| | | |
| | OMB APPROVAL | |
| | OMB Number: 3235-0570 | |
| | Expires: January 31, 2014 | |
| | Estimated average burden
hours per response: 20.6 | |
| |
UNITED STATES
SECURITIES AND EXCHANGE COMMISSION
Washington, D.C. 20549
FORM N-CSR
CERTIFIED SHAREHOLDER REPORT OF REGISTERED MANAGEMENT
INVESTMENT COMPANIES
Investment Company Act file number 811-05426
AIM Investment Funds (Invesco Investment Funds)
(Exact name of registrant as specified in charter)
11 Greenway Plaza, Suite 2500 Houston, Texas 77046
(Address of principal executive offices) (Zip code)
Philip A. Taylor 11 Greenway Plaza, Suite 2500 Houston, Texas 77046
(Name and address of agent for service)
Registrant’s telephone number, including area code: (713) 626-1919
Date of fiscal year end: 10/31
Date of reporting period: 10/31/11
Item 1. Reports to Stockholders.
| | |
| |
| Annual Report to Shareholders | | October 31, 2011 |
| |
| |
Invesco Balanced-Risk Allocation Fund
Nasdaq:
A: ABRZX § B: ABRBX § C: ABRCX § R: ABRRX § Y: ABRYX §Institutional: ABRIX
| | | |
|
| |
| 2 | | Letters to Shareholders |
| 4 | | Performance Summary |
| 4 | | Management Discussion |
| 6 | | Long-Term Fund Performance |
| 8 | | Supplemental Information |
| 10 | | Consolidated Schedule of Investments |
| 11 | | Consolidated Financial Statements |
| 13 | | Notes to Consolidated Financial Statements |
| 22 | | Consolidated Financial Highlights |
| 23 | | Auditor’s Report |
| 24 | | Fund Expenses |
| 25 | | Approval of Investment Advisory and Sub-Advisory Agreements |
| 27 | | Tax Information |
| T-1 | | Trustees and Officers |
Letters to Shareholders

Philip Taylor
Dear Shareholders:
Enclosed is important information about your Fund and its performance. I encourage you to read this report to learn more about your Fund’s short- and long-term performance and its holdings as of the close of the reporting period. This report also includes useful information about your Fund’s management team and a discussion of how your Fund was managed during the reporting period.
Investors are likely to confront both opportunities and challenges in 2012 – just as we did in 2011. After all, changes in market sentiment never do investors the courtesy of announcing their impending arrival, and your goals and needs may have changed, requiring changes in your financial strategy.
That’s why the start of a new year is always a good time to catch up with your financial adviser.
He or she can explain how your investments performed in the year just ended – how each performed individually, and more important, how they performed as a diversified portfolio. Of course, it’s important to remember that an investment’s long-term performance is more important than its short-term performance. Looking ahead to the new year and evaluating your individual situation, your financial adviser can provide valuable insight into whether your investments are still appropriate for your individual needs, goals and risk tolerance.
For current information about your Fund
In addition to meeting with your financial adviser to discuss your individual situation at the start of the new year, you also may find it helpful to stay abreast of market trends and developments. Doing so may provide reassurance in times of economic uncertainty and market volatility such as we saw in 2011 – and are likely to see again in 2012.
Invesco can help you stay informed about your investments and market trends. On our website, invesco.com/us, we provide timely market updates and commentary from many of our fund managers and other investment professionals. Also on our website, you can obtain information about your account at any hour of the day or night. I invite you to visit and explore the tools and information we offer at invesco.com/us.
Our commitment to investment excellence
As we’ve seen over the last several years, market conditions can change – often suddenly and dramatically. That’s one reason financial advisers typically advise their clients to be well diversified and to maintain a long-term investment focus. While diversification can’t guarantee a profit or protect against loss, it may cushion the impact of dramatic market moves. Maintaining a long-term investment focus for your long-term goals – financing your retirement or your children’s education, for example – may help you avoid making rash investment decisions based on short-term market swings.
Likewise, Invesco’s investment professionals maintain a long-term focus. Across our broad array of investment products, investment excellence is our ultimate goal. Each of our funds is managed by specialized teams of investment professionals, and as a company, we maintain a single focus – investment management – that allows our fund managers to concentrate on doing what they do best: managing your money.
Our funds are managed strictly according to their stated investment objectives and strategies, with robust risk oversight using consistent, repeatable investment processes that don’t change in response to short-term market events. This disciplined approach can’t guarantee a profit; no investment can do that, since all involve some measure of risk. But it can ensure that your money is managed the way we said it would be – according to your Fund’s objective and strategies.
Our adherence to stated investment objectives and strategies allows your financial adviser to build a diversified portfolio that meets your individual risk tolerance and financial goals. It also means that when your goals change, your financial adviser will be able to find an Invesco fund that’s appropriate for your needs.
Questions?
If you have questions about your account, please contact one of our client service representatives at 800 959 4246. If you have a general Invesco-related question or comment for me, I invite you to email me directly at phil@invesco.com.
All of us at Invesco look forward to serving your investment management needs for many years to come. Thank you for investing with us.
Sincerely,
Philip Taylor
Senior Managing Director, Invesco Ltd.
2 Invesco Balanced-Risk Allocation Fund

Bruce Crockett
Dear Fellow Shareholders:
Although the world’s economies are gradually recovering from the financial crisis, it has not been a smooth path. Unrest in the Middle East, persistently weak job and housing markets in the U.S. and continued government balance sheet repair in Europe are contributing to a slow, labored march toward global recovery.
In this environment, investors face risks that could make it more difficult to achieve their long-term financial goals – a secure retirement, home ownership, a child’s college education. Although the markets are complex and dynamic, there are ways to simplify the process and potentially increase your odds of achieving your goals. The best approach is to create a solid financial plan that helps you save and invest in ways that anticipate your needs over the long term.
Your financial adviser can help you define your financial plan, develop an appropriate investment strategy and put you in a better position to achieve your financial goals over the long term. This can take some of the guesswork out of the process and help you make thoughtful investments. Your financial adviser also can help you better understand your tolerance for risk, so that your investment approach lets you sleep at night while getting you closer to your goals. Lastly, your financial adviser can develop an asset allocation strategy that seeks to balance your investment approach, providing some protection against a decline in the markets while allowing you to participate in rising markets. Invesco calls this type of approach “intentional investing.” It means thinking carefully, planning thoughtfully and acting deliberately.
While no investment can guarantee favorable returns, your Board remains committed to managing costs and enhancing the performance of Invesco’s funds as part of our Investor First orientation. We continue to oversee the funds with the same strong sense of responsibility for your money and your continued trust that we’ve always maintained.
Thanks to the approval of our fund shareholders, Invesco has made great progress in realigning our U.S. mutual fund product line following our acquisition of Morgan Stanley’s retail asset management business, including Van Kampen Investments. When completed, the realignment will reduce overlap in the product lineup, enhance efficiency across our product line and build a solid foundation for further growth to meet client and shareholder needs. I would like to thank those of you who voted your proxy, and I hope our shareholders haven’t been too inconvenienced by the process.
As always, please contact me at bruce@brucecrockett.com with any questions or concerns you may have. On behalf of your Board, we look forward to continuing to represent your interests and serving your needs.
Sincerely,
Bruce L. Crockett
Independent Chair
Invesco Funds Board of Trustees
3 Invesco Balanced-Risk Allocation Fund
Management’s Discussion of Fund Performance
Performance summary
For the 12 months ended October 31, 2011, Class A shares of Invesco Balanced-Risk Allocation Fund, at net asset value, returned 9.13%, significantly outperforming the Custom Balanced-Risk Allocation Style Index. Strong commodity and fixed income markets over the reporting period, as measured by the S&P GSCI Index and the Barclays Capital U.S. Aggregate Index, respectively, contributed most to this outperformance. Global equity markets, as measured by the MSCI World Index, also rose slightly. Most of the Fund’s outperformance occurred in the second and third quarters of 2011, when stocks and commodities generally declined.
Your Fund’s long-term performance appears later in this report.
Fund vs. Indexes
Total returns, 10/31/10 to 10/31/11, at net asset value (NAV). Performance shown does not include applicable contingent deferred sales charges (CDSC) or front-end sales charges, which would have reduced performance.
| | | | | |
|
| Class A Shares | | | 9.13 | % |
| |
| Class B Shares | | | 8.30 | |
| |
| Class C Shares | | | 8.21 | |
| |
| Class R Shares | | | 8.84 | |
| |
| Class Y Shares | | | 9.36 | |
| |
| Institutional Class Shares | | | 9.36 | |
| |
S&P 500 Index▼ (Broad Market Index) | | | 8.07 | |
| |
Custom Balanced-Risk Allocation Broad Index§ (Style-Specific Index) | | | 7.23 | |
| |
Custom Balanced-Risk Allocation Style Index§ (Style-Specific Index) | | | 3.52 | |
| |
Lipper Global Flexible Portfolio Funds Index▼ (Peer Group Index) | | | -0.44 | |
| |
| | | | | |
Source(s): ▼Lipper Inc.; §Invesco, Lipper Inc. | | | | |
How we invest
The Fund’s investment process, under normal conditions, is implemented with derivatives and other financially-linked instruments whose performance is expected to correspond to U.S. and international fixed income, equity and commodity markets. The Fund invests in derivatives and other financially-linked instruments such as total return swaps, futures and exchange-traded funds. The Fund will seek to gain exposure to the commodity markets primarily through investments in Invesco Cayman Commodity Fund I Ltd. (the “Subsidiary”), a wholly-owned subsidiary of the Fund organized under the laws of the Cayman Islands.
Our philosophy is based on the idea that understanding, managing and allocating risk is fundamental to a properly constructed portfolio. The Fund uses a risk premium capture strategy that seeks to generate returns by investing in equity, bond and commodity markets using a risk
Risk Allocation
By asset class
| | | | | | | | | |
| | | Risk | | | % of Net Assets | |
| Asset Class | | Contribution | | | as of 10/31/11* | |
| Equity | | | 36.4 | % | | | 20.6 | % |
| |
| Fixed Income | | | 36.5 | | | | 108.4 | |
| |
| Commodities | | | 27.1 | | | | 26.3 | |
| | |
| * | | Due to the use of leverage, the percentages may not equal 100%. |
balanced investment process. Our primary goal is to build a portfolio that may perform well in diverse economic environments – recessionary, non-inflationary growth and inflationary growth – while balancing the amount of risk contributed by its exposure to equity, fixed income and commodity markets. We use a disciplined, three-step investment process that seeks to build a portfolio that may perform well in any economic environment while attempting to limit the impact that poor performance from any single asset has on overall Fund performance.
We begin the process by selecting representative assets for each asset class (equities, fixed income and commodities) from a universe of more than 50 assets. We consider three criteria when selecting assets:
| n | | Low correlation among the assets – We estimate long-term correlation among assets to build a Fund that is fully diversified. |
| | | | | |
|
| Total Net Assets | | $2.4 billion |
The Fund’s holdings are subject to change, and there is no assurance that the Fund will continue to hold any particular security.
The Fund uses commodity-linked derivative investments and enhanced investment techniques such as leverage.
| n | | Theoretical basis for excess return – We analyze each asset’s expected excess return over cash (its risk premium). |
| |
| n | | Liquidity, transparency and flexibility – The strategy is implemented using exchange-traded futures and other derivative or financially linked instruments. This ensures ample capacity and allows for daily liquidity while providing pure asset-class exposure. |
Next, we seek to construct the portfolio so that an approximately equal amount of risk comes from our equity, fixed income and commodity allocations. This balanced-risk allocation drives the weight of each asset class. We believe this approach may help mitigate large losses in capital and improve the portfolio’s risk/reward profile which is commonly referred to as the Sharpe ratio. We re-estimate the risk contributed by each asset and re-optimize the portfolio monthly, or when new assets are added to the portfolio. Typically, the majority of the leverage in the Fund stems from the fixed income exposure, since it is the asset class that requires upsizing due to its generally lower risk profile.
Finally, on a monthly basis, we actively adjust portfolio positions to reflect the near-term environment while remaining consistent with the optimized portfolio structure. The positions are weighted to reflect the volatility of each asset (e.g., bonds tend to have larger active positions than equities). This step is crucial because various asset classes respond differently to different economic environments. Active positioning better aligns the portfolio with the prevailing economic climate.
Market conditions and your Fund
At the beginning of the reporting period, global equity markets rose sharply after a difficult third quarter of 2010. Equities were supported by very loose monetary policies in the world’s largest industrialized economies. The rise in government bond yields during that time took valuation much closer to our estimate of fair value. The various commodity complexes all enjoyed price advances, propelled largely by tightening supply-demand balances. The Fund’s tactical overweight positions in equities and commodities proved beneficial during the third quarter of 2010 as fixed income positions were a drag on performance.
Entering 2011, equity gains continued due, in part, to accommodative monetary policies by major central banks. Government bond yields, which plunged
4 Invesco Balanced-Risk Allocation Fund
substantially in March, resumed their upward trend in April. Within commodities, the broad-based upward trend also remained intact. With the exception of Australia, all of the government fixed income investments in the Fund had a negative contribution during this time. The Fund’s equity exposures were generally positive, with particularly strong results by U.S. large- and small-cap positions. Additionally, within the Fund, commodities posted mixed results, with crude oil and precious metals faring well, while copper and agricultural commodities declined. Tactical shifts in the first part of 2011 had minimal impact on Fund performance.
Volatility returned to global equity and commodities markets during the summer months of 2011. The causes of this volatility included the performance of the peripheral European economies and the ending of another round of quantitative easing. Bonds benefitted during this time as yields declined in response to global economic uncertainty. The Fund’s diversified, strategic exposure to government bonds was the largest contributor to returns with the asset class behaving as a safe haven. Tactical overweight exposure in government bond markets and gold, along with underweight exposure to soymeal, also proved beneficial.
Volatility of risky assets continued into the third quarter of 2011 as global equities and most commodities experienced meaningful weakness during the third quarter. Bonds and gold experienced strong returns during the third quarter as investors sought shelter in safe-haven assets. The Fund’s strategic allocation to bonds was instrumental in defending the portfolio against the weakness experienced in equities and commodities during this challenging period. In addition, a tactical overweight position in bonds and underweight position in equities drove results.
Global equity and commodities markets experienced a powerful rally to close the reporting period. Bonds, however, experienced a pullback in October, with investors favoring riskier asset classes. The Fund’s exposure to commodities – especially crude oil and copper – was the largest contributor to returns during October. Equity investments also performed well, with notable strength from Hong Kong, Europe and the U.S. With the improved outlook for a solution to the European debt crisis in place, investors’ impetus for owning sovereign bonds declined, resulting in negative performance for the asset class.
Please note that our strategy is principally implemented using derivative instruments, including futures and total return swaps. Derivatives can be a more liquid and cost effective way to gain exposure to asset classes. Additionally, the leverage used in our strategy is inherent in these instruments.
Thank you for your continued commitment to Invesco Balanced-Risk Allocation Fund.
The views and opinions expressed in management’s discussion of Fund performance are those of Invesco Advisers, Inc. These views and opinions are subject to change at any time based on factors such as market and economic conditions. These views and opinions may not be relied upon as investment advice or recommendations, or as an offer for a particular security. The information is not a complete analysis of every aspect of any market, country, industry, security or the Fund. Statements of fact are from sources considered reliable, but Invesco Advisers, Inc. makes no representation or warranty as to their completeness or accuracy. Although historical performance is no guarantee of future results, these insights may help you understand our investment management philosophy.
See important Fund and, if applicable, index disclosures later in this report.
Scott Wolle
Chartered Financial Analyst, portfolio manager, is manager of Invesco Balanced-Risk Allocation Fund. He is chief investment officer of Invesco Global Asset Allocation. Mr. Wolle began his investment career in 1991 and joined Invesco in 1999. Mr. Wolle earned a B.S. from Virginia Polytechnic Institute and State University, graduating magna cum laude. He earned an M.B.A. from the Fuqua School of Business at Duke University, where he earned the distinction of Fuqua Scholar.
Mark Ahnrud
Chartered Financial Analyst, portfolio manager, is manager of Invesco Balanced-Risk Allocation Fund. He began his investment career in 1985 and joined Invesco in 2000. Mr. Ahnrud earned a B.S. in finance and investments from Babson College and an M.B.A. from the Fuqua School of Business at Duke University with a concentration in finance and real estate.
Chris Devine
Chartered Financial Analyst, portfolio manager, is manager of Invesco Balanced-Risk Allocation Fund. He began his investment career in 1996 and joined Invesco in 1998. Mr. Devine earned a B.A. from Wake Forest University and an M.B.A. from the University of Georgia.
Scott Hixon
Chartered Financial Analyst, portfolio manager, is manager of Invesco Balanced-Risk Allocation Fund. He began his investment career in 1992 and joined Invesco in 1994. Mr. Hixon earned a B.B.A. in finance and graduated magna cum laude from Georgia Southern University. He earned an M.B.A. in finance from Georgia State University.
Christian Ulrich
Chartered Financial Analyst, portfolio manager, is manager of Invesco Balanced-Risk Allocation Fund. He began his investment career in 1987 and joined Invesco in 2000. Mr. Ulrich earned the equivalent of a B.B.A. from the KV Zurich Business School in Zurich, Switzerland.
Assisted by the Global Asset
Allocation Team
5 Invesco Balanced-Risk Allocation Fund
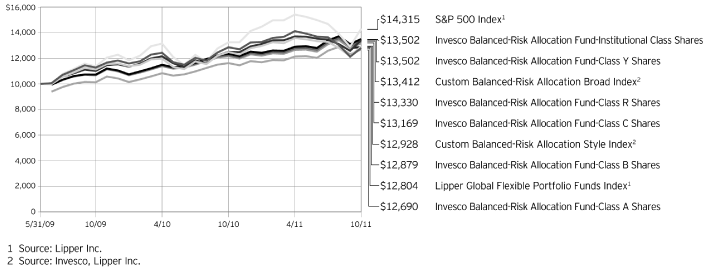
Your Fund’s Long-Term Performance
Results of a $10,000 Investment-Oldest Share Classes since Inception
Index data from 5/31/09, Fund data from 6/2/09
Past performance cannot guarantee comparable future results.
The data shown in the chart include reinvested distributions, applicable sales charges and Fund expenses including management fees. Results for Class B shares are calculated as if a hypothetical
shareholder had liquidated his entire investment in the Fund at the close of the reporting period and paid the contingent deferred sales charges, if applicable. Index results include reinvested dividends, but they do not reflect sales charges. Performance of the peer group,
if applicable, reflects fund expenses and management fees; performance of a market index does not. Performance shown in the chart and table(s) does not reflect deduction of taxes a shareholder would pay on Fund distributions or sale of Fund shares.
6 Invesco Balanced-Risk Allocation Fund
Average Annual Total Returns
As of 10/31/11, including maximum applicable sales charges
| | | | | |
|
Class A Shares | | | | |
| |
| Inception (6/2/09) | | | 10.37 | % |
| |
| 1 Year | | | 3.13 | |
| |
| | | | | |
Class B Shares | | | | |
| |
| Inception (6/2/09) | | | 11.05 | % |
| |
| 1 Year | | | 3.30 | |
| |
| | | | | |
Class C Shares | | | | |
| |
| Inception (6/2/09) | | | 12.08 | % |
| |
| 1 Year | | | 7.21 | |
| |
| | | | | |
Class R Shares | | | | |
| |
| Inception (6/2/09) | | | 12.65 | % |
| |
| 1 Year | | | 8.84 | |
| |
| | | | | |
Class Y Shares | | | | |
| |
| Inception (6/2/09) | | | 13.25 | % |
| |
| 1 Year | | | 9.36 | |
| |
| | | | | |
Institutional Class Shares | | | | |
| |
| Inception (6/2/09) | | | 13.25 | % |
| |
| 1 Year | | | 9.36 | |
The performance data quoted represent past performance and cannot guarantee comparable future results; current performance may be lower or higher. Please visit invesco.com/performance for the most recent month-end performance. Performance figures reflect reinvested distributions, changes in net asset value and the effect of the maximum sales charge unless otherwise stated. Investment return and principal value will fluctuate so that you may have a gain or loss when you sell shares.
Average Annual Total Returns
As of 9/30/11, the most recent calendar quarter-end, including maximum applicable sales charges
| | | | | |
|
Class A Shares | | | | |
| |
| Inception (6/2/09) | | | 9.33 | % |
| |
| 1 Year | | | 1.10 | |
| |
| | | | | |
Class B Shares | | | | |
| |
| Inception (6/2/09) | | | 10.01 | % |
| |
| 1 Year | | | 1.10 | |
| |
| | | | | |
Class C Shares | | | | |
| |
| Inception (6/2/09) | | | 11.14 | % |
| |
| 1 Year | | | 5.10 | |
| |
| | | | | |
Class R Shares | | | | |
| |
| Inception (6/2/09) | | | 11.70 | % |
| |
| 1 Year | | | 6.65 | |
| |
| | | | | |
Class Y Shares | | | | |
| |
| Inception (6/2/09) | | | 12.29 | % |
| |
| 1 Year | | | 7.20 | |
| |
| | | | | |
Institutional Class Shares | | | | |
| |
| Inception (6/2/09) | | | 12.29 | % |
| |
| 1 Year | | | 7.20 | |
The net annual Fund operating expense ratio set forth in the most recent Fund prospectus as of the date of this report for Class A, Class B, Class C, Class R, Class Y and Institutional Class shares was 1.15%, 1.90%, 1.90%, 1.40%, 0.90% and 0.90%, respectively.1,2 The total annual Fund operating expense ratio set forth in the most recent Fund prospectus as of the date of this report for Class A, Class B, Class C, Class R, Class Y and Institutional Class shares was 1.53%,
2.28%, 2.28%, 1.78%, 1.28% and 1.15%, respectively.2 The expense ratios presented above may vary from the expense ratios presented in other sections of this report that are based on expenses incurred during the period covered by this report.
Class A share performance reflects the maximum 5.50% sales charge, and Class B and Class C share performance reflects the applicable contingent deferred sales charge (CDSC) for the period involved. The CDSC on Class B shares declines from 5% beginning at the time of purchase to 0% at the beginning of the seventh year. The CDSC on Class C shares is 1% for the first year after purchase. Class R, Class Y and Institutional Class shares do not have a front-end sales charge or a CDSC; therefore, performance is at net asset value.
The performance of the Fund’s share classes will differ primarily due to different sales charge structures and class expenses.
Had the adviser not waived fees and/or expenses, performance would have been lower.
| 1 | | Total annual Fund operating expenses after any contractual fee waivers and/or expense reimbursements by the adviser in effect through at least February 28, 2012. See current prospectus for more information. |
| 2 | | The expense ratio includes acquired fund fees and expenses of the underlying funds in which the Fund invests of 0.11% for Invesco Balanced-Risk Allocation Fund. |
continued from page 9
| n | | The Fund is not managed to track the performance of any particular index, including the index(es) defined here, and consequently, the performance of the Fund may deviate significantly from the performance of the index(es). |
| n | | A direct investment cannot be made in an index. Unless otherwise indicated, index results include reinvested dividends, and they do not reflect sales charges. Performance of the peer group, if applicable, reflects fund expenses; performance of a market index does not. |
Other information
| n | | The Chartered Financial Analyst® (CFA®) designation is globally recognized and attests to a charterholder’s success in a rigorous and comprehensive study program in the field of investment management and research analysis. |
| n | | The returns shown in management’s discussion of Fund performance are based on net asset values calculated for shareholder transactions. Generally accepted accounting principles require adjustments to be made to the net assets of the Fund at period end for financial reporting purposes, and as such, the net asset values for shareholder transactions and the returns based on those net asset values may |
| | | differ from the net asset values and returns reported in the Financial Highlights. |
7 Invesco Balanced-Risk Allocation Fund
Invesco Balanced-Risk Allocation Fund’s investment objective is to provide total return with a low to moderate correlation to traditional financial market indices.
| n | | Unless otherwise stated, information presented in this report is as of October 31, 2011, and is based on total net assets. |
| |
| n | | Unless otherwise noted, all data provided by Invesco. |
| |
| n | | To access your Fund’s reports/prospectus, visit invesco.com/fundreports. |
About share classes
| n | | Class B shares may not be purchased or acquired by exchange from share classes other than Class B shares. Please see the prospectus for more information. |
| |
| n | | Class R shares are available only to certain retirement plans. Please see the prospectus for more information. |
| |
| n | | Class Y shares are available to only certain investors. Please see the prospectus for more information. |
| |
| n | | Institutional Class shares are offered exclusively to institutional investors, including defined contribution plans that meet certain criteria. Please see the prospectus for more information. |
Principal risks of investing in the Fund
| n | | Commodity-linked notes risk. The Fund’s investments in commodity-linked notes may involve substantial risks, including risk of loss of a significant portion of their principal value. In addition to risks associated with the underlying commodities, they may be subject to additional special risks, such as the lack of a secondary trading market and temporary price distortions due to speculators and/or the continuous rolling over of futures contracts underlying the notes. Commodity-linked notes are also subject to counter-party risk, which is the risk that the other party to the contract will not fulfill its contractual obligation to complete the transaction with the Fund. |
| |
| n | | Commodity risk. The Fund’s and the Subsidiary’s investment exposure to the commodities markets and/or a particular sector of the commodities markets, may subject the Fund and the Subsidiary to greater volatility than investments in traditional securities, such as stocks and bonds. The commodities markets may fluctuate widely based on a variety of factors, including changes in overall market movements, domestic and foreign political and |
| | | economic events and policies, war, acts of terrorism, changes in domestic or foreign interest rates and/or investor expectations concerning interest rates, domestic and foreign inflation rates and investment and trading activities of mutual funds, hedge funds and commodities funds. Prices of various commodities may also be affected by factors such as drought, floods, weather, livestock disease, embargoes, tariffs and other regulatory developments. The prices of commodities can also fluctuate widely due to supply and demand disruptions in major producing or consuming regions. Because the Fund’s and the Subsidiary’s performance is linked to the performance of potentially volatile commodities, investors should be willing to assume the risks of potentially significant fluctuations in the value of the Fund’s shares. |
| n | | Concentration risk. To the extent, the Fund invests a greater amount in any one sector or industry, the Fund’s performance will depend to a greater extent on the overall condition of the sector or industry, and there is increased risk to the Fund if conditions adversely affect that sector or industry. |
| |
| n | | Counterparty risk. Individually negotiated or over-the-counter derivatives are also subject to counterparty risk, which is the risk that the other party to the contract (such as a futures contract or swap agreement) will not fulfill its contractual obligations, which may cause losses or additional costs to the Fund. |
| n | | Credit risk. The issuer of instruments in which the Fund invests may be unable to meet interest and/or principal payments, thereby causing its instruments to decrease in value and lowering the issuer’s credit rating. |
| |
| n | | Currency/exchange risk. The dollar value of the Fund’s foreign investments will be affected by changes in the exchange rates between the dollar and the currencies in which those investments are traded. |
| n | | Derivatives risk. Derivatives may be more difficult to purchase, sell or value than other investments and may be subject to market, interest rate, credit, leverage, counterparty and management risks. A fund investing in a derivative could lose more than the cash amount invested or incur higher taxes. Over-the-counter derivatives are also subject to counterparty risk, which is the risk that the other party to the contract will not fulfill its contractual obligation to complete the transaction with the Fund. |
The derivative instruments and techniques that the Fund and the Subsidiary may principally use include:
Swaps. A swap contract is an agreement between two parties pursuant to which the parties exchange payments at specified dates on the basis of a specified notional amount, with the payments calculated by reference to specified securities, indexes, reference rates, currencies or other instruments. Swaps are subject to credit risk and counterparty risk.
Futures. A decision as to whether, when and how to use futures involves the exercise of skill and judgment and even a well conceived futures transaction may be unsuccessful because of market behavior or unexpected events.
| n | | Developing markets securities risk. Securities issued by foreign companies and governments located in developing countries may be affected more negatively by inflation, devaluation of their currencies, higher transaction costs, delays in settlement, adverse political developments, the introduction of capital controls, withholding taxes, nationalization of private assets, expropriation, social unrest, war or lack of timely information than those in developed countries. |
| |
| n | | Exchange-traded funds risk. An investment by the Fund in ETFs generally presents the same primary risks as an investment in a mutual fund. In |
This report must be accompanied or preceded by a currently effective Fund prospectus, which contains more complete information, including sales charges and expenses. Investors should read it carefully before investing.
NOT FDIC INSURED | MAY LOSE VALUE | NO BANK GUARANTEE
Fund Nasdaq Symbols
| | | | | |
|
| Class A Shares | | ABRZX |
| Class B Shares | | ABRBX |
| Class C Shares | | ABRCX |
| Class R Shares | | ABRRX |
| Class Y Shares | | ABRYX |
| Institutional Class Shares | | ABRIX |
8 Invesco Balanced-Risk Allocation Fund
| | | addition, an ETF may be subject to the following: (1) a discount of the ETF’s shares to its net asset value; (2) failure to develop an active trading market for the ETF’s shares; (3) the listing exchange halting trading of the ETF’s shares; (4) failure of the ETF’s shares to track the referenced index; and (5) holding troubled securities in the referenced index. ETFs may involve duplication of management fees and certain other expenses, as the Fund indirectly bears its proportionate share of any expenses paid by the ETFs in which it invests. Further, certain of the ETFs in which the Fund may invest are leveraged. The more the Fund invests in such leveraged ETFs, the more this leverage will magnify any losses on those investments. |
| n | | Exchange-traded notes risk. Exchange-Traded Notes (ETNs) are subject to credit risk, including the credit risk of the issuer, and the value of the ETN may drop due to a downgrade in the issuer’s credit rating, despite the underlying market benchmark or strategy remaining unchanged. The value of an ETN may also be influenced by time to maturity, level of supply and demand for the ETN, volatility and lack of liquidity in underlying assets, changes in the applicable interest rates, changes in the issuer’s credit rating, and economic, legal, political, or geographic events that affect the referenced underlying asset. |
| n | | Foreign securities risk. The Fund’s foreign investments may be affected by changes in a foreign country’s exchange rates; political and social instability; changes in economic or taxation policies; difficulties when enforcing obligations; decreased liquidity; and increased volatility. Foreign companies may be subject to less regulation resulting in less publicly available information about the companies. |
| n | | Interest rate risk. Interest rate risk refers to the risk that bond prices generally fall as interest rates rise; conversely, bond prices generally rise as interest rates fall. Specific bonds differ in their sensitivity to changes in interest rates depending on their individual characteristics, including duration. |
| n | | Leverage risk. Leverage exists when the Fund purchases or sells an instrument or enters into a transaction without investing cash in an amount equal to the full economic exposure of the instrument or transaction and the Fund could lose more than it invested. |
| | | Leverage created from borrowing or certain types of transactions or instruments, including derivatives, may impair the Fund’s liquidity, cause it to liquidate positions at an unfavorable time, increase volatility or otherwise not achieve its intended objective. |
| n | | Liquidity risk. The Fund may hold illiquid securities that it is unable to sell at the preferred time or price and could lose its entire investment in such securities. |
| |
| n | | Management risk. The investment techniques and risk analysis used by the Fund’s portfolio managers may not produce the desired results. |
| |
| n | | Market risk. The prices of and the income generated by the Fund’s securities may decline in response to, among other things, investor sentiment; general economic and market conditions; regional or global instability; and currency and interest rate fluctuations. |
| |
| n | | Non-diversification risk. The Fund is non-diversified and can invest a greater portion of its assets in a single issuer. A change in the value of the issuer could affect the value of the Fund more than if it was a diversified fund. |
| |
| n | | Subsidiary risk. By investing in the Subsidiary, the Fund is indirectly exposed to risks associated with the Subsidiary’s investments, including derivatives and commodities. Because the Subsidiary is not registered under the Investment Company Act of 1940, the Fund, as the sole investor in the Subsidiary, will not have the protections offered to investors in U.S. registered investment companies. Changes in the laws of the United States and/or the Cayman Islands, under which the Fund and the Subsidiary, respectively, are organized, could result in the inability of the Fund and/or the Subsidiary to operate as described in this prospectus and could negatively affect the Fund and its shareholders. |
| |
| n | | Tax risk. The Fund intends to treat the income it derives from commodity-linked notes as qualifying income based on a private letter ruling it has received from the Internal Revenue Service (IRS) holding that the income from a form of commodity-linked note constitutes qualifying income. Additionally, the Fund intends to treat the income it derives from the Subsidiary as qualifying income based on a private letter ruling it has received from the IRS holding that the income of the Subsidiary attributable to the Fund is income derived with respect to the Fund’s |
| | | business of investing in the stock of the Subsidiary and thus constitutes qualifying income. If, however, the IRS were to change its position with respect to the conclusions reached in these private letter rulings, such that the Fund’s income from the Subsidiary and commodity-linked notes is not “qualifying income,” the Fund may be unable to qualify as a regulated investment company for one or more years. In this event, the Fund’s Board of Trustees may authorize a significant change in investment strategy or Fund liquidation. |
| n | | U.S. government risk. The Fund may invest in obligations issued by U.S. government agencies and instrumentalities that may receive varying levels of support from the government, which could affect the Fund’s ability to recover should they default. |
About indexes used in this report
| n | | The S&P 500® Index is an unmanaged index considered representative of the U.S. stock market. |
| |
| n | | The Custom Balanced-Risk Allocation Broad Index consists of 60% of the S&P 500 Index and 40% of the Barclays Capital U.S. Aggregate Index. |
| |
| n | | The Custom Balanced-Risk Allocation Style Index consists of 60% of the MSCI World Index and 40% of the Barclays Capital U.S. Aggregate Index. Effective December 1, 2009, the fixed income component of the Custom Balanced-Risk Allocation Style Index changed from the JP Morgan GBI Global (Traded) Index to the Barclays Capital U.S. Aggregate Index. |
| |
| n | | The Lipper Global Flexible Portfolio Funds Index is an equally weighted representation of the largest funds in the Lipper Global Flexible Portfolio Funds category. These funds allocate their investments across various asset classes, including both domestic and foreign stocks, bonds and money market instruments, with a focus on total return. |
| |
| n | | The MSCI World IndexSM is an unmanaged index considered representative of stocks of developed countries. |
| |
| n | | The Barclays Capital U.S. Aggregate Index is an unmanaged index considered representative of the U.S. investment-grade, fixed-rate bond market. |
| |
| n | | The S&P GSCI Index is an unmanaged world production-weighted index composed of the principal physical commodities that are the subject of active, liquid futures markets. |
continued on page 7
9 Invesco Balanced-Risk Allocation Fund
Consolidated Schedule of Investments
October 31, 2011
| | | | | | | | | |
| | | Principal
| | |
| | | Amount | | Value |
| |
U.S. Treasury Bills–16.24%(a)(b)
|
| 0.00%, 01/26/12 | | $ | 260,000,000 | | | $ | 259,996,895 | |
| |
| 0.01%, 01/26/12 | | | 20,000,000 | | | | 19,999,761 | |
| |
| 0.12%, 01/26/12 | | | 66,000,000 | | | | 65,999,212 | |
| |
| 0.00%, 02/09/12 | | | 10,000,000 | | | | 9,999,861 | |
| |
| 0.04%, 02/09/12 | | | 25,000,000 | | | | 24,999,652 | |
| |
| 0.06%, 02/09/12 | | | 10,000,000 | | | | 9,999,861 | |
| |
| Total U.S. Treasury Bills (Cost $390,970,512) | | | | | | | 390,995,242 | |
| |
| | | | | | | | | |
| | | Shares | | |
Exchange Traded Funds–3.59%
|
PowerShares DB Gold Fund(c) (Cost $77,581,443) | | | 1,439,000 | | | | 86,498,290 | |
| |
| | | | | | | | | |
| |
Money Market Funds–71.77%
|
Liquid Assets Portfolio–Institutional Class(d) | | | 686,555,021 | | | | 686,555,021 | |
| |
Premier Portfolio–Institutional Class(d) | | | 686,555,021 | | | | 686,555,021 | |
| |
STIC (Global Series) PLC–U.S. Dollar Liquidity Portfolio–Institutional Class(d) | | | 355,049,468 | | | | 355,049,468 | |
| |
| Total Money Market Funds (Cost $1,728,159,510) | | | | | | | 1,728,159,510 | |
| |
| TOTAL INVESTMENTS–91.60% (Cost $2,196,711,465) | | | | | | | 2,205,653,042 | |
| |
| OTHER ASSETS LESS LIABILITIES–8.40% | | | | | | | 202,279,661 | |
| |
| NET ASSETS–100.00% | | | | | | $ | 2,407,932,703 | |
| |
Notes to Schedule of Investments:
| | |
| (a) | | Security traded on a discount basis. The interest rate shown represents the discount rate at the time of purchase by the Fund. |
| (b) | | All or a portion of the value was pledged as collateral for open swap agreements. See Note 1J. |
| (c) | | Not an affiliate of the Fund or its investment adviser. |
| (d) | | The money market fund and the Fund are affiliated by having the same investment adviser. |
| | | | | | | | | | | | | | | | | | | |
| Open Futures Contracts and Swap Agreements at Period-End |
| | | | | | | | | | | Unrealized
|
| | | | | Number of
| | Expiration
| | Notional
| | Appreciation
|
| Long Futures Contracts | | | | Contracts | | Month | | Value | | (Depreciation) |
| |
| Australian 10 Year Bonds | | | | | 3,287 | | | | December-2011 | | | $ | 386,452,835 | | | $ | (11,267,893 | ) |
| |
| Canada 10 Year Bonds | | | | | 2,288 | | | | December-2011 | | | | 301,129,879 | | | | 1,674,835 | |
| |
| Dow Jones Eurostoxx 50 | | | | | 2,470 | | | | December-2011 | | | | 81,615,607 | | | | 12,054,942 | |
| |
E-Mini S&P 500 Index | | | | | 1,720 | | | | December-2011 | | | | 107,439,800 | | | | 8,921,398 | |
| |
| Euro Bonds | | | | | 1,700 | | | | December-2011 | | | | 318,664,726 | | | | (1,910,829 | ) |
| |
| FTSE 100 Index | | | | | 845 | | | | December-2011 | | | | 75,250,243 | | | | 5,424,666 | |
| |
| Hang Seng Index | | | | | 560 | | | | November-2011 | | | | 71,308,310 | | | | 3,945,316 | |
| |
| 100 Ounce Gold | | | | | 1,095 | | | | December-2011 | | | | 188,909,400 | | | | 6,820,002 | |
| |
| Japan 10 Year Bonds | | | | | 171 | | | | December-2011 | | | | 310,722,180 | | | | (1,362,115 | ) |
| |
| LME Copper | | | | | 572 | | | | March-2012 | | | | 114,328,500 | | | | 14,127,599 | |
| |
| Long Gilt | | | | | 1,578 | | | | December-2011 | | | | 325,632,744 | | | | 898,562 | |
| |
| Russell 2000 Index Mini | | | | | 1,250 | | | | Decemeber-2011 | | | | 92,412,500 | | | | 9,468,090 | |
| |
| Topix Tokyo Price Index | | | | | 595 | | | | December-2011 | | | | 57,764,774 | | | | 1,227,743 | |
| |
| U.S. Treasury Long Bonds | | | | | 1,825 | | | | December-2011 | | | | 253,732,031 | | | | 3,250,488 | |
| |
| WTI Light Sweet Crude Oil | | | | | 1,385 | | | | January-2012 | | | | 128,915,800 | | | | 20,633,867 | |
| |
| Total Futures Contracts | | | | | | | | | | | | $ | 2,814,279,329 | | | $ | 73,906,671 | |
| |
| | | | | | | | | | | | | | | | | | | |
| | | | | | | | | | | | | | | | | | | |
| Swap Agreements | | Counterparty | | | | | | | | |
| |
| Australian 10 Year Bonds | | Merrill Lynch | | | 878 | | | | December-2011 | | | $ | 102,559,384 | | | $ | (3,326,361 | ) |
| |
| Canada 10 Year Bonds | | Goldman Sachs | | | 1,447 | | | | December-2011 | | | | 190,678,902 | | | | 911,473 | |
| |
| Euro Bonds | | Merrill Lynch | | | 620 | | | | December-2011 | | | | 118,512,879 | | | | 314,608 | |
| |
| Japan 10 Year Bonds | | Merrill Lynch | | | 36 | | | | December-2011 | | | | 66,173,513 | | | | (338,785 | ) |
| |
| Long Gilt | | Goldman Sachs | | | 885 | | | | December-2011 | | | | 183,719,906 | | | | 241,213 | |
| |
| Soybean Meal* | | Barclays Capital | | | 7,710 | | | | December-2011 | | | | 103,238,256 | | | | (2,205,419 | ) |
| |
| Total Swap Agreements | | | | | | | | | | | | $ | 764,882,840 | | | $ | (4,403,271 | ) |
| |
| |
| * | Receive a return equal to Barclays Capital Soybean Meal S2 Nearby Excess Return Index and pay the product of (i) 0.30% of the Notional Amount multiplied by (ii) days in the period divided by 365. |
See accompanying Notes to Consolidated Financial Statements which are an integral part of the financial statements.
10 Invesco Balanced-Risk Allocation Fund
Consolidated Statement of Assets and Liabilities
October 31, 2011
| | | | | |
Assets:
|
| Investments, at value (Cost $468,551,955) | | $ | 477,493,532 | |
| |
| Investments in affiliated money market funds, at value and cost | | | 1,728,159,510 | |
| |
| Total investments, at value (Cost $2,196,711,465) | | | 2,205,653,042 | |
| |
| Receivable for: | | | | |
| Deposits with brokers for open futures contracts | | | 159,700,320 | |
| |
| Investments sold | | | 137,636 | |
| |
| Fund shares sold | | | 53,475,510 | |
| |
| Dividends and interest | | | 134,832 | |
| |
| Premiums paid on swap agreements | | | 46 | |
| |
| Investment for trustee deferred compensation and retirement plans | | | 6,156 | |
| |
| Other assets | | | 42,162 | |
| |
| Total assets | | | 2,419,149,704 | |
| |
Liabilities:
|
| Payable for: | | | | |
| Fund shares reacquired | | | 5,336,955 | |
| |
| Variation margin | | | 554,913 | |
| |
| Accrued fees to affiliates | | | 794,009 | |
| |
| Accrued other operating expenses | | | 105,522 | |
| |
| Trustee deferred compensation and retirement plans | | | 22,331 | |
| |
| Unrealized depreciation on swap agreements | | | 4,403,271 | |
| |
| Total liabilities | | | 11,217,001 | |
| |
| Net assets applicable to shares outstanding | | $ | 2,407,932,703 | |
| |
Net assets consist of:
|
| Shares of beneficial interest | | $ | 2,288,774,334 | |
| |
| Undistributed net investment income | | | 68,742,715 | |
| |
| Undistributed net realized gain | | | (28,029,322 | ) |
| |
| Unrealized appreciation | | | 78,444,976 | |
| |
| | | $ | 2,407,932,703 | |
| |
Net Assets:
|
| Class A | | $ | 1,001,088,377 | |
| |
| Class B | | $ | 17,721,526 | |
| |
| Class C | | $ | 383,786,319 | |
| |
| Class R | | $ | 2,955,506 | |
| |
| Class Y | | $ | 553,001,331 | |
| |
| Institutional Class | | $ | 449,379,644 | |
| |
Shares outstanding, $0.01 par value per share, with an unlimited number of shares authorized:
|
| Class A | | | 83,378,776 | |
| |
| Class B | | | 1,501,110 | |
| |
| Class C | | | 32,512,175 | |
| |
| Class R | | | 247,680 | |
| |
| Class Y | | | 45,819,690 | |
| |
| Institutional Class | | | 37,238,284 | |
| |
| Class A: | | | | |
| Net asset value per share | | $ | 12.01 | |
| |
Maximum offering price per share
(Net asset value of $12.01 divided by 94.50%) | | $ | 12.71 | |
| |
| Class B: | | | | |
| Net asset value and offering price per share | | $ | 11.81 | |
| |
| Class C: | | | | |
| Net asset value and offering price per share | | $ | 11.80 | |
| |
| Class R: | | | | |
| Net asset value and offering price per share | | $ | 11.93 | |
| |
| Class Y: | | | | |
| Net asset value and offering price per share | | $ | 12.07 | |
| |
| Institutional Class: | | | | |
| Net asset value and offering price per share | | $ | 12.07 | |
| |
See accompanying Notes to Consolidated Financial Statements which are an integral part of the financial statements.
11 Invesco Balanced-Risk Allocation Fund
Consolidated Statement of Operations
For the year ended October 31, 2011
| | | | | |
Investment income:
|
| Dividends from affiliated money market funds | | $ | 724,418 | |
| |
| Interest | | | 435,844 | |
| |
| Total investment income | | | 1,160,262 | |
| |
Expenses:
|
| Advisory fees | | | 11,129,710 | |
| |
| Administrative services fees | | | 331,052 | |
| |
| Custodian fees | | | 24,603 | |
| |
| Distribution fees: | | | | |
| Class A | | | 1,083,353 | |
| |
| Class B | | | 134,147 | |
| |
| Class C | | | 1,592,913 | |
| |
| Class R | | | 7,205 | |
| |
| Transfer agent fees — A, B, C, R and Y | | | 743,681 | |
| |
| Transfer agent fees — Institutional | | | 2,462 | |
| |
| Trustees’ and officers’ fees and benefits | | | 45,151 | |
| |
| Other | | | 281,315 | |
| |
| Total expenses | | | 15,375,592 | |
| |
| Less: Fees waived, expenses reimbursed and expense offset arrangement(s) | | | (2,901,511 | ) |
| |
| Net expenses | | | 12,474,081 | |
| |
| Net investment income (loss) | | | (11,313,819 | ) |
| |
Realized and unrealized gain (loss) from:
|
| Net realized gain (loss) from: | | | | |
| Investment securities | | | 12,680,387 | |
| |
| Foreign currencies | | | (814,048 | ) |
| |
| Futures contracts | | | 47,903,427 | |
| |
| Swap agreements | | | 7,793,159 | |
| |
| | | | 67,562,925 | |
| |
| Change in net unrealized appreciation (depreciation) of: | | | | |
| Investment securities | | | (4,580,926 | ) |
| |
| Futures contracts | | | 49,673,018 | |
| |
| Swap agreements | | | (922,046 | ) |
| |
| | | | 44,170,046 | |
| |
| Net realized and unrealized gain | | | 111,732,971 | |
| |
| Net increase in net assets resulting from operations | | $ | 100,419,152 | |
| |
See accompanying Notes to Consolidated Financial Statements which are an integral part of the financial statements.
12 Invesco Balanced-Risk Allocation Fund
Consolidated Statement of Changes in Net Assets
For the years ended October 31, 2011 and 2010
| | | | | | | | | |
| | | 2011 | | 2010 |
| |
Operations:
|
| Net investment income (loss) | | $ | (11,313,819 | ) | | $ | (3,351,994 | ) |
| |
| Net realized gain | | | 67,562,925 | | | | 36,848,438 | |
| |
| Change in net unrealized appreciation | | | 44,170,046 | | | | 33,991,904 | |
| |
| Net increase in net assets resulting from operations | | | 100,419,152 | | | | 67,488,348 | |
| |
Distributions to shareholders from net investment income:
|
| Class A | | | (10,326,464 | ) | | | (507,775 | ) |
| |
| Class B | | | (439,288 | ) | | | (25,651 | ) |
| |
| Class C | | | (2,924,319 | ) | | | (107,413 | ) |
| |
| Class R | | | (25,578 | ) | | | (4,200 | ) |
| |
| Class Y | | | (3,108,815 | ) | | | (262,554 | ) |
| |
| Institutional Class | | | (17,683,480 | ) | | | (4,779,221 | ) |
| |
| Total distributions from net investment income | | | (34,507,944 | ) | | | (5,686,814 | ) |
| |
Distributions to shareholders from net realized gains:
|
| Class A | | | (4,488,032 | ) | | | (835,779 | ) |
| |
| Class B | | | (199,892 | ) | | | (43,747 | ) |
| |
| Class C | | | (1,330,671 | ) | �� | | (183,187 | ) |
| |
| Class R | | | (11,286 | ) | | | (6,994 | ) |
| |
| Class Y | | | (1,328,598 | ) | | | (427,053 | ) |
| |
| Institutional Class | | | (7,557,298 | ) | | | (7,773,567 | ) |
| |
| Total distributions from net realized gains | | | (14,915,777 | ) | | | (9,270,327 | ) |
| |
Share transactions–net:
|
| Class A | | | 772,897,074 | | | | 179,928,244 | |
| |
| Class B | | | 7,594,067 | | | | 8,309,525 | |
| |
| Class C | | | 317,328,870 | | | | 52,476,675 | |
| |
| Class R | | | 2,256,817 | | | | 484,459 | |
| |
| Class Y | | | 481,151,077 | | | | 58,677,183 | |
| |
| Institutional Class | | | (32,440,466 | ) | | | 211,410,306 | |
| |
| Net increase in net assets resulting from share transactions | | | 1,548,787,439 | | | | 511,286,392 | |
| |
| Net increase in net assets | | | 1,599,782,870 | | | | 563,817,599 | |
| |
Net Assets:
|
| Beginning of year | | | 808,149,833 | | | | 244,332,234 | |
| |
| End of year (includes undistributed net investment income of $68,742,715 and $34,689,936, respectively) | | $ | 2,407,932,703 | | | $ | 808,149,833 | |
| |
Notes to Consolidated Financial Statements
October 31, 2011
NOTE 1—Significant Accounting Policies
Invesco Balanced-Risk Allocation Fund (the “Fund”) is a series portfolio of AIM Investment Funds (Invesco Investment Funds) (the “Trust”). The Trust is organized as a Delaware statutory trust and is registered under the Investment Company Act of 1940, as amended (the “1940 Act”), as an open-end series management investment company consisting of thirteen separate series portfolios, each authorized to issue an unlimited number of shares of beneficial interest. The assets, liabilities and operations of each portfolio are accounted for separately. Information presented in these consolidated financial statements pertains only to the Fund. Matters affecting each portfolio or class will be voted on exclusively by the shareholders of such portfolio or class.
13 Invesco Balanced-Risk Allocation Fund
The Fund will seek to gain exposure to the commodity markets primarily through investments in the Invesco Cayman Commodity Fund I Ltd. (the “Subsidiary”), a wholly-owned subsidiary of the Fund organized under the laws of the Cayman Islands. The Subsidiary was organized by the Fund to invest in commodity-linked derivatives. The Fund may invest up to 25% of its total assets in the Subsidiary.
The Fund’s investment objective is to provide total return with a low to moderate correlation to traditional financial market indices.
The Fund currently consists of six different classes of shares: Class A, Class B, Class C, Class R, Class Y and Institutional Class. Class A shares are sold with a front-end sales charge unless certain waiver criteria are met and under certain circumstances load waived shares may be subject to contingent deferred sales charges (“CDSC”). Class C shares are sold with a CDSC. Class R, Class Y and Institutional Class shares are sold at net asset value. Effective November 30, 2010, new or additional investments in Class B shares are no longer permitted. Existing shareholders of Class B shares may continue to reinvest dividends and capital gains distributions in Class B shares until they convert. Also, shareholders in Class B shares will be able to exchange those shares for Class B shares of other Invesco Funds offering such shares until they convert. Generally, Class B shares will automatically convert to Class A shares on or about the month-end which is at least eight years after the date of purchase. Redemption of Class B shares prior to conversion date will be subject to a CDSC.
The following is a summary of the significant accounting policies followed by the Fund in the preparation of its consolidated financial statements.
| | |
| A. | | Security Valuations — Securities, including restricted securities, are valued according to the following policy. |
| | Debt obligations (including convertible bonds) and unlisted equities are fair valued using an evaluated quote provided by an independent pricing service. Evaluated quotes provided by the pricing service may be determined without exclusive reliance on quoted prices, and may reflect appropriate factors such as institution-size trading in similar groups of securities, developments related to specific securities, dividend rate, yield, quality, type of issue, coupon rate, maturity, individual trading characteristics and other market data. Debt securities are subject to interest rate and credit risks. In addition, all debt securities involve some risk of default with respect to interest and/or principal payments. |
| | A security listed or traded on an exchange (except convertible bonds) is valued at its last sales price or official closing price as of the close of the customary trading session on the exchange where the security is principally traded, or lacking any sales or official closing price on a particular day, the security may be valued at the closing bid price on that day. Securities traded in the over-the-counter market are valued based on prices furnished by independent pricing services or market makers. When such securities are valued by an independent pricing service they may be considered fair valued. Futures contracts are valued at the final settlement price set by an exchange on which they are principally traded. Listed options are valued at the mean between the last bid and ask prices from the exchange on which they are principally traded. Options not listed on an exchange are valued by an independent source at the mean between the last bid and ask prices. For purposes of determining net asset value per share, futures and option contracts generally are valued 15 minutes after the close of the customary trading session of the New York Stock Exchange (“NYSE”). |
| | Investments in open-end and closed-end registered investment companies that do not trade on an exchange are valued at the end of day net asset value per share. Investments in open-end and closed-end registered investment companies that trade on an exchange are valued at the last sales price or official closing price as of the close of the customary trading session on the exchange where the security is principally traded. |
| | Swap agreements are fair valued using an evaluated quote provided by an independent pricing service. Evaluated quotes provided by the pricing service are valued based on a model which may include end of day net present values, spreads, ratings, industry, and company performance. |
| | Foreign securities (including foreign exchange contracts) are converted into U.S. dollar amounts using the applicable exchange rates as of the close of the NYSE. If market quotations are available and reliable for foreign exchange traded equity securities, the securities will be valued at the market quotations. Because trading hours for certain foreign securities end before the close of the NYSE, closing market quotations may become unreliable. If between the time trading ends on a particular security and the close of the customary trading session on the NYSE, events occur that are significant and make the closing price unreliable, the Fund may fair value the security. If the event is likely to have affected the closing price of the security, the security will be valued at fair value in good faith using procedures approved by the Board of Trustees. Adjustments to closing prices to reflect fair value may also be based on a screening process of an independent pricing service to indicate the degree of certainty, based on historical data, that the closing price in the principal market where a foreign security trade is not the current value as of the close of the NYSE. Foreign securities meeting the approved degree of certainty that the price is not reflective of current value will be priced at the indication of fair value from the independent pricing service. Multiple factors may be considered by the independent pricing service in determining adjustments to reflect fair value and may include information relating to sector indices, American Depositary Receipts and domestic and foreign index futures. Foreign securities may have additional risks including exchange rate changes, potential for sharply devalued currencies and high inflation, political and economical upheaval, the relative lack of issuer information, relatively low market liquidity and the potential lack of strict financial and accounting controls and standards. |
| | Securities for which market prices are not provided by any of the above methods may be valued based upon quotes furnished by independent sources. The last bid price may be used to value equity securities. The mean between the last bid and asked prices is used to value debt obligations, including Corporate Loans. |
| | Securities for which market quotations are not readily available or are unreliable are valued at fair value as determined in good faith by or under the supervision of the Trust’s officers following procedures approved by the Board of Trustees. Issuer specific events, market trends, bid/ask quotes of brokers and information providers and other market data may be reviewed in the course of making a good faith determination of a security’s fair value. |
| | Valuations change in response to many factors including the historical and prospective earnings of the issuer, the value of the issuer’s assets, general economic conditions, interest rates, investor perceptions and market liquidity. Because of the inherent uncertainties of valuation, the values reflected in the consolidated financial statements may materially differ from the value received upon actual sale of those investments. |
| B. | | Securities Transactions and Investment Income — Securities transactions are accounted for on a trade date basis. Realized gains or losses on sales are computed on the basis of specific identification of the securities sold. Interest income is recorded on the accrual basis from settlement date. Dividend income (net of withholding tax, if any) is recorded on the ex-dividend date. Bond premiums and discounts are amortized and/or accreted for financial reporting purposes. |
14 Invesco Balanced-Risk Allocation Fund
| | |
| | The Fund may periodically participate in litigation related to Fund investments. As such, the Fund may receive proceeds from litigation settlements. Any proceeds received are included in the Consolidated Statement of Operations as realized gain (loss) for investments no longer held and as unrealized gain (loss) for investments still held. |
| | Brokerage commissions and mark ups are considered transaction costs and are recorded as an increase to the cost basis of securities purchased and/or a reduction of proceeds on a sale of securities. Such transaction costs are included in the determination of net realized and unrealized gain (loss) from investment securities reported in the Consolidated Statement of Operations and the Consolidated Statement of Changes in Net Assets and the net realized and unrealized gains (losses) on securities per share in the Consolidated Financial Highlights. Transaction costs are included in the calculation of the Fund’s net asset value and, accordingly, they reduce the Fund’s total returns. These transaction costs are not considered operating expenses and are not reflected in net investment income reported in the Consolidated Statement of Operations and Consolidated Statement of Changes in Net Assets, or the net investment income per share and ratios of expenses and net investment income reported in the Consolidated Financial Highlights, nor are they limited by any expense limitation arrangements between the Fund and the investment adviser. |
| | The Fund allocates income and realized and unrealized capital gains and losses to a class based on the relative net assets of each class. |
| C. | | Country Determination — For the purposes of making investment selection decisions and presentation in the Consolidated Schedule of Investments, the investment adviser may determine the country in which an issuer is located and/or credit risk exposure based on various factors. These factors include the laws of the country under which the issuer is organized, where the issuer maintains a principal office, the country in which the issuer derives 50% or more of its total revenues and the country that has the primary market for the issuer’s securities, as well as other criteria. Among the other criteria that may be evaluated for making this determination are the country in which the issuer maintains 50% or more of its assets, the type of security, financial guarantees and enhancements, the nature of the collateral and the sponsor organization. Country of issuer and/or credit risk exposure has been determined to be the United States of America, unless otherwise noted. |
| D. | | Distributions — Distributions from income and net realized capital gain, if any, are generally paid annually and recorded on ex-dividend date. The Fund may elect to treat a portion of the proceeds from redemptions as distributions for federal income tax purposes. |
| E. | | Federal Income Taxes — The Fund intends to comply with the requirements of Subchapter M of the Internal Revenue Code necessary to qualify as a regulated investment company and to distribute substantially all of the Fund’s taxable earnings to shareholders. As such, the Fund will not be subject to federal income taxes on otherwise taxable income (including net realized capital gain) that is distributed to shareholders. Therefore, no provision for federal income taxes is recorded in the consolidated financial statements. |
| | The Subsidiary is classified as a controlled foreign corporation under Subchapter N of the Internal Revenue Code. Therefore, the Fund is required to increase its taxable income by its share of the Subsidiary’s income. Net investment losses of the Subsidiary cannot be deducted by the Fund in the current period nor carried forward to offset taxable income in future periods. |
| | The Fund files tax returns in the U.S. Federal jurisdiction and certain other jurisdictions. Generally the Fund is subject to examinations by such taxing authorities for up to three years after the filing of the return for the tax period. |
| | The Fund files tax returns in the U.S. Federal jurisdiction and certain other jurisdictions. Generally, the Fund is subject to examinations by such taxing authorities for up to three years after the filing of the return for the tax period. |
| F. | | Expenses — Fees provided for under the Rule 12b-1 plan of a particular class of the Fund are charged to the operations of such class. Transfer agency fees and expenses and other shareholder recordkeeping fees and expenses attributable to the Institutional Class are charged to such class. Transfer agency fees and expenses and other shareholder recordkeeping fees and expenses relating to all other classes are allocated among those classes based on relative net assets. All other expenses are allocated among the classes based on relative net assets. |
| G. | | Accounting Estimates — The financial statements are prepared on a consolidated basis in conformity with accounting principles generally accepted in the United States of America (“GAAP”), which requires management to make estimates and assumptions that affect the reported amounts of assets and liabilities at the date of the financial statements and the reported amounts of revenues and expenses during the reporting period including estimates and assumptions related to taxation. Actual results could differ from those estimates by a significant amount. The accompanying financial statements reflect the financial position of the Fund and its Subsidiary and the results of operations on a consolidated basis. All inter-company accounts and transactions have been eliminated in consolidation. |
| | In addition, the Fund monitors for material events or transactions that may occur or become known after the period-end date and before the date the consolidated financial statements are released to print. |
| H. | | Indemnifications — Under the Trust’s organizational documents, each Trustee, officer, employee or other agent of the Trust, and under the Subsidiary’s organizational documents, the directors and officers of the Subsidiary, are indemnified against certain liabilities that may arise out of performance of their duties to the Fund and/or the Subsidiary, respectively. Additionally, in the normal course of business, the Fund enters into contracts, including the Fund’s servicing agreements, that contain a variety of indemnification clauses. The Fund’s maximum exposure under these arrangements is unknown as this would involve future claims that may be made against the Fund that have not yet occurred. The risk of material loss as a result of such indemnification claims is considered remote. |
| I. | | Futures Contracts — The Fund may enter into futures contracts to manage exposure to interest rate, equity and market price movements and/or currency risks. A futures contract is an agreement between two parties to purchase or sell a specified underlying security, currency or commodity (or delivery of a cash settlement price, in the case of an index future) for a fixed price at a future date. The Fund currently invests only in exchange-traded futures and they are standardized as to maturity date and underlying financial instrument. Initial margin deposits required upon entering into futures contracts are satisfied by the segregation of specific securities or cash as collateral at the futures commission merchant (broker). During the period the futures contracts are open, changes in the value of the contracts are recognized as unrealized gains or losses by recalculating the value of the contracts on a daily basis. Subsequent or variation margin payments are received or made depending upon whether unrealized gains or losses are incurred. These amounts are reflected as receivables or payables on the Consolidated Statement of Assets and Liabilities. When the contracts are closed or expire, the Fund recognizes a realized gain or loss equal to the difference between the proceeds from, or cost of, the closing transaction and the Fund’s basis in the contract. |
15 Invesco Balanced-Risk Allocation Fund
| | |
| | The net realized gain (loss) and the change in unrealized gain (loss) on futures contracts held during the period is included on the Consolidated Statement of Operations. The primary risks associated with futures contracts are market risk and the absence of a liquid secondary market. If the Fund were unable to liquidate a futures contract and/or enter into an offsetting closing transaction, the Fund would continue to be subject to market risk with respect to the value of the contracts and continue to be required to maintain the margin deposits on the futures contracts. Futures contracts have minimal counterparty risk since the exchange’s clearinghouse, as counterparty to all exchange-traded futures, guarantees the futures against default. Risks may exceed amounts recognized in the Consolidated Statement of Assets and Liabilities. |
| J. | | Swap Agreements — The Fund may enter into various swap transactions, including interest rate, total return, index, currency exchange rate and credit default swap contracts (“CDS”) for investment purposes or to manage interest rate, currency or credit risk. |
| | Interest rate, total return, index, and currency exchange rate swap agreements are two-party contracts entered into primarily to exchange the returns (or differentials in rates of returns) earned or realized on particular predetermined investments or instruments. The gross returns to be exchanged or “swapped” between the parties are calculated with respect to a notional amount, i.e., the return on or increase in value of a particular dollar amount invested at a particular interest rate or return of an underlying asset, in a particular foreign currency, or in a “basket” of securities representing a particular index. |
| | A CDS is an agreement between two parties (“Counterparties”) to exchange the credit risk of an issuer. A buyer of a CDS is said to buy protection by paying a fixed payment over the life of the agreement and in some situations an upfront payment to the seller of the CDS. If a defined credit event occurs (such as payment default or bankruptcy), the Fund as a protection buyer would cease paying its fixed payment, the Fund would deliver eligible bonds issued by the reference entity to the seller, and the seller would pay the full notional value, or the “par value”, of the referenced obligation to the Fund. A seller of a CDS is said to sell protection and thus would receive a fixed payment over the life of the agreement and an upfront payment, if applicable. If a credit event occurs, the Fund as a protection seller would cease to receive the fixed payment stream, the Fund would pay the buyer “par value” or the full notional value of the referenced obligation, and the Fund would receive the eligible bonds issued by the reference entity. In turn, these bonds may be sold in order to realize a recovery value. Alternatively, the seller of the CDS and its counterparty may agree to net the notional amount and the market value of the bonds and make a cash payment equal to the difference to the buyer of protection. If no credit event occurs, the Fund receives the fixed payment over the life of the agreement. As the seller, the Fund would effectively add leverage to its portfolio because, in addition to its total net assets, the Fund would be subject to investment exposure on the notional amount of the CDS. In connection with these agreements, cash and securities may be identified as collateral in accordance with the terms of the respective swap agreements to provide assets of value and recourse in the event of default under the swap agreement or bankruptcy/insolvency of a party to the swap agreement. If a counterparty becomes bankrupt or otherwise fails to perform its obligations due to financial difficulties, the Fund may experience significant delays in obtaining any recovery in a bankruptcy or other reorganization proceeding. The Fund may obtain only limited recovery or may obtain no recovery in such circumstances. |
| | Implied credit spreads represent the current level at which protection could be bought or sold given the terms of the existing CDS contract and serve as an indicator of the current status of the payment/performance risk of the CDS. An implied spread that has widened or increased since entry into the initial contract may indicate a deteriorating credit profile and increased risk of default for the reference entity. A declining or narrowing spread may indicate an improving credit profile or decreased risk of default for the reference entity. Alternatively, credit spreads may increase or decrease reflecting the general tolerance for risk in the credit markets. |
| | Changes in the value of swap agreements are recognized as unrealized gains (losses) in the Consolidated Statement of Operations by “marking to market” on a daily basis to reflect the value of the swap agreement at the end of each trading day. Payments received or paid at the beginning of the agreement are reflected as such on the Consolidated Statement of Assets and Liabilities and may be referred to as upfront payments. The Fund accrues for the fixed payment stream and amortizes upfront payments, if any, on swap agreements on a daily basis with the net amount, recorded as a component of realized gain (loss) on the Consolidated Statement of Operations. A liquidation payment received or made at the termination of a swap agreement is recorded as realized gain (loss) on the Consolidated Statement of Operations. The Fund segregates liquid securities having a value at least equal to the amount of the potential obligation of a Fund under any swap transaction. The Fund’s maximum risk of loss from counterparty risk, either as the protection seller or as the protection buyer, is the value of the contract. The risk may be mitigated by having a master netting arrangement between the Fund and the counterparty and by the posting of collateral by the counterparty to cover the Fund’s exposure to the counterparty. Entering into these agreements involves, to varying degrees, lack of liquidity and elements of credit, market, and counterparty risk in excess of amounts recognized on the Consolidated Statement of Assets and Liabilities. Such risks involve the possibility that a swap is difficult to sell or liquidate; the counterparty does not honor its obligations under the agreement and unfavorable interest rates and market fluctuations. |
| K. | | Other Risks — The Fund will seek to gain exposure to commodity markets primarily through an investment in the Subsidiary and through investments in exchange traded funds. The Subsidiary, unlike the Fund, may invest without limitation in commodities, commodity-linked derivatives and other securities, such as exchange traded notes, that may provide leverage and non-leveraged exposure to commodity markets. The Fund is indirectly exposed to the risks associated with the Subsidiary’s investments. |
| | The Fund is non-diversified and may invest in securities of fewer issuers than if it were diversified. Thus, the value of the Fund’s shares may vary more widely and the Fund may be subject to greater market and credit risk than if the Fund invested more broadly. |
| L. | | Collateral — To the extent the Fund has pledged or segregated a security as collateral and that security is subsequently sold, it is the Fund’s practice to replace such collateral no later than the next business day. |
16 Invesco Balanced-Risk Allocation Fund
NOTE 2—Advisory Fees and Other Fees Paid to Affiliates
The Trust has entered into a master investment advisory agreement with Invesco Advisers, Inc. (the “Adviser” or “Invesco”). Under the terms of the investment advisory agreement, the Fund pays an advisory fee to the Adviser based on the annual rate of the Fund’s average daily net assets as follows:
| | | | | |
| Average Net Assets | | Rate |
| |
| First $250 million | | | 0 | .95% |
| |
| Next $250 million | | | 0 | .925% |
| |
| Next $500 million | | | 0 | .90% |
| |
| Next $1.5 billion | | | 0 | .875% |
| |
| Next $2.5 billion | | | 0 | .85% |
| |
| Next $2.5 billion | | | 0 | .825% |
| |
| Next $2.5 billion | | | 0 | .80% |
| |
| Over $10 billion | | | 0 | .775% |
| |
Under the terms of a master sub-advisory agreement between the Adviser and each of Invesco Asset Management Deutschland GmbH, Invesco Asset Management Limited, Invesco Asset Management (Japan) Limited, Invesco Australia Limited, Invesco Hong Kong Limited, Invesco Senior Secured Management, Inc. and Invesco Canada Ltd. (collectively, the “Affiliated Sub-Advisers”) the Adviser, not the Fund, may pay 40% of the fees paid to the Adviser to any such Affiliated Sub-Adviser(s) that provide discretionary investment management services to the Fund based on the percentage of assets allocated to such Sub-Adviser(s).
The Subsidiary has entered into a separate contract with the Adviser whereby the Adviser provides investment advisory and other services to the Subsidiary. In consideration of these services, the Subsidiary pays an advisory fee to the Adviser based on the annual rate of the Subsidiary’s average daily net assets as set forth in the table above.
The Adviser has contractually agreed, through at least February 28, 2012, to waive advisory fees and/or reimburse expenses to the extent necessary to limit total annual operating expenses after fee waiver and/or expense reimbursement (excluding certain items discussed below) of Class A, Class B, Class C, Class R, Class Y and Institutional Class shares to 1.04%, 1.79%, 1.79%, 1.29%, 0.79% and 0.79% of average daily net assets, respectively. In determining the Adviser’s obligation to waive advisory fees and/or reimburse expenses, the following expenses are not taken into account, and could cause the total annual operating expenses after fee waiver and/or reimbursement to exceed the numbers reflected above: (1) interest; (2) taxes; (3) dividend expense on short sales; (4) extraordinary or non-routine items; (5) expenses of the underlying funds that are paid indirectly as a result of share ownership of the underlying funds; and (6) expenses that the Fund has incurred but did not actually pay because of an expense offset arrangement. Unless the Board of the Trustees and Invesco mutually agree to amend or continue the fee waiver agreement, it will terminate on February 28, 2012.
Further, the Adviser has contractually agreed, through at least June 30, 2012, to waive the advisory fee payable by the Fund in an amount equal to 100% of the net advisory fees the Adviser receives from the affiliated money market funds on investments by the Fund of uninvested cash in such affiliated money market funds.
For the year ended October 31, 2011, the Adviser waived advisory fees $2,154,920 and reimbursed class level expenses of $414,280, $12,825, $152,285, $1,377, $162,731, and $2,462 of Class A, Class B, Class C, Class R, Class Y and Institutional Class shares, respectively.
At the request of the Trustees of the Trust, Invesco Ltd. agreed to reimburse expenses incurred by the Fund in connection with market timing matters in the Invesco Funds, which may include legal, audit, shareholder reporting, communications and trustee expenses. These expenses along with the related expense reimbursement are included in the Consolidated Statement of Operations. For the year ended October 31, 2011, Invesco Ltd. reimbursed expenses of the Fund in the amount of $448.
The Trust has entered into a master administrative services agreement with Invesco pursuant to which the Fund has agreed to pay Invesco for certain administrative costs incurred in providing accounting services to the Fund. For the year ended October 31, 2011, expenses incurred under the agreement are shown in the Consolidated Statement of Operations as administrative services fees.
The Trust has entered into a transfer agency and service agreement with Invesco Investment Services, Inc. (“IIS”) pursuant to which the Fund has agreed to pay IIS a fee for providing transfer agency and shareholder services to the Fund and reimburse IIS for certain expenses incurred by IIS in the course of providing such services. IIS may make payments to intermediaries that provide omnibus account services, sub-accounting services and/or networking services. All fees payable by IIS to intermediaries that provide omnibus account services or sub-accounting are charged back to the Fund, subject to certain limitations approved by the Trust’s Board of Trustees. For the year ended October 31, 2011, expenses incurred under the agreement are shown in the Consolidated Statement of Operations as transfer agent fees.
The Trust has entered into master distribution agreements with Invesco Distributors, Inc. (“IDI”) to serve as the distributor for the Class A, Class B, Class C, Class R, Class Y and Institutional Class shares of the Fund. The Trust has adopted plans pursuant to Rule 12b-1 under the 1940 Act with respect to the Fund’s Class A, Class B, Class C and Class R shares (collectively, the “Plans”). The Fund, pursuant to the Plans, pays IDI compensation at the annual rate of 0.25% of the Fund’s average daily net assets of Class A shares, 1.00% of the average daily net assets of Class B and Class C shares and 0.50% of the average daily net assets of Class R shares. Of the Plan payments, up to 0.25% of the average daily net assets of each class of shares may be paid to furnish continuing personal shareholder services to customers who purchase and own shares of such classes. Any amounts not paid as a service fee under the Plans would constitute an asset-based sales charge. Rules of the Financial Industry Regulatory Authority (“FINRA”) impose a cap on the total sales charges, including asset-based sales charges that may be paid by any class of shares of the Fund. For the year ended October 31, 2011, expenses incurred under the Plans are shown in the Consolidated Statement of Operations as distribution fees.
Front-end sales commissions and CDSC (collectively, the “sales charges”) are not recorded as expenses of the Fund. Front-end sales commissions are deducted from proceeds from the sales of Fund shares prior to investment in Class A shares of the Fund. CDSC are deducted from redemption proceeds prior to remittance to the shareholder. During the year ended October 31, 2011, IDI advised the Fund that IDI retained $607,362 in front-end sales commissions from the sale of Class A shares and $22,301, $14,602 and $51,546 from Class A, Class B and Class C shares, respectively, for CDSC imposed on redemptions by shareholders.
17 Invesco Balanced-Risk Allocation Fund
Certain officers and trustees of the Trust are officers and directors of the Adviser, Invesco Ltd., IIS and/or IDI.
NOTE 3—Additional Valuation Information
GAAP defines fair value as the price that would be received to sell an asset or paid to transfer a liability in an orderly transaction between market participants at the measurement date, under current market conditions. GAAP establishes a hierarchy that prioritizes the inputs to valuation methods giving the highest priority to readily available unadjusted quoted prices in an active market for identical assets (Level 1) and the lowest priority to significant unobservable inputs (Level 3) generally when market prices are not readily available or are unreliable. Based on the valuation inputs, the securities or other investments are tiered into one of three levels. Changes in valuation methods may result in transfers in or out of an investment’s assigned level:
| | |
| | Level 1 — | Prices are determined using quoted prices in an active market for identical assets. |
| | Level 2 — | Prices are determined using other significant observable inputs. Observable inputs are inputs that other market participants may use in pricing a security. These may include quoted prices for similar securities, interest rates, prepayment speeds, credit risk, yield curves, loss severities, default rates, discount rates, volatilities and others. |
| | Level 3 — | Prices are determined using significant unobservable inputs. In situations where quoted prices or observable inputs are unavailable (for example, when there is little or no market activity for an investment at the end of the period), unobservable inputs may be used. Unobservable inputs reflect the Fund’s own assumptions about the factors market participants would use in determining fair value of the securities or instruments and would be based on the best available information. |
The following is a summary of the tiered valuation input levels, as of October 31, 2011. The level assigned to the securities valuations may not be an indication of the risk or liquidity associated with investing in those securities. Because of the inherent uncertainties of valuation, the values reflected in the consolidated financial statements may materially differ from the value received upon actual sale of those investments.
During the year ended October 31, 2011, there were no significant transfers between investment levels.
| | | | | | | | | | | | | | | | | |
| | | Level 1 | | Level 2 | | Level 3 | | Total |
| |
| Exchange-Traded Funds | | $ | 86,498,290 | | | $ | — | | | $ | — | | | $ | 86,498,290 | |
| |
| Money Market Funds | | | 1,728,159,510 | | | | — | | | | — | | | | 1,728,159,510 | |
| |
| U.S. Treasury Debt Securities | | | — | | | | 390,995,242 | | | | — | | | | 390,995,242 | |
| |
| | | $ | 1,814,657,800 | | | $ | 390,995,242 | | | $ | — | | | $ | 2,205,653,042 | |
| |
| Futures and swap agreements* | | | 73,906,671 | | | | (4,403,271 | ) | | | — | | | | 69,503,400 | |
| |
| Total Investments | | $ | 1,888,564,471 | | | $ | 386,591,971 | | | $ | — | | | $ | 2,275,156,442 | |
| |
| |
| * | Unrealized appreciation (depreciation). |
NOTE 4—Derivative Investments
The Fund has implemented the required disclosures about derivative instruments and hedging activities in accordance with GAAP. This disclosure is intended to improve financial reporting about derivative instruments and hedging activities by requiring enhanced disclosures to enable investors to better understand their effects on an entity’s financial position and financial performance. The enhanced disclosure has no impact on the results of operations reported in the consolidated financial statements.
Value of Derivative Instruments at Period-End
The table below summarizes the value of the Fund’s derivative instruments, detailed by primary risk exposure, held as of October 31, 2011:
| | | | | | | | | |
| | | Value |
| Risk Exposure/Derivative Type | | Assets | | Liabilities |
| |
| Commodity risk | | | | | | | | |
Futures contracts(a) | | $ | 41,581,468 | | | $ | — | |
| |
| Commodity risk | | | | | | | | |
Swap agreements(b) | | | — | | | | (2,205,419 | ) |
| |
| Interest rate risk | | | | | | | | |
Futures contracts(a) | | | 5,823,885 | | | | (14,540,837 | ) |
| |
| Interest rate risk | | | | | | | | |
Swap agreements(b) | | | 1,467,294 | | | | (3,665,146 | ) |
| |
| Market risk | | | | | | | | |
Futures contracts(a) | | | 41,042,155 | | | | — | |
| |
| | | $ | 89,914,802 | | | $ | (20,411,402 | ) |
| |
| | |
| (a) | | Includes cumulative appreciation (depreciation) of futures contracts. Only current day’s variation margin receivable (payable) is reported within the Consolidated Statement of Assets & Liabilities. |
| (b) | | Values are disclosed on the Consolidated Statement of Assets and Liabilities under Unrealized depreciation on swap agreements. |
18 Invesco Balanced-Risk Allocation Fund
Effect of Derivative Instruments for the year ended October 31, 2011
The table below summarizes the gains (losses) on derivative instruments, detailed by primary risk exposure, recognized in earnings during the period:
| | | | | | | | | |
| | | Location of Gain (Loss) on
|
| | | Consolidated
|
| | | Statement of Operations |
| | | | | Swap
|
| | | Futures* | | Agreements* |
| |
| Realized Gain (Loss) | | | | | | | | |
| Commodity risk | | $ | (2,285,541 | ) | | $ | (21,646,404 | ) |
| |
| Interest rate risk | | | 76,816,088 | | | | 29,439,563 | |
| |
| Market risk | | | (26,627,120 | ) | | | — | |
| |
| Change in Unrealized Appreciation (Depreciation) | | | | | | | | |
| Commodity risk | | $ | 23,445,377 | | | $ | (2,205,419 | ) |
| |
| Interest rate risk | | | (10,532,288 | ) | | | 1,283,373 | |
| |
| Market risk | | | 36,759,929 | | | | — | |
| |
| Total | | $ | 97,576,445 | | | $ | 6,871,113 | |
| |
| |
| * | The average notional value of futures and swap agreements outstanding during the period was $1,436,619,256 and $620,448,381, respectively. |
NOTE 5—Expense Offset Arrangement(s)
The expense offset arrangement is comprised of transfer agency credits which result from balances in Demand Deposit Accounts (DDA) used by the transfer agent for clearing shareholder transactions. For the year ended October 31, 2011, the Fund received credits from this arrangement, which resulted in the reduction of the Fund’s total expenses of $183.
NOTE 6—Trustees’ and Officers’ Fees and Benefits
“Trustees’ and Officers’ Fees and Benefits” include amounts accrued by the Fund to pay remuneration to certain Trustees and Officers of the Fund. Trustees have the option to defer compensation payable by the Fund, and “Trustees’ and Officers’ Fees and Benefits” also include amounts accrued by the Fund to fund such deferred compensation amounts. Those Trustees who defer compensation have the option to select various Invesco Funds in which their deferral accounts shall be deemed to be invested. Finally, certain current Trustees are eligible to participate in a retirement plan that provides for benefits to be paid upon retirement to Trustees over a period of time based on the number of years of service. The Fund may have certain former Trustees who also participate in a retirement plan and receive benefits under such plan. “Trustees’ and Officers’ Fees and Benefits” include amounts accrued by the Fund to fund such retirement benefits. Obligations under the deferred compensation and retirement plans represent unsecured claims against the general assets of the Fund.
During the year ended October 31, 2011, the Fund paid legal fees of $2,900 for services rendered by Kramer, Levin, Naftalis & Frankel LLP as counsel to the Independent Trustees. A partner of that firm is a Trustee of the Trust.
NOTE 7—Cash Balances
The Fund is permitted to temporarily carry a negative or overdrawn balance in its account with The State Street Bank and Trust Company, the custodian bank. To compensate the custodian bank for such overdrafts, the overdrawn Fund may either (1) leave funds as a compensating balance in the account so the custodian bank can be compensated by earning the additional interest; or (2) compensate by paying the custodian bank at a rate agreed upon by the custodian bank and Invesco, not to exceed the contractually agreed upon rate.
NOTE 8—Distributions to Shareholders and Tax Components of Net Assets
Tax Character of Distributions to Shareholders Paid During the Years Ended October 31, 2011 and 2010:
| | | | | | | | | |
| | | 2011 | | 2010 |
| |
| Ordinary income | | $ | 45,215,259 | | | $ | 13,550,355 | |
| |
| Long-term capital gain | | | 4,208,462 | | | | 1,406,786 | |
| |
| Total distributions | | $ | 49,423,721 | | | $ | 14,957,141 | |
| |
19 Invesco Balanced-Risk Allocation Fund
Tax Components of Net Assets at Period-End:
| | | | | |
| | | 2011 |
| |
| Undistributed ordinary income | | $ | 80,572,187 | |
| |
| Undistributed long-term gain | | | 29,439,654 | |
| |
| Net unrealized appreciation (depreciation) — investments | | | (7,123,667 | ) |
| |
| Net unrealized appreciation — other investments | | | 16,291,746 | |
| |
| Temporary book/tax differences | | | (21,551 | ) |
| |
| Shares of beneficial interest | | | 2,288,774,334 | |
| |
| Total net assets | | $ | 2,407,932,703 | |
| |
The difference between book-basis and tax-basis unrealized appreciation (depreciation) is due to differences in the timing of recognition of gains and losses on investments for tax and book purposes. The Fund’s net unrealized appreciation (depreciation) difference is attributable primarily to wash sales and partnership distributions.
The temporary book/tax differences are a result of timing differences between book and tax recognition of income and/or expenses. The Fund’s temporary book/tax differences are the result of the trustee deferral of compensation and retirement plan benefits.
The Fund does not have a capital loss carryforward at period-end.
NOTE 9—Investment Securities
The aggregate amount of investment securities (other than short-term securities, U.S. Treasury obligations and money market funds, if any) purchased and sold by the Fund during the year ended October 31, 2011 was $95,491,155 and $99,438,089, respectively. Cost of investments on a tax basis includes the adjustments for financial reporting purposes as of the most recently completed Federal income tax reporting period-end.
| | | | | |
| Unrealized Appreciation (Depreciation) of Investment Securities on a Tax Basis |
| Aggregate unrealized appreciation of investment securities | | $ | — | |
| |
| Aggregate unrealized (depreciation) of investment securities | | | (7,123,667 | ) |
| |
| Net unrealized appreciation (depreciation) of investment securities | | $ | (7,123,667 | ) |
| |
| Cost of investments for tax purposes is $2,212,776,709. |
NOTE 10—Reclassification of Permanent Differences
Primarily as a result of differing book/tax treatment of foreign currency transactions and income from Subsidiary, on October 31, 2011, undistributed net investment income (loss) was increased by $79,874,542, undistributed net realized gain was decreased by $90,575,464 and shares of beneficial interest increased by $10,700,922. This reclassification had no effect on the net assets of the Fund.
20 Invesco Balanced-Risk Allocation Fund
NOTE 11—Share Information
| | | | | | | | | | | | | | | | | |
| | | Summary of Share Activity |
| |
| | | Year ended October 31, |
| | | 2011(a) | | 2010 |
| | | Shares | | Amount | | Shares | | Amount |
| |
| Sold: | | | | | | | | | | | | | | | | |
| Class A | | | 77,006,398 | | | $ | 905,075,428 | | | | 17,006,929 | | | $ | 189,637,788 | |
| |
| Class B | | | 970,373 | | | | 11,143,264 | | | | 828,081 | | | | 9,130,308 | |
| |
| Class C | | | 28,895,408 | | | | 333,944,506 | | | | 4,864,373 | | | | 54,069,170 | |
| |
| Class R | | | 202,476 | | | | 2,329,459 | | | | 45,828 | | | | 498,616 | |
| |
| Class Y | | | 46,866,632 | | | | 557,052,969 | | | | 5,954,547 | | | | 67,283,795 | |
| |
| Institutional Class | | | 5,536,932 | | | | 64,421,922 | | | | 30,216,155 | | | | 329,781,250 | |
| |
| Issued as reinvestment of dividends: | | | | | | | | | | | | | | | | |
| Class A | | | 1,061,138 | | | | 11,555,797 | | | | 122,084 | | | | 1,269,678 | |
| |
| Class B | | | 55,081 | | | | 593,775 | | | | 5,491 | | | | 56,885 | |
| |
| Class C | | | 341,362 | | | | 3,676,476 | | | | 24,987 | | | | 258,863 | |
| |
| Class R | | | 3,336 | | | | 36,167 | | | | 1,079 | | | | 11,194 | |
| |
| Class Y | | | 270,713 | | | | 2,956,189 | | | | 26,207 | | | | 272,815 | |
| |
| Institutional Class | | | 2,311,242 | | | | 25,238,765 | | | | 1,205,839 | | | | 12,552,788 | |
| |
| Automatic conversion of Class B shares to Class A shares: | | | | | | | | | | | | | | | | |
| Class A | | | 190,907 | | | | 2,199,780 | | | | 25,411 | | | | 282,103 | |
| |
| Class B | | | (193,459 | ) | | | (2,199,780 | ) | | | (25,246 | ) | | | (282,103 | ) |
| |
| Reacquired: | | | | | | | | | | | | | | | | |
| Class A | | | (12,654,336 | ) | | | (145,933,931 | ) | | | (1,027,151 | ) | | | (11,261,325 | ) |
| |
| Class B | | | (170,815 | ) | | | (1,943,192 | ) | | | (55,463 | ) | | | (595,565 | ) |
| |
| Class C | | | (1,776,699 | ) | | | (20,292,112 | ) | | | (168,730 | ) | | | (1,851,358 | ) |
| |
| Class R | | | (9,440 | ) | | | (108,809 | ) | | | (2,285 | ) | | | (25,351 | ) |
| |
| Class Y | | | (6,817,430 | ) | | | (78,858,081 | ) | | | (812,478 | ) | | | (8,879,427 | ) |
| |
| Institutional Class | | | (10,504,779 | ) | | | (122,101,153 | ) | | | (11,893,436 | ) | | | (130,923,732 | ) |
| |
| Net increase in share activity | | | 131,585,040 | | | $ | 1,548,787,439 | | | | 46,342,222 | | | $ | 511,286,392 | |
| |
| | |
| (a) | | There are entities that are record owners of more than 5% of the outstanding shares of the Fund and in the aggregate own 54% of the outstanding shares of the Fund. IDI has an agreement with these entities to sell Fund shares. The Fund, Invesco and/or Invesco affiliates may make payments to these entities, which are considered to be related to the Fund, for providing services to the Fund, Invesco and/or Invesco affiliates including but not limited to services such as securities brokerage, distribution, third party record keeping and account servicing. The Fund has no knowledge as to whether all or any portion of the shares owned of record by these entities are also owned beneficially. |
| | |
| | In addition, 17% of the outstanding shares of the Fund are owned by affiliated mutual funds. Affiliated mutual funds are other mutual funds that are also advised by Invesco. |
21 Invesco Balanced-Risk Allocation Fund
NOTE 12—Consolidated Financial Highlights
The following schedule presents financial highlights for a share of the Fund outstanding throughout the periods indicated.
| | | | | | | | | | | | | | | | | | | | | | | | | | | | | | | | | | | | | | | | | | | | | | | | | | | | | | | | | |
| | | | | | | | | | | | | | | | | | | | | | | Ratio of
| | Ratio of
| | | | |
| | | | | | | | | | | | | | | | | | | | | | | expenses
| | expenses
| | | | |
| | | | | | | Net gains
| | | | | | | | | | | | | | | | to average
| | to average net
| | Ratio of net
| | |
| | | Net asset
| | Net
| | on securities
| | | | Dividends
| | Distributions
| | | | | | | | | | net assets
| | assets without
| | investment
| | |
| | | value,
| | investment
| | (both
| | Total from
| | from net
| | from net
| | | | Net asset
| | | | Net assets,
| | with fee waivers
| | fee waivers
| | income (loss)
| | |
| | | beginning
| | income
| | realized and
| | investment
| | investment
| | realized
| | Total
| | value, end
| | Total
| | end of period
| | and/or expenses
| | and/or expenses
| | to average
| | Portfolio
|
| | | of period | | (loss)(a) | | unrealized) | | operations | | income | | gains | | distributions | | of period | | return(b) | | (000s omitted) | | absorbed | | absorbed | | net assets | | turnover(c) |
| |
| Class A |
| Year ended 10/31/11 | | $ | 11.68 | | | $ | (0.11 | ) | | $ | 1.11 | | | $ | 1.00 | | | $ | (0.47 | ) | | $ | (0.20 | ) | | $ | (0.67 | ) | | $ | 12.01 | | | | 9.13 | % | | $ | 1,001,088 | | | | 1.04 | %(d) | | | 1.31 | %(d) | | | (0.95 | )%(d) | | | 33 | % |
| Year ended 10/31/10 | | | 10.72 | | | | (0.10 | ) | | | 1.61 | | | | 1.51 | | | | (0.21 | ) | | | (0.34 | ) | | | (0.55 | ) | | | 11.68 | | | | 14.76 | | | | 207,600 | | | | 1.04 | | | | 1.42 | | | | (0.93 | ) | | | 15 | |
| Year ended 10/31/09(e) | | | 10.00 | | | | (0.05 | ) | | | 0.77 | | | | 0.72 | | | | — | | | | — | | | | — | | | | 10.72 | | | | 7.20 | | | | 17,667 | | | | 1.24 | (f) | | | 1.64 | (f) | | | (1.02 | )(f) | | | 116 | |
| |
| Class B |
| Year ended 10/31/11 | | | 11.56 | | | | (0.19 | ) | | | 1.09 | | | | 0.90 | | | | (0.45 | ) | | | (0.20 | ) | | | (0.65 | ) | | | 11.81 | | | | 8.30 | | | | 17,722 | | | | 1.79 | (d) | | | 2.06 | (d) | | | (1.70 | )(d) | | | 33 | |
| Year ended 10/31/10 | | | 10.68 | | | | (0.19 | ) | | | 1.61 | | | | 1.42 | | | | (0.20 | ) | | | (0.34 | ) | | | (0.54 | ) | | | 11.56 | | | | 13.95 | | | | 9,707 | | | | 1.79 | | | | 2.17 | | | | (1.68 | ) | | | 15 | |
| Year ended 10/31/09(e) | | | 10.00 | | | | (0.08 | ) | | | 0.76 | | | | 0.68 | | | | — | | | | — | | | | — | | | | 10.68 | | | | 6.80 | | | | 930 | | | | 1.99 | (f) | | | 2.39 | (f) | | | (1.77 | )(f) | | | 116 | |
| |
| Class C |
| Year ended 10/31/11 | | | 11.56 | | | | (0.19 | ) | | | 1.08 | | | | 0.89 | | | | (0.45 | ) | | | (0.20 | ) | | | (0.65 | ) | | | 11.80 | | | | 8.21 | | | | 383,786 | | | | 1.79 | (d) | | | 2.06 | (d) | | | (1.70 | )(d) | | | 33 | |
| Year ended 10/31/10 | | | 10.68 | | | | (0.19 | ) | | | 1.61 | | | | 1.42 | | | | (0.20 | ) | | | (0.34 | ) | | | (0.54 | ) | | | 11.56 | | | | 13.95 | | | | 58,377 | | | | 1.79 | | | | 2.17 | | | | (1.68 | ) | | | 15 | |
| Year ended 10/31/09(e) | | | 10.00 | | | | (0.08 | ) | | | 0.76 | | | | 0.68 | | | | — | | | | — | | | | — | | | | 10.68 | | | | 6.80 | | | | 3,542 | | | | 1.99 | (f) | | | 2.39 | (f) | | | (1.77 | )(f) | | | 116 | |
| |
| Class R |
| Year ended 10/31/11 | | | 11.63 | | | | (0.14 | ) | | | 1.10 | | | | 0.96 | | | | (0.46 | ) | | | (0.20 | ) | | | (0.66 | ) | | | 11.93 | | | | 8.84 | | | | 2,956 | | | | 1.29 | (d) | | | 1.56 | (d) | | | (1.20 | )(d) | | | 33 | |
| Year ended 10/31/10 | | | 10.71 | | | | (0.13 | ) | | | 1.60 | | | | 1.47 | | | | (0.21 | ) | | | (0.34 | ) | | | (0.55 | ) | | | 11.63 | | | | 14.36 | | | | 597 | | | | 1.29 | | | | 1.67 | | | | (1.18 | ) | | | 15 | |
| Year ended 10/31/09(e) | | | 10.00 | | | | (0.06 | ) | | | 0.77 | | | | 0.71 | | | | — | | | | — | | | | — | | | | 10.71 | | | | 7.10 | | | | 72 | | | | 1.49 | (f) | | | 1.89 | (f) | | | (1.27 | )(f) | | | 116 | |
| |
| Class Y |
| Year ended 10/31/11 | | | 11.71 | | | | (0.08 | ) | | | 1.11 | | | | 1.03 | | | | (0.47 | ) | | | (0.20 | ) | | | (0.67 | ) | | | 12.07 | | | | 9.45 | | | | 553,001 | | | | 0.79 | (d) | | | 1.06 | (d) | | | (0.70 | )(d) | | | 33 | |
| Year ended 10/31/10 | | | 10.73 | | | | (0.08 | ) | | | 1.61 | | | | 1.53 | | | | (0.21 | ) | | | (0.34 | ) | | | (0.55 | ) | | | 11.71 | | | | 14.97 | | | | 64,428 | | | | 0.79 | | | | 1.17 | | | | (0.68 | ) | | | 15 | |
| Year ended 10/31/09(e) | | | 10.00 | | | | (0.03 | ) | | | 0.76 | | | | 0.73 | | | | — | | | | — | | | | — | | | | 10.73 | | | | 7.30 | | | | 3,558 | | | | 0.99 | (f) | | | 1.39 | (f) | | | (0.77 | )(f) | | | 116 | |
| |
| Institutional Class |
| Year ended 10/31/11 | | | 11.72 | | | | (0.08 | ) | | | 1.11 | | | | 1.03 | | | | (0.48 | ) | | | (0.20 | ) | | | (0.68 | ) | | | 12.07 | | | | 9.36 | | | | 449,380 | | | | 0.79 | | | | 0.97 | | | | (0.70 | )(d) | | | 33 | |
| Year ended 10/31/10 | | | 10.73 | | | | (0.08 | ) | | | 1.62 | | | | 1.54 | | | | (0.21 | ) | | | (0.34 | ) | | | (0.55 | ) | | | 11.72 | | | | 15.06 | | | | 467,441 | | | | 0.79 | | | | 1.04 | | | | (0.68 | ) | | | 15 | |
| Year ended 10/31/09(e) | | | 10.00 | | | | (0.03 | ) | | | 0.76 | | | | 0.73 | | | | — | | | | — | | | | — | | | | 10.73 | | | | 7.30 | | | | 218,565 | | | | 0.99 | (f) | | | 1.17 | (f) | | | (0.77 | )(f) | | | 116 | |
| |
| | |
| (a) | | Calculated using average shares outstanding. |
| (b) | | Includes adjustments in accordance with accounting principles generally accepted in the United States of America and as such, the net asset value for financial reporting purposes and the returns based upon those net asset values may differ from the net asset value and returns for shareholder transactions. Does not include sales charges and is not annualized for periods less than one year, if applicable. |
| (c) | | Portfolio turnover is calculated at the fund level and is not annualized for periods less than one year, if applicable. |
| (d) | | Ratios are based on average daily net assets (000’s omitted) of $433,341, $13,415, $159,291, $1,441, $170,218 and $444,261 for Class A, Class B, Class C, Class R, Class Y and Institutional Class shares, respectively. |
| (e) | | Commencement date of June 2, 2009. |
| (f) | | Annualized. |
22 Invesco Balanced-Risk Allocation Fund
Report of Independent Registered Public Accounting Firm
To the Board of Trustees of AIM Investment Funds (Invesco Investment Funds)
and Shareholders of Invesco Balanced-Risk Allocation Fund:
In our opinion, the accompanying consolidated statement of assets and liabilities, including the consolidated schedule of investments, and the related consolidated statements of operations and of changes in net assets and the financial highlights present fairly, in all material respects, the consolidated financial position of Invesco Balanced-Risk Allocation Fund (one of the funds constituting AIM Investment Funds (Invesco Investment Funds), hereafter referred to as the “Fund”) at October 31, 2011, the results of its operations for the year then ended, the changes in its net assets for each of the two years in the period then ended and the financial highlights for each of the periods indicated, in conformity with accounting principles generally accepted in the United States of America. These consolidated financial statements and financial highlights (hereafter referred to as “financial statements”) are the responsibility of the Fund’s management; our responsibility is to express an opinion on these financial statements based on our audits. We conducted our audits of these financial statements in accordance with the standards of the Public Company Accounting Oversight Board (United States). Those standards require that we plan and perform the audit to obtain reasonable assurance about whether the financial statements are free of material misstatement. An audit includes examining, on a test basis, evidence supporting the amounts and disclosures in the financial statements, assessing the accounting principles used and significant estimates made by management, and evaluating the overall financial statement presentation. We believe that our audits, which included confirmation of securities at October 31, 2011 by correspondence with the custodian and brokers, provide a reasonable basis for our opinion.
PRICEWATERHOUSECOOPERS LLP
Houston, Texas
December 27, 2011
23 Invesco Balanced-Risk Allocation Fund
Calculating your ongoing Fund expenses
Example
As a shareholder of the Fund, you incur two types of costs: (1) transaction costs, which may include sales charges (loads) on purchase payments or contingent deferred sales charges on redemptions, and redemption fees, if any; and (2) ongoing costs, including management fees, distribution and/or service (12b-1) fees, and other Fund expenses. This example is intended to help you understand your ongoing costs (in dollars) of investing in the Fund and to compare these costs with ongoing costs of investing in other mutual funds. The example is based on an investment of $1,000 invested at the beginning of the period and held for the entire period May 1, 2011 through October 31, 2011.
Actual expenses
The table below provides information about actual account values and actual expenses. You may use the information in this table, together with the amount you invested, to estimate the expenses that you paid over the period. Simply divide your account value by $1,000 (for example, an $8,600 account value divided by $1,000 = 8.6), then multiply the result by the number in the table under the heading entitled “Actual Expenses Paid During Period” to estimate the expenses you paid on your account during this period.
Hypothetical example for comparison purposes
The table below also provides information about hypothetical account values and hypothetical expenses based on the Fund’s actual expense ratio and an assumed rate of return of 5% per year before expenses, which is not the Fund’s actual return.
The hypothetical account values and expenses may not be used to estimate the actual ending account balance or expenses you paid for the period. You may use this information to compare the ongoing costs of investing in the Fund and other funds. To do so, compare this 5% hypothetical example with the 5% hypothetical examples that appear in the shareholder reports of the other funds.
Please note that the expenses shown in the table are meant to highlight your ongoing costs only and do not reflect any transaction costs, such as sales charges (loads) on purchase payments, contingent deferred sales charges on redemptions, and redemption fees, if any. Therefore, the hypothetical information is useful in comparing ongoing costs only, and will not help you determine the relative total costs of owning different funds. In addition, if these transaction costs were included, your costs would have been higher.
| | | | | | | | | | | | | | | | | | | | | | | | | | | | | | | |
| | | | | | | | | | HYPOTHETICAL
| | | |
| | | | | | | ACTUAL | | | (5% annual return before expenses) | | | |
| | | | Beginning
| | | Ending
| | | Expenses
| | | Ending
| | | Expenses
| | | Annualized
|
| | | | Account Value
| | | Account Value
| | | Paid During
| | | Account Value
| | | Paid During
| | | Expense
|
| Class | | | (05/01/11) | | | (10/31/11)1 | | | Period2 | | | (10/31/11) | | | Period2 | | | Ratio |
| Class A | | | $ | 1,000.00 | | | | $ | 1,045.30 | | | | $ | 5.36 | | | | $ | 1,019.96 | | | | $ | 5.30 | | | | | 1.04 | % |
| | | | | | | | | | | | | | | | | | | | | | | | | | | | | | | |
| Class B | | | | 1,000.00 | | | | | 1,041.40 | | | | | 9.21 | | | | | 1,016.18 | | | | | 9.10 | | | | | 1.79 | |
| | | | | | | | | | | | | | | | | | | | | | | | | | | | | | | |
| Class C | | | | 1,000.00 | | | | | 1,040.60 | | | | | 9.21 | | | | | 1,016.18 | | | | | 9.10 | | | | | 1.79 | |
| | | | | | | | | | | | | | | | | | | | | | | | | | | | | | | |
| Class R | | | | 1,000.00 | | | | | 1,043.70 | | | | | 6.65 | | | | | 1,018.70 | | | | | 6.57 | | | | | 1.29 | |
| | | | | | | | | | | | | | | | | | | | | | | | | | | | | | | |
| Class Y | | | | 1,000.00 | | | | | 1,046.80 | | | | | 4.08 | | | | | 1,021.22 | | | | | 4.03 | | | | | 0.79 | |
| | | | | | | | | | | | | | | | | | | | | | | | | | | | | | | |
| Institutional | | | | 1,000.00 | | | | | 1,046.80 | | | | | 4.08 | | | | | 1,021.22 | | | | | 4.03 | | | | | 0.79 | |
| | | | | | | | | | | | | | | | | | | | | | | | | | | | | | | |
| |
| 1 | The actual ending account value is based on the actual total return of the Fund for the period May 1, 2011 through October 31, 2011, after actual expenses and will differ from the hypothetical ending account value which is based on the Fund’s expense ratio and a hypothetical annual return of 5% before expenses. |
| 2 | Expenses are equal to the Fund’s annualized expense ratio as indicated above multiplied by the average account value over the period, multiplied by 184/365 to reflect the most recent fiscal half year. |
24 Invesco Balanced-Risk Allocation Fund
Approval of Investment Advisory and Sub-Advisory Contracts
The Board of Trustees (the Board) of AIM Investment Funds (Invesco Investment Funds) Series is required under the Investment Company Act of 1940, as amended, to approve annually the renewal of the Invesco Balanced-Risk Allocation Fund (the Fund) investment advisory agreement with Invesco Advisers, Inc. (Invesco Advisers) and the Master Intergroup Sub-Advisory Contract for Mutual Funds (the sub-advisory contracts) with Invesco Asset Management Deutschland GmbH, Invesco Asset Management Limited, Invesco Asset Management (Japan) Limited, Invesco Australia Limited, Invesco Hong Kong Limited, Invesco Senior Secured Management, Inc. and Invesco Canada Ltd. (collectively, the Affiliated Sub-Advisers). During contract renewal meetings held on June 14-15, 2011, the Board as a whole, and the disinterested or “independent” Trustees, who comprise 80% of the Board, voting separately, approved the continuance of the Fund’s investment advisory agreement and the sub-advisory contracts for another year, effective July 1, 2011. In doing so, the Board considered the process that it follows in reviewing and approving the Fund’s investment advisory agreement and sub-advisory contracts and the information that it is provided. The Board determined that the Fund’s investment advisory agreement and the sub-advisory contracts are in the best interests of the Fund and its shareholders and the compensation to Invesco Advisers and the Affiliated Sub-Advisers under the agreements is fair and reasonable.
The Board’s Fund Evaluation Process
The Board’s Investments Committee has established three Sub-Committees, each of which is responsible for overseeing the management of a number of the series portfolios of the funds advised by Invesco Advisers (the Invesco Funds). The Sub-Committees meet throughout the year to review the performance of their assigned funds, including reviewing materials prepared under the direction of the independent Senior Officer, an officer of the Invesco Funds who reports directly to the independent Trustees. Over the course of each year, the Sub-Committees meet with portfolio managers for their assigned Invesco Funds and other members of management to review the performance, investment objective(s), policies, strategies and limitations and investment risks of these funds. The Sub-Committees meet regularly and at designated contract renewal meetings each year to conduct a review of the performance, fees, expenses, and other matters related to their assigned Invesco Funds. Each Sub-Committee recommends to the Investment Committee, which in turn recommends to the full Board, whether to approve the continuance of each Invesco Fund’s investment advisory agreement and sub-advisory contracts for another year.
During the contract renewal process, the Trustees receive comparative performance and fee data regarding the Invesco Funds prepared by Invesco Advisers and an independent company, Lipper, Inc. (Lipper). The Trustees also receive an independent written evaluation from the Senior Officer. The Senior Officer’s evaluation is prepared as part of his responsibility to manage the process by which the Invesco Funds’ proposed management fees are negotiated during the annual contract renewal process to ensure they are negotiated in a manner that is at arms’ length and reasonable. The independent Trustees are assisted in their annual evaluation of the Fund’s investment advisory agreement by the Senior Officer and by independent legal counsel. The independent Trustees also discuss the continuance of the investment advisory agreement and sub-advisory contracts in private sessions with the Senior Officer and counsel.
In evaluating the fairness and reasonableness of the Fund’s investment advisory agreement and sub-advisory contracts, the Board considered, among other things, the factors discussed below. The Trustees also considered information provided in connection with fund acquisitions approved by the Trustees to rationalize the Invesco Funds product range following the acquisition of the retail mutual fund business of Morgan Stanley (the Morgan Stanley Transaction). The Trustees recognized that the advisory fees for the Invesco Funds include advisory fees that are the result of years of review and negotiation between the Trustees and Invesco Advisers as well as advisory fees inherited from Morgan Stanley and Van Kampen funds acquired in the Morgan Stanley Transaction. The Trustees’ deliberations and conclusions in a particular year may be based in part on their deliberations and conclusions regarding these same arrangements throughout the year and in prior years. One Trustee may have weighed a particular piece of information differently than another Trustee.
The discussion below serves as the Senior Officer’s independent written evaluation with respect to the Fund’s investment advisory agreement as well as a discussion of the material factors and related conclusions that formed the basis for the Board’s approval of the Fund’s investment advisory agreement and sub-advisory contracts. Unless otherwise stated, this information is current as of June 15, 2011, and may not reflect consideration of factors that became known to the Board after that date, including, for example, changes to the Fund’s performance, advisory fees, expense limitations and/or fee waivers.
Factors and Conclusions and Summary of Independent Written Fee Evaluation
| |
| A. | Nature, Extent and Quality of Services Provided by Invesco Advisers and the Affiliated Sub-Advisers |
The Board reviewed the advisory services provided to the Fund by Invesco Advisers under the Fund’s investment advisory agreement, the performance of Invesco Advisers in providing these services, and the credentials and experience of the officers and employees of Invesco Advisers who provide these services, including the Fund’s portfolio manager or managers, with whom the Board met during the year. The Board’s review of the qualifications of Invesco Advisers to provide advisory services included the Board’s consideration of Invesco Advisers’ performance and investment process oversight, independent credit analysis and investment risk management.
In determining whether to continue the Fund’s investment advisory agreement, the Board considered the prior relationship between Invesco Advisers and the Fund, as well as the Board’s knowledge of Invesco Advisers’ operations, and concluded that it is beneficial to maintain the current relationship, in part, because of such knowledge. The Board also considered services that Invesco Advisers and its affiliates provide to the Invesco Funds such as various back office support functions, equity and fixed income trading operations, internal audit, distribution and legal and compliance. The Board concluded that the nature, extent and quality of the services provided to the Fund by Invesco Advisers are appropriate and satisfactory and the advisory services are provided in accordance with the terms of the Fund’s investment advisory agreement.
The Board reviewed the services provided by the Affiliated Sub-Advisers under the sub-advisory contracts and the credentials and experience of the officers and employees of the Affiliated Sub-Advisers who provide these services. The Board noted that the Affiliated Sub-Advisers have offices and personnel that are located in financial centers around the world. As a result, the Affiliated Sub-Advisers can provide research and investment analysis on the markets and economies of various countries in which the Fund invests and make recommendations on securities of companies located in such countries. The Board concluded that the sub-advisory contracts benefit the Fund and its shareholders by permitting Invesco Advisers to use the additional resources and talents of the Affiliated Sub-Advisers in managing the Fund. The Board concluded that the nature, extent and quality of the services provided by the Affiliated Sub-Advisers are appropriate and satisfactory and in accordance with the terms of the Fund’s sub-advisory contracts.
25 Invesco Balanced-Risk Allocation Fund
The Board considered Fund performance as a relevant factor in considering whether to approve the investment advisory agreement. The Board did not view Fund performance as a relevant factor in considering whether to approve the sub-advisory contracts for the Fund, as no Affiliated Sub-Adviser currently manages assets of the Fund.
The Board noted that the Fund recently began operations and that comparative performance data for only the past calendar year was available. The Board compared performance during the past calendar year to the performance of funds in the Lipper performance universe and against the Lipper Global Flexible Port Funds Index. The Board noted that performance of Class A shares of the Fund was in the second quintile of the performance universe for the one year period (the first quintile being the best performing funds and the fifth quintile being the worst performing funds). The Board noted that performance of Class A shares of the Fund was above the performance of the Index for the one year period. Although the independent written evaluation of the Fund’s Senior Officer only considered Fund performance through the most recent calendar year, the Trustees also reviewed more recent Fund performance and this review did not change their conclusions.
| |
| C. | Advisory Fees and Fee Waivers |
The Board compared the Fund’s contractual advisory fee rate to the contractual advisory fee rates of funds in the Fund’s Lipper expense group at a common asset level. The Board noted that the contractual advisory fee rate for Class A share of the Fund was at the median contractual advisory fee rate of funds in the expense group. The Board also reviewed the methodology used by Lipper in providing expense group information, which includes using audited financial data from the most recent annual report of each fund in the expense group that was publicly available as of the end of the past calendar year and including only one fund per investment adviser. The Board noted that comparative data is as of varying dates, which may affect the comparability of data during times of market volatility.
The Board also compared the Fund’s effective fee rate (the advisory fee after advisory fee waivers and before expense limitations/waivers) to the advisory fee rates of other mutual funds advised by Invesco Advisers and its affiliates with investment strategies comparable to those of the Fund. The Board noted that the Fund’s effective rate was below the fee rate for one mutual fund and above the fee rate of one offshore fund with comparable investment strategies.
Other than the funds described above, the Board noted that Invesco Advisers and the Affiliated Sub-Advisers do not manage other mutual funds or client accounts in a manner substantially similar to the management of the Fund.
The Board noted that Invesco Advisers has contractually agreed to waive fees and/or limit expenses of the Fund through at least February 28, 2012 in an amount necessary to limit total annual operating expenses to a specified percentage of average daily net assets for each class of the Fund. The Board also considered the effect this fee waiver would have on the Fund’s estimated total expenses.
The Board also considered the services provided by the Affiliated Sub-Advisers pursuant to the sub-advisory contracts, as well as the allocation of fees between Invesco Advisers and the Affiliated Sub-Advisers pursuant to the sub-advisory contracts. The Board noted that Invesco Advisers provides services to sub-advised Invesco Funds, including oversight of the Affiliated Sub-Advisers as well as the additional services described above other than day-to-day portfolio management. The Board also noted that the sub-advisory fees have no direct effect on the Fund or its shareholders, as they are paid by Invesco Advisers to the Affiliated Sub-Advisers.
Based upon the information and considerations described above, the Board concluded that the Fund’s advisory and sub-advisory fees are fair and reasonable.
| |
| D. | Economies of Scale and Breakpoints |
The Board considered the extent to which there are economies of scale in the provision of advisory services to the Fund. The Board also considered whether the Fund benefits from economies of scale through contractual breakpoints in the Fund’s advisory fee schedule. The Board also noted that the Fund shares directly in economies of scale through lower fees charged by third party service providers based on the combined size of the Invesco Funds and other clients advised by Invesco Advisers.
| |
| E. | Profitability and Financial Resources |
The Board reviewed information from Invesco Advisers concerning the costs of the advisory and other services that Invesco Advisers and its affiliates provide to the Fund and the profitability of Invesco Advisers and its affiliates in providing these services. The Board reviewed with Invesco Advisers the methodology used to prepare the profitability information. The Board considered the profitability of Invesco Advisers in connection with managing the Fund and the Invesco Funds. The Board noted that Invesco Advisers continues to operate at a net profit from services Invesco Advisers and its subsidiaries provide to the Fund and the Invesco Funds. The Board concluded that the level of profits realized by Invesco Advisers and its affiliates from providing services to the Fund is not excessive given the nature, quality and extent of the services provided to the Invesco Funds. The Board considered whether Invesco Advisers and each Affiliated Sub-Adviser are financially sound and have the resources necessary to perform their obligations under the investment advisory agreement and sub-advisory contracts. The Board concluded that Invesco Advisers and each Affiliated Sub-Adviser have the financial resources necessary to fulfill these obligations.
| |
| F. | Collateral Benefits to Invesco Advisers and its Affiliates |
The Board considered various other benefits received by Invesco Advisers and its affiliates from the relationship with the Fund, including the fees received for their provision of administrative, transfer agency and distribution services to the Fund. The Board considered the performance of Invesco Advisers and its affiliates in providing these services and the organizational structure employed to provide these services. The Board also considered that these services are provided to the Fund pursuant to written contracts that are reviewed and approved on an annual basis by the Board; that the services are required for the operation of the Fund; that Invesco Advisers and its affiliates can provide services, the nature and quality of which are at least equal to those provided by others offering the same or similar services; and that the fees for such services are fair and reasonable in light of the usual and customary charges by others for services of the same nature and quality.
The Board considered the benefits realized by Invesco Advisers and the Affiliated Sub-Advisers as a result of portfolio brokerage transactions executed through “soft dollar” arrangements. The Board noted that soft dollar arrangements shift the payment obligation for research and execution services from Invesco Advisers and the Affiliated Sub-Advisers to the Invesco Funds and therefore may reduce Invesco Advisers’ and the Affiliated Sub-Advisers’ expenses. The Board concluded that the soft dollar arrangements are appropriate. The Board also concluded that, based on their review and representations made by the Chief Compliance Officer of the Invesco Funds, these arrangements are consistent with regulatory requirements.
The Board considered that the Fund’s uninvested cash and cash collateral from any securities lending arrangements may be invested in money market funds advised by Invesco Advisers pursuant to procedures approved by the Board. The Board noted that Invesco Advisers receives advisory fees from these affiliated money market funds attributable to such investments, although Invesco Advisers has contractually agreed to waive through varying periods the advisory fees payable by the Invesco Funds. The waiver is in an amount equal to 100% of the net advisory fee Invesco Advisers receives from the affiliated money market funds with respect to the Fund’s investment in the affiliated money market funds of uninvested cash, but not cash collateral. The Board concluded that the Fund’s investment of uninvested cash and cash collateral from any securities lending arrangements in the affiliated money market funds is in the best interests of the Fund and its shareholders.
26 Invesco Balanced-Risk Allocation Fund
Tax Information
Form 1099-DIV, Form 1042-S and other year-end tax information provide shareholders with actual calendar year amounts that should be included in their tax returns. Shareholders should consult their tax advisors.
The following distribution information is being provided as required by the Internal Revenue Code or to meet a specific state’s requirement.
The Fund designates the following amounts or, if subsequently determined to be different, the maximum amount allowable for its fiscal year ended October 31, 2011:
| | | | | |
Federal and State Income Tax | | |
| |
| Long-Term Capital Gain Dividends | | $ | 4,208,462 | |
| Qualified Dividend Income* | | | 0.00% | |
| Corporate Dividends Received Deduction* | | | 0.00% | |
| U.S. Treasury Obligations* | | | 1.00% | |
| | | | | |
| | |
| | * | The above percentages are based on ordinary income dividends paid to shareholders during the Fund’s fiscal year. |
27 Invesco Balanced-Risk Allocation Fund
Trustees and Officers
The address of each trustee and officer is AIM Investment Funds (Invesco Investment Funds) (the “Trust”), 11 Greenway Plaza, Suite 2500, Houston, Texas 77046-1173. The trustees serve for the life of the Trust, subject to their earlier death, incapacitation, resignation, retirement or removal as more specifically provided in the Trust’s organizational documents. Each officer serves for a one year term or until their successors are elected and qualified. Column two below includes length of time served with predecessor entities, if any.
| | | | | | | | | |
| | | | | | | Number of
| | |
| | | | | | | Funds in
| | |
| | | | | | | Fund Complex
| | |
Name, Year of Birth and
| | Trustee and/
| | Principal Occupation(s)
| | Overseen by
| | Other Directorship(s)
|
| Position(s) Held with the Trust | | or Officer Since | | During Past 5 Years | | Trustee | | Held by Trustee |
| | | | | | | | | |
| | | | | | | | | |
| Interested Persons | | | | | | | | |
| | | | | | | | | |
| | | | | | | | | |
| | | | | | | | | |
Martin L. Flanagan1 — 1960
Trustee | | 2007 | | Executive Director, Chief Executive Officer and President, Invesco Ltd. (ultimate parent of Invesco and a global investment management firm); Advisor to the Board, Invesco Advisers, Inc. (formerly known as Invesco Institutional (N.A.), Inc.); Trustee, The Invesco Funds; Vice Chair, Investment Company Institute; and Member of Executive Board, SMU Cox School of Business
Formerly: Chairman, Invesco Advisers, Inc. (registered investment adviser); Director, Chairman, Chief Executive Officer and President, IVZ Inc. (holding company), INVESCO Group Services, Inc. (service provider) and Invesco North American Holdings, Inc. (holding company); Director, Chief Executive Officer and President, Invesco Holding Company Limited (parent of Invesco and a global investment management firm); Director, Invesco Ltd.; Chairman, Investment Company Institute and President, Co-Chief Executive Officer, Co-President, Chief Operating Officer and Chief Financial Officer, Franklin Resources, Inc. (global investment management organization) | | 141 | | None |
| | | | | | | | | |
| | | | | | | | | |
| | | | | | | | | |
Philip A. Taylor2 — 1954
Trustee, President and
Principal Executive Officer | | 2006 | | Head of North American Retail and Senior Managing Director, Invesco Ltd.; Director, Co-Chairman, Co-President and Co-Chief Executive Officer, Invesco Advisers, Inc. (formerly known as Invesco Institutional (N.A.), Inc.) (registered investment adviser); Director, Chairman, Chief Executive Officer and President, Invesco Management Group, Inc. (formerly Invesco Aim Management Group, Inc.) (financial services holding company); Director and President, INVESCO Funds Group, Inc. (registered investment adviser and registered transfer agent); Director and Chairman, Invesco Investment Services, Inc. (formerly known as Invesco Aim Investment Services, Inc.) (registered transfer agent) and IVZ Distributors, Inc. (formerly known as INVESCO Distributors, Inc.) (registered broker dealer); Director, President and Chairman, Invesco Inc. (holding company) and Invesco Canada Holdings Inc. (holding company); Chief Executive Officer, Invesco Corporate Class Inc. (corporate mutual fund company) and Invesco Canada Fund Inc. (corporate mutual fund company); Director, Chairman and Chief Executive Officer, Invesco Canada Ltd. (formerly known as Invesco Trimark Ltd./Invesco Trimark Ltèe) (registered investment adviser and registered transfer agent); Trustee, President and Principal Executive Officer, The Invesco Funds (other than AIM Treasurer’s Series Trust (Invesco Treasurer’s Series Trust) and Short-Term Investments Trust); Trustee and Executive Vice President, The Invesco Funds (AIM Treasurer’s Series Trust (Invesco Treasurer’s Series Trust) and Short-Term Investments Trust only); Director, Invesco Investment Advisers LLC (formerly known as Van Kampen Asset Management); Director, Chief Executive Officer and President, Van Kampen Exchange Corp.
Formerly: Director and Chairman, Van Kampen Investor Services Inc.: Director, Chief Executive Officer and President, 1371 Preferred Inc. (holding company); and Van Kampen Investments Inc.; Director and President, AIM GP Canada Inc. (general partner for limited partnerships); and Van Kampen Advisors, Inc.; Director and Chief Executive Officer, Invesco Trimark Dealer Inc. (registered broker dealer); Director, Invesco Distributors, Inc. (formerly known as Invesco Aim Distributors, Inc.) (registered broker dealer); Manager, Invesco PowerShares Capital Management LLC; Director, Chief Executive Officer and President, Invesco Advisers, Inc.; Director, Chairman, Chief Executive Officer and President, Invesco Aim Capital Management, Inc.; President, Invesco Trimark Dealer Inc. and Invesco Trimark Ltd./Invesco Trimark Ltèe; Director and President, AIM Trimark Corporate Class Inc. and AIM Trimark Canada Fund Inc.; Senior Managing Director, Invesco Holding Company Limited; Trustee and Executive Vice President, Tax-Free Investments Trust; Director and Chairman, Fund Management Company (former registered broker dealer); President and Principal Executive Officer, The Invesco Funds (AIM Treasurer’s Series Trust (Invesco Treasurer’s Series Trust), Short-Term Investments Trust and Tax-Free Investments Trust only); President, AIM Trimark Global Fund Inc. and AIM Trimark Canada Fund Inc. | | 141 | | None |
| | | | | | | | | |
| | | | | | | | | |
| | | | | | | | | |
Wayne W. Whalen3 — 1939
Trustee | | 2010 | | Of Counsel, and prior to 2010, partner in the law firm of Skadden, Arps, Slate, Meagher & Flom LLP, legal counsel to funds in the Fund Complex | | 159 | | Director of the Abraham Lincoln Presidential Library Foundation |
| | | | | | | | | |
| | | | | | | | | |
| | | | | | | | | |
| Independent Trustees | | | | | | | | |
| | | | | | | | | |
| | | | | | | | | |
| | | | | | | | | |
Bruce L. Crockett — 1944
Trustee and Chair | | 2001 | | Chairman, Crockett Technology Associates (technology consulting company)
Formerly: Director, Captaris (unified messaging provider); Director, President and Chief Executive Officer COMSAT Corporation; and Chairman, Board of Governors of INTELSAT (international communications company) | | 141 | | ACE Limited (insurance company); and Investment Company Institute |
| | | | | | | | | |
| | | | | | | | | |
| | | | | | | | | |
David C. Arch — 1945
Trustee | | 2010 | | Chairman and Chief Executive Officer of Blistex Inc., a consumer health care products manufacturer. | | 159 | | Member of the Heartland Alliance Advisory Board, a nonprofit organization serving human needs based in Chicago. Board member of the Illinois Manufacturers’ Association. Member of the Board of Visitors, Institute for the Humanities, University of Michigan |
| | | | | | | | | |
| |
| 1 | Mr. Flanagan is considered an interested person of the Trust because he is an officer of the adviser to the Trust, and an officer and a director of Invesco Ltd., ultimate parent of the adviser to the Trust. |
| 2 | Mr. Taylor is considered an interested person of the Trust because he is an officer and a director of the adviser to, and a director of the principal underwriter of, the Trust. |
| 3 | Mr. Whalen has been deemed to be an interested person of the Trust because of his prior service as counsel to the predecessor funds of certain Invesco open-end funds and his affiliation with the law firm that served as counsel to such predecessor funds and continues to serve as counsel to the Invesco Van Kampen closed-end funds. |
T-1 Invesco Balanced-Risk Allocation Fund
Trustees and Officers—(continued)
The address of each trustee and officer is AIM Investment Funds (Invesco Investment Funds) (the “Trust”), 11 Greenway Plaza, Suite 2500, Houston, Texas 77046-1173. The trustees serve for the life of the Trust, subject to their earlier death, incapacitation, resignation, retirement or removal as more specifically provided in the Trust’s organizational documents. Each officer serves for a one year term or until their successors are elected and qualified. Column two below includes length of time served with predecessor entities, if any.
| | | | | | | | | |
| | | | | | | Number of
| | |
| | | | | | | Funds in
| | |
| | | | | | | Fund Complex
| | |
Name, Year of Birth and
| | Trustee and/
| | Principal Occupation(s)
| | Overseen by
| | Other Directorship(s)
|
| Position(s) Held with the Trust | | or Officer Since | | During Past 5 Years | | Trustee | | Held by Trustee |
| | | | | | | | | |
| | | | | | | | | |
| Independent Trustees—(continued) | | | | | | | | |
| | | | | | | | | |
| | | | | | | | | |
| | | | | | | | | |
Bob R. Baker — 1936
Trustee | | 2003 | | Retired
Formerly: President and Chief Executive Officer, AMC Cancer Research Center; and Chairman and Chief Executive Officer, First Columbia Financial Corporation | | 141 | | None |
| | | | | | | | | |
| | | | | | | | | |
| | | | | | | | | |
Frank S. Bayley — 1939
Trustee | | 1987 | | Retired
Formerly: Director, Badgley Funds, Inc. (registered investment company) (2 portfolios) and Partner, law firm of Baker & McKenzie | | 141 | | Director and Chairman, C.D. Stimson Company (a real estate investment company) |
| | | | | | | | | |
| | | | | | | | | |
| | | | | | | | | |
James T. Bunch — 1942
Trustee | | 2003 | | Founder, Green, Manning & Bunch Ltd. (investment banking firm)
Formerly: Executive Committee, United States Golf Association; and Director, Policy Studies, Inc. and Van Gilder Insurance Corporation | | 141 | | Vice Chairman, Board of Governors, Western Golf Association/Evans Scholars Foundation and Director, Denver Film Society |
| | | | | | | | | |
| | | | | | | | | |
| | | | | | | | | |
Rodney F. Dammeyer — 1940
Trustee | | 2010 | | President of CAC, LLC, a private company offering capital investment and management advisory services.
Formerly: Prior to January 2004, Director of TeleTech Holdings Inc.; Prior to 2002, Director of Arris Group, Inc.; Prior to 2001, Managing Partner at Equity Group Corporate Investments. Prior to 1995, Vice Chairman of Anixter International. Prior to 1985, experience includes Senior Vice President and Chief Financial Officer of Household International, Inc, Executive Vice President and Chief Financial Officer of Northwest Industries, Inc. and Partner of Arthur Andersen & Co. | | 159 | | Director of Quidel Corporation and Stericycle, Inc. Prior to May 2008, Trustee of The Scripps Research Institute. Prior to February 2008, Director of Ventana Medical Systems, Inc. Prior to April 2007, Director of GATX Corporation. Prior to April 2004, Director of TheraSense, Inc. |
| | | | | | | | | |
| | | | | | | | | |
| | | | | | | | | |
Albert R. Dowden — 1941
Trustee | | 2001 | | Director of a number of public and private business corporations, including the Boss Group, Ltd. (private investment and management); Reich & Tang Funds (5 portfolios) (registered investment company); and Homeowners of America Holding Corporation/ Homeowners of America Insurance Company (property casualty company)
Formerly: Director, Continental Energy Services, LLC (oil and gas pipeline service); Director, CompuDyne Corporation (provider of product and services to the public security market) and Director, Annuity and Life Re (Holdings), Ltd. (reinsurance company); Director, President and Chief Executive Officer, Volvo Group North America, Inc.; Senior Vice President, AB Volvo; Director of various public and private corporations; Chairman, DHJ Media, Inc.; Director Magellan Insurance Company; and Director, The Hertz Corporation, Genmar Corporation (boat manufacturer), National Media Corporation; Advisory Board of Rotary Power International (designer, manufacturer, and seller of rotary power engines); and Chairman, Cortland Trust, Inc. (registered investment company) | | 141 | | Board of Nature’s Sunshine Products, Inc. |
| | | | | | | | | |
| | | | | | | | | |
| | | | | | | | | |
Jack M. Fields — 1952
Trustee | | 2001 | | Chief Executive Officer, Twenty First Century Group, Inc. (government affairs company); and Owner and Chief Executive Officer, Dos Angelos Ranch, L.P. (cattle, hunting, corporate entertainment), Discovery Global Education Fund (non-profit) and Cross Timbers Quail Research Ranch (non-profit)
Formerly: Chief Executive Officer, Texana Timber LP (sustainable forestry company) and member of the U.S. House of Representatives | | 141 | | Administaff |
| | | | | | | | | |
| | | | | | | | | |
| | | | | | | | | |
Carl Frischling — 1937
Trustee | | 2001 | | Partner, law firm of Kramer Levin Naftalis and Frankel LLP | | 141 | | Director, Reich & Tang Funds (6 portfolios) |
| | | | | | | | | |
| | | | | | | | | |
| | | | | | | | | |
Prema Mathai-Davis — 1950
Trustee | | 2001 | | Retired
Formerly: Chief Executive Officer, YWCA of the U.S.A. | | 141 | | None |
| | | | | | | | | |
| | | | | | | | | |
| | | | | | | | | |
Larry Soll — 1942
Trustee | | 2003 | | Retired
Formerly, Chairman, Chief Executive Officer and President, Synergen Corp. (a biotechnology company) | | 141 | | None |
| | | | | | | | | |
| | | | | | | | | |
| | | | | | | | | |
Hugo F. Sonnenschein — 1940
Trustee | | 2010 | | President Emeritus and Honorary Trustee of the University of Chicago and the Adam Smith Distinguished Service Professor in the Department of Economics at the University of Chicago. Prior to July 2000, President of the University of Chicago. | | 159 | | Trustee of the University of Rochester and a member of its investment committee. Member of the National Academy of Sciences, the American Philosophical Society and a fellow of the American Academy of Arts and Sciences |
| | | | | | | | | |
| | | | | | | | | |
| | | | | | | | | |
Raymond Stickel, Jr. — 1944
Trustee | | 2005 | | Retired
Formerly: Director, Mainstay VP Series Funds, Inc. (25 portfolios) and Partner, Deloitte & Touche | | 141 | | Director of Long Cove Club Owners’ Association (home owner’s association) |
| | | | | | | | | |
T-2 Invesco Balanced-Risk Allocation Fund
Trustees and Officers—(continued)
The address of each trustee and officer is AIM Investment Funds (Invesco Investment Funds) (the “Trust”), 11 Greenway Plaza, Suite 2500, Houston, Texas 77046-1173. The trustees serve for the life of the Trust, subject to their earlier death, incapacitation, resignation, retirement or removal as more specifically provided in the Trust’s organizational documents. Each officer serves for a one year term or until their successors are elected and qualified. Column two below includes length of time served with predecessor entities, if any.
| | | | | | | | | |
| | | | | | | Number of
| | |
| | | | | | | Funds in
| | |
| | | | | | | Fund Complex
| | |
Name, Year of Birth and
| | Trustee and/
| | Principal Occupation(s)
| | Overseen by
| | Other Directorship(s)
|
| Position(s) Held with the Trust | | or Officer Since | | During Past 5 Years | | Trustee | | Held by Trustee |
| | | | | | | | | |
| | | | | | | | | |
| Other Officers | | | | | | | | |
| | | | | | | | | |
| | | | | | | | | |
| | | | | | | | | |
Russell C. Burk — 1958
Senior Vice President and Senior Officer | | 2005 | | Senior Vice President and Senior Officer of Invesco Funds | | N/A | | N/A |
| | | | | | | | | |
| | | | | | | | | |
| | | | | | | | | |
John M. Zerr — 1962
Senior Vice President, Chief Legal Officer and Secretary | | 2006 | | Director, Senior Vice President, Secretary and General Counsel, Invesco Management Group, Inc. (formerly known as Invesco Aim Management Group, Inc.) and Van Kampen Exchange Corp.; Senior Vice President, Invesco Advisers, Inc. (formerly known as Invesco Institutional (N.A.), Inc.) (registered investment adviser); Senior Vice President and Secretary, Invesco Distributors, Inc. (formerly known as Invesco Aim Distributors, Inc.); Director, Vice President and Secretary, Invesco Investment Services, Inc. (formerly known as Invesco Aim Investment Services, Inc.) and IVZ Distributors, Inc. (formerly known as INVESCO Distributors, Inc.); Director and Vice President, INVESCO Funds Group, Inc.; Senior Vice President, Chief Legal Officer and Secretary, The Invesco Funds; Manager, Invesco PowerShares Capital Management LLC; Director, Secretary and General Counsel, Invesco Investment Advisers LLC (formerly known as Van Kampen Asset Management); Secretary and General Counsel, Van Kampen Funds Inc. and Chief Legal Officer, PowerShares Exchange-Traded Fund Trust, PowerShares Exchange-Traded Fund Trust II, PowerShares India Exchange-Traded Fund Trust and PowerShares Actively Managed Exchange-Traded Fund Trust
Formerly: Director and Secretary, Van Kampen Advisors Inc.; Director Vice President, Secretary and General Counsel Van Kampen Investor Services Inc.; Director, Invesco Distributors, Inc. (formerly known as Invesco Aim Distributors, Inc.); Director, Senior Vice President, General Counsel and Secretary, Invesco Advisers, Inc.; and Van Kampen Investments Inc.; Director, Vice President and Secretary, Fund Management Company; Director, Senior Vice President, Secretary, General Counsel and Vice President, Invesco Aim Capital Management, Inc.; Chief Operating Officer and General Counsel, Liberty Ridge Capital, Inc. (an investment adviser); Vice President and Secretary, PBHG Funds (an investment company) and PBHG Insurance Series Fund (an investment company); Chief Operating Officer, General Counsel and Secretary, Old Mutual Investment Partners (a broker-dealer); General Counsel and Secretary, Old Mutual Fund Services (an administrator) and Old Mutual Shareholder Services (a shareholder servicing center); Executive Vice President, General Counsel and Secretary, Old Mutual Capital, Inc. (an investment adviser); and Vice President and Secretary, Old Mutual Advisors Funds (an investment company) | | N/A | | N/A |
| | | | | | | | | |
| | | | | | | | | |
| | | | | | | | | |
Lisa O. Brinkley — 1959
Vice President | | 2004 | | Global Compliance Director, Invesco Ltd.; Chief Compliance Officer, Invesco Investment Services, Inc.(formerly known as Invesco Aim Investment Services, Inc.); and Vice President, The Invesco Funds
Formerly: Chief Compliance Officer, Invesco Distributors, Inc. (formerly known as Invesco Aim Distributors, Inc.) and Van Kampen Investor Services Inc.; Senior Vice President, Invesco Management Group, Inc.; Senior Vice President and Chief Compliance Officer, Invesco Advisers, Inc. and The Invesco Funds; Vice President and Chief Compliance Officer, Invesco Aim Capital Management, Inc. and Invesco Distributors, Inc.; Vice President, Invesco Investment Services, Inc. and Fund Management Company | | N/A | | N/A |
| | | | | | | | | |
| | | | | | | | | |
| | | | | | | | | |
Sheri Morris — 1964
Vice President, Treasurer and Principal Financial Officer | | 1999 | | Vice President, Treasurer and Principal Financial Officer, The Invesco Funds; and Vice President, Invesco Advisers, Inc. (formerly known as Invesco Institutional (N.A.), Inc.) (registered investment adviser).
Formerly: Treasurer, PowerShares Exchange-Traded Fund Trust, PowerShares Exchange--Traded Fund Trust II, PowerShares India Exchange-Traded Fund Trust and PowerShares Actively Managed Exchange-Traded Fund Trust; Vice President, Invesco Advisers, Inc., Invesco Aim Capital Management, Inc. and Invesco Aim Private Asset Management, Inc.; Assistant Vice President and Assistant Treasurer, The Invesco Funds and Assistant Vice President, Invesco Advisers, Inc., Invesco Aim Capital Management, Inc. and Invesco Aim Private Asset Management, Inc. | | N/A | | N/A |
| | | | | | | | | |
| | | | | | | | | |
| | | | | | | | | |
Karen Dunn Kelley — 1960
Vice President | | 2004 | | Head of Invesco’s World Wide Fixed Income and Cash Management Group; Senior Vice President, Invesco Advisers, Inc. (formerly known as Invesco Institutional (N.A.), Inc.) (registered investment adviser); Executive Vice President, Invesco Distributors, Inc. (formerly known as Invesco Aim Distributors, Inc.); Senior Vice President, Invesco Management Group, Inc. (formerly known as Invesco Aim Management Group, Inc.); and Director, Invesco Mortgage Capital Inc.; Vice President, The Invesco Funds (other than AIM Treasurer’s Series Trust (Invesco Treasurer’s Series Trust) and Short-Term Investments Trust); President and Principal Executive Officer, The Invesco Funds (AIM Treasurer’s Series Trust (Invesco Treasurer’s Series Trust) and Short-Term Investments Trust only).
Formerly: Senior Vice President, Van Kampen Investments Inc.; Vice President, Invesco Advisers, Inc. (formerly known as Invesco Institutional (N.A.), Inc.); Director of Cash Management and Senior Vice President, Invesco Advisers, Inc. and Invesco Aim Capital Management, Inc.; President and Principal Executive Officer, Tax-Free Investments Trust; Director and President, Fund Management Company; Chief Cash Management Officer, Director of Cash Management, Senior Vice President, and Managing Director, Invesco Aim Capital Management, Inc.; Director of Cash Management, Senior Vice President, and Vice President, Invesco Advisers, Inc. and The Invesco Funds (AIM Treasurer’s Series Trust (Invesco Treasurer’s Series Trust), Short-Term Investments Trust and Tax-Free Investments Trust only) | | N/A | | N/A |
| | | | | | | | | |
T-3 Invesco Balanced-Risk Allocation Fund
Trustees and Officers—(continued)
The address of each trustee and officer is AIM Investment Funds (Invesco Investment Funds) (the “Trust”), 11 Greenway Plaza, Suite 2500, Houston, Texas 77046-1173. The trustees serve for the life of the Trust, subject to their earlier death, incapacitation, resignation, retirement or removal as more specifically provided in the Trust’s organizational documents. Each officer serves for a one year term or until their successors are elected and qualified. Column two below includes length of time served with predecessor entities, if any.
| | | | | | | | | |
| | | | | | | Number of
| | |
| | | | | | | Funds in
| | |
| | | | | | | Fund Complex
| | |
Name, Year of Birth and
| | Trustee and/
| | Principal Occupation(s)
| | Overseen by
| | Other Directorship(s)
|
| Position(s) Held with the Trust | | or Officer Since | | During Past 5 Years | | Trustee | | Held by Trustee |
| | | | | | | | | |
| | | | | | | | | |
| Other Officers—(continued) | | | | | | | | |
| | | | | | | | | |
| | | | | | | | | |
| | | | | | | | | |
Lance A. Rejsek — 1967
Anti-Money Laundering Compliance Officer | | 2005 | | Anti-Money Laundering Compliance Officer, Invesco Advisers, Inc. (formerly known as Invesco Institutional (N.A.), Inc.) (registered investment adviser); Invesco Distributors, Inc. (formerly known as Invesco Aim Distributors, Inc.), Invesco Investment Services, Inc. (formerly known as Invesco Aim Investment Services, Inc.), The Invesco Funds, PowerShares Exchange-Traded Fund Trust, PowerShares Exchange-Traded Fund Trust II, PowerShares India Exchange-Traded Fund Trust, PowerShares Actively Managed Exchange-Traded Fund Trust, Invesco Investment Advisers LLC (formerly known as Van Kampen Asset Management) and Van Kampen Funds Inc.
Formerly: Anti-Money Laundering Compliance Officer, Van Kampen Investor Services Inc., Fund Management Company, Invesco Advisers, Inc., Invesco Aim Capital Management, Inc. and Invesco Aim Private Asset Management, Inc. | | N/A | | N/A |
| | | | | | | | | |
| | | | | | | | | |
| | | | | | | | | |
Todd L. Spillane — 1958
Chief Compliance Officer | | 2006 | | Senior Vice President, Invesco Management Group, Inc. (formerly known as Invesco Aim Management Group, Inc.) and Van Kampen Exchange Corp.; Senior Vice President and Chief Compliance Officer, Invesco Advisers, Inc. (registered investment adviser) (formerly known as Invesco Institutional (N.A.), Inc.); Chief Compliance Officer, The Invesco Funds, PowerShares Exchange-Traded Fund Trust, PowerShares Exchange-Traded Fund Trust II, PowerShares India Exchange-Traded Fund Trust, PowerShares Actively Managed Exchange-Traded Fund Trust, INVESCO Private Capital Investments, Inc. (holding company) and Invesco Private Capital, Inc. (registered investment adviser); Vice President, Invesco Distributors, Inc. (formerly known as Invesco Aim Distributors, Inc.) and Invesco Investment Services, Inc. (formerly known as Invesco Aim Investment Services, Inc.).
Formerly: Chief Compliance Officer, Invesco Van Kampen Closed-End Funds; Senior Vice President, Van Kampen Investments Inc.; Senior Vice President and Chief Compliance Officer, Invesco Advisers, Inc. and Invesco Aim Capital Management, Inc.; Chief Compliance Officer, Invesco Global Asset Management (N.A.), Inc., Invesco Senior Secured Management, Inc. (registered investment adviser) and Van Kampen Investor Services Inc.; Vice President, Invesco Aim Capital Management, Inc. and Fund Management Company | | N/A | | N/A |
| | | | | | | | | |
The Statement of Additional Information of the Trust includes additional information about the Fund’s Trustees and is available upon request, without charge, by calling 1.800.959.4246. Please refer to the Fund’s prospectus for information on the Fund’s sub-advisers.
| | | | | | | |
Office of the Fund
11 Greenway Plaza, Suite 2500
Houston, TX 77046-1173 | | Investment Adviser
Invesco Advisers, Inc.
1555 Peachtree Street, N.E.
Atlanta, GA 30309 | | Distributor
Invesco Distributors, Inc.
11 Greenway Plaza, Suite 2500
Houston, TX 77046-1173 | | Auditors
PricewaterhouseCoopers LLP
1201 Louisiana Street, Suite 2900
Houston, TX 77002-5678 |
| | | | | | | |
| | | | | | | |
Counsel to the Fund
Stradley Ronon Stevens & Young, LLP
2600 One Commerce Square
Philadelphia, PA 19103 | | Counsel to the Independent Trustees
Kramer, Levin, Naftalis & Frankel LLP
1177 Avenue of the Americas
New York, NY 10036-2714 | | Transfer Agent
Invesco Investment Services, Inc.
11 Greenway Plaza, Suite 2500
Houston, TX 77046-1173 | | Custodian
State Street Bank and Trust Company
225 Franklin
Boston, MA 02110-2801 |
T-4 Invesco Balanced-Risk Allocation Fund
Invesco mailing information
Send general correspondence to Invesco Investment Services, Inc., P.O. Box 219078, Kansas City, MO 64121-9078.
Invesco privacy policy
You share personal and financial information with us that is necessary for your transactions and your account records. We take very seriously the obligation to keep that information confidential and private.
Invesco collects nonpublic personal information about you from account applications or other forms you complete and from your transactions with us or our affiliates. We do not disclose information about you or our former customers to service providers or other third parties except to the extent necessary to service your account and in other limited circumstances as permitted by law. For example, we use this information to facilitate the delivery of transaction confirmations, financial reports, prospectuses and tax forms.
Even within Invesco, only people involved in the servicing of your accounts and compliance monitoring have access to your information. To ensure the highest level of confidentiality and security, Invesco maintains physical, electronic and procedural safeguards that meet or exceed federal standards. Special measures, such as data encryption and authentication, apply to your communications with us on our website. More detail is available to you at invesco.com/privacy.
Important notice regarding delivery of security holder documents
To reduce Fund expenses, only one copy of most shareholder documents may be mailed to shareholders with multiple accounts at the same address (Householding). Mailing of your shareholder documents may be householded indefinitely unless you instruct us otherwise. If you do not want the mailing of these documents to be combined with those for other members of your household, please contact Invesco Investment Services, Inc. at 800 959 4246 or contact your financial institution. We will begin sending you individual copies for each account within 30 days after receiving your request.
Fund holdings and proxy voting information
The Fund provides a complete list of its holdings four times in each fiscal year, at the quarter-ends. For the second and fourth quarters, the lists appear in the Fund’s semiannual and annual reports to shareholders. For the first and third quarters, the Fund files the lists with the Securities and Exchange Commission (SEC) on Form N-Q. The most recent list of portfolio holdings is available at invesco.com/completeqtrholdings. Shareholders can also look up the Fund’s Forms N-Q on the SEC website at sec.gov. Copies of the Fund’s Forms N-Q may be reviewed and copied at the SEC Public Reference Room in Washington, D.C. You can obtain information on the operation of the Public Reference Room, including information about duplicating fee charges, by calling 202 551 8090 or 800 732 0330, or by electronic request at the following email address: publicinfo@sec.gov. The SEC file numbers for the Fund are 811-05426 and 033-19338.
A description of the policies and procedures that the Fund uses to determine how to vote proxies relating to portfolio securities is available without charge, upon request, from our Client Services department at 800 959 4246 or at invesco.com/proxyguidelines. The information is also available on the SEC website, sec.gov.
Information regarding how the Fund voted proxies related to its portfolio securities during the 12 months ended June 30, 2011, is available at invesco.com/proxysearch. The information is also available on the SEC website, sec.gov.
Invesco Advisers, Inc. is an investment adviser; it provides investment advisory services to individual and institutional clients and does not sell securities. Invesco Distributors, Inc. is the U.S. distributor for Invesco Ltd.���s retail mutual funds, exchange-traded funds and institutional money market funds. Both are wholly owned, indirect subsidiaries of Invesco Ltd.
IBRA-AR-1 Invesco Distributors, Inc.
| | | |
|
| |
Annual Report to Shareholders | | October 31, 2011 |
Invesco Balanced-Risk Commodity Strategy Fund
Nasdaq:
A: BRCAX § B: BRCBX § C: BRCCX § R: BRCRX § Y: BRCYX § Institutional: BRCNX
| | | |
|
| |
| 2 | | Letters to Shareholders |
| 4 | | Performance Summary |
| 4 | | Management Discussion |
| 6 | | Long-Term Fund Performance |
| 8 | | Supplemental Information |
| 9 | | Schedule of Investments |
| 12 | | Financial Statements |
| 14 | | Notes to Financial Statements |
| 22 | | Financial Highlights |
| 23 | | Auditor’s Report |
| 24 | | Fund Expenses |
| 25 | | Approval of Investment Advisory and Sub-Advisory Agreements |
| 27 | | Tax Information |
| T-1 | | Trustees and Officers |
Letters to Shareholders

Philip Taylor
Dear Shareholders:
Enclosed is important information about your Fund and its performance. I encourage you to read this report to learn more about your Fund’s short- and long-term performance and its holdings as of the close of the reporting period. This report also includes useful information about your Fund’s management team and a discussion of how your Fund was managed during the reporting period.
Investors are likely to confront both opportunities and challenges in 2012 – just as we did in 2011. After all, changes in market sentiment never do investors the courtesy of announcing their impending arrival, and your goals and needs may have changed, requiring changes in your financial strategy.
That’s why the start of a new year is always a good time to catch up with your financial adviser. He or she can explain how your investments performed in the year just ended – how each performed individually, and more important, how they performed as a diversified portfolio. Of course, it’s important to remember that an investment’s long-term performance is more important than its short-term performance. Looking ahead to the new year and evaluating your individual situation, your financial adviser can provide valuable insight into whether your investments are still appropriate for your individual needs, goals and risk tolerance.
For current information about your Fund
In addition to meeting with your financial adviser to discuss your individual situation at the start of the new year, you also may find it helpful to stay abreast of market trends and developments. Doing so may provide reassurance in times of economic uncertainty and market volatility such as we saw in 2011 – and are likely to see again in 2012.
Invesco can help you stay informed about your investments and market trends. On our website, invesco.com/us, we provide timely market updates and commentary from many of our fund managers and other investment professionals. Also on our website, you can obtain information about your account at any hour of the day or night. I invite you to visit and explore the tools and information we offer at invesco.com/us.
Our commitment to investment excellence
As we’ve seen over the last several years, market conditions can change – often suddenly and dramatically. That’s one reason financial advisers typically advise their clients to be well diversified and to maintain a long-term investment focus. While diversification can’t guarantee a profit or protect against loss, it may cushion the impact of dramatic market moves. Maintaining a long-term investment focus for your long-term goals – financing your retirement or your children’s education, for example – may help you avoid making rash investment decisions based on short-term market swings.
Likewise, Invesco’s investment professionals maintain a long-term focus. Across our broad array of investment products, investment excellence is our ultimate goal. Each of our funds is managed by specialized teams of investment professionals, and as a company, we maintain a single focus – investment management – that allows our fund managers to concentrate on doing what they do best: managing your money.
Our funds are managed strictly according to their stated investment objectives and strategies, with robust risk oversight using consistent, repeatable investment processes that don’t change in response to short-term market events. This disciplined approach can’t guarantee a profit; no investment can do that, since all involve some measure of risk. But it can ensure that your money is managed the way we said it would be – according to your Fund’s objective and strategies.
Our adherence to stated investment objectives and strategies allows your financial adviser to build a diversified portfolio that meets your individual risk tolerance and financial goals. It also means that when your goals change, your financial adviser will be able to find an Invesco fund that’s appropriate for your needs.
Questions?
If you have questions about your account, please contact one of our client service representatives at 800 959 4246. If you have a general Invesco-related question or comment for me, I invite you to email me directly at phil@invesco.com.
All of us at Invesco look forward to serving your investment management needs for many years to come. Thank you for investing with us.
Sincerely,
Philip Taylor
Senior Managing Director, Invesco Ltd.
2 Invesco Balanced-Risk Commodity Strategy Fund

Bruce Crockett
Dear Fellow Shareholders:
Although the world’s economies are gradually recovering from the financial crisis, it has not been a smooth path. Unrest in the Middle East, persistently weak job and housing markets in the U.S. and continued government balance sheet repair in Europe are contributing to a slow, labored march toward global recovery.
In this environment, investors face risks that could make it more difficult to achieve their long-term financial goals – a secure retirement, home ownership, a child’s college education. Although the markets are complex and dynamic, there are ways to simplify the process and potentially increase your odds of achieving your goals. The best approach is to create a solid financial plan that helps you save and invest in ways that anticipate your needs over the long term.
Your financial adviser can help you define your financial plan, develop an appropriate investment strategy and put you in a better position to achieve your financial goals over the long term. This can take some of the guesswork out of the process and help you make thoughtful investments. Your financial adviser also can help you better understand your tolerance for risk, so that your investment approach lets you sleep at night while getting you closer to your goals. Lastly, your financial adviser can develop an asset allocation strategy that seeks to balance your investment approach, providing some protection against a decline in the markets while allowing you to participate in rising markets. Invesco calls this type of approach “intentional investing.” It means thinking carefully, planning thoughtfully and acting deliberately.
While no investment can guarantee favorable returns, your Board remains committed to managing costs and enhancing the performance of Invesco’s funds as part of our Investor First orientation. We continue to oversee the funds with the same strong sense of responsibility for your money and your continued trust that we’ve always maintained.
Thanks to the approval of our fund shareholders, Invesco has made great progress in realigning our U.S. mutual fund product line following our acquisition of Morgan Stanley’s retail asset management business, including Van Kampen Investments. When completed, the realignment will reduce overlap in the product lineup, enhance efficiency across our product line and build a solid foundation for further growth to meet client and shareholder needs. I would like to thank those of you who voted your proxy, and I hope our shareholders haven’t been too inconvenienced by the process.
As always, please contact me at bruce@brucecrockett.com with any questions or concerns you may have. On behalf of your Board, we look forward to continuing to represent your interests and serving your needs.
Sincerely,

Bruce L. Crockett
Independent Chair
Invesco Funds Board of Trustees
3 Invesco Balanced-Risk Commodity Strategy Fund
Management’s Discussion of Fund Performance
Performance summary
For the 11 months ended October 31, 2011, Class A shares of Invesco Balanced-Risk Commodity Strategy Fund, at net asset value, returned 3.67% and outperformed the Dow Jones-UBS Commodity Total Return Index, the Fund’s broad market/style-specific benchmark. Strength within the precious metals, particularly gold, and agriculture commodity segments were key contributors to absolute performance. A lower allocation to energy than the benchmark also contributed to relative performance. Most of the Fund’s outperformance occurred in the summer months of the reporting period, when energy commodities hindered benchmark performance.
Additional information about your Fund’s performance appears later in this report.
Fund vs. Indexes
Cumulative total returns, 11/30/10 to 10/31/11, at net asset value (NAV). Performance shown does not include applicable contingent deferred sales charges (CDSC) or front-end sales charges, which would have reduced performance.
| | | | | |
|
| Class A Shares | | | 3.67 | % |
| |
| Class B Shares | | | 3.08 | |
| |
| Class C Shares | | | 2.98 | |
| |
| Class R Shares | | | 3.67 | |
| |
| Class Y Shares | | | 4.17 | |
| |
| Institutional Class Shares | | | 4.17 | |
| |
Dow Jones-UBS Commodity Total Return Index▼
(Broad Market/Style-Specific Index) | | | 1.94 | |
| |
How we invest
The Fund invests, under normal conditions, in derivatives and other commodity-linked instruments whose performance is expected to correspond to the performance of the underlying commodity, without investing directly in physical commodities. The Fund seeks to achieve its investment objective by investing in derivatives and other commodity-linked instruments that provide exposure to the following four sectors of the commodities markets: agriculture, energy, industrial metals and precious metals. The Fund will seek to gain exposure to the commodity markets primarily through investments in Invesco Cayman Commodity Fund III Ltd. (the “Subsidiary”), a wholly-owned subsidiary of the Fund organized under the laws of the Cayman Islands. The Fund
Portfolio Composition
Risk Allocation as of 10/31/11
| | | | | |
| | | Contribution | |
| | | | | |
| Precious Metals | | | 30.6 | % |
| |
| Industrial Metals | | | 26.8 | |
| |
| Energy | | | 26.6 | |
| |
| Agriculture | | | 16.0 | |
| | | | | |
|
| Total Net Assets | | $171.8 million | |
| | | | | |
| Total Number of Holdings* | | | 1 | |
The Fund’s holdings are subject to change, and there is no assurance that the Fund will continue to hold any particular security.
* Excluding U.S. Treasury and money market fund holdings.
primarily will invest in total return swaps, commodity-linked notes and commodity futures. Relative to index-based commodity funds that are passively managed, the Fund seeks to potentially provide greater capital loss protection during down markets using our active three-step investment process.
The first step involves asset selection. We select representative commodity assets to gain exposure to each of the following commodity sectors: agriculture, energy, industrial metals and precious metals. Our selection process (1) evaluates a particular asset’s performance among other assets within a commodity sector and how the asset has performed during different market cycles; (2) screens the identified commodity assets to meet minimum liquidity criteria; and (3) reviews the expected correlation among the selected commodity assets and the expected risk for each commodity asset to determine whether the selected commodity assets are likely to improve the expected risk adjusted return of the Fund.
The second step involves portfolio construction. We use proprietary estimates for risk and correlation to create a potential portfolio of investments for the Fund. We re-estimate the risk contributed by each commodity asset and rebalance the portfolio monthly or when new commodity assets are introduced to the Fund.
The final step involves active positioning. We actively adjust commodity
positions to reflect the near-term market environment, while remaining consistent with the balanced-risk long-term portfolio structure described above. We balance these two competing ideas – opportunity for excess return from active positioning and the need to maintain commodity asset class exposure set forth in the balanced-risk portfolio structure – by setting controlled tactical ranges around the long-term commodity asset allocation. The resulting commodity asset allocation is then implemented by purchasing or selling derivatives, other commodity-linked instruments, exchange-traded funds and cash and cash equivalent instruments, including affiliated money market funds. By using derivatives, the Fund is potentially able to gain greater exposure to commodity assets in each commodity sector than would be possible using cash instruments, and thus seeks to balance the amount of risk each commodity asset contributes to the Fund.
When executing the investment process described above, we may purchase commodity-linked derivative instruments, such as futures and/or swap contracts on different types of commodity assets. We purchase these commodity-linked derivatives to obtain both long and short commodity positions to actively balance the risk associated with different types of commodity assets and sectors. When taking a long position, we generally believe that the price of the referenced commodity will go up. When taking a short position, we generally believe that the price of the referenced commodity will go down.
Market conditions and your Fund
At the beginning of the reporting period, global equity markets rose sharply after a rough third quarter of 2010. The various commodity complexes also enjoyed price advances, propelled by tightening supply-demand balances and good economic prospects in commodity-intensive emerging markets. Within the Fund, strategic positions in copper and soymeal were particularly strong contributors to returns during this time, but crude oil and gold had positive returns as well. The tactical strategy had a positive impact on results, too. Long positions in coffee and cotton – and our overweight exposure to silver – accounted for a good portion of the gains.
Entering 2011, equity gains continued due, in part, to modest growth, reasonably strong earnings prospects and accommodative monetary policies by major central banks. Within commodities,
4 Invesco Balanced-Risk Commodity Strategy Fund
the broad-based upward trend remained intact, with crude oil benefiting from geopolitical tensions and gold from continued bullish sentiment. During this time, Fund performance was mixed. Agriculture was weak, with wheat and sugar suffering the most pronounced price declines. Energy and precious metals enjoyed gains, however, given political instability in the Middle East and North Africa. Within the energy complex, the gap between Brent and West Texas Intermediate (WTI) crude oil prices narrowed somewhat, but remained unusually wide.
Volatility returned to equity markets during the summer months of 2011. Commodities, with the exception of gold, also experienced meaningful weakness in response to the economic backdrop. The Fund’s strategic position in gold proved beneficial as it behaved as a safe haven asset amid market uncertainty. Conversely, the Fund’s strategic exposure to crude oil, copper and, in particular, soymeal, detracted from returns. The combined net effect of tactical shifts was only marginally positive.
Volatility of risky assets continued into the third quarter of 2011 as global equities and most commodities experienced meaningful weakness during the third quarter. Economically sensitive commodities like crude oil and copper were especially hard hit. Gold experienced strong returns during this period in response to concerns about slowing economic growth and as investors sought shelter in safe haven assets. The Fund’s strategic allocation to precious metals was a positive contributor for the third quarter, but was overwhelmed by negative returns from industrial metals and, to a lesser extent, energy and agriculture. This pattern was replicated in the tactical allocation with the Fund’s overweight exposure to precious metals providing a positive contribution while overweight exposure to agriculture and livestock and industrial metals – together with underweight exposure to energy – weighed on results.
Global equity markets experienced a powerful rally to close the reporting period. Commodities also rebounded sharply, encouraged by expectations of continued accommodative monetary policy in Europe. The Fund’s performance at the end of the reporting period was driven almost entirely by our risk-balanced strategic allocation, as our tactical strategy had only a modest positive impact. WTI crude oil and copper were the strongest performing commodities in the energy and industrial metals
complexes, respectively. Agricultural commodities rebounded much more modestly as our exposure performed in line with the broad market. Precious metals also rallied in October, with silver outpacing gold.
Please note that our strategy is principally implemented with derivative instruments which include futures and total return swaps. Derivatives can be a more liquid and cost-effective way to gain exposure to asset classes. Additionally, the leverage used in the strategy is inherent in these instruments.
Thank you for your continued commitment to Invesco Balanced-Risk Commodity Strategy Fund.
The views and opinions expressed in management’s discussion of Fund performance are those of Invesco Advisers, Inc. These views and opinions are subject to change at any time based on factors such as market and economic conditions. These views and opinions may not be relied upon as investment advice or recommendations, or as an offer for a particular security. The information is not a complete analysis of every aspect of any market, country, industry, security or the Fund. Statements of fact are from sources considered reliable, but Invesco Advisers, Inc. makes no representation or warranty as to their completeness or accuracy. Although historical performance is no guarantee of future results, these insights may help you understand our investment management philosophy.
See important Fund and, if applicable, index disclosures later in this report.
Scott Wolle
Chartered Financial Analyst, portfolio manager, is manager of Invesco Balanced-Risk Commodity Strategy Fund. He is chief investment officer of Invesco Global Asset Allocation. Mr. Wolle began his investment career in 1991 and joined Invesco in 1999. Mr. Wolle earned a B.S. from Virginia Polytechnic Institute and State University, graduating magna cum laude. He earned an M.B.A. from the Fuqua School of Business at Duke University, where he earned the distinction of Fuqua Scholar.
Mark Ahnrud
Chartered Financial Analyst, portfolio manager, is manager of Invesco Balanced-Risk Commodity Strategy Fund. He began his investment career in 1985 and joined Invesco in 2000. Mr. Ahnrud earned a B.S. in finance and investments from Babson College and an M.B.A. from the Fuqua School of Business at Duke University with a concentration in finance and real estate.
Chris Devine
Chartered Financial Analyst, portfolio manager, is manager of Invesco Balanced-Risk Commodity Strategy Fund. He began his investment career in 1996 and joined Invesco in 1998. Mr. Devine earned a B.A. from Wake Forest University and an M.B.A. from the University of Georgia.
Scott Hixon
Chartered Financial Analyst, portfolio manager, is manager of Invesco Balanced-Risk Commodity Strategy Fund. He began his investment career in 1992 and joined Invesco in 1994. Mr. Hixon earned a B.B.A. in finance and graduated magna cum laude from Georgia Southern University. He earned an M.B.A. in finance from Georgia State University.
Christian Ulrich
Chartered Financial Analyst, portfolio manager, is manager of Invesco Balanced-Risk Commodity Strategy Fund. He began his investment career in 1987 and joined Invesco in 2000. Mr. Ulrich earned the equivalent of a B.B.A. from the KV Zurich Business School in Zurich, Switzerland.
Assisted by the Global Asset
Allocation Team
5 Invesco Balanced-Risk Commodity Strategy Fund
Your Fund’s Performance
Results of a $10,000 Investment – Oldest Share Classes since Inception
Fund and index data from 11/30/10
Past performance cannot guarantee comparable future results.
The data shown in the chart include reinvested distributions, applicable sales charges and Fund expenses including management fees. Results for Class B shares are calculated as if a hypothetical
shareholder had liquidated his entire investment in the Fund at the close of the reporting period and paid the contingent deferred sales charges, if applicable. Index results include reinvested dividends, but they do not reflect sales charges. Performance of the peer group,
if applicable, reflects fund expenses and management fees; performance of a market index does not. Performance shown in the chart and table(s) does not reflect deduction of taxes a shareholder would pay on Fund distributions or sale of Fund shares.
6 Invesco Balanced-Risk Commodity Strategy Fund
Cumulative Total Returns
As of 10/31/11, including maximum applicable
sales charges
| | | | | |
|
Class A Shares | | | | |
| |
| Inception (11/30/10) | | | -2.06 | % |
| |
| | | | | |
Class B Shares | | | | |
| |
| Inception (11/30/10) | | | -1.92 | % |
| |
| | | | | |
Class C Shares | | | | |
| |
| Inception (11/30/10) | | | 1.98 | % |
| |
| | | | | |
Class R Shares | | | | |
| |
| Inception (11/30/10) | | | 3.67 | % |
| |
| | | | | |
Class Y Shares | | | | |
| |
| Inception (11/30/10) | | | 4.17 | % |
| |
| | | | | |
Institutional Class Shares | | | | |
| |
| Inception (11/30/10) | | | 4.17 | % |
The performance data quoted represent past performance and cannot guarantee comparable future results; current performance may be lower or higher. Please visit invesco.com/performance for the most recent month-end performance. Performance figures reflect reinvested distributions, changes in net asset value and the effect of the maximum sales charge unless otherwise stated. Investment return and principal value will fluctuate so that you may have a gain or loss when you sell shares.
The net annual Fund operating expense ratio set forth in the most recent Fund prospectus as of the date of this report for Class A, Class B, Class C, Class R, Class Y and Institutional Class shares was 1.23%, 1.98%, 1.98%, 1.48%, 0.98% and 0.98%, respectively.1 The total annual Fund operating expense ratio set forth in the most recent Fund prospectus as of the date of this report for Class A, Class B, Class C, Class R, Class Y and Institutional Class shares was 1.77%, 2.52%, 2.52%, 2.02%, 1.52% and 1.30%, respectively. The expense ratios presented above may vary from the expense ratios presented in other sections of this report that are based on expenses incurred during the period covered by this report.
Class A share performance reflects the maximum 5.50% sales charge, and Class B and Class C share performance reflects the applicable contingent deferred sales charge (CDSC) for the period involved. The CDSC on Class B shares declines from 5% beginning at the time of purchase to 0% at the
Cumulative Total Returns
As of 9/30/11, the most recent calendar quarter-end, including maximum applicable sales charges
| | | | | |
|
Class A Shares | | | | |
| |
| Inception (11/30/10) | | | -8.63 | % |
| |
| | | | | |
Class B Shares | | | | |
| |
| Inception (11/30/10) | | | -8.68 | % |
| |
| | | | | |
Class C Shares | | | | |
| |
| Inception (11/30/10) | | | -4.83 | % |
| |
| | | | | |
Class R Shares | | | | |
| |
| Inception (11/30/10) | | | -3.38 | % |
| |
| | | | | |
Class Y Shares | | | | |
| |
| Inception (11/30/10) | | | -2.98 | % |
| |
| | | | | |
Institutional Class Shares | | | | |
| |
| Inception (11/30/10) | | | -3.08 | % |
beginning of the seventh year. The CDSC on Class C shares is 1% for the first year after purchase. Class R, Class Y and Institutional Class shares do not have a front-end sales charge or a CDSC; therefore, performance is at net asset value.
The performance of the Fund’s share classes will differ primarily due to different sales charge structures and class expenses.
Had the adviser not waived fees and/or expenses, performance would have been lower.
| | | |
| 1 | | Total annual Fund operating expenses after any contractual fee waivers and/or expense reimbursements by the adviser in effect through at least February 28, 2013. See current prospectus for more information. |
7 Invesco Balanced-Risk Commodity Strategy Fund
Invesco Balanced-Risk Commodity Strategy Fund’s investment objective is to provide total return.
| n | | Unless otherwise stated, information presented in this report is as of October 31, 2011, and is based on total net assets. |
| |
| n | | Unless otherwise noted, all data provided by Invesco. |
| |
| n | | To access your Fund’s reports/prospectus, visit invesco.com/fundreports. |
About share classes
| n | | Class B shares may not be purchased or acquired by exchange from share classes other than Class B shares. Please see the prospectus for more information. |
| |
| n | | Class R shares are available only to certain retirement plans. Please see the prospectus for more information. |
| |
| n | | Class Y shares are available to only certain investors. Please see the prospectus for more information. |
| |
| n | | Institutional Class shares are offered exclusively to institutional investors, including defined contribution plans that meet certain criteria. Please see the prospectus for more information. |
Principal risks of investing in the Fund
| n | | Commodity-linked notes risk. The Fund’s investments in commodity-linked notes may involve substantial risks, including risk of loss of a significant portion of their principal value. In addition to risks associated with the underlying commodities, they may be subject to additional special risks, such as the lack of a secondary trading market and temporary price distortions due to speculators and/or the continuous rolling over of futures contracts underlying the notes. Commodity-linked notes are also subject to counterparty risk, which is the risk that the other party to the contract will not fulfill its contractual obligation to complete the transaction with the Fund. |
| |
| n | | Commodity risk. The Fund’s and the Subsidiary’s investment exposure to the commodities markets and/or a particular sector of the commodities markets, may subject the Fund and the Subsidiary to greater volatility than investments in traditional securities, such as stocks and bonds. The commodities markets may fluctuate widely based on a variety of factors, including changes in overall market movements, domestic and foreign political and |
| | | economic events and policies, war, acts of terrorism, changes in domestic or foreign interest rates and/or investor expectations concerning interest rates, domestic and foreign inflation rates and investment and trading activities of mutual funds, hedge funds and commodities funds. Prices of various commodities may also be affected by factors such as drought, floods, weather, livestock disease, embargoes, tariffs and other regulatory developments. The prices of commodities can also fluctuate widely due to supply and demand disruptions in major producing or consuming regions. Because the Fund’s and the Subsidiary’s performance is linked to the performance of potentially volatile commodities, investors should be willing to assume the risks of potentially significant fluctuations in the value of the Fund’s shares. |
| |
| n | | Concentration risk. To the extent the Fund invests a greater amount in any one sector or industry, the Fund’s performance will depend to a greater extent on the overall condition of the sector or industry, and there is increased risk to the Fund if conditions adversely affect that sector or industry. |
| |
| n | | Counterparty risk. Individually negotiated or over-the-counter derivatives are also subject to counterparty risk, which is the risk that the other party to the contract (such as a futures contract or swap agreement) will not fulfill its contractual obligations, which may cause losses or additional costs to the Fund. |
| |
| n | | Credit risk. The issuer of instruments in which the Fund invests may be unable to meet interest and/or principal payments, thereby causing its instruments to decrease in value and lowering the issuer’s credit rating. |
| |
| n | | Derivatives risk. Derivatives may be more difficult to purchase, sell or value than other investments and may be subject to market, interest rate, credit, leverage, counterparty and management risks. A fund investing in a |
| | | derivative could lose more than the cash amount invested or incur higher taxes. Over-the-counter derivatives are also subject to counterparty risk, which is the risk that the other party to the contract will not fulfill its contractual obligation to complete the transaction with the Fund. |
| |
| | | The derivative instruments and techniques that the Fund and the Subsidiary may principally use include: |
| |
| | | Swaps. A swap contract is an agreement between two parties pursuant to which the parties exchange payments at specified dates on the basis of a specified notional amount, with the payments calculated by reference to specified securities, indexes, reference rates, currencies or other instruments. Swaps are subject to credit risk and counterparty risk. |
| |
| | | Futures. A decision as to whether, when and how to use futures involves the exercise of skill and judgment and even a well conceived futures transaction may be unsuccessful because of market behavior or unexpected events. |
| |
| n | | Interest rate risk. Interest rate risk refers to the risk that bond prices generally fall as interest rates rise; conversely, bond prices generally rise as interest rates fall. Specific bonds differ in their sensitivity to changes in interest rates depending on their individual characteristics, including duration. |
| |
| n | | Leverage risk. Leverage exists when the Fund purchases or sells an instrument or enters into a transaction without investing cash in an amount equal to the full economic exposure of the instrument or transaction and the Fund could lose more than it invested. Leverage created from borrowing or certain types of transactions or instruments, including derivatives, may impair the Fund’s liquidity, cause it to liquidate positions at an unfavorable time, increase volatility or otherwise not achieve its intended objective. |
This report must be accompanied or preceded by a currently effective Fund prospectus, which contains more complete information, including sales charges and expenses. Investors should read it carefully before investing.
NOT FDIC INSURED | MAY LOSE VALUE | NO BANK GUARANTEE
| | | |
|
Fund Nasdaq Symbols | | |
| Class A Shares | | BRCAX |
| Class B Shares | | BRCBX |
| Class C Shares | | BRCCX |
| Class R Shares | | BRCRX |
| Class Y Shares | | BRCYX |
| Institutional Class Shares | | BRCNX |
8 Invesco Balanced-Risk Commodity Strategy Fund
| n | | Liquidity risk. The Fund may hold illiquid securities that it is unable to sell at the preferred time or price and could lose its entire investment in such securities. |
| |
| n | | Management risk. The investment techniques and risk analysis used by the Fund’s portfolio managers may not produce the desired results. |
| |
| n | | Market risk. The prices of and the income generated by the Fund’s securities may decline in response to, among other things, investor sentiment; general economic and market conditions; regional or global instability; and currency and interest rate fluctuations. |
| |
| n | | Non-diversification risk. The Fund is non-diversified and can invest a greater portion of its assets in a single issuer. A change in the value of the issuer could affect the value of the Fund more than if it was a diversified fund. |
| |
| n | | Subsidiary risk. By investing in the Subsidiary, the Fund is indirectly exposed to risks associated with the Subsidiary’s investments, including derivatives and commodities. Because the Subsidiary is not registered under the Investment Company Act of 1940, the Fund, as the sole investor in the Subsidiary, will not have the protections offered to investors in U.S. registered investment companies. Changes in the laws of the United States and/or the Cayman Islands, under which the Fund and the Subsidiary, respectively, are organized, could result in the inability of the Fund and/or the Subsidiary to operate as described in this prospectus and could negatively affect the Fund and its shareholders. |
| |
| n | | Tax risk. The Fund intends to treat the income it derives from commodity-linked notes as qualifying income based on a private letter ruling it has received from the Internal Revenue Service (IRS) holding that the income from a form of commodity-linked note constitutes qualifying income. Additionally, the Fund intends to treat the income it derives from the Subsidiary as qualifying income based on the reasoning contained in a private letter ruling provided to another Invesco Fund (which the Fund may not cite as precedent). If, however, the IRS were to change its position with respect to the conclusions |
| | | reached in these private letter rulings, such that the Fund’s income from the Subsidiary and commodity-linked notes is not “qualifying income,” the Fund may be unable to qualify as a regulated investment company for one or more years. In this event, the Fund’s Board of Trustees may authorize a significant change in investment strategy or Fund liquidation. |
| |
| n | | U.S. government obligations risk. The Fund may invest in obligations issued by U.S. government agencies and instrumentalities that may receive varying levels of support from the government, which could affect the Fund’s ability to recover should they default. |
About indexes used in this report
| n | | The Dow Jones-UBS Commodity Total Return Index is an unmanaged index designed to be a highly liquid and diversified benchmark for the commodity futures market. |
| |
| n | | The Fund is not managed to track the performance of any particular index, including the index(es) defined here, and consequently, the performance of the Fund may deviate significantly from the performance of the index(es). |
| |
| n | | A direct investment cannot be made in an index. Unless otherwise indicated, index results include reinvested dividends, and they do not reflect sales charges. Performance of the peer group, if applicable, reflects fund expenses; performance of a market index does not. |
Other information
| n | | The Chartered Financial Analyst® (CFA®) designation is globally recognized and attests to a charterholder’s success in a rigorous and comprehensive study program in the field of investment management and research analysis. |
| |
| n | | The returns shown in management’s discussion of Fund performance are based on net asset values calculated for shareholder transactions. Generally accepted accounting principles require adjustments to be made to the net assets of the Fund at period end for financial reporting purposes, and as such, the net asset values for shareholder transactions and the returns based on those net asset values may differ from the net asset values and returns reported in the Financial Highlights. |
9 Invesco Balanced-Risk Commodity Strategy Fund
Consolidated Schedule of Investments
October 31, 2011
| | | | | | | | | | | | | | | | | |
| | | Interest
| | Maturity
| | Principal
| | |
| | | Rate | | Date | | Amount | | Value |
| |
U.S. Treasury Securities–38.13%
|
U.S. Treasury Bills(a)(b) | | | 0.12 | % | | | 01/26/12 | | | $ | 7,500,000 | | | $ | 7,499,911 | |
| |
U.S. Treasury Bills(a)(b) | | | 0.04 | % | | | 01/26/12 | | | | 40,000,000 | | | | 39,999,522 | |
| |
U.S. Treasury Bills(a)(b) | | | 0.12 | % | | | 01/26/12 | | | | 6,000,000 | | | | 5,999,928 | |
| |
U.S. Treasury Bills(a)(b) | | | 0.00 | % | | | 02/09/12 | | | | 6,000,000 | | | | 5,999,916 | |
| |
U.S. Treasury Bills(a)(b) | | | 0.11 | % | | | 02/09/12 | | | | 6,000,000 | | | | 5,999,917 | |
| |
| Total U.S. Treasury Securities (Cost $65,490,910) | | | | | | | | | | | | | | | 65,499,194 | |
| |
| | | | | | | | | | | | | |
| | | Expiration
| | | | |
| | | Date | | | | |
Commodity-Linked Security–11.71%
�� |
| Cargill Commodity Linked Note, one-month U.S. Dollar LIBOR minus 0.10% (linked to the Dow Jones–UBS Commodities Index Total Return, multiplied by 3) (Cost $11,413,334) | | | 01/04/2012 | | | | 11,413,334 | | | | 20,111,937 | |
| |
| | | | | | | | | | | | | |
| | | | | | | | Shares | | | | | |
Money Market Funds–41.85%
|
Liquid Assets Portfolio–Institutional Class(c) | | | | | | | 35,502,496 | | | | 35,502,496 | |
| |
Premier Portfolio–Institutional Class(c) | | | | | | | 35,502,496 | | | | 35,502,496 | |
| |
STIC (Global Series) PLC–U.S. Dollar Liquidity Portfolio–Institutional Class(c) | | | | | | | 897,589 | | | | 897,589 | |
| |
| Total Money Market Funds (Cost $71,902,581) | | | | | | | | | | | 71,902,581 | |
| |
| TOTAL INVESTMENTS–91.69% (Cost $148,806,825) | | | | | | | | | | | 157,513,712 | |
| |
| OTHER ASSETS LESS LIABILITIES–8.31% | | | | | | | | | | | 14,274,898 | |
| |
| NET ASSETS–100.00% | | | | | | | | | | $ | 171,788,610 | |
| |
Notes to Schedule of Investments:
| | |
| (a) | | Security traded on a discount basis. The interest rate shown represents the discount rate at the time of purchase by the Fund. |
| (b) | | All or a portion of the value was pledged as collateral for open swap agreements. See Note 1L and Note 4. |
| (c) | | The money market fund and the Fund are affiliated by having the same investment adviser. |
| | | | | | | | | | | | | | | | | | | |
| Open Futures Contracts and Swap Agreements at Period-End |
| | | | | | | | | | | Unrealized
|
| | | | | Number of
| | Expiration
| | Notional
| | Appreciation
|
| Long Contracts | | | | Contracts | | Month | | Value | | (Depreciation) |
| |
| Live Cattle Futures | | | | | 112 | | | | December-2011 | | | $ | 5,313,280 | | | $ | (178,807 | ) |
| |
| WTI Crude Futures | | | | | 340 | | | | May-2012 | | | | 31,521,400 | | | | 21,190 | |
| |
| Subtotal | | | | | | | | | | | | $ | 36,834,680 | | | $ | (157,617 | ) |
| |
| | | | | | | | | | | | | | | | | | | |
| | | | | | | | | | | | | | | | | | | |
Short Contracts | | | | | | | | | | | | | | | | |
| | | | | | | | | | | | | | | | |
| |
| Coffee C Futures | | | | | 20 | | | | December-2011 | | | $ | (1,702,125 | ) | | $ | 5,800 | |
| |
| Corn Futures | | | | | 46 | | | | December-2011 | | | | (1,488,100 | ) | | | (150,874 | ) |
| |
| Cotton #2 Futures | | | | | 40 | | | | December-2011 | | | | (2,045,800 | ) | | | 122,400 | |
| |
| Soybean Futures | | | | | 35 | | | | January-2012 | | | | (2,130,188 | ) | | | 22,638 | |
| |
| Soybean Oil Futures | | | | | 90 | | | | December-2011 | | | | (2,763,180 | ) | | | (108,515 | ) |
| |
| Sugar #11 (World) Futures | | | | | 66 | | | | March-2012 | | | | (1,904,918 | ) | | | (92,242 | ) |
| |
| Wheat Futures | | | | | 41 | | | | December-2011 | | | | (1,287,912 | ) | | | (55,771 | ) |
| |
| Subtotal | | | | | | | | | | | | $ | (13,322,223 | ) | | $ | (256,564 | ) |
| |
| Total Futures Contracts | | | | | | | | | | | | $ | 23,512,457 | | | $ | (414,181 | ) |
| |
See accompanying Notes to Consolidated Financial Statements which are an integral part of the financial statements.
10 Invesco Balanced-Risk Commodity Strategy Fund
| | | | | | | | | | | | | | | |
| | | | | | | | | Unrealized
|
| | | | | Notional
| | Termination
| | Appreciation
|
| Swap Agreements | | Counterparty | | Amount | | Date | | (Depreciation) |
| |
| Receive a return equal to Goldman Sachs Soybean Meal Excess Return Strategy and pay the product of (i) 0.30% of the Notional Amount multiplied by (ii) days in the period divided by 365. | | Goldman Sachs | | $ | 31,835,312 | | | | November-2011 | | | $ | 1,136,982 | |
| |
| Receive a return equal to Dow Jones-UBS Gold Index and pay the product of (i) 0.20% of the Notional Amount multiplied by (ii) days in the period divided by 365. | | Merrill Lynch | | | 12,433,037 | | | | November-2011 | | | | 788,606 | |
| |
| Receive a return equal to Dow Jones-UBS Silver Index and pay the product of (i) 0.20% of the Notional Amount multiplied by (ii) days in the period divided by 365. | | Barclays Capital | | | 511,370 | | | | November-2011 | | | | 40,707 | |
| |
| Receive a return equal to Merrill Lynch Commodity Index eXtra XLP Copper Excess Return Index and pay the product of (i) 0.22% of the Notional Amount multiplied by (ii) days in the period divided by 365. | | Merrill Lynch | | | 30,267,308 | | | | November-2011 | | | | 4,118,075 | |
| |
| Receive a return equal to Goldman Sachs Soybean Meal Excess Return Strategy and pay the product of (i) 0.30% of the Notional Amount multiplied by (ii) days in the period divided by 365. | | Goldman Sachs | | | 3,952,052 | | | | October-2012 | | | | (71,232 | ) |
| |
| Total Swap Agreements | | | | | | | | | | | | $ | 6,013,138 | |
| |
See accompanying Notes to Consolidated Financial Statements which are an integral part of the financial statements.
11 Invesco Balanced-Risk Commodity Strategy Fund
Consolidated Statement of Assets and Liabilities
October 31, 2011
| | | | | |
Assets:
|
| Investments, at value (Cost $76,904,244) | | $ | 85,611,131 | |
| |
| Investments in affiliated money market funds, at value and cost | | | 71,902,581 | |
| |
| Total investments, at value (Cost $148,806,825) | | | 157,513,712 | |
| |
| Receivable for: | | | | |
| Deposits with brokers for open futures contracts | | | 5,305,000 | |
| |
| Investments sold | | | 2,233,957 | |
| |
| Variation margin | | | 145,855 | |
| |
| Fund shares sold | | | 1,170,277 | |
| |
| Dividends | | | 5,807 | |
| |
| Fund expenses absorbed | | | 29,090 | |
| |
| Unrealized appreciation on swap agreements | | | 6,013,138 | |
| |
| Investment for trustee deferred compensation and retirement plans | | | 1,120 | |
| |
| Other assets | | | 151,691 | |
| |
| Total assets | | | 172,569,647 | |
| |
Liabilities:
|
| Payable for: | | | | |
| Swap agreements close-out | | | 205,478 | |
| |
| Fund shares reacquired | | | 433,721 | |
| |
| Dividends | | | 14,520 | |
| |
| Accrued fees to affiliates | | | 38,388 | |
| |
| Accrued other operating expenses | | | 86,886 | |
| |
| Trustee deferred compensation and retirement plans | | | 2,044 | |
| |
| Total liabilities | | | 781,037 | |
| |
| Net assets applicable to shares outstanding | | $ | 171,788,610 | |
| |
Net assets consist of:
|
| Shares of beneficial interest | | $ | 163,083,625 | |
| |
| Undistributed net investment income (loss) | | | (6,015,040 | ) |
| |
| Undistributed net realized gain | | | 414,181 | |
| |
| Unrealized appreciation | | | 14,305,844 | |
| |
| | | $ | 171,788,610 | |
| |
Net Assets:
|
| Class A | | $ | 7,659,076 | |
| |
| Class B | | $ | 277,291 | |
| |
| Class C | | $ | 1,821,991 | |
| |
| Class R | | $ | 110,523 | |
| |
| Class Y | | $ | 59,062,829 | |
| |
| Institutional Class | | $ | 102,856,900 | |
| |
Shares outstanding, $0.01 par value per share, with an unlimited number of shares authorized:
|
| Class A | | | 735,066 | |
| |
| Class B | | | 26,775 | |
| |
| Class C | | | 176,037 | |
| |
| Class R | | | 10,604 | |
| |
| Class Y | | | 5,641,447 | |
| |
| Institutional Class | | | 9,828,066 | |
| |
| Class A: | | | | |
| Net asset value per share | | $ | 10.42 | |
| |
| Maximum offering price per share | | | | |
| (Net asset value of $10.42 divided by 94.50%) | | $ | 11.03 | |
| |
| Class B: | | | | |
| Net asset value and offering price per share | | $ | 10.36 | |
| |
| Class C: | | | | |
| Net asset value and offering price per share | | $ | 10.35 | |
| |
| Class R: | | | | |
| Net asset value and offering price per share | | $ | 10.42 | |
| |
| Class Y: | | | | |
| Net asset value and offering price per share | | $ | 10.47 | �� |
| |
| Institutional Class: | | | | |
| Net asset value and offering price per share | | $ | 10.47 | |
| |
See accompanying Notes to Consolidated Financial Statements which are an integral part of the financial statements.
12 Invesco Balanced-Risk Commodity Strategy Fund
Consolidated Statement of Operations
For the period November 30, 2010 (commencement date) to October 31, 2011
| | | | | |
Investment income:
|
| Dividends | | $ | 5,423 | |
| |
| Dividends from affiliated money market funds | | | 70,479 | |
| |
| Interest | | | 34,417 | |
| |
| Total investment income | | | 110,319 | |
| |
Expenses:
|
| Advisory fees | | | 1,286,092 | |
| |
| Administrative services fees | | | 46,027 | |
| |
| Custodian fees | | | 4,895 | |
| |
| Distribution fees: | | | | |
| Class A | | | 10,021 | |
| |
| Class B | | | 1,458 | |
| |
| Class C | | | 9,460 | |
| |
| Class R | | | 170 | |
| |
| Transfer agent fees — A, B, C, R and Y | | | 18,905 | |
| |
| Transfer agent fees — Institutional | | | 328 | |
| |
| Trustees’ and officers’ fees and benefits | | | 17,155 | |
| |
| Other | | | 123,074 | |
| |
| Total expenses | | | 1,517,585 | |
| |
| Less: Fees waived and expenses reimbursed | | | (307,673 | ) |
| |
| Net expenses | | | 1,209,912 | |
| |
| Net investment income (loss) | | | (1,099,593 | ) |
| |
Realized and unrealized gain (loss) from:
|
| Net realized gain (loss) from: | | | | |
| Investment securities | | | 1,864 | |
| |
| Futures contracts | | | (3,533,863 | ) |
| |
| Swap agreements | | | (7,465,807 | ) |
| |
| | | | (10,997,806 | ) |
| |
| Change in net unrealized appreciation (depreciation) of: | | | | |
| Investment securities | | | 8,706,887 | |
| |
| Futures contracts | | | (414,181 | ) |
| |
| Swap agreements | | | 6,013,138 | |
| |
| | | | 14,305,844 | |
| |
| Net realized and unrealized gain | | | 3,308,038 | |
| |
| Net increase in net assets resulting from operations | | $ | 2,208,445 | |
| |
See accompanying Consolidated Notes to Financial Statements which are an integral part of the financial statements.
13 Invesco Balanced-Risk Commodity Strategy Fund
Consolidated Statement of Changes in Net Assets
For the period November 30, 2010 (commencement date) to October 31, 2011
| | | | | |
| | | 2011 |
| |
Operations:
|
| Net investment income (loss) | | $ | (1,099,593 | ) |
| |
| Net realized gain (loss) | | | (10,997,806 | ) |
| |
| Change in net unrealized appreciation | | | 14,305,844 | |
| |
| Net increase in net assets resulting from operations | | | 2,208,445 | |
| |
Share transactions–net:
|
| Class A | | | 8,314,165 | |
| |
| Class B | | | 303,350 | |
| |
| Class C | | | 2,020,085 | |
| |
| Class R | | | 119,570 | |
| |
| Class Y | | | 63,364,005 | |
| |
| Institutional Class | | | 95,458,990 | |
| |
| Net increase in net assets resulting from share transactions | | | 169,580,165 | |
| |
| Net increase in net assets | | | 171,788,610 | |
| |
Net assets:
|
| Beginning of period | | | — | |
| |
| End of period (includes undistributed net investment income (loss) of $(6,015,040)) | | $ | 171,788,610 | |
| |
Notes to Consolidated Financial Statements
October 31, 2011
NOTE 1—Significant Accounting Policies
Invesco Balanced-Risk Commodity Strategy Fund (the “Fund”) is a series portfolio of AIM Investment Funds (Invesco Investment Funds), formerly AIM Investment Funds, (the “Trust”). The Trust is organized as a Delaware statutory trust and is registered under the Investment Company Act of 1940, as amended (the “1940 Act”), as an open-end series management investment company consisting of thirteen separate series portfolios, each authorized to issue an unlimited number of shares of beneficial interest. The assets, liabilities and operations of each portfolio are accounted for separately. Information presented in these consolidated financial statements pertains only to the Fund. Matters affecting each portfolio or class will be voted on exclusively by the shareholders of such portfolio or class.
The Fund will seek to gain exposure to the commodity markets primarily through investments in the Invesco Cayman Commodity Fund III Ltd. (the “Subsidiary”), a wholly-owned subsidiary of the Fund organized under the laws of the Cayman Islands. The Subsidiary was organized by the Fund to invest in commodity-linked derivatives. The Fund may invest up to 25% of its total assets in the Subsidiary.
The Fund’s investment objective is to provide total return.
The Fund currently consists of six different classes of shares: Class A, Class B, Class C, Class R, Class Y and Institutional Class. Class A shares are sold with a front-end sales charge unless certain waiver criteria are met and under certain circumstances load waived shares may be subject to contingent deferred sales charges (“CDSC”). Class C shares are sold with a CDSC. Class R, Class Y and Institutional Class shares are sold at net asset value. Effective November 30, 2010, new or additional investments in Class B shares are no longer permitted. Existing shareholders of Class B shares may continue to reinvest dividends and capital gains distributions in Class B shares until they convert. Also, shareholders in Class B shares will be able to exchange those shares for Class B shares of other Invesco Funds offering such shares until they convert. Generally, Class B shares will automatically convert to Class A shares on or about the month-end which is at least eight years after the date of purchase. Redemption of Class B shares prior to conversion date will be subject to a CDSC.
The following is a summary of the significant accounting policies followed by the Fund in the preparation of its consolidated financial statements.
| | |
| A. | | Security Valuations — Securities, including restricted securities, are valued according to the following policy. |
| | Debt obligations (including convertible bonds) and unlisted equities are fair valued using an evaluated quote provided by an independent pricing service. Evaluated quotes provided by the pricing service may be determined without exclusive reliance on quoted prices, and may reflect appropriate factors such as institution-size trading in similar groups of securities, developments related to specific securities, dividend rate, yield, quality, type of issue, coupon rate, maturity, individual trading characteristics and other market data. Debt securities are subject to interest rate and credit risks. In addition, all debt securities involve some risk of default with respect to interest and/or principal payments. |
| | A security listed or traded on an exchange (except convertible bonds) is valued at its last sales price or official closing price as of the close of the customary trading session on the exchange where the security is principally traded, or lacking any sales or official closing price on a particular day, the |
14 Invesco Balanced-Risk Commodity Strategy Fund
| | |
| | security may be valued at the closing bid price on that day. Securities traded in the over-the-counter market are valued based on prices furnished by independent pricing services or market makers. When such securities are valued by an independent pricing service they may be considered fair valued. Futures contracts are valued at the final settlement price set by an exchange on which they are principally traded. Listed options are valued at the mean between the last bid and ask prices from the exchange on which they are principally traded. Options not listed on an exchange are valued by an independent source at the mean between the last bid and ask prices. For purposes of determining net asset value per share, futures and option contracts generally are valued 15 minutes after the close of the customary trading session of the New York Stock Exchange (“NYSE”). |
| | Investments in open-end and closed-end registered investment companies that do not trade on an exchange are valued at the end of day net asset value per share. Investments in open-end and closed-end registered investment companies that trade on an exchange are valued at the last sales price or official closing price as of the close of the customary trading session on the exchange where the security is principally traded. |
| | Swap agreements are fair valued using an evaluated quote provided by an independent pricing service. Evaluated quotes provided by the pricing service are valued based on a model which may include end of day net present values, spreads, ratings, industry, and company performance. |
| | Foreign securities (including foreign exchange contracts) are converted into U.S. dollar amounts using the applicable exchange rates as of the close of the NYSE. If market quotations are available and reliable for foreign exchange traded equity securities, the securities will be valued at the market quotations. Because trading hours for certain foreign securities end before the close of the NYSE, closing market quotations may become unreliable. If between the time trading ends on a particular security and the close of the customary trading session on the NYSE, events occur that are significant and make the closing price unreliable, the Fund may fair value the security. If the event is likely to have affected the closing price of the security, the security will be valued at fair value in good faith using procedures approved by the Board of Trustees. Adjustments to closing prices to reflect fair value may also be based on a screening process of an independent pricing service to indicate the degree of certainty, based on historical data, that the closing price in the principal market where a foreign security trade is not the current value as of the close of the NYSE. Foreign securities meeting the approved degree of certainty that the price is not reflective of current value will be priced at the indication of fair value from the independent pricing service. Multiple factors may be considered by the independent pricing service in determining adjustments to reflect fair value and may include information relating to sector indices, American Depositary Receipts and domestic and foreign index futures. Foreign securities may have additional risks including exchange rate changes, potential for sharply devalued currencies and high inflation, political and economical upheaval, the relative lack of issuer information, relatively low market liquidity and the potential lack of strict financial and accounting controls and standards. |
| | Securities for which market prices are not provided by any of the above methods may be valued based upon quotes furnished by independent sources. The last bid price may be used to value equity securities. The mean between the last bid and asked prices is used to value debt obligations, including Corporate Loans. |
| | Securities for which market quotations are not readily available or are unreliable are valued at fair value as determined in good faith by or under the supervision of the Trust’s officers following procedures approved by the Board of Trustees. Issuer specific events, market trends, bid/ask quotes of brokers and information providers and other market data may be reviewed in the course of making a good faith determination of a security’s fair value. |
| | Valuations change in response to many factors including the historical and prospective earnings of the issuer, the value of the issuer’s assets, general economic conditions, interest rates, investor perceptions and market liquidity. Because of the inherent uncertainties of valuation, the values reflected in the consolidated financial statements may materially differ from the value received upon actual sale of those investments. |
| B. | | Securities Transactions and Investment Income — Securities transactions are accounted for on a trade date basis. Realized gains or losses on sales are computed on the basis of specific identification of the securities sold. Interest income is recorded on the accrual basis from settlement date. Dividend income (net of withholding tax, if any) is recorded on the ex-dividend date. Bond premiums and discounts are amortized and/or accreted for financial reporting purposes. |
| | The Fund may periodically participate in litigation related to Fund investments. As such, the Fund may receive proceeds from litigation settlements. Any proceeds received are included in the Consolidated Statement of Operations as realized gain (loss) for investments no longer held and as unrealized gain (loss) for investments still held. |
| | Brokerage commissions and mark ups are considered transaction costs and are recorded as an increase to the cost basis of securities purchased and/or a reduction of proceeds on a sale of securities. Such transaction costs are included in the determination of net realized and unrealized gain (loss) from investment securities reported in the Consolidated Statement of Operations and the Consolidated Statement of Changes in Net Assets and the net realized and unrealized gains (losses) on securities per share in the Consolidated Financial Highlights. Transaction costs are included in the calculation of the Fund’s net asset value and, accordingly, they reduce the Fund’s total returns. These transaction costs are not considered operating expenses and are not reflected in net investment income reported in the Consolidated Statement of Operations and Consolidated Statement of Changes in Net Assets, or the net investment income per share and ratios of expenses and net investment income reported in the Consolidated Financial Highlights, nor are they limited by any expense limitation arrangements between the Fund and the investment adviser. |
| | The Fund allocates income and realized and unrealized capital gains and losses to a class based on the relative net assets of each class. |
| C. | | Country Determination — For the purposes of making investment selection decisions and presentation in the Consolidated Schedule of Investments, the investment adviser may determine the country in which an issuer is located and/or credit risk exposure based on various factors. These factors include the laws of the country under which the issuer is organized, where the issuer maintains a principal office, the country in which the issuer derives 50% or more of its total revenues and the country that has the primary market for the issuer’s securities, as well as other criteria. Among the other criteria that may be evaluated for making this determination are the country in which the issuer maintains 50% or more of its assets, the type of security, financial guarantees and enhancements, the nature of the collateral and the sponsor organization. Country of issuer and/or credit risk exposure has been determined to be the United States of America, unless otherwise noted. |
| D. | | Distributions — Distributions from income and net realized capital gain, if any, are generally paid annually and recorded on ex-dividend date. The Fund may elect to treat a portion of the proceeds from redemptions as distributions for federal income tax purposes. |
15 Invesco Balanced-Risk Commodity Strategy Fund
| | |
| E. | | Federal Income Taxes — The Fund intends to comply with the requirements of Subchapter M of the Internal Revenue Code necessary to qualify as a regulated investment company and to distribute substantially all of the Fund’s taxable earnings to shareholders. As such, the Fund will not be subject to federal income taxes on otherwise taxable income (including net realized capital gain) that is distributed to shareholders. Therefore, no provision for federal income taxes is recorded in the consolidated financial statements. |
| | The Subsidiary is classified as a controlled foreign corporation under Subchapter N of the Internal Revenue Code. Therefore, the Fund is required to increase its taxable income by its share of the Subsidiary’s income. Net investment losses of the Subsidiary cannot be deducted by the Fund in the current period nor carried forward to offset taxable income in future periods. |
| | The Fund files tax returns in the U.S. Federal jurisdiction and certain other jurisdictions. Generally the Fund is subject to examinations by such taxing authorities for up to three years after the filing of the return for the tax period. |
| F. | | Expenses — Fees provided for under the Rule 12b-1 plan of a particular class of the Fund are charged to the operations of such class. Transfer agency fees and expenses and other shareholder recordkeeping fees and expenses attributable to the Institutional Class are charged to such class. Transfer agency fees and expenses and other shareholder recordkeeping fees and expenses relating to all other classes are allocated among those classes based on relative net assets. All other expenses are allocated among the classes based on relative net assets. |
| G. | | Accounting Estimates — The financial statements are prepared on a consolidated basis in conformity with accounting principles generally accepted in the United States of America (“GAAP”), which requires management to make estimates and assumptions that affect the reported amounts of assets and liabilities at the date of the financial statements and the reported amounts of revenues and expenses during the reporting period including estimates and assumptions related to taxation. Actual results could differ from those estimates by a significant amount. The accompanying financial statements reflect the financial position of the Fund and its Subsidiary and the results of operations on a consolidated basis. All inter-company accounts and transactions have been eliminated in consolidation. |
| | In addition, the Fund monitors for material events or transactions that may occur or become known after the period-end date and before the date the consolidated financial statements are released to print. |
| H. | | Indemnifications — Under the Trust’s organizational documents, each Trustee, officer, employee or other agent of the Trust, and under the Subsidiary’s organizational documents, the directors and officers of the Subsidiary, are indemnified against certain liabilities that may arise out of performance of their duties to the Fund and/or the Subsidiary, respectively. Additionally, in the normal course of business, the Fund enters into contracts, including the Fund’s servicing agreements, that contain a variety of indemnification clauses. The Fund’s maximum exposure under these arrangements is unknown as this would involve future claims that may be made against the Fund that have not yet occurred. The risk of material loss as a result of such indemnification claims is considered remote. |
| I. | | Other Risks — The Fund will seek to gain exposure to commodity markets primarily through an investment in the Subsidiary and through investments in exchange traded funds. The Subsidiary, unlike the Fund, may invest without limitation in commodities, commodity-linked derivatives and other securities, such as exchange traded notes, that may provide leverage and non-leveraged exposure to commodity markets. The Fund is indirectly exposed to the risks associated with the Subsidiary’s investments. |
| | The Fund is non-diversified and may invest in securities of fewer issuers than if it were diversified. Thus, the value of the Fund’s shares may vary more widely and the Fund may be subject to greater market and credit risk than if the Fund invested more broadly. |
| J. | | Structured Securities — The Fund may invest in structured securities. Structured securities are a type of derivative security whose value is determined by reference to changes in the value of underlying securities, currencies, interest rates, commodities, indices or other financial indicators (“reference instruments”). Most structured securities are fixed-income securities that have maturities of three years or less. Structured securities may be positively or negatively indexed (i.e., their principal value or interest rates may increase or decrease if the underlying reference instrument appreciates) and may have return characteristics similar to direct investments in the underlying reference instrument. |
| | Structured securities may entail a greater degree of market risk than other types of debt securities because the investor bears the risk of the reference instruments. In addition to the credit risk of structured securities and the normal risks of price changes in response to changes in interest rates, the principal amount of structured notes or indexed securities may decrease as a result of changes in the value of the underlying reference instruments. Changes in the daily value of structured securities are recorded as unrealized gains (losses) in the Consolidated Statement of Operations. When the structured securities mature or are sold, the Fund recognizes a realized gain (loss) on the Consolidated Statement of Operations. |
| K. | | Futures Contracts — The Fund may enter into futures contracts to manage exposure to interest rate, equity and market price movements and/or currency risks. A futures contract is an agreement between two parties to purchase or sell a specified underlying security, currency or commodity (or delivery of a cash settlement price, in the case of an index future) for a fixed price at a future date. The Fund currently invests only in exchange-traded futures and they are standardized as to maturity date and underlying financial instrument. Initial margin deposits required upon entering into futures contracts are satisfied by the segregation of specific securities or cash as collateral at the futures commission merchant (broker). During the period the futures contracts are open, changes in the value of the contracts are recognized as unrealized gains or losses by recalculating the value of the contracts on a daily basis. Subsequent or variation margin payments are received or made depending upon whether unrealized gains or losses are incurred. These amounts are reflected as receivables or payables on the Consolidated Statement of Assets and Liabilities. When the contracts are closed or expire, the Fund recognizes a realized gain or loss equal to the difference between the proceeds from, or cost of, the closing transaction and the Fund’s basis in the contract. The net realized gain (loss) and the change in unrealized gain (loss) on futures contracts held during the period is included on the Consolidated Statement of Operations. The primary risks associated with futures contracts are market risk and the absence of a liquid secondary market. If the Fund were unable to liquidate a futures contract and/or enter into an offsetting closing transaction, the Fund would continue to be subject to market risk with respect to the value of the contracts and continue to be required to maintain the margin deposits on the futures contracts. Futures contracts have minimal counterparty risk since the exchange’s clearinghouse, as counterparty to all exchange-traded futures, guarantees the futures against default. Risks may exceed amounts recognized in the Consolidated Statement of Assets and Liabilities. |
16 Invesco Balanced-Risk Commodity Strategy Fund
| | |
| L. | | Swap Agreements — The Fund may enter into various swap transactions, including interest rate, total return, index, currency exchange rate and credit default swap contracts (“CDS”) for investment purposes or to manage interest rate, currency or credit risk. |
| | Interest rate, total return, index, and currency exchange rate swap agreements are two-party contracts entered into primarily to exchange the returns (or differentials in rates of returns) earned or realized on particular predetermined investments or instruments. The gross returns to be exchanged or “swapped” between the parties are calculated with respect to a notional amount, i.e., the return on or increase in value of a particular dollar amount invested at a particular interest rate or return of an underlying asset, in a particular foreign currency, or in a “basket” of securities representing a particular index. |
| | A CDS is an agreement between two parties (“Counterparties”) to exchange the credit risk of an issuer. A buyer of a CDS is said to buy protection by paying a fixed payment over the life of the agreement and in some situations an upfront payment to the seller of the CDS. If a defined credit event occurs (such as payment default or bankruptcy), the Fund as a protection buyer would cease paying its fixed payment, the Fund would deliver eligible bonds issued by the reference entity to the seller, and the seller would pay the full notional value, or the “par value”, of the referenced obligation to the Fund. A seller of a CDS is said to sell protection and thus would receive a fixed payment over the life of the agreement and an upfront payment, if applicable. If a credit event occurs, the Fund as a protection seller would cease to receive the fixed payment stream, the Fund would pay the buyer “par value” or the full notional value of the referenced obligation, and the Fund would receive the eligible bonds issued by the reference entity. In turn, these bonds may be sold in order to realize a recovery value. Alternatively, the seller of the CDS and its counterparty may agree to net the notional amount and the market value of the bonds and make a cash payment equal to the difference to the buyer of protection. If no credit event occurs, the Fund receives the fixed payment over the life of the agreement. As the seller, the Fund would effectively add leverage to its portfolio because, in addition to its total net assets, the Fund would be subject to investment exposure on the notional amount of the CDS. In connection with these agreements, cash and securities may be identified as collateral in accordance with the terms of the respective swap agreements to provide assets of value and recourse in the event of default under the swap agreement or bankruptcy/insolvency of a party to the swap agreement. If a counterparty becomes bankrupt or otherwise fails to perform its obligations due to financial difficulties, the Fund may experience significant delays in obtaining any recovery in a bankruptcy or other reorganization proceeding. The Fund may obtain only limited recovery or may obtain no recovery in such circumstances. |
| | Implied credit spreads represent the current level at which protection could be bought or sold given the terms of the existing CDS contract and serve as an indicator of the current status of the payment/performance risk of the CDS. An implied spread that has widened or increased since entry into the initial contract may indicate a deteriorating credit profile and increased risk of default for the reference entity. A declining or narrowing spread may indicate an improving credit profile or decreased risk of default for the reference entity. Alternatively, credit spreads may increase or decrease reflecting the general tolerance for risk in the credit markets. |
| | Changes in the value of swap agreements are recognized as unrealized gains (losses) in the Consolidated Statement of Operations by “marking to market” on a daily basis to reflect the value of the swap agreement at the end of each trading day. Payments received or paid at the beginning of the agreement are reflected as such on the Consolidated Statement of Assets and Liabilities and may be referred to as upfront payments. The Fund accrues for the fixed payment stream and amortizes upfront payments, if any, on swap agreements on a daily basis with the net amount, recorded as a component of realized gain (loss) on the Consolidated Statement of Operations. A liquidation payment received or made at the termination of a swap agreement is recorded as realized gain (loss) on the Consolidated Statement of Operations. The Fund segregates liquid securities having a value at least equal to the amount of the potential obligation of a Fund under any swap transaction. The Fund’s maximum risk of loss from counterparty risk, either as the protection seller or as the protection buyer, is the value of the contract. The risk may be mitigated by having a master netting arrangement between the Fund and the counterparty and by the posting of collateral by the counterparty to cover the Fund’s exposure to the counterparty. Entering into these agreements involves, to varying degrees, lack of liquidity and elements of credit, market, and counterparty risk in excess of amounts recognized on the Consolidated Statement of Assets and Liabilities. Such risks involve the possibility that a swap is difficult to sell or liquidate; the counterparty does not honor its obligations under the agreement and unfavorable interest rates and market fluctuations. |
| M. | | Collateral — To the extent the Fund has pledged or segregated a security as collateral and that security is subsequently sold, it is the Fund’s practice to replace such collateral no later than the next business day. |
NOTE 2—Advisory Fees and Other Fees Paid to Affiliates
The Trust has entered into a master investment advisory agreement with Invesco Advisers, Inc. (the “Adviser” or “Invesco”). Under the terms of the investment advisory agreement, the Fund pays an advisory fee to the Adviser based on the annual rate of the Fund’s average daily net assets as follows:
| | | | | |
| Average Net Assets | | Rate |
| |
| First $250 million | | | 1 | .05% |
| |
| Next $250 million | | | 1 | .025% |
| |
| Next $500 million | | | 1 | .00% |
| |
| Next $1.5 billion | | | 0 | .975% |
| |
| Next $2.5 billion | | | 0 | .95% |
| |
| Next $2.5 billion | | | 0 | .925% |
| |
| Next $2.5 billion | | | 0 | .90% |
| |
| Over $10 billion | | | 0 | .875% |
| |
Under the terms of a master sub-advisory agreement between the Adviser and each of Invesco Asset Management Deutschland GmbH, Invesco Asset Management Limited, Invesco Asset Management (Japan) Limited, Invesco Australia Limited, Invesco Hong Kong Limited, Invesco Senior Secured Management,
17 Invesco Balanced-Risk Commodity Strategy Fund
Inc. and Invesco Canada Ltd. (collectively, the “Affiliated Sub-Advisers”) the Adviser, not the Fund, may pay 40% of the fees paid to the Adviser to any such Affiliated Sub-Adviser(s) that provide discretionary investment management services to the Fund based on the percentage of assets allocated to such Sub-Adviser(s).
The Subsidiary has entered into a separate contract with the Adviser whereby the Adviser provides investment advisory and other services to the Subsidiary. In consideration of these services, the Subsidiary pays an advisory fee to the Adviser based on the annual rate of the Subsidiary’s average daily net assets as set forth in the table above.
The Adviser has contractually agreed, through at least February 28, 2013, to waive advisory fees and/or reimburse expenses to the extent necessary to limit total annual operating expenses after fee waiver and/or expense reimbursement (excluding certain items discussed below) of Class A, Class B, Class C, Class R, Class Y and Institutional Class shares to 1.22%, 1.97%, 1.97%, 1.47%, 0.97% and 0.97% of average daily net assets, respectively. In determining the Adviser’s obligation to waive advisory fees and/or reimburse expenses, the following expenses are not taken into account, and could cause total annual operating expenses after fee waiver and/or expense reimbursement to exceed the numbers reflected above: (1) interest; (2) taxes; (3) dividend expense on short sales; (4) extraordinary or non-routine items; and (5) expenses that the Fund has incurred but did not actually pay because of an expense offset arrangement. Unless the Board of the Trustees and Invesco mutually agree to amend or continue the fee waiver agreement, it will terminate on February 28, 2013.
Further, the Adviser has contractually agreed, through at least June 30, 2012, to waive the advisory fee payable by the Fund in an amount equal to 100% of the net advisory fees the Adviser receives from the affiliated money market funds on investments by the Fund of uninvested cash in such affiliated money market funds.
For the period November 30, 2010 (commencement date) to October 31, 2011, the Adviser waived advisory fees $288,440 and reimbursed class level expenses of $3,287, $119, $776, $28, $14,695 and $328 of Class A, Class B, Class C, Class R, Class Y and Institutional Class shares, respectively.
The Trust has entered into a master administrative services agreement with Invesco pursuant to which the Fund has agreed to pay Invesco for certain administrative costs incurred in providing accounting services to the Fund. For the period November 30, 2010 (commencement date) to October 31, 2011, expenses incurred under the agreement are shown in the Consolidated Statement of Operations as administrative services fees.
The Trust has entered into a transfer agency and service agreement with Invesco Investment Services, Inc. (“IIS”) pursuant to which the Fund has agreed to pay IIS a fee for providing transfer agency and shareholder services to the Fund and reimburse IIS for certain expenses incurred by IIS in the course of providing such services. IIS may make payments to intermediaries that provide omnibus account services, sub-accounting services and/or networking services. All fees payable by IIS to intermediaries that provide omnibus account services or sub-accounting are charged back to the Fund, subject to certain limitations approved by the Trust’s Board of Trustees. For the period November 30, 2010 (commencement date) to October 31, 2011, expenses incurred under the agreement are shown in the Consolidated Statement of Operations as transfer agent fees.
The Trust has entered into master distribution agreements with Invesco Distributors, Inc. (“IDI”) to serve as the distributor for the Class A, Class B, Class C, Class R, Class Y and Institutional Class shares of the Fund. The Trust has adopted plans pursuant to Rule 12b-1 under the 1940 Act with respect to the Fund’s Class A, Class B, Class C and Class R shares (collectively, the “Plans”). The Fund, pursuant to the Plans, pays IDI compensation at the annual rate of 0.25% of the Fund’s average daily net assets of Class A shares, 1.00% of the average daily net assets of Class B and Class C shares and 0.50% of the average daily net assets of Class R shares. Of the Plan payments, up to 0.25% of the average daily net assets of each class of shares may be paid to furnish continuing personal shareholder services to customers who purchase and own shares of such classes. Any amounts not paid as a service fee under the Plans would constitute an asset-based sales charge. Rules of the Financial Industry Regulatory Authority (“FINRA”) impose a cap on the total sales charges, including asset-based sales charges that may be paid by any class of shares of the Fund. For the period November 30, 2010 (commencement date) to October 31, 2011, expenses incurred under the Plans are shown in the Consolidated Statement of Operations as distribution fees.
Front-end sales commissions and CDSC (collectively, the “sales charges”) are not recorded as expenses of the Fund. Front-end sales commissions are deducted from proceeds from the sales of Fund shares prior to investment in Class A shares of the Fund. CDSC are deducted from redemption proceeds prior to remittance to the shareholder. During the period ended October 31, 2011, IDI advised the Fund that IDI retained $9,169 in front-end sales commissions from the sale of Class A shares and $0, $0 and $5,630 from Class A, Class B and Class C shares, respectively, for CDSC imposed on redemptions by shareholders.
Certain officers and trustees of the Trust are officers and directors of the Adviser, Invesco Ltd., IIS and/or IDI.
NOTE 3—Additional Valuation Information
GAAP defines fair value as the price that would be received to sell an asset or paid to transfer a liability in an orderly transaction between market participants at the measurement date, under current market conditions. GAAP establishes a hierarchy that prioritizes the inputs to valuation methods giving the highest priority to readily available unadjusted quoted prices in an active market for identical assets (Level 1) and the lowest priority to significant unobservable inputs (Level 3) generally when market prices are not readily available or are unreliable. Based on the valuation inputs, the securities or other investments are tiered into one of three levels. Changes in valuation methods may result in transfers in or out of an investment’s assigned level:
| | |
| | Level 1 — | Prices are determined using quoted prices in an active market for identical assets. |
| | Level 2 — | Prices are determined using other significant observable inputs. Observable inputs are inputs that other market participants may use in pricing a security. These may include quoted prices for similar securities, interest rates, prepayment speeds, credit risk, yield curves, loss severities, default rates, discount rates, volatilities and others. |
| | Level 3 — | Prices are determined using significant unobservable inputs. In situations where quoted prices or observable inputs are unavailable (for example, when there is little or no market activity for an investment at the end of the period), unobservable inputs may be used. Unobservable inputs reflect the Fund’s own assumptions about the factors market participants would use in determining fair value of the securities or instruments and would be based on the best available information. |
The following is a summary of the tiered valuation input levels, as of October 31, 2011. The level assigned to the securities valuations may not be an indication of the risk or liquidity associated with investing in those securities. Because of the inherent uncertainties of valuation, the values reflected in consolidated the financial statements may materially differ from the value received upon actual sale of those investments.
18 Invesco Balanced-Risk Commodity Strategy Fund
During the period November 30, 2010 (commencement date) to October 31, 2011, there were no significant transfers between investment levels.
| | | | | | | | | | | | | | | | | |
| | | Level 1 | | Level 2 | | Level 3 | | Total |
| |
| Commodity-Linked Securities | | $ | — | | | $ | 20,111,937 | | | $ | — | | | $ | 20,111,937 | |
| |
| U.S. Treasury Debt Securities | | | — | | | | 65,499,194 | | | | — | | | | 65,499,194 | |
| |
| Money Market Funds | | | 71,902,581 | | | | — | | | | — | | | | 71,902,581 | |
| |
| | | $ | 71,902,581 | | | $ | 85,611,131 | | | $ | — | | | $ | 157,513,712 | |
| |
| Futures and Swap Agreements* | | | (414,181 | ) | | | 6,013,138 | | | | — | | | | 5,598,957 | |
| |
| Total Investments | | $ | 71,488,400 | | | $ | 91,624,269 | | | $ | — | | | $ | 163,112,669 | |
| |
| |
| * | Unrealized appreciation (depreciation). |
NOTE 4—Derivative Investments
Effective November 30, 2010 (commencement date), the Fund has implemented the required disclosures about derivative instruments and hedging activities in accordance with GAAP. This disclosure is intended to improve financial reporting about derivative instruments and hedging activities by requiring enhanced disclosures to enable investors to better understand their effects on an entity’s financial position and financial performance. The enhanced disclosure has no impact on the results of operations reported in the consolidated financial statements.
Value of Derivative Instruments at Period-End
The table below summarizes the value of the Fund’s derivative instruments, detailed by primary risk exposure, held as of October 31, 2011:
| | | | | | | | | |
| | | Value |
| Risk Exposure/Derivative Type | | Assets | | Liabilities |
| |
| Commodity risk | | | | | | | | |
Futures Contracts(a) | | $ | 172,028 | | | $ | (586,209 | ) |
| |
| Commodity risk | | | | | | | | |
Swap Agreements(b) | | | 6,084,370 | | | | (71,232 | ) |
| |
| | |
| (a) | | Includes cumulative appreciation (depreciation) of futures contracts. Only current day’s variation margin receivable (payable) is reported within the Consolidated Statement of Assets & Liabilities. |
| (b) | | Values are disclosed on the Consolidated Statement of Assets and Liabilities under the Unrealized appreciation for swap agreements. |
Effect of Derivative Instruments for the period November 30, 2010 (commencement date) to October 31, 2011
The table below summarizes the gains (losses) on derivative instruments, detailed by primary risk exposure, recognized in earnings during the period:
| | | | | | | �� | | |
| | | Location of Gain (Loss) on
|
| | | Consolidated Statement of
|
| | | Operations |
| | | | | Swap
|
| | | Futures* | | Agreements* |
| |
| Realized Gain (Loss) | | | | | | | | |
| Commodity risk | | $ | (3,533,863 | ) | | $ | (7,465,807 | ) |
| |
| Change in Unrealized Appreciation (Depreciation) | | | | | | | | |
| Commodity risk | | | (414,181 | ) | | | 6,013,138 | |
| |
| Total | | $ | (3,948,044 | ) | | $ | (1,452,669 | ) |
| |
| |
| * | The average notional value of futures and swap agreements outstanding during the period was $6,725,930 and $99,628,206, respectively. |
NOTE 5—Trustees’ and Officers’ Fees and Benefits
“Trustees’ and Officers’ Fees and Benefits” include amounts accrued by the Fund to pay remuneration to certain Trustees and Officers of the Fund. Trustees have the option to defer compensation payable by the Fund, and “Trustees’ and Officers’ Fees and Benefits” also include amounts accrued by the Fund to fund such deferred compensation amounts. Those Trustees who defer compensation have the option to select various Invesco Funds in which their deferral accounts shall be deemed to be invested. Finally, certain current Trustees are eligible to participate in a retirement plan that provides for benefits to be paid upon retirement to Trustees over a period of time based on the number of years of service. The Fund may have certain former Trustees who also participate in a retirement plan and receive benefits under such plan. “Trustees’ and Officers’ Fees and Benefits” include amounts accrued by the Fund to fund such retirement benefits. Obligations under the deferred compensation and retirement plans represent unsecured claims against the general assets of the Fund.
During the period November 30, 2010 (commencement date) to October 31, 2011, the Fund paid legal fees of $204 for services rendered by Kramer, Levin, Naftalis & Frankel LLP as counsel to the Independent Trustees. A partner of that firm is a Trustee of the Trust.
19 Invesco Balanced-Risk Commodity Strategy Fund
NOTE 6—Cash Balances
The Fund is permitted to temporarily carry a negative or overdrawn balance in its account with The State Street Bank and Trust Company, the custodian bank. To compensate the custodian bank for such overdrafts, the overdrawn Fund may either (1) leave funds as a compensating balance in the account so the custodian bank can be compensated by earning the additional interest; or (2) compensate by paying the custodian bank at a rate agreed upon by the custodian bank and Invesco, not to exceed the contractually agreed upon rate.
NOTE 7—Distributions to Shareholders and Tax Components of Net Assets
There were no ordinary income and long-term gain distributions paid during the period November 30, 2010 (commencement date) to October 31, 2011
Consolidated Tax Components of Net Assets at Period-End:
| | | | | |
| | | 2011 |
| |
| Net unrealized appreciation — investments | | $ | 8,706,887 | |
| |
| Temporary book/tax differences | | | (1,902 | ) |
| |
| Shares of beneficial interest | | | 163,083,625 | |
| |
| Total net assets | | $ | 171,788,610 | |
| |
The Fund’s temporary book/tax differences are the result of the trustee deferral of compensation and retirement plan benefits.
The Fund does not have a capital loss carryforward at period-end.
20 Invesco Balanced-Risk Commodity Strategy Fund
NOTE 8—Investment Securities
The aggregate amount of investment securities (other than short-term securities, U.S. Treasury obligations and money market funds, if any) purchased and sold by the Fund during the period November 30, 2010 (commencement date) to October 31, 2011 was $11,413,334 and $0, respectively. Cost of investments on a tax basis includes the adjustments for financial reporting purposes as of the most recently completed Federal income tax reporting period-end.
| | | | | |
| Unrealized Appreciation (Depreciation) of Investment Securities on a Tax Basis |
| Aggregate unrealized appreciation of investment securities | | $ | 11,723,543 | |
| |
| Aggregate unrealized (depreciation) of investment securities | | | (3,016,656 | ) |
| |
| Net unrealized appreciation of investment securities | | $ | 8,706,887 | |
| |
| Cost of investments for tax purposes is the same for tax and financial statement purposes. |
NOTE 9—Reclassification of Permanent Differences
Primarily as a result of differing book/tax treatment of swap agreements, stock issuance costs and net operating losses, on October 31, 2011, undistributed net investment income (loss) was decreased by $4,915,447, undistributed net realized gain (loss) was increased by $11,411,987 and shares of beneficial interest decreased by $6,496,540. This reclassification had no effect on the net assets of the Fund.
NOTE 10—Share Information
| | | | | | | | | |
| | | Summary of Share Activity |
| |
| | | November 30, 2010 (commencement date) to October 31, 2011(a) |
| | | Shares | | Amount |
| |
| Sold: | | | | | | | | |
| Class A | | | 956,611 | | | $ | 10,742,667 | |
| |
| Class B | | | 33,165 | | | | 370,460 | |
| |
| Class C | | | 229,561 | | | | 2,628,093 | |
| |
| Class R | | | 10,613 | | | | 119,654 | |
| |
| Class Y | | | 5,968,110 | | | | 66,912,642 | |
| |
| Institutional Class | | | 12,594,602 | | | | 126,334,880 | |
| |
| Automatic conversion of Class B shares to Class A shares: | | | | | | | | |
| Class A | | | 953 | | | | 10,492 | |
| |
| Class B | | | (957 | ) | | | (10,492 | ) |
| |
| Reacquired: | | | | | | | | |
| Class A | | | (222,498 | ) | | | (2,438,994 | ) |
| |
| Class B | | | (5,433 | ) | | | (56,618 | ) |
| |
| Class C | | | (53,524 | ) | | | (608,008 | ) |
| |
| Class R | | | (9 | ) | | | (84 | ) |
| |
| Class Y | | | (326,663 | ) | | | (3,548,637 | ) |
| |
| Institutional Class | | | (2,766,536 | ) | | | (30,875,890 | ) |
| |
| Net increase in share activity | | | 16,417,995 | | | $ | 169,580,165 | |
| |
| | |
| (a) | | There is an entity that is a record owner of more than 5% of the outstanding shares of the Fund and owns 30% of the outstanding shares of the Fund. IDI has an agreement with this entity to sell Fund shares. The Fund, Invesco and/or Invesco affiliates may make payments to this entity, which is considered to be related to the Fund, for providing services to the Fund, Invesco and/or Invesco affiliates including but not limited to services such as, securities brokerage, distribution, third party record keeping and account servicing. The Fund has no knowledge as to whether all or any portion of the shares owned of record by this entity is also owned beneficially. |
| | In addition, 60% of the outstanding shares of the Fund are owned by affiliated mutual funds. Affiliated mutual funds are mutual funds that are advised by Invesco. |
21 Invesco Balanced-Risk Commodity Strategy Fund
NOTE 11—Consolidated Financial Highlights
The following schedule presents financial highlights for a share of the Fund outstanding throughout the periods indicated.
| | | | | | | | | | | | | | | | | | | | | | | | | | | | | | | | | | | | | | | | | | | | | |
| | | | | | | | | | | | | | | | | Ratio of
| | | | | | |
| | | | | | | | | | | | | | | | | expenses
| | Ratio of
| | | | |
| | | | | | | | | | | | | | | | | to average
| | expenses
| | | | |
| | | | | | | | | | | | | | | | | net assets
| | to average net
| | | | |
| | | | | | | Net gains
| | | | | | | | | | with fee
| | assets without
| | Ratio of net
| | |
| | | Net asset
| | Net
| | on securities
| | | | | | | | | | waivers
| | fee waivers
| | investment
| | |
| | | value,
| | investment
| | (both
| | Total from
| | Net asset
| | | | Net assets,
| | and/or
| | and/or
| | income (loss)
| | |
| | | beginning
| | income
| | realized and
| | investment
| | value, end
| | Total
| | end of period
| | expenses
| | expenses
| | to average
| | Portfolio
|
| | | of period | | (loss)(a) | | unrealized) | | operations | | of period | | Return(b) | | (000s omitted) | | absorbed | | absorbed | | net assets | | turnover(c) |
| |
| Class A |
| Eleven months ended 10/31/11(d) | | $ | 10.00 | | | $ | (0.12 | ) | | $ | 0.54 | | | $ | 0.42 | | | $ | 10.42 | | | | 4.20 | % | | $ | 7,659 | | | | 1.22 | %(e) | | | 1.54 | %(e) | | | (1.13 | )%(e) | | | 0 | % |
| |
| Class B |
| Eleven months ended 10/31/11(d) | | | 10.00 | | | | (0.19 | ) | | | 0.55 | | | | 0.36 | | | | 10.36 | | | | 3.60 | | | | 277 | | | | 1.97 | (e) | | | 2.29 | (e) | | | (1.88 | )(e) | | | 0 | |
| |
| Class C |
| Eleven months ended 10/31/11(d) | | | 10.00 | | | | (0.19 | ) | | | 0.54 | | | | 0.35 | | | | 10.35 | | | | 3.50 | | | | 1,822 | | | | 1.97 | (e) | | | 2.29 | (e) | | | (1.88 | )(e) | | | 0 | |
| |
| Class R |
| Eleven months ended 10/31/11(d) | | | 10.00 | | | | (0.14 | ) | | | 0.56 | | | | 0.42 | | | | 10.42 | | | | 4.20 | | | | 111 | | | | 1.47 | (e) | | | 1.79 | (e) | | | (1.38 | )(e) | | | 0 | |
| |
| Class Y |
| Eleven months ended 10/31/11(d) | | | 10.00 | | | | (0.09 | ) | | | 0.56 | | | | 0.47 | | | | 10.47 | | | | 4.70 | | | | 59,063 | | | | 0.97 | (e) | | | 1.29 | (e) | | | (0.88 | )(e) | | | 0 | |
| |
| Institutional Class |
| Eleven months ended 10/31/11(d) | | | 10.00 | | | | (0.09 | ) | | | 0.56 | | | | 0.47 | | | | 10.47 | | | | 4.70 | | | | 102,857 | | | | 0.97 | (e) | | | 1.21 | (e) | | | (0.88 | )(e) | | | 0 | |
| |
| | |
| (a) | | Calculated using average shares outstanding. |
| (b) | | Includes adjustments in accordance with accounting principles generally accepted in the United States of America and as such, the net asset value for financial reporting purposes and the returns based upon those net asset values may differ from the net asset value and returns for shareholder transactions. Does not include sales charges and is not annualized for periods less than one year, if applicable. |
| (c) | | Portfolio turnover is calculated at the fund level and is not annualized for periods less than one year, if applicable. |
| (d) | | Commencement date of November 30, 2010. |
| (e) | | Ratios are annualized and based on average daily net assets (000’s omitted) of $4,355, $158, $1,028, $37, $19,468 and $108,011 for Class A, Class B, Class C, Class R, Class Y and Institutional Class shares, respectively. |
NOTE 12—Proposed Reorganization
The Board of Trustees of the Fund unanimously approved an Agreement and Plan of Reorganization (the “Agreement”) pursuant to which the Fund would acquire all of the assets and liabilities of Invesco Commodity Strategy Fund (the “Target Fund”) in exchange for shares of the Fund.
The Agreement requires approval of the Target Fund’s shareholders and will be submitted to the shareholders for their consideration at a meeting to be held in or around April 2012. Upon closing of the reorganization, shareholders of the Target Fund will receive a corresponding class of shares of the Fund in exchange for their shares of the Target Fund and the Target Fund will liquidate and cease operations.
22 Invesco Balanced-Risk Commodity Strategy Fund
Report of Independent Registered Public Accounting Firm
To the Board of Trustees of AIM Investment Funds (Invesco Investment Funds)
and Shareholders of Invesco Balanced-Risk Commodity Strategy Fund:
In our opinion, the accompanying consolidated statement of assets and liabilities, including the consolidated schedule of investments, and the related consolidated statements of operations and of changes in net assets and the financial highlights present fairly, in all material respects, the consolidated financial position of Invesco Balanced-Risk Commodity Strategy Fund (one of the funds constituting AIM Investment Funds (Invesco Investment Funds), hereafter referred to as the “Fund”) at October 31, 2011, the results of its operations, the changes in its net assets and the financial highlights for the period November 30, 2010 (commencement date) through October 31, 2011, in conformity with accounting principles generally accepted in the United States of America. These consolidated financial statements and financial highlights (hereafter referred to as “financial statements”) are the responsibility of the Fund’s management; our responsibility is to express an opinion on these financial statements based on our audit. We conducted our audit of these financial statements in accordance with the standards of the Public Company Accounting Oversight Board (United States). Those standards require that we plan and perform the audit to obtain reasonable assurance about whether the financial statements are free of material misstatement. An audit includes examining, on a test basis, evidence supporting the amounts and disclosures in the financial statements, assessing the accounting principles used and significant estimates made by management, and evaluating the overall financial statement presentation. We believe that our audit, which included confirmation of securities at October 31, 2011 by correspondence with the custodian and brokers, provide a reasonable basis for our opinion.
PRICEWATERHOUSECOOPERS LLP
Houston, Texas
December 27, 2011
23 Invesco Balanced-Risk Commodity Strategy Fund
Calculating your ongoing Fund expenses
Example
As a shareholder of the Fund, you incur two types of costs: (1) transaction costs, which may include sales charges (loads) on purchase payments or contingent deferred sales charges on redemptions, and redemption fees, if any; and (2) ongoing costs, including management fees, distribution and/or service (12b-1) fees, and other Fund expenses. This example is intended to help you understand your ongoing costs (in dollars) of investing in the Fund and to compare these costs with ongoing costs of investing in other mutual funds. The example is based on an investment of $1,000 invested at the beginning of the period and held for the entire period May 1, 2011 through October 31, 2011.
Actual expenses
The table below provides information about actual account values and actual expenses. You may use the information in this table, together with the amount you invested, to estimate the expenses that you paid over the period. Simply divide your account value by $1,000 (for example, an $8,600 account value divided by $1,000 = 8.6), then multiply the result by the number in the table under the heading entitled “Actual Expenses Paid During Period” to estimate the expenses you paid on your account during this period.
Hypothetical example for comparison purposes
The table below also provides information about hypothetical account values and hypothetical expenses based on the Fund’s actual expense ratio and an assumed rate of return of 5% per year before expenses, which is not the Fund’s actual return.
The hypothetical account values and expenses may not be used to estimate the actual ending account balance or expenses you paid for the period. You may use this information to compare the ongoing costs of investing in the Fund and other funds. To do so, compare this 5% hypothetical example with the 5% hypothetical examples that appear in the shareholder reports of the other funds.
Please note that the expenses shown in the table are meant to highlight your ongoing costs only and do not reflect any transaction costs, such as sales charges (loads) on purchase payments, contingent deferred sales charges on redemptions, and redemption fees, if any. Therefore, the hypothetical information is useful in comparing ongoing costs only, and will not help you determine the relative total costs of owning different funds. In addition, if these transaction costs were included, your costs would have been higher.
| | | | | | | | | | | | | | | | | | | | | | | | | | | | | | | |
| | | | | | | | | | HYPOTHETICAL
| | | |
| | | | | | | | | | (5% annual return before
| | | |
| | | | | | | ACTUAL | | | expenses) | | | |
| | | | Beginning
| | | Ending
| | | Expenses
| | | Ending
| | | Expenses
| | | Annualized
|
| | | | Account Value
| | | Account Value
| | | Paid During
| | | Account Value
| | | Paid During
| | | Expense
|
| Class | | | (05/01/11) | | | (10/31/11)1 | | | Period2 | | | (10/31/11) | | | Period2 | | | Ratio |
| A | | | $ | 1,000.00 | | | | $ | 887.80 | | | | $ | 5.81 | | | | $ | 1,019.06 | | | | $ | 6.21 | | | | | 1.22 | % |
| | | | | | | | | | | | | | | | | | | | | | | | | | | | | | | |
| B | | | | 1,000.00 | | | | | 884.90 | | | | | 9.36 | | | | | 1,015.27 | | | | | 10.01 | | | | | 1.97 | |
| | | | | | | | | | | | | | | | | | | | | | | | | | | | | | | |
| C | | | | 1,000.00 | | | | | 884.10 | | | | | 9.36 | | | | | 1,015.27 | | | | | 10.01 | | | | | 1.97 | |
| | | | | | | | | | | | | | | | | | | | | | | | | | | | | | | |
| R | | | | 1,000.00 | | | | | 887.80 | | | | | 6.99 | | | | | 1,017.80 | | | | | 7.48 | | | | | 1.47 | |
| | | | | | | | | | | | | | | | | | | | | | | | | | | | | | | |
| Y | | | | 1,000.00 | | | | | 890.50 | | | | | 4.62 | | | | | 1,020.32 | | | | | 4.94 | | | | | 0.97 | |
| | | | | | | | | | | | | | | | | | | | | | | | | | | | | | | |
| Institutional | | | | 1,000.00 | | | | | 890.50 | | | | | 4.62 | | | | | 1,020.32 | | | | | 4.94 | | | | | 0.97 | |
| | | | | | | | | | | | | | | | | | | | | | | | | | | | | | | |
| |
| 1 | The actual ending account value is based on the actual total return of the Fund for the period May 1, 2011 through October 31, 2011, after actual expenses and will differ from the hypothetical ending account value which is based on the Fund’s expense ratio and a hypothetical annual return of 5% before expenses. |
| 2 | Expenses are equal to the Fund’s annualized expense ratio as indicated above multiplied by the average account value over the period, multiplied by 184/365 to reflect the most recent fiscal half year. |
24 Invesco Balanced-Risk Commodity Strategy Fund
| |
| Approval of Investment Advisory and Sub-Advisory Contracts |
The Board of Trustees (the Board) of AIM Investment Funds (Invesco Investment Funds) is required under the Investment Company Act of 1940, as amended, to approve annually the renewal of the Invesco Balanced-Risk Commodity Strategy Fund (the Fund) investment advisory agreement with Invesco Advisers, Inc. (Invesco Advisers) and the Master Intergroup Sub-Advisory Contract for Mutual Funds (the sub-advisory contracts) with Invesco Asset Management Deutschland GmbH, Invesco Asset Management Limited, Invesco Asset Management (Japan) Limited, Invesco Australia Limited, Invesco Hong Kong Limited, Invesco Senior Secured Management, Inc. and Invesco Canada Ltd. (collectively, the Affiliated Sub-Advisers). During contract renewal meetings held on June 14-15, 2011, the Board as a whole, and the disinterested or “independent” Trustees, who comprise 80% of the Board, voting separately, approved the continuance of the Fund’s investment advisory agreement and the sub-advisory contracts for another year, effective July 1, 2011. In doing so, the Board considered the process that it follows in reviewing and approving the Fund’s investment advisory agreement and sub-advisory contracts and the information that it is provided. The Board determined that the Fund’s investment advisory agreement and the sub-advisory contracts are in the best interests of the Fund and its shareholders and the compensation to Invesco Advisers and the Affiliated Sub-Advisers under the agreements is fair and reasonable.
The Board’s Fund Evaluation Process
The Board’s Investments Committee has established three Sub-Committees, each of which is responsible for overseeing the management of a number of the series portfolios of the funds advised by Invesco Advisers (the Invesco Funds). The Sub-Committees meet throughout the year to review the performance of their assigned funds, including reviewing materials prepared under the direction of the independent Senior Officer, an officer of the Invesco Funds who reports directly to the independent Trustees. Over the course of each year, the Sub-Committees meet with portfolio managers for their assigned Invesco Funds and other members of management to review the performance, investment objective(s), policies, strategies and limitations and investment risks of these funds. The Sub-Committees meet regularly and at designated contract renewal meetings each year to conduct a review of the performance, fees, expenses and other matters related to their assigned Invesco Funds. Each Sub-Committee recommends to the Investments Committee, which in turn recommends to the full Board, whether to approve the continuance of each Invesco Fund’s investment advisory agreement and sub-advisory contracts for another year.
During the contract renewal process, the Trustees receive comparative performance and fee data regarding the Invesco Funds prepared by Invesco Advisers and an independent company, Lipper, Inc. (Lipper). The Trustees also receive an independent written evaluation from the Senior Officer. The Senior Officer’s evaluation is prepared as part of his responsibility to manage the process by which the Invesco Funds’ proposed management fees are negotiated during the annual contract renewal process to ensure they are negotiated in a manner that is at arms’ length and reasonable. The independent Trustees are assisted in their annual evaluation of the Fund’s investment advisory agreement by the Senior Officer and by independent legal counsel. The independent Trustees also discuss the continuance of the investment advisory agreement and sub-advisory contracts in private sessions with the Senior Officer and counsel.
In evaluating the fairness and reasonableness of the Fund’s investment advisory agreement and sub-advisory contracts, the Board considered, among other things, the factors discussed below. The Trustees also considered information provided in connection with fund acquisitions approved by the Trustees to rationalize the Invesco Funds product range following the acquisition of the retail mutual fund business of Morgan Stanley (the Morgan Stanley Transaction). The Trustees recognized that the advisory fees for the Invesco Funds include advisory fees that are the result of years of review and negotiation between the Trustees and Invesco Advisers as well as advisory fees inherited from Morgan Stanley and Van Kampen funds acquired in the Morgan Stanley Transaction. The Trustees’ deliberations and conclusions in a particular year may be based in part on their deliberations and conclusions regarding these same arrangements throughout the year and in prior years. One Trustee may have weighed a particular piece of information differently than another Trustee.
The discussion below serves as the Senior Officer’s independent written evaluation with respect to the Fund’s investment advisory agreement as well as a discussion of the material factors and related conclusions that formed the basis for the Board’s approval of the Fund’s investment advisory agreement and sub-advisory contracts. Unless otherwise stated, this information is current as of June 15, 2011, and may not reflect consideration of factors that became known to the Board after that date, including, for example, changes to the Fund’s performance, advisory fees, expense limitations and/or fee waivers.
Factors and Conclusions and Summary of Independent Written Fee Evaluation
| |
| A. | Nature, Extent and Quality of Services Provided by Invesco Advisers and the Affiliated Sub-Advisers |
The Board reviewed the advisory services to be provided to the Fund by Invesco Advisers under the Fund’s investment advisory agreement and the credentials and experience of the officers and employees of Invesco Advisers who provide these services. The Board’s review of the qualifications of Invesco Advisers to provide these services included the Board’s consideration of Invesco Advisers’ portfolio and product review process, various back office support functions provided by Invesco Advisers and its affiliates, and Invesco Adviser’s global trading operations. In determining whether to approve the Fund’s investment advisory agreement, the Board considered the prior relationship between Invesco Advisers and the Invesco Funds, as well as the Board’s knowledge of Invesco Advisers’ operations. The Board concluded that the nature, extent and quality of the advisory services to be provided to the Fund by Invesco Advisers are appropriate.
The Board reviewed the services to be provided by the Affiliated Sub-Advisers under the sub-advisory contracts and the credentials and experience of the officers and employees of the Affiliated Sub-Advisers who provide these services. The Board noted that the Affiliated Sub-Advisers have offices and personnel that are located in financial centers around the world. As a result, the Affiliated Sub-Advisers can provide research and investment analysis on the markets and economies of various countries in which Invesco Funds invest and make recommendations on securities of companies located in such countries. The Board concluded that the sub-advisory contracts will benefit the Fund and its shareholders by permitting Invesco Advisers to use the resources and talents of the Affiliated Sub-Advisers in managing the Fund. The Board concluded that the nature, extent and quality of the services to be provided by the Affiliated Sub-Advisers are appropriate.
In determining whether to approve the Fund’s investment advisory agreements, the Board considered the prior relationship between Invesco Advisers and the Invesco Funds, as well as the Board’s knowledge of Invesco Advisers’ operations, and concluded that it was beneficial to maintain the relationship for the Fund, in part, because of such knowledge.
25 Invesco Balanced-Risk Commodity Strategy Fund
The Board did not consider Fund performance as a relevant factor in considering whether to approve the investment advisory agreement because the Fund was newly launched in 2010 and has no performance history.
| |
| C. | Advisory and Sub-Advisory Fees and Fee Waivers |
The Board noted that no Lipper material was available for the Fund.
The Board compared the Fund’s effective fee rate (the advisory fee after advisory fee waivers and before expense limitations/waivers) to the advisory fee rates of other mutual funds advised by Invesco Advisers and its affiliates with investment strategies comparable to those of the Fund. The Board noted that the Fund’s rate was below the rate of one mutual fund with comparable investment strategies.
The Board also considered the fees charged by Invesco Advisers and the Affiliated Sub-Advisers to other client accounts with investment strategies comparable to those of the Fund. The Board noted that Invesco Advisers or the Affiliated Sub-Advisers may charge lower fees to large institutional clients solely for investment management services. Invesco Advisers reviewed with the Board the significantly greater scope of services it provides to the Invesco Funds relative to other client accounts. These additional services include provision of administrative services, officers and office space, oversight of service providers, preparation of annual registration statement updates and financial information and regulatory compliance under the Investment Company Act of 1940, as amended. Invesco Advisers also reviewed generally the higher frequency of shareholder purchases and redemptions in the Invesco Funds relative to the flow of assets for other client accounts. Invesco Advisers advised the Board that advance notice of redemptions is often provided to Invesco Advisers by institutional clients. The Board did note that sub-advisory fees charged by the Affiliated Sub-Advisers to manage the Invesco Funds and to manage other client accounts were often more comparable. The Board concluded that the aggregate services provided to the Invesco Funds were sufficiently different from those provided to institutional clients, and the Board not place significant weight on these fee comparisons.
The Board noted that Invesco Advisers has contractually agreed to waive fees and/or limit expenses of the Fund through at least February 28, 2012 in an amount necessary to limit total annual operating expenses to a specified percentage of average daily net assets for each class of the Fund. The Board also considered the effect this fee waiver would have on the Fund’s total estimated expenses.
The Board also considered the services provided by the Affiliated Sub-Advisers pursuant to the sub-advisory contracts, as well as the allocation of fees between Invesco Advisers and the Affiliated Sub-Advisers pursuant to the sub-advisory contracts. The Board noted that Invesco Advisers provides services to sub-advised Invesco Funds, including oversight of the Affiliated Sub-Advisers as well as the additional services described above other than day-to-day portfolio management. The Board also noted that the sub-advisory fees have no direct effect on the Fund or its shareholders, as they are paid by Invesco Advisers to the Affiliated Sub-Advisers.
Based upon the information and considerations described above, the Board concluded that the Fund’s advisory and sub-advisory fees are fair and reasonable.
| |
| D. | Economies of Scale and Breakpoints |
The Board considered the extent to which there are economies of scale in the provision of advisory services to the Fund. The Board also considered whether the Fund benefits from economies of scale through contractual breakpoints in the Fund’s advisory fee schedule. The Board also noted that the Fund shares directly in economies of scale through lower fees charged by third party service providers based on the combined size of the Invesco Funds and other clients advised by Invesco Advisers.
| |
| E. | Profitability and Financial Resources |
The Board reviewed information from Invesco Advisers concerning the costs of the advisory and other services that Invesco Advisers and its affiliates provide to the Fund and the profitability of Invesco Advisers and its affiliates in providing these services. The Board reviewed with Invesco Advisers the methodology used to prepare the profitability information. The Board considered the profitability of Invesco Advisers in connection with managing the Fund and the Invesco Funds. The Board noted that Invesco Advisers continues to operate at a net profit from services Invesco Advisers and its subsidiaries provide to the Fund and the Invesco Funds. The Board concluded that the level of profits realized by Invesco Advisers and its affiliates from providing services to the Fund is not excessive given the nature, quality and extent of the services provided to the Invesco Funds. The Board considered whether Invesco Advisers and each Affiliated Sub-Adviser are financially sound and have the resources necessary to perform their obligations under the investment advisory agreement and sub-advisory contracts. The Board concluded that Invesco Advisers and each Affiliated Sub-Adviser have the financial resources necessary to fulfill these obligations.
| |
| F. | Collateral Benefits to Invesco Advisers and its Affiliates |
The Board considered various other benefits received by Invesco Advisers and its affiliates from the relationship with the Fund, including the fees received for their provision of administrative, transfer agency and distribution services to the Fund. The Board considered the performance of Invesco Advisers and its affiliates in providing these services and the organizational structure employed to provide these services. The Board also considered that these services are provided to the Fund pursuant to written contracts that are reviewed and approved on an annual basis by the Board; that the services are required for the operation of the Fund; that Invesco Advisers and its affiliates can provide services, the nature and quality of which are at least equal to those provided by others offering the same or similar services; and that the fees for such services are fair and reasonable in light of the usual and customary charges by others for services of the same nature and quality.
The Board considered the benefits realized by Invesco Advisers and the Affiliated Sub-Advisers as a result of portfolio brokerage transactions executed through “soft dollar” arrangements. Invesco Advisers noted that the Fund does not execute brokerage transactions through “soft dollar” arrangements to any significant degree.
The Board considered that the Fund’s uninvested cash and cash collateral from any securities lending arrangements may be invested in money market funds advised by Invesco Advisers pursuant to procedures approved by the Board. The Board noted that Invesco Advisers receives advisory fees from these affiliated money market funds attributable to such investments, although Invesco Advisers has contractually agreed to waive through varying periods the advisory fees payable by the Invesco Funds. The waiver is in an amount equal to 100% of the net advisory fee Invesco Advisers receives from the affiliated money market funds with respect to the Fund’s investment in the affiliated money market funds of uninvested cash, but not cash collateral. The Board concluded that the Fund’s investment of uninvested cash and cash collateral from any securities lending arrangements in the affiliated money market funds is in the best interests of the Fund and its shareholders.
26 Invesco Balanced-Risk Commodity Strategy Fund
Tax Information
Form 1099-DIV, Form 1042-S and other year-end tax information provide shareholders with actual calendar year amounts that should be included in their tax returns. Shareholders should consult their tax advisors.
The following distribution information is being provided as required by the Internal Revenue Code or to meet a specific state’s requirement.
The Fund designates the following amounts or, if subsequently determined to be different, the maximum amount allowable for its fiscal year ended October 31, 2011:
| | | | | |
Federal and State Income Tax | | |
| |
| U.S. Treasury Obligations* | | | 4.39% | |
| | |
| | * | The above percentage is based on ordinary income dividends paid to shareholders during the Fund’s fiscal year. |
27 Invesco Balanced-Risk Commodity Strategy Fund
Trustees and Officers
The address of each trustee and officer is AIM Investment Funds (Invesco Investment Funds) (the “Trust”), 11 Greenway Plaza, Suite 2500, Houston, Texas 77046-1173. The trustees serve for the life of the Trust, subject to their earlier death, incapacitation, resignation, retirement or removal as more specifically provided in the Trust’s organizational documents. Each officer serves for a one year term or until their successors are elected and qualified. Column two below includes length of time served with predecessor entities, if any.
| | | | | | | | | |
| | | | | | | Number of
| | |
| | | | | | | Funds in
| | |
| | | | | | | Fund Complex
| | |
Name, Year of Birth and
| | Trustee and/
| | Principal Occupation(s)
| | Overseen by
| | Other Directorship(s)
|
| Position(s) Held with the Trust | | or Officer Since | | During Past 5 Years | | Trustee | | Held by Trustee |
| | | | | | | | | |
| | | | | | | | | |
| Interested Persons | | | | | | | | |
| | | | | | | | | |
| | | | | | | | | |
| | | | | | | | | |
Martin L. Flanagan1 — 1960
Trustee | | 2007 | | Executive Director, Chief Executive Officer and President, Invesco Ltd. (ultimate parent of Invesco and a global investment management firm); Advisor to the Board, Invesco Advisers, Inc. (formerly known as Invesco Institutional (N.A.), Inc.); Trustee, The Invesco Funds; Vice Chair, Investment Company Institute; and Member of Executive Board, SMU Cox School of Business
Formerly: Chairman, Invesco Advisers, Inc. (registered investment adviser); Director, Chairman, Chief Executive Officer and President, IVZ Inc. (holding company), INVESCO Group Services, Inc. (service provider) and Invesco North American Holdings, Inc. (holding company); Director, Chief Executive Officer and President, Invesco Holding Company Limited (parent of Invesco and a global investment management firm); Director, Invesco Ltd.; Chairman, Investment Company Institute and President, Co-Chief Executive Officer, Co-President, Chief Operating Officer and Chief Financial Officer, Franklin Resources, Inc. (global investment management organization) | | 141 | | None |
| | | | | | | | | |
| | | | | | | | | |
| | | | | | | | | |
Philip A. Taylor2 — 1954
Trustee, President and
Principal Executive Officer | | 2006 | | Head of North American Retail and Senior Managing Director, Invesco Ltd.; Director, Co-Chairman, Co-President and Co-Chief Executive Officer, Invesco Advisers, Inc. (formerly known as Invesco Institutional (N.A.), Inc.) (registered investment adviser); Director, Chairman, Chief Executive Officer and President, Invesco Management Group, Inc. (formerly Invesco Aim Management Group, Inc.) (financial services holding company); Director and President, INVESCO Funds Group, Inc. (registered investment adviser and registered transfer agent); Director and Chairman, Invesco Investment Services, Inc. (formerly known as Invesco Aim Investment Services, Inc.) (registered transfer agent) and IVZ Distributors, Inc. (formerly known as INVESCO Distributors, Inc.) (registered broker dealer); Director, President and Chairman, Invesco Inc. (holding company) and Invesco Canada Holdings Inc. (holding company); Chief Executive Officer, Invesco Corporate Class Inc. (corporate mutual fund company) and Invesco Canada Fund Inc. (corporate mutual fund company); Director, Chairman and Chief Executive Officer, Invesco Canada Ltd. (formerly known as Invesco Trimark Ltd./Invesco Trimark Ltèe) (registered investment adviser and registered transfer agent); Trustee, President and Principal Executive Officer, The Invesco Funds (other than AIM Treasurer’s Series Trust (Invesco Treasurer’s Series Trust) and Short-Term Investments Trust); Trustee and Executive Vice President, The Invesco Funds (AIM Treasurer’s Series Trust (Invesco Treasurer’s Series Trust) and Short-Term Investments Trust only); Director, Invesco Investment Advisers LLC (formerly known as Van Kampen Asset Management); Director, Chief Executive Officer and President, Van Kampen Exchange Corp.
Formerly: Director and Chairman, Van Kampen Investor Services Inc.: Director, Chief Executive Officer and President, 1371 Preferred Inc. (holding company); and Van Kampen Investments Inc.; Director and President, AIM GP Canada Inc. (general partner for limited partnerships); and Van Kampen Advisors, Inc.; Director and Chief Executive Officer, Invesco Trimark Dealer Inc. (registered broker dealer); Director, Invesco Distributors, Inc. (formerly known as Invesco Aim Distributors, Inc.) (registered broker dealer); Manager, Invesco PowerShares Capital Management LLC; Director, Chief Executive Officer and President, Invesco Advisers, Inc.; Director, Chairman, Chief Executive Officer and President, Invesco Aim Capital Management, Inc.; President, Invesco Trimark Dealer Inc. and Invesco Trimark Ltd./Invesco Trimark Ltèe; Director and President, AIM Trimark Corporate Class Inc. and AIM Trimark Canada Fund Inc.; Senior Managing Director, Invesco Holding Company Limited; Trustee and Executive Vice President, Tax-Free Investments Trust; Director and Chairman, Fund Management Company (former registered broker dealer); President and Principal Executive Officer, The Invesco Funds (AIM Treasurer’s Series Trust (Invesco Treasurer’s Series Trust), Short-Term Investments Trust and Tax-Free Investments Trust only); President, AIM Trimark Global Fund Inc. and AIM Trimark Canada Fund Inc. | | 141 | | None |
| | | | | | | | | |
| | | | | | | | | |
| | | | | | | | | |
Wayne W. Whalen3 — 1939
Trustee | | 2010 | | Of Counsel, and prior to 2010, partner in the law firm of Skadden, Arps, Slate, Meagher & Flom LLP, legal counsel to funds in the Fund Complex | | 159 | | Director of the Abraham Lincoln Presidential Library Foundation |
| | | | | | | | | |
| | | | | | | | | |
| | | | | | | | | |
| Independent Trustees | | | | | | | | |
| | | | | | | | | |
| | | | | | | | | |
| | | | | | | | | |
Bruce L. Crockett — 1944
Trustee and Chair | | 2001 | | Chairman, Crockett Technology Associates (technology consulting company)
Formerly: Director, Captaris (unified messaging provider); Director, President and Chief Executive Officer COMSAT Corporation; and Chairman, Board of Governors of INTELSAT (international communications company) | | 141 | | ACE Limited (insurance company); and Investment Company Institute |
| | | | | | | | | |
| | | | | | | | | |
| | | | | | | | | |
David C. Arch — 1945
Trustee | | 2010 | | Chairman and Chief Executive Officer of Blistex Inc., a consumer health care products manufacturer. | | 159 | | Member of the Heartland Alliance Advisory Board, a nonprofit organization serving human needs based in Chicago. Board member of the Illinois Manufacturers’ Association. Member of the Board of Visitors, Institute for the Humanities, University of Michigan |
| | | | | | | | | |
| |
| 1 | Mr. Flanagan is considered an interested person of the Trust because he is an officer of the adviser to the Trust, and an officer and a director of Invesco Ltd., ultimate parent of the adviser to the Trust. |
| 2 | Mr. Taylor is considered an interested person of the Trust because he is an officer and a director of the adviser to, and a director of the principal underwriter of, the Trust. |
| 3 | Mr. Whalen has been deemed to be an interested person of the Trust because of his prior service as counsel to the predecessor funds of certain Invesco open-end funds and his affiliation with the law firm that served as counsel to such predecessor funds and continues to serve as counsel to the Invesco Van Kampen closed-end funds. |
T-1 Invesco Balanced-Risk Commodity Strategy Fund
Trustees and Officers—(continued)
The address of each trustee and officer is AIM Investment Funds (Invesco Investment Funds) (the “Trust”), 11 Greenway Plaza, Suite 2500, Houston, Texas 77046-1173. The trustees serve for the life of the Trust, subject to their earlier death, incapacitation, resignation, retirement or removal as more specifically provided in the Trust’s organizational documents. Each officer serves for a one year term or until their successors are elected and qualified. Column two below includes length of time served with predecessor entities, if any.
| | | | | | | | | |
| | | | | | | Number of
| | |
| | | | | | | Funds in
| | |
| | | | | | | Fund Complex
| | |
Name, Year of Birth and
| | Trustee and/
| | Principal Occupation(s)
| | Overseen by
| | Other Directorship(s)
|
| Position(s) Held with the Trust | | or Officer Since | | During Past 5 Years | | Trustee | | Held by Trustee |
| | | | | | | | | |
| | | | | | | | | |
| Independent Trustees—(continued) | | | | | | | | |
| | | | | | | | | |
| | | | | | | | | |
| | | | | | | | | |
Bob R. Baker — 1936
Trustee | | 2003 | | Retired
Formerly: President and Chief Executive Officer, AMC Cancer Research Center; and Chairman and Chief Executive Officer, First Columbia Financial Corporation | | 141 | | None |
| | | | | | | | | |
| | | | | | | | | |
| | | | | | | | | |
Frank S. Bayley — 1939
Trustee | | 1987 | | Retired
Formerly: Director, Badgley Funds, Inc. (registered investment company) (2 portfolios) and Partner, law firm of Baker & McKenzie | | 141 | | Director and Chairman, C.D. Stimson Company (a real estate investment company) |
| | | | | | | | | |
| | | | | | | | | |
| | | | | | | | | |
James T. Bunch — 1942
Trustee | | 2003 | | Founder, Green, Manning & Bunch Ltd. (investment banking firm)
Formerly: Executive Committee, United States Golf Association; and Director, Policy Studies, Inc. and Van Gilder Insurance Corporation | | 141 | | Vice Chairman, Board of Governors, Western Golf Association/Evans Scholars Foundation and Director, Denver Film Society |
| | | | | | | | | |
| | | | | | | | | |
| | | | | | | | | |
Rodney F. Dammeyer — 1940
Trustee | | 2010 | | President of CAC, LLC, a private company offering capital investment and management advisory services.
Formerly: Prior to January 2004, Director of TeleTech Holdings Inc.; Prior to 2002, Director of Arris Group, Inc.; Prior to 2001, Managing Partner at Equity Group Corporate Investments. Prior to 1995, Vice Chairman of Anixter International. Prior to 1985, experience includes Senior Vice President and Chief Financial Officer of Household International, Inc, Executive Vice President and Chief Financial Officer of Northwest Industries, Inc. and Partner of Arthur Andersen & Co. | | 159 | | Director of Quidel Corporation and Stericycle, Inc. Prior to May 2008, Trustee of The Scripps Research Institute. Prior to February 2008, Director of Ventana Medical Systems, Inc. Prior to April 2007, Director of GATX Corporation. Prior to April 2004, Director of TheraSense, Inc. |
| | | | | | | | | |
| | | | | | | | | |
| | | | | | | | | |
Albert R. Dowden — 1941
Trustee | | 2001 | | Director of a number of public and private business corporations, including the Boss Group, Ltd. (private investment and management); Reich & Tang Funds (5 portfolios) (registered investment company); and Homeowners of America Holding Corporation/ Homeowners of America Insurance Company (property casualty company)
Formerly: Director, Continental Energy Services, LLC (oil and gas pipeline service); Director, CompuDyne Corporation (provider of product and services to the public security market) and Director, Annuity and Life Re (Holdings), Ltd. (reinsurance company); Director, President and Chief Executive Officer, Volvo Group North America, Inc.; Senior Vice President, AB Volvo; Director of various public and private corporations; Chairman, DHJ Media, Inc.; Director Magellan Insurance Company; and Director, The Hertz Corporation, Genmar Corporation (boat manufacturer), National Media Corporation; Advisory Board of Rotary Power International (designer, manufacturer, and seller of rotary power engines); and Chairman, Cortland Trust, Inc. (registered investment company) | | 141 | | Board of Nature’s Sunshine Products, Inc. |
| | | | | | | | | |
| | | | | | | | | |
| | | | | | | | | |
Jack M. Fields — 1952
Trustee | | 2001 | | Chief Executive Officer, Twenty First Century Group, Inc. (government affairs company); and Owner and Chief Executive Officer, Dos Angelos Ranch, L.P. (cattle, hunting, corporate entertainment), Discovery Global Education Fund (non-profit) and Cross Timbers Quail Research Ranch (non-profit)
Formerly: Chief Executive Officer, Texana Timber LP (sustainable forestry company) and member of the U.S. House of Representatives | | 141 | | Administaff |
| | | | | | | | | |
| | | | | | | | | |
| | | | | | | | | |
Carl Frischling — 1937
Trustee | | 2001 | | Partner, law firm of Kramer Levin Naftalis and Frankel LLP | | 141 | | Director, Reich & Tang Funds (6 portfolios) |
| | | | | | | | | |
| | | | | | | | | |
| | | | | | | | | |
Prema Mathai-Davis — 1950
Trustee | | 2001 | | Retired
Formerly: Chief Executive Officer, YWCA of the U.S.A. | | 141 | | None |
| | | | | | | | | |
| | | | | | | | | |
| | | | | | | | | |
Larry Soll — 1942
Trustee | | 2003 | | Retired
Formerly, Chairman, Chief Executive Officer and President, Synergen Corp. (a biotechnology company) | | 141 | | None |
| | | | | | | | | |
| | | | | | | | | |
| | | | | | | | | |
Hugo F. Sonnenschein — 1940
Trustee | | 2010 | | President Emeritus and Honorary Trustee of the University of Chicago and the Adam Smith Distinguished Service Professor in the Department of Economics at the University of Chicago. Prior to July 2000, President of the University of Chicago. | | 159 | | Trustee of the University of Rochester and a member of its investment committee. Member of the National Academy of Sciences, the American Philosophical Society and a fellow of the American Academy of Arts and Sciences |
| | | | | | | | | |
| | | | | | | | | |
| | | | | | | | | |
Raymond Stickel, Jr. — 1944
Trustee | | 2005 | | Retired
Formerly: Director, Mainstay VP Series Funds, Inc. (25 portfolios) and Partner, Deloitte & Touche | | 141 | | Director of Long Cove Club Owners’ Association (home owner’s association) |
| | | | | | | | | |
T-2 Invesco Balanced-Risk Commodity Strategy Fund
Trustees and Officers—(continued)
The address of each trustee and officer is AIM Investment Funds (Invesco Investment Funds) (the “Trust”), 11 Greenway Plaza, Suite 2500, Houston, Texas 77046-1173. The trustees serve for the life of the Trust, subject to their earlier death, incapacitation, resignation, retirement or removal as more specifically provided in the Trust’s organizational documents. Each officer serves for a one year term or until their successors are elected and qualified. Column two below includes length of time served with predecessor entities, if any.
| | | | | | | | | |
| | | | | | | Number of
| | |
| | | | | | | Funds in
| | |
| | | | | | | Fund Complex
| | |
Name, Year of Birth and
| | Trustee and/
| | Principal Occupation(s)
| | Overseen by
| | Other Directorship(s)
|
| Position(s) Held with the Trust | | or Officer Since | | During Past 5 Years | | Trustee | | Held by Trustee |
| | | | | | | | | |
| | | | | | | | | |
| Other Officers | | | | | | | | |
| | | | | | | | | |
| | | | | | | | | |
| | | | | | | | | |
Russell C. Burk — 1958
Senior Vice President and Senior Officer | | 2005 | | Senior Vice President and Senior Officer of Invesco Funds | | N/A | | N/A |
| | | | | | | | | |
| | | | | | | | | |
| | | | | | | | | |
John M. Zerr — 1962
Senior Vice President, Chief Legal Officer and Secretary | | 2006 | | Director, Senior Vice President, Secretary and General Counsel, Invesco Management Group, Inc. (formerly known as Invesco Aim Management Group, Inc.) and Van Kampen Exchange Corp.; Senior Vice President, Invesco Advisers, Inc. (formerly known as Invesco Institutional (N.A.), Inc.) (registered investment adviser); Senior Vice President and Secretary, Invesco Distributors, Inc. (formerly known as Invesco Aim Distributors, Inc.); Director, Vice President and Secretary, Invesco Investment Services, Inc. (formerly known as Invesco Aim Investment Services, Inc.) and IVZ Distributors, Inc. (formerly known as INVESCO Distributors, Inc.); Director and Vice President, INVESCO Funds Group, Inc.; Senior Vice President, Chief Legal Officer and Secretary, The Invesco Funds; Manager, Invesco PowerShares Capital Management LLC; Director, Secretary and General Counsel, Invesco Investment Advisers LLC (formerly known as Van Kampen Asset Management); Secretary and General Counsel, Van Kampen Funds Inc. and Chief Legal Officer, PowerShares Exchange-Traded Fund Trust, PowerShares Exchange-Traded Fund Trust II, PowerShares India Exchange-Traded Fund Trust and PowerShares Actively Managed Exchange-Traded Fund Trust
Formerly: Director and Secretary, Van Kampen Advisors Inc.; Director Vice President, Secretary and General Counsel Van Kampen Investor Services Inc.; Director, Invesco Distributors, Inc. (formerly known as Invesco Aim Distributors, Inc.); Director, Senior Vice President, General Counsel and Secretary, Invesco Advisers, Inc.; and Van Kampen Investments Inc.; Director, Vice President and Secretary, Fund Management Company; Director, Senior Vice President, Secretary, General Counsel and Vice President, Invesco Aim Capital Management, Inc.; Chief Operating Officer and General Counsel, Liberty Ridge Capital, Inc. (an investment adviser); Vice President and Secretary, PBHG Funds (an investment company) and PBHG Insurance Series Fund (an investment company); Chief Operating Officer, General Counsel and Secretary, Old Mutual Investment Partners (a broker-dealer); General Counsel and Secretary, Old Mutual Fund Services (an administrator) and Old Mutual Shareholder Services (a shareholder servicing center); Executive Vice President, General Counsel and Secretary, Old Mutual Capital, Inc. (an investment adviser); and Vice President and Secretary, Old Mutual Advisors Funds (an investment company) | | N/A | | N/A |
| | | | | | | | | |
| | | | | | | | | |
| | | | | | | | | |
Lisa O. Brinkley — 1959
Vice President | | 2004 | | Global Compliance Director, Invesco Ltd.; Chief Compliance Officer, Invesco Investment Services, Inc.(formerly known as Invesco Aim Investment Services, Inc.); and Vice President, The Invesco Funds
Formerly: Chief Compliance Officer, Invesco Distributors, Inc. (formerly known as Invesco Aim Distributors, Inc.) and Van Kampen Investor Services Inc.; Senior Vice President, Invesco Management Group, Inc.; Senior Vice President and Chief Compliance Officer, Invesco Advisers, Inc. and The Invesco Funds; Vice President and Chief Compliance Officer, Invesco Aim Capital Management, Inc. and Invesco Distributors, Inc.; Vice President, Invesco Investment Services, Inc. and Fund Management Company | | N/A | | N/A |
| | | | | | | | | |
| | | | | | | | | |
| | | | | | | | | |
Sheri Morris — 1964
Vice President, Treasurer and Principal Financial Officer | | 1999 | | Vice President, Treasurer and Principal Financial Officer, The Invesco Funds; and Vice President, Invesco Advisers, Inc. (formerly known as Invesco Institutional (N.A.), Inc.) (registered investment adviser).
Formerly: Treasurer, PowerShares Exchange-Traded Fund Trust, PowerShares Exchange--Traded Fund Trust II, PowerShares India Exchange-Traded Fund Trust and PowerShares Actively Managed Exchange-Traded Fund Trust; Vice President, Invesco Advisers, Inc., Invesco Aim Capital Management, Inc. and Invesco Aim Private Asset Management, Inc.; Assistant Vice President and Assistant Treasurer, The Invesco Funds and Assistant Vice President, Invesco Advisers, Inc., Invesco Aim Capital Management, Inc. and Invesco Aim Private Asset Management, Inc. | | N/A | | N/A |
| | | | | | | | | |
| | | | | | | | | |
| | | | | | | | | |
Karen Dunn Kelley — 1960
Vice President | | 2004 | | Head of Invesco’s World Wide Fixed Income and Cash Management Group; Senior Vice President, Invesco Advisers, Inc. (formerly known as Invesco Institutional (N.A.), Inc.) (registered investment adviser); Executive Vice President, Invesco Distributors, Inc. (formerly known as Invesco Aim Distributors, Inc.); Senior Vice President, Invesco Management Group, Inc. (formerly known as Invesco Aim Management Group, Inc.); and Director, Invesco Mortgage Capital Inc.; Vice President, The Invesco Funds (other than AIM Treasurer’s Series Trust (Invesco Treasurer’s Series Trust) and Short-Term Investments Trust); President and Principal Executive Officer, The Invesco Funds (AIM Treasurer’s Series Trust (Invesco Treasurer’s Series Trust) and Short-Term Investments Trust only).
Formerly: Senior Vice President, Van Kampen Investments Inc.; Vice President, Invesco Advisers, Inc. (formerly known as Invesco Institutional (N.A.), Inc.); Director of Cash Management and Senior Vice President, Invesco Advisers, Inc. and Invesco Aim Capital Management, Inc.; President and Principal Executive Officer, Tax-Free Investments Trust; Director and President, Fund Management Company; Chief Cash Management Officer, Director of Cash Management, Senior Vice President, and Managing Director, Invesco Aim Capital Management, Inc.; Director of Cash Management, Senior Vice President, and Vice President, Invesco Advisers, Inc. and The Invesco Funds (AIM Treasurer’s Series Trust (Invesco Treasurer’s Series Trust), Short-Term Investments Trust and Tax-Free Investments Trust only) | | N/A | | N/A |
| | | | | | | | | |
T-3 Invesco Balanced-Risk Commodity Strategy Fund
Trustees and Officers—(continued)
The address of each trustee and officer is AIM Investment Funds (Invesco Investment Funds) (the “Trust”), 11 Greenway Plaza, Suite 2500, Houston, Texas 77046-1173. The trustees serve for the life of the Trust, subject to their earlier death, incapacitation, resignation, retirement or removal as more specifically provided in the Trust’s organizational documents. Each officer serves for a one year term or until their successors are elected and qualified. Column two below includes length of time served with predecessor entities, if any.
| | | | | | | | | |
| | | | | | | Number of
| | |
| | | | | | | Funds in
| | |
| | | | | | | Fund Complex
| | |
Name, Year of Birth and
| | Trustee and/
| | Principal Occupation(s)
| | Overseen by
| | Other Directorship(s)
|
| Position(s) Held with the Trust | | or Officer Since | | During Past 5 Years | | Trustee | | Held by Trustee |
| | | | | | | | | |
| | | | | | | | | |
| Other Officers—(continued) | | | | | | | | |
| | | | | | | | | |
| | | | | | | | | |
| | | | | | | | | |
Lance A. Rejsek — 1967
Anti-Money Laundering Compliance Officer | | 2005 | | Anti-Money Laundering Compliance Officer, Invesco Advisers, Inc. (formerly known as Invesco Institutional (N.A.), Inc.) (registered investment adviser); Invesco Distributors, Inc. (formerly known as Invesco Aim Distributors, Inc.), Invesco Investment Services, Inc. (formerly known as Invesco Aim Investment Services, Inc.), The Invesco Funds, PowerShares Exchange-Traded Fund Trust, PowerShares Exchange-Traded Fund Trust II, PowerShares India Exchange-Traded Fund Trust, PowerShares Actively Managed Exchange-Traded Fund Trust, Invesco Investment Advisers LLC (formerly known as Van Kampen Asset Management) and Van Kampen Funds Inc.
Formerly: Anti-Money Laundering Compliance Officer, Van Kampen Investor Services Inc., Fund Management Company, Invesco Advisers, Inc., Invesco Aim Capital Management, Inc. and Invesco Aim Private Asset Management, Inc. | | N/A | | N/A |
| | | | | | | | | |
| | | | | | | | | |
| | | | | | | | | |
Todd L. Spillane — 1958
Chief Compliance Officer | | 2006 | | Senior Vice President, Invesco Management Group, Inc. (formerly known as Invesco Aim Management Group, Inc.) and Van Kampen Exchange Corp.; Senior Vice President and Chief Compliance Officer, Invesco Advisers, Inc. (registered investment adviser) (formerly known as Invesco Institutional (N.A.), Inc.); Chief Compliance Officer, The Invesco Funds, PowerShares Exchange-Traded Fund Trust, PowerShares Exchange-Traded Fund Trust II, PowerShares India Exchange-Traded Fund Trust, PowerShares Actively Managed Exchange-Traded Fund Trust, INVESCO Private Capital Investments, Inc. (holding company) and Invesco Private Capital, Inc. (registered investment adviser); Vice President, Invesco Distributors, Inc. (formerly known as Invesco Aim Distributors, Inc.) and Invesco Investment Services, Inc. (formerly known as Invesco Aim Investment Services, Inc.).
Formerly: Chief Compliance Officer, Invesco Van Kampen Closed-End Funds; Senior Vice President, Van Kampen Investments Inc.; Senior Vice President and Chief Compliance Officer, Invesco Advisers, Inc. and Invesco Aim Capital Management, Inc.; Chief Compliance Officer, Invesco Global Asset Management (N.A.), Inc., Invesco Senior Secured Management, Inc. (registered investment adviser) and Van Kampen Investor Services Inc.; Vice President, Invesco Aim Capital Management, Inc. and Fund Management Company | | N/A | | N/A |
| | | | | | | | | |
The Statement of Additional Information of the Trust includes additional information about the Fund’s Trustees and is available upon request, without charge, by calling 1.800.959.4246. Please refer to the Fund’s prospectus for information on the Fund’s sub-advisers.
| | | | | | | |
Office of the Fund
11 Greenway Plaza, Suite 2500
Houston, TX 77046-1173 | | Investment Adviser
Invesco Advisers, Inc.
1555 Peachtree Street, N.E.
Atlanta, GA 30309 | | Distributor
Invesco Distributors, Inc.
11 Greenway Plaza, Suite 2500
Houston, TX 77046-1173 | | Auditors
PricewaterhouseCoopers LLP
1201 Louisiana Street, Suite 2900
Houston, TX 77002-5678 |
| | | | | | | |
| | | | | | | |
Counsel to the Fund
Stradley Ronon Stevens & Young, LLP
2600 One Commerce Square
Philadelphia, PA 19103 | | Counsel to the Independent Trustees
Kramer, Levin, Naftalis & Frankel LLP
1177 Avenue of the Americas
New York, NY 10036-2714 | | Transfer Agent
Invesco Investment Services, Inc.
11 Greenway Plaza, Suite 2500
Houston, TX 77046-1173 | | Custodian
State Street Bank and Trust Company
225 Franklin
Boston, MA 02110-2801 |
T-4 Invesco Balanced-Risk Commodity Strategy Fund
Invesco mailing information
Send general correspondence to Invesco Investment Services, Inc., P.O. Box 219078, Kansas City, MO 64121-9078.
Invesco privacy policy
You share personal and financial information with us that is necessary for your transactions and your account records. We take very seriously the obligation to keep that information confidential and private.
Invesco collects nonpublic personal information about you from account applications or other forms you complete and from your transactions with us or our affiliates. We do not disclose information about you or our former customers to service providers or other third parties except to the extent necessary to service your account and in other limited circumstances as permitted by law. For example, we use this information to facilitate the delivery of transaction confirmations, financial reports, prospectuses and tax forms.
Even within Invesco, only people involved in the servicing of your accounts and compliance monitoring have access to your information. To ensure the highest level of confidentiality and security, Invesco maintains physical, electronic and procedural safeguards that meet or exceed federal standards. Special measures, such as data encryption and authentication, apply to your communications with us on our website. More detail is available to you at invesco.com/privacy.
Important notice regarding delivery of security holder documents
To reduce Fund expenses, only one copy of most shareholder documents may be mailed to shareholders with multiple accounts at the same address (Householding). Mailing of your shareholder documents may be householded indefinitely unless you instruct us otherwise. If you do not want the mailing of these documents to be combined with those for other members of your household, please contact Invesco Investment Services, Inc. at 800 959 4246 or contact your financial institution. We will begin sending you individual copies for each account within 30 days after receiving your request.
Fund holdings and proxy voting information
The Fund provides a complete list of its holdings four times in each fiscal year, at the quarter-ends. For the second and fourth quarters, the lists appear in the Fund’s semiannual and annual reports to shareholders. For the first and third quarters, the Fund files the lists with the Securities and Exchange Commission (SEC) on Form N-Q. The most recent list of portfolio holdings is available at invesco.com/completeqtrholdings. Shareholders can also look up the Fund’s Forms N-Q on the SEC website at sec.gov. Copies of the Fund’s Forms N-Q may be reviewed and copied at the SEC Public Reference Room in Washington, D.C. You can obtain information on the operation of the Public Reference Room, including information about duplicating fee charges, by calling 202 551 8090 or 800 732 0330, or by electronic request at the following email address: publicinfo@sec.gov. The SEC file numbers for the Fund are 811-05426 and 033-19338.
A description of the policies and procedures that the Fund uses to determine how to vote proxies relating to portfolio securities is available without charge, upon request, from our Client Services department at 800 959 4246 or at invesco.com/proxyguidelines. The information is also available on the SEC website, sec.gov.
Information regarding how the Fund voted proxies related to its portfolio securities during the 12 months ended June 30, 2011, is available at invesco.com/proxysearch. The information is also available on the SEC website, sec.gov.
Invesco Advisers, Inc. is an investment adviser; it provides investment advisory services to individual and institutional clients and does not sell securities. Invesco Distributors, Inc. is the U.S. distributor for Invesco Ltd.’s retail mutual funds, exchange-traded funds and institutional money market funds. Both are wholly owned, indirect subsidiaries of Invesco Ltd.
BRCS-AR-1 Invesco Distributors, Inc.
| | |
| Annual Report to Shareholders | | October 31, 2011 |
Invesco China Fund
Nasdaq:
A: AACFX § B: ABCFX § C: CACFX § Y: AMCYX § Institutional: IACFX
| | |
|
| 2 | | Letters to Shareholders |
| 4 | | Performance Summary |
| 4 | | Management Discussion |
| 6 | | Long-Term Fund Performance |
| 8 | | Supplemental Information |
| 9 | | Schedule of Investments |
| 11 | | Financial Statements |
| 13 | | Notes to Financial Statements |
| 20 | | Financial Highlights |
| 21 | | Auditor’s Report |
| 22 | | Fund Expenses |
| 23 | | Approval of Investment Advisory and Sub-Advisory Agreements |
| 25 | | Tax Information |
| T-1 | | Trustees and Officers |
Letters to Shareholders

Philip Taylor
Dear Shareholders:
Enclosed is important information about your Fund and its performance. I encourage you to read this report to learn more about your Fund’s short- and long-term performance and its holdings as of the close of the reporting period. This report also includes useful information about your Fund’s management team and a discussion of how your Fund was managed during the reporting period.
Investors are likely to confront both opportunities and challenges in 2012 – just as we did in 2011. After all, changes in market sentiment never do investors the courtesy of announcing their impending arrival, and your goals and needs may have changed, requiring changes in your financial strategy.
That’s why the start of a new year is always a good time to catch up with your financial adviser. He or she can explain how your investments performed in the year just ended – how each performed individually, and more important, how they performed as a diversified portfolio. Of course, it’s important to remember that an investment’s long-term performance is more important than its short-term performance. Looking ahead to the new year and evaluating your individual situation, your financial adviser can provide valuable insight into whether your investments are still appropriate for your individual needs, goals and risk tolerance.
For current information about your Fund
In addition to meeting with your financial adviser to discuss your individual situation at the start of the new year, you also may find it helpful to stay abreast of market trends and developments. Doing so may provide reassurance in times of economic uncertainty and market volatility such as we saw in 2011 – and are likely to see again in 2012.
Invesco can help you stay informed about your investments and market trends. On our website, invesco.com/us, we provide timely market updates and commentary from many of our fund managers and other investment professionals. Also on our website, you can obtain information about your account at any hour of the day or night. I invite you to visit and explore the tools and information we offer at invesco.com/us.
Our commitment to investment excellence
As we’ve seen over the last several years, market conditions can change – often suddenly and dramatically. That’s one reason financial advisers typically advise their clients to be well diversified and to maintain a long-term investment focus. While diversification can’t guarantee a profit or protect against loss, it may cushion the impact of dramatic market moves. Maintaining a long-term investment focus for your long-term goals – financing your retirement or your children’s education, for example – may help you avoid making rash investment decisions based on short-term market swings.
Likewise, Invesco’s investment professionals maintain a long-term focus. Across our broad array of investment products, investment excellence is our ultimate goal. Each of our funds is managed by specialized teams of investment professionals, and as a company, we maintain a single focus – investment management – that allows our fund managers to concentrate on doing what they do best: managing your money.
Our funds are managed strictly according to their stated investment objectives and strategies, with robust risk oversight using consistent, repeatable investment processes that don’t change in response to short-term market events. This disciplined approach can’t guarantee a profit; no investment can do that, since all involve some measure of risk. But it can ensure that your money is managed the way we said it would be – according to your Fund’s objective and strategies.
Our adherence to stated investment objectives and strategies allows your financial adviser to build a diversified portfolio that meets your individual risk tolerance and financial goals. It also means that when your goals change, your financial adviser will be able to find an Invesco fund that’s appropriate for your needs.
Questions?
If you have questions about your account, please contact one of our client service representatives at 800 959 4246. If you have a general Invesco-related question or comment for me, I invite you to email me directly at phil@invesco.com.
All of us at Invesco look forward to serving your investment management needs for many years to come. Thank you for investing with us.
Sincerely,
Philip Taylor
Senior Managing Director, Invesco Ltd.
2 Invesco China Fund

Bruce Crockett
Dear Fellow Shareholders:
Although the world’s economies are gradually recovering from the financial crisis, it has not been a smooth path. Unrest in the Middle East, persistently weak job and housing markets in the U.S. and continued government balance sheet repair in Europe are contributing to a slow, labored march toward global recovery.
In this environment, investors face risks that could make it more difficult to achieve their long-term financial goals – a secure retirement, home ownership, a child’s college education. Although the markets are complex and dynamic, there are ways to simplify the process and potentially increase your odds of achieving your goals. The best approach is to create a solid financial plan that helps you save and invest in ways that anticipate your needs over the long term.
Your financial adviser can help you define your financial plan, develop an appropriate investment strategy and put you in a better position to achieve your financial goals over the long term. This can take some of the guesswork out of the process and help you make thoughtful investments. Your financial adviser also can help you better understand your tolerance for risk, so that your investment approach lets you sleep at night while getting you closer to your goals. Lastly, your financial adviser can develop an asset allocation strategy that seeks to balance your investment approach, providing some protection against a decline in the markets while allowing you to participate in rising markets. Invesco calls this type of approach “intentional investing.” It means thinking carefully, planning thoughtfully and acting deliberately.
While no investment can guarantee favorable returns, your Board remains committed to managing costs and enhancing the performance of Invesco’s funds as part of our Investor First orientation. We continue to oversee the funds with the same strong sense of responsibility for your money and your continued trust that we’ve always maintained.
Thanks to the approval of our fund shareholders, Invesco has made great progress in realigning our U.S. mutual fund product line following our acquisition of Morgan Stanley’s retail asset management business, including Van Kampen Investments. When completed, the realignment will reduce overlap in the product lineup, enhance efficiency across our product line and build a solid foundation for further growth to meet client and shareholder needs. I would like to thank those of you who voted your proxy, and I hope our shareholders haven’t been too inconvenienced by the process.
As always, please contact me at bruce@brucecrockett.com with any questions or concerns you may have. On behalf of your Board, we look forward to continuing to represent your interests and serving your needs.
Sincerely,
Bruce L. Crockett
Independent Chair
Invesco Funds Board of Trustees
3 Invesco China Fund
Management’s Discussion of Fund Performance
Performance summary
For the fiscal year ended October 31, 2011, Invesco China Fund underperformed its style-specific benchmark, the MSCI China 10/40 Index. The Fund’s under-performance was primarily due to negative stock selection in the energy sector. Alternatively, holdings in the consumer discretionary sector helped the Fund’s performance compared with that of the benchmark. On an absolute basis, the financials sector was the largest detractor from Fund performance, while the telecommunication services sector was the only positive contributor.
Your Fund’s long-term performance appears later in this report.
Fund vs. Indexes
Total returns, 10/31/10 to 10/31/11, at net asset value (NAV). Performance shown does not include applicable contingent deferred sales charges (CDSC) or front-end sales charges, which would have reduced performance.
| | | | | |
|
| Class A Shares | | | -19.96 | % |
| |
| Class B Shares | | | -20.56 | |
| |
| Class C Shares | | | -20.54 | |
| |
| Class Y Shares | | | -19.74 | |
| |
| Institutional Class Shares | | | -19.58 | |
| |
MSCI EAFE Index▼ (Broad Market Index) | | | -4.08 | |
| |
MSCI China 10/40 Index▀ (Style-Specific Index) | | | -15.53 | |
| |
Lipper China Region Funds Index▼ (Peer Group Index) | | | -20.65 | |
| |
| | |
| Source(s): ▼Lipper Inc.; ▀Invesco, Bloomberg L.P. |
How we invest
We believe there are areas of inefficiency in the Chinese equity market that we can systematically take advantage of by strictly adhering to a disciplined investment process.
Our investment process combines a disciplined bottom-up and top-down multifactor analysis. However, we primarily focus on bottom-up stock selection, where we believe we can add the most value. Indexes are listed for reference only. The Fund is not managed – nor is the portfolio constructed – to mimic any index.
To capitalize on secular growth in China, we have a broad-based investment universe, including all listed companies in China, companies incorporated in mainland China that are listed on the Hong Kong Stock Exchange, firms
incorporated in Hong Kong whose main businesses are in China, and other China-related corporations listed in or outside Hong Kong. We research within this universe to identify stocks with the following characteristics:
| n | | Growth stocks selling at a reasonable price |
| |
| n | | Quality stocks we believe to be undervalued that will potentially benefit from a pickup in the earnings cycle In particular, we evaluate three main criteria when we perform stock research: |
| |
| n | | Management/franchise value – management and ownership, earnings quality, balance sheet quality, product quality |
| |
| n | | Earnings growth – earnings per share growth, earnings momentum, growth in market share, origin of growth |
| |
| n | | Valuation – relative and absolute measures |
We consider selling a Fund holding if:
| n | | We believe the stock is trading significantly above its fair value. |
| |
| n | | We believe a stock has negative earnings momentum or has had sequential earnings downgrades, unless its valuation is already very low or distressed. |
| |
| n | | We see a permanent, fundamental deterioration in a company’s business prospects. |
| |
| n | | We identify a more attractive opportunity elsewhere. |
Market conditions and your Fund
The fiscal year began with the Chinese equity market on an upward trend through the first quarter of 2011, but thereafter, volatility drastically increased due to investor concerns about the intensified sovereign debt crisis in the eurozone and weak growth prospects in the developed economies. With most major economies facing downward gross domestic product (GDP) revisions coupled with renewed fears of double-dip recession, we continued to forecast China’s GDP growth to be 9.2% for 2011 and 8.7% for 2012, and maintained our stance that a hard landing scenario was remote.
With our understanding that China’s top priority is to stabilize prices, we did not believe the Chinese government would make drastic policy changes. Instead, we believed it would maintain a high level of flexibility and the ability to fine-tune its policy to ensure stable and healthy economic growth. We acknowledged that the Chinese government has the capacity to introduce a new round of fiscal expansion if needed, though if this occurs, we don’t anticipate the scale to be as large as the renminbi (RMB) 4 trillion infrastructure plan announced in 2008.
Portfolio Composition
By sector
| | | | | |
|
| Financials | | | 20.1 | % |
| |
| Energy | | | 19.5 | |
| |
| Materials | | | 13.0 | |
| |
| Consumer Discretionary | | | 12.7 | |
| |
| Consumer Staples | | | 12.4 | |
| |
| Information Technology | | | 9.0 | |
| |
| Telecommunication Services | | | 7.7 | |
| |
| Industrials | | | 3.7 | |
| |
| Health Care | | | 1.2 | |
| |
| Utilities | | | 0.6 | |
| |
Money Market Funds | | | | |
Plus Other Assets Less Liabilities | | | 0.1 | |
Top 10 Equity Holdings*
| | | | | | | | | |
|
| | 1. | | | Tencent Holdings Ltd. | | | 5.0 | % |
| |
| | 2. | | | CNOOC Ltd. | | | 4.9 | |
| |
| | 3. | | | Industrial & Commercial | | | | |
| | | | | Bank of China Ltd.-Class H | | | 4.4 | |
| |
| | 4. | | | China Construction Bank Corp.-Class H | | | 4.3 | |
| |
| | 5. | | | PetroChina Co. Ltd.-Class H | | | 3.8 | |
| |
| | 6. | | | Silver Base Group Holdings Ltd. | | | 3.7 | |
| |
| | 7. | | | China Shenhua Energy Co. Ltd.-Class H | | | 3.6 | |
| |
| | 8. | | | Anhui Conch Cement Co. Ltd.-Class H | | | 3.5 | |
| |
| | 9. | | | China Petroleum and Chemical Corp. | | | | |
| | | | | (Sinopec)-Class H | | | 3.4 | |
| |
| | 10. | | | Bank of China Ltd.-Class H | | | 3.0 | |
Top Five Industries*
| | | | | | | | | |
|
| | 1. | | | Diversified Banks | | | 12.6 | % |
| |
| | 2. | | | Construction Materials | | | 8.5 | |
| |
| | 3. | | | Integrated Oil & Gas | | | 7.3 | |
| |
| | 4. | | | Coal & Consumable Fuels | | | 6.2 | |
| |
| | 5. | | | Oil & Gas Exploration & Production | | | 6.0 | |
| | | | |
|
| Total Net Assets | | $155.8 million | |
| | | | | |
| Total Number of Holdings* | | | 68 | |
The Fund’s holdings are subject to change, and there is no assurance that the Fund will continue to hold any particular security.
*Excluding money market fund holdings.
4 Invesco China Fund
China and most emerging markets posted double-digit losses during the fiscal year. The Fund also posted a loss with all but one sector in negative territory. On an absolute basis, our holdings in the financials sector detracted the most from Fund performance, while the telecommunication services sector was the only positive contributor. The Fund underperformed its style-specific benchmark, the MSCI China 10/40 Index, mainly because of poor stock selection in the energy sector. Alternatively, positive stock selection in the consumer discretionary sector benefited Fund performance relative to the benchmark.
In terms of stocks, consumer discretionary holding Silver Base Group was the largest contributor to Fund performance during the fiscal year. Silver Base Group is a leading distributor of alcoholic beverages in the People’s Republic of China and international markets. Telecommunication services holding China Unicom Hong Kong was also among the top contributors to performance during the reporting period. The company is the second largest fixed-line and mobile carrier in China.
The financials sector was the largest detractor from Fund returns during the fiscal year as fears of a global economic slowdown and European sovereign debt uncertainties weighed on our holdings in the sector. Financial companies China Life Insurance, Bank of China, Poly Hong Kong Investments and Industrial & Commercial Bank of China were all among the largest detractors from Fund performance. Energy holding Yanzhou Coal Mining, the sixth largest coal miner in China, was also among the largest detractors.
Amid the market environment during the reporting period, we focused our strategy on companies we believe are of higher quality. Stock selection continued to be the key. We took advantage of the recent downturn and accumulated more positions in companies with strong balance sheets and cheap valuations in the consumer staples sector. We also adopted a more defensive stance by increasing our exposure to the telecommunication services sector.
Given that emerging markets like China experienced extreme volatility during the fiscal year, we’d like to caution investors against making investment decisions based on the short term. As always, we recommend that you consult a financial adviser to discuss your individual financial program.
We remain committed to our investment discipline and maintain our positive stance on the Chinese economy and stock market over the long term. We thank you for your participation in Invesco China Fund.
The views and opinions expressed in management’s discussion of Fund performance are those of Invesco Advisers, Inc. These views and opinions are subject to change at any time based on factors such as market and economic conditions. These views and opinions may not be relied upon as investment advice or recommendations, or as an offer for a particular security. The information is not a complete analysis of every aspect of any market, country, industry, security or the Fund. Statements of fact are from sources considered reliable, but Invesco Advisers, Inc. makes no representation or warranty as to their completeness or accuracy. Although historical performance is no guarantee of future results, these insights may help you understand our investment management philosophy.
See important Fund and, if applicable, index disclosures later in this report.
Samantha Ho
Chartered Financial Analyst, portfolio manager, is manager of Invesco China Fund. She joined Invesco in 2004. Ms. Ho earned a B.B.A. from Bryn Mawr College and an M.B.A. from the UCLA Graduate School of Management.
May Lo
Portfolio manager, is manager of Invesco China Fund. She joined Invesco in 2005. Ms. Lo earned a B.S. from Cornell University and an M.B.A. from the Sloan School of Business at the Massachusetts Institute of Technology.
5 Invesco China Fund
Your Fund’s Long-Term Performance
Results of a $10,000 Investment – Oldest Share Classes since Inception
Fund and index data from 3/31/06
Past performance cannot guarantee comparable future results.
The data shown in the chart include reinvested distributions, applicable sales charges and Fund expenses including management fees. Results for Class B shares are calculated as if a hypothetical shareholder had liquidated his entire investment in the Fund at the close of the reporting period and paid the contingent deferred sales charges, if applicable. Index results include reinvested dividends, but they do not reflect sales
charges. Performance of the peer group, if applicable, reflects fund expenses and management fees; performance of a market index does not. Performance shown in the chart and table(s) does not reflect deduction of taxes a shareholder would pay on Fund distributions or sale of Fund shares.
This chart, which is a logarithmic chart, presents the fluctuations in the value of the Fund and its indexes. We believe that a logarithmic chart is more effective than other types of charts in illustrating
changes in value during the early years shown in the chart. The vertical axis, the one that indicates the dollar value of an investment, is constructed with each segment representing a percent change in the value of the investment. In this chart, each segment represents a doubling, or 100% change, in the value of the investment. In other words, the space between $5,000 and $10,000 is the same size as the space between $10,000 and $20,000, and so on.
6 Invesco China Fund
Average Annual Total Returns
As of 10/31/11, including maximum applicable sales charges
| | | | | | | | | |
|
| Class A Shares | | | | |
| |
| Inception (3/31/06) | | | 10.48 | % |
| |
| | 5 | | | Years | | | 9.70 | |
| |
| | 1 | | | Year | | | -24.37 | |
| |
| | | | | | | | | |
| Class B Shares | | | | |
| |
| Inception (3/31/06) | | | 10.67 | % |
| |
| | 5 | | | Years | | | 9.87 | |
| |
| | 1 | | | Year | | | -24.53 | |
| |
| | | | | | | | | |
| Class C Shares | | | | |
| |
| Inception (3/31/06) | | | 10.76 | % |
| |
| | 5 | | | Years | | | 10.14 | |
| |
| | 1 | | | Year | | | -21.34 | |
| |
| | | | | | | | | |
| Class Y Shares | | | | |
| |
| Inception | | | 11.75 | % |
| |
| | 5 | | | Years | | | 11.11 | |
| |
| | 1 | | | Year | | | -19.74 | |
| |
| | | | | | | | | |
| Institutional Class Shares | | | | |
| |
| Inception (3/31/06) | | | 12.13 | % |
| |
| | 5 | | | Years | | | 11.52 | |
| |
| | 1 | | | Year | | | -19.58 | |
Class Y shares incepted on October 3, 2008. Performance shown prior to that date is that of Class A shares and includes the 12b-1 fees applicable to Class A shares. Class A share performance reflects any applicable fee waivers or expense reimbursements.
The performance data quoted represent past performance and cannot guarantee comparable future results; current performance may be lower or higher. Please visit invesco.com/performance for the
Average Annual Total Returns
As of 9/30/11, the most recent calendar quarter-end, including maximum applicable sales charges
| | | | | | | | | |
|
| Class A Shares | | | | |
| |
| Inception (3/31/06) | | | 8.39 | % |
| |
| | 5 | | | Years | | | 8.68 | |
| |
| | 1 | | | Year | | | -29.04 | |
| |
| | | | | | | | | |
| Class B Shares | | | | |
| |
| Inception (3/31/06) | | | 8.59 | % |
| |
| | 5 | | | Years | | | 8.83 | |
| |
| | 1 | | | Year | | | -29.18 | |
| |
| | | | | | | | | |
| Class C Shares | | | | |
| |
| Inception (3/31/06) | | | 8.68 | % |
| |
| | 5 | | | Years | | | 9.09 | |
| |
| | 1 | | | Year | | | -26.23 | |
| |
| | | | | | | | | |
| Class Y Shares | | | | |
| |
| Inception | | | 9.65 | % |
| |
| | 5 | | | Years | | | 10.08 | |
| |
| | 1 | | | Year | | | -24.71 | |
| |
| | | | | | | | | |
| Institutional Class Shares | | | | |
| |
| Inception (3/31/06) | | | 10.02 | % |
| |
| | 5 | | | Years | | | 10.47 | |
| |
| | 1 | | | Year | | | -24.59 | |
most recent month-end performance. Performance figures reflect reinvested distributions, changes in net asset value and the effect of the maximum sales charge unless otherwise stated. Investment return and principal value will fluctuate so that you may have a gain or loss when you sell shares.
The total annual Fund operating expense ratio set forth in the most recent Fund prospectus as of the date of this report for Class A, Class B, Class C, Class Y and Institutional Class
shares was 1.67%, 2.42%, 2.42%, 1.42% and 1.25%, respectively. The expense ratios presented above may vary from the expense ratios presented in other sections of this report that are based on expenses incurred during the period covered by this report.
Class A share performance reflects the maximum 5.50% sales charge, and Class B and Class C share performance reflects the applicable contingent deferred sales charge (CDSC) for the period involved. The CDSC on Class B shares declines from 5% beginning at the time of purchase to 0% at the beginning of the seventh year. The CDSC on Class C shares is 1% for the first year after purchase. Class Y and Institutional Class shares do not have a front-end sales charge or a CDSC; therefore, performance is at net asset value.
The performance of the Fund’s share classes will differ primarily due to different sales charge structures and class expenses.
A redemption fee of 2% is imposed on certain redemptions or exchanges out of the Fund within 31 days of purchase. Exceptions to the redemption fee are listed in the Fund’s prospectus. Effective January 1, 2012, after the close of the reporting period, the Fund will eliminate the redemption fee, if applicable, assessed on shares of the Fund redeemed or exchanged within 31 days of purchase.
continued from page 8
| n | | The Lipper China Region Funds Index is an unmanaged index considered representative of China region funds tracked by Lipper. |
| |
| n | | The Fund is not managed to track the performance of any particular index, including the index(es) defined here, and consequently, the performance of the Fund may deviate significantly from the performance of the index(es). |
| |
| n | | A direct investment cannot be made in an index. Unless otherwise indicated, index results include reinvested dividends, and they do not reflect sales charges. Performance of the peer group, if applicable, reflects fund |
| | | expenses; performance of a market index does not. |
Other information
| n | | The Chartered Financial Analyst® (CFA®) designation is globally recognized and attests to a charterholder’s success in a rigorous and comprehensive study program in the field of investment management and research analysis. |
| |
| n | | The returns shown in management’s discussion of Fund performance are based on net asset values calculated for shareholder transactions. Generally accepted accounting principles require adjustments to be made to the net |
| | | assets of the Fund at period end for financial reporting purposes, and as such, the net asset values for shareholder transactions and the returns based on those net asset values may differ from the net asset values and returns reported in the Financial Highlights. |
| |
| n | | Industry classifications used in this report are generally according to the Global Industry Classification Standard, which was developed by and is the exclusive property and a service mark of MSCI Inc. and Standard & Poor’s. |
7 Invesco China Fund
Invesco China Fund’s investment objective is long-term growth of capital.
| n | | Unless otherwise stated, information presented in this report is as of October 31, 2011, and is based on total net assets. |
| |
| n | | Unless otherwise noted, all data provided by Invesco. |
| |
| n | | To access your Fund’s reports/prospectus, visit invesco.com/fundreports. |
About share classes
| n | | Class B shares may not be purchased or acquired by exchange from share classes other than Class B shares. Please see the prospectus for more information. |
| |
| n | | Class Y shares are available to only certain investors. Please see the prospectus for more information. |
| |
| n | | Institutional Class shares are offered exclusively to institutional investors, including defined contribution plans that meet certain criteria. Please see the prospectus for more information. |
Principal risks of investing in the Fund
| n | | Convertible securities risk. The Fund may own convertible securities, the value of which may be affected by market interest rates, the risk that the issuer will default, the value of the underlying stock or the right of the issuer to buy back the convertible securities. |
| n | | Credit risk. The issuer of instruments in which the Fund invests may be unable to meet interest and/or principal payments, thereby causing its instruments to decrease in value and lowering the issuer’s credit rating. |
| n | | Currency/exchange rate risk. The dollar value of the Fund’s foreign investments will be affected by changes in the exchange rates between the dollar and the currencies in which those investments are traded. |
| n | | Developing markets securities risk. Securities issued by foreign companies and governments located in developing countries may be affected more negatively by inflation, devaluation of their currencies, higher transaction costs, delays in settlement, adverse political developments, the introduction of capital controls, withholding taxes, nationalization of private assets, expropriation, social unrest, war or lack of timely information than those in developed countries. |
| n | | Foreign securities risk. The Fund’s foreign investments may be affected |
| | | by changes in a foreign country’s exchange rates; political and social instability; changes in economic or taxation policies; difficulties when enforcing obligations; decreased liquidity; and increased volatility. Foreign companies may be subject to less regulation resulting in less publicly available information about the companies. |
| |
| n | | Geographic concentration risk. Because the Fund’s investments are concentrated in China, the Fund’s performance is expected to be closely tied to social, political, and economic conditions within China and to be more volatile than the performance of more geographically diversified funds. |
| |
| n | | Interest rate risk. Interest rate risk refers to the risk that bond prices generally fall as interest rates rise; conversely, bond prices generally rise as interest rates fall. Specific bonds differ in their sensitivity to changes in interest rates depending on their individual characteristics, including duration. |
| |
| n | | IPO risk. Although the Fund’s return during certain periods was positively impacted by its investments in initial public offerings (IPOs), there can be no assurance that the Fund will have favorable IPO investment opportunities in the future. |
| |
| n | | Management risk. The investment techniques and risk analysis used by the Fund’s portfolio managers may not produce the desired results. |
| |
| n | | Market risk. The prices of and the income generated by the Fund’s securities may decline in response to, among other things, investor sentiment; general economic and market conditions; regional or global instability; and currency and interest rate fluctuations. |
| |
| n | | Small- and mid-capitalization risk. Stocks of small and mid-sized companies tend to be more vulnerable to adverse developments in the above factors and may have little or no operating history or track record of success, and limited product lines, |
| | | markets, management and financial resources. The securities of small- and mid-sized companies may be more volatile due to less market interest and less publicly available information about the issuer. They also may be illiquid or restricted as to resale, or may trade less frequently and in smaller volumes, all of which may cause difficulty when establishing or closing a position at a desirable price. |
| |
| n | | Unique economic and political risks of investing in China. China remains a totalitarian country with the following risks: nationalization, expropriation, or confiscation of property; difficulty in obtaining and/or enforcing judgments; alteration or discontinuation of economic reforms; military conflicts, either internal or with other countries; inflation, currency fluctuations and fluctuations in inflation and interest rates that may have negative effects on the economy and securities markets of China; and China’s dependency on the economies of other Asian countries, many of which are developing countries. |
| |
| n | | Warrants risk. Warrants may be significantly less valuable on their relevant expiration date resulting in a loss of money or they may expire worthless resulting in a total loss of the investment. Warrants may also be postponed or terminated early resulting in a partial or total loss of the investment. Warrants may also be subject to illiquidity. |
About indexes used in this report
| n | | The MSCI EAFE® Index is an unmanaged index considered representative of stocks of Europe, Australasia and the Far East. |
| |
| n | | The MSCI China 10/40 Index is a free float-adjusted market capitalization index designed to measure equity market performance in China, taking into consideration the concentration constraints applicable to funds registered for sale in Europe pursuant to the UCITS III Directive. |
continued on page 7
This report must be accompanied or preceded by a currently effective Fund prospectus, which contains more complete information, including sales charges and expenses. Investors should read it carefully before investing.
NOT FDIC INSURED | MAY LOSE VALUE | NO BANK GUARANTEE
Fund Nasdaq Symbols
| | | | | |
|
| Class A Shares | | AACFX |
| Class B Shares | | ABCFX |
| Class C Shares | | CACFX |
| Class Y Shares | | AMCYX |
| Institutional Class Shares | | IACFX |
8 Invesco China Fund
Schedule of Investments(a)
October 31, 2011
| | | | | | | | | |
| | | Shares | | Value |
| |
Common Stocks & Other Equity Interests–99.85%(b)
|
Airlines–0.31%
| | | | |
China Eastern Airlines Corp. Ltd.–Class H(c) | | | 1,242,000 | | | $ | 488,286 | |
| |
Apparel Retail–0.44%
| | | | |
| Emperor Watch & Jewellery Ltd. (Hong Kong) | | | 4,380,000 | | | | 689,761 | |
| |
Apparel, Accessories & Luxury Goods–0.97%
| | | | |
Samsonite International S.A. (Luxembourg)(c) | | | 921,000 | | | | 1,506,211 | |
| |
Auto Parts & Equipment–1.24%
| | | | |
| Minth Group Ltd. | | | 500,000 | | | | 511,855 | |
| |
| Xinyi Glass Holdings Ltd. | | | 2,304,000 | | | | 1,413,905 | |
| |
| | | | | | | | 1,925,760 | |
| |
Automobile Manufacturers–3.08%
| | | | |
| AviChina Industry & Technology Co. Ltd.–Class H | | | 3,692,000 | | | | 1,616,395 | |
| |
Brilliance China Automotive Holdings Ltd. (Hong Kong)(c) | | | 1,584,000 | | | | 1,663,444 | |
| |
| Qingling Motors Co. Ltd.–Class H | | | 5,520,000 | | | | 1,512,987 | |
| |
| | | | | | | | 4,792,826 | |
| |
Automotive Retail–1.12%
| | | | |
| Zhongsheng Group Holdings Ltd. | | | 1,006,500 | | | | 1,750,398 | |
| |
Building Products–0.66%
| | | | |
| China Liansu Group Holdings Ltd. | | | 1,914,000 | | | | 1,025,304 | |
| |
Casinos & Gaming–1.13%
| | | | |
| Wynn Macau, Ltd. (Supranational) | | | 643,200 | | | | 1,766,325 | |
| |
Coal & Consumable Fuels–6.23%
| | | | |
| China Shenhua Energy Co. Ltd.–Class H | | | 1,226,500 | | | | 5,614,967 | |
| |
| Inner Mongolia Yitai Coal Co., Ltd.–Class B | | | 362,310 | | | | 1,991,929 | |
| |
| Yanzhou Coal Mining Co. Ltd.–Class H | | | 844,000 | | | | 2,091,829 | |
| |
| | | | | | | | 9,698,725 | |
| |
Commodity Chemicals–0.84%
| | | | |
| Lee & Man Holding Ltd. (Hong Kong) | | | 2,000,000 | | | | 1,314,427 | |
| |
Communications Equipment–1.40%
| | | | |
| ZTE Corp.–Class H | | | 769,800 | | | | 2,187,146 | |
| |
Construction & Farm Machinery & Heavy Trucks–0.92%
| | | | |
| CSR Corp Ltd–Class H | | | 1,233,000 | | | | 711,736 | |
| |
| Zoomlion Heavy Industry Science & Technology Co., Ltd.–Class H | | | 513,600 | | | | 728,244 | |
| |
| | | | | | | | 1,439,980 | |
| |
Construction Materials–8.52%
| | | | |
| Anhui Conch Cement Co. Ltd.–Class H | | | 1,487,500 | | | | 5,407,132 | |
| |
| Asia Cement China Holdings Corp. | | | 2,477,000 | | | | 1,170,337 | |
| |
| BBMG Corp.–Class H | | | 1,062,500 | | | | 902,857 | |
| |
| China National Building Material Co. Ltd.–Class H | | | 1,638,000 | | | | 2,099,572 | |
| |
| China Resources Cement Holdings Ltd. (Hong Kong) | | | 2,960,000 | | | | 2,347,179 | |
| |
| CSG Holding Co. Ltd.–Class B | | | 1,581,625 | | | | 1,344,996 | |
| |
| | | | | | | | 13,272,073 | |
| |
Distillers & Vintners–0.89%
| | | | |
| JLF Investment Co. Ltd. (Hong Kong) | | | 22,336,000 | | | | 1,381,640 | |
| |
Distributors–3.74%
| | | | |
| Silver Base Group Holdings Ltd. | | | 5,529,000 | | | | 5,831,090 | |
| |
Diversified Banks–12.62%
| | | | |
| Bank of China Ltd.–Class H | | | 13,190,600 | | | | 4,652,483 | |
| |
| China Construction Bank Corp.–Class H | | | 9,107,290 | | | | 6,619,924 | |
| |
| China Merchants Bank Co., Ltd.–Class H | | | 795,500 | | | | 1,568,686 | |
| |
| Industrial & Commercial Bank of China Ltd.–Class H | | | 11,112,940 | | | | 6,822,993 | |
| |
| | | | | | | | 19,664,086 | |
| |
Diversified Metals & Mining–2.64%
| | | | |
| China Metal Recycling Holdings Ltd. (Hong Kong) | | | 2,294,400 | | | | 2,397,074 | |
| |
| Jiangxi Copper Co. Ltd.–Class H | | | 731,000 | | | | 1,716,630 | |
| |
| | | | | | | | 4,113,704 | |
| |
Diversified Real Estate Activities–0.58%
| | | | |
New World Development Co. Ltd.–Rts. (Hong Kong)(c) | | | 300,000 | | | | 102,332 | |
| |
| Poly (Hong Kong) Investments Ltd. (Hong Kong) | | | 1,598,000 | | | | 802,664 | |
| |
| | | | | | | | 904,996 | |
| |
Electrical Components & Equipment–0.54%
| | | | |
| Zhuzhou CSR Times Electric Co., Ltd.–Class H | | | 367,000 | | | | 846,654 | |
| |
Electronic Components–0.51%
| | | | |
| Kingboard Chemical Holdings Ltd. | | | 232,500 | | | | 788,805 | |
| |
Environmental & Facilities Services–0.54%
| | | | |
| China Everbright International Ltd. (Hong Kong) | | | 3,000,000 | | | | 846,235 | |
| |
Gold–0.60%
| | | | |
| Zijin Mining Group Co., Ltd.–Class H | | | 2,266,000 | | | | 940,475 | |
| |
Health Care Distributors–1.16%
| | | | |
Shanghai Pharmaceuticals Holding Co.,
Ltd.–Class H(c) | | | 943,300 | | | | 1,799,168 | |
| |
| | | | | | | | | |
| | | | | | | | | |
See accompanying Notes to Financial Statements which are an integral part of the financial statements.
9 Invesco China Fund
| | | | | | | | | |
| | | Shares | | Value |
| |
Hotels, Resorts & Cruise Lines–2.18%
| | | | |
Ctrip.com International, Ltd.–ADR(c) | | | 65,820 | | | $ | 2,294,485 | |
| |
| Shanghai Jinjiang International Hotels Development Co., Ltd.–Class B | | | 790,527 | | | | 1,103,850 | |
| |
| | | | | | | | 3,398,335 | |
| |
Household Products–1.05%
| | | | |
| Vinda International Holdings Ltd. | | | 1,444,000 | | | | 1,637,606 | |
| |
Independent Power Producers & Energy Traders–0.56%
| | | | |
Datang International Power Generation Co.
Ltd.–Class H | | | 3,436,000 | | | | 874,308 | |
| |
Integrated Oil & Gas–7.25%
| | | | |
| China Petroleum & Chemical Corp. (Sinopec)–Class H | | | 5,628,000 | | | | 5,335,654 | |
| |
| PetroChina Co. Ltd.–Class H | | | 4,580,000 | | | | 5,958,598 | |
| |
| | | | | | | | 11,294,252 | |
| |
Integrated Telecommunication Services–4.79%
| | | | |
| China Telecom Corp. Ltd.–Class H | | | 6,964,000 | | | | 4,333,884 | |
| |
| China Unicom (Hong Kong) Ltd. (Hong Kong) | | | 1,554,000 | | | | 3,128,795 | |
| |
| | | | | | | | 7,462,679 | |
| |
Internet Software & Services–4.97%
| | | | |
| Tencent Holdings Ltd. | | | 337,700 | | | | 7,735,014 | |
| |
Investment Banking & Brokerage–1.25%
| | | | |
CITIC Securities Co. Ltd.–Class H(c)(d) | | | 974,500 | | | | 1,941,775 | |
| |
Life & Health Insurance–1.89%
| | | | |
| China Life Insurance Co., Ltd.–Class H | | | 1,142,000 | | | | 2,951,289 | |
| |
Marine Ports & Services–0.72%
| | | | |
| Cosco Pacific Ltd. (Hong Kong) | | | 810,000 | | | | 1,127,593 | |
| |
Oil & Gas Exploration & Production–6.02%
| | | | |
| CNOOC Ltd. | | | 4,046,000 | | | | 7,647,259 | |
| |
| Kunlun Energy Co. Ltd. (Hong Kong) | | | 1,254,000 | | | | 1,735,108 | |
| |
| | | | | | | | 9,382,367 | |
| |
Packaged Foods & Meats–4.08%
| | | | |
| China Foods Ltd. (Hong Kong) | | | 3,608,000 | | | | 2,836,761 | |
| |
| China Mengniu Dairy Co. Ltd. | | | 579,000 | | | | 1,844,282 | |
| |
| Want Want China Holdings Ltd. | | | 1,814,000 | | | | 1,670,489 | |
| |
| | | | | | | | 6,351,532 | |
| |
Personal Products–2.62%
| | | | |
| Hengan International Group Co. Ltd. | | | 470,500 | | | | 4,073,987 | |
| |
Property & Casualty Insurance–1.58%
| | | | |
| PICC Property and Casualty Co. Ltd.–Class H | | | 1,810,000 | | | | 2,463,201 | |
| |
Real Estate Development–2.21%
| | | | |
| Evergrande Real Estate Group Ltd. | | | 2,538,000 | | | | 1,074,252 | |
| |
| Guangzhou R&F Properties Co. Ltd.–Class H | | | 515,600 | | | | 495,665 | |
| |
| KWG Property Holding Ltd. | | | 1,368,000 | | | | 583,461 | |
| |
| Longfor Properties | | | 374,000 | | | | 469,047 | |
| |
| Shimao Property Holdings Ltd. | | | 844,000 | | | | 825,659 | |
| |
| | | | | | | | 3,448,084 | |
| |
Restaurants–1.67%
| | | | |
| Ajisen China Holdings Ltd. | | | 1,826,000 | | | | 2,603,440 | |
| |
Steel–1.29%
| | | | |
| China Vanadium Titano-Magnetite Mining Co. Ltd. (Hong Kong) | | | 3,000,000 | | | | 600,990 | |
| |
| Xingda International Holdings Ltd. | | | 2,495,000 | | | | 1,410,745 | |
| |
| | | | | | | | 2,011,735 | |
| |
Technology Distributors–2.12%
| | | | |
| Digital China Holdings Ltd. (Hong Kong) | | | 2,114,000 | | | | 3,303,912 | |
| |
Wireless Telecommunication Services–2.92%
| | | | |
| China Mobile Ltd. (Hong Kong) | | | 476,500 | | | | 4,540,881 | |
| |
| Total Common Stocks & Other Equity Interests (Cost $143,364,449) | | | | | | | 155,576,065 | |
| |
Money Market Funds–0.63%
|
Liquid Assets Portfolio–Institutional Class(e) | | | 488,195 | | | | 488,195 | |
| |
Premier Portfolio–Institutional Class(e) | | | 488,195 | | | | 488,195 | |
| |
| Total Money Market Funds (Cost $976,390) | | | | | | | 976,390 | |
| |
| TOTAL INVESTMENTS–100.48% (Cost $144,340,839) | | | | | | | 156,552,455 | |
| |
| OTHER ASSETS LESS LIABILITIES–(0.48)% | | | | | | | (744,799 | ) |
| |
| NET ASSETS–100.00% | | | | | | $ | 155,807,656 | |
| |
Investment Abbreviations:
| | | |
| ADR | | – American Depositary Receipt |
| Rts. | | – Rights |
Notes to Schedule of Investments:
| | |
| (a) | | Industry and/or sector classifications used in this report are generally according to the Global Industry Classification Standard, which was developed by and is the exclusive property and a service mark of MSCI Inc. and Standard & Poor’s. |
| (b) | | Country of issuer and/or credit risk exposure listed in Common Stocks & Other Equity Interests has been determined to be China unless otherwise noted. |
| (c) | | Non-income producing security. |
| (d) | | Security purchased or received in a transaction exempt from registration under the Securities Act of 1933, as amended. The security may be resold pursuant to an exemption from registration under the 1933 Act, typically to qualified institutional buyers. The value of this security at October 31, 2011 represented 1.25% of the Fund’s Net Assets. |
| (e) | | The money market fund and the Fund are affiliated by having the same investment adviser. |
See accompanying Notes to Financial Statements which are an integral part of the financial statements.
10 Invesco China Fund
Statement of Assets and Liabilities
October 31, 2011
| | | | | |
Assets:
|
| Investments, at value (Cost $143,364,449) | | $ | 155,576,065 | |
| |
| Investments in affiliated money market funds, at value and cost | | | 976,390 | |
| |
| Total investments, at value (Cost $144,340,839) | | | 156,552,455 | |
| |
| Foreign currencies, at value (Cost $108,389) | | | 108,464 | |
| |
| Receivable for: | | | | |
| Investments sold | | | 5,592,614 | |
| |
| Fund shares sold | | | 172,027 | |
| |
| Dividends | | | 10,036 | |
| |
| Investment for trustee deferred compensation and retirement plans | | | 11,091 | |
| |
| Other assets | | | 17,267 | |
| |
| Total assets | | | 162,463,954 | |
| |
Liabilities:
|
| Payable for: | | | | |
| Investments purchased | | | 5,942,114 | |
| |
| Fund shares reacquired | | | 438,710 | |
| |
| Accrued fees to affiliates | | | 149,517 | |
| |
| Accrued other operating expenses | | | 101,480 | |
| |
| Trustee deferred compensation and retirement plans | | | 24,477 | |
| |
| Total liabilities | | | 6,656,298 | |
| |
| Net assets applicable to shares outstanding | | $ | 155,807,656 | |
| |
Net assets consist of:
|
| Shares of beneficial interest | | $ | 210,494,172 | |
| |
| Undistributed net investment income | | | 616,332 | |
| |
| Undistributed net realized gain (loss) | | | (67,515,279 | ) |
| |
| Unrealized appreciation | | | 12,212,431 | |
| |
| | | $ | 155,807,656 | |
| |
Net Assets:
|
| Class A | | $ | 102,247,544 | |
| |
| Class B | | $ | 13,988,372 | |
| |
| Class C | | $ | 32,319,239 | |
| |
| Class Y | | $ | 6,482,576 | |
| |
| Institutional Class | | $ | 769,925 | |
| |
Shares outstanding, $0.01 par value per share, with an unlimited number of shares authorized:
|
| Class A | | | 5,834,628 | |
| |
| Class B | | | 820,470 | |
| |
| Class C | | | 1,898,656 | |
| |
| Class Y | | | 368,690 | |
| |
| Institutional Class | | | 43,716 | |
| |
| Class A: | | | | |
| Net asset value per share | | $ | 17.52 | |
| |
Maximum offering price per share
(Net asset value of $17.52 divided by 94.50%) | | $ | 18.54 | |
| |
| Class B: | | | | |
| Net asset value and offering price per share | | $ | 17.05 | |
| |
| Class C: | | | | |
| Net asset value and offering price per share | | $ | 17.02 | |
| |
| Class Y: | | | | |
| Net asset value and offering price per share | | $ | 17.58 | |
| |
| Institutional Class: | | | | |
| Net asset value and offering price per share | | $ | 17.61 | |
| |
See accompanying Notes to Financial Statements which are an integral part of the financial statements.
11 Invesco China Fund
Statement of Operations
For the year ended October 31, 2011
| | | | | |
Investment income:
|
| Dividends (net of foreign withholding taxes of $349,736) | | $ | 4,734,477 | |
| |
| Dividends from affiliated money market funds | | | 4,365 | |
| |
| Total investment income | | | 4,738,842 | |
| |
Expenses:
|
| Advisory fees | | | 1,981,179 | |
| |
| Administrative services fees | | | 50,000 | |
| |
| Custodian fees | | | 146,175 | |
| |
| Distribution fees: | | | | |
| Class A | | | 340,715 | |
| |
| Class B | | | 196,092 | |
| |
| Class C | | | 462,457 | |
| |
| Transfer agent fees — A, B, C and Y | | | 619,860 | |
| |
| Transfer agent fees — Institutional | | | 882 | |
| |
| Trustees’ and officers’ fees and benefits | | | 23,307 | |
| |
| Other | | | 193,494 | |
| |
| Total expenses | | | 4,014,161 | |
| |
| Less: Fees waived, expenses reimbursed and expense offset arrangement(s) | | | (8,535 | ) |
| |
| Net expenses | | | 4,005,626 | |
| |
| Net investment income | | | 733,216 | |
| |
Realized and unrealized gain (loss) from:
|
| Net realized gain (loss) from: | | | | |
| Investment securities | | | 10,394,691 | |
| |
| Foreign currencies | | | (55,126 | ) |
| |
| | | | 10,339,565 | |
| |
| Change in net unrealized appreciation (depreciation) of: | | | | |
| Investment securities | | | (54,329,628 | ) |
| |
| Foreign currencies | | | 633 | |
| |
| | | | (54,328,995 | ) |
| |
| Net realized and unrealized gain (loss) | | | (43,989,430 | ) |
| |
| Net increase (decrease) in net assets resulting from operations | | $ | (43,256,214 | ) |
| |
See accompanying Notes to Financial Statements which are an integral part of the financial statements.
12 Invesco China Fund
Statement of Changes in Net Assets
For the years ended October 31, 2011 and 2010
| | | | | | | | | |
| | | 2011 | | 2010 |
| |
Operations:
|
| Net investment income | | $ | 733,216 | | | $ | 156,713 | |
| |
| Net realized gain | | | 10,339,565 | | | | 29,501,110 | |
| |
| Change in net unrealized appreciation (depreciation) | | | (54,328,995 | ) | | | 14,108,420 | |
| |
| Net increase (decrease) in net assets resulting from operations | | | (43,256,214 | ) | | | 43,766,243 | |
| |
Distributions to shareholders from net investment income:
|
| Class A | | | (296,385 | ) | | | (1,340,537 | ) |
| |
| Class B | | | — | | | | (85,595 | ) |
| |
| Class C | | | — | | | | (204,447 | ) |
| |
| Class Y | | | (51,203 | ) | | | (60,815 | ) |
| |
| Institutional Class | | | (5,491 | ) | | | (7,016 | ) |
| |
| Total distributions from net investment income | | | (353,079 | ) | | | (1,698,410 | ) |
| |
Share transactions–net:
|
| Class A | | | (36,369,760 | ) | | | (15,984,376 | ) |
| |
| Class B | | | (5,874,911 | ) | | | (3,523,948 | ) |
| |
| Class C | | | (18,007,653 | ) | | | (4,683,441 | ) |
| |
| Class Y | | | (3,341,289 | ) | | | 4,769,591 | |
| |
| Institutional Class | | | (29,230 | ) | | | 220,922 | |
| |
| Net increase (decrease) in net assets resulting from share transactions | | | (63,622,843 | ) | | | (19,201,252 | ) |
| |
| Net increase (decrease) in net assets | | | (107,232,136 | ) | | | 22,866,581 | |
| |
Net assets:
|
| Beginning of year | | | 263,039,792 | | | | 240,173,211 | |
| |
| End of year (includes undistributed net investment income of $616,332 and $291,321, respectively) | | $ | 155,807,656 | | | $ | 263,039,792 | |
| |
Notes to Financial Statements
October 31, 2011
NOTE 1—Significant Accounting Policies
Invesco China Fund (the “Fund”) is a series portfolio of AIM Investment Funds (Invesco Investment Funds) (the “Trust”). The Trust is organized as a Delaware statutory trust and is registered under the Investment Company Act of 1940, as amended (the “1940 Act”), as an open-end series management investment company consisting of thirteen separate series portfolios, each authorized to issue an unlimited number of shares of beneficial interest. The assets, liabilities and operations of each portfolio are accounted for separately. Information presented in these financial statements pertains only to the Fund. Matters affecting each portfolio or class will be voted on exclusively by the shareholders of such portfolio or class.
The Fund’s investment objective is long-term growth of capital.
The Fund currently consists of five different classes of shares: Class A, Class B, Class C, Class Y and Institutional Class. Class A shares are sold with a front-end sales charge unless certain waiver criteria are met and under certain circumstances load waived shares may be subject to contingent deferred sales charges (“CDSC”). Class C shares are sold with a CDSC. Class Y and Institutional Class shares are sold at net asset value. Effective November 30, 2010, new or additional investments in Class B shares are no longer permitted. Existing shareholders of Class B shares may continue to reinvest dividends and capital gains distributions in Class B shares until they convert. Also, shareholders in Class B shares will be able to exchange those shares for Class B shares of other Invesco Funds offering such shares until they convert. Generally, Class B shares will automatically convert to Class A shares on or about the month-end which is at least eight years after the date of purchase. Redemption of Class B shares prior to conversion date will be subject to a CDSC.
The following is a summary of the significant accounting policies followed by the Fund in the preparation of its financial statements.
| | |
| A. | | Security Valuations — Securities, including restricted securities, are valued according to the following policy. |
| | A security listed or traded on an exchange (except convertible bonds) is valued at its last sales price or official closing price as of the close of the customary trading session on the exchange where the security is principally traded, or lacking any sales or official closing price on a particular day, the security may be valued at the closing bid price on that day. Securities traded in the over-the-counter market are valued based on prices furnished by |
13 Invesco China Fund
| | |
| | independent pricing services or market makers. When such securities are valued by an independent pricing service they may be considered fair valued. Futures contracts are valued at the final settlement price set by an exchange on which they are principally traded. Listed options are valued at the mean between the last bid and ask prices from the exchange on which they are principally traded. Options not listed on an exchange are valued by an independent source at the mean between the last bid and ask prices. For purposes of determining net asset value per share, futures and option contracts generally are valued 15 minutes after the close of the customary trading session of the New York Stock Exchange (“NYSE”). |
| | Investments in open-end and closed-end registered investment companies that do not trade on an exchange are valued at the end of day net asset value per share. Investments in open-end and closed-end registered investment companies that trade on an exchange are valued at the last sales price or official closing price as of the close of the customary trading session on the exchange where the security is principally traded. |
| | Debt obligations (including convertible bonds) and unlisted equities are fair valued using an evaluated quote provided by an independent pricing service. Evaluated quotes provided by the pricing service may be determined without exclusive reliance on quoted prices, and may reflect appropriate factors such as institution-size trading in similar groups of securities, developments related to specific securities, dividend rate, yield, quality, type of issue, coupon rate, maturity, individual trading characteristics and other market data. Debt securities are subject to interest rate and credit risks. In addition, all debt securities involve some risk of default with respect to interest and/or principal payments. |
| | Foreign securities (including foreign exchange contracts) are converted into U.S. dollar amounts using the applicable exchange rates as of the close of the NYSE. If market quotations are available and reliable for foreign exchange traded equity securities, the securities will be valued at the market quotations. Because trading hours for certain foreign securities end before the close of the NYSE, closing market quotations may become unreliable. If between the time trading ends on a particular security and the close of the customary trading session on the NYSE, events occur that are significant and make the closing price unreliable, the Fund may fair value the security. If the event is likely to have affected the closing price of the security, the security will be valued at fair value in good faith using procedures approved by the Board of Trustees. Adjustments to closing prices to reflect fair value may also be based on a screening process of an independent pricing service to indicate the degree of certainty, based on historical data, that the closing price in the principal market where a foreign security trade is not the current value as of the close of the NYSE. Foreign securities meeting the approved degree of certainty that the price is not reflective of current value will be priced at the indication of fair value from the independent pricing service. Multiple factors may be considered by the independent pricing service in determining adjustments to reflect fair value and may include information relating to sector indices, American Depositary Receipts and domestic and foreign index futures. Foreign securities may have additional risks including exchange rate changes, potential for sharply devalued currencies and high inflation, political and economic upheaval, the relative lack of issuer information, relatively low market liquidity and the potential lack of strict financial and accounting controls and standards. |
| | Securities for which market prices are not provided by any of the above methods may be valued based upon quotes furnished by independent sources. The last bid price may be used to value equity securities. The mean between the last bid and asked prices is used to value debt obligations, including Corporate Loans. |
| | Securities for which market quotations are not readily available or are unreliable are valued at fair value as determined in good faith by or under the supervision of the Trust’s officers following procedures approved by the Board of Trustees. Issuer specific events, market trends, bid/ask quotes of brokers and information providers and other market data may be reviewed in the course of making a good faith determination of a security’s fair value. |
| | Valuations change in response to many factors including the historical and prospective earnings of the issuer, the value of the issuer’s assets, general economic conditions, interest rates, investor perceptions and market liquidity. Because of the inherent uncertainties of valuation, the values reflected in the financial statements may materially differ from the value received upon actual sale of those investments. |
| B. | | Securities Transactions and Investment Income — Securities transactions are accounted for on a trade date basis. Realized gains or losses on sales are computed on the basis of specific identification of the securities sold. Interest income is recorded on the accrual basis from settlement date. Dividend income (net of withholding tax, if any) is recorded on the ex-dividend date. |
| | The Fund may periodically participate in litigation related to Fund investments. As such, the Fund may receive proceeds from litigation settlements. Any proceeds received are included in the Statement of Operations as realized gain (loss) for investments no longer held and as unrealized gain (loss) for investments still held. |
| | Brokerage commissions and mark ups are considered transaction costs and are recorded as an increase to the cost basis of securities purchased and/or a reduction of proceeds on a sale of securities. Such transaction costs are included in the determination of net realized and unrealized gain (loss) from investment securities reported in the Statement of Operations and the Statement of Changes in Net Assets and the net realized and unrealized gains (losses) on securities per share in the Financial Highlights. Transaction costs are included in the calculation of the Fund’s net asset value and, accordingly, they reduce the Fund’s total returns. These transaction costs are not considered operating expenses and are not reflected in net investment income reported in the Statement of Operations and Statement of Changes in Net Assets, or the net investment income per share and ratios of expenses and net investment income reported in the Financial Highlights, nor are they limited by any expense limitation arrangements between the Fund and the investment adviser. |
| | The Fund allocates income and realized and unrealized capital gains and losses to a class based on the relative net assets of each class. |
| C. | | Country Determination — For the purposes of making investment selection decisions and presentation in the Schedule of Investments, the investment adviser may determine the country in which an issuer is located and/or credit risk exposure based on various factors. These factors include the laws of the country under which the issuer is organized, where the issuer maintains a principal office, the country in which the issuer derives 50% or more of its total revenues and the country that has the primary market for the issuer’s securities, as well as other criteria. Among the other criteria that may be evaluated for making this determination are the country in which the issuer maintains 50% or more of its assets, the type of security, financial guarantees and enhancements, the nature of the collateral and the sponsor organization. Country of issuer and/or credit risk exposure has been determined to be the United States of America, unless otherwise noted. |
| D. | | Distributions — Distributions from income and net realized capital gain, if any, are generally paid annually and recorded on ex-dividend date. The Fund may elect to treat a portion of the proceeds from redemptions as distributions for federal income tax purposes. |
14 Invesco China Fund
| | |
| E. | | Federal Income Taxes — The Fund intends to comply with the requirements of Subchapter M of the Internal Revenue Code necessary to qualify as a regulated investment company and to distribute substantially all of the Fund’s taxable earnings to shareholders. As such, the Fund will not be subject to federal income taxes on otherwise taxable income (including net realized capital gain) that is distributed to shareholders. Therefore, no provision for federal income taxes is recorded in the financial statements. |
| | The Fund files tax returns in the U.S. Federal jurisdiction and certain other jurisdictions. Generally, the Fund is subject to examinations by such taxing authorities for up to three years after the filing of the return for the tax period. |
| F. | | Expenses — Fees provided for under the Rule 12b-1 plan of a particular class of the Fund are charged to the operations of such class. Transfer agency fees and expenses and other shareholder recordkeeping fees and expenses attributable to the Institutional Class are charged to such class. Transfer agency fees and expenses and other shareholder recordkeeping fees and expenses relating to all other classes are allocated among those classes based on relative net assets. All other expenses are allocated among the classes based on relative net assets. |
| G. | | Accounting Estimates — The preparation of financial statements in conformity with accounting principles generally accepted in the United States of America (“GAAP”) requires management to make estimates and assumptions that affect the reported amounts of assets and liabilities at the date of the financial statements and the reported amounts of revenues and expenses during the reporting period including estimates and assumptions related to taxation. Actual results could differ from those estimates by a significant amount. In addition, the Fund monitors for material events or transactions that may occur or become known after the period-end date and before the date the financial statements are released to print. |
| H. | | Indemnifications — Under the Trust’s organizational documents, each Trustee, officer, employee or other agent of the Trust is indemnified against certain liabilities that may arise out of performance of their duties to the Fund. Additionally, in the normal course of business, the Fund enters into contracts, including the Fund’s servicing agreements that contain a variety of indemnification clauses. The Fund’s maximum exposure under these arrangements is unknown as this would involve future claims that may be made against the Fund that have not yet occurred. The risk of material loss as a result of such indemnification claims is considered remote. |
| I. | | Other Risks — Investing in a single-country mutual fund involves greater risk than investing in a more diversified fund due to lack of exposure to other countries. The political and economic conditions and changes in regulatory, tax or economic policy in a single country could significantly affect the market in that country and in surrounding or related countries. |
| | Investing in developing countries can add additional risk, such as high rates of inflation or sharply devalued currencies against the U.S. dollar. |
| | Transaction costs are often higher and there may be delays in settlement procedures. |
| | Certain securities issued by companies in China may be less liquid, harder to sell or more volatile than may U.S. securities. |
| J. | | Redemption Fees — The Fund has a 2% redemption fee that is to be retained by the Fund to offset transaction costs and other expenses associated with short-term redemptions and exchanges. The fee, subject to certain exceptions, is imposed on certain redemptions or exchanges of shares within 31 days of purchase. The redemption fee is recorded as an increase in shareholder capital and is allocated among the share classes based on the relative net assets of each class. Effective January 1, 2012, the Fund will eliminate the 2% redemption fee, if applicable, assessed on shares of the Fund redeemed or exchanged within 31 days of purchase. |
| K. | | Foreign Currency Translations — Foreign currency is valued at the close of the NYSE based on quotations posted by banks and major currency dealers. Portfolio securities and other assets and liabilities denominated in foreign currencies are translated into U.S. dollar amounts at date of valuation. Purchases and sales of portfolio securities (net of foreign taxes withheld on disposition) and income items denominated in foreign currencies are translated into U.S. dollar amounts on the respective dates of such transactions. The Fund does not separately account for the portion of the results of operations resulting from changes in foreign exchange rates on investments and the fluctuations arising from changes in market prices of securities held. The combined results of changes in foreign exchange rates and the fluctuation of market prices on investments (net of estimated foreign tax withholding) are included with the net realized and unrealized gain or loss from investments in the Statement of Operations. Reported net realized foreign currency gains or losses arise from (1) sales of foreign currencies, (2) currency gains or losses realized between the trade and settlement dates on securities transactions, and (3) the difference between the amounts of dividends, interest, and foreign withholding taxes recorded on the Fund’s books and the U.S. dollar equivalent of the amounts actually received or paid. Net unrealized foreign currency gains and losses arise from changes in the fair values of assets and liabilities, other than investments in securities at fiscal period end, resulting from changes in exchange rates. |
| | The Fund may invest in foreign securities which may be subject to foreign taxes on income, gains on investments or currency repatriation, a portion of which may be recoverable. |
| L. | | Foreign Currency Contracts — The Fund may enter into foreign currency contracts to manage or minimize currency or exchange rate risk. The Fund may also enter into foreign currency contracts for the purchase or sale of a security denominated in a foreign currency in order to “lock in” the U.S. dollar price of that security. A foreign currency contract is an obligation to purchase or sell a specific currency for an agreed-upon price at a future date. The use of foreign currency contracts does not eliminate fluctuations in the price of the underlying securities the Fund owns or intends to acquire but establishes a rate of exchange in advance. Fluctuations in the value of these contracts are measured by the difference in the contract date and reporting date exchange rates and are recorded as unrealized appreciation (depreciation) until the contracts are closed. When the contracts are closed, realized gains (losses) are recorded. Realized and unrealized gains (losses) on the contracts are included in the Statement of Operations. The primary risks associated with foreign currency contracts include failure of the counterparty to meet the terms of the contract and the value of the foreign currency changing unfavorably. These risks may be in excess of the amounts reflected in the Statement of Assets and Liabilities. |
15 Invesco China Fund
NOTE 2—Advisory Fees and Other Fees Paid to Affiliates
The Trust has entered into a master investment advisory agreement with Invesco Advisers, Inc. (the “Adviser” or “Invesco”). Under the terms of the investment advisory agreement, the Fund pays an advisory fee to the Adviser based on the annual rate of the Fund’s average daily net assets as follows:
| | | | | |
| Average Net Assets | | Rate |
| |
| First $250 million | | | 0 | .935% |
| |
| Next $250 million | | | 0 | .91% |
| |
| Next $500 million | | | 0 | .885% |
| |
| Next $1.5 billion | | | 0 | .86% |
| |
| Next $2.5 billion | | | 0 | .835% |
| |
| Next $2.5 billion | | | 0 | .81% |
| |
| Next $2.5 billion | | | 0 | .785% |
| |
| Over $10 billion | | | 0 | .76% |
| |
Under the terms of a master sub-advisory agreement between the Adviser and each of Invesco Asset Management Deutschland GmbH, Invesco Asset Management Limited, Invesco Asset Management (Japan) Limited, Invesco Australia Limited, Invesco Hong Kong Limited, Invesco Senior Secured Management, Inc. and Invesco Canada Ltd. (collectively, the “Affiliated Sub-Advisers”) the Adviser, not the Fund, may pay 40% of the fees paid to the Adviser to any such Affiliated Sub-Adviser(s) that provide discretionary investment management services to the Fund based on the percentage of assets allocated to such Sub-Adviser(s).
The Adviser has contractually agreed, through at least February 28, 2013, to waive advisory fees and/or reimburse expenses to the extent necessary to limit total annual operating expenses after fee waiver and/or expense reimbursement (excluding certain items discussed below) of Class A, Class B, Class C, Class Y and Institutional Class shares to 2.25%, 3.00%, 3.00%, 2.00% and 2.00% of average daily net assets, respectively. In determining the Adviser’s obligation to waive advisory fees and/or reimburse expenses, the following expenses are not taken into account, and could cause the total annual operating expenses after fee waiver and/or reimbursement to exceed the numbers reflected above: (1) interest; (2) taxes; (3) dividend expense on short sales; (4) extraordinary or non-routine items; and (5) expenses that the Fund has incurred but did not actually pay because of an expense offset arrangement. Unless the Board of the Trustees and Invesco mutually agree to amend or continue the fee waiver agreement, it will terminate on February 28, 2013. The Adviser did not waive fees and/or reimburse expenses under this expense limitation.
Further, the Adviser has contractually agreed, through at least June 30, 2012, to waive the advisory fee payable by the Fund in an amount equal to 100% of the net advisory fees the Adviser receives from the affiliated money market funds on investments by the Fund of uninvested cash in such affiliated money market funds.
For the year ended October 31, 2011, the Adviser waived advisory fees of $6,071.
At the request of the Trustees of the Trust, Invesco Ltd. agreed to reimburse expenses incurred by the Fund in connection with market timing matters in the Invesco Funds, which may include legal, audit, shareholder reporting, communications and trustee expenses. These expenses along with the related expense reimbursement are included in the Statement of Operations. For the year ended October 31, 2011, Invesco Ltd. reimbursed expenses of the Fund in the amount of $1,030.
The Trust has entered into a master administrative services agreement with Invesco pursuant to which the Fund has agreed to pay Invesco for certain administrative costs incurred in providing accounting services to the Fund. For the year ended October 31, 2011, expenses incurred under the agreement are shown in the Statement of Operations as administrative services fees.
The Trust has entered into a transfer agency and service agreement with Invesco Investment Services, Inc. (“IIS”) pursuant to which the Fund has agreed to pay IIS a fee for providing transfer agency and shareholder services to the Fund and reimburse IIS for certain expenses incurred by IIS in the course of providing such services. IIS may make payments to intermediaries that provide omnibus account services, sub-accounting services and/or networking services. All fees payable by IIS to intermediaries that provide omnibus account services or sub-accounting are charged back to the Fund, subject to certain limitations approved by the Trust’s Board of Trustees. For the year ended October 31, 2011, expenses incurred under the agreement are shown in the Statement of Operations as transfer agent fees.
The Trust has entered into master distribution agreements with Invesco Distributors, Inc. (“IDI”) to serve as the distributor for the Class A, Class B, Class C, Class Y and Institutional Class shares of the Fund. The Trust has adopted plans pursuant to Rule 12b-1 under the 1940 Act with respect to the Fund’s Class A, Class B and Class C shares (collectively, the “Plans”). The Fund, pursuant to the Plans, pays IDI compensation at the annual rate of 0.25% of the Fund’s average daily net assets of Class A shares and 1.00% of the average daily net assets of Class B and Class C shares. Of the Plan payments, up to 0.25% of the average daily net assets of each class of shares may be paid to furnish continuing personal shareholder services to customers who purchase and own shares of such classes. Any amounts not paid as a service fee under the Plans would constitute an asset-based sales charge. Rules of the Financial Industry Regulatory Authority (“FINRA”) impose a cap on the total sales charges, including asset-based sales charges that may be paid by any class of shares of the Fund. For the year ended October 31, 2011, expenses incurred under the Plans are shown in the Statement of Operations as distribution fees.
Front-end sales commissions and CDSC (collectively, the “sales charges”) are not recorded as expenses of the Fund. Front-end sales commissions are deducted from proceeds from the sales of Fund shares prior to investment in Class A shares of the Fund. CDSC are deducted from redemption proceeds prior to remittance to the shareholder. During the year ended October 31, 2011, IDI advised the Fund that IDI retained $42,358 in front-end sales commissions from the sale of Class A shares and $59, $67,983 and $8,203 from Class A, Class B and Class C shares, respectively, for CDSC imposed on redemptions by shareholders.
Certain officers and trustees of the Trust are officers and directors of the Adviser, Invesco Ltd., IIS and/or IDI.
16 Invesco China Fund
NOTE 3—Additional Valuation Information
GAAP defines fair value as the price that would be received to sell an asset or paid to transfer a liability in an orderly transaction between market participants at the measurement date, under current market conditions. GAAP establishes a hierarchy that prioritizes the inputs to valuation methods giving the highest priority to readily available unadjusted quoted prices in an active market for identical assets (Level 1) and the lowest priority to significant unobservable inputs (Level 3) generally when market prices are not readily available or are unreliable. Based on the valuation inputs, the securities or other investments are tiered into one of three levels. Changes in valuation methods may result in transfers in or out of an investment’s assigned level:
| | |
| | Level 1 — | Prices are determined using quoted prices in an active market for identical assets. |
| | Level 2 — | Prices are determined using other significant observable inputs. Observable inputs are inputs that other market participants may use in pricing a security. These may include quoted prices for similar securities, interest rates, prepayment speeds, credit risk, yield curves, loss severities, default rates, discount rates, volatilities and others. |
| | Level 3 — | Prices are determined using significant unobservable inputs. In situations where quoted prices or observable inputs are unavailable (for example, when there is little or no market activity for an investment at the end of the period), unobservable inputs may be used. Unobservable inputs reflect the Fund’s own assumptions about the factors market participants would use in determining fair value of the securities or instruments and would be based on the best available information. |
The following is a summary of the tiered valuation input levels, as of October 31, 2011. The level assigned to the securities valuations may not be an indication of the risk or liquidity associated with investing in those securities. Because of the inherent uncertainties of valuation, the values reflected in the financial statements may materially differ from the value received upon actual sale of those investments.
During the year ended October 31, 2011, there were no significant transfers between investment levels.
| | | | | | | | | | | | | | | | | |
| | | Level 1* | | Level 2* | | Level 3 | | Total |
| |
| Consumer Discretionary | | $ | 2,294,485 | | | $ | 21,969,691 | | | $ | — | | | $ | 24,264,176 | |
| |
| Consumer Staples | | | — | | | | 13,444,765 | | | | — | | | | 13,444,765 | |
| |
| Energy | | | — | | | | 30,375,344 | | | | — | | | | 30,375,344 | |
| |
| Financial | | | 1,941,775 | | | | 29,431,656 | | | | — | | | | 31,373,431 | |
| |
| Health Care | | | — | | | | 1,799,168 | | | | | | | | 1,799,168 | |
| |
| Industrial | | | — | | | | 5,774,052 | | | | — | | | | 5,774,052 | |
| |
| Information Technology | | | — | | | | 14,014,877 | | | | — | | | | 14,014,877 | |
| |
| Materials | | | — | | | | 21,652,411 | | | | — | | | | 21,652,411 | |
| |
| Telecommunication Services | | | — | | | | 12,003,560 | | | | — | | | | 12,003,560 | |
| |
| Utilities | | | — | | | | 874,281 | | | | — | | | | 874,281 | |
| |
| Money Market Funds | | | 976,390 | | | | — | | | | — | | | | 976,390 | |
| |
| Total Investments | | $ | 5,212,650 | | | $ | 151,339,805 | | | $ | — | | | $ | 156,552,455 | |
| |
| |
| * | Transfers occurred between Level 1 and Level 2 due to foreign fair value adjustments. |
NOTE 4—Expense Offset Arrangement(s)
The expense offset arrangement is comprised of transfer agency credits which result from balances in Demand Deposit Accounts (DDA) used by the transfer agent for clearing shareholder transactions. For the year ended October 31, 2011, the Fund received credits from this arrangement, which resulted in the reduction of the Fund’s total expenses of $1,434.
NOTE 5—Trustees’ and Officers’ Fees and Benefits
“Trustees’ and Officers’ Fees and Benefits” include amounts accrued by the Fund to pay remuneration to certain Trustees and Officers of the Fund. Trustees have the option to defer compensation payable by the Fund, and “Trustees’ and Officers’ Fees and Benefits” also include amounts accrued by the Fund to fund such deferred compensation amounts. Those Trustees who defer compensation have the option to select various Invesco Funds in which their deferral accounts shall be deemed to be invested. Finally, certain current Trustees are eligible to participate in a retirement plan that provides for benefits to be paid upon retirement to Trustees over a period of time based on the number of years of service. The Fund may have certain former Trustees who also participate in a retirement plan and receive benefits under such plan. “Trustees’ and Officers’ Fees and Benefits” include amounts accrued by the Fund to fund such retirement benefits. Obligations under the deferred compensation and retirement plans represent unsecured claims against the general assets of the Fund.
During the year ended October 31, 2011, the Fund paid legal fees of $1,858 for services rendered by Kramer, Levin, Naftalis & Frankel LLP as counsel to the Independent Trustees. A partner of that firm is a Trustee of the Trust.
NOTE 6—Cash Balances
The Fund is permitted to temporarily carry a negative or overdrawn balance in its account with The State Street Bank and Trust Company, the custodian bank. To compensate the custodian bank for such overdrafts, the overdrawn Fund may either (1) leave funds as a compensating balance in the account so the custodian bank can be compensated by earning the additional interest; or (2) compensate by paying the custodian bank at a rate agreed upon by the custodian bank and Invesco, not to exceed the contractually agreed upon rate.
17 Invesco China Fund
NOTE 7—Distributions to Shareholders and Tax Components of Net Assets
Tax Character of Distributions to Shareholders Paid During the Years Ended October 31, 2011 and 2010:
| | | | | | | | | |
| | | 2011 | | 2010 |
| |
| Ordinary income | | $ | 353,079 | | | $ | 1,698,410 | |
| |
Tax Components of Net Assets at Period-End:
| | | | | |
| | | 2011 |
| |
| Undistributed ordinary income | | $ | 639,403 | |
| |
| Net unrealized appreciation — investments | | | 9,004,592 | |
| |
| Net unrealized appreciation-other investments | | | 815 | |
| |
| Temporary book/tax differences | | | (23,071 | ) |
| |
| Capital loss carryforward | | | (64,308,255 | ) |
| |
| Shares of beneficial interest | | | 210,494,172 | |
| |
| Total net assets | | $ | 155,807,656 | |
| |
The difference between book-basis and tax-basis unrealized appreciation (depreciation) is due to differences in the timing of recognition of gains and losses on investments for tax and book purposes. The Fund’s net unrealized appreciation difference is attributable primarily to wash sales.
The temporary book/tax differences are a result of timing differences between book and tax recognition of income and/or expenses. The Fund’s temporary book/tax differences are the result of the trustee deferral of compensation and retirement plan benefits.
Capital loss carryforward is calculated and reported as of a specific date. Results of transactions and other activity after that date may affect the amount of capital loss carryforward actually available for the Fund to utilize. The ability to utilize capital loss carryforward in the future may be limited under the Internal Revenue Code and related regulations based on the results of future transactions.
The Fund utilized $8,827,310 of capital loss carryforward in the current period to offset net realized capital gain for federal income tax purposes. The Fund has a capital loss carryforward as of October 31, 2011, which expires as follows:
| | | | | |
| | | Capital Loss
|
| Expiration | | Carryforward* |
| |
| October 31, 2016 | | $ | 52,960,397 | |
| |
| October 31, 2017 | | | 11,347,858 | |
| |
| Total capital loss carryforward | | $ | 64,308,255 | |
| |
| |
| * | Capital loss carryforward as of the date listed above is reduced for limitations, if any, to the extent required by the Internal Revenue Code. |
NOTE 8—Investment Securities
The aggregate amount of investment securities (other than short-term securities, U.S. Treasury obligations and money market funds, if any) purchased and sold by the Fund during the year ended October 31, 2011 was $201,815,570 and $261,337,458, respectively. Cost of investments on a tax basis includes the adjustments for financial reporting purposes as of the most recently completed Federal income tax reporting period-end.
| | | | | |
| Unrealized Appreciation (Depreciation) of Investment Securities on a Tax Basis |
| |
| Aggregate unrealized appreciation of investment securities | | $ | 19,893,535 | |
| |
| Aggregate unrealized (depreciation) of investment securities | | | (10,888,943 | ) |
| |
| Net unrealized appreciation of investment securities | | $ | 9,004,592 | |
| |
| Cost of investments for tax purposes is $147,547,863. |
NOTE 9—Reclassification of Permanent Differences
Primarily as a result of differing book/tax treatment of foreign currency transactions, on October 31, 2011, undistributed net investment income was decreased by $55,126 and undistributed net realized gain (loss) was increased by $55,126. This reclassification had no effect on the net assets of the Fund.
18 Invesco China Fund
NOTE 10—Share Information
| | | | | | | | | | | | | | | | | |
| | | Summary of Share Activity |
| |
| | | Year ended October 31, |
| | | 2011(a) | | 2010 |
| | | Shares | | Amount | | Shares | | Amount |
| |
| Sold: | | | | | | | | | | | | | | | | |
| Class A | | | 1,373,489 | | | $ | 28,760,786 | | | | 3,871,989 | | | $ | 75,343,537 | |
| |
| Class B | | | 82,369 | | | | 1,694,208 | | | | 343,926 | | | | 6,527,204 | |
| |
| Class C | | | 226,768 | | | | 4,651,952 | | | | 881,957 | | | | 16,794,971 | |
| |
| Class Y | | | 223,439 | | | | 4,551,312 | | | | 476,792 | | | | 9,493,755 | |
| |
| Institutional Class | | | 10,493 | | | | 211,702 | | | | 32,278 | | | | 609,728 | |
| |
| Issued as reinvestment of dividends: | | | | | | | | | | | | | | | | |
| Class A | | | 12,898 | | | | 277,433 | | | | 63,085 | | | | 1,253,500 | |
| |
| Class B | | | — | | | | — | | | | 4,074 | | | | 79,716 | |
| |
| Class C | | | — | | | | — | | | | 9,643 | | | | 188,419 | |
| |
| Class Y | | | 2,126 | | | | 45,798 | | | | 2,838 | | | | 56,464 | |
| |
| Institutional Class | | | 245 | | | | 5,271 | | | | 342 | | | | 6,807 | |
| |
| Automatic conversion of Class B shares to Class A shares: | | | | | | | | | | | | | | | | |
| Class A | | | 53,341 | | | | 1,096,700 | | | | 73,949 | | | | 1,404,908 | |
| |
| Class B | | | (54,627 | ) | | | (1,096,700 | ) | | | (75,340 | ) | | | (1,404,908 | ) |
| |
Reacquired:(b) | | | | | | | | | | | | | | | | |
| Class A | | | (3,203,589 | ) | | | (66,504,679 | ) | | | (4,971,913 | ) | | | (93,986,321 | ) |
| |
| Class B | | | (323,017 | ) | | | (6,472,419 | ) | | | (471,540 | ) | | | (8,725,960 | ) |
| |
| Class C | | | (1,119,622 | ) | | | (22,659,605 | ) | | | (1,173,256 | ) | | | (21,666,831 | ) |
| |
| Class Y | | | (385,703 | ) | | | (7,938,399 | ) | | | (260,073 | ) | | | (4,780,628 | ) |
| |
| Institutional Class | | | (11,608 | ) | | | (246,203 | ) | | | (20,857 | ) | | | (395,613 | ) |
| |
| Net increase (decrease) in share activity | | | (3,112,998 | ) | | $ | (63,622,843 | ) | | | (1,212,106 | ) | | $ | (19,201,252 | ) |
| |
| | |
| (a) | | There are entities that are record owners of more than 5% of the outstanding shares of the Fund and in the aggregate own 10% of the outstanding shares of the Fund. IDI has an agreement with these entities to sell Fund shares. The Fund, Invesco and/or Invesco affiliates may make payments to these entities, which are considered to be related to the Fund, for providing services to the Fund, Invesco and/or Invesco affiliates including but not limited to services such as securities brokerage, distribution, third party record keeping and account servicing. The Fund has no knowledge as to whether all or any portion of the shares owned of record by these entities are also owned beneficially. |
| (b) | | Net of redemption fees of $7,202 and $28,816 allocated among the classes based on relative net assets of each class for the years ended October 31, 2011 and 2010, respectively. |
19 Invesco China Fund
NOTE 11—Financial Highlights
The following schedule presents financial highlights for a share of the Fund outstanding throughout the periods indicated.
| | | | | | | | | | | | | | | | | | | | | | | | | | | | | | | | | | | | | | | | | | | | | | | | | | | | | | | | | |
| | | | | | | | | | | | | | | | | | | | | | | Ratio of
| | Ratio of
| | | | |
| | | | | | | Net gains
| | | | | | | | | | | | | | | | expenses
| | expenses
| | | | |
| | | | | | | (losses) on
| | | | | | | | | | | | | | | | to average
| | to average net
| | Ratio of net
| | |
| | | Net asset
| | Net
| | securities
| | | | Dividends
| | Distributions
| | | | | | | | | | net assets
| | assets without
| | investment
| | |
| | | value,
| | investment
| | (both
| | Total from
| | from net
| | from net
| | | | Net asset
| | | | Net assets,
| | with fee waivers
| | fee waivers
| | income (loss)
| | |
| | | beginning
| | income
| | realized and
| | investment
| | investment
| | realized
| | Total
| | value, end
| | Total
| | end of period
| | and/or expenses
| | and/or expenses
| | to average
| | Portfolio
|
| | | of period | | (loss)(a) | | unrealized)(b) | | operations | | income | | gains | | distributions | | of period | | return(c) | | (000s omitted) | | absorbed | | absorbed | | net assets | | turnover(d) |
| |
| Class A |
| Year ended 10/31/11 | | $ | 21.93 | | | $ | 0.12 | | | $ | (4.49 | ) | | $ | (4.37 | ) | | $ | (0.04 | ) | | $ | — | | | $ | (0.04 | ) | | $ | 17.52 | | | | (19.96 | )% | | $ | 102,248 | | | | 1.67 | %(e) | | | 1.67 | %(e) | | | 0.57 | %(e) | | | 97 | % |
| Year ended 10/31/10 | | | 18.18 | | | | 0.06 | | | | 3.83 | | | | 3.89 | | | | (0.14 | ) | | | — | | | | (0.14 | ) | | | 21.93 | | | | 21.49 | | | | 166,662 | | | | 1.67 | | | | 1.67 | | | | 0.30 | | | | 100 | |
| Year ended 10/31/09 | | | 9.82 | | | | 0.11 | | | | 8.30 | | | | 8.41 | | | | (0.05 | ) | | | — | | | | (0.05 | ) | | | 18.18 | | | | 86.04 | | | | 155,689 | | | | 1.89 | | | | 1.90 | | | | 0.83 | | | | 98 | |
| Year ended 10/31/08 | | | 28.59 | | | | 0.07 | | | | (18.15 | ) | | | (18.08 | ) | | | (0.01 | ) | | | (0.68 | ) | | | (0.69 | ) | | | 9.82 | | | | (64.58 | ) | | | 69,460 | | | | 1.75 | | | | 1.76 | | | | 0.39 | | | | 94 | |
| Year ended 10/31/07 | | | 10.98 | | | | 0.01 | | | | 17.70 | | | | 17.71 | | | | (0.10 | ) | | | — | | | | (0.10 | ) | | | 28.59 | | | | 162.36 | | | | 385,401 | | | | 1.85 | | | | 1.86 | | | | 0.04 | | | | 102 | |
| |
| Class B |
| Year ended 10/31/11 | | | 21.46 | | | | (0.04 | ) | | | (4.37 | ) | | | (4.41 | ) | | | — | | | | — | | | | — | | | | 17.05 | | | | (20.55 | ) | | | 13,988 | | | | 2.42 | (e) | | | 2.42 | (e) | | | (0.18 | )(e) | | | 97 | |
| Year ended 10/31/10 | | | 17.85 | | | | (0.09 | ) | | | 3.76 | | | | 3.67 | | | | (0.06 | ) | | | — | | | | (0.06 | ) | | | 21.46 | | | | 20.61 | | | | 23,945 | | | | 2.42 | | | | 2.42 | | | | (0.45 | ) | | | 100 | |
| Year ended 10/31/09 | | | 9.66 | | | | 0.01 | | | | 8.18 | | | | 8.19 | | | | — | | | | — | | | | — | | | | 17.85 | | | | 84.78 | | | | 23,468 | | | | 2.64 | | | | 2.65 | | | | 0.08 | | | | 98 | |
| Year ended 10/31/08 | | | 28.32 | | | | (0.06 | ) | | | (17.92 | ) | | | (17.98 | ) | | | — | | | | (0.68 | ) | | | (0.68 | ) | | | 9.66 | | | | (64.84 | ) | | | 11,625 | | | | 2.50 | | | | 2.51 | | | | (0.36 | ) | | | 94 | |
| Year ended 10/31/07 | | | 10.93 | | | | (0.14 | ) | | | 17.60 | | | | 17.46 | | | | (0.07 | ) | | | — | | | | (0.07 | ) | | | 28.32 | | | | 160.56 | | | | 51,222 | | | | 2.60 | | | | 2.61 | | | | (0.71 | ) | | | 102 | |
| |
| Class C |
| Year ended 10/31/11 | | | 21.43 | | | | (0.04 | ) | | | (4.37 | ) | | | (4.41 | ) | | | — | | | | — | | | | — | | | | 17.02 | | | | (20.58 | ) | | | 32,319 | | | | 2.42 | (e) | | | 2.42 | (e) | | | (0.18 | )(e) | | | 97 | |
| Year ended 10/31/10 | | | 17.83 | | | | (0.09 | ) | | | 3.75 | | | | 3.66 | | | | (0.06 | ) | | | — | | | | (0.06 | ) | | | 21.43 | | | | 20.58 | | | | 59,812 | | | | 2.42 | | | | 2.42 | | | | (0.45 | ) | | | 100 | |
| Year ended 10/31/09 | | | 9.65 | | | | 0.01 | | | | 8.17 | | | | 8.18 | | | | — | | | | — | | | | — | | | | 17.83 | | | | 84.77 | | | | 54,780 | | | | 2.64 | | | | 2.65 | | | | 0.08 | | | | 98 | |
| Year ended 10/31/08 | | | 28.29 | | | | (0.06 | ) | | | (17.90 | ) | | | (17.96 | ) | | | — | | | | (0.68 | ) | | | (0.68 | ) | | | 9.65 | | | | (64.83 | ) | | | 21,548 | | | | 2.50 | | | | 2.51 | | | | (0.36 | ) | | | 94 | |
| Year ended 10/31/07 | | | 10.92 | | | | (0.14 | ) | | | 17.58 | | | | 17.44 | | | | (0.07 | ) | | | — | | | | (0.07 | ) | | | 28.29 | | | | 160.52 | | | | 127,122 | | | | 2.60 | | | | 2.61 | | | | (0.71 | ) | | | 102 | |
| |
| Class Y |
| Year ended 10/31/11 | | | 22.01 | | | | 0.17 | | | | (4.51 | ) | | | (4.34 | ) | | | (0.09 | ) | | | — | | | | (0.09 | ) | | | 17.58 | | | | (19.78 | ) | | | 6,483 | | | | 1.42 | (e) | | | 1.42 | (e) | | | 0.82 | (e) | | | 97 | |
| Year ended 10/31/10 | | | 18.23 | | | | 0.10 | | | | 3.85 | | | | 3.95 | | | | (0.17 | ) | | | — | | | | (0.17 | ) | | | 22.01 | | | | 21.76 | | | | 11,638 | | | | 1.42 | | | | 1.42 | | | | 0.55 | | | | 100 | |
| Year ended 10/31/09 | | | 9.82 | | | | 0.16 | | | | 8.30 | | | | 8.46 | | | | (0.05 | ) | | | — | | | | (0.05 | ) | | | 18.23 | | | | 86.55 | | | | 5,637 | | | | 1.64 | | | | 1.65 | | | | 1.08 | | | | 98 | |
| Period ended 10/31/08(f) | | | 12.02 | | | | 0.00 | | | | (2.20 | ) | | | (2.20 | ) | | | — | | | | — | | | | — | | | | 9.82 | | | | (18.30 | ) | | | 569 | | | | 1.80 | (g) | | | 1.81 | (g) | | | 0.34 | (g) | | | 94 | |
| |
| Institutional Class |
| Year ended 10/31/11 | | | 22.04 | | | | 0.21 | | | | (4.51 | ) | | | (4.30 | ) | | | (0.13 | ) | | | — | | | | (0.13 | ) | | | 17.61 | | | | (19.61 | ) | | | 770 | | | | 1.23 | (e) | | | 1.23 | (e) | | | 1.01 | (e) | | | 97 | |
| Year ended 10/31/10 | | | 18.25 | | | | 0.14 | | | | 3.86 | | | | 4.00 | | | | (0.21 | ) | | | — | | | | (0.21 | ) | | | 22.04 | | | | 22.04 | | | | 982 | | | | 1.25 | | | | 1.25 | | | | 0.72 | | | | 100 | |
| Year ended 10/31/09 | | | 9.91 | | | | 0.20 | | | | 8.33 | | | | 8.53 | | | | (0.19 | ) | | | — | | | | (0.19 | ) | | | 18.25 | | | | 87.28 | | | | 599 | | | | 1.27 | | | | 1.28 | | | | 1.45 | | | | 98 | |
| Year ended 10/31/08 | | | 28.72 | | | | 0.17 | | | | (18.25 | ) | | | (18.08 | ) | | | (0.05 | ) | | | (0.68 | ) | | | (0.73 | ) | | | 9.91 | | | | (64.37 | ) | | | 259 | | | | 1.26 | | | | 1.27 | | | | 0.88 | | | | 94 | |
| Year ended 10/31/07 | | | 10.99 | | | | 0.09 | | | | 17.74 | | | | 17.83 | | | | (0.10 | ) | | | — | | | | (0.10 | ) | | | 28.72 | | | | 163.45 | | | | 3,658 | | | | 1.35 | | | | 1.36 | | | | 0.53 | | | | 102 | |
| |
| | |
| (a) | | Calculated using average shares outstanding. |
| (b) | | Includes redemption fess added to shares of beneficial interest which were less than $0.005 per share for the years ended October 31, 2011, 2010 and 2009, respectively. Redemption fees added to shares of beneficial interest for Class A, Class B, Class C and Institutional Class shares were $0.02 and $0.03 per share for the years ended October 31, 2008 and 2007, respectively. |
| (c) | | Includes adjustments in accordance with accounting principles generally accepted in the United States of America and as such, the net asset value for financial reporting purposes and the returns based upon those net asset values may differ from the net asset value and returns for shareholder transactions. Does not include sales charges and is not annualized for periods less than one year, if applicable. |
| (d) | | Portfolio turnover is calculated at the fund level and is not annualized for periods less than one year, if applicable. |
| (e) | | Ratios are based on average daily net assets (000’s omitted) of $136,286, $19,609, $46,246, $8,868 and $882 for Class A, Class B, Class C, Class Y and Institutional Class shares, respectively. |
| (f) | | Commencement date of October 3, 2008. |
| (g) | | Annualized. |
20 Invesco China Fund
Report of Independent Registered Public Accounting Firm
To the Board of Trustees of AIM Investment Funds (Invesco Investment Funds)
and Shareholders of Invesco China Fund:
In our opinion, the accompanying statement of assets and liabilities, including the schedule of investments, and the related statements of operations and of changes in net assets and the financial highlights present fairly, in all material respects, the financial position of Invesco China Fund (one of the funds constituting AIM Investment Funds (Invesco Investment Funds), hereafter referred to as the “Fund”) at October 31, 2011, the results of its operations for the year then ended, the changes in its net assets for each of the two years in the period then ended and the financial highlights for each of the five years in the period then ended, in conformity with accounting principles generally accepted in the United States of America. These financial statements and financial highlights (hereafter referred to as “financial statements”) are the responsibility of the Fund’s management; our responsibility is to express an opinion on these financial statements based on our audits. We conducted our audits of these financial statements in accordance with the standards of the Public Company Accounting Oversight Board (United States). Those standards require that we plan and perform the audit to obtain reasonable assurance about whether the financial statements are free of material misstatement. An audit includes examining, on a test basis, evidence supporting the amounts and disclosures in the financial statements, assessing the accounting principles used and significant estimates made by management, and evaluating the overall financial statement presentation. We believe that our audits, which included confirmation of securities at October 31, 2011 by correspondence with the custodian and brokers, provide a reasonable basis for our opinion.
PRICEWATERHOUSECOOPERS LLP
Houston, Texas
December 21, 2011
21 Invesco China Fund
Calculating your ongoing Fund expenses
Example
As a shareholder of the Fund, you incur two types of costs: (1) transaction costs, which may include sales charges (loads) on purchase payments or contingent deferred sales charges on redemptions, and redemption fees, if any; and (2) ongoing costs, including management fees, distribution and/or service (12b-1) fees, and other Fund expenses. This example is intended to help you understand your ongoing costs (in dollars) of investing in the Fund and to compare these costs with ongoing costs of investing in other mutual funds. The example is based on an investment of $1,000 invested at the beginning of the period and held for the entire period May 1, 2011 through October 31, 2011.
Actual expenses
The table below provides information about actual account values and actual expenses. You may use the information in this table, together with the amount you invested, to estimate the expenses that you paid over the period. Simply divide your account value by $1,000 (for example, an $8,600 account value divided by $1,000 = 8.6), then multiply the result by the number in the table under the heading entitled “Actual Expenses Paid During Period” to estimate the expenses you paid on your account during this period.
Hypothetical example for comparison purposes
The table below also provides information about hypothetical account values and hypothetical expenses based on the Fund’s actual expense ratio and an assumed rate of return of 5% per year before expenses, which is not the Fund’s actual return.
The hypothetical account values and expenses may not be used to estimate the actual ending account balance or expenses you paid for the period. You may use this information to compare the ongoing costs of investing in the Fund and other funds. To do so, compare this 5% hypothetical example with the 5% hypothetical examples that appear in the shareholder reports of the other funds.
Please note that the expenses shown in the table are meant to highlight your ongoing costs only and do not reflect any transaction costs, such as sales charges (loads) on purchase payments, contingent deferred sales charges on redemptions, and redemption fees, if any. Therefore, the hypothetical information is useful in comparing ongoing costs only, and will not help you determine the relative total costs of owning different funds. In addition, if these transaction costs were included, your costs would have been higher.
| | | | | | | | | | | | | | | | | | | | | | | | | | | | | | | |
| | | | | | | | | | HYPOTHETICAL
| | | |
| | | | | | | | | | (5% annual return before
| | | |
| | | | | | | ACTUAL | | | expenses) | | | |
| | | | | | | | | | Expenses
| | | | | | Expenses
| | | Annualized
|
Share
| | | Beginning
| | | Ending
| | | Paid During
| | | Ending
| | | Paid During
| | | Expense
|
| Class | | | Account Value | | | Account Value | | | Period | | | Account Value | | | Period | | | Ratio |
| Class A | | | $ | 1,000.00 | | | | $ | 784.90 | | | | $ | 7.56 | | | | $ | 1,016.74 | | | | $ | 8.54 | | | | | 1.68 | % |
| | | | | | | | | | | | | | | | | | | | | | | | | | | | | | | |
| Class B | | | | 1,000.00 | | | | | 781.70 | | | | | 10.91 | | | | | 1,012.96 | | | | | 12.33 | | | | | 2.43 | |
| | | | | | | | | | | | | | | | | | | | | | | | | | | | | | | |
| Class C | | | | 1,000.00 | | | | | 782.20 | | | | | 10.92 | | | | | 1,012.96 | | | | | 12.33 | | | | | 2.43 | |
| | | | | | | | | | | | | | | | | | | | | | | | | | | | | | | |
| Class Y | | | | 1,000.00 | | | | | 785.90 | | | | | 6.44 | | | | | 1,018.00 | | | | | 7.27 | | | | | 1.43 | |
| | | | | | | | | | | | | | | | | | | | | | | | | | | | | | | |
| Institutional | | | | 1,000.00 | | | | | 786.90 | | | | | 5.40 | | | | | 1,019.16 | | | | | 6.11 | | | | | 1.20 | |
| | | | | | | | | | | | | | | | | | | | | | | | | | | | | | | |
| |
| 1 | The actual ending account value is based on the actual total return of the Fund for the period May 1, 2011 through October 31, 2011, after actual expenses and will differ from the hypothetical ending account value which is based on the Fund’s expense ratio and a hypothetical annual return of 5% before expenses. |
| 2 | Expenses are equal to the Fund’s annualized expense ratio as indicated above multiplied by the average account value over the period, multiplied by 184/365 to reflect the most recent fiscal half year. |
22 Invesco China Fund
| |
| Approval of Investment Advisory and Sub-Advisory Contracts |
The Board of Trustees (the Board) of AIM Investment Funds (Invesco Investment Funds) is required under the Investment Company Act of 1940, as amended, to approve annually the renewal of the Invesco China Fund (the Fund) investment advisory agreement with Invesco Advisers, Inc. (Invesco Advisers) and the Master Intergroup Sub-Advisory Contract for Mutual Funds (the sub-advisory contracts) with Invesco Asset Management Deutschland GmbH, Invesco Asset Management Limited, Invesco Asset Management (Japan) Limited, Invesco Australia Limited, Invesco Hong Kong Limited, Invesco Senior Secured Management, Inc. and Invesco Canada Ltd. (collectively, the Affiliated Sub-Advisers). During contract renewal meetings held on June 14-15, 2011, the Board as a whole, and the disinterested or “independent” Trustees, who comprise 80% of the Board, voting separately, approved the continuance of the Fund’s investment advisory agreement and the sub-advisory contracts for another year, effective July 1, 2011. In doing so, the Board considered the process that it follows in reviewing and approving the Fund’s investment advisory agreement and sub-advisory contracts and the information that it is provided. The Board determined that the Fund’s investment advisory agreement and the sub-advisory contracts are in the best interests of the Fund and its shareholders and the compensation to Invesco Advisers and the Affiliated Sub-Advisers under the agreements is fair and reasonable.
The Board’s Fund Evaluation Process
The Board’s Investments Committee has established three Sub-Committees, each of which is responsible for overseeing the management of a number of the series portfolios of the funds advised by Invesco Advisers (the Invesco Funds). The Sub-Committees meet throughout the year to review the performance of their assigned funds, including reviewing materials prepared under the direction of the independent Senior Officer, an officer of the Invesco Funds who reports directly to the independent Trustees. Over the course of each year, the Sub-Committees meet with portfolio managers for their assigned Invesco Funds and other members of management to review the performance, investment objective(s), policies, strategies and limitations and investment risks of these funds. The Sub-Committees meet regularly and at designated contract renewal meetings each year to conduct a review of the performance, fees, expenses and other matters related to their assigned Invesco Funds. Each Sub-Committee recommends to the Investments Committee, which in turn recommends to the full Board, whether to approve the continuance of each Invesco Fund’s investment advisory agreement and sub-advisory contracts for another year.
During the contract renewal process, the Trustees receive comparative performance and fee data regarding the Invesco Funds prepared by Invesco Advisers and an independent company, Lipper, Inc. (Lipper). The Trustees also receive an independent written evaluation from the Senior Officer. The Senior Officer’s evaluation is prepared as part of his responsibility to manage the process by which the Invesco Funds’ proposed management fees are negotiated during the annual contract renewal process to ensure they are negotiated in a manner that is at arms’ length and reasonable. The independent Trustees are assisted in their annual evaluation of the Fund’s investment advisory agreement by the Senior Officer and by independent legal counsel. The independent Trustees also discuss the continuance of the investment advisory agreement and sub-advisory contracts in private sessions with the Senior Officer and counsel.
In evaluating the fairness and reasonableness of the Fund’s investment advisory agreement and sub-advisory contracts, the Board considered, among other things, the factors discussed below. The Trustees also considered information provided in connection with fund acquisitions approved by the Trustees to rationalize the Invesco Funds product range following the acquisition of the retail mutual fund business of Morgan Stanley (the Morgan Stanley Transaction). The Trustees recognized that the advisory fees for the Invesco Funds include advisory fees that are the result of years of review and negotiation between the Trustees and Invesco Advisers as well as advisory fees inherited from Morgan Stanley and Van Kampen funds acquired in the Morgan Stanley Transaction. The Trustees’ deliberations and conclusions in a particular year may be based in part on their deliberations and conclusions regarding these same arrangements throughout the year and in prior years. One Trustee may have weighed a particular piece of information differently than another Trustee.
The discussion below serves as the Senior Officer’s independent written evaluation with respect to the Fund’s investment advisory agreement as well as a discussion of the material factors and related conclusions that formed the basis for the Board’s approval of the Fund’s investment advisory agreement and sub-advisory contracts. Unless otherwise stated, this information is current as of June 15, 2011, and may not reflect consideration of factors that became known to the Board after that date, including, for example, changes to the Fund’s performance, advisory fees, expense limitations and/or fee waivers.
Factors and Conclusions and Summary of Independent Written Fee Evaluation
| |
| A. | Nature, Extent and Quality of Services Provided by Invesco Advisers and the Affiliated Sub-Advisers |
The Board reviewed the advisory services provided to the Fund by Invesco Advisers under the Fund’s investment advisory agreement, the performance of Invesco Advisers in providing these services, and the credentials and experience of the officers and employees of Invesco Advisers who provide these services, including the Fund’s portfolio manager or managers, with whom the Board met during the year. The Board’s review of the qualifications of Invesco Advisers to provide advisory services included the Board’s considerations of Invesco Advisers’ performance and investment process oversight, independent credit analysis and investment risk management.
In determining whether to continue the Fund’s investment advisory agreement, the Board considered the prior relationship between Invesco Advisers and the Fund, as well as the Board’s knowledge of Invesco Advisers’ operations, and concluded that it is beneficial to maintain the current relationship, in part, because of such knowledge. The Board also considered services that Invesco Advisers and its affiliates provide to the Invesco Funds such as various back office support functions, equity and fixed income trading operations, internal audit, distribution and legal compliance. The Board concluded that the nature, extent and quality of the services provided to the Fund by Invesco Advisers are appropriate and satisfactory and the advisory services are provided in accordance with the terms of the Fund’s investment advisory agreement.
The Board reviewed the services provided by the Affiliated Sub-Advisers under the sub-advisory contracts and the credentials and experience of the officers and employees of the Affiliated Sub-Advisers who provide these services. The Board noted that the Affiliated Sub-Advisers have offices and personnel that are located in financial centers around the world. As a result, the Affiliated Sub-Advisers can provide research and investment analysis on the markets and economies of various countries in which the Fund invests and make recommendations on securities of companies located in such countries. The Board concluded that the sub-advisory contracts benefit the Fund and its shareholders by permitting Invesco Advisers to use the resources and talents of the Affiliated Sub-Advisers in managing the Fund. The Board concluded that the nature, extent and quality of the services provided by the Affiliated Sub-Advisers are appropriate and satisfactory and in accordance with the terms of the Fund’s sub-advisory contracts.
The Board considered Fund performance as a relevant factor in considering whether to approve the investment advisory agreement as well as the sub-advisory contracts for the Fund, as Invesco Hong Kong Limited currently manages assets of the Fund.
The Board noted that the Fund recently began operations and that only four calendar years of comparative performance data was available. The Board compared the Fund’s performance during the past one and three calendar years to the performance of funds in the Lipper performance universe and against the Lipper China Region Funds Index. The Board noted that performance of Class A shares of the Fund was in the fifth quintile
23 Invesco China Fund
of the performance universe for the one year period and the second quintile for the three year period (the first quintile being the best performing funds and the fifth quintile being the worst performing funds). The Board noted that performance of Class A shares of the Fund was below the performance of the Index for the one and three year periods. Although the independent written evaluation of the Fund’s Senior Officer only considered Fund performance through the most recent calendar year, the Trustees also reviewed more recent Fund performance and this review did not change their conclusions.
| |
| C. | Advisory and Sub-Advisory Fees and Fee Waivers |
The Board compared the Fund’s contractual advisory fee rate to the contractual advisory fee rates of funds in the Fund’s Lipper expense group at a common asset level. The Board noted that the contractual advisory fee rate for Class A shares of the Fund was below the median contractual advisory fee rate of funds in the expense group. The Board also reviewed the methodology used by Lipper in providing expense group information, which includes using audited financial data from the most recent annual report of each fund in the expense group that was publicly available as of the end of the past calendar year and including only one fund per investment adviser. The Board noted that comparative data is as of varying dates, which may affect the comparability of data during times of market volatility.
The Board noted that there were no other domestic mutual funds comparable to the Fund advised by Invesco Advisors. However, the Board compared the Fund’s sub-advisory fee rate to the sub-advisory fee rates of other clients of Invesco Hong Kong Limited with investment strategies comparable to those of the Fund. The Board noted that the Fund’s sub-advisory fee rate was below the rate for one offshore fund sub-advised by Invesco Hong Kong Limited.
The Board also considered the fees charged by Invesco Advisers and the Affiliated Sub-Advisers to other client accounts with investment strategies similar to those of the Fund. The Board noted that Invesco Advisers or the Affiliated Sub-Advisers may charge lower fees to large institutional clients solely for investment management services. Invesco Advisers reviewed with the Board the significantly greater scope of services it provides to the Invesco Funds relative to other client accounts. These additional services include provision of administrative services, officers and office space, oversight of service providers, preparation of annual registration statement updates and financial information and regulatory compliance under the Investment Company Act of 1940, as amended. Invesco Advisers also reviewed generally the higher frequency of shareholder purchases and redemptions in the Invesco Funds relative to the flow of assets for other client accounts. Invesco Advisers advised the Board that advance notice of redemptions is often provided to Invesco Advisers by institutional clients. The Board did note that sub-advisory fees charged by the Affiliated Sub-Advisers to manage the Invesco Funds and to manage other client accounts were often more comparable. The Board concluded that the aggregate services provided to the Invesco Funds were sufficiently different from those provided to institutional clients, and the Board did not place significant weight on these fee comparisons.
The Board noted that Invesco Advisers has contractually agreed to waive fees and/or limit expenses of the Fund through at least February 28, 2012 in an amount necessary to limit total annual operating expenses to a specified percentage of average daily net assets for each class of the Fund. The Board noted that at the current expense ratio for the Fund, this expense waiver does not have any impact.
The Board also considered the services provided by the Affiliated Sub-Advisers pursuant to the sub-advisory contracts, as well as the allocation of fees between Invesco Advisers and the Affiliated Sub-Advisers pursuant to the sub-advisory contracts. The Board noted that Invesco Advisers provides services to sub-advised Invesco Funds, including oversight of the Affiliated Sub-Advisers as well as the additional services described above other than day-to-day portfolio management. The Board also noted that the sub-advisory fees have no direct effect on the Fund or its shareholders, as they are paid by Invesco Advisers to the Affiliated Sub-Advisers.
Based upon the information and considerations described above, the Board concluded that the Fund’s advisory and sub-advisory fees are fair and reasonable.
| |
| D. | Economies of Scale and Breakpoints |
The Board considered the extent to which there are economies of scale in the provision of advisory services to the Fund. The Board also considered whether the Fund benefits from economies of scale through contractual breakpoints in the Fund’s advisory fee schedule. The Board also noted that the Fund shares directly in economies of scale through lower fees charged by third party service providers based on the combined size of the Invesco Funds and other clients advised by Invesco Advisers.
| |
| E. | Profitability and Financial Resources |
The Board reviewed information from Invesco Advisers concerning the costs of the advisory and other services that Invesco Advisers and its affiliates provide to the Fund and the profitability of Invesco Advisers and its affiliates in providing these services. The Board reviewed with Invesco Advisers the methodology used to prepare the profitability information. The Board considered the profitability of Invesco Advisers in connection with managing the Fund and the Invesco Funds. The Board noted that Invesco Advisers continues to operate at a net profit from services Invesco Advisers and its subsidiaries provide to the Fund and the Invesco Funds. The Board concluded that the level of profits realized by Invesco Advisers and its affiliates from providing services to the Fund is not excessive given the nature, quality and extent of the services provided to the Invesco Funds. The Board considered whether Invesco Advisers and each Affiliated Sub-Adviser are financially sound and have the resources necessary to perform their obligations under the investment advisory agreement and sub-advisory contracts. The Board concluded that Invesco Advisers and each Affiliated Sub-Adviser have the financial resources necessary to fulfill these obligations.
| |
| F. | Collateral Benefits to Invesco Advisers and its Affiliates |
The Board considered various other benefits received by Invesco Advisers and its affiliates from the relationship with the Fund, including the fees received for their provision of administrative, transfer agency and distribution services to the Fund. The Board considered the performance of Invesco Advisers and its affiliates in providing these services and the organizational structure employed to provide these services. The Board also considered that these services are provided to the Fund pursuant to written contracts that are reviewed and approved on an annual basis by the Board; that the services are required for the operation of the Fund; that Invesco Advisers and its affiliates can provide services, the nature and quality of which are at least equal to those provided by others offering the same or similar services; and that the fees for such services are fair and reasonable in light of the usual and customary charges by others for services of the same nature and quality.
The Board considered the benefits realized by Invesco Advisers and the Affiliated Sub-Advisers as a result of portfolio brokerage transactions executed through “soft dollar” arrangements. The Board noted that soft dollar arrangements shift the payment obligation for research and execution services from Invesco Advisers and the Affiliated Sub-Advisers to the Invesco Funds and therefore may reduce Invesco Advisers’ and the Affiliated Sub-Advisers’ expenses. The Board concluded that the soft dollar arrangements are appropriate. The Board also concluded that, based on their review and representations made by the Chief Compliance Officer of the Invesco Funds, these arrangements are consistent with regulatory requirements.
The Board considered that the Fund’s uninvested cash and cash collateral from any securities lending arrangements may be invested in money market funds advised by Invesco Advisers pursuant to procedures approved by the Board. The Board noted that Invesco Advisers receives advisory fees from these affiliated money market funds attributable to such investments, although Invesco Advisers has contractually agreed to waive through varying periods the advisory fees payable by the Invesco Funds. The waiver is in an amount equal to 100% of the net advisory fee Invesco Advisers receives from the affiliated money market funds with respect to the Fund’s investment in the affiliated money market funds of uninvested cash, but not cash collateral. The Board concluded that the Fund’s investment of uninvested cash and cash collateral from any securities lending arrangements in the affiliated money market funds is in the best interests of the Fund and its shareholders.
24 Invesco China Fund
Tax Information
Form 1099-DIV, Form 1042-S and other year-end tax information provide shareholders with actual calendar year amounts that should be included in their tax returns. Shareholders should consult their tax advisors.
The following distribution information is being provided as required by the Internal Revenue Code or to meet a specific state’s requirement.
The Fund designates the following amounts or, if subsequently determined to be different, the maximum amount allowable for its fiscal year ended October 31, 2011:
| | | | | |
Federal and State Income Tax | | |
| |
| Qualified Dividend Income* | | | 100% | |
| Corporate Dividends Received Deduction* | | | 0.00% | |
| | |
| | * | The above percentages are based on ordinary income dividends paid to shareholders during the Fund’s fiscal year. |
25 Invesco China Fund
Trustees and Officers
The address of each trustee and officer is AIM Investment Funds (Invesco Investment Funds) (the “Trust”), 11 Greenway Plaza, Suite 2500, Houston, Texas 77046-1173. The trustees serve for the life of the Trust, subject to their earlier death, incapacitation, resignation, retirement or removal as more specifically provided in the Trust’s organizational documents. Each officer serves for a one year term or until their successors are elected and qualified. Column two below includes length of time served with predecessor entities, if any.
| | | | | | | | | |
| | | | | | | Number of
| | |
| | | | | | | Funds in
| | |
| | | | | | | Fund Complex
| | |
Name, Year of Birth and
| | Trustee and/
| | Principal Occupation(s)
| | Overseen by
| | Other Directorship(s)
|
| Position(s) Held with the Trust | | or Officer Since | | During Past 5 Years | | Trustee | | Held by Trustee |
| | | | | | | | | |
| | | | | | | | | |
| Interested Persons | | | | | | | | |
| | | | | | | | | |
| | | | | | | | | |
| | | | | | | | | |
Martin L. Flanagan1 — 1960
Trustee | | 2007 | | Executive Director, Chief Executive Officer and President, Invesco Ltd. (ultimate parent of Invesco and a global investment management firm); Advisor to the Board, Invesco Advisers, Inc. (formerly known as Invesco Institutional (N.A.), Inc.); Trustee, The Invesco Funds; Vice Chair, Investment Company Institute; and Member of Executive Board, SMU Cox School of Business
Formerly: Chairman, Invesco Advisers, Inc. (registered investment adviser); Director, Chairman, Chief Executive Officer and President, IVZ Inc. (holding company), INVESCO Group Services, Inc. (service provider) and Invesco North American Holdings, Inc. (holding company); Director, Chief Executive Officer and President, Invesco Holding Company Limited (parent of Invesco and a global investment management firm); Director, Invesco Ltd.; Chairman, Investment Company Institute and President, Co-Chief Executive Officer, Co-President, Chief Operating Officer and Chief Financial Officer, Franklin Resources, Inc. (global investment management organization) | | 141 | | None |
| | | | | | | | | |
| | | | | | | | | |
| | | | | | | | | |
Philip A. Taylor2 — 1954
Trustee, President and
Principal Executive Officer | | 2006 | | Head of North American Retail and Senior Managing Director, Invesco Ltd.; Director, Co-Chairman, Co-President and Co-Chief Executive Officer, Invesco Advisers, Inc. (formerly known as Invesco Institutional (N.A.), Inc.) (registered investment adviser); Director, Chairman, Chief Executive Officer and President, Invesco Management Group, Inc. (formerly Invesco Aim Management Group, Inc.) (financial services holding company); Director and President, INVESCO Funds Group, Inc. (registered investment adviser and registered transfer agent); Director and Chairman, Invesco Investment Services, Inc. (formerly known as Invesco Aim Investment Services, Inc.) (registered transfer agent) and IVZ Distributors, Inc. (formerly known as INVESCO Distributors, Inc.) (registered broker dealer); Director, President and Chairman, Invesco Inc. (holding company) and Invesco Canada Holdings Inc. (holding company); Chief Executive Officer, Invesco Corporate Class Inc. (corporate mutual fund company) and Invesco Canada Fund Inc. (corporate mutual fund company); Director, Chairman and Chief Executive Officer, Invesco Canada Ltd. (formerly known as Invesco Trimark Ltd./Invesco Trimark Ltèe) (registered investment adviser and registered transfer agent); Trustee, President and Principal Executive Officer, The Invesco Funds (other than AIM Treasurer’s Series Trust (Invesco Treasurer’s Series Trust) and Short-Term Investments Trust); Trustee and Executive Vice President, The Invesco Funds (AIM Treasurer’s Series Trust (Invesco Treasurer’s Series Trust) and Short-Term Investments Trust only); Director, Invesco Investment Advisers LLC (formerly known as Van Kampen Asset Management); Director, Chief Executive Officer and President, Van Kampen Exchange Corp.
Formerly: Director and Chairman, Van Kampen Investor Services Inc.: Director, Chief Executive Officer and President, 1371 Preferred Inc. (holding company); and Van Kampen Investments Inc.; Director and President, AIM GP Canada Inc. (general partner for limited partnerships); and Van Kampen Advisors, Inc.; Director and Chief Executive Officer, Invesco Trimark Dealer Inc. (registered broker dealer); Director, Invesco Distributors, Inc. (formerly known as Invesco Aim Distributors, Inc.) (registered broker dealer); Manager, Invesco PowerShares Capital Management LLC; Director, Chief Executive Officer and President, Invesco Advisers, Inc.; Director, Chairman, Chief Executive Officer and President, Invesco Aim Capital Management, Inc.; President, Invesco Trimark Dealer Inc. and Invesco Trimark Ltd./Invesco Trimark Ltèe; Director and President, AIM Trimark Corporate Class Inc. and AIM Trimark Canada Fund Inc.; Senior Managing Director, Invesco Holding Company Limited; Trustee and Executive Vice President, Tax-Free Investments Trust; Director and Chairman, Fund Management Company (former registered broker dealer); President and Principal Executive Officer, The Invesco Funds (AIM Treasurer’s Series Trust (Invesco Treasurer’s Series Trust), Short-Term Investments Trust and Tax-Free Investments Trust only); President, AIM Trimark Global Fund Inc. and AIM Trimark Canada Fund Inc. | | 141 | | None |
| | | | | | | | | |
| | | | | | | | | |
| | | | | | | | | |
Wayne W. Whalen3 — 1939
Trustee | | 2010 | | Of Counsel, and prior to 2010, partner in the law firm of Skadden, Arps, Slate, Meagher & Flom LLP, legal counsel to funds in the Fund Complex | | 159 | | Director of the Abraham Lincoln Presidential Library Foundation |
| | | | | | | | | |
| | | | | | | | | |
| | | | | | | | | |
| Independent Trustees | | | | | | | | |
| | | | | | | | | |
| | | | | | | | | |
| | | | | | | | | |
Bruce L. Crockett — 1944
Trustee and Chair | | 2001 | | Chairman, Crockett Technology Associates (technology consulting company)
Formerly: Director, Captaris (unified messaging provider); Director, President and Chief Executive Officer COMSAT Corporation; and Chairman, Board of Governors of INTELSAT (international communications company) | | 141 | | ACE Limited (insurance company); and Investment Company Institute |
| | | | | | | | | |
| | | | | | | | | |
| | | | | | | | | |
David C. Arch — 1945
Trustee | | 2010 | | Chairman and Chief Executive Officer of Blistex Inc., a consumer health care products manufacturer. | | 159 | | Member of the Heartland Alliance Advisory Board, a nonprofit organization serving human needs based in Chicago. Board member of the Illinois Manufacturers’ Association. Member of the Board of Visitors, Institute for the Humanities, University of Michigan |
| | | | | | | | | |
| |
| 1 | Mr. Flanagan is considered an interested person of the Trust because he is an officer of the adviser to the Trust, and an officer and a director of Invesco Ltd., ultimate parent of the adviser to the Trust. |
| 2 | Mr. Taylor is considered an interested person of the Trust because he is an officer and a director of the adviser to, and a director of the principal underwriter of, the Trust. |
| 3 | Mr. Whalen has been deemed to be an interested person of the Trust because of his prior service as counsel to the predecessor funds of certain Invesco open-end funds and his affiliation with the law firm that served as counsel to such predecessor funds and continues to serve as counsel to the Invesco Van Kampen closed-end funds. |
T-1 Invesco China Fund
Trustees and Officers—(continued)
The address of each trustee and officer is AIM Investment Funds (Invesco Investment Funds) (the “Trust”), 11 Greenway Plaza, Suite 2500, Houston, Texas 77046-1173. The trustees serve for the life of the Trust, subject to their earlier death, incapacitation, resignation, retirement or removal as more specifically provided in the Trust’s organizational documents. Each officer serves for a one year term or until their successors are elected and qualified. Column two below includes length of time served with predecessor entities, if any.
| | | | | | | | | |
| | | | | | | Number of
| | |
| | | | | | | Funds in
| | |
| | | | | | | Fund Complex
| | |
Name, Year of Birth and
| | Trustee and/
| | Principal Occupation(s)
| | Overseen by
| | Other Directorship(s)
|
| Position(s) Held with the Trust | | or Officer Since | | During Past 5 Years | | Trustee | | Held by Trustee |
| | | | | | | | | |
| | | | | | | | | |
| Independent Trustees—(continued) | | | | | | | | |
| | | | | | | | | |
| | | | | | | | | |
| | | | | | | | | |
Bob R. Baker — 1936
Trustee | | 2003 | | Retired
Formerly: President and Chief Executive Officer, AMC Cancer Research Center; and Chairman and Chief Executive Officer, First Columbia Financial Corporation | | 141 | | None |
| | | | | | | | | |
| | | | | | | | | |
| | | | | | | | | |
Frank S. Bayley — 1939
Trustee | | 1987 | | Retired
Formerly: Director, Badgley Funds, Inc. (registered investment company) (2 portfolios) and Partner, law firm of Baker & McKenzie | | 141 | | Director and Chairman, C.D. Stimson Company (a real estate investment company) |
| | | | | | | | | |
| | | | | | | | | |
| | | | | | | | | |
James T. Bunch — 1942
Trustee | | 2003 | | Founder, Green, Manning & Bunch Ltd. (investment banking firm)
Formerly: Executive Committee, United States Golf Association; and Director, Policy Studies, Inc. and Van Gilder Insurance Corporation | | 141 | | Vice Chairman, Board of Governors, Western Golf Association/Evans Scholars Foundation and Director, Denver Film Society |
| | | | | | | | | |
| | | | | | | | | |
| | | | | | | | | |
Rodney F. Dammeyer — 1940
Trustee | | 2010 | | President of CAC, LLC, a private company offering capital investment and management advisory services.
Formerly: Prior to January 2004, Director of TeleTech Holdings Inc.; Prior to 2002, Director of Arris Group, Inc.; Prior to 2001, Managing Partner at Equity Group Corporate Investments. Prior to 1995, Vice Chairman of Anixter International. Prior to 1985, experience includes Senior Vice President and Chief Financial Officer of Household International, Inc, Executive Vice President and Chief Financial Officer of Northwest Industries, Inc. and Partner of Arthur Andersen & Co. | | 159 | | Director of Quidel Corporation and Stericycle, Inc. Prior to May 2008, Trustee of The Scripps Research Institute. Prior to February 2008, Director of Ventana Medical Systems, Inc. Prior to April 2007, Director of GATX Corporation. Prior to April 2004, Director of TheraSense, Inc. |
| | | | | | | | | |
| | | | | | | | | |
| | | | | | | | | |
Albert R. Dowden — 1941
Trustee | | 2001 | | Director of a number of public and private business corporations, including the Boss Group, Ltd. (private investment and management); Reich & Tang Funds (5 portfolios) (registered investment company); and Homeowners of America Holding Corporation/ Homeowners of America Insurance Company (property casualty company)
Formerly: Director, Continental Energy Services, LLC (oil and gas pipeline service); Director, CompuDyne Corporation (provider of product and services to the public security market) and Director, Annuity and Life Re (Holdings), Ltd. (reinsurance company); Director, President and Chief Executive Officer, Volvo Group North America, Inc.; Senior Vice President, AB Volvo; Director of various public and private corporations; Chairman, DHJ Media, Inc.; Director Magellan Insurance Company; and Director, The Hertz Corporation, Genmar Corporation (boat manufacturer), National Media Corporation; Advisory Board of Rotary Power International (designer, manufacturer, and seller of rotary power engines); and Chairman, Cortland Trust, Inc. (registered investment company) | | 141 | | Board of Nature’s Sunshine Products, Inc. |
| | | | | | | | | |
| | | | | | | | | |
| | | | | | | | | |
Jack M. Fields — 1952
Trustee | | 2001 | | Chief Executive Officer, Twenty First Century Group, Inc. (government affairs company); and Owner and Chief Executive Officer, Dos Angelos Ranch, L.P. (cattle, hunting, corporate entertainment), Discovery Global Education Fund (non-profit) and Cross Timbers Quail Research Ranch (non-profit)
Formerly: Chief Executive Officer, Texana Timber LP (sustainable forestry company) and member of the U.S. House of Representatives | | 141 | | Administaff |
| | | | | | | | | |
| | | | | | | | | |
| | | | | | | | | |
Carl Frischling — 1937
Trustee | | 2001 | | Partner, law firm of Kramer Levin Naftalis and Frankel LLP | | 141 | | Director, Reich & Tang Funds (6 portfolios) |
| | | | | | | | | |
| | | | | | | | | |
| | | | | | | | | |
Prema Mathai-Davis — 1950
Trustee | | 2001 | | Retired
Formerly: Chief Executive Officer, YWCA of the U.S.A. | | 141 | | None |
| | | | | | | | | |
| | | | | | | | | |
| | | | | | | | | |
Larry Soll — 1942
Trustee | | 2003 | | Retired
Formerly, Chairman, Chief Executive Officer and President, Synergen Corp. (a biotechnology company) | | 141 | | None |
| | | | | | | | | |
| | | | | | | | | |
| | | | | | | | | |
Hugo F. Sonnenschein — 1940
Trustee | | 2010 | | President Emeritus and Honorary Trustee of the University of Chicago and the Adam Smith Distinguished Service Professor in the Department of Economics at the University of Chicago. Prior to July 2000, President of the University of Chicago. | | 159 | | Trustee of the University of Rochester and a member of its investment committee. Member of the National Academy of Sciences, the American Philosophical Society and a fellow of the American Academy of Arts and Sciences |
| | | | | | | | | |
| | | | | | | | | |
| | | | | | | | | |
Raymond Stickel, Jr. — 1944
Trustee | | 2005 | | Retired
Formerly: Director, Mainstay VP Series Funds, Inc. (25 portfolios) and Partner, Deloitte & Touche | | 141 | | Director of Long Cove Club Owners’ Association (home owner’s association) |
| | | | | | | | | |
T-2 Invesco China Fund
Trustees and Officers—(continued)
The address of each trustee and officer is AIM Investment Funds (Invesco Investment Funds) (the “Trust”), 11 Greenway Plaza, Suite 2500, Houston, Texas 77046-1173. The trustees serve for the life of the Trust, subject to their earlier death, incapacitation, resignation, retirement or removal as more specifically provided in the Trust’s organizational documents. Each officer serves for a one year term or until their successors are elected and qualified. Column two below includes length of time served with predecessor entities, if any.
| | | | | | | | | |
| | | | | | | Number of
| | |
| | | | | | | Funds in
| | |
| | | | | | | Fund Complex
| | |
Name, Year of Birth and
| | Trustee and/
| | Principal Occupation(s)
| | Overseen by
| | Other Directorship(s)
|
| Position(s) Held with the Trust | | or Officer Since | | During Past 5 Years | | Trustee | | Held by Trustee |
| | | | | | | | | |
| | | | | | | | | |
| Other Officers | | | | | | | | |
| | | | | | | | | |
| | | | | | | | | |
| | | | | | | | | |
Russell C. Burk — 1958
Senior Vice President and Senior Officer | | 2005 | | Senior Vice President and Senior Officer of Invesco Funds | | N/A | | N/A |
| | | | | | | | | |
| | | | | | | | | |
| | | | | | | | | |
John M. Zerr — 1962
Senior Vice President, Chief Legal Officer and Secretary | | 2006 | | Director, Senior Vice President, Secretary and General Counsel, Invesco Management Group, Inc. (formerly known as Invesco Aim Management Group, Inc.) and Van Kampen Exchange Corp.; Senior Vice President, Invesco Advisers, Inc. (formerly known as Invesco Institutional (N.A.), Inc.) (registered investment adviser); Senior Vice President and Secretary, Invesco Distributors, Inc. (formerly known as Invesco Aim Distributors, Inc.); Director, Vice President and Secretary, Invesco Investment Services, Inc. (formerly known as Invesco Aim Investment Services, Inc.) and IVZ Distributors, Inc. (formerly known as INVESCO Distributors, Inc.); Director and Vice President, INVESCO Funds Group, Inc.; Senior Vice President, Chief Legal Officer and Secretary, The Invesco Funds; Manager, Invesco PowerShares Capital Management LLC; Director, Secretary and General Counsel, Invesco Investment Advisers LLC (formerly known as Van Kampen Asset Management); Secretary and General Counsel, Van Kampen Funds Inc. and Chief Legal Officer, PowerShares Exchange-Traded Fund Trust, PowerShares Exchange-Traded Fund Trust II, PowerShares India Exchange-Traded Fund Trust and PowerShares Actively Managed Exchange-Traded Fund Trust
Formerly: Director and Secretary, Van Kampen Advisors Inc.; Director Vice President, Secretary and General Counsel Van Kampen Investor Services Inc.; Director, Invesco Distributors, Inc. (formerly known as Invesco Aim Distributors, Inc.); Director, Senior Vice President, General Counsel and Secretary, Invesco Advisers, Inc.; and Van Kampen Investments Inc.; Director, Vice President and Secretary, Fund Management Company; Director, Senior Vice President, Secretary, General Counsel and Vice President, Invesco Aim Capital Management, Inc.; Chief Operating Officer and General Counsel, Liberty Ridge Capital, Inc. (an investment adviser); Vice President and Secretary, PBHG Funds (an investment company) and PBHG Insurance Series Fund (an investment company); Chief Operating Officer, General Counsel and Secretary, Old Mutual Investment Partners (a broker-dealer); General Counsel and Secretary, Old Mutual Fund Services (an administrator) and Old Mutual Shareholder Services (a shareholder servicing center); Executive Vice President, General Counsel and Secretary, Old Mutual Capital, Inc. (an investment adviser); and Vice President and Secretary, Old Mutual Advisors Funds (an investment company) | | N/A | | N/A |
| | | | | | | | | |
| | | | | | | | | |
| | | | | | | | | |
Lisa O. Brinkley — 1959
Vice President | | 2004 | | Global Compliance Director, Invesco Ltd.; Chief Compliance Officer, Invesco Investment Services, Inc.(formerly known as Invesco Aim Investment Services, Inc.); and Vice President, The Invesco Funds
Formerly: Chief Compliance Officer, Invesco Distributors, Inc. (formerly known as Invesco Aim Distributors, Inc.) and Van Kampen Investor Services Inc.; Senior Vice President, Invesco Management Group, Inc.; Senior Vice President and Chief Compliance Officer, Invesco Advisers, Inc. and The Invesco Funds; Vice President and Chief Compliance Officer, Invesco Aim Capital Management, Inc. and Invesco Distributors, Inc.; Vice President, Invesco Investment Services, Inc. and Fund Management Company | | N/A | | N/A |
| | | | | | | | | |
| | | | | | | | | |
| | | | | | | | | |
Sheri Morris — 1964
Vice President, Treasurer and Principal Financial Officer | | 1999 | | Vice President, Treasurer and Principal Financial Officer, The Invesco Funds; and Vice President, Invesco Advisers, Inc. (formerly known as Invesco Institutional (N.A.), Inc.) (registered investment adviser).
Formerly: Treasurer, PowerShares Exchange-Traded Fund Trust, PowerShares Exchange--Traded Fund Trust II, PowerShares India Exchange-Traded Fund Trust and PowerShares Actively Managed Exchange-Traded Fund Trust; Vice President, Invesco Advisers, Inc., Invesco Aim Capital Management, Inc. and Invesco Aim Private Asset Management, Inc.; Assistant Vice President and Assistant Treasurer, The Invesco Funds and Assistant Vice President, Invesco Advisers, Inc., Invesco Aim Capital Management, Inc. and Invesco Aim Private Asset Management, Inc. | | N/A | | N/A |
| | | | | | | | | |
| | | | | | | | | |
| | | | | | | | | |
Karen Dunn Kelley — 1960
Vice President | | 2004 | | Head of Invesco’s World Wide Fixed Income and Cash Management Group; Senior Vice President, Invesco Advisers, Inc. (formerly known as Invesco Institutional (N.A.), Inc.) (registered investment adviser); Executive Vice President, Invesco Distributors, Inc. (formerly known as Invesco Aim Distributors, Inc.); Senior Vice President, Invesco Management Group, Inc. (formerly known as Invesco Aim Management Group, Inc.); and Director, Invesco Mortgage Capital Inc.; Vice President, The Invesco Funds (other than AIM Treasurer’s Series Trust (Invesco Treasurer’s Series Trust) and Short-Term Investments Trust); President and Principal Executive Officer, The Invesco Funds (AIM Treasurer’s Series Trust (Invesco Treasurer’s Series Trust) and Short-Term Investments Trust only).
Formerly: Senior Vice President, Van Kampen Investments Inc.; Vice President, Invesco Advisers, Inc. (formerly known as Invesco Institutional (N.A.), Inc.); Director of Cash Management and Senior Vice President, Invesco Advisers, Inc. and Invesco Aim Capital Management, Inc.; President and Principal Executive Officer, Tax-Free Investments Trust; Director and President, Fund Management Company; Chief Cash Management Officer, Director of Cash Management, Senior Vice President, and Managing Director, Invesco Aim Capital Management, Inc.; Director of Cash Management, Senior Vice President, and Vice President, Invesco Advisers, Inc. and The Invesco Funds (AIM Treasurer’s Series Trust (Invesco Treasurer’s Series Trust), Short-Term Investments Trust and Tax-Free Investments Trust only) | | N/A | | N/A |
| | | | | | | | | |
T-3 Invesco China Fund
Trustees and Officers—(continued)
The address of each trustee and officer is AIM Investment Funds (Invesco Investment Funds) (the “Trust”), 11 Greenway Plaza, Suite 2500, Houston, Texas 77046-1173. The trustees serve for the life of the Trust, subject to their earlier death, incapacitation, resignation, retirement or removal as more specifically provided in the Trust’s organizational documents. Each officer serves for a one year term or until their successors are elected and qualified. Column two below includes length of time served with predecessor entities, if any.
| | | | | | | | | |
| | | | | | | Number of
| | |
| | | | | | | Funds in
| | |
| | | | | | | Fund Complex
| | |
Name, Year of Birth and
| | Trustee and/
| | Principal Occupation(s)
| | Overseen by
| | Other Directorship(s)
|
| Position(s) Held with the Trust | | or Officer Since | | During Past 5 Years | | Trustee | | Held by Trustee |
| | | | | | | | | |
| | | | | | | | | |
| Other Officers—(continued) | | | | | | | | |
| | | | | | | | | |
| | | | | | | | | |
| | | | | | | | | |
Lance A. Rejsek — 1967
Anti-Money Laundering Compliance Officer | | 2005 | | Anti-Money Laundering Compliance Officer, Invesco Advisers, Inc. (formerly known as Invesco Institutional (N.A.), Inc.) (registered investment adviser); Invesco Distributors, Inc. (formerly known as Invesco Aim Distributors, Inc.), Invesco Investment Services, Inc. (formerly known as Invesco Aim Investment Services, Inc.), The Invesco Funds, PowerShares Exchange-Traded Fund Trust, PowerShares Exchange-Traded Fund Trust II, PowerShares India Exchange-Traded Fund Trust, PowerShares Actively Managed Exchange-Traded Fund Trust, Invesco Investment Advisers LLC (formerly known as Van Kampen Asset Management) and Van Kampen Funds Inc.
Formerly: Anti-Money Laundering Compliance Officer, Van Kampen Investor Services Inc., Fund Management Company, Invesco Advisers, Inc., Invesco Aim Capital Management, Inc. and Invesco Aim Private Asset Management, Inc. | | N/A | | N/A |
| | | | | | | | | |
| | | | | | | | | |
| | | | | | | | | |
Todd L. Spillane — 1958
Chief Compliance Officer | | 2006 | | Senior Vice President, Invesco Management Group, Inc. (formerly known as Invesco Aim Management Group, Inc.) and Van Kampen Exchange Corp.; Senior Vice President and Chief Compliance Officer, Invesco Advisers, Inc. (registered investment adviser) (formerly known as Invesco Institutional (N.A.), Inc.); Chief Compliance Officer, The Invesco Funds, PowerShares Exchange-Traded Fund Trust, PowerShares Exchange-Traded Fund Trust II, PowerShares India Exchange-Traded Fund Trust, PowerShares Actively Managed Exchange-Traded Fund Trust, INVESCO Private Capital Investments, Inc. (holding company) and Invesco Private Capital, Inc. (registered investment adviser); Vice President, Invesco Distributors, Inc. (formerly known as Invesco Aim Distributors, Inc.) and Invesco Investment Services, Inc. (formerly known as Invesco Aim Investment Services, Inc.).
Formerly: Chief Compliance Officer, Invesco Van Kampen Closed-End Funds; Senior Vice President, Van Kampen Investments Inc.; Senior Vice President and Chief Compliance Officer, Invesco Advisers, Inc. and Invesco Aim Capital Management, Inc.; Chief Compliance Officer, Invesco Global Asset Management (N.A.), Inc., Invesco Senior Secured Management, Inc. (registered investment adviser) and Van Kampen Investor Services Inc.; Vice President, Invesco Aim Capital Management, Inc. and Fund Management Company | | N/A | | N/A |
| | | | | | | | | |
The Statement of Additional Information of the Trust includes additional information about the Fund’s Trustees and is available upon request, without charge, by calling 1.800.959.4246. Please refer to the Fund’s prospectus for information on the Fund’s sub-advisers.
| | | | | | | |
Office of the Fund
11 Greenway Plaza, Suite 2500
Houston, TX 77046-1173 | | Investment Adviser
Invesco Advisers, Inc.
1555 Peachtree Street, N.E.
Atlanta, GA 30309 | | Distributor
Invesco Distributors, Inc.
11 Greenway Plaza, Suite 2500
Houston, TX 77046-1173 | | Auditors
PricewaterhouseCoopers LLP
1201 Louisiana Street, Suite 2900 Houston, TX 77002-5678 |
| | | | | | | |
| | | | | | | |
Counsel to the Fund
Stradley Ronon Stevens & Young, LLP
2600 One Commerce Square Philadelphia, PA 19103 | | Counsel to the Independent Trustees
Kramer, Levin, Naftalis & Frankel LLP 1177 Avenue of the Americas
New York, NY 10036-2714 | | Transfer Agent
Invesco Investment Services, Inc. 11 Greenway Plaza, Suite 2500 Houston, TX 77046-1173 | | Custodian
State Street Bank and Trust Company
225 Franklin
Boston, MA 02110-2801 |
T-4 Invesco China Fund
Invesco mailing information
Send general correspondence to Invesco Investment Services, Inc., P.O. Box 219078, Kansas City, MO 64121-9078.
Invesco privacy policy
You share personal and financial information with us that is necessary for your transactions and your account records. We take very seriously the obligation to keep that information confidential and private.
Invesco collects nonpublic personal information about you from account applications or other forms you complete and from your transactions with us or our affiliates. We do not disclose information about you or our former customers to service providers or other third parties except to the extent necessary to service your account and in other limited circumstances as permitted by law. For example, we use this information to facilitate the delivery of transaction confirmations, financial reports, prospectuses and tax forms.
Even within Invesco, only people involved in the servicing of your accounts and compliance monitoring have access to your information. To ensure the highest level of confidentiality and security, Invesco maintains physical, electronic and procedural safeguards that meet or exceed federal standards. Special measures, such as data encryption and authentication, apply to your communications with us on our website. More detail is available to you at invesco.com/privacy.
Important notice regarding delivery of security holder documents
To reduce Fund expenses, only one copy of most shareholder documents may be mailed to shareholders with multiple accounts at the same address (Householding). Mailing of your shareholder documents may be householded indefinitely unless you instruct us otherwise. If you do not want the mailing of these documents to be combined with those for other members of your household, please contact Invesco Investment Services, Inc. at 800 959 4246 or contact your financial institution. We will begin sending you individual copies for each account within 30 days after receiving your request.
Fund holdings and proxy voting information
The Fund provides a complete list of its holdings four times in each fiscal year, at the quarter-ends. For the second and fourth quarters, the lists appear in the Fund’s semiannual and annual reports to shareholders. For the first and third quarters, the Fund files the lists with the Securities and Exchange Commission (SEC) on Form N-Q. The most recent list of portfolio holdings is available at invesco.com/completeqtrholdings. Shareholders can also look up the Fund’s Forms N-Q on the SEC website at sec.gov. Copies of the Fund’s Forms N-Q may be reviewed and copied at the SEC Public Reference Room in Washington, D.C. You can obtain information on the operation of the Public Reference Room, including information about duplicating fee charges, by calling 202 551 8090 or 800 732 0330, or by electronic request at the following email address: publicinfo@sec.gov. The SEC file numbers for the Fund are 811-05426 and 033-19338.
A description of the policies and procedures that the Fund uses to determine how to vote proxies relating to portfolio securities is available without charge, upon request, from our Client Services department at 800 959 4246 or at invesco.com/proxyguidelines. The information is also available on the SEC website, sec.gov.
Information regarding how the Fund voted proxies related to its portfolio securities during the 12 months ended June 30, 2011, is available at invesco.com/proxysearch. The information is also available on the SEC website, sec.gov.
Invesco Advisers, Inc. is an investment adviser; it provides investment advisory services to individual and institutional clients and does not sell securities. Invesco Distributors, Inc. is the U.S. distributor for Invesco Ltd.’s retail mutual funds, exchange-traded funds and institutional money market funds. Both are wholly owned, indirect subsidiaries of Invesco Ltd.
| | | | | |
|
| | | CHI-AR-1 | | Invesco Distributors, Inc. |
| | |
| Annual Report to Shareholders | | October 31, 2011 |
Invesco Commodities Strategy Fund
Nasdaq:
A: COAAX n B: COAHX n C: COACX n R: COARX n Y: COAIX n Institutional: COAJX
| | | |
|
| |
| 2 | | Letters to Shareholders |
| 4 | | Performance Summary |
| 4 | | Management Discussion |
| 6 | | Long-Term Fund Performance |
| 8 | | Supplemental Information |
| 9 | | Consolidated Schedule of Investments |
| 11 | | Consolidated Financial Statements |
| 13 | | Notes to Consolidated Financial Statements |
| 22 | | Consolidated Financial Highlights |
| 23 | | Auditor’s Report |
| 24 | | Fund Expenses |
| 25 | | Approval of Investment Advisory and Sub-Advisory Agreements |
| T-1 | | Trustees and Officers |
Letters to Shareholders

Philip Taylor
Dear Shareholders:
Enclosed is important information about your Fund and its performance. I encourage you to read this report to learn more about your Fund’s short- and long-term performance and its holdings as of the close of the reporting period. This report also includes useful information about your Fund’s management team and a discussion of how your Fund was managed during the reporting period.
Investors are likely to confront both opportunities and challenges in 2012 – just as we did in 2011. After all, changes in market sentiment never do investors the courtesy of announcing their impending arrival, and your goals and needs may have changed, requiring changes in your financial strategy.
That’s why the start of a new year is always a good time to catch up with your financial adviser. He or she can explain how your investments performed in the year just ended – how each performed individually, and more important, how they performed as a diversified portfolio. Of course, it’s important to remember that an investment’s long-term performance is more important than its short-term performance. Looking ahead to the new year and evaluating your individual situation, your financial adviser can provide valuable insight into whether your investments are still appropriate for your individual needs, goals and risk tolerance.
For current information about your Fund
In addition to meeting with your financial adviser to discuss your individual situation at the start of the new year, you also may find it helpful to stay abreast of market trends and developments. Doing so may provide reassurance in times of economic uncertainty and market volatility such as we saw in 2011 – and are likely to see again in 2012.
Invesco can help you stay informed about your investments and market trends. On our website, invesco.com/us, we provide timely market updates and commentary from many of our fund managers and other investment professionals. Also on our website, you can obtain information about your account at any hour of the day or night. I invite you to visit and explore the tools and information we offer at invesco.com/us.
Our commitment to investment excellence
As we’ve seen over the last several years, market conditions can change – often suddenly and dramatically. That’s one reason financial advisers typically advise their clients to be well diversified and to maintain a long-term investment focus. While diversification can’t guarantee a profit or protect against loss, it may cushion the impact of dramatic market moves. Maintaining a long-term investment focus for your long-term goals – financing your retirement or your children’s education, for example – may help you avoid making rash investment decisions based on short-term market swings.
Likewise, Invesco’s investment professionals maintain a long-term focus. Across our broad array of investment products, investment excellence is our ultimate goal. Each of our funds is managed by specialized teams of investment professionals, and as a company, we maintain a single focus – investment management – that allows our fund managers to concentrate on doing what they do best: managing your money.
Our funds are managed strictly according to their stated investment objectives and strategies, with robust risk oversight using consistent, repeatable investment processes that don’t change in response to short-term market events. This disciplined approach can’t guarantee a profit; no investment can do that, since all involve some measure of risk. But it can ensure that your money is managed the way we said it would be – according to your Fund’s objective and strategies.
Our adherence to stated investment objectives and strategies allows your financial adviser to build a diversified portfolio that meets your individual risk tolerance and financial goals. It also means that when your goals change, your financial adviser will be able to find an Invesco fund that’s appropriate for your needs.
Questions?
If you have questions about your account, please contact one of our client service representatives at 800 959 4246. If you have a general Invesco-related question or comment for me, I invite you to email me directly at phil@invesco.com.
All of us at Invesco look forward to serving your investment management needs for many years to come. Thank you for investing with us.
Sincerely,
Philip Taylor
Senior Managing Director, Invesco Ltd.
2 Invesco Commodities Strategy Fund

Bruce Crockett
Dear Fellow Shareholders:
Although the world’s economies are gradually recovering from the financial crisis, it has not been a smooth path. Unrest in the Middle East, persistently weak job and housing markets in the U.S. and continued government balance sheet repair in Europe are contributing to a slow, labored march toward global recovery.
In this environment, investors face risks that could make it more difficult to achieve their long-term financial goals – a secure retirement, home ownership, a child’s college education. Although the markets are complex and dynamic, there are ways to simplify the process and potentially increase your odds of achieving your goals. The best approach is to create a solid financial plan that helps you save and invest in ways that anticipate your needs over the long term.
Your financial adviser can help you define your financial plan, develop an appropriate investment strategy and put you in a better position to achieve your financial goals over the long term. This can take some of the guesswork out of the process and help you make thoughtful investments. Your financial adviser also can help you better understand your tolerance for risk, so that your investment approach lets you sleep at night while getting you closer to your goals. Lastly, your financial adviser can develop an asset allocation strategy that seeks to balance your investment approach, providing some protection against a decline in the markets while allowing you to participate in rising markets. Invesco calls this type of approach “intentional investing.” It means thinking carefully, planning thoughtfully and acting deliberately.
While no investment can guarantee favorable returns, your Board remains committed to managing costs and enhancing the performance of Invesco’s funds as part of our Investor First orientation. We continue to oversee the funds with the same strong sense of responsibility for your money and your continued trust that we’ve always maintained.
Thanks to the approval of our fund shareholders, Invesco has made great progress in realigning our U.S. mutual fund product line following our acquisition of Morgan Stanley’s retail asset management business, including Van Kampen Investments. When completed, the realignment will reduce overlap in the product lineup, enhance efficiency across our product line and build a solid foundation for further growth to meet client and shareholder needs. I would like to thank those of you who voted your proxy, and I hope our shareholders haven’t been too inconvenienced by the process.
As always, please contact me at bruce@brucecrockett.com with any questions or concerns you may have. On behalf of your Board, we look forward to continuing to represent your interests and serving your needs.
Sincerely,
Bruce L. Crockett
Independent Chair
Invesco Funds Board of Trustees
3 Invesco Commodities Strategy Fund
Management’s Discussion of Fund Performance
Performance summary
Please note that the Fund’s fiscal year-end has changed from July 31 to October 31; therefore, the period covered by this report is from July 31, 2011, the date of the last annual report, through October 31, 2011, the Fund’s new fiscal year-end.
For the three months ended October 31, 2011, Class A shares of Invesco Commodities Strategy Fund, at net asset value, returned -8.54% and slightly underperformed the Dow Jones-UBS Commodity Total Return Index, the Fund’s broad market/ style-specific benchmark. Weaknesses within the industrial metals, energy and agriculture commodity sectors were the main detractors from absolute and relative performance. Most of the Fund’s underperformance occurred in September, when agricultural commodities and industrial metals suffered deep declines.
Your Fund’s long-term performance appears later in this report.
Fund vs. Indexes
Cumulative total returns, 7/31/11 to 10/31/11, at net asset value (NAV). Performance shown does not include applicable contingent deferred sales charges (CDSC) or front-end sales charges, which would have reduced performance.
| | | | | |
|
| Class A Shares | | | -8.54 | % |
| |
| Class B Shares | | | -8.70 | |
| |
| Class C Shares | | | -8.69 | |
| |
| Class R Shares | | | -8.62 | |
| |
| Class Y Shares | | | -8.45 | |
| |
| Institutional Class Shares | | | -8.47 | |
| |
Dow Jones-UBS Commodity Total Return Index▼
(Broad Market/Style-Specific Index) | | | -8.18 | |
| |
How we invest
The Fund, under normal circumstances, uses an index-based investment process in an effort to provide the returns of the Dow Jones-UBS Commodity Total Return Index through the use of commodity-linked notes, commodity total return swaps, commodity futures and money market instruments. Additionally, the Fund employs an actively managed, quantitative investment approach that seeks to generate incremental return (alpha) above the Dow Jones-UBS Commodity Total Return Index. The Fund will seek to gain exposure to the commodity markets primarily through investments in Invesco Cayman Commodity Fund II Ltd. (the “Subsidiary”), a wholly-owned subsidiary of the Fund organized under the laws of the Cayman Islands. Relative to
Portfolio Composition
By commodity sector
| | | | | |
|
| Energy | | | 31.6 | % |
| |
| Agriculture | | | 29.7 | |
| |
| Precious Metals | | | 21.9 | |
| |
| Industrial Metals | | | 16.8 | |
| | | | | |
| Total Net Assets | | $90.8 million |
| Total Number of Holdings* | | | 5 | |
The Fund’s holdings are subject to change, and there is no assurance that the Fund will continue to hold any particular security.
*Excluding U.S. Treasury and money market fund holdings.
index-based commodity funds that are passively managed, the Fund seeks to provide greater capital loss protection during down markets using our active three-step investment process. This process is designed to balance the risk among the main commodity sectors such that no one sector drives the portfolio’s performance.
The first step involves asset selection. We select representative commodity assets to gain exposure to each of the following commodity sectors: agriculture, energy, industrial metals and precious metals. Our selection process (1) evaluates a particular asset’s performance among other assets within a commodity sector and how the asset has performed during different market cycles; (2) screens the identified commodity assets to meet minimum liquidity criteria; and (3) reviews the expected correlation among the selected commodity assets and the expected risk for each commodity asset to determine whether the selected commodity assets are likely to improve the expected risk-adjusted return of the Fund.
The second step involves portfolio construction. Proprietary estimates for risk and correlation are used to create a potential portfolio of investments for the Fund. We re-estimate the risk, contributed by each commodity asset, and rebalance
the portfolio monthly or when new commodity assets are introduced to the Fund.
The final step involves active positioning. We actively adjust commodity positions to reflect the near-term market environment, while remaining consistent with the balanced-risk long-term portfolio structure described above. We balance these two competing ideas – opportunity for excess return from active positioning and the need to maintain commodity asset class exposure set forth in the balanced-risk portfolio structure – by setting controlled tactical ranges around the long-term commodity asset allocation. The resulting commodity asset allocation is then implemented by purchasing or selling derivatives, other commodity-linked instruments, exchange-traded funds, cash and cash equivalent instruments, including affiliated money market funds. By using derivatives, the Fund is potentially able to gain greater exposure to commodity assets within each commodity sector than would be possible using cash instruments, and is able to balance the amount of risk each commodity asset contributes to the Fund.
When executing the investment process described above, we may purchase commodity-linked derivative instruments, such as futures and/or swap contracts on different types of commodity assets. We purchase these commodity-linked derivatives to obtain both long and short positions to actively balance the risk associated with different types of commodity assets and sectors. When taking a long position, we generally believe that the price of the referenced commodity will go up. When taking a short position, we generally believe that the price of the referenced commodity will go down.
Market conditions and your Fund
The beginning of the reporting period was marked by the continuing volatility of risky assets as global equities and most commodities experienced meaningful weakness. Several equity markets posted losses and economically sensitive commodities like crude oil and copper were especially hard hit. Of particular interest was the behavior of Hong Kong equities and copper which are often viewed as bellwethers for the health of the global economy. Tactical overweights to copper and soy meal hindered Fund performance during this time.
4 Invesco Commodities Strategy Fund
Commodities rebounded sharply by the close of the reporting period, helped by expectations for continued accommodative monetary policy as a result of the implementation of the European Financial Stability Facility, which is intended to safeguard financial stability in Europe by providing financial assistance to European nations. The Fund’s exposure to energy and industrial metals – especially crude oil and copper – was the largest contributor to returns during October, limiting losses for the reporting period.
Please note that the Fund’s strategy is principally implemented with derivative instruments which include futures and total return swaps. Derivatives can be a more liquid and cost-effective way to gain exposure to asset classes. Additionally, the leverage used in the strategy is inherent in these instruments.
Thank you for your continued commitment to Invesco Commodities Strategy Fund.
The views and opinions expressed in management’s discussion of Fund performance are those of Invesco Advisers, Inc. These views and opinions are subject to change at any time based on factors such as market and economic conditions. These views and opinions may not be relied upon as investment advice or recommendations, or as an offer for a particular security. The information is not a complete analysis of every aspect of any market, country, industry, security or the Fund. Statements of fact are from sources considered reliable, but Invesco Advisers, Inc. makes no representation or warranty as to their completeness or accuracy. Although historical performance is no guarantee of future results, these insights may help you understand our investment management philosophy.
See important Fund and, if applicable, index disclosures later in this report.
Scott Wolle
Chartered Financial Analyst, portfolio manager, is manager of Invesco Commodities Strategy Fund. He is chief investment officer of Invesco Global Asset Allocation. Mr. Wolle began his investment career in 1991 and joined Invesco in 1999. Mr. Wolle earned a B.S. from Virginia Polytechnic Institute and State University, graduating magna cum laude. He earned an M.B.A. from the Fuqua School of Business at Duke University, where he earned the distinction of Fuqua Scholar.
Mark Ahnrud
Chartered Financial Analyst, portfolio manager, is manager of Invesco Commodities Strategy Fund. He began his investment career in 1985 and joined Invesco in 2000. Mr. Ahnrud earned a B.S. in finance and investments from Babson College and an M.B.A. from the Fuqua School of Business at Duke University with a concentration in finance and real estate.
Chris Devine
Chartered Financial Analyst, portfolio manager, is manager of Invesco Commodities Strategy Fund. He began his investment career in 1996 and joined Invesco in 1998. Mr. Devine earned a B.A. from Wake Forest University and an M.B.A. from the University of Georgia.
Scott Hixon
Chartered Financial Analyst, portfolio manager, is manager of Invesco Commodities Strategy Fund. He began his investment career in 1992 and joined Invesco in 1994. Mr. Hixon earned a B.B.A. in finance and graduated magna cum laude from Georgia Southern University. He earned an M.B.A. in finance from Georgia State University.
Christian Ulrich
Chartered Financial Analyst, portfolio manager, is manager of Invesco Commodities Strategy Fund. He began his investment career in 1987 and joined Invesco in 2000. Mr. Ulrich earned the equivalent of a B.B.A. from the KV Zurich Business School in Zurich, Switzerland.
Assisted by the Global Asset
Allocation Team
5 Invesco Commodities Strategy Fund
Your Fund’s Long-Term Performance
Results of a $10,000 Investment – Oldest Share Classes Since Inception
Fund and index data from 4/30/08
Past performance cannot guarantee comparable future results.
The data shown in the chart include reinvested distributions, applicable sales charges and Fund expenses including
management fees. Index results include reinvested dividends, but they do not reflect sales charges. Performance of the peer group, if applicable, reflects fund expenses and management fees;
performance of a market index does not. Performance shown in the chart and table(s) does not reflect deduction of taxes a shareholder would pay on Fund distributions or sale of Fund shares.
6 Invesco Commodities Strategy Fund
Average Annual Total Returns
As of 10/31/11, including maximum applicable sales
charges
| | | | | |
|
Class A Shares | | | | |
| |
| Inception (4/30/08) | | | -10.84 | % |
| |
| 1 Year | | | -3.60 | |
| |
| |
Class B Shares | | | | |
| |
| Inception (2/5/10) | | | 7.04 | % |
| |
| 1 Year | | | -3.77 | |
| |
| |
Class C Shares | | | | |
| |
| Inception (4/30/08) | | | -10.07 | % |
| |
| 1 Year | | | 0.35 | |
| |
| |
Class R Shares | | | | |
| |
| Inception (4/30/08) | | | -9.63 | % |
| |
| 1 Year | | | 1.80 | |
| |
| |
Class Y Shares | | | | |
| |
| Inception (4/30/08) | | | -9.16 | % |
| |
| 1 Year | | | 2.27 | |
| |
| |
Institutional Class Shares | | | | |
| |
| Inception | | | -9.24 | % |
| |
| 1 Year | | | 2.40 | |
Effective June 1, 2010, Class A, Class B, Class C, Class I and Class R shares of the predecessor fund, Morgan Stanley Commodities Alpha Fund, advised by Morgan Stanley Investment Advisors Inc. were reorganized into Class A, Class B, Class C, Class Y and Class R shares, respectively, of Invesco Commodities Strategy Fund. Returns shown above for Class A, Class B, Class C, Class R and Class Y shares are blended returns of the predecessor fund and Invesco Commodities Strategy Fund. Share class returns will differ from the predecessor fund because of different expenses.
Average Annual Total Returns
As of 9/30/11, the most recent calendar quarter-end,
including maximum applicable sales charges
| | | | | |
|
Class A Shares | | | | |
| |
| Inception (4/30/08) | | | -12.90 | % |
| |
| 1 Year | | | -5.70 | |
| |
| |
Class B Shares | | | | |
| |
| Inception (2/5/10) | | | 2.81 | % |
| |
| 1 Year | | | -5.78 | |
| |
| |
Class C Shares | | | | |
| |
| Inception (4/30/08) | | | -12.12 | % |
| |
| 1 Year | | | -1.78 | |
| |
| |
Class R Shares | | | | |
| |
| Inception (4/30/08) | | | -11.68 | % |
| |
| 1 Year | | | -0.40 | |
| |
| |
Class Y Shares | | | | |
| |
| Inception (4/30/08) | | | -11.23 | % |
| |
| 1 Year | | | 0.04 | |
| |
| |
Institutional Class Shares | | | | |
| |
| Inception | | | -11.30 | % |
| |
| 1 Year | | | 0.19 | |
Institutional Class shares incepted on June 1, 2010. Performance shown prior to that date is that of the predecessor fund’s Class A shares and includes the 12b-1 fees applicable to Class A shares. Class A shares performance reflects any applicable fee waivers or expense reimbursements.
The performance data quoted represent past performance and cannot guarantee comparable future results; current performance may be lower or higher. Please visit invesco.com/performance for the most recent month-end performance. Performance figures reflect
reinvested distributions, changes in net asset value and the effect of the maximum sales charge unless otherwise stated. Investment return and principal value will fluctuate so that you may have a gain or loss when you sell shares.
The total annual Fund operating expense ratio set forth in the most recent Fund prospectus as of the date of this report for Class A, Class B, Class C, Class R, Class Y and Institutional Class shares was 1.21%, 1.96%, 1.96%, 1.46%, 0.96% and 0.86%, respectively. The expense ratios presented above may vary from the expense ratios presented in other sections of this report that are based on expenses incurred during the period covered by this report.
Class A share performance reflects the maximum 5.50% sales charge, and Class B and Class C share performance reflects the applicable contingent deferred sales charge (CDSC) for the period involved. The CDSC on Class B shares declines from 5% beginning at the time of purchase to 0% at the beginning of the seventh year. The CDSC on Class C shares is 1% for the first year after purchase. Class R, Class Y and Institutional Class shares do not have a front-end sales charge or a CDSC; therefore, performance is at net asset value.
The performance of the Fund’s share classes will differ primarily due to different sales charge structures and class expenses.
Had the adviser not waived fees and/ or expenses in the past, performance would have been lower.
continued from page 8
| n | | U.S. government obligations risk. The Fund may invest in obligations issued by U.S. government agencies and instrumentalities that may receive varying levels of support from the government, which could affect the Fund’s ability to recover should they default. |
| |
| n | | Leverage Risk. Leverage exists when the Fund purchases or sells an instrument or enters into a transaction without investing cash in an amount equal to the full economic exposure of the instrument or transaction and the Fund could lose more than it invested. Leverage created from borrowing or certain types of transactions or instruments, including derivatives, may impair the Fund’s liquidity, cause it to liquidate positions at an unfavorable time, increase volatility or otherwise not achieve its intended objective. |
About indexes used in this report
| n | | The Dow Jones-UBS Commodity Total Return Index is an unmanaged index designed to be a highly liquid and diversified benchmark for the commodity futures market. |
| |
| n | | A direct investment cannot be made in an index. Unless otherwise indicated, index results include reinvested dividends, and they do not reflect sales charges. Performance of the peer group, if applicable, reflects fund expenses; performance of a market index does not. |
Other information
| n | | The Chartered Financial Analyst® (CFA®) designation is globally recognized and attests to a charterholder’s success in a rigorous and comprehensive study |
program in the field of investment management and research analysis.
| n | | The returns shown in management’s discussion of Fund performance are based on net asset values calculated for shareholder transactions. Generally accepted accounting principles require adjustments to be made to the net assets of the Fund at period end for financial reporting purposes, and as such, the net asset values for shareholder transactions and the returns based on those net asset values may differ from the net asset values and returns reported in the Financial Highlights. |
7 Invesco Commodities Strategy Fund
Invesco Commodities Strategy Fund’s investment objective is long-term total return.
| n | | Unless otherwise stated, information presented in this report is as of October 31, 2011, and is based on total net assets. |
| |
| n | | Unless otherwise noted, all data provided by Invesco. |
| |
| n | | To access your Fund’s reports/prospectus, visit invesco.com/fundreports. |
About share classes
| n | | Class B shares may not be purchased or acquired by exchange from share classes other than Class B shares. Please see the prospectus for more information. |
| |
| n | | Class R shares are available only to certain retirement plans. Please see the prospectus for more information. |
| |
| n | | Class Y shares are available to only certain investors. Please see the prospectus for more information. |
| |
| n | | Institutional Class shares are offered exclusively to institutional investors, including defined contribution plans that meet certain criteria. Please see the prospectus for more information. |
Principal risks of investing in the Fund
| n | | Commodity risk. The Fund’s and the Subsidiary’s investment exposure to the commodities markets and/or a particular sector of the commodities markets, may subject the Fund and the Subsidiary to greater volatility than investments in traditional securities, such as stocks and bonds. The commodities markets may fluctuate widely based on a variety of factors, including changes in overall market movements, domestic and foreign political and economic events and policies, war, acts of terrorism, changes in domestic or foreign interest rates and/or investor expectations concerning interest rates, domestic and foreign inflation rates and investment and trading activities of mutual funds, hedge funds and commodities funds. Prices of various commodities may also be affected by factors such as drought, floods, weather, livestock disease, embargoes, tariffs and other regulatory developments. The prices of commodities can also fluctuate widely due to supply and demand disruptions in major producing or consuming regions. Because the Fund’s and the Subsidiary’s performance is linked to the performance of potentially volatile commodities, investors should be willing to assume the risks of potentially significant fluctuations in the value of the Fund’s shares. |
| n | | Commodity-linked notes risk. The Fund’s investments in commodity-linked notes involve substantial risks, including risk of loss of a significant portion of their principal value. In addition to commodity risk, they may be subject to additional special risks, such as the lack of a secondary market and temporary price distortions due to speculators and/or the continuous rolling over of futures contracts underlying the notes. Commodity-linked notes are also subject to counterparty risk, which is the risk that the other party to the contract will not fulfill its contractual obligation to complete the transaction with the Fund. |
| n | | Subsidiary risk. By investing in the Subsidiary, the Fund is indirectly exposed to risks associated with the Subsidiary’s investments, including derivatives and commodities. Because the Subsidiary is not registered under the Investment Company Act of 1940, the Fund, as the sole investor in the Subsidiary, will not have the protections offered to investors in U.S. registered investment companies. Changes in the laws of the United States and/or the Cayman Islands, under which the Fund and the Subsidiary, respectively, are organized, could result in the inability of the Fund and/or the Subsidiary to operate as described in this prospectus and could negatively affect the Fund and its shareholders. |
| n | | Credit risk. The issuer of instruments in which the Fund invests may be unable to meet interest and/or principal payments, thereby causing its instruments to decrease in value and lowering the issuer’s credit rating. |
| n | | Non-diversification risk. The Fund is non-diversified and can invest a greater portion of its assets in a single issuer. A change in the value of the issuer could affect the value of the Fund more than if it was a diversified fund. |
| n | | Derivatives risk. Derivatives may be more difficult to purchase, sell or value than other investments and may be subject to market, interest rate, credit, leverage, counterparty and management risks. A fund investing in a derivative could lose more than the cash |
amount invested or incur higher taxes. Over-the-counter derivatives are also subject to counterparty risk, which is the risk that the other party to the contract will not fulfill its contractual obligation to complete the transaction with the Fund.
The derivative instruments and techniques that the Fund and the Subsidiary may principally use include:
Swaps. A swap contract is an agreement between two parties pursuant to which the parties exchange payments at specified dates on the basis of a specified notional amount, with the payments calculated by reference to specified securities, indexes, reference rates, currencies or other instruments. Swaps are subject to credit risk and counterparty risk.
Futures. A decision as to whether, when and how to use futures involves the exercise of skill and judgment and even a well conceived futures transaction may be unsuccessful because of market behavior or unexpected events.
| n | | Interest rate risk. Interest rate risk refers to the risk that bond prices generally fall as interest rates rise; conversely, bond prices generally rise as interest rates fall. Specific bonds differ in their sensitivity to changes in interest rates depending on their individual characteristics, including duration. |
| n | | Liquidity risk. The Fund may hold illiquid securities that it is unable to sell at the preferred time or price and could lose its entire investment in such securities. |
| n | | Tax risk. If the Internal Revenue Service were to change its position, as set out in a number of private letter rulings (which the Fund may not cite as precedent), such that the Fund’s income from the Subsidiary and commodity-linked notes is not “qualifying income,” the Fund may be unable to qualify as a regulated investment company for one or more years. In this event, the Fund’s Board may authorize a significant change in investment strategy or Fund liquidation. |
continued on page 7
This report must be accompanied or preceded by a currently effective Fund prospectus, which contains more complete information, including sales charges and expenses. Investors should read it carefully before investing.
NOT FDIC INSURED | MAY LOSE VALUE | NO BANK GUARANTEE
Fund Nasdaq Symbols
| | | | | |
|
| Class A Shares | | COAAX |
| Class B Shares | | COAHX |
| Class C Shares | | COACX |
| Class R Shares | | COARX |
| Class Y Shares | | COAIX |
| Institutional Class Shares | | COAJX |
8 Invesco Commodities Strategy Fund
Consolidated Schedule of Investments
October 31, 2011
| | | | | | | | | | | | | | | | | |
| | | Interest
| | Maturity
| | Principal
| | |
| | | Rate | | Date | | Amount | | Value |
| |
U.S. Treasury Securities–41.84%(a)(b)
|
| U.S. Treasury Bills | | | 0.12 | % | | | 01/26/12 | | | $ | 8,000,000 | | | $ | 7,999,905 | |
| |
| U.S. Treasury Bills | | | 0.01 | % | | | 01/26/12 | | | | 30,000,000 | | | | 29,999,642 | |
| |
| Total U.S. Treasury Securities (Cost $37,996,978) | | | | | | | | | | | | | | | 37,999,547 | |
| |
| | | | | Expiration
| | | | |
| | | | | Date | | | | |
Commodity-Linked Securities–28.13%
|
| Cargill Commodity Linked Note, one-month U.S. Dollar LIBOR minus 0.10% (linked to the Dow Jones–UBS Commodities Index Total Return, multiplied by 3) | | | | | | | 12/29/11 | | | | 3,334,000 | | | | 3,597,222 | |
| |
| Swedish Export Credit Corp. Commodity Linked Note, three-month U.S. Dollar LIBOR minus 0.40% (linked to the Dow Jones–UBS SM Enhanced E 95 Total Return Index, multiplied by 3) (Sweden) | | | | | | | 11/20/12 | | | | 11,540,000 | | | | 11,708,836 | |
| |
| UBS Commodity Linked Note, one-month U.S. Dollar LIBOR minus 0.10% (linked to the Dow Jones–UBS Commodities Index Total Return, multiplied by 3) | | | | | | | 12/22/11 | | | | 3,330,000 | | | | 3,588,969 | |
| |
| UBS Commodity Linked Note, one-month U.S. Dollar LIBOR minus 0.10% (linked to the Dow Jones–UBS Commodities Index Total Return, multiplied by 3) | | | | | | | 12/21/11 | | | | 6,266,667 | | | | 6,649,807 | |
| |
| Total Commodity-Linked Securities (Cost $24,470,667) | | | | | | | | | | | | | | | 25,544,834 | |
| |
| | | | | | | Shares | | |
Exchange Traded Fund–2.72%
|
PowerShares DB Gold Fund(c) (Cost $1,929,555) | | | | | | | | | | | 41,100 | | | | 2,470,521 | |
| |
Money Market Funds–26.84%
|
Liquid Assets Portfolio–Institutional Class(d) | | | | | | | | | | | 8,550,672 | | | | 8,550,672 | |
| |
Premier Portfolio–Institutional Class(d) | | | | | | | | | | | 8,550,672 | | | | 8,550,672 | |
| |
STIC (Global Series) PLC–U.S. Dollar Liquidity Portfolio–Institutional Class(d) | | | | | | | | | | | 7,272,889 | | | | 7,272,889 | |
| |
| Total Money Market Funds (Cost $24,374,233) | | | | | | | | | | | | | | | 24,374,233 | |
| |
| TOTAL INVESTMENTS–99.53% (Cost $88,771,433) | | | | | | | | | | | | | | | 90,389,135 | |
| |
| OTHER ASSETS LESS LIABILITIES–0.47% | | | | | | | | | | | | | | | 428,968 | |
| |
| NET ASSETS–100.00% | | | | | | | | | | | | | | $ | 90,818,103 | |
| |
Notes to Schedule of Investments:
| | |
| (a) | | Security traded on a discount basis. The interest rate shown represents the discount rate at the time of purchase by the Fund. |
| (b) | | All or a portion of the value was pledged as collateral to cover margin requirements for open futures contracts and swap agreements. See Note 1J, 1K and Note 4. |
| (c) | | Not an affiliate of the Fund or its investment adviser. |
| (d) | | The money market fund and the Fund are affiliated by having the same investment adviser. |
See accompanying Notes to Consolidated Financial Statements which are an integral part of the financial statements.
9 Invesco Commodities Strategy Fund
| | | | | | | | | | | | | | | | | |
| Open Futures Contracts and Swap Agreements at Period-End |
| | | | | | | | | Unrealized
|
| | | Number of
| | Expiration
| | Notional
| | Appreciation
|
| | | Contracts | | Month | | Value | | (Depreciation) |
| |
Long Contracts |
|
| |
| 100 Ounce Gold | | | 31 | | | | December-2011 | | | $ | 5,348,120 | | | $ | 337,563 | |
| |
| Live cattle | | | 13 | | | | December-2011 | | | | 616,720 | | | | (22,276 | ) |
| |
| LME copper | | | 25 | | | | March-2012 | | | | 4,996,875 | | | | 737,152 | |
| |
| WTI Light Sweet Crude Oil | | | 61 | | | | January-2012 | | | | 5,677,880 | | | | 941,047 | |
| |
| Subtotal | | | | | | | | | | $ | 16,639,595 | | | $ | 1,993,486 | |
| |
Short Contracts
|
| |
| Coffee C | | | 3 | | | | December-2011 | | | $ | (255,319 | ) | | $ | 870 | |
| |
| Corn | | | 6 | | | | December-2011 | | | | (194,100 | ) | | | (19,679 | ) |
| |
| Cotton No. 2 | | | 6 | | | | December-2011 | | | | (306,870 | ) | | | 21,976 | |
| |
| LME copper | | | 2 | | | | January-2012 | | | | (399,700 | ) | | | (63,261 | ) |
| |
| Soybean | | | 5 | | | | January-2012 | | | | (304,312 | ) | | | 3,234 | |
| |
| Soybean oil | | | 13 | | | | December-2011 | | | | (399,126 | ) | | | (15,674 | ) |
| |
| Sugar No. 11 | | | 9 | | | | March-2012 | | | | (259,762 | ) | | | (12,578 | ) |
| |
| Wheat | | | 6 | | | | December-2011 | | | | (188,475 | ) | | | (8,162 | ) |
| |
| WTI Light Sweet Crude Oil | | | 10 | | | | April-2012 | | | | (928,300 | ) | | | (144,130 | ) |
| |
| Subtotal | | | | | | | | | | $ | (3,235,964 | ) | | $ | (237,404 | ) |
| |
| Total Futures Contracts | | | | | | | | | | | | | | $ | 1,756,082 | |
| |
| | | | | | | | | | | | | | | | | |
| | | | | | | | | | | | | | | | | |
| | | | | Notional
| | Termination
| | |
| Swap Agreements | | Counterparty | | Value | | Date | | |
| |
Receive a return equal to Goldman Sachs Soybean Meal Total Return Strategy and pay a floating rate based on a 1-month U.S. T-Bill auction high rate plus 30 basis points | | | Goldman Sachs | | | $ | 4,419,242 | | | | November-2011 | | | $ | 107,403 | |
| |
Receive a floating rate equal to 3-month U.S. T-Bill auction high rate and pay a return equal to Dow Jones-UBS Commodities Index Total Return plus 20 basis points | | | Goldman Sachs | | | | 3,493,301 | | | | October-2012 | | | | (62,808 | ) |
| |
| Total Swap Agreements | | | | | | $ | 7,912,543 | | | | | | | $ | 44,595 | |
| |
See accompanying Notes to Consolidated Financial Statements which are an integral part of the financial statements.
10 Invesco Commodities Strategy Fund
Consolidated Statement of Assets and Liabilities
October 31, 2011
| | | | | |
Assets:
|
| Investments, at value (Cost $64,397,200) | | $ | 66,014,902 | |
| |
| Investments in affiliated money market funds, at value and cost | | | 24,374,233 | |
| |
| Total investments, at value (Cost $88,771,433) | | | 90,389,135 | |
| |
| Receivable for: | | | | |
| Deposits with brokers for open futures contracts | | | 4,155,073 | |
| |
| Investments sold | | | 9,361,494 | |
| |
| Fund shares sold | | | 252 | |
| |
| Dividends | | | 5,510 | |
| |
| Unrealized appreciation on swap agreements | | | 44,595 | |
| |
| Investment for trustee deferred compensation and retirement plans | | | 2,300 | |
| |
| Other assets | | | 33,348 | |
| |
| Total assets | | | 103,991,707 | |
| |
Liabilities:
|
| Payable for: | | | | |
| Investments purchased | | | 11,540,000 | |
| |
| Fund shares reacquired | | | 347,851 | |
| |
| Variation margin | | | 987,411 | |
| |
| Accrued fees to affiliates | | | 127,676 | |
| |
| Accrued other operating expenses | | | 106,977 | |
| |
| Trustee deferred compensation and retirement plans | | | 63,689 | |
| |
| Total liabilities | | | 13,173,604 | |
| |
| Net assets applicable to shares outstanding | | $ | 90,818,103 | |
| |
Net assets consist of:
|
| Shares of beneficial interest | | $ | 84,177,303 | |
| |
| Undistributed net investment income | | | 4,108,789 | |
| |
| Undistributed net realized gain (loss) | | | (886,774 | ) |
| |
| Unrealized appreciation | | | 3,418,785 | |
| |
| | | $ | 90,818,103 | |
| |
Net Assets:
|
| Class A | | $ | 70,652,848 | |
| |
| Class B | | $ | 7,366,146 | |
| |
| Class C | | $ | 7,442,865 | |
| |
| Class R | | $ | 207,360 | |
| |
| Class Y | | $ | 5,095,107 | |
| |
| Institutional Class | | $ | 53,777 | |
| |
Shares outstanding, $0.01 par value per share, with an unlimited number of shares authorized:
|
| Class A | | | 3,490,280 | |
| |
| Class B | | | 369,527 | |
| |
| Class C | | | 372,793 | |
| |
| Class R | | | 10,289 | |
| |
| Class Y | | | 250,233 | |
| |
| Institutional Class | | | 2,631 | |
| |
| Class A: | | | | |
| Net asset value per share | | $ | 20.24 | |
| |
| Maximum offering price per share | | | | |
| (Net asset value of $20.24 divided by 94.50%) | | $ | 21.42 | |
| |
| Class B: | | | | |
| Net asset value and offering price per share | | $ | 19.93 | |
| |
| Class C: | | | | |
| Net asset value and offering price per share | | $ | 19.97 | |
| |
| Class R: | | | | |
| Net asset value and offering price per share | | $ | 20.15 | |
| |
| Class Y: | | | | |
| Net asset value and offering price per share | | $ | 20.36 | |
| |
| Institutional Class: | | | | |
| Net asset value and offering price per share | | $ | 20.44 | |
| |
See accompanying Notes to Consolidated Financial Statements which are an integral part of the financial statements.
11 Invesco Commodities Strategy Fund
Consolidated Statement of Operations
For the three months ended October 31, 2011 and the year ended July 31, 2011
| | | | | | | | | |
| | | October 31,
| | July 31,
|
| | | 2011 | | 2011 |
| |
Investment income:
|
| Interest | | $ | 23,403 | | | $ | 165,072 | |
| |
| Dividends from affiliated money market funds | | | 6,834 | | | | 36,022 | |
| |
| Total investment income | | | 30,237 | | | | 201,094 | |
| |
Expenses:
|
| Advisory fees | | | 121,717 | | | | 545,520 | |
| |
| Administrative services fees | | | 12,603 | | | | 50,000 | |
| |
| Custodian fees | | | 2,680 | | | | 17,293 | |
| |
| Distribution fees: | | | | | | | | |
| Class A | | | 46,727 | | | | 206,663 | |
| |
| Class B | | | 20,433 | | | | 107,990 | |
| |
| Class C | | | 21,786 | | | | 82,876 | |
| |
| Class R | | | 266 | | | | 640 | |
| |
| Transfer agent fees — A, B, C, R and Y | | | 61,817 | | | | 171,168 | |
| |
| Transfer agent fees — Institutional | | | 8 | | | | — | |
| |
| Trustees’ and officers’ fees and benefits | | | 5,904 | | | | 16,924 | |
| |
| Registration and filing fees | | | 17,995 | | | | 97,308 | |
| |
| Reports to shareholders | | | 23,410 | | | | — | |
| |
| Professional services fees | | | 10,056 | | | | 81,400 | |
| |
| Other | | | 3,557 | | | | 64,032 | |
| |
| Total expenses | | | 348,959 | | | | 1,441,814 | |
| |
| Less: Fees waived and expenses reimbursed | | | (15,823 | ) | | | (47,250 | ) |
| |
| Net expenses | | | 333,136 | | | | 1,394,564 | |
| |
| Net investment income (loss) | | | (302,899 | ) | | | (1,193,470 | ) |
| |
Realized and unrealized gain (loss) from:
|
| Net realized gain (loss) from: | | | | | | | | |
| Investment securities | | | (3,092,775 | ) | | | 18,457,532 | |
| |
| Futures contracts | | | (2,988,167 | ) | | | 4,386,716 | |
| |
| Swap agreements | | | (592,794 | ) | | | 512,733 | |
| |
| | | | (6,673,736 | ) | | | 23,356,981 | |
| |
| Change in net unrealized appreciation (depreciation) of: | | | | | | | | |
| Investment securities | | | (3,331,034 | ) | | | (446,187 | ) |
| |
| Foreign currencies | | | (374 | ) | | | 1,060 | |
| |
| Futures contracts | | | 1,642,041 | | | | (540,767 | ) |
| |
| Swap agreements | | | (340,899 | ) | | | 578,025 | |
| |
| | | | (2,030,266 | ) | | | (407,869 | ) |
| |
| Net realized and unrealized gain (loss) | | | (8,704,002 | ) | | | 22,949,112 | |
| |
| Net increase (decrease) in net assets resulting from operations | | $ | (9,006,901 | ) | | $ | 21,755,642 | |
| |
See accompanying Notes to Consolidated Financial Statements which are an integral part of the financial statements.
12 Invesco Commodities Strategy Fund
Consolidated Statement of Changes in Net Assets
For the three months ended October 31, 2011 and the years ended July 31, 2011 and 2010
| | | | | | | | | | | | | |
| | | October 31,
| | July 31,
| | July 31,
|
| | | 2011 | | 2011 | | 2010 |
| |
Operations:
|
| Net investment income (loss) | | $ | (302,899 | ) | | $ | (1,193,470 | ) | | $ | (841,987 | ) |
| |
| Net realized gain (loss) | | | (6,673,736 | ) | | | 23,356,981 | | | | 6,029,264 | |
| |
| Change in net unrealized appreciation (depreciation) | | | (2,030,266 | ) | | | (407,869 | ) | | | 1,425,390 | |
| |
| Net increase (decrease) in net assets resulting from operations | | | (9,006,901 | ) | | | 21,755,642 | | | | 6,612,667 | |
| |
Distributions to shareholders from net investment income:
|
| Class A | | | — | | | | (1,932,809 | ) | | | — | |
| |
| Class B | | | — | | | | (216,652 | ) | | | — | |
| |
| Class C | | | — | | | | (160,154 | ) | | | — | |
| |
| Class R | | | — | | | | (2,526 | ) | | | — | |
| |
| Class Y | | | — | | | | (139,066 | ) | | | — | |
| |
| Institutional Class | | | — | | | | (283 | ) | | | — | |
| |
| Total distributions from net investment income | | | — | | | | (2,451,490 | ) | | | — | |
| |
Share transactions–net:
|
| Class A | | | (3,560,097 | ) | | | (10,669,592 | ) | | | 67,549,809 | |
| |
| Class B | | | (967,156 | ) | | | (4,121,844 | ) | | | 10,564,434 | |
| |
| Class C | | | (1,689,954 | ) | | | 738,340 | | | | 5,120,349 | |
| |
| Class R | | | 4,583 | | | | 179,166 | | | | (75,734 | ) |
| |
| Class Y | | | (63,077 | ) | | | (2,008,396 | ) | | | (32,023,070 | ) |
| |
| Institutional Class | | | — | | | | (1,298,653 | ) | | | 1,192,103 | |
| |
| Net increase (decrease) in net assets resulting from share transactions | | | (6,275,701 | ) | | | (17,180,979 | ) | | | 52,327,891 | |
| |
| Net increase (decrease) in net assets | | | (15,282,602 | ) | | | 2,123,173 | | | | 58,940,558 | |
| |
Net assets:
|
| Beginning of period | | | 106,100,705 | | | | 103,977,532 | | | | 45,036,974 | |
| |
| End of period (includes undistributed net investment income (loss) of $4,108,789, $4,054,285 and $(1,405,341), respectively) | | $ | 90,818,103 | | | $ | 106,100,705 | | | $ | 103,977,532 | |
| |
Notes to Consolidated Financial Statements
October 31, 2011
NOTE 1—Significant Accounting Policies
Invesco Commodities Strategy Fund (the “Fund”) is a series portfolio of AIM Investment Funds (Invesco Investment Funds) (the “Trust”). The Trust is organized as a Delaware statutory trust and is registered under the Investment Company Act of 1940, as amended (the “1940 Act”), as an open-end series management investment company consisting of thirteen separate series portfolios, each authorized to issue an unlimited number of shares of beneficial interest. The assets, liabilities and operations of each portfolio are accounted for separately. Information presented in these financial statements pertains only to the Fund. Matters affecting each portfolio or class will be voted on exclusively by the shareholders of such portfolio or class.
On October 31, 2011, the Fund’s fiscal year-end changed from July 31 to October 31.
The Fund’s investment objective is long-term total return.
The Fund will seek to gain exposure to the commodity markets primarily through investments in the Invesco Cayman Commodity Fund II Ltd. (the “Subsidiary”), a wholly-owned subsidiary of the Fund organized under the laws of the Cayman Islands. The Subsidiary was organized by the Fund to invest in commodity-linked derivatives. The Fund may invest up to 25% of its total assets in the Subsidiary.
The Fund currently consists of six different classes of shares: Class A, Class B, Class C, Class R, Class Y and Institutional Class. Class A shares are sold with a front-end sales charge unless certain waiver criteria are met and under certain circumstances load waived shares may be subject to contingent deferred sales charges (“CDSC”). Class C shares are sold with a CDSC. Class R, Class Y and Institutional Class shares are sold at net asset value. Effective November 30, 2010, new or additional investments in Class B shares are no longer permitted. Existing shareholders of Class B shares may continue to reinvest dividends and capital gains distributions in Class B shares until they convert. Also, shareholders in Class B shares will be able to exchange those shares for Class B shares of other
13 Invesco Commodities Strategy Fund
Invesco Funds offering such shares until they convert. Generally, Class B shares will automatically convert to Class A shares on or about the month-end which is at least eight years after the date of purchase. Redemption of Class B shares prior to conversion date will be subject to a CDSC.
The following is a summary of the significant accounting policies followed by the Fund in the preparation of its consolidated financial statements.
| | |
| A. | | Security Valuations — Securities, including restricted securities, are valued according to the following policy. |
| | Debt obligations (including convertible bonds) and unlisted equities are fair valued using an evaluated quote provided by an independent pricing service. Evaluated quotes provided by the pricing service may be determined without exclusive reliance on quoted prices, and may reflect appropriate factors such as institution-size trading in similar groups of securities, developments related to specific securities, dividend rate, yield, quality, type of issue, coupon rate, maturity, individual trading characteristics and other market data. Debt securities are subject to interest rate and credit risks. In addition, all debt securities involve some risk of default with respect to interest and/or principal payments. |
| | A security listed or traded on an exchange (except convertible bonds) is valued at its last sales price or official closing price as of the close of the customary trading session on the exchange where the security is principally traded, or lacking any sales or official closing price on a particular day, the security may be valued at the closing bid price on that day. Securities traded in the over-the-counter market are valued based on prices furnished by independent pricing services or market makers. When such securities are valued by an independent pricing service they may be considered fair valued. Futures contracts are valued at the final settlement price set by an exchange on which they are principally traded. Listed options are valued at the mean between the last bid and ask prices from the exchange on which they are principally traded. Options not listed on an exchange are valued by an independent source at the mean between the last bid and ask prices. For purposes of determining net asset value per share, futures and option contracts generally are valued 15 minutes after the close of the customary trading session of the New York Stock Exchange (“NYSE”). |
| | Investments in open-end and closed-end registered investment companies that do not trade on an exchange are valued at the end of day net asset value per share. Investments in open-end and closed-end registered investment companies that trade on an exchange are valued at the last sales price or official closing price as of the close of the customary trading session on the exchange where the security is principally traded. |
| | Swap agreements are fair valued using an evaluated quote provided by an independent pricing service. Evaluated quotes provided by the pricing service are valued based on a model which may include end of day net present values, spreads, ratings, industry, and company performance. |
| | Foreign securities (including foreign exchange contracts) are converted into U.S. dollar amounts using the applicable exchange rates as of the close of the NYSE. If market quotations are available and reliable for foreign exchange traded equity securities, the securities will be valued at the market quotations. Because trading hours for certain foreign securities end before the close of the NYSE, closing market quotations may become unreliable. If between the time trading ends on a particular security and the close of the customary trading session on the NYSE, events occur that are significant and make the closing price unreliable, the Fund may fair value the security. If the event is likely to have affected the closing price of the security, the security will be valued at fair value in good faith using procedures approved by the Board of Trustees. Adjustments to closing prices to reflect fair value may also be based on a screening process of an independent pricing service to indicate the degree of certainty, based on historical data, that the closing price in the principal market where a foreign security trade is not the current value as of the close of the NYSE. Foreign securities meeting the approved degree of certainty that the price is not reflective of current value will be priced at the indication of fair value from the independent pricing service. Multiple factors may be considered by the independent pricing service in determining adjustments to reflect fair value and may include information relating to sector indices, American Depositary Receipts and domestic and foreign index futures. Foreign securities may have additional risks including exchange rate changes, potential for sharply devalued currencies and high inflation, political and economical upheaval, the relative lack of issuer information, relatively low market liquidity and the potential lack of strict financial and accounting controls and standards. |
| | Securities for which market prices are not provided by any of the above methods may be valued based upon quotes furnished by independent sources. The last bid price may be used to value equity securities. The mean between the last bid and asked prices is used to value debt obligations, including Corporate Loans. |
| | Securities for which market quotations are not readily available or are unreliable are valued at fair value as determined in good faith by or under the supervision of the Trust’s officers following procedures approved by the Board of Trustees. Issuer specific events, market trends, bid/ask quotes of brokers and information providers and other market data may be reviewed in the course of making a good faith determination of a security’s fair value. |
| | Valuations change in response to many factors including the historical and prospective earnings of the issuer, the value of the issuer’s assets, general economic conditions, interest rates, investor perceptions and market liquidity. Because of the inherent uncertainties of valuation, the values reflected in the consolidated financial statements may materially differ from the value received upon actual sale of those investments. |
| B. | | Securities Transactions and Investment Income — Securities transactions are accounted for on a trade date basis. Realized gains or losses on sales are computed on the basis of specific identification of the securities sold. Interest income is recorded on the accrual basis from settlement date. Dividend income (net of withholding tax, if any) is recorded on the ex-dividend date. Bond premiums and discounts are amortized and/or accreted for financial reporting purposes. |
| | The Fund may periodically participate in litigation related to Fund investments. As such, the Fund may receive proceeds from litigation settlements. Any proceeds received are included in the Consolidated Statement of Operations as realized gain (loss) for investments no longer held and as unrealized gain (loss) for investments still held. |
| | Brokerage commissions and mark ups are considered transaction costs and are recorded as an increase to the cost basis of securities purchased and/or a reduction of proceeds on a sale of securities. Such transaction costs are included in the determination of net realized and unrealized gain (loss) from investment securities reported in the Consolidated Statement of Operations and the Consolidated Statement of Changes in Net Assets and the net realized and unrealized gains (losses) on securities per share in the Consolidated Financial Highlights. Transaction costs are included in the calculation of the Fund’s net asset value and, accordingly, they reduce the Fund’s total returns. These transaction costs are not considered operating expenses and are not reflected in net investment income reported in the Consolidated Statement of Operations and Consolidated Statement of Changes in Net Assets, or the net investment income per share and ratios of expenses and net investment income reported in the Consolidated Financial Highlights, nor are they limited by any expense limitation arrangements between the Fund and the investment adviser. |
14 Invesco Commodities Strategy Fund
| | |
| | The Fund allocates income and realized and unrealized capital gains and losses to a class based on the relative net assets of each class. |
| C. | | Country Determination — For the purposes of making investment selection decisions and presentation in the Consolidated Schedule of Investments, the investment adviser may determine the country in which an issuer is located and/or credit risk exposure based on various factors. These factors include the laws of the country under which the issuer is organized, where the issuer maintains a principal office, the country in which the issuer derives 50% or more of its total revenues and the country that has the primary market for the issuer’s securities, as well as other criteria. Among the other criteria that may be evaluated for making this determination are the country in which the issuer maintains 50% or more of its assets, the type of security, financial guarantees and enhancements, the nature of the collateral and the sponsor organization. Country of issuer and/or credit risk exposure has been determined to be the United States of America, unless otherwise noted. |
| D. | | Distributions — Distributions from income and net realized capital gain, if any, are generally paid annually and recorded on ex-dividend date. The Fund may elect to treat a portion of the proceeds from redemptions as distributions for federal income tax purposes. |
| E. | | Federal Income Taxes — The Fund intends to comply with the requirements of Subchapter M of the Internal Revenue Code necessary to qualify as a regulated investment company and to distribute substantially all of the Fund’s taxable earnings to shareholders. As such, the Fund will not be subject to federal income taxes on otherwise taxable income (including net realized capital gain) that is distributed to shareholders. Therefore, no provision for federal income taxes is recorded in the consolidated financial statements. |
| | The Subsidiary is classified as a controlled foreign corporation under Subchapter N of the Internal Revenue Code. Therefore, the Fund is required to increase its taxable income by its share of the Subsidiary’s income. Net investment losses of the Subsidiary cannot be deducted by the Fund in the current period nor carried forward to offset taxable income in future periods. |
| | The Fund files tax returns in the U.S. Federal jurisdiction and certain other jurisdictions. Generally the Fund is subject to examinations by such taxing authorities for up to three years after the filing of the return for the tax period. |
| F. | | Expenses — Fees provided for under the Rule 12b-1 plan of a particular class of the Fund are charged to the operations of such class. Transfer agency fees and expenses and other shareholder recordkeeping fees and expenses attributable to the Institutional Class are charged to such class. Transfer agency fees and expenses and other shareholder recordkeeping fees and expenses relating to all other classes are allocated among those classes based on relative net assets. All other expenses are allocated among the classes based on relative net assets. |
| G. | | Accounting Estimates — The financial statements are prepared on a consolidated basis in conformity with accounting principles generally accepted in the United States of America (“GAAP”), which requires management to make estimates and assumptions that affect the reported amounts of assets and liabilities at the date of the financial statements and the reported amounts of revenues and expenses during the reporting period including estimates and assumptions related to taxation. Actual results could differ from those estimates by a significant amount. The accompanying financial statements reflect the financial position of the Fund and its Subsidiary and the results of operations on a consolidated basis. All inter-company accounts and transactions have been eliminated in consolidation. |
| | In addition, the Fund monitors for material events or transactions that may occur or become known after the period-end date and before the date the consolidated financial statements are released to print. |
| H. | | Change in Accounting Policy — Consolidated Financial Statements — The accompanying financial statements reflect the financial position of the Fund and its Subsidiary and the results of operations on a consolidated basis. Prior to January 31, 2011, the financial statements for both the Fund and its Subsidiary were presented as stand alone entities. The change in policy was implemented to provide shareholders of the Fund with a more accurate and transparent portrayal of the Fund’s investment strategy, financial position and the results of its operations and more fully reflects the fact that the sole purpose of the Subsidiary is to serve as a vehicle through which the Fund gains additional exposure to commodities. The result of the policy change did not have an impact on total net assets of the Fund, but resulted in the following changes to the financial statements. As of the beginning of the Fund’s fiscal period, the financial statement line items on the Statement of Assets and Liabilities were affected by the change as follows: Investments, at value increased $20,867,104 and wholly-owned subsidiary, at value decreased by $20,867,104. Undistributed net investment income increased $54,249; undistributed net realized gain (loss) increased $1,103,893 and unrealized appreciation decreased $1,158,142. For the year ended July 31, 2011, the financial statement line items on the Statement of Operations were affected by the change as follows: Total investment income increased $61,121, advisory fees increased $109,982, other expenses increased $36,373 and net investment income (loss) decreased $85,234. For the years ended July 31, 2011 and July 31, 2010, the following changes were made to the Statement of Changes in Net Assets: Net investment income (loss) decreased $85,234 and $627, respectively; net realized gains increased $4,327,473 and $139,102, respectively, and change in net unrealized appreciation (depreciation) decreased $4,242,239 and $138,475, respectively. |
| I. | | Indemnifications — Under the Trust’s organizational documents, each Trustee, officer, employee or other agent of the Trust, and under the Subsidiary’s organizational documents, the directors and officers of the Subsidiary, are indemnified against certain liabilities that may arise out of performance of their duties to the Fund and/or the Subsidiary, respectively. Additionally, in the normal course of business, the Fund enters into contracts, including the Fund’s servicing agreements, that contain a variety of indemnification clauses. The Fund’s maximum exposure under these arrangements is unknown as this would involve future claims that may be made against the Fund that have not yet occurred. The risk of material loss as a result of such indemnification claims is considered remote. |
| J. | | Structured Securities — The Fund may invest in structured securities. Structured securities are a type of derivative security whose value is determined by reference to changes in the value of underlying securities, currencies, interest rates, commodities, indices or other financial indicators (“reference instruments”). Most structured securities are fixed-income securities that have maturities of three years or less. Structured securities may be positively or negatively indexed (i.e., their principal value or interest rates may increase or decrease if the underlying reference instrument appreciates) and may have return characteristics similar to direct investments in the underlying reference instrument. |
| | Structured securities may entail a greater degree of market risk than other types of debt securities because the investor bears the risk of the reference instruments. In addition to the credit risk of structured securities and the normal risks of price changes in response to changes in interest rates, the principal amount of structured notes or indexed securities may decrease as a result of changes in the value of the underlying reference instruments. |
15 Invesco Commodities Strategy Fund
| | |
| | Changes in the daily value of structured securities are recorded as unrealized gains (losses) in the Consolidated Statement of Operations. When the structured securities mature or are sold, the Fund recognizes a realized gain (loss) on the Consolidated Statement of Operations. |
| K. | | Futures Contracts — The Fund may enter into futures contracts to manage exposure to interest rate, equity and market price movements and/or currency risks. A futures contract is an agreement between two parties to purchase or sell a specified underlying security, currency or commodity (or delivery of a cash settlement price, in the case of an index future) for a fixed price at a future date. The Fund currently invests only in exchange-traded futures and they are standardized as to maturity date and underlying financial instrument. Initial margin deposits required upon entering into futures contracts are satisfied by the segregation of specific securities or cash as collateral at the futures commission merchant (broker). During the period the futures contracts are open, changes in the value of the contracts are recognized as unrealized gains or losses by recalculating the value of the contracts on a daily basis. Subsequent or variation margin payments are received or made depending upon whether unrealized gains or losses are incurred. These amounts are reflected as receivables or payables on the Consolidated Statement of Assets and Liabilities. When the contracts are closed or expire, the Fund recognizes a realized gain or loss equal to the difference between the proceeds from, or cost of, the closing transaction and the Fund’s basis in the contract. The net realized gain (loss) and the change in unrealized gain (loss) on futures contracts held during the period is included on the Consolidated Statement of Operations. The primary risks associated with futures contracts are market risk and the absence of a liquid secondary market. If the Fund were unable to liquidate a futures contract and/or enter into an offsetting closing transaction, the Fund would continue to be subject to market risk with respect to the value of the contracts and continue to be required to maintain the margin deposits on the futures contracts. Futures contracts have minimal counterparty risk since the exchange’s clearinghouse, as counterparty to all exchange-traded futures, guarantees the futures against default. Risks may exceed amounts recognized in the Consolidated Statement of Assets and Liabilities. |
| L. | | Swap Agreements — The Fund may enter into various swap transactions, including interest rate, total return, index, currency exchange rate and credit default swap contracts (“CDS”) for investment purposes or to manage interest rate, currency or credit risk. |
| | Interest rate, total return, index, and currency exchange rate swap agreements are two-party contracts entered into primarily to exchange the returns (or differentials in rates of returns) earned or realized on particular predetermined investments or instruments. The gross returns to be exchanged or “swapped” between the parties are calculated with respect to a notional amount, i.e., the return on or increase in value of a particular dollar amount invested at a particular interest rate or return of an underlying asset, in a particular foreign currency, or in a “basket” of securities representing a particular index. |
| | A CDS is an agreement between two parties (“Counterparties”) to exchange the credit risk of an issuer. A buyer of a CDS is said to buy protection by paying a fixed payment over the life of the agreement and in some situations an upfront payment to the seller of the CDS. If a defined credit event occurs (such as payment default or bankruptcy), the Fund as a protection buyer would cease paying its fixed payment, the Fund would deliver eligible bonds issued by the reference entity to the seller, and the seller would pay the full notional value, or the “par value”, of the referenced obligation to the Fund. A seller of a CDS is said to sell protection and thus would receive a fixed payment over the life of the agreement and an upfront payment, if applicable. If a credit event occurs, the Fund as a protection seller would cease to receive the fixed payment stream, the Fund would pay the buyer “par value” or the full notional value of the referenced obligation, and the Fund would receive the eligible bonds issued by the reference entity. In turn, these bonds may be sold in order to realize a recovery value. Alternatively, the seller of the CDS and its counterparty may agree to net the notional amount and the market value of the bonds and make a cash payment equal to the difference to the buyer of protection. If no credit event occurs, the Fund receives the fixed payment over the life of the agreement. As the seller, the Fund would effectively add leverage to its portfolio because, in addition to its total net assets, the Fund would be subject to investment exposure on the notional amount of the CDS. In connection with these agreements, cash and securities may be identified as collateral in accordance with the terms of the respective swap agreements to provide assets of value and recourse in the event of default under the swap agreement or bankruptcy/insolvency of a party to the swap agreement. If a counterparty becomes bankrupt or otherwise fails to perform its obligations due to financial difficulties, the Fund may experience significant delays in obtaining any recovery in a bankruptcy or other reorganization proceeding. The Fund may obtain only limited recovery or may obtain no recovery in such circumstances. |
| | Implied credit spreads represent the current level at which protection could be bought or sold given the terms of the existing CDS contract and serve as an indicator of the current status of the payment/performance risk of the CDS. An implied spread that has widened or increased since entry into the initial contract may indicate a deteriorating credit profile and increased risk of default for the reference entity. A declining or narrowing spread may indicate an improving credit profile or decreased risk of default for the reference entity. Alternatively, credit spreads may increase or decrease reflecting the general tolerance for risk in the credit markets. |
| | Changes in the value of swap agreements are recognized as unrealized gains (losses) in the Consolidated Statement of Operations by “marking to market” on a daily basis to reflect the value of the swap agreement at the end of each trading day. Payments received or paid at the beginning of the agreement are reflected as such on the Consolidated Statement of Assets and Liabilities and may be referred to as upfront payments. The Fund accrues for the fixed payment stream and amortizes upfront payments, if any, on swap agreements on a daily basis with the net amount, recorded as a component of realized gain (loss) on the Consolidated Statement of Operations. A liquidation payment received or made at the termination of a swap agreement is recorded as realized gain (loss) on the Consolidated Statement of Operations. The Fund segregates liquid securities having a value at least equal to the amount of the potential obligation of a Fund under any swap transaction. The Fund’s maximum risk of loss from counterparty risk, either as the protection seller or as the protection buyer, is the value of the contract. The risk may be mitigated by having a master netting arrangement between the Fund and the counterparty and by the posting of collateral by the counterparty to cover the Fund’s exposure to the counterparty. Entering into these agreements involves, to varying degrees, lack of liquidity and elements of credit, market, and counterparty risk in excess of amounts recognized on the Consolidated Statement of Assets and Liabilities. Such risks involve the possibility that a swap is difficult to sell or liquidate; the counterparty does not honor its obligations under the agreement and unfavorable interest rates and market fluctuations. |
| M. | | Other Risks — The Fund will seek to gain exposure to commodity markets primarily through an investment in the Subsidiary and through investments in exchange traded funds. The Subsidiary, unlike the Fund, may invest without limitation in commodities, commodity-linked derivatives and |
16 Invesco Commodities Strategy Fund
| | |
| | other securities, such as exchange traded notes, that may provide leverage and non-leveraged exposure to commodity markets. The Fund is indirectly exposed to the risks associated with the Subsidiary’s investments. |
| | The Fund is non-diversified and may invest in securities of fewer issuers than if it were diversified. Thus, the value of the Fund’s shares may vary more widely and the Fund may be subject to greater market and credit risk than if the Fund invested more broadly. |
| N. | | Collateral — To the extent the Fund has pledged or segregated a security as collateral and that security is subsequently sold, it is the Fund’s practice to replace such collateral no later than the next business day. |
NOTE 2—Advisory Fees and Other Fees Paid to Affiliates
The Trust has entered into a master investment advisory agreement with Invesco Advisers, Inc. (the “Adviser” or “Invesco”). Under the terms of the investment advisory agreement, the Fund pays an advisory fee to the Advisor at the annual rate of 0.50% of the Fund’s average daily net assets.
Under the terms of a master sub-advisory agreement between the Adviser and each of Invesco Asset Management Deutschland GmbH, Invesco Asset Management Limited, Invesco Asset Management (Japan) Limited, Invesco Australia Limited, Invesco Hong Kong Limited, Invesco Senior Secured Management, Inc. and Invesco Canada Ltd. (collectively, the “Affiliated Sub-Advisers”) the Adviser, not the Fund, may pay 40% of the fees paid to the Adviser to any such Affiliated Sub-Adviser(s) that provide discretionary investment management services to the Fund based on the percentage of assets allocated to such Sub-Adviser(s).
The Subsidiary has entered into a separate contract with the Adviser whereby the Adviser provides investment advisory and other services to the Subsidiary. In consideration of these services, the Subsidiary pays an advisory fee to the Adviser based on the annual rate of the Subsidiary’s average daily net assets as set forth above.
The Adviser has contractually agreed, through at least June 30, 2012, to waive advisory fees and/or reimburse expenses of all shares to the extent necessary to limit total annual fund operating expenses after fee waiver and/or expense reimbursement (excluding certain items discussed below) of Class A, Class B, Class C, Class R, Class Y and Institutional Class shares to 1.25%, 2.00%, 2.00%, 1.50%, 1.00% and 1.00%, respectively, of average daily net assets. In determining the Adviser’s obligation to waive advisory fees and/or reimburse expenses, the following expenses are not taken into account, and could cause the total annual fund operating expenses after fee waiver and/or expense reimbursement to exceed the numbers reflected above: (1) interest; (2) taxes; (3) dividend expense on short sales; (4) extraordinary or non-routine items; (5) expenses of the underlying funds that are paid indirectly as a result of share ownership of the underlying funds; and (6) expenses that the Fund has incurred but did not actually pay because of an expense offset arrangement. Unless the Board of the Trustees and Invesco mutually agree to amend or continue the fee waiver agreement, it will terminate on June 30, 2012.
Further, the Adviser has contractually agreed, through at least June 30, 2012, to waive the advisory fee payable by the Fund in an amount equal to 100% of the net advisory fees the Adviser receives from the affiliated money market funds on investments by the Fund of uninvested cash in such affiliated money market funds.
For the period August 1, 2011 to October 31, 2011, the Adviser waived advisory fees of $11,874 and reimbursed class level expenses of $3,949 for Class A, Class B, Class C, Class R and Class Y shares in proportion to the relative net assets of such classes and the year ended July 31, 2011, the Adviser waived advisory fees of $47,113.
The Trust has entered into a master administrative services agreement with Invesco pursuant to which the Fund has agreed to pay Invesco for certain administrative costs incurred in providing accounting services to the Fund. For the period August 1, 2011 to October 31, 2011 and the year ended July 31, 2011, expenses incurred under the agreement are shown in the Consolidated Statement of Operations as administrative services fees.
The Trust has entered into a transfer agency and service agreement with Invesco Investment Services, Inc. (“IIS”) pursuant to which the Fund has agreed to pay IIS a fee for providing transfer agency and shareholder services to the Fund and reimburse IIS for certain expenses incurred by IIS in the course of providing such services. IIS may make payments to intermediaries that provide omnibus account services, sub-accounting services and/or networking services. All fees payable by IIS to intermediaries that provide omnibus account services or sub-accounting are charged back to the Fund, subject to certain limitations approved by the Trust’s Board of Trustees. For the period August 1, 2011 to October 31, 2011 and the year ended July 31, 2011, expenses incurred under the agreement are shown in the Consolidated Statement of Operations as transfer agent fees.
Shares of the Fund are distributed by Invesco Distributors, Inc. (“IDI”), an affiliate of the Adviser. The Fund has adopted a Plan of Distribution (the “Plan”) pursuant to Rule 12b-1 under the 1940 Act. The Plan provides that the Fund will reimburse IDI for distribution related expenses that IDI incurs up to a maximum of the following annual rates: (1) Class A — up to 0.25% of the average daily net assets of Class A shares; (2) Class B — up to 1.00% of the average daily net assets of Class B shares; (3) Class C — up to 1.00% of the average daily net assets of Class C shares; and (4) Class R — up to 0.50% of the average daily net assets of Class R shares.
In the case of Class B and Class C shares, provided that the Plan continues in effect, any cumulative expenses incurred by IDI, but not yet reimbursed to IDI, may be recovered through the payment of future distribution fees from the Fund pursuant to the Plan and contingent deferred sales charges paid by investors upon redemption of Class B and Class C shares.
For the period August 1, 2011 to October 31, 2011 and the year ended July 31, 2011, expenses incurred under these agreements are shown in the Consolidated Statement of Operations as distribution fees.
Front-end sales commissions and CDSC (collectively, the “sales charges”) are not recorded as expenses of the Fund. Front-end sales commissions are deducted from proceeds from the sales of Fund shares prior to investment in Class A shares of the Fund. CDSC are deducted from redemption proceeds prior to remittance to the shareholder. During the period August 1, 2011 to October 31, 2011, IDI advised the Fund that IDI retained $218 in front-end sales commissions from the sale of Class A shares and $0, $1,201 and $1,444 from Class A, Class B and Class C shares, respectively, for CDSC imposed on redemptions by shareholders. For the year ended July 31, 2011, IDI advised the Fund that IDI retained $8,733 in front-end sales commissions from the sale of Class A shares and $299, $11,573 and $434 from Class A, Class B and Class C shares, respectively, for CDSC imposed on redemptions by shareholders.
Certain officers and trustees of the Trust are officers and directors of the Adviser, Invesco Ltd., IIS and/or IDI.
17 Invesco Commodities Strategy Fund
NOTE 3—Additional Valuation Information
GAAP defines fair value as the price that would be received to sell an asset or paid to transfer a liability in an orderly transaction between market participants at the measurement date, under current market conditions. GAAP establishes a hierarchy that prioritizes the inputs to valuation methods giving the highest priority to readily available unadjusted quoted prices in an active market for identical assets (Level 1) and the lowest priority to significant unobservable inputs (Level 3) generally when market prices are not readily available or are unreliable. Based on the valuation inputs, the securities or other investments are tiered into one of three levels. Changes in valuation methods may result in transfers in or out of an investment’s assigned level:
| | |
| | Level 1 — | Prices are determined using quoted prices in an active market for identical assets. |
| | Level 2 — | Prices are determined using other significant observable inputs. Observable inputs are inputs that other market participants may use in pricing a security. These may include quoted prices for similar securities, interest rates, prepayment speeds, credit risk, yield curves, loss severities, default rates, discount rates, volatilities and others. |
| | Level 3 — | Prices are determined using significant unobservable inputs. In situations where quoted prices or observable inputs are unavailable (for example, when there is little or no market activity for an investment at the end of the period), unobservable inputs may be used. Unobservable inputs reflect the Fund’s own assumptions about the factors market participants would use in determining fair value of the securities or instruments and would be based on the best available information. |
The following is a summary of the tiered valuation input levels, as of October 31, 2011. The level assigned to the securities valuations may not be an indication of the risk or liquidity associated with investing in those securities. Because of the inherent uncertainties of valuation, the values reflected in the consolidated financial statements may materially differ from the value received upon actual sale of those investments.
During the period August 1, 2011 to October 31, 2011, there were no significant transfers between investment levels.
| | | | | | | | | | | | | | | | | |
| | | Level 1 | | Level 2 | | Level 3 | | Total |
| |
| Commodity-Linked Securities | | $ | — | | | $ | 25,544,834 | | | $ | — | | | $ | 25,544,834 | |
| |
| Exchange Traded Fund | | | 2,470,521 | | | | — | | | | — | | | | 2,470,521 | |
| |
| Money Market Funds | | | 24,374,233 | | | | — | | | | — | | | | 24,374,233 | |
| |
| U.S. Treasury Debt Securities | | | — | | | | 37,999,547 | | | | — | | | | 37,999,547 | |
| |
| | | $ | 26,844,754 | | | $ | 63,544,381 | | | $ | — | | | $ | 90,389,135 | |
| |
| Futures and Swap Agreements* | | | 1,756,082 | | | | 44,595 | | | | — | | | | 1,800,677 | |
| |
| Total Investments | | $ | 28,600,836 | | | $ | 63,588,976 | | | $ | — | | | $ | 92,189,812 | |
| |
| |
| * | Unrealized appreciation. |
NOTE 4—Derivative Investments
The Fund has implemented the required disclosures about derivative instruments and hedging activities in accordance with GAAP. This disclosure is intended to improve financial reporting about derivative instruments and hedging activities by requiring enhanced disclosures to enable investors to better understand their effects on an entity’s financial position and financial performance. The enhanced disclosure has no impact on the results of operations reported in the consolidated financial statements.
Value of Derivative Instruments at Period-End
The table below summarizes the value of the Fund’s derivative instruments, detailed by primary risk exposure, held as of October 31, 2011:
| | | | | | | | | |
| | | Value |
| Risk Exposure/Derivative Type | | Assets | | Liabilities |
| |
| Commodity risk | | | | | | | | |
Futures contracts(a) | | $ | 2,041,842 | | | $ | (285,760 | ) |
| |
| Commodity risk | | | | | | | | |
Swap agreements(b) | | | 107,403 | | | | (62,808 | ) |
| |
| | | $ | 2,149,245 | | | $ | (348,568 | ) |
| |
| | |
| (a) | | Includes cumulative appreciation (depreciation) of futures contracts. Only current day’s variation margin receivable (payable) is reported within the Consolidated Statement of Assets & Liabilities. |
| (b) | | Values are included on the Consolidated Statement of Assets and Liabilities under the Unrealized appreciation on swap agreements. |
18 Invesco Commodities Strategy Fund
Effect of Derivative Instruments for the period August 1, 2011 to October 31, 2011 and the year ended July 31, 2011
The table below summarizes the gains (losses) on derivative instruments, detailed by primary risk exposure, recognized in earnings during the period:
| | | | | | | | | | | | | | | | | |
| | | Location of Gain (Loss) on
|
| | | Consolidated Statement of Operations |
| | | October 31, 2011 | | July 31, 2011 |
| | | | | Swap
| | | | Swap
|
| | | Futures* | | Agreements* | | Futures* | | Agreements* |
| |
| Realized Gain (Loss) | | | | | | | | | | | | | | | | |
| Commodity risk | | $ | (2,988,167 | ) | | $ | (592,794 | ) | | $ | 4,386,716 | | | $ | 512,733 | |
| |
| Change in Unrealized Appreciation (Depreciation) | | | | | | | | | | | | | | | | |
| Commodity risk | | | 1,642,041 | | | | (340,899 | ) | | | (540,767 | ) | | | 578,025 | |
| |
| Total | | $ | (1,346,126 | ) | | $ | (933,693 | ) | | $ | 3,845,949 | | | $ | 1,090,758 | |
| |
| |
| * | The average notional value outstanding of futures and swap agreements during the period was $19,573,290 and $24,460,680, respectively. The average notional value outstanding of futures and swap agreements during the year ended July 31, 2011 was $21,362,965 and $12,385,040, respectively. |
NOTE 5—Expense Offset Arrangement(s)
The expense offset arrangement is comprised of transfer agency credits which result from balances in Demand Deposit Accounts (DDA) used by the transfer agent for clearing shareholder transactions. For the period August 1, 2011 to October 31, 2011 and the year ended July 31, 2011, the Fund received credits from this arrangement, which resulted in the reduction of the Fund’s total expenses of $0 and $137, respectively.
NOTE 6—Trustees’ and Officers’ Fees and Benefits
“Trustees’ and Officers’ Fees and Benefits” include amounts accrued by the Fund to pay remuneration to certain Trustees and Officers of the Fund. Trustees have the option to defer compensation payable by the Fund, and “Trustees’ and Officers’ Fees and Benefits” also include amounts accrued by the Fund to fund such deferred compensation amounts. Those Trustees who defer compensation have the option to select various Invesco Funds in which their deferral accounts shall be deemed to be invested. Finally, certain current Trustees are eligible to participate in a retirement plan that provides for benefits to be paid upon retirement to Trustees over a period of time based on the number of years of service. The Fund may have certain former Trustees who also participate in a retirement plan and receive benefits under such plan. “Trustees’ and Officers’ Fees and Benefits” include amounts accrued by the Fund to fund such retirement benefits. Obligations under the deferred compensation and retirement plans represent unsecured claims against the general assets of the Fund.
During the period August 1, 2011 to October 31, 2011 and the year ended July 31, 2011, the Fund paid legal fees of $1,647 and $1,595, respectively, for services rendered by Kramer, Levin, Naftalis & Frankel LLP as counsel to the Independent Trustees. A partner of that firm is a Trustee of the Trust.
NOTE 7—Cash Balances
Additionally, the Fund is permitted to temporarily carry a negative or overdrawn balance in its account with State Street Bank and Trust Company, the custodian bank. To compensate the custodian bank for such overdrafts, the overdrawn Fund may either (1) leave funds as a compensating balance in the account so the custodian bank can be compensated by earning the additional interest; or (2) compensate by paying the custodian bank at a rate agreed upon by the custodian bank and Invesco, not to exceed the contractually agreed upon rate.
NOTE 8—Distributions to Shareholders and Tax Components of Net Assets
Tax Character of Distributions to Shareholders Paid During the Period August 1, 2011 to October 31, 2011 and the
Years Ended July 31, 2011 and 2010:
| | | | | | | | | | | | | |
| | | Three months ended
| | Year ended
| | Year ended
|
| | | October 31, 2011 | | July 31, 2011 | | July 31, 2010 |
| |
| Ordinary income | | $ | — | | | $ | 2,451,490 | | | $ | — | |
| |
19 Invesco Commodities Strategy Fund
Tax Components of Net Assets at Period-End:
As of October 31, 2011, the components of net assets on a tax basis were as follows:
| | | | | |
| | | 2011 |
| |
| Undistributed ordinary income | | $ | 7,650,776 | |
| |
| Undistributed long-term gain | | | 9,830,344 | |
| |
| Net unrealized appreciation — investments | | | 1,437,141 | |
| |
| Net unrealized appreciation — other investments | | | 718,366 | |
| |
| Temporary book/tax differences | | | (66,960 | ) |
| |
| Capital loss carryforward | | | (12,928,867 | ) |
| |
| Shares of beneficial interest | | | 84,177,303 | |
| |
| Total net assets | | $ | 90,818,103 | |
| |
The difference between book-basis and tax-basis unrealized appreciation (depreciation) is due to differences in the timing of recognition of gains and losses on investments for tax and book purposes. The Fund’s net unrealized appreciation difference is attributable primarily to partnership distributions and swap agreements adjustments.
The temporary book/tax differences are a result of timing differences between book and tax recognition of income and/or expenses. The Fund’s temporary book/tax differences are the result of the trustee deferral of compensation and retirement plan benefits.
Capital loss carryforward is calculated and reported as of a specific date. Results of transactions and other activity after that date may affect the amount of capital loss carryforward actually available for the Fund to utilize. The Regulated Investment Company Modernization Act of 2010 (the “Act”) eliminated the eight-year carryover period for capital losses that arise in taxable years beginning after its enactment date of December 22, 2010. Consequently, these capital losses can be carried forward for an unlimited period. However, capital losses with an expiration period may not be used to offset capital gains until all net capital losses without an expiration date have been utilized. Additionally, post-enactment capital loss carryovers will retain their character as either short-term or long-term capital losses instead of as short-term capital losses as under prior law. The ability to utilize capital loss carryforward in the future may be limited under the Internal Revenue Code and related regulations based on the results of future transactions. Under these limitation rules, the Fund is limited to utilizing $5,596,943 of capital loss carryforward in the fiscal year ending October 31, 2012.
The Fund has a capital loss carryforward as of October 31, 2011, which expires as follows:
| | | | | | | | | | | | | |
| | | Capital Loss Carryforward* |
| | | |
| Expiration | | Short-Term | | Long-Term | | Total |
| |
| October 31, 2016 | | $ | 9,263,864 | | | $ | — | | | $ | 9,263,864 | |
| |
| October 31, 2017 | | | 276,503 | | | | — | | | | 276,503 | |
| |
| Not subject to expiration | | | 3,368,467 | | | | 20,033 | | | | 3,388,500 | |
| |
| Total capital loss carryforward | | $ | 12,908,834 | | | $ | 20,033 | | | $ | 12,928,867 | |
| |
| |
| * | Capital loss carryforward as of the date listed above is reduced for limitations, if any, to the extent required by the Internal Revenue Code. |
NOTE 9—Investment Securities
The aggregate amount of investment securities (other than short-term securities, U.S. Treasury obligations and money market funds, if any) purchased and sold by the Fund during the period August 1, 2011 to October 31, 2011 was $11,540,000 and $10,406,653, respectively. Cost of investments on a tax basis includes the adjustments for financial reporting purposes as of the most recently completed Federal income tax reporting period-end.
| | | | | |
| Unrealized Appreciation (Depreciation) of Investment Securities on a Tax Basis |
| |
| Aggregate unrealized appreciation of investment securities | | $ | 1,437,141 | |
| |
| Aggregate unrealized (depreciation) of investment securities | | | — | |
| |
| Net unrealized appreciation of investment securities | | $ | 1,437,141 | |
| |
| Cost of investments for tax purposes is $88,951,994. |
NOTE 10—Reclassification of Permanent Differences
Primarily as a result of differing book/tax treatment of disallowed capital loss carryforward, net operating losses and net capital gains from the Subsidiary, on October 31, 2011, undistributed net investment income (loss) was increased by $357,403, undistributed net realized gain (loss) was increased by $3,360,193 and shares of beneficial interest decreased by $3,717,596. This reclassification had no effect on the net assets of the Fund.
20 Invesco Commodities Strategy Fund
NOTE 11—Share Information
| | | | | | | | | | | | | | | | | | | | | | | | | |
| | | Summary of Share Activity |
| |
| | | Three months ended
| | |
| | | October 31,
| | Year ended July 31, |
| | | 2011(a) | | 2011 | | 2010 |
| | | Shares | | Amount | | Shares | | Amount | | Shares | | Amount |
| |
| Sold: | | | | | | | | | | | | | | | | | | | | | | | | |
| Class A | | | 11,048 | | | $ | 233,249 | | | | 313,129 | | | $ | 6,674,587 | | | | 133,071 | | | $ | 2,443,431 | |
| |
Class B(b) | | | 3,151 | | | | 65,990 | | | | 33,974 | | | | 718,223 | | | | — | | | | — | |
| |
| Class C | | | 1,562 | | | | 33,168 | | | | 128,378 | | | | 2,749,015 | | | | 22,326 | | | | 415,210 | |
| |
| Class R | | | 426 | | | | 8,646 | | | | 8,631 | | | | 180,566 | | | | 913 | | | | 17,280 | |
| |
| Class Y | | | 269 | | | | 5,759 | | | | 15,772 | | | | 342,594 | | | | 192,434 | | | | 3,531,920 | |
| |
Institutional Class(b) | | | — | | | | — | | | | 29,414 | | | | 562,629 | | | | 96,495 | | | | 1,718,197 | |
| |
| Issued as reinvestment of dividends: | | | | | | | | | | | | | | | | | | | | | | | | |
| Class A | | | — | | | | — | | | | 84,559 | | | | 1,747,833 | | | | — | | | | — | |
| |
| Class B | | | — | | | | — | | | | 9,483 | | | | 194,391 | | | | — | | | | — | |
| |
| Class C | | | — | | | | — | | | | 6,865 | | | | 140,802 | | | | — | | | | — | |
| |
| Class R | | | — | | | | — | | | | 121 | | | | 2,504 | | | | — | | | | — | |
| |
| Class Y | | | — | | | | — | | | | 6,067 | | | | 125,892 | | | | — | | | | — | |
| |
Issued in connection with acquisition:(c) | | | | | | | | | | | | | | | | | | | | | | | | |
| Class A | | | — | | | | — | | | | — | | | | — | | | | 4,398,198 | | | | 77,188,378 | |
| |
| Class B | | | — | | | | — | | | | — | | | | — | | | | 877,143 | | | | 15,297,433 | |
| |
| Class C | | | — | | | | — | | | | — | | | | — | | | | 410,565 | | | | 7,160,253 | |
| |
| Class Y | | | — | | | | — | | | | — | | | | — | | | | 304,313 | | | | 5,352,859 | |
| |
| Automatic conversion of Class B shares to Class A shares: | | | | | | | | | | | | | | | | | | | | | | | | |
| Class A | | | 22,654 | | | | 467,073 | | | | 100,110 | | | | 2,107,668 | | | | 36,656 | | | | 658,711 | |
| |
| Class B | | | (22,987 | ) | | | (467,073 | ) | | | (101,248 | ) | | | (2,107,668 | ) | | | (36,975 | ) | | | (658,711 | ) |
| |
| Reacquired: | | | | | | | | | | | | | | | | | | | | | | | | |
| Class A | | | (204,114 | ) | | | (4,260,419 | ) | | | (1,012,867 | ) | | | (21,199,680 | ) | | | (699,405 | ) | | | (12,740,711 | ) |
| |
| Class B | | | (27,518 | ) | | | (566,073 | ) | | | (139,391 | ) | | | (2,926,790 | ) | | | (226,105 | ) | | | (4,074,288 | ) |
| |
| Class C | | | (89,767 | ) | | | (1,723,122 | ) | | | (104,379 | ) | | | (2,151,477 | ) | | | (135,446 | ) | | | (2,455,114 | ) |
| |
| Class R | | | (194 | ) | | | (4,063 | ) | | | (174 | ) | | | (3,904 | ) | | | (5,048 | ) | | | (93,014 | ) |
| |
| Class Y | | | (3,231 | ) | | | (68,836 | ) | | | (124,534 | ) | | | (2,476,882 | ) | | | (2,169,421 | ) | | | (40,907,849 | ) |
| |
| Institutional Class | | | — | | | | — | | | | (93,343 | ) | | | (1,861,282 | ) | | | (29,935 | ) | | | (526,094 | ) |
| |
| Net increase (decrease) in share activity | | | (308,701 | ) | | $ | (6,275,701 | ) | | | (839,433 | ) | | $ | (17,180,979 | ) | | | 3,169,779 | | | $ | 52,327,891 | |
| |
| | |
| (a) | | There is an entity that is a record owner of more than 5% of the outstanding shares of the Fund and owns 72% of the outstanding shares of the Fund. IDI has an agreement with this entity to sell Fund shares. The Fund, Invesco and/or Invesco affiliates may make payments to this entity, which is considered to be related to the Fund, for providing services to the Fund, Invesco and/or Invesco affiliates including but not limited to services such as, securities brokerage, distribution, third party record keeping and account servicing. The Fund has no knowledge as to whether all or any portion of the shares owned of record by this entity are also owned beneficially. |
| (b) | | Commencement date of February 5, 2010 and June 1, 2010 for Class B and Institutional Class, respectively. |
| (c) | | As of the opening of business on February 8, 2010, the Fund acquired all the net assets of Morgan Stanley Natural Resource Development Securities Inc. pursuant to a plan of reorganization approved by the Trustees of the Fund on September 24, 2009 and by the shareholders of Morgan Stanley Natural Resource Development Securities Inc. on January 12, 2010. The acquisition was accomplished by a tax-free exchange of 5,990,219 shares of the Fund for 9,831,116 shares outstanding of Morgan Stanley Natural Resource Development Securities Inc. as of the close of business on February 5, 2010. Each class of Morgan Stanley Natural Resource Development Securities Inc. was exchanged for the like class of shares of the Fund based on the relative net asset value of Morgan Stanley Natural Resource Development Securities Inc. to the net asset value of the Fund on the close of business, February 5, 2010. Morgan Stanley Natural Resource Development Securities Inc.’s net assets at that date of $104,998,923 were combined with those of the Fund. The net assets of the Fund immediately before the acquisition were $42,605,601. |
21 Invesco Commodities Strategy Fund
NOTE 12—Consolidated Financial Highlights
The following schedule presents financial highlights for a share of the Fund outstanding throughout the periods indicated.
| | | | | | | | | | | | | | | | | | | | | | | | | | | | | | | | | | | | | | | | | | | | | | | | | | | | | |
| | | | | | | | | | | | | | | | | | | Ratio of
| | Ratio of
| | | | | | |
| | | | | | | | | | | | | | | | | | | expenses
| | expenses
| | | | | | |
| | | | | | | Net gains
| | | | | | | | | | | | to average
| | to average net
| | Ratio of net
| | | | |
| | | Net asset
| | Net
| | (losses) on
| | | | Dividends
| | | | | | | | net assets
| | assets without
| | investment
| | | | |
| | | value,
| | investment
| | securities (both
| | Total from
| | from net
| | Net asset
| | | | Net assets,
| | with fee waivers
| | fee waivers
| | income (loss)
| | | | |
| | | beginning
| | income
| | realized and
| | investment
| | investment
| | value, end
| | Total
| | end of period
| | and/or expenses
| | and/or expenses
| | to average
| | Rebate from
| | Portfolio
|
| | | of period | | (loss)(a) | | unrealized) | | operations | | income | | of period | | return(b) | | (000s omitted) | | absorbed | | absorbed | | net assets | | affiliates | | turnover(c) |
| |
| Class A |
| Three months ended 10/31/11 | | $ | 22.13 | | | $ | (0.06 | ) | | $ | (1.83 | ) | | $ | (1.89 | ) | | $ | — | | | $ | 20.24 | | | | (8.54 | )% | | $ | 70,653 | | | | 1.25 | %(d) | | | 1.32 | %(d) | | | (1.13 | )%(d) | | | — | % | | | 22 | % |
| Year ended 07/31/11 | | | 18.45 | | | | (0.21 | ) | | | 4.38 | | | | 4.17 | | | | (0.49 | ) | | | 22.13 | | | | 22.82 | | | | 81,005 | | | | 1.17 | | | | 1.21 | | | | (0.98 | ) | | | — | | | | 69 | |
| Year ended 07/31/10 | | | 18.19 | | | | (0.18 | )(e) | | | 0.44 | (e) | | | 0.26 | | | | — | | | | 18.45 | | | | 1.43 | | | | 77,046 | | | | 1.15 | (e) | | | 1.21 | (e) | | | (1.00 | )(e) | | | — | | | | 131 | |
| Year ended 07/31/09 | | | 29.55 | | | | (0.07 | )(e) | | | (10.90 | )(e) | | | (10.97 | ) | | | (0.39 | ) | | | 18.19 | | | | (36.93 | ) | | | 5,528 | | | | 1.45 | (e)(f) | | | 2.53 | (e)(f) | | | (0.41 | )(e)(f))(g) | | | 0.05 | | | | 225 | |
| Year ended 07/31/08(h) | | | 30.00 | | | | 0.10 | (e) | | | (0.55 | )(e) | | | (0.45 | ) | | | — | | | | 29.55 | | | | (1.50 | ) | | | 6,342 | | | | 1.38 | (e)(f)(i) | | | 1.38 | (e)(f)(i) | | | 1.27 | (e)(f)(i) | | | 0.00 | (i)(j) | | | 6 | |
| |
| Class B |
| Three months ended 10/31/11 | | | 21.83 | | | | (0.10 | ) | | | (1.80 | ) | | | (1.90 | ) | | | — | | | | 19.93 | | | | (8.70 | ) | | | 7,366 | | | | 2.00 | (d) | | | 2.07 | (d) | | | (1.88 | )(d) | | | — | | | | 22 | |
| Year ended 07/31/11 | | | 18.27 | | | | (0.36 | ) | | | 4.32 | | | | 3.96 | | | | (0.40 | ) | | | 21.83 | | | | 21.83 | | | | 9,101 | | | | 1.92 | | | | 1.96 | | | | (1.73 | ) | | | — | | | | 69 | |
| Year ended 07/31/10(h) | | | 17.44 | | | | (0.15 | )(e) | | | 0.98 | (e) | | | 0.83 | | | | — | | | | 18.27 | | | | 4.76 | | | | 11,221 | | | | 1.90 | (e)(i) | | | 1.96 | (e)(i) | | | (1.75 | )(e)(i) | | | — | | | | 131 | |
| |
| Class C |
| Three months ended 10/31/11 | | | 21.87 | | | | (0.10 | ) | | | (1.80 | ) | | | (1.90 | ) | | | — | | | | 19.97 | | | | (8.69 | )(k) | | | 7,443 | | | | 1.98 | (d)(k) | | | 2.05 | (d)(k) | | | (1.86 | )(d)(k) | | | — | | | | 22 | |
| Year ended 07/31/11 | | | 18.27 | | | | (0.34 | ) | | | 4.34 | | | | 4.00 | | | | (0.40 | ) | | | 21.87 | | | | 22.05 | | | | 10,082 | | | | 1.80 | | | | 1.84 | | | | (1.61 | ) | | | — | | | | 69 | |
| Year ended 07/31/10 | | | 18.15 | | | | (0.32 | )(e) | | | 0.44 | (e) | | | 0.12 | | | | — | | | | 18.27 | | | | 0.66 | | | | 7,859 | | | | 1.90 | (e) | | | 1.96 | (e) | | | (1.75 | )(e) | | | — | | | | 131 | |
| Year ended 07/31/09 | | | 29.47 | | | | (0.21 | )(e) | | | (10.86 | )(e) | | | (11.07 | ) | | | (0.25 | ) | | | 18.15 | | | | (37.47 | ) | | | 2,408 | | | | 2.22 | (e)(f) | | | 3.30 | (e)(f) | | | (1.17 | )(e)(f)(g) | | | 0.05 | | | | 225 | |
| Year ended 07/31/08(h) | | | 30.00 | | | | 0.04 | (e) | | | (0.57 | )(e) | | | (0.53 | ) | | | — | | | | 29.47 | | | | (1.70 | ) | | | 5,111 | | | | 2.13 | (e(f)(i) | | | 2.13 | (e)(f)(i) | | | 0.53 | (e)(f)(i) | | | 0.00 | (i)(j) | | | 6 | |
| |
| Class R |
| Three months ended 10/31/11 | | | 22.04 | | | | (0.07 | ) | | | (1.82 | ) | | | (1.89 | ) | | | — | | | | 20.15 | | | | (8.58 | ) | | | 207 | | | | 1.50 | (d) | | | 1.57 | (d) | | | (1.38 | )(d) | | | — | | | | 22 | |
| Year ended 07/31/11 | | | 18.39 | | | | (0.27 | ) | | | 4.38 | | | | 4.11 | | | | (0.46 | ) | | | 22.04 | | | | 22.54 | | | | 222 | | | | 1.42 | | | | 1.46 | | | | (1.23 | ) | | | — | | | | 69 | |
| Year ended 07/31/10 | | | 18.18 | | | | (0.23 | )(e) | | | 0.44 | (e) | | | 0.21 | | | | — | | | | 18.39 | | | | 1.16 | | | | 27 | | | | 1.40 | (e) | | | 1.46 | (e) | | | (1.25 | )(e) | | | — | | | | 131 | |
| Year ended 07/31/09 | | | 29.53 | | | | (0.12 | )(e) | | | (10.90 | )(e) | | | (11.02 | ) | | | (0.33 | ) | | | 18.18 | | | | (37.13 | ) | | | 102 | | | | 1.72 | (e)(f) | | | 2.80 | (e)(f) | | | (0.67 | )(e)(f)(g) | | | 0.05 | | | | 225 | |
| Year ended 07/31/08(h) | | | 30.00 | | | | 0.03 | (e) | | | (0.50 | )(e) | | | (0.47 | ) | | | — | | | | 29.53 | | | | (1.57 | ) | | | 146 | | | | 1.68 | (e)(f)(i) | | | 1.68 | (e)(f)(i) | | | 0.39 | (e)(f)(i) | | | 0.00 | (i)(j) | | | 6 | |
| |
| Class Y |
| Three months ended 10/31/11 | | | 22.24 | | | | (0.05 | ) | | | (1.83 | ) | | | (1.88 | ) | | | — | | | | 20.36 | | | | (8.45 | ) | | | 5,095 | | | | 1.00 | (d) | | | 1.07 | (d) | | | (0.88 | )(d) | | | — | | | | 22 | |
| Year ended 07/31/11 | | | 18.52 | | | | (0.15 | ) | | | 4.39 | | | | 4.24 | | | | (0.52 | ) | | | 22.24 | | | | 23.11 | | | | 5,632 | | | | 0.92 | | | | 0.96 | | | | (0.73 | ) | | | — | | | | 69 | |
| Year ended 07/31/10 | | | 18.21 | | | | (0.14 | )(e) | | | 0.45 | (e) | | | 0.31 | | | | — | | | | 18.52 | | | | 1.70 | | | | 6,591 | | | | 0.90 | (e) | | | 0.96 | (e) | | | (0.75 | )(e) | | | — | | | | 131 | |
| Year ended 07/31/09 | | | 29.57 | | | | (0.03 | )(e) | | | (10.91 | )(e) | | | (10.94 | ) | | | (0.42 | ) | | | 18.21 | | | | (36.77 | ) | | | 36,939 | | | | 1.22 | (e)(f) | | | 2.30 | (e)(f) | | | (0.17 | )(e)(f)(g) | | | 0.05 | | | | 225 | |
| Year ended 07/31/08(h) | | | 30.00 | | | | 0.07 | (e) | | | (0.50 | )(e) | | | (0.43 | ) | | | — | | | | 29.57 | | | | (1.47 | ) | | | 49,066 | | | | 1.19 | (e)(f)(i) | | | 1.19 | (e)(f)(i) | | | 0.88 | (e)(f)(i) | | | 0.00 | (i)(j) | | | 6 | |
| |
| Institutional Class |
| Three months ended 10/31/11 | | | 22.32 | | | | (0.04 | ) | | | (1.84 | ) | | | (1.88 | ) | | | — | | | | 20.44 | | | | (8.42 | ) | | | 54 | | | | 0.82 | (d) | | | 0.87 | (d) | | | (0.70 | )(d) | | | — | | | | 22 | |
| Year ended 07/31/11 | | | 18.53 | | | | (0.11 | ) | | | 4.39 | | | | 4.28 | | | | (0.49 | ) | | | 22.32 | | | | 23.28 | | | | 59 | | | | 0.75 | | | | 0.79 | | | | (0.56 | ) | | | — | | | | 69 | |
| Year ended 07/31/10(h) | | | 17.29 | | | | (0.02 | )(e) | | | 1.26 | (e) | | | 1.24 | | | | — | | | | 18.53 | | | | 7.17 | | | | 1,233 | | | | 0.89 | (e)(i) | | | 0.95 | (e)(i) | | | (0.74 | )(e)(i) | | | — | | | | 131 | |
| |
| | |
| (a) | | Calculated using average shares outstanding. |
| (b) | | Includes adjustments in accordance with accounting principles generally accepted in the United States of America and as such, the net asset value for financial reporting purposes and the returns based upon those net asset values may differ from the net asset value and returns for shareholder transactions. Does not include sales charges and is not annualized for periods less than one year, if applicable. |
| (c) | | Portfolio turnover is calculated at the fund level and is not annualized for periods less than one year, if applicable. |
| (d) | | Ratios are annualized and based on average daily net assets (000’s) of $74,154, $8,106, $8,801 $, $211, $5,252 and $55 for Class A, Class B, Class C, Class R, Class Y and Institutional Class shares, respectively. |
| (e) | | Effective January 31, 2011, the Fund began reporting operations of its wholly-owned subsidiary on a consolidated basis. Had the Fund reported on a consolidated basis in prior periods, ratio of expenses to average net assets without fee waivers and/or expense reimbursements would have increased by 0.13%, 0.18% and 0.04% for the years ended July 31, 2008, 2009 and 2010, respectively. The ratio of expenses to average net assets with fee waivers and/or expense reimbursements would have increased 0.00%, 0.00% and 0.02%, respectively for the same time period. The ratio of net investment income (loss) to average net assets would have increased 0.14%, 0.08% and 0.00% for the years ended July 31, 2008, 2009 and 2010, respectively. This change did not have a material impact to net investment income (loss) per share or net realized and unrealized gain (loss) per share. |
| (f) | | The ratios reflect the rebate of certain Fund expenses in connection with investments in a Morgan Stanley affiliate during the period. The effect of the rebate on the ratios is disclosed in the above table as “Rebate from affiliates”. |
| (g) | | Ratio of net investment income (loss) to average net assets without fee waivers and/or expense reimbursements for Class A, Class C, Class R and Class Y was (1.48)%, (2.25)%, (1.75)% and (1.25)%, respectively, for the year ended July 31, 2009. |
| (h) | | Commencement date of April 30, 2008 for Class A, Class C Class R and Class Y shares. Commencement date of February 5, 2010 and June 1, 2010 for Class B and Institutional Class shares, respectively. |
| (i) | | Annualized. |
| (j) | | Amount is less than 0.005%. |
| (k) | | The total return, ratio of expenses to average net assets and ratio of net investment income (loss) to average net assets reflect actual 12b-1 fees of 0.98% for the period ended October 31, 2011. |
NOTE 13—Proposed Reorganization
The Board of Trustees of the Fund unanimously approved an Agreement and Plan of Reorganization (the “Agreement”) pursuant to which the Fund would transfer all of its assets and liabilities to Invesco Balanced-Risk Commodity Strategy Fund (the “Acquiring Fund”).
The Agreement requires approval of the Fund’s shareholders and will be submitted to the shareholders for their consideration at a meeting to be held in or around April 2012. Upon closing of the reorganization, shareholders of the Fund will receive a corresponding class of shares of the Acquiring Fund in exchange for their shares of the Fund and the Fund will liquidate and cease operations.
22 Invesco Commodities Strategy Fund
Report of Independent Registered Public Accounting Firm
To the Board of Trustees of AIM Investment Funds (Invesco Investment Funds)
and Shareholders of Invesco Commodities Strategy Fund:
In our opinion, the accompanying consolidated statement of assets and liabilities, including the consolidated schedule of investments, and the related consolidated statements of operations and of changes in net assets and the consolidated financial highlights present fairly, in all material respects, the consolidated financial position of Invesco Commodities Strategy Fund (one of the funds constituting AIM Investment Funds (Invesco Investment Funds), hereafter referred to as the “Fund”) at October 31, 2011, the results of its operations for the period then ended and for the year ended July 31, 2011, the changes in its net assets and the financial highlights for the period then ended and each of the two years in the period ended July 31, 2011, in conformity with accounting principles generally accepted in the United States of America. These consolidated financial statements and financial highlights (hereafter referred to as “financial statements”) are the responsibility of the Fund’s management; our responsibility is to express an opinion on these financial statements based on our audits. We conducted our audits of these financial statements in accordance with the standards of the Public Company Accounting Oversight Board (United States). Those standards require that we plan and perform the audit to obtain reasonable assurance about whether the financial statements are free of material misstatement. An audit includes examining, on a test basis, evidence supporting the amounts and disclosures in the financial statements, assessing the accounting principles used and significant estimates made by management, and evaluating the overall financial statement presentation. We believe that our audits, which included confirmation of securities at October 31, 2011 by correspondence with the custodian and brokers, provide a reasonable basis for our opinion. The financial highlights of the Fund for the periods ended July 31, 2009 and prior were audited by other independent auditors whose report dated September 29, 2009 expressed an unqualified opinion on those financial statements.
PRICEWATERHOUSECOOPERS LLP
Houston, Texas
December 27, 2011
23 Invesco Commodities Strategy Fund
Calculating your ongoing Fund expenses
Example
As a shareholder of the Fund, you incur two types of costs: (1) transaction costs, which may include sales charges (loads) on purchase payments or contingent deferred sales charges on redemptions, and redemption fees, if any; and (2) ongoing costs, including management fees, distribution and/or service (12b-1) fees, and other Fund expenses. This example is intended to help you understand your ongoing costs (in dollars) of investing in the Fund and to compare these costs with ongoing costs of investing in other mutual funds. The example is based on an investment of $1,000 invested at the beginning of the period and held for the entire period May 1, 2011 through October 31, 2011.
Actual expenses
The table below provides information about actual account values and actual expenses. You may use the information in this table, together with the amount you invested, to estimate the expenses that you paid over the period. Simply divide your account value by $1,000 (for example, an $8,600 account value divided by $1,000 = 8.6), then multiply the result by the number in the table under the heading entitled “Actual Expenses Paid During Period” to estimate the expenses you paid on your account during this period.
Hypothetical example for comparison purposes
The table below also provides information about hypothetical account values and hypothetical expenses based on the Fund’s actual expense ratio and an assumed rate of return of 5% per year before expenses, which is not the Fund’s actual return.
The hypothetical account values and expenses may not be used to estimate the actual ending account balance or expenses you paid for the period. You may use this information to compare the ongoing costs of investing in the Fund and other funds. To do so, compare this 5% hypothetical example with the 5% hypothetical examples that appear in the shareholder reports of the other funds.
Please note that the expenses shown in the table are meant to highlight your ongoing costs only and do not reflect any transaction costs, such as sales charges (loads) on purchase payments, contingent deferred sales charges on redemptions, and redemption fees, if any. Therefore, the hypothetical information is useful in comparing ongoing costs only, and will not help you determine the relative total costs of owning different funds. In addition, if these transaction costs were included, your costs would have been higher.
| | | | | | | | | | | | | | | | | | | | | | | | | | | | | | | |
| | | | | | | | | | HYPOTHETICAL
| | | |
| | | | | | | ACTUAL | | | (5% annual return before expenses) | | | |
| | | | Beginning
| | | Ending
| | | Expenses
| | | Ending
| | | Expenses
| | | Annualized
|
| | | | Account Value
| | | Account Value
| | | Paid During
| | | Account Value
| | | Paid During
| | | Expense
|
| Class | | | (05/01/11) | | | (10/31/11)1 | | | Period2 | | | (10/31/11) | | | Period2 | | | Ratio |
| A | | | $ | 1,000.00 | | | | $ | 858.40 | | | | $ | 5.81 | | | | $ | 1,018.95 | | | | $ | 6.31 | | | | | 1.24 | % |
| | | | | | | | | | | | | | | | | | | | | | | | | | | | | | | |
| B | | | | 1,000.00 | | | | | 854.60 | | | | | 9.30 | | | | | 1,015.17 | | | | | 10.11 | | | | | 1.99 | |
| | | | | | | | | | | | | | | | | | | | | | | | | | | | | | | |
| C | | | | 1,000.00 | | | | | 856.00 | | | | | 8.75 | | | | | 1,015.78 | | | | | 9.50 | | | | | 1.87 | |
| | | | | | | | | | | | | | | | | | | | | | | | | | | | | | | |
| R | | | | 1,000.00 | | | | | 857.40 | | | | | 6.98 | | | | | 1,017.69 | | | | | 7.58 | | | | | 1.49 | |
| | | | | | | | | | | | | | | | | | | | | | | | | | | | | | | |
| Y | | | | 1,000.00 | | | | | 859.40 | | | | | 4.64 | | | | | 1,020.21 | | | | | 5.04 | | | | | 0.99 | |
| | | | | | | | | | | | | | | | | | | | | | | | | | | | | | | |
| Institutional | | | | 1,000.00 | | | | | 860.20 | | | | | 2.91 | | | | | 1,022.08 | | | | | 3.16 | | | | | 0.62 | |
| | | | | | | | | | | | | | | | | | | | | | | | | | | | | | | |
| |
| 1 | The actual ending account value is based on the actual total return of the Fund for the period May 1, 2011 through October 31, 2011, after actual expenses and will differ from the hypothetical ending account value which is based on the Fund’s expense ratio and a hypothetical annual return of 5% before expenses. |
| 2 | Expenses are equal to the Fund’s annualized expense ratio as indicated above multiplied by the average account value over the period, multiplied by 184/365 to reflect the most recent fiscal half year. |
24 Invesco Commodities Strategy Fund
| |
| Approval of Investment Advisory and Sub-Advisory Contracts |
The Board of Trustees (the Board) of AIM Investment Funds (Invesco Investment Funds) is required under the Investment Company Act of 1940, as amended, to approve annually the renewal of the Invesco Commodities Strategy Fund (the Fund) investment advisory agreement with Invesco Advisers, Inc. (Invesco Advisers) and the Master Intergroup Sub-Advisory Contract for Mutual Funds (the sub-advisory contracts) with Invesco Asset Management Deutschland GmbH, Invesco Asset Management Limited, Invesco Asset Management (Japan) Limited, Invesco Australia Limited, Invesco Hong Kong Limited, Invesco Senior Secured Management, Inc. and Invesco Canada Ltd. (collectively, the Affiliated Sub-Advisers). During contract renewal meetings held on June 14-15, 2011, the Board as a whole, and the disinterested or “independent” Trustees, who comprise 80% of the Board, voting separately, approved the continuance of the Fund’s investment advisory agreement and the sub-advisory contracts for another year, effective July 1, 2011. In doing so, the Board considered the process that it follows in reviewing and approving the Fund’s investment advisory agreement and sub-advisory contracts and the information that it is provided. The Board determined that the Fund’s investment advisory agreement and the sub-advisory contracts are in the best interests of the Fund and its shareholders and the compensation to Invesco Advisers and the Affiliated Sub-Advisers under the agreements is fair and reasonable.
The Board’s Fund Evaluation Process
The Board’s Investments Committee has established three Sub-Committees, each of which is responsible for overseeing the management of a number of the series portfolios of the funds advised by Invesco Advisers (the Invesco Funds). The Sub-Committees meet throughout the year to review the performance of their assigned funds, including reviewing materials prepared under the direction of the independent Senior Officer, an officer of the Invesco Funds who reports directly to the independent Trustees. Over the course of each year, the Sub-Committees meet with portfolio managers for their assigned Invesco Funds and other members of management to review the performance, investment objective(s), policies, strategies and limitations and investment risks of these funds. The Sub-Committees meet regularly and at designated contract renewal meetings each year to conduct a review of the performance, fees, expenses and other matters related to their assigned Invesco Funds. Each Sub-Committee recommends to the Investments Committee, which in turn recommends to the full Board, whether to approve the continuance of each Invesco Fund’s investment advisory agreement and sub-advisory contracts for another year.
During the contract renewal process, the Trustees receive comparative performance and fee data regarding the Invesco Funds prepared by Invesco Advisers and an independent company, Lipper, Inc. (Lipper). The Trustees also receive an independent written evaluation from the Senior Officer. The Senior Officer’s evaluation is prepared as part of his responsibility to manage the process by which the Invesco Funds’ proposed management fees are negotiated during the annual contract renewal process to ensure they are negotiated in a manner that is at arms’ length and reasonable. The independent Trustees are assisted in their annual evaluation of the Fund’s investment advisory agreement by the Senior Officer and by independent legal counsel. The independent Trustees also discuss the continuance of the investment advisory agreement and sub-advisory contracts in private sessions with the Senior Officer and counsel.
In evaluating the fairness and reasonableness of the Fund’s investment advisory agreement and sub-advisory contracts, the Board considered, among other things, the factors discussed below. The Trustees also considered information provided in connection with fund acquisitions approved by the Trustees to rationalize the Invesco Funds product range following the acquisition of the retail mutual fund business of Morgan Stanley (the Morgan Stanley Transaction). The Trustees recognized that the advisory fees for the Invesco Funds include advisory fees that are the result of years of review and negotiation between the Trustees and Invesco Advisers as well as advisory fees inherited from Morgan Stanley and Van Kampen funds acquired in the Morgan Stanley Transaction. The Trustees’ deliberations and conclusions in a particular year may be based in part on their deliberations and conclusions regarding these same arrangements throughout the year and in prior years. One Trustee may have weighed a particular piece of information differently than another Trustee.
The discussion below serves as the Senior Officer’s independent written evaluation with respect to the Fund’s investment advisory agreement as well as a discussion of the material factors and related conclusions that formed the basis for the Board’s approval of the Fund’s investment advisory agreement and sub-advisory contracts. Unless otherwise stated, this information is current as of June 15, 2011, and may not reflect consideration of factors that became known to the Board after that date, including, for example, changes to the Fund’s performance, advisory fees, expense limitations and/or fee waivers.
Factors and Conclusions and Summary of Independent Written Fee Evaluation
| |
| A. | Nature, Extent and Quality of Services Provided by Invesco Advisers and the Affiliated Sub-Advisers |
The Board reviewed the advisory services provided to the Fund by Invesco Advisers under the Fund’s investment advisory agreement, the performance of Invesco Advisers in providing these services, and the credentials and experience of the officers and employees of Invesco Advisers who provide these services, including the Fund’s portfolio manager or managers, with whom the Board met during the year. The Board’s review of the qualifications of Invesco Advisers to provide advisory services included the Board’s consideration of Invesco Advisers’ performance and investment process oversight, independent credit analysis and investment risk management.
In determining whether to continue the Fund’s investment advisory agreement, the Board considered the prior relationship between Invesco Advisers and the Fund, as well as the Board’s knowledge of Invesco Advisers’ operations, and concluded that it is beneficial to maintain the current relationship, in part, because of such knowledge. The Board also considered services that Invesco Advisers and its affiliates provide to the Invesco Funds such as various back office support functions, equity and fixed income trading operations, internal audit, distribution and legal and compliance. The Board concluded that the nature, extent and quality of the services provided to the Fund by Invesco Advisers are appropriate and satisfactory and the advisory services are provided in accordance with the terms of the Fund’s investment advisory agreement.
The Board reviewed the services provided by the Affiliated Sub-Advisers under the sub-advisory contracts and the credentials and experience of the officers and employees of the Affiliated Sub-Advisers who provide these services. The Board noted that the Affiliated Sub-Advisers have offices and personnel that are located in financial centers around the world. As a result, the Affiliated Sub-Advisers can provide research and investment analysis on the markets and economies of various countries in which the Fund invests and make recommendations on securities of companies located in such countries. The Board concluded that the sub-advisory contracts benefit the Fund and its shareholders by permitting Invesco Advisers to use the resources and talents of the Affiliated Sub-Advisers in managing the Fund. The Board concluded that the nature, extent and quality of the services provided by the Affiliated Sub-Advisers are appropriate and satisfactory and in accordance with the terms of the Fund’s sub-advisory contracts.
The Board considered Fund performance as a relevant factor in considering whether to approve the investment advisory agreement as well as the sub-advisory contracts for the Fund, as Invesco Asset Management Limited currently manages assets of the Fund.
The Board noted that the Fund recently began operations and that comparative performance data
25 Invesco Commodities Strategy Fund
for only the past two calendar years was available. The Board noted that performance of Class A shares of the Fund was in the third quintile of the performance universe for the one and two year periods (the first quintile being the best performing funds and the fifth quintile being the worst performing funds). The Board also noted that performance of the Fund was below the DJ-UBS Commodity TR Index for the one year period ending December 31, 2010. Although the independent written evaluation of the Fund’s Senior Officer only considered Fund performance through the most recent calendar year, the Trustees also reviewed more recent Fund performance and this review did not change their conclusions.
| |
| C. | Advisory and Sub-Advisory Fees and Fee Waivers |
The Board compared the Fund’s contractual advisory fee rate to the contractual advisory fee rates of funds in the Fund’s Lipper expense group at a common asset level. The Board noted that the contractual advisory fee rate for Class A shares of the Fund was at the median contractual advisory fee rate of funds in the expense group. The Board also reviewed the methodology used by Lipper in providing expense group information, which includes using audited financial data from the most recent annual report of each fund in the expense group that was publicly available as of the end of the past calendar year and including only one fund per investment adviser. The Board noted that comparative data is as of varying dates, which may affect the comparability of data during times of market volatility.
The Board also compared the Fund’s effective fee rate (the advisory fee after advisory fee waivers and before expense limitations/waivers) to the advisory fee rates of other mutual funds advised by Invesco Advisers and its affiliates with investment strategies comparable to those of the Fund. The Board noted that the Fund’s rate was below the rate of one mutual fund with comparable investment strategies.
The Board also considered the fees charged by Invesco Advisers and the Affiliated Sub-Advisers to other client accounts with investment strategies comparable to those of the Fund. The Board noted that Invesco Advisers or the Affiliated Sub-Advisers may charge lower fees to large institutional clients solely for investment management services. Invesco Advisers reviewed with the Board the significantly greater scope of services it provides to the Invesco Funds relative to other client accounts. These additional services include provision of administrative services, officers and office space, oversight of service providers, preparation of annual registration statement updates and financial information and regulatory compliance under the Investment Company Act of 1940, as amended. Invesco Advisers also reviewed generally the higher frequency of shareholder purchases and redemptions in the Invesco Funds relative to the flow of assets for other client accounts. Invesco Advisers advised the Board that advance notice of redemptions is often provided to Invesco Advisers by institutional clients. The Board did note that sub-advisory fees charged by the Affiliated Sub-Advisers to manage the Invesco Funds and to manage other client accounts were often more comparable. The Board concluded that the aggregate services provided to the Invesco Funds were sufficiently different from those provided to institutional clients, and the Board not place significant weight on these fee comparisons.
The Board noted that Invesco Advisers has contractually agreed to waive fees and/or limit expenses of the Fund through at least June 30, 2012 in an amount necessary to limit total annual operating expenses to a specified percentage of average daily net assets for each class of the Fund. The Board noted that at the current expense ratio for the Fund, this expense waiver does not have any impact.
The Board also considered the services provided by the Affiliated Sub-Advisers pursuant to the sub-advisory contracts, as well as the allocation of fees between Invesco Advisers and the Affiliated Sub-Advisers pursuant to the sub-advisory contracts. The Board noted that Invesco Advisers provides services to sub-advised Invesco Funds, including oversight of the Affiliated Sub-Advisers as well as the additional services described above other than day-to-day portfolio management. The Board also noted that the sub-advisory fees have no direct effect on the Fund or its shareholders, as they are paid by Invesco Advisers to the Affiliated Sub-Advisers.
Based upon the information and considerations described above, the Board concluded that the Fund’s advisory and sub-advisory fees are fair and reasonable.
| |
| D. | Economies of Scale and Breakpoints |
The Board considered the extent to which there are economies of scale in the provision of advisory services to the Fund. The Board also considered whether the Fund benefits from economies of scale through contractual breakpoints in the Fund’s advisory fee schedule. The Board also noted that the Fund shares directly in economies of scale through lower fees charged by third party service providers based on the combined size of the Invesco Funds and other clients advised by Invesco Advisers.
| |
| E. | Profitability and Financial Resources |
The Board reviewed information from Invesco Advisers concerning the costs of the advisory and other services that Invesco Advisers and its affiliates provide to the Fund and the profitability of Invesco Advisers and its affiliates in providing these services. The Board reviewed with Invesco Advisers the methodology used to prepare the profitability information. The Board considered the profitability of Invesco Advisers in connection with managing the Fund and the Invesco Funds. The Board noted that Invesco Advisers continues to operate at a net profit from services Invesco Advisers and its subsidiaries provide to the Fund and the Invesco Funds. The Board concluded that the level of profits realized by Invesco Advisers and its affiliates from providing services to the Fund is not excessive given the nature, quality and extent of the services provided to the Invesco Funds. The Board considered whether Invesco Advisers and each Affiliated Sub-Adviser are financially sound and have the resources necessary to perform their obligations under the investment advisory agreement and sub-advisory contracts. The Board concluded that Invesco Advisers and each Affiliated Sub-Adviser have the financial resources necessary to fulfill these obligations.
| |
| F. | Collateral Benefits to Invesco Advisers and its Affiliates |
The Board considered various other benefits received by Invesco Advisers and its affiliates from the relationship with the Fund, including the fees received for their provision of administrative, transfer agency and distribution services to the Fund. The Board considered the performance of Invesco Advisers and its affiliates in providing these services and the organizational structure employed to provide these services. The Board also considered that these services are provided to the Fund pursuant to written contracts that are reviewed and approved on an annual basis by the Board; that the services are required for the operation of the Fund; that Invesco Advisers and its affiliates can provide services, the nature and quality of which are at least equal to those provided by others offering the same or similar services; and that the fees for such services are fair and reasonable in light of the usual and customary charges by others for services of the same nature and quality.
The Board considered the benefits realized by Invesco Advisers and the Affiliated Sub-Advisers as a result of portfolio brokerage transactions executed through “soft dollar” arrangements. Invesco Advisers noted that the Fund does not execute brokerage transactions through “soft dollar” arrangements to any significant degree.
The Board considered that the Fund’s uninvested cash and cash collateral from any securities lending arrangements may be invested in money market funds advised by Invesco Advisers pursuant to procedures approved by the Board. The Board noted that Invesco Advisers receives advisory fees from these affiliated money market funds attributable to such investments, although Invesco Advisers has contractually agreed to waive through varying periods the advisory fees payable by the Invesco Funds. The waiver is in an amount equal to 100% of the net advisory fee Invesco Advisers receives from the affiliated money market funds with respect to the Fund’s investment in the affiliated money market funds of uninvested cash, but not cash collateral. The Board concluded that the Fund’s investment of uninvested cash and cash collateral from any securities lending arrangements in the affiliated money market funds is in the best interests of the Fund and its shareholders.
26 Invesco Commodities Strategy Fund
Trustees and Officers
The address of each trustee and officer is AIM Investment Funds (Invesco Investment Funds) (the “Trust”), 11 Greenway Plaza, Suite 2500, Houston, Texas 77046-1173. The trustees serve for the life of the Trust, subject to their earlier death, incapacitation, resignation, retirement or removal as more specifically provided in the Trust’s organizational documents. Each officer serves for a one year term or until their successors are elected and qualified. Column two below includes length of time served with predecessor entities, if any.
| | | | | | | | | |
| | | | | | | Number of
| | |
| | | | | | | Funds in
| | |
| | | | | | | Fund Complex
| | |
Name, Year of Birth and
| | Trustee and/
| | Principal Occupation(s)
| | Overseen by
| | Other Directorship(s)
|
| Position(s) Held with the Trust | | or Officer Since | | During Past 5 Years | | Trustee | | Held by Trustee |
| | | | | | | | | |
| | | | | | | | | |
| Interested Persons | | | | | | | | |
| | | | | | | | | |
| | | | | | | | | |
| | | | | | | | | |
Martin L. Flanagan1 — 1960
Trustee | | 2007 | | Executive Director, Chief Executive Officer and President, Invesco Ltd. (ultimate parent of Invesco and a global investment management firm); Advisor to the Board, Invesco Advisers, Inc. (formerly known as Invesco Institutional (N.A.), Inc.); Trustee, The Invesco Funds; Vice Chair, Investment Company Institute; and Member of Executive Board, SMU Cox School of Business
Formerly: Chairman, Invesco Advisers, Inc. (registered investment adviser); Director, Chairman, Chief Executive Officer and President, IVZ Inc. (holding company), INVESCO Group Services, Inc. (service provider) and Invesco North American Holdings, Inc. (holding company); Director, Chief Executive Officer and President, Invesco Holding Company Limited (parent of Invesco and a global investment management firm); Director, Invesco Ltd.; Chairman, Investment Company Institute and President, Co-Chief Executive Officer, Co-President, Chief Operating Officer and Chief Financial Officer, Franklin Resources, Inc. (global investment management organization) | | 141 | | None |
| | | | | | | | | |
| | | | | | | | | |
| | | | | | | | | |
Philip A. Taylor2 — 1954
Trustee, President and
Principal Executive Officer | | 2006 | | Head of North American Retail and Senior Managing Director, Invesco Ltd.; Director, Co-Chairman, Co-President and Co-Chief Executive Officer, Invesco Advisers, Inc. (formerly known as Invesco Institutional (N.A.), Inc.) (registered investment adviser); Director, Chairman, Chief Executive Officer and President, Invesco Management Group, Inc. (formerly Invesco Aim Management Group, Inc.) (financial services holding company); Director and President, INVESCO Funds Group, Inc. (registered investment adviser and registered transfer agent); Director and Chairman, Invesco Investment Services, Inc. (formerly known as Invesco Aim Investment Services, Inc.) (registered transfer agent) and IVZ Distributors, Inc. (formerly known as INVESCO Distributors, Inc.) (registered broker dealer); Director, President and Chairman, Invesco Inc. (holding company) and Invesco Canada Holdings Inc. (holding company); Chief Executive Officer, Invesco Corporate Class Inc. (corporate mutual fund company) and Invesco Canada Fund Inc. (corporate mutual fund company); Director, Chairman and Chief Executive Officer, Invesco Canada Ltd. (formerly known as Invesco Trimark Ltd./Invesco Trimark Ltèe) (registered investment adviser and registered transfer agent); Trustee, President and Principal Executive Officer, The Invesco Funds (other than AIM Treasurer’s Series Trust (Invesco Treasurer’s Series Trust) and Short-Term Investments Trust); Trustee and Executive Vice President, The Invesco Funds (AIM Treasurer’s Series Trust (Invesco Treasurer’s Series Trust) and Short-Term Investments Trust only); Director, Invesco Investment Advisers LLC (formerly known as Van Kampen Asset Management); Director, Chief Executive Officer and President, Van Kampen Exchange Corp.
Formerly: Director and Chairman, Van Kampen Investor Services Inc.: Director, Chief Executive Officer and President, 1371 Preferred Inc. (holding company); and Van Kampen Investments Inc.; Director and President, AIM GP Canada Inc. (general partner for limited partnerships); and Van Kampen Advisors, Inc.; Director and Chief Executive Officer, Invesco Trimark Dealer Inc. (registered broker dealer); Director, Invesco Distributors, Inc. (formerly known as Invesco Aim Distributors, Inc.) (registered broker dealer); Manager, Invesco PowerShares Capital Management LLC; Director, Chief Executive Officer and President, Invesco Advisers, Inc.; Director, Chairman, Chief Executive Officer and President, Invesco Aim Capital Management, Inc.; President, Invesco Trimark Dealer Inc. and Invesco Trimark Ltd./Invesco Trimark Ltèe; Director and President, AIM Trimark Corporate Class Inc. and AIM Trimark Canada Fund Inc.; Senior Managing Director, Invesco Holding Company Limited; Trustee and Executive Vice President, Tax-Free Investments Trust; Director and Chairman, Fund Management Company (former registered broker dealer); President and Principal Executive Officer, The Invesco Funds (AIM Treasurer’s Series Trust (Invesco Treasurer’s Series Trust), Short-Term Investments Trust and Tax-Free Investments Trust only); President, AIM Trimark Global Fund Inc. and AIM Trimark Canada Fund Inc. | | 141 | | None |
| | | | | | | | | |
| | | | | | | | | |
| | | | | | | | | |
Wayne W. Whalen3 — 1939
Trustee | | 2010 | | Of Counsel, and prior to 2010, partner in the law firm of Skadden, Arps, Slate, Meagher & Flom LLP, legal counsel to funds in the Fund Complex | | 159 | | Director of the Abraham Lincoln Presidential Library Foundation |
| | | | | | | | | |
| | | | | | | | | |
| | | | | | | | | |
| Independent Trustees | | | | | | | | |
| | | | | | | | | |
| | | | | | | | | |
| | | | | | | | | |
Bruce L. Crockett — 1944
Trustee and Chair | | 2001 | | Chairman, Crockett Technology Associates (technology consulting company)
Formerly: Director, Captaris (unified messaging provider); Director, President and Chief Executive Officer COMSAT Corporation; and Chairman, Board of Governors of INTELSAT (international communications company) | | 141 | | ACE Limited (insurance company); and Investment Company Institute |
| | | | | | | | | |
| | | | | | | | | |
| | | | | | | | | |
David C. Arch — 1945
Trustee | | 2010 | | Chairman and Chief Executive Officer of Blistex Inc., a consumer health care products manufacturer. | | 159 | | Member of the Heartland Alliance Advisory Board, a nonprofit organization serving human needs based in Chicago. Board member of the Illinois Manufacturers’ Association. Member of the Board of Visitors, Institute for the Humanities, University of Michigan |
| | | | | | | | | |
| |
| 1 | Mr. Flanagan is considered an interested person of the Trust because he is an officer of the adviser to the Trust, and an officer and a director of Invesco Ltd., ultimate parent of the adviser to the Trust. |
| 2 | Mr. Taylor is considered an interested person of the Trust because he is an officer and a director of the adviser to, and a director of the principal underwriter of, the Trust. |
| 3 | Mr. Whalen has been deemed to be an interested person of the Trust because of his prior service as counsel to the predecessor funds of certain Invesco open-end funds and his affiliation with the law firm that served as counsel to such predecessor funds and continues to serve as counsel to the Invesco Van Kampen closed-end funds. |
T-1 Invesco Commodities Strategy Fund
Trustees and Officers—(continued)
The address of each trustee and officer is AIM Investment Funds (Invesco Investment Funds) (the “Trust”), 11 Greenway Plaza, Suite 2500, Houston, Texas 77046-1173. The trustees serve for the life of the Trust, subject to their earlier death, incapacitation, resignation, retirement or removal as more specifically provided in the Trust’s organizational documents. Each officer serves for a one year term or until their successors are elected and qualified. Column two below includes length of time served with predecessor entities, if any.
| | | | | | | | | |
| | | | | | | Number of
| | |
| | | | | | | Funds in
| | |
| | | | | | | Fund Complex
| | |
Name, Year of Birth and
| | Trustee and/
| | Principal Occupation(s)
| | Overseen by
| | Other Directorship(s)
|
| Position(s) Held with the Trust | | or Officer Since | | During Past 5 Years | | Trustee | | Held by Trustee |
| | | | | | | | | |
| | | | | | | | | |
| Independent Trustees—(continued) | | | | | | | | |
| | | | | | | | | |
| | | | | | | | | |
| | | | | | | | | |
Bob R. Baker — 1936
Trustee | | 2003 | | Retired
Formerly: President and Chief Executive Officer, AMC Cancer Research Center; and Chairman and Chief Executive Officer, First Columbia Financial Corporation | | 141 | | None |
| | | | | | | | | |
| | | | | | | | | |
| | | | | | | | | |
Frank S. Bayley — 1939
Trustee | | 1987 | | Retired
Formerly: Director, Badgley Funds, Inc. (registered investment company) (2 portfolios) and Partner, law firm of Baker & McKenzie | | 141 | | Director and Chairman, C.D. Stimson Company (a real estate investment company) |
| | | | | | | | | |
| | | | | | | | | |
| | | | | | | | | |
James T. Bunch — 1942
Trustee | | 2003 | | Founder, Green, Manning & Bunch Ltd. (investment banking firm)
Formerly: Executive Committee, United States Golf Association; and Director, Policy Studies, Inc. and Van Gilder Insurance Corporation | | 141 | | Vice Chairman, Board of Governors, Western Golf Association/Evans Scholars Foundation and Director, Denver Film Society |
| | | | | | | | | |
| | | | | | | | | |
| | | | | | | | | |
Rodney F. Dammeyer — 1940
Trustee | | 2010 | | President of CAC, LLC, a private company offering capital investment and management advisory services.
Formerly: Prior to January 2004, Director of TeleTech Holdings Inc.; Prior to 2002, Director of Arris Group, Inc.; Prior to 2001, Managing Partner at Equity Group Corporate Investments. Prior to 1995, Vice Chairman of Anixter International. Prior to 1985, experience includes Senior Vice President and Chief Financial Officer of Household International, Inc, Executive Vice President and Chief Financial Officer of Northwest Industries, Inc. and Partner of Arthur Andersen & Co. | | 159 | | Director of Quidel Corporation and Stericycle, Inc. Prior to May 2008, Trustee of The Scripps Research Institute. Prior to February 2008, Director of Ventana Medical Systems, Inc. Prior to April 2007, Director of GATX Corporation. Prior to April 2004, Director of TheraSense, Inc. |
| | | | | | | | | |
| | | | | | | | | |
| | | | | | | | | |
Albert R. Dowden — 1941
Trustee | | 2001 | | Director of a number of public and private business corporations, including the Boss Group, Ltd. (private investment and management); Reich & Tang Funds (5 portfolios) (registered investment company); and Homeowners of America Holding Corporation/ Homeowners of America Insurance Company (property casualty company)
Formerly: Director, Continental Energy Services, LLC (oil and gas pipeline service); Director, CompuDyne Corporation (provider of product and services to the public security market) and Director, Annuity and Life Re (Holdings), Ltd. (reinsurance company); Director, President and Chief Executive Officer, Volvo Group North America, Inc.; Senior Vice President, AB Volvo; Director of various public and private corporations; Chairman, DHJ Media, Inc.; Director Magellan Insurance Company; and Director, The Hertz Corporation, Genmar Corporation (boat manufacturer), National Media Corporation; Advisory Board of Rotary Power International (designer, manufacturer, and seller of rotary power engines); and Chairman, Cortland Trust, Inc. (registered investment company) | | 141 | | Board of Nature’s Sunshine Products, Inc. |
| | | | | | | | | |
| | | | | | | | | |
| | | | | | | | | |
Jack M. Fields — 1952
Trustee | | 2001 | | Chief Executive Officer, Twenty First Century Group, Inc. (government affairs company); and Owner and Chief Executive Officer, Dos Angelos Ranch, L.P. (cattle, hunting, corporate entertainment), Discovery Global Education Fund (non-profit) and Cross Timbers Quail Research Ranch (non-profit)
Formerly: Chief Executive Officer, Texana Timber LP (sustainable forestry company) and member of the U.S. House of Representatives | | 141 | | Administaff |
| | | | | | | | | |
| | | | | | | | | |
| | | | | | | | | |
Carl Frischling — 1937
Trustee | | 2001 | | Partner, law firm of Kramer Levin Naftalis and Frankel LLP | | 141 | | Director, Reich & Tang Funds (6 portfolios) |
| | | | | | | | | |
| | | | | | | | | |
| | | | | | | | | |
Prema Mathai-Davis — 1950
Trustee | | 2001 | | Retired
Formerly: Chief Executive Officer, YWCA of the U.S.A. | | 141 | | None |
| | | | | | | | | |
| | | | | | | | | |
| | | | | | | | | |
Larry Soll — 1942
Trustee | | 2003 | | Retired
Formerly, Chairman, Chief Executive Officer and President, Synergen Corp. (a biotechnology company) | | 141 | | None |
| | | | | | | | | |
| | | | | | | | | |
| | | | | | | | | |
Hugo F. Sonnenschein — 1940
Trustee | | 2010 | | President Emeritus and Honorary Trustee of the University of Chicago and the Adam Smith Distinguished Service Professor in the Department of Economics at the University of Chicago. Prior to July 2000, President of the University of Chicago. | | 159 | | Trustee of the University of Rochester and a member of its investment committee. Member of the National Academy of Sciences, the American Philosophical Society and a fellow of the American Academy of Arts and Sciences |
| | | | | | | | | |
| | | | | | | | | |
| | | | | | | | | |
Raymond Stickel, Jr. — 1944
Trustee | | 2005 | | Retired
Formerly: Director, Mainstay VP Series Funds, Inc. (25 portfolios) and Partner, Deloitte & Touche | | 141 | | Director of Long Cove Club Owners’ Association (home owner’s association) |
| | | | | | | | | |
T-2 Invesco Commodities Strategy Fund
Trustees and Officers—(continued)
The address of each trustee and officer is AIM Investment Funds (Invesco Investment Funds) (the “Trust”), 11 Greenway Plaza, Suite 2500, Houston, Texas 77046-1173. The trustees serve for the life of the Trust, subject to their earlier death, incapacitation, resignation, retirement or removal as more specifically provided in the Trust’s organizational documents. Each officer serves for a one year term or until their successors are elected and qualified. Column two below includes length of time served with predecessor entities, if any.
| | | | | | | | | |
| | | | | | | Number of
| | |
| | | | | | | Funds in
| | |
| | | | | | | Fund Complex
| | |
Name, Year of Birth and
| | Trustee and/
| | Principal Occupation(s)
| | Overseen by
| | Other Directorship(s)
|
| Position(s) Held with the Trust | | or Officer Since | | During Past 5 Years | | Trustee | | Held by Trustee |
| | | | | | | | | |
| | | | | | | | | |
| Other Officers | | | | | | | | |
| | | | | | | | | |
| | | | | | | | | |
| | | | | | | | | |
Russell C. Burk — 1958
Senior Vice President and Senior Officer | | 2005 | | Senior Vice President and Senior Officer of Invesco Funds | | N/A | | N/A |
| | | | | | | | | |
| | | | | | | | | |
| | | | | | | | | |
John M. Zerr — 1962
Senior Vice President, Chief Legal Officer and Secretary | | 2006 | | Director, Senior Vice President, Secretary and General Counsel, Invesco Management Group, Inc. (formerly known as Invesco Aim Management Group, Inc.) and Van Kampen Exchange Corp.; Senior Vice President, Invesco Advisers, Inc. (formerly known as Invesco Institutional (N.A.), Inc.) (registered investment adviser); Senior Vice President and Secretary, Invesco Distributors, Inc. (formerly known as Invesco Aim Distributors, Inc.); Director, Vice President and Secretary, Invesco Investment Services, Inc. (formerly known as Invesco Aim Investment Services, Inc.) and IVZ Distributors, Inc. (formerly known as INVESCO Distributors, Inc.); Director and Vice President, INVESCO Funds Group, Inc.; Senior Vice President, Chief Legal Officer and Secretary, The Invesco Funds; Manager, Invesco PowerShares Capital Management LLC; Director, Secretary and General Counsel, Invesco Investment Advisers LLC (formerly known as Van Kampen Asset Management); Secretary and General Counsel, Van Kampen Funds Inc. and Chief Legal Officer, PowerShares Exchange-Traded Fund Trust, PowerShares Exchange-Traded Fund Trust II, PowerShares India Exchange-Traded Fund Trust and PowerShares Actively Managed Exchange-Traded Fund Trust
Formerly: Director and Secretary, Van Kampen Advisors Inc.; Director Vice President, Secretary and General Counsel Van Kampen Investor Services Inc.; Director, Invesco Distributors, Inc. (formerly known as Invesco Aim Distributors, Inc.); Director, Senior Vice President, General Counsel and Secretary, Invesco Advisers, Inc.; and Van Kampen Investments Inc.; Director, Vice President and Secretary, Fund Management Company; Director, Senior Vice President, Secretary, General Counsel and Vice President, Invesco Aim Capital Management, Inc.; Chief Operating Officer and General Counsel, Liberty Ridge Capital, Inc. (an investment adviser); Vice President and Secretary, PBHG Funds (an investment company) and PBHG Insurance Series Fund (an investment company); Chief Operating Officer, General Counsel and Secretary, Old Mutual Investment Partners (a broker-dealer); General Counsel and Secretary, Old Mutual Fund Services (an administrator) and Old Mutual Shareholder Services (a shareholder servicing center); Executive Vice President, General Counsel and Secretary, Old Mutual Capital, Inc. (an investment adviser); and Vice President and Secretary, Old Mutual Advisors Funds (an investment company) | | N/A | | N/A |
| | | | | | | | | |
| | | | | | | | | |
| | | | | | | | | |
Lisa O. Brinkley — 1959
Vice President | | 2004 | | Global Compliance Director, Invesco Ltd.; Chief Compliance Officer, Invesco Investment Services, Inc.(formerly known as Invesco Aim Investment Services, Inc.); and Vice President, The Invesco Funds
Formerly: Chief Compliance Officer, Invesco Distributors, Inc. (formerly known as Invesco Aim Distributors, Inc.) and Van Kampen Investor Services Inc.; Senior Vice President, Invesco Management Group, Inc.; Senior Vice President and Chief Compliance Officer, Invesco Advisers, Inc. and The Invesco Funds; Vice President and Chief Compliance Officer, Invesco Aim Capital Management, Inc. and Invesco Distributors, Inc.; Vice President, Invesco Investment Services, Inc. and Fund Management Company | | N/A | | N/A |
| | | | | | | | | |
| | | | | | | | | |
| | | | | | | | | |
Sheri Morris — 1964
Vice President, Treasurer and Principal Financial Officer | | 1999 | | Vice President, Treasurer and Principal Financial Officer, The Invesco Funds; and Vice President, Invesco Advisers, Inc. (formerly known as Invesco Institutional (N.A.), Inc.) (registered investment adviser).
Formerly: Treasurer, PowerShares Exchange-Traded Fund Trust, PowerShares Exchange--Traded Fund Trust II, PowerShares India Exchange-Traded Fund Trust and PowerShares Actively Managed Exchange-Traded Fund Trust; Vice President, Invesco Advisers, Inc., Invesco Aim Capital Management, Inc. and Invesco Aim Private Asset Management, Inc.; Assistant Vice President and Assistant Treasurer, The Invesco Funds and Assistant Vice President, Invesco Advisers, Inc., Invesco Aim Capital Management, Inc. and Invesco Aim Private Asset Management, Inc. | | N/A | | N/A |
| | | | | | | | | |
| | | | | | | | | |
| | | | | | | | | |
Karen Dunn Kelley — 1960
Vice President | | 2004 | | Head of Invesco’s World Wide Fixed Income and Cash Management Group; Senior Vice President, Invesco Advisers, Inc. (formerly known as Invesco Institutional (N.A.), Inc.) (registered investment adviser); Executive Vice President, Invesco Distributors, Inc. (formerly known as Invesco Aim Distributors, Inc.); Senior Vice President, Invesco Management Group, Inc. (formerly known as Invesco Aim Management Group, Inc.); and Director, Invesco Mortgage Capital Inc.; Vice President, The Invesco Funds (other than AIM Treasurer’s Series Trust (Invesco Treasurer’s Series Trust) and Short-Term Investments Trust); President and Principal Executive Officer, The Invesco Funds (AIM Treasurer’s Series Trust (Invesco Treasurer’s Series Trust) and Short-Term Investments Trust only).
Formerly: Senior Vice President, Van Kampen Investments Inc.; Vice President, Invesco Advisers, Inc. (formerly known as Invesco Institutional (N.A.), Inc.); Director of Cash Management and Senior Vice President, Invesco Advisers, Inc. and Invesco Aim Capital Management, Inc.; President and Principal Executive Officer, Tax-Free Investments Trust; Director and President, Fund Management Company; Chief Cash Management Officer, Director of Cash Management, Senior Vice President, and Managing Director, Invesco Aim Capital Management, Inc.; Director of Cash Management, Senior Vice President, and Vice President, Invesco Advisers, Inc. and The Invesco Funds (AIM Treasurer’s Series Trust (Invesco Treasurer’s Series Trust), Short-Term Investments Trust and Tax-Free Investments Trust only) | | N/A | | N/A |
| | | | | | | | | |
T-3 Invesco Commodities Strategy Fund
Trustees and Officers—(continued)
The address of each trustee and officer is AIM Investment Funds (Invesco Investment Funds) (the “Trust”), 11 Greenway Plaza, Suite 2500, Houston, Texas 77046-1173. The trustees serve for the life of the Trust, subject to their earlier death, incapacitation, resignation, retirement or removal as more specifically provided in the Trust’s organizational documents. Each officer serves for a one year term or until their successors are elected and qualified. Column two below includes length of time served with predecessor entities, if any.
| | | | | | | | | |
| | | | | | | Number of
| | |
| | | | | | | Funds in
| | |
| | | | | | | Fund Complex
| | |
Name, Year of Birth and
| | Trustee and/
| | Principal Occupation(s)
| | Overseen by
| | Other Directorship(s)
|
| Position(s) Held with the Trust | | or Officer Since | | During Past 5 Years | | Trustee | | Held by Trustee |
| | | | | | | | | |
| | | | | | | | | |
| Other Officers—(continued) | | | | | | | | |
| | | | | | | | | |
| | | | | | | | | |
| | | | | | | | | |
Lance A. Rejsek — 1967
Anti-Money Laundering Compliance Officer | | 2005 | | Anti-Money Laundering Compliance Officer, Invesco Advisers, Inc. (formerly known as Invesco Institutional (N.A.), Inc.) (registered investment adviser); Invesco Distributors, Inc. (formerly known as Invesco Aim Distributors, Inc.), Invesco Investment Services, Inc. (formerly known as Invesco Aim Investment Services, Inc.), The Invesco Funds, PowerShares Exchange-Traded Fund Trust, PowerShares Exchange-Traded Fund Trust II, PowerShares India Exchange-Traded Fund Trust, PowerShares Actively Managed Exchange-Traded Fund Trust, Invesco Investment Advisers LLC (formerly known as Van Kampen Asset Management) and Van Kampen Funds Inc.
Formerly: Anti-Money Laundering Compliance Officer, Van Kampen Investor Services Inc., Fund Management Company, Invesco Advisers, Inc., Invesco Aim Capital Management, Inc. and Invesco Aim Private Asset Management, Inc. | | N/A | | N/A |
| | | | | | | | | |
| | | | | | | | | |
| | | | | | | | | |
Todd L. Spillane — 1958
Chief Compliance Officer | | 2006 | | Senior Vice President, Invesco Management Group, Inc. (formerly known as Invesco Aim Management Group, Inc.) and Van Kampen Exchange Corp.; Senior Vice President and Chief Compliance Officer, Invesco Advisers, Inc. (registered investment adviser) (formerly known as Invesco Institutional (N.A.), Inc.); Chief Compliance Officer, The Invesco Funds, PowerShares Exchange-Traded Fund Trust, PowerShares Exchange-Traded Fund Trust II, PowerShares India Exchange-Traded Fund Trust, PowerShares Actively Managed Exchange-Traded Fund Trust, INVESCO Private Capital Investments, Inc. (holding company) and Invesco Private Capital, Inc. (registered investment adviser); Vice President, Invesco Distributors, Inc. (formerly known as Invesco Aim Distributors, Inc.) and Invesco Investment Services, Inc. (formerly known as Invesco Aim Investment Services, Inc.).
Formerly: Chief Compliance Officer, Invesco Van Kampen Closed-End Funds; Senior Vice President, Van Kampen Investments Inc.; Senior Vice President and Chief Compliance Officer, Invesco Advisers, Inc. and Invesco Aim Capital Management, Inc.; Chief Compliance Officer, Invesco Global Asset Management (N.A.), Inc., Invesco Senior Secured Management, Inc. (registered investment adviser) and Van Kampen Investor Services Inc.; Vice President, Invesco Aim Capital Management, Inc. and Fund Management Company | | N/A | | N/A |
| | | | | | | | | |
The Statement of Additional Information of the Trust includes additional information about the Fund’s Trustees and is available upon request, without charge, by calling 1.800.959.4246. Please refer to the Fund’s prospectus for information on the Fund’s sub-advisers.
| | | | | | | |
Office of the Fund
11 Greenway Plaza, Suite 2500
Houston, TX 77046-1173 | | Investment Adviser
Invesco Advisers, Inc.
1555 Peachtree Street, N.E.
Atlanta, GA 30309 | | Distributor
Invesco Distributors, Inc.
11 Greenway Plaza, Suite 2500
Houston, TX 77046-1173 | | Auditors
PricewaterhouseCoopers LLP
1201 Louisiana Street, Suite 2900
Houston, TX 77002-5678 |
| | | | | | | |
| | | | | | | |
Counsel to the Fund
Stradley Ronon Stevens & Young, LLP
2600 One Commerce Square
Philadelphia, PA 19103 | | Counsel to the Independent Trustees
Kramer, Levin, Naftalis & Frankel LLP
1177 Avenue of the Americas
New York, NY 10036-2714 | | Transfer Agent
Invesco Investment Services, Inc.
11 Greenway Plaza, Suite 2500 Houston, TX 77046-1173 | | Custodian
State Street Bank and Trust Company
225 Franklin
Boston, MA 02110-2801 |
T-4 Invesco Commodities Strategy Fund
Invesco mailing information
Send general correspondence to Invesco Investment Services, Inc., P.O. Box 219078, Kansas City, MO 64121-9078.
Invesco privacy policy
You share personal and financial information with us that is necessary for your transactions and your account records. We take very seriously the obligation to keep that information confidential and private.
Invesco collects nonpublic personal information about you from account applications or other forms you complete and from your transactions with us or our affiliates. We do not disclose information about you or our former customers to service providers or other third parties except to the extent necessary to service your account and in other limited circumstances as permitted by law. For example, we use this information to facilitate the delivery of transaction confirmations, financial reports, prospectuses and tax forms.
Even within Invesco, only people involved in the servicing of your accounts and compliance monitoring have access to your information. To ensure the highest level of confidentiality and security, Invesco maintains physical, electronic and procedural safeguards that meet or exceed federal standards. Special measures, such as data encryption and authentication, apply to your communications with us on our website. More detail is available to you at invesco.com/privacy.
Important notice regarding delivery of security holder documents
To reduce Fund expenses, only one copy of most shareholder documents may be mailed to shareholders with multiple accounts at the same address (Householding). Mailing of your shareholder documents may be householded indefinitely unless you instruct us otherwise. If you do not want the mailing of these documents to be combined with those for other members of your household, please contact Invesco Investment Services, Inc. at 800 959 4246 or contact your financial institution. We will begin sending you individual copies for each account within 30 days after receiving your request.
Fund holdings and proxy voting information
The Fund provides a complete list of its holdings four times in each fiscal year, at the quarter-ends. For the second and fourth quarters, the lists appear in the Fund’s semiannual and annual reports to shareholders. For the first and third quarters, the Fund files the lists with the Securities and Exchange Commission (SEC) on Form N-Q. The most recent list of portfolio holdings is available at invesco.com/completeqtrholdings. Shareholders can also look up the Fund’s Forms N-Q on the SEC website at sec.gov. Copies of the Fund’s Forms N-Q may be reviewed and copied at the SEC Public Reference Room in Washington, D.C. You can obtain information on the operation of the Public Reference Room, including information about duplicating fee charges, by calling 202 551 8090 or 800 732 0330, or by electronic request at the following email address: publicinfo@sec.gov. The SEC file numbers for the Fund are 811-05426 and 033-19338.
A description of the policies and procedures that the Fund uses to determine how to vote proxies relating to portfolio securities is available without charge, upon request, from our Client Services department at 800 959 4246 or at invesco.com/proxyguidelines. The information is also available on the SEC website, sec.gov.
Information regarding how the Fund voted proxies related to its portfolio securities during the 12 months ended June 30, 2011, is available at invesco.com/proxysearch. The information is also available on the SEC website, sec.gov.
Invesco Advisers, Inc. is an investment adviser; it provides investment advisory services to individual and institutional clients and does not sell securities. Invesco Distributors, Inc. is the U.S. distributor for Invesco Ltd.’s retail mutual funds, exchange-traded funds and institutional money market funds. Both are wholly owned, indirect subsidiaries of Invesco Ltd.
MS-CSTR-AR-1 Invesco Distributors, Inc.
| | |
| Annual Report to Shareholders | | October 31, 2011 |
Invesco Developing Markets FundNasdaq:
A: GTDDX § B: GTDBX § C: GTDCX § Y: GTDYX § Institutional: GTDIX
| | | |
| |
| 2 | | Letters to Shareholders |
| 4 | | Performance Summary |
| 4 | | Management Discussion |
| 6 | | Long-Term Fund Performance |
| 8 | | Supplemental Information |
| 9 | | Schedule of Investments |
| 11 | | Financial Statements |
| 13 | | Notes to Financial Statements |
| 21 | | Financial Highlights |
| 22 | | Auditor’s Report |
| 23 | | Fund Expenses |
| 24 | | Approval of Investment Advisory and Sub-Advisory Agreements |
| 26 | | Tax Information |
| T-1 | | Trustees and Officers |
Letters to Shareholders

Philip Taylor
Dear Shareholders:
Enclosed is important information about your Fund and its performance. I encourage you to read this report to learn more about your Fund’s short- and long-term performance and its holdings as of the close of the reporting period. This report also includes useful information about your Fund’s management team and a discussion of how your Fund was managed during the reporting period.
Investors are likely to confront both opportunities and challenges in 2012 — just as we did in 2011. After all, changes in market sentiment never do investors the courtesy of announcing their impending arrival, and your goals and needs may have changed, requiring changes in your financial strategy.
That’s why the start of a new year is always a good time to catch up with your financial adviser. He or she can explain how your investments performed in the year just ended — how each performed individually, and more important, how they performed as a diversified portfolio. Of course, it’s important to remember that an investment’s long-term performance is more important than its short-term performance. Looking ahead to the new year and evaluating your individual situation, your financial adviser can provide valuable insight into whether your investments are still appropriate for your individual needs, goals and risk tolerance.
For current information about your Fund
In addition to meeting with your financial adviser to discuss your individual situation at the start of the new year, you also may find it helpful to stay abreast of market trends and developments. Doing so may provide reassurance in times of economic uncertainty and market volatility such as we saw in 2011 — and are likely to see again in 2012.
Invesco can help you stay informed about your investments and market trends. On our website, invesco.com/us, we provide timely market updates and commentary from many of our fund managers and other investment professionals. Also on our website, you can obtain information about your account at any hour of the day or night. I invite you to visit and explore the tools and information we offer at invesco.com/us.
Our commitment to investment excellence
As we’ve seen over the last several years, market conditions can change — often suddenly and dramatically. That’s one reason financial advisers typically advise their clients to be well diversified and to maintain a long-term investment focus. While diversification can’t guarantee a profit or protect against loss, it may cushion the impact of dramatic market moves. Maintaining a long-term investment focus for your long-term goals — financing your retirement or your children’s education, for example — may help you avoid making rash investment decisions based on short-term market swings.
Likewise, Invesco’s investment professionals maintain a long-term focus. Across our broad array of investment products, investment excellence is our ultimate goal. Each of our funds is managed by specialized teams of investment professionals, and as a company, we maintain a single focus — investment management — that allows our fund managers to concentrate on doing what they do best: managing your money.
Our funds are managed strictly according to their stated investment objectives and strategies, with robust risk oversight using consistent, repeatable investment processes that don’t change in response to short-term market events. This disciplined approach can’t guarantee a profit; no investment can do that, since all involve some measure of risk. But it can ensure that your money is managed the way we said it would be — according to your Fund’s objective and strategies.
Our adherence to stated investment objectives and strategies allows your financial adviser to build a diversified portfolio that meets your individual risk tolerance and financial goals. It also means that when your goals change, your financial adviser will be able to find an Invesco fund that’s appropriate for your needs.
Questions?
If you have questions about your account, please contact one of our client service representatives at 800 959 4246. If you have a general Invesco-related question or comment for me, I invite you to email me directly at phil@invesco.com.
All of us at Invesco look forward to serving your investment management needs for many years to come. Thank you for investing with us.
Sincerely,
Philip Taylor
Senior Managing Director, Invesco Ltd.
| | | |
|
2 | | Invesco Developing Markets Fund |

Bruce Crockett
Dear Fellow Shareholders:
Although the world’s economies are gradually recovering from the financial crisis, it has not been a smooth path. Unrest in the Middle East, persistently weak job and housing markets in the U.S. and continued government balance sheet repair in Europe are contributing to a slow, labored march toward global recovery.
In this environment, investors face risks that could make it more difficult to achieve their long-term financial goals — a secure retirement, home ownership, a child’s college education. Although the markets are complex and dynamic, there are ways to simplify the process and potentially increase your odds of achieving your goals. The best approach is to create a solid financial plan that helps you save and invest in ways that anticipate your needs over the long term.
Your financial adviser can help you define your financial plan, develop an appropriate investment strategy and put you in a better position to achieve your financial goals over the long term. This can take some of the guesswork out of the process and help you make thoughtful investments. Your financial adviser also can help you better understand your tolerance for risk, so that your investment approach lets you sleep at night while getting you closer to your goals. Lastly, your financial adviser can develop an asset allocation strategy that seeks to balance your investment approach, providing some protection against a decline in the markets while allowing you to participate in rising markets. Invesco calls this type of approach “intentional investing.” It means thinking carefully, planning thoughtfully and acting deliberately.
While no investment can guarantee favorable returns, your Board remains committed to managing costs and enhancing the performance of Invesco’s funds as part of our Investor First orientation. We continue to oversee the funds with the same strong sense of responsibility for your money and your continued trust that we’ve always maintained.
Thanks to the approval of our fund shareholders, Invesco has made great progress in realigning our U.S. mutual fund product line following our acquisition of Morgan Stanley’s retail asset management business, including Van Kampen Investments. When completed, the realignment will reduce overlap in the product lineup, enhance efficiency across our product line and build a solid foundation for further growth to meet client and shareholder needs. I would like to thank those of you who voted your proxy, and I hope our shareholders haven’t been too inconvenienced by the process.
As always, please contact me at bruce@brucecrockett.com with any questions or concerns you may have. On behalf of your Board, we look forward to continuing to represent your interests and serving your needs.
Sincerely,
Bruce L. Crockett
Independent Chair
Invesco Funds Board of Trustees
| | | |
|
3 | | Invesco Developing Markets Fund |
Management’s Discussion of Fund Performance
Performance summary
Global equity markets faced headwinds in 2010 and 2011. China’s growth continued to slow as the U.S. battled high unemployment and runaway deficits. Several European countries faced similar deficits, which brought to light the imperfect structure of the euro. The reporting period ended with a market upswing, however, as European leaders took steps to address the Greek sovereign debt issue, expand the bailout fund and stabilize the banking system.
The volatility and weakness experienced by global equity markets over the fiscal year ended October 31, 2011, was reflected in the performance of Invesco Developing Markets Fund. Class A shares at net asset value (NAV) slightly outperformed the Fund’s style-specific benchmark, the MSCI Emerging Markets Index.
Your Fund’s long-term performance appears later in this report.
Fund vs. Indexes
Total returns, 10/31/10 to 10/31/11, at net asset value (NAV). Performance shown does not include applicable contingent deferred sales charges (CDSC) or front-end sales charges, which would have reduced performance.
| | | | | |
|
| Class A Shares | | | -7.62 | % |
| |
| Class B Shares | | | -8.33 | |
| |
| Class C Shares | | | -8.31 | |
| |
| Class Y Shares | | | -7.37 | |
| |
| Institutional Class Shares | | | -7.24 | |
| |
MSCI EAFE Index▼ (Broad Market Index) | | | -4.08 | |
| |
MSCI Emerging Markets Index▼ (Style-Specific Index) | | | -7.72 | |
| |
Lipper Emerging Market Funds Index▼ (Peer Group Index) | | | -9.49 | |
| |
Source(s): ▼Lipper Inc. | | | | |
How we invest
When selecting stocks for your Fund, we use a disciplined investment strategy that emphasizes fundamental research, supported by both quantitative analysis and portfolio construction techniques. Our EQV (earnings, quality, valuation) strategy focuses primarily on identifying quality companies that have experienced, or exhibit the potential for, accelerated or above-average earnings growth, but whose stock prices have not fully reflected these attributes.
While research responsibilities within the portfolio management team are focused by geographic region, we select
investments for the Fund using a bottom-up investment approach, which means we construct the Fund primarily on a stock-by-stock basis. We focus on the strengths of individual companies rather than sectors, countries or market-cap trends.
We believe disciplined sell decisions are key to successful investing. We consider selling a stock for one of the following reasons:
| n | | A company’s fundamentals deteriorate, or it posts disappointing earnings. |
| |
| n | | A stock’s price seems overvalued. |
| |
| n | | A more attractive opportunity becomes available. |
Market conditions and your Fund
Market volatility was intense during the reporting period. During mid-2011, Greek sovereign debt concerns and signs of slowing global growth continued to worry investors. In addition, numerous world events caught investors’ attention, including the growing unrest in the Middle East and northern Africa, and the devastating earthquake and tsunami in Japan on March 11. Renewed credit problems overseas and the market correction that occurred in May, June, July and August created a more uncertain environment, which prompted many investors to favor safety over risk.
In emerging market countries, investors grew risk-averse on news of potential defaults in Europe as well as slowing growth and accounting concerns in China, leading to a relatively indiscriminate correction in almost all emerging market countries. Concerns about potential overheating in emerging market economies and potential double-dip recession in developed economies continued to foster uncertainty about the pace and vigor of a global economic recovery.
In this environment, we continued to construct the Fund’s portfolio with a long-term view and a bottom-up approach (i.e., selecting stocks on an individual basis). The portfolio held an average of about 11% cash over the period. This higher-than-average cash position was advantageous in a period when markets were plagued with volatility. It’s important to note that we do not use cash for “top-down” tactical asset allocation purposes. Historically, when the portfolio’s cash position has been
Portfolio CompositionBy sector
| | | | | |
|
| Financials | | | 23.7 | % |
| |
| Consumer Discretionary | | | 12.2 | |
| |
| Information Technology | | | 11.2 | |
| |
| Telecommunication Services | | | 9.8 | |
| |
| Energy | | | 7.6 | |
| |
| Consumer Staples | | | 7.2 | |
| |
| Materials | | | 6.2 | |
| |
| Utilities | | | 5.6 | |
| |
| Industrials | | | 4.1 | |
| |
| Health Care | | | 2.9 | |
| |
Money Market Funds
Plus Other Assets Less Liabilities | | | 9.5 | |
| | | | | | | | | |
|
| | 1. | | | Banco Bradesco S.A.-ADR | | | 3.7 | % |
| |
| | 2. | | | Industrial & Commercial Bank of China Ltd.-Class H | | | 3.4 | |
| |
| | 3. | | | Cielo S.A. | | | 3.1 | |
| |
| | 4. | | | Fomento Economico Mexicano, S.A.B. de C.V.-ADR | | | 2.9 | |
| |
| | 5. | | | America Movil S.A.B. de C.V.-Series L-ADR | | | 2.5 | |
| |
| | 6. | | | Taiwan Semiconductor Manufacturing Co. Ltd. | | | 2.5 | |
| |
| | 7. | | | NHN Corp. | | | 2.4 | |
| |
| | 8. | | | Credicorp Ltd. | | | 2.3 | |
| |
| | 9. | | | Philippine Long Distance Telephone Co. 2.2 | | | | |
| |
| | 10. | | | SM Investments Corp. | | | 2.2 | |
| | | | | | | | | |
|
| | 1. | | | Brazil | | | 18.3 | % |
| |
| | 2. | | | China | | | 10.2 | |
| |
| | 3. | | | Mexico | | | 9.9 | |
| |
| | 4. | | | Philippines | | | 7.9 | |
| |
| | 5. | | | Indonesia | | | 5.4 | |
| | | | | |
|
| Total Net Assets | | $2.5 billion |
| Total Number of Holdings* | | | 70 | |
The Fund’s holdings are subject to change, and there is no assurance that the Fund will continue to hold any particular security.
*Excluding money market fund holdings.
| | | |
|
4 | | Invesco Developing Markets Fund |
higher than average, it has reflected a lack of good EQV investment opportunities in the marketplace, rather than an overall negative opinion on markets.
In geographic terms, each of the Fund’s broad regional exposures was down for the reporting period on an absolute basis. Results relative to the MSCI Emerging Markets Index were more favorable, with the Fund outperforming the index in both Latin America and Asia. A 0% exposure to India, one of the period’s weakest markets, was the largest country-level contributor to relative results. Relative performance was also supported by the Fund’s exposure to Brazil, the Philippines and Thailand.
NHN, South Korea’s premier Internet company and operator of its most popular search portal, was among the top individual contributors to Fund performance over the period. NHN continued to benefit from the proliferation of smartphone usage, which in turn drove search advertising on mobile devices.
In contrast, a meaningful underweight position in South Korea combined with lagging stock selection in Hong Kong, Indonesia and Russia were key detractors from relative results. Industrial & Commercial Bank of China (ICBC) was among the top individual detractors from Fund performance. The company’s stock price declined as part of the global sell-off of financial stocks, which was exacerbated by an increase in the perceived risk associated with asset quality. We maintained our position in the stock as we believe there is value in ICBC due to its strong capital position and prudent loan portfolios.
From a sector perspective, exposure to industrials and information technology enabled the Fund to deliver strong positive returns and significantly outperform the MSCI Emerging Markets Index in these sectors over the reporting period. Select holdings in the software & services and capital goods industries were particularly strong. In contrast, stock selection in the telecommunication services, materials and consumer discretionary sectors made them the largest detractors from relative results.
As long-term, bottom-up stock selectors, we see volatility as an opportunity to buy quality growth companies at more attractive valuations than usual; consequently, we took advantage of market volatility to buy several stocks that had long been on our EQV radar.
Stock selection in the portfolio continued to be driven by the underlying fundamentals of a company — not any top-down macroeconomic views. That said, because of our belief in the long-term strength of consumer growth in emerging markets, we maintained significant overweight exposure to the consumer discretionary sector at the end of the reporting period. The Fund also remained overweight versus the index in the utilities, health care and telecommunication services sectors, while its largest underweight exposures were in the materials, energy and financials sectors.
In closing, volatile markets can test an investor’s resolve, but it’s worth noting that real investment opportunity can present itself when the markets are turbulent. We thank you for your continued investment in Invesco Developing Markets Fund.
The views and opinions expressed in management’s discussion of Fund performance are those of Invesco Advisers, Inc. These views and opinions are subject to change at any time based on factors such as market and economic conditions. These views and opinions may not be relied upon as investment advice or recommendations, or as an offer for a particular security. The information is not a complete analysis of every aspect of any market, country, industry, security or the Fund. Statements of fact are from sources considered reliable, but Invesco Advisers, Inc. makes no representation or warranty as to their completeness or accuracy. Although historical performance is no guarantee of future results, these insights may help you understand our investment management philosophy.
See important Fund and, if applicable, index disclosures later in this report.
Shuxin Cao
Chartered Financial Analyst, portfolio manager, is lead manager of Invesco Developing Markets Fund with respect to the Fund’s investments in Asia Pacific and Latin America. He joined Invesco in 1997. Mr. Cao earned a B.A. in English from the Tianjin Foreign Language Institute and an M.B.A. from Texas A&M University. He is also a Certified Public Accountant.
Borge Endresen
Chartered Financial Analyst, portfolio manager, is lead manager of Invesco Developing Markets Fund with respect to the Fund’s investments in Europe, Africa and the Middle East. He joined Invesco in 1999. Mr. Endresen earned a B.S. in finance from the University of Oregon and an M.B.A. from The University of Texas at Austin.
Mark Jason
Chartered Financial Analyst, portfolio manager, is manager of Invesco Developing Markets Fund. He joined Invesco in 2001.
Mr. Jason earned a B.S. in finance and a B.S. in real estate from California State University at Northridge.
| | | |
|
5 | | Invesco Developing Markets Fund |
Your Fund’s Long-Term Performance
Results of a $10,000 Investment — Oldest Share Class since Inception
Index data from 12/31/93, Fund data from 1/11/94
Past performance cannot guarantee comparable future results.
The data shown in the chart include reinvested distributions, applicable sales charges and Fund expenses including management fees. Index results include reinvested dividends, but they do not reflect sales charges. Performance of the peer group, if applicable, reflects fund expenses and management fees; performance of a market index does not.
Performance shown in the chart and table(s) does not reflect deduction of taxes a shareholder would pay on Fund distributions or sale of Fund shares.
This chart, which is a logarithmic chart, presents the fluctuations in the value of the Fund and its indexes. We believe that a logarithmic chart is more effective than other types of charts in illustrating changes in value during the early years shown in the chart. The vertical axis, the
one that indicates the dollar value of an investment, is constructed with each segment representing a percent change in the value of the investment. In this chart, each segment represents a doubling, or 100% change, in the value of the investment. In other words, the space between $2,500 and $5,000 is the same size as the space between $5,000 and $10,000, and so on.
| | | |
|
6 | | Invesco Developing Markets Fund |
Average Annual Total ReturnsAs of 10/31/11, including maximum applicable
sales charges
| | | | | | | | | |
|
| Class A Shares | | | | |
| |
| Inception (1/11/94) | | | 5.73 | % |
| |
| | 10 | | | Years | | | 17.96 | |
| |
| | 5 | | | Years | | | 6.33 | |
| |
| | 1 | | | Year | | | -12.70 | |
| |
| |
| Class B Shares | | | | |
| |
| Inception (11/3/97) | | | 7.49 | % |
| |
| | 10 | | | Years | | | 18.01 | |
| |
| | 5 | | | Years | | | 6.42 | |
| |
| | 1 | | | Year | | | -12.90 | |
| |
| |
| Class C Shares | | | | |
| |
| Inception (3/1/99) | | | 12.24 | % |
| |
| | 10 | | | Years | | | 17.84 | |
| |
| | 5 | | | Years | | | 6.73 | |
| |
| | 1 | | | Year | | | -9.23 | |
| |
| |
| Class Y Shares | | | | |
| |
| | 10 | | | Years | | | 18.72 | % |
| |
| | 5 | | | Years | | | 7.70 | |
| |
| | 1 | | | Year | | | -7.37 | |
| |
| |
| Institutional Class Shares | | | | |
| |
| | 10 | | | Years | | | 18.96 | % |
| |
| | 5 | | | Years | | | 8.02 | |
| |
| | 1 | | | Year | | | -7.24 | |
Class Y shares incepted on October 3, 2008. Performance shown prior to that date is that of Class A shares and includes the 12b-1 fees applicable to Class A shares. Class A share performance reflects any applicable fee waivers or expense reimbursements.
Institutional Class shares incepted on October 25, 2005. Performance shown prior to that date is that of Class A shares and includes the 12b-1 fees applicable to Class A shares. Class A share performance reflects any applicable fee waivers or expense reimbursements.
The performance data quoted represent past performance and cannot guarantee comparable future results; current performance may be lower or higher. Please visit invesco.com/performance for the most recent month-end performance. Performance figures reflect reinvested distributions, changes in net asset value and the effect of the maximum sales charge unless otherwise stated. Investment return and principal value will fluctuate so that you may have a gain or loss when you sell shares.
The total annual Fund operating expense ratio set forth in the most recent Fund prospectus as of the date
Average Annual Total Returns
As of 9/30/11, the most recent calendar quarter-end, including maximum applicable sales charges
| | | | | | | | | |
|
| Class A Shares | | | | |
| |
| Inception (1/11/94) | | | 5.21 | % |
| |
| | 10 | | | Years | | | 17.56 | |
| |
| | 5 | | | Years | | | 5.89 | |
| |
| | 1 | | | Year | | | -18.02 | |
| |
| |
| Class B Shares | | | | |
| |
| Inception (11/3/97) | | | 6.82 | % |
| |
| | 10 | | | Years | | | 17.62 | |
| |
| | 5 | | | Years | | | 5.99 | |
| |
| | 1 | | | Year | | | -18.24 | |
| |
| |
| Class C Shares | | | | |
| |
| Inception (3/1/99) | | | 11.51 | % |
| |
| | 10 | | | Years | | | 17.43 | |
| |
| | 5 | | | Years | | | 6.29 | |
| |
| | 1 | | | Year | | | -14.79 | |
| |
| |
| Class Y Shares | | | | |
| |
| | 10 | | | Years | | | 18.32 | % |
| |
| | 5 | | | Years | | | 7.26 | |
| |
| | 1 | | | Year | | | -13.06 | |
| |
| |
| Institutional Class Shares | | | | |
| |
| | 10 | | | Years | | | 18.55 | % |
| |
| | 5 | | | Years | | | 7.58 | |
| |
| | 1 | | | Year | | | -12.92 | |
of this report for Class A, Class B, Class C, Class Y and Institutional Class shares was 1.53%, 2.28%, 2.28%, 1.28% and 1.12%, respectively. The expense ratios presented above may vary from the expense ratios presented in other sections of this report that are based on expenses incurred during the period covered by this report.
Class A share performance reflects the maximum 5.50% sales charge, and Class B and Class C share performance reflects the applicable contingent deferred sales charge (CDSC) for the period involved. The CDSC on Class B shares declines from 5% beginning at the time of purchase to 0% at the beginning of the seventh year. The CDSC on Class C shares is 1% for the first year after purchase. Class Y and Institutional Class shares do not have a front-end sales charge or a CDSC; therefore, performance is at net asset value.
The performance of the Fund’s share classes will differ primarily due to different sales charge structures and class expenses.
Had the adviser not waived fees and/or reimbursed expenses in the past, performance would have been lower.
A redemption fee of 2% is imposed on certain redemptions or exchanges out of the Fund within 31 days of purchase. Exceptions to the redemption fee are listed in the Fund’s prospectus. Effective January 1, 2012, after the close of the reporting period, the Fund will eliminate the redemption fee, if applicable, assessed on shares of the Fund redeemed or exchanged within 31 days of purchase.
| | | |
|
7 | | Invesco Developing Markets Fund |
Invesco Developing Markets Fund’s investment objective is long-term growth of capital.
| n | | Unless otherwise stated, information presented in this report is as of October 31, 2011, and is based on total net assets. |
| |
| n | | Unless otherwise noted, all data provided by Invesco. |
| |
| n | | To access your Fund’s reports/prospectus, visit invesco.com/fundreports. |
About share classes
| n | | Class B shares may not be purchased or acquired by exchange from share classes other than Class B shares. Please see the prospectus for more information. |
| n | | Class Y shares are available to only certain investors. Please see the prospectus for more information. |
| n | | Institutional Class shares are offered exclusively to institutional investors, including defined contribution plans that meet certain criteria. Please see the prospectus for more information. |
Principal risks of investing in the Fund
| n | | Developing markets securities risk. |
| |
| | | Securities issued by foreign companies and governments located in developing countries may be affected more negatively by inflation, devaluation of their currencies, higher transaction costs, delays in settlement, adverse political developments, the introduction of capital controls, withholding taxes, nationalization of private assets, expropriation, social unrest, war or lack of timely information than those in developed countries. |
| |
| n | | Foreign securities risk. The Fund’s foreign investments may be affected by changes in a foreign country’s exchange rates; political and social instability; changes in economic or taxation policies; difficulties when enforcing obligations; decreased liquidity; and increased volatility. Foreign companies may be subject to less regulation resulting in less publicly available information about the companies. |
| |
| n | | IPO risk. Although the Fund’s return during certain periods was positively impacted by its investments in initial public offerings (IPOs), there can be no assurance that the Fund will have favorable IPO investment opportunities in the future. |
| n | | Management risk. The investment techniques and risk analysis used by the Fund’s portfolio managers may not produce the desired results. |
| |
| n | | Market risk. The prices of and the income generated by the Fund’s securities may decline in response to, among other things, investor sentiment; general economic and market conditions; regional or global instability; and currency and interest rate fluctuations. |
| |
| n | | Non-diversification risk. The Fund is non-diversified and can invest a greater portion of its assets in a single issuer. A change in the value of the issuer could affect the value of the Fund more than if it was a diversified fund. |
| |
| n | | Small- and mid-capitalization risk. Stocks of small and mid-sized companies tend to be more vulnerable to adverse developments in the above factors and may have little or no operating history or track record of success, and limited product lines, markets, management and financial resources. The securities of small and mid-sized companies may be more volatile due to less market interest and less publicly available information about the issuer. They also may be illiquid or restricted as to resale, or may trade less frequently and in smaller volumes, all of which may cause difficulty when establishing or closing a position at a desirable price. |
About indexes used in this report
| n | | The MSCI EAFE® Index is an unmanaged index considered representative of stocks of Europe, Australasia and the Far East. |
| |
| n | | The MSCI Emerging Markets IndexSM is an unmanaged index considered representative of stocks of developing countries. |
| |
| n | | The Lipper Emerging Market Funds Index is an unmanaged index considered representative of emerging market funds tracked by Lipper. |
| n | | The Fund is not managed to track the performance of any particular index, including the index(es) defined here, and consequently, the performance of the Fund may deviate significantly from the performance of the index(es). |
| |
| n | | A direct investment cannot be made in an index. Unless otherwise indicated, index results include reinvested dividends, and they do not reflect sales charges. Performance of the peer group, if applicable, reflects fund expenses; performance of a market index does not. |
Other information
| n | | The Chartered Financial Analyst® (CFA®) designation is globally recognized and attests to a charterholder’s success in a rigorous and comprehensive study program in the field of investment management and research analysis. |
| |
| n | | CPA® and Certified Public Accountant® are trademarks owned by the American Institute of Certified Public Accountants. |
| |
| n | | The returns shown in management’s discussion of Fund performance are based on net asset values calculated for shareholder transactions. Generally accepted accounting principles require adjustments to be made to the net assets of the Fund at period end for financial reporting purposes, and as such, the net asset values for shareholder transactions and the returns based on those net asset values may differ from the net asset values and returns reported in the Financial Highlights. |
| |
| n | | Industry classifications used in this report are generally according to the Global Industry Classification Standard, which was developed by and is the exclusive property and a service mark of MSCI Inc. and Standard & Poor’s. |
This report must be accompanied or preceded by a currently effective Fund prospectus, which contains more complete information, including sales charges and expenses. Investors should read it carefully before investing.
NOT FDIC INSURED | MAY LOSE VALUE | NO BANK GURANTEE
Fund Nasdaq Symbols
| | | | | |
|
| Class A Shares | | GTDDX |
| Class B Shares | | GTDBX |
| Class C Shares | | GTDCX |
| Class Y Shares | | GTDYX |
| Institutional Class Shares | | GTDIX |
| | | |
|
8 | | Invesco Developing Markets Fund |
Schedule of Investments
October 31, 2011
| | | | | | | | | |
| | | Shares | | Value |
| |
Common Stocks & Other Equity Interests–89.27%
|
Brazil–17.04%
| | | | |
| Banco Bradesco S.A.–ADR | | | 5,126,482 | | | $ | 93,301,972 | |
| |
| BR Malls Participacoes S.A. | | | 3,705,900 | | | | 40,283,870 | |
| |
| CETIP S.A. | | | 759,800 | | | | 10,411,434 | |
| |
| Cielo S.A. | | | 2,669,280 | | | | 71,302,152 | |
| |
Cielo S.A.(a) | | | 240,000 | | | | 6,410,911 | |
| |
| Diagnosticos da America S.A. | | | 4,497,000 | | | | 36,275,852 | |
| |
| Duratex S.A. | | | 5,728,740 | | | | 31,486,867 | |
| |
| Equatorial Energia S.A. | | | 1,415,800 | | | | 9,267,025 | |
| |
| MRV Engenharia e Participacoes S.A. | | | 3,749,900 | | | | 26,577,364 | |
| |
OGX Petroleo e Gas Participacoes S.A.(b) | | | 2,175,100 | | | | 18,230,424 | |
| |
| Petroleo Brasileiro S.A.–ADR | | | 1,447,351 | | | | 36,603,507 | |
| |
| Totvs S.A. | | | 1,201,100 | | | | 20,021,834 | |
| |
| Valid Solucoes e Servicos de Seguranca em Meios de Pagamento e Identificacao S.A. | | | 904,330 | | | | 10,752,656 | |
| |
Valid Solucoes e Servicos de Seguranca em Meios de Pagamento e Identificacao S.A.(a) | | | 246,510 | | | | 2,931,051 | |
| |
| Wilson Sons Ltd.–BDR | | | 434,100 | | | | 6,224,200 | |
| |
Wilson Sons Ltd.–BDR(a) | | | 528,500 | | | | 7,577,723 | |
| |
| | | | | | | | 427,658,842 | |
| |
China–10.21%
| | | | |
| Anta Sports Products Ltd. | | | 25,246,000 | | | | 22,604,458 | |
| |
| China Yurun Food Group Ltd. | | | 12,893,000 | | | | 22,164,012 | |
| |
| CNOOC Ltd. | | | 15,960,000 | | | | 30,165,660 | |
| |
| Industrial & Commercial Bank of China Ltd.–Class H | | | 137,423,000 | | | | 84,373,371 | |
| |
| Lee & Man Paper Manufacturing Ltd. | | | 62,004,000 | | | | 25,141,657 | |
| |
NetEase.com Inc.–ADR(b) | | | 757,483 | | | | 35,881,970 | |
| |
| Stella International Holdings Ltd. | | | 11,189,000 | | | | 25,304,058 | |
| |
| Want Want China Holdings Ltd. | | | 11,449,000 | | | | 10,543,235 | |
| |
| | | | | | | | 256,178,421 | |
| |
Czech Republic–0.71%
| | | | |
| CEZ A.S. | | | 423,574 | | | | 17,911,003 | |
| |
Egypt–1.06%
| | | | |
Centamin Egypt Ltd.(b) | | | 8,609,967 | | | | 14,843,283 | |
| |
Egyptian Financial Group–Hermes Holding(b) | | | 5,496,735 | | | | 11,783,034 | |
| |
| | | | | | | | 26,626,317 | |
| |
Hong Kong–1.45%
| | | | |
| China Mobile Ltd. | | | 3,812,000 | | | | 36,327,047 | |
| |
Indonesia–5.37%
| | | | |
| PT Bank Central Asia Tbk | | | 24,954,000 | | | | 22,562,445 | |
| |
| PT Indocement Tunggal Prakarsa Tbk | | | 8,427,000 | | | | 15,255,580 | |
| |
| PT Perusahaan Gas Negara | | | 142,222,000 | | | | 46,628,790 | |
| |
| PT Telekomunikasi Indonesia Tbk | | | 60,779,500 | | | | 50,456,505 | |
| |
| | | | | | | | 134,903,320 | |
| |
Israel–0.99%
| | | | |
| Teva Pharmaceutical Industries Ltd.–ADR | | | 606,015 | | | | 24,755,713 | |
| |
Luxembourg–0.39%
| | | | |
| Millicom International Cellular S.A.–SDR | | | 88,216 | | | | 9,684,991 | |
| |
Malaysia–3.55%
| | | | |
| Parkson Holdings Berhad | | | 23,173,008 | | | | 42,149,327 | |
| |
| Public Bank Berhad | | | 11,351,900 | | | | 46,933,389 | |
| |
| | | | | | | | 89,082,716 | |
| |
Mexico–9.91%
| | | | |
| America Movil S.A.B. de C.V.–Series L–ADR | | | 2,502,344 | | | | 63,609,584 | |
| |
| Fomento Economico Mexicano, S.A.B. de C.V.–ADR | | | 1,076,318 | | | | 72,167,122 | |
| |
Grupo Financiero BanCrecer S.A. de C.V.–Class B(b) | | | 1 | | | | 0 | |
| |
| Grupo Televisa S.A.B.–ADR | | | 2,362,899 | | | | 50,400,636 | |
| |
| Kimberly-Clark de Mexico, S.A.B. de C.V.–Class A | | | 8,362,890 | | | | 47,567,731 | |
| |
Urbi, Desarrollos Urbanos, S.A.B. de C.V.(a)(b) | | | 415,400 | | | | 529,249 | |
| |
Urbi, Desarrollos Urbanos, S.A.B. de C.V.(b) | | | 11,244,600 | | | | 14,326,426 | |
| |
| | | | | | | | 248,600,748 | |
| |
Netherlands–0.70%
| | | | |
| VimpelCom Ltd.–ADR | | | 1,605,246 | | | | 17,625,601 | |
| |
Nigeria–0.72%
| | | | |
| Zenith Bank PLC | | | 222,745,307 | | | | 18,043,419 | |
| |
Peru–2.26%
| | | | |
| Credicorp Ltd. | | | 520,590 | | | | 56,629,780 | |
| |
Philippines–7.91%
| | | | |
| Ayala Corp. | | | 5,806,692 | | | | 41,071,447 | |
| |
| Energy Development Corp. | | | 241,801,150 | | | | 34,246,275 | |
| |
Energy Development Corp.(a) | | | 4,528,750 | | | | 641,406 | |
| |
GMA Holdings, Inc.–PDR(a)(b) | | | 2,532,000 | | | | 378,105 | |
| |
GMA Holdings, Inc.–PDR(b) | | | 77,828,400 | | | | 11,622,170 | |
| |
| Philippine Long Distance Telephone Co. | | | 992,755 | | | | 55,341,145 | |
| |
| SM Investments Corp. | | | 4,279,018 | | | | 55,250,461 | |
| |
| | | | | | | | 198,551,009 | |
| |
Russia–4.19%
| | | | |
| Gazprom OAO–ADR | | | 3,847,806 | | | | 44,585,078 | |
| |
| Mobile TeleSystems–ADR | | | 900,533 | | | | 12,868,617 | |
| |
See accompanying Notes to Financial Statements which are an integral part of the financial statements.
9 Invesco Developing Markets Fund
| | | | | | | | | |
| | | Shares | | Value |
| |
Russia–(continued)
| | | | |
| | | | | | | | | |
| Sberbank of Russia | | | 8,205,559 | | | $ | 22,731,901 | |
| |
| TNK–BP Holding | | | 9,963,140 | | | | 24,907,850 | |
| |
| | | | | | | | 105,093,446 | |
| |
South Africa–3.64%
| | | | |
| AngloGold Ashanti Ltd.–ADR | | | 580,441 | | | | 26,241,738 | |
| |
| Naspers Ltd.–Class N | | | 975,489 | | | | 46,219,909 | |
| |
| Sasol Ltd. | | | 418,828 | | | | 18,881,227 | |
| |
| | | | | | | | 91,342,874 | |
| |
South Korea–5.12%
| | | | |
| Hyundai Department Store Co., Ltd. | | | 194,547 | | | | 27,786,193 | |
| |
| MegaStudy Co., Ltd. | | | 177,086 | | | | 19,599,879 | |
| |
NHN Corp.(b) | | | 291,335 | | | | 60,712,826 | |
| |
| S1 Corp. | | | 392,082 | | | | 20,398,492 | |
| |
| | | | | | | | 128,497,390 | |
| |
Taiwan–3.40%
| | | | |
| Taiwan Semiconductor Manufacturing Co. Ltd. | | | 25,703,000 | | | | 62,685,112 | |
| |
| Wistron Corp. | | | 19,658,534 | | | | 22,775,518 | |
| |
| | | | | | | | 85,460,630 | |
| |
Thailand–4.88%
| | | | |
| BEC World PCL | | | 14,437,500 | | | | 17,511,433 | |
| |
| CP ALL PCL | | | 5,986,300 | | | | 9,118,283 | |
| |
| Kasikornbank PCL | | | 13,239,400 | | | | 53,287,540 | |
| |
| Siam Commercial Bank PCL | | | 11,249,800 | | | | 42,487,906 | |
| |
| | | | | | | | 122,405,162 | |
| |
Turkey–4.03%
| | | | |
| Anadolu Efes Biracilik ve Malt Sanayii A.S. | | | 1,621,889 | | | | 19,663,624 | |
| |
| Eczacibasi Ilac Sanayi ve Ticaret A.S. | | | 10,175,924 | | | | 12,424,916 | |
| |
| Haci Omer Sabanci Holding A.S. | | | 14,913,764 | | | | 50,844,433 | |
| |
| Tupras-Turkiye Petrol Rafinerileri A.S. | | | 812,408 | | | | 18,276,806 | |
| |
| | | | | | | | 101,209,779 | |
| |
United Kingdom–1.74%
| | | | |
| African Barrick Gold Ltd. | | | 5,031,144 | | | | 43,582,585 | |
| |
| Total Common Stocks & Other Equity Interests (Cost $2,005,509,422) | | | | | | | 2,240,170,793 | |
| |
Preferred Stocks–1.27%
|
Brazil–1.27%
| | | | |
| Companhia de Transmissao de Energia Eletrica Paulista–Pfd. (Cost $29,495,450) | | | 1,100,800 | | | | 31,765,814 | |
| |
Money Market Funds–9.56%
|
Liquid Assets Portfolio–Institutional Class(c) | | | 119,982,193 | | | | 119,982,193 | |
| |
Premier Portfolio–Institutional Class(c) | | | 119,982,193 | | | | 119,982,193 | |
| |
| Total Money Market Funds (Cost $239,964,386) | | | | | | | 239,964,386 | |
| |
| TOTAL INVESTMENTS–100.10% (Cost $2,274,969,258) | | | | | | | 2,511,900,993 | |
| |
| OTHER ASSETS LESS LIABILITIES–(0.10)% | | | | | | | (2,466,001 | ) |
| |
| NET ASSETS–100.00% | | | | | | $ | 2,509,434,992 | |
| |
Investment Abbreviations:
| | | |
| ADR | | – American Depositary Receipt |
| BDR | | – British Deposit Receipt |
| PDR | | – Philippine Deposit Receipt |
| Pfd. | | – Preferred |
| SDR | | – Swedish Depositary Receipt |
Notes to Schedule of Investments:
| | |
| (a) | | Security purchased or received in a transaction exempt from registration under the Securities Act of 1933, as amended. The security may be resold pursuant to an exemption from registration under the 1933 Act, typically to qualified institutional buyers. The aggregate value of these securities at October 31, 2011 was $18,468,445, which represented 0.74% of the Fund’s Net Assets. |
| (b) | | Non-income producing security. |
| (c) | | The money market fund and the Fund are affiliated by having the same investment adviser. |
See accompanying Notes to Financial Statements which are an integral part of the financial statements.
10 Invesco Developing Markets Fund
Statement of Assets and Liabilities
October 31, 2011
| | | | | |
Assets:
|
| Investments, at value (Cost $2,035,004,872) | | $ | 2,271,936,607 | |
| |
| Investments in affiliated money market funds, at value and cost | | | 239,964,386 | |
| |
| Total investments, at value (Cost $2,274,969,258) | | | 2,511,900,993 | |
| |
| Foreign currencies, at value (Cost $6,795,240) | | | 6,563,167 | |
| |
| Receivable for: | | | | |
| Investments sold | | | 8,472,551 | |
| |
| Fund shares sold | | | 7,313,558 | |
| |
| Dividends | | | 2,325,761 | |
| |
| Investment for trustee deferred compensation and retirement plans | | | 39,117 | |
| |
| Other assets | | | 51,584 | |
| |
| Total assets | | | 2,536,666,731 | |
| |
Liabilities:
|
| Payable for: | | | | |
| Investments purchased | | | 14,468,318 | |
| |
| Fund shares reacquired | | | 3,504,829 | |
| |
| Accrued fees to affiliates | | | 1,372,937 | |
| |
| Accrued other operating expenses | | | 7,750,108 | |
| |
| Trustee deferred compensation and retirement plans | | | 135,547 | |
| |
| Total liabilities | | | 27,231,739 | |
| |
| Net assets applicable to shares outstanding | | $ | 2,509,434,992 | |
| |
Net assets consist of:
|
| Shares of beneficial interest | | $ | 2,336,600,391 | |
| |
| Undistributed net investment income | | | 16,822,276 | |
| |
| Undistributed net realized gain (loss) | | | (80,599,257 | ) |
| |
| Unrealized appreciation | | | 236,611,582 | |
| |
| | | $ | 2,509,434,992 | |
| |
Net Assets:
|
| Class A | | $ | 1,388,008,487 | |
| |
| Class B | | $ | 71,065,688 | |
| |
| Class C | | $ | 213,879,046 | |
| |
| Class Y | | $ | 364,320,337 | |
| |
| Institutional Class | | $ | 472,161,434 | |
| |
Shares outstanding, $0.01 par value per share, with an unlimited number of shares authorized:
|
| Class A | | | 45,681,752 | |
| |
| Class B | | | 2,415,741 | |
| |
| Class C | | | 7,279,035 | |
| |
| Class Y | | | 11,943,836 | |
| |
| Institutional Class | | | 15,488,422 | |
| |
| Class A: | | | | |
| Net asset value per share | | $ | 30.38 | |
| |
| Maximum offering price per share | | | | |
| (Net asset value of $30.38 divided by 94.50%) | | $ | 32.15 | |
| |
| Class B: | | | | |
| Net asset value and offering price per share | | $ | 29.42 | |
| |
| Class C: | | | | |
| Net asset value and offering price per share | | $ | 29.38 | |
| |
| Class Y: | | | | |
| Net asset value and offering price per share | | $ | 30.50 | |
| |
| Institutional Class: | | | | |
| Net asset value and offering price per share | | $ | 30.48 | |
| |
See accompanying Notes to Financial Statements which are an integral part of the financial statements.
11 Invesco Developing Markets Fund
Statement of Operations
For the year ended October 31, 2011
| | | | | |
Investment income:
|
| Dividends (net of foreign withholding taxes of $8,460,251) | | $ | 61,538,622 | |
| |
| Dividends from affiliated money market funds | | | 282,297 | |
| |
| Total investment income | | | 61,820,919 | |
| |
Expenses:
|
| Advisory fees | | | 21,197,117 | |
| |
| Administrative services fees | | | 503,808 | |
| |
| Custodian fees | | | 2,017,217 | |
| |
| Distribution fees: | | | | |
| Class A | | | 3,606,323 | |
| |
| Class B | | | 679,745 | |
| |
| Class C | | | 2,260,556 | |
| |
| Transfer agent fees — A, B, C and Y | | | 4,156,192 | |
| |
| Transfer agent fees — Institutional | | | 124,836 | |
| |
| Trustees’ and officers’ fees and benefits | | | 82,659 | |
| |
| Other | | | 559,736 | |
| |
| Total expenses | | | 35,188,189 | |
| |
| Less: Fees waived, expenses reimbursed and expense offset arrangement(s) | | | (430,152 | ) |
| |
| Net expenses | | | 34,758,037 | |
| |
| Net investment income | | | 27,062,882 | |
| |
Realized and unrealized gain (loss) from:
|
| Net realized gain (loss) from: | | | | |
| Investment securities (net of tax on the sale of foreign investments of $1,420,145) | | | 59,310,259 | |
| |
| Foreign currencies (net of currency tax of $2,987,621) | | | (3,235,298 | ) |
| |
| | | | 56,074,961 | |
| |
| Change in net unrealized appreciation (depreciation) of: | | | | |
| Investment securities (net of foreign taxes on holding of $(644,958)) | | | (291,355,241 | ) |
| |
| Foreign currencies | | | 353,721 | |
| |
| | | | (291,001,520 | ) |
| |
| Net realized and unrealized gain (loss) | | | (234,926,559 | ) |
| |
| Net increase (decrease) in net assets resulting from operations | | $ | (207,863,677 | ) |
| |
See accompanying Notes to Financial Statements which are an integral part of the financial statements.
12 Invesco Developing Markets Fund
Statement of Changes in Net Assets
For the years ended October 31, 2011 and 2010
| | | | | | | | | |
| | | 2011 | | 2010 |
| |
Operations:
|
| Net investment income | | $ | 27,062,882 | | | $ | 15,528,929 | |
| |
| Net realized gain | | | 56,074,961 | | | | 50,470,975 | |
| |
| Change in net unrealized appreciation (depreciation) | | | (291,001,520 | ) | | | 330,252,596 | |
| |
| Net increase (decrease) in net assets resulting from operations | | | (207,863,677 | ) | | | 396,252,500 | |
| |
Distributions to shareholders from net investment income:
|
| Class A | | | (9,655,142 | ) | | | (11,475,621 | ) |
| |
| Class B | | | (81,586 | ) | | | (410,848 | ) |
| |
| Class C | | | (302,676 | ) | | | (1,198,045 | ) |
| |
| Class Y | | | (2,082,680 | ) | | | (834,075 | ) |
| |
| Institutional Class | | | (3,283,825 | ) | | | (539,553 | ) |
| |
| Total distributions from net investment income | | | (15,405,909 | ) | | | (14,458,142 | ) |
| |
Distributions to shareholders from net realized gains:
|
| Class A | | | (1,390,785 | ) | | | — | |
| |
| Class B | | | (63,154 | ) | | | — | |
| |
| Class C | | | (234,307 | ) | | | — | |
| |
| Class Y | | | (237,094 | ) | | | — | |
| |
| Institutional Class | | | (331,608 | ) | | | — | |
| |
| Total distributions from net realized gains | | | (2,256,948 | ) | | | — | |
| |
Share transactions–net:
|
| Class A | | | 169,724,959 | | | | 182,511,482 | |
| |
| Class B | | | 17,998,997 | | | | (2,545,284 | ) |
| |
| Class C | | | 13,263,172 | | | | 38,207,197 | |
| |
| Class Y | | | 183,120,381 | | | | 122,728,301 | |
| |
| Institutional Class | | | 198,584,898 | | | | 250,360,999 | |
| |
| Net increase in net assets resulting from share transactions | | | 582,692,407 | | | | 591,262,695 | |
| |
| Net increase in net assets | | | 357,165,873 | | | | 973,057,053 | |
| |
Net assets:
|
| Beginning of year | | | 2,152,269,119 | | | | 1,179,212,066 | |
| |
| End of year (includes undistributed net investment income of $16,822,276 and $9,434,682, respectively) | | $ | 2,509,434,992 | | | $ | 2,152,269,119 | |
| |
Notes to Financial Statements
October 31, 2011
NOTE 1—Significant Accounting Policies
Invesco Developing Markets Fund (the “Fund”) is a series portfolio of AIM Investment Funds (Invesco Investment Funds) (the “Trust”). The Trust is organized as a Delaware statutory trust and is registered under the Investment Company Act of 1940, as amended (the “1940 Act”), as an open-end series management investment company consisting of thirteen separate series portfolios, each authorized to issue an unlimited number of shares of beneficial interest. The assets, liabilities and operations of each portfolio are accounted for separately. Information presented in these financial statements pertains only to the Fund. Matters affecting each portfolio or class will be voted on exclusively by the shareholders of such portfolio or class.
The Fund’s objective is to provide long-term growth of capital and, secondarily, income.
The Fund currently consists of five different classes of shares: Class A, Class B, Class C, Class Y and Institutional Class. Class A shares are sold with a front-end sales charge unless certain waiver criteria are met and under certain circumstances load waived shares may be subject to contingent deferred sales charges (“CDSC”). Class C shares are sold with a CDSC. Class Y and Institutional Class shares are sold at net asset value. Effective November 30, 2010, new or
13 Invesco Developing Markets Fund
additional investments in Class B shares are no longer permitted. Existing shareholders of Class B shares may continue to reinvest dividends and capital gains distributions in Class B shares until they convert. Also, shareholders in Class B shares will be able to exchange those shares for Class B shares of other Invesco Funds offering such shares until they convert. Generally, Class B shares will automatically convert to Class A shares on or about the month-end which is at least eight years after the date of purchase. Redemption of Class B shares prior to conversion date will be subject to a CDSC.
The following is a summary of the significant accounting policies followed by the Fund in the preparation of its financial statements.
| | |
| A. | | Security Valuations — Securities, including restricted securities, are valued according to the following policy. |
| | A security listed or traded on an exchange (except convertible bonds) is valued at its last sales price or official closing price as of the close of the customary trading session on the exchange where the security is principally traded, or lacking any sales or official closing price on a particular day, the security may be valued at the closing bid price on that day. Securities traded in the over-the-counter market are valued based on prices furnished by independent pricing services or market makers. When such securities are valued by an independent pricing service they may be considered fair valued. Futures contracts are valued at the final settlement price set by an exchange on which they are principally traded. Listed options are valued at the mean between the last bid and ask prices from the exchange on which they are principally traded. Options not listed on an exchange are valued by an independent source at the mean between the last bid and ask prices. For purposes of determining net asset value per share, futures and option contracts generally are valued 15 minutes after the close of the customary trading session of the New York Stock Exchange (“NYSE”). |
| | Investments in open-end and closed-end registered investment companies that do not trade on an exchange are valued at the end of day net asset value per share. Investments in open-end and closed-end registered investment companies that trade on an exchange are valued at the last sales price or official closing price as of the close of the customary trading session on the exchange where the security is principally traded. |
| | Debt obligations (including convertible bonds) and unlisted equities are fair valued using an evaluated quote provided by an independent pricing service. Evaluated quotes provided by the pricing service may be determined without exclusive reliance on quoted prices, and may reflect appropriate factors such as institution-size trading in similar groups of securities, developments related to specific securities, dividend rate, yield, quality, type of issue, coupon rate, maturity, individual trading characteristics and other market data. Debt securities are subject to interest rate and credit risks. In addition, all debt securities involve some risk of default with respect to interest and/or principal payments. |
| | Foreign securities (including foreign exchange contracts) are converted into U.S. dollar amounts using the applicable exchange rates as of the close of the NYSE. If market quotations are available and reliable for foreign exchange traded equity securities, the securities will be valued at the market quotations. Because trading hours for certain foreign securities end before the close of the NYSE, closing market quotations may become unreliable. If between the time trading ends on a particular security and the close of the customary trading session on the NYSE, events occur that are significant and make the closing price unreliable, the Fund may fair value the security. If the event is likely to have affected the closing price of the security, the security will be valued at fair value in good faith using procedures approved by the Board of Trustees. Adjustments to closing prices to reflect fair value may also be based on a screening process of an independent pricing service to indicate the degree of certainty, based on historical data, that the closing price in the principal market where a foreign security trade is not the current value as of the close of the NYSE. Foreign securities meeting the approved degree of certainty that the price is not reflective of current value will be priced at the indication of fair value from the independent pricing service. Multiple factors may be considered by the independent pricing service in determining adjustments to reflect fair value and may include information relating to sector indices, American Depositary Receipts and domestic and foreign index futures. Foreign securities may have additional risks including exchange rate changes, potential for sharply devalued currencies and high inflation, political and economical upheaval, the relative lack of issuer information, relatively low market liquidity and the potential lack of strict financial and accounting controls and standards. |
| | Securities for which market prices are not provided by any of the above methods may be valued based upon quotes furnished by independent sources. The last bid price may be used to value equity securities. The mean between the last bid and asked prices is used to value debt obligations, including Corporate Loans. |
| | Securities for which market quotations are not readily available or are unreliable are valued at fair value as determined in good faith by or under the supervision of the Trust’s officers following procedures approved by the Board of Trustees. Issuer specific events, market trends, bid/ask quotes of brokers and information providers and other market data may be reviewed in the course of making a good faith determination of a security’s fair value. |
| | Valuations change in response to many factors including the historical and prospective earnings of the issuer, the value of the issuer’s assets, general economic conditions, interest rates, investor perceptions and market liquidity. Because of the inherent uncertainties of valuation, the values reflected in the financial statements may materially differ from the value received upon actual sale of those investments. |
| B. | | Securities Transactions and Investment Income — Securities transactions are accounted for on a trade date basis. Realized gains or losses on sales are computed on the basis of specific identification of the securities sold. Interest income is recorded on the accrual basis from settlement date. Dividend income (net of withholding tax, if any) is recorded on the ex-dividend date. |
| | The Fund may periodically participate in litigation related to Fund investments. As such, the Fund may receive proceeds from litigation settlements. Any proceeds received are included in the Statement of Operations as realized gain (loss) for investments no longer held and as unrealized gain (loss) for investments still held. |
| | Brokerage commissions and mark ups are considered transaction costs and are recorded as an increase to the cost basis of securities purchased and/or a reduction of proceeds on a sale of securities. Such transaction costs are included in the determination of net realized and unrealized gain (loss) from investment securities reported in the Statement of Operations and the Statement of Changes in Net Assets and the net realized and unrealized gains (losses) on securities per share in the Financial Highlights. Transaction costs are included in the calculation of the Fund’s net asset value and, accordingly, they reduce the Fund’s total returns. These transaction costs are not considered operating expenses and are not reflected in net investment income reported in the Statement of Operations and Statement of Changes in Net Assets, or the net investment income per share and ratios of expenses and net investment income reported in the Financial Highlights, nor are they limited by any expense limitation arrangements between the Fund and the investment adviser. |
| | The Fund allocates income and realized and unrealized capital gains and losses to a class based on the relative net assets of each class. |
14 Invesco Developing Markets Fund
| | |
| C. | | Country Determination — For the purposes of making investment selection decisions and presentation in the Schedule of Investments, the investment adviser may determine the country in which an issuer is located and/or credit risk exposure based on various factors. These factors include the laws of the country under which the issuer is organized, where the issuer maintains a principal office, the country in which the issuer derives 50% or more of its total revenues and the country that has the primary market for the issuer’s securities, as well as other criteria. Among the other criteria that may be evaluated for making this determination are the country in which the issuer maintains 50% or more of its assets, the type of security, financial guarantees and enhancements, the nature of the collateral and the sponsor organization. Country of issuer and/or credit risk exposure has been determined to be the United States of America, unless otherwise noted. |
| D. | | Distributions — Distributions from income and net realized capital gain, if any, are generally paid annually and recorded on ex-dividend date. The Fund may elect to treat a portion of the proceeds from redemptions as distributions for federal income tax purposes. |
| E. | | Federal Income Taxes — The Fund intends to comply with the requirements of Subchapter M of the Internal Revenue Code necessary to qualify as a regulated investment company and to distribute substantially all of the Fund’s taxable earnings to shareholders. As such, the Fund will not be subject to federal income taxes on otherwise taxable income (including net realized capital gain) that is distributed to shareholders. Therefore, no provision for federal income taxes is recorded in the financial statements. |
| | The Fund files tax returns in the U.S. Federal jurisdiction and certain other jurisdictions. Generally, the Fund is subject to examinations by such taxing authorities for up to three years after the filing of the return for the tax period. |
| F. | | Expenses — Fees provided for under the Rule 12b-1 plan of a particular class of the Fund are charged to the operations of such class. Transfer agency fees and expenses and other shareholder recordkeeping fees and expenses attributable to the Institutional Class are charged to such class. Transfer agency fees and expenses and other shareholder recordkeeping fees and expenses relating to all other classes are allocated among those classes based on relative net assets. All other expenses are allocated among the classes based on relative net assets. |
| G. | | Accounting Estimates — The preparation of financial statements in conformity with accounting principles generally accepted in the United States of America (“GAAP”) requires management to make estimates and assumptions that affect the reported amounts of assets and liabilities at the date of the financial statements and the reported amounts of revenues and expenses during the reporting period including estimates and assumptions related to taxation. Actual results could differ from those estimates by a significant amount. In addition, the Fund monitors for material events or transactions that may occur or become known after the period-end date and before the date the financial statements are released to print. |
| H. | | Indemnifications — Under the Trust’s organizational documents, each Trustee, officer, employee or other agent of the Trust is indemnified against certain liabilities that may arise out of performance of their duties to the Fund. Additionally, in the normal course of business, the Fund enters into contracts, including the Fund’s servicing agreements that contain a variety of indemnification clauses. The Fund’s maximum exposure under these arrangements is unknown as this would involve future claims that may be made against the Fund that have not yet occurred. The risk of material loss as a result of such indemnification claims is considered remote. |
| I. | | Redemption Fees — The Fund has a 2% redemption fee that is to be retained by the Fund to offset transaction costs and other expenses associated with short-term redemptions and exchanges. The fee, subject to certain exceptions, is imposed on certain redemptions or exchanges of shares within 31 days of purchase. The redemption fee is recorded as an increase in shareholder capital and is allocated among the share classes based on the relative net assets of each class. Effective January 1, 2012, the Fund will eliminate the 2% redemption fee, if applicable, assessed on shares of the Fund redeemed or exchanged within 31 days of purchase. |
| J. | | Foreign Currency Translations — Foreign currency is valued at the close of the NYSE based on quotations posted by banks and major currency dealers. Portfolio securities and other assets and liabilities denominated in foreign currencies are translated into U.S. dollar amounts at date of valuation. Purchases and sales of portfolio securities (net of foreign taxes withheld on disposition) and income items denominated in foreign currencies are translated into U.S. dollar amounts on the respective dates of such transactions. The Fund does not separately account for the portion of the results of operations resulting from changes in foreign exchange rates on investments and the fluctuations arising from changes in market prices of securities held. The combined results of changes in foreign exchange rates and the fluctuation of market prices on investments (net of estimated foreign tax withholding) are included with the net realized and unrealized gain or loss from investments in the Statement of Operations. Reported net realized foreign currency gains or losses arise from (1) sales of foreign currencies, (2) currency gains or losses realized between the trade and settlement dates on securities transactions, and (3) the difference between the amounts of dividends, interest, and foreign withholding taxes recorded on the Fund’s books and the U.S. dollar equivalent of the amounts actually received or paid. Net unrealized foreign currency gains and losses arise from changes in the fair values of assets and liabilities, other than investments in securities at fiscal period end, resulting from changes in exchange rates. |
| | The Fund may invest in foreign securities which may be subject to foreign taxes on income, gains on investments or currency repatriation, a portion of which may be recoverable. |
| K. | | Foreign Currency Contracts — The Fund may enter into foreign currency contracts to manage or minimize currency or exchange rate risk. The Fund may also enter into foreign currency contracts for the purchase or sale of a security denominated in a foreign currency in order to “lock in” the U.S. dollar price of that security. A foreign currency contract is an obligation to purchase or sell a specific currency for an agreed-upon price at a future date. The use of foreign currency contracts does not eliminate fluctuations in the price of the underlying securities the Fund owns or intends to acquire but establishes a rate of exchange in advance. Fluctuations in the value of these contracts are measured by the difference in the contract date and reporting date exchange rates and are recorded as unrealized appreciation (depreciation) until the contracts are closed. When the contracts are closed, realized gains (losses) are recorded. Realized and unrealized gains (losses) on the contracts are included in the Statement of Operations. The primary risks associated with foreign currency contracts include failure of the counterparty to meet the terms of the contract and the value of the foreign currency changing unfavorably. These risks may be in excess of the amounts reflected in the Statement of Assets and Liabilities. |
15 Invesco Developing Markets Fund
NOTE 2—Advisory Fees and Other Fees Paid to Affiliates
The Trust has entered into a master investment advisory agreement with Invesco Advisers, Inc. (the “Adviser” or “Invesco”). Under the terms of the investment advisory agreement, the Fund pays an advisory fee to the Adviser based on the annual rate of the Fund’s average daily net assets as follows:
| | | | | |
| Average Net Assets | | Rate |
| |
| First $250 million | | | 0 | .935% |
| |
| Next $250 million | | | 0 | .91% |
| |
| Next $500 million | | | 0 | .885% |
| |
| Next $1.5 billion | | | 0 | .86% |
| |
| Next $2.5 billion | | | 0 | .835% |
| |
| Next $2.5 billion | | | 0 | .81% |
| |
| Next $2.5 billion | | | 0 | .785% |
| |
| Over $10 billion | | | 0 | .76% |
| |
Under the terms of a master sub-advisory agreement between the Adviser and each of Invesco Asset Management Deutschland GmbH, Invesco Asset Management Limited, Invesco Asset Management (Japan) Limited, Invesco Australia Limited, Invesco Hong Kong Limited, Invesco Senior Secured Management, Inc. and Invesco Canada Ltd. (collectively, the “Affiliated Sub-Advisers”) the Adviser, not the Fund, may pay 40% of the fees paid to the Adviser to any such Affiliated Sub-Adviser(s) that provide discretionary investment management services to the Fund based on the percentage of assets allocated to such Sub-Adviser(s).
Effective May 23, 2011, the Adviser has contractually agreed, through at least June 30, 2012, to waive advisory fees and/or reimburse expenses to the extent necessary to limit total annual operating expenses after fee waiver and/or reimbursement (excluding certain items discussed below) of Class A, Class B, Class C, Class Y and Institutional Class shares to 2.10%, 2.85%, 2.85%, 1.85% and 1.85% of average daily net assets, respectively. Prior to May 23, 2011, the Adviser had contractually agreed to waive advisory fees and/or reimburse expenses to limit total annual operating expenses after fee waivers and/or expense reimbursement of Class A, Class B, Class C, Class Y and Institutional Class shares to 2.25%, 3.00%, 3.00%, 2.00% and 2.00% of average daily net assets, respectively. In determining the Adviser’s obligation to waive advisory fees and/or reimburse expenses, the following expenses are not taken into account, and could cause total annual operating expenses to exceed the numbers reflected above: (1) interest; (2) taxes; (3) dividend expense on short sales; (4) extraordinary or non-routine items; and (5) expenses that the Fund has incurred but did not actually pay because of an expense offset arrangement. Unless the Board of the Trustees and Invesco mutually agree to amend or continue the fee waiver agreement, it will terminate on June 30, 2012. The Adviser did not waive fees and/or reimburse expenses during the period under this expense limitation.
Further, the Adviser has contractually agreed, through at least June 30, 2012, to waive the advisory fee payable by the Fund in an amount equal to 100% of the net advisory fees the Adviser receives from the affiliated money market funds on investments by the Fund of uninvested cash in such affiliated money market funds.
For the year ended October 31, 2011, the Adviser waived advisory fees of $419,153.
At the request of the Trustees of the Trust, Invesco Ltd. agreed to reimburse expenses incurred by the Fund in connection with market timing matters in the Invesco Funds, which may include legal, audit, shareholder reporting, communications and trustee expenses. These expenses along with the related expense reimbursement are included in the Statement of Operations. For the year ended October 31, 2011, Invesco Ltd. reimbursed expenses of the Fund in the amount of $4,251.
The Trust has entered into a master administrative services agreement with Invesco pursuant to which the Fund has agreed to pay Invesco for certain administrative costs incurred in providing accounting services to the Fund. For the year ended October 31, 2011, expenses incurred under the agreement are shown in the Statement of Operations as administrative services fees.
The Trust has entered into a transfer agency and service agreement with Invesco Investment Services, Inc. (“IIS”) pursuant to which the Fund has agreed to pay IIS a fee for providing transfer agency and shareholder services to the Fund and reimburse IIS for certain expenses incurred by IIS in the course of providing such services. IIS may make payments to intermediaries that provide omnibus account services, sub-accounting services and/or networking services. All fees payable by IIS to intermediaries that provide omnibus account services or sub-accounting are charged back to the Fund, subject to certain limitations approved by the Trust’s Board of Trustees. For the year ended October 31, 2011, expenses incurred under the agreement are shown in the Statement of Operations as transfer agent fees.
The Trust has entered into master distribution agreements with Invesco Distributors, Inc. (“IDI”) to serve as the distributor for the Class A, Class B, Class C, Class Y and Institutional Class shares of the Fund. The Trust has adopted plans pursuant to Rule 12b-1 under the 1940 Act with respect to the Fund’s Class A, Class B and Class C shares (collectively, the “Plans”). The Fund, pursuant to the Plans, pays IDI compensation at the annual rate of 0.25% of the Fund’s average daily net assets of Class A shares and 1.00% of the average daily net assets of Class B and Class C shares. Of the Plan payments, up to 0.25% of the average daily net assets of each class of shares may be paid to furnish continuing personal shareholder services to customers who purchase and own shares of such classes. Any amounts not paid as a service fee under the Plans would constitute an asset-based sales charge. Rules of the Financial Industry Regulatory Authority (“FINRA”) impose a cap on the total sales charges, including asset-based sales charges that may be paid by any class of shares of the Fund. For the year ended October 31, 2011, expenses incurred under the Plans are shown in the Statement of Operations as distribution fees.
Front-end sales commissions and CDSC (collectively, the “sales charges”) are not recorded as expenses of the Fund. Front-end sales commissions are deducted from proceeds from the sales of Fund shares prior to investment in Class A shares of the Fund. CDSC are deducted from redemption proceeds prior to remittance to the shareholder. During the year ended October 31, 2011, IDI advised the Fund that IDI retained $105,752 in front-end sales commissions from the sale of Class A shares and $27,730, $117,469 and $48,558 from Class A, Class B and Class C shares, respectively, for CDSC imposed on redemptions by shareholders.
Certain officers and trustees of the Trust are officers and directors of the Adviser, Invesco Ltd., IIS and/or IDI.
16 Invesco Developing Markets Fund
NOTE 3—Additional Valuation Information
GAAP defines fair value as the price that would be received to sell an asset or paid to transfer a liability in an orderly transaction between market participants at the measurement date, under current market conditions. GAAP establishes a hierarchy that prioritizes the inputs to valuation methods giving the highest priority to readily available unadjusted quoted prices in an active market for identical assets (Level 1) and the lowest priority to significant unobservable inputs (Level 3) generally when market prices are not readily available or are unreliable. Based on the valuation inputs, the securities or other investments are tiered into one of three levels. Changes in valuation methods may result in transfers in or out of an investment’s assigned level:
| | |
| | Level 1 — | Prices are determined using quoted prices in an active market for identical assets. |
| | Level 2 — | Prices are determined using other significant observable inputs. Observable inputs are inputs that other market participants may use in pricing a security. These may include quoted prices for similar securities, interest rates, prepayment speeds, credit risk, yield curves, loss severities, default rates, discount rates, volatilities and others. |
| | Level 3 — | Prices are determined using significant unobservable inputs. In situations where quoted prices or observable inputs are unavailable (for example, when there is little or no market activity for an investment at the end of the period), unobservable inputs may be used. Unobservable inputs reflect the Fund’s own assumptions about the factors market participants would use in determining fair value of the securities or instruments and would be based on the best available information. |
The following is a summary of the tiered valuation input levels, as of October 31, 2011. The level assigned to the securities valuations may not be an indication of the risk or liquidity associated with investing in those securities. Because of the inherent uncertainties of valuation, the values reflected in the financial statements may materially differ from the value received upon actual sale of those investments.
| | | | | | | | | | | | | | | | | |
| | | Level 1* | | Level 2* | | Level 3 | | Total |
| |
| Brazil | | $ | 459,424,656 | | | $ | — | | | $ | — | | | $ | 459,424,656 | |
| |
| China | | | 35,881,970 | | | | 220,296,451 | | | | — | | | | 256,178,421 | |
| |
| Czech Republic | | | 17,911,003 | | | | — | | | | — | | | | 17,911,003 | |
| |
| Egypt | | | 14,843,283 | | | | 11,783,034 | | | | — | | | | 26,626,317 | |
| |
| Hong Kong | | | — | | | | 36,327,047 | | | | — | | | | 36,327,047 | |
| |
| Indonesia | | | — | | | | 134,903,320 | | | | — | | | | 134,903,320 | |
| |
| Isreal | | | 24,755,713 | | | | — | | | | — | | | | 24,755,713 | |
| |
| Luxembourg | | | — | | | | 9,684,991 | | | | — | | | | 9,684,991 | |
| |
| Malaysia | | | — | | | | 89,082,716 | | | | — | | | | 89,082,716 | |
| |
| Mexico | | | 248,600,748 | | | | — | | | | 0 | | | | 248,600,748 | |
| |
| Netherlands | | | 17,625,601 | | | | — | | | | — | | | | 17,625,601 | |
| |
| Nigeria | | | 18,043,419 | | | | — | | | | — | | | | 18,043,419 | |
| |
| Peru | | | 56,629,780 | | | | — | | | | — | | | | 56,629,780 | |
| |
| Philippines | | | 12,000,275 | | | | 186,550,734 | | | | — | | | | 198,551,009 | |
| |
| Russia | | | 37,776,467 | | | | 67,316,979 | | | | — | | | | 105,093,446 | |
| |
| South Africa | | | 45,122,965 | | | | 46,219,909 | | | | — | | | | 91,342,874 | |
| |
| South Korea | | | — | | | | 128,497,390 | | | | — | | | | 128,497,390 | |
| |
| Taiwan | | | — | | | | 85,460,630 | | | | — | | | | 85,460,630 | |
| |
| Thailand | | | — | | | | 122,405,162 | | | | — | | | | 122,405,162 | |
| |
| Turkey | | | — | | | | 101,209,779 | | | | — | | | | 101,209,779 | |
| |
| United Kingdom | | | — | | | | 43,582,585 | | | | — | | | | 43,582,585 | |
| |
| United States | | | 239,964,386 | | | | — | | | | — | | | | 239,964,386 | |
| |
| Total Investments | | $ | 1,228,580,266 | | | $ | 1,283,320,727 | | | $ | 0 | | | $ | 2,511,900,993 | |
| |
| |
| * | Transfers occured between Level 1 and Level 2 due to foreign fair value adjustments. |
NOTE 4—Expense Offset Arrangement(s)
The expense offset arrangements are comprised of (1) transfer agency credits which result from balances in Demand Deposit Accounts (DDA) used by the transfer agent for clearing shareholder transactions and (2) custodian credits which result from periodic overnight cash balances at the custodian. For the year ended October 31, 2011, the Fund received credits from these arrangements, which resulted in the reduction of the Fund’s total expenses of $6,748.
NOTE 5—Trustees’ and Officers’ Fees and Benefits
“Trustees’ and Officers’ Fees and Benefits” include amounts accrued by the Fund to pay remuneration to certain Trustees and Officers of the Fund. Trustees have the option to defer compensation payable by the Fund, and “Trustees’ and Officers’ Fees and Benefits” also include amounts accrued by the Fund to fund such deferred compensation amounts. Those Trustees who defer compensation have the option to select various Invesco Funds in which their deferral accounts shall
17 Invesco Developing Markets Fund
be deemed to be invested. Finally, certain current Trustees are eligible to participate in a retirement plan that provides for benefits to be paid upon retirement to Trustees over a period of time based on the number of years of service. The Fund may have certain former Trustees who also participate in a retirement plan and receive benefits under such plan. “Trustees’ and Officers’ Fees and Benefits” include amounts accrued by the Fund to fund such retirement benefits. Obligations under the deferred compensation and retirement plans represent unsecured claims against the general assets of the Fund.
During the year ended October 31, 2011, the Fund paid legal fees of $5,042 for services rendered by Kramer, Levin, Naftalis & Frankel LLP as counsel to the Independent Trustees. A partner of that firm is a Trustee of the Trust.
NOTE 6—Cash Balances
The Fund is permitted to temporarily carry a negative or overdrawn balance in its account with The State Street Bank and Trust Company, the custodian bank. To compensate the custodian bank for such overdrafts, the overdrawn Fund may either (1) leave funds as a compensating balance in the account so the custodian bank can be compensated by earning the additional interest; or (2) compensate by paying the custodian bank at a rate agreed upon by the custodian bank and Invesco, not to exceed the contractually agreed upon rate.
NOTE 7—Distributions to Shareholders and Tax Components of Net Assets
Tax Character of Distributions to Shareholders Paid During the Years Ended October 31, 2011 and 2010:
| | | | | | | | | |
| | | 2011 | | 2010 |
| |
| Ordinary income | | $ | 15,047,707 | | | $ | 14,458,142 | |
| |
| Long-term capital gain | | | 2,615,150 | | | | — | |
| |
| Total distributions | | $ | 17,662,857 | | | $ | 14,458,142 | |
| |
Tax Components of Net Assets at Period-End:
| | | | | |
| | | 2011 |
| |
| Undistributed ordinary income | | $ | 20,393,119 | |
| |
| Undistributed long-term gain | | | 49,336,608 | |
| |
| Net unrealized appreciation — investments | | | 226,587,665 | |
| |
| Net unrealized appreciation (depreciation) — other investments | | | (320,153 | ) |
| |
| Temporary book/tax differences | | | (130,592 | ) |
| |
| Capital loss carryforward | | | (123,032,046 | ) |
| |
| Shares of beneficial interest | | | 2,336,600,391 | |
| |
| Total net assets | | $ | 2,509,434,992 | |
| |
The difference between book-basis and tax-basis unrealized appreciation (depreciation) is due to differences in the timing of recognition of gains and losses on investments for tax and book purposes. The Fund’s net unrealized appreciation (depreciation) difference is attributable primarily to wash sales and the recognition for tax purposes of unrealized gains on passive foreign investment companies.
The temporary book/tax differences are a result of timing differences between book and tax recognition of income and/or expenses. The Fund’s temporary book/tax differences are the result of the trustee deferral of compensation and retirement plan benefits.
Capital loss carryforward is calculated and reported as of a specific date. Results of transactions and other activity after that date may affect the amount of capital loss carryforward actually available for the Fund to utilize. The ability to utilize capital loss carryforward in the future may be limited under the Internal Revenue Code and related regulations based on the results of future transactions. Under these limitation rules, the Fund is limited to utilizing $14,997,570 of capital loss carryforward in the fiscal year ending October 31, 2012.
The Fund utilized $13,180,933 of capital loss carryforward in the current period to offset net realized capital gain for federal income tax purposes. The Fund has a capital loss carryforward as of October 31, 2011, which expires as follows:
| | | | | |
| | | Capital Loss
|
| Expiration | | Carryforward* |
| |
| October 31, 2016 | | $ | 4,060,986 | |
| |
| October 31, 2017 | | | 118,971,060 | |
| |
| Total capital loss carryforward | | $ | 123,032,046 | |
| |
| |
| * | Capital loss carryforward as of the date listed above is reduced for limitations, if any, to the extent required by the Internal Revenue Code. To the extent that unrealized gains as of May 23, 2011, the date of reorganization of Invesco Van Kampen Emerging Markets Fund into the Fund are realized on securities held in each fund at such date of reorganization, the capital loss carryforward may be further limited for up to five years from the date of the reorganization. |
18 Invesco Developing Markets Fund
NOTE 8—Investment Securities
The aggregate amount of investment securities (other than short-term securities, U.S. Treasury obligations and money market funds, if any) purchased and sold by the Fund during the year ended October 31, 2011 was $811,188,348 and $354,667,275, respectively. Cost of investments on a tax basis includes the adjustments for financial reporting purposes as of the most recently completed Federal income tax reporting period-end.
| | | | | |
| Unrealized Appreciation (Depreciation) of Investment Securities on a Tax Basis |
| |
| Aggregate unrealized appreciation of investment securities | | $ | 387,672,933 | |
| |
| Aggregate unrealized (depreciation) of investment securities | | | (161,085,268 | ) |
| |
| Net unrealized appreciation of investment securities | | $ | 226,587,665 | |
| |
| Cost of investments for tax purposes is $2,285,313,328. |
NOTE 9—Reclassification of Permanent Differences
Primarily as a result of differing book/tax treatment of foreign currency transactions and foreign capital gain taxes, on October 31, 2011, undistributed net investment income was decreased by $4,048,110, undistributed net realized gain (loss) was increased by $4,121,208 and shares of beneficial interest decreased by $73,098. This reclassification had no effect on the net assets of the Fund.
Further, as a result of tax deferrals and capital loss carryforward acquired in the reorganization of Invesco Van Kampen Emerging Markets Fund into the Fund, on May 23, 2011, undistributed net investment income was decreased by $221,269, undistributed net realized gain (loss) was decreased by $139,767,670 and shares of beneficial interest was increased by $139,988,939. These reclassifications had no effect on the net assets of the Fund.
19 Invesco Developing Markets Fund
NOTE 10—Share Information
| | | | | | | | | | | | | | | | | |
| | | Summary of Share Activity |
| |
| | | Year ended
| | Year ended
|
| | | October 31, 2011(a) | | October 31, 2010 |
| | | Shares | | Amount | | Shares | | Amount |
| |
| Sold: | | | | | | | | | | | | | | | | |
| Class A | | | 13,333,166 | | | $ | 433,592,819 | | | | 18,831,176 | | | $ | 550,055,563 | |
| |
| Class B | | | 155,249 | | | | 4,938,533 | | | | 566,622 | | | | 16,121,664 | |
| |
| Class C | | | 887,004 | | | | 28,089,901 | | | | 2,771,125 | | | | 78,125,052 | |
| |
| Class Y | | | 9,216,332 | | | | 290,951,222 | | | | 5,376,345 | | | | 160,513,309 | |
| |
| Institutional Class | | | 8,809,593 | | | | 283,606,556 | | | | 8,771,997 | | | | 271,330,309 | |
| |
| Issued as reinvestment of dividends: | | | | | | | | | | | | | | | | |
| Class A | | | 315,280 | | | | 10,271,799 | | | | 376,952 | | | | 10,151,312 | |
| |
| Class B | | | 4,409 | | | | 139,971 | | | | 14,681 | | | | 386,123 | |
| |
| Class C | | | 16,274 | | | | 516,198 | | | | 42,825 | | | | 1,125,023 | |
| |
| Class Y | | | 65,534 | | | | 2,138,366 | | | | 24,400 | | | | 657,826 | |
| |
| Institutional Class | | | 85,579 | | | | 2,786,443 | | | | 15,448 | | | | 415,394 | |
| |
| Automatic conversion of Class B shares to Class A shares: | | | | | | | | | | | | | | | | |
| Class A | | | 222,739 | | | | 7,105,741 | | | | 209,288 | | | | 5,946,525 | |
| |
| Class B | | | (229,422 | ) | | | (7,105,741 | ) | | | (215,011 | ) | | | (5,946,525 | ) |
| |
Issued in connection with acquisition:(b) | | | | | | | | | | | | | | | | |
| Class A | | | 7,097,789 | | | | 236,300,576 | | | | — | | | | — | |
| |
| Class B | | | 1,067,847 | | | | 34,530,890 | | | | — | | | | — | |
| |
| Class C | | | 1,534,925 | | | | 49,580,803 | | | | — | | | | — | |
| |
| Class Y | | | 275,332 | | | | 9,192,213 | | | | — | | | | — | |
| |
| Institutional Class | | | 373 | | | | 12,436 | | | | — | | | | — | |
| |
Reacquired:(c) | | | | | | | | | | | | | | | | |
| Class A | | | (16,179,102 | ) | | | (517,545,976 | ) | | | (13,836,234 | ) | | | (383,641,918 | ) |
| |
| Class B | | | (468,601 | ) | | | (14,504,656 | ) | | | (479,485 | ) | | | (13,106,546 | ) |
| |
| Class C | | | (2,090,600 | ) | | | (64,923,730 | ) | | | (1,501,099 | ) | | | (41,042,878 | ) |
| |
| Class Y | | | (3,744,182 | ) | | | (119,161,420 | ) | | | (1,335,069 | ) | | | (38,442,834 | ) |
| |
| Institutional Class | | | (2,724,182 | ) | | | (87,820,537 | ) | | | (729,745 | ) | | | (21,384,704 | ) |
| |
| Net increase in share activity | | | 17,651,336 | | | $ | 582,692,407 | | | | 18,904,216 | | | $ | 591,262,695 | |
| |
| | |
| (a) | | There are entities that are record owners of more than 5% of the outstanding shares of the Fund and in the aggregate own 18% of the outstanding shares of the Fund. The Fund and the Fund’s principal underwriter or adviser, are parties to participation agreements with these entities whereby these entities sell units of interest in separate accounts funding variable products that are invested in the Fund. The Fund, Invesco and/or Invesco affiliates may make payments to these entities, which are considered to be related to the Fund, for providing services to the Fund, Invesco and/or Invesco affiliates including but not limited to services such as, securities brokerage, third party record keeping and account servicing and administrative services. The Fund has no knowledge as to whether all or any portion of the shares owned of record by these entities are also owned beneficially. |
| (b) | | As of the open of business on May 23, 2011 the Fund acquired all the net assets of Invesco Van Kampen Emerging Markets Fund pursuant to a plan of reorganization approved by the Trustees of the Fund on November 10, 2011 and by the shareholders of Invesco Developing Markets Fund on April 14, 2011. The acquisition was accomplished by a tax-free exchange of 9,976,265 shares of the Fund for 21,482,018 shares outstanding of Invesco Van Kampen Emerging Markets Fund as of the close of business on May 20, 2011. Each class of Invesco Van Kampen Emerging Markets Fund was exchanged for the like class of shares of the Fund based on the relative net asset value of Invesco Van Kampen Emerging Markets Fund to the net asset value of the Fund at the close of business on May 20, 2011. Invesco Van Kampen Emerging Markets Fund’s net assets at that date of $329,616,919, including $44,451,279 of unrealized appreciation, were combined with those of the Fund. The net assets of the Fund immediately before and after the acquisition were $2,373,704,608 and $2,703,321,527, respectively.. |
| (c) | | Net of redemption fees of $162,747 and $166,754 allocated among the classes based on relative net assets of each class for the years ended October 31, 2011 and 2010, respectively. |
20 Invesco Developing Markets Fund
NOTE 11—Financial Highlights
The following schedule presents financial highlights for a share of the Fund outstanding throughout the periods indicated.
| | | | | | | | | | | | | | | | | | | | | | | | | | | | | | | | | | | | | | | | | | | | | | | | | | | | | | | | | |
| | | | | | | | | | | | | | | | | | | | | | | Ratio of
| | Ratio of
| | | | |
| | | | | | | Net gains
| | | | | | | | | | | | | | | | expenses
| | expenses
| | | | |
| | | | | | | (losses) on
| | | | | | | | | | | | | | | | to average
| | to average net
| | Ratio of net
| | |
| | | Net asset
| | | | securities
| | | | Dividends
| | Distributions
| | | | | | | | | | net assets
| | assets without
| | investment
| | |
| | | value,
| | Net
| | (both
| | Total from
| | from net
| | from net
| | | | Net asset
| | | | Net assets,
| | with fee waivers
| | fee waivers
| | income
| | |
| | | beginning
| | investment
| | realized and
| | investment
| | investment
| | realized
| | Total
| | value, end
| | Total
| | end of period
| | and/or expenses
| | and/or expenses
| | to average
| | Portfolio
|
| | | of period | | income(a) | | unrealized)(b) | | operations | | income | | gains | | Distributions | | of period | | Return(c) | | (000s omitted) | | absorbed | | absorbed | | net assets | | turnover(d) |
| |
| Class A |
| Year ended 10/31/11 | | $ | 33.15 | | | $ | 0.36 | | | $ | (2.87 | ) | | $ | (2.51 | ) | | $ | (0.23 | ) | | $ | (0.03 | ) | | $ | (0.26 | ) | | $ | 30.38 | | | | (7.62 | )% | | $ | 1,388,008 | | | | 1.45 | %(e) | | | 1.47 | %(e) | | | 1.11 | %(e) | | | 17 | % |
| Year ended 10/31/10 | | | 25.61 | | | | 0.33 | | | | 7.54 | | | | 7.87 | | | | (0.33 | ) | | | — | | | | (0.33 | ) | | | 33.15 | | | | 31.04 | | | | 1,355,604 | | | | 1.52 | | | | 1.53 | | | | 1.17 | | | | 22 | |
| Year ended 10/31/09 | | | 16.28 | | | | 0.27 | | | | 9.80 | | | | 10.07 | | | | (0.33 | ) | | | (0.41 | ) | | | (0.74 | ) | | | 25.61 | | | | 65.27 | | | | 904,273 | | | | 1.66 | | | | 1.71 | | | | 1.35 | | | | 28 | |
| Year ended 10/31/08 | | | 37.97 | | | | 0.37 | | | | (20.45 | ) | | | (20.08 | ) | | | (0.23 | ) | | | (1.38 | ) | | | (1.61 | ) | | | 16.28 | | | | (55.04 | ) | | | 401,275 | | | | 1.59 | | | | 1.60 | | | | 1.26 | | | | 27 | |
| Year ended 10/31/07 | | | 23.80 | | | | 0.27 | | | | 13.96 | | | | 14.23 | | | | (0.06 | ) | | | — | | | | (0.06 | ) | | | 37.97 | | | | 59.90 | | | | 1,152,814 | | | | 1.57 | | | | 1.61 | | | | 0.89 | | | | 41 | |
| |
| Class B |
| Year ended 10/31/11 | | | 32.16 | | | | 0.11 | | | | (2.78 | ) | | | (2.67 | ) | | | (0.04 | ) | | | (0.03 | ) | | | (0.07 | ) | | | 29.42 | | | | (8.30 | ) | | | 71,066 | | | | 2.20 | (e) | | | 2.22 | (e) | | | 0.36 | (e) | | | 17 | |
| Year ended 10/31/10 | | | 24.92 | | | | 0.12 | | | | 7.33 | | | | 7.45 | | | | (0.21 | ) | | | — | | | | (0.21 | ) | | | 32.16 | | | | 30.07 | | | | 60,657 | | | | 2.27 | | | | 2.28 | | | | 0.42 | | | | 22 | |
| Year ended 10/31/09 | | | 15.69 | | | | 0.11 | | | | 9.59 | | | | 9.70 | | | | (0.06 | ) | | | (0.41 | ) | | | (0.47 | ) | | | 24.92 | | | | 64.01 | | | | 49,822 | | | | 2.41 | | | | 2.46 | | | | 0.60 | | | | 28 | |
| Year ended 10/31/08 | | | 36.72 | | | | 0.15 | | | | (19.74 | ) | | | (19.59 | ) | | | (0.06 | ) | | | (1.38 | ) | | | (1.44 | ) | | | 15.69 | | | | (55.36 | ) | | | 32,309 | | | | 2.34 | | | | 2.35 | | | | 0.51 | | | | 27 | |
| Year ended 10/31/07 | | | 23.14 | | | | 0.04 | | | | 13.54 | | | | 13.58 | | | | — | | | | — | | | | — | | | | 36.72 | | | | 58.69 | | | | 103,476 | | | | 2.32 | | | | 2.36 | | | | 0.14 | | | | 41 | |
| |
| Class C |
| Year ended 10/31/11 | | | 32.12 | | | | 0.11 | | | | (2.78 | ) | | | (2.67 | ) | | | (0.04 | ) | | | (0.03 | ) | | | (0.07 | ) | | | 29.38 | | | | (8.31 | ) | | | 213,879 | | | | 2.20 | (e) | | | 2.22 | (e) | | | 0.36 | (e) | | | 17 | |
| Year ended 10/31/10 | | | 24.89 | | | | 0.12 | | | | 7.32 | | | | 7.44 | | | | (0.21 | ) | | | — | | | | (0.21 | ) | | | 32.12 | | | | 30.07 | | | | 222,634 | | | | 2.27 | | | | 2.28 | | | | 0.42 | | | | 22 | |
| Year ended 10/31/09 | | | 15.67 | | | | 0.11 | | | | 9.58 | | | | 9.69 | | | | (0.06 | ) | | | (0.41 | ) | | | (0.47 | ) | | | 24.89 | | | | 64.03 | | | | 139,845 | | | | 2.41 | | | | 2.46 | | | | 0.60 | | | | 28 | |
| Year ended 10/31/08 | | | 36.68 | | | | 0.15 | | | | (19.72 | ) | | | (19.57 | ) | | | (0.06 | ) | | | (1.38 | ) | | | (1.44 | ) | | | 15.67 | | | | (55.37 | ) | | | 76,853 | | | | 2.34 | | | | 2.35 | | | | 0.51 | | | | 27 | |
| Year ended 10/31/07 | | | 23.12 | | | | 0.04 | | | | 13.52 | | | | 13.56 | | | | — | | | | — | | | | — | | | | 36.68 | | | | 58.65 | | | | 219,121 | | | | 2.32 | | | | 2.36 | | | | 0.14 | | | | 41 | |
| |
| Class Y |
| Year ended 10/31/11 | | | 33.26 | | | | 0.44 | | | | (2.88 | ) | | | (2.44 | ) | | | (0.29 | ) | | | (0.03 | ) | | | (0.32 | ) | | | 30.50 | | | | (7.39 | ) | | | 364,320 | | | | 1.20 | (e) | | | 1.22 | (e) | | | 1.36 | (e) | | | 17 | |
| Year ended 10/31/10 | | | 25.66 | | | | 0.41 | | | | 7.56 | | | | 7.97 | | | | (0.37 | ) | | | — | | | | (0.37 | ) | | | 33.26 | | | | 31.41 | | | | 203,884 | | | | 1.27 | | | | 1.28 | | | | 1.42 | | | | 22 | |
| Year ended 10/31/09 | | | 16.29 | | | | 0.37 | | | | 9.75 | | | | 10.12 | | | | (0.34 | ) | | | (0.41 | ) | | | (0.75 | ) | | | 25.66 | | | | 65.56 | | | | 52,993 | | | | 1.41 | | | | 1.46 | | | | 1.60 | | | | 28 | |
| Year ended 10/31/08(f) | | | 20.65 | | | | 0.02 | | | | (4.38 | ) | | | (4.36 | ) | | | — | | | | — | | | | — | | | | 16.29 | | | | (21.11 | ) | | | 1,854 | | | | 1.36 | (g) | | | 1.37 | (g) | | | 1.49 | (g) | | | 27 | |
| |
| Institutional Class |
| Year ended 10/31/11 | | | 33.22 | | | | 0.49 | | | | (2.87 | ) | | | (2.38 | ) | | | (0.33 | ) | | | (0.03 | ) | | | (0.36 | ) | | | 30.48 | | | | (7.24 | ) | | | 472,161 | | | | 1.02 | (e) | | | 1.04 | (e) | | | 1.54 | (e) | | | 17 | |
| Year ended 10/31/10 | | | 25.63 | | | | 0.48 | | | | 7.52 | | | | 8.00 | | | | (0.41 | ) | | | — | | | | (0.41 | ) | | | 33.22 | | | | 31.59 | | | | 309,491 | | | | 1.11 | | | | 1.12 | | | | 1.58 | | | | 22 | |
| Year ended 10/31/09 | | | 16.40 | | | | 0.37 | | | | 9.77 | | | | 10.14 | | | | (0.50 | ) | | | (0.41 | ) | | | (0.91 | ) | | | 25.63 | | | | 66.01 | | | | 32,279 | | | | 1.17 | | | | 1.19 | | | | 1.84 | | | | 28 | |
| Year ended 10/31/08 | | | 38.17 | | | | 0.51 | | | | (20.56 | ) | | | (20.05 | ) | | | (0.34 | ) | | | (1.38 | ) | | | (1.72 | ) | | | 16.40 | | | | (54.81 | ) | | | 11,589 | | | | 1.12 | | | | 1.13 | | | | 1.73 | | | | 27 | |
| Year ended 10/31/07 | | | 23.91 | | | | 0.41 | | | | 14.00 | | | | 14.41 | | | | (0.15 | ) | | | — | | | | (0.15 | ) | | | 38.17 | | | | 60.59 | | | | 30,734 | | | | 1.12 | | | | 1.16 | | | | 1.34 | | | | 41 | |
| |
| | |
| (a) | | Calculated using average shares outstanding. |
| (b) | | Includes redemption fees added to shares of beneficial interest which were less than $0.005 per share. |
| (c) | | Includes adjustments in accordance with accounting principles generally accepted in the United States of America and as such, the net asset value for financial reporting purposes and the returns based upon those net asset values may differ from the net asset value and returns for shareholder transactions. Does not include sales charges and is not annualized for periods less than one year, if applicable. |
| (d) | | Portfolio turnover is calculated at the fund level and is not annualized for periods less than one year, if applicable. For the year ended October 31, 2011, the portfolio turnover calculation excludes the value of securities purchased of $179,562,130 and sold of $23,686,059 in the effort to realign the Fund’s portfolio holdings after the reorganization of Invesco Van Kampen Emerging Markets Fund into the Fund. |
| (e) | | Ratios are based on average daily net assets (000’s omitted) of $1,442,529, $67,975, $226,056, $276,040 and $401,310 for Class A, Class B, Class C, Class Y and Institutional Class shares, respectively. |
| (f) | | Commencement date of October 3, 2008. |
| (g) | | Annualized. |
21 Invesco Developing Markets Fund
Report of Independent Registered Public Accounting Firm
To the Board of Trustees of AIM Investment Funds (Invesco Investment Funds)
and Shareholders of Invesco Developing Markets Fund:
In our opinion, the accompanying statement of assets and liabilities, including the schedule of investments, and the related statements of operations and of changes in net assets and the financial highlights present fairly, in all material respects, the financial position of Invesco Developing Markets Fund (one of the funds constituting AIM Investment Funds (Invesco Investment Funds), hereafter referred to as the “Fund”) at October 31, 2011, the results of its operations for the year then ended, the changes in its net assets for each of the two years in the period then ended and the financial highlights for each of the five years in the period then ended, in conformity with accounting principles generally accepted in the United States of America. These financial statements and financial highlights (hereafter referred to as “financial statements”) are the responsibility of the Fund’s management; our responsibility is to express an opinion on these financial statements based on our audits. We conducted our audits of these financial statements in accordance with the standards of the Public Company Accounting Oversight Board (United States). Those standards require that we plan and perform the audit to obtain reasonable assurance about whether the financial statements are free of material misstatement. An audit includes examining, on a test basis, evidence supporting the amounts and disclosures in the financial statements, assessing the accounting principles used and significant estimates made by management, and evaluating the overall financial statement presentation. We believe that our audits, which included confirmation of securities at October 31, 2011 by correspondence with the custodian and brokers, provide a reasonable basis for our opinion.
PRICEWATERHOUSECOOPERS LLP
Houston, Texas
December 21, 2011
22 Invesco Developing Markets Fund
Calculating your ongoing Fund expenses
Example
As a shareholder of the Fund, you incur two types of costs: (1) transaction costs, which may include sales charges (loads) on purchase payments or contingent deferred sales charges on redemptions, and redemption fees, if any; and (2) ongoing costs, including management fees, distribution and/or service (12b-1) fees, and other Fund expenses. This example is intended to help you understand your ongoing costs (in dollars) of investing in the Fund and to compare these costs with ongoing costs of investing in other mutual funds. The example is based on an investment of $1,000 invested at the beginning of the period and held for the entire period May 1, 2011 through October 31, 2011.
Actual expenses
The table below provides information about actual account values and actual expenses. You may use the information in this table, together with the amount you invested, to estimate the expenses that you paid over the period. Simply divide your account value by $1,000 (for example, an $8,600 account value divided by $1,000 = 8.6), then multiply the result by the number in the table under the heading entitled “Actual Expenses Paid During Period” to estimate the expenses you paid on your account during this period.
Hypothetical example for comparison purposes
The table below also provides information about hypothetical account values and hypothetical expenses based on the Fund’s actual expense ratio and an assumed rate of return of 5% per year before expenses, which is not the Fund’s actual return.
The hypothetical account values and expenses may not be used to estimate the actual ending account balance or expenses you paid for the period. You may use this information to compare the ongoing costs of investing in the Fund and other funds. To do so, compare this 5% hypothetical example with the 5% hypothetical examples that appear in the shareholder reports of the other funds.
Please note that the expenses shown in the table are meant to highlight your ongoing costs only and do not reflect any transaction costs, such as sales charges (loads) on purchase payments, contingent deferred sales charges on redemptions, and redemption fees, if any. Therefore, the hypothetical information is useful in comparing ongoing costs only, and will not help you determine the relative total costs of owning different funds. In addition, if these transaction costs were included, your costs would have been higher.
| | | | | | | | | | | | | | | | | | | | | | | | | | | | | | | |
| | | | | | | | | | | | | HYPOTHETICAL
| | | |
| | | | | | | | | | | | | (5% annual return before
| | | |
| | | | | | | ACTUAL | | | expenses) | | | |
| | | | Beginning
| | | Ending
| | | Expenses
| | | Ending
| | | Expenses
| | | Annualized
|
| | | | Account Value
| | | Account Value
| | | Paid During
| | | Account Value
| | | Paid During
| | | Expense
|
| Class | | | (05/01/11) | | | (10/31/11)1 | | | Period2 | | | (10/31/11) | | | Period2 | | | Ratio |
| A | | | $ | 1,000.00 | | | | $ | 874.80 | | | | $ | 6.94 | | | | $ | 1,017.80 | | | | $ | 7.47 | | | | | 1.47 | % |
| | | | | | | | | | | | | | | | | | | | | | | | | | | | | | | |
| B | | | | 1,000.00 | | | | | 871.20 | | | | | 10.46 | | | | | 1,014.02 | | | | | 11.26 | | | | | 2.22 | |
| | | | | | | | | | | | | | | | | | | | | | | | | | | | | | | |
| C | | | | 1,000.00 | | | | | 871.30 | | | | | 10.47 | | | | | 1,014.02 | | | | | 11.26 | | | | | 2.22 | |
| | | | | | | | | | | | | | | | | | | | | | | | | | | | | | | |
| Y | | | | 1,000.00 | | | | | 875.90 | | | | | 5.76 | | | | | 1,019.06 | | | | | 6.20 | | | | | 1.22 | |
| | | | | | | | | | | | | | | | | | | | | | | | | | | | | | | |
| Institutional | | | | 1,000.00 | | | | | 876.60 | | | | | 5.24 | | | | | 1,019.96 | | | | | 5.30 | | | | | 1.04 | |
| | | | | | | | | | | | | | | | | | | | | | | | | | | | | | | |
| |
| 1 | The actual ending account value is based on the actual total return of the Fund for the period May 1, 2011 through October 31, 2011, after actual expenses and will differ from the hypothetical ending account value which is based on the Fund’s expense ratio and a hypothetical annual return of 5% before expenses. |
| 2 | Expenses are equal to the Fund’s annualized expense ratio as indicated above multiplied by the average account value over the period, multiplied by 184/365 to reflect the most recent fiscal half year. |
23 Invesco Developing Markets Fund
| |
| Approval of Investment Advisory and Sub-Advisory Contracts |
The Board of Trustees (the Board) of AIM Investment Funds (Invesco Investment Funds) is required under the Investment Company Act of 1940, as amended, to approve annually the renewal of the Invesco Developing Markets Fund (the Fund) investment advisory agreement with Invesco Advisers, Inc. (Invesco Advisers) and the Master Intergroup Sub-Advisory Contract for Mutual Funds (the sub-advisory contracts) with Invesco Asset Management Deutschland GmbH, Invesco Asset Management Limited, Invesco Asset Management (Japan) Limited, Invesco Australia Limited, Invesco Hong Kong Limited, Invesco Senior Secured Management, Inc. and Invesco Canada Ltd. (collectively, the Affiliated Sub-Advisers). During contract renewal meetings held on June 14-15, 2011, the Board as a whole, and the disinterested or “independent” Trustees, who comprise 80% of the Board, voting separately, approved the continuance of the Fund’s investment advisory agreement and the sub-advisory contracts for another year, effective July 1, 2011. In doing so, the Board considered the process that it follows in reviewing and approving the Fund’s investment advisory agreement and sub-advisory contracts and the information that it is provided. The Board determined that the Fund’s investment advisory agreement and the sub-advisory contracts are in the best interests of the Fund and its shareholders and the compensation to Invesco Advisers and the Affiliated Sub-Advisers under the agreements is fair and reasonable.
The Board’s Fund Evaluation Process
The Board’s Investments Committee has established three Sub-Committees, each of which is responsible for overseeing the management of a number of the series portfolios of the funds advised by Invesco Advisers (the Invesco Funds). The Sub-Committees meet throughout the year to review the performance of their assigned funds, including reviewing materials prepared under the direction of the independent Senior Officer, an officer of the Invesco Funds who reports directly to the independent Trustees. Over the course of each year, the Sub-Committees meet with portfolio managers for their assigned Invesco Funds and other members of management to review the performance, investment objective(s), policies, strategies and limitations and investment risks of these funds. The Sub-Committees meet regularly and at designated contract renewal meetings each year to conduct a review of the performance, fees, expenses and other matters related to their assigned Invesco Funds. Each Sub-Committee recommends to the Investments Committee, which in turn recommends to the full Board, whether to approve the continuance of each Invesco Fund’s investment advisory agreement and sub-advisory contracts for another year.
During the contract renewal process, the Trustees receive comparative performance and fee data regarding the Invesco Funds prepared by Invesco Advisers and an independent company, Lipper, Inc. (Lipper). The Trustees also receive an independent written evaluation from the Senior Officer. The Senior Officer’s evaluation is prepared as part of his responsibility to manage the process by which the Invesco Funds’ proposed management fees are negotiated during the annual contract renewal process to ensure they are negotiated in a manner that is at arms’ length and reasonable. The independent Trustees are assisted in their annual evaluation of the Fund’s investment advisory agreement by the Senior Officer and by independent legal counsel. The independent Trustees also discuss the continuance of the investment advisory agreement and sub-advisory contracts in private sessions with the Senior Officer and counsel.
In evaluating the fairness and reasonableness of the Fund’s investment advisory agreement and sub-advisory contracts, the Board considered, among other things, the factors discussed below. The Trustees also considered information provided in connection with fund acquisitions approved by the Trustees to rationalize the Invesco Funds product range following the acquisition of the retail mutual fund business of Morgan Stanley (the Morgan Stanley Transaction). The Trustees recognized that the advisory fees for the Invesco Funds include advisory fees that are the result of years of review and negotiation between the Trustees and Invesco Advisers as well as advisory fees inherited from Morgan Stanley and Van Kampen funds acquired in the Morgan Stanley Transaction. The Trustees’ deliberations and conclusions in a particular year may be based in part on their deliberations and conclusions regarding these same arrangements throughout the year and in prior years. One Trustee may have weighed a particular piece of information differently than another Trustee.
The discussion below serves as the Senior Officer’s independent written evaluation with respect to the Fund’s investment advisory agreement as well as a discussion of the material factors and related conclusions that formed the basis for the Board’s approval of the Fund’s investment advisory agreement and sub-advisory contracts. Unless otherwise stated, this information is current as of June 15, 2011, and may not reflect consideration of factors that became known to the Board after that date, including, for example, changes to the Fund’s performance, advisory fees, expense limitations and/or fee waivers.
Factors and Conclusions and Summary of Independent Written Fee Evaluation
| |
| A. | Nature, Extent and Quality of Services Provided by Invesco Advisers and the Affiliated Sub-Advisers |
The Board reviewed the advisory services provided to the Fund by Invesco Advisers under the Fund’s investment advisory agreement, the performance of Invesco Advisers in providing these services, and the credentials and experience of the officers and employees of Invesco Advisers who provide these services, including the Fund’s portfolio manager or managers, with whom the Board met during the year. The Board’s review of the qualifications of Invesco Advisers to provide advisory services included the Board’s considerations of Invesco Advisers’ performance and investment process oversight, independent credit analysis and investment risk management.
In determining whether to continue the Fund’s investment advisory agreement, the Board considered the prior relationship between Invesco Advisers and the Fund, as well as the Board’s knowledge of Invesco Advisers’ operations, and concluded that it is beneficial to maintain the current relationship, in part, because of such knowledge. The Board also considered services that Invesco Advisers and its affiliates provide to the Invesco Funds such as various back office support functions, equity and fixed income trading operations, internal audit, distribution and legal and compliance. The Board concluded that the nature, extent and quality of the services provided to the Fund by Invesco Advisers are appropriate and satisfactory and the advisory services are provided in accordance with the terms of the Fund’s investment advisory agreement.
The Board reviewed the services provided by the Affiliated Sub-Advisers under the sub-advisory contracts and the credentials and experience of the officers and employees of the Affiliated Sub-Advisers who provide these services. The Board noted that the Affiliated Sub-Advisers have offices and personnel that are located in financial centers around the world. As a result, the Affiliated Sub-Advisers can provide research and investment analysis on the markets and economies of various countries in which the Fund invests and make recommendations on securities of companies located in such countries. The Board concluded that the sub-advisory contracts benefit the Fund and its shareholders by permitting Invesco Advisers to use the resources and talents of the Affiliated Sub-Advisers in managing the Fund. The Board concluded that the nature, extent and quality of the services provided by the Affiliated Sub-Advisers are appropriate and satisfactory and in accordance with the terms of the Fund’s sub-advisory contracts.
The Board considered Fund performance as a relevant factor in considering whether to approve the investment advisory agreement. The Board did not view Fund performance as a relevant factor in considering whether to approve the sub-advisory contracts for the Fund, as no Affiliated Sub-Adviser currently manages assets of the Fund.
The Board compared the Fund’s performance during the past one, three and five calendar years to the performance of funds in the Lipper performance universe and against the Lipper Emerging Markets Funds Index. The Board noted that
24 Invesco Developing Markets Fund
performance of Class A shares of the Fund was in the second quintile of the performance universe for the one year period and the first quintile for the three and five year periods (the first quintile being the best performing funds and the fifth quintile being the worst performing funds). The Board noted that performance of Class A Shares of the Fund was above the performance of the Index for the one, three and five year periods. Although the independent written evaluation of the Fund’s Senior Officer only considered Fund performance through the most recent calendar year, the Trustees also reviewed more recent Fund performance and this review did not change their conclusions.
| |
| C. | Advisory and Sub-Advisory Fees and Fee Waivers |
The Board compared the Fund’s contractual advisory fee rate to the contractual advisory fee rates of funds in the Fund’s Lipper expense group at a common asset level. The Board noted that the contractual advisory fee rate for Class A shares of the Fund was below the median contractual advisory fee rate of funds in the expense group. The Board also reviewed the methodology used by Lipper in providing expense group information, which includes using audited financial data from the most recent annual report of each fund in the expense group that was publicly available as of the end of the past calendar year and including only one fund per investment adviser. The Board noted that comparative data is as of varying dates, which may affect the comparability of data during times of market volatility.
The Board noted that Affiliated Sub-Advisers and other Invesco Advisers affiliated investment advisers advise funds with comparable investment strategies in other jurisdictions; however, the Board did not consider comparisons of fees charged to those funds to be apt, as those fees may include more than investment management services.
The Board also considered the fees charged by Invesco Advisers and the Affiliated Sub-Advisers to other client accounts with investment strategies comparable to those of the Fund. The Board noted that Invesco Advisers or the Affiliated Sub-Advisers may charge lower fees to large institutional clients solely for investment management services. Invesco Advisers reviewed with the Board the significantly greater scope of services it provides to the Invesco Funds relative to other client accounts. These additional services include provision of administrative services, officers and office space, oversight of service providers, preparation of annual registration statement updates and financial information and regulatory compliance under the Investment Company Act of 1940, as amended. Invesco Advisers also reviewed generally the higher frequency of shareholder purchases and redemptions in the Invesco Funds relative to the flow of assets for other client accounts. Invesco Advisers advised the Board that advance notice of redemptions is often provided to Invesco Advisers by institutional clients. The Board did note that sub-advisory fees charged by the Affiliated Sub-Advisers to manage the Invesco Funds and to manage other client accounts were often more comparable. The Board concluded that the aggregate services provided to the Invesco Funds were sufficiently different from those provided to institutional clients, and the Board did not place significant weight on these fee comparisons.
The Board noted that Invesco Advisers has contractually agreed to waive fees and/or limit expenses of the Fund through at least June 30,2012 in an amount necessary to limit total annual operating expenses to a specified percentage of average daily net assets for each class of the Fund. The Board noted that at the current expense ratio for the Fund, this expense waiver does not have any impact.
The Board also considered the services provided by the Affiliated Sub-Advisers pursuant to the sub-advisory contracts, as well as the allocation of fees between Invesco Advisers and the Affiliated Sub-Advisers pursuant to the sub-advisory contracts. The Board noted that Invesco Advisers provides services to sub-advised Invesco Funds, including oversight of the Affiliated Sub-Advisers as well as the additional services described above other than day-to-day portfolio management. The Board also noted that the sub-advisory fees have no direct effect on the Fund or its shareholders, as they are paid by Invesco Advisers to the Affiliated Sub-Advisers.
Based upon the information and considerations described above, the Board concluded that the Fund’s advisory and sub-advisory fees are fair and reasonable.
| |
| D. | Economies of Scale and Breakpoints |
The Board considered the extent to which there are economies of scale in the provision of advisory services to the Fund. The Board also considered whether the Fund benefits from economies of scale through contractual breakpoints in the Fund’s advisory fee schedule. The Board also noted that the Fund shares directly in economies of scale through lower fees charged by third party service providers based on the combined size of the Invesco Funds and other clients advised by Invesco Advisers.
| |
| E. | Profitability and Financial Resources |
The Board reviewed information from Invesco Advisers concerning the costs of the advisory and other services that Invesco Advisers and its affiliates provide to the Fund and the profitability of Invesco Advisers and its affiliates in providing these services. The Board reviewed with Invesco Advisers the methodology used to prepare the profitability information. The Board considered the profitability of Invesco Advisers in connection with managing the Fund and the Invesco Funds. The Board noted that Invesco Advisers continues to operate at a net profit from services Invesco Advisers and its subsidiaries provide to the Fund and the Invesco Funds. The Board concluded that the level of profits realized by Invesco Advisers and its affiliates from providing services to the Fund is not excessive given the nature, quality and extent of the services provided to the Invesco Funds. The Board considered whether Invesco Advisers and each Affiliated Sub-Adviser are financially sound and have the resources necessary to perform their obligations under the investment advisory agreement and sub-advisory contracts. The Board concluded that Invesco Advisers and each Affiliated Sub-Adviser have the financial resources necessary to fulfill these obligations.
| |
| F. | Collateral Benefits to Invesco Advisers and its Affiliates |
The Board considered various other benefits received by Invesco Advisers and its affiliates from the relationship with the Fund, including the fees received for their provision of administrative, transfer agency and distribution services to the Fund. The Board considered the performance of Invesco Advisers and its affiliates in providing these services and the organizational structure employed to provide these services. The Board also considered that these services are provided to the Fund pursuant to written contracts that are reviewed and approved on an annual basis by the Board; that the services are required for the operation of the Fund; that Invesco Advisers and its affiliates can provide services, the nature and quality of which are at least equal to those provided by others offering the same or similar services; and that the fees for such services are fair and reasonable in light of the usual and customary charges by others for services of the same nature and quality.
The Board considered the benefits realized by Invesco Advisers and the Affiliated Sub-Advisers as a result of portfolio brokerage transactions executed through “soft dollar” arrangements. The Board noted that soft dollar arrangements shift the payment obligation for research and execution services from Invesco Advisers and the Affiliated Sub-Advisers to the Invesco Funds and therefore may reduce Invesco Advisers’ and the Affiliated Sub-Advisers’ expenses. The Board concluded that the soft dollar arrangements are appropriate. The Board also concluded that, based on their review and representations made by the Chief Compliance Officer of the Invesco Funds, these arrangements are consistent with regulatory requirements.
The Board considered that the Fund’s uninvested cash and cash collateral from any securities lending arrangements may be invested in money market funds advised by Invesco Advisers pursuant to procedures approved by the Board. The Board noted that Invesco Advisers receives advisory fees from these affiliated money market funds attributable to such investments, although Invesco Advisers has contractually agreed to waive through varying periods the advisory fees payable by the Invesco Funds. The waiver is in an amount equal to 100% of the net advisory fee Invesco Advisers receives from the affiliated money market funds with respect to the Fund’s investment in the affiliated money market funds of uninvested cash, but not cash collateral. The Board concluded that the Fund’s investment of uninvested cash and cash collateral from any securities lending arrangements in the affiliated money market funds is in the best interests of the Fund and its shareholders.
25 Invesco Developing Markets Fund
Tax Information
Form 1099-DIV, Form 1042-S and other year-end tax information provide shareholders with actual calendar year amounts that should be included in their tax returns. Shareholders should consult their tax advisors.
The following distribution information is being provided as required by the Internal Revenue Code or to meet a specific state’s requirement.
The Fund designates the following amounts or, if subsequently determined to be different, the maximum amount allowable for its fiscal year ended October 31, 2011:
| | | | | |
Federal and State Income Tax | | |
| |
| Long-Term Capital Gain Dividends | | $ | 2,615,150 | |
| Qualified Dividend Income* | | | 100% | |
| Corporate Dividends Received Deduction* | | | 0% | |
| | |
| | * | The above percentages are based on ordinary income dividends paid to shareholders during the Fund’s fiscal year. |
26 Invesco Developing Markets Fund
Trustees and Officers
The address of each trustee and officer is AIM Investment Funds (Invesco Investment Funds) (the “Trust”), 11 Greenway Plaza, Suite 2500, Houston, Texas 77046-1173. The trustees serve for the life of the Trust, subject to their earlier death, incapacitation, resignation, retirement or removal as more specifically provided in the Trust’s organizational documents. Each officer serves for a one year term or until their successors are elected and qualified. Column two below includes length of time served with predecessor entities, if any.
| | | | | | | | | |
| | | | | | | Number of
| | |
| | | | | | | Funds in
| | |
| | | | | | | Fund Complex
| | |
Name, Year of Birth and
| | Trustee and/
| | Principal Occupation(s)
| | Overseen by
| | Other Directorship(s)
|
| Position(s) Held with the Trust | | or Officer Since | | During Past 5 Years | | Trustee | | Held by Trustee |
| | | | | | | | | |
| | | | | | | | | |
| Interested Persons | | | | | | | | |
| | | | | | | | | |
| | | | | | | | | |
| | | | | | | | | |
Martin L. Flanagan1 — 1960
Trustee | | 2007 | | Executive Director, Chief Executive Officer and President, Invesco Ltd. (ultimate parent of Invesco and a global investment management firm); Advisor to the Board, Invesco Advisers, Inc. (formerly known as Invesco Institutional (N.A.), Inc.); Trustee, The Invesco Funds; Vice Chair, Investment Company Institute; and Member of Executive Board, SMU Cox School of Business
Formerly: Chairman, Invesco Advisers, Inc. (registered investment adviser); Director, Chairman, Chief Executive Officer and President, IVZ Inc. (holding company), INVESCO Group Services, Inc. (service provider) and Invesco North American Holdings, Inc. (holding company); Director, Chief Executive Officer and President, Invesco Holding Company Limited (parent of Invesco and a global investment management firm); Director, Invesco Ltd.; Chairman, Investment Company Institute and President, Co-Chief Executive Officer, Co-President, Chief Operating Officer and Chief Financial Officer, Franklin Resources, Inc. (global investment management organization) | | 141 | | None |
| | | | | | | | | |
| | | | | | | | | |
| | | | | | | | | |
Philip A. Taylor2 — 1954
Trustee, President and
Principal Executive Officer | | 2006 | | Head of North American Retail and Senior Managing Director, Invesco Ltd.; Director, Co-Chairman, Co-President and Co-Chief Executive Officer, Invesco Advisers, Inc. (formerly known as Invesco Institutional (N.A.), Inc.) (registered investment adviser); Director, Chairman, Chief Executive Officer and President, Invesco Management Group, Inc. (formerly Invesco Aim Management Group, Inc.) (financial services holding company); Director and President, INVESCO Funds Group, Inc. (registered investment adviser and registered transfer agent); Director and Chairman, Invesco Investment Services, Inc. (formerly known as Invesco Aim Investment Services, Inc.) (registered transfer agent) and IVZ Distributors, Inc. (formerly known as INVESCO Distributors, Inc.) (registered broker dealer); Director, President and Chairman, Invesco Inc. (holding company) and Invesco Canada Holdings Inc. (holding company); Chief Executive Officer, Invesco Corporate Class Inc. (corporate mutual fund company) and Invesco Canada Fund Inc. (corporate mutual fund company); Director, Chairman and Chief Executive Officer, Invesco Canada Ltd. (formerly known as Invesco Trimark Ltd./Invesco Trimark Ltèe) (registered investment adviser and registered transfer agent); Trustee, President and Principal Executive Officer, The Invesco Funds (other than AIM Treasurer’s Series Trust (Invesco Treasurer’s Series Trust) and Short-Term Investments Trust); Trustee and Executive Vice President, The Invesco Funds (AIM Treasurer’s Series Trust (Invesco Treasurer’s Series Trust) and Short-Term Investments Trust only); Director, Invesco Investment Advisers LLC (formerly known as Van Kampen Asset Management); Director, Chief Executive Officer and President, Van Kampen Exchange Corp.
Formerly: Director and Chairman, Van Kampen Investor Services Inc.: Director, Chief Executive Officer and President, 1371 Preferred Inc. (holding company); and Van Kampen Investments Inc.; Director and President, AIM GP Canada Inc. (general partner for limited partnerships); and Van Kampen Advisors, Inc.; Director and Chief Executive Officer, Invesco Trimark Dealer Inc. (registered broker dealer); Director, Invesco Distributors, Inc. (formerly known as Invesco Aim Distributors, Inc.) (registered broker dealer); Manager, Invesco PowerShares Capital Management LLC; Director, Chief Executive Officer and President, Invesco Advisers, Inc.; Director, Chairman, Chief Executive Officer and President, Invesco Aim Capital Management, Inc.; President, Invesco Trimark Dealer Inc. and Invesco Trimark Ltd./Invesco Trimark Ltèe; Director and President, AIM Trimark Corporate Class Inc. and AIM Trimark Canada Fund Inc.; Senior Managing Director, Invesco Holding Company Limited; Trustee and Executive Vice President, Tax-Free Investments Trust; Director and Chairman, Fund Management Company (former registered broker dealer); President and Principal Executive Officer, The Invesco Funds (AIM Treasurer’s Series Trust (Invesco Treasurer’s Series Trust), Short-Term Investments Trust and Tax-Free Investments Trust only); President, AIM Trimark Global Fund Inc. and AIM Trimark Canada Fund Inc. | | 141 | | None |
| | | | | | | | | |
| | | | | | | | | |
| | | | | | | | | |
Wayne W. Whalen3 — 1939
Trustee | | 2010 | | Of Counsel, and prior to 2010, partner in the law firm of Skadden, Arps, Slate, Meagher & Flom LLP, legal counsel to funds in the Fund Complex | | 159 | | Director of the Abraham Lincoln Presidential Library Foundation |
| | | | | | | | | |
| | | | | | | | | |
| | | | | | | | | |
| Independent Trustees | | | | | | | | |
| | | | | | | | | |
| | | | | | | | | |
| | | | | | | | | |
Bruce L. Crockett — 1944
Trustee and Chair | | 2001 | | Chairman, Crockett Technology Associates (technology consulting company)
Formerly: Director, Captaris (unified messaging provider); Director, President and Chief Executive Officer COMSAT Corporation; and Chairman, Board of Governors of INTELSAT (international communications company) | | 141 | | ACE Limited (insurance company); and Investment Company Institute |
| | | | | | | | | |
| | | | | | | | | |
| | | | | | | | | |
David C. Arch — 1945
Trustee | | 2010 | | Chairman and Chief Executive Officer of Blistex Inc., a consumer health care products manufacturer. | | 159 | | Member of the Heartland Alliance Advisory Board, a nonprofit organization serving human needs based in Chicago. Board member of the Illinois Manufacturers’ Association. Member of the Board of Visitors, Institute for the Humanities, University of Michigan |
| | | | | | | | | |
| |
| 1 | Mr. Flanagan is considered an interested person of the Trust because he is an officer of the adviser to the Trust, and an officer and a director of Invesco Ltd., ultimate parent of the adviser to the Trust. |
| 2 | Mr. Taylor is considered an interested person of the Trust because he is an officer and a director of the adviser to, and a director of the principal underwriter of, the Trust. |
| 3 | Mr. Whalen has been deemed to be an interested person of the Trust because of his prior service as counsel to the predecessor funds of certain Invesco open-end funds and his affiliation with the law firm that served as counsel to such predecessor funds and continues to serve as counsel to the Invesco Van Kampen closed-end funds. |
T-1 Invesco Developing Markets Fund
Trustees and Officers—(continued)
The address of each trustee and officer is AIM Investment Funds (Invesco Investment Funds) (the “Trust”), 11 Greenway Plaza, Suite 2500, Houston, Texas 77046-1173. The trustees serve for the life of the Trust, subject to their earlier death, incapacitation, resignation, retirement or removal as more specifically provided in the Trust’s organizational documents. Each officer serves for a one year term or until their successors are elected and qualified. Column two below includes length of time served with predecessor entities, if any.
| | | | | | | | | |
| | | | | | | Number of
| | |
| | | | | | | Funds in
| | |
| | | | | | | Fund Complex
| | |
Name, Year of Birth and
| | Trustee and/
| | Principal Occupation(s)
| | Overseen by
| | Other Directorship(s)
|
| Position(s) Held with the Trust | | or Officer Since | | During Past 5 Years | | Trustee | | Held by Trustee |
| | | | | | | | | |
| | | | | | | | | |
| Independent Trustees—(continued) | | | | | | | | |
| | | | | | | | | |
| | | | | | | | | |
| | | | | | | | | |
Bob R. Baker — 1936
Trustee | | 2003 | | Retired
Formerly: President and Chief Executive Officer, AMC Cancer Research Center; and Chairman and Chief Executive Officer, First Columbia Financial Corporation | | 141 | | None |
| | | | | | | | | |
| | | | | | | | | |
| | | | | | | | | |
Frank S. Bayley — 1939
Trustee | | 1987 | | Retired
Formerly: Director, Badgley Funds, Inc. (registered investment company) (2 portfolios) and Partner, law firm of Baker & McKenzie | | 141 | | Director and Chairman, C.D. Stimson Company (a real estate investment company) |
| | | | | | | | | |
| | | | | | | | | |
| | | | | | | | | |
James T. Bunch — 1942
Trustee | | 2003 | | Founder, Green, Manning & Bunch Ltd. (investment banking firm)
Formerly: Executive Committee, United States Golf Association; and Director, Policy Studies, Inc. and Van Gilder Insurance Corporation | | 141 | | Vice Chairman, Board of Governors, Western Golf Association/Evans Scholars Foundation and Director, Denver Film Society |
| | | | | | | | | |
| | | | | | | | | |
| | | | | | | | | |
Rodney F. Dammeyer — 1940
Trustee | | 2010 | | President of CAC, LLC, a private company offering capital investment and management advisory services.
Formerly: Prior to January 2004, Director of TeleTech Holdings Inc.; Prior to 2002, Director of Arris Group, Inc.; Prior to 2001, Managing Partner at Equity Group Corporate Investments. Prior to 1995, Vice Chairman of Anixter International. Prior to 1985, experience includes Senior Vice President and Chief Financial Officer of Household International, Inc, Executive Vice President and Chief Financial Officer of Northwest Industries, Inc. and Partner of Arthur Andersen & Co. | | 159 | | Director of Quidel Corporation and Stericycle, Inc. Prior to May 2008, Trustee of The Scripps Research Institute. Prior to February 2008, Director of Ventana Medical Systems, Inc. Prior to April 2007, Director of GATX Corporation. Prior to April 2004, Director of TheraSense, Inc. |
| | | | | | | | | |
| | | | | | | | | |
| | | | | | | | | |
Albert R. Dowden — 1941
Trustee | | 2001 | | Director of a number of public and private business corporations, including the Boss Group, Ltd. (private investment and management); Reich & Tang Funds (5 portfolios) (registered investment company); and Homeowners of America Holding Corporation/ Homeowners of America Insurance Company (property casualty company)
Formerly: Director, Continental Energy Services, LLC (oil and gas pipeline service); Director, CompuDyne Corporation (provider of product and services to the public security market) and Director, Annuity and Life Re (Holdings), Ltd. (reinsurance company); Director, President and Chief Executive Officer, Volvo Group North America, Inc.; Senior Vice President, AB Volvo; Director of various public and private corporations; Chairman, DHJ Media, Inc.; Director Magellan Insurance Company; and Director, The Hertz Corporation, Genmar Corporation (boat manufacturer), National Media Corporation; Advisory Board of Rotary Power International (designer, manufacturer, and seller of rotary power engines); and Chairman, Cortland Trust, Inc. (registered investment company) | | 141 | | Board of Nature’s Sunshine Products, Inc. |
| | | | | | | | | |
| | | | | | | | | |
| | | | | | | | | |
Jack M. Fields — 1952
Trustee | | 2001 | | Chief Executive Officer, Twenty First Century Group, Inc. (government affairs company); and Owner and Chief Executive Officer, Dos Angelos Ranch, L.P. (cattle, hunting, corporate entertainment), Discovery Global Education Fund (non-profit) and Cross Timbers Quail Research Ranch (non-profit)
Formerly: Chief Executive Officer, Texana Timber LP (sustainable forestry company) and member of the U.S. House of Representatives | | 141 | | Administaff |
| | | | | | | | | |
| | | | | | | | | |
| | | | | | | | | |
Carl Frischling — 1937
Trustee | | 2001 | | Partner, law firm of Kramer Levin Naftalis and Frankel LLP | | 141 | | Director, Reich & Tang Funds (6 portfolios) |
| | | | | | | | | |
| | | | | | | | | |
| | | | | | | | | |
Prema Mathai-Davis — 1950
Trustee | | 2001 | | Retired
Formerly: Chief Executive Officer, YWCA of the U.S.A. | | 141 | | None |
| | | | | | | | | |
| | | | | | | | | |
| | | | | | | | | |
Larry Soll — 1942
Trustee | | 2003 | | Retired
Formerly, Chairman, Chief Executive Officer and President, Synergen Corp. (a biotechnology company) | | 141 | | None |
| | | | | | | | | |
| | | | | | | | | |
| | | | | | | | | |
Hugo F. Sonnenschein — 1940
Trustee | | 2010 | | President Emeritus and Honorary Trustee of the University of Chicago and the Adam Smith Distinguished Service Professor in the Department of Economics at the University of Chicago. Prior to July 2000, President of the University of Chicago. | | 159 | | Trustee of the University of Rochester and a member of its investment committee. Member of the National Academy of Sciences, the American Philosophical Society and a fellow of the American Academy of Arts and Sciences |
| | | | | | | | | |
| | | | | | | | | |
| | | | | | | | | |
Raymond Stickel, Jr. — 1944
Trustee | | 2005 | | Retired
Formerly: Director, Mainstay VP Series Funds, Inc. (25 portfolios) and Partner, Deloitte & Touche | | 141 | | Director of Long Cove Club Owners’ Association (home owner’s association) |
| | | | | | | | | |
T-2 Invesco Developing Markets Fund
Trustees and Officers—(continued)
The address of each trustee and officer is AIM Investment Funds (Invesco Investment Funds) (the “Trust”), 11 Greenway Plaza, Suite 2500, Houston, Texas 77046-1173. The trustees serve for the life of the Trust, subject to their earlier death, incapacitation, resignation, retirement or removal as more specifically provided in the Trust’s organizational documents. Each officer serves for a one year term or until their successors are elected and qualified. Column two below includes length of time served with predecessor entities, if any.
| | | | | | | | | |
| | | | | | | Number of
| | |
| | | | | | | Funds in
| | |
| | | | | | | Fund Complex
| | |
Name, Year of Birth and
| | Trustee and/
| | Principal Occupation(s)
| | Overseen by
| | Other Directorship(s)
|
| Position(s) Held with the Trust | | or Officer Since | | During Past 5 Years | | Trustee | | Held by Trustee |
| | | | | | | | | |
| | | | | | | | | |
| Other Officers | | | | | | | | |
| | | | | | | | | |
| | | | | | | | | |
| | | | | | | | | |
Russell C. Burk — 1958
Senior Vice President and Senior Officer | | 2005 | | Senior Vice President and Senior Officer of Invesco Funds | | N/A | | N/A |
| | | | | | | | | |
| | | | | | | | | |
| | | | | | | | | |
John M. Zerr — 1962
Senior Vice President, Chief Legal Officer and Secretary | | 2006 | | Director, Senior Vice President, Secretary and General Counsel, Invesco Management Group, Inc. (formerly known as Invesco Aim Management Group, Inc.) and Van Kampen Exchange Corp.; Senior Vice President, Invesco Advisers, Inc. (formerly known as Invesco Institutional (N.A.), Inc.) (registered investment adviser); Senior Vice President and Secretary, Invesco Distributors, Inc. (formerly known as Invesco Aim Distributors, Inc.); Director, Vice President and Secretary, Invesco Investment Services, Inc. (formerly known as Invesco Aim Investment Services, Inc.) and IVZ Distributors, Inc. (formerly known as INVESCO Distributors, Inc.); Director and Vice President, INVESCO Funds Group, Inc.; Senior Vice President, Chief Legal Officer and Secretary, The Invesco Funds; Manager, Invesco PowerShares Capital Management LLC; Director, Secretary and General Counsel, Invesco Investment Advisers LLC (formerly known as Van Kampen Asset Management); Secretary and General Counsel, Van Kampen Funds Inc. and Chief Legal Officer, PowerShares Exchange-Traded Fund Trust, PowerShares Exchange-Traded Fund Trust II, PowerShares India Exchange-Traded Fund Trust and PowerShares Actively Managed Exchange-Traded Fund Trust
Formerly: Director and Secretary, Van Kampen Advisors Inc.; Director Vice President, Secretary and General Counsel Van Kampen Investor Services Inc.; Director, Invesco Distributors, Inc. (formerly known as Invesco Aim Distributors, Inc.); Director, Senior Vice President, General Counsel and Secretary, Invesco Advisers, Inc.; and Van Kampen Investments Inc.; Director, Vice President and Secretary, Fund Management Company; Director, Senior Vice President, Secretary, General Counsel and Vice President, Invesco Aim Capital Management, Inc.; Chief Operating Officer and General Counsel, Liberty Ridge Capital, Inc. (an investment adviser); Vice President and Secretary, PBHG Funds (an investment company) and PBHG Insurance Series Fund (an investment company); Chief Operating Officer, General Counsel and Secretary, Old Mutual Investment Partners (a broker-dealer); General Counsel and Secretary, Old Mutual Fund Services (an administrator) and Old Mutual Shareholder Services (a shareholder servicing center); Executive Vice President, General Counsel and Secretary, Old Mutual Capital, Inc. (an investment adviser); and Vice President and Secretary, Old Mutual Advisors Funds (an investment company) | | N/A | | N/A |
| | | | | | | | | |
| | | | | | | | | |
| | | | | | | | | |
Lisa O. Brinkley — 1959
Vice President | | 2004 | | Global Compliance Director, Invesco Ltd.; Chief Compliance Officer, Invesco Investment Services, Inc.(formerly known as Invesco Aim Investment Services, Inc.); and Vice President, The Invesco Funds
Formerly: Chief Compliance Officer, Invesco Distributors, Inc. (formerly known as Invesco Aim Distributors, Inc.) and Van Kampen Investor Services Inc.; Senior Vice President, Invesco Management Group, Inc.; Senior Vice President and Chief Compliance Officer, Invesco Advisers, Inc. and The Invesco Funds; Vice President and Chief Compliance Officer, Invesco Aim Capital Management, Inc. and Invesco Distributors, Inc.; Vice President, Invesco Investment Services, Inc. and Fund Management Company | | N/A | | N/A |
| | | | | | | | | |
| | | | | | | | | |
| | | | | | | | | |
Sheri Morris — 1964
Vice President, Treasurer and Principal Financial Officer | | 1999 | | Vice President, Treasurer and Principal Financial Officer, The Invesco Funds; and Vice President, Invesco Advisers, Inc. (formerly known as Invesco Institutional (N.A.), Inc.) (registered investment adviser).
Formerly: Treasurer, PowerShares Exchange-Traded Fund Trust, PowerShares Exchange--Traded Fund Trust II, PowerShares India Exchange-Traded Fund Trust and PowerShares Actively Managed Exchange-Traded Fund Trust; Vice President, Invesco Advisers, Inc., Invesco Aim Capital Management, Inc. and Invesco Aim Private Asset Management, Inc.; Assistant Vice President and Assistant Treasurer, The Invesco Funds and Assistant Vice President, Invesco Advisers, Inc., Invesco Aim Capital Management, Inc. and Invesco Aim Private Asset Management, Inc. | | N/A | | N/A |
| | | | | | | | | |
| | | | | | | | | |
| | | | | | | | | |
Karen Dunn Kelley — 1960
Vice President | | 2004 | | Head of Invesco’s World Wide Fixed Income and Cash Management Group; Senior Vice President, Invesco Advisers, Inc. (formerly known as Invesco Institutional (N.A.), Inc.) (registered investment adviser); Executive Vice President, Invesco Distributors, Inc. (formerly known as Invesco Aim Distributors, Inc.); Senior Vice President, Invesco Management Group, Inc. (formerly known as Invesco Aim Management Group, Inc.); and Director, Invesco Mortgage Capital Inc.; Vice President, The Invesco Funds (other than AIM Treasurer’s Series Trust (Invesco Treasurer’s Series Trust) and Short-Term Investments Trust); President and Principal Executive Officer, The Invesco Funds (AIM Treasurer’s Series Trust (Invesco Treasurer’s Series Trust) and Short-Term Investments Trust only).
Formerly: Senior Vice President, Van Kampen Investments Inc.; Vice President, Invesco Advisers, Inc. (formerly known as Invesco Institutional (N.A.), Inc.); Director of Cash Management and Senior Vice President, Invesco Advisers, Inc. and Invesco Aim Capital Management, Inc.; President and Principal Executive Officer, Tax-Free Investments Trust; Director and President, Fund Management Company; Chief Cash Management Officer, Director of Cash Management, Senior Vice President, and Managing Director, Invesco Aim Capital Management, Inc.; Director of Cash Management, Senior Vice President, and Vice President, Invesco Advisers, Inc. and The Invesco Funds (AIM Treasurer’s Series Trust (Invesco Treasurer’s Series Trust), Short-Term Investments Trust and Tax-Free Investments Trust only) | | N/A | | N/A |
| | | | | | | | | |
T-3 Invesco Developing Markets Fund
Trustees and Officers—(continued)
The address of each trustee and officer is AIM Investment Funds (Invesco Investment Funds) (the “Trust”), 11 Greenway Plaza, Suite 2500, Houston, Texas 77046-1173. The trustees serve for the life of the Trust, subject to their earlier death, incapacitation, resignation, retirement or removal as more specifically provided in the Trust’s organizational documents. Each officer serves for a one year term or until their successors are elected and qualified. Column two below includes length of time served with predecessor entities, if any.
| | | | | | | | | |
| | | | | | | Number of
| | |
| | | | | | | Funds in
| | |
| | | | | | | Fund Complex
| | |
Name, Year of Birth and
| | Trustee and/
| | Principal Occupation(s)
| | Overseen by
| | Other Directorship(s)
|
| Position(s) Held with the Trust | | or Officer Since | | During Past 5 Years | | Trustee | | Held by Trustee |
| | | | | | | | | |
| | | | | | | | | |
| Other Officers—(continued) | | | | | | | | |
| | | | | | | | | |
| | | | | | | | | |
| | | | | | | | | |
Lance A. Rejsek — 1967
Anti-Money Laundering Compliance Officer | | 2005 | | Anti-Money Laundering Compliance Officer, Invesco Advisers, Inc. (formerly known as Invesco Institutional (N.A.), Inc.) (registered investment adviser); Invesco Distributors, Inc. (formerly known as Invesco Aim Distributors, Inc.), Invesco Investment Services, Inc. (formerly known as Invesco Aim Investment Services, Inc.), The Invesco Funds, PowerShares Exchange-Traded Fund Trust, PowerShares Exchange-Traded Fund Trust II, PowerShares India Exchange-Traded Fund Trust, PowerShares Actively Managed Exchange-Traded Fund Trust, Invesco Investment Advisers LLC (formerly known as Van Kampen Asset Management) and Van Kampen Funds Inc.
Formerly: Anti-Money Laundering Compliance Officer, Van Kampen Investor Services Inc., Fund Management Company, Invesco Advisers, Inc., Invesco Aim Capital Management, Inc. and Invesco Aim Private Asset Management, Inc. | | N/A | | N/A |
| | | | | | | | | |
| | | | | | | | | |
| | | | | | | | | |
Todd L. Spillane — 1958
Chief Compliance Officer | | 2006 | | Senior Vice President, Invesco Management Group, Inc. (formerly known as Invesco Aim Management Group, Inc.) and Van Kampen Exchange Corp.; Senior Vice President and Chief Compliance Officer, Invesco Advisers, Inc. (registered investment adviser) (formerly known as Invesco Institutional (N.A.), Inc.); Chief Compliance Officer, The Invesco Funds, PowerShares Exchange-Traded Fund Trust, PowerShares Exchange-Traded Fund Trust II, PowerShares India Exchange-Traded Fund Trust, PowerShares Actively Managed Exchange-Traded Fund Trust, INVESCO Private Capital Investments, Inc. (holding company) and Invesco Private Capital, Inc. (registered investment adviser); Vice President, Invesco Distributors, Inc. (formerly known as Invesco Aim Distributors, Inc.) and Invesco Investment Services, Inc. (formerly known as Invesco Aim Investment Services, Inc.).
Formerly: Chief Compliance Officer, Invesco Van Kampen Closed-End Funds; Senior Vice President, Van Kampen Investments Inc.; Senior Vice President and Chief Compliance Officer, Invesco Advisers, Inc. and Invesco Aim Capital Management, Inc.; Chief Compliance Officer, Invesco Global Asset Management (N.A.), Inc., Invesco Senior Secured Management, Inc. (registered investment adviser) and Van Kampen Investor Services Inc.; Vice President, Invesco Aim Capital Management, Inc. and Fund Management Company | | N/A | | N/A |
| | | | | | | | | |
The Statement of Additional Information of the Trust includes additional information about the Fund’s Trustees and is available upon request, without charge, by calling 1.800.959.4246. Please refer to the Fund’s prospectus for information on the Fund’s sub-advisers.
| | | | | | | |
Office of the Fund
11 Greenway Plaza, Suite 2500
Houston, TX 77046-1173 | | Investment Adviser
Invesco Advisers, Inc.
1555 Peachtree Street, N.E.
Atlanta, GA 30309 | | Distributor
Invesco Distributors, Inc.
11 Greenway Plaza, Suite 2500
Houston, TX 77046-1173 | | Auditors
PricewaterhouseCoopers LLP
1201 Louisiana Street, Suite 2900
Houston, TX 77002-5678 |
| | | | | | | |
| | | | | | | |
Counsel to the Fund
Stradley Ronon Stevens & Young, LLP
2600 One Commerce Square
Philadelphia, PA 19103 | | Counsel to the Independent Trustees
Kramer, Levin, Naftalis & Frankel LLP
1177 Avenue of the Americas
New York, NY 10036-2714 | | Transfer Agent
Invesco Investment Services, Inc.
11 Greenway Plaza, Suite 2500
Houston, TX 77046-1173 | | Custodian
State Street Bank and Trust Company
225 Franklin
Boston, MA 02110-2801 |
T-4 Invesco Developing Markets Fund
Invesco mailing information
Send general correspondence to Invesco Investment Services, Inc., P.O. Box 219078, Kansas City, MO 64121-9078.
Invesco privacy policy
You share personal and financial information with us that is necessary for your transactions and your account records. We take very seriously the obligation to keep that information confidential and private.
Invesco collects nonpublic personal information about you from account applications or other forms you complete and from your transactions with us or our affiliates. We do not disclose information about you or our former customers to service providers or other third parties except to the extent necessary to service your account and in other limited circumstances as permitted by law. For example, we use this information to facilitate the delivery of transaction confirmations, financial reports, prospectuses and tax forms.
Even within Invesco, only people involved in the servicing of your accounts and compliance monitoring have access to your information. To ensure the highest level of confidentiality and security, Invesco maintains physical, electronic and procedural safeguards that meet or exceed federal standards. Special measures, such as data encryption and authentication, apply to your communications with us on our website. More detail is available to you at invesco.com/privacy.
Important notice regarding delivery of security holder documents
To reduce Fund expenses, only one copy of most shareholder documents may be mailed to shareholders with multiple accounts at the same address (Householding). Mailing of your shareholder documents may be householded indefinitely unless you instruct us otherwise. If you do not want the mailing of these documents to be combined with those for other members of your household, please contact Invesco Investment Services, Inc. at 800 959 4246 or contact your financial institution. We will begin sending you individual copies for each account within 30 days after receiving your request.
Fund holdings and proxy voting information
The Fund provides a complete list of its holdings four times in each fiscal year, at the quarter-ends. For the second and fourth quarters, the lists appear in the Fund’s semiannual and annual reports to shareholders. For the first and third quarters, the Fund files the lists with the Securities and Exchange Commission (SEC) on Form N-Q. The most recent list of portfolio holdings is available at invesco.com/completeqtrholdings. Shareholders can also look up the Fund’s Forms N-Q on the SEC website at sec.gov. Copies of the Fund’s Forms N-Q may be reviewed and copied at the SEC Public Reference Room in Washington, D.C. You can obtain information on the operation of the Public Reference Room, including information about duplicating fee charges, by calling 202 551 8090 or 800 732 0330, or by electronic request at the following email address: publicinfo@sec.gov. The SEC file numbers for the Fund are 811-05426 and 033-19338.
A description of the policies and procedures that the Fund uses to determine how to vote proxies relating to portfolio securities is available without charge, upon request, from our Client Services department at 800 959 4246 or at invesco.com/proxyguidelines. The information is also available on the SEC website, sec.gov.
Information regarding how the Fund voted proxies related to its portfolio securities during the 12 months ended June 30, 2011, is available at invesco.com/proxysearch. The information is also available on the SEC website, sec.gov.
Invesco Advisers, Inc. is an investment adviser; it provides investment advisory services to individual and institutional clients and does not sell securities. Invesco Distributors, Inc. is the U.S. distributor for Invesco Ltd.’s retail mutual funds, exchange-traded funds and institutional money market funds. Both are wholly owned, indirect subsidiaries of Invesco Ltd.
| | | | |
| | | | | |
| | | | | |
| | | DVM-AR-1 | | Invesco Distributors, Inc. |
| | |
| Annual Report to Shareholders | | October 31, 2011 |
Invesco Emerging Markets Equity FundNasdaq:
A: IEMAX § C: IEMCX § R: IEMRX § Y: IEMYX § Institutional: IEMIX
| | | |
| |
| 2 | | Letters to Shareholders |
| 4 | | Performance Summary |
| 4 | | Management Discussion |
| 6 | | Long-Term Fund Performance |
| 8 | | Supplemental Information |
| 9 | | Schedule of Investments |
| 11 | | Financial Statements |
| 13 | | Notes to Financial Statements |
| 19 | | Financial Highlights |
| 20 | | Auditor’s Report |
| 21 | | Fund Expenses |
| 22 | | Approval of Investment Advisory and Sub-Advisory Agreements |
| T-1 | | Trustees and Officers |
Letters to Shareholders

Philip Taylor
Dear Shareholders:
Enclosed is important information about your Fund and its performance. I encourage you to read this report to learn more about your Fund’s short- and long-term performance and its holdings as of the close of the reporting period. This report also includes useful information about your Fund’s management team and a discussion of how your Fund was managed during the reporting period.
Investors are likely to confront both opportunities and challenges in 2012 — just as we did in 2011. After all, changes in market sentiment never do investors the courtesy of announcing their impending arrival, and your goals and needs may have changed, requiring changes in your financial strategy.
That’s why the start of a new year is always a good time to catch up with your financial adviser. He or she can explain how your investments performed in the year just ended — how each performed individually, and more important, how they performed as a diversified portfolio. Of course, it’s important to remember that an investment’s long-term performance is more important than its short-term performance. Looking ahead to the new year and evaluating your individual situation, your financial adviser can provide valuable insight into whether your investments are still appropriate for your individual needs, goals and risk tolerance.
For current information about your Fund
In addition to meeting with your financial adviser to discuss your individual situation at the start of the new year, you also may find it helpful to stay abreast of market trends and developments. Doing so may provide reassurance in times of economic uncertainty and market volatility such as we saw in 2011 — and are likely to see again in 2012.
Invesco can help you stay informed about your investments and market trends. On our website, invesco.com/us, we provide timely market updates and commentary from many of our fund managers and other investment professionals. Also on our website, you can obtain information about your account at any hour of the day or night. I invite you to visit and explore the tools and information we offer at invesco.com/us.
Our commitment to investment excellence
As we’ve seen over the last several years, market conditions can change — often suddenly and dramatically. That’s one reason financial advisers typically advise their clients to be well diversified and to maintain a long-term investment focus. While diversification can’t guarantee a profit or protect against loss, it may cushion the impact of dramatic market moves. Maintaining a long-term investment focus for your long-term goals — financing your retirement or your children’s education, for example — may help you avoid making rash investment decisions based on short-term market swings.
Likewise, Invesco’s investment professionals maintain a long-term focus. Across our broad array of investment products, investment excellence is our ultimate goal. Each of our funds is managed by specialized teams of investment professionals, and as a company, we maintain a single focus — investment management — that allows our fund managers to concentrate on doing what they do best: managing your money.
Our funds are managed strictly according to their stated investment objectives and strategies, with robust risk oversight using consistent, repeatable investment processes that don’t change in response to short-term market events. This disciplined approach can’t guarantee a profit; no investment can do that, since all involve some measure of risk. But it can ensure that your money is managed the way we said it would be — according to your Fund’s objective and strategies.
Our adherence to stated investment objectives and strategies allows your financial adviser to build a diversified portfolio that meets your individual risk tolerance and financial goals. It also means that when your goals change, your financial adviser will be able to find an Invesco fund that’s appropriate for your needs.
Questions?
If you have questions about your account, please contact one of our client service representatives at 800 959 4246. If you have a general Invesco-related question or comment for me, I invite you to email me directly at phil@invesco.com.
All of us at Invesco look forward to serving your investment management needs for many years to come. Thank you for investing with us.
Sincerely,
Philip Taylor
Senior Managing Director, Invesco Ltd.
| | | |
| |
2 | | Invesco Emerging Markets Equity Fund |

Bruce Crockett
Dear Fellow Shareholders:
Although the world’s economies are gradually recovering from the financial crisis, it has not been a smooth path. Unrest in the Middle East, persistently weak job and housing markets in the U.S. and continued government balance sheet repair in Europe are contributing to a slow, labored march toward global recovery.
In this environment, investors face risks that could make it more difficult to achieve their long-term financial goals — a secure retirement, home ownership, a child’s college education. Although the markets are complex and dynamic, there are ways to simplify the process and potentially increase your odds of achieving your goals. The best approach is to create a solid financial plan that helps you save and invest in ways that anticipate your needs over the long term.
Your financial adviser can help you define your financial plan, develop an appropriate investment strategy and put you in a better position to achieve your financial goals over the long term. This can take some of the guesswork out of the process and help you make thoughtful investments. Your financial adviser also can help you better understand your tolerance for risk, so that your investment approach lets you sleep at night while getting you closer to your goals. Lastly, your financial adviser can develop an asset allocation strategy that seeks to balance your investment approach, providing some protection against a decline in the markets while allowing you to participate in rising markets. Invesco calls this type of approach “intentional investing.” It means thinking carefully, planning thoughtfully and acting deliberately.
While no investment can guarantee favorable returns, your Board remains committed to managing costs and enhancing the performance of Invesco’s funds as part of our Investor First orientation. We continue to oversee the funds with the same strong sense of responsibility for your money and your continued trust that we’ve always maintained.
Thanks to the approval of our fund shareholders, Invesco has made great progress in realigning our U.S. mutual fund product line following our acquisition of Morgan Stanley’s retail asset management business, including Van Kampen Investments. When completed, the realignment will reduce overlap in the product lineup, enhance efficiency across our product line and build a solid foundation for further growth to meet client and shareholder needs. I would like to thank those of you who voted your proxy, and I hope our shareholders haven’t been too inconvenienced by the process.
As always, please contact me at bruce@brucecrockett.com with any questions or concerns you may have. On behalf of your Board, we look forward to continuing to represent your interests and serving your needs.
Sincerely,
Bruce L. Crockett
Independent Chair
Invesco Funds Board of Trustees
| | | |
| |
|
3 | | Invesco Emerging Markets Equity Fund |
Management’s Discussion of Fund Performance
Performance summary
For the five months ended October 31, 2011, Invesco Emerging Market Equity Fund, at net asset value, underperformed its broad market, style-specific and peer group indexes. The Fund’s inception date was May 31, 2011, and the information in this report covers the period from the Fund’s inception through October 31, 2011.
Stock selection in the consumer staples and utilities sectors contributed to performance, while holdings in the information technology, materials, financials and industrials sectors detracted from performance during the period.
Additional information about your Fund’s performance appears later in this report.
Fund vs. Indexes
Cumulative total returns, 5/31/11 to 10/31/11, at net asset value (NAV). Performance shown does not include applicable contingent deferred sales charges (CDSC) or front-end sales charges, which would have reduced performance.
| | | | | |
|
| Class A Shares | | | -19.30 | % |
| |
| Class C Shares | | | -19.60 | |
| |
| Class R Shares | | | -19.40 | |
| |
| Class Y Shares | | | -19.30 | |
| |
| Institutional Class Shares | | | -19.30 | |
| |
MSCI EAFE Index▼ (Broad Market Index) | | | -12.31 | |
| |
MSCI Emerging Markets Index▼ (Style-Specific Index) | | | -13.65 | |
| |
Lipper Emerging Market Funds Index▼ (Peer Group Index) | | | -14.27 | |
Source(s): ▼Lipper Inc.
How we invest
The Fund invests primarily in stocks of mid- and large-cap emerging market companies with records of stable earnings and strong balance sheets. Our investment process includes a valuation assessment, fundamental research and team-based portfolio decisions. We address risk at the security level by emphasizing balance sheet strength and earnings stability of individual holdings. At the portfolio level, we seek to achieve appropriate diversification relative to the MSCI Emerging Markets Index. We are committed to a long-term investment horizon resulting in low rates of portfolio turnover. Our risk management efforts seek to ensure that the largest single component of active risk is security specific, which is consistent with stock selection being the sole targeted area of excess return.
We strive to maintain a consistent investment discipline through varying market conditions and an appropriate level of portfolio diversification. Individual holdings, however, are selected based on their own merits, not on projections of country or sector performance.
Our sell discipline is a replication of the security selection process in that we look to trim or liquidate positions in the portfolio based on valuation, fundamentals or portfolio design considerations.
Market conditions and your Fund
Global equity markets faced headwinds in 2011. Notably, several southern European countries, including Greece, Spain, Portugal and Italy, faced solvency concerns amid massive fiscal deficits. Although the U.S. economy continued to grow in 2011, investors remained concerned about high unemployment and a weak housing market.
The reporting period ended with a market upswing as European leaders took steps to address the Greek sovereign debt issue, expand the bailout fund and stabilize the banking system. At about the same time, economic data seemed to suggest that the U.S. was unlikely to fall into a much-feared double-dip recession, and corporate earnings remained relatively strong.
Throughout the reporting period, investors grew risk-averse on news of potential defaults in Europe and slowing growth and accounting concerns in China. This led to a relatively widespread correction in almost all emerging markets toward the end of the reporting period.
Concerns about potential overheating in emerging market economies, coupled with concerns of a potential double-dip recession in developed economies, combined to foster widespread uncertainty about the pace and vigor of a global economic recovery.
The Fund stayed true to its process by emphasizing its quality orientation in stock selection in several sectors. Our stock selection in the consumer staples and utilities sectors made the largest contribution to the Fund’s relative results. Among our consumer staples holdings, South Africa-based Tiger Brands, a consumer packaged foods company, was a top contributor.
Detracting from the Fund’s relative performance was stock selection in the industrials, information technology (IT), financials, materials and consumer discretionary sectors. In the consumer discretionary sector, Mexican homebuilder Desarrolladora Homex detracted from the Fund’s performance. We sold our position in Desarrolladora Homex before the close of the fiscal year. Additionally, the Fund’s holdings in cell phone maker HTC, which is based in Taiwan, negatively affected performance. On an absolute basis, the Fund’s holdings in the consumer
Portfolio Composition
By sector
| | | | | |
|
| Financials | | | 20.8 | % |
| |
| Energy | | | 16.1 | |
| |
| Consumer Discretionary | | | 11.9 | |
| |
| Information Technology | | | 11.4 | |
| |
| Materials | | | 10.9 | |
| |
| Telecommunication Services | | | 9.7 | |
| |
| Investment Companies — Exchange Traded Funds | | | 5.6 | |
| |
| Consumer Staples | | | 4.6 | |
| |
| Utilities | | | 2.4 | |
| |
| Industrials | | | 2.2 | |
| |
Money Market Funds Plus Other Assets Less Liabilities | | | 4.4 | |
Top 10 Equity Holdings*
| | | | | | | | | |
|
| | 1. | | | Samsung Electronics, Ltd. | | | 4.8 | % |
| |
| | 2. | | | Hyundai Mobis | | | 4.4 | |
| |
| | 3. | | | China Mobile Ltd. | | | 3.6 | |
| |
| | 4. | | | China Minsheng Banking Corp., Ltd. -Class H | | | 3.3 | |
| |
| | 5. | | | Petroleo Brasileiro S.A.-ADR | | | 3.3 | |
| |
| | 6. | | | Steinhoff International Holdings Ltd. | | | 2.7 | |
| |
| | 7. | | | PDG Realty S.A. Empreendimentos e Participacoes | | | 2.7 | |
| |
| | 8. | | | POSCO | | | 2.7 | |
| |
| | 9. | | | AmericaMovil S.A.B. de C.V.-Series L | | | 2.7 | |
| |
| | 10. | | | Vale S.A.-ADR | | | 2.6 | |
| | | | | |
|
| Total Net Assets | | $12.0 million |
| |
| Total Number of Holdings* | | | 44 |
The Fund’s holdings are subject to change, and there is no assurance that the Fund will continue to hold any particular security.
*Excluding money market fund holdings.
| | | |
|
4 | | Invesco Emerging Markets Equity Fund |
staples sector posted positive returns for the reporting period.
While the IT sector as a whole detracted from Fund performance, several of the Fund’s IT holdings contributed positively. Indeed, one IT company — South Korean consumer electronics company Samsung Electronics — was a top contributor to Fund performance for the reporting period.
From a geographic perspective, the Fund’s Asia/Pacific-region holdings, excluding China, detracted most significantly from performance during the reporting period. Specifically, stock selection in Hong Kong, South Korea and Taiwan negatively affected Fund performance. In addition, stock selection in India, Brazil and Russia detracted from Fund performance. Conversely, stock selection in China helped Fund performance versus the benchmark. The Fund also benefited from an overweight position in the United Arab Emirates.
At the close of the reporting period, and relative to the MSCI Emerging Markets Index, the Fund was overweight in the consumer discretionary and telecommunication services sectors. The Fund was underweight in the consumer staples, financials, industrials and materials sectors. At the close of the reporting period, the Fund maintained an overweight position in South Korea, Thailand and South Africa but was underweight in Brazil, Hong Kong and India. The Fund had an equal weight in China. Fund holdings are determined based on the merits of individual securities, not on a country or sector basis.
The ongoing likelihood of defaults in sovereign debt and decelerating economic growth across both developed and emerging markets have sparked fears of another recession for much of the world. While these macroeconomic risks are very real, corporate balance sheets were generally healthy and market valuations were attractive from an historical context at the close of the reporting period
Thank you for your investment in Invesco Emerging Markets Equity Fund.
The views and opinions expressed in management’s discussion of Fund performance are those of Invesco Advisers, Inc. These views and opinions are subject to change at any time based on factors such as market and economic conditions. These views and opinions may not be relied upon as investment advice or recommendations, or as an offer for a particular security. The information is not a complete analysis of every aspect of any market, country, industry, security or the Fund. Statements of fact are from sources considered reliable, but Invesco Advisers, Inc. makes no representation or warranty as to their completeness or accuracy. Although historical performance is no guarantee of future results, these insights may help you understand our investment management philosophy.
See important Fund and, if applicable, index disclosures later in this report.
Ingrid Baker
Chartered Financial Analyst, portfolio manager, is manager of Invesco Emerging Markets Equity Fund. She joined Invesco in 1999. Ms. Baker earned a B.A. in international politics from Oberlin College and an M.B.A. in finance from the University of Navarra.
Jason Kindland
Chartered Financial Analyst, portfolio manager, is manager of Invesco Emerging Markets Equity Fund. He joined Invesco in 1997. He earned a bachelor of mechanical engineering degree from the Georgia Institute of Technology and an M.B.A. from Emory University.
Michelle Middleton
Chartered Financial Analyst, portfolio manager, is manager of Invesco Emerging Markets Equity Fund. She joined Invesco in 2000. She earned a B.B.A. in finance and an M.S. in finance from Georgia State University.
Matthew Miller
Chartered Financial Analyst, portfolio manager, is manager of Invesco Emerging Markets Equity Fund. He joined Invesco in 2000. Mr. Miller earned a B.A. in physics from Emory University.
Anuja Singha
Chartered Financial Analyst, portfolio manager, is manager of Invesco Emerging Markets Equity Fund. She joined Invesco in 1998. She earned a B.A. in economics from Mills College and a Ph.D. in economics from Emory University.
| | | |
|
5 | | Invesco Emerging Markets Equity Fund |
Your Fund’s Long-Term Performance
Results of a $10,000 Investment – Oldest Share Classes since Inception
Fund and index data from 5/31/11
Past performance cannot guarantee comparable future results.
The data shown in the chart include reinvested distributions, applicable sales charges and Fund expenses including
management fees. Index results include reinvested dividends, but they do not reflect sales charges. Performance of the peer group, if applicable, reflects fund expenses and management fees;
performance of a market index does not. Performance shown in the chart and table(s) does not reflect deduction of taxes a shareholder would pay on Fund distributions or sale of Fund shares.
| | | |
|
6 | | Invesco Emerging Markets Equity Fund |
Cumultative Total ReturnsAs of 10/31/11, including maximum applicable
sales charges
| | | | | |
|
Class A Shares | | | | |
| |
| Inception (5/31/11) | | | -23.72 | % |
| |
Class C Shares | | | | |
| |
| Inception (5/31/11) | | | -20.40 | % |
| |
Class R Shares | | | | |
| |
| Inception (5/31/11) | | | -19.40 | % |
| |
Class Y Shares | | | | |
| |
| Inception (5/31/11) | | | -19.30 | % |
| |
Institutional Class Shares | | | | |
| |
| Inception (5/31/11) | | | -19.30 | % |
The performance data quoted represent past performance and cannot guarantee comparable future results; current performance may be lower or higher. Please visit invesco.com/performance for the most recent month-end performance. Performance figures reflect reinvested distributions, changes in net asset value and the effect of the maximum sales charge unless otherwise stated. Investment return and principal value will fluctuate so that you may have a gain or loss when you sell shares.
The net annual Fund operating expense ratio set forth in the most recent Fund prospectus as of the date of this report for Class A, Class C, Class R, Class Y and Institutional Class shares was 1.85%, 2.60%, 2.10%, 1.60% and 1.60%, respectively.1 The total annual Fund operating expense ratio set forth in the most recent Fund prospectus as of the date of this report for Class A, Class C, Class R, Class Y and Institutional Class shares was 2.67%, 3.42%, 2.92%, 2.42% and 2.30%, respectively. The expense ratios presented above may vary from the expense ratios presented in other sections of this report that are based on expenses incurred during the period covered by this report.
Class A share performance reflects the maximum 5.50% sales charge, and Class C share performance reflects the applicable contingent deferred sales charge (CDSC) for the period involved. The CDSC on Class C shares is 1% for the first year after purchase. Class R, Class Y and Institutional Class shares do not have a front-end sales charge or a CDSC; therefore, performance is at net asset value.
Cumulative Total ReturnsAs of 9/30/11, the most recent calendar quarter-end, including maximum applicable sales charges
| | | | | |
|
Class A Shares | | | | |
| |
| Inception (5/31/11) | | | -32.42 | % |
| |
Class C Shares | | | | |
| |
| Inception (5/31/11) | | | -29.31 | % |
| |
Class R Shares | | | | |
| |
| Inception (5/31/11) | | | -28.50 | % |
| |
Class Y Shares | | | | |
| |
| Inception (5/31/11) | | | -28.40 | % |
| |
Institutional Class Shares | | | | |
| |
| Inception (5/31/11) | | | -28.40 | % |
The performance of the Fund’s share classes will differ primarily due to different sales charge structures and class expenses.
Had the adviser not waived fees and/or expenses, performance would have been lower.
A redemption fee of 2% is imposed on certain redemptions or exchanges out of the Fund within 31 days of purchase. Exceptions to the redemption fee are listed in the Fund’s prospectus. Effective January 1, 2012, after the close of the reporting period, the Fund will eliminate the redemption fee, if applicable, assessed on shares of the Fund redeemed or exchanged within 31 days of purchase.
| | |
| 1 | | Total annual Fund operating expenses after any contractual fee waivers and/or expense reimbursements by the adviser in effect through at least June 30, 2012. See current prospectus for more information. |
| | | |
|
7 | | Invesco Emerging Markets Equity Fund |
Invesco Emerging Markets Equity Fund’s investment objective is long-term growth of capital.
| n | | Unless otherwise stated, information presented in this report is as of October 31, 2011, and is based on total net assets. |
| |
| n | | Unless otherwise noted, all data provided by Invesco. |
| |
| n | | To access your Fund’s reports/prospectus, visit invesco.com/fundreports. |
About share classes
| n | | Class R shares are available only to certain retirement plans. Please see the prospectus for more information. |
| |
| n | | Class Y shares are available to only certain investors. Please see the prospectus for more information. |
| |
| n | | Institutional Class shares are offered exclusively to institutional investors, including defined contribution plans that meet certain criteria. Please see the prospectus for more information. |
Principal risks of investing in the Fund
| n | | Depositary receipts risk. Depositary receipts involve many of the same risks as those associated with direct investment in foreign securities. In addition, the underlying issuers of certain depositary receipts, particularly unsponsored or unregistered depositary receipts, are under no obligation to distribute shareholder communications to the holders of such receipts or to pass through to them any voting rights with respect to the deposited securities. |
| |
| n | | Developing markets securities risk. Securities issued by foreign companies and governments located in developing countries may be affected more negatively by inflation, devaluation of their currencies, higher transaction costs, delays in settlement, adverse political developments, the introduction of capital controls, withholding taxes, nationalization of private assets, expropriation, social unrest, war or lack of timely information than those in developed countries. |
| n | | Foreign securities risk. The Fund’s foreign investments may be affected by changes in a foreign country’s exchange rates; political and social instability; changes in economic or taxation policies; difficulties when enforcing obligations; decreased liquidity; and increased volatility. Foreign companies may be subject to less regulation resulting in less publicly available information about the companies. |
| n | | Management risk. The investment techniques and risk analysis used by the Fund’s portfolio managers may not produce the desired results. |
| |
| n | | Market risk. The prices of and the income generated by the Fund’s securities may decline in response to, among other things, investor sentiment; general economic and market conditions; regional or global instability; and currency and interest rate fluctuations. |
About indexes used in this report
| n | | The MSCI EAFE Index® is an unmanaged index considered representative of stocks of Europe, Australasia and the Far East. |
| |
| n | | The MSCI Emerging Markets IndexSM is an unmanaged index considered representative of stocks of developing countries. |
| |
| n | | The Lipper Emerging Market Funds Index is an unmanaged index considered representative of emerging market funds tracked by Lipper. |
| |
| n | | The Fund is not managed to track the performance of any particular index, including the index(es) defined here, and consequently, the performance of the Fund may deviate significantly from the performance of the index(es). |
| |
| n | | A direct investment cannot be made in an index. Unless otherwise indicated, index results include reinvested dividends, and they do not reflect sales charges. Performance of the peer group, if applicable, reflects fund expenses; performance of a market index does not. |
Other information
| n | | The Chartered Financial Analyst® (CFA®) designation is globally recognized and attests to a charterholder’s success in a rigorous and comprehensive study program in the field of investment management and research analysis. |
| |
| n | | The returns shown in management’s discussion of Fund performance are based on net asset values calculated |
| | | for shareholder transactions. Generally accepted accounting principles require adjustments to be made to the net assets of the Fund at period end for financial reporting purposes, and as such, the net asset values for shareholder transactions and the returns based on those net asset values may differ from the net asset values and returns reported in the Financial Highlights. |
| |
| | | Industry classifications used in this report are generally according to the Global Industry Classification Standard, which was developed by and is the exclusive property and a service mark of MSCI Inc. and Standard & Poor’s. |
This report must be accompanied or preceded by a currently effective Fund prospectus, which contains more complete information, including sales charges and expenses. Investors should read it carefully before investing.
NOT FDIC INSURED | MAY LOSE VALUE | NO BANK GUARANTEE
Fund Nasdaq Symbols
| | | | | |
|
| Class A Shares | | IEMAX |
| Class C Shares | | IEMCX |
| Class R Shares | | IEMRX |
| Class Y Shares | | IEMYX |
| Institutional Class Shares | | IEMIX |
| | | |
|
8 | | Invesco Emerging Markets Equity Fund |
Schedule of Investments
October 31, 2011
| | | | | | | | | |
| | | Shares | | Value |
| |
Common Stocks & Other Equity Interests–90.05%
|
Brazil–13.36%
| | | | |
Banco Santander Brasil S.A.(a) | | | 31,700 | | | $ | 286,384 | |
| |
| Companhia Energetica de Minas Gerais–ADR | | | 16,830 | | | | 286,783 | |
| |
| PDG Realty S.A. Empreendimentos e Participacoes | | | 74,200 | | | | 327,817 | |
| |
| Petroleo Brasileiro S.A.–ADR | | | 14,534 | | | | 392,563 | |
| |
| Vale S.A.–ADR | | | 12,326 | | | | 313,204 | |
| |
| | | | | | | | 1,606,751 | |
| |
China–11.74%
| | | | |
| China Construction Bank Corp.–Class H | | | 256,000 | | | | 186,082 | |
| |
| China Dongxiang Group Co. | | | 671,000 | | | | 117,975 | |
| |
| China Minsheng Banking Corp., Ltd.–Class H | | | 497,500 | | | | 399,092 | |
| |
| CNOOC Ltd. | | | 165,000 | | | | 311,863 | |
| |
| KWG Property Holding Ltd. | | | 258,000 | | | | 110,039 | |
| |
| Renhe Commercial Holdings Co., Ltd. | | | 2,082,000 | | | | 286,157 | |
| |
| | | | | | | | 1,411,208 | |
| |
Hong Kong–3.64%
| | | | |
| China Mobile Ltd. | | | 46,000 | | | | 438,364 | |
| |
Indonesia–1.21%
| | | | |
| Telekomunikasi Indonesia Tbk PT | | | 175,500 | | | | 145,692 | |
| |
Mexico–2.66%
| | | | |
| America Movil S.A.B. de C.V.–Series L | | | 251,500 | | | | 319,486 | |
| |
Poland–2.34%
| | | | |
| KGHM Polska Miedz S.A. | | | 5,819 | | | | 280,799 | |
| |
Russia–5.49%
| | | | |
| Gazprom–ADR | | | 19,106 | | | | 221,384 | |
| |
Magnitogorsk Iron & Steel Works, REGS-GDR(b) | | | 26,092 | | | | 160,230 | |
| |
Rosneft Oil Co., REGS-GDR(b) | | | 39,447 | | | | 278,656 | |
| |
| | | | | | | | 660,270 | |
| |
South Africa–10.03%
| | | | |
| Sasol Ltd. | | | 6,461 | | | | 291,269 | |
| |
| Standard Bank Group Ltd. | | | 23,046 | | | | 282,879 | |
| |
Steinhoff International Holdings Ltd.(c) | | | 111,374 | | | | 331,157 | |
| |
| Tiger Brands Ltd. | | | 10,459 | | | | 300,031 | |
| |
| | | | | | | | 1,205,336 | |
| |
South Korea–23.63%
| | | | |
| Dongbu Insurance Co., Ltd. | | | 5,975 | | | | 248,631 | |
| |
| Hyundai Mipo Dockyard Co., Ltd. | | | 2,406 | | | | 261,614 | |
| |
| Hyundai Mobis | | | 1,826 | | | | 525,912 | |
| |
| KT&G Corp. | | | 4,138 | | | | 259,042 | |
| |
| LG Electronics Inc. | | | 1,849 | | | | 123,079 | |
| |
| POSCO | | | 942 | | | | 326,090 | |
| |
| Samsung Electronics Co., Ltd. | | | 662 | | | | 573,204 | |
| |
| Shinhan Financial Group Co., Ltd. | | | 6,687 | | | | 261,796 | |
| |
| SK Telecom Co., Ltd.–ADR | | | 17,653 | | | | 261,088 | |
| |
| | | | | | | | 2,840,456 | |
| |
Taiwan–6.64%
| | | | |
| AU Optronics Corp.–ADR | | | 26,060 | | | | 111,536 | |
| |
| Coretronic Corp | | | 34,000 | | | | 25,580 | |
| |
| HTC Corp. | | | 9,958 | | | | 221,425 | |
| |
| Powertech Technology Inc. | | | 124,900 | | | | 305,173 | |
| |
| Wistron Corp. | | | 116,000 | | | | 134,393 | |
| |
| | | | | | | | 798,107 | |
| |
Thailand–3.59%
| | | | |
| Bangkok Bank Public Co., Ltd.–NVDR | | | 62,700 | | | | 301,277 | |
| |
| PTT PCL | | | 13,300 | | | | 130,509 | |
| |
| | | | | | | | 431,786 | |
| |
Turkey–1.20%
| | | | |
Asya Katilim Bankasi A.S.(c) | | | 135,808 | | | | 143,918 | |
| |
United Kingdom–1.97%
| | | | |
| Eurasian Natural Resources Corp. | | | 22,512 | | | | 236,440 | |
| |
United States–5.59%
| | | | |
PowerShares India Portfolio(d) | | | 6,631 | | | | 131,559 | |
| |
| WisdomTree India Earnings Fund | | | 27,000 | | | | 539,730 | |
| |
Vietnam–2.55%
| | | | |
| Dragon Oil PLC | | | 34,468 | | | | 306,756 | |
| |
| Total Common Stocks & Other Equity Interests (Cost $12,840,239) | | | | | | | 11,496,658 | |
| |
Money Market Funds–4.80%
|
Liquid Assets Portfolio–Institutional Class(e) | | | 288,639 | | | | 288,639 | |
| |
Premier Portfolio–Institutional Class(e) | | | 288,639 | | | | 288,639 | |
| |
| Total Money Market Funds (Cost $577,278) | | | | | | | 577,278 | |
| |
| TOTAL INVESTMENTS–100.44% (Cost $13,417,517) | | | | | | | 12,073,936 | |
| |
| OTHER ASSETS LESS LIABILITIES–(0.44)% | | | | | | | (52,734 | ) |
| |
| NET ASSETS–100.00% | | | | | | $ | 12,021,202 | |
| |
See accompanying Notes to Financial Statements which are an integral part of the financial statements.
9 Invesco Emerging Markets Equity Fund
Investment Abbreviations:
| | | |
| ADR | | – American Depositary Receipt |
| GDR | | – Global Depositary Receipt |
| NVDR | | – Non-Voting Depositary Receipt |
| REGS | | – Regulation S |
Notes to Schedule of Investments:
| | |
| (a) | | Each unit represents 55 common shares and 50 preferred shares |
| (b) | | Security purchased or received in a transaction exempt from registration under the Securities Act of 1933, as amended. The security may be resold pursuant to an exemption from registration under the 1933 Act, typically to qualified institutional buyers. The aggregate value of these securities at October 31, 2011 was $438,886, which represented 3.65% of the Trust’s Net Assets. |
| (c) | | Non-income producing security. |
| (d) | | The Exchange Traded Fund and the Fund are affiliated by either having the same investment adviser or an investment adviser under common control with the Fund’s investment adviser. |
| (e) | | The money market fund and the Fund are affiliated by having the same investment adviser. |
See accompanying Notes to Financial Statements which are an integral part of the financial statements.
10 Invesco Emerging Markets Equity Fund
Statement of Assets and Liabilities
October 31, 2011
| | | | | |
Assets:
|
| Investments, at value (Cost $12,840,239) | | $ | 11,496,658 | |
| |
| Investments in affiliated money market funds, at value and cost | | | 577,278 | |
| |
| Total investments, at value (Cost $13,417,517) | | | 12,073,936 | |
| |
| Foreign currencies, at value (Cost $43,742) | | | 43,836 | |
| |
| Receivable for: | | | | |
| Fund shares sold | | | 12,401 | |
| |
| Dividends | | | 9,208 | |
| |
| Other assets | | | 65,520 | |
| |
| Total assets | | | 12,204,901 | |
| |
Liabilities:
|
| Payable for: | | | | |
| Fund shares reacquired | | | 72,577 | |
| |
| Accrued fees to affiliates | | | 74,889 | |
| |
| Accrued other operating expenses | | | 36,233 | |
| |
| Total liabilities | | | 183,699 | |
| |
| Net assets applicable to shares outstanding | | $ | 12,021,202 | |
| |
Net assets consist of:
|
| Shares of beneficial interest | | $ | 13,397,457 | |
| |
| Undistributed net investment income | | | 95,386 | |
| |
| Undistributed net realized gain (loss) | | | (128,278 | ) |
| |
| Unrealized appreciation (depreciation) | | | (1,343,363 | ) |
| |
| | | $ | 12,021,202 | |
| |
Net Assets:
|
| Class A | | $ | 4,019,216 | |
| |
| Class C | | $ | 235,624 | |
| |
| Class R | | $ | 8,759 | |
| |
| Class Y | | $ | 37,707 | |
| |
| Institutional Class | | $ | 7,719,896 | |
| |
Shares outstanding, $0.01 par value per share, with an unlimited number of shares authorized:
|
| Class A | | | 498,182 | |
| |
| Class C | | | 29,287 | |
| |
| Class R | | | 1,086.4 | |
| |
| Class Y | | | 4,671 | |
| |
| Institutional Class | | | 956,191 | |
| |
| Class A: | | | | |
| Net asset value per share | | $ | 8.07 | |
| |
Maximum offering price per share
(Net asset value of $8.07 divided by 94.50%) | | $ | 8.54 | |
| |
| Class C: | | | | |
| Net asset value and offering price per share | | $ | 8.05 | |
| |
| Class R: | | | | |
| Net asset value and offering price per share | | $ | 8.06 | |
| |
| Class Y: | | | | |
| Net asset value and offering price per share | | $ | 8.07 | |
| |
| Institutional Class: | | | | |
| Net asset value and offering price per share | | $ | 8.07 | |
| |
See accompanying Notes to Financial Statements which are an integral part of the financial statements.
11 Invesco Emerging Markets Equity Fund
Statement of Operations
For the period May 31, 2011 (commencement date) through October 31, 2011
| | | | | |
Investment income:
|
| Dividends (net of foreign withholding taxes of $7,249) | | $ | 74,587 | |
| |
| Dividends from affiliated money market funds | | | 170 | |
| |
| Total investment income | | | 74,757 | |
| |
Expenses:
|
| Advisory fees | | | 25,843 | |
| |
| Administrative services fees | | | 21,096 | |
| |
| Custodian fees | | | 24,658 | |
| |
| Distribution fees: | | | | |
| Class A | | | 3,639 | |
| |
| Class C | | | 368 | |
| |
| Class R | | | 19 | |
| |
| Transfer agent fees — A, C, R and Y | | | 2,619 | |
| |
| Transfer agent fees — Institutional | | | 118 | |
| |
| Trustees’ and officers’ fees and benefits | | | 8,521 | |
| |
| Registration and filing fees | | | 19,330 | |
| |
| Reports to shareholders | | | 10,437 | |
| |
| Professional services fees | | | 20,707 | |
| |
| Other | | | 3,535 | |
| |
| Total expenses | | | 140,890 | |
| |
| Less: Fees waived, and expenses reimbursed | | | (93,011 | ) |
| |
| Net expenses | | | 47,879 | |
| |
| Net investment income | | | 26,878 | |
| |
Realized and unrealized gain (loss) from:
|
| Net realized gain (loss) from: | | | | |
| Investment securities | | | (128,278 | ) |
| |
| Foreign currencies (net of currency tax of $(17,991)) | | | (15,882 | ) |
| |
| | | | (144,160 | ) |
| |
| Change in net unrealized appreciation (depreciation) of: | | | | |
| Investment securities | | | (1,343,581 | ) |
| |
| Foreign currencies | | | 218 | |
| |
| | | | (1,343,363 | ) |
| |
| Net realized and unrealized gain (loss) | | | (1,487,523 | ) |
| |
| Net increase (decrease) in net assets resulting from operations | | $ | (1,460,645 | ) |
| |
See accompanying Notes to Financial Statements which are an integral part of the financial statements.
12 Invesco Emerging Markets Equity Fund
Statement of Changes in Net Assets
For the period May 31, 2011 (commencement date) through October 31, 2011
| | | | | |
| | | October 31,
|
| | | 2011 |
| |
Operations:
|
| Net investment income | | $ | 26,878 | |
| |
| Net realized gain (loss) | | | (144,160 | ) |
| |
| Change in net unrealized appreciation (depreciation) | | | (1,343,363 | ) |
| |
| Net increase (decrease) in net assets resulting from operations | | | (1,460,645 | ) |
| |
Share transactions–net:
|
| Class A | | | 4,734,437 | |
| |
| Class C | | | 251,618 | |
| |
| Class R | | | 10,813 | |
| |
| Class Y | | | 35,943 | |
| |
| Institutional Class | | | 8,449,036 | |
| |
| Net increase in net assets resulting from share transactions | | | 13,481,847 | |
| |
| Net increase in net assets | | | 12,021,202 | |
| |
Net assets:
|
| Beginning of period | | | — | |
| |
| End of period (includes undistributed net investment income of $95,386) | | $ | 12,021,202 | |
| |
Notes to Financial Statements
October 31, 2011
NOTE 1—Significant Accounting Policies
Invesco Emerging Markets Equity Fund (the “Fund”) is a series portfolio of AIM Investment Funds (Invesco Investment Funds) (the “Trust”). The Trust is organized as a Delaware statutory trust and is registered under the Investment Company Act of 1940, as amended (the “1940 Act”), as an open-end series management investment company consisting of thirteen separate series portfolios, each authorized to issue an unlimited number of shares of beneficial interest. The assets, liabilities and operations of each portfolio are accounted for separately. Information presented in these financial statements pertains only to the Fund. Matters affecting each portfolio or class will be voted on exclusively by the shareholders of such portfolio or class.
The Fund’s investment objective is long-term growth of capital.
The Fund currently consists of five different classes of shares: Class A, Class C, Class R, Class Y and Institutional Class. Class A shares are sold with a front-end sales charge unless certain waiver criteria are met and under certain circumstances load waiver shares may be subject to contingent deferred sales charges (“CDSC”). Class C are sold with a CDSC. Class R, Class Y and Institutional Class shares are sold at net asset value.
The following is a summary of the significant accounting policies followed by the Fund in the preparation of its financial statements.
| | |
| A. | | Security Valuations — Securities, including restricted securities, are valued according to the following policy. |
| | A security listed or traded on an exchange (except convertible bonds) is valued at its last sales price or official closing price as of the close of the customary trading session on the exchange where the security is principally traded, or lacking any sales or official closing price on a particular day, the security may be valued at the closing bid price on that day. Securities traded in the over-the-counter market are valued based on prices furnished by independent pricing services or market makers. When such securities are valued by an independent pricing service they may be considered fair valued. Futures contracts are valued at the final settlement price set by an exchange on which they are principally traded. Listed options are valued at the mean between the last bid and ask prices from the exchange on which they are principally traded. Options not listed on an exchange are valued by an independent source at the mean between the last bid and ask prices. For purposes of determining net asset value per share, futures and option contracts generally are valued 15 minutes after the close of the customary trading session of the New York Stock Exchange (“NYSE”). |
| | Investments in open-end and closed-end registered investment companies that do not trade on an exchange are valued at the end of day net asset value per share. Investments in open-end and closed-end registered investment companies that trade on an exchange are valued at the last sales price or official closing price as of the close of the customary trading session on the exchange where the security is principally traded. |
| | Debt obligations (including convertible bonds) and unlisted equities are fair valued using an evaluated quote provided by an independent pricing service. Evaluated quotes provided by the pricing service may be determined without exclusive reliance on quoted prices, and may reflect appropriate factors such as institution-size trading in similar groups of securities, developments related to specific securities, dividend rate, yield, quality, type of issue, coupon rate, |
13 Invesco Emerging Markets Equity Fund
| | |
| | maturity, individual trading characteristics and other market data. Debt securities are subject to interest rate and credit risks. In addition, all debt securities involve some risk of default with respect to interest and/or principal payments. |
| | Foreign securities (including foreign exchange contracts) are converted into U.S. dollar amounts using the applicable exchange rates as of the close of the NYSE. If market quotations are available and reliable for foreign exchange traded equity securities, the securities will be valued at the market quotations. Because trading hours for certain foreign securities end before the close of the NYSE, closing market quotations may become unreliable. If between the time trading ends on a particular security and the close of the customary trading session on the NYSE, events occur that are significant and make the closing price unreliable, the Fund may fair value the security. If the event is likely to have affected the closing price of the security, the security will be valued at fair value in good faith using procedures approved by the Board of Trustees. Adjustments to closing prices to reflect fair value may also be based on a screening process of an independent pricing service to indicate the degree of certainty, based on historical data, that the closing price in the principal market where a foreign security trade is not the current value as of the close of the NYSE. Foreign securities meeting the approved degree of certainty that the price is not reflective of current value will be priced at the indication of fair value from the independent pricing service. Multiple factors may be considered by the independent pricing service in determining adjustments to reflect fair value and may include information relating to sector indices, American Depositary Receipts and domestic and foreign index futures. Foreign securities may have additional risks including exchange rate changes, potential for sharply devalued currencies and high inflation, political and economical upheaval, the relative lack of issuer information, relatively low market liquidity and the potential lack of strict financial and accounting controls and standards. |
| | Securities for which market prices are not provided by any of the above methods may be valued based upon quotes furnished by independent sources. The last bid price may be used to value equity securities. The mean between the last bid and asked prices is used to value debt obligations, including Corporate Loans. |
| | Securities for which market quotations are not readily available or are unreliable are valued at fair value as determined in good faith by or under the supervision of the Trust’s officers following procedures approved by the Board of Trustees. Issuer specific events, market trends, bid/ask quotes of brokers and information providers and other market data may be reviewed in the course of making a good faith determination of a security’s fair value. |
| | Valuations change in response to many factors including the historical and prospective earnings of the issuer, the value of the issuer’s assets, general economic conditions, interest rates, investor perceptions and market liquidity. Because of the inherent uncertainties of valuation, the values reflected in the financial statements may materially differ from the value received upon actual sale of those investments. |
| B. | | Securities Transactions and Investment Income — Securities transactions are accounted for on a trade date basis. Realized gains or losses on sales are computed on the basis of specific identification of the securities sold. Interest income is recorded on the accrual basis from settlement date. Dividend income (net of withholding tax, if any) is recorded on the ex-dividend date. Bond premiums and discounts are amortized and/or accreted for financial reporting purposes. |
| | The Fund may periodically participate in litigation related to Fund investments. As such, the Fund may receive proceeds from litigation settlements. Any proceeds received are included in the Statement of Operations as realized gain (loss) for investments no longer held and as unrealized gain (loss) for investments still held. |
| | Brokerage commissions and mark ups are considered transaction costs and are recorded as an increase to the cost basis of securities purchased and/or a reduction of proceeds on a sale of securities. Such transaction costs are included in the determination of net realized and unrealized gain (loss) from investment securities reported in the Statement of Operations and the Statement of Changes in Net Assets and the net realized and unrealized gains (losses) on securities per share in the Financial Highlights. Transaction costs are included in the calculation of the Fund’s net asset value and, accordingly, they reduce the Fund’s total returns. These transaction costs are not considered operating expenses and are not reflected in net investment income reported in the Statement of Operations and Statement of Changes in Net Assets, or the net investment income per share and ratios of expenses and net investment income reported in the Financial Highlights, nor are they limited by any expense limitation arrangements between the Fund and the investment adviser. |
| | The Fund allocates income and realized and unrealized capital gains and losses to a class based on the relative net assets of each class. |
| C. | | Country Determination — For the purposes of making investment selection decisions and presentation in the Schedule of Investments, the investment adviser may determine the country in which an issuer is located and/or credit risk exposure based on various factors. These factors include the laws of the country under which the issuer is organized, where the issuer maintains a principal office, the country in which the issuer derives 50% or more of its total revenues and the country that has the primary market for the issuer’s securities, as well as other criteria. Among the other criteria that may be evaluated for making this determination are the country in which the issuer maintains 50% or more of its assets, the type of security, financial guarantees and enhancements, the nature of the collateral and the sponsor organization. Country of issuer and/or credit risk exposure has been determined to be the United States of America, unless otherwise noted. |
| D. | | Distributions — Distributions from income and net realized capital gain, if any, are generally paid annually and recorded on ex-dividend date. The Fund may elect to treat a portion of the proceeds from redemptions as distributions for federal income tax purposes. |
| E. | | Federal Income Taxes — The Fund intends to comply with the requirements of Subchapter M of the Internal Revenue Code necessary to qualify as a regulated investment company and to distribute substantially all of the Fund’s taxable earnings to shareholders. As such, the Fund will not be subject to federal income taxes on otherwise taxable income (including net realized capital gain) that is distributed to shareholders. Therefore, no provision for federal income taxes is recorded in the financial statements. |
| | The Fund files tax returns in the U.S. Federal jurisdiction and certain other jurisdictions. Generally, the Fund is subject to examinations by such taxing authorities for up to three years after the filing of the return for the tax period. |
| F. | | Expenses — Fees provided for under the Rule 12b-1 plan of a particular class of the Fund are charged to the operations of such class. Transfer agency fees and expenses and other shareholder recordkeeping fees and expenses attributable to the Institutional Class are charged to such class. Transfer agency fees and expenses and other shareholder recordkeeping fees and expenses relating to all other classes are allocated among those classes based on relative net assets. All other expenses are allocated among the classes based on relative net assets. |
14 Invesco Emerging Markets Equity Fund
| | |
| G. | | Accounting Estimates — The preparation of financial statements in conformity with accounting principles generally accepted in the United States of America (“GAAP”) requires management to make estimates and assumptions that affect the reported amounts of assets and liabilities at the date of the financial statements and the reported amounts of revenues and expenses during the reporting period including estimates and assumptions related to taxation. Actual results could differ from those estimates by a significant amount. In addition, the Fund monitors for material events or transactions that may occur or become known after the period-end date and before the date the financial statements are released to print. |
| H. | | Indemnifications — Under the Trust’s organizational documents, each Trustee, officer, employee or other agent of the Trust is indemnified against certain liabilities that may arise out of performance of their duties to the Fund. Additionally, in the normal course of business, the Fund enters into contracts, including the Fund’s servicing agreements that contain a variety of indemnification clauses. The Fund’s maximum exposure under these arrangements is unknown as this would involve future claims that may be made against the Fund that have not yet occurred. The risk of material loss as a result of such indemnification claims is considered remote. |
| I. | | Redemption Fees — The Fund has a 2% redemption fee that is to be retained by the Fund to offset transaction costs and other expenses associated with short-term redemptions and exchanges. The fee, subject to certain exceptions, is imposed on certain redemptions or exchanges of shares within 31 days of purchase. The redemption fee is recorded as an increase in shareholder capital and is allocated among the share classes based on the relative net assets of each class. Effective January 1, 2012, the Fund will eliminate the 2% redemption fee, if applicable, assessed on shares of the Fund redeemed or exchanged within 31 days of purchase. |
| J. | | Foreign Currency Translations — Foreign currency is valued at the close of the NYSE based on quotations posted by banks and major currency dealers. Portfolio securities and other assets and liabilities denominated in foreign currencies are translated into U.S. dollar amounts at date of valuation. Purchases and sales of portfolio securities (net of foreign taxes withheld on disposition) and income items denominated in foreign currencies are translated into U.S. dollar amounts on the respective dates of such transactions. The Fund does not separately account for the portion of the results of operations resulting from changes in foreign exchange rates on investments and the fluctuations arising from changes in market prices of securities held. The combined results of changes in foreign exchange rates and the fluctuation of market prices on investments (net of estimated foreign tax withholding) are included with the net realized and unrealized gain or loss from investments in the Statement of Operations. Reported net realized foreign currency gains or losses arise from (1) sales of foreign currencies, (2) currency gains or losses realized between the trade and settlement dates on securities transactions, and (3) the difference between the amounts of dividends, interest, and foreign withholding taxes recorded on the Fund’s books and the U.S. dollar equivalent of the amounts actually received or paid. Net unrealized foreign currency gains and losses arise from changes in the fair values of assets and liabilities, other than investments in securities at fiscal period end, resulting from changes in exchange rates. |
| | The Fund may invest in foreign securities which may be subject to foreign taxes on income, gains on investments or currency repatriation, a portion of which may be recoverable. |
| K. | | Foreign Currency Contracts — The Fund may enter into foreign currency contracts to manage or minimize currency or exchange rate risk. The Fund may also enter into foreign currency contracts for the purchase or sale of a security denominated in a foreign currency in order to “lock in” the U.S. dollar price of that security. A foreign currency contract is an obligation to purchase or sell a specific currency for an agreed-upon price at a future date. The use of foreign currency contracts does not eliminate fluctuations in the price of the underlying securities the Fund owns or intends to acquire but establishes a rate of exchange in advance. Fluctuations in the value of these contracts are measured by the difference in the contract date and reporting date exchange rates and are recorded as unrealized appreciation (depreciation) until the contracts are closed. When the contracts are closed, realized gains (losses) are recorded. Realized and unrealized gains (losses) on the contracts are included in the Statement of Operations. The primary risks associated with foreign currency contracts include failure of the counterparty to meet the terms of the contract and the value of the foreign currency changing unfavorably. These risks may be in excess of the amounts reflected in the Statement of Assets and Liabilities. |
NOTE 2—Advisory Fees and Other Fees Paid to Affiliates
The Trust has entered into a master investment advisory agreement with Invesco Advisers, Inc. (the “Adviser” or “Invesco”). Under the terms of the investment advisory agreement, the Fund pays an advisory fee to the Adviser based on the annual rate of the Fund’s average daily net assets as follows:
| | | | | |
| Average Net Assets | | Rate |
| |
| First $250 million | | | 0 | .935% |
| |
| Next $250 million | | | 0 | .91% |
| |
| Next $500 million | | | 0 | .885% |
| |
| Next $1.5 billion | | | 0 | .86% |
| |
| Next $2.5 billion | | | 0 | .835% |
| |
| Next $2.5 billion | | | 0 | .81% |
| |
| Next $2.5 billion | | | 0 | .785% |
| |
| Over $10 billion | | | 0 | .76% |
| |
Under the terms of a master sub-advisory agreement between the Adviser and each of Invesco Asset Management Deutschland GmbH, Invesco Asset Management Limited, Invesco Asset Management (Japan) Limited, Invesco Australia Limited, Invesco Hong Kong Limited, Invesco Senior Secured Management, Inc. and Invesco Canada Ltd. (collectively, the “Affiliated Sub-Advisers”) the Adviser, not the Fund, may pay 40% of the fees paid to the Adviser to any such Affiliated Sub-Adviser(s) that provide(s) discretionary investment management services to the Fund based on the percentage of assets allocated to such Sub-Adviser(s).
15 Invesco Emerging Markets Equity Fund
The Adviser has contractually agreed, through at least February 28, 2013, to waive advisory fees and/or reimburse expenses to the extent necessary to limit total annual operating expenses after fee waiver and/or expense reimbursement (excluding certain items discussed below) of Class A, Class C, Class R, Class Y and Institutional Class shares to 1.85%, 2.60%, 2.10%, 1.60% and 1.60% of average daily net assets, respectively. In determining the Adviser’s obligation to waive advisory fees and/or reimburse expenses, the following expenses are not taken into account, and could cause the net annual operating expenses after fee waiver and/or expense reimbursement to exceed the numbers reflected above: (1) interest; (2) taxes; (3) dividend expense on short sales; (4) extraordinary or non-routine items; and (5) expenses that the Fund has incurred but did not actually pay because of an expense offset arrangement. Unless the Board of the Trustees and Invesco mutually agree to amend or continue the fee waiver agreement, it will terminate on February 28, 2013.
The Adviser has contractually agreed, through at least June 30, 2012, to waive the advisory fee payable by the Fund in an amount equal to 100% of the net advisory fees the Adviser receives from the affiliated money market funds on investments by the Fund of uninvested cash in such affiliated money market funds.
For the period May 31, 2011 (commencement date) to October 31, 2011, the Adviser waived advisory fees of $90,274 and reimbursed Class level expenses of $2,538, $64, $7, $10 and $118 for Class A, Class C, Class R, Class Y and Institutional Class shares, respectively.
The Trust has entered into a master administrative services agreement with Invesco pursuant to which the Fund has agreed to pay Invesco for certain administrative costs incurred in providing accounting services to the Fund. For the period May 31, 2011 (commencement date) to October 31, 2011, expenses incurred under the agreement are shown in the Statement of Operations as administrative services fees.
The Trust has entered into a transfer agency and service agreement with Invesco Investment Services, Inc. (“IIS”) pursuant to which the Fund has agreed to pay IIS a fee for providing transfer agency and shareholder services to the Fund and reimburse IIS for certain expenses incurred by IIS in the course of providing such services. IIS may make payments to intermediaries that provide omnibus account services, sub-accounting services and/or networking services. All fees payable by IIS to intermediaries that provide omnibus account services or sub-accounting are charged back to the Fund, subject to certain limitations approved by the Trust’s Board of Trustees. For the period May 31, 2011 (commencement date) to October 31, 2011, expenses incurred under the agreement are shown in the Statement of Operations as transfer agent fees.
The Trust has entered into master distribution agreements with Invesco Distributors, Inc. (“IDI”) to serve as the distributor for the Class A, Class C, Class R, Class Y and Institutional Class shares of the Fund. The Trust has adopted plans pursuant to Rule 12b-1 under the 1940 Act with respect to the Fund’s Class A, Class C and Class R shares (collectively, the “Plans”). The Fund, pursuant to the Plans, pays IDI compensation at the annual rate of 0.25% of the Fund’s average daily net assets of Class A shares, 1.00% of the average daily net assets of Class C shares and 0.50% of the average daily net assets of Class R shares. Of the Plan payments, up to 0.25% of the average daily net assets of each class of shares may be paid to furnish continuing personal shareholder services to customers who purchase and own shares of such classes. Any amounts not paid as a service fee under the Plans would constitute an asset-based sales charge. Rules of the Financial Industry Regulatory Authority (“FINRA”) impose a cap on the total sales charges, including asset-based sales charges that may be paid by any class of shares of the Fund.
Front-end sales commissions and CDSC (collectively, the “sales charges”) are not recorded as expenses of the Fund. Front-end sales commissions are deducted from proceeds from the sales of Fund shares prior to investment in Class A shares of the Fund. CDSC are deducted from redemption proceeds prior to remittance to the shareholder. During the period May 31, 2011 (commencement date) to October 31, 2011, IDI advised the Fund that IDI retained $2,095 in front-end sales commissions from the sale of Class A shares and $11 and $12 from Class A and Class C shares, respectively, for CDSC imposed upon redemptions by shareholders.
Certain officers and trustees of the Trust are officers and directors of the Adviser, Invesco Ltd., IIS and/or IDI.
NOTE 3—Additional Valuation Information
GAAP defines fair value as the price that would be received to sell an asset or paid to transfer a liability in an orderly transaction between market participants at the measurement date, under current market conditions. GAAP establishes a hierarchy that prioritizes the inputs to valuation methods giving the highest priority to readily available unadjusted quoted prices in an active market for identical assets (Level 1) and the lowest priority to significant unobservable inputs (Level 3) generally when market prices are not readily available or are unreliable. Based on the valuation inputs, the securities or other investments are tiered into one of three levels. Changes in valuation methods may result in transfers in or out of an investment’s assigned level:
| | |
| | Level 1 — | Prices are determined using quoted prices in an active market for identical assets. |
| | Level 2 — | Prices are determined using other significant observable inputs. Observable inputs are inputs that other market participants may use in pricing a security. These may include quoted prices for similar securities, interest rates, prepayment speeds, credit risk, yield curves, loss severities, default rates, discount rates, volatilities and others. |
| | Level 3 — | Prices are determined using significant unobservable inputs. In situations where quoted prices or observable inputs are unavailable (for example, when there is little or no market activity for an investment at the end of the period), unobservable inputs may be used. Unobservable inputs reflect the Fund’s own assumptions about the factors market participants would use in determining fair value of the securities or instruments and would be based on the best available information. |
16 Invesco Emerging Markets Equity Fund
The following is a summary of the tiered valuation input levels, as of October 31, 2011. The level assigned to the securities valuations may not be an indication of the risk or liquidity associated with investing in those securities. Because of the inherent uncertainties of valuation, the values reflected in the financial statements may materially differ from the value received upon actual sale of those investments.
During the period May 31, 2011 (commencement date) through October 31, 2011, there were no significant transfers between investment levels.
| | | | | | | | | | | | | | | | | |
| | | Level 1 | | Level 2 | | Level 3 | | Total |
| |
| Brazil | | $ | 1,606,751 | | | $ | — | | | $ | — | | | $ | 1,606,751 | |
| |
| China | | | — | | | | 1,411,208 | | | | — | | | | 1,411,208 | |
| |
| Hong Kong | | | — | | | | 438,364 | | | | — | | | | 438,364 | |
| |
| Indonesia | | | — | | | | 145,692 | | | | — | | | | 145,692 | |
| |
| Mexico | | | 319,486 | | | | — | | | | — | | | | 319,486 | |
| |
| Poland | | | — | | | | 280,799 | | | | — | | | | 280,799 | |
| |
| Russia | | | — | | | | 660,270 | | | | — | | | | 660,270 | |
| |
| South Africa | | | 291,269 | | | | 914,067 | | | | — | | | | 1,205,336 | |
| |
| South Korea | | | 520,130 | | | | 2,320,326 | | | | — | | | | 2,840,456 | |
| |
| Taiwan | | | 111,537 | | | | 686,570 | | | | — | | | | 798,107 | |
| |
| Thailand | | | — | | | | 431,786 | | | | — | | | | 431,786 | |
| |
| Turkey | | | — | | | | 143,918 | | | | — | | | | 143,918 | |
| |
| United Kingdom | | | — | | | | 236,440 | | | | — | | | | 236,440 | |
| |
| United States | | | 1,248,567 | | | | — | | | | — | | | | 1,248,567 | |
| |
| Vietnam | | | 306,756 | | | | — | | | | — | | | | 306,756 | |
| |
| Total Investments | | $ | 4,404,496 | | | $ | 7,669,440 | | | $ | — | | | $ | 12,073,936 | |
| |
NOTE 4—Trustees’ and Officers’ Fees and Benefits
“Trustees’ and Officers’ Fees and Benefits” include amounts accrued by the Fund to pay remuneration to certain Trustees and Officers of the Fund. Trustees have the option to defer compensation payable by the Fund, and “Trustees’ and Officers’ Fees and Benefits” also include amounts accrued by the Fund to fund such deferred compensation amounts. Those Trustees who defer compensation have the option to select various Invesco Funds in which their deferral accounts shall be deemed to be invested. Finally, certain current Trustees are eligible to participate in a retirement plan that provides for benefits to be paid upon retirement to Trustees over a period of time based on the number of years of service. The Fund may have certain former Trustees who also participate in a retirement plan and receive benefits under such plan. “Trustees’ and Officers’ Fees and Benefits” include amounts accrued by the Fund to fund such retirement benefits. Obligations under the deferred compensation and retirement plans represent unsecured claims against the general assets of the Fund.
During the period May 31, 2011 (commencement date) to October 31, 2011, the Fund paid no legal fees for services rendered by Kramer, Levin, Naftalis & Frankel LLP as counsel to the Independent Trustees. A partner of that firm is a Trustee of the Trust.
NOTE 5—Cash Balances
The Fund is permitted to temporarily carry a negative or overdrawn balance in its account with State Street Bank and Trust Company, the custodian bank. To compensate the custodian bank for such overdrafts, the overdrawn Fund may either (1) leave funds as a compensating balance in the account so the custodian bank can be compensated by earning the additional interest; or (2) compensate by paying the custodian bank at a rate agreed upon by the custodian bank and Invesco, not to exceed the contractually agreed upon rate.
17 Invesco Emerging Markets Equity Fund
NOTE 6—Tax Components of Net Assets
Tax Components of Net Assets at Period-End:
| | | | | |
| | | 2011 |
| |
| Undistributed ordinary income | | $ | 95,386 | |
| |
| Net unrealized appreciation (depreciation) — investments | | | (1,344,666 | ) |
| |
| Net unrealized appreciation — other investments | | | 185 | |
| |
| Capital loss carryforward | | | (127,160 | ) |
| |
| Shares of beneficial interest | | | 13,397,457 | |
| |
| Total net assets | | $ | 12,021,202 | |
| |
The difference between book-basis and tax-basis unrealized appreciation (depreciation) is due to differences in the timing of recognition of gains and losses on investments for tax and book purposes. The Fund’s net unrealized appreciation (depreciation) difference is attributable primarily to wash sales.
The temporary book/tax differences are a result of timing differences between book and tax recognition of income and/or expenses. The Fund’s temporary book/tax differences are the result of the trustee deferral of compensation and retirement plan benefits.
Capital loss carryforward is calculated and reported as of a specific date. Results of transactions and other activity after that date may affect the amount of capital loss carryforward actually available for the Fund to utilize. The Regulated Investment Company Modernization Act of 2010 (the “Act”) eliminated the eight-year carryover period for capital losses that arise in taxable years beginning after its enactment date of December 22, 2010. Consequently, these capital losses can be carried forward for an unlimited period. However, capital losses with an expiration period may not be used to offset capital gains until all net capital losses without an expiration date have been utilized. Additionally, post-enactment capital loss carryovers will retain their character as either short-term or long-term capital losses instead of as short-term capital losses as under prior law. The ability to utilize capital loss carryforward in the future may be limited under the Internal Revenue Code and related regulations based on the results of future transactions.
The Fund has a capital loss carryforward as of October 31, 2011 of $127,160 (short-term) which is not subject to expiration.
NOTE 7—Investment Securities
The aggregate amount of investment securities (other than short-term securities, U.S. Treasury obligations and money market funds, if any) purchased and sold by the Fund during the period May 31, 2011 (commencement date) to October 31, 2011 was $13,990,984 and $1,022,500, respectively. Cost of investments on a tax basis includes the adjustments for financial reporting purposes as of the most recently completed Federal income tax reporting period-end.
| | | | | |
| Unrealized Appreciation (Depreciation) of Investment Securities on a Tax Basis |
| Aggregate unrealized appreciation of investment securities | | $ | 114,934 | |
| |
| Aggregate unrealized (depreciation) of investment securities | | | (1,459,600 | ) |
| |
| Net unrealized appreciation (depreciation) of investment securities | | $ | (1,344,666 | ) |
| |
| Cost of investments for tax purposes is $13,418,602. | | | | |
NOTE 8—Reclassification of Permanent Differences
Primarily as a result of differing book/tax treatment of stock issuance costs, on October 31, 2011, undistributed net investment income was increased by $68,508, undistributed net realized gain (loss) was increased by $15,882 and shares of beneficial interest decreased by $84,390. This reclassification had no effect on the net assets of the Fund.
18 Invesco Emerging Markets Equity Fund
NOTE 9—Share Information
| | | | | | | | | |
| | | Summary of Share Activity |
| |
| | | Period ended
|
| | | October 31, 2011(a) |
| | | Shares | | Amount |
| |
| Sold: | | | | | | | | |
| Class A | | | 556,920 | | | $ | 5,217,786 | |
| |
| Class C | | | 30,355 | | | | 260,277 | |
| |
| Class R | | | 1,086.4 | | | | 10,813 | |
| |
| Class Y | | | 4,971 | | | | 38,917 | |
| |
| Institutional Class | | | 974,359 | | | | 8,587,665 | |
| |
Reacquired(b): | | | | | | | | |
| Class A | | | (58,738 | ) | | | (483,349 | ) |
| |
| Class C | | | (1,068 | ) | | | (8,659 | ) |
| |
| Class R | | | — | | | | — | |
| |
| Class Y | | | (300 | ) | | | (2,974 | ) |
| |
| Institutional Class | | | (18,168 | ) | | | (138,629 | ) |
| |
| Net increase in share activity | | | 1,489,417.4 | | | $ | 13,481,847 | |
| |
| | |
| (a) | | 85% of the outstanding shares of the Fund are owned by affiliated mutual funds. Affiliated mutual funds are other mutual funds that are also advised by Invesco. |
| (b) | | Net of redemption fees of $2,312 |
NOTE 10—Financial Highlights
The following schedule presents financial highlights for a share of the Fund outstanding throughout the periods indicated.
| | | | | | | | | | | | | | | | | | | | | | | | | | | | | | | | | | | | | | | | | | | | | | | | | |
| | | | | | | | | | | | | | | | | Ratio of
| | Ratio of
| | | | | | |
| | | | | | | Net gains
| | | | | | | | | | expenses
| | expenses
| | | | | | |
| | | | | | | (losses) on
| | | | | | | | | | to average
| | to average net
| | Ratio of net
| | | | |
| | | Net asset
| | | | securities
| | | | | | | | | | net assets
| | assets without
| | investment
| | | | |
| | | value,
| | Net
| | (both
| | Total from
| | Net asset
| | | | Net assets,
| | with fee waivers
| | fee waivers
| | income to
| | | | |
| | | beginning
| | investment
| | realized and
| | investment
| | value, end
| | Total
| | end of period
| | and/or expenses
| | and/or expenses
| | average
| | Portfolio
| | |
| | | of period | | income(a) | | unrealized) | | operations | | of period | | Return(b) | | (000s omitted) | | absorbed(c) | | absorbed(c) | | net assets(c) | | turnover(d) | | |
| |
| Class A |
| Period ended 10/31/11(e) | | $ | 10.00 | | | $ | 0.03 | | | $ | (1.96 | ) | | $ | (1.93 | ) | | $ | 8.07 | | | | (19.30 | )% | | $ | 4,019 | | | | 1.84 | % | | | 5.28 | % | | | 0.87 | % | | | 16 | % | | | | |
| |
| Class C |
| Period ended 10/31/11(e) | | | 10.00 | | | | 0.00 | | | | (1.95 | ) | | | (1.95 | ) | | | 8.05 | | | | (19.50 | ) | | | 236 | | | | 2.59 | | | | 6.03 | | | | 0.12 | | | | 16 | | | | | |
| |
| Class R |
| Period ended 10/31/11(e) | | | 10.00 | | | | 0.02 | | | | (1.96 | ) | | | (1.94 | ) | | | 8.06 | | | | (19.40 | ) | | | 9 | | | | 2.09 | | | | 5.53 | | | | 0.62 | | | | 16 | | | | | |
| |
| Class Y |
| Period ended 10/31/11(e) | | | 10.00 | | | | 0.04 | | | | (1.97 | ) | | | (1.93 | ) | | | 8.07 | | | | (19.30 | ) | | | 38 | | | | 1.59 | | | | 5.03 | | | | 1.12 | | | | 16 | | | | | |
| |
| Institutional Class |
| Period ended 10/31/11(e) | | | 10.00 | | | | 0.04 | | | | (1.97 | ) | | | (1.93 | ) | | | 8.07 | | | | (19.30 | ) | | | 7,720 | | | | 1.59 | | | | 4.86 | | | | 1.12 | | | | 16 | | | | | |
| |
| | |
| (a) | | Calculated using average shares outstanding. |
| (b) | | Includes adjustments in accordance with accounting principles generally accepted in the United States of America and as such, the net asset value for financial reporting purposes and the returns based upon those net asset values may differ from the net asset value and returns for shareholder transactions. Does not include sales charges and is not annualized for periods less than one year, if applicable. |
| (c) | | Ratios are annualized and based on average daily net assets (000’s omitted) of $3,450, $87, $9, $14 and $2,991 for Class A, Class C, Class R, Class Y and Institutional Class, respectively. |
| (d) | | Portfolio turnover is calculated at the fund level and is not annualized for periods less than one year, if applicable. |
| (e) | | Commencement date of May 31, 2011. |
19 Invesco Emerging Markets Equity Fund
Report of Independent Registered Public Accounting Firm
To the Board of Trustees of AIM Investment Funds (Invesco Investment Funds)
and Shareholders of Invesco Emerging Markets Equity Fund:
In our opinion, the accompanying statement of assets and liabilities, including the schedule of investments, and the related statements of operations and of changes in net assets and the financial highlights present fairly, in all material respects, the financial position of Invesco Emerging Markets Equity Fund (one of the funds constituting AIM Investment Funds (Invesco Investment Funds), hereafter referred to as the “Fund”) at October 31, 2011, the results of its operations, the changes in its net assets and the financial highlights for the period May 31, 2011 (commencement date) through October 31, 2011, in conformity with accounting principles generally accepted in the United States of America. These financial statements and financial highlights (hereafter referred to as “financial statements”) are the responsibility of the Fund’s management; our responsibility is to express an opinion on these financial statements based on our audit. We conducted our audit of these financial statements in accordance with the standards of the Public Company Accounting Oversight Board (United States). Those standards require that we plan and perform the audit to obtain reasonable assurance about whether the financial statements are free of material misstatement. An audit includes examining, on a test basis, evidence supporting the amounts and disclosures in the financial statements, assessing the accounting principles used and significant estimates made by management, and evaluating the overall financial statement presentation. We believe that our audit, which included confirmation of securities at October 31, 2011 by correspondence with the custodian and brokers, provide a reasonable basis for our opinion.
PRICEWATERHOUSECOOPERS LLP
Houston, Texas
December 27, 2011
20 Invesco Emerging Markets Equity Fund
Calculating your ongoing Fund expenses
Example
As a shareholder of the Fund, you incur two types of costs: (1) transaction costs, which may include sales charges (loads) on purchase payments or contingent deferred sales charges on redemptions, and redemption fees, if any; and (2) ongoing costs, including management fees, distribution and/or service (12b-1) fees, and other Fund expenses. This example is intended to help you understand your ongoing costs (in dollars) of investing in the Fund and to compare these costs with ongoing costs of investing in other mutual funds. The example is based on an investment of $1,000 invested at the May 31, 2011 (commencement date) through October 31, 2011. The hypothetical ending account value and expenses in the below example are based on an investment of $1,000 invested at the beginning of the period and held for the entire period May 1, 2011 through October 31, 2011.
Actual expenses
The table below provides information about actual account values and actual expenses. You may use the information in this table, together with the amount you invested, to estimate the expenses that you paid over the period. Simply divide your account value by $1,000 (for example, an $8,600 account value divided by $1,000 = 8.6), then multiply the result by the number in the table under the heading entitled “Actual Expenses Paid During Period” to estimate the expenses you paid on your account during this period.
Hypothetical example for comparison purposes
The table below also provides information about hypothetical account values and hypothetical expenses based on the Fund’s actual expense ratio and an assumed rate of return of 5% per year before expenses, which is not the Fund’s actual return.
The hypothetical account values and expenses may not be used to estimate the actual ending account balance or expenses you paid for the period. You may use this information to compare the ongoing costs of investing in the Fund and other funds. To do so, compare this 5% hypothetical example with the 5% hypothetical examples that appear in the shareholder reports of the other funds.
Please note that the expenses shown in the table are meant to highlight your ongoing costs only and do not reflect any transaction costs, such as sales charges (loads) on purchase payments, contingent deferred sales charges on redemptions, and redemption fees, if any. Therefore, the hypothetical information is useful in comparing ongoing costs only, and will not help you determine the relative total costs of owning different funds. In addition, if these transaction costs were included, your costs would have been higher.
| | | | | | | | | | | | | | | | | | | | | | | | | | | | | | | |
| | | | | | | | | | HYPOTHETICAL
| | | |
| | | | | | | | | | (5% annual return before
| | | |
| | | | | | | ACTUAL | | | expenses) | | | |
| | | | Beginning
| | | Ending
| | | Expenses
| | | Ending
| | | Expenses
| | | Annualized
|
| | | | Account Value
| | | Account Value
| | | Paid During
| | | Account Value
| | | Paid During
| | | Expense
|
| Class | | | (05/01/11) | | | (10/31/11)1 | | | Period2 | | | (10/31/11) | | | Period2 | | | Ratio |
| A | | | $ | 1,000.00 | | | | $ | 807.00 | | | | $ | 7.01 | | | | $ | 1,013.33 | | | | $ | 7.82 | | | | | 1.84 | % |
| | | | | | | | | | | | | | | | | | | | | | | | | | | | | | | |
| C | | | | 1,000.00 | | | | | 804.00 | | | | | 9.86 | | | | | 1,010.17 | | | | | 10.98 | | | | | 2.59 | |
| | | | | | | | | | | | | | | | | | | | | | | | | | | | | | | |
| R | | | | 1,000.00 | | | | | 806.00 | | | | | 7.96 | | | | | 1,012.28 | | | | | 8.87 | | | | | 2.09 | |
| | | | | | | | | | | | | | | | | | | | | | | | | | | | | | | |
| Y | | | | 1,000.00 | | | | | 807.00 | | | | | 6.06 | | | | | 1,014.39 | | | | | 6.76 | | | | | 1.59 | |
| | | | | | | | | | | | | | | | | | | | | | | | | | | | | | | |
| Institutional | | | | 1,000.00 | | | | | 807.00 | | | | | 6.70 | | | | | 1,014.40 | | | | | 6.74 | | | | | 1.59 | |
| | | | | | | | | | | | | | | | | | | | | | | | | | | | | | | |
| |
| 1 | The actual ending account value is based on the actual total return of the Fund for the period May 31, 2011 (commencement date) through October 31, 2011, after actual expenses, and will differ from the hypothetical ending account value which is based on the Fund’s expense ratio and a hypothetical annual return of 5% before expenses. |
| 2 | Expenses are equal to the Fund’s annualized expense ratio as indicated above multiplied by the average account value over the period, multiplied by 154 (as of close of business May 31, 2011 (commencement date) through October 31, 2011)/365. Because Class A, Class C, Class R, Class Y and Institutional Class shares have not been in existence for a full six month period, the actual ending account value and expense information shown may not provide a meaningful comparison to fund expense information of classes that show such data for a full six month period and, because the actual ending account value and expense information in the expense example covers a short time period, return and expense data may not be indicative of return and expense data for longer time periods. |
| 3 | Hypothetical expenses are equal to the annualized expense ratio indicated above multiplied by the average account value over the period, multiplied by 184/365 to reflect a one-half year period. The hypothetical ending account value and expenses may be used to compare ongoing costs of investing in Class A, Class C, Class R, Class Y and Institutional Class shares of the Fund and other funds because such data is based on a full six month period. |
21 Invesco Emerging Markets Equity Fund
| |
| Initial Approval of Investment Advisory and Sub-Advisory Agreements |
The Board of Trustees (the Board) of AIM Investment Funds (Invesco Investment Funds) (the Company) is required under the Investment Company Act of 1940 to approve the Invesco Emerging Markets Equity Fund (the Fund) investment advisory agreements. During meetings held on March 15-16, 2011, the Board as a whole and the disinterested or “independent” Trustees, voting separately approved (i) an amendment to the Company’s investment advisory agreement with Invesco Advisers, Inc. (Invesco Advisers) to add the Fund, and (ii) an amendment to the Master Intergroup Sub-Advisory Contract for Mutual Funds (the sub-advisory contracts) with Invesco Asset Management Deutschland GmbH, Invesco Asset Management Limited, Invesco Asset Management (Japan) Limited, Invesco Australia Limited, Invesco Hong Kong Limited, Invesco Senior Secured Management, Inc. and Invesco Canada Ltd. (collectively, the Affiliated Sub-Advisers) to add the Fund. In doing so, the Board determined that the investment advisory agreements are in the best interests of the Fund and its shareholders and that the compensation to Invesco Advisers and the Affiliated Sub-Advisers under the Fund’s investment advisory agreements is fair and reasonable.
The Board’s Fund Evaluation Process
The Board’s Investments Committee has established three Sub-Committees that are responsible for overseeing the management of a number of the series portfolios of the funds advised by Invesco Advisers (the Invesco Funds). The Fund will be assigned to one of the Sub-Committees. This Sub-Committee structure permits the Trustees to focus on the performance of the Invesco Funds that have been assigned to them. The Sub-Committees meet throughout the year to review the performance of their assigned funds, and the Sub-Committees review monthly and quarterly comparative performance information and periodic asset flow data for their assigned funds. Over the course of each year, the Sub-Committees meet with portfolio managers for their assigned funds and other members of management and review with these individuals the performance, investment objective(s), policies, strategies, limitations and investment risk of these funds.
In evaluating the fairness and reasonableness of the Fund’s investment advisory agreements, the Board considered, among other things, the factors discussed below. The discussion below serves as a summary of the material factors and related conclusions that formed the basis for the Board’s approval of the Fund’s investment advisory agreements. The Board considered the information provided to it and did not identify any particular factor that was controlling. One Trustee may have weighed a particular piece of information differently than another Trustee.
Factors and Conclusions and Summary of Evaluation of Investment Advisory and Sub-Advisory Agreements
| |
| A. | Nature, Extent and Quality of Services Provided by Invesco Advisers and the Affiliated Sub-Advisers |
The Board reviewed the advisory services to be provided to the Fund by Invesco Advisers under the Fund’s investment advisory agreement and the credentials and experience of the officers and employees of Invesco Advisers who provide these services. The Board’s review of the qualifications of Invesco Advisers to provide these services included the Board’s consideration of Invesco Advisers’ portfolio and product review process, various back office support functions provided by Invesco Advisers and its affiliates, and Invesco Adviser’s global trading operations. In determining whether to approve the Fund’s investment advisory agreement, the Board considered the prior relationship between Invesco Advisers and the Invesco Funds, as well as the Board’s knowledge of Invesco Advisers’ operations. The Board concluded that the nature, extent and quality of the advisory services to be provided to the Fund by Invesco Advisers are appropriate.
The Board reviewed the services to be provided by the Affiliated Sub-Advisers under the sub-advisory contracts and the credentials and experience of the officers and employees of the Affiliated Sub-Advisers who provide these services. The Board noted that the Affiliated Sub-Advisers, which have offices and personnel that are located in financial centers around the world. As a result, the Affiliated Sub-Advisers can provide research and investment analysis on the markets and economies of various countries in which the Fund invests and make recommendations on securities of companies located in such countries. The Board concluded that the sub-advisory contracts will benefit the Fund and its shareholders by permitting Invesco Advisers to use the resources and talents of the Affiliated Sub-Advisers in managing the Fund. The Board concluded that the nature, extent and quality of the services to be provided by the Affiliated Sub-Advisers are appropriate.
In determining whether to approve the Fund’s investment advisory agreements, the Board considered the prior relationship between Invesco Advisers and the Invesco Funds, as well as the Board’s knowledge of Invesco Advisers’ operations, and concluded that it was beneficial to maintain the relationship for the Fund, in part, because of such knowledge.
The Board did not consider the performance of the Fund because the Fund is new and has no performance history.
| |
| C. | Advisory and Sub-Advisory Fees and Fee Waivers |
The Board considered the contractual advisory fee rate of the Fund and the proposed fee limitations that will be in place for the Fund through June 30, 2012. The Board also considered the services to be provided by the Affiliated Sub-Advisers pursuant to the sub-advisory contracts and the services to be provided by Invesco Advisers pursuant to the Fund’s investment advisory agreement, as well as the allocation of fees between Invesco Advisers and the Affiliated Sub-Advisers pursuant to the sub-advisory contracts. The Board noted that the sub-advisory fees have no direct effect on the Fund or its shareholders, as they are paid by Invesco Advisers to the Affiliated Sub-Advisers.
After taking account of the Fund’s contractual advisory fee rate, the contractual sub-advisory fee rate, the expense limits and other relevant factors, the Board concluded that the Fund’s advisory and sub-advisory fees were fair and reasonable.
| |
| D. | Economies of Scale and Breakpoints |
The Board considered the extent to which there are economies of scale in the provision of advisory services to the Fund. The Board also considered whether the Fund benefits from such economies of scale through contractual breakpoints in the Fund’s advisory fee schedule. The Board noted that the Fund’s contractual advisory fee schedule provides for breakpoints. The Board also noted that the Fund shares directly in economies of scale through lower fees charged by third party service providers based on the combined size of all of the Invesco Funds and other clients advised by Invesco Advisers.
| |
| E. | Profitability and Financial Resources |
The Board considered information from Invesco Advisers concerning the costs of the advisory and other services that Invesco Advisers and its affiliates provide to the Invesco Funds and the profitability of Invesco Advisers and its affiliates in providing these services. The Board noted that Invesco Advisers continues to operate at a net profit with respect to the services Invesco Advisers and its subsidiaries provide to the Invesco Funds. The Board concluded that the Fund’s fees were fair and reasonable, and that the level of profits realized by Invesco Advisers and its affiliates from providing services to the Fund are not anticipated to be excessive in light of
22 Invesco Emerging Markets Equity Fund
the nature, quality and extent of the services provided. The Board considered whether Invesco Advisers and each Affiliated Sub-Adviser are financially sound and have the resources necessary to perform their obligations under the Fund’s investment advisory agreement and sub-advisory contracts. The Board concluded that Invesco Advisers and each Affiliated Sub-Adviser have the financial resources necessary to fulfill these obligations.
| |
| F. | Collateral Benefits to Invesco Advisers and its Affiliates |
The Board considered various other benefits received by Invesco Advisers and its affiliates resulting from Invesco Advisers’ relationship with the Fund, including the fees received by Invesco Advisers and its affiliates for their provision of administrative, transfer agency and distribution services to the Fund. The Board considered the performance of Invesco Advisers and its affiliates in providing these services to other Invesco Funds and the organizational structure employed by Invesco Advisers and its affiliates to provide these services. The Board also considered that these services will be provided to the Fund pursuant to written contracts that are reviewed and approved on an annual basis by the Board; that the services are required for the operation of the Fund; that Invesco Advisers and its affiliates can provide services, the nature and quality of which are at least equal to those provided by others offering the same or similar services; and that the fees for such services are fair and reasonable in light of the usual and customary charges by others for services of the same nature and quality.
The Board considered the benefits realized by Invesco Advisers and the Affiliated Sub-Advisers as a result of portfolio brokerage transactions executed through “soft dollar” arrangements. The Board noted that soft dollar arrangements shift the payment obligation for research and execution services from Invesco Advisers and the Affiliated Sub-Advisers to the Invesco Funds and therefore may reduce Invesco Advisers’ and the Affiliated Sub-Advisers’ expenses. The Board concluded that the soft dollar arrangements are appropriate. The Board also concluded that, based on their review and representations made by the Chief Compliance Officer of the Invesco Funds, these arrangements are consistent with regulatory requirements.
The Board considered the fact that the Fund’s uninvested cash and cash collateral from any securities lending arrangements may be invested in money market funds advised by Invesco Advisers pursuant to procedures approved by the Board. The Board noted that Invesco Advisers will receive advisory fees from these affiliated money market funds attributable to such investments, although Invesco Advisers has contractually agreed to waive through at least June 30, 2012, the advisory fees payable by the Fund in an amount equal to 100% of the net advisory fee Invesco Advisers or its affiliates receive from the affiliated money market funds with respect to the Fund’s investment in the affiliated money market funds of uninvested cash, but not cash collateral. The Board concluded that the Fund’s investment of uninvested cash and cash collateral from any securities lending arrangements in the affiliated money market funds is in the best interests of the Fund and its shareholders.
23 Invesco Emerging Markets Equity Fund
Trustees and Officers
The address of each trustee and officer is AIM Investment Funds (Invesco Investment Funds) (the “Trust”), 11 Greenway Plaza, Suite 2500, Houston, Texas 77046-1173. The trustees serve for the life of the Trust, subject to their earlier death, incapacitation, resignation, retirement or removal as more specifically provided in the Trust’s organizational documents. Each officer serves for a one year term or until their successors are elected and qualified. Column two below includes length of time served with predecessor entities, if any.
| | | | | | | | | |
| | | | | | | Number of
| | |
| | | | | | | Funds in
| | |
| | | | | | | Fund Complex
| | |
Name, Year of Birth and
| | Trustee and/
| | Principal Occupation(s)
| | Overseen by
| | Other Directorship(s)
|
| Position(s) Held with the Trust | | or Officer Since | | During Past 5 Years | | Trustee | | Held by Trustee |
| | | | | | | | | |
| | | | | | | | | |
| Interested Persons | | | | | | | | |
| | | | | | | | | |
| | | | | | | | | |
| | | | | | | | | |
Martin L. Flanagan1 — 1960
Trustee | | 2007 | | Executive Director, Chief Executive Officer and President, Invesco Ltd. (ultimate parent of Invesco and a global investment management firm); Advisor to the Board, Invesco Advisers, Inc. (formerly known as Invesco Institutional (N.A.), Inc.); Trustee, The Invesco Funds; Vice Chair, Investment Company Institute; and Member of Executive Board, SMU Cox School of Business
Formerly: Chairman, Invesco Advisers, Inc. (registered investment adviser); Director, Chairman, Chief Executive Officer and President, IVZ Inc. (holding company), INVESCO Group Services, Inc. (service provider) and Invesco North American Holdings, Inc. (holding company); Director, Chief Executive Officer and President, Invesco Holding Company Limited (parent of Invesco and a global investment management firm); Director, Invesco Ltd.; Chairman, Investment Company Institute and President, Co-Chief Executive Officer, Co-President, Chief Operating Officer and Chief Financial Officer, Franklin Resources, Inc. (global investment management organization) | | 141 | | None |
| | | | | | | | | |
| | | | | | | | | |
| | | | | | | | | |
Philip A. Taylor2 — 1954
Trustee, President and
Principal Executive Officer | | 2006 | | Head of North American Retail and Senior Managing Director, Invesco Ltd.; Director, Co-Chairman, Co-President and Co-Chief Executive Officer, Invesco Advisers, Inc. (formerly known as Invesco Institutional (N.A.), Inc.) (registered investment adviser); Director, Chairman, Chief Executive Officer and President, Invesco Management Group, Inc. (formerly Invesco Aim Management Group, Inc.) (financial services holding company); Director and President, INVESCO Funds Group, Inc. (registered investment adviser and registered transfer agent); Director and Chairman, Invesco Investment Services, Inc. (formerly known as Invesco Aim Investment Services, Inc.) (registered transfer agent) and IVZ Distributors, Inc. (formerly known as INVESCO Distributors, Inc.) (registered broker dealer); Director, President and Chairman, Invesco Inc. (holding company) and Invesco Canada Holdings Inc. (holding company); Chief Executive Officer, Invesco Corporate Class Inc. (corporate mutual fund company) and Invesco Canada Fund Inc. (corporate mutual fund company); Director, Chairman and Chief Executive Officer, Invesco Canada Ltd. (formerly known as Invesco Trimark Ltd./Invesco Trimark Ltèe) (registered investment adviser and registered transfer agent); Trustee, President and Principal Executive Officer, The Invesco Funds (other than AIM Treasurer’s Series Trust (Invesco Treasurer’s Series Trust) and Short-Term Investments Trust); Trustee and Executive Vice President, The Invesco Funds (AIM Treasurer’s Series Trust (Invesco Treasurer’s Series Trust) and Short-Term Investments Trust only); Director, Invesco Investment Advisers LLC (formerly known as Van Kampen Asset Management); Director, Chief Executive Officer and President, Van Kampen Exchange Corp.
Formerly: Director and Chairman, Van Kampen Investor Services Inc.: Director, Chief Executive Officer and President, 1371 Preferred Inc. (holding company); and Van Kampen Investments Inc.; Director and President, AIM GP Canada Inc. (general partner for limited partnerships); and Van Kampen Advisors, Inc.; Director and Chief Executive Officer, Invesco Trimark Dealer Inc. (registered broker dealer); Director, Invesco Distributors, Inc. (formerly known as Invesco Aim Distributors, Inc.) (registered broker dealer); Manager, Invesco PowerShares Capital Management LLC; Director, Chief Executive Officer and President, Invesco Advisers, Inc.; Director, Chairman, Chief Executive Officer and President, Invesco Aim Capital Management, Inc.; President, Invesco Trimark Dealer Inc. and Invesco Trimark Ltd./Invesco Trimark Ltèe; Director and President, AIM Trimark Corporate Class Inc. and AIM Trimark Canada Fund Inc.; Senior Managing Director, Invesco Holding Company Limited; Trustee and Executive Vice President, Tax-Free Investments Trust; Director and Chairman, Fund Management Company (former registered broker dealer); President and Principal Executive Officer, The Invesco Funds (AIM Treasurer’s Series Trust (Invesco Treasurer’s Series Trust), Short-Term Investments Trust and Tax-Free Investments Trust only); President, AIM Trimark Global Fund Inc. and AIM Trimark Canada Fund Inc. | | 141 | | None |
| | | | | | | | | |
| | | | | | | | | |
| | | | | | | | | |
Wayne W. Whalen3 — 1939
Trustee | | 2010 | | Of Counsel, and prior to 2010, partner in the law firm of Skadden, Arps, Slate, Meagher & Flom LLP, legal counsel to funds in the Fund Complex | | 159 | | Director of the Abraham Lincoln Presidential Library Foundation |
| | | | | | | | | |
| | | | | | | | | |
| | | | | | | | | |
| Independent Trustees | | | | | | | | |
| | | | | | | | | |
| | | | | | | | | |
| | | | | | | | | |
Bruce L. Crockett — 1944
Trustee and Chair | | 2001 | | Chairman, Crockett Technology Associates (technology consulting company)
Formerly: Director, Captaris (unified messaging provider); Director, President and Chief Executive Officer COMSAT Corporation; and Chairman, Board of Governors of INTELSAT (international communications company) | | 141 | | ACE Limited (insurance company); and Investment Company Institute |
| | | | | | | | | |
| | | | | | | | | |
| | | | | | | | | |
David C. Arch — 1945
Trustee | | 2010 | | Chairman and Chief Executive Officer of Blistex Inc., a consumer health care products manufacturer. | | 159 | | Member of the Heartland Alliance Advisory Board, a nonprofit organization serving human needs based in Chicago. Board member of the Illinois Manufacturers’ Association. Member of the Board of Visitors, Institute for the Humanities, University of Michigan |
| | | | | | | | | |
| |
| 1 | Mr. Flanagan is considered an interested person of the Trust because he is an officer of the adviser to the Trust, and an officer and a director of Invesco Ltd., ultimate parent of the adviser to the Trust. |
| 2 | Mr. Taylor is considered an interested person of the Trust because he is an officer and a director of the adviser to, and a director of the principal underwriter of, the Trust. |
| 3 | Mr. Whalen has been deemed to be an interested person of the Trust because of his prior service as counsel to the predecessor funds of certain Invesco open-end funds and his affiliation with the law firm that served as counsel to such predecessor funds and continues to serve as counsel to the Invesco Van Kampen closed-end funds. |
T-1 Invesco Emerging Markets Equity Fund
Trustees and Officers—(continued)
The address of each trustee and officer is AIM Investment Funds (Invesco Investment Funds) (the “Trust”), 11 Greenway Plaza, Suite 2500, Houston, Texas 77046-1173. The trustees serve for the life of the Trust, subject to their earlier death, incapacitation, resignation, retirement or removal as more specifically provided in the Trust’s organizational documents. Each officer serves for a one year term or until their successors are elected and qualified. Column two below includes length of time served with predecessor entities, if any.
| | | | | | | | | |
| | | | | | | Number of
| | |
| | | | | | | Funds in
| | |
| | | | | | | Fund Complex
| | |
Name, Year of Birth and
| | Trustee and/
| | Principal Occupation(s)
| | Overseen by
| | Other Directorship(s)
|
| Position(s) Held with the Trust | | or Officer Since | | During Past 5 Years | | Trustee | | Held by Trustee |
| | | | | | | | | |
| | | | | | | |
| Independent Trustees—(continued) | | | | | | |
| | | | | | | | | |
| | | | | | | | | |
| | | | | | | | | |
Bob R. Baker — 1936
Trustee | | 2003 | | Retired
Formerly: President and Chief Executive Officer, AMC Cancer Research Center; and Chairman and Chief Executive Officer, First Columbia Financial Corporation | | 141 | | None |
| | | | | | | | | |
| | | | | | | | | |
| | | | | | | | | |
Frank S. Bayley — 1939
Trustee | | 1987 | | Retired
Formerly: Director, Badgley Funds, Inc. (registered investment company) (2 portfolios) and Partner, law firm of Baker & McKenzie | | 141 | | Director and Chairman, C.D. Stimson Company (a real estate investment company) |
| | | | | | | | | |
| | | | | | | | | |
| | | | | | | | | |
James T. Bunch — 1942
Trustee | | 2003 | | Founder, Green, Manning & Bunch Ltd. (investment banking firm)
Formerly: Executive Committee, United States Golf Association; and Director, Policy Studies, Inc. and Van Gilder Insurance Corporation | | 141 | | Vice Chairman, Board of Governors, Western Golf Association/Evans Scholars Foundation and Director, Denver Film Society |
| | | | | | | | | |
| | | | | | | | | |
| | | | | | | | | |
Rodney F. Dammeyer — 1940
Trustee | | 2010 | | President of CAC, LLC, a private company offering capital investment and management advisory services.
Formerly: Prior to January 2004, Director of TeleTech Holdings Inc.; Prior to 2002, Director of Arris Group, Inc.; Prior to 2001, Managing Partner at Equity Group Corporate Investments. Prior to 1995, Vice Chairman of Anixter International. Prior to 1985, experience includes Senior Vice President and Chief Financial Officer of Household International, Inc, Executive Vice President and Chief Financial Officer of Northwest Industries, Inc. and Partner of Arthur Andersen & Co. | | 159 | | Director of Quidel Corporation and Stericycle, Inc. Prior to May 2008, Trustee of The Scripps Research Institute. Prior to February 2008, Director of Ventana Medical Systems, Inc. Prior to April 2007, Director of GATX Corporation. Prior to April 2004, Director of TheraSense, Inc. |
| | | | | | | | | |
| | | | | | | | | |
| | | | | | | | | |
Albert R. Dowden — 1941
Trustee | | 2001 | | Director of a number of public and private business corporations, including the Boss Group, Ltd. (private investment and management); Reich & Tang Funds (5 portfolios) (registered investment company); and Homeowners of America Holding Corporation/ Homeowners of America Insurance Company (property casualty company)
Formerly: Director, Continental Energy Services, LLC (oil and gas pipeline service); Director, CompuDyne Corporation (provider of product and services to the public security market) and Director, Annuity and Life Re (Holdings), Ltd. (reinsurance company); Director, President and Chief Executive Officer, Volvo Group North America, Inc.; Senior Vice President, AB Volvo; Director of various public and private corporations; Chairman, DHJ Media, Inc.; Director Magellan Insurance Company; and Director, The Hertz Corporation, Genmar Corporation (boat manufacturer), National Media Corporation; Advisory Board of Rotary Power International (designer, manufacturer, and seller of rotary power engines); and Chairman, Cortland Trust, Inc. (registered investment company) | | 141 | | Board of Nature’s Sunshine Products, Inc. |
| | | | | | | | | |
| | | | | | | | | |
| | | | | | | | | |
Jack M. Fields — 1952
Trustee | | 2001 | | Chief Executive Officer, Twenty First Century Group, Inc. (government affairs company); and Owner and Chief Executive Officer, Dos Angelos Ranch, L.P. (cattle, hunting, corporate entertainment), Discovery Global Education Fund (non-profit) and Cross Timbers Quail Research Ranch (non-profit)
Formerly: Chief Executive Officer, Texana Timber LP (sustainable forestry company) and member of the U.S. House of Representatives | | 141 | | Administaff |
| | | | | | | | | |
| | | | | | | | | |
| | | | | | | | | |
Carl Frischling — 1937
Trustee | | 2001 | | Partner, law firm of Kramer Levin Naftalis and Frankel LLP | | 141 | | Director, Reich & Tang Funds (6 portfolios) |
| | | | | | | | | |
| | | | | | | | | |
| | | | | | | | | |
Prema Mathai-Davis — 1950
Trustee | | 2001 | | Retired
Formerly: Chief Executive Officer, YWCA of the U.S.A. | | 141 | | None |
| | | | | | | | | |
| | | | | | | | | |
| | | | | | | | | |
Larry Soll — 1942
Trustee | | 2003 | | Retired
Formerly, Chairman, Chief Executive Officer and President, Synergen Corp. (a biotechnology company) | | 141 | | None |
| | | | | | | | | |
| | | | | | | | | |
| | | | | | | | | |
Hugo F. Sonnenschein — 1940
Trustee | | 2010 | | President Emeritus and Honorary Trustee of the University of Chicago and the Adam Smith Distinguished Service Professor in the Department of Economics at the University of Chicago. Prior to July 2000, President of the University of Chicago. | | 159 | | Trustee of the University of Rochester and a member of its investment committee. Member of the National Academy of Sciences, the American Philosophical Society and a fellow of the American Academy of Arts and Sciences |
| | | | | | | | | |
| | | | | | | | | |
| | | | | | | | | |
Raymond Stickel, Jr. — 1944
Trustee | | 2005 | | Retired
Formerly: Director, Mainstay VP Series Funds, Inc. (25 portfolios) and Partner, Deloitte & Touche | | 141 | | Director of Long Cove Club Owners’ Association (home owner’s association) |
| | | | | | | | | |
T-2 Invesco Emerging Markets Equity Fund
Trustees and Officers—(continued)
The address of each trustee and officer is AIM Investment Funds (Invesco Investment Funds) (the “Trust”), 11 Greenway Plaza, Suite 2500, Houston, Texas 77046-1173. The trustees serve for the life of the Trust, subject to their earlier death, incapacitation, resignation, retirement or removal as more specifically provided in the Trust’s organizational documents. Each officer serves for a one year term or until their successors are elected and qualified. Column two below includes length of time served with predecessor entities, if any.
| | | | | | | | | |
| | | | | | | Number of
| | |
| | | | | | | Funds in
| | |
| | | | | | | Fund Complex
| | |
Name, Year of Birth and
| | Trustee and/
| | Principal Occupation(s)
| | Overseen by
| | Other Directorship(s)
|
| Position(s) Held with the Trust | | or Officer Since | | During Past 5 Years | | Trustee | | Held by Trustee |
| | | | | | | | | |
| | | | | | | | | |
| Other Officers | | | | | | | | |
| | | | | | | | | |
| | | | | | | | | |
| | | | | | | | | |
Russell C. Burk — 1958
Senior Vice President and Senior Officer | | 2005 | | Senior Vice President and Senior Officer of Invesco Funds | | N/A | | N/A |
| | | | | | | | | |
| | | | | | | | | |
| | | | | | | | | |
John M. Zerr — 1962
Senior Vice President, Chief Legal Officer and Secretary | | 2006 | | Director, Senior Vice President, Secretary and General Counsel, Invesco Management Group, Inc. (formerly known as Invesco Aim Management Group, Inc.) and Van Kampen Exchange Corp.; Senior Vice President, Invesco Advisers, Inc. (formerly known as Invesco Institutional (N.A.), Inc.) (registered investment adviser); Senior Vice President and Secretary, Invesco Distributors, Inc. (formerly known as Invesco Aim Distributors, Inc.); Director, Vice President and Secretary, Invesco Investment Services, Inc. (formerly known as Invesco Aim Investment Services, Inc.) and IVZ Distributors, Inc. (formerly known as INVESCO Distributors, Inc.); Director and Vice President, INVESCO Funds Group, Inc.; Senior Vice President, Chief Legal Officer and Secretary, The Invesco Funds; Manager, Invesco PowerShares Capital Management LLC; Director, Secretary and General Counsel, Invesco Investment Advisers LLC (formerly known as Van Kampen Asset Management); Secretary and General Counsel, Van Kampen Funds Inc. and Chief Legal Officer, PowerShares Exchange-Traded Fund Trust, PowerShares Exchange-Traded Fund Trust II, PowerShares India Exchange-Traded Fund Trust and PowerShares Actively Managed Exchange-Traded Fund Trust
Formerly: Director and Secretary, Van Kampen Advisors Inc.; Director Vice President, Secretary and General Counsel Van Kampen Investor Services Inc.; Director, Invesco Distributors, Inc. (formerly known as Invesco Aim Distributors, Inc.); Director, Senior Vice President, General Counsel and Secretary, Invesco Advisers, Inc.; and Van Kampen Investments Inc.; Director, Vice President and Secretary, Fund Management Company; Director, Senior Vice President, Secretary, General Counsel and Vice President, Invesco Aim Capital Management, Inc.; Chief Operating Officer and General Counsel, Liberty Ridge Capital, Inc. (an investment adviser); Vice President and Secretary, PBHG Funds (an investment company) and PBHG Insurance Series Fund (an investment company); Chief Operating Officer, General Counsel and Secretary, Old Mutual Investment Partners (a broker-dealer); General Counsel and Secretary, Old Mutual Fund Services (an administrator) and Old Mutual Shareholder Services (a shareholder servicing center); Executive Vice President, General Counsel and Secretary, Old Mutual Capital, Inc. (an investment adviser); and Vice President and Secretary, Old Mutual Advisors Funds (an investment company) | | N/A | | N/A |
| | | | | | | | | |
| | | | | | | | | |
| | | | | | | | | |
Lisa O. Brinkley — 1959
Vice President | | 2004 | | Global Compliance Director, Invesco Ltd.; Chief Compliance Officer, Invesco Investment Services, Inc.(formerly known as Invesco Aim Investment Services, Inc.); and Vice President, The Invesco Funds
Formerly: Chief Compliance Officer, Invesco Distributors, Inc. (formerly known as Invesco Aim Distributors, Inc.) and Van Kampen Investor Services Inc.; Senior Vice President, Invesco Management Group, Inc.; Senior Vice President and Chief Compliance Officer, Invesco Advisers, Inc. and The Invesco Funds; Vice President and Chief Compliance Officer, Invesco Aim Capital Management, Inc. and Invesco Distributors, Inc.; Vice President, Invesco Investment Services, Inc. and Fund Management Company | | N/A | | N/A |
| | | | | | | | | |
| | | | | | | | | |
| | | | | | | | | |
Sheri Morris — 1964
Vice President, Treasurer and Principal Financial Officer | | 1999 | | Vice President, Treasurer and Principal Financial Officer, The Invesco Funds; and Vice President, Invesco Advisers, Inc. (formerly known as Invesco Institutional (N.A.), Inc.) (registered investment adviser).
Formerly: Treasurer, PowerShares Exchange-Traded Fund Trust, PowerShares Exchange--Traded Fund Trust II, PowerShares India Exchange-Traded Fund Trust and PowerShares Actively Managed Exchange-Traded Fund Trust; Vice President, Invesco Advisers, Inc., Invesco Aim Capital Management, Inc. and Invesco Aim Private Asset Management, Inc.; Assistant Vice President and Assistant Treasurer, The Invesco Funds and Assistant Vice President, Invesco Advisers, Inc., Invesco Aim Capital Management, Inc. and Invesco Aim Private Asset Management, Inc. | | N/A | | N/A |
| | | | | | | | | |
| | | | | | | | | |
| | | | | | | | | |
Karen Dunn Kelley — 1960
Vice President | | 2004 | | Head of Invesco’s World Wide Fixed Income and Cash Management Group; Senior Vice President, Invesco Advisers, Inc. (formerly known as Invesco Institutional (N.A.), Inc.) (registered investment adviser); Executive Vice President, Invesco Distributors, Inc. (formerly known as Invesco Aim Distributors, Inc.); Senior Vice President, Invesco Management Group, Inc. (formerly known as Invesco Aim Management Group, Inc.); and Director, Invesco Mortgage Capital Inc.; Vice President, The Invesco Funds (other than AIM Treasurer’s Series Trust (Invesco Treasurer’s Series Trust) and Short-Term Investments Trust); President and Principal Executive Officer, The Invesco Funds (AIM Treasurer’s Series Trust (Invesco Treasurer’s Series Trust) and Short-Term Investments Trust only).
Formerly: Senior Vice President, Van Kampen Investments Inc.; Vice President, Invesco Advisers, Inc. (formerly known as Invesco Institutional (N.A.), Inc.); Director of Cash Management and Senior Vice President, Invesco Advisers, Inc. and Invesco Aim Capital Management, Inc.; President and Principal Executive Officer, Tax-Free Investments Trust; Director and President, Fund Management Company; Chief Cash Management Officer, Director of Cash Management, Senior Vice President, and Managing Director, Invesco Aim Capital Management, Inc.; Director of Cash Management, Senior Vice President, and Vice President, Invesco Advisers, Inc. and The Invesco Funds (AIM Treasurer’s Series Trust (Invesco Treasurer’s Series Trust), Short-Term Investments Trust and Tax-Free Investments Trust only) | | N/A | | N/A |
| | | | | | | | | |
T-3 Invesco Emerging Markets Equity Fund
Trustees and Officers—(continued)
The address of each trustee and officer is AIM Investment Funds (Invesco Investment Funds) (the “Trust”), 11 Greenway Plaza, Suite 2500, Houston, Texas 77046-1173. The trustees serve for the life of the Trust, subject to their earlier death, incapacitation, resignation, retirement or removal as more specifically provided in the Trust’s organizational documents. Each officer serves for a one year term or until their successors are elected and qualified. Column two below includes length of time served with predecessor entities, if any.
| | | | | | | | | |
| | | | | | | Number of
| | |
| | | | | | | Funds in
| | |
| | | | | | | Fund Complex
| | |
Name, Year of Birth and
| | Trustee and/
| | Principal Occupation(s)
| | Overseen by
| | Other Directorship(s)
|
| Position(s) Held with the Trust | | or Officer Since | | During Past 5 Years | | Trustee | | Held by Trustee |
| | | | | | | | | |
| | | | | | | |
| Other Officers—(continued) | | | | | | |
| | | | | | | | | |
| | | | | | | | | |
| | | | | | | | | |
Lance A. Rejsek — 1967
Anti-Money Laundering Compliance Officer | | 2005 | | Anti-Money Laundering Compliance Officer, Invesco Advisers, Inc. (formerly known as Invesco Institutional (N.A.), Inc.) (registered investment adviser); Invesco Distributors, Inc. (formerly known as Invesco Aim Distributors, Inc.), Invesco Investment Services, Inc. (formerly known as Invesco Aim Investment Services, Inc.), The Invesco Funds, PowerShares Exchange-Traded Fund Trust, PowerShares Exchange-Traded Fund Trust II, PowerShares India Exchange-Traded Fund Trust, PowerShares Actively Managed Exchange-Traded Fund Trust, Invesco Investment Advisers LLC (formerly known as Van Kampen Asset Management) and Van Kampen Funds Inc.
Formerly: Anti-Money Laundering Compliance Officer, Van Kampen Investor Services Inc., Fund Management Company, Invesco Advisers, Inc., Invesco Aim Capital Management, Inc. and Invesco Aim Private Asset Management, Inc. | | N/A | | N/A |
| | | | | | | | | |
| | | | | | | | | |
| | | | | | | | | |
Todd L. Spillane — 1958
Chief Compliance Officer | | 2006 | | Senior Vice President, Invesco Management Group, Inc. (formerly known as Invesco Aim Management Group, Inc.) and Van Kampen Exchange Corp.; Senior Vice President and Chief Compliance Officer, Invesco Advisers, Inc. (registered investment adviser) (formerly known as Invesco Institutional (N.A.), Inc.); Chief Compliance Officer, The Invesco Funds, PowerShares Exchange-Traded Fund Trust, PowerShares Exchange-Traded Fund Trust II, PowerShares India Exchange-Traded Fund Trust, PowerShares Actively Managed Exchange-Traded Fund Trust, INVESCO Private Capital Investments, Inc. (holding company) and Invesco Private Capital, Inc. (registered investment adviser); Vice President, Invesco Distributors, Inc. (formerly known as Invesco Aim Distributors, Inc.) and Invesco Investment Services, Inc. (formerly known as Invesco Aim Investment Services, Inc.).
Formerly: Chief Compliance Officer, Invesco Van Kampen Closed-End Funds; Senior Vice President, Van Kampen Investments Inc.; Senior Vice President and Chief Compliance Officer, Invesco Advisers, Inc. and Invesco Aim Capital Management, Inc.; Chief Compliance Officer, Invesco Global Asset Management (N.A.), Inc., Invesco Senior Secured Management, Inc. (registered investment adviser) and Van Kampen Investor Services Inc.; Vice President, Invesco Aim Capital Management, Inc. and Fund Management Company | | N/A | | N/A |
| | | | | | | | | |
The Statement of Additional Information of the Trust includes additional information about the Fund’s Trustees and is available upon request, without charge, by calling 1.800.959.4246. Please refer to the Fund’s prospectus for information on the Fund’s sub-advisers.
| | | | | | | |
Office of the Fund
11 Greenway Plaza, Suite 2500
Houston, TX 77046-1173 | | Investment Adviser
Invesco Advisers, Inc.
1555 Peachtree Street, N.E.
Atlanta, GA 30309 | | Distributor
Invesco Distributors, Inc.
11 Greenway Plaza, Suite 2500 Houston, TX 77046-1173 | | Auditors
PricewaterhouseCoopers LLP
1201 Louisiana Street, Suite 2900 Houston, TX 77002-5678 |
| | | | | | | |
| | | | | | | |
Counsel to the Fund
Stradley Ronon Stevens & Young, LLP
2600 One Commerce Square Philadelphia, PA 19103 | | Counsel to the Independent Trustees
Kramer, Levin, Naftalis & Frankel LLP 1177 Avenue of the Americas
New York, NY 10036-2714 | | Transfer Agent
Invesco Investment Services, Inc. 11 Greenway Plaza, Suite 2500 Houston, TX 77046-1173 | | Custodian
State Street Bank and Trust Company
225 Franklin
Boston, MA 02110-2801 |
T-4 Invesco Emerging Markets Equity Fund
Invesco mailing information
Send general correspondence to Invesco Investment Services, Inc., P.O. Box 219078, Kansas City, MO 64121-9078.
Invesco privacy policy
You share personal and financial information with us that is necessary for your transactions and your account records. We take very seriously the obligation to keep that information confidential and private.
Invesco collects nonpublic personal information about you from account applications or other forms you complete and from your transactions with us or our affiliates. We do not disclose information about you or our former customers to service providers or other third parties except to the extent necessary to service your account and in other limited circumstances as permitted by law. For example, we use this information to facilitate the delivery of transaction confirmations, financial reports, prospectuses and tax forms.
Even within Invesco, only people involved in the servicing of your accounts and compliance monitoring have access to your information. To ensure the highest level of confidentiality and security, Invesco maintains physical, electronic and procedural safeguards that meet or exceed federal standards. Special measures, such as data encryption and authentication, apply to your communications with us on our website. More detail is available to you at invesco.com/privacy.
Important notice regarding delivery of security holder documents
To reduce Fund expenses, only one copy of most shareholder documents may be mailed to shareholders with multiple accounts at the same address (Householding). Mailing of your shareholder documents may be householded indefinitely unless you instruct us otherwise. If you do not want the mailing of these documents to be combined with those for other members of your household, please contact Invesco Investment Services, Inc. at 800 959 4246 or contact your financial institution. We will begin sending you individual copies for each account within 30 days after receiving your request.
Fund holdings and proxy voting information
The Fund provides a complete list of its holdings four times in each fiscal year, at the quarter-ends. For the second and fourth quarters, the lists appear in the Fund’s semiannual and annual reports to shareholders. For the first and third quarters, the Fund files the lists with the Securities and Exchange Commission (SEC) on Form N-Q. The most recent list of portfolio holdings is available at invesco.com/completeqtrholdings. Shareholders can also look up the Fund’s Forms N-Q on the SEC website at sec.gov. Copies of the Fund’s Forms N-Q may be reviewed and copied at the SEC Public Reference Room in Washington, D.C. You can obtain information on the operation of the Public Reference Room, including information about duplicating fee charges, by calling 202 551 8090 or 800 732 0330, or by electronic request at the following email address: publicinfo@sec.gov. The SEC file numbers for the Fund are 811-05426 and 033-19338.
A description of the policies and procedures that the Fund uses to determine how to vote proxies relating to portfolio securities is available without charge, upon request, from our Client Services department at 800 959 4246 or at invesco.com/proxyguidelines. The information is also available on the SEC website, sec.gov.
Information regarding how the Fund voted proxies related to its portfolio securities during the 12 months ended June 30, 2011, is available at invesco.com/proxysearch. The information is also available on the SEC website, sec.gov.
Invesco Advisers, Inc. is an investment adviser; it provides investment advisory services to individual and institutional clients and does not sell securities. Invesco Distributors, Inc. is the U.S. distributor for Invesco Ltd.’s retail mutual funds, exchange-traded funds and institutional money market funds. Both are wholly owned, indirect subsidiaries of Invesco Ltd.
| | | | |
| | | | | |
| | | | | |
| | | EME-AR-1 | | Invesco Distributors, Inc. |
| | |
| Annual Report to Shareholders | | October 31, 2011 |
Invesco Emerging Market Local Currency
Debt FundNasdaq:
A: IAEMX § B: IBEMX § C: ICEMX § R: IREMX § Y: IYEMX § Institutional: IIEMX
| | | |
| |
| 2 | | Letters to Shareholders |
| 4 | | Performance Summary |
| 4 | | Management Discussion |
| 6 | | Long-Term Fund Performance |
| 8 | | Supplemental Information |
| 9 | | Schedule of Investments |
| 11 | | Financial Statements |
| 14 | | Notes to Financial Statements |
| 21 | | Financial Highlights |
| 22 | | Auditor’s Report |
| 23 | | Fund Expenses |
| 24 | | Approval of Investment Advisory and Sub-Advisory Agreements |
| 26 | | Tax Information |
| T-1 | | Trustees and Officers |
Letters to Shareholders

Philip Taylor
Dear Shareholders:
Enclosed is important information about your Fund and its performance. I encourage you to read this report to learn more about your Fund’s short- and long-term performance and its holdings as of the close of the reporting period. This report also includes useful information about your Fund’s management team and a discussion of how your Fund was managed during the reporting period.
Investors are likely to confront both opportunities and challenges in 2012 – just as we did in 2011. After all, changes in market sentiment never do investors the courtesy of announcing their impending arrival, and your goals and needs may have changed, requiring changes in your financial strategy.
That’s why the start of a new year is always a good time to catch up with your financial adviser. He or she can explain how your investments performed in the year just ended – how each performed individually, and more important, how they performed as a diversified portfolio. Of course, it’s important to remember that an investment’s long-term performance is more important than its short-term performance. Looking ahead to the new year and evaluating your individual situation, your financial adviser can provide valuable insight into whether your investments are still appropriate for your individual needs, goals and risk tolerance.
For current information about your Fund
In addition to meeting with your financial adviser to discuss your individual situation at the start of the new year, you also may find it helpful to stay abreast of market trends and developments. Doing so may provide reassurance in times of economic uncertainty and market volatility such as we saw in 2011 – and are likely to see again in 2012.
Invesco can help you stay informed about your investments and market trends. On our website, invesco.com/us, we provide timely market updates and commentary from many of our fund managers and other investment professionals. Also on our website, you can obtain information about your account at any hour of the day or night. I invite you to visit and explore the tools and information we offer at invesco.com/us.
Our commitment to investment excellence
As we’ve seen over the last several years, market conditions can change – often suddenly and dramatically. That’s one reason financial advisers typically advise their clients to be well diversified and to maintain a long-term investment focus. While diversification can’t guarantee a profit or protect against loss, it may cushion the impact of dramatic market moves. Maintaining a long-term investment focus for your long-term goals – financing your retirement or your children’s education, for example – may help you avoid making rash investment decisions based on short-term market swings.
Likewise, Invesco’s investment professionals maintain a long-term focus. Across our broad array of investment products, investment excellence is our ultimate goal. Each of our funds is managed by specialized teams of investment professionals, and as a company, we maintain a single focus – investment management – that allows our fund managers to concentrate on doing what they do best: managing your money.
Our funds are managed strictly according to their stated investment objectives and strategies, with robust risk oversight using consistent, repeatable investment processes that don’t change in response to short-term market events. This disciplined approach can’t guarantee a profit; no investment can do that, since all involve some measure of risk. But it can ensure that your money is managed the way we said it would be – according to your Fund’s objective and strategies.
Our adherence to stated investment objectives and strategies allows your financial adviser to build a diversified portfolio that meets your individual risk tolerance and financial goals. It also means that when your goals change, your financial adviser will be able to find an Invesco fund that’s appropriate for your needs.
Questions?
If you have questions about your account, please contact one of our client service representatives at 800 959 4246. If you have a general Invesco-related question or comment for me, I invite you to email me directly at phil@invesco.com.
All of us at Invesco look forward to serving your investment management needs for many years to come. Thank you for investing with us.
Sincerely,
Philip Taylor
Senior Managing Director, Invesco Ltd.
| | | |
| |
2 | | Invesco Emerging Market Local Currency Debt Fund |

Bruce Crockett
Dear Fellow Shareholders:
Although the world’s economies are gradually recovering from the financial crisis, it has not been a smooth path. Unrest in the Middle East, persistently weak job and housing markets in the U.S. and continued government balance sheet repair in Europe are contributing to a slow, labored march toward global recovery.
In this environment, investors face risks that could make it more difficult to achieve their long-term financial goals – a secure retirement, home ownership, a child’s college education. Although the markets are complex and dynamic, there are ways to simplify the process and potentially increase your odds of achieving your goals. The best approach is to create a solid financial plan that helps you save and invest in ways that anticipate your needs over the long term.
Your financial adviser can help you define your financial plan, develop an appropriate investment strategy and put you in a better position to achieve your financial goals over the long term. This can take some of the guesswork out of the process and help you make thoughtful investments. Your financial adviser also can help you better understand your tolerance for risk, so that your investment approach lets you sleep at night while getting you closer to your goals. Lastly, your financial adviser can develop an asset allocation strategy that seeks to balance your investment approach, providing some protection against a decline in the markets while allowing you to participate in rising markets. Invesco calls this type of approach “intentional investing.” It means thinking carefully, planning thoughtfully and acting deliberately.
While no investment can guarantee favorable returns, your Board remains committed to managing costs and enhancing the performance of Invesco’s funds as part of our Investor First orientation. We continue to oversee the funds with the same strong sense of responsibility for your money and your continued trust that we’ve always maintained.
Thanks to the approval of our fund shareholders, Invesco has made great progress in realigning our U.S. mutual fund product line following our acquisition of Morgan Stanley’s retail asset management business, including Van Kampen Investments. When completed, the realignment will reduce overlap in the product lineup, enhance efficiency across our product line and build a solid foundation for further growth to meet client and shareholder needs. I would like to thank those of you who voted your proxy, and I hope our shareholders haven’t been too inconvenienced by the process.
As always, please contact me at bruce@brucecrockett.com with any questions or concerns you may have. On behalf of your Board, we look forward to continuing to represent your interests and serving your needs.
Sincerely,
Bruce L. Crockett
Independent Chair
Invesco Funds Board of Trustees
| | | |
| |
3 | | Invesco Emerging Market Local Currency Debt Fund |
Management’s Discussion of Fund Performance
Performance summary
For the fiscal year ended October 31, 2011, Class A shares of Invesco Emerging Market Local Currency Debt Fund, at net asset value (NAV), returned 0.44%, underperforming the JP Morgan GBI-Emerging Markets Global Diversified Index, the Fund’s broad market/style-specific index.
Your Fund’s long-term performance appears later in this report.
Fund vs. Indexes
Total returns, 10/31/10 to 10/31/11, at net asset value (NAV). Performance shown does not include applicable contingent deferred sales charges (CDSC) or front-end sales charges, which would have reduced performance.
| | | | | |
|
| Class A Shares | | | 0.44 | % |
| |
| Class B Shares | | | -0.33 | |
| |
| Class C Shares | | | -0.33 | |
| |
| Class R Shares | | | 0.09 | |
| |
| Class Y Shares | | | 0.69 | |
| |
| Institutional Class Shares | | | 0.68 | |
| |
JP Morgan GBI-Emerging Markets Global Diversified Index▼
(Broad Market/Style-Specific Index) | | | 1.53 | |
| |
Lipper Emerging Markets Debt Funds Index■ (Peer Group Index) | | | 1.40 | |
| |
Source(s): ▼Invesco, Bloomberg L.P.; ■Invesco, Lipper Inc. | | | | |
How we invest
We invest primarily in debt securities denominated in the currencies of emerging market countries. The debt securities in which the Fund primarily invests include sovereign, quasi-sovereign, corporate and supranational bonds. Quasi-sovereign debt securities are debt securities either explicitly guaranteed by a foreign government or whose majority shareholder is a foreign government. Supranational bonds are bonds issued by an international organization designated or supported by two or more government entities and designed to promote economic reconstruction, development or international banking institutions. Derivatives in which the Fund primarily invests include forward foreign exchange contracts and interest rate swap agreements. The Fund at times will also invest in options.
While the Fund anticipates being largely invested in investment grade securities, the Fund may invest up to
100% of its total assets in securities considered to be non-investment grade (junk bonds).
In making investment decisions, we make an initial assessment of the global economic environment, which provides the context for our sovereign and local currencies outlook, positioning relative to the economic cycle and the level of fundamental risk targeted within the Fund. We conduct sovereign debt and currency analysis using bottom-up fundamental analysis of the macroeconomic environment of each country, political analysis, appraisals of market supply and demand dynamics, as well as other factors. We then make a forward-looking assessment for each country’s fixed income securities and currency. Securities are selected for inclusion based on the perceived value of individual securities relative to alternatives, duration and yield curve positioning given the interest rate outlook, credit and
currency opportunities and an effort to achieve appropriate diversification.
We consider selling securities when:
| n | | The foreign exchange and interest rate outlook is no longer consistent with the original investment thesis. |
| |
| n | | The issue has met or exceeded its foreign exchange and interest rate objectives. |
| |
| n | | There are more attractive investment alternatives in the market. |
Market conditions and your Fund
Global markets were extremely volatile during the reporting period. The markets finished 2010 on an upward trend that extended into early 2011 as investor sentiment remained relatively bullish. However, volatility significantly increased in the first quarter of 2011 due to turmoil in the Middle East and an earthquake and tsunami in Japan. In August, global equity and bond markets sold off precipitously due to concerns surrounding the European sovereign debt crisis and the continued budget standoff in the U.S., which eventually led to a U.S. credit rating downgrade by ratings agency Standard & Poor’s. This prompted concerns of a “double-dip” recession, and investors’ fears carried over into September, driving a sell-off of all risky assets. Nevertheless, markets rebounded in October on hopes that European leaders would make progress in resolving the region’s debt problems.
Emerging markets (EM) local currency bond performance (as measured by the JP Morgan GBI-Emerging Markets Global Diversified Index) was positive, with a return of 1.53% for the 12 months ended October 31, 2011. EM local currency bonds remained resilient in the face of various market shocks in the first half of 2011, but fell victim to risk aversion in late August as the European debt crisis hit global risk assets. September was the worst month for EM local currency
Portfolio Composition
By industry
| | | | | |
|
| Sovereign Debt | | | 58.1 | % |
| |
| Diversified Banks | | | 20.8 | |
| |
| Investment Banking & Brokerage | | | 7.3 | |
| |
| Electric Utilities | | | 3.2 | |
| |
| Other Diversified Financial Services | | | 2.8 | |
| |
| Diversified Chemicals | | | 1.9 | |
| |
| Integrated Telecommunication Services | | | 1.0 | |
| |
Money Market Funds
Plus Other Assets Less Liabilities | | | 4.9 | |
Top 10 Fixed Income Issuers*
| | | | | | | | | |
|
| | 1. | | | Malaysia Government | | | 9.2 | % |
| |
| | 2. | | | Poland Government | | | 8.8 | |
| |
| | 3. | | | South Africa Government | | | 5.8 | |
| |
| | 4. | | | Brazil Notas do Tesouro Nacional | | | 5.7 | |
| |
| | 5. | | | Mexican Bonos | | | 4.7 | |
| |
| | 6. | | | Thailand Government | | | 4.4 | |
| |
| | 7. | | | Barclays Bank PLC | | | 4.2 | |
| |
| | 8. | | | Turkey Government | | | 4.1 | |
| |
| | 9. | | | Russia Foreign Bond | | | 4.0 | |
| |
| | 10. | | | Citigroup Funding Inc. | | | 3.9 | |
Top Five Countries
| | | | | | | | | |
|
| | 1. | | | Brazil | | | 11.0 | % |
| |
| | 2. | | | United States | | | 10.1 | |
| |
| | 3. | | | Supranational | | | 9.2 | |
| |
| | 4. | | | Malaysia | | | 9.2 | |
| |
| | 5. | | | Poland | | | 8.8 | |
| | | | | | | | | |
| |
| Total Net Assets | | $47.3 million |
| | | | | | | | | |
| Total Number of Holdings* | | | 42 |
The Fund’s holdings are subject to change, and there is no assurance that the Fund will continue to hold any particular security.
*Excluding money market fund holdings.
| | | |
|
4 | | Invesco Emerging Market Local Currency Debt Fund |
bonds since the 2008 collapse of Lehman Brothers, causing returns to turn negative for the first 11 months of the fiscal year. However, EM local currency bonds rallied in October, bringing their performance back to positive territory for the fiscal year.
While EM securities took a hit due to fears over the European debt crisis, fundamentals in EM economies remained strong. The World Economic Outlook survey, conducted by the International Monetary Fund, projected that the output of emerging economies will expand at rates of 6.4% and 6.1% in 2011 and 2012, respectively, while developed economies will grow at a slower 1.6% and 1.9% pace.1 Furthermore, according to IMF year-end estimates, EM debt ratios are one-third the level of developed countries, and EM central banks have built up foreign exchange revenues of $7.6 trillion.”1 Also, the asset class has seen improved credit ratings as all three major JP Morgan EM debt indexes are investment-grade rated.
As the markets were very volatile, many local-currency bonds both helped and hurt the Fund’s relative performance at different points of the reporting period. At the end of 2010, the Fund’s exposure to Eastern Europe – in particular, Hungary and Turkey – proved beneficial to performance. However, Hungary and Turkey became the main detractors from relative performance in early 2011. We pared the Fund’s exposure to Eastern Europe due to concerns over the European debt crisis, and subsequently our underweight exposure to Hungary and Turkey became the top contributors to relative performance during the latter part of the reporting period. The Fund’s underweight exposure to Thailand, although beneficial in the second quarter of 2011, detracted from performance in the third quarter as the Thai baht was a lower-volatility currency. Over the full reporting period, the Fund was hurt by its positioning in Latin America, and in particular Brazil, as well as by its bond selection in South Africa. The Fund’s tactical positioning in Peru proved to be beneficial for its relative performance.
The Fund also invested in credit linked notes during the reporting period; this contributed to the Fund’s relative performance. Credit linked notes are securities structured to reflect the market returns and risks of a specific reference asset. We use credit linked notes to gain exposure to certain local debt markets, such as Indonesia, in which direct investments
may be difficult due to government restrictions and/or tax issues.
We thank you for your investment in Invesco Emerging Market Local Currency Debt Fund.
1 Source: International Monetary Fund
The views and opinions expressed in management’s discussion of Fund performance are those of Invesco Advisers, Inc. These views and opinions are subject to change at any time based on factors such as market and economic conditions. These views and opinions may not be relied upon as investment advice or recommendations, or as an offer for a particular security. The information is not a complete analysis of every aspect of any market, country, industry, security or the Fund. Statements of fact are from sources considered reliable, but Invesco Advisers, Inc. makes no representation or warranty as to their completeness or accuracy. Although historical performance is no guarantee of future results, these insights may help you understand our investment management philosophy.
See important Fund and, if applicable, index disclosures later in this report.
Claudia Calich
Portfolio manager, is lead manager of Invesco Emerging Market Local Currency Debt Fund. She joined Invesco in 2004 and leads Invesco Fixed Income’s emerging markets team. Ms. Calich graduated with honors with a B.A. in economics from Susquehanna University. She also earned an M.A. in international economics from the International University of Japan in Niigata.
Jack Deino
Chartered Financial Analyst, portfolio manager, is manager of Invesco Emerging Market Local Currency Debt Fund. He joined Invesco in 2006. Mr. Deino earned a B.A. in Latin American studies from The University of Texas.
Eric Lindenbaum
Portfolio manager, is manager of Invesco Emerging Market Local Currency Debt Fund. He joined Invesco in 2004. Mr. Lindenbaum earned a B.A. from The Johns Hopkins University. He earned an M.B.A. in finance and a Masters of International Affairs degree in economics from Columbia University.
| | | |
| |
5 | | Invesco Emerging Market Local Currency Debt Fund |
Your Fund’s Long-Term Performance
Results of a $10,000 Investment – Oldest Share Classes since Inception
Fund data from 6/16/10, index data from 6/30/10
Past performance cannot guarantee comparable future results.
The data shown in the chart include reinvested distributions, applicable sales charges and Fund expenses including management fees. Results for Class B shares are calculated as if a hypothetical
shareholder had liquidated his entire investment in the Fund at the close of the reporting period and paid the contingent deferred sales charges, if applicable. Index results include reinvested dividends, but they do not reflect sales charges. Performance of the peer group,
if applicable, reflects fund expenses and management fees; performance of a market index does not. Performance shown in the chart and table(s) does not reflect deduction of taxes a shareholder would pay on Fund distributions or sale of Fund shares.
continued from page 8
| | | be unable to qualify as a regulated investment company for one or more years. In this event, the Fund’s Board may authorize a significant change in investment strategy or Fund liquidation. |
About indexes used in this report
| n | | The JP Morgan GBI-Emerging Markets Global Diversified Index is a comprehensive global and local emerging markets index and consists of liquid, fixed rate, domestic-currency government bonds. |
| |
| n | | The Lipper Emerging Markets Debt Funds Index is an unmanaged index considered representative of emerging market debt funds tracked by Lipper. |
| |
| n | | The Fund is not managed to track the performance of any particular index, including the index(es) defined here, and consequently, the performance of the Fund may deviate significantly from the performance of the index(es). |
| n | | A direct investment cannot be made in an index. Unless otherwise indicated, index results include reinvested dividends, and they do not reflect sales charges. Performance of the peer group, if applicable, reflects fund expenses; performance of a market index does not. |
Other information
| n | | The Chartered Financial Analyst® (CFA®) designation is globally recognized and attests to a charterholder’s success in a rigorous and comprehensive study program in the field of investment management and research analysis. |
| |
| n | | The returns shown in management’s discussion of Fund performance are based on net asset values calculated for shareholder transactions. Generally accepted accounting principles require adjustments to be made to the net assets of the Fund at period end for financial reporting purposes, and as such, the net asset values for |
| | | shareholder transactions and the returns based on those net asset values may differ from the net asset values and returns reported in the Financial Highlights. |
| |
| n | | Industry classifications used in this report are generally according to the Global Industry Classification Standard, which was developed by and is the exclusive property and a service mark of MSCI Inc. and Standard & Poor’s. |
| | | |
| |
6 | | Invesco Emerging Market Local Currency Debt Fund |
Average Annual Total Returns
As of 10/31/11, including maximum applicable sales charges
| | | | | | | | | |
|
| Class A Shares |
| |
| Inception (6/16/10) | | | 5.75 | % |
| |
| | 1 | | | Year | | | -4.30 | |
| |
| | | | | | | | | |
| Class B Shares |
| |
| Inception (6/16/10) | | | 5.87 | % |
| |
| | 1 | | | Year | | | -4.99 | |
| |
| | | | | | | | | |
| Class C Shares |
| |
| Inception (6/16/10) | | | 8.70 | % |
| |
| | 1 | | | Year | | | -1.26 | |
| |
| | | | | | | | | |
| Class R Shares |
| |
| Inception (6/16/10) | | | 9.23 | % |
| |
| | 1 | | | Year | | | 0.09 | |
| | | | | | | | | |
| Class Y Shares |
| |
| Inception (6/16/10) | | | 9.83 | % |
| |
| | 1 | | | Year | | | 0.69 | |
| |
| | | | | | | | | |
| Institutional Class Shares |
| |
| Inception (6/16/10) | | | 9.76 | % |
| |
| | 1 | | | Year | | | 0.68 | |
The performance data quoted represent past performance and cannot guarantee comparable future results; current performance may be lower or higher. Please visit invesco.com/performance for the most recent month-end performance. Performance figures reflect reinvested distributions, changes in net asset value and the effect of the maximum sales charge unless otherwise stated. Investment return and principal value will fluctuate so that you may have a gain or loss when you sell shares.
The net annual Fund operating expense ratio set forth in the most recent Fund prospectus as of the date
Average Annual Total Returns
As of 9/30/11, the most recent calendar quarter-end, including maximum applicable sales charges
| | | | | | | | | |
|
| Class A Shares |
| |
| Inception (6/16/10) | | | 1.73 | % |
| |
| | 1 | | | Year | | | -8.03 | |
| |
| | | | | | | | | |
| Class B Shares |
| |
| Inception (6/16/10) | | | 1.85 | % |
| |
| | 1 | | | Year | | | -8.64 | |
| |
| | | | | | | | | |
| Class C Shares |
| |
| Inception (6/16/10) | | | 4.88 | % |
| |
| | 1 | | | Year | | | -5.05 | |
| |
| | | | | | | | | |
| Class R Shares |
| |
| Inception (6/16/10) | | | 5.39 | % |
| |
| | 1 | | | Year | | | -3.67 | |
| |
| | | | | | | | | |
| Class Y Shares |
| |
| Inception (6/16/10) | | | 5.98 | % |
| |
| | 1 | | | Year | | | -3.09 | |
| |
| | | | | | | | | |
| Institutional Class Shares |
| |
| Inception (6/16/10) | | | 5.90 | % |
| |
| | 1 | | | Year | | | -3.18 | |
of this report for Class A, Class B, Class C, Class R, Class Y and Institutional Class shares was 1.24%, 1.99%, 1.99%, 1.49%, 0.99% and 0.99%, respectively.1 The total annual Fund operating expense ratio set forth in the most recent Fund prospectus as of the date of this report for Class A, Class B, Class C, Class R, Class Y and Institutional Class shares was 1.67%, 2.42%, 2.42%, 1.92%, 1.42% and 1.20%, respectively. The expense ratios presented above may vary from the expense ratios presented in other sections of this report that are based on expenses incurred during the period covered by this report.
Class A share performance reflects the maximum 4.75% sales charge, and Class B and Class C share performance reflects the applicable contingent deferred sales charge (CDSC) for the period involved. The CDSC on Class B shares declines from 5% beginning at the time of purchase to 0% at the beginning of the seventh year. The CDSC on Class C shares is 1% for the first year after purchase. Class R, Y and Institutional Class shares do not have a front-end sales charge or a CDSC; therefore, performance is at net asset value.
The performance of the Fund’s share classes will differ primarily due to different sales charge structures and class expenses.
Had the adviser not waived fees and/or expenses, performance would have been lower.
A redemption fee of 2% is imposed on certain redemptions or exchanges out of the Fund within 31 days of purchase. Exceptions to the redemption fee are listed in the Fund’s prospectus. Effective January 1, 2012, after the close of the reporting period, the Fund will eliminate the redemption fee, if applicable, assessed on shares of the Fund redeemed or exchanged within 31 days of purchase.
| 1 | | Total annual Fund operating expenses after any contractual fee waivers and/or expense reimbursements by the adviser in effect through at least February 28, 2012. See current prospectus for more information. |
| | | |
| |
7 | | Invesco Emerging Market Local Currency Debt Fund |
Invesco Emerging Market Local Currency Debt Fund’s investment objective is to provide total return.
| n | | Unless otherwise stated, information presented in this report is as of October 31, 2011, and is based on total net assets. |
| |
| n | | Unless otherwise noted, all data provided by Invesco. |
| |
| n | | To access your Fund’s reports/prospectus, visit invesco.com/fundreports. |
About share classes
| n | | Class B shares may not be purchased or acquired by exchange from share classes other than Class B shares. Please see the prospectus for more information. |
| |
| n | | Class R shares are available only to certain retirement plans. Please see the prospectus for more information. |
| |
| n | | Class Y shares are available to only certain investors. Please see the prospectus for more information. |
| |
| n | | Institutional Class shares are offered exclusively to institutional investors, including defined contribution plans that meet certain criteria. Please see the prospectus for more information. |
Principal risks of investing in the Fund
| n | | Active trading risk. The Fund engages in frequent trading of portfolio securities. Active trading results in added expenses and may result in a lower return and increased tax liability. |
| |
| n | | Counterparty risk. Individually negotiated or over-the-counter derivatives are also subject to counterparty risk, which is the risk that the other party to the contract (such as a futures contract or swap agreement) will not fulfill its contractual obligations, which may cause losses or additional costs to the Fund. |
| |
| n | | Credit risk. The issuer of instruments in which the Fund invests may be unable to meet interest and/or principal payments, thereby causing its instruments to decrease in value and lowering the issuer’s credit rating. |
| |
| n | | Currency/exchange rate risk. The dollar value of the Fund’s foreign investments will be affected by changes in the exchange rates between the dollar and the currencies in which those investments are traded. |
| |
| n | | Derivatives risk. Derivatives may be more difficult to purchase, sell or value than other investments and may be subject to market, interest rate, credit, leverage, counterparty and management risks. A fund investing in a |
| | | derivative could lose more than the cash amount invested or incur higher taxes. Over-the-counter derivatives are also subject to counterparty risk, which is the risk that the other party to the contract will not fulfill its contractual obligation to complete the transaction with the Fund. |
| |
| n | | Developing markets securities risk. Securities issued by foreign companies and governments located in developing countries may be affected more negatively by inflation, devaluation of their currencies, higher transaction costs, delays in settlement, adverse political developments, the introduction of capital controls, withholding taxes, nationalization of private assets, expropriation, social unrest, war or lack of timely information than those in developed countries. |
| |
| n | | Foreign securities risk. The Fund’s foreign investments may be affected by changes in a foreign country’s exchange rates; political and social instability; changes in economic or taxation policies; difficulties when enforcing obligations; decreased liquidity; and increased volatility. Foreign companies may be subject to less regulation resulting in less publicly available information about the companies. |
| |
| n | | High yield bond (junk bond) risk. Junk bonds involve a greater risk of default or price changes due to changes in the credit quality of the issuer. The values of junk bonds fluctuate more than those of high-quality bonds in response to company, political, regulatory or economic developments. Values of junk bonds can decline significantly over short periods of time. |
| |
| n | | Interest rate risk. Interest rate risk refers to the risk that bond prices generally fall as interest rates rise; conversely, bond prices generally rise as interest rates fall. Specific bonds differ in their sensitivity to changes in interest rates depending on their individual characteristics, including duration. |
| |
| n | | Leverage risk. Leverage exists when the Fund purchases or sells an instrument or enters into a transaction |
| | | without investing cash in an amount equal to the full economic exposure of the instrument or transaction and the Fund could lose more than it invested. Leverage created from borrowing or certain types of transactions or instruments, including derivatives, may impair the Fund’s liquidity, cause it to liquidate positions at an unfavorable time, increase volatility or otherwise not achieve its intended objective. |
| |
| n | | Management risk. The investment techniques and risk analysis used by the Fund’s portfolio managers may not produce the desired results. |
| |
| n | | Market risk. The prices of and the income generated by the Fund’s securities may decline in response to, among other things, investor sentiment; general economic and market conditions; regional or global instability; and currency and interest rate fluctuations. |
| |
| n | | Non-diversification risk. The Fund is non-diversified and can invest a greater portion of its assets in a single issuer. A change in the value of the issuer could affect the value of the Fund more than if it was a diversified fund. |
| |
| n | | Options risk. A decision as to whether, when and how to use options involves the exercise of skill and judgment and even a well conceived option transaction may be unsuccessful because of market behavior or unexpected events. The prices of options can be highly volatile and the use of options can lower total returns. |
| |
| n | | Reinvestment risk. Reinvestment risk is the risk that a bond’s cash flows (coupon income and principal repayment) will be reinvested at an interest rate below that on the original bond. |
| |
| n | | Swaps risk. Swaps are subject to credit risk and counterparty risk. |
| |
| n | | Tax risk. If the U.S. Treasury Department were to exercise its authority to issue regulations that exclude from the definition of “qualifying income” foreign currency gains not directly related to the Fund’s business of investing in securities, the Fund may |
| |
continued on page 6 |
This report must be accompanied or preceded by a currently effective Fund prospectus, which contains more complete information, including sales charges and expenses. Investors should read it carefully before investing.
NOT FDIC INSURED | MAY LOSE VALUE | NO BANK GUARANTEE
Fund Nasdaq Symbols
| | | |
|
| Class A Shares | | IAEMX |
| Class B Shares | | IBEMX |
| Class C Shares | | ICEMX |
| Class R Shares | | IREMX |
| Class Y Shares | | IYEMX |
| Institutional Class Shares | | IIEMX |
| | | |
|
8 | | Invesco Emerging Market Local Currency Debt Fund |
Schedule of Investments
October 31, 2011
| | | | | | | | | |
| | | Principal
| | |
| | | Amount | | Value |
| |
Non U.S. Dollar Denominated Bonds & Notes–94.95%(a)
|
Brazil–10.83%
| | | | |
Banco Safra S.A., Sr. Unsec. Notes, 10.25%, 08/08/16(b) | | BRL | 1,400,000 | | | $ | 791,514 | |
| |
Brasil Telecom S.A., Sr. Unsec. Notes, 9.75%, 09/15/16(b) | | BRL | 860,000 | | | | 493,734 | |
| |
Brazil Notas do Tesouro Nacional,
Series F, Unsub. Notes, 10.00%, 01/01/17 | | BRL | 1,100,000 | | | | 605,367 | |
| |
Notes, 10.00%, 01/01/21 | | BRL | 3,700,000 | | | | 1,971,401 | |
| |
Itau Unibanco Holding S.A., Sr. Unsec. Notes, 10.50%, 11/23/15(b) | | BRL | 2,050,000 | | | | 1,260,564 | |
| |
| | | | | | | | 5,122,580 | |
| |
Chile–1.53%
| | | | |
| Chile Government, Sr. Unsec. Global Notes, 5.50%, 08/05/20 | | CLP | 334,000,000 | | | | 721,384 | |
| |
Colombia–3.63%
| | | | |
Colombia Government, Sr. Unsec. Global Bonds,
7.75%, 04/14/21 | | COP | 1,200,000,000 | | | | 758,134 | |
| |
| 9.85%, 06/28/27 | | COP | 530,000,000 | | | | 402,306 | |
| |
Empresas Publicas de Medellin, Sr. Unsec. Bonds, 8.38%, 02/01/21(b) | | COP | 1,000,000,000 | | | | 555,004 | |
| |
| | | | | | | | 1,715,444 | |
| |
Germany–1.09%
| | | | |
| Kreditanstalt fuer Wiederaufbau, Tranche 1, Sr. Unsec. Gtd. Medium-Term Euro Notes, 14.50%, 01/26/17 | | TRY | 720,000 | | | | 513,879 | |
| |
Hungary–3.24%
| | | | |
| Hungary Government, Series 17/B, Bonds, 6.75%, 02/24/17 | | HUF | 348,500,000 | | | | 1,533,291 | |
| |
Ireland–2.04%
| | | | |
| RusHydro Finance Ltd., Sr. Sec. Medium-Term Euro Loan Participation Notes, 7.88%, 10/28/15 | | RUB | 30,000,000 | | | | 963,736 | |
| |
Luxembourg–2.14%
| | | | |
| Russian Agricultural Bank OJSC Via RSHB Capital S.A, Sr. Unsec. Euro Loan Participation Notes, 7.50%, 03/25/13 | | RUB | 30,600,000 | | | | 1,013,366 | |
| |
Malaysia–9.17%
| | | | |
Malaysia Government,
Series 0111, Bonds,
4.16%, 07/15/21 | | MYR | 6,781,000 | | | | 2,287,963 | |
| |
Series 0110, Sr. Unsec. Bonds, 3.84%, 08/12/15 | | MYR | 1,000,000 | | | | 332,607 | |
| |
Series 0902, Sr. Unsec. Bonds, 4.38%, 11/29/19 | | MYR | 5,000,000 | | | | 1,713,282 | |
| |
| | | | | | | | 4,333,852 | |
| |
Mali–1.93%
| | | | |
| Sinochem Offshore Capital Co. Ltd., Sr. Unsec. Gtd. Euro Notes, 1.80%, 01/18/14 | | CNY | 6,000,000 | | | | 910,305 | |
| |
Mexico–4.73%
| | | | |
| Mexican Bonos, Series M20, Bonds, 10.00%, 12/05/24 | | MXN | 22,700,000 | | | | 2,236,648 | |
| |
Peru–2.32%
| | | | |
Peruvian Government, Sr. Unsec. Notes, 8.20%, 08/12/26(b) | | PEN | 2,460,000 | | | | 1,095,171 | |
| |
Philippines–0.96%
| | | | |
| Philippine Government, Sr. Unsec. Global Notes, 4.95%, 01/15/21 | | PHP | 20,000,000 | | | | 452,423 | |
| |
Poland–8.84%
| | | | |
Poland Government,
Series DS1015, Bonds,
6.25%, 10/24/15 | | PLN | 6,125,000 | | | | 2,020,408 | |
| |
Series DS1017, Bonds,
5.25%, 10/25/17 | | PLN | 6,855,000 | | | | 2,158,982 | |
| |
| | | | | | | | 4,179,390 | |
| |
Russia–3.97%
| | | | |
Russia Foreign Bond, REGS, Sr. Unsec. Euro Bonds, 7.85%, 03/10/18(b) | | RUB | 55,000,000 | | | | 1,879,152 | |
| |
South Africa–5.82%
| | | | |
South Africa Government,
Series R186, Bonds,
10.50%, 12/21/26 | | ZAR | 9,370,000 | | | | 1,406,184 | |
| |
Series R208, Bonds,
6.75%, 03/31/21 | | ZAR | 11,475,000 | | | | 1,344,201 | |
| |
| | | | | | | | 2,750,385 | |
| |
South Korea–0.68%
| | | | |
Export-Import Bank of Korea, Sr. Unsec. Notes, 8.30%, 03/15/14(b) | | IDR | 2,850,000,000 | | | | 323,116 | |
| |
| | | | | | | | | |
| | | | | | | | | |
See accompanying Notes to Financial Statements which are an integral part of the financial statements.
9 Invesco Emerging Market Local Currency Debt Fund
| | | | | | | | | |
| | | Principal
| | |
| | | Amount | | Value |
| |
Supranational–9.19%
| | | | |
Asian Development Bank, Series 421-00-2, Sr. Unsec. Medium-Term Euro Notes, 9.00%, 06/27/13 | | ZAR | 8,950,000 | | | $ | 1,170,243 | |
| |
European Bank for Reconstruction & Development,
Sr. Unsec. Medium-Term Euro Notes, 0.00%, 12/31/18(c) | | ZAR | 5,600,000 | | | | 407,396 | |
| |
Sr. Unsec. Medium-Term Global Notes, 4.80%, 09/20/15 | | PHP | 7,000,000 | | | | 174,389 | |
| |
| 8.00%, 02/18/13 | | ZAR | 1,330,000 | | | | 172,112 | |
| |
| European Investment Bank, Series 1629/08, Sr. Unsec. Medium-Term Euro Notes, | | | | | | | | |
| 6.50%, 01/05/15 | | HUF | 73,000,000 | | | | 341,160 | |
| |
| 9.63%, 04/01/15 | | TRY | 2,060,000 | | | | 1,209,230 | |
| |
| International Bank for Reconstruction & Development, Sr. Unsec. Medium-Term Euro Notes, 10.00%, 03/02/17 | | TRY | 1,400,000 | | | | 868,870 | |
| |
| | | | | | | | 4,343,400 | |
| |
Thailand–4.40%
| | | | |
Thailand Government, Sr. Unsec. Bonds,
3.88%, 06/13/19 | | THB | 6,875,000 | | | | 234,180 | |
| |
| 4.13%, 11/18/16 | | THB | 54,300,000 | | | | 1,846,445 | |
| |
| | | | | | | | 2,080,625 | |
| |
Turkey–4.11%
| | | | |
Turkey Government, Bonds, 0.00%, 02/20/13(c) | | TRY | 1,555,000 | | | | 778,359 | |
| |
| 10.50%, 01/15/20 | | TRY | 680,000 | | | | 407,100 | |
| |
| 11.00%, 08/06/14 | | TRY | 1,290,000 | | | | 757,344 | |
| |
| | | | | | | | 1,942,803 | |
| |
United Kingdom–4.22%
| | | | |
| Barclays Bank PLC, Series FR52, Sr. Unsec. Medium-Term Euro Notes, 10.50%, 08/19/30 | | IDR | 13,200,000,000 | | | | 1,996,476 | |
| |
United States–10.11%
| | | | |
Citigroup Funding Inc., Sr. Unsec. Gtd. Medium-Term Euro Notes, 8.38%, 09/17/26(b) | | IDR | 14,000,000,000 | | | | 1,819,578 | |
| |
| General Electric Capital Corp., Sr. Unsec. Medium-Term Euro Notes, 8.87%, 06/02/18 | | MXN | 17,800,000 | | | | 1,315,939 | |
| |
| Morgan Stanley, Series G, Sr. Unsec. Medium-Term Euro Notes, 8.44%, 12/28/15 | | MXN | 20,000,000 | | | | 1,645,307 | |
| |
| | | | | | | | 4,780,824 | |
| |
| Total Non U.S. Dollar Denominated Bonds & Notes (Cost $45,916,219) | | | | | | | 44,888,250 | |
| |
| | | | | | | | | |
| | | Shares | | |
Money Market Funds–2.69%
|
Liquid Assets Portfolio–Institutional Class(d) | | | 635,350 | | | | 635,350 | |
| |
Premier Portfolio–Institutional Class(d) | | | 635,350 | | | | 635,350 | |
| |
| Total Money Market Funds (Cost $1,270,700) | | | | | | | 1,270,700 | |
| |
| TOTAL INVESTMENTS–97.64% (Cost $47,186,919) | | | | | | | 46,158,950 | |
| |
| OTHER ASSETS LESS LIABILITIES–2.36% | | | | | | | 1,117,479 | |
| |
| NET ASSETS–100.00% | | | | | | $ | 47,276,429 | |
| |
Investment Abbreviations:
| | | |
| BRL | | – Brazilian Real |
| CLP | | – Chilean Peso |
| CNY | | – Chinese Yuan |
| COP | | – Colombian Peso |
| Gtd. | | – Guaranteed |
| HUF | | – Hungary Forint |
| IDR | | – Indonesian Rupiah |
| MXN | | – Mexican Peso |
| MYR | | – Malaysian Ringgit |
| PEN | | – Peru Nuevo Sol |
| PHP | | – Philippines Peso |
| PLN | | – Poland Zloty |
| REGS | | – Regulation S |
| RUB | | – Russian Rouble |
| Sec. | | – Secured |
| Sr. | | – Senior |
| THB | | – Thai Baht |
| TRY | | – New Turkish Lira |
| Unsec. | | – Unsecured |
| ZAR | | – South African Rand |
Notes to Schedule of Investments:
| | |
| (a) | | Foreign denominated security. Principal amount is denominated in currency indicated. |
| (b) | | Security purchased or received in a transaction exempt from registration under the Securities Act of 1933, as amended. The security may be resold pursuant to an exemption from registration under the 1933 Act, typically to qualified institutional buyers. The aggregate value of these securities at October 31, 2011 was $8,217,833, which represented 17.38% of the Fund’s Net Assets. |
| (c) | | Zero coupon bond issued at a discount. |
| (d) | | The money market fund and the Fund are affiliated by having the same investment adviser. |
See accompanying Notes to Financial Statements which are an integral part of the financial statements.
10 Invesco Emerging Market Local Currency Debt Fund
Statement of Assets and Liabilities
October 31, 2011
| | | | | |
Assets:
|
| Investments, at value (Cost $45,916,219) | | $ | 44,888,250 | |
| |
| Investments in affiliated money market funds, at value and cost | | | 1,270,700 | |
| |
| Total investments, at value (Cost $47,186,919) | | | 46,158,950 | |
| |
| Foreign currencies, at value (Cost $409,838) | | | 410,315 | |
| |
| Receivable for: | | | | |
| Fund shares sold | | | 266,456 | |
| |
| Dividends and interest | | | 1,119,190 | |
| |
| Investment for trustee deferred compensation and retirement plans | | | 2,124 | |
| |
| Other assets | | | 19,957 | |
| |
| Total assets | | | 47,976,992 | |
| |
Liabilities:
|
| Payable for: | | | | |
| Investments purchased | | | 350,095 | |
| |
| Fund shares reacquired | | | 170,526 | |
| |
| Accrued fees to affiliates | | | 34,762 | |
| |
| Accrued other operating expenses | | | 141,837 | |
| |
| Trustee deferred compensation and retirement plans | | | 2,871 | |
| |
| Unrealized depreciation on swap agreements | | | 472 | |
| |
| Total liabilities | | | 700,563 | |
| |
| Net assets applicable to shares outstanding | | $ | 47,276,429 | |
| |
Net assets consist of:
|
| Shares of beneficial interest | | $ | 44,830,501 | |
| |
| Undistributed net investment income | | | 2,441,953 | |
| |
| Undistributed net realized gain | | | 1,088,487 | |
| |
| Unrealized appreciation (depreciation) | | | (1,084,512 | ) |
| |
| | | $ | 47,276,429 | |
| |
Net Assets:
|
| Class A | | $ | 12,886,424 | |
| |
| Class B | | $ | 842,609 | |
| |
| Class C | | $ | 3,078,667 | |
| |
| Class R | | $ | 385,720 | |
| |
| Class Y | | $ | 1,130,621 | |
| |
| Institutional Class | | $ | 28,952,388 | |
| |
Shares outstanding, $0.01 par value per share, with an unlimited number of shares authorized:
|
| Class A | | | 1,243,670 | |
| |
| Class B | | | 81,397 | |
| |
| Class C | | | 297,272 | |
| |
| Class R | | | 37,229 | |
| |
| Class Y | | | 109,067 | |
| |
| Institutional Class | | | 2,796,085 | |
| |
| Class A: | | | | |
| Net asset value per share | | $ | 10.36 | |
| |
| Maximum offering price per share | | | | |
| (Net asset value of $10.36 divided by 95.25%) | | $ | 10.88 | |
| |
| Class B: | | | | |
| Net asset value and offering price per share | | $ | 10.35 | |
| |
| Class C: | | | | |
| Net asset value and offering price per share | | $ | 10.36 | |
| |
| Class R: | | | | |
| Net asset value and offering price per share | | $ | 10.36 | |
| |
| Class Y: | | | | |
| Net asset value and offering price per share | | $ | 10.37 | |
| |
| Institutional Class: | | | | |
| Net asset value and offering price per share | | $ | 10.35 | |
| |
See accompanying Notes to Financial Statements which are an integral part of the financial statements.
11 Invesco Emerging Market Local Currency Debt Fund
Statement of Operations
For the year ended October 31, 2011
| | | | | |
Investment income:
|
| Interest | | $ | 2,850,113 | |
| |
| Dividends from affiliated money market funds | | | 2,619 | |
| |
| Total investment income | | | 2,852,732 | |
| |
Expenses:
|
| Advisory fees | | | 345,156 | |
| |
| Administrative services fees | | | 50,000 | |
| |
| Custodian fees | | | 38,123 | |
| |
| Distribution fees: | | | | |
| Class A | | | 19,857 | |
| |
| Class B | | | 6,663 | |
| |
| Class C | | | 14,414 | |
| |
| Class R | | | 411 | |
| |
| Transfer agent fees — A, B, C, R and Y | | | 27,388 | |
| |
| Transfer agent fees — Institutional | | | 591 | |
| |
| Trustees’ and officers’ fees and benefits | | | 16,243 | |
| |
| Registration and filing fees | | | 138,443 | |
| |
| Other | | | 40,405 | |
| |
| Total expenses | | | 697,694 | |
| |
| Less: Fees waived, expenses reimbursed and expense offset arrangement(s) | | | (204,176 | ) |
| |
| Net expenses | | | 493,518 | |
| |
| Net investment income | | | 2,359,214 | |
| |
Realized and unrealized gain (loss) from:
|
| Net realized gain (loss) from: | | | | |
| Investment securities | | | 3,536,764 | |
| |
| Foreign currencies | | | (224,521 | ) |
| |
| Foreign currency contracts | | | 14,183 | |
| |
| | | | 3,326,426 | |
| |
| Change in net unrealized appreciation (depreciation) of: | | | | |
| Investment securities | | | (6,716,378 | ) |
| |
| Foreign currencies | | | (111,458 | ) |
| |
| Swap agreements | | | (472 | ) |
| |
| | | | (6,828,308 | ) |
| |
| Net realized and unrealized gain (loss) | | | (3,501,882 | ) |
| |
| Net increase (decrease) in net assets resulting from operations | | $ | (1,142,668 | ) |
| |
See accompanying Notes to Financial Statements which are an integral part of the financial statements.
12 Invesco Emerging Market Local Currency Debt Fund
Statement of Changes in Net Assets
For the year ended October 31, 2011 and the period from June 16, 2010 (commencement date) through October 31, 2010
| | | | | | | | | |
| | | | | June 16, 2010
|
| | | | | (commencement
|
| | | | | date) through
|
| | | October 31,
| | October 31,
|
| | | 2011 | | 2010 |
| |
Operations:
|
| Net investment income | | $ | 2,359,214 | | | $ | 1,260,377 | |
| |
| Net realized gain | | | 3,326,426 | | | | 766,697 | |
| |
| Change in net unrealized appreciation (depreciation) | | | (6,828,308 | ) | | | 5,743,796 | |
| |
| Net increase (decrease) in net assets resulting from operations | | | (1,142,668 | ) | | | 7,770,870 | |
| |
Distributions to shareholders from net investment income:
|
| Class A | | | (355,179 | ) | | | (12,011 | ) |
| |
| Class B | | | (32,336 | ) | | | (3,450 | ) |
| |
| Class C | | | (57,061 | ) | | | (1,015 | ) |
| |
| Class R | | | (3,770 | ) | | | (305 | ) |
| |
| Class Y | | | (50,686 | ) | | | (1,924 | ) |
| |
| Institutional Class | | | (2,130,960 | ) | | | (1,028,892 | ) |
| |
| Total distributions from net investment income | | | (2,629,992 | ) | | | (1,047,597 | ) |
| |
Distributions to shareholders from net realized gains:
|
| Class A | | | (37,695 | ) | | | — | |
| |
| Class B | | | (8,132 | ) | | | — | |
| |
| Class C | | | (8,445 | ) | | | — | |
| |
| Class R | | | (837 | ) | | | — | |
| |
| Class Y | | | (9,604 | ) | | | — | |
| |
| Institutional Class | | | (476,938 | ) | | | — | |
| |
| Total distributions from net realized gains | | | (541,651 | ) | | | — | |
| |
Share transactions–net:
|
| Class A | | | 12,108,990 | | | | 1,725,109 | |
| |
| Class B | | | 450,075 | | | | 434,371 | |
| |
| Class C | | | 2,967,745 | | | | 309,891 | |
| |
| Class R | | | 351,505 | | | | 42,541 | |
| |
| Class Y | | | 742,606 | | | | 417,033 | |
| |
| Institutional Class | | | (38,283,705 | ) | | | 63,601,306 | |
| |
| Net increase (decrease) in net assets resulting from share transactions | | | (21,662,784 | ) | | | 66,530,251 | |
| |
| Net increase (decrease) in net assets | | | (25,977,095 | ) | | | 73,253,524 | |
| |
Net Assets:
|
| Beginning of year | | | 73,253,524 | | | | — | |
| |
| End of year (includes undistributed net investment income of $2,441,953 and $487,910, respectively) | | $ | 47,276,429 | | | $ | 73,253,524 | |
| |
See accompanying Notes to Financial Statements which are an integral part of the financial statements.
13 Invesco Emerging Market Local Currency Debt Fund
Notes to Financial Statements
October 31, 2010
NOTE 1—Significant Accounting Policies
Invesco Emerging Market Local Currency Debt Fund (the “Fund”) is a series portfolio of AIM Investment Funds (Invesco Investment Funds) (the “Trust”). The Trust is organized as a Delaware statutory trust and is registered under the Investment Company Act of 1940, as amended (the “1940 Act”), as an open-end series management investment company consisting of thirteen separate series portfolios, each authorized to issue an unlimited number of shares of beneficial interest. The assets, liabilities and operations of each portfolio are accounted for separately. Information presented in these financial statements pertains only to the Fund. Matters affecting each portfolio or class will be voted on exclusively by the shareholders of such portfolio or class.
The Fund’s investment objective is to provide total return.
The Fund currently consists of six different classes of shares: Class A, Class B, Class C, Class R, Class Y and Institutional Class. Class A shares are sold with a front-end sales charge unless certain waiver criteria are met and under certain circumstances load waived shares may be subject to contingent deferred sales charges (“CDSC”). Class C shares are sold with a CDSC. Class R, Class Y and Institutional Class shares are sold at net asset value. Effective November 30, 2010, new or additional investments in Class B shares are no longer permitted. Existing shareholders of Class B shares may continue to reinvest dividends and capital gains distributions in Class B shares until they convert. Also, shareholders in Class B shares will be able to exchange those shares for Class B shares of other Invesco Funds offering such shares until they convert. Generally, Class B shares will automatically convert to Class A shares on or about the month-end which is at least eight years after the date of purchase. Redemption of Class B shares prior to conversion date will be subject to a CDSC.
The following is a summary of the significant accounting policies followed by the Fund in the preparation of its financial statements.
| | |
| A. | | Security Valuations — Securities, including restricted securities, are valued according to the following policy. |
| | A security listed or traded on an exchange (except convertible bonds) is valued at its last sales price or official closing price as of the close of the customary trading session on the exchange where the security is principally traded, or lacking any sales or official closing price on a particular day, the security may be valued at the closing bid price on that day. Securities traded in the over-the-counter market are valued based on prices furnished by independent pricing services or market makers. When such securities are valued by an independent pricing service they may be considered fair valued. Futures contracts are valued at the final settlement price set by an exchange on which they are principally traded. Listed options are valued at the mean between the last bid and ask prices from the exchange on which they are principally traded. Options not listed on an exchange are valued by an independent source at the mean between the last bid and ask prices. For purposes of determining net asset value per share, futures and option contracts generally are valued 15 minutes after the close of the customary trading session of the New York Stock Exchange (“NYSE”). |
| | Investments in open-end and closed-end registered investment companies that do not trade on an exchange are valued at the end of day net asset value per share. Investments in open-end and closed-end registered investment companies that trade on an exchange are valued at the last sales price or official closing price as of the close of the customary trading session on the exchange where the security is principally traded. |
| | Debt obligations (including convertible bonds) and unlisted equities are fair valued using an evaluated quote provided by an independent pricing service. Evaluated quotes provided by the pricing service may be determined without exclusive reliance on quoted prices, and may reflect appropriate factors such as institution-size trading in similar groups of securities, developments related to specific securities, dividend rate, yield, quality, type of issue, coupon rate, maturity, individual trading characteristics and other market data. Debt securities are subject to interest rate and credit risks. In addition, all debt securities involve some risk of default with respect to interest and/or principal payments. |
| | Foreign securities (including foreign exchange contracts) are converted into U.S. dollar amounts using the applicable exchange rates as of the close of the NYSE. If market quotations are available and reliable for foreign exchange traded equity securities, the securities will be valued at the market quotations. Because trading hours for certain foreign securities end before the close of the NYSE, closing market quotations may become unreliable. If between the time trading ends on a particular security and the close of the customary trading session on the NYSE, events occur that are significant and make the closing price unreliable, the Fund may fair value the security. If the event is likely to have affected the closing price of the security, the security will be valued at fair value in good faith using procedures approved by the Board of Trustees. Adjustments to closing prices to reflect fair value may also be based on a screening process of an independent pricing service to indicate the degree of certainty, based on historical data, that the closing price in the principal market where a foreign security trade is not the current value as of the close of the NYSE. Foreign securities meeting the approved degree of certainty that the price is not reflective of current value will be priced at the indication of fair value from the independent pricing service. Multiple factors may be considered by the independent pricing service in determining adjustments to reflect fair value and may include information relating to sector indices, American Depositary Receipts and domestic and foreign index futures. Foreign securities may have additional risks including exchange rate changes, potential for sharply devalued currencies and high inflation, political and economical upheaval, the relative lack of issuer information, relatively low market liquidity and the potential lack of strict financial and accounting controls and standards. |
| | Securities for which market prices are not provided by any of the above methods may be valued based upon quotes furnished by independent sources. The last bid price may be used to value equity securities. The mean between the last bid and asked prices is used to value debt obligations, including Corporate Loans. |
| | Securities for which market quotations are not readily available or are unreliable are valued at fair value as determined in good faith by or under the supervision of the Trust’s officers following procedures approved by the Board of Trustees. Issuer specific events, market trends, bid/ask quotes of brokers and information providers and other market data may be reviewed in the course of making a good faith determination of a security’s fair value. |
| | Valuations change in response to many factors including the historical and prospective earnings of the issuer, the value of the issuer’s assets, general economic conditions, interest rates, investor perceptions and market liquidity. Because of the inherent uncertainties of valuation, the values reflected in the financial statements may materially differ from the value received upon actual sale of those investments. |
14 Invesco Emerging Market Local Currency Debt Fund
| | |
| B. | | Securities Transactions and Investment Income — Securities transactions are accounted for on a trade date basis. Realized gains or losses on sales are computed on the basis of specific identification of the securities sold. Interest income is recorded on the accrual basis from settlement date. Dividend income (net of withholding tax, if any) is recorded on the ex-dividend date. Bond premiums and discounts are amortized and/or accreted for financial reporting purposes. |
| | The Fund may periodically participate in litigation related to Fund investments. As such, the Fund may receive proceeds from litigation settlements. Any proceeds received are included in the Statement of Operations as realized gain (loss) for investments no longer held and as unrealized gain (loss) for investments still held. |
| | Brokerage commissions and mark ups are considered transaction costs and are recorded as an increase to the cost basis of securities purchased and/or a reduction of proceeds on a sale of securities. Such transaction costs are included in the determination of net realized and unrealized gain (loss) from investment securities reported in the Statement of Operations and the Statement of Changes in Net Assets and the net realized and unrealized gains (losses) on securities per share in the Financial Highlights. Transaction costs are included in the calculation of the Fund’s net asset value and, accordingly, they reduce the Fund’s total returns. These transaction costs are not considered operating expenses and are not reflected in net investment income reported in the Statement of Operations and Statement of Changes in Net Assets, or the net investment income per share and ratios of expenses and net investment income reported in the Financial Highlights, nor are they limited by any expense limitation arrangements between the Fund and the investment adviser. |
| | The Fund allocates income and realized and unrealized capital gains and losses to a class based on the relative net assets of each class. |
| C. | | Country Determination — For the purposes of making investment selection decisions and presentation in the Schedule of Investments, the investment adviser may determine the country in which an issuer is located and/or credit risk exposure based on various factors. These factors include the laws of the country under which the issuer is organized, where the issuer maintains a principal office, the country in which the issuer derives 50% or more of its total revenues and the country that has the primary market for the issuer’s securities, as well as other criteria. Among the other criteria that may be evaluated for making this determination are the country in which the issuer maintains 50% or more of its assets, the type of security, financial guarantees and enhancements, the nature of the collateral and the sponsor organization. Country of issuer and/or credit risk exposure has been determined to be the United States of America, unless otherwise noted. |
| D. | | Distributions — Distributions from income are declared and paid monthly. Distributions from net realized capital gain, if any, are generally paid annually and recorded on ex-dividend date. The Fund may elect to treat a portion of the proceeds from redemptions as distributions for federal income tax purposes. |
| E. | | Federal Income Taxes — The Fund intends to comply with the requirements of Subchapter M of the Internal Revenue Code necessary to qualify as a regulated investment company and to distribute substantially all of the Fund’s taxable earnings to shareholders. As such, the Fund will not be subject to federal income taxes on otherwise taxable income (including net realized capital gain) that is distributed to shareholders. Therefore, no provision for federal income taxes is recorded in the financial statements. |
| | The Fund files tax returns in the U.S. Federal jurisdiction and certain other jurisdictions. Generally, the Fund is subject to examinations by such taxing authorities for up to three years after the filing of the return for the tax period. |
| F. | | Expenses — Fees provided for under the Rule 12b-1 plan of a particular class of the Fund are charged to the operations of such class. Transfer agency fees and expenses and other shareholder recordkeeping fees and expenses attributable to the Institutional Class are charged to such class. Transfer agency fees and expenses and other shareholder recordkeeping fees and expenses relating to all other classes are allocated among those classes based on relative net assets. All other expenses are allocated among the classes based on relative net assets. |
| G. | | Accounting Estimates — The preparation of financial statements in conformity with accounting principles generally accepted in the United States of America (“GAAP”) requires management to make estimates and assumptions that affect the reported amounts of assets and liabilities at the date of the financial statements and the reported amounts of revenues and expenses during the reporting period including estimates and assumptions related to taxation. Actual results could differ from those estimates by a significant amount. In addition, the Fund monitors for material events or transactions that may occur or become known after the period-end date and before the date the financial statements are released to print. |
| H. | | Indemnifications — Under the Trust’s organizational documents, each Trustee, officer, employee or other agent of the Trust is indemnified against certain liabilities that may arise out of performance of their duties to the Fund. Additionally, in the normal course of business, the Fund enters into contracts, including the Fund’s servicing agreements that contain a variety of indemnification clauses. The Fund’s maximum exposure under these arrangements is unknown as this would involve future claims that may be made against the Fund that have not yet occurred. The risk of material loss as a result of such indemnification claims is considered remote. |
| I. | | Redemption Fees — The Fund has a 2% redemption fee that is to be retained by the Fund to offset transaction costs and other expenses associated with short-term redemptions and exchanges. The fee, subject to certain exceptions, is imposed on certain redemptions or exchanges of shares within 31 days of purchase. The redemption fee is recorded as an increase in shareholder capital and is allocated among the share classes based on the relative net assets of each class. Effective January 1, 2012, the Fund will eliminate the 2% redemption fee, if applicable, assessed on shares of the Fund redeemed or exchanged within 31 days of purchase. |
| J. | | Foreign Currency Translations — Foreign currency is valued at the close of the NYSE based on quotations posted by banks and major currency dealers. Portfolio securities and other assets and liabilities denominated in foreign currencies are translated into U.S. dollar amounts at date of valuation. Purchases and sales of portfolio securities (net of foreign taxes withheld on disposition) and income items denominated in foreign currencies are translated into U.S. dollar amounts on the respective dates of such transactions. The Fund does not separately account for the portion of the results of operations resulting from changes in foreign exchange rates on investments and the fluctuations arising from changes in market prices of securities held. The combined results of changes in foreign exchange rates and the fluctuation of market prices on investments (net of estimated foreign tax withholding) are included with the net realized and unrealized gain or loss from investments in the Statement of Operations. Reported net realized foreign currency gains or losses arise from (1) sales of foreign currencies, (2) currency gains or losses realized between the trade and settlement dates on securities transactions, and (3) the difference between the amounts of dividends, interest, and foreign withholding taxes recorded on the Fund’s books and the U.S. dollar equivalent of |
15 Invesco Emerging Market Local Currency Debt Fund
| | |
| | the amounts actually received or paid. Net unrealized foreign currency gains and losses arise from changes in the fair values of assets and liabilities, other than investments in securities at fiscal period end, resulting from changes in exchange rates. |
| | The Fund may invest in foreign securities which may be subject to foreign taxes on income, gains on investments or currency repatriation, a portion of which may be recoverable. |
| K. | | Foreign Currency Contracts — The Fund may enter into foreign currency contracts to manage or minimize currency or exchange rate risk. The Fund may also enter into foreign currency contracts for the purchase or sale of a security denominated in a foreign currency in order to “lock in” the U.S. dollar price of that security. A foreign currency contract is an obligation to purchase or sell a specific currency for an agreed-upon price at a future date. The use of foreign currency contracts does not eliminate fluctuations in the price of the underlying securities the Fund owns or intends to acquire but establishes a rate of exchange in advance. Fluctuations in the value of these contracts are measured by the difference in the contract date and reporting date exchange rates and are recorded as unrealized appreciation (depreciation) until the contracts are closed. When the contracts are closed, realized gains (losses) are recorded. Realized and unrealized gains (losses) on the contracts are included in the Statement of Operations. The primary risks associated with foreign currency contracts include failure of the counterparty to meet the terms of the contract and the value of the foreign currency changing unfavorably. These risks may be in excess of the amounts reflected in the Statement of Assets and Liabilities. |
| L. | | Swap Agreements — The Fund may enter into various swap transactions, including interest rate, total return, index, currency exchange rate and credit default swap contracts (“CDS”) for investment purposes or to manage interest rate, currency or credit risk. |
| | Interest rate, total return, index, and currency exchange rate swap agreements are two-party contracts entered into primarily to exchange the returns (or differentials in rates of returns) earned or realized on particular predetermined investments or instruments. The gross returns to be exchanged or “swapped” between the parties are calculated with respect to a notional amount, i.e., the return on or increase in value of a particular dollar amount invested at a particular interest rate or return of an underlying asset, in a particular foreign currency, or in a “basket” of securities representing a particular index. |
| | A CDS is an agreement between two parties (“Counterparties”) to exchange the credit risk of an issuer. A buyer of a CDS is said to buy protection by paying a fixed payment over the life of the agreement and in some situations an upfront payment to the seller of the CDS. If a defined credit event occurs (such as payment default or bankruptcy), the Fund as a protection buyer would cease paying its fixed payment, the Fund would deliver eligible bonds issued by the reference entity to the seller, and the seller would pay the full notional value, or the “par value”, of the referenced obligation to the Fund. A seller of a CDS is said to sell protection and thus would receive a fixed payment over the life of the agreement and an upfront payment, if applicable. If a credit event occurs, the Fund as a protection seller would cease to receive the fixed payment stream, the Fund would pay the buyer “par value” or the full notional value of the referenced obligation, and the Fund would receive the eligible bonds issued by the reference entity. In turn, these bonds may be sold in order to realize a recovery value. Alternatively, the seller of the CDS and its counterparty may agree to net the notional amount and the market value of the bonds and make a cash payment equal to the difference to the buyer of protection. If no credit event occurs, the Fund receives the fixed payment over the life of the agreement. As the seller, the Fund would effectively add leverage to its portfolio because, in addition to its total net assets, the Fund would be subject to investment exposure on the notional amount of the CDS. In connection with these agreements, cash and securities may be identified as collateral in accordance with the terms of the respective swap agreements to provide assets of value and recourse in the event of default under the swap agreement or bankruptcy/insolvency of a party to the swap agreement. If a counterparty becomes bankrupt or otherwise fails to perform its obligations due to financial difficulties, the Fund may experience significant delays in obtaining any recovery in a bankruptcy or other reorganization proceeding. The Fund may obtain only limited recovery or may obtain no recovery in such circumstances. |
| | Implied credit spreads represent the current level at which protection could be bought or sold given the terms of the existing CDS contract and serve as an indicator of the current status of the payment/performance risk of the CDS. An implied spread that has widened or increased since entry into the initial contract may indicate a deteriorating credit profile and increased risk of default for the reference entity. A declining or narrowing spread may indicate an improving credit profile or decreased risk of default for the reference entity. Alternatively, credit spreads may increase or decrease reflecting the general tolerance for risk in the credit markets. |
| | Changes in the value of swap agreements are recognized as unrealized gains (losses) in the Statement of Operations by “marking to market” on a daily basis to reflect the value of the swap agreement at the end of each trading day. Payments received or paid at the beginning of the agreement are reflected as such on the Statement of Assets and Liabilities and may be referred to as upfront payments. The Fund accrues for the fixed payment stream and amortizes upfront payments, if any, on swap agreements on a daily basis with the net amount, recorded as a component of realized gain (loss) on the Statement of Operations. A liquidation payment received or made at the termination of a swap agreement is recorded as realized gain (loss) on the Statement of Operations. The Fund segregates liquid securities having a value at least equal to the amount of the potential obligation of a Fund under any swap transaction. The Fund’s maximum risk of loss from counterparty risk, either as the protection seller or as the protection buyer, is the value of the contract. The risk may be mitigated by having a master netting arrangement between the Fund and the counterparty and by the posting of collateral by the counterparty to cover the Fund’s exposure to the counterparty. Entering into these agreements involves, to varying degrees, lack of liquidity and elements of credit, market, and counterparty risk in excess of amounts recognized on the Statement of Assets and Liabilities. Such risks involve the possibility that a swap is difficult to sell or liquidate; the counterparty does not honor its obligations under the agreement and unfavorable interest rates and market fluctuations. |
16 Invesco Emerging Market Local Currency Debt Fund
NOTE 2—Advisory Fees and Other Fees Paid to Affiliates
The Trust has entered into a master investment advisory agreement with Invesco Advisers, Inc. (the “Adviser” or “Invesco”). Under the terms of the investment advisory agreement, the Fund pays an advisory fee to the Adviser based on the annual rate of the Fund’s average daily net assets as follows:
| | | | | |
| Average Net Assets | | Rate |
| |
| First $500 million | | | 0 | .75% |
| |
| Next $500 million | | | 0 | .70% |
| |
| Next $500 million | | | 0 | .67% |
| |
| Over $1.5 billion | | | 0 | .65% |
| |
Under the terms of a master sub-advisory agreement between the Adviser and each of Invesco Asset Management Deutschland GmbH, Invesco Asset Management Limited, Invesco Asset Management (Japan) Limited, Invesco Australia Limited, Invesco Hong Kong Limited, Invesco Senior Secured Management, Inc. and Invesco Canada Ltd. (collectively, the “Affiliated Sub-Advisers”) the Adviser, not the Fund, may pay 40% of the fees paid to the Adviser to any such Affiliated Sub-Adviser(s) that provide(s) discretionary investment management services to the Fund based on the percentage of assets allocated to such Sub-Adviser(s).
The Adviser has contractually agreed, through at least February 28, 2013, to waive advisory fees and/or reimburse expenses to the extent necessary to limit total annual operating expenses after fee waiver and/or expense reimbursement (excluding certain items discussed below) of Class A, Class B, Class C, Class R, Class Y and Institutional Class shares to 1.24%, 1.99%, 1.99%, 1.49%, 0.99% and 0.99% of average daily net assets, respectively. In determining the Adviser’s obligation to waive advisory fees and/or reimburse expenses, the following expenses are not taken into account, and could cause the net annual operating expenses after fee waiver and/or expense reimbursement to exceed the numbers reflected above: (1) interest; (2) taxes; (3) dividend expense on short sales; (4) extraordinary or non-routine items; and (5) expenses that the Fund has incurred but did not actually pay because of an expense offset arrangement. Unless the Board of the Trustees and Invesco mutually agree to amend or continue the fee waiver agreement, it will terminate on February 28, 2013.
The Adviser has contractually agreed, through at least June 30, 2012, to waive the advisory fee payable by the Fund in an amount equal to 100% of the net advisory fees the Adviser receives from the affiliated money market funds on investments by the Fund of uninvested cash in such affiliated money market funds.
For the year ended October 31, 2011, the Adviser waived fund level fees of $174,086 and reimbursed class level expenses of $19,636, $1,647, $3,563, $203, $2,338 and $591 of Class A, Class B, Class C, Class R, Class Y and Institutional Class shares, respectively.
The Trust has entered into a master administrative services agreement with Invesco pursuant to which the Fund has agreed to pay Invesco for certain administrative costs incurred in providing accounting services to the Fund. For the year ended October 31, 2011, expenses incurred under the agreement are shown in the Statement of Operations as administrative services fees.
The Trust has entered into a transfer agency and service agreement with Invesco Investment Services, Inc. (“IIS”) pursuant to which the Fund has agreed to pay IIS a fee for providing transfer agency and shareholder services to the Fund and reimburse IIS for certain expenses incurred by IIS in the course of providing such services. IIS may make payments to intermediaries that provide omnibus account services, sub-accounting services and/or networking services. All fees payable by IIS to intermediaries that provide omnibus account services or sub-accounting are charged back to the Fund, subject to certain limitations approved by the Trust’s Board of Trustees. For the year ended October 31, 2011, expenses incurred under the agreement are shown in the Statement of Operations as transfer agent fees.
The Trust has entered into master distribution agreements with Invesco Distributors, Inc. (“IDI”) to serve as the distributor for the Class A, Class B, Class C, Class R, Class Y and Institutional Class shares of the Fund. The Trust has adopted plans pursuant to Rule 12b-1 under the 1940 Act with respect to the Fund’s Class A, Class B, Class C and Class R shares (collectively the “Plans”). The Fund, pursuant to the Plans, pays IDI compensation at the annual rate of 0.25% of the Fund’s average daily net assets of Class A shares, 1.00% of the average daily net assets of Class B and Class C shares and 0.50% of the average daily net assets of Class R shares. Of the Plan payments, up to 0.25% of the average daily net assets of each class of shares may be paid to furnish continuing personal shareholder services to customers who purchase and own shares of such classes. Any amounts not paid as a service fee under the Plans would constitute an asset-based sales charge. Rules of the Financial Industry Regulatory Authority (“FINRA”) impose a cap on the total sales charges, including asset-based sales charges that may be paid by any class of shares of the Fund. For the year ended October 31, 2011, expenses incurred under the Plans are shown in the Statement of Operations as distribution fees.
Front-end sales commissions and CDSC (collectively the “sales charges”) are not recorded as expenses of the Fund. Front-end sales commissions are deducted from proceeds from the sales of Fund shares prior to investment in Class A shares of the Fund. CDSC are deducted from redemption proceeds prior to remittance to the shareholder. During the year ended October 31, 2011, IDI advised the Fund that IDI retained $7,957 in front-end sales commissions from the sale of Class A shares and $0, $266 and $1,109 from Class A, Class B and Class C shares, respectively, for CDSC imposed on redemptions by shareholders.
Certain officers and trustees of the Trust are officers and directors of the Adviser, Invesco Ltd., IIS and/or IDI.
NOTE 3—Additional Valuation Information
GAAP defines fair value as the price that would be received to sell an asset or paid to transfer a liability in an orderly transaction between market participants at the measurement date, under current market conditions. GAAP establishes a hierarchy that prioritizes the inputs to valuation methods giving the highest priority to readily available unadjusted quoted prices in an active market for identical assets (Level 1) and the lowest priority to significant unobservable inputs
17 Invesco Emerging Market Local Currency Debt Fund
(Level 3) generally when market prices are not readily available or are unreliable. Based on the valuation inputs, the securities or other investments are tiered into one of three levels. Changes in valuation methods may result in transfers in or out of an investment’s assigned level:
| | |
| | Level 1 — | Prices are determined using quoted prices in an active market for identical assets. |
| | Level 2 — | Prices are determined using other significant observable inputs. Observable inputs are inputs that other market participants may use in pricing a security. These may include quoted prices for similar securities, interest rates, prepayment speeds, credit risk, yield curves, loss severities, default rates, discount rates, volatilities and others. |
| | Level 3 — | Prices are determined using significant unobservable inputs. In situations where quoted prices or observable inputs are unavailable (for example, when there is little or no market activity for an investment at the end of the period), unobservable inputs may be used. Unobservable inputs reflect the Fund’s own assumptions about the factors market participants would use in determining fair value of the securities or instruments and would be based on the best available information. |
The following is a summary of the tiered valuation input levels, as of October 31, 2011. The level assigned to the securities valuations may not be an indication of the risk or liquidity associated with investing in those securities. Because of the inherent uncertainties of valuation, the values reflected in the financial statements may materially differ from the value received upon actual sale of those investments.
During the year ended October 31, 2011, there were no significant transfers between investment levels.
| | | | | | | | | | | | | | | | | |
| | | Level 1 | | Level 2 | | Level 3 | | Total |
| |
| Money Market Funds | | $ | 1,270,700 | | | $ | — | | | $ | — | | | $ | 1,270,700 | |
| |
| Foreign Debt Securities | | | — | | | | 17,441,363 | | | | — | | | | 17,441,363 | |
| |
| Foreign Government Debt Securities | | | — | | | | 27,446,887 | | | | — | | | | 27,446,887 | |
| |
| | | $ | 1,270,700 | | | $ | 44,888,250 | | | $ | — | | | $ | 46,158,950 | |
| |
| Swap Agreements* | | | — | | | | (472 | ) | | | — | | | | (472 | ) |
| |
| Total Investments | | $ | 1,270,700 | | | $ | 44,887,778 | | | $ | — | | | $ | 46,158,478 | |
| |
| |
| * | Unrealized appreciation (depreciation). |
NOTE 4—Derivative Investments
The Fund has implemented the required disclosures about derivative instruments and hedging activities in accordance with GAAP. This disclosure is intended to improve financial reporting about derivative instruments and hedging activities by requiring enhanced disclosures to enable investors to better understand their effects on an entity’s financial position and financial performance. The enhanced disclosure has no impact on the results of operations reported in the financial statements.
Value of Derivative Instruments at Period-End
The table below summarizes the value of the Fund’s derivative instruments, detailed by primary risk exposure, held as of October 31, 2011:
| | | | | | | | | |
| | | Value |
| Risk Exposure/ Derivative Type | | Assets | | Liabilities |
| |
| Interest rate risk | | | | | | | | |
Foreign Swap(a) | | $ | — | | | $ | (472 | ) |
| |
| | |
| (a) | | Includes cumulative appreciation (depreciation) of foreign swaps. |
Effect of Derivative Instruments for the year ended October 31, 2011
The table below summarizes the gains (losses) on derivative instruments, detailed by primary risk exposure, recognized in earnings during the period:
| | | | | | | | | |
| | | Location of Gain (Loss) on
|
| | | Statement of Operations |
| | | Swap
| | Foreign Currency
|
| | | Agreements* | | Contracts* |
| |
| Realized Gain | | | | | | | | |
| Currency risk | | $ | — | | | $ | 14,183 | |
| |
| Change in Unrealized Appreciation (Depreciation) | | | | | | | | |
| Currency risk | | $ | — | | | $ | (111,458 | ) |
| |
| Interest rate risk | | | (472 | ) | | | — | |
| |
| Total | | $ | (472 | ) | | $ | (97,275 | ) |
| |
| |
| * | The notional value average value of swap agreements and foreign currency contracts outstanding during the period was $8,676 and $227,828, respectively. |
| | | | | | | | | | | | | | | | | | | | | |
| | | Interest Rate Swaps Agreements |
| | | | | Pay
| | Floating Rate*
| | | | Unrealized
|
| | | Notional
| | Fixed
| | (Rate Reset
| | Termination
| | Appreciation
|
| | | Amount | | Rate | | Monthly) | | Date | | (Depreciation) |
| |
| Deutsche Bank A.G. | | HUF | | | 100,000,000 | | | 6.77% | | | 6.19% | | | | 11/03/13 | | | $ | (472 | ) |
| |
| |
| * | Based on 6 month Budapest Interbank Offered Rate (BUBOR). |
| | | |
| Currency Abbreviation: |
| HUF- Hungary Forint | | |
18 Invesco Emerging Market Local Currency Debt Fund
NOTE 5—Expense Offset Arrangement(s)
The expense offset arrangement is comprised of custodian credits which result from periodic overnight cash balances at the custodian. For the year ended October 31, 2011, the Fund received credits from this arrangement, which resulted in the reduction of the Fund’s total expenses of $2,112.
NOTE 6—Trustees’ and Officers’ Fees and Benefits
“Trustees’ and Officers’ Fees and Benefits” include amounts accrued by the Fund to pay remuneration to certain Trustees and Officers of the Fund. Trustees have the option to defer compensation payable by the Fund, and “Trustees’ and Officers’ Fees and Benefits” also include amounts accrued by the Fund to fund such deferred compensation amounts. Those Trustees who defer compensation have the option to select various Invesco Funds in which their deferral accounts shall be deemed to be invested. Finally, certain current Trustees are eligible to participate in a retirement plan that provides for benefits to be paid upon retirement to Trustees over a period of time based on the number of years of service. The Fund may have certain former Trustees who also participate in a retirement plan and receive benefits under such plan. “Trustees’ and Officers’ Fees and Benefits” include amounts accrued by the Fund to fund such retirement benefits. Obligations under the deferred compensation and retirement plans represent unsecured claims against the general assets of the Fund.
During the year ended October 31, 2011, the Fund paid legal fees of $1,548 for services rendered by Kramer, Levin, Naftalis & Frankel LLP as counsel to the Independent Trustees. A partner of that firm is a Trustee of the Trust.
NOTE 7—Cash Balances
The Fund is permitted to temporarily carry a negative or overdrawn balance in its account with State Street Bank and Trust Company, the custodian bank. To compensate the custodian bank for such overdrafts, the overdrawn Fund may either (1) leave funds as a compensating balance in the account so the custodian bank can be compensated by earning the additional interest; or (2) compensate by paying the custodian bank at a rate agreed upon by the custodian bank and Invesco, not to exceed the contractually agreed upon rate.
NOTE 8—Distributions to Shareholders and Tax Components of Net Assets
Tax Character of Distributions to Shareholders Paid During the Years Ended October 31, 2011 and 2010:
| | | | | | | | | |
| | | 2011 | | 2010 |
| |
| Ordinary income | | $ | 3,171,643 | | | $ | 1,047,597 | |
| |
Tax Components of Net Assets at Period-End:
| | | | | |
| | | 2011 |
| |
| Undistributed ordinary income | | $ | 3,391,790 | |
| |
| Undistributed long-term gain | | | 141,252 | |
| |
| Net unrealized appreciation (depreciation) — investments | | | (1,027,969 | ) |
| |
| Net unrealized appreciation (depreciation) — other investments | | | (56,543 | ) |
| |
| Temporary book/tax differences | | | (2,602 | ) |
| |
| Shares of beneficial interest | | | 44,830,501 | |
| |
| Total net assets | | $ | 47,276,429 | |
| |
The temporary book/tax differences are a result of timing differences between book and tax recognition of income and/or expenses. The Fund’s temporary book/tax differences are the result of the trustee deferral of compensation and retirement plan benefits.
The Fund does not have a capital loss carryforward at period-end.
NOTE 9—Investment Securities
The aggregate amount of investment securities (other than short-term securities, U.S. Treasury obligations and money market funds, if any) purchased and sold by the Fund during the year ended October 31, 2011 was $46,163,865 and $69,010,576, respectively. Cost of investments on a tax basis includes the adjustments for financial reporting purposes as of the most recently completed Federal income tax reporting period-end.
| | | | | |
| Unrealized Appreciation (Depreciation) of Investment Securities on a Tax Basis |
| |
| Aggregate unrealized appreciation of investment securities | | $ | 953,313 | |
| |
| Aggregate unrealized (depreciation) of investment securities | | | (1,981,282 | ) |
| |
| Net unrealized (depreciation) of investment securities | | $ | (1,027,969 | ) |
| |
| Cost of investments is the same for tax and financial reporting purposes | | | | |
19 Invesco Emerging Market Local Currency Debt Fund
NOTE 10—Reclassification of Permanent Differences
Primarily as a result of differing book/tax treatment of foreign currency transactions, on October 31, 2011, undistributed net investment income was increased by $2,224,821 and undistributed net realized gain was decreased by $2,224,821. This reclassification had no effect on the net assets of the Fund.
NOTE 11—Share Information
| | | | | | | | | | | | | | | | | |
| | | Summary of Share Activity |
| |
| | | | | June 16, 2010
|
| | | Year ended
| | (commencement date) to
|
| | | October 31, 2010(a) | | October 31, 2010 |
| | | Shares | | Amount | | Shares | | Amount |
| |
| Sold: | | | | | | | | | | | | | | | | |
| Class A | | | 1,881,707 | | | $ | 20,475,302 | | | | 169,790 | | | $ | 1,832,459 | |
| |
| Class B | | | 66,218 | | | | 718,824 | | | | 50,392 | | | | 536,509 | |
| |
| Class C | | | 305,777 | | | | 3,355,130 | | | | 28,174 | | | | 309,048 | |
| |
| Class R | | | 36,624 | | | | 387,033 | | | | 3,925 | | | | 42,236 | |
| |
| Class Y | | | 163,593 | | | | 1,742,215 | | | | 38,682 | | | | 415,109 | |
| |
| Institutional Class | | | 557,441 | | | | 5,880,731 | | | | 6,986,499 | | | | 70,699,760 | |
| |
| Issued as reinvestment of dividends: | | | | | | | | | | | | | | | | |
| Class A | | | 30,411 | | | | 324,846 | | | | 931 | | | | 10,071 | |
| |
| Class B | | | 3,533 | | | | 37,552 | | | | 253 | | | | 2,732 | |
| |
| Class C | | | 5,105 | | | | 54,298 | | | | 77 | | | | 843 | |
| |
| Class R | | | 370 | | | | 3,872 | | | | 28 | | | | 305 | |
| |
| Class Y | | | 4,534 | | | | 48,370 | | | | 174 | | | | 1,924 | |
| |
| Institutional Class | | | 244,747 | | | | 2,606,624 | | | | 96,762 | | | | 1,028,892 | |
| |
| Automatic conversion of Class B shares to Class A shares: | | | | | | | | | | | | | | | | |
| Class A | | | 2,641 | | | | 28,333 | | | | 28 | | | | 304 | |
| |
| Class B | | | (2,643 | ) | | | (28,333 | ) | | | (28 | ) | | | (304 | ) |
| |
Reacquired(b) | | | | | | | | | | | | | | | | |
| Class A | | | (830,917 | ) | | | (8,719,491 | ) | | | (10,921 | ) | | | (117,725 | ) |
| |
| Class B | | | (26,698 | ) | | | (277,968 | ) | | | (9,630 | ) | | | (104,566 | ) |
| |
| Class C | | | (41,861 | ) | | | (441,683 | ) | | | — | | | | — | |
| |
| Class R | | | (3,718 | ) | | | (39,400 | ) | | | — | | | | — | |
| |
| Class Y | | | (97,916 | ) | | | (1,047,979 | ) | | | — | | | | — | |
| |
| Institutional Class | | | (4,329,405 | ) | | | (46,771,060 | ) | | | (759,959 | ) | | | (8,127,346 | ) |
| |
| Net increase (decrease) in share activity | | | (2,030,457 | ) | | $ | (21,662,784 | ) | | | 6,595,177 | | | $ | 66,530,251 | |
| |
| | |
| (a) | | There are entities that are record owners of more than 5% of the outstanding shares of the Fund and in the aggregate own 19% of the outstanding shares of the Fund. IDI has an agreement with these entities to sell Fund shares. The Fund, Invesco and/or Invesco affiliates may make payments to these entities, which are considered to be related to the Fund, for providing services to the Fund, Invesco and/or Invesco affiliates including but not limited to services such as securities brokerage, distribution, third party record keeping and account servicing. The Fund has no knowledge as to whether all or any portion of the shares owned of record by these entities are also owned beneficially. |
| | In addition, 60% of the outstanding shares of the Fund are owned by affiliated mutual funds. Affiliated mutual funds are other mutual funds that are also advised by Invesco. |
| (b) | | Net of redemption fees of $2,715 and $390 allocated among the classes based on relative net assets of each class for the year ended October 31, 2011 and June 16, 2009 (Commencement debt) through October 31, 2011. |
20 Invesco Emerging Market Local Currency Debt Fund
NOTE 12—Financial Highlights
The following schedule presents financial highlights for a share of the Fund outstanding throughout the periods indicated.
| | | | | | | | | | | | | | | | | | | | | | | | | | | | | | | | | | | | | | | | | | | | | | | | | | | | | | | | | |
| | | | | | | | | | | | | | | | | | | | | | | Ratio of
| | Ratio of
| | | | |
| | | | | | | Net gains
| | | | | | | | | | | | | | | | expenses
| | expenses
| | | | |
| | | | | | | (losses) on
| | | | | | | | | | | | | | | | to average
| | to average net
| | Ratio of net
| | |
| | | Net asset
| | | | securities
| | | | Dividends
| | Distributions
| | | | | | | | | | net assets
| | assets without
| | investment
| | |
| | | value,
| | Net
| | (both
| | Total from
| | from net
| | from net
| | | | Net asset
| | | | Net assets,
| | with fee waivers
| | fee waivers
| | income
| | |
| | | beginning
| | investment
| | realized and
| | investment
| | investment
| | realized
| | Total
| | value, end
| | Total
| | end of period
| | and/or expenses
| | and/or expenses
| | to average
| | Portfolio
|
| | | of period | | income(a) | | unrealized) | | operations | | income | | gains | | Distributions | | of period(b) | | Return(c) | | (000s omitted) | | absorbed | | absorbed | | net assets | | turnover(d) |
| |
| Class A |
| Year ended 10/31/11 | | $ | 11.11 | | | $ | 0.53 | | | $ | (0.49 | ) | | $ | 0.04 | | | $ | (0.63 | ) | | $ | (0.16 | ) | | $ | (0.79 | ) | | $ | 10.36 | | | | 0.34 | % | | $ | 12,886 | | | | 1.23 | %(e) | | | 1.86 | %(e) | | | 4.97 | %(e) | | | 106 | % |
| Year ended 10/31/10(f) | | | 10.00 | | | | 0.21 | | | | 1.07 | | | | 1.28 | | | | (0.17 | ) | | | — | | | | (0.17 | ) | | | 11.11 | | | | 12.90 | | | | 1,776 | | | | 1.24 | (g) | | | 1.76 | (g) | | | 5.06 | (g) | | | 22 | |
| |
| Class B |
| Year ended 10/31/11 | | | 11.10 | | | | 0.45 | | | | (0.49 | ) | | | (0.04 | ) | | | (0.55 | ) | | | (0.16 | ) | | | (0.71 | ) | | | 10.35 | | | | (0.42 | ) | | | 843 | | | | 1.98 | (e) | | | 2.61 | (e) | | | 4.22 | (e) | | | 106 | |
| Year ended 10/31/10(f) | | | 10.00 | | | | 0.18 | | | | 1.07 | | | | 1.25 | | | | (0.15 | ) | | | — | | | | (0.15 | ) | | | 11.10 | | | | 12.52 | | | | 455 | | | | 1.99 | (g) | | | 2.51 | (g) | | | 4.31 | (g) | | | 22 | |
| |
| Class C |
| Year ended 10/31/11 | | | 11.10 | | | | 0.45 | | | | (0.48 | ) | | | (0.03 | ) | | | (0.55 | ) | | | (0.16 | ) | | | (0.71 | ) | | | 10.36 | | | | (0.33 | ) | | | 3,079 | | | | 1.98 | (e) | | | 2.61 | (e) | | | 4.22 | (e) | | | 106 | |
| Year ended 10/31/10(f) | | | 10.00 | | | | 0.18 | | | | 1.07 | | | | 1.25 | | | | (0.15 | ) | | | — | | | | (0.15 | ) | | | 11.10 | | | | 12.52 | | | | 314 | | | | 1.99 | (g) | | | 2.51 | (g) | | | 4.31 | (g) | | | 22 | |
| |
| Class R |
| Year ended 10/31/11 | | | 11.11 | | | | 0.49 | | | | (0.48 | ) | | | 0.01 | | | | (0.60 | ) | | | (0.16 | ) | | | (0.76 | ) | | | 10.36 | | | | 0.09 | | | | 386 | | | | 1.48 | (e) | | | 2.11 | (e) | | | 4.72 | (e) | | | 106 | |
| Year ended 10/31/10(f) | | | 10.00 | | | | 0.20 | | | | 1.07 | | | | 1.27 | | | | (0.16 | ) | | | — | | | | (0.16 | ) | | | 11.11 | | | | 12.81 | | | | 44 | | | | 1.49 | (g) | | | 2.01 | (g) | | | 4.81 | (g) | | | 22 | |
| |
| Class Y |
| Year ended 10/31/11 | | | 11.11 | | | | 0.56 | | | | (0.49 | ) | | | 0.07 | | | | (0.65 | ) | | | (0.16 | ) | | | (0.81 | ) | | | 10.37 | | | | 0.69 | | | | 1,131 | | | | 0.98 | (e) | | | 1.61 | (e) | | | 5.22 | (e) | | | 106 | |
| Year ended 10/31/10(f) | | | 10.00 | | | | 0.22 | | | | 1.07 | | | | 1.29 | | | | (0.18 | ) | | | — | | | | (0.18 | ) | | | 11.11 | | | | 13.00 | | | | 432 | | | | 0.99 | (g) | | | 1.51 | (g) | | | 5.31 | (g) | | | 22 | |
| |
| Institutional Class |
| Year ended 10/31/11 | | | 11.11 | | | | 0.56 | | | | (0.51 | ) | | | 0.05 | | | | (0.65 | ) | | | (0.16 | ) | | | (0.81 | ) | | | 10.35 | | | | 0.50 | | | | 28,952 | | | | 0.98 | (e) | | | 1.36 | (e) | | | 5.22 | (e) | | | 106 | |
| Year ended 10/31/10(f) | | | 10.00 | | | | 0.21 | | | | 1.08 | | | | 1.29 | | | | (0.18 | ) | | | — | | | | (0.18 | ) | | | 11.11 | | | | 13.00 | | | | 70,233 | | | | 0.99 | (g) | | | 1.29 | (g) | | | 5.31 | (g) | | | 22 | |
| |
| | |
| (a) | | Calculated using average shares outstanding. |
| (b) | | Includes redemption fees added to shares of beneficial interest which were less than $0.005 per share. |
| (c) | | Includes adjustments in accordance with accounting principles generally accepted in the United States of America and as such, the net asset value for financial reporting purposes and the returns based upon those net asset values may differ from the net asset value and returns for shareholder transactions. Does not include sales charges and is not annualized for periods less than one year. |
| (d) | | Portfolio turnover is calculated at the fund level and is not annualized for periods less than one year, if applicable. |
| (e) | | Ratios are based on average daily net assets (000’s omitted) of $7,943, $666, $1,441, $82, $946 and $34,943 for Class A, Class B, Class C, Class R, Class Y and Institutional Class shares, respectively. |
| (f) | | Commencement date of June 16, 2010. |
| (g) | | Annualized. |
21 Invesco Emerging Market Local Currency Debt Fund
Report of Independent Registered Public Accounting Firm
To the Board of Trustees of AIM Investment Funds (Invesco Investment Funds)
and Shareholders of Invesco Emerging Market Local Currency Debt Fund:
In our opinion, the accompanying statement of assets and liabilities, including the schedule of investments, and the related statements of operations and of changes in net assets and the financial highlights present fairly, in all material respects, the financial position of Invesco Emerging Market Local Currency Debt Fund (one of the funds constituting AIM Investment Funds (Invesco Investment Funds), hereafter referred to as the “Fund”) at October 31, 2011, the results of its operations for the year then ended, the changes in its net assets and the financial highlights for the year ended October 31, 2011 and for the period June 16, 2010 (commencement date) through October 31, 2010, in conformity with accounting principles generally accepted in the United States of America. These financial statements and financial highlights (hereafter referred to as “financial statements”) are the responsibility of the Fund’s management; our responsibility is to express an opinion on these financial statements based on our audits. We conducted our audits of these financial statements in accordance with the standards of the Public Company Accounting Oversight Board (United States). Those standards require that we plan and perform the audit to obtain reasonable assurance about whether the financial statements are free of material misstatement. An audit includes examining, on a test basis, evidence supporting the amounts and disclosures in the financial statements, assessing the accounting principles used and significant estimates made by management, and evaluating the overall financial statement presentation. We believe that our audits, which included confirmation of securities at October 31, 2011 by correspondence with the custodian and brokers, provide a reasonable basis for our opinion.
PRICEWATERHOUSECOOPERS LLP
Houston, Texas
December 27, 2011
22 Invesco Emerging Market Local Currency Debt Fund
Calculating your ongoing Fund expenses
Example
As a shareholder of the Fund, you incur two types of costs: (1) transaction costs, which may include sales charges (loads) on purchase payments or contingent deferred sales charges on redemptions, and redemption fees, if any; and (2) ongoing costs, including management fees, distribution and/or service (12b-1) fees, and other Fund expenses. This example is intended to help you understand your ongoing costs (in dollars) of investing in the Fund and to compare these costs with ongoing costs of investing in other mutual funds. The example is based on an investment of $1,000 invested at the beginning of the period and held for the entire period May 1, 2011 through October 31, 2011.
Actual expenses
The table below provides information about actual account values and actual expenses. You may use the information in this table, together with the amount you invested, to estimate the expenses that you paid over the period. Simply divide your account value by $1,000 (for example, an $8,600 account value divided by $1,000 = 8.6), then multiply the result by the number in the table under the heading entitled “Actual Expenses Paid During Period” to estimate the expenses you paid on your account during this period.
Hypothetical example for comparison purposes
The table below also provides information about hypothetical account values and hypothetical expenses based on the Fund’s actual expense ratio and an assumed rate of return of 5% per year before expenses, which is not the Fund’s actual return.
The hypothetical account values and expenses may not be used to estimate the actual ending account balance or expenses you paid for the period. You may use this information to compare the ongoing costs of investing in the Fund and other funds. To do so, compare this 5% hypothetical example with the 5% hypothetical examples that appear in the shareholder reports of the other funds.
Please note that the expenses shown in the table are meant to highlight your ongoing costs only and do not reflect any transaction costs, such as sales charges (loads) on purchase payments, contingent deferred sales charges on redemptions, and redemption fees, if any. Therefore, the hypothetical information is useful in comparing ongoing costs only, and will not help you determine the relative total costs of owning different funds. In addition, if these transaction costs were included, your costs would have been higher.
| | | | | | | | | | | | | | | | | | | | | | | | | | | | | | | |
| | | | | | | | | | HYPOTHETICAL
| | | |
| | | | | | | ACTUAL | | | (5% annual return before expenses) | | | |
| | | | Beginning
| | | Ending
| | | Expenses
| | | Ending
| | | Expenses
| | | Annualized
|
| | | | Account Value
| | | Account Value
| | | Paid During
| | | Account Value
| | | Paid During
| | | Expense
|
| Class | | | (05/01/11) | | | (10/31/11)1 | | | Period2 | | | (10/31/11) | | | Period2 | | | Ratio |
| A | | | $ | 1,000.00 | | | | $ | 942.90 | | | | $ | 6.07 | | | | $ | 1,018.95 | | | | $ | 6.31 | | | | | 1.24 | % |
| | | | | | | | | | | | | | | | | | | | | | | | | | | | | | | |
| B | | | | 1,000.00 | | | | | 939.20 | | | | | 9.73 | | | | | 1,015.17 | | | | | 10.11 | | | | | 1.99 | |
| | | | | | | | | | | | | | | | | | | | | | | | | | | | | | | |
| C | | | | 1,000.00 | | | | | 939.20 | | | | | 9.73 | | | | | 1,015.17 | | | | | 10.11 | | | | | 1.99 | |
| | | | | | | | | | | | | | | | | | | | | | | | | | | | | | | |
| R | | | | 1,000.00 | | | | | 941.60 | | | | | 7.29 | | | | | 1,017.69 | | | | | 7.58 | | | | | 1.49 | |
| | | | | | | | | | | | | | | | | | | | | | | | | | | | | | | |
| Y | | | | 1,000.00 | | | | | 944.00 | | | | | 4.85 | | | | | 1,020.21 | | | | | 5.04 | | | | | 0.99 | |
| | | | | | | | | | | | | | | | | | | | | | | | | | | | | | | |
| Institutional | | | | 1,000.00 | | | | | 944.00 | | | | | 4.85 | | | | | 1,020.21 | | | | | 5.04 | | | | | 0.99 | |
| | | | | | | | | | | | | | | | | | | | | | | | | | | | | | | |
| |
| 1 | The actual ending account value is based on the actual total return of the Fund for the period May 1, 2011 through October 31, 2011, after actual expenses and will differ from the hypothetical ending account value which is based on the Fund’s expense ratio and a hypothetical annual return of 5% before expenses. |
| 2 | Expenses are equal to the Fund’s annualized expense ratio as indicated above multiplied by the average account value over the period, multiplied by 184/365 to reflect the most recent fiscal half year. |
23 Invesco Emerging Market Local Currency Debt Fund
| |
| Approval of Investment Advisory and Sub-Advisory Contracts |
The Board of Trustees (the Board) of AIM Investment Funds (Invesco Investment Funds) is required under the Investment Company Act of 1940, as amended, to approve annually the renewal of the Invesco Emerging Market Local Currency Debt Fund (the Fund) investment advisory agreement with Invesco Advisers, Inc. (Invesco Advisers) and the Master Intergroup Sub-Advisory Contract for Mutual Funds (the sub-advisory contracts) with Invesco Asset Management Deutschland GmbH, Invesco Asset Management Limited, Invesco Asset Management (Japan) Limited, Invesco Australia Limited, Invesco Hong Kong Limited, Invesco Senior Secured Management, Inc. and Invesco Canada Ltd. (collectively, the Affiliated Sub-Advisers). During contract renewal meetings held on June 14-15, 2011, the Board as a whole, and the disinterested or “independent” Trustees, who comprise 80% of the Board, voting separately, approved the continuance of the Fund’s investment advisory agreement and the sub-advisory contracts for another year, effective July 1, 2011. In doing so, the Board considered the process that it follows in reviewing and approving the Fund’s investment advisory agreement and sub-advisory contracts and the information that it is provided. The Board determined that the Fund’s investment advisory agreement and the sub-advisory contracts are in the best interests of the Fund and its shareholders and the compensation to Invesco Advisers and the Affiliated Sub-Advisers under the agreements is fair and reasonable.
The Board’s Fund Evaluation Process
The Board’s Investments Committee has established three Sub-Committees, each of which is responsible for overseeing the management of a number of the series portfolios of the funds advised by Invesco Advisers (the Invesco Funds). The Sub-Committees meet throughout the year to review the performance of their assigned funds, including reviewing materials prepared under the direction of the independent Senior Officer, an officer of the Invesco Funds who reports directly to the independent Trustees. Over the course of each year, the Sub-Committees meet with portfolio managers for their assigned Invesco Funds and other members of management to review the performance, investment objective(s), policies, strategies and limitations and investment risks of these funds. The Sub-Committees meet regularly and at designated contract renewal meetings each year to conduct a review of the performance, fees, expenses and other matters related to their assigned Invesco Funds. Each Sub-Committee recommends to the Investments Committee, which in turn recommends to the full Board, whether to approve the continuance of each Invesco Fund’s investment advisory agreement and sub-advisory contracts for another year.
During the contract renewal process, the Trustees receive comparative performance and fee data regarding the Invesco Funds prepared by Invesco Advisers and an independent company, Lipper, Inc. (Lipper). The Trustees also receive an independent written evaluation from the Senior Officer. The Senior Officer’s evaluation is prepared as part of his responsibility to manage the process by which the Invesco Funds’ proposed management fees are negotiated during the annual contract renewal process to ensure they are negotiated in a manner that is at arms’ length and reasonable. The independent Trustees are assisted in their annual evaluation of the Fund’s investment advisory agreement by the Senior Officer and by independent legal counsel. The independent Trustees also discuss the continuance of the investment advisory agreement and sub-advisory contracts in private sessions with the Senior Officer and counsel.
In evaluating the fairness and reasonableness of the Fund’s investment advisory agreement and sub-advisory contracts, the Board considered, among other things, the factors discussed below. The Trustees also considered information provided in connection with fund acquisitions approved by the Trustees to rationalize the Invesco Funds product range following the acquisition of the retail mutual fund business of Morgan Stanley (the Morgan Stanley Transaction). The Trustees recognized that the advisory fees for the Invesco Funds include advisory fees that are the result of years of review and negotiation between the Trustees and Invesco Advisers as well as advisory fees inherited from Morgan Stanley and Van Kampen funds acquired in the Morgan Stanley Transaction. The Trustees’ deliberations and conclusions in a particular year may be based in part on their deliberations and conclusions regarding these same arrangements throughout the year and in prior years. One Trustee may have weighed a particular piece of information differently than another Trustee.
The discussion below serves as the Senior Officer’s independent written evaluation with respect to the Fund’s investment advisory agreement as well as a discussion of the material factors and related conclusions that formed the basis for the Board’s approval of the Fund’s investment advisory agreement and sub-advisory contracts. Unless otherwise stated, this information is current as of June 15, 2011, and may not reflect consideration of factors that became known to the Board after that date, including, for example, changes to the Fund’s performance, advisory fees, expense limitations and/or fee waivers.
Factors and Conclusions and Summary of Independent Written Fee Evaluation
| |
| A. | Nature, Extent and Quality of Services Provided by Invesco Advisers and the Affiliated Sub-Advisers |
The Board reviewed the advisory services provided to the Fund by Invesco Advisers under the Fund’s investment advisory agreement, the performance of Invesco Advisers in providing these services, and the credentials and experience of the officers and employees of Invesco Advisers who provide these services, including the Fund’s portfolio manager or managers, with whom the Board met during the year. The Board’s review of the qualifications of Invesco Advisers to provide advisory services included the Board’s consideration of Invesco Advisers’ performance and investment process oversight, independent credit analysis and investment risk management.
In determining whether to continue the Fund’s investment advisory agreement, the Board considered the prior relationship between Invesco Advisers and the Fund, as well as the Board’s knowledge of Invesco Advisers’ operations, and concluded that it is beneficial to maintain the current relationship, in part, because of such knowledge. The Board also considered services that Invesco Advisers and its affiliates provide to the Invesco Funds such as various back office support functions, equity and fixed income trading operations, internal audit, distribution and legal and compliance. The Board concluded that the nature, extent and quality of the services provided to the Fund by Invesco Advisers are appropriate and satisfactory and the advisory services are provided in accordance with the terms of the Fund’s investment advisory agreement.
The Board reviewed the services provided by the Affiliated Sub-Advisers under the sub-advisory contracts and the credentials and experience of the officers and employees of the Affiliated Sub-Advisers who provide these services. The Board noted that the Affiliated Sub-Advisers have offices and personnel that are located in financial centers around the world. As a result, the Affiliated Sub-Advisers can provide research and investment analysis on the markets and economies of various countries in which the Fund invests and make recommendations on securities of companies located in such countries. The Board concluded that the sub-advisory contracts benefit the Fund and its shareholders by permitting Invesco Advisers to use the resources and talents of the Affiliated Sub-Advisers in managing the Fund. The Board concluded that the
24 Invesco Emerging Market Local Currency Debt Fund
nature, extent and quality of the services provided by the Affiliated Sub-Advisers are appropriate and satisfactory and in accordance with the terms of the Fund’s sub-advisory contracts.
The Board did not consider the performance of the Fund because the Fund does not yet have a full year’s performance history.
| |
| C. | Advisory and Sub-Advisory Fees and Fee Waivers |
The Board noted there was no comparative Lipper expense group material for the Fund because the Fund does not yet have a full year of operations. The Board noted that Invesco Advisers and the Affiliated Sub-Advisers do not manage other mutual funds or client accounts in a manner substantially similar to the management of the Fund.
The Board compared the Fund’s effective fee rate (the advisory fee after advisory fee waivers and before expense limitations/waivers) to the advisory fee rates of other funds advised by Invesco Advisers and its affiliates with investment strategies comparable to those of the Fund. The Board noted that the other funds were offshore funds and determined that a comparison of fees was not apt.
Other than the funds described above, the Board noted that Invesco Advisers and the Affiliated Sub-Advisers do not manage other mutual funds or client accounts in a manner substantially similar to the management of the Fund.
The Board noted that Invesco Advisers has contractually agreed to waive fees and/or limit expenses of the Fund through at least February 28, 2012 in an amount necessary to limit total annual operating expenses to a specified percentage of average daily net assets for each class of the Fund. The Board also considered the effect this fee waiver would have on the Fund’s total estimated expenses.
The Board also considered the services provided by the Affiliated Sub-Advisers pursuant to the sub-advisory contracts, as well as the allocation of fees between Invesco Advisers and the Affiliated Sub-Advisers pursuant to the sub-advisory contracts. The Board noted that Invesco Advisers provides services to sub-advised Invesco Funds, including oversight of the Affiliated Sub-Advisers as well as the additional services described above other than day-to-day portfolio management. The Board also noted that the sub-advisory fees have no direct effect on the Fund or its shareholders, as they are paid by Invesco Advisers to the Affiliated Sub-Advisers.
Based upon the information and considerations described above, the Board concluded that the Fund’s advisory and sub-advisory fees are fair and reasonable.
| |
| D. | Economies of Scale and Breakpoints |
The Board considered the extent to which there are economies of scale in the provision of advisory services to the Fund. The Board also considered whether the Fund benefits from economies of scale through contractual breakpoints in the Fund’s advisory fee schedule. The Board also noted that the Fund shares directly in economies of scale through lower fees charged by third party service providers based on the combined size of the Invesco Funds and other clients advised by Invesco Advisers.
| |
| E. | Profitability and Financial Resources |
The Board reviewed information from Invesco Advisers concerning the costs of the advisory and other services that Invesco Advisers and its affiliates provide to the Fund and the profitability of Invesco Advisers and its affiliates in providing these services. The Board reviewed with Invesco Advisers the methodology used to prepare the profitability information. The Board considered the profitability of Invesco Advisers in connection with managing the Fund and the Invesco Funds. The Board noted that Invesco Advisers continues to operate at a net profit from services Invesco Advisers and its subsidiaries provide to the Fund and the Invesco Funds. The Board concluded that the level of profits realized by Invesco Advisers and its affiliates from providing services to the Fund is not excessive given the nature, quality and extent of the services provided to the Invesco Funds. The Board considered whether Invesco Advisers and each Affiliated Sub-Adviser are financially sound and have the resources necessary to perform their obligations under the investment advisory agreement and sub-advisory contracts. The Board concluded that Invesco Advisers and each Affiliated Sub-Adviser have the financial resources necessary to fulfill these obligations.
| |
| F. | Collateral Benefits to Invesco Advisers and its Affiliates |
The Board considered various other benefits received by Invesco Advisers and its affiliates from the relationship with the Fund, including the fees received for their provision of administrative, transfer agency and distribution services to the Fund. The Board considered the performance of Invesco Advisers and its affiliates in providing these services and the organizational structure employed to provide these services. The Board also considered that these services are provided to the Fund pursuant to written contracts that are reviewed and approved on an annual basis by the Board; that the services are required for the operation of the Fund; that Invesco Advisers and its affiliates can provide services, the nature and quality of which are at least equal to those provided by others offering the same or similar services; and that the fees for such services are fair and reasonable in light of the usual and customary charges by others for services of the same nature and quality.
The Board considered the benefits realized by Invesco Advisers and the Affiliated Sub-Advisers as a result of portfolio brokerage transactions executed through “soft dollar” arrangements. Invesco Advisers noted that the Fund does not execute brokerage transactions through “soft dollar” arrangements to any significant degree.
The Board considered that the Fund’s uninvested cash and cash collateral from any securities lending arrangements may be invested in money market funds advised by Invesco Advisers pursuant to procedures approved by the Board. The Board noted that Invesco Advisers receives advisory fees from these affiliated money market funds attributable to such investments, although Invesco Advisers has contractually agreed to waive through varying periods the advisory fees payable by the Invesco Funds. The waiver is in an amount equal to 100% of the net advisory fee Invesco Advisers receives from the affiliated money market funds with respect to the Fund’s investment in the affiliated money market funds of uninvested cash, but not cash collateral. The Board concluded that the Fund’s investment of uninvested cash and cash collateral from any securities lending arrangements in the affiliated money market funds is in the best interests of the Fund and its shareholders.
25 Invesco Emerging Market Local Currency Debt Fund
Tax Information
Form 1099-DIV, Form 1042-S and other year-end tax information provide shareholders with actual calendar year amounts that should be included in their tax returns. Shareholders should consult their tax advisors.
The following distribution information is being provided as required by the Internal Revenue Code or to meet a specific state’s requirement.
The Fund designates the following amounts or, if subsequently determined to be different, the maximum amount allowable for its fiscal year ended October 31, 2011:
| | | | | |
Federal and State Income Tax | | |
| |
| Qualified Dividend Income* | | | 0.00% | |
| Corporate Dividends Received Deduction* | | | 0.00% | |
| | |
| | * | The above percentages are based on ordinary income dividends paid to shareholders during the Fund’s fiscal year. |
26 Invesco Emerging Market Local Currency Debt Fund
Trustees and Officers
The address of each trustee and officer is AIM Investment Funds (Invesco Investment Funds) (the “Trust”), 11 Greenway Plaza, Suite 2500, Houston, Texas 77046-1173. The trustees serve for the life of the Trust, subject to their earlier death, incapacitation, resignation, retirement or removal as more specifically provided in the Trust’s organizational documents. Each officer serves for a one year term or until their successors are elected and qualified. Column two below includes length of time served with predecessor entities, if any.
| | | | | | | | | |
| | | | | | | Number of
| | |
| | | | | | | Funds in
| | |
| | | | | | | Fund Complex
| | |
Name, Year of Birth and
| | Trustee and/
| | Principal Occupation(s)
| | Overseen by
| | Other Directorship(s)
|
| Position(s) Held with the Trust | | or Officer Since | | During Past 5 Years | | Trustee | | Held by Trustee |
| | | | | | | | | |
| | | | | | | | | |
| Interested Persons | | | | | | | | |
| | | | | | | | | |
| | | | | | | | | |
| | | | | | | | | |
Martin L. Flanagan1 — 1960
Trustee | | 2007 | | Executive Director, Chief Executive Officer and President, Invesco Ltd. (ultimate parent of Invesco and a global investment management firm); Advisor to the Board, Invesco Advisers, Inc. (formerly known as Invesco Institutional (N.A.), Inc.); Trustee, The Invesco Funds; Vice Chair, Investment Company Institute; and Member of Executive Board, SMU Cox School of Business
Formerly: Chairman, Invesco Advisers, Inc. (registered investment adviser); Director, Chairman, Chief Executive Officer and President, IVZ Inc. (holding company), INVESCO Group Services, Inc. (service provider) and Invesco North American Holdings, Inc. (holding company); Director, Chief Executive Officer and President, Invesco Holding Company Limited (parent of Invesco and a global investment management firm); Director, Invesco Ltd.; Chairman, Investment Company Institute and President, Co-Chief Executive Officer, Co-President, Chief Operating Officer and Chief Financial Officer, Franklin Resources, Inc. (global investment management organization) | | 141 | | None |
| | | | | | | | | |
| | | | | | | | | |
| | | | | | | | | |
Philip A. Taylor2 — 1954
Trustee, President and
Principal Executive Officer | | 2006 | | Head of North American Retail and Senior Managing Director, Invesco Ltd.; Director, Co-Chairman, Co-President and Co-Chief Executive Officer, Invesco Advisers, Inc. (formerly known as Invesco Institutional (N.A.), Inc.) (registered investment adviser); Director, Chairman, Chief Executive Officer and President, Invesco Management Group, Inc. (formerly Invesco Aim Management Group, Inc.) (financial services holding company); Director and President, INVESCO Funds Group, Inc. (registered investment adviser and registered transfer agent); Director and Chairman, Invesco Investment Services, Inc. (formerly known as Invesco Aim Investment Services, Inc.) (registered transfer agent) and IVZ Distributors, Inc. (formerly known as INVESCO Distributors, Inc.) (registered broker dealer); Director, President and Chairman, Invesco Inc. (holding company) and Invesco Canada Holdings Inc. (holding company); Chief Executive Officer, Invesco Corporate Class Inc. (corporate mutual fund company) and Invesco Canada Fund Inc. (corporate mutual fund company); Director, Chairman and Chief Executive Officer, Invesco Canada Ltd. (formerly known as Invesco Trimark Ltd./Invesco Trimark Ltèe) (registered investment adviser and registered transfer agent); Trustee, President and Principal Executive Officer, The Invesco Funds (other than AIM Treasurer’s Series Trust (Invesco Treasurer’s Series Trust) and Short-Term Investments Trust); Trustee and Executive Vice President, The Invesco Funds (AIM Treasurer’s Series Trust (Invesco Treasurer’s Series Trust) and Short-Term Investments Trust only); Director, Invesco Investment Advisers LLC (formerly known as Van Kampen Asset Management); Director, Chief Executive Officer and President, Van Kampen Exchange Corp.
Formerly: Director and Chairman, Van Kampen Investor Services Inc.: Director, Chief Executive Officer and President, 1371 Preferred Inc. (holding company); and Van Kampen Investments Inc.; Director and President, AIM GP Canada Inc. (general partner for limited partnerships); and Van Kampen Advisors, Inc.; Director and Chief Executive Officer, Invesco Trimark Dealer Inc. (registered broker dealer); Director, Invesco Distributors, Inc. (formerly known as Invesco Aim Distributors, Inc.) (registered broker dealer); Manager, Invesco PowerShares Capital Management LLC; Director, Chief Executive Officer and President, Invesco Advisers, Inc.; Director, Chairman, Chief Executive Officer and President, Invesco Aim Capital Management, Inc.; President, Invesco Trimark Dealer Inc. and Invesco Trimark Ltd./Invesco Trimark Ltèe; Director and President, AIM Trimark Corporate Class Inc. and AIM Trimark Canada Fund Inc.; Senior Managing Director, Invesco Holding Company Limited; Trustee and Executive Vice President, Tax-Free Investments Trust; Director and Chairman, Fund Management Company (former registered broker dealer); President and Principal Executive Officer, The Invesco Funds (AIM Treasurer’s Series Trust (Invesco Treasurer’s Series Trust), Short-Term Investments Trust and Tax-Free Investments Trust only); President, AIM Trimark Global Fund Inc. and AIM Trimark Canada Fund Inc. | | 141 | | None |
| | | | | | | | | |
| | | | | | | | | |
| | | | | | | | | |
Wayne W. Whalen3 — 1939
Trustee | | 2010 | | Of Counsel, and prior to 2010, partner in the law firm of Skadden, Arps, Slate, Meagher & Flom LLP, legal counsel to funds in the Fund Complex | | 159 | | Director of the Abraham Lincoln Presidential Library Foundation |
| | | | | | | | | |
| | | | | | | | | |
| | | | | | | | | |
| Independent Trustees | | | | | | | | |
| | | | | | | | | |
| | | | | | | | | |
| | | | | | | | | |
Bruce L. Crockett — 1944
Trustee and Chair | | 2001 | | Chairman, Crockett Technology Associates (technology consulting company)
Formerly: Director, Captaris (unified messaging provider); Director, President and Chief Executive Officer COMSAT Corporation; and Chairman, Board of Governors of INTELSAT (international communications company) | | 141 | | ACE Limited (insurance company); and Investment Company Institute |
| | | | | | | | | |
| | | | | | | | | |
| | | | | | | | | |
David C. Arch — 1945
Trustee | | 2010 | | Chairman and Chief Executive Officer of Blistex Inc., a consumer health care products manufacturer. | | 159 | | Member of the Heartland Alliance Advisory Board, a nonprofit organization serving human needs based in Chicago. Board member of the Illinois Manufacturers’ Association. Member of the Board of Visitors, Institute for the Humanities, University of Michigan |
| | | | | | | | | |
| |
| 1 | Mr. Flanagan is considered an interested person of the Trust because he is an officer of the adviser to the Trust, and an officer and a director of Invesco Ltd., ultimate parent of the adviser to the Trust. |
| 2 | Mr. Taylor is considered an interested person of the Trust because he is an officer and a director of the adviser to, and a director of the principal underwriter of, the Trust. |
| 3 | Mr. Whalen has been deemed to be an interested person of the Trust because of his prior service as counsel to the predecessor funds of certain Invesco open-end funds and his affiliation with the law firm that served as counsel to such predecessor funds and continues to serve as counsel to the Invesco Van Kampen closed-end funds. |
T-1 Invesco Emerging Market Local Currency Debt Fund
Trustees and Officers—(continued)
The address of each trustee and officer is AIM Investment Funds (Invesco Investment Funds) (the “Trust”), 11 Greenway Plaza, Suite 2500, Houston, Texas 77046-1173. The trustees serve for the life of the Trust, subject to their earlier death, incapacitation, resignation, retirement or removal as more specifically provided in the Trust’s organizational documents. Each officer serves for a one year term or until their successors are elected and qualified. Column two below includes length of time served with predecessor entities, if any.
| | | | | | | | | |
| | | | | | | Number of
| | |
| | | | | | | Funds in
| | |
| | | | | | | Fund Complex
| | |
Name, Year of Birth and
| | Trustee and/
| | Principal Occupation(s)
| | Overseen by
| | Other Directorship(s)
|
| Position(s) Held with the Trust | | or Officer Since | | During Past 5 Years | | Trustee | | Held by Trustee |
| | | | | | | | | |
| | | | | | | | | |
| Independent Trustees—(continued) | | | | | | | | |
| | | | | | | | | |
| | | | | | | | | |
| | | | | | | | | |
Bob R. Baker — 1936
Trustee | | 2003 | | Retired
Formerly: President and Chief Executive Officer, AMC Cancer Research Center; and Chairman and Chief Executive Officer, First Columbia Financial Corporation | | 141 | | None |
| | | | | | | | | |
| | | | | | | | | |
| | | | | | | | | |
Frank S. Bayley — 1939
Trustee | | 1987 | | Retired
Formerly: Director, Badgley Funds, Inc. (registered investment company) (2 portfolios) and Partner, law firm of Baker & McKenzie | | 141 | | Director and Chairman, C.D. Stimson Company (a real estate investment company) |
| | | | | | | | | |
| | | | | | | | | |
| | | | | | | | | |
James T. Bunch — 1942
Trustee | | 2003 | | Founder, Green, Manning & Bunch Ltd. (investment banking firm)
Formerly: Executive Committee, United States Golf Association; and Director, Policy Studies, Inc. and Van Gilder Insurance Corporation | | 141 | | Vice Chairman, Board of Governors, Western Golf Association/Evans Scholars Foundation and Director, Denver Film Society |
| | | | | | | | | |
| | | | | | | | | |
| | | | | | | | | |
Rodney F. Dammeyer — 1940
Trustee | | 2010 | | President of CAC, LLC, a private company offering capital investment and management advisory services.
Formerly: Prior to January 2004, Director of TeleTech Holdings Inc.; Prior to 2002, Director of Arris Group, Inc.; Prior to 2001, Managing Partner at Equity Group Corporate Investments. Prior to 1995, Vice Chairman of Anixter International. Prior to 1985, experience includes Senior Vice President and Chief Financial Officer of Household International, Inc, Executive Vice President and Chief Financial Officer of Northwest Industries, Inc. and Partner of Arthur Andersen & Co. | | 159 | | Director of Quidel Corporation and Stericycle, Inc. Prior to May 2008, Trustee of The Scripps Research Institute. Prior to February 2008, Director of Ventana Medical Systems, Inc. Prior to April 2007, Director of GATX Corporation. Prior to April 2004, Director of TheraSense, Inc. |
| | | | | | | | | |
| | | | | | | | | |
| | | | | | | | | |
Albert R. Dowden — 1941
Trustee | | 2001 | | Director of a number of public and private business corporations, including the Boss Group, Ltd. (private investment and management); Reich & Tang Funds (5 portfolios) (registered investment company); and Homeowners of America Holding Corporation/ Homeowners of America Insurance Company (property casualty company)
Formerly: Director, Continental Energy Services, LLC (oil and gas pipeline service); Director, CompuDyne Corporation (provider of product and services to the public security market) and Director, Annuity and Life Re (Holdings), Ltd. (reinsurance company); Director, President and Chief Executive Officer, Volvo Group North America, Inc.; Senior Vice President, AB Volvo; Director of various public and private corporations; Chairman, DHJ Media, Inc.; Director Magellan Insurance Company; and Director, The Hertz Corporation, Genmar Corporation (boat manufacturer), National Media Corporation; Advisory Board of Rotary Power International (designer, manufacturer, and seller of rotary power engines); and Chairman, Cortland Trust, Inc. (registered investment company) | | 141 | | Board of Nature’s Sunshine Products, Inc. |
| | | | | | | | | |
| | | | | | | | | |
| | | | | | | | | |
Jack M. Fields — 1952
Trustee | | 2001 | | Chief Executive Officer, Twenty First Century Group, Inc. (government affairs company); and Owner and Chief Executive Officer, Dos Angelos Ranch, L.P. (cattle, hunting, corporate entertainment), Discovery Global Education Fund (non-profit) and Cross Timbers Quail Research Ranch (non-profit)
Formerly: Chief Executive Officer, Texana Timber LP (sustainable forestry company) and member of the U.S. House of Representatives | | 141 | | Administaff |
| | | | | | | | | |
| | | | | | | | | |
| | | | | | | | | |
Carl Frischling — 1937
Trustee | | 2001 | | Partner, law firm of Kramer Levin Naftalis and Frankel LLP | | 141 | | Director, Reich & Tang Funds (6 portfolios) |
| | | | | | | | | |
| | | | | | | | | |
| | | | | | | | | |
Prema Mathai-Davis — 1950
Trustee | | 2001 | | Retired
Formerly: Chief Executive Officer, YWCA of the U.S.A. | | 141 | | None |
| | | | | | | | | |
| | | | | | | | | |
| | | | | | | | | |
Larry Soll — 1942
Trustee | | 2003 | | Retired
Formerly, Chairman, Chief Executive Officer and President, Synergen Corp. (a biotechnology company) | | 141 | | None |
| | | | | | | | | |
| | | | | | | | | |
| | | | | | | | | |
Hugo F. Sonnenschein — 1940
Trustee | | 2010 | | President Emeritus and Honorary Trustee of the University of Chicago and the Adam Smith Distinguished Service Professor in the Department of Economics at the University of Chicago. Prior to July 2000, President of the University of Chicago. | | 159 | | Trustee of the University of Rochester and a member of its investment committee. Member of the National Academy of Sciences, the American Philosophical Society and a fellow of the American Academy of Arts and Sciences |
| | | | | | | | | |
| | | | | | | | | |
| | | | | | | | | |
Raymond Stickel, Jr. — 1944
Trustee | | 2005 | | Retired
Formerly: Director, Mainstay VP Series Funds, Inc. (25 portfolios) and Partner, Deloitte & Touche | | 141 | | Director of Long Cove Club Owners’ Association (home owner’s association) |
| | | | | | | | | |
T-2 Invesco Emerging Market Local Currency Debt Fund
Trustees and Officers—(continued)
The address of each trustee and officer is AIM Investment Funds (Invesco Investment Funds) (the “Trust”), 11 Greenway Plaza, Suite 2500, Houston, Texas 77046-1173. The trustees serve for the life of the Trust, subject to their earlier death, incapacitation, resignation, retirement or removal as more specifically provided in the Trust’s organizational documents. Each officer serves for a one year term or until their successors are elected and qualified. Column two below includes length of time served with predecessor entities, if any.
| | | | | | | | | |
| | | | | | | Number of
| | |
| | | | | | | Funds in
| | |
| | | | | | | Fund Complex
| | |
Name, Year of Birth and
| | Trustee and/
| | Principal Occupation(s)
| | Overseen by
| | Other Directorship(s)
|
| Position(s) Held with the Trust | | or Officer Since | | During Past 5 Years | | Trustee | | Held by Trustee |
| | | | | | | | | |
| | | | | | | | | |
| Other Officers | | | | | | | | |
| | | | | | | | | |
| | | | | | | | | |
| | | | | | | | | |
Russell C. Burk — 1958
Senior Vice President and Senior Officer | | 2005 | | Senior Vice President and Senior Officer of Invesco Funds | | N/A | | N/A |
| | | | | | | | | |
| | | | | | | | | |
| | | | | | | | | |
John M. Zerr — 1962
Senior Vice President, Chief Legal Officer and Secretary | | 2006 | | Director, Senior Vice President, Secretary and General Counsel, Invesco Management Group, Inc. (formerly known as Invesco Aim Management Group, Inc.) and Van Kampen Exchange Corp.; Senior Vice President, Invesco Advisers, Inc. (formerly known as Invesco Institutional (N.A.), Inc.) (registered investment adviser); Senior Vice President and Secretary, Invesco Distributors, Inc. (formerly known as Invesco Aim Distributors, Inc.); Director, Vice President and Secretary, Invesco Investment Services, Inc. (formerly known as Invesco Aim Investment Services, Inc.) and IVZ Distributors, Inc. (formerly known as INVESCO Distributors, Inc.); Director and Vice President, INVESCO Funds Group, Inc.; Senior Vice President, Chief Legal Officer and Secretary, The Invesco Funds; Manager, Invesco PowerShares Capital Management LLC; Director, Secretary and General Counsel, Invesco Investment Advisers LLC (formerly known as Van Kampen Asset Management); Secretary and General Counsel, Van Kampen Funds Inc. and Chief Legal Officer, PowerShares Exchange-Traded Fund Trust, PowerShares Exchange-Traded Fund Trust II, PowerShares India Exchange-Traded Fund Trust and PowerShares Actively Managed Exchange-Traded Fund Trust
Formerly: Director and Secretary, Van Kampen Advisors Inc.; Director Vice President, Secretary and General Counsel Van Kampen Investor Services Inc.; Director, Invesco Distributors, Inc. (formerly known as Invesco Aim Distributors, Inc.); Director, Senior Vice President, General Counsel and Secretary, Invesco Advisers, Inc.; and Van Kampen Investments Inc.; Director, Vice President and Secretary, Fund Management Company; Director, Senior Vice President, Secretary, General Counsel and Vice President, Invesco Aim Capital Management, Inc.; Chief Operating Officer and General Counsel, Liberty Ridge Capital, Inc. (an investment adviser); Vice President and Secretary, PBHG Funds (an investment company) and PBHG Insurance Series Fund (an investment company); Chief Operating Officer, General Counsel and Secretary, Old Mutual Investment Partners (a broker-dealer); General Counsel and Secretary, Old Mutual Fund Services (an administrator) and Old Mutual Shareholder Services (a shareholder servicing center); Executive Vice President, General Counsel and Secretary, Old Mutual Capital, Inc. (an investment adviser); and Vice President and Secretary, Old Mutual Advisors Funds (an investment company) | | N/A | | N/A |
| | | | | | | | | |
| | | | | | | | | |
| | | | | | | | | |
Lisa O. Brinkley — 1959
Vice President | | 2004 | | Global Compliance Director, Invesco Ltd.; Chief Compliance Officer, Invesco Investment Services, Inc.(formerly known as Invesco Aim Investment Services, Inc.); and Vice President, The Invesco Funds
Formerly: Chief Compliance Officer, Invesco Distributors, Inc. (formerly known as Invesco Aim Distributors, Inc.) and Van Kampen Investor Services Inc.; Senior Vice President, Invesco Management Group, Inc.; Senior Vice President and Chief Compliance Officer, Invesco Advisers, Inc. and The Invesco Funds; Vice President and Chief Compliance Officer, Invesco Aim Capital Management, Inc. and Invesco Distributors, Inc.; Vice President, Invesco Investment Services, Inc. and Fund Management Company | | N/A | | N/A |
| | | | | | | | | |
| | | | | | | | | |
| | | | | | | | | |
Sheri Morris — 1964
Vice President, Treasurer and Principal Financial Officer | | 1999 | | Vice President, Treasurer and Principal Financial Officer, The Invesco Funds; and Vice President, Invesco Advisers, Inc. (formerly known as Invesco Institutional (N.A.), Inc.) (registered investment adviser).
Formerly: Treasurer, PowerShares Exchange-Traded Fund Trust, PowerShares Exchange--Traded Fund Trust II, PowerShares India Exchange-Traded Fund Trust and PowerShares Actively Managed Exchange-Traded Fund Trust; Vice President, Invesco Advisers, Inc., Invesco Aim Capital Management, Inc. and Invesco Aim Private Asset Management, Inc.; Assistant Vice President and Assistant Treasurer, The Invesco Funds and Assistant Vice President, Invesco Advisers, Inc., Invesco Aim Capital Management, Inc. and Invesco Aim Private Asset Management, Inc. | | N/A | | N/A |
| | | | | | | | | |
| | | | | | | | | |
| | | | | | | | | |
Karen Dunn Kelley — 1960
Vice President | | 2004 | | Head of Invesco’s World Wide Fixed Income and Cash Management Group; Senior Vice President, Invesco Advisers, Inc. (formerly known as Invesco Institutional (N.A.), Inc.) (registered investment adviser); Executive Vice President, Invesco Distributors, Inc. (formerly known as Invesco Aim Distributors, Inc.); Senior Vice President, Invesco Management Group, Inc. (formerly known as Invesco Aim Management Group, Inc.); and Director, Invesco Mortgage Capital Inc.; Vice President, The Invesco Funds (other than AIM Treasurer’s Series Trust (Invesco Treasurer’s Series Trust) and Short-Term Investments Trust); President and Principal Executive Officer, The Invesco Funds (AIM Treasurer’s Series Trust (Invesco Treasurer’s Series Trust) and Short-Term Investments Trust only).
Formerly: Senior Vice President, Van Kampen Investments Inc.; Vice President, Invesco Advisers, Inc. (formerly known as Invesco Institutional (N.A.), Inc.); Director of Cash Management and Senior Vice President, Invesco Advisers, Inc. and Invesco Aim Capital Management, Inc.; President and Principal Executive Officer, Tax-Free Investments Trust; Director and President, Fund Management Company; Chief Cash Management Officer, Director of Cash Management, Senior Vice President, and Managing Director, Invesco Aim Capital Management, Inc.; Director of Cash Management, Senior Vice President, and Vice President, Invesco Advisers, Inc. and The Invesco Funds (AIM Treasurer’s Series Trust (Invesco Treasurer’s Series Trust), Short-Term Investments Trust and Tax-Free Investments Trust only) | | N/A | | N/A |
| | | | | | | | | |
T-3 Invesco Emerging Market Local Currency Debt Fund
Trustees and Officers—(continued)
The address of each trustee and officer is AIM Investment Funds (Invesco Investment Funds) (the “Trust”), 11 Greenway Plaza, Suite 2500, Houston, Texas 77046-1173. The trustees serve for the life of the Trust, subject to their earlier death, incapacitation, resignation, retirement or removal as more specifically provided in the Trust’s organizational documents. Each officer serves for a one year term or until their successors are elected and qualified. Column two below includes length of time served with predecessor entities, if any.
| | | | | | | | | |
| | | | | | | Number of
| | |
| | | | | | | Funds in
| | |
| | | | | | | Fund Complex
| | |
Name, Year of Birth and
| | Trustee and/
| | Principal Occupation(s)
| | Overseen by
| | Other Directorship(s)
|
| Position(s) Held with the Trust | | or Officer Since | | During Past 5 Years | | Trustee | | Held by Trustee |
| | | | | | | | | |
| | | | | | | | | |
| Other Officers—(continued) | | | | | | | | |
| | | | | | | | | |
| | | | | | | | | |
| | | | | | | | | |
Lance A. Rejsek — 1967
Anti-Money Laundering Compliance Officer | | 2005 | | Anti-Money Laundering Compliance Officer, Invesco Advisers, Inc. (formerly known as Invesco Institutional (N.A.), Inc.) (registered investment adviser); Invesco Distributors, Inc. (formerly known as Invesco Aim Distributors, Inc.), Invesco Investment Services, Inc. (formerly known as Invesco Aim Investment Services, Inc.), The Invesco Funds, PowerShares Exchange-Traded Fund Trust, PowerShares Exchange-Traded Fund Trust II, PowerShares India Exchange-Traded Fund Trust, PowerShares Actively Managed Exchange-Traded Fund Trust, Invesco Investment Advisers LLC (formerly known as Van Kampen Asset Management) and Van Kampen Funds Inc.
Formerly: Anti-Money Laundering Compliance Officer, Van Kampen Investor Services Inc., Fund Management Company, Invesco Advisers, Inc., Invesco Aim Capital Management, Inc. and Invesco Aim Private Asset Management, Inc. | | N/A | | N/A |
| | | | | | | | | |
| | | | | | | | | |
| | | | | | | | | |
Todd L. Spillane — 1958
Chief Compliance Officer | | 2006 | | Senior Vice President, Invesco Management Group, Inc. (formerly known as Invesco Aim Management Group, Inc.) and Van Kampen Exchange Corp.; Senior Vice President and Chief Compliance Officer, Invesco Advisers, Inc. (registered investment adviser) (formerly known as Invesco Institutional (N.A.), Inc.); Chief Compliance Officer, The Invesco Funds, PowerShares Exchange-Traded Fund Trust, PowerShares Exchange-Traded Fund Trust II, PowerShares India Exchange-Traded Fund Trust, PowerShares Actively Managed Exchange-Traded Fund Trust, INVESCO Private Capital Investments, Inc. (holding company) and Invesco Private Capital, Inc. (registered investment adviser); Vice President, Invesco Distributors, Inc. (formerly known as Invesco Aim Distributors, Inc.) and Invesco Investment Services, Inc. (formerly known as Invesco Aim Investment Services, Inc.).
Formerly: Chief Compliance Officer, Invesco Van Kampen Closed-End Funds; Senior Vice President, Van Kampen Investments Inc.; Senior Vice President and Chief Compliance Officer, Invesco Advisers, Inc. and Invesco Aim Capital Management, Inc.; Chief Compliance Officer, Invesco Global Asset Management (N.A.), Inc., Invesco Senior Secured Management, Inc. (registered investment adviser) and Van Kampen Investor Services Inc.; Vice President, Invesco Aim Capital Management, Inc. and Fund Management Company | | N/A | | N/A |
| | | | | | | | | |
The Statement of Additional Information of the Trust includes additional information about the Fund’s Trustees and is available upon request, without charge, by calling 1.800.959.4246. Please refer to the Fund’s prospectus for information on the Fund’s sub-advisers.
| | | | | | | |
Office of the Fund
11 Greenway Plaza, Suite 2500
Houston, TX 77046-1173 | | Investment Adviser
Invesco Advisers, Inc.
1555 Peachtree Street, N.E.
Atlanta, GA 30309 | | Distributor
Invesco Distributors, Inc.
11 Greenway Plaza, Suite 2500
Houston, TX 77046-1173 | | Auditors
PricewaterhouseCoopers LLP
1201 Louisiana Street, Suite 2900
Houston, TX 77002-5678 |
| | | | | | | |
| | | | | | | |
Counsel to the Fund
Stradley Ronon Stevens & Young, LLP
2600 One Commerce Square
Philadelphia, PA 19103 | | Counsel to the Independent Trustees
Kramer, Levin, Naftalis & Frankel LLP
1177 Avenue of the Americas
New York, NY 10036-2714 | | Transfer Agent
Invesco Investment Services, Inc.
11 Greenway Plaza, Suite 2500
Houston, TX 77046-1173 | | Custodian
State Street Bank and Trust Company
225 Franklin
Boston, MA 02110-2801 |
T-4 Invesco Emerging Market Local Currency Debt Fund
Invesco mailing information
Send general correspondence to Invesco Investment Services, Inc., P.O. Box 219078, Kansas City, MO 64121-9078.
Invesco privacy policy
You share personal and financial information with us that is necessary for your transactions and your account records. We take very seriously the obligation to keep that information confidential and private.
Invesco collects nonpublic personal information about you from account applications or other forms you complete and from your transactions with us or our affiliates. We do not disclose information about you or our former customers to service providers or other third parties except to the extent necessary to service your account and in other limited circumstances as permitted by law. For example, we use this information to facilitate the delivery of transaction confirmations, financial reports, prospectuses and tax forms.
Even within Invesco, only people involved in the servicing of your accounts and compliance monitoring have access to your information. To ensure the highest level of confidentiality and security, Invesco maintains physical, electronic and procedural safeguards that meet or exceed federal standards. Special measures, such as data encryption and authentication, apply to your communications with us on our website. More detail is available to you at invesco.com/privacy.
Important notice regarding delivery of security holder documents
To reduce Fund expenses, only one copy of most shareholder documents may be mailed to shareholders with multiple accounts at the same address (Householding). Mailing of your shareholder documents may be householded indefinitely unless you instruct us otherwise. If you do not want the mailing of these documents to be combined with those for other members of your household, please contact Invesco Investment Services, Inc. at 800 959 4246 or contact your financial institution. We will begin sending you individual copies for each account within 30 days after receiving your request.
Fund holdings and proxy voting information
The Fund provides a complete list of its holdings four times in each fiscal year, at the quarter-ends. For the second and fourth quarters, the lists appear in the Fund’s semiannual and annual reports to shareholders. For the first and third quarters, the Fund files the lists with the Securities and Exchange Commission (SEC) on Form N-Q. The most recent list of portfolio holdings is available at invesco.com/completeqtrholdings. Shareholders can also look up the Fund’s Forms N-Q on the SEC website at sec.gov. Copies of the Fund’s Forms N-Q may be reviewed and copied at the SEC Public Reference Room in Washington, D.C. You can obtain information on the operation of the Public Reference Room, including information about duplicating fee charges, by calling 202 551 8090 or 800 732 0330, or by electronic request at the following email address: publicinfo@sec.gov. The SEC file numbers for the Fund are 811-05426 and 033-19338.
A description of the policies and procedures that the Fund uses to determine how to vote proxies relating to portfolio securities is available without charge, upon request, from our Client Services department at 800 959 4246 or at invesco.com/proxyguidelines. The information is also available on the SEC website, sec.gov.
Information regarding how the Fund voted proxies related to its portfolio securities during the 12 months ended June 30, 2011, is available at invesco.com/proxysearch. The information is also available on the SEC website, sec.gov.
Invesco Advisers, Inc. is an investment adviser; it provides investment advisory services to individual and institutional clients and does not sell securities. Invesco Distributors, Inc. is the U.S. distributor for Invesco Ltd.’s retail mutual funds, exchange-traded funds and institutional money market funds. Both are wholly owned, indirect subsidiaries of Invesco Ltd.
| | | | | |
|
| |
| | | EMLCD-AR-1 | | Invesco Distributors, Inc. |
| | | |
|
| |
Annual Report to Shareholders | | October 31, 2011 |
Invesco Endeavor Fund
Nasdaq:
A: ATDAX § B: ATDBX § C: ATDCX § R: ATDRX § Y: ATDYX § Institutional: ATDIX
| | | |
|
| |
| 2 | | Letters to Shareholders |
| 4 | | Performance Summary |
| 4 | | Management Discussion |
| 6 | | Long-Term Fund Performance |
| 8 | | Supplemental Information |
| 9 | | Schedule of Investments |
| 10 | | Financial Statements |
| 12 | | Notes to Financial Statements |
| 19 | | Financial Highlights |
| 20 | | Auditor’s Report |
| 21 | | Fund Expenses |
| 22 | | Approval of Investment Advisory and Sub-Advisory Agreements |
| T-1 | | Trustees and Officers |
Letters to Shareholders

Philip Taylor
Dear Shareholders:
Enclosed is important information about your Fund and its performance. I encourage you to read this report to learn more about your Fund’s short- and long-term performance and its holdings as of the close of the reporting period. This report also includes useful information about your Fund’s management team and a discussion of how your Fund was managed during the reporting period.
Investors are likely to confront both opportunities and challenges in 2012 – just as we did in 2011. After all, changes in market sentiment never do investors the courtesy of announcing their impending arrival, and your goals and needs may have changed, requiring changes in your financial strategy.
That’s why the start of a new year is always a good time to catch up with your financial adviser. He or she can explain how your investments performed in the year just ended – how each performed individually, and more important, how they performed as a diversified portfolio. Of course, it’s important to remember that an investment’s long-term performance is more important than its short-term performance. Looking ahead to the new year and evaluating your individual situation, your financial adviser can provide valuable insight into whether your investments are still appropriate for your individual needs, goals and risk tolerance.
For current information about your Fund
In addition to meeting with your financial adviser to discuss your individual situation at the start of the new year, you also may find it helpful to stay abreast of market trends and developments. Doing so may provide reassurance in times of economic uncertainty and market volatility such as we saw in 2011 – and are likely to see again in 2012.
Invesco can help you stay informed about your investments and market trends. On our website, invesco.com/us, we provide timely market updates and commentary from many of our fund managers and other investment professionals. Also on our website, you can obtain information about your account at any hour of the day or night. I invite you to visit and explore the tools and information we offer at invesco.com/us.
Our commitment to investment excellence
As we’ve seen over the last several years, market conditions can change – often suddenly and dramatically. That’s one reason financial advisers typically advise their clients to be well diversified and to maintain a long-term investment focus. While diversification can’t guarantee a profit or protect against loss, it may cushion the impact of dramatic market moves. Maintaining a long-term investment focus for your long-term goals – financing your retirement or your children’s education, for example – may help you avoid making rash investment decisions based on short-term market swings.
Likewise, Invesco’s investment professionals maintain a long-term focus. Across our broad array of investment products, investment excellence is our ultimate goal. Each of our funds is managed by specialized teams of investment professionals, and as a company, we maintain a single focus – investment management – that allows our fund managers to concentrate on doing what they do best: managing your money.
Our funds are managed strictly according to their stated investment objectives and strategies, with robust risk oversight using consistent, repeatable investment processes that don’t change in response to short-term market events. This disciplined approach can’t guarantee a profit; no investment can do that, since all involve some measure of risk. But it can ensure that your money is managed the way we said it would be – according to your Fund’s objective and strategies.
Our adherence to stated investment objectives and strategies allows your financial adviser to build a diversified portfolio that meets your individual risk tolerance and financial goals. It also means that when your goals change, your financial adviser will be able to find an Invesco fund that’s appropriate for your needs.
Questions?
If you have questions about your account, please contact one of our client service representatives at 800 959 4246. If you have a general Invesco-related question or comment for me, I invite you to email me directly at phil@invesco.com.
All of us at Invesco look forward to serving your investment management needs for many years to come. Thank you for investing with us.
Sincerely,
Philip Taylor
Senior Managing Director, Invesco Ltd.
2 Invesco Endeavor Fund

Bruce Crockett
Dear Fellow Shareholders:
Although the world’s economies are gradually recovering from the financial crisis, it has not been a smooth path. Unrest in the Middle East, persistently weak job and housing markets in the U.S. and continued government balance sheet repair in Europe are contributing to a slow, labored march toward global recovery.
In this environment, investors face risks that could make it more difficult to achieve their long-term financial goals – a secure retirement, home ownership, a child’s college education. Although the markets are complex and dynamic, there are ways to simplify the process and potentially increase your odds of achieving your goals. The best approach is to create a solid financial plan that helps you save and invest in ways that anticipate your needs over the long term.
Your financial adviser can help you define your financial plan, develop an appropriate investment strategy and put you in a better position to achieve your financial goals over the long term. This can take some of the guesswork out of the process and help you make thoughtful investments. Your financial adviser also can help you better understand your tolerance for risk, so that your investment approach lets you sleep at night while getting you closer to your goals. Lastly, your financial adviser can develop an asset allocation strategy that seeks to balance your investment approach, providing some protection against a decline in the markets while allowing you to participate in rising markets. Invesco calls this type of approach “intentional investing.” It means thinking carefully, planning thoughtfully and acting deliberately.
While no investment can guarantee favorable returns, your Board remains committed to managing costs and enhancing the performance of Invesco’s funds as part of our Investor First orientation. We continue to oversee the funds with the same strong sense of responsibility for your money and your continued trust that we’ve always maintained.
Thanks to the approval of our fund shareholders, Invesco has made great progress in realigning our U.S. mutual fund product line following our acquisition of Morgan Stanley’s retail asset management business, including Van Kampen Investments. When completed, the realignment will reduce overlap in the product lineup, enhance efficiency across our product line and build a solid foundation for further growth to meet client and shareholder needs. I would like to thank those of you who voted your proxy, and I hope our shareholders haven’t been too inconvenienced by the process.
As always, please contact me at bruce@brucecrockett.com with any questions or concerns you may have. On behalf of your Board, we look forward to continuing to represent your interests and serving your needs.
Sincerely,
Bruce L. Crockett
Independent Chair
Invesco Funds Board of Trustees
3 Invesco Endeavor Fund
Management’s Discussion of Fund Performance
Performance summary
For the fiscal year ended October 31, 2011, all share classes of Invesco Endeavor Fund, at net asset value (NAV), outperformed the Fund’s broad market, style-specific and peer group indexes.
Drivers of performance were largely stock specific. We attribute the Fund’s outperformance versus its style-specific index mainly to above-market returns from select investments in the health care and consumer discretionary sectors. Alternatively, select holdings in the industrials and information technology (IT) sectors were the largest detractors from Fund performance during the fiscal year.
Your Fund’s long-term performance appears later in this report.
Fund vs. Indexes
Total returns, 10/31/10 to 10/31/11, at net asset value (NAV). Performance shown does not include applicable contingent deferred sales charges (CDSC) or front-end sales charges, which would have reduced performance.
| | | | | |
|
| Class A Shares | | | 10.61 | % |
| |
| Class B Shares | | | 9.82 | |
| |
| Class C Shares | | | 9.81 | |
| |
| Class R Shares | | | 10.32 | |
| |
| Class Y Shares | | | 10.97 | |
| |
| Institutional Class Shares | | | 11.19 | |
| |
S&P 500 Index▼ (Broad Market Index) | | | 8.07 | |
| |
Russell Midcap Index▼ (Style-Specific Index) | | | 7.85 | |
| |
Lipper Mid-Cap Core Funds Index▼ (Peer Group Index) | | | 4.66 | |
How we invest
We view ourselves as business people buying businesses, and we consider the purchase of a stock as an ownership interest in a business. We strive to develop a proprietary view of a business through in-depth, fundamental research that includes careful financial statement analysis and meetings with company management teams. We then seek to purchase businesses whose stock prices are below what we have calculated to be the true value of the company based on its future free cash flows.
In conducting a comprehensive analysis of a company, we strive to identify primarily U.S. stocks that have:
| n | | Sustainable competitive advantages. |
| |
| n | | Strong growth prospects. |
| |
| n | | Attractive economics. |
| |
| n | | Honest and capable management teams. |
Also central to our discipline is our adherence to an investment horizon of three- to five years. We use this long-term approach because we believe good business strategies usually take that long to implement and to produce strong earnings growth. We also use a concentrated portfolio approach, constructing a portfolio of about 20 to 30 stocks. We believe this allows each investment opportunity to materially impact Fund performance.
While deliberate efforts are made to reduce risk through industry diversification, our primary method of attempting to reduce risk is to purchase businesses that are trading below their estimated intrinsic value. Thus, if our assessment of the company’s future is incorrect and the stock declines in price, the impact should be tempered since we originally acquired the stock at less than its estimated intrinsic value.
| | | Holdings are considered for sale if: |
| |
| n | | A more attractive investment opportunity exists. |
| |
| n | | Full value of the investment is deemed to have been realized. |
Holdings are also considered for sale if the original thesis for buying the company changes due to a fundamental negative change in management strategy or a fundamental negative change in the competitive environment.
Market conditions and your Fund
The fiscal year began with equity markets on an upward trend through the first quarter of 2011. Corporate fundamentals continued to advance as cost controls and improving revenues helped produce strong margins and earnings. However, in the latter half of the fiscal year, investor focus shifted from fundamentals to global macroeconomic concerns. Market volatility drastically increased due to civil unrest in Egypt and Libya and the devastating earthquake and tsunami in Japan. At the same time, the sovereign debt crisis intensified in the eurozone and growth in developed economies decelerated, prompting fears of a global recession. Despite significant volatility, most major equity indexes managed positive returns for the fiscal year.
Our investment approach focuses on individual businesses rather than market sectors. Therefore, your Fund shares little in common with sector weightings of the Fund’s indexes. However, if we were to broadly categorize businesses with which we had the most success during the fiscal year, our investments in select health care and consumer discretionary stocks were among the largest contributors to Fund performance. Select holdings in the industrials and IT sectors were among the largest detractors.
Health care company Kinetic Concepts was the largest contributor to Fund results during the fiscal year. Kinetic Concepts is a global leader in “negative pressure wound therapy” that
Portfolio Composition
By sector
| | | | | |
|
| Industrials | | | 31.7 | % |
| |
| Information Technology | | | 16.9 | |
| |
| Health Care | | | 11.3 | |
| |
| Materials | | | 8.5 | |
| |
| Financials | | | 5.1 | |
| |
| Consumer Staples | | | 4.0 | |
| |
| Consumer Discretionary | | | 0.5 | |
| |
Money Market Funds
Plus Other Assets Less Liabilities | | | 22.0 | |
Top 10 Equity Holdings*
| | | | | | | | | |
|
| | 1. | | | Brightpoint, Inc. | | | 5.4 | % |
| |
| | 2. | | | Newalta Corp. | | | 5.4 | |
| |
| | 3. | | | International Rectifier Corp. | | | 4.8 | |
| |
| | 4. | | | Quanta Services, Inc. | | | 4.8 | |
| |
| | 5. | | | Louisiana-Pacific Corp. | | | 4.7 | |
| |
| | 6. | | | Pike Electric Corp. | | | 4.7 | |
| |
| | 7. | | | Activision Blizzard, Inc. | | | 4.5 | |
| |
| | 8. | | | Zimmer Holdings, Inc. | | | 4.5 | |
| |
| | 9. | | | Orion Marine Group, Inc. | | | 4.3 | |
| |
| | 10. | | | Molson Coors Brewing Co.-Class B | | | 4.0 | |
| | | | | |
|
| Total Net Assets | | $228.5 million | |
| | | | | |
| Total Number of Holdings* | | | 24 | |
The Fund’s holdings are subject to change, and there is no assurance that the Fund will continue to hold any particular security.
*Excluding money market fund holdings.
4 Invesco Endeavor Fund
helps heal acute wounds faster than gauze dressings. A significant segment of the company is its regenerative tissue business. Kinetic Concepts has an industry-leading product in this segment that we believe has great potential to increase sales in Europe and around the world. Overall, we believe the company has innovative technologies, superior distribution and a highly efficient billing system. Shares of the company appreciated during most of the reporting period, especially after it received a takeover offer from a private equity firm in mid-July. We sold our position in Kinetic Concepts during the reporting period.
Another top contributor to Fund performance was Arbitron. Arbitron is a rating provider for radio stations that offers information on listener habits and demographic data. Arbitron developed a technology that will enhance the reliability and accuracy of gathering listener data – versus the current method of listeners diarizing the information, which isn’t as accurate because it depends on the listener’s memory. During the reporting period, Arbitron announced it had renewed a multi-year contract with its largest customer. Although we believed there was little risk that this renewal would not occur, the company’s share price appreciated as the news provided some clarity for market participants. We took the opportunity to sell our position in Arbitron as a result of the strong price appreciation.
Orion Marine Group and Research in Motion were the largest detractors from Fund performance during the fiscal year. Orion Marine Group is a marine specialty contractor for the heavy civil marine infrastructure market operating mainly along the U.S. Gulf Coast, Atlantic Seaboard and Caribbean Basin. The share price of the company’s stock declined mainly because of investor concerns regarding the strength of the U.S. economy and the general outlook for infrastructure spending. We used this price weakness as an opportunity to add to our position in Orion Marine Group. Research in Motion is a global leader in the wireless industry with their BlackBerry line of devices. Product delays caused the company to miss near-term market expectations. Investors sold shares en masse, as intense competitive pressure and ongoing execution challenges have called into question Research in Motion’s ability to compete effectively in the smartphone market.
Given the Fund’s small exposure to foreign securities, we attempt to partially limit our exposure to currency fluctuations by using currency hedges – the purchase or sale of a foreign security denominated or quoted in that currency. Over the long-term, this technique has allowed us to lock in current exchange rates so the returns of our foreign stocks are more representative of their local currency returns. Our currency hedges made a small positive contribution to the Fund’s overall performance during the fiscal year.
Increased market volatility during the fiscal year presented some select buying opportunities. We took advantage of this market situation by making some new investments and adding to some of our existing holdings. We also sold several holdings based on valuations and other factors.
During the fiscal year, we continued to focus on finding quality businesses trading at attractive values relative to what we believe are their long-term prospects. In contrast, the market is often driven by short-term events or outlooks. Market volatility during the reporting period allowed us to take advantage of investment opportunities we believe may benefit your Fund in the long term. Given this volatility, we would like to caution investors against making investment decisions based on short-term performance. As always, we recommend that you consult a financial adviser to discuss your individual financial program.
While we can never predict future Fund performance, we pledge to you that we will adhere to our discipline of being business people who buy businesses – and we will continually strive to upgrade the quality of your Fund’s portfolio.
As always, we thank you for your investment in Invesco Endeavor Fund and for sharing our long-term investment perspective.
The views and opinions expressed in management’s discussion of Fund performance are those of Invesco Advisers, Inc. These views and opinions are subject to change at any time based on factors such as market and economic conditions. These views and opinions may not be relied upon as investment advice or recommendations, or as an offer for a particular security. The information is not a complete analysis of every aspect of any market, country, industry, security or the Fund. Statements of fact are from sources considered reliable, but Invesco Advisers, Inc. makes no representation or warranty as to their completeness or accuracy. Although historical performance is no guarantee of future results, these insights may help you understand our investment management philosophy.
See important Fund and, if applicable, index disclosures later in this report.
Clayton Zacharias
Chartered Financial Analyst, portfolio manager, is lead manager of Invesco Endeavor Fund. Mr. Zacharias joined Invesco in 2002. He earned a B.B.A. from Simon Fraser University.
Mark Uptigrove
Chartered Financial Analyst, portfolio manager, is manager of Invesco Endeavor Fund. Mr. Uptigrove joined Invesco in 2005. He earned a B.A. from the University of Western Ontario and an M.B.A. from the Richard Ivey School of Business.
5 Invesco Endeavor Fund
Your Fund’s Long-Term Performance
Results of a $10,000 Investment – Oldest Share Classes since Inception
Index data from 10/31/03, Fund data from 11/4/03
Past performance cannot guarantee comparable future results.
The data shown in the chart include reinvested distributions, applicable sales charges and Fund expenses including management fees. Results for Class B shares are calculated as if a hypothetical shareholder had liquidated his entire investment in the Fund at the close of the reporting period and paid the contingent deferred sales charges, if applicable. Index results include reinvested dividends, but they do not reflect sales
charges. Performance of the peer group, if applicable, reflects fund expenses and management fees; performance of a market index does not. Performance shown in the chart and table(s) does not reflect deduction of taxes a shareholder would pay on Fund distributions or sale of Fund shares.
This chart, which is a logarithmic chart, presents the fluctuations in the value of the Fund and its indexes. We believe that a logarithmic chart is more effective than other types of charts in illustrating
changes in value during the early years shown in the chart. The vertical axis, the one that indicates the dollar value of an investment, is constructed with each segment representing a percent change in the value of the investment. In this chart, each segment represents a doubling, or 100% change, in the value of the investment. In other words, the space between $5,000 and $10,000 is the same size as the space between $10,000 and $20,000, and so on.
6 Invesco Endeavor Fund
Average Annual Total Returns
As of 10/31/11, including maximum applicable
sales charges
| | | | | | | | | |
|
| Class A Shares | | | | |
| |
| Inception (11/4/03) | | | 7.64 | % |
| |
| | 5 | | | Years | | | 2.78 | |
| |
| | 1 | | | Year | | | 4.54 | |
| |
| | | | | | | | | |
| Class B Shares | | | | |
| |
| Inception (11/4/03) | | | 7.62 | % |
| |
| | 5 | | | Years | | | 2.81 | |
| |
| | 1 | | | Year | | | 4.82 | |
| |
| | | | | | | | | |
| Class C Shares | | | | |
| |
| Inception (11/4/03) | | | 7.63 | % |
| |
| | 5 | | | Years | | | 3.17 | |
| |
| | 1 | | | Year | | | 8.81 | |
| |
| | | | | | | | | |
| Class R Shares | | | | |
| |
| Inception | | | 8.15 | % |
| |
| | 5 | | | Years | | | 3.70 | |
| |
| | 1 | | | Year | | | 10.32 | |
| |
| | | | | | | | | |
| Class Y Shares | | | | |
| |
| Inception | | | 8.51 | % |
| |
| | 5 | | | Years | | | 4.12 | |
| |
| | 1 | | | Year | | | 10.97 | |
| |
| | | | | | | | | |
| Institutional Class Shares | | | | |
| |
| Inception | | | 8.93 | % |
| |
| | 5 | | | Years | | | 4.52 | |
| |
| | 1 | | | Year | | | 11.19 | |
Class R shares incepted on April 30, 2004. Performance shown prior to that date is that of Class A shares, restated to reflect the higher 12b-1 fees applicable to Class R shares. Class A share performance reflects any applicable fee waivers or expense reimbursements.
Class Y shares incepted on October 3, 2008. Performance shown prior to that date is that of Class A shares and includes the 12b-1 fees applicable to Class A shares. Class A share performance reflects any applicable fee waivers or expense reimbursements.
Institutional Class shares incepted on April 30, 2004. Performance shown prior to that date is that of Class A shares and includes the 12b-1 fees applicable to Class A shares. Class A share performance reflects any applicable fee waivers or expense reimbursements.
Average Annual Total Returns
As of 9/30/11, the most recent calendar quarter-end, including maximum applicable sales charges
| | | | | | | | | |
|
| Class A Shares | | | | |
| |
| Inception (11/4/03) | | | 6.31 | % |
| |
| | 5 | | | Years | | | 1.90 | |
| |
| | 1 | | | Year | | | -2.51 | |
| |
| | | | | | | | | |
| Class B Shares | | | | |
| |
| Inception (11/4/03) | | | 6.31 | % |
| |
| | 5 | | | Years | | | 1.93 | |
| |
| | 1 | | | Year | | | -2.59 | |
| |
| | | | | | | | | |
| Class C Shares | | | | |
| |
| Inception (11/4/03) | | | 6.31 | % |
| |
| | 5 | | | Years | | | 2.29 | |
| |
| | 1 | | | Year | | | 1.41 | |
| |
| | | | | | | | | |
| Class R Shares | | | | |
| |
| Inception | | | 6.83 | % |
| |
| | 5 | | | Years | | | 2.81 | |
| |
| | 1 | | | Year | | | 2.90 | |
| |
| | | | | | | | | |
| Class Y Shares | | | | |
| |
| Inception | | | 7.18 | % |
| |
| | 5 | | | Years | | | 3.22 | |
| |
| | 1 | | | Year | | | 3.41 | |
| |
| | | | | | | | | |
| Institutional Class Shares | | | | |
| |
| Inception | | | 7.59 | % |
| |
| | 5 | | | Years | | | 3.62 | |
| |
| | 1 | | | Year | | | 3.66 | |
The performance data quoted represent past performance and cannot guarantee comparable future results; current performance may be lower or higher. Please visit invesco.com/performance for the most recent month-end performance. Performance figures reflect reinvested distributions, changes in net asset value and the effect of the maximum sales charge unless otherwise stated. Investment return and principal value will fluctuate so that you may have a gain or loss when you sell shares.
The total annual Fund operating expense ratio set forth in the most recent Fund prospectus as of the date of this report for Class A, Class B, Class C, Class R, Class Y and Institutional Class shares was 1.47%, 2.22%, 2.22%, 1.72%, 1.22% and 0.96%, respectively. The expense
ratios presented above may vary from the expense ratios presented in other sections of this report that are based on expenses incurred during the period covered by this report.
Class A share performance reflects the maximum 5.50% sales charge, and Class B and Class C share performance reflects the applicable contingent deferred sales charge (CDSC) for the period involved. The CDSC on Class B shares declines from 5% beginning at the time of purchase to 0% at the beginning of the seventh year. The CDSC on Class C shares is 1% for the first year after purchase. Class R, Class Y and Institutional Class shares do not have a front-end sales charge or a CDSC; therefore, performance is at net asset value.
The performance of the Fund’s share classes will differ primarily due to different sales charge structures and class expenses.
7 Invesco Endeavor Fund
Invesco Endeavor Fund’s investment objective is long-term growth of capital.
| n | | Unless otherwise stated, information presented in this report is as of October 31, 2011, and is based on total net assets. |
| |
| n | | Unless otherwise noted, all data provided by Invesco. |
| |
| n | | To access your Fund’s reports/prospectus, visit invesco.com/fundreports. |
About share classes
| n | | Class B shares may not be purchased or acquired by exchange from share classes other than Class B shares. Please see the prospectus for more information. |
| |
| n | | Class R shares are available only to certain retirement plans. Please see the prospectus for more information. |
| |
| n | | Class Y shares are available to only certain investors. Please see the prospectus for more information. |
| |
| n | | Institutional Class shares are offered exclusively to institutional investors, including defined contribution plans that meet certain criteria. Please see the prospectus for more information. |
Principal risks of investing in the Fund
| n | | Debt securities risk. The Fund may invest in debt securities that are affected by changing interest rates and changes in their effective maturities and credit quality. |
| |
| n | | Foreign securities risk. The Fund’s foreign investments may be affected by changes in a foreign country’s exchange rates; political and social instability; changes in economic or taxation policies; difficulties when enforcing obligations; decreased liquidity; and increased volatility. Foreign companies may be subject to less regulation resulting in less publicly available information about the companies. |
| |
| n | | Management risk. The investment techniques and risk analysis used by the Fund’s portfolio managers may not produce the desired results. |
| |
| n | | Market risk. The prices of and the income generated by the Fund’s securities may decline in response to, among other things, investor sentiment; general economic and market conditions; regional or global instability; and currency and interest rate fluctuations. |
| n | | Small- and mid-capitalization risk. Stocks of small and mid-sized companies tend to be more vulnerable to adverse developments in the above factors and may have little or no operating history or track record of success, and limited product lines, markets, management and financial resources. The securities of small and mid-sized companies may be more volatile due to less market interest and less publicly available information about the issuer. They also may be illiquid or restricted as to resale, or may trade less frequently and in smaller volumes, all of which may cause difficulty when establishing or closing a position at a desirable price. |
| |
| n | | U.S. government obligations risk. The Fund may invest in obligations issued by U.S. Government agencies and instrumentalities that may receive varying levels of support from the government, which could affect the Fund’s ability to recover should they default. |
About indexes used in this report
| n | | The S&P 500® Index is an unmanaged index considered representative of the U.S. stock market. |
| |
| n | | The Russell Midcap® Index is an unmanaged index considered representative of mid-cap stocks. The Russell Midcap Index is a trademark/service mark of the Frank Russell Co. Russell® is a trademark of the Frank Russell Co. |
| |
| n | | The Lipper Mid-Cap Core Funds Index is an unmanaged index considered representative of mid-cap core funds tracked by Lipper. |
| |
| n | | The Fund is not managed to track the performance of any particular index, including the index(es) defined here, and consequently, the performance of the Fund may deviate significantly from the performance of the index(es). |
| n | | A direct investment cannot be made in an index. Unless otherwise indicated, index results include reinvested dividends, and they do not reflect sales charges. Performance of the peer group, if applicable, reflects fund expenses; performance of a market index does not. |
Other information
| n | | The Chartered Financial Analyst® (CFA®) designation is globally recognized and attests to a charterholder’s success in a rigorous and comprehensive study program in the field of investment management and research analysis. |
| |
| n | | The returns shown in management’s discussion of Fund performance are based on net asset values calculated for shareholder transactions. Generally accepted accounting principles require adjustments to be made to the net assets of the Fund at period end for financial reporting purposes, and as such, the net asset values for shareholder transactions and the returns based on those net asset values may differ from the net asset values and returns reported in the Financial Highlights. |
| |
| n | | Industry classifications used in this report are generally according to the Global Industry Classification Standard, which was developed by and is the exclusive property and a service mark of MSCI Inc. and Standard & Poor’s. |
This report must be accompanied or preceded by a currently effective Fund prospectus, which contains more complete information, including sales charges and expenses. Investors should read it carefully before investing.
NOT FDIC INSURED | MAY LOSE VALUE | NO BANK GUARANTEE
Fund Nasdaq Symbols
| | | |
|
| Class A Shares | | ATDAX |
| Class B Shares | | ATDBX |
| Class C Shares | | ATDCX |
| Class R Shares | | ATDRX |
| Class Y Shares | | ATDYX |
| Institutional Class Shares | | ATDIX |
8 Invesco Endeavor Fund
Schedule of Investments(a)
October 31, 2011
| | | | | | | | | |
| | | Shares | | Value |
| |
Common Stocks & Other Equity Interests–78.02%
|
Airlines–1.87%
| | | | |
Ryanair Holdings PLC–ADR (Ireland)(b) | | | 148,800 | | | $ | 4,280,976 | |
| |
Brewers–4.02%
| | | | |
| Molson Coors Brewing Co.–Class B | | | 216,908 | | | | 9,183,885 | |
| |
Building Products–2.42%
| | | | |
| Kingspan Group PLC (Ireland) | | | 621,400 | | | | 5,519,718 | |
| |
Communications Equipment–2.28%
| | | | |
| Plantronics, Inc. | | | 110,000 | | | | 3,675,100 | |
| |
Research In Motion Ltd. (Canada)(b) | | | 76,200 | | | | 1,539,240 | |
| |
| | | | | | | | 5,214,340 | |
| |
Construction & Engineering–13.72%
| | | | |
Orion Marine Group, Inc.(b)(c) | | | 1,445,000 | | | | 9,811,550 | |
| |
Pike Electric Corp.(b) | | | 1,398,471 | | | | 10,642,364 | |
| |
Quanta Services, Inc.(b) | | | 521,100 | | | | 10,885,779 | |
| |
| | | | | | | | 31,339,693 | |
| |
Distributors–0.24%
| | | | |
| Pool Corp. | | | 18,726 | | | | 547,174 | |
| |
Diversified Chemicals–3.75%
| | | | |
Solutia Inc.(b) | | | 527,221 | | | | 8,567,341 | |
| |
Environmental & Facilities Services–5.39%
| | | | |
| Newalta Corp. (Canada) | | | 1,040,369 | | | | 12,315,083 | |
| |
Forest Products–4.71%
| | | | |
Louisiana-Pacific Corp.(b) | | | 1,619,250 | | | | 10,768,012 | |
| |
Health Care Distributors–3.58%
| | | | |
| Patterson Cos. Inc. | | | 260,000 | | | | 8,182,200 | |
| |
Health Care Equipment–4.46%
| | | | |
Zimmer Holdings, Inc.(b) | | | 193,500 | | | | 10,183,905 | |
| |
Home Entertainment Software–4.48%
| | | | |
| Activision Blizzard, Inc. | | | 765,000 | | | | 10,243,350 | |
| |
Industrial Conglomerates–2.42%
| | | | |
| DCC PLC (Ireland) | | | 199,800 | | | | 5,521,573 | |
| |
Leisure Facilities–0.26%
| | | | |
| International Speedway Corp.–Class A | | | 24,651 | | | | 588,173 | |
| |
Life & Health Insurance–3.18%
| | | | |
| Unum Group | | | 305,000 | | | | 7,271,200 | |
| |
Managed Health Care–3.26%
| | | | |
| UnitedHealth Group Inc. | | | 155,000 | | | | 7,438,450 | |
| |
Multi-Line Insurance–1.92%
| | | | |
| Vienna Insurance Group AG Wiener Versicherung Gruppe (Austria) | | | 105,249 | | | | 4,390,411 | |
| |
Semiconductors–4.75%
| | | | |
International Rectifier Corp.(b) | | | 447,098 | | | | 10,860,010 | |
| |
Technology Distributors–5.40%
| | | | |
Brightpoint, Inc.(b) | | | 1,215,504 | | | | 12,337,366 | |
| |
Trading Companies & Distributors–3.19%
| | | | |
Grafton Group PLC (Ireland)(d) | | | 1,878,806 | | | | 7,279,171 | |
| |
Trucking–2.72%
| | | | |
| Con-way Inc. | | | 211,300 | | | | 6,227,011 | |
| |
| Total Common Stocks & Other Equity Interests (Cost $164,700,597) | | | | | | | 178,259,042 | |
| |
Money Market Funds–22.08%
|
Liquid Assets Portfolio–Institutional Class(e) | | | 25,228,753 | | | | 25,228,753 | |
| |
Premier Portfolio–Institutional Class(e) | | | 25,228,753 | | | | 25,228,753 | |
| |
| Total Money Market Funds (Cost $50,457,506) | | | | | | | 50,457,506 | |
| |
| TOTAL INVESTMENTS–100.10% (Cost $215,158,103) | | | | | | | 228,716,548 | |
| |
| OTHER ASSETS LESS LIABILITIES–(0.10)% | | | | | | | (234,146 | ) |
| |
| NET ASSETS–100.00% | | | | | | $ | 228,482,402 | |
| |
Investment Abbreviation:
| | | |
| ADR | | – American Depositary Receipt |
Notes to Schedule of Investments:
| | |
| (a) | | Industry and/or sector classifications used in this report are generally according to the Global Industry Classification Standard, which was developed by and is the exclusive property and a service mark of MSCI Inc. and Standard & Poor’s. |
| (b) | | Non-income producing security. |
| (c) | | Affiliated company during the period. The Investment Company Act of 1940 defines affiliates as those issuances in which a fund holds 5% or more of the outstanding voting securities. The Fund has not owned enough of the outstanding voting securities of the issuer to have control (as defined in the Investment Company Act of 1940) of that issuer. The value of this security as of October 31, 2011 represented 4.29% of the Fund’s Net Assets. See Note 5. |
| (d) | | Each unit is comprised of one ordinary share of Euro 0.05, one C share and seventeen Class A shares. |
| (e) | | The money market fund and the Fund are affiliated by having the same investment adviser. |
See accompanying Notes to Financial Statements which are an integral part of the financial statements.
9 Invesco Endeavor Fund
Statement of Assets and Liabilities
October 31, 2011
| | | | | |
Assets:
|
| Investments, at value (Cost $150,761,579) | | $ | 168,447,492 | |
| |
| Investments in affiliates, at value (Cost $64,396,524) | | | 60,269,056 | |
| |
| Total investments, at value (Cost $215,158,103) | | | 228,716,548 | |
| |
| Foreign currencies, at value (Cost $230) | | | 229 | |
| |
| Receivable for: | | | | |
| Investments sold | | | 618,718 | |
| |
| Fund shares sold | | | 1,766,597 | |
| |
| Dividends | | | 58,424 | |
| |
| Investment for trustee deferred compensation and retirement plans | | | 15,351 | |
| |
| Other assets | | | 30,302 | |
| |
| Total assets | | | 231,206,169 | |
| |
Liabilities:
|
| Payable for: | | | | |
| Investments purchased | | | 1,560,373 | |
| |
| Fund shares reacquired | | | 913,711 | |
| |
| Foreign currency contracts outstanding | | | 61,721 | |
| |
| Accrued fees to affiliates | | | 101,703 | |
| |
| Accrued other operating expenses | | | 58,148 | |
| |
| Trustee deferred compensation and retirement plans | | | 28,111 | |
| |
| Total liabilities | | | 2,723,767 | |
| |
| Net assets applicable to shares outstanding | | $ | 228,482,402 | |
| |
Net assets consist of:
|
| Shares of beneficial interest | | $ | 214,249,646 | |
| |
| Undistributed net investment income (loss) | | | (26,167 | ) |
| |
| Undistributed net realized gain | | | 761,385 | |
| |
| Unrealized appreciation | | | 13,497,538 | |
| |
| | | $ | 228,482,402 | |
| |
Net Assets:
|
| Class A | | $ | 91,974,759 | |
| |
| Class B | | $ | 7,541,777 | |
| |
| Class C | | $ | 20,709,754 | |
| |
| Class R | | $ | 14,721,201 | |
| |
| Class Y | | $ | 5,801,911 | |
| |
| Institutional Class | | $ | 87,733,000 | |
| |
Shares outstanding, $0.01 par value per share, with an unlimited number of shares authorized:
|
| Class A | | | 5,622,241 | |
| |
| Class B | | | 484,855 | |
| |
| Class C | | | 1,330,835 | |
| |
| Class R | | | 911,864 | |
| |
| Class Y | | | 351,890 | |
| |
| Institutional Class | | | 5,255,676 | |
| |
| Class A: | | | | |
| Net asset value per share | | $ | 16.36 | |
| |
Maximum offering price per share
(Net asset value of $16.36 divided by 94.50%) | | $ | 17.31 | |
| |
| Class B: | | | | |
| Net asset value and offering price per share | | $ | 15.55 | |
| |
| Class C: | | | | |
| Net asset value and offering price per share | | $ | 15.56 | |
| |
| Class R: | | | | |
| Net asset value and offering price per share | | $ | 16.14 | |
| |
| Class Y: | | | | |
| Net asset value and offering price per share | | $ | 16.49 | |
| |
| Institutional Class: | | | | |
| Net asset value and offering price per share | | $ | 16.69 | |
| |
See accompanying Notes to Financial Statements which are an integral part of the financial statements.
10 Invesco Endeavor Fund
Statement of Operations
For the year ended October 31, 2011
| | | | | |
Investment income:
|
| Dividends (net of foreign withholding taxes of $64,609) | | $ | 1,844,013 | |
| |
| Dividends from affiliates | | | 38,469 | |
| |
| Total investment income | | | 1,882,482 | |
| |
Expenses:
|
| Advisory fees | | | 1,641,568 | |
| |
| Administrative services fees | | | 100,679 | |
| |
| Custodian fees | | | 18,732 | |
| |
| Distribution fees: | | | | |
| Class A | | | 222,278 | |
| |
| Class B | | | 89,644 | |
| |
| Class C | | | 214,413 | |
| |
| Class R | | | 74,691 | |
| |
| Transfer agent fees — A, B, C, R and Y | | | 346,443 | |
| |
| Transfer agent fees — Institutional | | | 2,803 | |
| |
| Trustees’ and officers’ fees and benefits | | | 22,305 | |
| |
| Other | | | 144,726 | |
| |
| Total expenses | | | 2,878,282 | |
| |
| Less: Fees waived, expenses reimbursed and expense offset arrangement(s) | | | (59,154 | ) |
| |
| Net expenses | | | 2,819,128 | |
| |
| Net investment income (loss) | | | (936,646 | ) |
| |
Realized and unrealized gain from:
|
| Net realized gain from: | | | | |
| Investment securities | | | 10,404,427 | |
| |
| Foreign currencies | | | 193 | |
| |
| Foreign currency contracts | | | 63,660 | |
| |
| | | | 10,468,280 | |
| |
| Change in net unrealized appreciation (depreciation) of: | | | | |
| Investment securities | | | 12,352,584 | |
| |
| Foreign currencies | | | (1,640 | ) |
| |
| Foreign currency contracts | | | (67,275 | ) |
| |
| | | | 12,283,669 | |
| |
| Net realized and unrealized gain | | | 22,751,949 | |
| |
| Net increase in net assets resulting from operations | | $ | 21,815,303 | |
| |
See accompanying Notes to Financial Statements which are an integral part of the financial statements.
11 Invesco Endeavor Fund
Statement of Changes in Net Assets
For the years ended October 31, 2011 and 2010
| | | | | | | | | |
| | | 2011 | | 2010 |
| |
Operations:
|
| Net investment income (loss) | | $ | (936,646 | ) | | $ | (646,741 | ) |
| |
| Net realized gain | | | 10,468,280 | | | | 9,449,388 | |
| |
| Change in net unrealized appreciation | | | 12,283,669 | | | | 13,742,062 | |
| |
| Net increase in net assets resulting from operations | | | 21,815,303 | | | | 22,544,709 | |
| |
Share transactions–net:
|
| Class A | | | 1,659,003 | | | | (9,502,599 | ) |
| |
| Class B | | | (2,446,312 | ) | | | (1,207,182 | ) |
| |
| Class C | | | (465,019 | ) | | | (93,800 | ) |
| |
| Class R | | | 476,691 | | | | 5,808,688 | |
| |
| Class Y | | | 1,253,030 | | | | 2,681,829 | |
| |
| Institutional Class | | | 3,396,515 | | | | 68,483,146 | |
| |
| Net increase in net assets resulting from share transactions | | | 3,873,908 | | | | 66,170,082 | |
| |
| Net increase in net assets | | | 25,689,211 | | | | 88,714,791 | |
| |
Net assets:
|
| Beginning of year | | | 202,793,191 | | | | 114,078,400 | |
| |
| End of year (includes undistributed net investment income (loss) of $(26,167) and $(20,890), respectively) | | $ | 228,482,402 | | | $ | 202,793,191 | |
| |
Notes to Financial Statements
October 31, 2011
NOTE 1—Significant Accounting Policies
Invesco Endeavor Fund (the “Fund”) is a series portfolio of AIM Investment Funds (Invesco Investment Funds) (the “Trust”). The Trust is organized as a Delaware statutory trust and is registered under the Investment Company Act of 1940, as amended (the “1940 Act”), as an open-end series management investment company consisting of thirteen separate series portfolios, each authorized to issue an unlimited number of shares of beneficial interest. The assets, liabilities and operations of each portfolio are accounted for separately. Information presented in these financial statements pertains only to the Fund. Matters affecting each portfolio or class will be voted on exclusively by the shareholders of such portfolio or class.
The Fund’s investment objective is long-term growth of capital.
The Fund currently consists of six different classes of shares: Class A, Class B, Class C, Class R, Class Y and Institutional Class. Class A shares are sold with a front-end sales charge unless certain waiver criteria are met and under certain circumstances load waived shares may be subject to contingent deferred sales charges (“CDSC”). Class C shares are sold with a CDSC. Class R, Class Y and Institutional Class shares are sold at net asset value. Effective November 30, 2010, new or additional investments in Class B shares are no longer permitted. Existing shareholders of Class B shares may continue to reinvest dividends and capital gains distributions in Class B shares until they convert. Also, shareholders in Class B shares will be able to exchange those shares for Class B shares of other Invesco Funds offering such shares until they convert. Generally, Class B shares will automatically convert to Class A shares on or about the month-end which is at least eight years after the date of purchase. Redemption of Class B shares prior to conversion date will be subject to a CDSC.
The following is a summary of the significant accounting policies followed by the Fund in the preparation of its financial statements.
| | |
| A. | | Security Valuations — Securities, including restricted securities, are valued according to the following policy. |
| | A security listed or traded on an exchange (except convertible bonds) is valued at its last sales price or official closing price as of the close of the customary trading session on the exchange where the security is principally traded, or lacking any sales or official closing price on a particular day, the security may be valued at the closing bid price on that day. Securities traded in the over-the-counter market are valued based on prices furnished by independent pricing services or market makers. When such securities are valued by an independent pricing service they may be considered fair valued. Futures contracts are valued at the final settlement price set by an exchange on which they are principally traded. Listed options are valued at the mean between the last bid and ask prices from the exchange on which they are principally traded. Options not listed on an exchange are valued by an independent source at the mean between the last bid and ask prices. For purposes of determining net asset value per share, futures and option contracts generally are valued 15 minutes after the close of the customary trading session of the New York Stock Exchange (“NYSE”). |
12 Invesco Endeavor Fund
| | |
| | Investments in open-end and closed-end registered investment companies that do not trade on an exchange are valued at the end of day net asset value per share. Investments in open-end and closed-end registered investment companies that trade on an exchange are valued at the last sales price or official closing price as of the close of the customary trading session on the exchange where the security is principally traded. |
| | Debt obligations (including convertible bonds) and unlisted equities are fair valued using an evaluated quote provided by an independent pricing service. Evaluated quotes provided by the pricing service may be determined without exclusive reliance on quoted prices, and may reflect appropriate factors such as institution-size trading in similar groups of securities, developments related to specific securities, dividend rate, yield, quality, type of issue, coupon rate, maturity, individual trading characteristics and other market data. Debt securities are subject to interest rate and credit risks. In addition, all debt securities involve some risk of default with respect to interest and/or principal payments. |
| | Foreign securities (including foreign exchange contracts) are converted into U.S. dollar amounts using the applicable exchange rates as of the close of the NYSE. If market quotations are available and reliable for foreign exchange traded equity securities, the securities will be valued at the market quotations. Because trading hours for certain foreign securities end before the close of the NYSE, closing market quotations may become unreliable. If between the time trading ends on a particular security and the close of the customary trading session on the NYSE, events occur that are significant and make the closing price unreliable, the Fund may fair value the security. If the event is likely to have affected the closing price of the security, the security will be valued at fair value in good faith using procedures approved by the Board of Trustees. Adjustments to closing prices to reflect fair value may also be based on a screening process of an independent pricing service to indicate the degree of certainty, based on historical data, that the closing price in the principal market where a foreign security trade is not the current value as of the close of the NYSE. Foreign securities meeting the approved degree of certainty that the price is not reflective of current value will be priced at the indication of fair value from the independent pricing service. Multiple factors may be considered by the independent pricing service in determining adjustments to reflect fair value and may include information relating to sector indices, American Depositary Receipts and domestic and foreign index futures. Foreign securities may have additional risks including exchange rate changes, potential for sharply devalued currencies and high inflation, political and economical upheaval, the relative lack of issuer information, relatively low market liquidity and the potential lack of strict financial and accounting controls and standards. |
| | Securities for which market prices are not provided by any of the above methods may be valued based upon quotes furnished by independent sources. The last bid price may be used to value equity securities. The mean between the last bid and asked prices is used to value debt obligations, including Corporate Loans. |
| | Securities for which market quotations are not readily available or are unreliable are valued at fair value as determined in good faith by or under the supervision of the Trust’s officers following procedures approved by the Board of Trustees. Issuer specific events, market trends, bid/ask quotes of brokers and information providers and other market data may be reviewed in the course of making a good faith determination of a security’s fair value. |
| | Valuations change in response to many factors including the historical and prospective earnings of the issuer, the value of the issuer’s assets, general economic conditions, interest rates, investor perceptions and market liquidity. Because of the inherent uncertainties of valuation, the values reflected in the financial statements may materially differ from the value received upon actual sale of those investments. |
| B. | | Securities Transactions and Investment Income — Securities transactions are accounted for on a trade date basis. Realized gains or losses on sales are computed on the basis of specific identification of the securities sold. Interest income is recorded on the accrual basis from settlement date. Dividend income (net of withholding tax, if any) is recorded on the ex-dividend date. |
| | The Fund may periodically participate in litigation related to Fund investments. As such, the Fund may receive proceeds from litigation settlements. Any proceeds received are included in the Statement of Operations as realized gain (loss) for investments no longer held and as unrealized gain (loss) for investments still held. |
| | Brokerage commissions and mark ups are considered transaction costs and are recorded as an increase to the cost basis of securities purchased and/or a reduction of proceeds on a sale of securities. Such transaction costs are included in the determination of net realized and unrealized gain (loss) from investment securities reported in the Statement of Operations and the Statement of Changes in Net Assets and the net realized and unrealized gains (losses) on securities per share in the Financial Highlights. Transaction costs are included in the calculation of the Fund’s net asset value and, accordingly, they reduce the Fund’s total returns. These transaction costs are not considered operating expenses and are not reflected in net investment income reported in the Statement of Operations and Statement of Changes in Net Assets, or the net investment income per share and ratios of expenses and net investment income reported in the Financial Highlights, nor are they limited by any expense limitation arrangements between the Fund and the investment adviser. |
| | The Fund allocates income and realized and unrealized capital gains and losses to a class based on the relative net assets of each class. |
| C. | | Country Determination — For the purposes of making investment selection decisions and presentation in the Schedule of Investments, the investment adviser may determine the country in which an issuer is located and/or credit risk exposure based on various factors. These factors include the laws of the country under which the issuer is organized, where the issuer maintains a principal office, the country in which the issuer derives 50% or more of its total revenues and the country that has the primary market for the issuer’s securities, as well as other criteria. Among the other criteria that may be evaluated for making this determination are the country in which the issuer maintains 50% or more of its assets, the type of security, financial guarantees and enhancements, the nature of the collateral and the sponsor organization. Country of issuer and/or credit risk exposure has been determined to be the United States of America, unless otherwise noted. |
| D. | | Distributions — Distributions from income and net realized capital gain, if any, are generally paid annually and recorded on ex-dividend date. The Fund may elect to treat a portion of the proceeds from redemptions as distributions for federal income tax purposes. |
| E. | | Federal Income Taxes — The Fund intends to comply with the requirements of Subchapter M of the Internal Revenue Code necessary to qualify as a regulated investment company and to distribute substantially all of the Fund’s taxable earnings to shareholders. As such, the Fund will not be subject to federal income taxes on otherwise taxable income (including net realized capital gain) that is distributed to shareholders. Therefore, no provision for federal income taxes is recorded in the financial statements. |
13 Invesco Endeavor Fund
| | |
| | The Fund files tax returns in the U.S. Federal jurisdiction and certain other jurisdictions. Generally, the Fund is subject to examinations by such taxing authorities for up to three years after the filing of the return for the tax period. |
| F. | | Expenses — Fees provided for under the Rule 12b-1 plan of a particular class of the Fund are charged to the operations of such class. Transfer agency fees and expenses and other shareholder recordkeeping fees and expenses attributable to the Institutional Class are charged to such class. Transfer agency fees and expenses and other shareholder recordkeeping fees and expenses relating to all other classes are allocated among those classes based on relative net assets. All other expenses are allocated among the classes based on relative net assets. |
| G. | | Accounting Estimates — The preparation of financial statements in conformity with accounting principles generally accepted in the United States of America (“GAAP”) requires management to make estimates and assumptions that affect the reported amounts of assets and liabilities at the date of the financial statements and the reported amounts of revenues and expenses during the reporting period including estimates and assumptions related to taxation. Actual results could differ from those estimates by a significant amount. In addition, the Fund monitors for material events or transactions that may occur or become known after the period-end date and before the date the financial statements are released to print. |
| H. | | Indemnifications — Under the Trust’s organizational documents, each Trustee, officer, employee or other agent of the Trust is indemnified against certain liabilities that may arise out of performance of their duties to the Fund. Additionally, in the normal course of business, the Fund enters into contracts, including the Fund’s servicing agreements that contain a variety of indemnification clauses. The Fund’s maximum exposure under these arrangements is unknown as this would involve future claims that may be made against the Fund that have not yet occurred. The risk of material loss as a result of such indemnification claims is considered remote. |
| I. | | Foreign Currency Translations — Foreign currency is valued at the close of the NYSE based on quotations posted by banks and major currency dealers. Portfolio securities and other assets and liabilities denominated in foreign currencies are translated into U.S. dollar amounts at date of valuation. Purchases and sales of portfolio securities (net of foreign taxes withheld on disposition) and income items denominated in foreign currencies are translated into U.S. dollar amounts on the respective dates of such transactions. The Fund does not separately account for the portion of the results of operations resulting from changes in foreign exchange rates on investments and the fluctuations arising from changes in market prices of securities held. The combined results of changes in foreign exchange rates and the fluctuation of market prices on investments (net of estimated foreign tax withholding) are included with the net realized and unrealized gain or loss from investments in the Statement of Operations. Reported net realized foreign currency gains or losses arise from (1) sales of foreign currencies, (2) currency gains or losses realized between the trade and settlement dates on securities transactions, and (3) the difference between the amounts of dividends, interest, and foreign withholding taxes recorded on the Fund’s books and the U.S. dollar equivalent of the amounts actually received or paid. Net unrealized foreign currency gains and losses arise from changes in the fair values of assets and liabilities, other than investments in securities at fiscal period end, resulting from changes in exchange rates. |
| | The Fund may invest in foreign securities which may be subject to foreign taxes on income, gains on investments or currency repatriation, a portion of which may be recoverable. |
| J. | | Foreign Currency Contracts — The Fund may enter into foreign currency contracts to manage or minimize currency or exchange rate risk. The Fund may also enter into foreign currency contracts for the purchase or sale of a security denominated in a foreign currency in order to “lock in” the U.S. dollar price of that security. A foreign currency contract is an obligation to purchase or sell a specific currency for an agreed-upon price at a future date. The use of foreign currency contracts does not eliminate fluctuations in the price of the underlying securities the Fund owns or intends to acquire but establishes a rate of exchange in advance. Fluctuations in the value of these contracts are measured by the difference in the contract date and reporting date exchange rates and are recorded as unrealized appreciation (depreciation) until the contracts are closed. When the contracts are closed, realized gains (losses) are recorded. Realized and unrealized gains (losses) on the contracts are included in the Statement of Operations. The primary risks associated with foreign currency contracts include failure of the counterparty to meet the terms of the contract and the value of the foreign currency changing unfavorably. These risks may be in excess of the amounts reflected in the Statement of Assets and Liabilities. |
NOTE 2—Advisory Fees and Other Fees Paid to Affiliates
The Trust has entered into a master investment advisory agreement with Invesco Advisers, Inc. (the “Adviser” or “Invesco”). Under the terms of the investment advisory agreement, the Fund pays an advisory fee to the Adviser based on the annual rate of the Fund’s average daily net assets as follows:
| | | | | |
| Average Net Assets | | Rate |
| |
| First $250 million | | | 0 | .745% |
| |
| Next $250 million | | | 0 | .73% |
| |
| Next $500 million | | | 0 | .715% |
| |
| Next $1.5 billion | | | 0 | .70% |
| |
| Next $2.5 billion | | | 0 | .685% |
| |
| Next $2.5 billion | | | 0 | .67% |
| |
| Next $2.5 billion | | | 0 | .655% |
| |
| Over $10 billion | | | 0 | .64% |
| |
Under the terms of a master sub-advisory agreement between the Adviser and each of Invesco Asset Management Deutschland GmbH, Invesco Asset Management Limited, Invesco Asset Management (Japan) Limited, Invesco Australia Limited, Invesco Hong Kong Limited, Invesco Senior Secured Management, Inc. and Invesco Canada Ltd. (collectively, the “Affiliated Sub-Advisers”) the Adviser, not the Fund, may pay 40% of the fees paid to the Adviser to any such Affiliated Sub-Adviser(s) that provide discretionary investment management services to the Fund based on the percentage of assets allocated to such Sub-Adviser(s).
14 Invesco Endeavor Fund
The Adviser has contractually agreed, through at least February 28, 2013, to waive advisory fees and/or reimburse expenses to the extent necessary to limit total annual operating expenses after fee waiver and/or expense reimbursement (excluding certain items discussed below) of Class A, Class B, Class C, Class R, Class Y and Institutional Class shares to 2.00%, 2.75%, 2.75%, 2.25%, 1.75% and 1.75% of average daily net assets, respectively. In determining the Adviser’s obligation to waive advisory fees and/or reimburse expenses, the following expenses are not taken into account, and could cause total annual operating expenses after fee waiver and/or expense reimbursement to exceed the numbers reflected above: (1) interest; (2) taxes; (3) dividend expense on short sales; (4) extraordinary or non-routine items; and (5) expenses that the Fund has incurred but did not actually pay because of an expense offset arrangement. Unless the Board of Trustees and Invesco mutually agree to amend or continue the fee waiver agreement, it will terminate on February 28, 2013. The Adviser did not waive fees and/or reimburse expenses under this expense limitation.
The Adviser has contractually agreed, through at least June 30, 2012, to waive the advisory fee payable by the Fund in an amount equal to 100% of the net advisory fees the Adviser receives from the affiliated money market funds on investments by the Fund of uninvested cash in such affiliated money market funds.
For the year ended October 31, 2011, the Adviser waived advisory fees of $57,995.
At the request of the Trustees of the Trust, Invesco Ltd. agreed to reimburse expenses incurred by the Fund in connection with market timing matters in the Invesco Funds, which may include legal, audit, shareholder reporting, communications and trustee expenses. These expenses along with the related expense reimbursement are included in the Statement of Operations. For the year ended October 31, 2011, Invesco Ltd. reimbursed expenses of the Fund in the amount of $465.
The Trust has entered into a master administrative services agreement with Invesco pursuant to which the Fund has agreed to pay Invesco for certain administrative costs incurred in providing accounting services to the Fund. For the year ended October 31, 2011, expenses incurred under the agreement are shown in the Statement of Operations as administrative services fees.
The Trust has entered into a transfer agency and service agreement with Invesco Investment Services, Inc. (“IIS”) pursuant to which the Fund has agreed to pay IIS a fee for providing transfer agency and shareholder services to the Fund and reimburse IIS for certain expenses incurred by IIS in the course of providing such services. IIS may make payments to intermediaries that provide omnibus account services, sub-accounting services and/or networking services. All fees payable by IIS to intermediaries that provide omnibus account services or sub-accounting are charged back to the Fund, subject to certain limitations approved by the Trust’s Board of Trustees. For the year ended October 31, 2011, expenses incurred under the agreement are shown in the Statement of Operations as transfer agent fees.
The Trust has entered into master distribution agreements with Invesco Distributors, Inc. (“IDI”) to serve as the distributor for the Class A, Class B, Class C, Class R, Class Y and Institutional Class shares of the Fund. The Trust has adopted plans pursuant to Rule 12b-1 under the 1940 Act with respect to the Fund’s Class A, Class B, Class C and Class R shares (collectively, the “Plans”). The Fund, pursuant to the Plans, pays IDI compensation at the annual rate of 0.25% of the Fund’s average daily net assets of Class A shares, 1.00% of the average daily net assets of Class B and Class C shares and 0.50% of the average daily net assets of Class R shares. Of the Plan payments, up to 0.25% of the average daily net assets of each class of shares may be paid to furnish continuing personal shareholder services to customers who purchase and own shares of such classes. Any amounts not paid as a service fee under the Plans would constitute an asset-based sales charge. Rules of the Financial Industry Regulatory Authority (“FINRA”) impose a cap on the total sales charges, including asset-based sales charges that may be paid by any class of shares of the Fund. For the year ended October 31, 2011, expenses incurred under the Plans are shown in the Statement of Operations as distribution fees.
Front-end sales commissions and CDSC (collectively, the “sales charges”) are not recorded as expenses of the Fund. Front-end sales commissions are deducted from proceeds from the sales of Fund shares prior to investment in Class A shares of the Fund. CDSC are deducted from redemption proceeds prior to remittance to the shareholder. During the year ended October 31, 2011, IDI advised the Fund that IDI retained $20,566 in front-end sales commissions from the sale of Class A shares and $1,800, $13,288 and $1,519 from Class A, Class B and Class C shares, respectively, for CDSC imposed on redemptions by shareholders.
Certain officers and trustees of the Trust are officers and directors of the Adviser, Invesco Ltd., IIS and/or IDI.
NOTE 3—Additional Valuation Information
GAAP defines fair value as the price that would be received to sell an asset or paid to transfer a liability in an orderly transaction between market participants at the measurement date, under current market conditions. GAAP establishes a hierarchy that prioritizes the inputs to valuation methods giving the highest priority to readily available unadjusted quoted prices in an active market for identical assets (Level 1) and the lowest priority to significant unobservable inputs (Level 3) generally when market prices are not readily available or are unreliable. Based on the valuation inputs, the securities or other investments are tiered into one of three levels. Changes in valuation methods may result in transfers in or out of an investment’s assigned level:
| | |
| | Level 1 — | Prices are determined using quoted prices in an active market for identical assets. |
| | Level 2 — | Prices are determined using other significant observable inputs. Observable inputs are inputs that other market participants may use in pricing a security. These may include quoted prices for similar securities, interest rates, prepayment speeds, credit risk, yield curves, loss severities, default rates, discount rates, volatilities and others. |
| | Level 3 — | Prices are determined using significant unobservable inputs. In situations where quoted prices or observable inputs are unavailable (for example, when there is little or no market activity for an investment at the end of the period), unobservable inputs may be used. Unobservable inputs reflect the Fund’s own assumptions about the factors market participants would use in determining fair value of the securities or instruments and would be based on the best available information. |
15 Invesco Endeavor Fund
The following is a summary of the tiered valuation input levels, as of October 31, 2011. The level assigned to the securities valuations may not be an indication of the risk or liquidity associated with investing in those securities. Because of the inherent uncertainties of valuation, the values reflected in the financial statements may materially differ from the value received upon actual sale of those investments.
During the year ended October 31, 2011, there were no significant transfers between investment levels.
| | | | | | | | | | | | | | | | | |
| | | Level 1 | | Level 2 | | Level 3 | | Total |
| |
| Equity Securities | | $ | 213,284,846 | | | $ | 15,431,702 | | | $ | — | | | $ | 228,716,548 | |
| |
| Foreign Currency Contracts* | | | — | | | | (61,721 | ) | | | — | | | | (61,721 | ) |
| |
| Total Investments | | $ | 213,284,846 | | | $ | 15,369,981 | | | $ | — | | | $ | 228,654,827 | |
| |
| |
| * | Unrealized appreciation (depreciation). |
NOTE 4—Derivative Investments
The Fund has implemented the required disclosures about derivative instruments and hedging activities in accordance with GAAP. This disclosure is intended to improve financial reporting about derivative instruments and hedging activities by requiring enhanced disclosures to enable investors to better understand their effects on an entity’s financial position and financial performance. The enhanced disclosure has no impact on the results of operations reported in the financial statements.
Value of Derivative Instruments at Period-End
The table below summarizes the value of the Fund’s derivative instruments, detailed by primary risk exposure, held as of October 31, 2011:
| | | | | | | | | |
| | | Value |
| Risk Exposure/Derivative Type | | Assets | | Liabilities |
| |
Currency risk(a) | | | | | | | | |
| Foreign currency contracts | | $ | — | | | $ | (61,721 | ) |
| |
| | |
| (a) | | Values are disclosed on the Statement of Assets and Liabilities under the Foreign currency contracts outstanding. |
Effect of Derivative Instruments for the year ended October 31, 2011
The table below summarizes the gains (losses) on derivative instruments, detailed by primary risk exposure, recognized in earnings during the period:
| | | | | |
| | | Location of Gain (Loss) on
|
| | | Statement of Operations |
| | | Foreign Currency
|
| | | Contracts* |
| |
| Realized Gain | | | | |
| Currency risk | | $ | 63,660 | |
| |
| Change in Unrealized Appreciation (Depreciation) | | | | |
| Currency risk | | | (67,275 | ) |
| |
| Total | | $ | (3,615 | ) |
| |
| |
| * | The average notional value of foreign currency contracts outstanding during the period was $4,189,276. |
| | | | | | | | | | | | | | | | | | | | | | | | | |
| Open Foreign Currency Contracts |
| | | | | | | | | | | | | Unrealized
|
Settlement
| | | | Contract to | | Notional
| | Appreciation
|
| Date | | Counterparty | | Deliver | | Receive | | Value | | (Depreciation) |
| |
| 12/15/11 | | Scotia McLeod | | EUR | | | 3,000,000 | | | | USD | | | | 4,087,800 | | | $ | 4,149,521 | | | $ | (61,721 | ) |
| |
| | | |
| Currency Abbreviations: |
| EUR | | – Euro |
| USD | | – U.S. Dollar |
NOTE 5—Investments in Other Affiliates
The Investment Company Act of 1940 defines affiliates as those issuances in which a fund holds 5% or more of the outstanding voting securities. The Fund has not owned enough of the outstanding voting securities of the issuer to have control (as defined in the Investment Company Act of 1940) of that issuer. The following is a summary of the investments in affiliates for the year ended October 31, 2011.
| | | | | | | | | | | | | | | | | | | | | | | | | | | | | |
| | | | | | | | | Change in
| | | | | | |
| | | | | | | | | Unrealized
| | | | | | |
| | | Value
| | Purchases
| | Proceeds
| | Appreciation
| | Realized
| | Value
| | Dividend
|
| | | 10/31/10 | | at Cost | | from Sales | | (Depreciation) | | Gain | | 10/31/11 | | Income |
| |
| Orion Marine Group | | $ | — | | | $ | 13,939,018 | | | $ | — | | | $ | (4,127,468 | ) | | $ | — | | | $ | 9,811,550 | | | $ | — | |
| |
16 Invesco Endeavor Fund
NOTE 6—Expense Offset Arrangement(s)
The expense offset arrangement is comprised of transfer agency credits which result from balances in Demand Deposit Accounts (DDA) used by the transfer agent for clearing shareholder transactions. For the year ended October 31, 2011, the Fund received credits from this arrangement, which resulted in the reduction of the Fund’s total expenses of $694.
NOTE 7—Trustees’ and Officers’ Fees and Benefits
“Trustees’ and Officers’ Fees and Benefits” include amounts accrued by the Fund to pay remuneration to certain Trustees and Officers of the Fund. Trustees have the option to defer compensation payable by the Fund, and “Trustees’ and Officers’ Fees and Benefits” also include amounts accrued by the Fund to fund such deferred compensation amounts. Those Trustees who defer compensation have the option to select various Invesco Funds in which their deferral accounts shall be deemed to be invested. Finally, certain current Trustees are eligible to participate in a retirement plan that provides for benefits to be paid upon retirement to Trustees over a period of time based on the number of years of service. The Fund may have certain former Trustees who also participate in a retirement plan and receive benefits under such plan. “Trustees’ and Officers’ Fees and Benefits” include amounts accrued by the Fund to fund such retirement benefits. Obligations under the deferred compensation and retirement plans represent unsecured claims against the general assets of the Fund.
During the year ended October 31, 2011, the Fund paid legal fees of $1,804 for services rendered by Kramer, Levin, Naftalis & Frankel LLP as counsel to the Independent Trustees. A partner of that firm is a Trustee of the Trust.
NOTE 8—Cash Balances
The Fund is permitted to temporarily carry a negative or overdrawn balance in its account with The State Street Bank and Trust Company, the custodian bank. To compensate the custodian bank for such overdrafts, the overdrawn Fund may either (1) leave funds as a compensating balance in the account so the custodian bank can be compensated by earning the additional interest; or (2) compensate by paying the custodian bank at a rate agreed upon by the custodian bank and Invesco, not to exceed the contractually agreed upon rate.
NOTE 9—Distributions to Shareholders and Tax Components of Net Assets
Tax Character of Distributions to Shareholders Paid During the Years Ended October 31, 2011 and 2010:
There were no ordinary income or long term capital gain distributions paid during the years ended October 31, 2011 and 2010.
Tax Components of Net Assets at Period-End:
| | | | | |
| | | 2011 |
| |
| Undistributed long-term gain | | $ | 1,021,055 | |
| |
| Net unrealized appreciation — investments | | | 13,237,054 | |
| |
| Net unrealized appreciation — other investments | | | 814 | |
| |
| Temporary book/tax differences | | | (26,167 | ) |
| |
| Shares of beneficial interest | | | 214,249,646 | |
| |
| Total net assets | | $ | 228,482,402 | |
| |
The difference between book-basis and tax-basis unrealized appreciation (depreciation) is due to differences in the timing of recognition of gains and losses on investments for tax and book purposes. The Fund’s net unrealized appreciation difference is attributable primarily to wash sales.
The temporary book/tax differences are a result of timing differences between book and tax recognition of income and/or expenses. The Fund’s temporary book/tax differences are the result of the trustee deferral of compensation and retirement plan benefits.
Capital loss carryforward is calculated and reported as of a specific date. Results of transactions and other activity after that date may affect the amount of capital loss carryforward actually available for the Fund to utilize. The ability to utilize capital loss carryforward in the future may be limited under the Internal Revenue Code and related regulations based on the results of future transactions.
The Fund utilized $9,379,757 of capital loss carryforward in the current period to offset net realized capital gain for federal income tax purposes.
The Fund does not have a capital loss carryforward as of October 31, 2011.
NOTE 10—Investment Securities
The aggregate amount of investment securities (other than short-term securities, U.S. Treasury obligations and money market funds, if any) purchased and sold by the Fund during the year ended October 31, 2011 was $54,414,572 and $60,582,801, respectively. Cost of investments on a tax basis includes the adjustments for financial reporting purposes as of the most recently completed Federal income tax reporting period-end.
| | | | | |
| Unrealized Appreciation (Depreciation) of Investment Securities on a Tax Basis |
| |
| Aggregate unrealized appreciation of investment securities | | $ | 26,404,204 | |
| |
| Aggregate unrealized (depreciation) of investment securities | | | (13,167,150 | ) |
| |
| Net unrealized appreciation of investment securities | | $ | 13,237,054 | |
| |
| Cost of investments for tax purposes is $215,479,494. | | | | |
17 Invesco Endeavor Fund
NOTE 11—Reclassification of Permanent Differences
Primarily as a result of differing book/tax treatment of net operating losses, on October 31, 2011, undistributed net investment income (loss) was increased by $931,369, undistributed net realized gain was decreased by $193 and shares of beneficial interest decreased by $931,176. This reclassification had no effect on the net assets of the Fund.
NOTE 12—Share Information
| | | | | | | | | | | | | | | | | |
| | | Summary of Share Activity |
| |
| | | Years ended October 31, |
| | | 2011(a) | | 2010 |
| | | Shares | | Amount | | Shares | | Amount |
| |
| Sold: | | | | | | | | | | | | | | | | |
| Class A | | | 2,250,578 | | | $ | 37,036,191 | | | | 2,275,618 | | | $ | 32,469,765 | |
| |
| Class B | | | 87,343 | | | | 1,363,653 | | | | 130,801 | | | | 1,806,557 | |
| |
| Class C | | | 378,193 | | | | 6,046,481 | | | | 621,388 | | | | 8,632,458 | |
| |
| Class R | | | 328,658 | | | | 5,318,586 | | | | 613,828 | | | | 8,580,232 | |
| |
| Class Y | | | 160,728 | | | | 2,693,363 | | | | 310,055 | | | | 4,597,298 | |
| |
| Institutional Class | | | 1,334,279 | | | | 22,166,183 | | | | 5,033,806 | | | | 71,281,764 | |
| |
| Automatic conversion of Class B shares to Class A shares: | | | | | | | | | | | | | | | | |
| Class A | | | 80,655 | | | | 1,357,508 | | | | 72,093 | | | | 1,021,064 | |
| |
| Class B | | | (84,506 | ) | | | (1,357,508 | ) | | | (74,980 | ) | | | (1,021,064 | ) |
| |
| Reacquired: | | | | | | | | | | | | | | | | |
| Class A | | | (2,223,934 | ) | | | (36,734,696 | ) | | | (3,108,504 | ) | | | (42,993,428 | ) |
| |
| Class B | | | (155,202 | ) | | | (2,452,457 | ) | | | (149,390 | ) | | | (1,992,675 | ) |
| |
| Class C | | | (419,364 | ) | | | (6,511,500 | ) | | | (655,882 | ) | | | (8,726,258 | ) |
| |
| Class R | | | (295,369 | ) | | | (4,841,895 | ) | | | (201,827 | ) | | | (2,771,544 | ) |
| |
| Class Y | | | (88,061 | ) | | | (1,440,333 | ) | | | (136,289 | ) | | | (1,915,469 | ) |
| |
| Institutional Class | | | (1,128,095 | ) | | | (18,769,668 | ) | | | (194,666 | ) | | | (2,798,618 | ) |
| |
| Net increase in share activity | | | 225,903 | | | $ | 3,873,908 | | | | 4,536,051 | | | $ | 66,170,082 | |
| |
| | |
| (a) | | There are entities that are record owners of more than 5% of the outstanding shares of the Fund and in the aggregate own 11% of the outstanding shares of the Fund. IDI has an agreement with these entities to sell Fund shares. The Fund, Invesco and/or Invesco affiliates may make payments to these entities, which are considered to be related to the Fund, for providing services to the Fund, Invesco and/or Invesco affiliates including but not limited to services such as securities brokerage, distribution, third party record keeping and account servicing. The Fund has no knowledge as to whether all or any portion of the shares owned of record by these entities are also owned beneficially. |
| | |
| | In addition, 32% of the outstanding shares of the Fund are owned by affiliated mutual funds. Affiliated mutual funds are other mutual funds that are also advised by Invesco. |
18 Invesco Endeavor Fund
NOTE 13—Financial Highlights
The following schedule presents financial highlights for a share of the Fund outstanding throughout the periods indicated.
| | | | | | | | | | | | | | | | | | | | | | | | | | | | | | | | | | | | | | | | | | | | | | | | | | | | | | | | | |
| | | | | | | | | | | | | | | | | | | | | | | Ratio of
| | Ratio of
| | | | |
| | | | | | | Net gains
| | | | | | | | | | | | | | | | expenses
| | expenses
| | | | |
| | | | | | | (losses) on
| | | | | | | | | | | | | | | | to average
| | to average net
| | Ratio of net
| | |
| | | Net asset
| | Net
| | securities
| | | | Dividends
| | Distributions
| | | | | | | | | | net assets
| | assets without
| | investment
| | |
| | | value,
| | investment
| | (both
| | Total from
| | from net
| | from net
| | | | Net asset
| | | | Net assets,
| | with fee waivers
| | fee waivers
| | income (loss)
| | |
| | | beginning
| | income
| | realized and
| | investment
| | investment
| | realized
| | Total
| | value, end
| | Total
| | end of period
| | and/or expenses
| | and/or expenses
| | to average
| | Portfolio
|
| | | of period | | (loss)(a) | | unrealized) | | operations | | income | | gains | | distributions | | of period | | return(b) | | (000s omitted) | | absorbed | | absorbed | | net assets | | turnover(c) |
| |
| Class A |
| Year ended 10/31/11 | | $ | 14.78 | | | $ | (0.08 | ) | | $ | 1.66 | | | $ | 1.58 | | | $ | — | | | $ | — | | | $ | — | | | $ | 16.36 | | | | 10.69 | % | | $ | 91,975 | | | | 1.34 | %(d) | | | 1.37 | %(d) | | | (0.49 | )%(d) | | | 30 | % |
| Year ended 10/31/10 | | | 12.51 | | | | (0.05 | ) | | | 2.32 | | | | 2.27 | | | | — | | | | — | | | | — | | | | 14.78 | | | | 18.15 | | | | 81,536 | | | | 1.45 | | | | 1.47 | | | | (0.36 | ) | | | 38 | |
| Year ended 10/31/09 | | | 8.99 | | | | (0.04 | ) | | | 3.60 | | | | 3.56 | | | | (0.04 | ) | | | — | | | | (0.04 | ) | | | 12.51 | | | | 39.91 | | | | 78,496 | | | | 1.71 | | | | 1.72 | | | | (0.35 | ) | | | 30 | |
| Year ended 10/31/08 | | | 16.73 | | | | 0.05 | | | | (6.42 | ) | | | (6.37 | ) | | | (0.04 | ) | | | (1.33 | ) | | | (1.37 | ) | | | 8.99 | | | | (41.00 | ) | | | 54,056 | | | | 1.52 | | | | 1.53 | | | | 0.42 | | | | 30 | |
| Year ended 10/31/07 | | | 15.66 | | | | 0.07 | | | | 1.82 | | | | 1.89 | | | | — | | | | (0.82 | ) | | | (0.82 | ) | | | 16.73 | | | | 12.44 | | | | 159,244 | | | | 1.35 | | | | 1.39 | | | | 0.40 | | | | 39 | |
| |
| Class B |
| Year ended 10/31/11 | | | 14.16 | | | | (0.20 | ) | | | 1.59 | | | | 1.39 | | | | — | | | | — | | | | — | | | | 15.55 | | | | 9.82 | | | | 7,542 | | | | 2.09 | (d) | | | 2.12 | (d) | | | (1.24 | )(d) | | | 30 | |
| Year ended 10/31/10 | | | 12.07 | | | | (0.15 | ) | | | 2.24 | | | | 2.09 | | | | — | | | | — | | | | — | | | | 14.16 | | | | 17.32 | | | | 9,025 | | | | 2.20 | | | | 2.22 | | | | (1.11 | ) | | | 38 | |
| Year ended 10/31/09 | | | 8.70 | | | | (0.10 | ) | | | 3.47 | | | | 3.37 | | | | — | | | | — | | | | — | | | | 12.07 | | | | 38.74 | | | | 8,823 | | | | 2.46 | | | | 2.47 | | | | (1.10 | ) | | | 30 | |
| Year ended 10/31/08 | | | 16.30 | | | | (0.04 | ) | | | (6.23 | ) | | | (6.27 | ) | | | — | | | | (1.33 | ) | | | (1.33 | ) | | | 8.70 | | | | (41.41 | ) | | | 7,771 | | | | 2.27 | | | | 2.28 | | | | (0.33 | ) | | | 30 | |
| Year ended 10/31/07 | | | 15.39 | | | | (0.06 | ) | | | 1.79 | | | | 1.73 | | | | — | | | | (0.82 | ) | | | (0.82 | ) | | | 16.30 | | | | 11.58 | | | | 22,258 | | | | 2.10 | | | | 2.14 | | | | (0.35 | ) | | | 39 | |
| |
| Class C |
| Year ended 10/31/11 | | | 14.17 | | | | (0.20 | ) | | | 1.59 | | | | 1.39 | | | | — | | | | — | | | | — | | | | 15.56 | | | | 9.81 | | | | 20,710 | | | | 2.09 | (d) | | | 2.12 | (d) | | | (1.24 | )(d) | | | 30 | |
| Year ended 10/31/10 | | | 12.08 | | | | (0.15 | ) | | | 2.24 | | | | 2.09 | | | | — | | | | — | | | | — | | | | 14.17 | | | | 17.30 | | | | 19,436 | | | | 2.20 | | | | 2.22 | | | | (1.11 | ) | | | 38 | |
| Year ended 10/31/09 | | | 8.70 | | | | (0.10 | ) | | | 3.48 | | | | 3.38 | | | | — | | | | — | | | | — | | | | 12.08 | | | | 38.85 | | | | 16,995 | | | | 2.46 | | | | 2.47 | | | | (1.10 | ) | | | 30 | |
| Year ended 10/31/08 | | | 16.30 | | | | (0.04 | ) | | | (6.23 | ) | | | (6.27 | ) | | | — | | | | (1.33 | ) | | | (1.33 | ) | | | 8.70 | | | | (41.41 | ) | | | 14,941 | | | | 2.27 | | | | 2.28 | | | | (0.33 | ) | | | 30 | |
| Year ended 10/31/07 | | | 15.39 | | | | (0.06 | ) | | | 1.79 | | | | 1.73 | | | | — | | | | (0.82 | ) | | | (0.82 | ) | | | 16.30 | | | | 11.58 | | | | 41,790 | | | | 2.10 | | | | 2.14 | | | | (0.35 | ) | | | 39 | |
| |
| Class R |
| Year ended 10/31/11 | | | 14.63 | | | | (0.12 | ) | | | 1.63 | | | | 1.51 | | | | — | | | | — | | | | — | | | | 16.14 | | | | 10.32 | | | | 14,721 | | | | 1.59 | (d) | | | 1.62 | (d) | | | (0.74 | )(d) | | | 30 | |
| Year ended 10/31/10 | | | 12.40 | | | | (0.08 | ) | | | 2.31 | | | | 2.23 | | | | — | | | | — | | | | — | | | | 14.63 | | | | 17.98 | | | | 12,850 | | | | 1.70 | | | | 1.72 | | | | (0.61 | ) | | | 38 | |
| Year ended 10/31/09 | | | 8.91 | | | | (0.06 | ) | | | 3.56 | | | | 3.50 | | | | (0.01 | ) | | | — | | | | (0.01 | ) | | | 12.40 | | | | 39.43 | | | | 5,787 | | | | 1.96 | | | | 1.97 | | | | (0.60 | ) | | | 30 | |
| Year ended 10/31/08 | | | 16.59 | | | | 0.02 | | | | (6.35 | ) | | | (6.33 | ) | | | (0.02 | ) | | | (1.33 | ) | | | (1.35 | ) | | | 8.91 | | | | (41.06 | ) | | | 4,317 | | | | 1.77 | | | | 1.78 | | | | 0.17 | | | | 30 | |
| Year ended 10/31/07 | | | 15.58 | | | | 0.03 | | | | 1.80 | | | | 1.83 | | | | — | | | | (0.82 | ) | | | (0.82 | ) | | | 16.59 | | | | 12.11 | | | | 4,905 | | | | 1.60 | | | | 1.64 | | | | 0.15 | | | | 39 | |
| |
| Class Y |
| Year ended 10/31/11 | | | 14.86 | | | | (0.04 | ) | | | 1.67 | | | | 1.63 | | | | — | | | | — | | | | — | | | | 16.49 | | | | 10.97 | | | | 5,802 | | | | 1.09 | (d) | | | 1.12 | (d) | | | (0.24 | )(d) | | | 30 | |
| Year ended 10/31/10 | | | 12.55 | | | | (0.01 | ) | | | 2.32 | | | | 2.31 | | | | — | | | | — | | | | — | | | | 14.86 | | | | 18.41 | | | | 4,150 | | | | 1.20 | | | | 1.22 | | | | (0.11 | ) | | | 38 | |
| Year ended 10/31/09 | | | 9.00 | | | | (0.01 | ) | | | 3.61 | | | | 3.60 | | | | (0.05 | ) | | | — | | | | (0.05 | ) | | | 12.55 | | | | 40.24 | | | | 1,323 | | | | 1.46 | | | | 1.47 | | | | (0.10 | ) | | | 30 | |
| Year ended 10/31/08(e) | | | 11.18 | | | | 0.00 | | | | (2.18 | ) | | | (2.18 | ) | | | — | | | | — | | | | — | | | | 9.00 | | | | (19.50 | ) | | | 343 | | | | 1.32 | (f) | | | 1.34 | (f) | | | 0.62 | (f) | | | 30 | |
| |
| Institutional Class |
| Year ended 10/31/11 | | | 15.01 | | | | 0.00 | | | | 1.68 | | | | 1.68 | | | | — | | | | — | | | | — | | | | 16.69 | | | | 11.19 | | | | 87,733 | | | | 0.85 | (d) | | | 0.88 | (d) | | | 0.00 | (d) | | | 30 | |
| Year ended 10/31/10 | | | 12.62 | | | | 0.02 | | | | 2.37 | | | | 2.39 | | | | — | | | | — | | | | — | | | | 15.01 | | | | 18.94 | | | | 75,795 | | | | 0.94 | | | | 0.96 | | | | 0.16 | | | | 38 | |
| Year ended 10/31/09 | | | 9.12 | | | | 0.03 | | | | 3.60 | | | | 3.63 | | | | (0.13 | ) | | | — | | | | (0.13 | ) | | | 12.62 | | | | 40.76 | | | | 2,655 | | | | 1.08 | | | | 1.09 | | | | 0.28 | | | | 30 | |
| Year ended 10/31/08 | | | 16.94 | | | | 0.12 | | | | (6.49 | ) | | | (6.37 | ) | | | (0.12 | ) | | | (1.33 | ) | | | (1.45 | ) | | | 9.12 | | | | (40.66 | ) | | | 2,329 | | | | 0.98 | | | | 0.99 | | | | 0.96 | | | | 30 | |
| Year ended 10/31/07 | | | 15.78 | | | | 0.15 | | | | 1.83 | | | | 1.98 | | | | — | | | | (0.82 | ) | | | (0.82 | ) | | | 16.94 | | | | 12.94 | | | | 5,864 | | | | 0.90 | | | | 0.94 | | | | 0.85 | | | | 39 | |
| |
| | |
| (a) | | Calculated using average shares outstanding. |
| (b) | | Includes adjustments in accordance with accounting principles generally accepted in the United States of America and as such, the net asset value for financial reporting purposes and the returns based upon those net asset values may differ from the net asset value and returns for shareholder transactions. Does not include sales charges and is not annualized for periods less than one year, if applicable. |
| (c) | | Portfolio turnover is calculated at the fund level and is not annualized for periods less than one year, if applicable. |
| (d) | | Ratios are based on average daily net assets (000’s) of $88,911, $8,964, $21,441, $14,938, $5,291 and $80,799 for Class A, Class B, Class C, Class R, Class Y and Institutional Class shares, respectively. |
| (e) | | Commencement date of October 3, 2008. |
| (f) | | Annualized. |
19 Invesco Endeavor Fund
Report of Independent Registered Public Accounting Firm
To the Board of Trustees of AIM Investment Funds (Invesco Investment Funds)
and Shareholders of Invesco Endeavor Fund:
In our opinion, the accompanying statement of assets and liabilities, including the schedule of investments, and the related statements of operations and of changes in net assets and the financial highlights present fairly, in all material respects, the financial position of Invesco Endeavor Fund (one of the funds constituting AIM Investment Funds (Invesco Investment Funds), hereafter referred to as the “Fund”) at October 31, 2011, the results of its operations for the year then ended, the changes in its net assets for each of the two years in the period then ended and the financial highlights for each of the five years in the period then ended, in conformity with accounting principles generally accepted in the United States of America. These financial statements and financial highlights (hereafter referred to as “financial statements”) are the responsibility of the Fund’s management; our responsibility is to express an opinion on these financial statements based on our audits. We conducted our audits of these financial statements in accordance with the standards of the Public Company Accounting Oversight Board (United States). Those standards require that we plan and perform the audit to obtain reasonable assurance about whether the financial statements are free of material misstatement. An audit includes examining, on a test basis, evidence supporting the amounts and disclosures in the financial statements, assessing the accounting principles used and significant estimates made by management, and evaluating the overall financial statement presentation. We believe that our audits, which included confirmation of securities at October 31, 2011 by correspondence with the custodian and brokers, provide a reasonable basis for our opinion.
PricewaterhouseCoopers LLP
Houston, Texas
December 21, 2011
20 Invesco Endeavor Fund
Calculating your ongoing Fund expenses
Example
As a shareholder of the Fund, you incur two types of costs: (1) transaction costs, which may include sales charges (loads) on purchase payments or contingent deferred sales charges on redemptions, and redemption fees, if any; and (2) ongoing costs, including management fees, distribution and/or service (12b-1) fees, and other Fund expenses. This example is intended to help you understand your ongoing costs (in dollars) of investing in the Fund and to compare these costs with ongoing costs of investing in other mutual funds. The example is based on an investment of $1,000 invested at the beginning of the period and held for the entire period May 1, 2011 through October 31, 2011.
Actual expenses
The table below provides information about actual account values and actual expenses. You may use the information in this table, together with the amount you invested, to estimate the expenses that you paid over the period. Simply divide your account value by $1,000 (for example, an $8,600 account value divided by $1,000 = 8.6), then multiply the result by the number in the table under the heading entitled “Actual Expenses Paid During Period” to estimate the expenses you paid on your account during this period.
Hypothetical example for comparison purposes
The table below also provides information about hypothetical account values and hypothetical expenses based on the Fund’s actual expense ratio and an assumed rate of return of 5% per year before expenses, which is not the Fund’s actual return.
The hypothetical account values and expenses may not be used to estimate the actual ending account balance or expenses you paid for the period. You may use this information to compare the ongoing costs of investing in the Fund and other funds. To do so, compare this 5% hypothetical example with the 5% hypothetical examples that appear in the shareholder reports of the other funds.
Please note that the expenses shown in the table are meant to highlight your ongoing costs only and do not reflect any transaction costs, such as sales charges (loads) on purchase payments, contingent deferred sales charges on redemptions, and redemption fees, if any. Therefore, the hypothetical information is useful in comparing ongoing costs only, and will not help you determine the relative total costs of owning different funds. In addition, if these transaction costs were included, your costs would have been higher.
| | | | | | | | | | | | | | | | | | | | | | | | | | | | | | | |
| | | | | | | | | | HYPOTHETICAL
| | | |
| | | | | | | | | | (5% annual return before
| | | |
| | | | | | | ACTUAL | | | expenses) | | | |
| | | | Beginning
| | | Ending
| | | Expenses
| | | Ending
| | | Expenses
| | | Annualized
|
| | | | Account Value
| | | Account Value
| | | Paid During
| | | Account Value
| | | Paid During
| | | Expense
|
| Class | | | (05/01/11) | | | (10/31/11)1 | | | Period2 | | | (10/31/11) | | | Period2 | | | Ratio |
| A | | | $ | 1,000.00 | | | | $ | 908.40 | | | | $ | 6.69 | | | | $ | 1,018.20 | | | | $ | 7.07 | | | | | 1.39 | % |
| | | | | | | | | | | | | | | | | | | | | | | | | | | | | | | |
| B | | | | 1,000.00 | | | | | 904.60 | | | | | 10.27 | | | | | 1,014.42 | | | | | 10.87 | | | | | 2.14 | |
| | | | | | | | | | | | | | | | | | | | | | | | | | | | | | | |
| C | | | | 1,000.00 | | | | | 905.20 | | | | | 10.28 | | | | | 1,014.42 | | | | | 10.87 | | | | | 2.14 | |
| | | | | | | | | | | | | | | | | | | | | | | | | | | | | | | |
| R | | | | 1,000.00 | | | | | 907.20 | | | | | 7.88 | | | | | 1,016.94 | | | | | 8.34 | | | | | 1.64 | |
| | | | | | | | | | | | | | | | | | | | | | | | | | | | | | | |
| Y | | | | 1,000.00 | | | | | 910.10 | | | | | 5.49 | | | | | 1,019.46 | | | | | 5.80 | | | | | 1.14 | |
| | | | | | | | | | | | | | | | | | | | | | | | | | | | | | | |
| Institutional | | | | 1,000.00 | | | | | 910.50 | | | | | 4.24 | | | | | 1,020.77 | | | | | 4.48 | | | | | 0.88 | |
| | | | | | | | | | | | | | | | | | | | | | | | | | | | | | | |
| |
| 1 | The actual ending account value is based on the actual total return of the Fund for the period May 1, 2011 through October 31, 2011, after actual expenses and will differ from the hypothetical ending account value which is based on the Fund’s expense ratio and a hypothetical annual return of 5% before expenses. |
| 2 | Expenses are equal to the Fund’s annualized expense ratio as indicated above multiplied by the average account value over the period, multiplied by 184/365 to reflect the most recent fiscal half year. |
21 Invesco Endeavor Fund
| |
| Approval of Investment Advisory and Sub-Advisory Contracts |
The Board of Trustees (the Board) of AIM Investment Funds (Invesco Investment Funds) is required under the Investment Company Act of 1940, as amended, to approve annually the renewal of the Invesco Endeavor Fund (the Fund) investment advisory agreement with Invesco Advisers, Inc. (Invesco Advisers) and the Master Intergroup Sub-Advisory Contract for Mutual Funds (the sub-advisory contracts) with Invesco Asset Management Deutschland GmbH, Invesco Asset Management Limited, Invesco Asset Management (Japan) Limited, Invesco Australia Limited, Invesco Hong Kong Limited, Invesco Senior Secured Management, Inc. and Invesco Canada Ltd. (collectively, the Affiliated Sub-Advisers). During contract renewal meetings held on June 14-15, 2011, the Board as a whole, and the disinterested or “independent” Trustees, who comprise 80% of the Board, voting separately, approved the continuance of the Fund’s investment advisory agreement and the sub-advisory contracts for another year, effective July 1, 2011. In doing so, the Board considered the process that it follows in reviewing and approving the Fund’s investment advisory agreement and sub-advisory contracts and the information that it is provided. The Board determined that the Fund’s investment advisory agreement and the sub-advisory contracts are in the best interests of the Fund and its shareholders and the compensation to Invesco Advisers and the Affiliated Sub-Advisers under the agreements is fair and reasonable.
The Board’s Fund Evaluation Process
The Board’s Investments Committee has established three Sub-Committees, each of which is responsible for overseeing the management of a number of the series portfolios of the funds advised by Invesco Advisers (the Invesco Funds). The Sub-Committees meet throughout the year to review the performance of their assigned funds, including reviewing materials prepared under the direction of the independent Senior Officer, an officer of the Invesco Funds who reports directly to the independent Trustees. Over the course of each year, the Sub-Committees meet with portfolio managers for their assigned Invesco Funds and other members of management to review the performance, investment objective(s), policies, strategies and limitations and investment risks of these funds. The Sub-Committees meet regularly and at designated contract renewal meetings each year to conduct a review of the performance, fees, expenses and other matters related to their assigned Invesco Funds. Each Sub-Committee recommends to the Investments Committee, which in turn recommends to the full Board, whether to approve the continuance of each Invesco Fund’s investment advisory agreement and sub-advisory contracts for another year.
During the contract renewal process, the Trustees receive comparative performance and fee data regarding the Invesco Funds prepared by Invesco Advisers and an independent company, Lipper, Inc. (Lipper). The Trustees also receive an independent written evaluation from the Senior Officer. The Senior Officer’s evaluation is prepared as part of his responsibility to manage the process by which the Invesco Funds’ proposed management fees are negotiated during the annual contract renewal process to ensure they are negotiated in a manner that is at arms’ length and reasonable. The independent Trustees are assisted in their annual evaluation of the Fund’s investment advisory agreement by the Senior Officer and by independent legal counsel. The independent Trustees also discuss the continuance of the investment advisory agreement and sub-advisory contracts in private sessions with the Senior Officer and counsel.
In evaluating the fairness and reasonableness of the Fund’s investment advisory agreement and sub-advisory contracts, the Board considered, among other things, the factors discussed below. The Trustees also considered information provided in connection with fund acquisitions approved by the Trustees to rationalize the Invesco Funds product range following the acquisition of the retail mutual fund business of Morgan Stanley (the Morgan Stanley Transaction). The Trustees recognized that the advisory fees for the Invesco Funds include advisory fees that are the result of years of review and negotiation between the Trustees and Invesco Advisers as well as advisory fees inherited from Morgan Stanley and Van Kampen funds acquired in the Morgan Stanley Transaction. The Trustees’ deliberations and conclusions in a particular year may be based in part on their deliberations and conclusions regarding these same arrangements throughout the year and in prior years. One Trustee may have weighed a particular piece of information differently than another Trustee.
The discussion below serves as the Senior Officer’s independent written evaluation with respect to the Fund’s investment advisory agreement as well as a discussion of the material factors and related conclusions that formed the basis for the Board’s approval of the Fund’s investment advisory agreement and sub-advisory contracts. Unless otherwise stated, this information is current as of June 15, 2011, and may not reflect consideration of factors that became known to the Board after that date, including, for example, changes to the Fund’s performance, advisory fees, expense limitations and/or fee waivers.
Factors and Conclusions and Summary of Independent Written Fee Evaluation
| |
| A. | Nature, Extent and Quality of Services Provided by Invesco Advisers and the Affiliated Sub-Advisers |
The Board reviewed the advisory services provided to the Fund by Invesco Advisers under the Fund’s investment advisory agreement, the performance of Invesco Advisers in providing these services, and the credentials and experience of the officers and employees of Invesco Advisers who provide these services, including the Fund’s portfolio manager or managers, with whom the Board met during the year. The Board’s review of the qualifications of Invesco Advisers to provide advisory services included the Board’s consideration of Invesco Advisers’ performance and investment process oversight, independent credit analysis and investment risk management.
In determining whether to continue the Fund’s investment advisory agreement, the Board considered the prior relationship between Invesco Advisers and the Fund, as well as the Board’s knowledge of Invesco Advisers’ operations, and concluded that it is beneficial to maintain the current relationship, in part, because of such knowledge. The Board also considered services that Invesco Advisers and its affiliates provide to the Invesco Funds such as various back office support functions, equity and fixed income trading operations, internal audit, distribution and legal and compliance. The Board concluded that the nature, extent and quality of the services provided to the Fund by Invesco Advisers are appropriate and satisfactory and the advisory services are provided in accordance with the terms of the Fund’s investment advisory agreement.
The Board reviewed the services provided by the Affiliated Sub-Advisers under the sub-advisory contracts and the credentials and experience of the officers and employees of the Affiliated Sub-Advisers who provide these services. The Board noted that the Affiliated Sub-Advisers have offices and personnel that are located in financial centers around the world. As a result, the Affiliated Sub-Advisers can provide research and investment analysis on the markets and economies of various countries in which the Fund invests and make recommendations on securities of companies located in such countries. The Board concluded that the sub-advisory contracts benefit the Fund and its shareholders by permitting Invesco Advisers to use the resources and talents of the Affiliated Sub-Advisers in managing the Fund. The Board concluded that the
22 Invesco Endeavor Fund
nature, extent and quality of the services provided by the Affiliated Sub-Advisers are appropriate and satisfactory and in accordance with the terms of the Fund’s sub-advisory contracts.
The Board considered Fund performance as a relevant factor in considering whether to approve the investment advisory agreement as well as the sub-advisory contracts for the Fund, as Invesco Canada Ltd. currently manages assets of the Fund.
The Board compared the Fund’s performance during the past one, three and five calendar years to the performance of funds in the Lipper performance universe and against the Lipper Mid-Cap Core Funds Index. The Board noted that performance of Class A shares of the Fund was in the third quintile of the performance universe for the one year period and the first quintile for the three and five year periods (the first quintile being the best performing funds and the fifth quintile being the worst performing funds). The Board noted that performance of Class A shares of the Fund was below the performance of the Index for the one year period and above the performance of the Index for the three and five year periods. Although the independent written evaluation of the Fund’s Senior Officer only considered Fund performance through the most recent calendar year, the Trustees also reviewed more recent Fund performance and this review did not change their conclusions.
| |
| C. | Advisory and Sub-Advisory Fees and Fee Waivers |
The Board compared the Fund’s contractual advisory fee rate to the contractual advisory fee rates of funds in the Fund’s Lipper expense group at a common asset level. The Board noted that the contractual advisory fee rate for Class A shares of the Fund was below the median contractual advisory fee rate of funds in the expense group. The Board also reviewed the methodology used by Lipper in providing expense group information, which includes using audited financial data from the most recent annual report of each fund in the expense group that was publicly available as of the end of the past calendar year and including only one fund per investment adviser. The Board noted that comparative data is as of varying dates, which may affect the comparability of data during times of market volatility.
The Board noted that Invesco Advisers and the Affiliated Sub-Advisers do not advise other mutual funds or client accounts with investment strategies comparable to those of the Fund.
The Board also noted that Invesco Advisers has contractually agreed to waive fees and/or limit expenses of the Fund through at least February 28, 2012 in an amount necessary to limit total annual operating expenses to a specified percentage of average daily net assets for each class of the Fund. The Board noted that at the current expense ratio for the Fund, this expense waiver does not have any impact.
The Board also considered the services provided by the Affiliated Sub-Advisers pursuant to the sub-advisory contracts, as well as the allocation of fees between Invesco Advisers and the Affiliated Sub-Advisers pursuant to the sub-advisory contracts. The Board noted that Invesco Advisers provides services to sub-advised Invesco Funds, including oversight of the Affiliated Sub-Advisers as well as the additional services described above other than day-to-day portfolio management. The Board also noted that the sub-advisory fees have no direct effect on the Fund or its shareholders, as they are paid by Invesco Advisers to the Affiliated Sub-Advisers.
Based upon the information and considerations described above, the Board concluded that the Fund’s advisory and sub-advisory fees are fair and reasonable.
| |
| D. | Economies of Scale and Breakpoints |
The Board considered the extent to which there are economies of scale in the provision of advisory services to the Fund. The Board also considered whether the Fund benefits from economies of scale through contractual breakpoints in the Fund’s advisory fee schedule. The Board also noted that the Fund shares directly in economies of scale through lower fees charged by third party service providers based on the combined size of the Invesco Funds and other clients advised by Invesco Advisers.
| |
| E. | Profitability and Financial Resources |
The Board reviewed information from Invesco Advisers concerning the costs of the advisory and other services that Invesco Advisers and its affiliates provide to the Fund and the profitability of Invesco Advisers and its affiliates in providing these services. The Board reviewed with Invesco Advisers the methodology used to prepare the profitability information. The Board considered the profitability of Invesco Advisers in connection with managing the Fund and the Invesco Funds. The Board noted that Invesco Advisers continues to operate at a net profit from services Invesco Advisers and its subsidiaries provide to the Fund and the Invesco Funds. The Board concluded that the level of profits realized by Invesco Advisers and its affiliates from providing services to the Fund is not excessive given the nature, quality and extent of the services provided to the Invesco Funds. The Board considered whether Invesco Advisers and each Affiliated Sub-Adviser are financially sound and have the resources necessary to perform their obligations under the investment advisory agreement and sub-advisory contracts. The Board concluded that Invesco Advisers and each Affiliated Sub-Adviser have the financial resources necessary to fulfill these obligations.
| |
| F. | Collateral Benefits to Invesco Advisers and its Affiliates |
The Board considered various other benefits received by Invesco Advisers and its affiliates from the relationship with the Fund, including the fees received for their provision of administrative, transfer agency and distribution services to the Fund. The Board considered the performance of Invesco Advisers and its affiliates in providing these services and the organizational structure employed to provide these services. The Board also considered that these services are provided to the Fund pursuant to written contracts that are reviewed and approved on an annual basis by the Board; that the services are required for the operation of the Fund; that Invesco Advisers and its affiliates can provide services, the nature and quality of which are at least equal to those provided by others offering the same or similar services; and that the fees for such services are fair and reasonable in light of the usual and customary charges by others for services of the same nature and quality.
The Board considered the benefits realized by Invesco Advisers and the Affiliated Sub-Advisers as a result of portfolio brokerage transactions executed through “soft dollar” arrangements. The Board noted that soft dollar arrangements shift the payment obligation for research and execution services from Invesco Advisers and the Affiliated Sub-Advisers to the Invesco Funds and therefore may reduce Invesco Advisers’ and the Affiliated Sub-Advisers’ expenses. The Board concluded that the soft dollar arrangements are appropriate. The Board also concluded that, based on their review and representations made by the Chief Compliance Officer of the Invesco Funds, these arrangements are consistent with regulatory requirements.
The Board considered that the Fund’s uninvested cash and cash collateral from any securities lending arrangements may be invested in money market funds advised by Invesco Advisers pursuant to procedures approved by the Board. The Board noted that Invesco Advisers receives advisory fees from these affiliated money market funds attributable to such investments, although Invesco Advisers has contractually agreed to waive through varying periods the advisory fees payable by the Invesco Funds. The waiver is in an amount equal to 100% of the net advisory fee Invesco Advisers receives from the affiliated money market funds with respect to the Fund’s investment in the affiliated money market funds of uninvested cash, but not cash collateral. The Board concluded that the Fund’s investment of uninvested cash and cash collateral from any securities lending arrangements in the affiliated money market funds is in the best interests of the Fund and its shareholders.
23 Invesco Endeavor Fund
Trustees and Officers
The address of each trustee and officer is AIM Investment Funds (Invesco Investment Funds) (the “Trust”), 11 Greenway Plaza, Suite 2500, Houston, Texas 77046-1173. The trustees serve for the life of the Trust, subject to their earlier death, incapacitation, resignation, retirement or removal as more specifically provided in the Trust’s organizational documents. Each officer serves for a one year term or until their successors are elected and qualified. Column two below includes length of time served with predecessor entities, if any.
| | | | | | | | | |
| | | | | | | Number of
| | |
| | | | | | | Funds in
| | |
| | | | | | | Fund Complex
| | |
Name, Year of Birth and
| | Trustee and/
| | Principal Occupation(s)
| | Overseen by
| | Other Directorship(s)
|
| Position(s) Held with the Trust | | or Officer Since | | During Past 5 Years | | Trustee | | Held by Trustee |
| | | | | | | | | |
| | | | | | | | | |
| Interested Persons | | | | | | | | |
| | | | | | | | | |
| | | | | | | | | |
| | | | | | | | | |
Martin L. Flanagan1 — 1960
Trustee | | 2007 | | Executive Director, Chief Executive Officer and President, Invesco Ltd. (ultimate parent of Invesco and a global investment management firm); Advisor to the Board, Invesco Advisers, Inc. (formerly known as Invesco Institutional (N.A.), Inc.); Trustee, The Invesco Funds; Vice Chair, Investment Company Institute; and Member of Executive Board, SMU Cox School of Business
Formerly: Chairman, Invesco Advisers, Inc. (registered investment adviser); Director, Chairman, Chief Executive Officer and President, IVZ Inc. (holding company), INVESCO Group Services, Inc. (service provider) and Invesco North American Holdings, Inc. (holding company); Director, Chief Executive Officer and President, Invesco Holding Company Limited (parent of Invesco and a global investment management firm); Director, Invesco Ltd.; Chairman, Investment Company Institute and President, Co-Chief Executive Officer, Co-President, Chief Operating Officer and Chief Financial Officer, Franklin Resources, Inc. (global investment management organization) | | 141 | | None |
| | | | | | | | | |
| | | | | | | | | |
| | | | | | | | | |
Philip A. Taylor2 — 1954
Trustee, President and
Principal Executive Officer | | 2006 | | Head of North American Retail and Senior Managing Director, Invesco Ltd.; Director, Co-Chairman, Co-President and Co-Chief Executive Officer, Invesco Advisers, Inc. (formerly known as Invesco Institutional (N.A.), Inc.) (registered investment adviser); Director, Chairman, Chief Executive Officer and President, Invesco Management Group, Inc. (formerly Invesco Aim Management Group, Inc.) (financial services holding company); Director and President, INVESCO Funds Group, Inc. (registered investment adviser and registered transfer agent); Director and Chairman, Invesco Investment Services, Inc. (formerly known as Invesco Aim Investment Services, Inc.) (registered transfer agent) and IVZ Distributors, Inc. (formerly known as INVESCO Distributors, Inc.) (registered broker dealer); Director, President and Chairman, Invesco Inc. (holding company) and Invesco Canada Holdings Inc. (holding company); Chief Executive Officer, Invesco Corporate Class Inc. (corporate mutual fund company) and Invesco Canada Fund Inc. (corporate mutual fund company); Director, Chairman and Chief Executive Officer, Invesco Canada Ltd. (formerly known as Invesco Trimark Ltd./Invesco Trimark Ltèe) (registered investment adviser and registered transfer agent); Trustee, President and Principal Executive Officer, The Invesco Funds (other than AIM Treasurer’s Series Trust (Invesco Treasurer’s Series Trust) and Short-Term Investments Trust); Trustee and Executive Vice President, The Invesco Funds (AIM Treasurer’s Series Trust (Invesco Treasurer’s Series Trust) and Short-Term Investments Trust only); Director, Invesco Investment Advisers LLC (formerly known as Van Kampen Asset Management); Director, Chief Executive Officer and President, Van Kampen Exchange Corp.
Formerly: Director and Chairman, Van Kampen Investor Services Inc.: Director, Chief Executive Officer and President, 1371 Preferred Inc. (holding company); and Van Kampen Investments Inc.; Director and President, AIM GP Canada Inc. (general partner for limited partnerships); and Van Kampen Advisors, Inc.; Director and Chief Executive Officer, Invesco Trimark Dealer Inc. (registered broker dealer); Director, Invesco Distributors, Inc. (formerly known as Invesco Aim Distributors, Inc.) (registered broker dealer); Manager, Invesco PowerShares Capital Management LLC; Director, Chief Executive Officer and President, Invesco Advisers, Inc.; Director, Chairman, Chief Executive Officer and President, Invesco Aim Capital Management, Inc.; President, Invesco Trimark Dealer Inc. and Invesco Trimark Ltd./Invesco Trimark Ltèe; Director and President, AIM Trimark Corporate Class Inc. and AIM Trimark Canada Fund Inc.; Senior Managing Director, Invesco Holding Company Limited; Trustee and Executive Vice President, Tax-Free Investments Trust; Director and Chairman, Fund Management Company (former registered broker dealer); President and Principal Executive Officer, The Invesco Funds (AIM Treasurer’s Series Trust (Invesco Treasurer’s Series Trust), Short-Term Investments Trust and Tax-Free Investments Trust only); President, AIM Trimark Global Fund Inc. and AIM Trimark Canada Fund Inc. | | 141 | | None |
| | | | | | | | | |
| | | | | | | | | |
| | | | | | | | | |
Wayne W. Whalen3 — 1939
Trustee | | 2010 | | Of Counsel, and prior to 2010, partner in the law firm of Skadden, Arps, Slate, Meagher & Flom LLP, legal counsel to funds in the Fund Complex | | 159 | | Director of the Abraham Lincoln Presidential Library Foundation |
| | | | | | | | | |
| | | | | | | | | |
| | | | | | | | | |
| Independent Trustees | | | | | | | | |
| | | | | | | | | |
| | | | | | | | | |
| | | | | | | | | |
Bruce L. Crockett — 1944
Trustee and Chair | | 2001 | | Chairman, Crockett Technology Associates (technology consulting company)
Formerly: Director, Captaris (unified messaging provider); Director, President and Chief Executive Officer COMSAT Corporation; and Chairman, Board of Governors of INTELSAT (international communications company) | | 141 | | ACE Limited (insurance company); and Investment Company Institute |
| | | | | | | | | |
| | | | | | | | | |
| | | | | | | | | |
David C. Arch — 1945
Trustee | | 2010 | | Chairman and Chief Executive Officer of Blistex Inc., a consumer health care products manufacturer. | | 159 | | Member of the Heartland Alliance Advisory Board, a nonprofit organization serving human needs based in Chicago. Board member of the Illinois Manufacturers’ Association. Member of the Board of Visitors, Institute for the Humanities, University of Michigan |
| | | | | | | | | |
| |
| 1 | Mr. Flanagan is considered an interested person of the Trust because he is an officer of the adviser to the Trust, and an officer and a director of Invesco Ltd., ultimate parent of the adviser to the Trust. |
| 2 | Mr. Taylor is considered an interested person of the Trust because he is an officer and a director of the adviser to, and a director of the principal underwriter of, the Trust. |
| 3 | Mr. Whalen has been deemed to be an interested person of the Trust because of his prior service as counsel to the predecessor funds of certain Invesco open-end funds and his affiliation with the law firm that served as counsel to such predecessor funds and continues to serve as counsel to the Invesco Van Kampen closed-end funds. |
T-1 Invesco Endeavor Fund
Trustees and Officers—(continued)
The address of each trustee and officer is AIM Investment Funds (Invesco Investment Funds) (the “Trust”), 11 Greenway Plaza, Suite 2500, Houston, Texas 77046-1173. The trustees serve for the life of the Trust, subject to their earlier death, incapacitation, resignation, retirement or removal as more specifically provided in the Trust’s organizational documents. Each officer serves for a one year term or until their successors are elected and qualified. Column two below includes length of time served with predecessor entities, if any.
| | | | | | | | | |
| | | | | | | Number of
| | |
| | | | | | | Funds in
| | |
| | | | | | | Fund Complex
| | |
Name, Year of Birth and
| | Trustee and/
| | Principal Occupation(s)
| | Overseen by
| | Other Directorship(s)
|
| Position(s) Held with the Trust | | or Officer Since | | During Past 5 Years | | Trustee | | Held by Trustee |
| | | | | | | | | |
| | | | | | | |
| Independent Trustees—(continued) | | | | | | |
| | | | | | | | | |
| | | | | | | | | |
| | | | | | | | | |
Bob R. Baker — 1936
Trustee | | 2003 | | Retired
Formerly: President and Chief Executive Officer, AMC Cancer Research Center; and Chairman and Chief Executive Officer, First Columbia Financial Corporation | | 141 | | None |
| | | | | | | | | |
| | | | | | | | | |
| | | | | | | | | |
Frank S. Bayley — 1939
Trustee | | 1987 | | Retired
Formerly: Director, Badgley Funds, Inc. (registered investment company) (2 portfolios) and Partner, law firm of Baker & McKenzie | | 141 | | Director and Chairman, C.D. Stimson Company (a real estate investment company) |
| | | | | | | | | |
| | | | | | | | | |
| | | | | | | | | |
James T. Bunch — 1942
Trustee | | 2003 | | Founder, Green, Manning & Bunch Ltd. (investment banking firm)
Formerly: Executive Committee, United States Golf Association; and Director, Policy Studies, Inc. and Van Gilder Insurance Corporation | | 141 | | Vice Chairman, Board of Governors, Western Golf Association/Evans Scholars Foundation and Director, Denver Film Society |
| | | | | | | | | |
| | | | | | | | | |
| | | | | | | | | |
Rodney F. Dammeyer — 1940
Trustee | | 2010 | | President of CAC, LLC, a private company offering capital investment and management advisory services.
Formerly: Prior to January 2004, Director of TeleTech Holdings Inc.; Prior to 2002, Director of Arris Group, Inc.; Prior to 2001, Managing Partner at Equity Group Corporate Investments. Prior to 1995, Vice Chairman of Anixter International. Prior to 1985, experience includes Senior Vice President and Chief Financial Officer of Household International, Inc, Executive Vice President and Chief Financial Officer of Northwest Industries, Inc. and Partner of Arthur Andersen & Co. | | 159 | | Director of Quidel Corporation and Stericycle, Inc. Prior to May 2008, Trustee of The Scripps Research Institute. Prior to February 2008, Director of Ventana Medical Systems, Inc. Prior to April 2007, Director of GATX Corporation. Prior to April 2004, Director of TheraSense, Inc. |
| | | | | | | | | |
| | | | | | | | | |
| | | | | | | | | |
Albert R. Dowden — 1941
Trustee | | 2001 | | Director of a number of public and private business corporations, including the Boss Group, Ltd. (private investment and management); Reich & Tang Funds (5 portfolios) (registered investment company); and Homeowners of America Holding Corporation/ Homeowners of America Insurance Company (property casualty company)
Formerly: Director, Continental Energy Services, LLC (oil and gas pipeline service); Director, CompuDyne Corporation (provider of product and services to the public security market) and Director, Annuity and Life Re (Holdings), Ltd. (reinsurance company); Director, President and Chief Executive Officer, Volvo Group North America, Inc.; Senior Vice President, AB Volvo; Director of various public and private corporations; Chairman, DHJ Media, Inc.; Director Magellan Insurance Company; and Director, The Hertz Corporation, Genmar Corporation (boat manufacturer), National Media Corporation; Advisory Board of Rotary Power International (designer, manufacturer, and seller of rotary power engines); and Chairman, Cortland Trust, Inc. (registered investment company) | | 141 | | Board of Nature’s Sunshine Products, Inc. |
| | | | | | | | | |
| | | | | | | | | |
| | | | | | | | | |
Jack M. Fields — 1952
Trustee | | 2001 | | Chief Executive Officer, Twenty First Century Group, Inc. (government affairs company); and Owner and Chief Executive Officer, Dos Angelos Ranch, L.P. (cattle, hunting, corporate entertainment), Discovery Global Education Fund (non-profit) and Cross Timbers Quail Research Ranch (non-profit)
Formerly: Chief Executive Officer, Texana Timber LP (sustainable forestry company) and member of the U.S. House of Representatives | | 141 | | Administaff |
| | | | | | | | | |
| | | | | | | | | |
| | | | | | | | | |
Carl Frischling — 1937
Trustee | | 2001 | | Partner, law firm of Kramer Levin Naftalis and Frankel LLP | | 141 | | Director, Reich & Tang Funds (6 portfolios) |
| | | | | | | | | |
| | | | | | | | | |
| | | | | | | | | |
Prema Mathai-Davis — 1950
Trustee | | 2001 | | Retired
Formerly: Chief Executive Officer, YWCA of the U.S.A. | | 141 | | None |
| | | | | | | | | |
| | | | | | | | | |
| | | | | | | | | |
Larry Soll — 1942
Trustee | | 2003 | | Retired
Formerly, Chairman, Chief Executive Officer and President, Synergen Corp. (a biotechnology company) | | 141 | | None |
| | | | | | | | | |
| | | | | | | | | |
| | | | | | | | | |
Hugo F. Sonnenschein — 1940
Trustee | | 2010 | | President Emeritus and Honorary Trustee of the University of Chicago and the Adam Smith Distinguished Service Professor in the Department of Economics at the University of Chicago. Prior to July 2000, President of the University of Chicago. | | 159 | | Trustee of the University of Rochester and a member of its investment committee. Member of the National Academy of Sciences, the American Philosophical Society and a fellow of the American Academy of Arts and Sciences |
| | | | | | | | | |
| | | | | | | | | |
| | | | | | | | | |
Raymond Stickel, Jr. — 1944
Trustee | | 2005 | | Retired
Formerly: Director, Mainstay VP Series Funds, Inc. (25 portfolios) and Partner, Deloitte & Touche | | 141 | | Director of Long Cove Club Owners’ Association (home owner’s association) |
| | | | | | | | | |
T-2 Invesco Endeavor Fund
Trustees and Officers—(continued)
The address of each trustee and officer is AIM Investment Funds (Invesco Investment Funds) (the “Trust”), 11 Greenway Plaza, Suite 2500, Houston, Texas 77046-1173. The trustees serve for the life of the Trust, subject to their earlier death, incapacitation, resignation, retirement or removal as more specifically provided in the Trust’s organizational documents. Each officer serves for a one year term or until their successors are elected and qualified. Column two below includes length of time served with predecessor entities, if any.
| | | | | | | | | |
| | | | | | | Number of
| | |
| | | | | | | Funds in
| | |
| | | | | | | Fund Complex
| | |
Name, Year of Birth and
| | Trustee and/
| | Principal Occupation(s)
| | Overseen by
| | Other Directorship(s)
|
| Position(s) Held with the Trust | | or Officer Since | | During Past 5 Years | | Trustee | | Held by Trustee |
| | | | | | | | | |
| | | | | | | | | |
| Other Officers | | | | | | | | |
| | | | | | | | | |
| | | | | | | | | |
| | | | | | | | | |
Russell C. Burk — 1958
Senior Vice President and Senior Officer | | 2005 | | Senior Vice President and Senior Officer of Invesco Funds | | N/A | | N/A |
| | | | | | | | | |
| | | | | | | | | |
| | | | | | | | | |
John M. Zerr — 1962
Senior Vice President, Chief Legal Officer and Secretary | | 2006 | | Director, Senior Vice President, Secretary and General Counsel, Invesco Management Group, Inc. (formerly known as Invesco Aim Management Group, Inc.) and Van Kampen Exchange Corp.; Senior Vice President, Invesco Advisers, Inc. (formerly known as Invesco Institutional (N.A.), Inc.) (registered investment adviser); Senior Vice President and Secretary, Invesco Distributors, Inc. (formerly known as Invesco Aim Distributors, Inc.); Director, Vice President and Secretary, Invesco Investment Services, Inc. (formerly known as Invesco Aim Investment Services, Inc.) and IVZ Distributors, Inc. (formerly known as INVESCO Distributors, Inc.); Director and Vice President, INVESCO Funds Group, Inc.; Senior Vice President, Chief Legal Officer and Secretary, The Invesco Funds; Manager, Invesco PowerShares Capital Management LLC; Director, Secretary and General Counsel, Invesco Investment Advisers LLC (formerly known as Van Kampen Asset Management); Secretary and General Counsel, Van Kampen Funds Inc. and Chief Legal Officer, PowerShares Exchange-Traded Fund Trust, PowerShares Exchange-Traded Fund Trust II, PowerShares India Exchange-Traded Fund Trust and PowerShares Actively Managed Exchange-Traded Fund Trust
Formerly: Director and Secretary, Van Kampen Advisors Inc.; Director Vice President, Secretary and General Counsel Van Kampen Investor Services Inc.; Director, Invesco Distributors, Inc. (formerly known as Invesco Aim Distributors, Inc.); Director, Senior Vice President, General Counsel and Secretary, Invesco Advisers, Inc.; and Van Kampen Investments Inc.; Director, Vice President and Secretary, Fund Management Company; Director, Senior Vice President, Secretary, General Counsel and Vice President, Invesco Aim Capital Management, Inc.; Chief Operating Officer and General Counsel, Liberty Ridge Capital, Inc. (an investment adviser); Vice President and Secretary, PBHG Funds (an investment company) and PBHG Insurance Series Fund (an investment company); Chief Operating Officer, General Counsel and Secretary, Old Mutual Investment Partners (a broker-dealer); General Counsel and Secretary, Old Mutual Fund Services (an administrator) and Old Mutual Shareholder Services (a shareholder servicing center); Executive Vice President, General Counsel and Secretary, Old Mutual Capital, Inc. (an investment adviser); and Vice President and Secretary, Old Mutual Advisors Funds (an investment company) | | N/A | | N/A |
| | | | | | | | | |
| | | | | | | | | |
| | | | | | | | | |
Lisa O. Brinkley — 1959
Vice President | | 2004 | | Global Compliance Director, Invesco Ltd.; Chief Compliance Officer, Invesco Investment Services, Inc.(formerly known as Invesco Aim Investment Services, Inc.); and Vice President, The Invesco Funds
Formerly: Chief Compliance Officer, Invesco Distributors, Inc. (formerly known as Invesco Aim Distributors, Inc.) and Van Kampen Investor Services Inc.; Senior Vice President, Invesco Management Group, Inc.; Senior Vice President and Chief Compliance Officer, Invesco Advisers, Inc. and The Invesco Funds; Vice President and Chief Compliance Officer, Invesco Aim Capital Management, Inc. and Invesco Distributors, Inc.; Vice President, Invesco Investment Services, Inc. and Fund Management Company | | N/A | | N/A |
| | | | | | | | | |
| | | | | | | | | |
| | | | | | | | | |
Sheri Morris — 1964
Vice President, Treasurer and Principal Financial Officer | | 1999 | | Vice President, Treasurer and Principal Financial Officer, The Invesco Funds; and Vice President, Invesco Advisers, Inc. (formerly known as Invesco Institutional (N.A.), Inc.) (registered investment adviser).
Formerly: Treasurer, PowerShares Exchange-Traded Fund Trust, PowerShares Exchange--Traded Fund Trust II, PowerShares India Exchange-Traded Fund Trust and PowerShares Actively Managed Exchange-Traded Fund Trust; Vice President, Invesco Advisers, Inc., Invesco Aim Capital Management, Inc. and Invesco Aim Private Asset Management, Inc.; Assistant Vice President and Assistant Treasurer, The Invesco Funds and Assistant Vice President, Invesco Advisers, Inc., Invesco Aim Capital Management, Inc. and Invesco Aim Private Asset Management, Inc. | | N/A | | N/A |
| | | | | | | | | |
| | | | | | | | | |
| | | | | | | | | |
Karen Dunn Kelley — 1960
Vice President | | 2004 | | Head of Invesco’s World Wide Fixed Income and Cash Management Group; Senior Vice President, Invesco Advisers, Inc. (formerly known as Invesco Institutional (N.A.), Inc.) (registered investment adviser); Executive Vice President, Invesco Distributors, Inc. (formerly known as Invesco Aim Distributors, Inc.); Senior Vice President, Invesco Management Group, Inc. (formerly known as Invesco Aim Management Group, Inc.); and Director, Invesco Mortgage Capital Inc.; Vice President, The Invesco Funds (other than AIM Treasurer’s Series Trust (Invesco Treasurer’s Series Trust) and Short-Term Investments Trust); President and Principal Executive Officer, The Invesco Funds (AIM Treasurer’s Series Trust (Invesco Treasurer’s Series Trust) and Short-Term Investments Trust only).
Formerly: Senior Vice President, Van Kampen Investments Inc.; Vice President, Invesco Advisers, Inc. (formerly known as Invesco Institutional (N.A.), Inc.); Director of Cash Management and Senior Vice President, Invesco Advisers, Inc. and Invesco Aim Capital Management, Inc.; President and Principal Executive Officer, Tax-Free Investments Trust; Director and President, Fund Management Company; Chief Cash Management Officer, Director of Cash Management, Senior Vice President, and Managing Director, Invesco Aim Capital Management, Inc.; Director of Cash Management, Senior Vice President, and Vice President, Invesco Advisers, Inc. and The Invesco Funds (AIM Treasurer’s Series Trust (Invesco Treasurer’s Series Trust), Short-Term Investments Trust and Tax-Free Investments Trust only) | | N/A | | N/A |
| | | | | | | | | |
T-3 Invesco Endeavor Fund
Trustees and Officers—(continued)
The address of each trustee and officer is AIM Investment Funds (Invesco Investment Funds) (the “Trust”), 11 Greenway Plaza, Suite 2500, Houston, Texas 77046-1173. The trustees serve for the life of the Trust, subject to their earlier death, incapacitation, resignation, retirement or removal as more specifically provided in the Trust’s organizational documents. Each officer serves for a one year term or until their successors are elected and qualified. Column two below includes length of time served with predecessor entities, if any.
| | | | | | | | | |
| | | | | | | Number of
| | |
| | | | | | | Funds in
| | |
| | | | | | | Fund Complex
| | |
Name, Year of Birth and
| | Trustee and/
| | Principal Occupation(s)
| | Overseen by
| | Other Directorship(s)
|
| Position(s) Held with the Trust | | or Officer Since | | During Past 5 Years | | Trustee | | Held by Trustee |
| | | | | | | | | |
| | | | | | | |
| Other Officers—(continued) | | | | | | |
| | | | | | | | | |
| | | | | | | | | |
| | | | | | | | | |
Lance A. Rejsek — 1967
Anti-Money Laundering Compliance Officer | | 2005 | | Anti-Money Laundering Compliance Officer, Invesco Advisers, Inc. (formerly known as Invesco Institutional (N.A.), Inc.) (registered investment adviser); Invesco Distributors, Inc. (formerly known as Invesco Aim Distributors, Inc.), Invesco Investment Services, Inc. (formerly known as Invesco Aim Investment Services, Inc.), The Invesco Funds, PowerShares Exchange-Traded Fund Trust, PowerShares Exchange-Traded Fund Trust II, PowerShares India Exchange-Traded Fund Trust, PowerShares Actively Managed Exchange-Traded Fund Trust, Invesco Investment Advisers LLC (formerly known as Van Kampen Asset Management) and Van Kampen Funds Inc.
Formerly: Anti-Money Laundering Compliance Officer, Van Kampen Investor Services Inc., Fund Management Company, Invesco Advisers, Inc., Invesco Aim Capital Management, Inc. and Invesco Aim Private Asset Management, Inc. | | N/A | | N/A |
| | | | | | | | | |
| | | | | | | | | |
| | | | | | | | | |
Todd L. Spillane — 1958
Chief Compliance Officer | | 2006 | | Senior Vice President, Invesco Management Group, Inc. (formerly known as Invesco Aim Management Group, Inc.) and Van Kampen Exchange Corp.; Senior Vice President and Chief Compliance Officer, Invesco Advisers, Inc. (registered investment adviser) (formerly known as Invesco Institutional (N.A.), Inc.); Chief Compliance Officer, The Invesco Funds, PowerShares Exchange-Traded Fund Trust, PowerShares Exchange-Traded Fund Trust II, PowerShares India Exchange-Traded Fund Trust, PowerShares Actively Managed Exchange-Traded Fund Trust, INVESCO Private Capital Investments, Inc. (holding company) and Invesco Private Capital, Inc. (registered investment adviser); Vice President, Invesco Distributors, Inc. (formerly known as Invesco Aim Distributors, Inc.) and Invesco Investment Services, Inc. (formerly known as Invesco Aim Investment Services, Inc.).
Formerly: Chief Compliance Officer, Invesco Van Kampen Closed-End Funds; Senior Vice President, Van Kampen Investments Inc.; Senior Vice President and Chief Compliance Officer, Invesco Advisers, Inc. and Invesco Aim Capital Management, Inc.; Chief Compliance Officer, Invesco Global Asset Management (N.A.), Inc., Invesco Senior Secured Management, Inc. (registered investment adviser) and Van Kampen Investor Services Inc.; Vice President, Invesco Aim Capital Management, Inc. and Fund Management Company | | N/A | | N/A |
| | | | | | | | | |
The Statement of Additional Information of the Trust includes additional information about the Fund’s Trustees and is available upon request, without charge, by calling 1.800.959.4246. Please refer to the Fund’s prospectus for information on the Fund’s sub-advisers.
| | | | | | | |
Office of the Fund
11 Greenway Plaza, Suite 2500
Houston, TX 77046-1173 | | Investment Adviser
Invesco Advisers, Inc.
1555 Peachtree Street, N.E.
Atlanta, GA 30309 | | Distributor
Invesco Distributors, Inc.
11 Greenway Plaza, Suite 2500 Houston, TX 77046-1173 | | Auditors
PricewaterhouseCoopers LLP
1201 Louisiana Street, Suite 2900 Houston, TX 77002-5678 |
| | | | | | | |
| | | | | | | |
Counsel to the Fund
Stradley Ronon Stevens & Young, LLP
2600 One Commerce Square Philadelphia, PA 19103 | | Counsel to the Independent Trustees
Kramer, Levin, Naftalis & Frankel LLP 1177 Avenue of the Americas
New York, NY 10036-2714 | | Transfer Agent
Invesco Investment Services, Inc. 11 Greenway Plaza, Suite 2500 Houston, TX 77046-1173 | | Custodian
State Street Bank and Trust Company
225 Franklin
Boston, MA 02110-2801 |
T-4 Invesco Endeavor Fund
Invesco mailing information
Send general correspondence to Invesco Investment Services, Inc., P.O. Box 219078, Kansas City, MO 64121-9078.
Invesco privacy policy
You share personal and financial information with us that is necessary for your transactions and your account records. We take very seriously the obligation to keep that information confidential and private.
Invesco collects nonpublic personal information about you from account applications or other forms you complete and from your transactions with us or our affiliates. We do not disclose information about you or our former customers to service providers or other third parties except to the extent necessary to service your account and in other limited circumstances as permitted by law. For example, we use this information to facilitate the delivery of transaction confirmations, financial reports, prospectuses and tax forms.
Even within Invesco, only people involved in the servicing of your accounts and compliance monitoring have access to your information. To ensure the highest level of confidentiality and security, Invesco maintains physical, electronic and procedural safeguards that meet or exceed federal standards. Special measures, such as data encryption and authentication, apply to your communications with us on our website. More detail is available to you at invesco.com/privacy.
Important notice regarding delivery of security holder documents
To reduce Fund expenses, only one copy of most shareholder documents may be mailed to shareholders with multiple accounts at the same address (Householding). Mailing of your shareholder documents may be householded indefinitely unless you instruct us otherwise. If you do not want the mailing of these documents to be combined with those for other members of your household, please contact Invesco Investment Services, Inc. at 800 959 4246 or contact your financial institution. We will begin sending you individual copies for each account within 30 days after receiving your request.
Fund holdings and proxy voting information
The Fund provides a complete list of its holdings four times in each fiscal year, at the quarter-ends. For the second and fourth quarters, the lists appear in the Fund’s semiannual and annual reports to shareholders. For the first and third quarters, the Fund files the lists with the Securities and Exchange Commission (SEC) on Form N-Q. The most recent list of portfolio holdings is available at invesco.com/completeqtrholdings. Shareholders can also look up the Fund’s Forms N-Q on the SEC website at sec.gov. Copies of the Fund’s Forms N-Q may be reviewed and copied at the SEC Public Reference Room in Washington, D.C. You can obtain information on the operation of the Public Reference Room, including information about duplicating fee charges, by calling 202 551 8090 or 800 732 0330, or by electronic request at the following email address: publicinfo@sec.gov. The SEC file numbers for the Fund are 811-05426 and 033-19338.
A description of the policies and procedures that the Fund uses to determine how to vote proxies relating to portfolio securities is available without charge, upon request, from our Client Services department at 800 959 4246 or at invesco.com/proxyguidelines. The information is also available on the SEC website, sec.gov.
Information regarding how the Fund voted proxies related to its portfolio securities during the 12 months ended June 30, 2011, is available at invesco.com/proxysearch. The information is also available on the SEC website, sec.gov.
Invesco Advisers, Inc. is an investment adviser; it provides investment advisory services to individual and institutional clients and does not sell securities. Invesco Distributors, Inc. is the U.S. distributor for Invesco Ltd.’s retail mutual funds, exchange-traded funds and institutional money market funds. Both are wholly owned, indirect subsidiaries of Invesco Ltd.
END-AR-1 Invesco Distributors, Inc.
Annual Report to Shareholders October 31, 2011
Invesco Global Advantage Fund
Nasdaq:
A: GADAX§ B: GADBX§ C: GADCX§ Y: GADDX
| | | |
|
| |
| 2 | | Letters to Shareholders |
| 4 | | Performance Summary |
| 4 | | Management Discussion |
| 6 | | Long-Term Fund Performance |
| 8 | | Supplemental Information |
| 9 | | Schedule of Investments |
| 11 | | Financial Statements |
| 13 | | Notes to Financial Statements |
| 20 | | Financial Highlights |
| 21 | | Auditor’s Report |
| 22 | | Fund Expenses |
| 23 | | Approval of Investment Advisory and Sub-Advisory Agreements |
| 25 | | Proxy Results |
| T-1 | | Trustees and Officers |
Letters to Shareholders

Philip Taylor
Dear Shareholders:
Enclosed is important information about your Fund and its performance. I encourage you to read this report to learn more about your Fund’s short- and long-term performance and its holdings as of the close of the reporting period. This report also includes useful information about your Fund’s management team and a discussion of how your Fund was managed during the reporting period.
Investors are likely to confront both opportunities and challenges in 2012 — just as we did in 2011. After all, changes in market sentiment never do investors the courtesy of announcing their impending arrival, and your goals and needs may have changed, requiring changes in your financial strategy.
That’s why the start of a new year is always a good time to catch up with your financial adviser. He or she can explain how your investments performed in the year just ended — how each performed individually, and more important, how they performed as a diversified portfolio. Of course, it’s important to remember that an investment’s long-term performance is more important than its short-term performance. Looking ahead to the new year and evaluating your individual situation, your financial adviser can provide valuable insight into whether your investments are still appropriate for your individual needs, goals and risk tolerance.
For current information about your Fund
In addition to meeting with your financial adviser to discuss your individual situation at the start of the new year, you also may find it helpful to stay abreast of market trends and developments. Doing so may provide reassurance in times of economic uncertainty and market volatility such as we saw in 2011 — and are likely to see again in 2012.
Invesco can help you stay informed about your investments and market trends. On our website, invesco.com/us, we provide timely market updates and commentary from many of our fund managers and other investment professionals. Also on our website, you can obtain information about your account at any hour of the day or night. I invite you to visit and explore the tools and information we offer at invesco.com/us.
Our commitment to investment excellence
As we’ve seen over the last several years, market conditions can change — often suddenly and dramatically. That’s one reason financial advisers typically advise their clients to be well diversified and to maintain a long-term investment focus. While diversification can’t guarantee a profit or protect against loss, it may cushion the impact of dramatic market moves. Maintaining a long-term investment focus for your long-term goals — financing your retirement or your children’s education, for example — may help you avoid making rash investment decisions based on short-term market swings.
Likewise, Invesco’s investment professionals maintain a long-term focus. Across our broad array of investment products, investment excellence is our ultimate goal. Each of our funds is managed by specialized teams of investment professionals, and as a company, we maintain a single focus — investment management — that allows our fund managers to concentrate on doing what they do best: managing your money.
Our funds are managed strictly according to their stated investment objectives and strategies, with robust risk oversight using consistent, repeatable investment processes that don’t change in response to short-term market events. This disciplined approach can’t guarantee a profit; no investment can do that, since all involve some measure of risk. But it can ensure that your money is managed the way we said it would be — according to your Fund’s objective and strategies.
Our adherence to stated investment objectives and strategies allows your financial adviser to build a diversified portfolio that meets your individual risk tolerance and financial goals. It also means that when your goals change, your financial adviser will be able to find an Invesco fund that’s appropriate for your needs.
Questions?
If you have questions about your account, please contact one of our client service representatives at 800 959 4246. If you have a general Invesco-related question or comment for me, I invite you to email me directly at phil@invesco.com.
All of us at Invesco look forward to serving your investment management needs for many years to come. Thank you for investing with us.
Sincerely,
Philip Taylor
Senior Managing Director, Invesco Ltd.
| 2 | | Invesco Global Advantage Fund |

Bruce Crockett
Dear Fellow Shareholders:
Although the world’s economies are gradually recovering from the financial crisis, it has not been a smooth path. Unrest in the Middle East, persistently weak job and housing markets in the U.S. and continued government balance sheet repair in Europe are contributing to a slow, labored march toward global recovery.
In this environment, investors face risks that could make it more difficult to achieve their long-term financial goals — a secure retirement, home ownership, a child’s college education. Although the markets are complex and dynamic, there are ways to simplify the process and potentially increase your odds of achieving your goals. The best approach is to create a solid financial plan that helps you save and invest in ways that anticipate your needs over the long term.
Your financial adviser can help you define your financial plan, develop an appropriate investment strategy and put you in a better position to achieve your financial goals over the long term. This can take some of the guesswork out of the process and help you make thoughtful investments. Your financial adviser also can help you better understand your tolerance for risk, so that your investment approach lets you sleep at night while getting you closer to your goals. Lastly, your financial adviser can develop an asset allocation strategy that seeks to balance your investment approach, providing some protection against a decline in the markets while allowing you to participate in rising markets. Invesco calls this type of approach “intentional investing.” It means thinking carefully, planning thoughtfully and acting deliberately.
While no investment can guarantee favorable returns, your Board remains committed to managing costs and enhancing the performance of Invesco’s funds as part of our Investor First orientation. We continue to oversee the funds with the same strong sense of responsibility for your money and your continued trust that we’ve always maintained.
Thanks to the approval of our fund shareholders, Invesco has made great progress in realigning our U.S. mutual fund product line following our acquisition of Morgan Stanley’s retail asset management business, including Van Kampen Investments. When completed, the realignment will reduce overlap in the product lineup, enhance efficiency across our product line and build a solid foundation for further growth to meet client and shareholder needs. I would like to thank those of you who voted your proxy, and I hope our shareholders haven’t been too inconvenienced by the process.
As always, please contact me at bruce@brucecrockett.com with any questions or concerns you may have. On behalf of your Board, we look forward to continuing to represent your interests and serving your needs.
Sincerely,
Bruce L. Crockett
Independent Chair
Invesco Funds Board of Trustees
| 3 | | Invesco Global Advantage Fund |
Management’s Discussion of Fund Performance
Performance summary
Please note that the fiscal year-end for the Fund has changed to October 31. Therefore, the period covered by this report is from May 31, 2011, the date of the last annual report, through October 31, 2011, the Fund’s new fiscal year-end.
Global equity markets faced headwinds in 2010 and 2011. China’s growth continued to slow as the U.S. battled high unemployment and runaway deficits. Several European countries faced similar deficits, which brought to light the imperfect structure of the euro. The reporting period ended with a market upswing, however, as European leaders took steps to address the Greek sovereign debt issue, expand the bailout fund and stabilize the banking system.
The volatility and weakness experienced by global equity markets over the fiscal year ended October 31, 2011, was reflected in the performance of Invesco Global Advantage Fund, which underperformed its style-specific benchmark, the MSCI World Growth Index.
Your Fund’s long-term performance appears later in this report.
Fund vs. Indexes
Cumulative total returns, 5/31/11 to 10/31/11, at net asset value (NAV). Performance shown does not include applicable contingent deferred sales charges (CDSC) or front-end sales charges, which would have reduced performance.
| | | | | |
|
Class A Shares† | | | -9.37 | % |
| |
Class B Shares† | | | -9.69 | |
| |
Class C Shares† | | | -9.66 | |
| |
Class Y Shares † | | | -9.25 | |
| |
MSCI World Index▼ (Broad Market Index) | | | -9.44 | |
| |
MSCI World Growth Index ▼(Style-Specific Index) | | | -8.35 | |
| |
Lipper Global Multi-Cap Growth Funds Index ▼ (Former Peer Group Index)†† | | | -12.32 | |
| |
Lipper Global Large-Cap Growth Funds Index ▼(Peer Group Index)†† | | | -10.00 | |
| |
Source(s): ▼Lipper Inc.
The Fund recently adopted a three-tier benchmark structure to compare its performance to broad market, style-specific and peer group market measures.
| | |
| † | | Performance includes litigation proceeds. Had these proceeds not been received, total returns would have been lower. |
| |
| †† | | During the reporting period, the Fund has elected to use the Lipper Global Large-Cap Growth Funds Index as its peer group index rather than the Lipper Global Multi-Cap Growth Funds Index because the Lipper Global Large-Cap Growth Funds Index more closely reflects the performance of the types of securities in which the Fund invests. |
How we invest
When selecting stocks for your Fund, we use a disciplined investment strategy that emphasizes fundamental research, supported by both quantitative analysis and portfolio construction techniques. Our EQV (earnings, quality, valuation) strategy focuses primarily on identifying quality companies that have experienced, or
exhibit the potential for, accelerated or above-average earnings growth, but whose stock prices have not fully reflected these attributes.
While research responsibilities within the portfolio management team are focused by geographic region, we select investments for the Fund using a bottom-up investment approach, which means we
construct the Fund primarily on a stock-by-stock basis. We focus on the strengths of individual companies rather than sectors, countries or market-cap trends.
We believe disciplined sell decisions are key to successful investing. We consider selling a stock for one of the following reasons:
| n | | A company’s fundamentals deteriorate, or it posts disappointing earnings. |
| |
| n | | A stock’s price seems overvalued. |
| |
| n | | A more attractive opportunity becomes available. |
Market conditions and your Fund
Market volatility was a common theme during the reporting period. During mid-2011, Greek sovereign debt concerns and signs of slowing global growth continued to worry investors. In addition, numerous world events caught investors’ attention, including the growing unrest in the Middle East and northern Africa, and the devastating earthquake and tsunami in Japan on March 11.
Although markets stabilized and were generally positive through the summer, major equity indexes sold off precipitously in August as the U.S. struggled with its debt ceiling and ultimately received the first-ever downgrade to its credit rating from Standard & Poor’s. Uncertainty created by the U.S. credit downgrade combined with a lack of consumer confidence and an intensifying debt crisis in the eurozone continued to weigh on investors through the end of the period, reigniting fears of a global recession and a double-dip recession in the U.S.
In this environment, we continued to construct the Fund’s portfolio with a long-term view and a bottom-up approach (i.e., selecting stocks on an individual basis). Despite negative absolute returns for the Fund, our holdings in the U.K., Germany and the Netherlands outperformed those of the MSCI World Growth Index and were the most significant
Portfolio Composition
By sector
| | | | | |
|
| Consumer Discretionary | | | 21.3 | % |
| |
| Information Technology | | | 18.9 | |
| |
| Health Care | | | 13.7 | |
| |
| Consumer Staples | | | 12.8 | |
| |
| Energy | | | 9.0 | |
| |
| Financials | | | 7.8 | |
| |
| Industrials | | | 7.2 | |
| |
| Materials | | | 3.5 | |
| |
| Telecommunication Services | | | 2.4 | |
| |
| Utilities | | | 0.7 | |
| |
Money Market Funds | | | | |
Plus Other Assets Less Liabilities | | | 2.7 | |
Top 10 Equity Holdings*
| | | | | | | | | |
|
| | 1. | | | Apple Inc. | | | 2.6 | % |
| |
| | 2. | | | UnitedHealth Group Inc. | | | 2.1 | |
| |
| | 3. | | | Imperial Tobacco Group PLC | | | 2.0 | |
| |
| | 4. | | | Teva Pharmaceutical Industries Ltd.-ADR | | | 1.8 | |
| |
| | 5. | | | Canon, Inc. | | | 1.7 | |
| |
| | 6. | | | BHP Billiton Ltd. | | | 1.7 | |
| |
| | 7. | | | Anheuser-Busch InBev N.V. | | | 1.6 | |
| |
| | 8. | | | Unilever N.V. | | | 1.6 | |
| |
| | 9. | | | Banco Bradesco S.A.-ADR | | | 1.6 | |
| |
| | 10. | | | Occidental Petroleum Corp. | | | 1.5 | |
Top Five Countries*
| | | | | |
|
| 1. | | United States | | 25.4 | % |
| |
| 2. | | United Kingdom | | 14.4 |
| |
| 3. | | Japan | | 7.4 |
| |
| 4. | | Switzerland | | 6.6 |
| |
| 5. | | Germany | | 6.3 |
| | | | | |
| |
| Total Net Assets | | $115.3 million |
| Total Number of Holdings* | | 95 |
The Fund’s holdings are subject to change, and there is no assurance that the Fund will continue to hold any particular security.
| | |
| * | | Excluding money market fund holdings. |
| 4 | | Invesco Global Advantage Fund |
positive contributors to relative performance over the reporting period.
From a sector perspective, exposure to the energy sector supported relative results. A meaningful underweight in the materials sector, one of the reporting period’s weakest market segments, also benefited relative results.
Apple, Deckers Outdoor and NHN were among the top individual contributors to Fund performance. Apple is a U.S.-based multinational consumer electronics company with well-known products that include the Macintosh computer line, the iPod, iPhone and iPad. The company’s earnings growth accelerated sharply toward the end of the reporting period, driven by strong sales of its iPhone and iPad products. We trimmed our position in Apple during the period because the stock grew to represent more than 3% of the portfolio.
Deckers Outdoor is a U.S.-based footwear company that manufactures products under the Ahnu, Mozo, Sanuk, Simple Shoes, Teva, Tsubo and UGG Australia brands. The company moved its U.K. distribution operations in-house, which created a shift in revenues for the year. We took advantage of the stock’s price weakness to initiate a position in Deckers Outdoor during the period.
NHN is South Korea’s premier internet company and operator of the nation’s top search portal. NHN continued to benefit from the proliferation of smartphone usage, which in turn drove search advertising on mobile devices.
In contrast, the Fund underperformed the index by the widest margins in the financials, industrials and health care sectors. From a geographic perspective, Fund holdings were hardest hit in Europe, with holdings in France and Sweden detracting the most from relative results.
BNP Paribas, a global financial institution based in France, was the most significant individual detractor from Fund performance over the reporting period. The company’s stock was negatively affected by European sovereign debt issues and liquidity concerns surrounding many European banks. BNP Paribas’ most significant sovereign exposure is to Italy, and it has negligible exposure to Greece and Portugal. We believe BNP Paribas remains a quality banking business.
The Fund’s exposure to emerging markets detracted from both absolute and relative results. During the reporting period, emerging markets underper-formed developed markets due to multiple macroeconomic headwinds, including the European debt crisis, a
deteriorating global economy, rising inflation and tightening monetary policies.
As long-term, bottom-up stock selectors, we see volatility as an opportunity to buy quality growth companies at more attractive valuations than usual; consequently, we took advantage of market volatility to buy several stocks that had long been on our EQV radar.
Stock selection in the portfolio continued to be driven by the underlying fundamentals of a company — not any top-down macroeconomic views. That said, because of our belief in the long-term strength of consumer growth outside the U.S., we maintained overweight exposure to the consumer discretionary sector at the end of the reporting period. We reduced our exposure to the health care sector slightly but remained overweight compared with the index. We also ended the period with overweight exposure to the telecommunication services sector, while our largest underweight positions were in the materials, industrials and consumer staples sectors.
On August 31, 2011, Barrett Sides retired from the investment management business and was replaced on the management team by Mark Jason. A complete list of your Fund’s managers appears at right.
At the close of the reporting period, we remained focused on investing according to our bottom-up stock selection process and maintaining our long-term investment view. We thank you for your investment in Invesco Global Advantage Fund.
The views and opinions expressed in management’s discussion of Fund performance are those of Invesco Advisers, Inc. These views and opinions are subject to change at any time based on factors such as market and economic conditions. These views and opinions may not be relied upon as investment advice or recommendations, or as an offer for a particular security. The information is not a complete analysis of every aspect of any market, country, industry, security or the Fund. Statements of fact are from sources considered reliable, but Invesco Advisers, Inc. makes no representation or warranty as to their completeness or accuracy. Although historical performance is no guarantee of future results, these insights may help you understand our investment management philosophy.
See important Fund and, if applicable, index disclosures later in this report.
Matthew Dennis
Chartered Financial Analyst, portfolio manager, is lead manager of Invesco Global Advantage Fund. He joined Invesco in 2000. Mr. Dennis earned a B.A. in economics from The University of Texas at Austin and an M.S. in finance from Texas A&M University.
Ryan Amerman
Chartered Financial Analyst, portfolio manager, is manager of Invesco Global Advantage Fund. He joined Invesco in 1996. Mr. Amerman earned a B.B.A. from Stephen F. Austin State University and an M.B.A. from the University of St. Thomas.
Mark Jason
Chartered Financial Analyst, portfolio manager, is manager of Invesco Global Advantage Fund. He joined Invesco in 2001. Mr. Jason earned a B.S. in finance and a B.S. in real estate from California State University at Northridge.
| 5 | | Invesco Global Advantage Fund |
Your Fund’s Long-Term Performance
Results of a $10,000 Investment – Oldest Share Classes since Inception
Fund data from 2/25/98, index data from 2/28/98
Past performance cannot guarantee comparable future results.
As noted earlier in this report, during the reporting period, the Fund has adopted a three-tier benchmark structure to compare its performance to broad market, style-specific and peer group market measures. These additional benchmarks will now be included in the chart above. Benchmarks not shown do not have sufficient history dating back to the Fund’s inception.
The data shown in the chart include reinvested distributions, applicable sales charges and Fund expenses including management fees. Results for Class B
shares are calculated as if a hypothetical shareholder had liquidated his entire investment in the Fund at the close of the reporting period and paid the contingent deferred sales charges, if applicable. Index results include reinvested dividends, but they do not reflect sales charges. Performance of the peer group, if applicable, reflects fund expenses and management fees; performance of a market index does not. Performance shown in the chart and table(s) does not reflect deduction of taxes a shareholder would pay on Fund distributions or sale of Fund shares.
This chart, which is a logarithmic chart, presents the fluctuations in the value of the Fund and its indexes. We believe that a logarithmic chart is more effective than other types of charts in illustrating changes in value during the early years shown in the chart. The vertical axis, the one that indicates the dollar value of an investment, is constructed with each segment representing a percent change in the value of the investment. In this chart, each segment represents a doubling, or 100% change, in the value of the investment. In other words, the space between $5,000 and $10,000 is the same size as the space between $10,000 and $20,000.
| 6 | | Invesco Global Advantage Fund |
Average Annual Total Returns
As of 10/31/11, including maximum applicable sales charges
| | | | | | | | | |
| Class A Shares | | | | |
| Inception (2/25/98) | | | 1.48 | % |
| |
| | 10 | | Years | | | 4.25 | |
| |
| | 5 | | Years | | | 0.76 | |
| |
| | 1 | | Year | | | -3.89 | |
| |
| | | | | | | | | |
| Class B Shares | | | | |
| |
| Inception (2/25/98) | | | 1.45 | % |
| |
| | 10 | | Years | | | 4.21 | |
| |
| | 5 | | Years | | | 0.76 | |
| |
| | 1 | | Year | | | -4.11 | |
| |
| | | | | | | | | |
| Class C Shares | | | | |
| |
| Inception (2/25/98) | | | 1.15 | % |
| |
| | 10 | | Years | | | 4.05 | |
| |
| | 5 | | Years | | | 1.14 | |
| |
| | 1 | | Year | | | -0.11 | |
| |
| | | | | | | | | |
| Class Y Shares | | | | |
| |
| Inception (2/25/98) | | | 2.14 | % |
| |
| | 10 | | Years | | | 5.11 | |
| |
| | 5 | | Years | | | 2.16 | |
| |
| | 1 | | Year | | | 1.97 | |
| |
| Performance includes litigation proceeds. Had these proceeds not been received, total returns would have been lower. |
Effective June 1, 2010, Class A, Class B, Class C and Class I shares of the predecessor fund, Morgan Stanley Global Advantage Fund, advised by Morgan Stanley Investment Advisors Inc. were reorganized into Class A, Class B, Class C and Class Y shares, respectively, of Invesco Global Advantage Fund. Returns shown above for Class A, Class B, Class C and Class Y shares are blended returns of the predecessor fund and Invesco Global Advantage Fund. Share class returns will differ from the predecessor fund because of different expenses.
The performance data quoted represent past performance and cannot guarantee comparable future results; current performance may be lower or higher. Please visit invesco.com/performance for the most recent month-end performance. Performance figures reflect reinvested distributions, changes in net asset value and the effect of the maximum sales charge unless otherwise stated. Investment return and principal value will fluctuate so that you may have a gain or loss when you sell shares.
Average Annual Total Returns
As of 9/30/11, the most recent calendar quarter-end, including maximum applicable sales charges
| | | | | | | | | |
| Class A Shares | | | | |
| Inception (2/25/98) | | | 0.73 | % |
| |
| | 10 | | Years | | | 3.31 | |
| |
| | 5 | | Years | | | -0.50 | |
| |
| | 1 | | Year | | | -8.98 | |
| |
| | | | | | | | | |
| Class B Shares | | | | |
| |
| Inception (2/25/98) | | | 0.70 | % |
| |
| | 10 | | Years | | | 3.28 | |
| |
| | 5 | | Years | | | -0.53 | |
| |
| | 1 | | Year | | | -9.25 | |
| |
| | | | | | | | | |
| Class C Shares | | | | |
| |
| Inception (2/25/98) | | | 0.40 | % |
| |
| | 10 | | Years | | | 3.11 | |
| |
| | 5 | | Years | | | -0.15 | |
| |
| | 1 | | Year | | | -5.42 | |
| |
| | | | | | | | | |
| Class Y Shares | | | | |
| |
| Inception (2/25/98) | | | 1.38 | % |
| |
| | 10 | | Years | | | 4.15 | |
| |
| | 5 | | Years | | | 0.87 | |
| |
| | 1 | | Year | | | -3.48 | |
| |
| Performance includes litigation proceeds. Had these proceeds not been received, total returns would have been lower. |
The total annual Fund operating expense ratio set forth in the most recent Fund prospectus as of the date of this report for Class A, Class B, Class C, and Class Y shares was 1.27%, 2.02%, 2.02% and 1.02%, respectively. The expense ratios presented above may vary from the expense ratios presented in other sections of this report that are based on expenses incurred during the period covered by this report.
Class A share performance reflects the maximum 5.50% sales charge, and Class B and Class C share performance reflects the applicable contingent deferred sales charge (CDSC) for the period involved. The CDSC on Class B shares declines from 5% beginning at the time of purchase to 0% at the beginning of the seventh year. The CDSC on Class C shares is 1% for the first year after purchase. Class Y shares do not have a front-end sales charge or a CDSC; therefore, performance is at net asset value.
The performance of the Fund’s share classes will differ primarily due to different sales charge structures and class expenses.
| 7 | | Invesco Global Advantage Fund |
Invesco Global Advantage Fund’s investment objective is long-term capital growth.
| n | | Unless otherwise stated, information presented in this report is as of October 31, 2011, and is based on total net assets. |
| |
| n | | Unless otherwise noted, all data provided by Invesco. |
| |
| n | | To access your Fund’s reports/prospectus, visit invesco.com/fundreports. |
| |
About share classes
| n | | Class B shares may not be purchased or acquired by exchange from share classes other than Class B shares. Please see the prospectus for more information. |
| |
| n | | Class Y shares are available to only certain investors. Please see the prospectus for more information. |
| |
Principal risks of investing in the Fund
| n | | Common stock and other equity securities. In general, stock and other equity security values fluctuate, and sometimes widely fluctuate, in response to activities specific to the company as well as general market, economic and political conditions. |
| |
| n | | Foreign and emerging market securities. Investments in foreign markets entail special risks such as currency, political, economic and market risks. There also may be greater market volatility, less reliable financial information, higher transaction and custody costs, decreased market liquidity and less government and exchange regulation associated with investments in foreign markets. The risks of investing in emerging market countries are greater than risks associated with investments in foreign developed countries. The use of forward foreign currency exchange contracts involve the risk that such transactions may reduce or preclude the opportunity for gain and that currency contracts create exposure to currencies in which the Fund’s securities are not denominated. |
About indexes used in this report
| n | | The MSCI World IndexSM is an unmanaged index considered representative of stocks of developed countries. |
| |
| n | | The MSCI World Growth Index is an unmanaged index considered representative of growth stocks of developed countries. |
| |
| n | | The Lipper Global Multi-Cap Growth Funds Index is an unmanaged index considered representative of global multi-cap growth funds tracked by Lipper. |
| |
| n | | The Lipper Global Large-Cap Growth Funds Index is an unmanaged index considered representative of global large-cap growth funds tracked by Lipper. |
| |
| n | | The Fund is not managed to track the performance of any particular index, including the index(es) defined here, and consequently, the performance of the Fund may deviate significantly from the performance of the index(es). |
| |
| n | | A direct investment cannot be made in an index. Unless otherwise indicated, index results include reinvested dividends, and they do not reflect sales charges. Performance of the peer group, if applicable, reflects fund expenses; performance of a market index does not. |
Other information
| n | | The Chartered Financial Analyst® (CFA®) designation is globally recognized and attests to a charterholder’s success in a rigorous and comprehensive study program in the field of investment management and research analysis. |
| |
| n | | The returns shown in management’s discussion of Fund performance are based on net asset values calculated for shareholder transactions. Generally accepted accounting principles require adjustments to be made to the net assets of the Fund at period end for financial reporting purposes, and as such, the net asset values for shareholder transactions and the returns based on those net asset values may differ from the net asset values and returns reported in the Financial Highlights. |
| |
| n | | Industry classifications used in this report are generally according to the Global Industry Classification Standard, which was developed by and is the exclusive property and a service mark of MSCI Inc. and Standard & Poor’s. |
This report must be accompanied or preceded by a currently effective Fund prospectus, which contains more complete information, including sales charges and expenses. Investors should read it carefully before investing.
NOT FDIC INSURED | MAY LOSE VALUE | NO BANK GUARANTEE
Fund Nasdaq Symbols
| | | |
|
| Class A Shares | | GADAX |
| Class B Shares | | GADBX |
| Class C Shares | | GADCX |
| Class Y Shares | | GADDX |
| 8 | | Invesco Global Advantage Fund |
Schedule of Investments
October 31, 2011
| | | | | | | | | |
| | | Shares | | Value |
| |
Common Stocks & Other Equity Interests–96.28%
|
Australia–4.63%
| | | | |
| BHP Billiton Ltd. | | | 48,910 | | | $ | 1,913,507 | |
| |
| Brambles Ltd. | | | 153,765 | | | | 1,060,453 | |
| |
| QBE Insurance Group Ltd. | | | 56,192 | | | | 861,878 | |
| |
| WorleyParsons Ltd. | | | 51,890 | | | | 1,500,539 | |
| |
| | | | | | | | 5,336,377 | |
| |
Belgium–1.64%
| | | | |
| Anheuser-Busch InBev N.V. | | | 34,018 | | | | 1,888,663 | |
| |
Brazil–2.06%
| | | | |
| Banco Bradesco S.A.–ADR | | | 98,609 | | | | 1,794,684 | |
| |
| Cielo S.A. | | | 21,600 | | | | 576,982 | |
| |
| | | | | | | | 2,371,666 | |
| |
Canada–1.04%
| | | | |
| Suncor Energy, Inc. | | | 37,444 | | | | 1,191,588 | |
| |
China–1.22%
| | | | |
Industrial & Commercial Bank of China
Ltd.–Class H(a) | | | 2,291,000 | | | | 1,406,601 | |
| |
Denmark–1.17%
| | | | |
| Novo Nordisk A.S.–Class B | | | 12,789 | | | | 1,350,456 | |
| |
France–4.86%
| | | | |
| BNP Paribas S.A. | | | 19,115 | | | | 847,541 | |
| |
| Cap Gemini S.A. | | | 28,562 | | | | 1,092,230 | |
| |
| Cie Generale des Etablissements Michelin–Class B | | | 10,162 | | | | 734,040 | |
| |
| Danone S.A. | | | 22,364 | | | | 1,545,924 | |
| |
| L’Oreal S.A. | | | 6,907 | | | | 760,680 | |
| |
| Schneider Electric S.A. | | | 10,711 | | | | 620,419 | |
| |
| | | | | | | | 5,600,834 | |
| |
Germany–5.29%
| | | | |
| Adidas AG | | | 24,803 | | | | 1,744,864 | |
| |
| Bayer AG | | | 8,989 | | | | 573,317 | |
| |
| Bayerische Motoren Werke AG | | | 12,803 | | | | 1,043,394 | |
| |
| Fresenius Medical Care AG & Co. KGaA | | | 15,023 | | | | 1,092,974 | |
| |
| SAP AG | | | 27,275 | | | | 1,643,582 | |
| |
| | | | | | | | 6,098,131 | |
| |
Hong Kong–1.21%
| | | | |
| China Mobile Ltd. | | | 65,000 | | | | 619,428 | |
| |
| Hutchison Whampoa Ltd. | | | 85,000 | | | | 776,612 | |
| |
| | | | | | | | 1,396,040 | |
| |
India–0.98%
| | | | |
| Infosys Ltd.–ADR | | | 19,283 | | | | 1,129,791 | |
| |
Ireland–4.09%
| | | | |
| Accenture PLC–Class A | | | 27,934 | | | | 1,683,303 | |
| |
| Cooper Industries PLC | | | 16,157 | | | | 847,596 | |
| |
| Ingersoll-Rand PLC | | | 20,357 | | | | 633,713 | |
| |
| WPP PLC | | | 149,748 | | | | 1,551,991 | |
| |
| | | | | | | | 4,716,603 | |
| |
Israel–1.83%
| | | | |
| Teva Pharmaceutical Industries Ltd.–ADR | | | 51,687 | | | | 2,111,414 | |
| |
Japan–7.44%
| | | | |
| Canon, Inc. | | | 43,100 | | | | 1,968,212 | |
| |
| Fanuc Corp. | | | 5,500 | | | | 888,109 | |
| |
| Keyence Corp. | | | 4,800 | | | | 1,220,878 | |
| |
| Komatsu Ltd. | | | 28,700 | | | | 706,649 | |
| |
| Nidec Corp. | | | 13,000 | | | | 1,069,892 | |
| |
| Toyota Motor Corp. | | | 30,000 | | | | 1,003,070 | |
| |
| Yamada Denki Co., Ltd. | | | 23,850 | | | | 1,718,893 | |
| |
| | | | | | | | 8,575,703 | |
| |
Mexico–1.84%
| | | | |
| America Movil S.A.B. de C.V.–Series L–ADR | | | 39,196 | | | | 996,362 | |
| |
| Grupo Televisa S.A.B. de C.V.–ADR | | | 52,611 | | | | 1,122,193 | |
| |
| | | | | | | | 2,118,555 | |
| |
Netherlands–2.25%
| | | | |
| Koninklijke Ahold N.V. | | | 61,959 | | | | 792,305 | |
| |
| Unilever N.V. | | | 52,238 | | | | 1,796,323 | |
| |
| | | | | | | | 2,588,628 | |
| |
Russia–0.99%
| | | | |
| Gazprom OAO–ADR | | | 98,364 | | | | 1,139,758 | |
| |
Singapore–0.68%
| | | | |
| United Overseas Bank Ltd. | | | 58,000 | | | | 785,865 | |
| |
South Korea–2.19%
| | | | |
| Hyundai Mobis | | | 4,967 | | | | 1,430,562 | |
| |
NHN Corp.(b) | | | 5,249 | | | | 1,093,867 | |
| |
| | | | | | | | 2,524,429 | |
| |
Spain–0.91%
| | | | |
| Amadeus IT Holding S.A.–Class A | | | 55,734 | | | | 1,046,099 | |
| |
Sweden–2.52%
| | | | |
| Swedbank AB–Class A | | | 66,298 | | | | 925,454 | |
| |
| Telefonaktiebolaget LM Ericsson–Class B | | | 127,605 | | | | 1,328,338 | |
| |
| Volvo AB–Class B | | | 52,605 | | | | 652,208 | |
| |
| | | | | | | | 2,906,000 | |
| |
| | | | | | | | | |
| | | | | | | | | |
See accompanying Notes to Financial Statements which are an integral part of the financial statements.
9 Invesco Global Advantage Fund
| | | | | | | | | |
| | | Shares | | Value |
| |
Switzerland–6.62%
| | | | |
ABB Ltd.(b) | | | 55,219 | | | $ | 1,041,149 | |
| |
Julius Baer Group Ltd.(b) | | | 27,907 | | | | 1,049,835 | |
| |
| Nestle S.A. | | | 18,542 | | | | 1,073,143 | |
| |
| Novartis AG | | | 31,392 | | | | 1,774,362 | |
| |
| Roche Holding AG | | | 8,494 | | | | 1,396,605 | |
| |
Syngenta AG(b) | | | 4,248 | | | | 1,299,519 | |
| |
| | | | | | | | 7,634,613 | |
| |
Taiwan–1.02%
| | | | |
| Taiwan Semiconductor Manufacturing Co. Ltd. | | | 484,000 | | | | 1,180,391 | |
| |
United Kingdom–14.37%
| | | | |
| BG Group PLC | | | 63,660 | | | | 1,379,566 | |
| |
| British American Tobacco PLC | | | 22,115 | | | | 1,012,033 | |
| |
| Centrica PLC | | | 170,828 | | | | 809,074 | |
| |
| Compass Group PLC | | | 180,784 | | | | 1,640,866 | |
| |
| GlaxoSmithKline PLC | | | 15,964 | | | | 359,359 | |
| |
| Imperial Tobacco Group PLC | | | 63,927 | | | | 2,329,705 | |
| |
| Kingfisher PLC | | | 270,264 | | | | 1,117,700 | |
| |
| Next PLC | | | 36,037 | | | | 1,471,917 | |
| |
| Reed Elsevier PLC | | | 174,210 | | | | 1,491,250 | |
| |
| Royal Dutch Shell PLC–Class B | | | 43,405 | | | | 1,560,176 | |
| |
| Smith & Nephew PLC | | | 97,111 | | | | 885,993 | |
| |
| Tesco PLC | | | 211,370 | | | | 1,362,261 | |
| |
| Vodafone Group PLC | | | 413,263 | | | | 1,146,095 | |
| |
| | | | | | | | 16,565,995 | |
| |
United States–25.43%
| | | | |
Amazon.com, Inc.(b) | | | 6,083 | | | | 1,298,781 | |
| |
Apple Inc.(b) | | | 7,304 | | | | 2,956,513 | |
| |
| Broadcom Corp.–Class A | | | 22,226 | | | | 802,136 | |
| |
Cameron International Corp.(b) | | | 24,978 | | | | 1,227,419 | |
| |
| Cardinal Health, Inc. | | | 33,568 | | | | 1,486,055 | |
| |
| Chubb Corp. (The) | | | 10,254 | | | | 687,531 | |
| |
| Comcast Corp.–Class A | | | 56,472 | | | | 1,324,268 | |
| |
| Corning Inc. | | | 27,754 | | | | 396,605 | |
| |
| Costco Wholesale Corp. | | | 13,799 | | | | 1,148,767 | |
| |
Deckers Outdoor Corp.(b) | | | 11,530 | | | | 1,328,717 | |
| |
DIRECTV–Class A(b) | | | 31,896 | | | | 1,449,992 | |
| |
Express Scripts, Inc.(b) | | | 14,573 | | | | 666,423 | |
| |
| Exxon Mobil Corp. | | | 7,228 | | | | 564,435 | |
| |
Gilead Sciences, Inc.(b) | | | 36,558 | | | | 1,523,006 | |
| |
Google Inc.–Class A(b) | | | 2,812 | | | | 1,666,504 | |
| |
| Home Depot, Inc. (The) | | | 16,338 | | | | 584,900 | |
| |
| Johnson Controls, Inc. | | | 18,321 | | | | 603,311 | |
| |
| JPMorgan Chase & Co. | | | 16,594 | | | | 576,807 | |
| |
| Macy’s, Inc. | | | 25,942 | | | | 792,009 | |
| |
Medco Health Solutions, Inc.(b) | | | 2,371 | | | | 130,073 | |
| |
| Microsoft Corp. | | | 57,781 | | | | 1,538,708 | |
| |
| Mosaic Co. (The) | | | 13,832 | | | | 810,002 | |
| |
| Occidental Petroleum Corp. | | | 19,291 | | | | 1,792,906 | |
| |
| PepsiCo, Inc. | | | 16,887 | | | | 1,063,037 | |
| |
| UnitedHealth Group Inc. | | | 49,652 | | | | 2,382,800 | |
| |
| Visa Inc.–Class A | | | 5,530 | | | | 515,728 | |
| |
| | | | | | | | 29,317,433 | |
| |
| Total Common Stocks & Other Equity Interests (Cost $97,034,765) | | | | | | | 110,981,633 | |
| |
Preferred Stocks–0.99%
|
Germany–0.99%
| | | | |
| Volkswagen AG–Pfd. (Cost $1,176,554) | | | 6,556 | | | | 1,146,894 | |
| |
Money Market Funds–2.25%
|
Liquid Assets Portfolio–Institutional Class(c) | | | 1,298,691 | | | | 1,298,691 | |
| |
Premier Portfolio–Institutional Class(c) | | | 1,298,690 | | | | 1,298,690 | |
| |
| Total Money Market Funds (Cost $2,597,381) | | | | | | | 2,597,381 | |
| |
| TOTAL INVESTMENTS–99.52% (Cost $100,808,700) | | | | | | | 114,725,908 | |
| |
| OTHER ASSETS LESS LIABILITIES–0.48% | | | | | | | 548,708 | |
| |
| NET ASSETS–100.00% | | | | | | $ | 115,274,616 | |
| |
Investment Abbreviations:
| | | |
| ADR | | – American Depositary Receipt |
| Pfd. | | – Preferred |
Notes to Schedule of Investments:
| | |
| (a) | | Non-income producing security acquired as part of a unit with or in exchange for other securities or acquired through a corporate action. |
| (b) | | Non-income producing security. |
| (c) | | The money market fund and the Fund are affiliated by having the same investment adviser. |
See accompanying Notes to Financial Statements which are an integral part of the financial statements.
10 Invesco Global Advantage Fund
Statement of Assets and Liabilities
October 31, 2011
| | | | | |
Assets:
|
| Investments, at value (Cost $98,211,319) | | $ | 112,128,527 | |
| |
| Investments in affiliated money market funds, at value and cost | | | 2,597,381 | |
| |
| Total investments, at value (Cost $100,808,700) | | | 114,725,908 | |
| |
| Foreign currencies, at value (Cost $223,168) | | | 244,946 | |
| |
| Receivable for: | | | | |
| Investments sold | | | 947,704 | |
| |
| Fund shares sold | | | 35,726 | |
| |
| Dividends | | | 206,405 | |
| |
| Investment for trustee deferred compensation and retirement plans | | | 2,437 | |
| |
| Other assets | | | 18,615 | |
| |
| Total assets | | | 116,181,741 | |
| |
Liabilities:
|
| Payable for: | | | | |
| Investments purchased | | | 363,260 | |
| |
| Fund shares reacquired | | | 191,117 | |
| |
| Accrued fees to affiliates | | | 252,358 | |
| |
| Accrued other operating expenses | | | 95,830 | |
| |
| Trustee deferred compensation and retirement plans | | | 4,560 | |
| |
| Total liabilities | | | 907,125 | |
| |
| Net assets applicable to shares outstanding | | $ | 115,274,616 | |
| |
Net assets consist of:
|
| Shares of beneficial interest | | $ | 108,465,520 | |
| |
| Undistributed net investment income | | | 984,287 | |
| |
| Undistributed net realized gain (loss) | | | (8,101,179 | ) |
| |
| Unrealized appreciation | | | 13,925,988 | |
| |
| | | $ | 115,274,616 | |
| |
Net Assets:
|
| Class A | | $ | 100,334,962 | |
| |
| Class B | | $ | 2,569,709 | |
| |
| Class C | | $ | 12,038,261 | |
| |
| Class Y | | $ | 331,684 | |
| |
Shares outstanding, $0.01 par value per share, with an unlimited number of shares authorized:
|
| Class A | | | 9,025,913 | |
| |
| Class B | | | 252,901 | |
| |
| Class C | | | 1,181,486 | |
| |
| Class Y | | | 29,157 | |
| |
| Class A: | | | | |
| Net asset value per share | | $ | 11.12 | |
| |
| Maximum offering price per share | | | | |
| (Net asset value of $11.12 divided by 94.50%) | | $ | 11.77 | |
| |
| Class B: | | | | |
| Net asset value and offering price per share | | $ | 10.16 | |
| |
| Class C: | | | | |
| Net asset value and offering price per share | | $ | 10.19 | |
| |
| Class Y: | | | | |
| Net asset value and offering price per share | | $ | 11.38 | |
| |
See accompanying Notes to Financial Statements which are an integral part of the financial statements.
11 Invesco Global Advantage Fund
Statement of Operations
For the period June 1, 2011 to October 31, 2011 and the year ended May 31, 2011
| | | | | | | | | |
| | | For the five months ended
| | For the year ended
|
| | | October 31,
| | May 31,
|
| | | 2011 | | 2011 |
| |
Investment income:
|
| Dividends (net of foreign withholding taxes of $55,900 and $229,421, respectively) | | $ | 810,120 | | | $ | 2,814,655 | |
| |
| Dividends from affiliated money market funds | | | 873 | | | | 6,759 | |
| |
| Total investment income | | | 810,993 | | | | 2,821,414 | |
| |
Expenses:
|
| Advisory fees | | | 286,511 | | | | 739,786 | |
| |
| Administrative services fees | | | 20,959 | | | | 50,000 | |
| |
| Custodian fees | | | 36,047 | | | | 80,320 | |
| |
| Distribution fees: | | | | | | | | |
| Class A | | | 109,068 | | | | 280,193 | |
| |
| Class B | | | 12,382 | | | | 40,417 | |
| |
| Class C | | | 49,892 | | | | 132,356 | |
| |
| Transfer agent fees | | | 146,415 | | | | 280,722 | |
| |
| Trustees’ and officers’ fees and benefits | | | 9,668 | | | | 17,707 | |
| |
| Other | | | 91,415 | | | | 158,664 | |
| |
| Total expenses | | | 762,357 | | | | 1,780,165 | |
| |
| Less: Fees waived and expense offset arrangement(s) | | | (10,630 | ) | | | (7,263 | ) |
| |
| Net expenses | | | 751,727 | | | | 1,772,902 | |
| |
| Net investment income | | | 59,266 | | | | 1,048,512 | |
| |
Realized and unrealized gain (loss) from:
|
| Net realized gain (loss) from: | | | | | | | | |
| Investment securities | | | 2,575,580 | | | | 6,952,968 | |
| |
| Foreign currencies | | | 4,823 | | | | (79,872 | ) |
| |
| | | | 2,580,403 | | | | 6,873,096 | |
| |
| Change in net unrealized appreciation (depreciation) of: | | | | | | | | |
| Investment securities | | | (15,382,849 | ) | | | 26,178,387 | |
| |
| Foreign currencies | | | 9,111 | | | | 6,609 | |
| |
| | | | (15,373,738 | ) | | | 26,184,996 | |
| |
| Net realized and unrealized gain (loss) | | | (12,793,335 | ) | | | 33,058,092 | |
| |
| Net increase (decrease) in net assets resulting from operations | | $ | (12,734,069 | ) | | $ | 34,106,604 | |
| |
See accompanying Notes to Financial Statements which are an integral part of the financial statements.
12 Invesco Global Advantage Fund
Statement of Changes in Net Assets
For the period June 1, 2011 to October 31, 2011 and the years ended May 31, 2011 and 2010
| | | | | | | | | | | | | |
| | | October 31,
| | May 31,
| | May 31,
|
| | | 2011 | | 2011 | | 2010 |
| |
Operations:
|
| Net investment income (loss) | | $ | 59,266 | | | $ | 1,048,512 | | | $ | (706 | ) |
| |
| Net realized gain | | | 2,580,403 | | | | 6,873,096 | | | | 4,903,451 | |
| |
| Change in net unrealized appreciation (depreciation) | | | (15,373,738 | ) | | | 26,184,996 | | | | 16,662,892 | |
| |
| Net increase (decrease) in net assets resulting from operations | | | (12,734,069 | ) | | | 34,106,604 | | | | 21,565,637 | |
| |
Distributions to shareholders from net investment income:
|
| Class A | | | — | | | | — | | | | (250,486 | ) |
| |
| Class Y | | | — | | | | — | | | | (911 | ) |
| |
| Total distributions from net investment income | | | — | | | | — | | | | (251,397 | ) |
| |
Share transactions–net:
|
| Class A | | | (6,007,204 | ) | | | (17,011,035 | ) | | | (18,036,570 | ) |
| |
| Class B | | | (600,793 | ) | | | (2,020,652 | ) | | | (2,810,953 | ) |
| |
| Class C | | | (639,169 | ) | | | (1,760,063 | ) | | | (1,734,643 | ) |
| |
| Class Y | | | (104,029 | ) | | | 201,801 | | | | 18,384 | |
| |
| Net increase (decrease) in net assets resulting from share transactions | | | (7,351,195 | ) | | | (20,589,949 | ) | | | (22,563,782 | ) |
| |
| Net increase (decrease) in net assets | | | (20,085,264 | ) | | | 13,516,655 | | | | (1,249,542 | ) |
| |
Net assets:
|
| Beginning of period | | | 135,359,880 | | | | 121,843,225 | | | | 123,092,767 | |
| |
| End of period (includes undistributed net investment income of $984,287, $944,419 and $0, respectively) | | $ | 115,274,616 | | | $ | 135,359,880 | | | $ | 121,843,225 | |
| |
Notes to Financial Statements
October 31, 2011
NOTE 1—Significant Accounting Policies
Invesco Global Advantage Fund (the “Fund”) is a series portfolio of AIM Investment Funds (Invesco Investment Funds) (the “Trust”). The Trust is organized as a Delaware statutory trust and is registered under the Investment Company Act of 1940, as amended (the “1940 Act”), as an open-end series management investment company consisting of thirteen separate series portfolios, each authorized to issue an unlimited number of shares of beneficial interest. The assets, liabilities and operations of each portfolio are accounted for separately. Information presented in these financial statements pertains only to the Fund. Matters affecting each portfolio or class will be voted on exclusively by the shareholders of such portfolio or class.
On October 31, 2011, the Fund’s fiscal year-end changed from May 31 to October 31.
The Fund’s investment objective is long-term capital growth.
The Fund currently consists of four different classes of shares: Class A, Class B, Class C and Class Y. Class A shares are sold with a front-end sales charge unless certain waiver criteria are met and under certain circumstances load waived shares may be subject to contingent deferred sales charges (“CDSC”). Class C shares are sold with a CDSC. Class Y shares are sold at net asset value. Effective November 30, 2010, new or additional investments in Class B shares are no longer permitted. Existing shareholders of Class B shares may continue to reinvest dividends and capital gains distributions in Class B shares until they convert. Also, shareholders in Class B shares will be able to exchange those shares for Class B shares of other Invesco Funds offering such shares until they convert. Generally, Class B shares will automatically convert to Class A shares on or about the month-end which is at least eight years after the date of purchase. Redemption of Class B shares prior to conversion date will be subject to a CDSC.
The following is a summary of the significant accounting policies followed by the Fund in the preparation of its financial statements.
| | |
| A. | | Security Valuations — Securities, including restricted securities, are valued according to the following policy. |
| | A security listed or traded on an exchange (except convertible bonds) is valued at its last sales price or official closing price as of the close of the customary trading session on the exchange where the security is principally traded, or lacking any sales or official closing price on a particular day, the security may be valued at the closing bid price on that day. Securities traded in the over-the-counter market are valued based on prices furnished by independent pricing services or market makers. When such securities are valued by an independent pricing service they may be considered fair valued. Futures contracts are valued at the final settlement price set by an exchange on which they are principally traded. Listed options are valued at the mean between the last bid and ask prices from the exchange on which they are principally traded. Options not listed on an exchange are valued by an |
13 Invesco Global Advantage Fund
| | |
| | independent source at the mean between the last bid and ask prices. For purposes of determining net asset value per share, futures and option contracts generally are valued 15 minutes after the close of the customary trading session of the New York Stock Exchange (“NYSE”). |
| | Investments in open-end and closed-end registered investment companies that do not trade on an exchange are valued at the end of day net asset value per share. Investments in open-end and closed-end registered investment companies that trade on an exchange are valued at the last sales price or official closing price as of the close of the customary trading session on the exchange where the security is principally traded. |
| | Debt obligations (including convertible bonds) and unlisted equities are fair valued using an evaluated quote provided by an independent pricing service. Evaluated quotes provided by the pricing service may be determined without exclusive reliance on quoted prices, and may reflect appropriate factors such as institution-size trading in similar groups of securities, developments related to specific securities, dividend rate, yield, quality, type of issue, coupon rate, maturity, individual trading characteristics and other market data. Debt securities are subject to interest rate and credit risks. In addition, all debt securities involve some risk of default with respect to interest and/or principal payments. |
| | Foreign securities (including foreign exchange contracts) are converted into U.S. dollar amounts using the applicable exchange rates as of the close of the NYSE. If market quotations are available and reliable for foreign exchange traded equity securities, the securities will be valued at the market quotations. Because trading hours for certain foreign securities end before the close of the NYSE, closing market quotations may become unreliable. If between the time trading ends on a particular security and the close of the customary trading session on the NYSE, events occur that are significant and make the closing price unreliable, the Fund may fair value the security. If the event is likely to have affected the closing price of the security, the security will be valued at fair value in good faith using procedures approved by the Board of Trustees. Adjustments to closing prices to reflect fair value may also be based on a screening process of an independent pricing service to indicate the degree of certainty, based on historical data, that the closing price in the principal market where a foreign security trade is not the current value as of the close of the NYSE. Foreign securities meeting the approved degree of certainty that the price is not reflective of current value will be priced at the indication of fair value from the independent pricing service. Multiple factors may be considered by the independent pricing service in determining adjustments to reflect fair value and may include information relating to sector indices, American Depositary Receipts and domestic and foreign index futures. Foreign securities may have additional risks including exchange rate changes, potential for sharply devalued currencies and high inflation, political and economical upheaval, the relative lack of issuer information, relatively low market liquidity and the potential lack of strict financial and accounting controls and standards. |
| | Securities for which market prices are not provided by any of the above methods may be valued based upon quotes furnished by independent sources. The last bid price may be used to value equity securities. The mean between the last bid and asked prices is used to value debt obligations, including Corporate Loans. |
| | Securities for which market quotations are not readily available or are unreliable are valued at fair value as determined in good faith by or under the supervision of the Trust’s officers following procedures approved by the Board of Trustees. Issuer specific events, market trends, bid/ask quotes of brokers and information providers and other market data may be reviewed in the course of making a good faith determination of a security’s fair value. |
| | Valuations change in response to many factors including the historical and prospective earnings of the issuer, the value of the issuer’s assets, general economic conditions, interest rates, investor perceptions and market liquidity. Because of the inherent uncertainties of valuation, the values reflected in the financial statements may materially differ from the value received upon actual sale of those investments. |
| B. | | Securities Transactions and Investment Income — Securities transactions are accounted for on a trade date basis. Realized gains or losses on sales are computed on the basis of specific identification of the securities sold. Interest income is recorded on the accrual basis from settlement date. Dividend income (net of withholding tax, if any) is recorded on the ex-dividend date. |
| | The Fund may periodically participate in litigation related to Fund investments. As such, the Fund may receive proceeds from litigation settlements. Any proceeds received are included in the Statement of Operations as realized gain (loss) for investments no longer held and as unrealized gain (loss) for investments still held. |
| | Brokerage commissions and mark ups are considered transaction costs and are recorded as an increase to the cost basis of securities purchased and/or a reduction of proceeds on a sale of securities. Such transaction costs are included in the determination of net realized and unrealized gain (loss) from investment securities reported in the Statement of Operations and the Statement of Changes in Net Assets and the net realized and unrealized gains (losses) on securities per share in the Financial Highlights. Transaction costs are included in the calculation of the Fund’s net asset value and, accordingly, they reduce the Fund’s total returns. These transaction costs are not considered operating expenses and are not reflected in net investment income reported in the Statement of Operations and Statement of Changes in Net Assets, or the net investment income per share and ratios of expenses and net investment income reported in the Financial Highlights, nor are they limited by any expense limitation arrangements between the Fund and the investment adviser. |
| | The Fund allocates income and realized and unrealized capital gains and losses to a class based on the relative net assets of each class. |
| C. | | Country Determination — For the purposes of making investment selection decisions and presentation in the Schedule of Investments, the investment adviser may determine the country in which an issuer is located and/or credit risk exposure based on various factors. These factors include the laws of the country under which the issuer is organized, where the issuer maintains a principal office, the country in which the issuer derives 50% or more of its total revenues and the country that has the primary market for the issuer’s securities, as well as other criteria. Among the other criteria that may be evaluated for making this determination are the country in which the issuer maintains 50% or more of its assets, the type of security, financial guarantees and enhancements, the nature of the collateral and the sponsor organization. Country of issuer and/or credit risk exposure has been determined to be the United States of America, unless otherwise noted. |
| D. | | Distributions — Distributions from income and net realized capital gain, if any, are generally paid annually and recorded on ex-dividend date. The Fund may elect to treat a portion of the proceeds from redemptions as distributions for federal income tax purposes. |
| E. | | Federal Income Taxes — The Fund intends to comply with the requirements of Subchapter M of the Internal Revenue Code necessary to qualify as a regulated investment company and to distribute substantially all of the Fund’s taxable earnings to shareholders. As such, the Fund will not be subject to federal income taxes on otherwise taxable income (including net realized capital gain) that is distributed to shareholders. Therefore, no provision for federal income taxes is recorded in the financial statements. |
14 Invesco Global Advantage Fund
| | |
| | The Fund files tax returns in the U.S. Federal jurisdiction and certain other jurisdictions. Generally, the Fund is subject to examinations by such taxing authorities for up to three years after the filing of the return for the tax period. |
| F. | | Expenses — Fees provided for under the Rule 12b-1 plan of a particular class of the Fund and which are directly attributable to that class are charged to the operations of such class. All other expenses are allocated among the classes based on relative net assets. |
| G. | | Accounting Estimates — The preparation of financial statements in conformity with accounting principles generally accepted in the United States of America (“GAAP”) requires management to make estimates and assumptions that affect the reported amounts of assets and liabilities at the date of the financial statements and the reported amounts of revenues and expenses during the reporting period including estimates and assumptions related to taxation. Actual results could differ from those estimates by a significant amount. In addition, the Fund monitors for material events or transactions that may occur or become known after the period-end date and before the date the financial statements are released to print. |
| H. | | Indemnifications — Under the Trust’s organizational documents, each Trustee, officer, employee or other agent of the Trust is indemnified against certain liabilities that may arise out of performance of their duties to the Fund. Additionally, in the normal course of business, the Fund enters into contracts, including the Fund’s servicing agreements that contain a variety of indemnification clauses. The Fund’s maximum exposure under these arrangements is unknown as this would involve future claims that may be made against the Fund that have not yet occurred. The risk of material loss as a result of such indemnification claims is considered remote. |
| I. | | Foreign Currency Translations — Foreign currency is valued at the close of the NYSE based on quotations posted by banks and major currency dealers. Portfolio securities and other assets and liabilities denominated in foreign currencies are translated into U.S. dollar amounts at date of valuation. Purchases and sales of portfolio securities (net of foreign taxes withheld on disposition) and income items denominated in foreign currencies are translated into U.S. dollar amounts on the respective dates of such transactions. The Fund does not separately account for the portion of the results of operations resulting from changes in foreign exchange rates on investments and the fluctuations arising from changes in market prices of securities held. The combined results of changes in foreign exchange rates and the fluctuation of market prices on investments (net of estimated foreign tax withholding) are included with the net realized and unrealized gain or loss from investments in the Statement of Operations. Reported net realized foreign currency gains or losses arise from (1) sales of foreign currencies, (2) currency gains or losses realized between the trade and settlement dates on securities transactions, and (3) the difference between the amounts of dividends, interest, and foreign withholding taxes recorded on the Fund’s books and the U.S. dollar equivalent of the amounts actually received or paid. Net unrealized foreign currency gains and losses arise from changes in the fair values of assets and liabilities, other than investments in securities at fiscal period end, resulting from changes in exchange rates. |
| | The Fund may invest in foreign securities which may be subject to foreign taxes on income, gains on investments or currency repatriation, a portion of which may be recoverable. |
| J. | | Foreign Currency Contracts — The Fund may enter into foreign currency contracts to manage or minimize currency or exchange rate risk. The Fund may also enter into foreign currency contracts for the purchase or sale of a security denominated in a foreign currency in order to “lock in” the U.S. dollar price of that security. A foreign currency contract is an obligation to purchase or sell a specific currency for an agreed-upon price at a future date. The use of foreign currency contracts does not eliminate fluctuations in the price of the underlying securities the Fund owns or intends to acquire but establishes a rate of exchange in advance. Fluctuations in the value of these contracts are measured by the difference in the contract date and reporting date exchange rates and are recorded as unrealized appreciation (depreciation) until the contracts are closed. When the contracts are closed, realized gains (losses) are recorded. Realized and unrealized gains (losses) on the contracts are included in the Statement of Operations. The primary risks associated with foreign currency contracts include failure of the counterparty to meet the terms of the contract and the value of the foreign currency changing unfavorably. These risks may be in excess of the amounts reflected in the Statement of Assets and Liabilities. |
NOTE 2—Advisory Fees and Other Fees Paid to Affiliates
The Trust has entered into a master investment advisory agreement with Invesco Advisers, Inc. (the “Adviser” or “Invesco”). Under the terms of the investment advisory agreement, the Fund pays an advisory fee to the Adviser based on the annual rate of the Fund’s average daily net assets as follows:
| | | | | |
| Average Daily Net Assets | | Rate |
| |
| First $1.5 billion | | | 0 | .57% |
| |
| Over $1.5 billion | | | 0 | .545% |
| |
Under the terms of a master sub-advisory agreement between the Adviser and each of Invesco Asset Management Deutschland GmbH, Invesco Asset Management Limited, Invesco Asset Management (Japan) Limited, Invesco Australia Limited, Invesco Hong Kong Limited, Invesco Senior Secured Management, Inc. and Invesco Canada Ltd. (collectively, the “Affiliated Sub-Advisers”) the Adviser, not the Fund, may pay 40% of the fees paid to the Adviser to any such Affiliated Sub-Adviser(s) that provide(s) discretionary investment management services to the Fund based on the percentage of assets allocated to such Sub-Adviser(s).
The Adviser has contractually agreed, through at least June 30, 2012, to waive advisory fees and/or reimburse expenses to the extent necessary to limit total annual operating expenses after fee waiver and/or expense reimbursement (excluding certain items discussed below) of Class A, Class B, Class C and Class Y shares to 1.41%, 2.16%, 2.16% and 1.16% of average daily net assets, respectively. In determining the Adviser’s obligation to waive advisory fees and/or reimburse expenses, the following expenses are not taken into account, and could cause the total annual operating expenses after fee waiver and/or expense reimbursement to exceed the numbers reflected above: (1) interest; (2) taxes; (3) dividend expense on short sales; (4) extraordinary or non-routine items; and (5) expenses that the Fund has incurred but did not actually pay because of an expense offset arrangement. Unless the Board of the Trustees and Invesco mutually agree to amend or continue the fee waiver agreement, it will terminate on June 30, 2012.
For the period June 1, 2011 to October 31, 2011 and the year ended May 31, 2011, the Adviser waived advisory fees of $10,630 and $7,111, respectively.
15 Invesco Global Advantage Fund
The Trust has entered into a master administrative services agreement with Invesco pursuant to which the Fund has agreed to pay Invesco for certain administrative costs incurred in providing accounting services to the Fund. For the period June 1, 2011 to October 31, 2011 and the year ended May 31, 2011, expenses incurred under the agreement are shown in the Statement of Operations as administrative services fees.
Also, Invesco has entered into service agreements whereby State Street Bank and Trust Company (“SSB”) serves as the custodian, fund accountant and provides certain administrative services to the Fund.
The Trust has entered into a transfer agency and service agreement with Invesco Investment Services, Inc. (“IIS”) pursuant to which the Fund has agreed to pay IIS a fee for providing transfer agency and shareholder services to the Fund and reimburse IIS for certain expenses incurred by IIS in the course of providing such services. IIS may make payments to intermediaries that provide omnibus account services, sub-accounting services and/or networking services. All fees payable by IIS to intermediaries that provide omnibus account services or sub-accounting are charged back to the Fund, subject to certain limitations approved by the Trust’s Board of Trustees. For the period June 1, 2011 to October 31, 2011 and the year ended May 31, 2011, the expenses incurred under the agreement are shown in the Statement of Operations as transfer agent fees.
Shares of the Fund are distributed by Invesco Distributors, Inc. (“IDI”), an affiliate of the Adviser. The Fund has adopted a Plan of Distribution (the “Plan”) pursuant to Rule 12b-1 under the 1940 Act. The Plan provides that the Fund will reimburse IDI for distribution related expenses that IDI incurs up to a maximum of the following annual rates: (1) Class A — up to 0.25% of the average daily net assets of Class A shares; (2) Class B — up to 1.00% of the average daily net assets of Class B shares; and (3) Class C — up to 1.00% of the average daily net assets of Class C shares.
In the case of Class B shares, provided that the Plan continues in effect, any cumulative expenses incurred by IDI, but not yet reimbursed to IDI, may be recovered through the payment of future distribution fees from the Fund pursuant to the Plan and contingent deferred sales charges paid by investors upon redemption of Class B shares.
For the period June 1, 2011 to October 31, 2011 and the year ended May 31, 2011, expenses incurred under these agreements are shown in the Statement of Operations as distribution fees.
Front-end sales commissions and CDSC (collectively, the “sales charges”) are not recorded as expenses of the Fund. Front-end sales commissions are deducted from proceeds from the sales of Fund shares prior to investment in Class A shares of the Fund. CDSC are deducted from redemption proceeds prior to remittance to the shareholder. During the period June 1, 2011 to October 31, 2011, IDI advised the Fund that IDI retained $255 in front-end sales commissions from the sale of Class A shares and $0, $457 and $473 from Class A, Class B and Class C shares, respectively, for CDSC imposed on redemptions by shareholders. During the year ended May 31, 2011, IDI advised the Fund that IDI retained $1,482 in front-end sales commissions from the sale of Class A shares and $0, $5,102 and $122 from Class A, Class B and Class C shares, respectively, for CDSC imposed on redemptions by shareholders.
Certain officers and trustees of the Trust are officers and directors of the Adviser, Invesco Ltd., IIS and/or IDI.
NOTE 3—Additional Valuation Information
GAAP defines fair value as the price that would be received to sell an asset or paid to transfer a liability in an orderly transaction between market participants at the measurement date, under current market conditions. GAAP establishes a hierarchy that prioritizes the inputs to valuation methods giving the highest priority to readily available unadjusted quoted prices in an active market for identical assets (Level 1) and the lowest priority to significant unobservable inputs (Level 3) generally when market prices are not readily available or are unreliable. Based on the valuation inputs, the securities or other investments are tiered into one of three levels. Changes in valuation methods may result in transfers in or out of an investment’s assigned level:
| | |
| | Level 1 — | Prices are determined using quoted prices in an active market for identical assets. |
| | Level 2 — | Prices are determined using other significant observable inputs. Observable inputs are inputs that other market participants may use in pricing a security. These may include quoted prices for similar securities, interest rates, prepayment speeds, credit risk, yield curves, loss severities, default rates, discount rates, volatilities and others. |
| | Level 3 — | Prices are determined using significant unobservable inputs. In situations where quoted prices or observable inputs are unavailable (for example, when there is little or no market activity for an investment at the end of the period), unobservable inputs may be used. Unobservable inputs reflect the Fund’s own assumptions about the factors market participants would use in determining fair value of the securities or instruments and would be based on the best available information. |
16 Invesco Global Advantage Fund
The following is a summary of the tiered valuation input levels, as of October 31, 2011. The level assigned to the securities valuations may not be an indication of the risk or liquidity associated with investing in those securities. Because of the inherent uncertainties of valuation, the values reflected in the financial statements may materially differ from the value received upon actual sale of those investments.
During the period June 1, 2011 to October 31, 2011, there were no significant transfers between investment levels.
| | | | | | | | | | | | | | | | | |
| | | Level 1 | | Level 2 | | Level 3 | | Total |
| |
| Australia | | $ | — | | | $ | 5,336,377 | | | $ | — | | | $ | 5,336,377 | |
| |
| Belgium | | | — | | | | 1,888,663 | | | | — | | | | 1,888,663 | |
| |
| Brazil | | | 2,371,666 | | | | — | | | | — | | | | 2,371,666 | |
| |
| Canada | | | 1,191,588 | | | | — | | | | — | | | | 1,191,588 | |
| |
| China | | | — | | | | 1,406,601 | | | | — | | | | 1,406,601 | |
| |
| Denmark | | | — | | | | 1,350,456 | | | | — | | | | 1,350,456 | |
| |
| France | | | — | | | | 5,600,834 | | | | — | | | | 5,600,834 | |
| |
| Germany | | | — | | | | 7,245,025 | | | | — | | | | 7,245,025 | |
| |
| Hong Kong | | | — | | | | 1,396,040 | | | | — | | | | 1,396,040 | |
| |
| India | | | 1,129,791 | | | | — | | | | — | | | | 1,129,791 | |
| |
| Ireland | | | 3,164,612 | | | | 1,551,991 | | | | — | | | | 4,716,603 | |
| |
| Israel | | | 2,111,414 | | | | — | | | | — | | | | 2,111,414 | |
| |
| Japan | | | — | | | | 8,575,703 | | | | — | | | | 8,575,703 | |
| |
| Mexico | | | 2,118,555 | | | | — | | | | — | | | | 2,118,555 | |
| |
| Netherlands | | | — | | | | 2,588,628 | | | | — | | | | 2,588,628 | |
| |
| Russia | | | — | | | | 1,139,758 | | | | — | | | | 1,139,758 | |
| |
| Singapore | | | — | | | | 785,865 | | | | — | | | | 785,865 | |
| |
| South Korea | | | — | | | | 2,524,429 | | | | — | | | | 2,524,429 | |
| |
| Spain | | | — | | | | 1,046,099 | | | | — | | | | 1,046,099 | |
| |
| Sweden | | | — | | | | 2,906,000 | | | | — | | | | 2,906,000 | |
| |
| Switzerland | | | 3,073,881 | | | | 4,560,732 | | | | — | | | | 7,634,613 | |
| |
| Taiwan | | | — | | | | 1,180,391 | | | | — | | | | 1,180,391 | |
| |
| United Kingdom | | | 1,919,535 | | | | 14,646,460 | | | | — | | | | 16,565,995 | |
| |
| United States | | | 31,914,814 | | | | — | | | | — | | | | 31,914,814 | |
| |
| Total Investments | | $ | 48,995,856 | | | $ | 65,730,052 | | | $ | — | | | $ | 114,725,908 | |
| |
NOTE 4—Expense Offset Arrangement(s)
The expense offset arrangement is comprised of transfer agency credits which result from balances in Demand Deposit Accounts (DDA) used by the transfer agent for clearing shareholder transactions. For the period June 1, 2011 to October 31, 2011 and the year ended May 31, 2011, the Fund received credits from this arrangement, which resulted in the reduction of the Fund’s total expenses of $0 and $152, respectively.
NOTE 5—Trustees’ and Officers’ Fees and Benefits
“Trustees’ and Officers’ Fees and Benefits” include amounts accrued by the Fund to pay remuneration to certain Trustees and Officers of the Fund. Trustees have the option to defer compensation payable by the Fund, and “Trustees’ and Officers’ Fees and Benefits” also include amounts accrued by the Fund to fund such deferred compensation amounts. Those Trustees who defer compensation have the option to select various Invesco Funds in which their deferral accounts shall be deemed to be invested. Finally, certain current Trustees are eligible to participate in a retirement plan that provides for benefits to be paid upon retirement to Trustees over a period of time based on the number of years of service. The Fund may have certain former Trustees who also participate in a retirement plan and receive benefits under such plan. “Trustees’ and Officers’ Fees and Benefits” include amounts accrued by the Fund to fund such retirement benefits. Obligations under the deferred compensation and retirement plans represent unsecured claims against the general assets of the Fund.
During the period June 1, 2011 to October 31, 2011 and the year ended May 31, 2011, the Fund paid legal fees of $557 and $1,391, respectively, for services rendered by Kramer, Levin, Naftalis & Frankel LLP as counsel to the Independent Trustees. A partner of that firm is a Trustee of the Trust.
NOTE 6—Cash Balances
The Fund is permitted to temporarily carry a negative or overdrawn balance in its account with SSB, the custodian bank. To compensate the custodian bank for such overdrafts, the overdrawn Fund may either (1) leave funds as a compensating balance in the account so the custodian bank can be compensated by earning the additional interest; or (2) compensate by paying the custodian bank at a rate agreed upon by the custodian bank and Invesco, not to exceed the contractually agreed upon rate.
17 Invesco Global Advantage Fund
NOTE 7—Distributions to Shareholders and Tax Components of Net Assets
Tax Character of Distributions to Shareholders Paid During the Period June 1, 2011 to October 31, 2011 and the Years Ended May 31, 2011 and 2010:
| | | | | | | | | | | | | |
| | | Five months ended
| | Year ended
| | Year ended
|
| | | October 31, 2011 | | May 31, 2011 | | May 31, 2010 |
| |
| Ordinary income | | $ | — | | | $ | — | | | $ | 251,397 | |
| |
Tax Components of Net Assets at Period-End:
| | | | | |
| | | 2011 |
| |
| Undistributed ordinary income | | $ | 988,538 | |
| |
| Net unrealized appreciation — investments | | | 13,909,282 | |
| |
| Net unrealized appreciation — other investments | | | 8,780 | |
| |
| Temporary book/tax differences | | | (4,251 | ) |
| |
| Capital loss carryforward | | | (8,093,253 | ) |
| |
| Shares of beneficial interest | | | 108,465,520 | |
| |
| Total net assets | | $ | 115,274,616 | |
| |
The difference between book-basis and tax-basis unrealized appreciation (depreciation) is due to differences in the timing of recognition of gains and losses on investments for tax and book purposes. The Fund’s net unrealized appreciation difference is attributable primarily to wash sales.
The temporary book/tax differences are a result of timing differences between book and tax recognition of income and/or expenses. The Fund’s temporary book/tax differences are the result of the trustee deferral of compensation and retirement plan benefits.
Capital loss carryforward is calculated and reported as of a specific date. Results of transactions and other activity after that date may affect the amount of capital loss carryforward actually available for the Fund to utilize. The Regulated Investment Company Modernization Act of 2010 (the “Act”) eliminated the eight-year carryover period for capital losses that arise in taxable years beginning after its enactment date of December 22, 2010. Consequently, these capital losses can be carried forward for an unlimited period. However, capital losses with an expiration period may not be used to offset capital gains until all net capital losses without an expiration date have been utilized. Additionally, post-enactment capital loss carryovers will retain their character as either short-term or long-term capital losses instead of as short-term capital losses as under prior law. The ability to utilize capital loss carryforward in the future may be limited under the Internal Revenue Code and related regulations based on the results of future transactions.
The Fund utilized $2,575,245 of capital loss carryforward in the current period to offset net realized capital gain for federal income tax purposes. The Fund has a capital loss carryforward as of October 31, 2011, which expires as follows:
| | | | | | | | | |
| | | Capital Loss
|
| | | Carryforward* |
Expiration | | Short-Term | | Total |
| |
| October 31, 2016 | | $ | 2,613,572 | | | $ | 2,613,572 | |
| |
| October 31, 2017 | | | 5,479,681 | | | | 5,479,681 | |
| |
| Total capital loss carryforward | | $ | 8,093,253 | | | $ | 8,093,253 | |
| |
| |
| * | Capital loss carryforward as of the date listed above is reduced for limitations, if any, to the extent required by the Internal Revenue Code. |
18 Invesco Global Advantage Fund
NOTE 8—Investment Securities
The aggregate amount of investment securities (other than short-term securities, U.S. Treasury obligations and money market funds, if any) purchased and sold by the Fund during the period June 1, 2011 to October 31, 2011 was $13,579,275 and $20,847,757, respectively. Cost of investments on a tax basis includes the adjustments for financial reporting purposes as of the most recently completed Federal income tax reporting period-end.
| | | | | |
| Unrealized Appreciation (Depreciation) of Investment Securities on a Tax Basis |
| |
| Aggregate unrealized appreciation of investment securities | | $ | 17,404,216 | |
| |
| Aggregate unrealized (depreciation) of investment securities | | | (3,494,934 | ) |
| |
| Net unrealized appreciation of investment securities | | $ | 13,909,282 | |
| |
| Cost of investments for tax purposes is $100,816,626. | | | | |
NOTE 9—Reclassification of Permanent Differences
Primarily as a result of differing book/tax treatment of foreign currency transactions and foreign capital gain taxes, on October 31, 2011, undistributed net investment income was decreased by $19,398, undistributed net realized gain (loss) was decreased by $4,823 and shares of beneficial interest increased by $24,221. This reclassification had no effect on the net assets of the Fund.
NOTE 10—Share Information
| | | | | | | | | | | | | | | | | | | | | | | | | |
| | | Summary of Share Activity |
| |
| | | Five months ended
| | Year ended
| | Year ended
|
| | | October 31, 2011(a) | | May 31, 2011 | | May 31, 2010 |
| | | Shares | | Amount | | Shares | | Amount | | Shares | | Amount |
| |
| Sold: | | | | | | | | | | | | | | | | | | | | | | | | |
| Class A | | | 30,046 | | | $ | 329,121 | | | | 182,012 | | | $ | 1,969,500 | | | | 285,166 | | | $ | 2,651,980 | |
| |
| Class B | | | 3,715 | | | | 40,214 | | | | 13,403 | | | | 134,721 | | | | 45,155 | | | | 392,802 | |
| |
| Class C | | | 1,848 | | | | 18,848 | | | | 17,209 | | | | 177,248 | | | | 17,169 | | | | 149,839 | |
| |
| Class Y | | | 5,157 | | | | 59,650 | | | | 20,428 | | | | 232,138 | | | | 2,199 | | | | 21,852 | |
| |
| Issued as reinvestment of dividends: | | | | | | | | | | | | | | | | | | | | | | | | |
| Class A | | | — | | | | — | | | | — | | | | — | | | | 24,944 | | | | 242,455 | |
| |
| Class B | | | — | | | | — | | | | — | | | | — | | | | 92 | | | | 911 | |
| |
| Automatic conversion of Class B shares to Class A shares: | | | | | | | | | | | | | | | | | | | | | | | | |
| Class A | | | 34,343 | | | | 399,307 | | | | 100,208 | | | | 1,101,231 | | | | 23,393 | | | | 222,248 | |
| |
| Class B | | | (38,616 | ) | | | (399,307 | ) | | | (108,891 | ) | | | (1,101,231 | ) | | | (25,268 | ) | | | (222,248 | ) |
| |
| Reacquired: | | | | | | | | | | | | | | | | | | | | | | | | |
| Class A | | | (599,435 | ) | | | (6,735,632 | ) | | | (1,847,008 | ) | | | (20,081,766 | ) | | | (2,263,388 | ) | | | (21,153,253 | ) |
| |
| Class B | | | (23,161 | ) | | | (241,700 | ) | | | (107,767 | ) | | | (1,054,142 | ) | | | (344,305 | ) | | | (2,981,507 | ) |
| |
| Class C | | | (65,282 | ) | | | (658,017 | ) | | | (197,172 | ) | | | (1,937,311 | ) | | | (218,678 | ) | | | (1,884,482 | ) |
| |
| Class Y | | | (14,464 | ) | | | (163,679 | ) | | | (2,644 | ) | | | (30,337 | ) | | | (456 | ) | | | (4,379 | ) |
| |
| Net increase (decrease) in share activity | | | (665,849 | ) | | $ | (7,351,195 | ) | | | (1,930,222 | ) | | $ | (20,589,949 | ) | | | (2,453,977 | ) | | $ | (22,563,782 | ) |
| |
| | |
| (a) | | There is an entity that is a record owner of more than 5% of the outstanding shares of the Fund and owns 76% of the outstanding shares of the Fund. IDI has an agreement with this entity to sell Fund shares. The Fund, Invesco and/or Invesco affiliates may make payments to this entity, which is considered to be related to the Fund, for providing services to the Fund, Invesco and/or Invesco affiliates including but not limited to services such as, securities brokerage, distribution, third party record keeping and account servicing. The Fund has no knowledge as to whether all or any portion of the shares owned of record by this entity are also owned beneficially. |
19 Invesco Global Advantage Fund
NOTE 11—Financial Highlights
The following schedule presents financial highlights for a share of the Fund outstanding throughout the periods indicated.
| | | | | | | | | | | | | | | | | | | | | | | | | | | | | | | | | | | | | | | | | | | | | | | | | |
| | | | | | | | | | | | | | | | | | | Ratio of
| | Ratio of
| | | | |
| | | | | | | Net gains
| | | | | | | | | | | | expenses
| | expenses
| | | | |
| | | | | | | (losses) on
| | | | | | | | | | | | to average
| | to average net
| | Ratio of net
| | |
| | | Net asset
| | Net
| | securities
| | | | Dividends
| | | | | | | | net assets
| | assets without
| | investment
| | |
| | | value,
| | investment
| | (both
| | Total from
| | from net
| | Net asset
| | | | Net assets,
| | with fee waivers
| | fee waivers
| | income (loss)
| | |
| | | beginning
| | income
| | realized and
| | investment
| | investment
| | value, end
| | Total
| | end of period
| | and/or expenses
| | and/or expenses
| | to average
| | Portfolio
|
| | | of period | | (loss)(a) | | unrealized) | | operations | | income | | of period | | Return(b) | | (000s omitted) | | absorbed | | absorbed | | net assets | | turnover(c) |
| |
| Class A |
| Five Months ended 10/31/11 | | $ | 12.27 | | | $ | 0.01 | | | $ | (1.16 | )(d) | | $ | (1.15 | ) | | $ | — | | | $ | 11.12 | | | | (9.37 | )%(d) | | $ | 100,335 | | | | 1.41 | %(e) | | | 1.43 | %(e) | | | 0.20 | %(e) | | | 11 | % |
| Year ended 05/31/11 | | | 9.41 | | | | 0.10 | | | | 2.76 | (d) | | | 2.86 | | | | — | | | | 12.27 | | | | 30.39 | (d) | | | 117,332 | | | | 1.26 | | | | 1.27 | | | | 0.92 | | | | 110 | |
| Year ended 05/31/10 | | | 8.01 | | | | 0.01 | | | | 1.41 | | | | 1.42 | | | | (0.02 | ) | | | 9.41 | | | | 17.73 | | | | 104,745 | | | | 1.38 | (f) | | | 1.38 | (f) | | | 0.10 | (f) | | | 18 | |
| Year ended 05/31/09 | | | 11.59 | | | | 0.03 | | | | (3.53 | ) | | | (3.50 | ) | | | (0.08 | ) | | | 8.01 | | | | (30.09 | ) | | | 104,570 | | | | 1.41 | (f) | | | 1.41 | (f) | | | 0.30 | (f) | | | 34 | |
| Year ended 05/31/08 | | | 12.17 | | | | 0.06 | | | | (0.63 | ) | | | (0.57 | ) | | | (0.01 | ) | | | 11.59 | | | | (4.71 | ) | | | 180,366 | | | | 1.23 | (f) | | | 1.23 | (f) | | | 0.53 | (f) | | | 28 | |
| Year ended 05/31/07 | | | 9.54 | | | | 0.02 | | | | 2.61 | | | | 2.63 | | | | — | | | | 12.17 | | | | 27.57 | | | | 208,521 | | | | 1.29 | | | | 1.29 | | | | 0.19 | | | | 15 | |
| |
| Class B |
| Five Months ended 10/31/11 | | | 11.25 | | | | (0.02 | ) | | | (1.07 | )(d) | | | (1.09 | ) | | | — | | | | 10.16 | | | | (9.69 | )(d) | | | 2,570 | | | | 2.16 | (e) | | | 2.18 | (e) | | | (0.55 | )(e) | | | 11 | |
| Year ended 05/31/11 | | | 8.70 | | | | 0.02 | | | | 2.53 | (d) | | | 2.55 | | | | — | | | | 11.25 | | | | 29.31 | (d) | | | 3,499 | | | | 2.01 | | | | 2.02 | | | | 0.17 | | | | 110 | |
| Year ended 05/31/10 | | | 7.44 | | | | (0.05 | ) | | | 1.31 | | | | 1.26 | | | | — | | | | 8.70 | | | | 16.94 | | | | 4,472 | | | | 2.13 | (f) | | | 2.13 | (f) | | | (0.65 | )(f) | | | 18 | |
| Year ended 05/31/09 | | | 10.72 | | | | (0.04 | ) | | | (3.24 | ) | | | (3.28 | ) | | | — | | | | 7.44 | | | | (30.60 | ) | | | 6,237 | | | | 2.16 | (f) | | | 2.16 | (f) | | | (0.45 | )(f) | | | 34 | |
| Year ended 05/31/08 | | | 11.33 | | | | (0.03 | ) | | | (0.58 | ) | | | (0.61 | ) | | | — | | | | 10.72 | | | | (5.38 | ) | | | 18,290 | | | | 1.98 | (f) | | | 1.98 | (f) | | | (0.22 | )(f) | | | 28 | |
| Year ended 05/31/07 | | | 8.95 | | | | (0.06 | ) | | | 2.44 | | | | 2.38 | | | | — | | | | 11.33 | | | | 26.59 | | | | 35,825 | | | | 2.06 | | | | 2.06 | | | | (0.58 | ) | | | 15 | |
| |
| Class C |
| Five Months ended 10/31/11 | | | 11.28 | | | | (0.02 | ) | | | (1.07 | )(d) | | | (1.09 | ) | | | — | | | | 10.19 | | | | (9.66 | )(d)(g) | | | 12,038 | | | | 2.11 | (e)(g) | | | 2.13 | (e)(g) | | | (0.50 | )(e)(g) | | | 11 | |
| Year ended 05/31/11 | | | 8.72 | | | | 0.02 | | | | 2.54 | (d) | | | 2.56 | | | | — | | | | 11.28 | | | | 29.36 | (d) | | | 14,047 | | | | 2.01 | | | | 2.02 | | | | 0.17 | | | | 110 | |
| Year ended 05/31/10 | | | 7.46 | | | | (0.06 | ) | | | 1.32 | | | | 1.26 | | | | — | | | | 8.72 | | | | 16.89 | | | | 12,427 | | | | 2.13 | (f) | | | 2.13 | (f) | | | (0.65 | )(f) | | | 18 | |
| Year ended 05/31/09 | | | 10.75 | | | | (0.03 | ) | | | (3.26 | ) | | | (3.29 | ) | | | — | | | | 7.46 | | | | (30.60 | ) | | | 12,132 | | | | 2.16 | (f) | | | 2.16 | (f) | | | (0.45 | )(f) | | | 34 | |
| Year ended 05/31/08 | | | 11.36 | | | | (0.02 | ) | | | (0.59 | ) | | | (0.61 | ) | | | — | | | | 10.75 | | | | (5.37 | ) | | | 20,935 | | | | 1.98 | (f) | | | 1.98 | (f) | | | (0.22 | )(f) | | | 28 | |
| Year ended 05/31/07 | | | 8.98 | | | | (0.06 | ) | | | 2.44 | | | | 2.38 | | | | — | | | | 11.36 | | | | 26.50 | | | | 24,700 | | | | 2.06 | | | | 2.06 | | | | (0.58 | ) | | | 15 | |
| |
| Class Y |
| Five Months ended 10/31/11 | | | 12.54 | | | | 0.02 | | | | (1.18 | )(d) | | | (1.16 | ) | | | — | | | | 11.38 | | | | (9.25 | )(d) | | | 332 | | | | 1.16 | (e) | | | 1.18 | (e) | | | 0.45 | (e) | | | 11 | |
| Year ended 05/31/11 | | | 9.60 | | | | 0.13 | | | | 2.81 | (d) | | | 2.94 | | | | — | | | | 12.54 | | | | 30.63 | (d) | | | 483 | | | | 1.01 | | | | 1.02 | | | | 1.17 | | | | 110 | |
| Year ended 05/31/10 | | | 8.17 | | | | 0.04 | | | | 1.44 | | | | 1.48 | | | | (0.05 | ) | | | 9.60 | | | | 18.04 | | | | 199 | | | | 1.13 | (f) | | | 1.13 | (f) | | | 0.35 | (f) | | | 18 | |
| Year ended 05/31/09 | | | 11.84 | | | | 0.04 | | | | (3.60 | ) | | | (3.56 | ) | | | (0.11 | ) | | | 8.17 | | | | (29.92 | ) | | | 154 | | | | 1.16 | (f) | | | 1.16 | (f) | | | 0.55 | (f) | | | 34 | |
| Year ended 05/31/08 | | | 12.43 | | | | 0.10 | | | | (0.66 | ) | | | (0.56 | ) | | | (0.03 | ) | | | 11.84 | | | | (4.41 | ) | | | 843 | | | | 0.98 | (f) | | | 0.98 | (f) | | | 0.78 | (f) | | | 28 | |
| Year ended 05/31/07 | | | 9.72 | | | | 0.03 | | | | 2.68 | | | | 2.71 | | | | — | | | | 12.43 | | | | 27.88 | | | | 1,059 | | | | 1.06 | | | | 1.06 | | | | 0.42 | | | | 15 | |
| |
| | |
| (a) | | Calculated using average shares outstanding. |
| (b) | | Includes adjustments in accordance with accounting principles generally accepted in the United States of America and as such, the net asset value for financial reporting purposes and the returns based upon those net asset values may differ from the net asset value and returns for shareholder transactions. Does not include sales charges and is not annualized for periods less than one year, if applicable. |
| (c) | | Portfolio turnover is calculated at the fund level and is not annualized for periods less than one year, if applicable. |
| (d) | | Includes litigation proceeds received during the period. Had the litigation proceeds not been received net gains (losses) on securities (both realized and unrealized) per share, for the five months ended October 31, 2011, would have been $(1.31), $(1.22), $(1.22) and $(1.33) for Class A, Class B, Class C and Class Y shares, respectively and total returns would have been lower; net gains (losses) on securities (both realized and unrealized) per share, for the year ended May 31, 2011, would have been $2.59, $2.36, $2.37 and $2.64 for Class A, Class B, Class C and Class Y shares, respectively and total returns would have been lower. |
| (e) | | Ratios are annualized and based on average daily net assets (000’s omitted) of $104,078, $2,954, $12,485 and $397 for Class A, Class B, Class C and Class Y, shares, respectively. |
| (f) | | The ratios reflect the rebate of certain Fund expenses in connection with investments in a Morgan Stanley affiliate during the period. The effect of the rebate on the ratios is less than 0.005% for each of the years ended May 31, 2010, 2009 and 2008. |
| (g) | | The total return, ratio of expenses to average net assets and ratio of net investment income (loss) to average net assets reflect actual 12b-1 fees paid of 0.95%. |
NOTE 12—Reorganization
The Board of Trustees unanimously approved an Agreement and Plan of Reorganization (the “Agreement”) pursuant to which the Trust would transfer all of its assets and liabilities to Invesco Global Growth Fund (the “Acquiring Fund”) in exchange for shares of the Acquiring Fund.
The Trust’s shareholders approved the Agreement on November 28, 2011 and the reorganization is expected to be consummated on December 19, 2011. Upon closing of the reorganization, shareholders of the Trust will receive a corresponding share class of the Acquiring Fund in exchange for their shares of the Trust and the Trust will liquidate and cease operations.
20 Invesco Global Advantage Fund
Report of Independent Registered Public Accounting Firm
To the Board of Trustees of AIM Investment Funds
(Invesco Investment Funds) and Shareholders of Invesco Global Advantage Fund:
In our opinion, the accompanying statement of assets and liabilities, including the schedule of investments, and the related statements of operations and of changes in net assets and the financial highlights present fairly, in all material respects, the financial position of Invesco Global Advantage Fund (one of the funds constituting AIM Investment Funds (Invesco Investment Funds), hereafter referred to as the “Fund”) at October 31, 2011, the results of its operations for the period then ended and the year ended May 31, 2011, and the changes in its net assets and the financial highlights for the period ended October 31, 2011 and each of the two years in the period ended May 31, 2011, in conformity with accounting principles generally accepted in the United States of America. These financial statements and financial highlights (hereafter referred to as “financial statements”) are the responsibility of the Fund’s management; our responsibility is to express an opinion on these financial statements based on our audits. We conducted our audits of these financial statements in accordance with the standards of the Public Company Accounting Oversight Board (United States). Those standards require that we plan and perform the audit to obtain reasonable assurance about whether the financial statements are free of material misstatement. An audit includes examining, on a test basis, evidence supporting the amounts and disclosures in the financial statements, assessing the accounting principles used and significant estimates made by management, and evaluating the overall financial statement presentation. We believe that our audits, which included confirmation of securities at October 31, 2011 by correspondence with the custodian and brokers, provide a reasonable basis for our opinion. The financial highlights of the Fund for the periods ended May 31, 2009 and prior were audited by other independent auditors whose report dated July 24, 2009 expressed an unqualified opinion on those financial statements
As discussed in Note 12, effective December 19, 2011, the Fund transferred all of its assets and liabilities to Invesco Global Growth Fund (the “Acquiring Fund”) and shareholders of the Fund received a corresponding class of shares of the Acquiring Fund in exchange for their shares of the Fund.
PRICEWATERHOUSECOOPERS LLP
Houston, Texas
December 21, 2011
21 Invesco Global Advantage Fund
Calculating your ongoing Fund expenses
Example
As a shareholder of the Fund, you incur two types of costs: (1) transaction costs, which may include sales charges (loads) on purchase payments or contingent deferred sales charges on redemptions, and redemption fees, if any; and (2) ongoing costs, including management fees, distribution and/or service (12b-1) fees, and other Fund expenses. This example is intended to help you understand your ongoing costs (in dollars) of investing in the Fund and to compare these costs with ongoing costs of investing in other mutual funds. The example is based on an investment of $1,000 invested at the beginning of the period and held for the entire period May 1, 2011 through October 31, 2011.
Actual expenses
The table below provides information about actual account values and actual expenses. You may use the information in this table, together with the amount you invested, to estimate the expenses that you paid over the period. Simply divide your account value by $1,000 (for example, an $8,600 account value divided by $1,000 = 8.6), then multiply the result by the number in the table under the heading entitled “Actual Expenses Paid During Period” to estimate the expenses you paid on your account during this period.
Hypothetical example for comparison purposes
The table below also provides information about hypothetical account values and hypothetical expenses based on the Fund’s actual expense ratio and an assumed rate of return of 5% per year before expenses, which is not the Fund’s actual return.
The hypothetical account values and expenses may not be used to estimate the actual ending account balance or expenses you paid for the period. You may use this information to compare the ongoing costs of investing in the Fund and other funds. To do so, compare this 5% hypothetical example with the 5% hypothetical examples that appear in the shareholder reports of the other funds.
Please note that the expenses shown in the table are meant to highlight your ongoing costs only and do not reflect any transaction costs, such as sales charges (loads) on purchase payments, contingent deferred sales charges on redemptions, and redemption fees, if any. Therefore, the hypothetical information is useful in comparing ongoing costs only, and will not help you determine the relative total costs of owning different funds. In addition, if these transaction costs were included, your costs would have been higher.
| | | | | | | | | | | | | | | | | | | | | | | | | | | | | | | |
| | | | | | | | | | HYPOTHETICAL
| | | |
| | | | | | | ACTUAL | | | (5% annual return before expenses) | | | |
| | | | Beginning
| | | Ending
| | | Expenses
| | | Ending
| | | Expenses
| | | Annualized
|
| | | | Account Value
| | | Account Value
| | | Paid During
| | | Account Value
| | | Paid During
| | | Expense
|
| Class | | | (05/01/11) | | | (10/31/11)1 | | | Period2 | | | (10/31/11) | | | Period2 | | | Ratio |
| A | | | $ | 1,000.00 | | | | $ | 893.20 | | | | $ | 6.73 | | | | $ | 1,018.10 | | | | $ | 7.17 | | | | | 1.41 | % |
| | | | | | | | | | | | | | | | | | | | | | | | | | | | | | | |
| B | | | | 1,000.00 | | | | | 888.90 | | | | | 10.28 | | | | | 1,014.32 | | | | | 10.97 | | | | | 2.16 | |
| | | | | | | | | | | | | | | | | | | | | | | | | | | | | | | |
| C | | | | 1,000.00 | | | | | 889.20 | | | | | 10.10 | | | | | 1,014.52 | | | | | 10.76 | | | | | 2.12 | |
| | | | | | | | | | | | | | | | | | | | | | | | | | | | | | | |
| Y | | | | 1,000.00 | | | | | 894.00 | | | | | 5.54 | | | | | 1,019.36 | | | | | 5.90 | | | | | 1.16 | |
| | | | | | | | | | | | | | | | | | | | | | | | | | | | | | | |
| |
| 1 | The actual ending account value is based on the actual total return of the Fund for the period May 1, 2011 through October 31, 2011, after actual expenses and will differ from the hypothetical ending account value which is based on the Fund’s expense ratio and a hypothetical annual return of 5% before expenses. |
| 2 | Expenses are equal to the Fund’s annualized expense ratio as indicated above multiplied by the average account value over the period, multiplied by 184/365 to reflect the most recent fiscal half year. |
22 Invesco Global Advantage Fund
| |
| Approval of Investment Advisory and Sub-Advisory Contracts |
The Board of Trustees (the Board) of AIM Investment Funds (Invesco Investment Funds) is required under the Investment Company Act of 1940, as amended, to approve annually the renewal of the Invesco Global Advantage Fund (the Fund) investment advisory agreement with Invesco Advisers, Inc. (Invesco Advisers) and the Master Intergroup Sub-Advisory Contract for Mutual Funds (the sub-advisory contracts) with Invesco Asset Management Deutschland GmbH, Invesco Asset Management Limited, Invesco Asset Management (Japan) Limited, Invesco Australia Limited, Invesco Hong Kong Limited, Invesco Senior Secured Management, Inc. and Invesco Canada Ltd. (collectively, the Affiliated Sub-Advisers). During contract renewal meetings held on June 14-15, 2011, the Board as a whole, and the disinterested or “independent” Trustees, who comprise 80% of the Board, voting separately, approved the continuance of the Fund’s investment advisory agreement and the sub-advisory contracts for another year, effective July 1, 2011. In doing so, the Board considered the process that it follows in reviewing and approving the Fund’s investment advisory agreement and sub-advisory contracts and the information that it is provided. The Board determined that the Fund’s investment advisory agreement and the sub-advisory contracts are in the best interests of the Fund and its shareholders and the compensation to Invesco Advisers and the Affiliated Sub-Advisers under the agreements is fair and reasonable. The Board noted that it had approved a merger of the Fund with Invesco Global Growth Fund and that shareholder approval is being solicited. Approval of the investment advisory agreement and the sub-advisory contracts was based on the agreements that would remain in place if the merger does not occur.
The Board’s Fund Evaluation Process
The Board’s Investments Committee has established three Sub-Committees, each of which is responsible for overseeing the management of a number of the series portfolios of the funds advised by Invesco Advisers (the Invesco Funds). The Sub-Committees meet throughout the year to review the performance of their assigned funds, including reviewing materials prepared under the direction of the independent Senior Officer, an officer of the Invesco Funds who reports directly to the independent Trustees. Over the course of each year, the Sub-Committees meet with portfolio managers for their assigned Invesco Funds and other members of management to review the performance, investment objective(s), policies, strategies and limitations and investment risks of these funds. The Sub-Committees meet regularly and at designated contract renewal meetings each year to conduct a review of the performance, fees, expenses and other matters related to their assigned Invesco Funds. Each Sub-Committee recommends to the Investments Committee, which in turn recommends to the full Board, whether to approve the continuance of each Invesco Fund’s investment advisory agreement and sub-advisory contracts for another year.
During the contract renewal process, the Trustees receive comparative performance and fee data regarding the Invesco Funds prepared by Invesco Advisers and an independent company, Lipper, Inc. (Lipper). The Trustees also receive an independent written evaluation from the Senior Officer. The Senior Officer’s evaluation is prepared as part of his responsibility to manage the process by which the Invesco Funds’ proposed management fees are negotiated during the annual contract renewal process to ensure they are negotiated in a manner that is at arms’ length and reasonable. The independent Trustees are assisted in their annual evaluation of the Fund’s investment advisory agreement by the Senior Officer and by independent legal counsel. The independent Trustees also discuss the continuance of the investment advisory agreement and sub-advisory contracts in private sessions with the Senior Officer and counsel.
In evaluating the fairness and reasonableness of the Fund’s investment advisory agreement and sub-advisory contracts, the Board considered, among other things, the factors discussed below. The Trustees also considered information provided in connection with fund acquisitions approved by the Trustees to rationalize the Invesco Funds product range following the acquisition of the retail mutual fund business of Morgan Stanley (the Morgan Stanley Transaction). The Trustees recognized that the advisory fees for the Invesco Funds include advisory fees that are the result of years of review and negotiation between the Trustees and Invesco Advisers as well as advisory fees inherited from Morgan Stanley and Van Kampen funds acquired in the Morgan Stanley Transaction. The Trustees’ deliberations and conclusions in a particular year may be based in part on their deliberations and conclusions regarding these same arrangements throughout the year and in prior years. One Trustee may have weighed a particular piece of information differently than another Trustee.
The discussion below serves as the Senior Officer’s independent written evaluation with respect to the Fund’s investment advisory agreement as well as a discussion of the material factors and related conclusions that formed the basis for the Board’s approval of the Fund’s investment advisory agreement and sub-advisory contracts. Unless otherwise stated, this information is current as of June 15, 2011, and may not reflect consideration of factors that became known to the Board after that date, including, for example, changes to the Fund’s performance, advisory fees, expense limitations and/or fee waivers.
Factors and Conclusions and Summary of Independent Written Fee Evaluation
| |
| A. | Nature, Extent and Quality of Services Provided by Invesco Advisers and the Affiliated Sub-Advisers |
The Board reviewed the advisory services provided to the Fund by Invesco Advisers under the Fund’s investment advisory agreement, the performance of Invesco Advisers in providing these services, and the credentials and experience of the officers and employees of Invesco Advisers who provide these services, including the Fund’s portfolio manager or managers, with whom the Board met during the year. The Board’s review of the qualifications of Invesco Advisers to provide advisory services included the Board’s consideration of Invesco Advisers’ performance and investment process oversight, independent credit analysis and investment risk management.
In determining whether to continue the Fund’s investment advisory agreement, the Board considered the prior relationship between Invesco Advisers and the Fund, as well as the Board’s knowledge of Invesco Advisers’ operations, and concluded that it is beneficial to maintain the current relationship, in part, because of such knowledge. The Board also considered services that Invesco Advisers and its affiliates provide to the Invesco Funds such as various back office support functions, equity and fixed income trading operations, internal audit, distribution and legal and compliance. The Board concluded that the nature, extent and quality of the services provided to the Fund by Invesco Advisers are appropriate and satisfactory and the advisory services are provided in accordance with the terms of the Fund’s investment advisory agreement.
The Board reviewed the services provided by the Affiliated Sub-Advisers under the sub-advisory contracts and the credentials and experience of the officers and employees of the Affiliated Sub-Advisers who provide these services. The Board noted that the Affiliated Sub-Advisers have offices and personnel that are located in financial centers around the world. As a result, the Affiliated Sub-Advisers can provide research and investment analysis on the markets and economies of various countries in which the Fund invests and make recommendations on securities of companies located in such countries. The Board concluded that the sub-advisory contracts benefit the Fund and its shareholders by permitting Invesco Advisers to use the resources and talents of the Affiliated Sub-Advisers in managing the Fund. The Board concluded that the nature, extent and quality of the services provided by the Affiliated Sub-Advisers are appropriate and
23 Invesco Global Advantage Fund
satisfactory and in accordance with the terms of the Fund’s sub-advisory contracts.
The Board considered Fund performance as a relevant factor in considering whether to approve the investment advisory agreement. The Board did not view Fund performance as a relevant factor in considering whether to approve the sub-advisory contracts for the Fund, as no Affiliated Sub-Adviser currently manages assets of the Fund.
The Board compared the Fund’s performance during the past one, three and five calendar years to the performance of funds in the Lipper performance universe and against the Lipper Global Large-Cap Growth Funds Index. The Board noted that performance of Class A shares of the Fund was in the first quintile of the performance universe for the one and five year periods and the second quintile for the three year period (the first quintile being the best performing funds and the fifth quintile being the worst performing funds). The Board noted that the performance of Class A shares of the Fund was above the performance of the Index for the one, three and five year periods. Although the independent written evaluation of the Fund’s Senior Officer only considered Fund performance through the most recent calendar year, the Trustees also reviewed more recent Fund performance and this review did not change their conclusions.
| |
| C. | Advisory and Sub-Advisory Fees and Fee Waivers |
The Board compared the Fund’s contractual advisory fee rate to the contractual advisory fee rates of funds in the Fund’s Lipper expense group at a common asset level. The Board noted that the contractual advisory fee rate for Class A shares of the Fund was below the median contractual advisory fee rate of funds in the expense group. The Board also reviewed the methodology used by Lipper in providing expense group information, which includes using audited financial data from the most recent annual report of each fund in the expense group that was publicly available as of the end of the past calendar year and including only one fund per investment adviser. The Board noted that comparative data is as of varying dates, which may affect the comparability of data during times of market volatility.
The Board also compared the Fund’s effective fee rate (the advisory fee after advisory fee waivers and before expense limitations/waivers) to the advisory fee rates of other mutual funds advised by Invesco Advisers and its affiliates with investment strategies comparable to those of the Fund. The Board noted that the Fund’s rate was below the rate of one mutual fund with comparable investment strategies.
Other than the mutual fund described above, the Board noted that Invesco Advisers and the Affiliated Sub-Advisers do not manage other mutual funds or client accounts in a manner substantially similar to the management of the Fund.
The Board noted that Invesco Advisers has contractually agreed to waive fees and/or limit expenses of the Fund through at least June 30, 2012 in an amount necessary to limit total annual operating expenses to a specified percentage of average daily net assets for each class of the Fund. The Board also considered the effect this fee waiver would have on the Fund’s total estimated expenses.
The Board also considered the services provided by the Affiliated Sub-Advisers pursuant to the sub-advisory contracts, as well as the allocation of fees between Invesco Advisers and the Affiliated Sub-Advisers pursuant to the sub-advisory contracts. The Board noted that Invesco Advisers provides services to sub-advised Invesco Funds, including oversight of the Affiliated Sub-Advisers as well as the additional services described above other than day-to-day portfolio management. The Board also noted that the sub-advisory fees have no direct effect on the Fund or its shareholders, as they are paid by Invesco Advisers to the Affiliated Sub-Advisers.
Based upon the information and considerations described above, the Board concluded that the Fund’s advisory and sub-advisory fees are fair and reasonable.
| |
| D. | Economies of Scale and Breakpoints |
The Board considered the extent to which there are economies of scale in the provision of advisory services to the Fund. The Board also considered whether the Fund benefits from economies of scale through contractual breakpoints in the Fund’s advisory fee schedule. The Board also noted that the Fund shares directly in economies of scale through lower fees charged by third party service providers based on the combined size of the Invesco Funds and other clients advised by Invesco Advisers.
| |
| E. | Profitability and Financial Resources |
The Board reviewed information from Invesco Advisers concerning the costs of the advisory and other services that Invesco Advisers and its affiliates provide to the Fund and the profitability of Invesco Advisers and its affiliates in providing these services. The Board reviewed with Invesco Advisers the methodology used to prepare the profitability information. The Board considered the profitability of Invesco Advisers in connection with managing the Fund and the Invesco Funds. The Board noted that Invesco Advisers continues to operate at a net profit from services Invesco Advisers and its subsidiaries provide to the Fund and the Invesco Funds. The Board concluded that the level of profits realized by Invesco Advisers and its affiliates from providing services to the Fund is not excessive given the nature, quality and extent of the services provided to the Invesco Funds. The Board considered whether Invesco Advisers and each Affiliated Sub-Adviser are financially sound and have the resources necessary to perform their obligations under the investment advisory agreement and sub-advisory contracts. The Board concluded that Invesco Advisers and each Affiliated Sub-Adviser have the financial resources necessary to fulfill these obligations.
| |
| F. | Collateral Benefits to Invesco Advisers and its Affiliates |
The Board considered various other benefits received by Invesco Advisers and its affiliates from the relationship with the Fund, including the fees received for their provision of administrative, transfer agency and distribution services to the Fund. The Board considered the performance of Invesco Advisers and its affiliates in providing these services and the organizational structure employed to provide these services. The Board also considered that these services are provided to the Fund pursuant to written contracts that are reviewed and approved on an annual basis by the Board; that the services are required for the operation of the Fund; that Invesco Advisers and its affiliates can provide services, the nature and quality of which are at least equal to those provided by others offering the same or similar services; and that the fees for such services are fair and reasonable in light of the usual and customary charges by others for services of the same nature and quality.
The Board considered the benefits realized by Invesco Advisers and the Affiliated Sub-Advisers as a result of portfolio brokerage transactions executed through “soft dollar” arrangements. The Board noted that soft dollar arrangements shift the payment obligation for research and execution services from Invesco Advisers and the Affiliated Sub-Advisers to the Invesco Funds and therefore may reduce Invesco Advisers’ and the Affiliated Sub-Advisers’ expenses. The Board concluded that the soft dollar arrangements are appropriate. The Board also concluded that, based on their review and representations made by the Chief Compliance Officer of the Invesco Funds, these arrangements are consistent with regulatory requirements.
The Board considered that the Fund’s uninvested cash and cash collateral from any securities lending arrangements may be invested in money market funds advised by Invesco Advisers pursuant to procedures approved by the Board. The Board noted that Invesco Advisers receives advisory fees from these affiliated money market funds attributable to such investments, although Invesco Advisers has contractually agreed to waive through varying periods the advisory fees payable by the Invesco Funds. The waiver is in an amount equal to 100% of the net advisory fee Invesco Advisers receives from the affiliated money market funds with respect to the Fund’s investment in the affiliated money market funds of uninvested cash, but not cash collateral. The Board concluded that the Fund’s investment of uninvested cash and cash collateral from any securities lending arrangements in the affiliated money market funds is in the best interests of the Fund and its shareholders.
24 Invesco Global Advantage Fund
Proxy Results
A Special Meeting (“Meeting”) of Shareholders of Invesco Global Advantage Fund was held on Wednesday, April 14, 2011, and was adjourned several times until November 28, 2011. The Meeting on November 28, 2011 was held for the following purpose:
| | | | | | | | | | | | | | | | | | | |
| | | | | | | Votes
| | | | Broker
|
| | | Matter | | Votes For | | Against | | Abstentions | | Non-Votes |
| |
| |
| (1) | | To approve an Agreement and Plan of Reorganization between Invesco Global Advantage Fund (the “Target Fund”) and Invesco Global Growth Fund (the “Acquiring Fund”) a series of AIM International Mutual Funds (Invesco International Mutual Funds), providing for: (a) the acquisition of all of the assets and assumption of all of the liabilities of the Target Fund by the Acquiring Fund in exchange for shares of a corresponding class of the Acquiring Fund; (b) the distribution of such shares to the shareholders of the Target Fund; and (c) the liquidation and termination of the Target Fund | | | 5,208,111 | | | | 239,565 | | | | 626,988 | | | | 0 | |
25 Invesco Global Advantage Fund
Trustees and Officers
The address of each trustee and officer is AIM Investment Funds (Invesco Investment Funds) (the “Trust”), 11 Greenway Plaza, Suite 2500, Houston, Texas 77046-1173. The trustees serve for the life of the Trust, subject to their earlier death, incapacitation, resignation, retirement or removal as more specifically provided in the Trust’s organizational documents. Each officer serves for a one year term or until their successors are elected and qualified. Column two below includes length of time served with predecessor entities, if any.
| | | | | | | | | |
| | | | | | | Number of
| | |
| | | | | | | Funds in
| | |
| | | | | | | Fund Complex
| | |
Name, Year of Birth and
| | Trustee and/
| | Principal Occupation(s)
| | Overseen by
| | Other Directorship(s)
|
| Position(s) Held with the Trust | | or Officer Since | | During Past 5 Years | | Trustee | | Held by Trustee |
| | | | | | | | | |
| | | | | | | | | |
| Interested Persons | | | | | | | | |
| | | | | | | | | |
| | | | | | | | | |
| | | | | | | | | |
Martin L. Flanagan1 — 1960
Trustee | | 2007 | | Executive Director, Chief Executive Officer and President, Invesco Ltd. (ultimate parent of Invesco and a global investment management firm); Advisor to the Board, Invesco Advisers, Inc. (formerly known as Invesco Institutional (N.A.), Inc.); Trustee, The Invesco Funds; Vice Chair, Investment Company Institute; and Member of Executive Board, SMU Cox School of Business
Formerly: Chairman, Invesco Advisers, Inc. (registered investment adviser); Director, Chairman, Chief Executive Officer and President, IVZ Inc. (holding company), INVESCO Group Services, Inc. (service provider) and Invesco North American Holdings, Inc. (holding company); Director, Chief Executive Officer and President, Invesco Holding Company Limited (parent of Invesco and a global investment management firm); Director, Invesco Ltd.; Chairman, Investment Company Institute and President, Co-Chief Executive Officer, Co-President, Chief Operating Officer and Chief Financial Officer, Franklin Resources, Inc. (global investment management organization) | | 141 | | None |
| | | | | | | | | |
| | | | | | | | | |
| | | | | | | | | |
Philip A. Taylor2 — 1954
Trustee, President and
Principal Executive Officer | | 2006 | | Head of North American Retail and Senior Managing Director, Invesco Ltd.; Director, Co-Chairman, Co-President and Co-Chief Executive Officer, Invesco Advisers, Inc. (formerly known as Invesco Institutional (N.A.), Inc.) (registered investment adviser); Director, Chairman, Chief Executive Officer and President, Invesco Management Group, Inc. (formerly Invesco Aim Management Group, Inc.) (financial services holding company); Director and President, INVESCO Funds Group, Inc. (registered investment adviser and registered transfer agent); Director and Chairman, Invesco Investment Services, Inc. (formerly known as Invesco Aim Investment Services, Inc.) (registered transfer agent) and IVZ Distributors, Inc. (formerly known as INVESCO Distributors, Inc.) (registered broker dealer); Director, President and Chairman, Invesco Inc. (holding company) and Invesco Canada Holdings Inc. (holding company); Chief Executive Officer, Invesco Corporate Class Inc. (corporate mutual fund company) and Invesco Canada Fund Inc. (corporate mutual fund company); Director, Chairman and Chief Executive Officer, Invesco Canada Ltd. (formerly known as Invesco Trimark Ltd./Invesco Trimark Ltèe) (registered investment adviser and registered transfer agent); Trustee, President and Principal Executive Officer, The Invesco Funds (other than AIM Treasurer’s Series Trust (Invesco Treasurer’s Series Trust) and Short-Term Investments Trust); Trustee and Executive Vice President, The Invesco Funds (AIM Treasurer’s Series Trust (Invesco Treasurer’s Series Trust) and Short-Term Investments Trust only); Director, Invesco Investment Advisers LLC (formerly known as Van Kampen Asset Management); Director, Chief Executive Officer and President, Van Kampen Exchange Corp.
Formerly: Director and Chairman, Van Kampen Investor Services Inc.: Director, Chief Executive Officer and President, 1371 Preferred Inc. (holding company); and Van Kampen Investments Inc.; Director and President, AIM GP Canada Inc. (general partner for limited partnerships); and Van Kampen Advisors, Inc.; Director and Chief Executive Officer, Invesco Trimark Dealer Inc. (registered broker dealer); Director, Invesco Distributors, Inc. (formerly known as Invesco Aim Distributors, Inc.) (registered broker dealer); Manager, Invesco PowerShares Capital Management LLC; Director, Chief Executive Officer and President, Invesco Advisers, Inc.; Director, Chairman, Chief Executive Officer and President, Invesco Aim Capital Management, Inc.; President, Invesco Trimark Dealer Inc. and Invesco Trimark Ltd./Invesco Trimark Ltèe; Director and President, AIM Trimark Corporate Class Inc. and AIM Trimark Canada Fund Inc.; Senior Managing Director, Invesco Holding Company Limited; Trustee and Executive Vice President, Tax-Free Investments Trust; Director and Chairman, Fund Management Company (former registered broker dealer); President and Principal Executive Officer, The Invesco Funds (AIM Treasurer’s Series Trust (Invesco Treasurer’s Series Trust), Short-Term Investments Trust and Tax-Free Investments Trust only); President, AIM Trimark Global Fund Inc. and AIM Trimark Canada Fund Inc. | | 141 | | None |
| | | | | | | | | |
| | | | | | | | | |
| | | | | | | | | |
Wayne W. Whalen3 — 1939
Trustee | | 2010 | | Of Counsel, and prior to 2010, partner in the law firm of Skadden, Arps, Slate, Meagher & Flom LLP, legal counsel to funds in the Fund Complex | | 159 | | Director of the Abraham Lincoln Presidential Library Foundation |
| | | | | | | | | |
| | | | | | | | | |
| | | | | | | | | |
| Independent Trustees | | | | | | | | |
| | | | | | | | | |
| | | | | | | | | |
| | | | | | | | | |
Bruce L. Crockett — 1944
Trustee and Chair | | 2001 | | Chairman, Crockett Technology Associates (technology consulting company)
Formerly: Director, Captaris (unified messaging provider); Director, President and Chief Executive Officer COMSAT Corporation; and Chairman, Board of Governors of INTELSAT (international communications company) | | 141 | | ACE Limited (insurance company); and Investment Company Institute |
| | | | | | | | | |
| | | | | | | | | |
| | | | | | | | | |
David C. Arch — 1945
Trustee | | 2010 | | Chairman and Chief Executive Officer of Blistex Inc., a consumer health care products manufacturer. | | 159 | | Member of the Heartland Alliance Advisory Board, a nonprofit organization serving human needs based in Chicago. Board member of the Illinois Manufacturers’ Association. Member of the Board of Visitors, Institute for the Humanities, University of Michigan |
| | | | | | | | | |
| |
| 1 | Mr. Flanagan is considered an interested person of the Trust because he is an officer of the adviser to the Trust, and an officer and a director of Invesco Ltd., ultimate parent of the adviser to the Trust. |
| 2 | Mr. Taylor is considered an interested person of the Trust because he is an officer and a director of the adviser to, and a director of the principal underwriter of, the Trust. |
| 3 | Mr. Whalen has been deemed to be an interested person of the Trust because of his prior service as counsel to the predecessor funds of certain Invesco open-end funds and his affiliation with the law firm that served as counsel to such predecessor funds and continues to serve as counsel to the Invesco Van Kampen closed-end funds. |
T-1 Invesco Global Advantage Fund
Trustees and Officers—(continued)
The address of each trustee and officer is AIM Investment Funds (Invesco Investment Funds) (the “Trust”), 11 Greenway Plaza, Suite 2500, Houston, Texas 77046-1173. The trustees serve for the life of the Trust, subject to their earlier death, incapacitation, resignation, retirement or removal as more specifically provided in the Trust’s organizational documents. Each officer serves for a one year term or until their successors are elected and qualified. Column two below includes length of time served with predecessor entities, if any.
| | | | | | | | | |
| | | | | | | Number of
| | |
| | | | | | | Funds in
| | |
| | | | | | | Fund Complex
| | |
Name, Year of Birth and
| | Trustee and/
| | Principal Occupation(s)
| | Overseen by
| | Other Directorship(s)
|
| Position(s) Held with the Trust | | or Officer Since | | During Past 5 Years | | Trustee | | Held by Trustee |
| | | | | | | | | |
| | | | | | | | | |
| Independent Trustees—(continued) | | | | | | | | |
| | | | | | | | | |
| | | | | | | | | |
| | | | | | | | | |
Bob R. Baker — 1936
Trustee | | 2003 | | Retired
Formerly: President and Chief Executive Officer, AMC Cancer Research Center; and Chairman and Chief Executive Officer, First Columbia Financial Corporation | | 141 | | None |
| | | | | | | | | |
| | | | | | | | | |
| | | | | | | | | |
Frank S. Bayley — 1939
Trustee | | 1987 | | Retired
Formerly: Director, Badgley Funds, Inc. (registered investment company) (2 portfolios) and Partner, law firm of Baker & McKenzie | | 141 | | Director and Chairman, C.D. Stimson Company (a real estate investment company) |
| | | | | | | | | |
| | | | | | | | | |
| | | | | | | | | |
James T. Bunch — 1942
Trustee | | 2003 | | Founder, Green, Manning & Bunch Ltd. (investment banking firm)
Formerly: Executive Committee, United States Golf Association; and Director, Policy Studies, Inc. and Van Gilder Insurance Corporation | | 141 | | Vice Chairman, Board of Governors, Western Golf Association/Evans Scholars Foundation and Director, Denver Film Society |
| | | | | | | | | |
| | | | | | | | | |
| | | | | | | | | |
Rodney F. Dammeyer — 1940
Trustee | | 2010 | | President of CAC, LLC, a private company offering capital investment and management advisory services.
Formerly: Prior to January 2004, Director of TeleTech Holdings Inc.; Prior to 2002, Director of Arris Group, Inc.; Prior to 2001, Managing Partner at Equity Group Corporate Investments. Prior to 1995, Vice Chairman of Anixter International. Prior to 1985, experience includes Senior Vice President and Chief Financial Officer of Household International, Inc, Executive Vice President and Chief Financial Officer of Northwest Industries, Inc. and Partner of Arthur Andersen & Co. | | 159 | | Director of Quidel Corporation and Stericycle, Inc. Prior to May 2008, Trustee of The Scripps Research Institute. Prior to February 2008, Director of Ventana Medical Systems, Inc. Prior to April 2007, Director of GATX Corporation. Prior to April 2004, Director of TheraSense, Inc. |
| | | | | | | | | |
| | | | | | | | | |
| | | | | | | | | |
Albert R. Dowden — 1941
Trustee | | 2001 | | Director of a number of public and private business corporations, including the Boss Group, Ltd. (private investment and management); Reich & Tang Funds (5 portfolios) (registered investment company); and Homeowners of America Holding Corporation/ Homeowners of America Insurance Company (property casualty company)
Formerly: Director, Continental Energy Services, LLC (oil and gas pipeline service); Director, CompuDyne Corporation (provider of product and services to the public security market) and Director, Annuity and Life Re (Holdings), Ltd. (reinsurance company); Director, President and Chief Executive Officer, Volvo Group North America, Inc.; Senior Vice President, AB Volvo; Director of various public and private corporations; Chairman, DHJ Media, Inc.; Director Magellan Insurance Company; and Director, The Hertz Corporation, Genmar Corporation (boat manufacturer), National Media Corporation; Advisory Board of Rotary Power International (designer, manufacturer, and seller of rotary power engines); and Chairman, Cortland Trust, Inc. (registered investment company) | | 141 | | Board of Nature’s Sunshine Products, Inc. |
| | | | | | | | | |
| | | | | | | | | |
| | | | | | | | | |
Jack M. Fields — 1952
Trustee | | 2001 | | Chief Executive Officer, Twenty First Century Group, Inc. (government affairs company); and Owner and Chief Executive Officer, Dos Angelos Ranch, L.P. (cattle, hunting, corporate entertainment), Discovery Global Education Fund (non-profit) and Cross Timbers Quail Research Ranch (non-profit)
Formerly: Chief Executive Officer, Texana Timber LP (sustainable forestry company) and member of the U.S. House of Representatives | | 141 | | Administaff |
| | | | | | | | | |
| | | | | | | | | |
| | | | | | | | | |
Carl Frischling — 1937
Trustee | | 2001 | | Partner, law firm of Kramer Levin Naftalis and Frankel LLP | | 141 | | Director, Reich & Tang Funds (6 portfolios) |
| | | | | | | | | |
| | | | | | | | | |
| | | | | | | | | |
Prema Mathai-Davis — 1950
Trustee | | 2001 | | Retired
Formerly: Chief Executive Officer, YWCA of the U.S.A. | | 141 | | None |
| | | | | | | | | |
| | | | | | | | | |
| | | | | | | | | |
Larry Soll — 1942
Trustee | | 2003 | | Retired
Formerly, Chairman, Chief Executive Officer and President, Synergen Corp. (a biotechnology company) | | 141 | | None |
| | | | | | | | | |
| | | | | | | | | |
| | | | | | | | | |
Hugo F. Sonnenschein — 1940
Trustee | | 2010 | | President Emeritus and Honorary Trustee of the University of Chicago and the Adam Smith Distinguished Service Professor in the Department of Economics at the University of Chicago. Prior to July 2000, President of the University of Chicago. | | 159 | | Trustee of the University of Rochester and a member of its investment committee. Member of the National Academy of Sciences, the American Philosophical Society and a fellow of the American Academy of Arts and Sciences |
| | | | | | | | | |
| | | | | | | | | |
| | | | | | | | | |
Raymond Stickel, Jr. — 1944
Trustee | | 2005 | | Retired
Formerly: Director, Mainstay VP Series Funds, Inc. (25 portfolios) and Partner, Deloitte & Touche | | 141 | | Director of Long Cove Club Owners’ Association (home owner’s association) |
| | | | | | | | | |
T-2 Invesco Global Advantage Fund
Trustees and Officers—(continued)
The address of each trustee and officer is AIM Investment Funds (Invesco Investment Funds) (the “Trust”), 11 Greenway Plaza, Suite 2500, Houston, Texas 77046-1173. The trustees serve for the life of the Trust, subject to their earlier death, incapacitation, resignation, retirement or removal as more specifically provided in the Trust’s organizational documents. Each officer serves for a one year term or until their successors are elected and qualified. Column two below includes length of time served with predecessor entities, if any.
| | | | | | | | | |
| | | | | | | Number of
| | |
| | | | | | | Funds in
| | |
| | | | | | | Fund Complex
| | |
Name, Year of Birth and
| | Trustee and/
| | Principal Occupation(s)
| | Overseen by
| | Other Directorship(s)
|
| Position(s) Held with the Trust | | or Officer Since | | During Past 5 Years | | Trustee | | Held by Trustee |
| | | | | | | | | |
| | | | | | | | | |
| Other Officers | | | | | | | | |
| | | | | | | | | |
| | | | | | | | | |
| | | | | | | | | |
Russell C. Burk — 1958
Senior Vice President and Senior Officer | | 2005 | | Senior Vice President and Senior Officer of Invesco Funds | | N/A | | N/A |
| | | | | | | | | |
| | | | | | | | | |
| | | | | | | | | |
John M. Zerr — 1962
Senior Vice President, Chief Legal Officer and Secretary | | 2006 | | Director, Senior Vice President, Secretary and General Counsel, Invesco Management Group, Inc. (formerly known as Invesco Aim Management Group, Inc.) and Van Kampen Exchange Corp.; Senior Vice President, Invesco Advisers, Inc. (formerly known as Invesco Institutional (N.A.), Inc.) (registered investment adviser); Senior Vice President and Secretary, Invesco Distributors, Inc. (formerly known as Invesco Aim Distributors, Inc.); Director, Vice President and Secretary, Invesco Investment Services, Inc. (formerly known as Invesco Aim Investment Services, Inc.) and IVZ Distributors, Inc. (formerly known as INVESCO Distributors, Inc.); Director and Vice President, INVESCO Funds Group, Inc.; Senior Vice President, Chief Legal Officer and Secretary, The Invesco Funds; Manager, Invesco PowerShares Capital Management LLC; Director, Secretary and General Counsel, Invesco Investment Advisers LLC (formerly known as Van Kampen Asset Management); Secretary and General Counsel, Van Kampen Funds Inc. and Chief Legal Officer, PowerShares Exchange-Traded Fund Trust, PowerShares Exchange-Traded Fund Trust II, PowerShares India Exchange-Traded Fund Trust and PowerShares Actively Managed Exchange-Traded Fund Trust
Formerly: Director and Secretary, Van Kampen Advisors Inc.; Director Vice President, Secretary and General Counsel Van Kampen Investor Services Inc.; Director, Invesco Distributors, Inc. (formerly known as Invesco Aim Distributors, Inc.); Director, Senior Vice President, General Counsel and Secretary, Invesco Advisers, Inc.; and Van Kampen Investments Inc.; Director, Vice President and Secretary, Fund Management Company; Director, Senior Vice President, Secretary, General Counsel and Vice President, Invesco Aim Capital Management, Inc.; Chief Operating Officer and General Counsel, Liberty Ridge Capital, Inc. (an investment adviser); Vice President and Secretary, PBHG Funds (an investment company) and PBHG Insurance Series Fund (an investment company); Chief Operating Officer, General Counsel and Secretary, Old Mutual Investment Partners (a broker-dealer); General Counsel and Secretary, Old Mutual Fund Services (an administrator) and Old Mutual Shareholder Services (a shareholder servicing center); Executive Vice President, General Counsel and Secretary, Old Mutual Capital, Inc. (an investment adviser); and Vice President and Secretary, Old Mutual Advisors Funds (an investment company) | | N/A | | N/A |
| | | | | | | | | |
| | | | | | | | | |
| | | | | | | | | |
Lisa O. Brinkley — 1959
Vice President | | 2004 | | Global Compliance Director, Invesco Ltd.; Chief Compliance Officer, Invesco Investment Services, Inc.(formerly known as Invesco Aim Investment Services, Inc.); and Vice President, The Invesco Funds
Formerly: Chief Compliance Officer, Invesco Distributors, Inc. (formerly known as Invesco Aim Distributors, Inc.) and Van Kampen Investor Services Inc.; Senior Vice President, Invesco Management Group, Inc.; Senior Vice President and Chief Compliance Officer, Invesco Advisers, Inc. and The Invesco Funds; Vice President and Chief Compliance Officer, Invesco Aim Capital Management, Inc. and Invesco Distributors, Inc.; Vice President, Invesco Investment Services, Inc. and Fund Management Company | | N/A | | N/A |
| | | | | | | | | |
| | | | | | | | | |
| | | | | | | | | |
Sheri Morris — 1964
Vice President, Treasurer and Principal Financial Officer | | 1999 | | Vice President, Treasurer and Principal Financial Officer, The Invesco Funds; and Vice President, Invesco Advisers, Inc. (formerly known as Invesco Institutional (N.A.), Inc.) (registered investment adviser).
Formerly: Treasurer, PowerShares Exchange-Traded Fund Trust, PowerShares Exchange--Traded Fund Trust II, PowerShares India Exchange-Traded Fund Trust and PowerShares Actively Managed Exchange-Traded Fund Trust; Vice President, Invesco Advisers, Inc., Invesco Aim Capital Management, Inc. and Invesco Aim Private Asset Management, Inc.; Assistant Vice President and Assistant Treasurer, The Invesco Funds and Assistant Vice President, Invesco Advisers, Inc., Invesco Aim Capital Management, Inc. and Invesco Aim Private Asset Management, Inc. | | N/A | | N/A |
| | | | | | | | | |
| | | | | | | | | |
| | | | | | | | | |
Karen Dunn Kelley — 1960
Vice President | | 2004 | | Head of Invesco’s World Wide Fixed Income and Cash Management Group; Senior Vice President, Invesco Advisers, Inc. (formerly known as Invesco Institutional (N.A.), Inc.) (registered investment adviser); Executive Vice President, Invesco Distributors, Inc. (formerly known as Invesco Aim Distributors, Inc.); Senior Vice President, Invesco Management Group, Inc. (formerly known as Invesco Aim Management Group, Inc.); and Director, Invesco Mortgage Capital Inc.; Vice President, The Invesco Funds (other than AIM Treasurer’s Series Trust (Invesco Treasurer’s Series Trust) and Short-Term Investments Trust); President and Principal Executive Officer, The Invesco Funds (AIM Treasurer’s Series Trust (Invesco Treasurer’s Series Trust) and Short-Term Investments Trust only).
Formerly: Senior Vice President, Van Kampen Investments Inc.; Vice President, Invesco Advisers, Inc. (formerly known as Invesco Institutional (N.A.), Inc.); Director of Cash Management and Senior Vice President, Invesco Advisers, Inc. and Invesco Aim Capital Management, Inc.; President and Principal Executive Officer, Tax-Free Investments Trust; Director and President, Fund Management Company; Chief Cash Management Officer, Director of Cash Management, Senior Vice President, and Managing Director, Invesco Aim Capital Management, Inc.; Director of Cash Management, Senior Vice President, and Vice President, Invesco Advisers, Inc. and The Invesco Funds (AIM Treasurer’s Series Trust (Invesco Treasurer’s Series Trust), Short-Term Investments Trust and Tax-Free Investments Trust only) | | N/A | | N/A |
| | | | | | | | | |
T-3 Invesco Global Advantage Fund
Trustees and Officers—(continued)
The address of each trustee and officer is AIM Investment Funds (Invesco Investment Funds) (the “Trust”), 11 Greenway Plaza, Suite 2500, Houston, Texas 77046-1173. The trustees serve for the life of the Trust, subject to their earlier death, incapacitation, resignation, retirement or removal as more specifically provided in the Trust’s organizational documents. Each officer serves for a one year term or until their successors are elected and qualified. Column two below includes length of time served with predecessor entities, if any.
| | | | | | | | | |
| | | | | | | Number of
| | |
| | | | | | | Funds in
| | |
| | | | | | | Fund Complex
| | |
Name, Year of Birth and
| | Trustee and/
| | Principal Occupation(s)
| | Overseen by
| | Other Directorship(s)
|
| Position(s) Held with the Trust | | or Officer Since | | During Past 5 Years | | Trustee | | Held by Trustee |
| | | | | | | | | |
| | | | | | | | | |
| Other Officers—(continued) | | | | | | | | |
| | | | | | | | | |
| | | | | | | | | |
| | | | | | | | | |
Lance A. Rejsek — 1967
Anti-Money Laundering Compliance Officer | | 2005 | | Anti-Money Laundering Compliance Officer, Invesco Advisers, Inc. (formerly known as Invesco Institutional (N.A.), Inc.) (registered investment adviser); Invesco Distributors, Inc. (formerly known as Invesco Aim Distributors, Inc.), Invesco Investment Services, Inc. (formerly known as Invesco Aim Investment Services, Inc.), The Invesco Funds, PowerShares Exchange-Traded Fund Trust, PowerShares Exchange-Traded Fund Trust II, PowerShares India Exchange-Traded Fund Trust, PowerShares Actively Managed Exchange-Traded Fund Trust, Invesco Investment Advisers LLC (formerly known as Van Kampen Asset Management) and Van Kampen Funds Inc.
Formerly: Anti-Money Laundering Compliance Officer, Van Kampen Investor Services Inc., Fund Management Company, Invesco Advisers, Inc., Invesco Aim Capital Management, Inc. and Invesco Aim Private Asset Management, Inc. | | N/A | | N/A |
| | | | | | | | | |
| | | | | | | | | |
| | | | | | | | | |
Todd L. Spillane — 1958
Chief Compliance Officer | | 2006 | | Senior Vice President, Invesco Management Group, Inc. (formerly known as Invesco Aim Management Group, Inc.) and Van Kampen Exchange Corp.; Senior Vice President and Chief Compliance Officer, Invesco Advisers, Inc. (registered investment adviser) (formerly known as Invesco Institutional (N.A.), Inc.); Chief Compliance Officer, The Invesco Funds, PowerShares Exchange-Traded Fund Trust, PowerShares Exchange-Traded Fund Trust II, PowerShares India Exchange-Traded Fund Trust, PowerShares Actively Managed Exchange-Traded Fund Trust, INVESCO Private Capital Investments, Inc. (holding company) and Invesco Private Capital, Inc. (registered investment adviser); Vice President, Invesco Distributors, Inc. (formerly known as Invesco Aim Distributors, Inc.) and Invesco Investment Services, Inc. (formerly known as Invesco Aim Investment Services, Inc.).
Formerly: Chief Compliance Officer, Invesco Van Kampen Closed-End Funds; Senior Vice President, Van Kampen Investments Inc.; Senior Vice President and Chief Compliance Officer, Invesco Advisers, Inc. and Invesco Aim Capital Management, Inc.; Chief Compliance Officer, Invesco Global Asset Management (N.A.), Inc., Invesco Senior Secured Management, Inc. (registered investment adviser) and Van Kampen Investor Services Inc.; Vice President, Invesco Aim Capital Management, Inc. and Fund Management Company | | N/A | | N/A |
| | | | | | | | | |
The Statement of Additional Information of the Trust includes additional information about the Fund’s Trustees and is available upon request, without charge, by calling 1.800.959.4246. Please refer to the Fund’s prospectus for information on the Fund’s sub-advisers.
| | | | | | | |
Office of the Fund
11 Greenway Plaza, Suite 2500
Houston, TX 77046-1173 | | Investment Adviser
Invesco Advisers, Inc.
1555 Peachtree Street, N.E.
Atlanta, GA 30309 | | Distributor
Invesco Distributors, Inc.
11 Greenway Plaza, Suite 2500
Houston, TX 77046-1173 | | Auditors
PricewaterhouseCoopers LLP
1201 Louisiana Street, Suite 2900
Houston, TX 77002-5678 |
| | | | | | | |
| | | | | | | |
Counsel to the Fund
Stradley Ronon Stevens & Young, LLP
2600 One Commerce Square
Philadelphia, PA 19103 | | Counsel to the Independent Trustees
Kramer, Levin, Naftalis & Frankel LLP
1177 Avenue of the Americas
New York, NY 10036-2714 | | Transfer Agent
Invesco Investment Services, Inc.
11 Greenway Plaza, Suite 2500
Houston, TX 77046-1173 | | Custodian
State Street Bank and Trust Company
225 Franklin
Boston, MA 02110-2801 |
T-4 Invesco Global Advantage Fund
Invesco mailing information
Send general correspondence to Invesco Investment Services, Inc., P.O. Box 219078, Kansas City, MO 64121-9078.
You share personal and financial information with us that is necessary for your transactions and your account records. We take very seriously the obligation to keep that information confidential and private.
Invesco collects nonpublic personal information about you from account applications or other forms you complete and from your transactions with us or our affiliates. We do not disclose information about you or our former customers to service providers or other third parties except to the extent necessary to service your account and in other limited circumstances as permitted by law. For example, we use this information to facilitate the delivery of transaction confirmations, financial reports, prospectuses and tax forms.
Even within Invesco, only people involved in the servicing of your accounts and compliance monitoring have access to your information. To ensure the highest level of confidentiality and security, Invesco maintains physical, electronic and procedural safeguards that meet or exceed federal standards. Special measures, such as data encryption and authentication, apply to your communications with us on our website. More detail is available to you at invesco.com/privacy.
Important notice regarding delivery of security holder documentsTo reduce Fund expenses, only one copy of most shareholder documents may be mailed to shareholders with multiple accounts at the same address (Householding). Mailing of your shareholder documents may be householded indefinitely unless you instruct us otherwise. If you do not want the mailing of these documents to be combined with those for other members of your household, please contact Invesco Investment Services, Inc. at 800 959 4246 or contact your financial institution. We will begin sending you individual copies for each account within 30 days after receiving your request.
Fund holdings and proxy voting informationThe Fund provides a complete list of its holdings four times in each fiscal year, at the quarter-ends. For the second and fourth quarters, the lists appear in the Fund’s semiannual and annual reports to shareholders. For the first and third quarters, the Fund files the lists with the Securities and Exchange Commission (SEC) on Form N-Q. The most recent list of portfolio holdings is available at invesco.com/completeqtrholdings. Shareholders can also look up the Fund’s Forms N-Q on the SEC website at sec.gov. Copies of the Fund’s Forms N-Q may be reviewed and copied at the SEC Public Reference Room in Washington, D.C. You can obtain information on the operation of the Public Reference Room, including information about duplicating fee charges, by calling 202 551 8090 or 800 732 0330, or by electronic request at the following email address: publicinfo@sec.gov. The SEC file numbers for the Fund are 811-05426 and 033-19338.
A description of the policies and procedures that the Fund uses to determine how to vote proxies relating to portfolio securities is available without charge, upon request, from our Client Services department at 800 959 4246 or at invesco.com/proxyguidelines. The information is also available on the SEC website, sec.gov.
Information regarding how the Fund voted proxies related to its portfolio securities during the 12 months ended June 30, 2011, is available at invesco.com/proxysearch. The information is also available on the SEC website, sec.gov.
Invesco Advisers, Inc. is an investment adviser; it provides investment advisory services to individual and institutional clients and does not sell securities. Invesco Distributors, Inc. is the U.S. distributor for Invesco Ltd.’s retail mutual funds, exchange-traded funds and institutional money market funds. Both are wholly owned, indirect subsidiaries of Invesco Ltd.
MS-GADV-AR-1 Invesco Distributors, Inc.
| | |
| Annual Report to Shareholders | | October 31, 2011 |
Invesco Global Health Care Fund
Nasdaq:
A: GGHCX § B: GTHBX § C: GTHCX § Y: GGHYX § Investor: GTHIX
| | | |
| |
| 2 | | Letters to Shareholders |
| 4 | | Performance Summary |
| 4 | | Management Discussion |
| 6 | | Long-Term Fund Performance |
| 8 | | Supplemental Information |
| 9 | | Schedule of Investments |
| 11 | | Financial Statements |
| 13 | | Notes to Financial Statements |
| 21 | | Financial Highlights |
| 22 | | Auditor’s Report |
| 23 | | Fund Expenses |
| 24 | | Approval of Investment Advisory and Sub-Advisory Agreements |
| T-1 | | Trustees and Officers |
Letters to Shareholders

Philip Taylor
Dear Shareholders:
Enclosed is important information about your Fund and its performance. I encourage you to read this report to learn more about your Fund’s short- and long-term performance and its holdings as of the close of the reporting period. This report also includes useful information about your Fund’s management team and a discussion of how your Fund was managed during the reporting period.
Investors are likely to confront both opportunities and challenges in 2012 – just as we did in 2011. After all, changes in market sentiment never do investors the courtesy of announcing their impending arrival, and your goals and needs may have changed, requiring changes in your financial strategy.
That’s why the start of a new year is always a good time to catch up with your financial adviser. He or she can explain how your investments performed in the year just ended – how each performed individually, and more important, how they performed as a diversified portfolio. Of course, it’s important to remember that an investment’s long-term performance is more important than its short-term performance. Looking ahead to the new year and evaluating your individual situation, your financial adviser can provide valuable insight into whether your investments are still appropriate for your individual needs, goals and risk tolerance.
For current information about your Fund
In addition to meeting with your financial adviser to discuss your individual situation at the start of the new year, you also may find it helpful to stay abreast of market trends and developments. Doing so may provide reassurance in times of economic uncertainty and market volatility such as we saw in 2011 – and are likely to see again in 2012.
Invesco can help you stay informed about your investments and market trends. On our website, invesco.com/us, we provide timely market updates and commentary from many of our fund managers and other investment professionals. Also on our website, you can obtain information about your account at any hour of the day or night. I invite you to visit and explore the tools and information we offer at invesco.com/us.
Our commitment to investment excellence
As we’ve seen over the last several years, market conditions can change – often suddenly and dramatically. That’s one reason financial advisers typically advise their clients to be well diversified and to maintain a long-term investment focus. While diversification can’t guarantee a profit or protect against loss, it may cushion the impact of dramatic market moves. Maintaining a long-term investment focus for your long-term goals – financing your retirement or your children’s education, for example – may help you avoid making rash investment decisions based on short-term market swings.
Likewise, Invesco’s investment professionals maintain a long-term focus. Across our broad array of investment products, investment excellence is our ultimate goal. Each of our funds is managed by specialized teams of investment professionals, and as a company, we maintain a single focus – investment management – that allows our fund managers to concentrate on doing what they do best: managing your money.
Our funds are managed strictly according to their stated investment objectives and strategies, with robust risk oversight using consistent, repeatable investment processes that don’t change in response to short-term market events. This disciplined approach can’t guarantee a profit; no investment can do that, since all involve some measure of risk. But it can ensure that your money is managed the way we said it would be – according to your Fund’s objective and strategies.
Our adherence to stated investment objectives and strategies allows your financial adviser to build a diversified portfolio that meets your individual risk tolerance and financial goals. It also means that when your goals change, your financial adviser will be able to find an Invesco fund that’s appropriate for your needs.
Questions?
If you have questions about your account, please contact one of our client service representatives at 800 959 4246. If you have a general Invesco-related question or comment for me, I invite you to email me directly at phil@invesco.com.
All of us at Invesco look forward to serving your investment management needs for many years to come. Thank you for investing with us.
Sincerely,
Philip Taylor
Senior Managing Director, Invesco Ltd.
| 2 | | Invesco Global Health Care Fund |

Bruce Crockett
Dear Fellow Shareholders:
Although the world’s economies are gradually recovering from the financial crisis, it has not been a smooth path. Unrest in the Middle East, persistently weak job and housing markets in the U.S. and continued government balance sheet repair in Europe are contributing to a slow, labored march toward global recovery.
In this environment, investors face risks that could make it more difficult to achieve their long-term financial goals – a secure retirement, home ownership, a child’s college education. Although the markets are complex and dynamic, there are ways to simplify the process and potentially increase your odds of achieving your goals. The best approach is to create a solid financial plan that helps you save and invest in ways that anticipate your needs over the long term.
Your financial adviser can help you define your financial plan, develop an appropriate investment strategy and put you in a better position to achieve your financial goals over the long term. This can take some of the guesswork out of the process and help you make thoughtful investments. Your financial adviser also can help you better understand your tolerance for risk, so that your investment approach lets you sleep at night while getting you closer to your goals. Lastly, your financial adviser can develop an asset allocation strategy that seeks to balance your investment approach, providing some protection against a decline in the markets while allowing you to participate in rising markets. Invesco calls this type of approach “intentional investing.” It means thinking carefully, planning thoughtfully and acting deliberately.
While no investment can guarantee favorable returns, your Board remains committed to managing costs and enhancing the performance of Invesco’s funds as part of our Investor First orientation. We continue to oversee the funds with the same strong sense of responsibility for your money and your continued trust that we’ve always maintained.
Thanks to the approval of our fund shareholders, Invesco has made great progress in realigning our U.S. mutual fund product line following our acquisition of Morgan Stanley’s retail asset management business, including Van Kampen Investments. When completed, the realignment will reduce overlap in the product lineup, enhance efficiency across our product line and build a solid foundation for further growth to meet client and shareholder needs. I would like to thank those of you who voted your proxy, and I hope our shareholders haven’t been too inconvenienced by the process.
As always, please contact me at bruce@brucecrockett.com with any questions or concerns you may have. On behalf of your Board, we look forward to continuing to represent your interests and serving your needs.
Sincerely,
Bruce L. Crockett
Independent Chair
Invesco Funds Board of Trustees
| 3 | | Invesco Global Health Care Fund |
Management’s Discussion of Fund Performance
Performance summary
For the fiscal year ended October 31, 2011, Invesco Global Health Care Fund’s investment results compared favorably to the broad market, as measured by the MSCI World Index, but underperformed its style-specific benchmark, the MSCI World Health Care Index. The Fund’s relative results were largely attributable to holdings in the pharmaceuticals sector, which underperformed the benchmark. The Fund’s biotechnology holdings and cash position also detracted from relative results. Health care equipment and managed health care stocks made the largest contribution to results on a relative and absolute basis.
Your Fund’s long-term performance appears later in this report.
Fund vs. Indexes
Total returns, 10/31/10 to 10/31/11, at net asset value (NAV). Performance shown does not include applicable contingent deferred sales charges (CDSC) or front-end sales charges, which would have reduced performance.
| | | | | |
| Class A Shares* | | | 6.12 | % |
| |
| Class B Shares* | | | 5.30 | |
| |
| Class C Shares* | | | 5.30 | |
| |
| Class Y Shares* | | | 6.39 | |
| |
| Investor Class Shares* | | | 6.12 | |
| |
MSCI World Index▼ (Broad Market Index) | | | 1.76 | |
| |
MSCI World Health Care Index▼ (Style-Specific Index) | | | 8.05 | |
| |
Lipper Global Health/Biotechnology Funds Index▼ (Peer Group Index) | | | 5.91 | |
| |
| | |
| * | | Performance includes litigation proceeds. Had these proceeds not been received, total returns would have been lower. |
How we invest
We seek health care stocks of all market capitalizations from around the world that we believe are attractively priced and have the potential to benefit from long-term earnings and cash flow growth.
In selecting securities for the Fund, we first screen the global investment universe. Stocks of at least $200 million in market capitalization are considered for further evaluation if they are identified as having attractive growth prospects relative to their current valuations. We use a research-oriented, bottom-up investment approach, focusing on company fundamentals in an effort to uncover future growth prospects that are not yet appreciated by the market.
In analyzing specific industries for possible investment, we ordinarily look for several of the following characteristics: above-average growth and demand; scientific and medical advances; below-average reimbursement risk; and high barriers to entry.
In analyzing specific companies for possible investment, we ordinarily look for several of the following characteristics: leading companies with defensible franchises; companies in the midst of a new product cycle; value-added and/or niche-oriented products and/or services; potentially
sustainable revenue growth; potential to expand profit margins and improve profitability; superior earnings-per-share growth; strong balance sheet and moderate financial leverage; and a capable management team.
Stock selection is then further refined by valuation analysis. In general, we target stocks trading at compelling valuations based upon one or more of the following parameters: price-to-earnings (P/E) ratio; P/E ratio versus expected earnings-per-share growth rate; enterprise value to earnings before interest, taxes, depreciation and amortization (EBITDA); discounted cash flow analysis; and sum of parts analysis.
The resulting target portfolio consists of 50–80 individual securities with exposure across most subsectors of health care and diversified by region. Additionally, position size is limited in an effort to maximize risk-adjusted returns.
We may consider selling a security when:
| n | | A stock’s price reaches its valuation target. |
| |
| n | | A company’s fundamentals deteriorate. |
| |
| n | | A company no longer meets our investment criteria. |
Market conditions and your Fund
The fiscal year began with equity markets on an upward trend through the first quarter of 2011, but thereafter, volatility drastically increased due to civil unrest in Egypt and Libya and the devastating earthquake and tsunami in Japan. Corporate earnings were largely positive, but often overshadowed by investor concerns about continuing high unemployment, a lack of consumer spending and soft housing data. At the same time, the sovereign debt crisis intensified in the eurozone and growth in developed economies decelerated, weighing on investors and prompting fears of a global recession and a “double-dip” recession in the U.S. During the reporting period, the U.S. received the first-ever downgrade to its credit rating from Standard & Poor’s, beginning a precipitous slide that continued for much of the latter three months of the fiscal year.
Despite the volatility, major domestic equity indexes managed positive returns for the fiscal year, and the MSCI World index managed to produce a single-digit gain. The energy sector had the highest return in the index, followed by the consumer staples and health care sectors, while the financials, utilities and materials sectors sustained losses.
The largest contributor to the Fund’s performance during the reporting period was Pharmasset, a biotechnology
Portfolio Composition
By sector
| | | | | |
| Health Care | | | 83.5 | % |
| |
| Consumer Staples | | | 3.6 | |
| |
| Financials | | | 0.8 | |
| |
| Industrials | | | 0.7 | |
| |
Money Market Funds
Plus Other Assets Less Liabilities | | | 11.4 | |
| | |
| Total Net Assets | | $1.1 billion |
| | | |
| Total Number of Holdings* | | 63 |
Top 10 Equity Holdings*
| | | | | | | | | |
| | | | | | | | | |
| |
| | 1. | | | Gilead Sciences, Inc. | | | 4.0 | % |
| |
| | 2. | | | Roche Holding AG | | | 4.0 | |
| |
| | 3. | | | Thermo Fisher Scientific, Inc. | | | 3.6 | |
| |
| | 4. | | | CVS Caremark Corp. | | | 3.0 | |
| |
| | 5. | | | BioMarin Pharmaceutical Inc. | | | 2.8 | |
| |
| | 6. | | | WellPoint Inc. | | | 2.8 | |
| |
| | 7. | | | Aetna, Inc. | | | 2.7 | |
| |
| | 8. | | | McKesson Corp. | | | 2.7 | |
| |
| | 9. | | | Abbott Laboratories | | | 2.6 | |
| |
| | 10. | | | Novartis AG-ADR | | | 2.6 | |
The Fund’s holdings are subject to change, and there is no assurance that the Fund will continue to hold any particular security.
*Excluding money market fund holdings.
| 4 | | Invesco Global Health Care Fund |
company whose primary focus is the development of oral therapeutics for the treatment of hepatitis C. The company does not have any products currently on the market; however, a number of its experimental stage oral treatments have produced encouraging results and helped increase the company’s stock price. In the third quarter of 2011, the FDA granted “fast track” designation to one of the company’s antiviral drug candidates, PSI-938, which may expedite development and speed up a possible review. In September 2011, Pharmasset released promising data on the ability of one of its other drugs to suppress hepatitis C infections. Both events sent the stock price of the company’s shares higher.
Biogen Idec was another contributor to Fund performance during the fiscal year. The company develops and markets therapeutics in the areas of neurology, immunology, hemophilia and oncology. In recent years, the company embarked on a restructuring initiative to cut costs and focus on its unique expertise in developing treatments for multiple sclerosis. The company has delivered better-than-expected revenue growth due largely to its newest multiple sclerosis (MS) drug, Tysabri. During the reporting period, Biogen Idec released strong positive results in its phase three clinical trial of experimental MS drug BG-12, increasing the likelihood of FDA approval. Shares of the company rose sharply following the announcement.
Hospira, which manufactures generic injectable pharmaceuticals and medication-management devices, was the largest detractor from Fund performance. The company faced headwinds related to quality issues with its North Carolina manufacturing facilities. Hospira is addressing these issues, but it has proven costlier than anticipated and depressed earnings in the short term. We eliminated our position in the company during the reporting period.
Another detractor from Fund performance during the reporting period was Teva Pharmaceutical Industries, the world’s largest generic drug maker. Teva also operates in the branded drug market; its stock’s weak performance was partly attributable to concerns about the 2013 patent expiration of its largest branded drug, Copaxone. Teva stock was also negatively affected when the company reported that its multiple sclerosis drug, Laquinimod, failed to meet a critical goal for reducing relapse rates in its phase three trial. Overall, we
felt the market overreacted to these issues, and we used the opportunity to increase our investment in the company.
The Fund held derivative instruments in the form of currency futures contracts to hedge our European currency exposure. The net cumulative effect of these derivative contracts was positive for overall Fund performance during the fiscal year.
We continued to focus on companies with new product cycles, less reimbursement risk and less competition. Relative to the MSCI World Health Care Index, we maintained a significant underweight position in large-cap pharmaceuticals because many firms face looming patent expirations with limited drug pipelines, which may result in modest (if any) earnings growth.
We continue to emphasize specialty pharmaceuticals and biotechnology stocks based on their generally robust in line portfolios, compelling pipelines and the view that many of these companies could be targets of ongoing consolidation. The Fund is primarily invested in U.S. stocks, where we have found more companies that fit our fundamental selection criteria. The international allocation is focused mainly on European large-cap pharmaceuticals, which have fewer patent expiration concerns than their U.S. counterparts.
As always, we thank you for your continued investment in Invesco Global Health Care Fund.
The views and opinions expressed in management’s discussion of Fund performance are those of Invesco Advisers, Inc. These views and opinions are subject to change at any time based on factors such as market and economic conditions. These views and opinions may not be relied upon as investment advice or recommendations, or as an offer for a particular security. The information is not a complete analysis of every aspect of any market, country, industry, security or the Fund. Statements of fact are from sources considered reliable, but Invesco Advisers, Inc. makes no representation or warranty as to their completeness or accuracy. Although historical performance is no guarantee of future results, these insights may help you understand our investment management philosophy.
See important Fund and, if applicable, index disclosures later in this report.
Derek Taner
Chartered Financial Analyst, portfolio manager, is lead manager of Invesco Global Health Care Fund. Mr. Taner joined Invesco in 2005. He earned a B.S. in business administration with an emphasis in accounting and an M.B.A. from the Haas School of Business at the University of California (Berkeley).
Dean Dillard
Chartered Financial Analyst, portfolio manager, is manager of Invesco Global Health Care Fund. He joined Invesco in 2000. Mr. Dillard earned a B.S. in corporate finance from the University of Alabama and an M.B.A. from the Owen School of Business at Vanderbilt University.
| 5 | | Invesco Global Health Care Fund |
Your Fund’s Long-Term Performance
Results of a $10,000 Investment – Oldest Share Class since Inception
Index data from 7/31/89, Fund data from 8/7/89
Past performance cannot guarantee comparable future results.
The data shown in the chart include reinvested distributions, applicable sales charges and Fund expenses including management fees. Index results include reinvested dividends, but they do not reflect sales charges. Performance of the peer group, if applicable, reflects fund expenses and management fees; performance of a market index does not.
Performance shown in the chart and table(s) does not reflect deduction of taxes a shareholder would pay on Fund distributions or sale of Fund shares.
This chart, which is a logarithmic chart, presents the fluctuations in the value of the Fund and its indexes. We believe that a logarithmic chart is more effective than other types of charts in illustrating changes in value during the early years shown in the chart. The vertical axis, the
one that indicates the dollar value of an investment, is constructed with each segment representing a percent change in the value of the investment. In this chart, each segment represents a doubling, or 100% change, in the value of the investment. In other words, the space between $5,000 and $10,000 is the same size as the space between $10,000 and $20,000, and so on.
| 6 | | Invesco Global Health Care Fund |
| | | | |
| |
| Average Annual Total Returns |
| As of 10/31/11, including maximum applicable sales charges |
| | | | | |
Class A Shares | | | | |
| |
| Inception (8/7/89) | | | 9.59 | % |
| |
| 10 Years | | | 2.69 | |
| |
| 5 Years | | | 1.00 | |
| |
| 1 Year | | | 0.29 | |
| |
| | | | | |
Class B Shares | | | | |
| |
| Inception (4/1/93) | | | 9.62 | % |
| |
| 10 Years | | | 2.74 | |
| |
| 5 Years | | | 1.07 | |
| |
| 1 Year | | | 0.30 | |
| |
| | | | | |
Class C Shares | | | | |
| |
| Inception (3/1/99) | | | 5.64 | % |
| |
| 10 Years | | | 2.59 | |
| |
| 5 Years | | | 1.38 | |
| |
| 1 Year | | | 4.30 | |
| |
| | | | | |
Class Y Shares | | | | |
| |
| 10 Years | | | 3.35 | % |
| |
| 5 Years | | | 2.30 | |
| |
| 1 Year | | | 6.39 | |
| |
| | | | | |
Investor Class Shares | | | | |
| |
| 10 Years | | | 3.28 | % |
| |
| 5 Years | | | 2.15 | |
| |
| 1 Year | | | 6.12 | |
| |
Performance includes litigation proceeds. Had these proceeds not been received, total returns would have been lower.
Class Y shares incepted on October 3, 2008. Performance shown prior to that date is that of Class A shares and includes the 12b-1 fees applicable to Class A shares. Class A share performance reflects any applicable fee waivers or expense reimbursements.
Investor Class shares incepted on July 15, 2005. Performance shown prior to that date is that of Class A shares and includes the 12b-1 fees applicable to Class A shares. Class A share performance reflects any applicable fee waivers or expense reimbursements.
The performance data quoted represent past performance and cannot guarantee comparable future results; current performance may be lower or higher. Please visit invesco.com/performance for the most recent month-end performance. Performance figures reflect reinvested distributions, changes in net asset value and the effect of the maximum sales charge unless otherwise stated.
| | | | |
| |
| Average Annual Total Returns |
| As of 9/30/11, the most recent calendar quarter-end, including maximum applicable sales charges |
| | | | | |
Class A Shares | | | | |
| |
| Inception (8/7/89) | | | 9.36 | % |
| |
| 10 Years | | | 1.97 | |
| |
| 5 Years | | | 0.17 | |
| |
| 1 Year | | | -2.77 | |
| |
| | | | | |
Class B Shares | | | | |
| |
| Inception (4/1/93) | | | 9.35 | % |
| |
| 10 Years | | | 2.02 | |
| |
| 5 Years | | | 0.24 | |
| |
| 1 Year | | | -2.87 | |
| |
| | | | | |
Class C Shares | | | | |
| |
| Inception (3/1/99) | | | 5.23 | % |
| |
| 10 Years | | | 1.87 | |
| |
| 5 Years | | | 0.55 | |
| |
| 1 Year | | | 1.13 | |
| |
| | | | | |
Class Y Shares | | | | |
| |
| 10 Years | | | 2.62 | % |
| |
| 5 Years | | | 1.46 | |
| |
| 1 Year | | | 3.16 | |
| |
| | | | | |
Investor Class Shares | | | | |
| |
| 10 Years | | | 2.55 | % |
| |
| 5 Years | | | 1.31 | |
| |
| 1 Year | | | 2.90 | |
| |
Performance includes litigation proceeds. Had these proceeds not been received, total returns would have been lower.
Investment return and principal value will fluctuate so that you may have a gain or loss when you sell shares.
The total annual Fund operating expense ratio set forth in the most recent Fund prospectus as of the date of this report for Class A, Class B, Class C, Class Y and Investor Class shares was 1.23%, 1.98%, 1.98%, 0.98% and 1.23%, respectively. The expense ratios presented above may vary from the expense ratios presented in other sections of this report that are based on expenses incurred during the period covered by this report.
Class A share performance reflects the maximum 5.50% sales charge, and Class B and Class C share performance reflects the applicable contingent deferred sales charge (CDSC) for the period involved. The CDSC on Class B shares declines from 5% beginning at the time of purchase to 0% at the beginning of the seventh year. The CDSC on Class C shares is 1% for the first year after purchase. Class Y
shares and Investor Class shares do not have a front-end sales charge or a CDSC; therefore, performance is at net asset value.
The performance of the Fund’s share classes will differ primarily due to different sales charge structures and class expenses.
A redemption fee of 2% is imposed on certain redemptions or exchanges out of the Fund within 31 days of purchase. Exceptions to the redemption fee are listed in the Fund’s prospectus. Effective January 1, 2012, after the close of the reporting period, the Fund will eliminate the redemption fee, if applicable, assessed on shares of the Fund redeemed or exchanged within 31 days of purchase.
| 7 | | Invesco Global Health Care Fund |
Invesco Global Health Care Fund’s investment objective is long-term growth of capital.
| n | | Unless otherwise stated, information presented in this report is as of October 31, 2011, and is based on total net assets. |
| |
| n | | Unless otherwise noted, all data provided by Invesco. |
| |
| n | | To access your Fund’s reports/prospectus, visit invesco.com/fundreports. |
About share classes
| n | | Class B shares may not be purchased or acquired by exchange from share classes other than Class B shares. Please see the prospectus for more information. |
| |
| n | | Class Y shares are available to only certain investors. Please see the prospectus for more information. |
| |
| n | | All Investor Class shares are closed to new investors. Contact your financial adviser about purchasing our other share classes. |
Principal risks of investing in the Fund
| n | | Developing markets securities risk. Securities issued by foreign companies and governments located in developing countries may be affected more negatively by inflation, devaluation of their currencies, higher transaction costs, delays in settlement, adverse political developments, the introduction of capital controls, withholding taxes, nationalization of private assets, expropriation, social unrest, war or lack of timely information than those in developed countries. |
| |
| n | | Foreign securities risk. The Fund’s foreign investments may be affected by changes in a foreign country’s exchange rates; political and social instability; changes in economic or taxation policies; difficulties when enforcing obligations; decreased liquidity; and increased volatility. Foreign companies may be subject to less regulation resulting in less publicly available information about the companies. |
| |
| n | | Health care sector risk. The Fund’s performance is vulnerable to factors affecting the health care industry, including government regulation, obsolescence caused by scientific advances and technological innovations. |
| |
| n | | Management risk. The investment techniques and risk analysis used by the Fund’s portfolio managers may not produce the desired results. |
| n | | Market risk. The prices of and the income generated by the Fund’s securities may decline in response to, among other things, investor sentiment; general economic and market conditions; regional or global instability; and currency and interest rate fluctuations. |
| |
| n | | Synthetic securities risk. Fluctuations in the values of synthetic instruments may not correlate perfectly with the instruments they are designed to replicate. Some synthetic instruments are more sensitive to interest rate changes and market price fluctuations than others. These instruments may be subject to counterparty risk and liquidity risk. |
About indexes used in this report
| n | | The MSCI World IndexSM is an unmanaged index considered representative of stocks of developed countries. |
| |
| n | | The MSCI World Health Care Index is an unmanaged index considered representative of health care stocks of developed countries. |
| |
| n | | The Lipper Global Health/Biotechnology Funds Index is an unmanaged index considered representative of global health/biotechnology funds tracked by Lipper. |
| |
| n | | The Fund is not managed to track the performance of any particular index, including the index(es) defined here, and consequently, the performance of the Fund may deviate significantly from the performance of the index(es). |
| |
| n | | A direct investment cannot be made in an index. Unless otherwise indicated, index results include reinvested dividends, and they do not reflect sales charges. Performance of the peer group, if applicable, reflects fund expenses; performance of a market index does not. |
Other information
| n | | The Chartered Financial Analyst® (CFA®) designation is globally recognized and attests to a charterholder’s success in a rigorous and comprehensive study program in the field of investment management and research analysis. |
| |
| n | | The returns shown in management’s discussion of Fund performance are based on net asset values calculated for shareholder transactions. Generally accepted accounting principles require adjustments to be made to the net assets of the Fund at period end for financial reporting purposes, and as such, the net asset values for shareholder transactions and the returns based on those net asset values may differ from the net asset values and returns reported in the Financial Highlights. |
| |
| n | | Industry classifications used in this report are generally according to the Global Industry Classification Standard, which was developed by and is the exclusive property and a service mark of MSCI Inc. and Standard & Poor’s. |
This report must be accompanied or preceded by a currently effective Fund prospectus, which contains more complete information, including sales charges and expenses. Investors should read it carefully before investing.
NOT FDIC INSURED | MAY LOSE VALUE | NO BANK GUARANTEE
Fund Nasdaq Symbols
| | |
| Class A Shares | | GGHCX |
| Class B Shares | | GTHBX |
| Class C Shares | | GTHCX |
| Class Y Shares | | GGHYX |
| Investor Class Shares | | GTHIX |
| 8 | | Invesco Global Health Care Fund |
Schedule of Investments(a)
October 31, 2011
| | | | | | | | | |
| | | Shares | | Value |
| |
Common Stocks & Other Equity Interests–88.59%
|
Biotechnology–16.50%
| | | | |
Actelion Ltd. (Switzerland)(b) | | | 98,223 | | | $ | 3,632,561 | |
| |
Amarin Corp. PLC–ADR (United Kingdom)(b)(c) | | | 1,713,980 | | | | 16,111,412 | |
| |
Biogen Idec Inc.(b) | | | 168,135 | | | | 19,564,189 | |
| |
BioMarin Pharmaceutical Inc.(b) | | | 869,682 | | | | 29,664,853 | |
| |
Celgene Corp.(b) | | | 262,499 | | | | 17,017,810 | |
| |
Evolutionary Genomics/GenoPlex, Inc. (Acquired 09/15/97-06/25/98; Cost $408,490)(b)(d)(e) | | | 109,377 | | | | 0 | |
| |
Gilead Sciences, Inc.(b) | | | 1,002,841 | | | | 41,778,356 | |
| |
Incyte Corp.(b) | | | 1,021,255 | | | | 14,062,681 | |
| |
Onyx Pharmaceuticals, Inc.(b) | | | 292,049 | | | | 11,953,566 | |
| |
Pharmasset, Inc.(b) | | | 137,533 | | | | 9,682,323 | |
| |
United Therapeutics Corp.(b) | | | 239,132 | | | | 10,457,243 | |
| |
| | | | | | | | 173,924,994 | |
| |
Drug Retail–3.55%
| | | | |
| CVS Caremark Corp. | | | 867,445 | | | | 31,488,254 | |
| |
| Drogasil S.A. (Brazil) | | | 945,978 | | | | 5,960,262 | |
| |
| | | | | | | | 37,448,516 | |
| |
Health Care Distributors–2.65%
| | | | |
| McKesson Corp. | | | 341,947 | | | | 27,885,778 | |
| |
Health Care Equipment–10.53%
| | | | |
| Baxter International Inc. | | | 470,834 | | | | 25,886,453 | |
| |
CareFusion Corp.(b) | | | 455,068 | | | | 11,649,741 | |
| |
| Covidien PLC (Ireland) | | | 541,220 | | | | 25,458,989 | |
| |
Hologic, Inc.(b) | | | 1,004,464 | | | | 16,191,960 | |
| |
MAKO Surgical Corp.(b) | | | 286,346 | | | | 11,010,004 | |
| |
| Olympus Corp. (Japan) | | | 717,200 | | | | 10,924,618 | |
| |
Sensys Medical, Inc. (Acquired 04/23/04-8/09/06; Cost $1,302)(b)(d)(e) | | | 8,750 | | | | 0 | |
| |
Wright Medical Group, Inc.(b) | | | 576,659 | | | | 9,912,768 | |
| |
| | | | | | | | 111,034,533 | |
| |
Health Care Facilities–3.09%
| | | | |
| Assisted Living Concepts Inc.–Class A | | | 451,122 | | | | 6,410,443 | |
| |
| Rhoen-Klinikum AG (Germany) | | | 736,803 | | | | 14,686,793 | |
| |
| Universal Health Services, Inc.–Class B | | | 288,172 | | | | 11,518,235 | |
| |
| | | | | | | | 32,615,471 | |
| |
Health Care Services–6.12%
| | | | |
DaVita, Inc.(b) | | | 336,932 | | | | 23,585,240 | |
| |
Express Scripts, Inc.(b) | | | 293,621 | | | | 13,427,288 | |
| |
Medco Health Solutions, Inc.(b) | | | 180,918 | | | | 9,925,161 | |
| |
| Quest Diagnostics Inc. | | | 314,661 | | | | 17,558,084 | |
| |
| | | | | | | | 64,495,773 | |
| |
Health Care Supplies–0.56%
| | | | |
| Meridian Bioscience, Inc. | | | 322,542 | | | | 5,876,715 | |
| |
Health Care Technology–3.46%
| | | | |
Allscripts Healthcare Solutions, Inc.(b) | | | 996,067 | | | | 19,074,683 | |
| |
Cerner Corp.(b) | | | 274,332 | | | | 17,400,879 | |
| |
| | | | | | | | 36,475,562 | |
| |
Life Sciences Tools & Services–5.24%
| | | | |
Life Technologies Corp.(b) | | | 413,924 | | | | 16,834,289 | |
| |
Thermo Fisher Scientific, Inc.(b) | | | 763,252 | | | | 38,368,678 | |
| |
| | | | | | | | 55,202,967 | |
| |
Managed Health Care–15.25%
| | | | |
| Aetna, Inc. | | | 705,047 | | | | 28,032,669 | |
| |
AMERIGROUP Corp.(b) | | | 179,518 | | | | 9,986,586 | |
| |
Amil Participacoes S.A. (Brazil)(d) | | | 859,600 | | | | 8,707,728 | |
| |
Aveta, Inc. (Acquired 12/21/05; Cost $10,877,598)(b)(d) | | | 805,748 | | | | 7,251,732 | |
| |
| CIGNA Corp. | | | 354,408 | | | | 15,714,451 | |
| |
Health Net Inc.(b) | | | 540,246 | | | | 15,013,436 | |
| |
| Humana Inc. | | | 237,009 | | | | 20,119,694 | |
| |
| UnitedHealth Group, Inc. | | | 548,225 | | | | 26,309,318 | |
| |
| WellPoint Inc. | | | 429,917 | | | | 29,621,281 | |
| |
| | | | | | | | 160,756,895 | |
| |
Pharmaceuticals–20.95%
| | | | |
| Abbott Laboratories | | | 514,629 | | | | 27,723,064 | |
| |
| Bayer AG (Germany) | | | 252,899 | | | | 16,129,864 | |
| |
EastPharma Ltd.–GDR (Turkey)(b) | | | 674,841 | | | | 809,809 | |
| |
Elan Corp. PLC–ADR (Ireland)(b) | | | 816,734 | | | | 9,792,641 | |
| |
| Hikma Pharmaceuticals PLC (United Kingdom) | | | 853,628 | | | | 9,231,205 | |
| |
| Ipsen S.A. (France) | | | 243,491 | | | | 8,021,166 | |
| |
Locus Pharmaceuticals, Inc. (Acquired 11/21/00-05/09/07; Cost $6,852,940)(b)(d) | | | 258,824 | | | | 0 | |
| |
MAP Pharmaceuticals Inc.(b) | | | 363,417 | | | | 5,371,303 | |
| |
| Medicis Pharmaceutical Corp.–Class A | | | 404,685 | | | | 15,495,389 | |
| |
| Nippon Shinyaku Co., Ltd. (Japan) | | | 834,000 | | | | 9,719,003 | |
| |
| Novartis AG–ADR (Switzerland) | | | 476,844 | | | | 26,927,381 | |
| |
Pharmstandard–GDR (Russia)(b)(d) | | | 138,700 | | | | 2,457,657 | |
| |
| Roche Holding AG (Switzerland) | | | 253,085 | | | | 41,612,875 | |
| |
| Shire PLC–ADR (Ireland) | | | 111,017 | | | | 10,468,903 | |
| |
| Teva Pharmaceutical Industries Ltd.–ADR (Israel) | | | 650,020 | | | | 26,553,317 | |
| |
Warner Chilcott PLC–Class A (Ireland)(b) | | | 576,402 | | | | 10,444,404 | |
| |
| | | | | | | | 220,757,981 | |
| |
| | | | | | | | | |
| | | | | | | | | |
See accompanying Notes to Financial Statements which are an integral part of the financial statements.
9 Invesco Global Health Care Fund
| | | | | | | | | |
| | | Shares | | Value |
| |
Research & Consulting Services–0.69%
| | | | |
Qualicorp S.A. (Brazil)(b) | | | 791,200 | | | $ | 7,235,489 | |
| |
| Total Common Stocks & Other Equity Interests (Cost $758,115,379) | | | | | | | 933,710,674 | |
| |
Preferred Stocks–0.00%
|
Health Care Equipment–0.00%
| | | | |
Intact Medical Corp., Series C, Pfd. (Acquired 03/26/01; Cost $2,000,001)(b)(d)(e) | | | 2,439,026 | | | | 0 | |
| |
Sensys Medical, Inc.,
Series A-2, Pfd. (Acquired 02/25/98-9/30/05; Cost $7,627,993)(b)(d)(e) | | | 2,173,209 | | | | 0 | |
| |
Series B, Conv. Pfd. (Acquired 03/16/05-1/12/07; Cost $245,305)(b)(d)(e) | | | 282,004 | | | | 0 | |
| |
| Total Preferred Stocks (Cost $9,873,299) | | | | | | | 0 | |
| |
| | | | | | | | | |
| | | Shares | | Value |
| |
Money Market Funds–12.33%
|
Liquid Assets Portfolio–Institutional Class(f) | | | 65,014,912 | | | $ | 65,014,912 | |
| |
Premier Portfolio–Institutional Class(f) | | | 65,014,911 | | | | 65,014,911 | |
| |
Total Money Market Funds
(Cost $130,029,823) | | | | | | | 130,029,823 | |
| |
TOTAL INVESTMENTS–100.92%
(Cost $898,018,501) | | | | | | | 1,063,740,497 | |
| |
| OTHER ASSETS LESS LIABILITIES–(0.92)% | | | | | | | (9,747,003 | ) |
| |
| NET ASSETS–100.00% | | | | | | $ | 1,053,993,494 | |
| |
Investment Abbreviations:
| | | |
| ADR | | – American Depositary Receipts |
| Conv. | | – Convertible |
| GDR | | – Global Depositary Receipts |
| Pfd. | | – Preferred |
Notes to Schedule of Investments:
| | |
| (a) | | Industry and/or sector classifications used in this report are generally according to the Global Industry Classification Standard, which was developed by and is the exclusive property and a service mark of MSCI Inc. and Standard & Poor’s. |
| (b) | | Non-income producing security. |
| (c) | | Affiliated company during the period. The Investment Company Act of 1940 defines affiliates as those issuances in which a fund holds 5% or more of the outstanding voting securities. The Fund has not owned enough of the outstanding voting securities of the issuer to have control (as defined in the Investment Company Act of 1940) of that issuer. The value of this security as of October 31, 2011 represented 1.53% of the Fund’s Net Assets. See Note 5. |
| (d) | | Security purchased or received in a transaction exempt from registration under the Securities Act of 1933, as amended. The security may be resold pursuant to an exemption from registration under the 1933 Act, typically to qualified institutional buyers. The aggregate value of these securities at October 31, 2011 was $19,226,926, which represented 1.82% of the Fund’s Net Assets. |
| (e) | | Security is considered venture capital. See Note 1I. |
| (f) | | The money market fund and the Fund are affiliated by having the same investment adviser. |
See accompanying Notes to Financial Statements which are an integral part of the financial statements.
10 Invesco Global Health Care Fund
Statement of Assets and Liabilities
October 31, 2011
| | | | | |
Assets:
|
| Investments, at value (Cost $744,523,358) | | $ | 917,599,262 | |
| |
| Investments in affiliates, at value (Cost $153,495,143) | | | 146,141,235 | |
| |
| Total investments, at value (Cost $898,018,501) | | | 1,063,740,497 | |
| |
| Receivable for: | | | | |
| Investments sold | | | 32,848,681 | |
| |
| Fund shares sold | | | 254,041 | |
| |
| Dividends | | | 1,526,229 | |
| |
| Foreign currency contracts outstanding | | | 3,168,630 | |
| |
| Investment for trustee deferred compensation and retirement plans | | | 113,364 | |
| |
| Other assets | | | 32,154 | |
| |
| Total assets | | | 1,101,683,596 | |
| |
Liabilities:
|
| Payable for: | | | | |
| Investments purchased | | | 45,227,870 | |
| |
| Fund shares reacquired | | | 1,033,924 | |
| |
| Amount due custodian | | | 33,762 | |
| |
| Amount due custodian — foreign (Cost $158) | | | 130,378 | |
| |
| Accrued fees to affiliates | | | 714,416 | |
| |
| Accrued other operating expenses | | | 288,838 | |
| |
| Trustee deferred compensation and retirement plans | | | 260,914 | |
| |
| Total liabilities | | | 47,690,102 | |
| |
| Net assets applicable to shares outstanding | | $ | 1,053,993,494 | |
| |
Net assets consist of:
|
| Shares of beneficial interest | | $ | 867,434,265 | |
| |
| Undistributed net investment income (loss) | | | 4,778,432 | |
| |
| Undistributed net realized gain | | | 13,080,514 | |
| |
| Unrealized appreciation | | | 168,700,283 | |
| |
| | | $ | 1,053,993,494 | |
| |
Net Assets:
|
| Class A | | $ | 540,450,991 | |
| |
| Class B | | $ | 29,063,811 | |
| |
| Class C | | $ | 32,702,148 | |
| |
| Class Y | | $ | 5,627,504 | |
| |
| Investor Class | | $ | 446,149,040 | |
| |
Shares outstanding, $0.01 par value per share, with an unlimited number of shares authorized:
|
| Class A | | | 19,473,848 | |
| |
| Class B | | | 1,250,578 | |
| |
| Class C | | | 1,405,759 | |
| |
| Class Y | | | 201,254 | |
| |
| Investor Class | | | 16,072,686 | |
| |
| Class A: | | | | |
| Net asset value per share | | $ | 27.75 | |
| |
| Maximum offering price per share | | | | |
(Net asset value of $27.75 ¸ 94.50%) | | $ | 29.37 | |
| |
| Class B: | | | | |
| Net asset value and offering price per share | | $ | 23.24 | |
| |
| Class C: | | | | |
| Net asset value and offering price per share | | $ | 23.26 | |
| |
| Class Y: | | | | |
| Net asset value and offering price per share | | $ | 27.96 | |
| |
| Investor Class: | | | | |
| Net asset value and offering price per share | | $ | 27.76 | |
| |
See accompanying Notes to Financial Statements which are an integral part of the financial statements.
11 Invesco Global Health Care Fund
Statement of Operations
For the year ended October 31, 2011
| | | | | |
Investment income:
|
| Dividends (net of foreign withholding taxes of $768,302) | | $ | 11,247,131 | |
| |
| Dividends from affiliates (includes securities lending income of $316,273) | | | 367,829 | |
| |
| Total investment income | | | 11,614,960 | |
| |
Expenses:
|
| Advisory fees | | | 6,802,505 | |
| |
| Administrative services fees | | | 280,559 | |
| |
| Custodian fees | | | 100,659 | |
| |
| Distribution fees: | | | | |
| Class A | | | 1,263,205 | |
| |
| Class B | | | 313,290 | |
| |
| Class C | | | 292,980 | |
| |
| Investor Class | | | 1,186,230 | |
| |
| Transfer agent fees | | | 2,457,009 | |
| |
| Trustees’ and officers’ fees and benefits | | | 49,997 | |
| |
| Other | | | 310,032 | |
| |
| Total expenses | | | 13,056,466 | |
| |
| Less: Fees waived, expenses reimbursed and expense offset arrangement(s) | | | (77,143 | ) |
| |
| Net expenses | | | 12,979,323 | |
| |
| Net investment income (loss) | | | (1,364,363 | ) |
| |
Realized and unrealized gain (loss) from:
|
| Net realized gain (loss) from: | | | | |
| Investment securities | | | 68,033,395 | |
| |
| Foreign currencies | | | (191,604 | ) |
| |
| Foreign currency contracts | | | (6,914,221 | ) |
| |
| | | | 60,927,570 | |
| |
| Change in net unrealized appreciation (depreciation) of: | | | | |
| Investment securities | | | (24,294,762 | ) |
| |
| Foreign currencies | | | (214,047 | ) |
| |
| Foreign currency contracts | | | 5,045,121 | |
| |
| | | | (19,463,688 | ) |
| |
| Net realized and unrealized gain | | | 41,463,882 | |
| |
| Net increase in net assets resulting from operations | | $ | 40,099,519 | |
| |
See accompanying Notes to Financial Statements which are an integral part of the financial statements.
12 Invesco Global Health Care Fund
Statement of Changes in Net Assets
For the years ended October 31, 2011 and 2010
| | | | | | | | | |
| | | 2011 | | 2010 |
| |
Operations:
|
| Net investment income (loss) | | $ | (1,364,363 | ) | | $ | (3,290,324 | ) |
| |
| Net realized gain | | | 60,927,570 | | | | 47,572,677 | |
| |
| Change in net unrealized appreciation (depreciation) | | | (19,463,688 | ) | | | 72,998,480 | |
| |
| Net increase in net assets resulting from operations | | | 40,099,519 | | | | 117,280,833 | |
| |
Share transactions–net:
|
| Class A | | | 89,991,058 | | | | (38,675,478 | ) |
| |
| Class B | | | (2,172,218 | ) | | | (22,445,384 | ) |
| |
| Class C | | | 8,524,053 | | | | (3,134,504 | ) |
| |
| Class Y | | | 778,506 | | | | 1,718,962 | |
| |
| Investor Class | | | (49,369,278 | ) | | | (49,631,996 | ) |
| |
| Net increase (decrease) in net assets resulting from share transactions | | | 47,752,121 | | | | (112,168,400 | ) |
| |
| Net increase in net assets | | | 87,851,640 | | | | 5,112,433 | |
| |
Net assets:
|
| Beginning of year | | | 966,141,854 | | | | 961,029,421 | |
| |
| End of year (includes undistributed net investment income (loss) of $4,778,432 and $(208,884), respectively) | | $ | 1,053,993,494 | | | $ | 966,141,854 | |
| |
Notes to Financial Statements
October 31, 2011
NOTE 1—Significant Accounting Policies
Invesco Global Health Care Fund (the “Fund”) is a series portfolio of AIM Investment Funds (Invesco Investment Funds) (the “Trust”). The Trust is organized as a Delaware statutory trust and is registered under the Investment Company Act of 1940, as amended (the “1940 Act”), as an open-end series management investment company consisting of thirteen separate series portfolios, each authorized to issue an unlimited number of shares of beneficial interest. The assets, liabilities and operations of each portfolio are accounted for separately. Information presented in these financial statements pertains only to the Fund. Matters affecting each portfolio or class will be voted on exclusively by the shareholders of such portfolio or class.
The Fund’s investment objective is long-term growth of capital.
The Fund currently consists of five different classes of shares: Class A, Class B, Class C, Class Y and Investor Class. Investor Class shares of the Fund are offered only to certain grandfathered investors. Class A shares are sold with a front-end sales charge unless certain waiver criteria are met and under certain circumstances load waiver shares may be subject to contingent deferred sales charges (“CDSC”). Class C shares are sold with a CDSC. Class Y and Investor Class shares are sold at net asset value. Effective November 30, 2010, new or additional investments in Class B shares are no longer permitted. Existing shareholders of Class B shares may continue to reinvest dividends and capital gains distributions in Class B shares until they convert. Also, shareholders in Class B shares will be able to exchange those shares for Class B shares of other Invesco Funds offering such shares until they convert. Generally, Class B shares will automatically convert to Class A shares on or about the month-end which is at least eight years after the date of purchase. Redemption of Class B shares prior to conversion date will be subject to a CDSC.
The following is a summary of the significant accounting policies followed by the Fund in the preparation of its financial statements.
| | |
| A. | | Security Valuations — Securities, including restricted securities, are valued according to the following policy. |
| | A security listed or traded on an exchange (except convertible bonds) is valued at its last sales price or official closing price as of the close of the customary trading session on the exchange where the security is principally traded, or lacking any sales or official closing price on a particular day, the security may be valued at the closing bid price on that day. Securities traded in the over-the-counter market are valued based on prices furnished by independent pricing services or market makers. When such securities are valued by an independent pricing service they may be considered fair valued. Futures contracts are valued at the final settlement price set by an exchange on which they are principally traded. Listed options are valued at the mean between the last bid and ask prices from the exchange on which they are principally traded. Options not listed on an exchange are valued by an independent source at the mean between the last bid and ask prices. For purposes of determining net asset value per share, futures and option contracts generally are valued 15 minutes after the close of the customary trading session of the New York Stock Exchange (“NYSE”). |
| | Investments in open-end and closed-end registered investment companies that do not trade on an exchange are valued at the end of day net asset value per share. Investments in open-end and closed-end registered investment companies that trade on an exchange are valued at the last sales price or official closing price as of the close of the customary trading session on the exchange where the security is principally traded. |
13 Invesco Global Health Care Fund
| | |
| | Debt obligations (including convertible bonds) and unlisted equities are fair valued using an evaluated quote provided by an independent pricing service. Evaluated quotes provided by the pricing service may be determined without exclusive reliance on quoted prices, and may reflect appropriate factors such as institution-size trading in similar groups of securities, developments related to specific securities, dividend rate, yield, quality, type of issue, coupon rate, maturity, individual trading characteristics and other market data. Debt securities are subject to interest rate and credit risks. In addition, all debt securities involve some risk of default with respect to interest and/or principal payments. |
| | Foreign securities (including foreign exchange contracts) are converted into U.S. dollar amounts using the applicable exchange rates as of the close of the NYSE. If market quotations are available and reliable for foreign exchange traded equity securities, the securities will be valued at the market quotations. Because trading hours for certain foreign securities end before the close of the NYSE, closing market quotations may become unreliable. If between the time trading ends on a particular security and the close of the customary trading session on the NYSE, events occur that are significant and make the closing price unreliable, the Fund may fair value the security. If the event is likely to have affected the closing price of the security, the security will be valued at fair value in good faith using procedures approved by the Board of Trustees. Adjustments to closing prices to reflect fair value may also be based on a screening process of an independent pricing service to indicate the degree of certainty, based on historical data, that the closing price in the principal market where a foreign security trade is not the current value as of the close of the NYSE. Foreign securities meeting the approved degree of certainty that the price is not reflective of current value will be priced at the indication of fair value from the independent pricing service. Multiple factors may be considered by the independent pricing service in determining adjustments to reflect fair value and may include information relating to sector indices, American Depositary Receipts and domestic and foreign index futures. Foreign securities may have additional risks including exchange rate changes, potential for sharply devalued currencies and high inflation, political and economical upheaval, the relative lack of issuer information, relatively low market liquidity and the potential lack of strict financial and accounting controls and standards. |
| | Securities for which market prices are not provided by any of the above methods may be valued based upon quotes furnished by independent sources. The last bid price may be used to value equity securities. The mean between the last bid and asked prices is used to value debt obligations, including Corporate Loans. |
| | Securities for which market quotations are not readily available or are unreliable are valued at fair value as determined in good faith by or under the supervision of the Trust’s officers following procedures approved by the Board of Trustees. Issuer specific events, market trends, bid/ask quotes of brokers and information providers and other market data may be reviewed in the course of making a good faith determination of a security’s fair value. |
| | Valuations change in response to many factors including the historical and prospective earnings of the issuer, the value of the issuer’s assets, general economic conditions, interest rates, investor perceptions and market liquidity. Because of the inherent uncertainties of valuation, the values reflected in the financial statements may materially differ from the value received upon actual sale of those investments. |
| B. | | Securities Transactions and Investment Income — Securities transactions are accounted for on a trade date basis. Realized gains or losses on sales are computed on the basis of specific identification of the securities sold. Interest income is recorded on the accrual basis from settlement date. Dividend income (net of withholding tax, if any) is recorded on the ex-dividend date. |
| | The Fund may periodically participate in litigation related to Fund investments. As such, the Fund may receive proceeds from litigation settlements. Any proceeds received are included in the Statement of Operations as realized gain (loss) for investments no longer held and as unrealized gain (loss) for investments still held. |
| | Brokerage commissions and mark ups are considered transaction costs and are recorded as an increase to the cost basis of securities purchased and/or a reduction of proceeds on a sale of securities. Such transaction costs are included in the determination of net realized and unrealized gain (loss) from investment securities reported in the Statement of Operations and the Statement of Changes in Net Assets and the net realized and unrealized gains (losses) on securities per share in the Financial Highlights. Transaction costs are included in the calculation of the Fund’s net asset value and, accordingly, they reduce the Fund’s total returns. These transaction costs are not considered operating expenses and are not reflected in net investment income reported in the Statement of Operations and Statement of Changes in Net Assets, or the net investment income per share and ratios of expenses and net investment income reported in the Financial Highlights, nor are they limited by any expense limitation arrangements between the Fund and the investment adviser. |
| | The Fund allocates income and realized and unrealized capital gains and losses to a class based on the relative net assets of each class. |
| C. | | Country Determination — For the purposes of making investment selection decisions and presentation in the Schedule of Investments, the investment adviser may determine the country in which an issuer is located and/or credit risk exposure based on various factors. These factors include the laws of the country under which the issuer is organized, where the issuer maintains a principal office, the country in which the issuer derives 50% or more of its total revenues and the country that has the primary market for the issuer’s securities, as well as other criteria. Among the other criteria that may be evaluated for making this determination are the country in which the issuer maintains 50% or more of its assets, the type of security, financial guarantees and enhancements, the nature of the collateral and the sponsor organization. Country of issuer and/or credit risk exposure has been determined to be the United States of America, unless otherwise noted. |
| D. | | Distributions — Distributions from income and net realized capital gain, if any, are generally paid annually and recorded on ex-dividend date. The Fund may elect to treat a portion of the proceeds from redemptions as distributions for federal income tax purposes. |
| E. | | Federal Income Taxes — The Fund intends to comply with the requirements of Subchapter M of the Internal Revenue Code necessary to qualify as a regulated investment company and to distribute substantially all of the Fund’s taxable earnings to shareholders. As such, the Fund will not be subject to federal income taxes on otherwise taxable income (including net realized capital gain) that is distributed to shareholders. Therefore, no provision for federal income taxes is recorded in the financial statements. |
| | The Fund files tax returns in the U.S. Federal jurisdiction and certain other jurisdictions. Generally, the Fund is subject to examinations by such taxing authorities for up to three years after the filing of the return for the tax period. |
| F. | | Expenses — Fees provided for under the Rule 12b-1 plan of a particular class of the Fund and which are directly attributable to that class are charged to the operations of such class. All other expenses are allocated among the classes based on relative net assets. |
14 Invesco Global Health Care Fund
| | |
| G. | | Accounting Estimates — The preparation of financial statements in conformity with accounting principles generally accepted in the United States of America (“GAAP”) requires management to make estimates and assumptions that affect the reported amounts of assets and liabilities at the date of the financial statements and the reported amounts of revenues and expenses during the reporting period including estimates and assumptions related to taxation. Actual results could differ from those estimates by a significant amount. In addition, the Fund monitors for material events or transactions that may occur or become known after the period-end date and before the date the financial statements are released to print. |
| H. | | Indemnifications — Under the Trust’s organizational documents, each Trustee, officer, employee or other agent of the Trust is indemnified against certain liabilities that may arise out of performance of their duties to the Fund. Additionally, in the normal course of business, the Fund enters into contracts, including the Fund’s servicing agreements that contain a variety of indemnification clauses. The Fund’s maximum exposure under these arrangements is unknown as this would involve future claims that may be made against the Fund that have not yet occurred. The risk of material loss as a result of such indemnification claims is considered remote. |
| I. | | Other Risks — The Fund may invest a large percentage of assets in securities of a limited number of companies, such that each investment may have a greater effect on the Fund’s overall performance, and any change in the value of those securities could significantly affect the value of your investment in the Fund. |
| | The Fund has invested in non-publicly traded companies, some of which are in the startup or development stages. These investments are inherently risky, as the market for the technologies or products these companies are developing are typically in the early stages and may never materialize. The Fund could lose its entire investment in these companies. These investments are valued at fair value as determined in good faith in accordance with procedures approved by the Board of Trustees. Investments in privately held venture capital securities are illiquid. |
| J. | | Redemption Fees — The Fund has a 2% redemption fee that is to be retained by the Fund to offset transaction costs and other expenses associated with short-term redemptions and exchanges. The fee, subject to certain exceptions, is imposed on certain redemptions or exchanges of shares within 31 days of purchase. The redemption fee is recorded as an increase in shareholder capital and is allocated among the share classes based on the relative net assets of each class. Effective January 1, 2012, the Fund will eliminate the 2% redemption fee, if applicable, assessed on shares of the Fund redeemed or exchanged within 31 days of purchase. |
| K. | | Securities Lending — The Fund may lend portfolio securities having a market value up to one-third of the Fund’s total assets. Such loans are secured by collateral equal to no less than the market value of the loaned securities determined daily by the securities lending provider. Such collateral will be cash or debt securities issued or guaranteed by the U.S. Government or any of its sponsored agencies. Cash collateral received in connection with these loans is invested in short-term money market instruments or affiliated money market funds and is shown as such on the Schedule of Investments. It is the Fund’s policy to obtain additional collateral from or return excess collateral to the borrower by the end of the next business day, following the valuation date of the securities loaned. Therefore, the value of the collateral held may be temporarily less than the value of the securities on loan. Lending securities entails a risk of loss to the Fund if and to the extent that the market value of the securities loaned were to increase and the borrower did not increase the collateral accordingly, and the borrower fails to return the securities. Upon the failure of the borrower to return the securities, collateral may be liquidated and the securities may be purchased on the open market to replace the loaned securities. The Fund could experience delays and costs in gaining access to the collateral. The Fund bears the risk of any deficiency in the amount of the collateral available for return to the borrower due to any loss on the collateral invested. Dividends received on cash collateral investments for securities lending transactions, which are net of compensation to counterparties, is included in Dividends from affiliates on the Statement of Operations. The aggregate value of securities out on loan is shown as a footnote on the Statement of Assets and Liabilities, if any. |
| L. | | Foreign Currency Translations — Foreign currency is valued at the close of the NYSE based on quotations posted by banks and major currency dealers. Portfolio securities and other assets and liabilities denominated in foreign currencies are translated into U.S. dollar amounts at date of valuation. Purchases and sales of portfolio securities (net of foreign taxes withheld on disposition) and income items denominated in foreign currencies are translated into U.S. dollar amounts on the respective dates of such transactions. The Fund does not separately account for the portion of the results of operations resulting from changes in foreign exchange rates on investments and the fluctuations arising from changes in market prices of securities held. The combined results of changes in foreign exchange rates and the fluctuation of market prices on investments (net of estimated foreign tax withholding) are included with the net realized and unrealized gain or loss from investments in the Statement of Operations. Reported net realized foreign currency gains or losses arise from (1) sales of foreign currencies, (2) currency gains or losses realized between the trade and settlement dates on securities transactions, and (3) the difference between the amounts of dividends, interest, and foreign withholding taxes recorded on the Fund’s books and the U.S. dollar equivalent of the amounts actually received or paid. Net unrealized foreign currency gains and losses arise from changes in the fair values of assets and liabilities, other than investments in securities at fiscal period end, resulting from changes in exchange rates. |
| | The Fund may invest in foreign securities which may be subject to foreign taxes on income, gains on investments or currency repatriation, a portion of which may be recoverable. |
| M. | | Foreign Currency Contracts — The Fund may enter into foreign currency contracts to manage or minimize currency or exchange rate risk. The Fund may also enter into foreign currency contracts for the purchase or sale of a security denominated in a foreign currency in order to “lock in” the U.S. dollar price of that security. A foreign currency contract is an obligation to purchase or sell a specific currency for an agreed-upon price at a future date. The use of foreign currency contracts does not eliminate fluctuations in the price of the underlying securities the Fund owns or intends to acquire but establishes a rate of exchange in advance. Fluctuations in the value of these contracts are measured by the difference in the contract date and reporting date exchange rates and are recorded as unrealized appreciation (depreciation) until the contracts are closed. When the contracts are closed, realized gains (losses) are recorded. Realized and unrealized gains (losses) on the contracts are included in the Statement of Operations. The primary risks associated with foreign currency contracts include failure of the counterparty to meet the terms of the contract and the value of the foreign currency changing unfavorably. These risks may be in excess of the amounts reflected in the Statement of Assets and Liabilities. |
15 Invesco Global Health Care Fund
NOTE 2—Advisory Fees and Other Fees Paid to Affiliates
The Trust has entered into a master investment advisory agreement with Invesco Advisers, Inc. (the “Adviser” or “Invesco”). Under the terms of the investment advisory agreement, the Fund pays an advisory fee to the Adviser based on the annual rate of the Fund’s average daily net assets as follows:
| | | | | |
| Average Net Assets | | Rate |
| |
| First $350 million | | | 0 | .75% |
| |
| Next $350 million | | | 0 | .65% |
| |
| Next $1.3 billion | | | 0 | .55% |
| |
| Next $2 billion | | | 0 | .45% |
| |
| Next $2 billion | | | 0 | .40% |
| |
| Next $2 billion | | | 0 | .375% |
| |
| Over $8 billion | | | 0 | .35% |
| |
Under the terms of a master sub-advisory agreement between the Adviser and each of Invesco Asset Management Deutschland GmbH, Invesco Asset Management Limited, Invesco Asset Management (Japan) Limited, Invesco Australia Limited, Invesco Hong Kong Limited, Invesco Senior Secured Management, Inc. and Invesco Canada Ltd. (collectively, the “Affiliated Sub-Advisers”) the Adviser, not the Fund, may pay 40% of the fees paid to the Adviser to any such Affiliated Sub-Adviser(s) that provide discretionary investment management services to the Fund based on the percentage of assets allocated to such Sub-Adviser(s).
Effective May 23, 2011, the Adviser has contractually agreed, through at least June 30, 2013, to waive advisory fees and/or reimburse expenses to the extent necessary to limit total annual operating expenses (excluding certain items discussed below) of Class A, Class B, Class C, Class Y and Investor Class shares to 1.65%, 2.40%, 2.40%, 1.40% and 1.65% of average daily net assets, respectively. Prior to May 23, 2011, the Adviser had contractually agreed to waive fees and/or reimburse expenses to the extent necessary to limit total annual fund operating expenses (excluding certain items discussed below) of Class A, Class B, Class C, Class Y and Investor Class shares to 2.00%, 2.75%, 2.75%, 1.75% and 2.00% of average daily net assets, respectively. In determining the Adviser’s obligation to waive advisory fees and/or reimburse expenses, the following expenses are not taken into account, and could cause total annual operating expenses after fee waiver and/or expense reimbursement to exceed the numbers reflected above: (1) interest; (2) taxes; (3) dividend expense on short sales; (4) extraordinary or non-routine items; and (5) expenses that the Fund has incurred but did not actually pay because of an expense offset arrangement. Unless the Board of the Trustees and Invesco mutually agree to amend or continue the fee waiver agreement, it will terminate on June 30, 2013. The Adviser did not waive fees for reimbursed expenses during the period under this expense limitation.
The Adviser has contractually agreed, through at least June 30, 2012, to waive the advisory fee payable by the Fund in an amount equal to 100% of the net advisory fees the Adviser receives from the affiliated money market funds on investments by the Fund of uninvested cash (excluding investments of cash collateral from securities lending) in such affiliated money market funds.
For the year ended October 31, 2011, the Adviser waived advisory fees of $67,298.
At the request of the Trustees of the Trust, Invesco Ltd. agreed to reimburse expenses incurred by the Fund in connection with market timing matters in the Invesco Funds, which may include legal, audit, shareholder reporting, communications and trustee expenses. These expenses along with the related expense reimbursement are included in the Statement of Operations. For the year ended October 31, 2011, Invesco Ltd. reimbursed expenses of the Fund in the amount of $4,062.
The Trust has entered into a master administrative services agreement with Invesco pursuant to which the Fund has agreed to pay Invesco for certain administrative costs incurred in providing accounting services to the Fund. For the year ended October 31, 2011, expenses incurred under the agreement are shown in the Statement of Operations as administrative services fees.
The Trust has entered into a transfer agency and service agreement with Invesco Investment Services, Inc. (“IIS”) pursuant to which the Fund has agreed to pay IIS a fee for providing transfer agency and shareholder services to the Fund and reimburse IIS for certain expenses incurred by IIS in the course of providing such services. IIS may make payments to intermediaries that provide omnibus account services, sub-accounting services and/or networking services. All fees payable by IIS to intermediaries that provide omnibus account services or sub-accounting are charged back to the Fund, subject to certain limitations approved by the Trust’s Board of Trustees. For the year ended October 31, 2011, the expenses incurred under the agreement are shown in the Statement of Operations as transfer agent fees.
The Trust has entered into master distribution agreements with Invesco Distributors, Inc. (“IDI”) to serve as the distributor for the Class A, Class B, Class C, Class Y and Investor Class shares of the Fund. The Trust has adopted plans pursuant to Rule 12b-1 under the 1940 Act with respect to the Fund’s Class A, Class B, Class C and Investor Class shares (collectively the “Plans”). The Fund, pursuant to the Plans, pays IDI compensation at the annual rate of 0.25% of the Fund’s average daily net assets of Class A shares, 1.00% of the average daily net assets of Class B and Class C shares and 0.25% of the average daily net assets of Investor Class shares. Of the Plan payments, up to 0.25% of the average daily net assets of each class of shares may be paid to furnish continuing personal shareholder services to customers who purchase and own shares of such classes. Any amounts not paid as a service fee under the Plans would constitute an asset-based sales charge. Rules of the Financial Industry Regulatory Authority (“FINRA”) impose a cap on the total sales charges, including asset-based sales charges that may be paid by any class of shares of the Fund. For the year ended October 31, 2011, expenses incurred under the Plans are shown in the Statement of Operations as distribution fees.
Front-end sales commissions and CDSC (collectively the “sales charges”) are not recorded as expenses of the Fund. Front-end sales commissions are deducted from proceeds from the sales of Fund shares prior to investment in Class A shares of the Fund. CDSC are deducted from redemption proceeds prior to remittance to the shareholder. During the year ended October 31, 2011, IDI advised the Fund that IDI retained $33,890 in front-end sales commissions from the sale of Class A shares and $3,464, $40,805 and $2,433 from Class A, Class B and Class C shares, respectively, for CDSC imposed on redemptions by shareholders.
16 Invesco Global Health Care Fund
Certain officers and trustees of the Trust are officers and directors of the Adviser, Invesco Ltd., IIS and/or IDI.
NOTE 3—Additional Valuation Information
GAAP defines fair value as the price that would be received to sell an asset or paid to transfer a liability in an orderly transaction between market participants at the measurement date, under current market conditions. GAAP establishes a hierarchy that prioritizes the inputs to valuation methods giving the highest priority to readily available unadjusted quoted prices in an active market for identical assets (Level 1) and the lowest priority to significant unobservable inputs (Level 3) generally when market prices are not readily available or are unreliable. Based on the valuation inputs, the securities or other investments are tiered into one of three levels. Changes in valuation methods may result in transfers in or out of an investment’s assigned level:
| | |
| | Level 1 — | Prices are determined using quoted prices in an active market for identical assets. |
| | Level 2 — | Prices are determined using other significant observable inputs. Observable inputs are inputs that other market participants may use in pricing a security. These may include quoted prices for similar securities, interest rates, prepayment speeds, credit risk, yield curves, loss severities, default rates, discount rates, volatilities and others. |
| | Level 3 — | Prices are determined using significant unobservable inputs. In situations where quoted prices or observable inputs are unavailable (for example, when there is little or no market activity for an investment at the end of the period), unobservable inputs may be used. Unobservable inputs reflect the Fund’s own assumptions about the factors market participants would use in determining fair value of the securities or instruments and would be based on the best available information. |
The following is a summary of the tiered valuation input levels, as of October 31, 2011. The level assigned to the securities valuations may not be an indication of the risk or liquidity associated with investing in those securities. Because of the inherent uncertainties of valuation, the values reflected in the financial statements may materially differ from the value received upon actual sale of those investments.
During the year ended October 31, 2011, there were no significant transfers between investment levels.
| | | | | | | | | | | | | | | | | |
| | | Level 1 | | Level 2 | | Level 3 | | Total |
| |
| Equity Securities | | $ | 940,073,022 | | | $ | 123,667,475 | | | $ | 0 | | | $ | 1,063,740,497 | |
| |
| Foreign Currency Contracts* | | | — | | | | 3,168,630 | | | | — | | | | 3,168,630 | |
| |
| Total Investments | | $ | 940,073,022 | | | $ | 126,836,105 | | | $ | 0 | | | $ | 1,066,909,127 | |
| |
| |
| * | Unrealized appreciation. |
NOTE 4—Derivative Investments
The Fund has implemented the required disclosures about derivative instruments and hedging activities in accordance with GAAP. This disclosure is intended to improve financial reporting about derivative instruments and hedging activities by requiring enhanced disclosures to enable investors to better understand their effects on an entity’s financial position and financial performance. The enhanced disclosure has no impact on the results of operations reported in the financial statements.
Value of Derivative Instruments at Period-End
The table below summarizes the value of the Fund’s derivative instruments, detailed by primary risk exposure, held as of October 31, 2011:
| | | | | | | | | |
| | | Value |
| Risk Exposure/Derivative Type | | Assets | | Liabilities |
| |
| Currency risk | | | | | | | | |
Foreign Currency Contracts(a) | | $ | 3,168,630 | | | $ | — | |
| |
| | |
| (a) | | Values are disclosed on the Statement of Assets and Liabilities under Foreign currency contracts outstanding. |
Effect of Derivative Instruments for the year ended October 31, 2011
The table below summarizes the gains (losses) on derivative instruments, detailed by primary risk exposure, recognized in earnings during the period:
| | | | | |
| | | Location of Gain (Loss) on
|
| | | Statement of Operations |
| | | Foreign Currency Contracts* |
| |
| Realized Gain (Loss) | | | | |
| Currency risk | | $ | (6,914,221 | ) |
| |
| Change in Unrealized Appreciation | | | | |
| Currency risk | | | 5,045,121 | |
| |
| Total | | $ | (1,869,100 | ) |
| |
| |
| * | The average notional value of foreign currency contracts outstanding during the period was $40,615,554. |
17 Invesco Global Health Care Fund
| | | | | | | | | | | | | | | | | | | | | | | |
| Open Foreign Currency Contracts |
Settlement
| | | | Contract to | | Notional
| | Unrealized
|
| Date | | Counterparty | | Deliver | | Receive | | Value | | Appreciation |
| |
| 11/14/11 | | Citibank Capital | | CHF | | | 16,800,000 | | | USD | | | 21,862,190 | | | $ | 19,144,061 | | | $ | 2,718,129 | |
| |
| 11/14/11 | | Citibank Capital | | EUR | | | 15,500,000 | | | USD | | | 21,894,835 | | | | 21,444,334 | | | | 450,501 | |
| |
| Total open foreign currency contracts | | | | | | | | | | | | | | | | $ | 40,588,395 | | | $ | 3,168,630 | |
| |
| | | |
| Currency Abbreviations: |
| CHF | | – Swiss Franc |
| EUR | | – Euro |
| USD | | – U.S. Dollar |
NOTE 5—Investments in Other Affiliates
The Investment Company Act of 1940 defines affiliates as those issuances in which a fund holds 5% or more of the outstanding voting securities. The Fund has not owned enough of the outstanding voting securities of the issuer to have control (as defined in the Investment Company Act of 1940) of that issuer. The following is a summary of the investments in affiliates for the year ended October 31, 2011.
| | | | | | | | | | | | | | | | | | | | | | | | | | | | | |
| | | | | | | | | Change in
| | | | | | |
| | | | | | | | | Unrealized
| | | | | | |
| | | Value
| | Purchases
| | Proceeds
| | Appreciation
| | Realized
| | Value
| | Dividend
|
| | | 10/31/10 | | at Cost | | from Sales | | (Depreciation) | | Gain | | 10/31/11 | | Income |
| |
| | | | | | | | | | | | | | | | | | | | | | | | | | | | | |
| Amarin Corp. PLC | | $ | — | | | $ | 23,465,320 | | | $ | — | | | $ | (7,353,908 | ) | | $ | — | | | $ | 16,111,412 | | | $ | — | |
| |
NOTE 6—Expense Offset Arrangement(s)
The expense offset arrangement is comprised of transfer agency credits which result from balances in Demand Deposit Accounts (DDA) used by the transfer agent for clearing shareholder transactions. For the year ended October 31, 2011, the Fund received credits from this arrangement, which resulted in the reduction of the Fund’s total expenses of $5,783.
NOTE 7—Trustees’ and Officers’ Fees and Benefits
“Trustees’ and Officers’ Fees and Benefits” include amounts accrued by the Fund to pay remuneration to certain Trustees and Officers of the Fund. Trustees have the option to defer compensation payable by the Fund, and “Trustees’ and Officers’ Fees and Benefits” also include amounts accrued by the Fund to fund such deferred compensation amounts. Those Trustees who defer compensation have the option to select various Invesco Funds in which their deferral accounts shall be deemed to be invested. Finally, certain current Trustees are eligible to participate in a retirement plan that provides for benefits to be paid upon retirement to Trustees over a period of time based on the number of years of service. The Fund may have certain former Trustees who also participate in a retirement plan and receive benefits under such plan. “Trustees’ and Officers’ Fees and Benefits” include amounts accrued by the Fund to fund such retirement benefits. Obligations under the deferred compensation and retirement plans represent unsecured claims against the general assets of the Fund.
During the year ended October 31, 2011, the Fund paid legal fees of $3,119 for services rendered by Kramer, Levin, Naftalis & Frankel LLP as counsel to the Independent Trustees. A partner of that firm is a Trustee of the Trust.
NOTE 8—Cash Balances
The Fund is permitted to temporarily carry a negative or overdrawn balance in its account with The State Street Bank and Trust Company, the custodian bank. To compensate the custodian bank for such overdrafts, the overdrawn Fund may either (1) leave funds as a compensating balance in the account so the custodian bank can be compensated by earning the additional interest; or (2) compensate by paying the custodian bank at a rate agreed upon by the custodian bank and Invesco, not to exceed the contractually agreed upon rate.
18 Invesco Global Health Care Fund
NOTE 9—Distributions to Shareholders and Tax Components of Net Assets
There were no ordinary income or long term gain distributions during the years ended October 31, 2011 and 2010.
Tax Components of Net Assets at Period-End:
| | | | | |
| | | 2011 |
| |
| Undistributed ordinary income | | $ | 5,061,466 | |
| |
| Undistributed long-term gain | | | 18,273,879 | |
| |
| Net unrealized appreciation — investments | | | 163,697,261 | |
| |
| Net unrealized appreciation (depreciation) — other investments | | | (190,343 | ) |
| |
| Temporary book/tax differences | | | (283,034 | ) |
| |
| Shares of beneficial interest | | | 867,434,265 | |
| |
| Total net assets | | $ | 1,053,993,494 | |
| |
The difference between book-basis and tax-basis unrealized appreciation is due to differences in the timing of recognition of gains and losses on investments for tax and book purposes. The Fund’s net unrealized appreciation difference is attributable primarily to wash sales.
The temporary book/tax differences are a result of timing differences between book and tax recognition of income and/or expenses. The Fund’s temporary book/tax differences are the result of the trustee deferral of compensation and retirement plan benefits.
Capital loss carryforward is calculated and reported as of a specific date. Results of transactions and other activity after that date may affect the amount of capital loss carryforward actually available for the Fund to utilize. The ability to utilize capital loss carryforward in the future may be limited under the Internal Revenue Code and related regulations based on the results of future transactions.
The Fund utilized $30,877,772 of capital loss carryforward in the current period to offset net realized capital gain for federal income tax purposes. The Fund does not have a capital loss carryforward as of October 31, 2011.
NOTE 10—Investment Securities
The aggregate amount of investment securities (other than short-term securities, U.S. Treasury obligations and money market funds, if any) purchased and sold by the Fund during the year ended October 31, 2011 was $347,705,658 and $474,188,347, respectively. Cost of investments on a tax basis includes the adjustments for financial reporting purposes as of the most recently completed Federal income tax reporting period-end.
| | | | | |
| Unrealized Appreciation (Depreciation) of Investment Securities on a Tax Basis |
| |
| Aggregate unrealized appreciation of investment securities | | $ | 216,209,529 | |
| |
| Aggregate unrealized (depreciation) of investment securities | | | (52,512,268 | ) |
| |
| Net unrealized appreciation of investment securities | | $ | 163,697,261 | |
| |
| Cost of investments for tax purposes is $900,043,236. |
NOTE 11—Reclassification of Permanent Differences
Primarily as a result of differing book/tax treatment of foreign currency transactions and merger expenses, on October 31, 2011, undistributed net investment income (loss) was increased by $6,424,294, undistributed net realized gain was decreased by $6,394,296 and shares of beneficial interest were decreased by $29,998. Further, as a result of tax deferrals acquired in the reorganization of Invesco Health Sciences Fund into the Fund, undistributed net investment income (loss) was decreased by $72,615, undistributed net realized gain was decreased by $868,894 and shares of beneficial interest were increased by $941,509. These reclassifications had no effect on the net assets of the Fund.
19 Invesco Global Health Care Fund
NOTE 12—Share Information
| | | | | | | | | | | | | | | | | |
| | | Summary of Share Activity |
| |
| | | Year ended October 31, |
| | | 2011(a) | | 2010 |
| | | Shares | | Amount | | Shares | | Amount |
| |
| Sold: | | | | | | | | | | | | | | | | |
| Class A | | | 1,634,064 | | | $ | 47,335,868 | | | | 1,068,716 | | | $ | 27,148,852 | |
| |
| Class B | | | 52,617 | | | | 1,264,176 | | | | 109,901 | | | | 2,370,622 | |
| |
| Class C | | | 326,613 | | | | 8,255,735 | | | | 167,617 | | | | 3,622,529 | |
| |
| Class Y | | | 75,726 | | | | 2,151,877 | | | | 109,397 | | | | 2,873,823 | |
| |
| Investor Class | | | 394,903 | | | | 11,397,577 | | | | 393,729 | | | | 10,009,522 | |
| |
| Automatic conversion of Class B shares to Class A shares: | | | | | | | | | | | | | | | | |
| Class A | | | 387,138 | | | | 11,042,267 | | | | 646,989 | | | | 16,456,516 | |
| |
| Class B | | | (460,746 | ) | | | (11,042,267 | ) | | | (763,432 | ) | | | (16,456,516 | ) |
| |
Issued in connection with acquisitions:(b) | | | | | | | | | | | | | | | | |
| Class A | | | 4,120,800 | | | | 128,948,848 | | | | — | | | | — | |
| |
| Class B | | | 559,533 | | | | 14,707,052 | | | | — | | | | — | |
| |
| Class C | | | 301,647 | | | | 7,937,279 | | | | — | | | | — | |
| |
| Class Y | | | 16,184 | | | | 509,567 | | | | — | | | | — | |
| |
Reacquired:(c) | | | | | | | | | | | | | | | | |
| Class A | | | (3,470,569 | ) | | | (97,335,925 | ) | | | (3,265,442 | ) | | | (82,280,846 | ) |
| |
| Class B | | | (299,822 | ) | | | (7,101,179 | ) | | | (391,023 | ) | | | (8,359,490 | ) |
| |
| Class C | | | (326,798 | ) | | | (7,668,961 | ) | | | (318,781 | ) | | | (6,757,033 | ) |
| |
| Class Y | | | (67,012 | ) | | | (1,882,938 | ) | | | (46,150 | ) | | | (1,154,861 | ) |
| |
| Investor Class | | | (2,169,430 | ) | | | (60,766,855 | ) | | | (2,358,499 | ) | | | (59,641,518 | ) |
| |
| Net increase (decrease) in share activity | | | 1,074,848 | | | $ | 47,752,121 | | | | (4,646,978 | ) | | $ | (112,168,400 | ) |
| |
| | |
| (a) | | There are entities that are record owners of more than 5% of the outstanding shares of the Fund and in the aggregate own 16% of the outstanding shares of the Fund. IDI has an agreement with these entities to sell Fund shares. The Fund, Invesco and/or Invesco affiliates may make payments to these entities, which are considered to be related to the Fund, for providing services to the Fund, Invesco and/or Invesco affiliates including but not limited to services such as securities brokerage, distribution, third party record keeping and account servicing. The Fund has no knowledge as to whether all or any portion of the shares owned of record by these entities are also owned beneficially. |
| (b) | | As of the open of business on May 23, 2011 the Fund acquired all the net assets of Invesco Health Sciences Fund pursuant to a plan of reorganization approved by the Trustees of the Fund on November 10, 2010 and by the shareholders of Invesco Health Sciences Fund on April 14, 2011. The acquisition was accomplished by a tax-free exchange of 4,998,164 shares of the Fund for 11,756,779 shares outstanding of Invesco Health Sciences Fund as of the close of business on May 20, 2011. Each class of Invesco Health Sciences Fund was exchanged for the like class of shares of the Fund based on the relative net asset value of Invesco Health Sciences Fund to the net asset value of the Fund at the close of business on May 20, 2011. Invesco Health Sciences Fund’s net assets at that date of $152,102,746, including $30,700,417 of unrealized appreciation, were combined with those of the Fund. The net assets of the Fund immediately before and after the acquisition were $1,090,486,862 and $1,242,589,608, respectively. |
| (c) | | Net of redemption fees of $33,488 and $10,407 allocated among the classes based on relative net assets of each class for the years ended October 31, 2011 and 2010, respectively. |
20 Invesco Global Health Care Fund
NOTE 13—Financial Highlights
The following schedule presents financial highlights for a share of the Fund outstanding throughout the periods indicated.
| | | | | | | | | | | | | | | | | | | | | | | | | | | | | | | | | | | | | | | | | | | | | | | | | |
| | | | | | | | | | | | | | | | | | | Ratio of
| | Ratio of
| | | | |
| | | | | | | | | | | | | | | | | | | expenses
| | expenses
| | | | |
| | | | | | | Net gains
| | | | | | | | | | | | to average
| | to average net
| | Ratio of net
| | |
| | | Net asset
| | Net
| | (losses) on
| | | | Distributions
| | | | | | | | net assets
| | assets without
| | investment
| | |
| | | value,
| | investment
| | securities (both
| | Total from
| | from net
| | Net asset
| | | | Net assets,
| | with fee waivers
| | fee waivers
| | income (loss)
| | |
| | | beginning
| | income
| | realized and
| | investment
| | realized
| | value, end
| | Total
| | end of period
| | and/or expenses
| | and/or expenses
| | to average
| | Portfolio
|
| | | of period | | (loss)(a) | | unrealized) | | operations | | gains | | of period(b) | | Return(c) | | (000s omitted) | | absorbed | | absorbed | | net assets | | turnover(d) |
| |
| Class A |
| Year ended 10/31/11 | | $ | 26.15 | | | $ | (0.03 | ) | | $ | 1.63 | (e) | | $ | 1.60 | | | $ | — | | | $ | 27.75 | | | | 6.12 | %(e) | | $ | 540,451 | | | | 1.20 | %(f) | | | 1.21 | %(f) | | | (0.09 | )%(f) | | | 37 | % |
| Year ended 10/31/10 | | | 23.20 | | | | (0.07 | ) | | | 3.02 | (e) | | | 2.95 | | | | — | | | | 26.15 | | | | 12.71 | (e) | | | 439,402 | | | | 1.23 | | | | 1.23 | | | | (0.29 | ) | | | 16 | |
| Year ended 10/31/09 | | | 21.41 | | | | (0.02 | ) | | | 2.41 | | | | 2.39 | | | | (0.60 | ) | | | 23.20 | | | | 11.80 | | | | 425,719 | | | | 1.31 | | | | 1.32 | | | | (0.08 | ) | | | 50 | |
| Year ended 10/31/08 | | | 31.94 | | | | 0.01 | (g) | | | (7.66 | ) | | | (7.65 | ) | | | (2.88 | ) | | | 21.41 | | | | (26.28 | ) | | | 425,928 | | | | 1.21 | | | | 1.22 | | | | 0.03 | (g) | | | 61 | |
| Year ended 10/31/07 | | | 31.28 | | | | (0.13 | ) | | | 3.79 | | | | 3.66 | | | | (3.00 | ) | | | 31.94 | | | | 12.82 | | | | 642,561 | | | | 1.19 | | | | 1.19 | | | | (0.44 | ) | | | 46 | |
| |
| Class B |
| Year ended 10/31/11 | | | 22.07 | | | | (0.20 | ) | | | 1.37 | (e) | | | 1.17 | | | | — | | | | 23.24 | | | | 5.30 | (e) | | | 29,064 | | | | 1.95 | (f) | | | 1.96 | (f) | | | (0.84 | )(f) | | | 37 | |
| Year ended 10/31/10 | | | 19.72 | | | | (0.22 | ) | | | 2.57 | (e) | | | 2.35 | | | | — | | | | 22.07 | | | | 11.92 | (e) | | | 30,872 | | | | 1.98 | | | | 1.98 | | | | (1.04 | ) | | | 16 | |
| Year ended 10/31/09 | | | 18.43 | | | | (0.15 | ) | | | 2.04 | | | | 1.89 | | | | (0.60 | ) | | | 19.72 | | | | 10.96 | | | | 48,194 | | | | 2.06 | | | | 2.07 | | | | (0.83 | ) | | | 50 | |
| Year ended 10/31/08 | | | 28.09 | | | | (0.17 | )(g) | | | (6.61 | ) | | | (6.78 | ) | | | (2.88 | ) | | | 18.43 | | | | (26.84 | ) | | | 66,561 | | | | 1.96 | | | | 1.97 | | | | (0.72 | )(g) | | | 61 | |
| Year ended 10/31/07 | | | 28.06 | | | | (0.32 | ) | | | 3.35 | | | | 3.03 | | | | (3.00 | ) | | | 28.09 | | | | 11.96 | | | | 119,886 | | | | 1.94 | | | | 1.94 | | | | (1.19 | ) | | | 46 | |
| |
| Class C |
| Year ended 10/31/11 | | | 22.09 | | | | (0.20 | ) | | | 1.37 | (e) | | | 1.17 | | | | — | | | | 23.26 | | | | 5.30 | (e) | | | 32,702 | | | | 1.95 | (f) | | | 1.96 | (f) | | | (0.84 | )(f) | | | 37 | |
| Year ended 10/31/10 | | | 19.74 | | | | (0.22 | ) | | | 2.57 | (e) | | | 2.35 | | | | — | | | | 22.09 | | | | 11.91 | (e) | | | 24,390 | | | | 1.98 | | | | 1.98 | | | | (1.04 | ) | | | 16 | |
| Year ended 10/31/09 | | | 18.45 | | | | (0.15 | ) | | | 2.04 | | | | 1.89 | | | | (0.60 | ) | | | 19.74 | | | | 10.95 | | | | 24,783 | | | | 2.06 | | | | 2.07 | | | | (0.83 | ) | | | 50 | |
| Year ended 10/31/08 | | | 28.11 | | | | (0.17 | )(g) | | | (6.61 | ) | | | (6.78 | ) | | | (2.88 | ) | | | 18.45 | | | | (26.82 | ) | | | 29,588 | | | | 1.96 | | | | 1.97 | | | | (0.72 | )(g) | | | 61 | |
| Year ended 10/31/07 | | | 28.08 | | | | (0.32 | ) | | | 3.35 | | | | 3.03 | | | | (3.00 | ) | | | 28.11 | | | | 11.96 | | | | 40,297 | | | | 1.94 | | | | 1.94 | | | | (1.19 | ) | | | 46 | |
| |
| Class Y |
| Year ended 10/31/11 | | | 26.28 | | | | 0.05 | | | | 1.63 | (e) | | | 1.68 | | | | — | | | | 27.96 | | | | 6.39 | (e) | | | 5,628 | | | | 0.95 | (f) | | | 0.96 | (f) | | | 0.16 | (f) | | | 37 | |
| Year ended 10/31/10 | | | 23.26 | | | | (0.01 | ) | | | 3.03 | (e) | | | 3.02 | | | | — | | | | 26.28 | | | | 12.98 | (e) | | | 4,635 | | | | 0.98 | | | | 0.98 | | | | (0.04 | ) | | | 16 | |
| Year ended 10/31/09 | | | 21.41 | | | | 0.04 | | | | 2.41 | | | | 2.45 | | | | (0.60 | ) | | | 23.26 | | | | 12.09 | | | | 2,631 | | | | 1.06 | | | | 1.07 | | | | 0.17 | | | | 50 | |
| Year ended 10/31/08(h) | | | 24.44 | | | | 0.00 | (g) | | | (3.03 | ) | | | (3.03 | ) | | | — | | | | 21.41 | | | | (12.40 | ) | | | 617 | | | | 0.96 | (i) | | | 0.97 | (i) | | | 0.28 | (g)(i) | | | 61 | |
| |
| Investor Class |
| Year ended 10/31/11 | | | 26.16 | | | | (0.03 | ) | | | 1.63 | (e) | | | 1.60 | | | | — | | | | 27.76 | | | | 6.12 | (e) | | | 446,149 | | | | 1.20 | (f) | | | 1.21 | (f) | | | (0.09 | )(f) | | | 37 | |
| Year ended 10/31/10 | | | 23.20 | | | | (0.07 | ) | | | 3.03 | (e) | | | 2.96 | | | | — | | | | 26.16 | | | | 12.76 | (e) | | | 466,842 | | | | 1.23 | | | | 1.23 | | | | (0.29 | ) | | | 16 | |
| Year ended 10/31/09 | | | 21.41 | | | | (0.02 | ) | | | 2.41 | | | | 2.39 | | | | (0.60 | ) | | | 23.20 | | | | 11.80 | | | | 459,704 | | | | 1.31 | | | | 1.32 | | | | (0.08 | ) | | | 50 | |
| Year ended 10/31/08 | | | 31.94 | | | | 0.01 | (g) | | | (7.66 | ) | | | (7.65 | ) | | | (2.88 | ) | | | 21.41 | | | | (26.28 | ) | | | 456,309 | | | | 1.21 | | | | 1.22 | | | | 0.03 | (g) | | | 61 | |
| Year ended 10/31/07 | | | 31.29 | | | | (0.13 | ) | | | 3.78 | | | | 3.65 | | | | (3.00 | ) | | | 31.94 | | | | 12.78 | | | | 688,705 | | | | 1.19 | | | | 1.19 | | | | (0.44 | ) | | | 46 | |
| |
| | |
| (a) | | Calculated using average shares outstanding. |
| (b) | | Includes redemption fees added to shares of beneficial interest which were less than $0.005 per share. |
| (c) | | Includes adjustments in accordance with accounting principles generally accepted in the United States of America and as such, the net asset value for financial reporting purposes and the returns based upon those net asset values may differ from the net asset value and returns for shareholder transactions. Does not include sales charges and is not annualized for periods less than one year, if applicable. |
| (d) | | Portfolio turnover is calculated at the fund level and is not annualized for periods less than one year, if applicable. For the year ended October 31, 2011, the portfolio turnover calculation excludes the value of securities purchased of $121,012,126 and sold of $51,261,834 in the effort to realign the Fund’s portfolio holdings after the reorganization of Invesco Health Sciences Fund into the Fund. For the year ended October 31, 2007, the portfolio turnover calculation excludes the value of securities purchased of $132,508,164 and sold of $38,304,911 in the effort to realign the Fund’s portfolio holdings after the reorganization of AIM Advantage Health Sciences Fund into the Fund. |
| (e) | | Includes litigation proceeds received during the period. Had the litigation proceeds not been received, net gains on securities (both realized and unrealized) per share for the year ended October 31, 2011 would have been $1.44, $1.18, $1.18, $1.44 and $1.44 for Class A, Class B, Class C, Class Y and Investor Class Shares, respectively, and total returns would have been lower; net gains on securities (both realized and unrealized) per share for the year ended October 31, 2010 would have been $2.90, $2.45, $2.45, $2.91 and $2.91 for Class A, Class B, Class C, Class Y and Investor Class shares, respectively, and total returns would have been lower. |
| (f) | | Ratios are based on average daily net assets (000’s) of $505,282, $31,329, $29,298, $5,509 and $474,492 for Class A, Class B, Class C, Class Y and Investor Class shares, respectively. |
| (g) | | Net investment income (loss) per share and the ratio of net investment income (loss) to average net assets include a special cash dividend received of $5.23 per share owned of Allscripts-Misys Healthcare Solutions, Inc. on October 13, 2008. Net investment income (loss) per share and the ratio of net investment income (loss) to average net assets excluding the special dividend are $(0.05) and (0.19)%, $(0.23) and (0.94)%, $(0.23) and (0.94)%, $0.00 and 0.06%, and $(0.05) and (0.19)% for Class A, Class B, Class C, Class Y and Investor Class shares, respectively. |
| (h) | | Commencement date of October 3, 2008. |
| (i) | | Annualized. |
21 Invesco Global Health Care Fund
Report of Independent Registered Public Accounting Firm
To the Board of Trustees of AIM Investment Funds (Invesco Investment Funds)
and Shareholders of Invesco Global Health Care Fund:
In our opinion, the accompanying statement of assets and liabilities, including the schedule of investments, and the related statements of operations and of changes in net assets and the financial highlights present fairly, in all material respects, the financial position of Invesco Global Health Care Fund (one of the funds constituting AIM Investment Funds (Invesco Investment Funds), hereafter referred to as the “Fund”) at October 31, 2011, the results of its operations for the year then ended, the changes in its net assets for each of the two years in the period then ended and the financial highlights for each of the five years in the period then ended, in conformity with accounting principles generally accepted in the United States of America. These financial statements and financial highlights (hereafter referred to as “financial statements”) are the responsibility of the Fund’s management; our responsibility is to express an opinion on these financial statements based on our audits. We conducted our audits of these financial statements in accordance with the standards of the Public Company Accounting Oversight Board (United States). Those standards require that we plan and perform the audits to obtain reasonable assurance about whether the financial statements are free of material misstatement. An audit includes examining, on a test basis, evidence supporting the amounts and disclosures in the financial statements, assessing the accounting principles used and significant estimates made by management, and evaluating the overall financial statement presentation. We believe that our audits, which included confirmation of securities at October 31, 2011 by correspondence with the custodian and brokers, provide a reasonable basis for our opinion.
PRICEWATERHOUSECOOPERS LLP
Houston, Texas
December 27, 2011
22 Invesco Global Health Care Fund
Calculating your ongoing Fund expenses
Example
As a shareholder of the Fund, you incur two types of costs: (1) transaction costs, which may include sales charges (loads) on purchase payments or contingent deferred sales charges on redemptions, and redemption fees, if any; and (2) ongoing costs, including management fees, distribution and/or service (12b-1) fees, and other Fund expenses. This example is intended to help you understand your ongoing costs (in dollars) of investing in the Fund and to compare these costs with ongoing costs of investing in other mutual funds. The example is based on an investment of $1,000 invested at the beginning of the period and held for the entire period May 1, 2011 through October 31, 2011.
Actual expenses
The table below provides information about actual account values and actual expenses. You may use the information in this table, together with the amount you invested, to estimate the expenses that you paid over the period. Simply divide your account value by $1,000 (for example, an $8,600 account value divided by $1,000 = 8.6), then multiply the result by the number in the table under the heading entitled “Actual Expenses Paid During Period” to estimate the expenses you paid on your account during this period.
Hypothetical example for comparison purposes
The table below also provides information about hypothetical account values and hypothetical expenses based on the Fund’s actual expense ratio and an assumed rate of return of 5% per year before expenses, which is not the Fund’s actual return.
The hypothetical account values and expenses may not be used to estimate the actual ending account balance or expenses you paid for the period. You may use this information to compare the ongoing costs of investing in the Fund and other funds. To do so, compare this 5% hypothetical example with the 5% hypothetical examples that appear in the shareholder reports of the other funds.
Please note that the expenses shown in the table are meant to highlight your ongoing costs only and do not reflect any transaction costs, such as sales charges (loads) on purchase payments, contingent deferred sales charges on redemptions, and redemption fees, if any. Therefore, the hypothetical information is useful in comparing ongoing costs only, and will not help you determine the relative total costs of owning different funds. In addition, if these transaction costs were included, your costs would have been higher.
| | | | | | | | | | | | | | | | | | | | | | | | | | | | | | | |
| | | | | | | | | | HYPOTHETICAL
| | | |
| | | | | | | | | | (5% annual return before
| | | |
| | | | | | | ACTUAL | | | expenses) | | | |
| | | | Beginning
| | | Ending
| | | Expenses
| | | Ending
| | | Expenses
| | | Annualized
|
| | | | Account Value
| | | Account Value
| | | Paid During
| | | Account Value
| | | Paid During
| | | Expense
|
| Class | | | (05/01/11) | | | (10/31/11)1 | | | Period2 | | | (10/31/11) | | | Period2 | | | Ratio |
| A | | | $ | 1,000.00 | | | | $ | 909.50 | | | | $ | 5.63 | | | | $ | 1,019.31 | | | | $ | 5.96 | | | | | 1.17 | % |
| | | | | | | | | | | | | | | | | | | | | | | | | | | | | | | |
| B | | | | 1,000.00 | | | | | 906.00 | | | | | 9.22 | | | | | 1,015.53 | | | | | 9.75 | | | | | 1.92 | |
| | | | | | | | | | | | | | | | | | | | | | | | | | | | | | | |
| C | | | | 1,000.00 | | | | | 906.10 | | | | | 9.22 | | | | | 1,015.53 | | | | | 9.75 | | | | | 1.92 | |
| | | | | | | | | | | | | | | | | | | | | | | | | | | | | | | |
| Y | | | | 1,000.00 | | | | | 910.70 | | | | | 4.43 | | | | | 1,020.57 | | | | | 4.69 | | | | | 0.92 | |
| | | | | | | | | | | | | | | | | | | | | | | | | | | | | | | |
| Investor | | | | 1,000.00 | | | | | 909.60 | | | | | 5.63 | | | | | 1,019.31 | | | | | 5.96 | | | | | 1.17 | |
| | | | | | | | | | | | | | | | | | | | | | | | | | | | | | | |
| |
| 1 | The actual ending account value is based on the actual total return of the Fund for the period May 1, 2011 through October 31, 2011, after actual expenses and will differ from the hypothetical ending account value which is based on the Fund’s expense ratio and a hypothetical annual return of 5% before expenses. |
| 2 | Expenses are equal to the Fund’s annualized expense ratio as indicated above multiplied by the average account value over the period, multiplied by 184/365 to reflect the most recent fiscal half year. |
23 Invesco Global Health Care Fund
| |
| Approval of Investment Advisory and Sub-Advisory Contracts |
The Board of Trustees (the Board) of AIM Investment Funds (Invesco Investment Funds) is required under the Investment Company Act of 1940, as amended, to approve annually the renewal of the Invesco Global Health Care Fund (the Fund) investment advisory agreement with Invesco Advisers, Inc. (Invesco Advisers) and the Master Intergroup Sub-Advisory Contract for Mutual Funds (the sub-advisory contracts) with Invesco Asset Management Deutschland GmbH, Invesco Asset Management Limited, Invesco Asset Management (Japan) Limited, Invesco Australia Limited, Invesco Hong Kong Limited, Invesco Senior Secured Management, Inc. and Invesco Canada Ltd. (collectively, the Affiliated Sub-Advisers). During contract renewal meetings held on June 14-15, 2011, the Board as a whole, and the disinterested or “independent” Trustees, who comprise 80% of the Board, voting separately, approved the continuance of the Fund’s investment advisory agreement and the sub-advisory contracts for another year, effective July 1, 2011. In doing so, the Board considered the process that it follows in reviewing and approving the Fund’s investment advisory agreement and sub-advisory contracts and the information that it is provided. The Board determined that the Fund’s investment advisory agreement and the sub-advisory contracts are in the best interests of the Fund and its shareholders and the compensation to Invesco Advisers and the Affiliated Sub-Advisers under the agreements is fair and reasonable.
The Board’s Fund Evaluation Process
The Board’s Investments Committee has established three Sub-Committees, each of which is responsible for overseeing the management of a number of the series portfolios of the funds advised by Invesco Advisers (the Invesco Funds). The Sub-Committees meet throughout the year to review the performance of their assigned funds, including reviewing materials prepared under the direction of the independent Senior Officer, an officer of the Invesco Funds who reports directly to the independent Trustees. Over the course of each year, the Sub-Committees meet with portfolio managers for their assigned Invesco Funds and other members of management to review the performance, investment objective(s), policies, strategies and limitations and investment risks of these funds. The Sub-Committees meet regularly and at designated contract renewal meetings each year to conduct a review of the performance, fees, expenses and other matters related to their assigned Invesco Funds. Each Sub-Committee recommends to the Investments Committee, which in turn recommends to the full Board, whether to approve the continuance of each Invesco Fund’s investment advisory agreement and sub-advisory contracts for another year.
During the contract renewal process, the Trustees receive comparative performance and fee data regarding the Invesco Funds prepared by Invesco Advisers and an independent company, Lipper, Inc. (Lipper). The Trustees also receive an independent written evaluation from the Senior Officer. The Senior Officer’s evaluation is prepared as part of his responsibility to manage the process by which the Invesco Funds’ proposed management fees are negotiated during the annual contract renewal process to ensure they are negotiated in a manner that is at arms’ length and reasonable. The independent Trustees are assisted in their annual evaluation of the Fund’s investment advisory agreement by the Senior Officer and by independent legal counsel. The independent Trustees also discuss the continuance of the investment advisory agreement and sub-advisory contracts in private sessions with the Senior Officer and counsel.
In evaluating the fairness and reasonableness of the Fund’s investment advisory agreement and sub-advisory contracts, the Board considered, among other things, the factors discussed below. The Trustees also considered information provided in connection with fund acquisitions approved by the Trustees to rationalize the Invesco Funds product range following the acquisition of the retail mutual fund business of Morgan Stanley (the Morgan Stanley Transaction). The Trustees recognized that the advisory fees for the Invesco Funds include advisory fees that are the result of years of review and negotiation between the Trustees and Invesco Advisers as well as advisory fees inherited from Morgan Stanley and Van Kampen funds acquired in the Morgan Stanley Transaction. The Trustees’ deliberations and conclusions in a particular year may be based in part on their deliberations and conclusions regarding these same arrangements throughout the year and in prior years. One Trustee may have weighed a particular piece of information differently than another Trustee.
The discussion below serves as the Senior Officer’s independent written evaluation with respect to the Fund’s investment advisory agreement as well as a discussion of the material factors and related conclusions that formed the basis for the Board’s approval of the Fund’s investment advisory agreement and sub-advisory contracts. Unless otherwise stated, this information is current as of June 15, 2011, and may not reflect consideration of factors that became known to the Board after that date, including, for example, changes to the Fund’s performance, advisory fees, expense limitations and/or fee waivers.
Factors and Conclusions and Summary of Independent Written Fee Evaluation
| |
| A. | Nature, Extent and Quality of Services Provided by Invesco Advisers and the Affiliated Sub-Advisers |
The Board reviewed the advisory services provided to the Fund by Invesco Advisers under the Fund’s investment advisory agreement, the performance of Invesco Advisers in providing these services, and the credentials and experience of the officers and employees of Invesco Advisers who provide these services, including the Fund’s portfolio manager or managers, with whom the Board met during the year. The Board’s review of the qualifications of Invesco Advisers to provide advisory services included the Board’s consideration of Invesco Advisers’ performance and investment process oversight, independent credit analysis and investment risk management.
In determining whether to continue the Fund’s investment advisory agreement, the Board considered the prior relationship between Invesco Advisers and the Fund, as well as the Board’s knowledge of Invesco Advisers’ operations, and concluded that it is beneficial to maintain the current relationship, in part, because of such knowledge. The Board also considered services that Invesco Advisers and its affiliates provide to the Invesco Funds such as various back office support functions, equity and fixed income trading operations, internal audit, distribution and legal and compliance. The Board concluded that the nature, extent and quality of the services provided to the Fund by Invesco Advisers are appropriate and satisfactory and the advisory services are provided in accordance with the terms of the Fund’s investment advisory agreement.
The Board reviewed the services provided by the Affiliated Sub-Advisers under the sub-advisory contracts and the credentials and experience of the officers and employees of the Affiliated Sub-Advisers who provide these services. The Board noted that the Affiliated Sub-Advisers have offices and personnel that are located in financial centers around the world. As a result, the Affiliated Sub-Advisers can provide research and investment analysis on the markets and economies of various countries in which the Fund invests and make recommendations on securities of companies located in such countries. The Board concluded that the sub-advisory contracts benefit the Fund and its shareholders by permitting Invesco Advisers to use the resources and talents of the Affiliated Sub-Advisers in managing the Fund. The Board concluded that the nature, extent and quality of the services provided by the Affiliated Sub-Advisers are appropriate and satisfactory and in accordance with the terms of the Fund’s sub-advisory contracts.
24 Invesco Global Health Care Fund
The Board considered Fund performance as a relevant factor in considering whether to approve the investment advisory agreement. The Board did not view Fund performance as a relevant factor in considering whether to approve the sub-advisory contracts for the Fund, as no Affiliated Sub-Adviser currently manages assets of the Fund.
The Board compared the Fund’s performance during the past one, three and five calendar years to the performance of funds in the Lipper performance universe and against the Lipper Global Health/Biotechnology Funds Index. The Board noted that performance of Class A shares of the Fund was in the fourth quintile of the performance universe for the one and three year periods and the third quintile for the five year period (the first quintile being the best performing funds and the fifth quintile being the worst performing funds). The Board noted that performance of Class A shares of the Fund was above the performance of the Index for the one, three and five year periods. Invesco Advisers discussed with the Board the positioning of the Fund relative to its peers and the factors that contributed to underperformance in 2010 including stock selection in certain segments of the industry. Although the independent written evaluation of the Fund’s Senior Officer only considered Fund performance through the most recent calendar year, the Trustees also reviewed more recent Fund performance and this review did not change their conclusions.
| |
| C. | Advisory and Sub-Advisory Fees and Fee Waivers |
The Board compared the Fund’s contractual advisory fee rate to the contractual advisory fee rates of funds in the Fund’s Lipper expense group at a common asset level. The Board noted that the contractual advisory fee rate for Class A shares of the Fund was above the median contractual advisory fee rate of funds in the expense group. The Board also reviewed the methodology used by Lipper in providing expense group information, which includes using audited financial data from the most recent annual report of each fund in the expense group that was publicly available as of the end of the past calendar year and including only one fund per investment adviser. The Board noted that comparative data is as of varying dates, which may affect the comparability of data during times of market volatility.
The Board also compared the Fund’s effective fee rate (the advisory fee after advisory fee waivers and before expense limitations/waivers) to the advisory fee rates of other mutual funds advised by Invesco Advisers and its affiliates with investment strategies comparable to those of the Fund. The Board noted that the Fund’s effective fee rate was below the effective fee rate of one mutual fund with comparable investment strategies.
Other than the mutual fund described above, the Board noted that Invesco Advisers and the Affiliated Sub-Advisers do not manage other mutual funds or client accounts in a manner substantially similar to the management of the Fund.
The Board noted that Invesco Advisers has contractually agreed to waive fees and/or limit expenses of the Fund through at least June 30, 2012 in an amount necessary to limit total annual operating expenses to a specified percentage of average daily net assets for each class of the Fund. The Board noted that at the current expense ratio for the Fund, this expense waiver does not have any impact.
The Board also considered the services provided by the Affiliated Sub-Advisers pursuant to the sub-advisory contracts and the services provided by Invesco Advisers pursuant to the Fund’s advisory agreement, as well as the allocation of fees between Invesco Advisers and the Affiliated Sub-Advisers pursuant to the sub-advisory contracts. The Board noted that Invesco Advisers provides services to sub-advised Invesco Funds, including oversight of the Affiliated Sub-Advisers as well as the additional services described above other than day-to-day portfolio management. The Board also noted that the sub-advisory fees have no direct effect on the Fund or its shareholders, as they are paid by Invesco Advisers to the Affiliated Sub-Advisers, and that Invesco Advisers and the Affiliated Sub-Advisers are affiliates.
Based upon the information and considerations described above, the Board concluded that the Fund’s advisory and sub-advisory fees are fair and reasonable.
| |
| D. | Economies of Scale and Breakpoints |
The Board considered the extent to which there are economies of scale in the provision of advisory services to the Fund. The Board also considered whether the Fund benefits from economies of scale through contractual breakpoints in the Fund’s advisory fee schedule. The Board also noted that the Fund shares directly in economies of scale through lower fees charged by third party service providers based on the combined size of the Invesco Funds and other clients advised by Invesco Advisers.
| |
| E. | Profitability and Financial Resources |
The Board reviewed information from Invesco Advisers concerning the costs of the advisory and other services that Invesco Advisers and its affiliates provide to the Fund and the profitability of Invesco Advisers and its affiliates in providing these services. The Board reviewed with Invesco Advisers the methodology used to prepare the profitability information. The Board considered the profitability of Invesco Advisers in connection with managing the Fund and the Invesco Funds. The Board noted that Invesco Advisers continues to operate at a net profit from services Invesco Advisers and its subsidiaries provide to the Fund and the Invesco Funds. The Board concluded that the level of profits realized by Invesco Advisers and its affiliates from providing services to the Fund is not excessive given the nature, quality and extent of the services provided to the Invesco Funds. The Board considered whether Invesco Advisers and each Affiliated Sub-Adviser are financially sound and have the resources necessary to perform their obligations under the investment advisory agreement and sub-advisory contracts. The Board concluded that Invesco Advisers and each Affiliated Sub-Adviser have the financial resources necessary to fulfill these obligations.
| |
| F. | Collateral Benefits to Invesco Advisers and its Affiliates |
The Board considered various other benefits received by Invesco Advisers and its affiliates from the relationship with the Fund, including the fees received for their provision of administrative, transfer agency and distribution services to the Fund. The Board considered the performance of Invesco Advisers and its affiliates in providing these services and the organizational structure employed to provide these services. The Board also considered that these services are provided to the Fund pursuant to written contracts that are reviewed and approved on an annual basis by the Board; that the services are required for the operation of the Fund; that Invesco Advisers and its affiliates can provide services, the nature and quality of which are at least equal to those provided by others offering the same or similar services; and that the fees for such services are fair and reasonable in light of the usual and customary charges by others for services of the same nature and quality.
The Board considered the benefits realized by Invesco Advisers and the Affiliated Sub-Advisers as a result of portfolio brokerage transactions executed through “soft dollar” arrangements. The Board noted that soft dollar arrangements shift the payment obligation for research and execution services from Invesco Advisers and the Affiliated Sub-Advisers to the Invesco Funds and therefore may reduce Invesco Advisers’ and the Affiliated Sub-Advisers’ expenses. The Board concluded that the soft dollar arrangements are appropriate. The Board also concluded that, based on their review and representations made by the Chief Compliance Officer of the Invesco Funds, these arrangements are consistent with regulatory requirements.
The Board considered that the Fund’s uninvested cash and cash collateral from any securities lending arrangements may be invested in money market funds advised by Invesco Advisers pursuant to procedures approved by the Board. The Board noted that Invesco Advisers receives advisory fees from these affiliated money market funds attributable to such investments, although Invesco Advisers has contractually agreed to waive through varying periods the advisory fees payable by the Invesco Funds. The waiver is in an amount equal to 100% of the net advisory fee Invesco Advisers receives from the affiliated money market funds with respect to the Fund’s investment in the affiliated money market funds of uninvested cash, but not cash collateral. The Board concluded that the Fund’s investment of uninvested cash and cash collateral from any securities lending arrangements in the affiliated money market funds is in the best interests of the Fund and its shareholders.
25 Invesco Global Health Care Fund
Trustees and Officers
The address of each trustee and officer is AIM Investment Funds (Invesco Investment Funds) (the “Trust”), 11 Greenway Plaza, Suite 2500, Houston, Texas 77046-1173. The trustees serve for the life of the Trust, subject to their earlier death, incapacitation, resignation, retirement or removal as more specifically provided in the Trust’s organizational documents. Each officer serves for a one year term or until their successors are elected and qualified. Column two below includes length of time served with predecessor entities, if any.
| | | | | | | | | |
| | | | | | | Number of
| | |
| | | | | | | Funds in
| | |
| | | | | | | Fund Complex
| | |
Name, Year of Birth and
| | Trustee and/
| | Principal Occupation(s)
| | Overseen by
| | Other Directorship(s)
|
| Position(s) Held with the Trust | | or Officer Since | | During Past 5 Years | | Trustee | | Held by Trustee |
| | | | | | | | | |
| | | | | | | | | |
| Interested Persons | | | | | | | | |
| | | | | | | | | |
| | | | | | | | | |
| | | | | | | | | |
Martin L. Flanagan1 — 1960
Trustee | | 2007 | | Executive Director, Chief Executive Officer and President, Invesco Ltd. (ultimate parent of Invesco and a global investment management firm); Advisor to the Board, Invesco Advisers, Inc. (formerly known as Invesco Institutional (N.A.), Inc.); Trustee, The Invesco Funds; Vice Chair, Investment Company Institute; and Member of Executive Board, SMU Cox School of Business
Formerly: Chairman, Invesco Advisers, Inc. (registered investment adviser); Director, Chairman, Chief Executive Officer and President, IVZ Inc. (holding company), INVESCO Group Services, Inc. (service provider) and Invesco North American Holdings, Inc. (holding company); Director, Chief Executive Officer and President, Invesco Holding Company Limited (parent of Invesco and a global investment management firm); Director, Invesco Ltd.; Chairman, Investment Company Institute and President, Co-Chief Executive Officer, Co-President, Chief Operating Officer and Chief Financial Officer, Franklin Resources, Inc. (global investment management organization) | | 141 | | None |
| | | | | | | | | |
| | | | | | | | | |
| | | | | | | | | |
Philip A. Taylor2 — 1954
Trustee, President and
Principal Executive Officer | | 2006 | | Head of North American Retail and Senior Managing Director, Invesco Ltd.; Director, Co-Chairman, Co-President and Co-Chief Executive Officer, Invesco Advisers, Inc. (formerly known as Invesco Institutional (N.A.), Inc.) (registered investment adviser); Director, Chairman, Chief Executive Officer and President, Invesco Management Group, Inc. (formerly Invesco Aim Management Group, Inc.) (financial services holding company); Director and President, INVESCO Funds Group, Inc. (registered investment adviser and registered transfer agent); Director and Chairman, Invesco Investment Services, Inc. (formerly known as Invesco Aim Investment Services, Inc.) (registered transfer agent) and IVZ Distributors, Inc. (formerly known as INVESCO Distributors, Inc.) (registered broker dealer); Director, President and Chairman, Invesco Inc. (holding company) and Invesco Canada Holdings Inc. (holding company); Chief Executive Officer, Invesco Corporate Class Inc. (corporate mutual fund company) and Invesco Canada Fund Inc. (corporate mutual fund company); Director, Chairman and Chief Executive Officer, Invesco Canada Ltd. (formerly known as Invesco Trimark Ltd./Invesco Trimark Ltèe) (registered investment adviser and registered transfer agent); Trustee, President and Principal Executive Officer, The Invesco Funds (other than AIM Treasurer’s Series Trust (Invesco Treasurer’s Series Trust) and Short-Term Investments Trust); Trustee and Executive Vice President, The Invesco Funds (AIM Treasurer’s Series Trust (Invesco Treasurer’s Series Trust) and Short-Term Investments Trust only); Director, Invesco Investment Advisers LLC (formerly known as Van Kampen Asset Management); Director, Chief Executive Officer and President, Van Kampen Exchange Corp.
Formerly: Director and Chairman, Van Kampen Investor Services Inc.: Director, Chief Executive Officer and President, 1371 Preferred Inc. (holding company); and Van Kampen Investments Inc.; Director and President, AIM GP Canada Inc. (general partner for limited partnerships); and Van Kampen Advisors, Inc.; Director and Chief Executive Officer, Invesco Trimark Dealer Inc. (registered broker dealer); Director, Invesco Distributors, Inc. (formerly known as Invesco Aim Distributors, Inc.) (registered broker dealer); Manager, Invesco PowerShares Capital Management LLC; Director, Chief Executive Officer and President, Invesco Advisers, Inc.; Director, Chairman, Chief Executive Officer and President, Invesco Aim Capital Management, Inc.; President, Invesco Trimark Dealer Inc. and Invesco Trimark Ltd./Invesco Trimark Ltèe; Director and President, AIM Trimark Corporate Class Inc. and AIM Trimark Canada Fund Inc.; Senior Managing Director, Invesco Holding Company Limited; Trustee and Executive Vice President, Tax-Free Investments Trust; Director and Chairman, Fund Management Company (former registered broker dealer); President and Principal Executive Officer, The Invesco Funds (AIM Treasurer’s Series Trust (Invesco Treasurer’s Series Trust), Short-Term Investments Trust and Tax-Free Investments Trust only); President, AIM Trimark Global Fund Inc. and AIM Trimark Canada Fund Inc. | | 141 | | None |
| | | | | | | | | |
| | | | | | | | | |
| | | | | | | | | |
Wayne W. Whalen3 — 1939
Trustee | | 2010 | | Of Counsel, and prior to 2010, partner in the law firm of Skadden, Arps, Slate, Meagher & Flom LLP, legal counsel to funds in the Fund Complex | | 159 | | Director of the Abraham Lincoln Presidential Library Foundation |
| | | | | | | | | |
| | | | | | | | | |
| | | | | | | | | |
| Independent Trustees | | | | | | | | |
| | | | | | | | | |
| | | | | | | | | |
| | | | | | | | | |
Bruce L. Crockett — 1944
Trustee and Chair | | 2001 | | Chairman, Crockett Technology Associates (technology consulting company)
Formerly: Director, Captaris (unified messaging provider); Director, President and Chief Executive Officer COMSAT Corporation; and Chairman, Board of Governors of INTELSAT (international communications company) | | 141 | | ACE Limited (insurance company); and Investment Company Institute |
| | | | | | | | | |
| | | | | | | | | |
| | | | | | | | | |
David C. Arch — 1945
Trustee | | 2010 | | Chairman and Chief Executive Officer of Blistex Inc., a consumer health care products manufacturer. | | 159 | | Member of the Heartland Alliance Advisory Board, a nonprofit organization serving human needs based in Chicago. Board member of the Illinois Manufacturers’ Association. Member of the Board of Visitors, Institute for the Humanities, University of Michigan |
| | | | | | | | | |
| |
| 1 | Mr. Flanagan is considered an interested person of the Trust because he is an officer of the adviser to the Trust, and an officer and a director of Invesco Ltd., ultimate parent of the adviser to the Trust. |
| 2 | Mr. Taylor is considered an interested person of the Trust because he is an officer and a director of the adviser to, and a director of the principal underwriter of, the Trust. |
| 3 | Mr. Whalen has been deemed to be an interested person of the Trust because of his prior service as counsel to the predecessor funds of certain Invesco open-end funds and his affiliation with the law firm that served as counsel to such predecessor funds and continues to serve as counsel to the Invesco Van Kampen closed-end funds. |
T-1 Invesco Global Health Care Fund
Trustees and Officers—(continued)
The address of each trustee and officer is AIM Investment Funds (Invesco Investment Funds) (the “Trust”), 11 Greenway Plaza, Suite 2500, Houston, Texas 77046-1173. The trustees serve for the life of the Trust, subject to their earlier death, incapacitation, resignation, retirement or removal as more specifically provided in the Trust’s organizational documents. Each officer serves for a one year term or until their successors are elected and qualified. Column two below includes length of time served with predecessor entities, if any.
| | | | | | | | | |
| | | | | | | Number of
| | |
| | | | | | | Funds in
| | |
| | | | | | | Fund Complex
| | |
Name, Year of Birth and
| | Trustee and/
| | Principal Occupation(s)
| | Overseen by
| | Other Directorship(s)
|
| Position(s) Held with the Trust | | or Officer Since | | During Past 5 Years | | Trustee | | Held by Trustee |
| | | | | | | | | |
| | | | | | | | | |
| Independent Trustees—(continued) | | | | | | | | |
| | | | | | | | | |
| | | | | | | | | |
| | | | | | | | | |
Bob R. Baker — 1936
Trustee | | 2003 | | Retired
Formerly: President and Chief Executive Officer, AMC Cancer Research Center; and Chairman and Chief Executive Officer, First Columbia Financial Corporation | | 141 | | None |
| | | | | | | | | |
| | | | | | | | | |
| | | | | | | | | |
Frank S. Bayley — 1939
Trustee | | 1987 | | Retired
Formerly: Director, Badgley Funds, Inc. (registered investment company) (2 portfolios) and Partner, law firm of Baker & McKenzie | | 141 | | Director and Chairman, C.D. Stimson Company (a real estate investment company) |
| | | | | | | | | |
| | | | | | | | | |
| | | | | | | | | |
James T. Bunch — 1942
Trustee | | 2003 | | Founder, Green, Manning & Bunch Ltd. (investment banking firm)
Formerly: Executive Committee, United States Golf Association; and Director, Policy Studies, Inc. and Van Gilder Insurance Corporation | | 141 | | Vice Chairman, Board of Governors, Western Golf Association/Evans Scholars Foundation and Director, Denver Film Society |
| | | | | | | | | |
| | | | | | | | | |
| | | | | | | | | |
Rodney F. Dammeyer — 1940
Trustee | | 2010 | | President of CAC, LLC, a private company offering capital investment and management advisory services.
Formerly: Prior to January 2004, Director of TeleTech Holdings Inc.; Prior to 2002, Director of Arris Group, Inc.; Prior to 2001, Managing Partner at Equity Group Corporate Investments. Prior to 1995, Vice Chairman of Anixter International. Prior to 1985, experience includes Senior Vice President and Chief Financial Officer of Household International, Inc, Executive Vice President and Chief Financial Officer of Northwest Industries, Inc. and Partner of Arthur Andersen & Co. | | 159 | | Director of Quidel Corporation and Stericycle, Inc. Prior to May 2008, Trustee of The Scripps Research Institute. Prior to February 2008, Director of Ventana Medical Systems, Inc. Prior to April 2007, Director of GATX Corporation. Prior to April 2004, Director of TheraSense, Inc. |
| | | | | | | | | |
| | | | | | | | | |
| | | | | | | | | |
Albert R. Dowden — 1941
Trustee | | 2001 | | Director of a number of public and private business corporations, including the Boss Group, Ltd. (private investment and management); Reich & Tang Funds (5 portfolios) (registered investment company); and Homeowners of America Holding Corporation/ Homeowners of America Insurance Company (property casualty company)
Formerly: Director, Continental Energy Services, LLC (oil and gas pipeline service); Director, CompuDyne Corporation (provider of product and services to the public security market) and Director, Annuity and Life Re (Holdings), Ltd. (reinsurance company); Director, President and Chief Executive Officer, Volvo Group North America, Inc.; Senior Vice President, AB Volvo; Director of various public and private corporations; Chairman, DHJ Media, Inc.; Director Magellan Insurance Company; and Director, The Hertz Corporation, Genmar Corporation (boat manufacturer), National Media Corporation; Advisory Board of Rotary Power International (designer, manufacturer, and seller of rotary power engines); and Chairman, Cortland Trust, Inc. (registered investment company) | | 141 | | Board of Nature’s Sunshine Products, Inc. |
| | | | | | | | | |
| | | | | | | | | |
| | | | | | | | | |
Jack M. Fields — 1952
Trustee | | 2001 | | Chief Executive Officer, Twenty First Century Group, Inc. (government affairs company); and Owner and Chief Executive Officer, Dos Angelos Ranch, L.P. (cattle, hunting, corporate entertainment), Discovery Global Education Fund (non-profit) and Cross Timbers Quail Research Ranch (non-profit)
Formerly: Chief Executive Officer, Texana Timber LP (sustainable forestry company) and member of the U.S. House of Representatives | | 141 | | Administaff |
| | | | | | | | | |
| | | | | | | | | |
| | | | | | | | | |
Carl Frischling — 1937
Trustee | | 2001 | | Partner, law firm of Kramer Levin Naftalis and Frankel LLP | | 141 | | Director, Reich & Tang Funds (6 portfolios) |
| | | | | | | | | |
| | | | | | | | | |
| | | | | | | | | |
Prema Mathai-Davis — 1950
Trustee | | 2001 | | Retired
Formerly: Chief Executive Officer, YWCA of the U.S.A. | | 141 | | None |
| | | | | | | | | |
| | | | | | | | | |
| | | | | | | | | |
Larry Soll — 1942
Trustee | | 2003 | | Retired
Formerly, Chairman, Chief Executive Officer and President, Synergen Corp. (a biotechnology company) | | 141 | | None |
| | | | | | | | | |
| | | | | | | | | |
| | | | | | | | | |
Hugo F. Sonnenschein — 1940
Trustee | | 2010 | | President Emeritus and Honorary Trustee of the University of Chicago and the Adam Smith Distinguished Service Professor in the Department of Economics at the University of Chicago. Prior to July 2000, President of the University of Chicago. | | 159 | | Trustee of the University of Rochester and a member of its investment committee. Member of the National Academy of Sciences, the American Philosophical Society and a fellow of the American Academy of Arts and Sciences |
| | | | | | | | | |
| | | | | | | | | |
| | | | | | | | | |
Raymond Stickel, Jr. — 1944
Trustee | | 2005 | | Retired
Formerly: Director, Mainstay VP Series Funds, Inc. (25 portfolios) and Partner, Deloitte & Touche | | 141 | | Director of Long Cove Club Owners’ Association (home owner’s association) |
| | | | | | | | | |
T-2 Invesco Global Health Care Fund
Trustees and Officers—(continued)
The address of each trustee and officer is AIM Investment Funds (Invesco Investment Funds) (the “Trust”), 11 Greenway Plaza, Suite 2500, Houston, Texas 77046-1173. The trustees serve for the life of the Trust, subject to their earlier death, incapacitation, resignation, retirement or removal as more specifically provided in the Trust’s organizational documents. Each officer serves for a one year term or until their successors are elected and qualified. Column two below includes length of time served with predecessor entities, if any.
| | | | | | | | | |
| | | | | | | Number of
| | |
| | | | | | | Funds in
| | |
| | | | | | | Fund Complex
| | |
Name, Year of Birth and
| | Trustee and/
| | Principal Occupation(s)
| | Overseen by
| | Other Directorship(s)
|
| Position(s) Held with the Trust | | or Officer Since | | During Past 5 Years | | Trustee | | Held by Trustee |
| | | | | | | | | |
| | | | | | | | | |
| Other Officers | | | | | | | | |
| | | | | | | | | |
| | | | | | | | | |
| | | | | | | | | |
Russell C. Burk — 1958
Senior Vice President and Senior Officer | | 2005 | | Senior Vice President and Senior Officer of Invesco Funds | | N/A | | N/A |
| | | | | | | | | |
| | | | | | | | | |
| | | | | | | | | |
John M. Zerr — 1962
Senior Vice President, Chief Legal Officer and Secretary | | 2006 | | Director, Senior Vice President, Secretary and General Counsel, Invesco Management Group, Inc. (formerly known as Invesco Aim Management Group, Inc.) and Van Kampen Exchange Corp.; Senior Vice President, Invesco Advisers, Inc. (formerly known as Invesco Institutional (N.A.), Inc.) (registered investment adviser); Senior Vice President and Secretary, Invesco Distributors, Inc. (formerly known as Invesco Aim Distributors, Inc.); Director, Vice President and Secretary, Invesco Investment Services, Inc. (formerly known as Invesco Aim Investment Services, Inc.) and IVZ Distributors, Inc. (formerly known as INVESCO Distributors, Inc.); Director and Vice President, INVESCO Funds Group, Inc.; Senior Vice President, Chief Legal Officer and Secretary, The Invesco Funds; Manager, Invesco PowerShares Capital Management LLC; Director, Secretary and General Counsel, Invesco Investment Advisers LLC (formerly known as Van Kampen Asset Management); Secretary and General Counsel, Van Kampen Funds Inc. and Chief Legal Officer, PowerShares Exchange-Traded Fund Trust, PowerShares Exchange-Traded Fund Trust II, PowerShares India Exchange-Traded Fund Trust and PowerShares Actively Managed Exchange-Traded Fund Trust
Formerly: Director and Secretary, Van Kampen Advisors Inc.; Director Vice President, Secretary and General Counsel Van Kampen Investor Services Inc.; Director, Invesco Distributors, Inc. (formerly known as Invesco Aim Distributors, Inc.); Director, Senior Vice President, General Counsel and Secretary, Invesco Advisers, Inc.; and Van Kampen Investments Inc.; Director, Vice President and Secretary, Fund Management Company; Director, Senior Vice President, Secretary, General Counsel and Vice President, Invesco Aim Capital Management, Inc.; Chief Operating Officer and General Counsel, Liberty Ridge Capital, Inc. (an investment adviser); Vice President and Secretary, PBHG Funds (an investment company) and PBHG Insurance Series Fund (an investment company); Chief Operating Officer, General Counsel and Secretary, Old Mutual Investment Partners (a broker-dealer); General Counsel and Secretary, Old Mutual Fund Services (an administrator) and Old Mutual Shareholder Services (a shareholder servicing center); Executive Vice President, General Counsel and Secretary, Old Mutual Capital, Inc. (an investment adviser); and Vice President and Secretary, Old Mutual Advisors Funds (an investment company) | | N/A | | N/A |
| | | | | | | | | |
| | | | | | | | | |
| | | | | | | | | |
Lisa O. Brinkley — 1959
Vice President | | 2004 | | Global Compliance Director, Invesco Ltd.; Chief Compliance Officer, Invesco Investment Services, Inc.(formerly known as Invesco Aim Investment Services, Inc.); and Vice President, The Invesco Funds
Formerly: Chief Compliance Officer, Invesco Distributors, Inc. (formerly known as Invesco Aim Distributors, Inc.) and Van Kampen Investor Services Inc.; Senior Vice President, Invesco Management Group, Inc.; Senior Vice President and Chief Compliance Officer, Invesco Advisers, Inc. and The Invesco Funds; Vice President and Chief Compliance Officer, Invesco Aim Capital Management, Inc. and Invesco Distributors, Inc.; Vice President, Invesco Investment Services, Inc. and Fund Management Company | | N/A | | N/A |
| | | | | | | | | |
| | | | | | | | | |
| | | | | | | | | |
Sheri Morris — 1964
Vice President, Treasurer and Principal Financial Officer | | 1999 | | Vice President, Treasurer and Principal Financial Officer, The Invesco Funds; and Vice President, Invesco Advisers, Inc. (formerly known as Invesco Institutional (N.A.), Inc.) (registered investment adviser).
Formerly: Treasurer, PowerShares Exchange-Traded Fund Trust, PowerShares Exchange--Traded Fund Trust II, PowerShares India Exchange-Traded Fund Trust and PowerShares Actively Managed Exchange-Traded Fund Trust; Vice President, Invesco Advisers, Inc., Invesco Aim Capital Management, Inc. and Invesco Aim Private Asset Management, Inc.; Assistant Vice President and Assistant Treasurer, The Invesco Funds and Assistant Vice President, Invesco Advisers, Inc., Invesco Aim Capital Management, Inc. and Invesco Aim Private Asset Management, Inc. | | N/A | | N/A |
| | | | | | | | | |
| | | | | | | | | |
| | | | | | | | | |
Karen Dunn Kelley — 1960
Vice President | | 2004 | | Head of Invesco’s World Wide Fixed Income and Cash Management Group; Senior Vice President, Invesco Advisers, Inc. (formerly known as Invesco Institutional (N.A.), Inc.) (registered investment adviser); Executive Vice President, Invesco Distributors, Inc. (formerly known as Invesco Aim Distributors, Inc.); Senior Vice President, Invesco Management Group, Inc. (formerly known as Invesco Aim Management Group, Inc.); and Director, Invesco Mortgage Capital Inc.; Vice President, The Invesco Funds (other than AIM Treasurer’s Series Trust (Invesco Treasurer’s Series Trust) and Short-Term Investments Trust); President and Principal Executive Officer, The Invesco Funds (AIM Treasurer’s Series Trust (Invesco Treasurer’s Series Trust) and Short-Term Investments Trust only).
Formerly: Senior Vice President, Van Kampen Investments Inc.; Vice President, Invesco Advisers, Inc. (formerly known as Invesco Institutional (N.A.), Inc.); Director of Cash Management and Senior Vice President, Invesco Advisers, Inc. and Invesco Aim Capital Management, Inc.; President and Principal Executive Officer, Tax-Free Investments Trust; Director and President, Fund Management Company; Chief Cash Management Officer, Director of Cash Management, Senior Vice President, and Managing Director, Invesco Aim Capital Management, Inc.; Director of Cash Management, Senior Vice President, and Vice President, Invesco Advisers, Inc. and The Invesco Funds (AIM Treasurer’s Series Trust (Invesco Treasurer’s Series Trust), Short-Term Investments Trust and Tax-Free Investments Trust only) | | N/A | | N/A |
| | | | | | | | | |
T-3 Invesco Global Health Care Fund
Trustees and Officers—(continued)
The address of each trustee and officer is AIM Investment Funds (Invesco Investment Funds) (the “Trust”), 11 Greenway Plaza, Suite 2500, Houston, Texas 77046-1173. The trustees serve for the life of the Trust, subject to their earlier death, incapacitation, resignation, retirement or removal as more specifically provided in the Trust’s organizational documents. Each officer serves for a one year term or until their successors are elected and qualified. Column two below includes length of time served with predecessor entities, if any.
| | | | | | | | | |
| | | | | | | Number of
| | |
| | | | | | | Funds in
| | |
| | | | | | | Fund Complex
| | |
Name, Year of Birth and
| | Trustee and/
| | Principal Occupation(s)
| | Overseen by
| | Other Directorship(s)
|
| Position(s) Held with the Trust | | or Officer Since | | During Past 5 Years | | Trustee | | Held by Trustee |
| | | | | | | | | |
| | | | | | | | | |
| Other Officers—(continued) | | | | | | | | |
| | | | | | | | | |
| | | | | | | | | |
| | | | | | | | | |
Lance A. Rejsek — 1967
Anti-Money Laundering Compliance Officer | | 2005 | | Anti-Money Laundering Compliance Officer, Invesco Advisers, Inc. (formerly known as Invesco Institutional (N.A.), Inc.) (registered investment adviser); Invesco Distributors, Inc. (formerly known as Invesco Aim Distributors, Inc.), Invesco Investment Services, Inc. (formerly known as Invesco Aim Investment Services, Inc.), The Invesco Funds, PowerShares Exchange-Traded Fund Trust, PowerShares Exchange-Traded Fund Trust II, PowerShares India Exchange-Traded Fund Trust, PowerShares Actively Managed Exchange-Traded Fund Trust, Invesco Investment Advisers LLC (formerly known as Van Kampen Asset Management) and Van Kampen Funds Inc.
Formerly: Anti-Money Laundering Compliance Officer, Van Kampen Investor Services Inc., Fund Management Company, Invesco Advisers, Inc., Invesco Aim Capital Management, Inc. and Invesco Aim Private Asset Management, Inc. | | N/A | | N/A |
| | | | | | | | | |
| | | | | | | | | |
| | | | | | | | | |
Todd L. Spillane — 1958
Chief Compliance Officer | | 2006 | | Senior Vice President, Invesco Management Group, Inc. (formerly known as Invesco Aim Management Group, Inc.) and Van Kampen Exchange Corp.; Senior Vice President and Chief Compliance Officer, Invesco Advisers, Inc. (registered investment adviser) (formerly known as Invesco Institutional (N.A.), Inc.); Chief Compliance Officer, The Invesco Funds, PowerShares Exchange-Traded Fund Trust, PowerShares Exchange-Traded Fund Trust II, PowerShares India Exchange-Traded Fund Trust, PowerShares Actively Managed Exchange-Traded Fund Trust, INVESCO Private Capital Investments, Inc. (holding company) and Invesco Private Capital, Inc. (registered investment adviser); Vice President, Invesco Distributors, Inc. (formerly known as Invesco Aim Distributors, Inc.) and Invesco Investment Services, Inc. (formerly known as Invesco Aim Investment Services, Inc.).
Formerly: Chief Compliance Officer, Invesco Van Kampen Closed-End Funds; Senior Vice President, Van Kampen Investments Inc.; Senior Vice President and Chief Compliance Officer, Invesco Advisers, Inc. and Invesco Aim Capital Management, Inc.; Chief Compliance Officer, Invesco Global Asset Management (N.A.), Inc., Invesco Senior Secured Management, Inc. (registered investment adviser) and Van Kampen Investor Services Inc.; Vice President, Invesco Aim Capital Management, Inc. and Fund Management Company | | N/A | | N/A |
| | | | | | | | | |
The Statement of Additional Information of the Trust includes additional information about the Fund’s Trustees and is available upon request, without charge, by calling 1.800.959.4246. Please refer to the Fund’s prospectus for information on the Fund’s sub-advisers.
| | | | | | | |
Office of the Fund
11 Greenway Plaza, Suite 2500
Houston, TX 77046-1173 | | Investment Adviser
Invesco Advisers, Inc.
1555 Peachtree Street, N.E.
Atlanta, GA 30309 | | Distributor
Invesco Distributors, Inc.
11 Greenway Plaza, Suite 2500
Houston, TX 77046-1173 | | Auditors
PricewaterhouseCoopers LLP
1201 Louisiana Street, Suite 2900
Houston, TX 77002-5678 |
| | | | | | | |
| | | | | | | |
Counsel to the Fund
Stradley Ronon Stevens & Young, LLP
2600 One Commerce Square
Philadelphia, PA 19103 | | Counsel to the Independent Trustees
Kramer, Levin, Naftalis & Frankel LLP
1177 Avenue of the Americas
New York, NY 10036-2714 | | Transfer Agent
Invesco Investment Services, Inc.
11 Greenway Plaza, Suite 2500
Houston, TX 77046-1173 | | Custodian
State Street Bank and Trust Company
225 Franklin
Boston, MA 02110-2801 |
T-4 Invesco Global Health Care Fund
Invesco mailing information
Send general correspondence to Invesco Investment Services, Inc., P.O. Box 219078, Kansas City, MO 64121-9078.
Invesco privacy policy
You share personal and financial information with us that is necessary for your transactions and your account records. We take very seriously the obligation to keep that information confidential and private.
Invesco collects nonpublic personal information about you from account applications or other forms you complete and from your transactions with us or our affiliates. We do not disclose information about you or our former customers to service providers or other third parties except to the extent necessary to service your account and in other limited circumstances as permitted by law. For example, we use this information to facilitate the delivery of transaction confirmations, financial reports, prospectuses and tax forms.
Even within Invesco, only people involved in the servicing of your accounts and compliance monitoring have access to your information. To ensure the highest level of confidentiality and security, Invesco maintains physical, electronic and procedural safeguards that meet or exceed federal standards. Special measures, such as data encryption and authentication, apply to your communications with us on our website. More detail is available to you at invesco.com/privacy.
Important notice regarding delivery of security holder documents
To reduce Fund expenses, only one copy of most shareholder documents may be mailed to shareholders with multiple accounts at the same address (Householding). Mailing of your shareholder documents may be householded indefinitely unless you instruct us otherwise. If you do not want the mailing of these documents to be combined with those for other members of your household, please contact Invesco Investment Services, Inc. at 800 959 4246 or contact your financial institution. We will begin sending you individual copies for each account within 30 days after receiving your request.
Fund holdings and proxy voting information
The Fund provides a complete list of its holdings four times in each fiscal year, at the quarter-ends. For the second and fourth quarters, the lists appear in the Fund’s semiannual and annual reports to shareholders. For the first and third quarters, the Fund files the lists with the Securities and Exchange Commission (SEC) on Form N-Q. The most recent list of portfolio holdings is available at invesco.com/completeqtrholdings. Shareholders can also look up the Fund’s Forms N-Q on the SEC website at sec.gov. Copies of the Fund’s Forms N-Q may be reviewed and copied at the SEC Public Reference Room in Washington, D.C. You can obtain information on the operation of the Public Reference Room, including information about duplicating fee charges, by calling 202 551 8090 or 800 732 0330, or by electronic request at the following email address: publicinfo@sec.gov. The SEC file numbers for the Fund are 811-05426 and 033-19338.
A description of the policies and procedures that the Fund uses to determine how to vote proxies relating to portfolio securities is available without charge, upon request, from our Client Services department at 800 959 4246 or at invesco.com/proxyguidelines. The information is also available on the SEC website, sec.gov.
Information regarding how the Fund voted proxies related to its portfolio securities during the 12 months ended June 30, 2011,
is available at invesco.com/proxysearch. The information is also available on the SEC website, sec.gov.
Invesco Advisers, Inc. is an investment adviser; it provides investment advisory services to individual and institutional clients and does not sell securities. Invesco Distributors, Inc. is the U.S. distributor for Invesco Ltd.’s retail mutual funds, exchange-traded funds and institutional money market funds. Both are wholly owned, indirect subsidiaries of Invesco Ltd.
| | | | | |
| | | GHC-AR-1 | | Invesco Distributors, Inc. |
| | |
| Annual Report to Shareholders | | October 31, 2011 |
Invesco International Total Return Fund
Nasdaq:
A: AUBAX § B: AUBBX § C: AUBCX § Y: AUBYX § Institutional: AUBIX
| | | |
| 2 | | Letters to Shareholders |
| 4 | | Performance Summary |
| 4 | | Management Discussion |
| 6 | | Long-Term Fund Performance |
| 8 | | Supplemental Information |
| 9 | | Schedule of Investments |
| 12 | | Financial Statements |
| 14 | | Notes to Financial Statements |
| 22 | | Financial Highlights |
| 23 | | Auditor’s Report |
| 24 | | Fund Expenses |
| 25 | | Approval of Investment Advisory and Sub-Advisory Agreements |
| 27 | | Tax Information |
| T-1 | | Trustees and Officers |
Letters to Shareholders

Philip Taylor
Dear Shareholders:
Enclosed is important information about your Fund and its performance. I encourage you to read this report to learn more about your Fund’s short- and long-term performance and its holdings as of the close of the reporting period. This report also includes useful information about your Fund’s management team and a discussion of how your Fund was managed during the reporting period.
Investors are likely to confront both opportunities and challenges in 2012 – just as we did in 2011. After all, changes in market sentiment never do investors the courtesy of announcing their impending arrival, and your goals and needs may have changed, requiring changes in your financial strategy.
That’s why the start of a new year is always a good time to catch up with your financial adviser. He or she can explain how your investments performed in the year just ended – how each performed individually, and more important, how they performed as a diversified portfolio. Of course, it’s important to remember that an investment’s long-term performance is more important than its short-term performance. Looking ahead to the new year and evaluating your individual situation, your financial adviser can provide valuable insight into whether your investments are still appropriate for your individual needs, goals and risk tolerance.
For current information about your Fund
In addition to meeting with your financial adviser to discuss your individual situation at the start of the new year, you also may find it helpful to stay abreast of market trends and developments. Doing so may provide reassurance in times of economic uncertainty and market volatility such as we saw in 2011 – and are likely to see again in 2012.
Invesco can help you stay informed about your investments and market trends. On our website, invesco.com/us, we provide timely market updates and commentary from many of our fund managers and other investment professionals. Also on our website, you can obtain information about your account at any hour of the day or night. I invite you to visit and explore the tools and information we offer at invesco.com/us.
Our commitment to investment excellence
As we’ve seen over the last several years, market conditions can change – often suddenly and dramatically. That’s one reason financial advisers typically advise their clients to be well diversified and to maintain a long-term investment focus. While diversification can’t guarantee a profit or protect against loss, it may cushion the impact of dramatic market moves. Maintaining a long-term investment focus for your long-term goals – financing your retirement or your children’s education, for example – may help you avoid making rash investment decisions based on short-term market swings.
Likewise, Invesco’s investment professionals maintain a long-term focus. Across our broad array of investment products, investment excellence is our ultimate goal. Each of our funds is managed by specialized teams of investment professionals, and as a company, we maintain a single focus – investment management – that allows our fund managers to concentrate on doing what they do best: managing your money.
Our funds are managed strictly according to their stated investment objectives and strategies, with robust risk oversight using consistent, repeatable investment processes that don’t change in response to short-term market events. This disciplined approach can’t guarantee a profit; no investment can do that, since all involve some measure of risk. But it can ensure that your money is managed the way we said it would be – according to your Fund’s objective and strategies.
Our adherence to stated investment objectives and strategies allows your financial adviser to build a diversified portfolio that meets your individual risk tolerance and financial goals. It also means that when your goals change, your financial adviser will be able to find an Invesco fund that’s appropriate for your needs.
Questions?
If you have questions about your account, please contact one of our client service representatives at 800 959 4246. If you have a general Invesco-related question or comment for me, I invite you to email me directly at phil@invesco.com.
All of us at Invesco look forward to serving your investment management needs for many years to come. Thank you for investing with us.
Sincerely,
Philip Taylor
Senior Managing Director, Invesco Ltd.
| 2 | | Invesco International Total Return Fund |

Bruce Crockett
Dear Fellow Shareholders:
Although the world’s economies are gradually recovering from the financial crisis, it has not been a smooth path. Unrest in the Middle East, persistently weak job and housing markets in the U.S. and continued government balance sheet repair in Europe are contributing to a slow, labored march toward global recovery.
In this environment, investors face risks that could make it more difficult to achieve their long-term financial goals – a secure retirement, home ownership, a child’s college education. Although the markets are complex and dynamic, there are ways to simplify the process and potentially increase your odds of achieving your goals. The best approach is to create a solid financial plan that helps you save and invest in ways that anticipate your needs over the long term.
Your financial adviser can help you define your financial plan, develop an appropriate investment strategy and put you in a better position to achieve your financial goals over the long term. This can take some of the guesswork out of the process and help you make thoughtful investments. Your financial adviser also can help you better understand your tolerance for risk, so that your investment approach lets you sleep at night while getting you closer to your goals. Lastly, your financial adviser can develop an asset allocation strategy that seeks to balance your investment approach, providing some protection against a decline in the markets while allowing you to participate in rising markets. Invesco calls this type of approach “intentional investing.” It means thinking carefully, planning thoughtfully and acting deliberately.
While no investment can guarantee favorable returns, your Board remains committed to managing costs and enhancing the performance of Invesco’s funds as part of our Investor First orientation. We continue to oversee the funds with the same strong sense of responsibility for your money and your continued trust that we’ve always maintained.
Thanks to the approval of our fund shareholders, Invesco has made great progress in realigning our U.S. mutual fund product line following our acquisition of Morgan Stanley’s retail asset management business, including Van Kampen Investments. When completed, the realignment will reduce overlap in the product lineup, enhance efficiency across our product line and build a solid foundation for further growth to meet client and shareholder needs. I would like to thank those of you who voted your proxy, and I hope our shareholders haven’t been too inconvenienced by the process.
As always, please contact me at bruce@brucecrockett.com with any questions or concerns you may have. On behalf of your Board, we look forward to continuing to represent your interests and serving your needs.
Sincerely,
Bruce L. Crockett
Independent Chair
Invesco Funds Board of Trustees
| 3 | | Invesco International Total Return Fund |
Management’s Discussion of Fund Performance
Performance summary
For the fiscal year ended October 31, 2011, Class A shares of Invesco International Total Return Fund, at net asset value (NAV), underperformed the Barclays Capital Global Aggregate ex-U.S. Index, its broad market and style-specific benchmark. A longer duration posture in Europe during the first half of the reporting period, and an overweight position in the credit sector during the latter part of the reporting period, contributed to this underperformance.
Your Fund’s long-term performance appears later in this report.
Fund vs. Indexes
Total returns, 10/31/10 to 10/31/11, at net asset value (NAV). Performance shown does not include applicable contingent deferred sales charges (CDSC) or front-end sales charges, which would have reduced performance.
| | | | | |
|
| Class A Shares | | | 3.37 | % |
| |
| Class B Shares | | | 2.66 | |
| |
| Class C Shares | | | 2.65 | |
| |
| Class Y Shares | | | 3.72 | |
| |
| Institutional Class Shares | | | 3.63 | |
| |
Barclays Capital Global Aggregate ex-U.S. Index▼
(Broad Market/Style-Specific Index) | | | 3.57 | |
| |
Lipper International Income Funds Index §(Peer Group Index) | | | 1.52 | |
| |
| | |
| Source(s): ▼Invesco, Barclays Capital; §Lipper Inc. |
How we invest
The Fund invests its assets in a diversified portfolio of foreign government and corporate debt securities, generally represented by the sector categories within the Barclays Capital Global Aggregate ex-U.S. Index (unhedged), and in foreign currency investments. Debt securities that the Fund may invest in include foreign sovereign, corporate or agency securities of varying maturities, including securitized securities, such as asset-backed and mortgage-backed securities, and commercial paper and other short-term debt instruments. The Fund may invest up to 30% of its total assets in U.S. dollar-denominated securities. It also may invest up to 25% of its total assets in non-investment grade securities, including non-investment grade emerging market securities.
The Fund may invest in derivatives, including swaps, options and futures contracts. The Fund may also utilize other strategies such as dollar rolls and reverse repurchase agreements. Derivative instruments, dollar rolls and reverse repurchase agreements may have the effect of leveraging the Fund’s portfolio. Foreign currency investments may include spot contracts, forward currency contracts, currency swaps, currency options, currency futures and options on currency futures. These strategies are implemented within the risk profile of the guidelines set forth in the prospectus. Currently the Fund is only utilizing futures and currency forwards for efficient portfolio management.
We believe dynamic and complex fixed income markets may create opportunities for investors that are best captured by independent specialist decision makers
interconnected as a global team. We use this philosophy in an effort to generate a total return consisting of income and capital appreciation.
Our security selection is supported by a team of specialists. Team members conduct top-down macroeconomic as well as bottom-up analysis on individual securities. Recommendations are communicated to portfolio managers through proprietary technology that allows all investment professionals to communicate in a timely manner.
Portfolio construction begins with a well-defined Fund design that establishes the target investment vehicles for generating the desired “alpha” (the extra return above a specific benchmark) as well as the risk parameters for the Fund. Investment vehicles are evaluated for liquidity and risk versus relative value.
Sell decisions are based on:
| n | | A conscious decision to alter the Fund’s macro-risk exposure (for example, duration, yield curve positioning or sector exposure). |
| |
| n | | The need to limit or reduce exposure to a particular sector or issuer. |
| |
| n | | Degradation of an issuer’s credit quality. |
| |
| n | | Realignment of a valuation target. |
| |
| n | | Presentation of a better relative value opportunity. |
| |
| n | | General liquidity needs of the Fund. |
Market conditions and your Fund
Global financial markets were volatile during the fiscal year as investors reacted to the economic implications of several world events during the reporting period, including the Japanese earthquake and tsunami disasters, civil unrest in the Middle East and northern Africa, and a reinvigorated eurozone sovereign debt crisis. Even so, the global investment
Portfolio Composition
By sector
| | | | | |
|
| Financials | | | 40.6 | % |
| |
| Sovereign Debt | | | 39.7 | |
| |
| Consumer Staples | | | 3.7 | |
| |
| Energy | | | 3.7 | |
| |
| Industrials | | | 2.6 | |
| |
| Utilities | | | 1.6 | |
| |
| Telecommunication Services | | | 1.1 | |
| |
| Collateralized Mortgage Obligations | | | 1.0 | |
| |
| Materials | | | 0.8 | |
| |
| Information Technology | | | 0.7 | |
| |
| Consumer Discretionary | | | 0.1 | |
| |
Money Market Funds | | | | |
Plus Other Assets Less Liabilities | | | 4.4 | |
Top 10 Fixed Income Issuers*
| | | | | | | | | |
|
| | 1. | | | Italy Buoni Poliennali Del Tesoro | | | 8.5 | % |
| |
| | 2. | | | Poland Government | | | 7.7 | |
| |
| | 3. | | | Dexia Municipal Agency S.A. | | | 7.5 | |
| |
| | 4. | | | Kreditanstalt fuer Wiederaufbau | | | 7.0 | |
| |
| | 5. | | | European Investment Bank | | | 6.6 | |
| |
| | 6. | | | United Kingdom Treasury | | | 4.5 | |
| |
| | 7. | | | General Electric Capital Corp. | | | 4.2 | |
| |
| | 8. | | | Gazprom OAO Via Gaz Capital S.A. | | | 3.6 | |
| |
| | 9. | | | Province of Ontario | | | 3.6 | |
| |
| | 10. | | | Bundesrepublik Deutschland | | | 3.2 | |
| | | | |
|
| Total Net Assets | | $69.9 million | |
| | | | | |
| Total Number of Holdings* | | | 77 | |
The Fund’s holdings are subject to change, and there is no assurance that the Fund will continue to hold any particular security.
*Excluding money market fund holdings.
| 4 | | Invesco International Total Return Fund |
grade bond market, as measured by the Barclays Capital Global Aggregate ex-U.S. Index, generated a positive total return for the reporting period.
During the early part of the fiscal year, interest rates trended higher across the globe. In the developed west, economies appeared to be on the mend and gross domestic product growth prospects, although low, were improving. In Europe, growing uncertainties about Greece and other European countries’ solvency led to higher yields for selective countries and a growing divergence of borrowing costs across the eurozone. Emerging market economies, especially in the Asia/Pacific region, were rebounding particularly well following the global financial crisis and their currencies attracted global capital flows, sparking some concerns of inflation, asset pricing bubbles and overheating economies. During the latter part of the fiscal year, the European sovereign debt crisis and related concerns about financial sector stability dominated headlines, leading to periods of extreme risk aversion, wider credit spreads, and subsequently high demand for the perceived safe havens of U.S. Treasuries and German Bunds. Central banks’ activities mirrored the differences across regions. Monetary tightening occurred across many markets in which signs of inflation began to appear. In contrast, the U.S., Japan, and the U.K. maintained key lending rates as below-target economic growth persisted and inflation became less of a concern.
In this environment, sector selection decisions were favorable overall. Positioning in credit, quasi-government and securitized market sectors were beneficial to fiscal year performance, although the credit and securitized market sectors detracted from results during the second half of the reporting period.
Country selection was also a significant contributor to relative performance during the reporting period. The Fund benefited from avoidance and/or underweights to peripheral European countries such as Greece, Portugal, Ireland, Italy and Spain. Tactical trading in Spain and Italy also added to performance over the fiscal year. Our cautious view on peripheral countries in the eurozone and a focus on core countries, mainly Germany, were beneficial for Fund performance and risk management.
Security selection versus benchmark constituents positively affected Fund performance, particularly among quasi-government and basic industry/ capital goods holdings. However, security selection in financials, transports, and utilities worked against relative performance, but not enough to negate the benefits of security selection across the broader portfolio.
The Fund uses active duration and yield curve positioning for risk management and for generating alpha versus its benchmark. Duration measures a portfolio’s price sensitivity to interest rate changes. Yield curve positioning refers to actively emphasizing points (maturities) along the yield curve with favorable risk/ return expectations.
The contribution to Fund performance from duration and yield curve positioning versus the benchmark was mixed over the reporting period. A longer duration posture in Europe during the first half of the fiscal year when rates were rising, and an underweight to Japanese duration while Japanese government bond yields fell near the end of the reporting period, worked against relative returns. Duration was managed with cash bonds and futures positions.
Buying and selling interest rate futures contracts across multiple global yield curves was an important tool used for the management of interest rate risk and maintaining our targeted portfolio duration. Part of our strategy to manage currency risk resulting from the purchase of cash bonds in foreign currency entailed hedging that risk via currency forwards. The currency hedging activity was carried out on an as-needed basis and was effective in managing unwanted currency risk.
We thank you for your continued participation in Invesco International Total Return Fund.
The views and opinions expressed in management’s discussion of Fund performance are those of Invesco Advisers, Inc. These views and opinions are subject to change at any time based on factors such as market and economic conditions. These views and opinions may not be relied upon as investment advice or recommendations, or as an offer for a particular security. The information is not a complete analysis of every aspect of any market, country, industry, security or the Fund. Statements of fact are from sources considered reliable, but Invesco Advisers, Inc. makes no representation or warranty as to their completeness or accuracy. Although historical performance is no guarantee of future results, these insights may help you understand our investment management philosophy. See important Fund and, if applicable, index disclosures later in this report.
See important Fund and, if applicable, index disclosures later in this report.
Avi Hooper
Chartered Financial Analyst, portfolio manager, is lead manager of Invesco International Total Return Fund. He joined Invesco in 2010. Mr. Hooper earned a B.A.S. with a focus on accounting and finance from York University.
Mark Nash
Chartered Financial Analyst, portfolio manager, is manager of Invesco International Total Return Fund. He joined Invesco in 2001. Mr. Nash earned a B.S. with honors in chemistry and an M.S. in materials engineering from the University of Nottingham.
| 5 | | Invesco International Total Return Fund |
Your Fund’s Long-Term Performance
Results of a $10,000 Investment – Oldest Share Classes since Inception
Fund and index data from 3/31/06
Past performance cannot guarantee comparable future results.
The data shown in the chart include reinvested distributions, applicable sales charges and Fund expenses including management fees. Results for Class B shares are calculated as if a hypothetical shareholder had liquidated his entire investment in the Fund at the close of the reporting period and paid the contingent deferred sales charges, if applicable. Index results include reinvested dividends, but they do not reflect sales
charges. Performance of the peer group, if applicable, reflects fund expenses and management fees; performance of a market index does not. Performance shown in the chart and table(s) does not reflect deduction of taxes a shareholder would pay on Fund distributions or sale of Fund shares.
This chart, which is a logarithmic chart, presents the fluctuations in the value of the Fund and its indexes. We believe that a logarithmic chart is more effective than other types of charts in illustrating
changes in value during the early years shown in the chart. The vertical axis, the one that indicates the dollar value of an investment, is constructed with each segment representing a percent change in the value of the investment. In this chart, each segment represents a doubling, or 100% change, in the value of the investment. In other words, the space between $5,000 and $10,000 is the same size as the space between $10,000 and $20,000.
continued from page 8
| | | borrowers with weakened credit histories or with lower capacity to make timely payments on their mortgages. |
| |
| n | | Reverse repurchase agreement risk.
Reverse repurchase agreements involve the risk that the market value of securities to be repurchased may decline below the repurchase price or that the other party may default on its obligation, resulting in delays, additional costs or the restriction of proceeds from the sale. |
About indexes used in this report
| n | | The Barclays Capital Global Aggregate ex-U.S. Index is an unmanaged index considered representative of bonds of foreign countries. |
| |
| n | | The Lipper International Income Funds Index is an unmanaged index considered representative of international income funds tracked by Lipper. |
| |
| n | | The Fund is not managed to track the performance of any particular index, including the index(es) defined here, |
| | | and consequently, the performance of the Fund may deviate significantly from the performance of the index(es). |
| |
| n | | A direct investment cannot be made in an index. Unless otherwise indicated, index results include reinvested dividends, and they do not reflect sales charges. Performance of the peer group, if applicable, reflects fund expenses; performance of a market index does not. |
continued on page 7
| 6 | | Invesco International Total Return Fund |
Average Annual Total Returns
As of 10/31/11, including maximum applicable sales
charges
| | | | | | | | | |
|
| Class A Shares | | | | |
| |
| Inception (3/31/06) | | | 5.52 | % |
| |
| | 5 Years | | | 4.93 | |
| |
| | 1 Year | | | -1.55 | |
| |
| | | | | | | | | |
| Class B Shares | | | | |
| |
| Inception (3/31/06) | | | 5.50 | % |
| |
| | 5 Years | | | 4.86 | |
| |
| | 1 Year | | | -2.10 | |
| |
| | | | | | | | | |
| Class C Shares | | | | |
| |
| Inception (3/31/06) | | | 5.64 | % |
| |
| | 5 Years | | | 5.16 | |
| |
| | 1 Year | | | 1.70 | |
| |
| | | | | | | | | |
| Class Y Shares | | | | |
| |
| Inception | | | 6.59 | % |
| |
| | 5 Years | | | 6.12 | |
| |
| | 1 Year | | | 3.72 | |
| |
| | | | | | | | | |
| Institutional Class Shares | | | | |
| |
| Inception (3/31/06) | | | 6.71 | % |
| |
| | 5 Years | | | 6.22 | |
| |
| | 1 Year | | | 3.63 | |
Class Y shares incepted on October 3, 2008. Performance shown prior to that date is that of Class A shares and includes the 12b-1 fees applicable to Class A shares. Class A share performance reflects any applicable fee waivers or expense reimbursements.
The performance data quoted represent past performance and cannot guarantee comparable future results; current performance may be lower or higher. Please visit invesco.com/performance for the most recent month-end performance. Performance figures reflect reinvested distributions, changes in net asset value and the effect of the maximum sales charge unless otherwise stated.
Average Annual Total Returns
As of 9/30/11, the most recent calendar quarter-end, including maximum applicable sales charges
| | | | | | | | | |
|
| Class A Shares | | | | |
| |
| Inception (3/31/06) | | | 5.29 | % |
| |
| | 5 Years | | | 4.78 | |
| |
| | 1 Year | | | -1.23 | |
| |
| | | | | | | | | |
| Class B Shares | | | | |
| |
| Inception (3/31/06) | | | 5.27 | % |
| |
| | 5 Years | | | 4.69 | |
| |
| | 1 Year | | | -1.85 | |
| |
| | | | | | | | | |
| Class C Shares | | | | |
| |
| Inception (3/31/06) | | | 5.42 | % |
| |
| | 5 Years | | | 5.02 | |
| |
| | 1 Year | | | 1.96 | |
| |
| | | | | | | | | |
| Class Y Shares | | | | |
| |
| Inception | | | 6.36 | % |
| |
| | 5 Years | | | 5.96 | |
| |
| | 1 Year | | | 3.98 | |
| |
| | | | | | | | | |
| Institutional Class Shares | | | | |
| |
| Inception (3/31/06) | | | 6.48 | % |
| |
| | 5 Years | | | 6.08 | |
| |
| | 1 Year | | | 3.89 | |
Investment return and principal value will fluctuate so that you may have a gain or loss when you sell shares.
The net annual Fund operating expense ratio set forth in the most recent Fund prospectus as of the date of this report for Class A, Class B, Class C, Class Y and Institutional Class shares was 1.10%, 1.85%, 1.85%, 0.85% and 0.85%, respectively.1 The total annual Fund operating expense ratio set forth in the most recent Fund prospectus as of the date of this report for Class A, Class B, Class C, Class Y and Institutional Class shares was 1.55%, 2.30%, 2.30%, 1.30% and 1.03%, respectively. The expense ratios presented above may vary from
the expense ratios presented in other sections of this report that are based on expenses incurred during the period covered by this report.
Class A share performance reflects the maximum 4.75% sales charge, and Class B and Class C share performance reflects the applicable contingent deferred sales charge (CDSC) for the period involved. The CDSC on Class B shares declines from 5% beginning at the time of purchase to 0% at the beginning of the seventh year. The CDSC on Class C shares is 1% for the first year after purchase. Class Y and Institutional Class shares do not have a front-end sales charge or a CDSC; therefore, performance is at net asset value.
The performance of the Fund’s share classes will differ primarily due to different sales charge structures and class expenses.
Had the adviser not waived fees and/or reimbursed expenses, performance would have been lower.
A redemption fee of 2% is imposed on certain redemptions or exchanges out of the Fund within 31 days of purchase. Exceptions to the redemption fee are listed in the Fund’s prospectus. Effective January 1, 2012, after the close of the reporting period, the Fund will eliminate the redemption fee, if applicable, assessed on shares of the Fund redeemed or exchanged within 31 days of purchase.
| 1 | | Total annual Fund operating expenses after any contractual fee waivers and/or expense reimbursements by the adviser in effect through at least February 28, 2012. See current prospectus for more information. |
continued from page 6
Other information
| n | | The Chartered Financial Analyst® (CFA®) designation is globally recognized and attests to a charterholder’s success in a rigorous and comprehensive study program in the field of investment management and research analysis. |
| |
| n | | The returns shown in management’s discussion of Fund performance are based on net asset values calculated for shareholder transactions. Generally accepted accounting principles require adjustments to be made to the net |
| | | assets of the Fund at period end for financial reporting purposes, and as such, the net asset values for shareholder transactions and the returns based on those net asset values may differ from the net asset values and returns reported in the Financial Highlights. |
| |
| n | | Industry classifications used in this report are generally according to the Global Industry Classification Standard, which was developed by and is the exclusive property and a service mark of MSCI Inc. and Standard & Poor’s. |
| 7 | | Invesco International Total Return Fund |
Invesco International Total Return Fund’s investment objective is total return, comprised of current income and capital appreciation.
| n | | Unless otherwise stated, information presented in this report is as of October 31, 2011, and is based on total net assets. |
| |
| n | | Unless otherwise noted, all data provided by Invesco. |
| |
| n | | To access your Fund’s reports/prospectus, visit invesco.com/fundreports. |
About share classes
| n | | Class B shares may not be purchased or acquired by exchange from share classes other than Class B shares. Please see the prospectus for more information. |
| |
| n | | Class Y shares are available to only certain investors. Please see the prospectus for more information. |
| |
| n | | Institutional Class shares are offered exclusively to institutional investors, including defined contribution plans that meet certain criteria. Please see the prospectus for more information. |
Principal risks of investing in the Fund
| n | | Active trading risk. The Fund engages in frequent trading of portfolio securities. Active trading results in added expenses and may result in a lower return and increased tax liability. |
| |
| n | | Credit risk. The issuer of instruments in which the Fund invests may be unable to meet interest and/or principal payments, thereby causing its instruments to decrease in value and lowering the issuer’s credit rating. |
| |
| n | | Currency/exchange rate risk. The dollar value of the Fund’s foreign investments will be affected by changes in the exchange rates between the dollar and the currencies in which those investments are traded. |
| |
| n | | Derivatives risk. Derivatives may be more difficult to purchase, sell or value than other investments and may be subject to market, interest rate, credit, leverage, counterparty and management risks. A fund investing in a derivative could lose more than the cash amount invested or incur higher taxes. Over-the-counter derivatives are also subject to counterparty risk, which is the risk that the other party to the contract will not fulfill its contractual obligation to complete the transaction with the Fund. |
| |
| n | | Developing markets securities risk. Securities issued by foreign companies and governments located in developing countries may be affected more negatively by inflation, devaluation of their currencies, higher transaction costs, delays in settlement, adverse political developments, the introduction of capital controls, withholding taxes, nationalization of private assets, expropriation, social unrest, war or lack of timely information than those in developed countries. |
| |
| n | | Dollar roll transactions risk. Dollar roll transactions involve the risk that the market value and yield of the securities retained by the Fund may decline below the price of the mortgage-related securities sold by the Fund that it is obligated to repurchase. |
| |
| n | | Foreign securities risk. The Fund’s foreign investments may be affected by changes in a foreign country’s exchange rates; political and social instability; changes in economic or taxation policies; difficulties when enforcing obligations; decreased liquidity; and increased volatility. Foreign companies may be subject to less regulation resulting in less publicly available information about the companies. |
| |
| n | | High yield bond (junk bond) risk. Junk bonds involve a greater risk of default or price changes due to changes in the credit quality of the issuer. The values of junk bonds fluctuate more than those of high quality bonds in response to company, political, regulatory or economic developments. Values of junk bonds can decline significantly over short periods of time. |
| |
| n | | Interest rate risk. Interest rate risk refers to the risk that bond prices generally fall as interest rates rise; conversely, bond prices generally rise as interest rates fall. Specific bonds differ in their sensitivity to changes in interest rates depending on their individual characteristics, including duration. |
| |
| n | | Leverage risk. Leverage exists when the Fund purchases or sells an instrument or enters into a transaction without investing cash in an amount equal to the full economic exposure of the instrument or transaction and the Fund could lose more than it invested. Leverage created from borrowing or certain types of transactions or instruments, including derivatives, may impair the Fund’s liquidity, cause it to liquidate positions at an unfavorable time, increase volatility or otherwise not achieve its intended objective. |
| |
| n | | Management risk. The investment techniques and risk analysis used by the Fund’s portfolio managers may not produce the desired results. |
| |
| n | | Market risk. The prices of and the income generated by the Fund’s securities may decline in response to, among other things, investor sentiment; general economic and market conditions; regional or global instability; and currency and interest rate fluctuations. |
| |
| n | | Mortgage- and asset-backed securities risk. The Fund may invest in mortgage- and asset-backed securities that are subject to prepayment or call risk, which is the risk that the borrower’s payments may be received earlier or later than expected due to changes in prepayment rates on underlying loans. Faster prepayments often happen when interest rates are falling. As a result, the Fund may reinvest these early payments at lower interest rates, thereby reducing the Fund’s income. Conversely, when interest rates rise, prepayments may happen more slowly, causing the security to lengthen in duration. Longer duration securities tend to be more volatile. Securities may be prepaid at a price less than the original purchase value. The risk of such defaults is generally higher in the case of mortgage pools that include subprime mortgages. Subprime mortgages refer to loans made to |
continued on page 6
This report must be accompanied or preceded by a currently effective Fund prospectus, which contains more complete information, including sales charges and expenses. Investors should read it carefully before investing.
NOT FDIC INSURED | MAY LOSE VALUE | NO BANK GUARANTEE
Fund Nasdaq Symbols
| | | | | |
|
| Class A Shares | | AUBAX |
| Class B Shares | | AUBBX |
| Class C Shares | | AUBCX |
| Class Y Shares | | AUBYX |
| Institutional Class Shares | | AUBIX |
| 8 | | Invesco International Total Return Fund |
Schedule of Investments
October 31, 2011
| | | | | | | | | |
| | | Principal
| | |
| | | Amount | | Value |
| |
Non U.S. Dollar Denominated Bonds & Notes–95.60%(a)
|
Belgium–1.31%
| | | | |
| Anheuser Busch Inbev S.A., Sr. Unsec. Gtd. Medium-Term Euro Notes, 6.57%, 02/27/14 | | EUR | 600,000 | | | $ | 916,504 | |
| |
Canada–6.99%
| | | | |
Canada Housing Trust No. 1, Sec. Gtd. Global Mortgage-Backed Notes, 3.80%, 06/15/21(b) | | CAD | 1,500,000 | | | | 1,629,042 | |
| |
Province of Ontario,
Sr. Unsec. Floating Rate Medium-Term Notes, 1.46%, 06/27/16(c) | | CAD | 800,000 | | | | 796,416 | |
| |
| Sr. Unsec. Medium-Term Euro Notes, 2.00%, 12/10/13 | | GBP | 1,050,000 | | | | 1,722,314 | |
| |
| Province of Quebec, Bonds, 4.25%, 12/01/43 | | CAD | 700,000 | | | | 735,838 | |
| |
| | | | | | | | 4,883,610 | |
| |
Cayman Islands–0.40%
| | | | |
IPIC Ltd., REGS, Unsec. Unsub. Gtd. Medium-Term Euro Notes, 5.88%, 03/14/21(b) | | EUR | 200,000 | | | | 276,878 | |
| |
Denmark–0.59%
| | | | |
Jyske Bank A/S, Sr. Unsec. Floating Rate Medium-Term Euro Notes, 2.79%, 11/25/13(c) | | EUR | 300,000 | | | | 410,371 | |
| |
Finland–0.26%
| | | | |
| Nokia Corp., Sr. Unsec. Medium-Term Euro Notes, 6.75%, 02/04/19 | | EUR | 125,000 | | | | 184,650 | |
| |
France–10.24%
| | | | |
AXA S.A., Jr. Unsec. Sub. Medium-Term Euro Notes, 6.77%(d) | | GBP | 75,000 | | | | 89,853 | |
| |
| BNP Paribas Home Loan S.A., Sr. Sec. Mortgage-Backed Euro Bonds, 2.25%, 10/01/12 | | EUR | 650,000 | | | | 901,635 | |
| |
| Casino Guichard Perrachon S.A., Series 27, Tranche 1, Sr. Unsec. Medium-Term Euro Notes, 4.47%, 04/04/16 | | EUR | 200,000 | | | | 281,743 | |
| |
Dexia Municipal Agency S.A.,
Series 172, Tranche 2, Sr. Sec. Medium-Term Euro Notes, 0.80%, 05/21/12 | | JPY | 150,000,000 | | | | 1,895,224 | |
| |
Series 301, Tranche 1, Sr. Sec. Medium-Term Euro Notes, 1.55%, 10/31/13 | | JPY | 100,000,000 | | | | 1,247,148 | |
| |
Sr. Sec. Medium-Term Euro Notes, 1.80%, 05/09/17 | | JPY | 189,000,000 | | | | 2,133,469 | |
| |
| France Government, Euro Bonds, 4.00%, 10/25/38 | | EUR | 360,000 | | | | 507,466 | |
| |
Societe Generale S.A., Jr. Unsec. Sub. Euro Bonds, 7.00%(d) | | EUR | 100,000 | | | | 99,626 | |
| |
| | | | | | | | 7,156,164 | |
| |
Germany–10.41%
| | | | |
| Bundesrepublik Deutschland, Series 05, Euro Bonds, 4.00%, 01/04/37 | | EUR | 1,350,000 | | | | 2,251,519 | |
| |
| EnBW Energie Baden-Wuerttemberg AG, Sr. Unsec. Medium-Term Euro Notes, 7.38%, 04/02/72 | | EUR | 120,000 | | | | 167,839 | |
| |
Kreditanstalt fuer Wiederaufbau,
Sr. Unsec. Gtd. Global Notes, 2.05%, 02/16/26 | | JPY | 150,000,000 | | | | 2,059,048 | |
| |
Unsec. Unsub. Gtd. Global Notes, 2.00%, 09/07/16 | | EUR | 2,000,000 | | | | 2,802,618 | |
| |
| | | | | | | | 7,281,024 | |
| |
Ireland–0.41%
| | | | |
| Cloverie PLC for Zurich Insurance Co. Ltd., Sub. Medium-Term Euro Notes, 7.50%, 07/24/39 | | EUR | 200,000 | | | | 288,169 | |
| |
Italy–10.24%
| | | | |
| Banca Monte dei Paschi di Siena S.p.A., Sr. Unsec. Medium-Term Euro Notes, 4.13%, 11/11/13 | | EUR | 300,000 | | | | 405,964 | |
| |
| Intesa Sanpaolo S.p.A., Jr. Unsec. Sub. Medium-Term Euro Notes, 6.63%, 05/08/18 | | EUR | 200,000 | | | | 241,160 | |
| |
Italy Buoni Poliennali Del Tesoro,
Euro Bonds, 4.25%, 07/01/14 | | EUR | 3,500,000 | | | | 4,707,846 | |
| |
Sr. Unsec. Euro Bonds, 4.75%, 08/01/23 | | EUR | 1,000,000 | | | | 1,206,719 | |
| |
| Societa Iniziative Autostradali e Servizi S.p.A., Sr. Sec. Medium-Term Euro Notes, 4.50%, 10/26/20 | | EUR | 200,000 | | | | 244,228 | |
| |
| Telecom Italia S.p.A, Sr. Unsec. Medium-Term Euro Notes, 7.00%, 01/20/17 | | EUR | 250,000 | | | | 356,099 | |
| |
| | | | | | | | 7,162,016 | |
| |
Japan–3.41%
| | | | |
Development Bank of Japan,
Unsec. Gtd. Global Bonds, 1.70%, 09/20/22 | | JPY | 35,000,000 | | | | 470,288 | |
| |
Unsec. Gtd. Global Notes, 1.05%, 06/20/23 | | JPY | 45,000,000 | | | | 561,788 | |
| |
| Japan Government Thirty Years, Series 31, Sr. Unsec. Bonds, 2.20%, 09/20/39 | | JPY | 100,000,000 | | | | 1,349,467 | |
| |
| | | | | | | | 2,381,543 | |
| |
Luxembourg–5.17%
| | | | |
| Arcelormittal, Sr. Unsec. Euro Bonds, 9.38%, 06/03/16 | | EUR | 175,000 | | | | 276,750 | |
| |
| Enel Finance International NV, Sr. Unsec. Gtd. Medium-Term Euro Notes, 5.00%, 07/12/21 | | EUR | 270,000 | | | | 361,162 | |
| |
| Gazprom OAO Via Gaz Capital S.A., Sr. Unsec. Euro Bonds, 2.89%, 11/15/12 | | JPY | 200,000,000 | | | | 2,541,724 | |
| |
See accompanying Notes to Financial Statements which are an integral part of the financial statements.
9 Invesco International Total Return Fund
| | | | | | | | | |
| | | Principal
| | |
| | | Amount | | Value |
| |
Luxembourg–(continued)
| | | | |
| | | | | | | | | |
| Glencore Finance Europe S.A., Series 6, Tranche 1, Sr. Unsec. Gtd. Medium-Term Euro Notes, 5.25%, 10/11/13 | | EUR | 300,000 | | | $ | 435,866 | |
| |
| | | | | | | | 3,615,502 | |
| |
Mexico–0.37%
| | | | |
| Mexican Bonos, Series M, Bonds, 7.50%, 06/21/12 | | MXN | 3,400,000 | | | | 260,371 | |
| |
Netherlands–4.07%
| | | | |
| ASML Holding N.V., Sr. Unsec. Euro Bonds, 5.75%, 06/13/17 | | EUR | 200,000 | | | | 298,043 | |
| |
| EDP Finance BV, Series 11, Sr. Unsec. Medium-Term Euro Notes, 4.25%, 06/12/12 | | EUR | 140,000 | | | | 193,687 | |
| |
| F Van Lanschot Bankiers N.V., Sr. Unsec. Medium-Term Euro Notes, 3.50%, 04/02/13 | | EUR | 600,000 | | | | 824,352 | |
| |
| ING Bank N.V., Sec. Mortgage-Backed Medium-Term Euro Notes, 3.00%, 09/30/14 | | EUR | 550,000 | | | | 782,254 | |
| |
Schiphol Nederland B.V., Sr. Unsec. Gtd. Medium-Term Euro Notes, 4.43%, 04/28/21 | | EUR | 200,000 | | | | 289,589 | |
| |
| 6.63%, 01/23/14 | | EUR | 300,000 | | | | 455,924 | |
| |
| | | | | | | | 2,843,849 | |
| |
Poland–7.72%
| | | | |
Poland Government,
Series 0416, Bonds, 5.00%, 04/25/16 | | PLN | 5,000,000 | | | | 1,581,144 | |
| |
Series 3BR, Sr. Unsec. Bonds, 1.00%, 06/20/12 | | JPY | 200,000,000 | | | | 2,539,245 | |
| |
Series 8, Sr. Unsec. Bonds, 1.92%, 11/13/12 | | JPY | 100,000,000 | | | | 1,277,941 | |
| |
| | | | | | | | 5,398,330 | |
| |
Singapore–0.45%
| | | | |
| Singapore Government, Sr. Unsec. Bonds, 2.25%, 06/01/21 | | SGD | 375,000 | | | | 312,917 | |
| |
South Korea–1.80%
| | | | |
| Korea Treasury, Series 1609, Sr. Unsec. Bonds, 3.50%, 09/10/16 | | KRW | 1,400,000,000 | | | | 1,256,441 | |
| |
Spain–4.57%
| | | | |
| Bankia S.A., Sec. Mortgage-Backed Medium-Term Euro Bonds, 4.88%, 03/31/14 | | EUR | 200,000 | | | | 275,715 | |
| |
BBVA Senior Finance SAU-REGS, Sr. Unsec. Gtd. Medium-Term Euro Notes, 4.00%, 03/22/13(b) | | EUR | 200,000 | | | | 276,304 | |
| |
| BBVA Subordinated Capital SAU, Unsec. Gtd. Sub. Medium-Term Euro Notes, 5.75%, 03/11/18 | | GBP | 150,000 | | | | 208,719 | |
| |
| CaixaBank, Sec. Mortgage-Backed Euro Bonds, 3.13%, 09/16/13 | | EUR | 200,000 | | | | 271,740 | |
| |
| Santader International Debt S.A. Unipersonal, Sr. Unsec. Gtd. Medium-Term Euro Notes, 3.75%, 02/28/13 | | EUR | 200,000 | | | | 276,066 | |
| |
| Spain Government, Sr. Unsec. Euro Bonds, 4.85%, 10/31/20 | | EUR | 1,100,000 | | | | 1,463,151 | |
| |
Telefonica Emisiones SAU,
Sr. Unsec. Gtd. Medium-Term Euro Notes, 5.50%, 04/01/16 | | EUR | 100,000 | | | | 144,800 | |
| |
REGS, Sr. Unsec. Gtd. Medium-Term Euro Notes, 4.75%, 02/07/17(b) | | EUR | 200,000 | | | | 278,253 | |
| |
| | | | | | | | 3,194,748 | |
| |
Supranational–9.26%
| | | | |
Asian Development Bank, Series 339-00-1, Sr. Unsec. Medium-Term Global Notes, 2.35%, 06/21/27 | | JPY | 130,000,000 | | | | 1,836,344 | |
| |
European Investment Bank,
Sr. Unsec. Global Bonds, 1.40%, 06/20/17 | | JPY | 120,000,000 | | | | 1,607,113 | |
| |
Sr. Unsec. Medium-Term Euro Bonds, 4.50%, 08/12/17 | | SEK | 4,000,000 | | | | 666,999 | |
| |
Sr. Unsec. Medium-Term Notes, 6.00%, 08/06/20 | | AUD | 1,400,000 | | | | 1,498,038 | |
| |
Sr. Unsec. Euro Notes, 2.38%, 07/10/20 | | CHF | 700,000 | | | | 864,361 | |
| |
| | | | | | | | 6,472,855 | |
| |
United Kingdom–11.89%
| | | | |
| Bat International Finance PLC, Sr. Unsec. Gtd. Medium-Term Euro Notes, 5.88%, 03/12/15 | | EUR | 450,000 | | | | 693,098 | |
| |
| Carnival PLC, Unsec. Gtd. Euro Notes, 7.13%, 06/25/12 | | GBP | 500,000 | | | | 828,271 | |
| |
| Co-Operative Group Ltd., Sr. Unsec. Gtd. Euro Notes, 5.63%, 07/08/20 | | GBP | 300,000 | | | | 485,565 | |
| |
| FCE Bank PLC, Sr. Unsec. Medium-Term Euro Notes, 5.13%, 11/16/15 | | GBP | 50,000 | | | | 80,194 | |
| |
| Imperial Tobacco Finance PLC, Series 19, Tranche 1, Sr. Unsec. Gtd. Medium-Term Euro Notes, 4.38%, 11/22/13 | | EUR | 500,000 | | | | 717,031 | |
| |
Infinis PLC, REGS, Sr. Sec. Euro Notes, 9.13%, 12/15/14(b) | | GBP | 100,000 | | | | 162,800 | |
| |
International Power Finance 2010 PLC, REGS, Sr. Unsec. Gtd. Euro Notes, 7.25%, 05/11/17(b) | | EUR | 150,000 | | | | 229,819 | |
| |
ISS Financing PLC, REGS, Sec. Euro Bonds, 11.00%, 06/15/14(b) | | EUR | 200,000 | | | | 291,269 | |
| |
Lloyds TSB Bank PLC, REGS, Sr. Unsec. Medium-Term Euro Notes, 4.50%, 09/15/14(b) | | EUR | 400,000 | | | | 552,508 | |
| |
Permanent Master Issuer PLC, Series 2009-1, Class A3, Floating Rate Pass Through Ctfs., 3.27%, 07/15/42(c) (Cost $739,913) | | EUR | 500,000 | | | | 695,124 | |
| |
| Royal Bank of Scotland PLC (The), Unsec. Sub. Medium-Term Euro Notes, 6.93%, 04/09/18 | | EUR | 375,000 | | | | 445,866 | |
| |
United Kingdom Treasury, Bonds,
3.75%, 09/07/21 | | GBP | 600,000 | | | | 1,072,243 | |
| |
| 4.25%, 12/07/40 | | GBP | 260,000 | | | | 483,495 | |
| |
| 4.75%, 12/07/38 | | GBP | 780,000 | | | | 1,566,862 | |
| |
| | | | | | | | 8,304,145 | |
| |
| | | | | | | | | |
| | | | | | | | | |
See accompanying Notes to Financial Statements which are an integral part of the financial statements.
10 Invesco International Total Return Fund
| | | | | | | | | |
| | | Principal
| | |
| | | Amount | | Value |
| |
United States–6.04%
| | | | |
| Bank of America Corp., Sr. Unsec. Medium-Term Euro Notes, 7.00%, 06/15/16 | | EUR | 400,000 | | | $ | 578,055 | |
| |
| General Electric Capital Corp., Sr. Unsec. Medium-Term Euro Notes, 1.00%, 03/21/12 | | JPY | 230,000,000 | | | | 2,942,544 | |
| |
| Morgan Stanley, Sr. Unsec. Medium-Term Euro Notes, 5.38%, 08/10/20 | | EUR | 300,000 | | | | 391,165 | |
| |
Nalco Co.-REGS, Sr. Unsec. Gtd. Euro Notes, 6.88%, 01/15/19(b) | | EUR | 200,000 | | | | 307,170 | |
| |
| | | | | | | | 4,218,934 | |
| |
| Total Non U.S. Dollar Denominated Bonds & Notes (Cost $65,281,485) | | | | | | | 66,819,021 | |
| |
| | | | | | | | | |
| |
Money Market Funds–1.70%
|
Liquid Assets Portfolio–Institutional Class(e) | | | 594,997 | | | | 594,997 | |
| |
Premier Portfolio–Institutional Class(e) | | | 594,997 | | | | 594,997 | |
| |
| Total Money Market Funds (Cost $1,189,994) | | | 1,189,994 | |
| |
| TOTAL INVESTMENTS–97.30% (Cost $66,471,479) | | | 68,009,015 | |
| |
| OTHER ASSETS LESS LIABILITIES–2.70% | | | | | | | 1,887,586 | |
| |
| NET ASSETS–100.00% | | | | | | $ | 69,896,601 | |
| |
Investment Abbreviations:
| | | |
| AUD | | – Australian Dollar |
| CAD | | – Canadian Dollar |
| CHF | | – Swiss Franc |
| Ctfs. | | – Certificates |
| EUR | | – Euro |
| GBP | | – British Pound Sterling |
| Gtd. | | – Guaranteed |
| JPY | | – Japanese Yen |
| Jr. | | – Junior |
| KRW | | – South Korean Won |
| MXN | | – Mexican Peso |
| PLN | | – Poland Zloty |
| REGS | | – Regulation S |
| Sec. | | – Secured |
| SEK | | – Swedish Krona |
| SGD | | – Singapore Dollar |
| Sr. | | – Senior |
| Sub. | | – Subordinated |
| Unsec. | | – Unsecured |
| Unsub. | | – Unsubordinated |
Notes to Schedule of Investments:
| | |
| (a) | | Foreign denominated security. Principal amount is denominated in currency indicated. |
| (b) | | Security purchased or received in a transaction exempt from registration under the Securities Act of 1933, as amended. The security may be resold pursuant to an exemption from registration under the 1933 Act, typically to qualified institutional buyers. The aggregate value of these securities at October 31, 2011 was $4,004,043, which represented 5.73% of the Trust’s Net Assets. |
| (c) | | Interest or dividend rate is redetermined periodically. Rate shown is the rate in effect on October 31, 2011. |
| (d) | | Perpetual bond with no specified maturity date. |
| (e) | | The money market fund and the Fund are affiliated by having the same investment adviser. |
See accompanying Notes to Financial Statements which are an integral part of the financial statements.
11 Invesco International Total Return Fund
Statement of Assets and Liabilities
October 31, 2011
| | | | | |
Assets:
|
| Investments, at value (Cost $65,281,485) | | $ | 66,819,021 | |
| |
| Investments in affiliated money market funds, at value and cost | | | 1,189,994 | |
| |
| Total investments, at value (Cost $66,471,479) | | | 68,009,015 | |
| |
| Foreign currencies, at value (Cost $873,768) | | | 769,748 | |
| |
| Receivable for: | | | | |
| Deposits with brokers for open futures contracts | | | 110,787 | |
| |
| Investments sold | | | 701,340 | |
| |
| Variation margin | | | 2,032 | |
| |
| Fund shares sold | | | 256,196 | |
| |
| Dividends and interest | | | 851,825 | |
| |
| Investment for trustee deferred compensation and retirement plans | | | 10,355 | |
| |
| Other assets | | | 110,796 | |
| |
| Total assets | | | 70,822,094 | |
| |
Liabilities:
|
| Payable for: | | | | |
| Investments purchased | | | 696,186 | |
| |
| Fund shares reacquired | | | 103,578 | |
| |
| Foreign currency contracts outstanding | | | 2,392 | |
| |
| Accrued fees to affiliates | | | 39,014 | |
| |
| Accrued other operating expenses | | | 69,596 | |
| |
| Trustee deferred compensation and retirement plans | | | 14,727 | |
| |
| Total liabilities | | | 925,493 | |
| |
| Net assets applicable to shares outstanding | | $ | 69,896,601 | |
| |
Net assets consist of:
|
| Shares of beneficial interest | | $ | 65,433,857 | |
| |
| Undistributed net investment income | | | 2,201,494 | |
| |
| Undistributed net realized gain | | | 728,007 | |
| |
| Unrealized appreciation | | | 1,533,243 | |
| |
| | | $ | 69,896,601 | |
| |
Net assets:
|
| Class A | | $ | 47,161,842 | |
| |
| Class B | | $ | 5,933,986 | |
| |
| Class C | | $ | 10,782,413 | |
| |
| Class Y | | $ | 1,322,337 | |
| |
| Institutional Class | | $ | 4,696,023 | |
| |
Shares outstanding, $0.01 par value per share, with an unlimited number of shares authorized:
|
| Class A | | | 4,054,423 | |
| |
| Class B | | | 511,222 | |
| |
| Class C | | | 928,667 | |
| |
| Class Y | | | 113,700 | |
| |
| Institutional Class | | | 403,629 | |
| |
| Class A: | | | | |
| Net asset value per share | | $ | 11.63 | |
| |
| Maximum offering price per share | | | | |
| (Net asset value of $11.63 divided by 95.25%) | | $ | 12.21 | |
| |
| Class B: | | | | |
| Net asset value and offering price per share | | $ | 11.61 | |
| |
| Class C: | | | | |
| Net asset value and offering price per share | | $ | 11.61 | |
| |
| Class Y: | | | | |
| Net asset value and offering price per share | | $ | 11.63 | |
| |
| Institutional Class: | | | | |
| Net asset value and offering price per share | | $ | 11.63 | |
| |
See accompanying Notes to Financial Statements which are an integral part of the financial statements.
12 Invesco International Total Return Fund
Statement of Operations
For the year ended October 31, 2011
| | | | | |
Investment income:
|
| Interest (net of foreign withholding taxes of $4,223) | | $ | 1,544,925 | |
| |
| Dividends from affiliated money market funds | | | 1,000 | |
| |
| Total investment income | | | 1,545,925 | |
| |
Expenses:
|
| Advisory fees | | | 366,546 | |
| |
| Administrative services fees | | | 50,000 | |
| |
| Custodian fees | | | 20,656 | |
| |
| Distribution fees: | | | | |
| | | | | |
| Class A | | | 91,997 | |
| |
| Class B | | | 59,477 | |
| |
| Class C | | | 85,329 | |
| |
| Transfer agent fees — A, B, C and Y | | | 135,600 | |
| |
| Transfer agent fees — Institutional | | | 552 | |
| |
| Trustees’ and officers’ fees and benefits | | | 18,190 | |
| |
| Registration and filing fees | | | 62,134 | |
| |
| Other | | | 85,772 | |
| |
| Total expenses | | | 976,253 | |
| |
| Less: Fees waived, expenses reimbursed and expense offset arrangement(s) | | | Notes (261,846 | ) |
| |
| Net expenses | | | 714,407 | |
| |
| Net investment income | | | 831,518 | |
| |
Realized and unrealized gain (loss) from:
|
| Net realized gain (loss) from: | | | | |
| Investment securities | | | 2,651,366 | |
| |
| Foreign currencies | | | (3,249 | ) |
| |
| Foreign currency contracts | | | 169,761 | |
| |
| Futures contracts | | | 29,654 | |
| |
| | | | 2,847,532 | |
| |
| Change in net unrealized appreciation (depreciation) of: | | | | |
| Investment securities | | | (2,604,424 | ) |
| |
| Foreign currencies | | | (113,893 | ) |
| |
| Foreign currency contracts | | | 24,049 | |
| |
| Futures contracts | | | 13,512 | |
| |
| | | | (2,680,756 | ) |
| |
| Net realized and unrealized gain | | | 166,776 | |
| |
| Net increase in net assets resulting from operations | | $ | 998,294 | |
| |
See accompanying Notes to Financial Statements which are an integral part of the financial statements.
13 Invesco International Total Return Fund
Statement of Changes in Net Assets
For the years ended October 31, 2011 and 2010
| | | | | | | | | |
| | | 2011 | | 2010 |
| |
Operations:
|
| Net investment income | | $ | 831,518 | | | $ | 1,127,850 | |
| |
| Net realized gain | | | 2,847,532 | | | | 3,391,064 | |
| |
| Change in net unrealized appreciation (depreciation) | | | (2,680,756 | ) | | | (1,719,933 | ) |
| |
| Net increase in net assets resulting from operations | | | 998,294 | | | | 2,798,981 | |
| |
Distributions to shareholders from net investment income:
|
| Class A | | | (1,688,264 | ) | | | (445,093 | ) |
| |
| Class B | | | (259,361 | ) | | | (49,253 | ) |
| |
| Class C | | | (361,736 | ) | | | (74,227 | ) |
| |
| Class Y | | | (28,171 | ) | | | (5,582 | ) |
| |
| Institutional Class | | | (227,338 | ) | | | (402,271 | ) |
| |
| Total distributions from net investment income | | | (2,564,870 | ) | | | (976,426 | ) |
| |
Distributions to shareholders from net realized gains:
|
| Class A | | | (976,342 | ) | | | — | |
| |
| Class B | | | (190,113 | ) | | | — | |
| |
| Class C | | | (263,923 | ) | | | — | |
| |
| Class Y | | | (15,498 | ) | | | — | |
| |
| Institutional Class | | | (130,713 | ) | | | — | |
| |
| Total distributions from net realized gains | | | (1,576,589 | ) | | | — | |
| |
Share transactions–net:
|
| Class A | | | 16,239,636 | | | | (753,363 | ) |
| |
| Class B | | | (315,311 | ) | | | (2,649,173 | ) |
| |
| Class C | | | 2,152,498 | | | | (4,941,936 | ) |
| |
| Class Y | | | 642,425 | | | | 407,750 | |
| |
| Institutional Class | | | 433,994 | | | | (22,665,389 | ) |
| |
| Net increase (decrease) in net assets resulting from share transactions | | | 19,153,242 | | | | (30,602,111 | ) |
| |
| Net increase (decrease) in net assets | | | 16,010,077 | | | | (28,779,556 | ) |
| |
Net assets:
|
| Beginning of year | | | 53,886,524 | | | | 82,666,080 | |
| |
| End of year (includes undistributed net investment income of $2,201,494 and $1,872,054, respectively) | | $ | 69,896,601 | | | $ | 53,886,524 | |
| |
Notes to Financial Statements
October 31, 2011
NOTE 1—Significant Accounting Policies
Invesco International Total Return Fund (the “Fund”) is a series portfolio of AIM Investment Funds (Invesco Investment Funds) (the “Trust”). The Trust is organized as a Delaware statutory trust and is registered under the Investment Company Act of 1940, as amended (the “1940 Act”), as an open-end series management investment company consisting of thirteen separate series portfolios, each authorized to issue an unlimited number of shares of beneficial interest. The assets, liabilities and operations of each portfolio are accounted for separately. Information presented in these financial statements pertains only to the Fund. Matters affecting each portfolio or class will be voted on exclusively by the shareholders of such portfolio or class.
The Fund’s investment objective is total return, comprised of current income and capital appreciation.
The Fund currently consists of five different classes of shares: Class A, Class B, Class C, Class Y and Institutional Class. Class A shares are sold with a front-end sales charge unless certain waiver criteria are met and under certain circumstances load waived shares may be subject to contingent deferred sales charges (“CDSC”). Class C shares are sold with a CDSC. Class Y and Institutional Class shares are sold at net asset value. Effective November 30, 2010, new or
14 Invesco International Total Return Fund
additional investments in Class B shares are no longer permitted. Existing shareholders of Class B shares may continue to reinvest dividends and capital gains distributions in Class B shares until they convert. Also, shareholders in Class B shares will be able to exchange those shares for Class B shares of other Invesco Funds offering such shares until they convert. Generally, Class B shares will automatically convert to Class A shares on or about the month-end which is at least eight years after the date of purchase. Redemption of Class B shares prior to conversion date will be subject to a CDSC.
The following is a summary of the significant accounting policies followed by the Fund in the preparation of its financial statements.
| | |
| A. | | Security Valuations — Securities, including restricted securities, are valued according to the following policy. |
| | Debt obligations (including convertible bonds) and unlisted equities are fair valued using an evaluated quote provided by an independent pricing service. Evaluated quotes provided by the pricing service may be determined without exclusive reliance on quoted prices, and may reflect appropriate factors such as institution-size trading in similar groups of securities, developments related to specific securities, dividend rate, yield, quality, type of issue, coupon rate, maturity, individual trading characteristics and other market data. Debt securities are subject to interest rate and credit risks. In addition, all debt securities involve some risk of default with respect to interest and/or principal payments. |
| | A security listed or traded on an exchange (except convertible bonds) is valued at its last sales price or official closing price as of the close of the customary trading session on the exchange where the security is principally traded, or lacking any sales or official closing price on a particular day, the security may be valued at the closing bid price on that day. Securities traded in the over-the-counter market are valued based on prices furnished by independent pricing services or market makers. When such securities are valued by an independent pricing service they may be considered fair valued. Futures contracts are valued at the final settlement price set by an exchange on which they are principally traded. Listed options are valued at the mean between the last bid and ask prices from the exchange on which they are principally traded. Options not listed on an exchange are valued by an independent source at the mean between the last bid and ask prices. For purposes of determining net asset value per share, futures and option contracts generally are valued 15 minutes after the close of the customary trading session of the New York Stock Exchange (“NYSE”). |
| | Investments in open-end and closed-end registered investment companies that do not trade on an exchange are valued at the end of day net asset value per share. Investments in open-end and closed-end registered investment companies that trade on an exchange are valued at the last sales price or official closing price as of the close of the customary trading session on the exchange where the security is principally traded. |
| | Foreign securities (including foreign exchange contracts) are converted into U.S. dollar amounts using the applicable exchange rates as of the close of the NYSE. If market quotations are available and reliable for foreign exchange traded equity securities, the securities will be valued at the market quotations. Because trading hours for certain foreign securities end before the close of the NYSE, closing market quotations may become unreliable. If between the time trading ends on a particular security and the close of the customary trading session on the NYSE, events occur that are significant and make the closing price unreliable, the Fund may fair value the security. If the event is likely to have affected the closing price of the security, the security will be valued at fair value in good faith using procedures approved by the Board of Trustees. Adjustments to closing prices to reflect fair value may also be based on a screening process of an independent pricing service to indicate the degree of certainty, based on historical data, that the closing price in the principal market where a foreign security trade is not the current value as of the close of the NYSE. Foreign securities meeting the approved degree of certainty that the price is not reflective of current value will be priced at the indication of fair value from the independent pricing service. Multiple factors may be considered by the independent pricing service in determining adjustments to reflect fair value and may include information relating to sector indices, American Depositary Receipts and domestic and foreign index futures. Foreign securities may have additional risks including exchange rate changes, potential for sharply devalued currencies and high inflation, political and economical upheaval, the relative lack of issuer information, relatively low market liquidity and the potential lack of strict financial and accounting controls and standards. |
| | Securities for which market prices are not provided by any of the above methods may be valued based upon quotes furnished by independent sources. The last bid price may be used to value equity securities. The mean between the last bid and asked prices is used to value debt obligations, including Corporate Loans. |
| | Securities for which market quotations are not readily available or are unreliable are valued at fair value as determined in good faith by or under the supervision of the Trust’s officers following procedures approved by the Board of Trustees. Issuer specific events, market trends, bid/ask quotes of brokers and information providers and other market data may be reviewed in the course of making a good faith determination of a security’s fair value. |
| | Valuations change in response to many factors including the historical and prospective earnings of the issuer, the value of the issuer’s assets, general economic conditions, interest rates, investor perceptions and market liquidity. Because of the inherent uncertainties of valuation, the values reflected in the financial statements may materially differ from the value received upon actual sale of those investments. |
| B. | | Securities Transactions and Investment Income — Securities transactions are accounted for on a trade date basis. Realized gains or losses on sales are computed on the basis of specific identification of the securities sold. Interest income is recorded on the accrual basis from settlement date. Dividend income (net of withholding tax, if any) is recorded on the ex-dividend date. Bond premiums and discounts are amortized and/or accreted for financial reporting purposes. |
| | The Fund may periodically participate in litigation related to Fund investments. As such, the Fund may receive proceeds from litigation settlements. Any proceeds received are included in the Statement of Operations as realized gain (loss) for investments no longer held and as unrealized gain (loss) for investments still held. |
| | Brokerage commissions and mark ups are considered transaction costs and are recorded as an increase to the cost basis of securities purchased and/or a reduction of proceeds on a sale of securities. Such transaction costs are included in the determination of net realized and unrealized gain (loss) from investment securities reported in the Statement of Operations and the Statement of Changes in Net Assets and the net realized and unrealized gains (losses) on securities per share in the Financial Highlights. Transaction costs are included in the calculation of the Fund’s net asset value and, accordingly, they reduce the Fund’s total returns. These transaction costs are not considered operating expenses and are not reflected in net investment income reported in the Statement of Operations and Statement of Changes in Net Assets, or the net investment income per share and ratios of expenses and net investment income reported in the Financial Highlights, nor are they limited by any expense limitation arrangements between the Fund and the investment adviser. |
| | The Fund allocates income and realized and unrealized capital gains and losses to a class based on the relative net assets of each class. |
15 Invesco International Total Return Fund
| | |
| C. | | Country Determination — For the purposes of making investment selection decisions and presentation in the Schedule of Investments, the investment adviser may determine the country in which an issuer is located and/or credit risk exposure based on various factors. These factors include the laws of the country under which the issuer is organized, where the issuer maintains a principal office, the country in which the issuer derives 50% or more of its total revenues and the country that has the primary market for the issuer’s securities, as well as other criteria. Among the other criteria that may be evaluated for making this determination are the country in which the issuer maintains 50% or more of its assets, the type of security, financial guarantees and enhancements, the nature of the collateral and the sponsor organization. Country of issuer and/or credit risk exposure has been determined to be the United States of America, unless otherwise noted. |
| D. | | Distributions — Distributions from income are declared and paid quarterly and are recorded on ex-dividend date. Distributions from net realized capital gain, if any, are generally paid annually and recorded on ex-dividend date. The Fund may elect to treat a portion of the proceeds from redemptions as distributions for federal income tax purposes. |
| E. | | Federal Income Taxes — The Fund intends to comply with the requirements of Subchapter M of the Internal Revenue Code necessary to qualify as a regulated investment company and to distribute substantially all of the Fund’s taxable earnings to shareholders. As such, the Fund will not be subject to federal income taxes on otherwise taxable income (including net realized capital gain) that is distributed to shareholders. Therefore, no provision for federal income taxes is recorded in the financial statements. |
| | The Fund files tax returns in the U.S. Federal jurisdiction and certain other jurisdictions. Generally, the Fund is subject to examinations by such taxing authorities for up to three years after the filing of the return for the tax period. |
| F. | | Expenses — Fees provided for under the Rule 12b-1 plan of a particular class of the Fund are charged to the operations of such class. Transfer agency fees and expenses and other shareholder recordkeeping fees and expenses attributable to the Institutional Class are charged to such class. Transfer agency fees and expenses and other shareholder recordkeeping fees and expenses relating to all other classes are allocated among those classes based on relative net assets. All other expenses are allocated among the classes based on relative net assets. |
| G. | | Accounting Estimates — The preparation of financial statements in conformity with accounting principles generally accepted in the United States of America (“GAAP”) requires management to make estimates and assumptions that affect the reported amounts of assets and liabilities at the date of the financial statements and the reported amounts of revenues and expenses during the reporting period including estimates and assumptions related to taxation. Actual results could differ from those estimates by a significant amount. In addition, the Fund monitors for material events or transactions that may occur or become known after the period-end date and before the date the financial statements are released to print. |
| H. | | Indemnifications — Under the Trust’s organizational documents, each Trustee, officer, employee or other agent of the Trust is indemnified against certain liabilities that may arise out of performance of their duties to the Fund. Additionally, in the normal course of business, the Fund enters into contracts, including the Fund’s servicing agreements that contain a variety of indemnification clauses. The Fund’s maximum exposure under these arrangements is unknown as this would involve future claims that may be made against the Fund that have not yet occurred. The risk of material loss as a result of such indemnification claims is considered remote. |
| I. | | Redemption Fees — The Fund has a 2% redemption fee that is to be retained by the Fund to offset transaction costs and other expenses associated with short-term redemptions and exchanges. The fee, subject to certain exceptions, is imposed on certain redemptions or exchanges of shares within 31 days of purchase. The redemption fee is recorded as an increase in shareholder capital and is allocated among the share classes based on the relative net assets of each class. Effective January 1, 2012, the Fund will eliminate the 2% redemption fee, if applicable, assessed on shares of the Fund redeemed or exchanged within 31 days of purchase. |
| J. | | Foreign Currency Translations — Foreign currency is valued at the close of the NYSE based on quotations posted by banks and major currency dealers. Portfolio securities and other assets and liabilities denominated in foreign currencies are translated into U.S. dollar amounts at date of valuation. Purchases and sales of portfolio securities (net of foreign taxes withheld on disposition) and income items denominated in foreign currencies are translated into U.S. dollar amounts on the respective dates of such transactions. The Fund does not separately account for the portion of the results of operations resulting from changes in foreign exchange rates on investments and the fluctuations arising from changes in market prices of securities held. The combined results of changes in foreign exchange rates and the fluctuation of market prices on investments (net of estimated foreign tax withholding) are included with the net realized and unrealized gain or loss from investments in the Statement of Operations. Reported net realized foreign currency gains or losses arise from (1) sales of foreign currencies, (2) currency gains or losses realized between the trade and settlement dates on securities transactions, and (3) the difference between the amounts of dividends, interest, and foreign withholding taxes recorded on the Fund’s books and the U.S. dollar equivalent of the amounts actually received or paid. Net unrealized foreign currency gains and losses arise from changes in the fair values of assets and liabilities, other than investments in securities at fiscal period end, resulting from changes in exchange rates. |
| | The Fund may invest in foreign securities which may be subject to foreign taxes on income, gains on investments or currency repatriation, a portion of which may be recoverable. |
| K. | | Foreign Currency Contracts — The Fund may enter into foreign currency contracts to manage or minimize currency or exchange rate risk. The Fund may also enter into foreign currency contracts for the purchase or sale of a security denominated in a foreign currency in order to “lock in” the U.S. dollar price of that security. A foreign currency contract is an obligation to purchase or sell a specific currency for an agreed-upon price at a future date. The use of foreign currency contracts does not eliminate fluctuations in the price of the underlying securities the Fund owns or intends to acquire but establishes a rate of exchange in advance. Fluctuations in the value of these contracts are measured by the difference in the contract date and reporting date exchange rates and are recorded as unrealized appreciation (depreciation) until the contracts are closed. When the contracts are closed, realized gains (losses) are recorded. Realized and unrealized gains (losses) on the contracts are included in the Statement of Operations. The primary risks associated with foreign currency contracts include failure of the counterparty to meet the terms of the contract and the value of the foreign currency changing unfavorably. These risks may be in excess of the amounts reflected in the Statement of Assets and Liabilities. |
| L. | | Futures Contracts — The Fund may enter into futures contracts to manage exposure to interest rate, equity and market price movements and/or currency risks. A futures contract is an agreement between two parties to purchase or sell a specified underlying security, currency or commodity (or |
16 Invesco International Total Return Fund
| | |
| | delivery of a cash settlement price, in the case of an index future) for a fixed price at a future date. The Fund currently invests only in exchange-traded futures and they are standardized as to maturity date and underlying financial instrument. Initial margin deposits required upon entering into futures contracts are satisfied by the segregation of specific securities or cash as collateral at the futures commission merchant (broker). During the period the futures contracts are open, changes in the value of the contracts are recognized as unrealized gains or losses by recalculating the value of the contracts on a daily basis. Subsequent or variation margin payments are received or made depending upon whether unrealized gains or losses are incurred. These amounts are reflected as receivables or payables on the Statement of Assets and Liabilities. When the contracts are closed or expire, the Fund recognizes a realized gain or loss equal to the difference between the proceeds from, or cost of, the closing transaction and the Fund’s basis in the contract. The net realized gain (loss) and the change in unrealized gain (loss) on futures contracts held during the period is included on the Statement of Operations. The primary risks associated with futures contracts are market risk and the absence of a liquid secondary market. If the Fund were unable to liquidate a futures contract and/or enter into an offsetting closing transaction, the Fund would continue to be subject to market risk with respect to the value of the contracts and continue to be required to maintain the margin deposits on the futures contracts. Futures contracts have minimal counterparty risk since the exchange’s clearinghouse, as counterparty to all exchange-traded futures, guarantees the futures against default. Risks may exceed amounts recognized in the Statement of Assets and Liabilities. |
| M. | | Collateral — To the extent the Fund has pledged or segregated a security as collateral and that security is subsequently sold, it is the Fund’s practice to replace such collateral no later than the next business day. |
NOTE 2—Advisory Fees and Other Fees Paid to Affiliates
The Trust has entered into a master investment advisory agreement with Invesco Advisers, Inc. (the “Adviser” or “Invesco”). Under the terms of the investment advisory agreement, the Fund pays an advisory fee to the Adviser based on the annual rate of the Fund’s average daily net assets as follows:
| | | | | |
| Average Net Assets | | Rate |
| |
| First $250 million | | | 0 | .65% |
| |
| Next $250 million | | | 0 | .59% |
| |
| Next $500 million | | | 0 | .565% |
| |
| Next $1.5 billion | | | 0 | .54% |
| |
| Next $2.5 billion | | | 0 | .515% |
| |
| Next $5 billion | | | 0 | .49% |
| |
| Over $10 billion | | | 0 | .465% |
| |
Under the terms of a master sub-advisory agreement between the Adviser and each of Invesco Asset Management Deutschland GmbH, Invesco Asset Management Limited, Invesco Asset Management (Japan) Limited, Invesco Australia Limited, Invesco Hong Kong Limited, Invesco Senior Secured Management, Inc. and Invesco Canada Ltd. (collectively, the “Affiliated Sub-Advisers”) the Adviser, not the Fund, may pay 40% of the fees paid to the Adviser to any such Affiliated Sub-Adviser(s) that provide discretionary investment management services to the Fund based on the percentage of assets allocated to such Sub-Adviser(s).
The Adviser has contractually agreed, through at least February 28, 2013, to waive advisory fees and/or reimburse expenses to the extent necessary to limit total annual operating expenses after fee waiver and/or expense reimbursement (excluding certain items discussed below) of Class A, Class B, Class C, Class Y and Institutional Class shares to 1.10%, 1.85%, 1.85%, 0.85% and 0.85% of average daily net assets, respectively. In determining the Adviser’s obligation to waive advisory fees and/or reimburse expenses, the following expenses are not taken into account, and could cause total annual operating expenses after fee waivers and/or expense reimbursements to exceed the numbers reflected above: (1) interest; (2) taxes; (3) dividend expense on short sales; (4) extraordinary or non-routine items; and (5) expenses that the Fund has incurred but did not actually pay because of an expense offset arrangement. Unless the Board of the Trustees and Invesco mutually agree to amend or continue the fee waiver agreement, it will terminate on February 28, 2013.
Further, the Adviser has contractually agreed, through at least June 30, 2012, to waive the advisory fee payable by the Fund in an amount equal to 100% of the net advisory fees the Adviser receives from the affiliated money market funds on investments by the Fund of uninvested cash in such affiliated money market funds.
For the year ended October 31, 2011, the Adviser waived advisory fees $125,465 and reimbursed class level expenses of $95,908, $15,502, $22,239, $1,579 and $552 of Class A, Class B, Class C, Class Y and Institutional Class shares, respectively.
At the request of the Trustees of the Trust, Invesco Ltd. agreed to reimburse expenses incurred by the Fund in connection with market timing matters in the Invesco Funds, which may include legal, audit, shareholder reporting, communications and trustee expenses. These expenses along with the related expense reimbursement are included in the Statement of Operations. For the year ended October 31, 2011, Invesco Ltd. reimbursed expenses of the Fund in the amount of $229.
The Trust has entered into a master administrative services agreement with Invesco pursuant to which the Fund has agreed to pay Invesco for certain administrative costs incurred in providing accounting services to the Fund. For the year ended October 31, 2011, expenses incurred under the agreement are shown in the Statement of Operations as administrative services fees.
The Trust has entered into a transfer agency and service agreement with Invesco Investment Services, Inc. (“IIS”) pursuant to which the Fund has agreed to pay IIS a fee for providing transfer agency and shareholder services to the Fund and reimburse IIS for certain expenses incurred by IIS in the course of providing such services. IIS may make payments to intermediaries that provide omnibus account services, sub-accounting services and/or networking services. All fees payable by IIS to intermediaries that provide omnibus account services or sub-accounting are charged back to the Fund, subject to certain limitations
17 Invesco International Total Return Fund
approved by the Trust’s Board of Trustees. For the year ended October 31, 2011, expenses incurred under the agreement are shown in the Statement of Operations as transfer agent fees.
The Trust has entered into master distribution agreements with Invesco Distributors, Inc. (“IDI”) to serve as the distributor for the Class A, Class B, Class C, Class Y and Institutional Class shares of the Fund. The Trust has adopted plans pursuant to Rule 12b-1 under the 1940 Act with respect to the Fund’s Class A, Class B and Class C shares (collectively, the “Plans”). The Fund, pursuant to the Plans, pays IDI compensation at the annual rate of 0.25% of the Fund’s average daily net assets of Class A shares and 1.00% of the average daily net assets of Class B and Class C shares. Of the Plan payments, up to 0.25% of the average daily net assets of each class of shares may be paid to furnish continuing personal shareholder services to customers who purchase and own shares of such classes. Any amounts not paid as a service fee under the Plans would constitute an asset-based sales charge. Rules of the Financial Industry Regulatory Authority (“FINRA”) impose a cap on the total sales charges, including asset-based sales charges that may be paid by any class of shares of the Fund. For the year ended October 31, 2011, expenses incurred under the Plans are shown in the Statement of Operations as distribution fees.
Front-end sales commissions and CDSC (collectively, the “sales charges”) are not recorded as expenses of the Fund. Front-end sales commissions are deducted from proceeds from the sales of Fund shares prior to investment in Class A shares of the Fund. CDSC are deducted from redemption proceeds prior to remittance to the shareholder. During the year ended October 31, 2011, IDI advised the Fund that IDI retained $15,119 in front-end sales commissions from the sale of Class A shares and $78, $11,596 and $861 from Class A, Class B and Class C shares, respectively, for CDSC imposed on redemptions by shareholders.
Certain officers and trustees of the Trust are officers and directors of the Adviser, Invesco Ltd., IIS and/or IDI.
NOTE 3—Additional Valuation Information
GAAP defines fair value as the price that would be received to sell an asset or paid to transfer a liability in an orderly transaction between market participants at the measurement date, under current market conditions. GAAP establishes a hierarchy that prioritizes the inputs to valuation methods giving the highest priority to readily available unadjusted quoted prices in an active market for identical assets (Level 1) and the lowest priority to significant unobservable inputs (Level 3) generally when market prices are not readily available or are unreliable. Based on the valuation inputs, the securities or other investments are tiered into one of three levels. Changes in valuation methods may result in transfers in or out of an investment’s assigned level:
| | |
| | Level 1 — | Prices are determined using quoted prices in an active market for identical assets. |
| | Level 2 — | Prices are determined using other significant observable inputs. Observable inputs are inputs that other market participants may use in pricing a security. These may include quoted prices for similar securities, interest rates, prepayment speeds, credit risk, yield curves, loss severities, default rates, discount rates, volatilities and others. |
| | Level 3 — | Prices are determined using significant unobservable inputs. In situations where quoted prices or observable inputs are unavailable (for example, when there is little or no market activity for an investment at the end of the period), unobservable inputs may be used. Unobservable inputs reflect the Fund’s own assumptions about the factors market participants would use in determining fair value of the securities or instruments and would be based on the best available information. |
The following is a summary of the tiered valuation input levels, as of October 31, 2011. The level assigned to the securities valuations may not be an indication of the risk or liquidity associated with investing in those securities. Because of the inherent uncertainties of valuation, the values reflected in the financial statements may materially differ from the value received upon actual sale of those investments.
During the year ended October 31, 2011, there were no significant transfers between investment levels.
| | | | | | | | | | | | | | | | | |
| | | Level 1 | | Level 2 | | Level 3 | | Total |
| |
| Corporate Debt Securities | | $ | — | | | $ | 38,484,831 | | | $ | — | | | $ | 38,484,831 | |
| |
| Foreign Government Debt Securities | | | — | | | | 23,778,680 | | | | — | | | | 23,778,680 | |
| |
| Money Market Funds | | | 1,189,994 | | | | — | | | | — | | | | 1,189,994 | |
| |
| Asset-Backed Securities | | | — | | | | 4,555,510 | | | | — | | | | 4,555,510 | |
| |
| | | $ | 1,189,994 | | | $ | 66,819,021 | | | $ | — | | | $ | 68,009,015 | |
| |
| Foreign Currency Contracts* | | | — | | | | (2,392 | ) | | | — | | | | (2,392 | ) |
| |
| Futures* | | | (7,769 | ) | | | — | | | | — | | | | (7,769 | ) |
| |
| Total Investments | | $ | 1,182,225 | | | $ | 66,816,629 | | | $ | — | | | $ | 67,998,854 | |
| |
| |
| * | Unrealized appreciation (depreciation). |
NOTE 4—Derivative Investments
The Fund has implemented the required disclosures about derivative instruments and hedging activities in accordance with GAAP. This disclosure is intended to improve financial reporting about derivative instruments and hedging activities by requiring enhanced disclosures to enable investors to better understand their effects on an entity’s financial position and financial performance. The enhanced disclosure has no impact on the results of operations reported in the financial statements.
18 Invesco International Total Return Fund
Value of Derivative Instruments at Period-End
The table below summarizes the value of the Fund’s derivative instruments, detailed by primary risk exposure, held as of October 31, 2011:
| | | | | | | | | |
| | | Value |
| Risk Exposure/Derivative Type | | Assets | | Liabilities |
| |
| Currency risk | | | | | | | | |
Foreign Currency Contracts(a) | | $ | 31,159 | | | $ | (33,551 | ) |
| |
| Interest rate risk | | | | | | | | |
Futures contracts(b) | | $ | 19,161 | | | $ | (26,930 | ) |
| |
| | |
| (a) | | Values are disclosed on the Statement of Assets and Liabilities under the Foreign currency contracts outstanding. |
| (b) | | Includes cumulative appreciation (depreciation) of futures contracts. Only current day’s variation margin receivable is reported within the Statement of Assets and Liabilities. |
Effect of Derivative Instruments for the year ended October 31, 2011
The table below summarizes the gains on derivative instruments, detailed by primary risk exposure, recognized in earnings during the period:
| | | | | | | | | |
| | | Location of Gain on
|
| | | Statement of Operations |
| | | | | Foreign Currency
|
| | | Futures* | | Contracts* |
| |
| Realized Gain | | | | | | | | |
| Currency risk | | $ | — | | | $ | 169,761 | |
| |
| Interest rate risk | | | 29,654 | | | | — | |
| |
| Change in Unrealized Appreciation | | | | | | | | |
| Currency risk | | | — | | | | 24,049 | |
| |
| Interest rate risk | | | 13,512 | | | | — | |
| |
| Total | | $ | 43,166 | | | $ | 193,810 | |
| |
| |
| * | The average notional value of futures and foreign currency contracts during the period was $16,319,320 and $12,224,044, respectively. |
| | | | | | | | | | | | | | | | | | | | | | | | | |
| Open Foreign Currency Contracts |
Settlement
| | | | Contract to | | Notional
| | Unrealized
|
| Date | | Counterparty | | Deliver | | Receive | | Value | | Appreciation |
| |
| 11/25/11 | | Citibank N.A. | | | EUR | | | | 800,000 | | | USD | | | 1,110,437 | | | $ | 1,106,682 | | | $ | 3,755 | |
| |
| 11/25/11 | | Citibank N.A. | | | HUF | | | | 155,000,000 | | | USD | | | 717,710 | | | | 700,440 | | | | 17,270 | |
| |
| 11/25/11 | | State Street | | | SEK | | | | 4,300,000 | | | USD | | | 669,002 | | | | 658,868 | | | | 10,134 | |
| |
| | | | | | | | | | | | | | | | | | | | | | | $ | 31,159 | |
| |
| | | | | | | | | | | | | | | | | | | | | | | | | |
Settlement
| | | | Contract to | | Notional
| | Unrealized
|
| Date | | Counterparty | | Deliver | | Receive | | Value | | Depreciation |
| |
| 11/25/11 | | Citibank N.A. | | | AUD | | | | 700,000 | | | USD | | | 729,585 | | | $ | 735,029 | | | $ | (5,444 | ) |
| |
| 11/25/11 | | Citibank N.A. | | | USD | | | | 672,678 | | | SEK | | | 4,300,000 | | | | 658,868 | | | | (13,810 | ) |
| |
| 11/25/11 | | State Street | | | GBP | | | | 350,000 | | | USD | | | 548,328 | | | | 562,625 | | | | (14,297 | ) |
| |
| | | | | | | | | | | | | | | | | | | | | | | $ | (33,551 | ) |
| |
| Total open foreign currency contracts | | | | | | | | | | | | | | | | | | | | | | $ | (2,392 | ) |
| |
Currency Abbreviations:
| | | |
| AUD | | – Australian Dollar |
| EUR | | – Euro |
| GBP | | – British Pound Sterling |
| HUF | | – Hungary Forint |
| SEK | | – Swedish Krona |
| USD | | – U.S. Dollar |
19 Invesco International Total Return Fund
| | | | | | | | | | | | | | | | | |
| Open Futures Contracts |
| | | | | | | | | Unrealized
|
| | | Number of
| | Expiration
| | Notional
| | Appreciation
|
| Long Contracts | | Contracts | | Month | | Value | | (Depreciation) |
| |
| Euro-Schatz | | | 11 | | | | December-2011 | | | $ | 1,669,634 | | | $ | (3,841 | ) |
| |
| Euro-Bonds | | | 8 | | | | December-2011 | | | | 1,499,599 | | | | 19,161 | |
| |
| Japan 10 Year Bonds | | | 32 | | | | December-2011 | | | | 5,820,414 | | | | (19,922 | ) |
| |
| Subtotal | | | | | | | | | | $ | 8,989,647 | | | $ | (4,602 | ) |
| |
| | | | | | | | | | | | | | | | | |
Short Contracts | | | | | | | | | | | | | | | | |
| |
| Canada 10 Year Bonds | | | 3 | | | | December-2011 | | | $ | (394,838 | ) | | $ | (3,167 | ) |
| |
| Total | | | | | | | | | | $ | 8,594,809 | | | $ | (7,769 | ) |
| |
NOTE 5—Expense Offset Arrangement(s)
The expense offset arrangement is comprised of transfer agency credits which result from balances in Demand Deposit Accounts (DDA) used by the transfer agent for clearing shareholder transactions. For the year ended October 31, 2011, the Fund received credits from this arrangement, which resulted in the reduction of the Fund’s total expenses of $372.
NOTE 6—Trustees’ and Officers’ Fees and Benefits
“Trustees’ and Officers’ Fees and Benefits” include amounts accrued by the Fund to pay remuneration to certain Trustees and Officers of the Fund. Trustees have the option to defer compensation payable by the Fund, and “Trustees’ and Officers’ Fees and Benefits” also include amounts accrued by the Fund to fund such deferred compensation amounts. Those Trustees who defer compensation have the option to select various Invesco Funds in which their deferral accounts shall be deemed to be invested. Finally, certain current Trustees are eligible to participate in a retirement plan that provides for benefits to be paid upon retirement to Trustees over a period of time based on the number of years of service. The Fund may have certain former Trustees who also participate in a retirement plan and receive benefits under such plan. “Trustees’ and Officers’ Fees and Benefits” include amounts accrued by the Fund to fund such retirement benefits. Obligations under the deferred compensation and retirement plans represent unsecured claims against the general assets of the Fund.
During the year ended October 31, 2011, the Fund paid legal fees of $1,556 for services rendered by Kramer, Levin, Naftalis & Frankel LLP as counsel to the Independent Trustees. A partner of that firm is a Trustee of the Trust.
NOTE 7—Cash Balances
The Fund may borrow for leveraging in an amount up to 5% of the Fund’s total assets (excluding the amount borrowed) at the time the borrowing is made. In doing so, the Fund is permitted to temporarily carry a negative or overdrawn balance in its account with The State Street Bank and Trust Company, the custodian bank. To compensate the custodian bank for such overdrafts, the overdrawn Fund may either (1) leave funds as a compensating balance in the account so the custodian bank can be compensated by earning the additional interest; or (2) compensate by paying the custodian bank at a rate agreed upon by the custodian bank and Invesco, not to exceed the contractually agreed upon rate. A Fund may not purchase additional securities when any borrowings from banks exceeds 5% of the Fund’s total assets.
NOTE 8—Distributions to Shareholders and Tax Components of Net Assets
Tax Character of Distributions to Shareholders Paid During the Years Ended October 31, 2011 and 2010:
| | | | | | | | | |
| | | 2011 | | 2010 |
| |
| Ordinary income | | $ | 3,340,844 | | | $ | 976,426 | |
| |
| Long-term capital gain | | | 800,615 | | | | — | |
| |
| Total distributions | | $ | 4,141,459 | | | $ | 976,426 | |
| |
Tax Components of Net Assets at Period-End:
| | | | | |
| | | 2011 |
| |
| Undistributed ordinary income | | $ | 2,518,109 | |
| |
| Undistributed long-term gain | | | 423,243 | |
| |
| Net unrealized appreciation — investments | | | 1,537,536 | |
| |
| Net unrealized appreciation (depreciation) — other investments | | | (2,728 | ) |
| |
| Temporary book/tax differences | | | (13,416 | ) |
| |
| Shares of beneficial interest | | | 65,433,857 | |
| |
| Total net assets | | $ | 69,896,601 | |
| |
20 Invesco International Total Return Fund
The temporary book/tax differences are a result of timing differences between book and tax recognition of income and/or expenses. The Fund’s temporary book/tax differences are the result of the trustee deferral of compensation and retirement plan benefits.
The Fund does not have a capital loss carryforward at period-end.
NOTE 9—Investment Securities
The aggregate amount of investment securities (other than short-term securities, U.S. Treasury obligations and money market funds, if any) purchased and sold by the Fund during the year ended October 31, 2011 was $137,041,493 and $120,086,155, respectively. Cost of investments on a tax basis includes the adjustments for financial reporting purposes as of the most recently completed Federal income tax reporting period-end.
| | | | | |
| Unrealized Appreciation (Depreciation) of Investment Securities on a Tax Basis |
| |
| Aggregate unrealized appreciation of investment securities | | $ | 2,580,294 | |
| |
| Aggregate unrealized (depreciation) of investment securities | | | (1,042,758 | ) |
| |
| Net unrealized appreciation of investment securities | | $ | 1,537,536 | |
| |
| Cost of investments for tax purposes is $66,471,479. |
NOTE 10—Reclassification of Permanent Differences
Primarily as a result of differing book/tax treatment of foreign currency transactions, on October 31, 2011, undistributed net investment income was increased by $2,062,792 and undistributed net realized gain was decreased by $2,062,792. This reclassification had no effect on the net assets of the Fund.
NOTE 11—Share Information
| | | | | | | | | | | | | | | | | |
| | | Summary of Share Activity |
| |
| | | Year ended
| | Year ended
|
| | | October 31, 2011(a) | | October 31, 2010 |
| | | Shares | | Amount | | Shares | | Amount |
| |
| Sold: | | | | | | | | | | | | | | | | |
| Class A | | | 2,864,497 | | | $ | 33,446,444 | | | | 968,265 | | | $ | 11,235,497 | |
| |
| Class B | | | 165,764 | | | | 1,902,975 | | | | 149,204 | | | | 1,730,252 | |
| |
| Class C | | | 455,959 | | | | 5,297,263 | | | | 305,957 | | | | 3,553,943 | |
| |
| Class Y | | | 85,574 | | | | 1,000,978 | | | | 43,274 | | | | 499,415 | |
| |
| Institutional Class | | | 66,768 | | | | 763,768 | | | | 418,681 | | | | 4,611,980 | |
| |
| Issued as reinvestment of dividends: | | | | | | | | | | | | | | | | |
| Class A | | | 220,292 | | | | 2,427,647 | | | | 35,837 | | | | 407,919 | |
| |
| Class B | | | 38,744 | | | | 424,252 | | | | 3,962 | | | | 45,140 | |
| |
| Class C | | | 54,237 | | | | 594,615 | | | | 6,133 | | | | 70,080 | |
| |
| Class Y | | | 3,821 | | | | 42,130 | | | | 474 | | | | 5,398 | |
| |
| Institutional Class | | | 32,470 | | | | 357,603 | | | | 35,408 | | | | 402,271 | |
| |
| Automatic conversion of Class B shares to Class A shares: | | | | | | | | | | | | | | | | |
| Class A | | | 82,279 | | | | 923,242 | | | | 100,374 | | | | 1,149,957 | |
| |
| Class B | | | (82,447 | ) | | | (923,242 | ) | | | (100,573 | ) | | | (1,149,957 | ) |
| |
Reacquired:(b) | | | | | | | | | | | | | | | | |
| Class A | | | (1,808,916 | ) | | | (20,557,697 | ) | | | (1,187,191 | ) | | | (13,546,736 | ) |
| |
| Class B | | | (151,421 | ) | | | (1,719,296 | ) | | | (286,521 | ) | | | (3,274,608 | ) |
| |
| Class C | | | (333,120 | ) | | | (3,739,380 | ) | | | (751,835 | ) | | | (8,565,959 | ) |
| |
| Class Y | | | (35,124 | ) | | | (400,683 | ) | | | (8,637 | ) | | | (97,063 | ) |
| |
| Institutional Class | | | (60,306 | ) | | | (687,377 | ) | | | (2,401,164 | ) | | | (27,679,640 | ) |
| |
| Net increase (decrease) in share activity | | | 1,599,071 | | | $ | 19,153,242 | | | | (2,668,352 | ) | | $ | (30,602,111 | ) |
| |
| | |
| (a) | | There are entities that are record owners of more than 5% of the outstanding shares of the Fund and in the aggregate own 18% of the outstanding shares of the Fund. IDI has an agreement with these entities to sell Fund shares. The Fund, Invesco and/or Invesco affiliates may make payments to these entities, which are considered to be related to the Fund, for providing services to the Fund, Invesco and/or Invesco affiliates including but not limited to services such as securities brokerage, distribution, third party record keeping and account servicing. The Fund has no knowledge as to whether all or any portion of the shares owned of record by these entities are also owned beneficially. |
In addition, 7% of the outstanding shares of the Fund are owned by affiliated mutual funds. Affiliated mutual funds are mutual funds that are advised by Invesco.
| | |
| (b) | | Net of redemption fees of $82,105 and $4,101 for the years ended October 31, 2011 and 2010, respectively. |
21 Invesco International Total Return Fund
NOTE 12—Financial Highlights
The following schedule presents financial highlights for a share of the Fund outstanding throughout the periods indicated.
| | | | | | | | | | | | | | | | | | | | | | | | | | | | | | | | | | | | | | | | | | | | | | | | | | | | | | | | | |
| | | | | | | | | | | | | | | | | | | | | | | Ratio of
| | Ratio of
| | | | |
| | | | | | | Net gains
| | | | | | | | | | | | | | | | expenses
| | expenses
| | | | |
| | | | | | | (losses) on
| | | | | | | | | | | | | | | | to average
| | to average net
| | Ratio of net
| | |
| | | Net asset
| | | | securities
| | | | Dividends
| | Distributions
| | | | | | | | | | net assets
| | assets without
| | investment
| | |
| | | value,
| | Net
| | (both
| | Total from
| | from net
| | from net
| | | | Net asset
| | | | Net assets,
| | with fee waivers
| | fee waivers
| | income
| | |
| | | beginning
| | investment
| | realized and
| | investment
| | investment
| | realized
| | Total
| | value, end
| | Total
| | end of period
| | and/or expenses
| | and/or expenses
| | to average
| | Portfolio
|
| | | of period | | income(a) | | unrealized) | | operations | | income | | gains | | Distributions | | of period(b) | | Return(c) | | (000s omitted) | | absorbed | | absorbed | | net assets | | turnover(d) |
| |
| Class A |
| Year ended 10/31/11 | | $ | 12.22 | | | $ | 0.19 | | | $ | 0.16 | | | $ | 0.35 | | | $ | (0.58 | ) | | $ | (0.36 | ) | | $ | (0.94 | ) | | $ | 11.63 | | | | 3.37 | % | | $ | 47,162 | | | | 1.10 | %(e) | | | 1.58 | %(e) | | | 1.64 | %(e) | | | 226 | % |
| Year ended 10/31/10 | | | 11.68 | | | | 0.19 | | | | 0.51 | | | | 0.70 | | | | (0.16 | ) | | | — | | | | (0.16 | ) | | | 12.22 | | | | 6.12 | | | | 32,947 | | | | 1.10 | | | | 1.55 | | | | 1.69 | | | | 203 | |
| Year ended 10/31/09 | | | 9.96 | | | | 0.22 | | | | 1.65 | | | | 1.87 | | | | (0.14 | ) | | | (0.01 | ) | | | (0.15 | ) | | | 11.68 | | | | 18.93 | | | | 32,460 | | | | 1.10 | | | | 1.51 | | | | 2.10 | | | | 233 | |
| Year ended 10/31/08 | | | 11.18 | | | | 0.24 | | | | (0.90 | ) | | | (0.66 | ) | | | (0.41 | ) | | | (0.15 | ) | | | (0.56 | ) | | | 9.96 | | | | (6.22 | ) | | | 39,418 | | | | 1.11 | | | | 1.42 | | | | 2.16 | | | | 224 | |
| Year ended 10/31/07 | | | 10.44 | | | | 0.25 | | | | 0.69 | | | | 0.94 | | | | (0.20 | ) | | | — | | | | (0.20 | ) | | | 11.18 | | | | 9.17 | | | | 6,247 | | | | 1.12 | | | | 2.06 | | | | 2.39 | | | | 509 | |
| |
| Class B |
| Year ended 10/31/11 | | | 12.19 | | | | 0.10 | | | | 0.17 | | | | 0.27 | | | | (0.49 | ) | | | (0.36 | ) | | | (0.85 | ) | | | 11.61 | | | | 2.66 | | | | 5,934 | | | | 1.85 | (e) | | | 2.33 | (e) | | | 0.89 | (e) | | | 226 | |
| Year ended 10/31/10 | | | 11.65 | | | | 0.11 | | | | 0.51 | | | | 0.62 | | | | (0.08 | ) | | | — | | | | (0.08 | ) | | | 12.19 | | | | 5.34 | | | | 6,591 | | | | 1.85 | | | | 2.30 | | | | 0.94 | | | | 203 | |
| Year ended 10/31/09 | | | 9.94 | | | | 0.14 | | | | 1.64 | | | | 1.78 | | | | (0.06 | ) | | | (0.01 | ) | | | (0.07 | ) | | | 11.65 | | | | 18.00 | | | | 9,026 | | | | 1.85 | | | | 2.26 | | | | 1.35 | | | | 233 | |
| Year ended 10/31/08 | | | 11.16 | | | | 0.16 | | | | (0.90 | ) | | | (0.74 | ) | | | (0.40 | ) | | | (0.08 | ) | | | (0.48 | ) | | | 9.94 | | | | (6.95 | ) | | | 11,432 | | | | 1.86 | | | | 2.17 | | | | 1.41 | | | | 224 | |
| Year ended 10/31/07 | | | 10.42 | | | | 0.17 | | | | 0.70 | | | | 0.87 | | | | (0.13 | ) | | | — | | | | (0.13 | ) | | | 11.16 | | | | 8.44 | | | | 2,395 | | | | 1.87 | | | | 2.81 | | | | 1.64 | | | | 509 | |
| |
| Class C |
| Year ended 10/31/11 | | | 12.19 | | | | 0.10 | | | | 0.17 | | | | 0.27 | | | | (0.49 | ) | | | (0.36 | ) | | | (0.85 | ) | | | 11.61 | | | | 2.65 | | | | 10,782 | | | | 1.85 | (e) | | | 2.33 | (e) | | | 0.89 | (e) | | | 226 | |
| Year ended 10/31/10 | | | 11.66 | | | | 0.11 | | | | 0.50 | | | | 0.61 | | | | (0.08 | ) | | | — | | | | (0.08 | ) | | | 12.19 | | | | 5.24 | | | | 9,165 | | | | 1.85 | | | | 2.30 | | | | 0.94 | | | | 203 | |
| Year ended 10/31/09 | | | 9.94 | | | | 0.14 | | | | 1.65 | | | | 1.79 | | | | (0.06 | ) | | | (0.01 | ) | | | (0.07 | ) | | | 11.66 | | | | 18.10 | | | | 13,887 | | | | 1.85 | | | | 2.26 | | | | 1.35 | | | | 233 | |
| Year ended 10/31/08 | | | 11.16 | | | | 0.16 | | | | (0.90 | ) | | | (0.74 | ) | | | (0.40 | ) | | | (0.08 | ) | | | (0.48 | ) | | | 9.94 | | | | (6.95 | ) | | | 16,262 | | | | 1.86 | | | | 2.17 | | | | 1.41 | | | | 224 | |
| Year ended 10/31/07 | | | 10.43 | | | | 0.17 | | | | 0.69 | | | | 0.86 | | | | (0.13 | ) | | | — | | | | (0.13 | ) | | | 11.16 | | | | 8.34 | | | | 1,999 | | | | 1.87 | | | | 2.81 | | | | 1.64 | | | | 509 | |
| |
| Class Y |
| Year ended 10/31/11 | | | 12.22 | | | | 0.22 | | | | 0.16 | | | | 0.38 | | | | (0.61 | ) | | | (0.36 | ) | | | (0.97 | ) | | | 11.63 | | | | 3.63 | | | | 1,322 | | | | 0.85 | (e) | | | 1.33 | (e) | | | 1.89 | (e) | | | 226 | |
| Year ended 10/31/10 | | | 11.68 | | | | 0.22 | | | | 0.51 | | | | 0.73 | | | | (0.19 | ) | | | — | | | | (0.19 | ) | | | 12.22 | | | | 6.39 | | | | 726 | | | | 0.85 | | | | 1.30 | | | | 1.94 | | | | 203 | |
| Year ended 10/31/09 | | | 9.96 | | | | 0.26 | | | | 1.64 | | | | 1.90 | | | | (0.17 | ) | | | (0.01 | ) | | | (0.18 | ) | | | 11.68 | | | | 19.22 | | | | 284 | | | | 0.85 | | | | 1.26 | | | | 2.35 | | | | 233 | |
| Year ended 10/31/08(f) | | | 10.54 | | | | 0.02 | | | | (0.60 | ) | | | (0.58 | ) | | | — | | | | — | | | | — | | | | 9.96 | | | | (5.50 | ) | | | 24 | | | | 0.86 | (g) | | | 1.20 | (g) | | | 2.41 | (g) | | | 224 | |
| |
| Institutional Class |
| Year ended 10/31/11 | | | 12.22 | | | | 0.22 | | | | 0.16 | | | | 0.38 | | | | (0.61 | ) | | | (0.36 | ) | | | (0.97 | ) | | | 11.63 | | | | 3.63 | | | | 4,696 | | | | 0.85 | (e) | | | 1.08 | (e) | | | 1.89 | (e) | | | 226 | |
| Year ended 10/31/10 | | | 11.68 | | | | 0.22 | | | | 0.51 | | | | 0.73 | | | | (0.19 | ) | | | — | | | | (0.19 | ) | | | 12.22 | | | | 6.39 | | | | 4,457 | | | | 0.85 | | | | 1.03 | | | | 1.94 | | | | 203 | |
| Year ended 10/31/09 | | | 9.96 | | | | 0.25 | | | | 1.65 | | | | 1.90 | | | | (0.17 | ) | | | (0.01 | ) | | | (0.18 | ) | | | 11.68 | | | | 19.22 | | | | 27,008 | | | | 0.85 | | | | 1.01 | | | | 2.35 | | | | 233 | |
| Year ended 10/31/08 | | | 11.18 | | | | 0.27 | | | | (0.90 | ) | | | (0.63 | ) | | | (0.42 | ) | | | (0.17 | ) | | | (0.59 | ) | | | 9.96 | | | | (5.99 | ) | | | 28,117 | | | | 0.85 | | | | 0.94 | | | | 2.42 | | | | 224 | |
| Year ended 10/31/07 | | | 10.44 | | | | 0.28 | | | | 0.69 | | | | 0.97 | | | | (0.23 | ) | | | — | | | | (0.23 | ) | | | 11.18 | | | | 9.42 | | | | 35,952 | | | | 0.86 | | | | 1.55 | | | | 2.64 | | | | 509 | |
| |
| | |
| (a) | | Calculated using average shares outstanding. |
| (b) | | Includes redemption fees added to shares of beneficial interest which were less than $0.005 per share. |
| (c) | | Includes adjustments in accordance with accounting principles generally accepted in the United States of America and as such, the net asset value for financial reporting purposes and the returns based upon those net asset values may differ from the net asset value and returns for shareholder transactions. Does not include sales charges and is not annualized for periods less than one year, if applicable. |
| (d) | | Portfolio turnover is calculated at the fund level and is not annualized for periods less than one year, if applicable. |
| (e) | | Ratios are based on average daily net assets (000’s) of $36,799, $5,948, $8,533, $606 and $4,506 for Class A, Class B, Class C, Class Y and Institutional Class shares, respectively. |
| (f) | | Commencement date of October 3, 2008. |
| (g) | | Annualized. |
22 Invesco International Total Return Fund
Report of Independent Registered Public Accounting Firm
To the Board of Trustees of AIM Investment Funds (Invesco Investment Funds)
and Shareholders of Invesco International Total Return Fund:
In our opinion, the accompanying statement of assets and liabilities, including the schedule of investments, and the related statements of operations and of changes in net assets and the financial highlights present fairly, in all material respects, the financial position of Invesco International Total Return Fund (one of the funds constituting AIM Investment Funds (Invesco Investment Funds), hereafter referred to as the “Fund”) at October 31, 2011, the results of its operations for the year then ended, the changes in its net assets for each of the two years in the period then ended and the financial highlights for each of the five years in the period then ended, in conformity with accounting principles generally accepted in the United States of America. These financial statements and financial highlights (hereafter referred to as “financial statements”) are the responsibility of the Fund’s management; our responsibility is to express an opinion on these financial statements based on our audits. We conducted our audits of these financial statements in accordance with the standards of the Public Company Accounting Oversight Board (United States). Those standards require that we plan and perform the audit to obtain reasonable assurance about whether the financial statements are free of material misstatement. An audit includes examining, on a test basis, evidence supporting the amounts and disclosures in the financial statements, assessing the accounting principles used and significant estimates made by management, and evaluating the overall financial statement presentation. We believe that our audits, which included confirmation of securities at October 31, 2011 by correspondence with the custodian and brokers, provide a reasonable basis for our opinion.
PRICEWATERHOUSECOOPERS LLP
Houston, Texas
December 27, 2011
23 Invesco International Total Return Fund
Calculating your ongoing Fund expenses
Example
As a shareholder of the Fund, you incur two types of costs: (1) transaction costs, which may include sales charges (loads) on purchase payments or contingent deferred sales charges on redemptions, and redemption fees, if any; and (2) ongoing costs, including management fees, distribution and/or service (12b-1) fees, and other Fund expenses. This example is intended to help you understand your ongoing costs (in dollars) of investing in the Fund and to compare these costs with ongoing costs of investing in other mutual funds. The example is based on an investment of $1,000 invested at the beginning of the period and held for the entire period May 1, 2011 through October 31, 2011.
Actual expenses
The table below provides information about actual account values and actual expenses. You may use the information in this table, together with the amount you invested, to estimate the expenses that you paid over the period. Simply divide your account value by $1,000 (for example, an $8,600 account value divided by $1,000 = 8.6), then multiply the result by the number in the table under the heading entitled “Actual Expenses Paid During Period” to estimate the expenses you paid on your account during this period.
Hypothetical example for comparison purposes
The table below also provides information about hypothetical account values and hypothetical expenses based on the Fund’s actual expense ratio and an assumed rate of return of 5% per year before expenses, which is not the Fund’s actual return.
The hypothetical account values and expenses may not be used to estimate the actual ending account balance or expenses you paid for the period. You may use this information to compare the ongoing costs of investing in the Fund and other funds. To do so, compare this 5% hypothetical example with the 5% hypothetical examples that appear in the shareholder reports of the other funds.
Please note that the expenses shown in the table are meant to highlight your ongoing costs only and do not reflect any transaction costs, such as sales charges (loads) on purchase payments, contingent deferred sales charges on redemptions, and redemption fees, if any. Therefore, the hypothetical information is useful in comparing ongoing costs only, and will not help you determine the relative total costs of owning different funds. In addition, if these transaction costs were included, your costs would have been higher.
| | | | | | | | | | | | | | | | | | | | | | | | | | | | | | | |
| | | | | | | | | | HYPOTHETICAL
| | | |
| | | | | | | ACTUAL | | | (5% annual return before expenses) | | | |
| | | | Beginning
| | | Ending
| | | Expenses
| | | Ending
| | | Expenses
| | | Annualized
|
| | | | Account Value
| | | Account Value
| | | Paid During
| | | Account Value
| | | Paid During
| | | Expense
|
| Class | | | (05/01/11) | | | (10/31/11)1 | | | Period2 | | | (10/31/11) | | | Period2 | | | Ratio |
| Class A | | | $ | 1,000.00 | | | | $ | 1,003.00 | | | | $ | 5.55 | | | | $ | 1,019.66 | | | | $ | 5.60 | | | | | 1.10 | % |
| | | | | | | | | | | | | | | | | | | | | | | | | | | | | | | |
| Class B | | | | 1,000.00 | | | | | 1,000.10 | | | | | 9.33 | | | | | 1,015.88 | | | | | 9.40 | | | | | 1.85 | |
| | | | | | | | | | | | | | | | | | | | | | | | | | | | | | | |
| Class C | | | | 1,000.00 | | | | | 1,000.10 | | | | | 9.33 | | | | | 1,015.88 | | | | | 9.40 | | | | | 1.85 | |
| | | | | | | | | | | | | | | | | | | | | | | | | | | | | | | |
| Class Y | | | | 1,000.00 | | | | | 1,005.20 | | | | | 4.30 | | | | | 1,020.92 | | | | | 4.33 | | | | | 0.85 | |
| | | | | | | | | | | | | | | | | | | | | | | | | | | | | | | |
| Institutional | | | | 1,000.00 | | | | | 1,004.30 | | | | | 4.28 | | | | | 1,020.92 | | | | | 4.33 | | | | | 0.85 | |
| | | | | | | | | | | | | | | | | | | | | | | | | | | | | | | |
| |
| 1 | The actual ending account value is based on the actual total return of the Fund for the period May 1, 2011 through October 31, 2011, after actual expenses and will differ from the hypothetical ending account value which is based on the Fund’s expense ratio and a hypothetical annual return of 5% before expenses. |
| 2 | Expenses are equal to the Fund’s annualized expense ratio as indicated above multiplied by the average account value over the period, multiplied by 184/365 to reflect the most recent fiscal half year. |
24 Invesco International Total Return Fund
| |
| Approval of Investment Advisory and Sub-Advisory Contracts |
The Board of Trustees (the Board) of AIM Investment Funds (Invesco Investment Funds) is required under the Investment Company Act of 1940, as amended, to approve annually the renewal of the Invesco International Total Return Fund (the Fund) investment advisory agreement with Invesco Advisers, Inc. (Invesco Advisers) and the Master Intergroup Sub-Advisory Contract for Mutual Funds (the sub-advisory contracts) with Invesco Asset Management Deutschland GmbH, Invesco Asset Management Limited, Invesco Asset Management (Japan) Limited, Invesco Australia Limited, Invesco Hong Kong Limited, Invesco Senior Secured Management, Inc. and Invesco Canada Ltd. (collectively, the Affiliated Sub-Advisers). During contract renewal meetings held on June 14-15, 2011, the Board as a whole, and the disinterested or “independent” Trustees, who comprise 80% of the Board, voting separately, approved the continuance of the Fund’s investment advisory agreement and the sub-advisory contracts for another year, effective July 1, 2011. In doing so, the Board considered the process that it follows in reviewing and approving the Fund’s investment advisory agreement and sub-advisory contracts and the information that it is provided. The Board determined that the Fund’s investment advisory agreement and the sub-advisory contracts are in the best interests of the Fund and its shareholders and the compensation to Invesco Advisers and the Affiliated Sub-Advisers under the agreements is fair and reasonable.
The Board’s Fund Evaluation Process
The Board’s Investments Committee has established three Sub-Committees, each of which is responsible for overseeing the management of a number of the series portfolios of the funds advised by Invesco Advisers (the Invesco Funds). The Sub-Committees meet throughout the year to review the performance of their assigned funds, including reviewing materials prepared under the direction of the independent Senior Officer, an officer of the Invesco Funds who reports directly to the independent Trustees. Over the course of each year, the Sub-Committees meet with portfolio managers for their assigned Invesco Funds and other members of management to review the performance, investment objective(s), policies, strategies and limitations and investment risks of these funds. The Sub-Committees meet regularly and at designated contract renewal meetings each year to conduct a review of the performance, fees, expenses and other matters related to their assigned Invesco Funds. Each Sub-Committee recommends to the Investments Committee, which in turn recommends to the full Board, whether to approve the continuance of each Invesco Fund’s investment advisory agreement and sub-advisory contracts for another year.
During the contract renewal process, the Trustees receive comparative performance and fee data regarding the Invesco Funds prepared by Invesco Advisers and an independent company, Lipper, Inc. (Lipper). The Trustees also receive an independent written evaluation from the Senior Officer. The Senior Officer’s evaluation is prepared as part of his responsibility to manage the process by which the Invesco Funds’ proposed management fees are negotiated during the annual contract renewal process to ensure they are negotiated in a manner that is at arms’ length and reasonable. The independent Trustees are assisted in their annual evaluation of the Fund’s investment advisory agreement by the Senior Officer and by independent legal counsel. The independent Trustees also discuss the continuance of the investment advisory agreement and sub-advisory contracts in private sessions with the Senior Officer and counsel.
In evaluating the fairness and reasonableness of the Fund’s investment advisory agreement and sub-advisory contracts, the Board considered, among other things, the factors discussed below. The Trustees also considered information provided in connection with fund acquisitions approved by the Trustees to rationalize the Invesco Funds product range following the acquisition of the retail mutual fund business of Morgan Stanley (the Morgan Stanley Transaction). The Trustees recognized that the advisory fees for the Invesco Funds include advisory fees that are the result of years of review and negotiation between the Trustees and Invesco Advisers as well as advisory fees inherited from Morgan Stanley and Van Kampen funds acquired in the Morgan Stanley Transaction. The Trustees’ deliberations and conclusions in a particular year may be based in part on their deliberations and conclusions regarding these same arrangements throughout the year and in prior years. One Trustee may have weighed a particular piece of information differently than another Trustee.
The discussion below serves as the Senior Officer’s independent written evaluation with respect to the Fund’s investment advisory agreement as well as a discussion of the material factors and related conclusions that formed the basis for the Board’s approval of the Fund’s investment advisory agreement and sub-advisory contracts. Unless otherwise stated, this information is current as of June 15, 2011, and may not reflect consideration of factors that became known to the Board after that date, including, for example, changes to the Fund’s performance, advisory fees, expense limitations and/or fee waivers.
Factors and Conclusions and Summary of Independent Written Fee Evaluation
| |
| A. | Nature, Extent and Quality of Services Provided by Invesco Advisers and the Affiliated Sub-Advisers |
The Board reviewed the advisory services provided to the Fund by Invesco Advisers under the Fund’s investment advisory agreement, the performance of Invesco Advisers in providing these services, and the credentials and experience of the officers and employees of Invesco Advisers who provide these services, including the Fund’s portfolio manager or managers, with whom the Board met during the year. The Board’s review of the qualifications of Invesco Advisers to provide advisory services included the Board’s consideration of Invesco Advisers’ performance and investment process oversight, independent credit analysis and investment risk management.
In determining whether to continue the Fund’s investment advisory agreement, the Board considered the prior relationship between Invesco Advisers and the Fund, as well as the Board’s knowledge of Invesco Advisers’ operations, and concluded that it is beneficial to maintain the current relationship, in part, because of such knowledge. The Board also considered services that Invesco Advisers and its affiliates provide to the Invesco Funds such as various back office support functions, equity and fixed income trading operations, internal audit, distribution and legal and compliance. The Board concluded that the nature, extent and quality of the services provided to the Fund by Invesco Advisers are appropriate and satisfactory and the advisory services are provided in accordance with the terms of the Fund’s investment advisory agreement.
The Board reviewed the services provided by the Affiliated Sub-Advisers under the sub-advisory contracts and the credentials and experience of the officers and employees of the Affiliated Sub-Advisers who provide these services. The Board noted that the Affiliated Sub-Advisers have offices and personnel that are located in financial centers around the world. As a result, the Affiliated Sub-Advisers can provide research and investment analysis on the markets and economies of various countries in which the Fund invests and make recommendations on securities of companies located in such countries. The Board concluded that the sub-advisory contracts benefit the Fund and its shareholders by permitting Invesco Advisers to use the resources and talents of the Affiliated Sub-Advisers in managing the Fund. The Board concluded that the nature, extent and quality of the services provided by the Affiliated Sub-Advisers are appropriate and
25 Invesco International Total Return Fund
satisfactory and in accordance with the terms of the Fund’s sub-advisory contracts.
The Board considered Fund performance as a relevant factor in considering whether to approve the investment advisory agreement as well as the sub-advisory contracts for the Fund, as Invesco Asset Management Limited currently manages assets of the Fund.
The Board noted that the Fund recently began operations and that only four calendar years of comparative performance data was available. The Board compared the Fund’s performance during the past one and three year periods to the performance of funds in the Lipper performance universe and against the Lipper International Income Funds Index. The Board noted that performance of Class A shares of the Fund was in the fifth quintile of the performance universe for the one and three year periods (the first quintile being the best performing funds and the fifth quintile being the worst performing funds). The Board noted that performance of Class A shares of the Fund was below the performance of the Index for the one and three year periods. Invesco Advisers advised the Board that performance was impacted by lower exposure to credit and high yield and emerging markets as well as being longer duration in certain segments of the market. Although the independent written evaluation of the Fund’s Senior Officer only considered Fund performance through the most recent calendar year, the Trustees also reviewed more recent Fund performance and this review did not change their conclusions.
| |
| C. | Advisory and Sub-Advisory Fees and Fee Waivers |
The Board compared the Fund’s contractual advisory fee rate to the contractual advisory fee rates of funds in the Fund’s Lipper expense group at a common asset level. The Board noted that the contractual advisory fee rate for Class A shares of the Fund was below the median contractual advisory fee rate of funds in the expense group. The Board also reviewed the methodology used by Lipper in providing expense group information, which includes using audited financial data from the most recent annual report of each fund in the expense group that was publicly available as of the end of the past calendar year and including only one fund per investment adviser. The Board noted that comparative data is as of varying dates, which may affect the comparability of data during times of market volatility.
The Board noted that Invesco Advisers and the Affiliated Sub-Advisers do not manage other mutual funds or client accounts in a manner substantially similar to the management of the Fund.
The Board noted that Invesco Advisers has contractually agreed to waive fees and/or limit expenses of the Fund through at least February 28, 2012 in an amount necessary to limit total annual operating expenses to a specified percentage of average daily net assets for each class of the Fund. The Board also considered the effect this fee waiver would have on the Fund’s total estimated expenses.
The Board also considered the services provided by the Affiliated Sub-Advisers pursuant to the sub-advisory contracts, as well as the allocation of fees between Invesco Advisers and the Affiliated Sub-Advisers pursuant to the sub-advisory contracts. The Board noted that Invesco Advisers provides services to sub-advised Invesco Funds, including oversight of the Affiliated Sub-Advisers as well as the additional services described above other than day-to-day portfolio management. The Board also noted that the sub-advisory fees have no direct effect on the Fund or its shareholders, as they are paid by Invesco Advisers to the Affiliated Sub-Advisers.
Based upon the information and considerations described above, the Board concluded that the Fund’s advisory and sub-advisory fees are fair and reasonable.
| |
| D. | Economies of Scale and Breakpoints |
The Board considered the extent to which there are economies of scale in the provision of advisory services to the Fund. The Board also considered whether the Fund benefits from economies of scale through contractual breakpoints in the Fund’s advisory fee schedule. The Board also noted that the Fund shares directly in economies of scale through lower fees charged by third party service providers based on the combined size of the Invesco Funds and other clients advised by Invesco Advisers.
| |
| E. | Profitability and Financial Resources |
The Board reviewed information from Invesco Advisers concerning the costs of the advisory and other services that Invesco Advisers and its affiliates provide to the Fund and the profitability of Invesco Advisers and its affiliates in providing these services. The Board reviewed with Invesco Advisers the methodology used to prepare the profitability information. The Board considered the profitability of Invesco Advisers in connection with managing the Fund and the Invesco Funds. The Board noted that Invesco Advisers continues to operate at a net profit from services Invesco Advisers and its subsidiaries provide to the Fund and the Invesco Funds. The Board concluded that the level of profits realized by Invesco Advisers and its affiliates from providing services to the Fund is not excessive given the nature, quality and extent of the services provided to the Invesco Funds. The Board considered whether Invesco Advisers and each Affiliated Sub-Adviser are financially sound and have the resources necessary to perform their obligations under the investment advisory agreement and sub-advisory contracts. The Board concluded that Invesco Advisers and each Affiliated Sub-Adviser have the financial resources necessary to fulfill these obligations.
| |
| F. | Collateral Benefits to Invesco Advisers and its Affiliates |
The Board considered various other benefits received by Invesco Advisers and its affiliates from the relationship with the Fund, including the fees received for their provision of administrative, transfer agency and distribution services to the Fund. The Board considered the performance of Invesco Advisers and its affiliates in providing these services and the organizational structure employed to provide these services. The Board also considered that these services are provided to the Fund pursuant to written contracts that are reviewed and approved on an annual basis by the Board; that the services are required for the operation of the Fund; that Invesco Advisers and its affiliates can provide services, the nature and quality of which are at least equal to those provided by others offering the same or similar services; and that the fees for such services are fair and reasonable in light of the usual and customary charges by others for services of the same nature and quality.
The Board considered the benefits realized by Invesco Advisers and the Affiliated Sub-Advisers as a result of portfolio brokerage transactions executed through “soft dollar” arrangements. The Board noted that soft dollar arrangements shift the payment obligation for research and execution services from Invesco Advisers and the Affiliated Sub-Advisers to the Invesco Funds and therefore may reduce Invesco Advisers’ and the Affiliated Sub-Advisers’ expenses. The Board concluded that the soft dollar arrangements are appropriate. The Board also concluded that, based on their review and representations made by the Chief Compliance Officer of the Invesco Funds, these arrangements are consistent with regulatory requirements.
The Board considered that the Fund’s uninvested cash and cash collateral from any securities lending arrangements may be invested in money market funds advised by Invesco Advisers pursuant to procedures approved by the Board. The Board noted that Invesco Advisers receives advisory fees from these affiliated money market funds attributable to such investments, although Invesco Advisers has contractually agreed to waive through varying periods the advisory fees payable by the Invesco Funds. The waiver is in an amount equal to 100% of the net advisory fee Invesco Advisers receives from the affiliated money market funds with respect to the Fund’s investment in the affiliated money market funds of uninvested cash, but not cash collateral. The Board concluded that the Fund’s investment of uninvested cash and cash collateral from any securities lending arrangements in the affiliated money market funds is in the best interests of the Fund and its shareholders.
26 Invesco International Total Return Fund
Tax Information
Form 1099-DIV, Form 1042-S and other year-end tax information provide shareholders with actual calendar year amounts that should be included in their tax returns. Shareholders should consult their tax advisors.
The following distribution information is being provided as required by the Internal Revenue Code or to meet a specific state’s requirement.
The Fund designates the following amounts or, if subsequently determined to be different, the maximum amount allowable for its fiscal year ended October 31, 2011:
| | | | | |
Federal and State Income Tax | | |
| |
| Long-Term Capital Gain Dividends | | $ | 800,615 | |
| Qualified Dividend Income* | | | 0% | |
| Corporate Dividends Received Deduction* | | | 0% | |
| | |
| | * | The above percentages are based on ordinary income dividends paid to shareholders during the fund’s fiscal year. |
27 Invesco International Total Return Fund
Trustees and Officers
The address of each trustee and officer is AIM Investment Funds (Invesco Investment Funds) (the “Trust”), 11 Greenway Plaza, Suite 2500, Houston, Texas 77046-1173. The trustees serve for the life of the Trust, subject to their earlier death, incapacitation, resignation, retirement or removal as more specifically provided in the Trust’s organizational documents. Each officer serves for a one year term or until their successors are elected and qualified. Column two below includes length of time served with predecessor entities, if any.
| | | | | | | | | |
| | | | | | | Number of
| | |
| | | | | | | Funds in
| | |
| | | | | | | Fund Complex
| | |
Name, Year of Birth and
| | Trustee and/
| | Principal Occupation(s)
| | Overseen by
| | Other Directorship(s)
|
| Position(s) Held with the Trust | | or Officer Since | | During Past 5 Years | | Trustee | | Held by Trustee |
| | | | | | | | | |
| | | | | | | | | |
| Interested Persons | | | | | | | | |
| | | | | | | | | |
| | | | | | | | | |
| | | | | | | | | |
Martin L. Flanagan1 — 1960
Trustee | | 2007 | | Executive Director, Chief Executive Officer and President, Invesco Ltd. (ultimate parent of Invesco and a global investment management firm); Advisor to the Board, Invesco Advisers, Inc. (formerly known as Invesco Institutional (N.A.), Inc.); Trustee, The Invesco Funds; Vice Chair, Investment Company Institute; and Member of Executive Board, SMU Cox School of Business
Formerly: Chairman, Invesco Advisers, Inc. (registered investment adviser); Director, Chairman, Chief Executive Officer and President, IVZ Inc. (holding company), INVESCO Group Services, Inc. (service provider) and Invesco North American Holdings, Inc. (holding company); Director, Chief Executive Officer and President, Invesco Holding Company Limited (parent of Invesco and a global investment management firm); Director, Invesco Ltd.; Chairman, Investment Company Institute and President, Co-Chief Executive Officer, Co-President, Chief Operating Officer and Chief Financial Officer, Franklin Resources, Inc. (global investment management organization) | | 141 | | None |
| | | | | | | | | |
| | | | | | | | | |
| | | | | | | | | |
Philip A. Taylor2 — 1954
Trustee, President and
Principal Executive Officer | | 2006 | | Head of North American Retail and Senior Managing Director, Invesco Ltd.; Director, Co-Chairman, Co-President and Co-Chief Executive Officer, Invesco Advisers, Inc. (formerly known as Invesco Institutional (N.A.), Inc.) (registered investment adviser); Director, Chairman, Chief Executive Officer and President, Invesco Management Group, Inc. (formerly Invesco Aim Management Group, Inc.) (financial services holding company); Director and President, INVESCO Funds Group, Inc. (registered investment adviser and registered transfer agent); Director and Chairman, Invesco Investment Services, Inc. (formerly known as Invesco Aim Investment Services, Inc.) (registered transfer agent) and IVZ Distributors, Inc. (formerly known as INVESCO Distributors, Inc.) (registered broker dealer); Director, President and Chairman, Invesco Inc. (holding company) and Invesco Canada Holdings Inc. (holding company); Chief Executive Officer, Invesco Corporate Class Inc. (corporate mutual fund company) and Invesco Canada Fund Inc. (corporate mutual fund company); Director, Chairman and Chief Executive Officer, Invesco Canada Ltd. (formerly known as Invesco Trimark Ltd./Invesco Trimark Ltèe) (registered investment adviser and registered transfer agent); Trustee, President and Principal Executive Officer, The Invesco Funds (other than AIM Treasurer’s Series Trust (Invesco Treasurer’s Series Trust) and Short-Term Investments Trust); Trustee and Executive Vice President, The Invesco Funds (AIM Treasurer’s Series Trust (Invesco Treasurer’s Series Trust) and Short-Term Investments Trust only); Director, Invesco Investment Advisers LLC (formerly known as Van Kampen Asset Management); Director, Chief Executive Officer and President, Van Kampen Exchange Corp.
Formerly: Director and Chairman, Van Kampen Investor Services Inc.: Director, Chief Executive Officer and President, 1371 Preferred Inc. (holding company); and Van Kampen Investments Inc.; Director and President, AIM GP Canada Inc. (general partner for limited partnerships); and Van Kampen Advisors, Inc.; Director and Chief Executive Officer, Invesco Trimark Dealer Inc. (registered broker dealer); Director, Invesco Distributors, Inc. (formerly known as Invesco Aim Distributors, Inc.) (registered broker dealer); Manager, Invesco PowerShares Capital Management LLC; Director, Chief Executive Officer and President, Invesco Advisers, Inc.; Director, Chairman, Chief Executive Officer and President, Invesco Aim Capital Management, Inc.; President, Invesco Trimark Dealer Inc. and Invesco Trimark Ltd./Invesco Trimark Ltèe; Director and President, AIM Trimark Corporate Class Inc. and AIM Trimark Canada Fund Inc.; Senior Managing Director, Invesco Holding Company Limited; Trustee and Executive Vice President, Tax-Free Investments Trust; Director and Chairman, Fund Management Company (former registered broker dealer); President and Principal Executive Officer, The Invesco Funds (AIM Treasurer’s Series Trust (Invesco Treasurer’s Series Trust), Short-Term Investments Trust and Tax-Free Investments Trust only); President, AIM Trimark Global Fund Inc. and AIM Trimark Canada Fund Inc. | | 141 | | None |
| | | | | | | | | |
| | | | | | | | | |
| | | | | | | | | |
Wayne W. Whalen3 — 1939
Trustee | | 2010 | | Of Counsel, and prior to 2010, partner in the law firm of Skadden, Arps, Slate, Meagher & Flom LLP, legal counsel to funds in the Fund Complex | | 159 | | Director of the Abraham Lincoln Presidential Library Foundation |
| | | | | | | | | |
| | | | | | | | | |
| | | | | | | | | |
| Independent Trustees | | | | | | | | |
| | | | | | | | | |
| | | | | | | | | |
| | | | | | | | | |
Bruce L. Crockett — 1944
Trustee and Chair | | 2001 | | Chairman, Crockett Technology Associates (technology consulting company)
Formerly: Director, Captaris (unified messaging provider); Director, President and Chief Executive Officer COMSAT Corporation; and Chairman, Board of Governors of INTELSAT (international communications company) | | 141 | | ACE Limited (insurance company); and Investment Company Institute |
| | | | | | | | | |
| | | | | | | | | |
| | | | | | | | | |
David C. Arch — 1945
Trustee | | 2010 | | Chairman and Chief Executive Officer of Blistex Inc., a consumer health care products manufacturer. | | 159 | | Member of the Heartland Alliance Advisory Board, a nonprofit organization serving human needs based in Chicago. Board member of the Illinois Manufacturers’ Association. Member of the Board of Visitors, Institute for the Humanities, University of Michigan |
| | | | | | | | | |
| |
| 1 | Mr. Flanagan is considered an interested person of the Trust because he is an officer of the adviser to the Trust, and an officer and a director of Invesco Ltd., ultimate parent of the adviser to the Trust. |
| 2 | Mr. Taylor is considered an interested person of the Trust because he is an officer and a director of the adviser to, and a director of the principal underwriter of, the Trust. |
| 3 | Mr. Whalen has been deemed to be an interested person of the Trust because of his prior service as counsel to the predecessor funds of certain Invesco open-end funds and his affiliation with the law firm that served as counsel to such predecessor funds and continues to serve as counsel to the Invesco Van Kampen closed-end funds. |
T-1 Invesco International Total Return Fund
Trustees and Officers—(continued)
The address of each trustee and officer is AIM Investment Funds (Invesco Investment Funds) (the “Trust”), 11 Greenway Plaza, Suite 2500, Houston, Texas 77046-1173. The trustees serve for the life of the Trust, subject to their earlier death, incapacitation, resignation, retirement or removal as more specifically provided in the Trust’s organizational documents. Each officer serves for a one year term or until their successors are elected and qualified. Column two below includes length of time served with predecessor entities, if any.
| | | | | | | | | |
| | | | | | | Number of
| | |
| | | | | | | Funds in
| | |
| | | | | | | Fund Complex
| | |
Name, Year of Birth and
| | Trustee and/
| | Principal Occupation(s)
| | Overseen by
| | Other Directorship(s)
|
| Position(s) Held with the Trust | | or Officer Since | | During Past 5 Years | | Trustee | | Held by Trustee |
| | | | | | | | | |
| | | | | | | | | |
| Independent Trustees—(continued) | | | | | | | | |
| | | | | | | | | |
| | | | | | | | | |
| | | | | | | | | |
Bob R. Baker — 1936
Trustee | | 2003 | | Retired
Formerly: President and Chief Executive Officer, AMC Cancer Research Center; and Chairman and Chief Executive Officer, First Columbia Financial Corporation | | 141 | | None |
| | | | | | | | | |
| | | | | | | | | |
| | | | | | | | | |
Frank S. Bayley — 1939
Trustee | | 1987 | | Retired
Formerly: Director, Badgley Funds, Inc. (registered investment company) (2 portfolios) and Partner, law firm of Baker & McKenzie | | 141 | | Director and Chairman, C.D. Stimson Company (a real estate investment company) |
| | | | | | | | | |
| | | | | | | | | |
| | | | | | | | | |
James T. Bunch — 1942
Trustee | | 2003 | | Founder, Green, Manning & Bunch Ltd. (investment banking firm)
Formerly: Executive Committee, United States Golf Association; and Director, Policy Studies, Inc. and Van Gilder Insurance Corporation | | 141 | | Vice Chairman, Board of Governors, Western Golf Association/Evans Scholars Foundation and Director, Denver Film Society |
| | | | | | | | | |
| | | | | | | | | |
| | | | | | | | | |
Rodney F. Dammeyer — 1940
Trustee | | 2010 | | President of CAC, LLC, a private company offering capital investment and management advisory services.
Formerly: Prior to January 2004, Director of TeleTech Holdings Inc.; Prior to 2002, Director of Arris Group, Inc.; Prior to 2001, Managing Partner at Equity Group Corporate Investments. Prior to 1995, Vice Chairman of Anixter International. Prior to 1985, experience includes Senior Vice President and Chief Financial Officer of Household International, Inc, Executive Vice President and Chief Financial Officer of Northwest Industries, Inc. and Partner of Arthur Andersen & Co. | | 159 | | Director of Quidel Corporation and Stericycle, Inc. Prior to May 2008, Trustee of The Scripps Research Institute. Prior to February 2008, Director of Ventana Medical Systems, Inc. Prior to April 2007, Director of GATX Corporation. Prior to April 2004, Director of TheraSense, Inc. |
| | | | | | | | | |
| | | | | | | | | |
| | | | | | | | | |
Albert R. Dowden — 1941
Trustee | | 2001 | | Director of a number of public and private business corporations, including the Boss Group, Ltd. (private investment and management); Reich & Tang Funds (5 portfolios) (registered investment company); and Homeowners of America Holding Corporation/ Homeowners of America Insurance Company (property casualty company)
Formerly: Director, Continental Energy Services, LLC (oil and gas pipeline service); Director, CompuDyne Corporation (provider of product and services to the public security market) and Director, Annuity and Life Re (Holdings), Ltd. (reinsurance company); Director, President and Chief Executive Officer, Volvo Group North America, Inc.; Senior Vice President, AB Volvo; Director of various public and private corporations; Chairman, DHJ Media, Inc.; Director Magellan Insurance Company; and Director, The Hertz Corporation, Genmar Corporation (boat manufacturer), National Media Corporation; Advisory Board of Rotary Power International (designer, manufacturer, and seller of rotary power engines); and Chairman, Cortland Trust, Inc. (registered investment company) | | 141 | | Board of Nature’s Sunshine Products, Inc. |
| | | | | | | | | |
| | | | | | | | | |
| | | | | | | | | |
Jack M. Fields — 1952
Trustee | | 2001 | | Chief Executive Officer, Twenty First Century Group, Inc. (government affairs company); and Owner and Chief Executive Officer, Dos Angelos Ranch, L.P. (cattle, hunting, corporate entertainment), Discovery Global Education Fund (non-profit) and Cross Timbers Quail Research Ranch (non-profit)
Formerly: Chief Executive Officer, Texana Timber LP (sustainable forestry company) and member of the U.S. House of Representatives | | 141 | | Administaff |
| | | | | | | | | |
| | | | | | | | | |
| | | | | | | | | |
Carl Frischling — 1937
Trustee | | 2001 | | Partner, law firm of Kramer Levin Naftalis and Frankel LLP | | 141 | | Director, Reich & Tang Funds (6 portfolios) |
| | | | | | | | | |
| | | | | | | | | |
| | | | | | | | | |
Prema Mathai-Davis — 1950
Trustee | | 2001 | | Retired
Formerly: Chief Executive Officer, YWCA of the U.S.A. | | 141 | | None |
| | | | | | | | | |
| | | | | | | | | |
| | | | | | | | | |
Larry Soll — 1942
Trustee | | 2003 | | Retired
Formerly, Chairman, Chief Executive Officer and President, Synergen Corp. (a biotechnology company) | | 141 | | None |
| | | | | | | | | |
| | | | | | | | | |
| | | | | | | | | |
Hugo F. Sonnenschein — 1940
Trustee | | 2010 | | President Emeritus and Honorary Trustee of the University of Chicago and the Adam Smith Distinguished Service Professor in the Department of Economics at the University of Chicago. Prior to July 2000, President of the University of Chicago. | | 159 | | Trustee of the University of Rochester and a member of its investment committee. Member of the National Academy of Sciences, the American Philosophical Society and a fellow of the American Academy of Arts and Sciences |
| | | | | | | | | |
| | | | | | | | | |
| | | | | | | | | |
Raymond Stickel, Jr. — 1944
Trustee | | 2005 | | Retired
Formerly: Director, Mainstay VP Series Funds, Inc. (25 portfolios) and Partner, Deloitte & Touche | | 141 | | Director of Long Cove Club Owners’ Association (home owner’s association) |
| | | | | | | | | |
T-2 Invesco International Total Return Fund
Trustees and Officers—(continued)
The address of each trustee and officer is AIM Investment Funds (Invesco Investment Funds) (the “Trust”), 11 Greenway Plaza, Suite 2500, Houston, Texas 77046-1173. The trustees serve for the life of the Trust, subject to their earlier death, incapacitation, resignation, retirement or removal as more specifically provided in the Trust’s organizational documents. Each officer serves for a one year term or until their successors are elected and qualified. Column two below includes length of time served with predecessor entities, if any.
| | | | | | | | | |
| | | | | | | Number of
| | |
| | | | | | | Funds in
| | |
| | | | | | | Fund Complex
| | |
Name, Year of Birth and
| | Trustee and/
| | Principal Occupation(s)
| | Overseen by
| | Other Directorship(s)
|
| Position(s) Held with the Trust | | or Officer Since | | During Past 5 Years | | Trustee | | Held by Trustee |
| | | | | | | | | |
| | | | | | | | | |
| Other Officers | | | | | | | | |
| | | | | | | | | |
| | | | | | | | | |
| | | | | | | | | |
Russell C. Burk — 1958
Senior Vice President and Senior Officer | | 2005 | | Senior Vice President and Senior Officer of Invesco Funds | | N/A | | N/A |
| | | | | | | | | |
| | | | | | | | | |
| | | | | | | | | |
John M. Zerr — 1962
Senior Vice President, Chief Legal Officer and Secretary | | 2006 | | Director, Senior Vice President, Secretary and General Counsel, Invesco Management Group, Inc. (formerly known as Invesco Aim Management Group, Inc.) and Van Kampen Exchange Corp.; Senior Vice President, Invesco Advisers, Inc. (formerly known as Invesco Institutional (N.A.), Inc.) (registered investment adviser); Senior Vice President and Secretary, Invesco Distributors, Inc. (formerly known as Invesco Aim Distributors, Inc.); Director, Vice President and Secretary, Invesco Investment Services, Inc. (formerly known as Invesco Aim Investment Services, Inc.) and IVZ Distributors, Inc. (formerly known as INVESCO Distributors, Inc.); Director and Vice President, INVESCO Funds Group, Inc.; Senior Vice President, Chief Legal Officer and Secretary, The Invesco Funds; Manager, Invesco PowerShares Capital Management LLC; Director, Secretary and General Counsel, Invesco Investment Advisers LLC (formerly known as Van Kampen Asset Management); Secretary and General Counsel, Van Kampen Funds Inc. and Chief Legal Officer, PowerShares Exchange-Traded Fund Trust, PowerShares Exchange-Traded Fund Trust II, PowerShares India Exchange-Traded Fund Trust and PowerShares Actively Managed Exchange-Traded Fund Trust
Formerly: Director and Secretary, Van Kampen Advisors Inc.; Director Vice President, Secretary and General Counsel Van Kampen Investor Services Inc.; Director, Invesco Distributors, Inc. (formerly known as Invesco Aim Distributors, Inc.); Director, Senior Vice President, General Counsel and Secretary, Invesco Advisers, Inc.; and Van Kampen Investments Inc.; Director, Vice President and Secretary, Fund Management Company; Director, Senior Vice President, Secretary, General Counsel and Vice President, Invesco Aim Capital Management, Inc.; Chief Operating Officer and General Counsel, Liberty Ridge Capital, Inc. (an investment adviser); Vice President and Secretary, PBHG Funds (an investment company) and PBHG Insurance Series Fund (an investment company); Chief Operating Officer, General Counsel and Secretary, Old Mutual Investment Partners (a broker-dealer); General Counsel and Secretary, Old Mutual Fund Services (an administrator) and Old Mutual Shareholder Services (a shareholder servicing center); Executive Vice President, General Counsel and Secretary, Old Mutual Capital, Inc. (an investment adviser); and Vice President and Secretary, Old Mutual Advisors Funds (an investment company) | | N/A | | N/A |
| | | | | | | | | |
| | | | | | | | | |
| | | | | | | | | |
Lisa O. Brinkley — 1959
Vice President | | 2004 | | Global Compliance Director, Invesco Ltd.; Chief Compliance Officer, Invesco Investment Services, Inc.(formerly known as Invesco Aim Investment Services, Inc.); and Vice President, The Invesco Funds
Formerly: Chief Compliance Officer, Invesco Distributors, Inc. (formerly known as Invesco Aim Distributors, Inc.) and Van Kampen Investor Services Inc.; Senior Vice President, Invesco Management Group, Inc.; Senior Vice President and Chief Compliance Officer, Invesco Advisers, Inc. and The Invesco Funds; Vice President and Chief Compliance Officer, Invesco Aim Capital Management, Inc. and Invesco Distributors, Inc.; Vice President, Invesco Investment Services, Inc. and Fund Management Company | | N/A | | N/A |
| | | | | | | | | |
| | | | | | | | | |
| | | | | | | | | |
Sheri Morris — 1964
Vice President, Treasurer and Principal Financial Officer | | 1999 | | Vice President, Treasurer and Principal Financial Officer, The Invesco Funds; and Vice President, Invesco Advisers, Inc. (formerly known as Invesco Institutional (N.A.), Inc.) (registered investment adviser).
Formerly: Treasurer, PowerShares Exchange-Traded Fund Trust, PowerShares Exchange--Traded Fund Trust II, PowerShares India Exchange-Traded Fund Trust and PowerShares Actively Managed Exchange-Traded Fund Trust; Vice President, Invesco Advisers, Inc., Invesco Aim Capital Management, Inc. and Invesco Aim Private Asset Management, Inc.; Assistant Vice President and Assistant Treasurer, The Invesco Funds and Assistant Vice President, Invesco Advisers, Inc., Invesco Aim Capital Management, Inc. and Invesco Aim Private Asset Management, Inc. | | N/A | | N/A |
| | | | | | | | | |
| | | | | | | | | |
| | | | | | | | | |
Karen Dunn Kelley — 1960
Vice President | | 2004 | | Head of Invesco’s World Wide Fixed Income and Cash Management Group; Senior Vice President, Invesco Advisers, Inc. (formerly known as Invesco Institutional (N.A.), Inc.) (registered investment adviser); Executive Vice President, Invesco Distributors, Inc. (formerly known as Invesco Aim Distributors, Inc.); Senior Vice President, Invesco Management Group, Inc. (formerly known as Invesco Aim Management Group, Inc.); and Director, Invesco Mortgage Capital Inc.; Vice President, The Invesco Funds (other than AIM Treasurer’s Series Trust (Invesco Treasurer’s Series Trust) and Short-Term Investments Trust); President and Principal Executive Officer, The Invesco Funds (AIM Treasurer’s Series Trust (Invesco Treasurer’s Series Trust) and Short-Term Investments Trust only).
Formerly: Senior Vice President, Van Kampen Investments Inc.; Vice President, Invesco Advisers, Inc. (formerly known as Invesco Institutional (N.A.), Inc.); Director of Cash Management and Senior Vice President, Invesco Advisers, Inc. and Invesco Aim Capital Management, Inc.; President and Principal Executive Officer, Tax-Free Investments Trust; Director and President, Fund Management Company; Chief Cash Management Officer, Director of Cash Management, Senior Vice President, and Managing Director, Invesco Aim Capital Management, Inc.; Director of Cash Management, Senior Vice President, and Vice President, Invesco Advisers, Inc. and The Invesco Funds (AIM Treasurer’s Series Trust (Invesco Treasurer’s Series Trust), Short-Term Investments Trust and Tax-Free Investments Trust only) | | N/A | | N/A |
| | | | | | | | | |
T-3 Invesco International Total Return Fund
Trustees and Officers—(continued)
The address of each trustee and officer is AIM Investment Funds (Invesco Investment Funds) (the “Trust”), 11 Greenway Plaza, Suite 2500, Houston, Texas 77046-1173. The trustees serve for the life of the Trust, subject to their earlier death, incapacitation, resignation, retirement or removal as more specifically provided in the Trust’s organizational documents. Each officer serves for a one year term or until their successors are elected and qualified. Column two below includes length of time served with predecessor entities, if any.
| | | | | | | | | |
| | | | | | | Number of
| | |
| | | | | | | Funds in
| | |
| | | | | | | Fund Complex
| | |
Name, Year of Birth and
| | Trustee and/
| | Principal Occupation(s)
| | Overseen by
| | Other Directorship(s)
|
| Position(s) Held with the Trust | | or Officer Since | | During Past 5 Years | | Trustee | | Held by Trustee |
| | | | | | | | | |
| | | | | | | | | |
| Other Officers—(continued) | | | | | | | | |
| | | | | | | | | |
| | | | | | | | | |
| | | | | | | | | |
Lance A. Rejsek — 1967
Anti-Money Laundering Compliance Officer | | 2005 | | Anti-Money Laundering Compliance Officer, Invesco Advisers, Inc. (formerly known as Invesco Institutional (N.A.), Inc.) (registered investment adviser); Invesco Distributors, Inc. (formerly known as Invesco Aim Distributors, Inc.), Invesco Investment Services, Inc. (formerly known as Invesco Aim Investment Services, Inc.), The Invesco Funds, PowerShares Exchange-Traded Fund Trust, PowerShares Exchange-Traded Fund Trust II, PowerShares India Exchange-Traded Fund Trust, PowerShares Actively Managed Exchange-Traded Fund Trust, Invesco Investment Advisers LLC (formerly known as Van Kampen Asset Management) and Van Kampen Funds Inc.
Formerly: Anti-Money Laundering Compliance Officer, Van Kampen Investor Services Inc., Fund Management Company, Invesco Advisers, Inc., Invesco Aim Capital Management, Inc. and Invesco Aim Private Asset Management, Inc. | | N/A | | N/A |
| | | | | | | | | |
| | | | | | | | | |
| | | | | | | | | |
Todd L. Spillane — 1958
Chief Compliance Officer | | 2006 | | Senior Vice President, Invesco Management Group, Inc. (formerly known as Invesco Aim Management Group, Inc.) and Van Kampen Exchange Corp.; Senior Vice President and Chief Compliance Officer, Invesco Advisers, Inc. (registered investment adviser) (formerly known as Invesco Institutional (N.A.), Inc.); Chief Compliance Officer, The Invesco Funds, PowerShares Exchange-Traded Fund Trust, PowerShares Exchange-Traded Fund Trust II, PowerShares India Exchange-Traded Fund Trust, PowerShares Actively Managed Exchange-Traded Fund Trust, INVESCO Private Capital Investments, Inc. (holding company) and Invesco Private Capital, Inc. (registered investment adviser); Vice President, Invesco Distributors, Inc. (formerly known as Invesco Aim Distributors, Inc.) and Invesco Investment Services, Inc. (formerly known as Invesco Aim Investment Services, Inc.).
Formerly: Chief Compliance Officer, Invesco Van Kampen Closed-End Funds; Senior Vice President, Van Kampen Investments Inc.; Senior Vice President and Chief Compliance Officer, Invesco Advisers, Inc. and Invesco Aim Capital Management, Inc.; Chief Compliance Officer, Invesco Global Asset Management (N.A.), Inc., Invesco Senior Secured Management, Inc. (registered investment adviser) and Van Kampen Investor Services Inc.; Vice President, Invesco Aim Capital Management, Inc. and Fund Management Company | | N/A | | N/A |
| | | | | | | | | |
The Statement of Additional Information of the Trust includes additional information about the Fund’s Trustees and is available upon request, without charge, by calling 1.800.959.4246. Please refer to the Fund’s prospectus for information on the Fund’s sub-advisers.
| | | | | | | |
Office of the Fund
11 Greenway Plaza, Suite 2500
Houston, TX 77046-1173 | | Investment Adviser
Invesco Advisers, Inc.
1555 Peachtree Street, N.E.
Atlanta, GA 30309 | | Distributor
Invesco Distributors, Inc.
11 Greenway Plaza, Suite 2500
Houston, TX 77046-1173 | | Auditors
PricewaterhouseCoopers LLP
1201 Louisiana Street, Suite 2900
Houston, TX 77002-5678 |
| | | | | | | |
| | | | | | | |
Counsel to the Fund
Stradley Ronon Stevens & Young, LLP
2600 One Commerce Square
Philadelphia, PA 19103 | | Counsel to the
Independent Trustees
Kramer, Levin, Naftalis & Frankel LLP
1177 Avenue of the Americas
New York, NY 10036-2714 | | Transfer Agent
Invesco Investment Services, Inc.
11 Greenway Plaza, Suite 2500
Houston, TX 77046-1173 | | Custodian
State Street Bank and Trust Company
225 Franklin
Boston, MA 02110-2801 |
T-4 Invesco International Total Return Fund
Invesco mailing information
Send general correspondence to Invesco Investment Services, Inc., P.O. Box 219078, Kansas City, MO 64121-9078.
Invesco privacy policy
You share personal and financial information with us that is necessary for your transactions and your account records. We take very seriously the obligation to keep that information confidential and private.
Invesco collects nonpublic personal information about you from account applications or other forms you complete and from your transactions with us or our affiliates. We do not disclose information about you or our former customers to service providers or other third parties except to the extent necessary to service your account and in other limited circumstances as permitted by law. For example, we use this information to facilitate the delivery of transaction confirmations, financial reports, prospectuses and tax forms.
Even within Invesco, only people involved in the servicing of your accounts and compliance monitoring have access to your information. To ensure the highest level of confidentiality and security, Invesco maintains physical, electronic and procedural safeguards that meet or exceed federal standards. Special measures, such as data encryption and authentication, apply to your communications with us on our website. More detail is available to you at invesco.com/privacy.
Important notice regarding delivery of security holder documents
To reduce Fund expenses, only one copy of most shareholder documents may be mailed to shareholders with multiple accounts at the same address (Householding). Mailing of your shareholder documents may be householded indefinitely unless you instruct us otherwise. If you do not want the mailing of these documents to be combined with those for other members of your household, please contact Invesco Investment Services, Inc. at 800 959 4246 or contact your financial institution. We will begin sending you individual copies for each account within 30 days after receiving your request.
Fund holdings and proxy voting information
The Fund provides a complete list of its holdings four times in each fiscal year, at the quarter-ends. For the second and fourth quarters, the lists appear in the Fund’s semiannual and annual reports to shareholders. For the first and third quarters, the Fund files the lists with the Securities and Exchange Commission (SEC) on Form N-Q. The most recent list of portfolio holdings is available at invesco.com/completeqtrholdings. Shareholders can also look up the Fund’s Forms N-Q on the SEC website at sec.gov. Copies of the Fund’s Forms N-Q may be reviewed and copied at the SEC Public Reference Room in Washington, D.C. You can obtain information on the operation of the Public Reference Room, including information about duplicating fee charges, by calling 202 551 8090 or 800 732 0330, or by electronic request at the following email address: publicinfo@sec.gov. The SEC file numbers for the Fund are 811-05426 and 033-19338.
A description of the policies and procedures that the Fund uses to determine how to vote proxies relating to portfolio securities is available without charge, upon request, from our Client Services department at 800 959 4246 or at invesco.com/proxyguidelines. The information is also available on the SEC website, sec.gov.
Information regarding how the Fund voted proxies related to its portfolio securities during the 12 months ended June 30, 2011, is available at invesco.com/proxysearch. The information is also available on the SEC website, sec.gov.
Invesco Advisers, Inc. is an investment adviser; it provides investment advisory services to individual and institutional clients and does not sell securities. Invesco Distributors, Inc. is the U.S. distributor for Invesco Ltd.’s retail mutual funds, exchange-traded funds and institutional money market funds. Both are wholly owned, indirect subsidiaries of Invesco Ltd.
| | | | | |
| | | ITR-AR-1 | | Invesco Distributors, Inc. |
| | | |
|
| |
Annual Report to Shareholders | | October 31, 2011 |
Invesco Pacific Growth Fund
Nasdaq:
A: TGRAX § B: TGRBX § C: TGRCX § R: TGRRX § Y: TGRDX § Institutional: TGRSX
| | | |
|
| |
| 2 | | Letters to Shareholders |
| 4 | | Performance Summary |
| 4 | | Management Discussion |
| 6 | | Long-Term Fund Performance |
| 8 | | Supplemental Information |
| 9 | | Schedule of Investments |
| 12 | | Financial Statements |
| 14 | | Notes to Financial Statements |
| 21 | | Financial Highlights |
| 22 | | Auditor’s Report |
| 23 | | Fund Expenses |
| 24 | | Approval of Investment Advisory and Sub-Advisory Agreements |
| 26 | | Tax Information |
| T-1 | | Trustees and Officers |
Letters to Shareholders

Philip Taylor
Dear Shareholders:
Enclosed is important information about your Fund and its performance. I encourage you to read this report to learn more about your Fund’s short- and long-term performance and its holdings as of the close of the reporting period. This report also includes useful information about your Fund’s management team and a discussion of how your Fund was managed during the reporting period.
Investors are likely to confront both opportunities and challenges in 2012 – just as we did in 2011. After all, changes in market sentiment never do investors the courtesy of announcing their impending arrival, and your goals and needs may have changed, requiring changes in your financial strategy.
That’s why the start of a new year is always a good time to catch up with your financial adviser. He or she can explain how your investments performed in the year just ended – how each performed individually, and more important, how they performed as a diversified portfolio. Of course, it’s important to remember that an investment’s long-term performance is more important than its short-term performance. Looking ahead to the new year and evaluating your individual situation, your financial adviser can provide valuable insight into whether your investments are still appropriate for your individual needs, goals and risk tolerance.
For current information about your Fund
In addition to meeting with your financial adviser to discuss your individual situation at the start of the new year, you also may find it helpful to stay abreast of market trends and developments. Doing so may provide reassurance in times of economic uncertainty and market volatility such as we saw in 2011 – and are likely to see again in 2012.
Invesco can help you stay informed about your investments and market trends. On our website, invesco.com/us, we provide timely market updates and commentary from many of our fund managers and other investment professionals. Also on our website, you can obtain information about your account at any hour of the day or night. I invite you to visit and explore the tools and information we offer at invesco.com/us.
Our commitment to investment excellence
As we’ve seen over the last several years, market conditions can change – often suddenly and dramatically. That’s one reason financial advisers typically advise their clients to be well diversified and to maintain a long-term investment focus. While diversification can’t guarantee a profit or protect against loss, it may cushion the impact of dramatic market moves. Maintaining a long-term investment focus for your long-term goals – financing your retirement or your children’s education, for example – may help you avoid making rash investment decisions based on short-term market swings.
Likewise, Invesco’s investment professionals maintain a long-term focus. Across our broad array of investment products, investment excellence is our ultimate goal. Each of our funds is managed by specialized teams of investment professionals, and as a company, we maintain a single focus – investment management – that allows our fund managers to concentrate on doing what they do best: managing your money.
Our funds are managed strictly according to their stated investment objectives and strategies, with robust risk oversight using consistent, repeatable investment processes that don’t change in response to short-term market events. This disciplined approach can’t guarantee a profit; no investment can do that, since all involve some measure of risk. But it can ensure that your money is managed the way we said it would be – according to your Fund’s objective and strategies.
Our adherence to stated investment objectives and strategies allows your financial adviser to build a diversified portfolio that meets your individual risk tolerance and financial goals. It also means that when your goals change, your financial adviser will be able to find an Invesco fund that’s appropriate for your needs.
Questions?
If you have questions about your account, please contact one of our client service representatives at 800 959 4246. If you have a general Invesco-related question or comment for me, I invite you to email me directly at phil@invesco.com.
All of us at Invesco look forward to serving your investment management needs for many years to come. Thank you for investing with us.
Sincerely,
Philip Taylor
Senior Managing Director, Invesco Ltd.
2 Invesco Pacific Growth Fund

Bruce Crockett
Dear Fellow Shareholders:
Although the world’s economies are gradually recovering from the financial crisis, it has not been a smooth path. Unrest in the Middle East, persistently weak job and housing markets in the U.S. and continued government balance sheet repair in Europe are contributing to a slow, labored march toward global recovery.
In this environment, investors face risks that could make it more difficult to achieve their long-term financial goals – a secure retirement, home ownership, a child’s college education. Although the markets are complex and dynamic, there are ways to simplify the process and potentially increase your odds of achieving your goals. The best approach is to create a solid financial plan that helps you save and invest in ways that anticipate your needs over the long term.
Your financial adviser can help you define your financial plan, develop an appropriate investment strategy and put you in a better position to achieve your financial goals over the long term. This can take some of the guesswork out of the process and help you make thoughtful investments. Your financial adviser also can help you better understand your tolerance for risk, so that your investment approach lets you sleep at night while getting you closer to your goals. Lastly, your financial adviser can develop an asset allocation strategy that seeks to balance your investment approach, providing some protection against a decline in the markets while allowing you to participate in rising markets. Invesco calls this type of approach “intentional investing.” It means thinking carefully, planning thoughtfully and acting deliberately.
While no investment can guarantee favorable returns, your Board remains committed to managing costs and enhancing the performance of Invesco’s funds as part of our Investor First orientation. We continue to oversee the funds with the same strong sense of responsibility for your money and your continued trust that we’ve always maintained.
Thanks to the approval of our fund shareholders, Invesco has made great progress in realigning our U.S. mutual fund product line following our acquisition of Morgan Stanley’s retail asset management business, including Van Kampen Investments. When completed, the realignment will reduce overlap in the product lineup, enhance efficiency across our product line and build a solid foundation for further growth to meet client and shareholder needs. I would like to thank those of you who voted your proxy, and I hope our shareholders haven’t been too inconvenienced by the process.
As always, please contact me at bruce@brucecrockett.com with any questions or concerns you may have. On behalf of your Board, we look forward to continuing to represent your interests and serving your needs.
Sincerely,
Bruce L. Crockett
Independent Chair
Invesco Funds Board of Trustees
3 Invesco Pacific Growth Fund
Management’s Discussion of Fund Performance
Performance summary
Global equity markets faced headwinds in 2010 and 2011. China’s growth continued to slow as the U.S. battled high unemployment and runaway deficits. Several European countries faced similar deficits, which brought to light the imperfect structure of the euro. The reporting period ended with a market upswing, however, as European leaders took steps to address the Greek sovereign debt issue, expand the bailout fund and stabilize the banking system.
The volatility and weakness experienced by global equity markets over the fiscal year ended October 31, 2011, was reflected in the performance of Invesco Pacific Growth Fund, which underperformed its style-specific benchmark, the Custom Pacific Growth Index.
Your Fund’s long-term performance appears later in this report.
Fund vs. Indexes
Total returns, 10/31/10 to 10/31/11, at net asset value (NAV). Performance shown does not include applicable contingent deferred sales charges (CDSC) or front-end sales charges, which would have reduced performance.
| | | | | |
|
| Class A Shares | | | -9.00 | % |
| |
| Class B Shares | | | -9.63 | |
| |
| Class C Shares | | | -9.57 | |
| |
| Class R Shares | | | -9.20 | |
| |
| Class Y Shares | | | -8.77 | |
| |
Institutional Class Shares† | | | -8.83 | |
| |
MSCI All Country Asia Pacific Index▼(Former Broad Market Index)‡ | | | -3.41 | |
| |
MSCI EAFE Index▼(Broad Market Index)‡ | | | -4.08 | |
| |
MSCI All Country Asia Pacific Ex-Japan Index▼(Former Style-Specific Index)‡ | | | -4.12 | |
| |
MSCI Japan Index▼ (Former Style-Specific Index)‡ | | | -2.33 | |
| |
Custom Pacific Growth Index■ (Style-Specific Index)‡ | | | -2.46 | |
| |
Lipper Pacific Region Funds Index▼(Peer Group Index) | | | -6.84 | |
| |
| | |
| Source(s): ▼Lipper Inc.; ■Invesco, Lipper Inc. |
| |
| † | | Share class incepted during the reporting period. See page 7 for a detailed explanation of Fund performance. |
| |
| ‡ | | During the reporting period, the Fund has elected to use the MSCI EAFE Index as its broad market index rather than the MSCI All Country Asia Pacific Index because the MSCI EAFE Index is better aligned with its investment processes and restrictions. In addition, the Fund has elected to use the Custom Pacific Growth Index as its style-specific index rather than the MSCI All Country Asia Pacific Ex-Japan Index and the MSCI Japan Index because the Custom Pacific Growth Index is better aligned with its investment processes and restrictions. |
How we invest
Asia (excluding Japan): Our investment process combines a disciplined bottom-up and top-down multifactor analysis. Regional portfolios reflect the holdings of the regional model portfolio, which is constructed using country model portfolios as building blocks. Country specialists are responsible for creating country model portfolios based on
proprietary research and analysis. The country weightings within the regional model portfolio reflect both bottom-up opportunities and top-down country preferences as determined during country allocation meetings.
Japan: Our investment process consists of bottom-up stock selection and portfolio construction. Starting with the stocks listed on the Tokyo Stock Exchange First Section, we use liquidity and
then a valuation screening to focus on the least expensive quartile group based on price-to-earnings, price-to-book or price-to-cash flow. We then use a fundamentals screening process to narrow the results down to a small group of names. Next, we conduct in-depth research, including company visits and management interviews, to define the potential value and growth opportunity from a long-term perspective.
When choosing a stock and deciding its weighting, our confidence level, relative valuation and liquidity are key considerations. In portfolio construction, we also emphasize portfolio balance, creating diversification among different types of undervalued securities based on our own value definition.
We consider selling a Fund holding if:
| n | | We believe the stock is trading significantly above its fair value. |
| |
| n | | We believe a stock has negative earnings momentum or has had sequential earnings downgrades, unless its valuation is already very low or distressed. |
| |
| n | | We see a permanent, fundamental deterioration in a company’s business prospects. |
| |
| n | | We identify a more attractive opportunity elsewhere. |
Market conditions and your Fund
Asia Pacific (excluding Japan) markets were extremely volatile during the reporting period in tandem with the global markets. Despite relatively sound fundamentals, regional markets sold off as escalating U.S. recession risks and renewed concerns over the eurozone sovereign debt outlook prompted investors to exit riskier emerging markets and cyclical equities and commodities.
Regional economic indicators, while still relatively robust, showed signs of a slowdown with the downturn in developed markets growth. Amid global economic uncertainties, we saw a
Portfolio Composition
By sector
| | | | | |
|
| Consumer Discretionary | | | 18.4 | % |
| |
| Information Technology | | | 17.4 | |
| |
| Industrials | | | 14.4 | |
| |
| Financials | | | 12.9 | |
| |
| Materials | | | 11.0 | |
| |
| Consumer Staples | | | 6.7 | |
| |
| Energy | | | 4.5 | |
| |
| Telecommunication Services | | | 4.3 | |
| |
| Health Care | | | 3.8 | |
| |
| Utilities | | | 1.3 | |
| |
Other Assets Less Liabilities | | | 5.3 | |
Top 10 Equity Holdings
| | | | | | | | | |
|
| | 1. | | | Canon, Inc. | | | 1.5 | % |
| |
| | 2. | | | Sands China Ltd. | | | 1.5 | |
| |
| | 3. | | | BHP Billiton Ltd. | | | 1.5 | |
| |
| | 4. | | | Samsung Electronics Co., Ltd. | | | 1.4 | |
| |
| | 5. | | | Mitsubishi Corp. | | | 1.3 | |
| |
| | 6. | | | Tencent Holdings Ltd. | | | 1.3 | |
| |
| | 7. | | | Keppel Corp. Ltd. | | | 1.3 | |
| |
| | 8. | | | China Shenhua Energy Co. Ltd.-Class H | | | 1.2 | |
| |
| | 9. | | | Nissan Motor Co., Ltd. | | | 1.2 | |
| |
| | 10. | | | Astra International Tbk PT | | | 1.2 | |
Top Five Countries
| | | | | | | | | |
|
| | 1. | | | Japan | | | 38.1 | % |
| |
| | 2. | | | Australia | | | 13.3 | |
| |
| | 3. | | | China | | | 10.1 | |
| |
| | 4. | | | Taiwan | | | 8.0 | |
| |
| | 5. | | | South Korea | | | 7.0 | |
| | | | | |
|
| Total Net Assets | | $101.9 million | |
| | | | | |
| Total Number of Holdings | | | 157 | |
The Fund’s holdings are subject to change, and there is no assurance that the Fund will continue to hold any particular security.
4 Invesco Pacific Growth Fund
sequential contraction in growth in the gross domestic product readings of most Asian economies, while export orders and volumes declined significantly over the third quarter of 2011. Robust domestic demand helped offset weakness in the external sector during the period, but there were signs that domestic demand had plateaued.
The flip side to weakening growth was a reduction in the inflation risks that overshadowed investor sentiment in the first half of 2011. With the exception of India and Japan, inflation in Asia Pacific showed signs of deceleration, as energy prices leveled off and food price increases began to ease. However, the struggle by regional central banks to get ahead of the inflation curve and bring rapid credit expansion, while keeping asset prices under control, suggested that the scope for policy easing would be more limited.
In Japan, the effects of the March earthquake and tsunami have largely passed, and production levels returned to normal. However, Japan faced the effects of a new natural disaster with flooding in Thailand because Japanese manufacturers use Thailand as a production hub. The yen’s continued strength and weak export numbers to the U.S. and Europe produced a steady stream of earnings growth downgrade revisions as well.
In this environment, the Fund underperformed its style-specific benchmark, the Custom Pacific Growth Index, during the reporting period. Driven primarily by stock selection, the Fund underperformed the index by the widest margins in the industrials, information technology (IT), telecommunication services and financials sectors. An underweight position in telecommunication services, the best-performing sector for the period, also detracted from performance.
At about 40%, the Fund’s largest country exposure was to Japan, while the benchmark weight was approximately 50%. Our underweight position and stock selection in Japan made it the largest country-level detractor from relative results. The Fund’s Japanese holdings were predominantly weak in the utilities, financials and IT sectors. Among individual holdings, Ricoh, a major copier manufacturer, lagged the market in a tough earnings environment arising from a stronger yen, and Nintendo performed poorly due to its lackluster launch of new handheld game console 3DS.
Fund holdings in China and Taiwan also detracted from relative performance. In China, the financials sector was the largest detractor during the fiscal year as
fears of a global economic slowdown and European sovereign debt uncertainties weighed on our holdings in the sector. Financial companies China Construction Bank and Bank of China were among the largest individual detractors from Fund performance.
Some of the Fund’s underperformance relative to the Custom Pacific Growth Index was offset by outperformance in the energy sector. An underweight exposure to the utilities sector also benefited results. From a country perspective, the Fund outperformed the index by the widest margins in Indonesia and India.
Top stock-level contributors for the fiscal year included Samsung Electronics, S-Oil and Astra International. We sold our position in S-Oil before the end of the reporting period.
Amid the market environment during the fiscal year, our strategy was focused on companies that we believe are higher quality and have longevity. Stock selection continued to be the key. We took advantage of the market downturn and accumulated more positions in companies with strong balance sheets and cheap valuations.
Given that the Asia Pacific region – particularly emerging markets within this region – experienced extreme volatility during the fiscal year, we would like to caution investors against making investment decisions based on the short term. As always, we recommend that you consult a financial adviser to discuss your individual financial program. We remain committed to our investment discipline and maintain our positive stance on the Asian economy and stock market over the long term. Thank you for your participation in Invesco Pacific Growth Fund.
The views and opinions expressed in management’s discussion of Fund performance are those of Invesco Advisers, Inc. These views and opinions are subject to change at any time based on factors such as market and economic conditions. These views and opinions may not be relied upon as investment advice or recommendations, or as an offer for a particular security. The information is not a complete analysis of every aspect of any market, country, industry, security or the Fund. Statements of fact are from sources considered reliable, but Invesco Advisers, Inc. makes no representation or warranty as to their completeness or accuracy. Although historical performance is no guarantee of future results, these insights may help you understand our investment management philosophy.
See important Fund and, if applicable, index disclosures later in this report.
Paul Chan
Chartered Financial Analyst, portfolio manager, is manager of Invesco Pacific Growth Fund. He joined Invesco in 2001. Mr. Chan earned a B.S. in economics from the University of Manitoba.
Daiji Ozawa
Chartered Financial Analyst, portfolio manager, is manager of Invesco Pacific Growth Fund. He joined Invesco in 2010. Mr. Ozawa earned a B.A. in political science from Waseda University.
Kunihiko Sugio
Portfolio manager, is manager of Invesco Pacific Growth Fund. He joined Invesco in 2010. Mr. Sugio earned a B.A. in economics from Wakayama University.
5 Invesco Pacific Growth Fund
Your Fund’s Long-Term Performance
Results of a $10,000 Investment – Oldest Share Class
Fund and index data from 10/31/01
Past performance cannot guarantee comparable future results.
During the reporting period, the Fund has elected to use the MSCI EAFE Index as its broad market index rather than the MSCI All Country Asia Pacific Index because the MSCI EAFE Index is better aligned with its investment processes and restrictions. In addition, the Fund has elected to use the Custom Pacific Growth Index as its style-specific index rather than the MSCI All Country Asia Pacific Ex-Japan Index and the MSCI Japan Index because the Custom Pacific Growth Index is better aligned with its investment processes and restrictions.
The data shown in the chart include reinvested distributions, applicable sales charges and Fund expenses including management fees. Results for Class B shares are calculated as if a hypothetical shareholder had liquidated his entire investment in the Fund at the close of the reporting period and paid the contingent deferred sales charges, if applicable. Index results include reinvested dividends, but they do not reflect sales charges. Performance of the peer group, if applicable, reflects fund expenses and management fees; performance of a market index does not. Performance shown in the chart and table(s) does not reflect deduction of taxes a shareholder would pay on Fund distributions or sale of Fund shares.
This chart, which is a logarithmic chart, presents the fluctuations in the value of the Fund and its indexes. We believe that a logarithmic chart is more effective than other types of charts in illustrating changes in value during the early years shown in the chart. The vertical axis, the one that indicates the dollar value of an investment, is constructed with each segment representing a percent change in the value of the investment. In this chart, each segment represents a doubling, or 100% change, in the value of the investment. In other words, the space between $5,000 and $10,000 is the same size as the space between $10,000 and $20,000 and so on.
continued from page 8
| n | | Small- and mid-capitalization risk.
Stocks of small and mid-sized companies tend to be more vulnerable to adverse developments in the above factors and may have little or no operating history or track record of success, and limited product lines, markets, management and financial resources. The securities of small and mid-sized companies may be more volatile due to less market interest and less publicly available information about the issuer. They also may be illiquid or restricted as to resale, or may trade less frequently and in smaller volumes, all of which may cause difficulty when establishing or closing a position at a desirable price. |
About indexes used in this report
| n | | The MSCI All Country Asia Pacific Index is an unmanaged index considered representative of Pacific region stock markets. |
| |
| n | | The MSCI EAFE® Index is an unmanaged index considered representative of stocks of Europe, Australasia and the Far East. |
| |
| n | | The MSCI All Country Asia Pacific Ex-Japan Index is an unmanaged index considered representative of Pacific region stock markets, excluding Japan. |
| |
| n | | The MSCI Japan Index is an unmanaged index considered representative of stocks in Japan. |
| n | | The Custom Pacific Growth Index was created by Invesco to serve as a benchmark for Invesco Pacific Growth Fund and is composed of the following indexes: MSCI Japan (50%) and MSCI All Country Asia Pacific Ex-Japan (50%). |
| |
| n | | The Lipper Pacific Region Funds Index is an unmanaged index considered representative of Pacific region funds tracked by Lipper. |
| |
| n | | The Fund is not managed to track the performance of any particular index, including the index(es) defined here, and consequently, the performance of the Fund may deviate significantly from the performance of the index(es). |
continued on page 7
6 Invesco Pacific Growth Fund
Average Annual Total Returns
As of 10/31/11, including maximum applicable
sales charges
| | | | | | | | | |
|
| Class A Shares | | | | |
| |
| Inception (7/28/97) | | | 0.37 | % |
| |
| | 10 | | | Years | | | 8.10 | |
| |
| | 5 | | | Years | | | -0.12 | |
| |
| | 1 | | | Year | | | -13.99 | |
| |
| | | | | | | | | |
| Class B Shares | | | | |
| |
| Inception (11/30/90) | | | 4.31 | % |
| |
| | 10 | | | Years | | | 8.02 | |
| |
| | 5 | | | Years | | | -0.13 | |
| |
| | 1 | | | Year | | | -14.14 | |
| |
| | | | | | | | | |
| Class C Shares | | | | |
| |
| Inception (7/28/97) | | | 0.04 | % |
| |
| | 10 | | | Years | | | 7.92 | |
| |
| | 5 | | | Years | | | 0.29 | |
| |
| | 1 | | | Year | | | -10.48 | |
| |
| | | | | | | | | |
| Class R Shares | | | | |
| |
| Inception (3/31/08) | | | -4.05 | % |
| |
| | 1 | | | Year | | | -9.20 | |
| |
| | | | | | | | | |
| Class Y Shares | | | | |
| |
| Inception (7/28/97) | | | 1.01 | % |
| |
| | 10 | | | Years | | | 8.97 | |
| |
| | 5 | | | Years | | | 1.28 | |
| |
| | 1 | | | Year | | | -8.77 | |
| |
| | | | | | | | | |
| Institutional Class Shares | | | | |
| |
| | 10 | | | Years | | | 8.73 | % |
| |
| | 5 | | | Years | | | 1.05 | |
| |
| | 1 | | | Year | | | -8.83 | |
Effective June 1, 2010, Class A, Class B, Class C, Class R, Class W and Class I shares of the predecessor fund, Morgan Stanley Pacific Growth Fund Inc., advised by Morgan Stanley Investment Advisors Inc. were reorganized into Class A, Class B, Class C, Class R,Class A and Class Y shares, respectively, of Invesco Pacific Growth Fund. Returns shown above for Class A, Class B, Class C, Class R and Class Y shares are blended returns of the predecessor fund and Invesco Pacific Growth Fund. Share class returns will differ from the predecessor fund
Average Annual Total Returns
As of 9/30/11, the most recent calendar quarter-end, including maximum applicable sales charges
| | | | | | | | | |
|
| Class A Shares | | | | |
| |
| Inception (7/28/97) | | | -0.11 | % |
| |
| | 10 | | | Years | | | 7.83 | |
| |
| | 5 | | | Years | | | -0.93 | |
| |
| | 1 | | | Year | | | -17.91 | |
| |
| | | | | | | | | |
| Class B Shares | | | | |
| |
| Inception (11/30/90) | | | 3.99 | % |
| |
| | 10 | | | Years | | | 7.77 | |
| |
| | 5 | | | Years | | | -0.95 | |
| |
| | 1 | | | Year | | | -18.05 | |
| |
| | | | | | | | | |
| Class C Shares | | | | |
| |
| Inception (7/28/97) | | | -0.44 | % |
| |
| | 10 | | | Years | | | 7.65 | |
| |
| | 5 | | | Years | | | -0.53 | |
| |
| | 1 | | | Year | | | -14.59 | |
| |
| | | | | | | | | |
| Class R Shares | | | | |
| |
| Inception (3/31/08) | | | -6.00 | % |
| |
| | 1 | | | Year | | | -13.33 | |
| |
| | | | | | | | | |
| Class Y Shares | | | | |
| |
| Inception (7/28/97) | | | 0.53 | % |
| |
| | 10 | | | Years | | | 8.71 | |
| |
| | 5 | | | Years | | | 0.46 | |
| |
| | 1 | | | Year | | | -12.92 | |
| |
| | | | | | | | | |
| Institutional Class Shares | | | | |
| |
| | 10 | | | Years | | | 8.46 | % |
| |
| | 5 | | | Years | | | 0.23 | |
| |
| | 1 | | | Year | | | -12.99 | |
because of different expenses.
Institutional Class shares incepted on May 23, 2011. Performance shown prior to that date is that of Class A shares and includes the 12b-1 fees applicable to Class A shares. Class A share performance reflects any applicable fee waivers or expense reimbursements.
The performance data quoted represent past performance and cannot guarantee comparable future results; current performance may be lower or higher. Please visit invesco.com/performance for the
most recent month-end performance. Performance figures reflect reinvested distributions, changes in net asset value and the effect of the maximum sales charge unless otherwise stated. Investment return and principal value will fluctuate so that you may have a gain or loss when you sell shares.
The total annual Fund operating expense ratio set forth in the most recent Fund prospectus as of the date of this report for Class A, Class B, Class C, Class R, Class Y and Institutional Class shares was 1.74%, 2.49%, 2.49%, 1.99%, 1.49% and 1.32%, respectively. The expense ratios presented above may vary from the expense ratios presented in other sections of this report that are based on expenses incurred during the period covered by this report.
Class A share performance reflects the maximum 5.50% sales charge, and Class B and Class C share performance reflects the applicable contingent deferred sales charge (CDSC) for the period involved. The CDSC on Class B shares declines from 5% beginning at the time of purchase to 0% at the beginning of the seventh year. The CDSC on Class C shares is 1% for the first year after purchase. Class R, Class Y and Institutional Class shares do not have a front-end sales charge or a CDSC; therefore, performance is at net asset value.
The performance of the Fund’s share classes will differ primarily due to different sales charge structures and class expenses.
A redemption fee of 2% is imposed on certain redemptions or exchanges out of the Fund within 31 days of purchase. Exceptions to the redemption fee are listed in the Fund’s prospectus. Effective January 1, 2012, after the close of the reporting period, the Fund will eliminate the redemption fee, if applicable, assessed on shares of the Fund redeemed or exchanged within 31 days of purchase.
continued from page 6
| n | | A direct investment cannot be made in an index. Unless otherwise indicated, index results include reinvested dividends, and they do not reflect sales charges. Performance of the peer group, if applicable, reflects fund expenses; performance of a market index does not. |
Other information
| n | | The Chartered Financial Analyst® (CFA®) designation is globally recognized and |
| | | attests to a charterholder’s success in a rigorous and comprehensive study program in the field of investment management and research analysis. |
| |
| n | | The returns shown in management’s discussion of Fund performance are based on net asset values calculated for shareholder transactions. Generally accepted accounting principles require adjustments to be made to the net assets of the Fund at period end for financial reporting purposes, and as |
| | | such, the net asset values for shareholder transactions and the returns based on those net asset values may differ from the net asset values and returns reported in the Financial Highlights. |
| |
| n | | Industry classifications used in this report are generally according to the Global Industry Classification Standard, which was developed by and is the exclusive property and a service mark of MSCI Inc. and Standard & Poor’s. |
7 Invesco Pacific Growth Fund
Invesco Pacific Growth Fund’s investment objective is to maximize the capital appreciation of its investments.
| n | | Unless otherwise stated, information presented in this report is as of October 31, 2011, and is based on total net assets. |
| |
| n | | Unless otherwise noted, all data provided by Invesco. |
| |
| n | | To access your Fund’s reports/prospectus, visit invesco.com/fundreports. |
About share classes
| n | | Class B shares may not be purchased or acquired by exchange from share classes other than Class B shares. Please see the prospectus for more information. |
| |
| n | | Class R shares are available only to certain retirement plans. Please see the prospectus for more information. |
| |
| n | | Class Y shares are available to only certain investors. Please see the prospectus for more information. |
| |
| n | | Institutional Class shares are offered exclusively to institutional investors, including defined contribution plans that meet certain criteria. Please see the prospectus for more information. |
Principal risks of investing in the Fund
| n | | Active trading risk. The Fund may engage in frequent trading of portfolio securities. Active trading results in added expenses and may result in a lower return and increased tax liability. |
| |
| n | | Equity securities risk. In general, stock and other equity security values fluctuate, and sometimes widely fluctuate, in response to activities specific to the company as well as general market, economic and political conditions. Investments in convertible securities subject the Fund to the risks associated with both fixed-income securities, including credit risk and interest rate risk, and common stocks. A portion of the Fund’s convertible investments may be rated below investment grade. |
| |
| n | | Growth investing risk. Investments in growth-oriented equity securities may have above-average volatility of price movement. The returns on growth securities may or may not move in tandem with the returns on other styles of investing or the overall stock markets. |
| |
| n | | Foreign and emerging market securities risk. Investments in foreign markets entail special risks such as currency, political, economic and market risks. There also may be greater market |
| | | volatility, less reliable financial information, higher transaction and custody costs, decreased market liquidity and less government and exchange regulation associated with investments in foreign markets. The risks of investing in emerging market countries are greater than risks associated with investments in foreign developed countries. Hedging the Fund’s currency risks through forward foreign currency exchange contracts involves the risk of mismatching the Fund’s objectives under a forward foreign currency exchange contract with the value of securities denominated in a particular currency. There is additional risk that such transactions reduce or preclude the opportunity for gain and that currency contracts create exposure to currencies in which the Fund’s securities are not denominated. |
| |
| n | | Derivatives risk. Derivatives may be more difficult to purchase, sell or value than other investments and may be subject to market, interest rate, credit, leverage, counterparty and management risks. A fund investing in a derivative could lose more than the cash amount invested or incur higher taxes. Over-the-counter derivatives are also subject to counterparty risk, which is the risk that the other party to the contract will not fulfill its contractual obligation to complete the transaction with the Fund. |
| |
| n | | Depositary receipts risk. Depositary receipts involve many of the same risks as those associated with direct investments in foreign securities. In addition, the underlying issuers of certain depositary receipts, particularly unsponsored or unregistered depositary receipts, are under no obligation to distribute shareholder communications to the holders of such receipts, or to pass through to them any voting rights with respect to the deposited securities. |
| |
| n | | Fixed-income securities risk. All fixed-income securities are subject to two types of risk: credit risk and |
| | | interest rate risk. Credit risk refers to the possibility that the issuer of a security will be unable to make interest payments and/or repay the principal on its debt. Interest rate risk refers to fluctuations in the value of a fixed- income security resulting from changes in the general level of interest rates. When the general level of interest rates goes up, the prices of most fixed-income securities go down. When the general level of interest rates goes down, the prices of most fixed income securities go up. (Zero coupon securities are typically subject to greater price fluctuations than comparable securities that pay interest.) |
| |
| n | | Investment companies risk. Any Fund investment in an investment company is subject to the underlying risk of that investment company’s portfolio securities. For example, if the investment company held common stocks, the Fund also would be exposed to the risk of investing in common stocks. In addition to the Fund’s fees and expenses, the Fund would bear its share of the investment company’s fees and expenses. |
| |
| n | | Convertible securities risk. The Fund also may invest a portion of its assets in convertible securities, which are securities that generally pay interest and may be converted into common stock. These securities may carry risks associated with both fixed-income securities and common stock. To the extent that a convertible security’s investment value is greater than its conversion value, its price will be likely to increase when interest rates fall and decrease when interest rates rise, as with a fixed-income security. If the conversion value exceeds the investment value, the price of the convertible security will tend to fluctuate directly with the price of the underlying equity security. A portion of these securities may include junk bonds, which have speculative characteristics. |
continued on page 6
This report must be accompanied or preceded by a currently effective Fund prospectus, which contains more complete information, including sales charges and expenses. Investors should read it carefully before investing.
NOT FDIC INSURED | MAY LOSE VALUE | NO BANK GUARANTEE
Fund Nasdaq Symbols
| | | | | |
|
| Class A Shares | | TGRAX |
| Class B Shares | | TGRBX |
| Class C Shares | | TGRCX |
| Class R Shares | | TGRRX |
| Class Y Shares | | TGRDX |
| Institutional Class Shares | | TGRSX |
8 Invesco Pacific Growth Fund
Schedule of Investments
October 31, 2011
| | | | | | | | | |
| | | Shares | | Value |
| |
Common Stocks & Other Equity Interests–94.70%
|
Australia–13.30%
| | | | |
| Australia & New Zealand Banking Group Ltd. | | | 33,542 | | | $ | 755,967 | |
| |
| Beach Energy Ltd. | | | 271,196 | | | | 331,481 | |
| |
| Bendigo and Adelaide Bank Ltd. | | | 40,733 | | | | 401,663 | |
| |
| BHP Billiton Ltd. | | | 38,726 | | | | 1,515,078 | |
| |
| Caltex Australia Ltd. | | | 12,801 | | | | 177,267 | |
| |
| Challenger Ltd. | | | 69,169 | | | | 325,672 | |
| |
Coca-Cola Amatil Ltd. | | | 36,087 | | | | 465,770 | |
| |
| Commonwealth Bank of Australia | | | 22,808 | | | | 1,170,515 | |
| |
| Crown Ltd. | | | 47,527 | | | | 396,546 | |
| |
| Iluka Resources Ltd. | | | 27,958 | | | | 464,461 | |
| |
| Incitec Pivot Ltd. | | | 89,712 | | | | 319,972 | |
| |
| National Australia Bank Ltd. | | | 40,765 | | | | 1,087,394 | |
| |
| Newcrest Mining Ltd. | | | 4,640 | | | | 163,345 | |
| |
| NRW Holdings Ltd. | | | 58,706 | | | | 148,914 | |
| |
| Orica Ltd. | | | 12,486 | | | | 334,983 | |
| |
| QBE Insurance Group Ltd. | | | 19,038 | | | | 292,007 | |
| |
| QR National Ltd. | | | 116,712 | | | | 400,164 | |
| |
| Ramsay Health Care Ltd. | | | 19,060 | | | | 373,312 | |
| |
| Rio Tinto Ltd. | | | 10,789 | | | | 773,108 | |
| |
Roc Oil Co. Ltd.(a) | | | 240,030 | | | | 74,555 | |
| |
| Santos Ltd. | | | 29,795 | | | | 395,812 | |
| |
| Sigma Pharmaceuticals Ltd. | | | 192,646 | | | | 139,625 | |
| |
| TABCORP Holdings Ltd. | | | 48,421 | | | | 148,909 | |
| |
| Telstra Corp. Ltd. | | | 179,787 | | | | 584,357 | |
| |
| Wesfarmers Ltd. | | | 8,654 | | | | 290,918 | |
| |
| Westpac Banking Corp. | | | 42,749 | | | | 994,321 | |
| |
| Woodside Petroleum Ltd. | | | 3,588 | | | | 134,943 | |
| |
| Woolworths Ltd. | | | 23,626 | | | | 587,159 | |
| |
| WorleyParsons Ltd. | | | 10,453 | | | | 302,277 | |
| |
| | | | | | | | 13,550,495 | |
| |
China–10.11%
| | | | |
| Bank of China Ltd.–Class H | | | 2,692,390 | | | | 949,638 | |
| |
| China Coal Energy Co. Ltd.–Class H | | | 290,000 | | | | 355,116 | |
| |
| China Construction Bank Corp.–Class H | | | 1,355,840 | | | | 985,536 | |
| |
| China National Materials Co. Ltd.–Class H | | | 828,000 | | | | 407,360 | |
| |
| China Petroleum and Chemical Corp.–Class H | | | 376,000 | | | | 356,469 | |
| |
| China Shenhua Energy Co. Ltd.–Class H | | | 267,500 | | | | 1,224,626 | |
| |
Chongqing Rural Commercial Bank Co., Ltd.–Class H(a) | | | 1,109,000 | | | | 480,108 | |
| |
| CNOOC Ltd. | | | 499,000 | | | | 943,149 | |
| |
| GOME Electrical Appliances Holdings Ltd. | | | 2,234,160 | | | | 670,937 | |
| |
| Jiangxi Copper Co. Ltd.–Class H | | | 222,000 | | | | 521,329 | |
| |
| Kingboard Chemical Holdings Ltd. | | | 152,000 | | | | 515,692 | |
| |
| Lianhua Supermarket Holdings Ltd.–Class H | | | 392,000 | | | | 630,259 | |
| |
| Nine Dragons Paper Holdings Ltd. | | | 570,000 | | | | 379,778 | |
| |
| Tencent Holdings Ltd. | | | 57,100 | | | | 1,307,875 | |
| |
| Weichai Power Co. Ltd.–Class H | | | 113,000 | | | | 568,869 | |
| |
| | | | | | | | 10,296,741 | |
| |
Hong Kong–5.31%
| | | | |
| China Mobile Ltd. | | | 126,500 | | | | 1,205,501 | |
| |
| Citic Pacific Ltd. | | | 279,000 | | | | 495,661 | |
| |
Investment Co. of China(a)(b) | | | 100,000 | | | | 0 | |
| |
| Lifestyle International Holdings Ltd. | | | 386,000 | | | | 1,032,970 | |
| |
| Power Assets Holdings Ltd. | | | 150,500 | | | | 1,148,076 | |
| |
Sands China Ltd.(a) | | | 519,600 | | | | 1,528,806 | |
| |
| | | | | | | | 5,411,014 | |
| |
India–3.87%
| | | | |
| Bank of Baroda | | | 48,865 | | | | 769,468 | |
| |
| Bharti Airtel Ltd. | | | 44,410 | | | | 355,621 | |
| |
| Dr. Reddys Laboratories Ltd. | | | 25,728 | | | | 872,436 | |
| |
| ITC Ltd. | | | 227,718 | | | | 990,774 | |
| |
| Tata Consultancy Services Ltd. | | | 42,264 | | | | 957,900 | |
| |
| | | | | | | | 3,946,199 | |
| |
Indonesia–2.67%
| | | | |
| Astra International Tbk PT | | | 158,000 | | | | 1,209,368 | |
| |
| Bank Mandiri Tbk PT | | | 1,401,162 | | | | 1,107,166 | |
| |
| Gudang Garam Tbk PT | | | 33,000 | | | | 215,751 | |
| |
| Telekomunikasi Indonesia Tbk PT | | | 227,000 | | | | 188,446 | |
| |
| | | | | | | | 2,720,731 | |
| |
Japan–38.07%
| | | | |
| Amada Co. Ltd. | | | 92,000 | | | | 606,229 | |
| |
| Astellas Pharma Inc. | | | 25,900 | | | | 945,018 | |
| |
| Canon, Inc. | | | 33,900 | | | | 1,548,083 | |
| |
| Casio Computer Co. Ltd. | | | 43,000 | | | | 263,665 | |
| |
| Dai Nippon Printing Co. Ltd. | | | 36,000 | | | | 376,932 | |
| |
| Daicel Chemical Industries Ltd. | | | 110,000 | | | | 624,384 | |
| |
| Daifuku Co. Ltd. | | | 63,000 | | | | 326,869 | |
| |
| Daiichi Sankyo Co. Ltd. | | | 38,900 | | | | 756,438 | |
| |
| Daikin Industries Ltd. | | | 27,300 | | | | 808,774 | |
| |
| Denki Kagaku Kogyo Kabushiki Kaisha | | | 155,000 | | | | 591,058 | |
| |
| East Japan Railway Co. | | | 9,900 | | | | 601,173 | |
| |
| FamilyMart Co. Ltd. | | | 17,500 | | | | 689,315 | |
| |
| Fuji Machine Manufacturing Co. Ltd. | | | 11,900 | | | | 210,627 | |
| |
| FUJIFILM Holdings Corp. | | | 31,300 | | | | 767,548 | |
| |
See accompanying Notes to Financial Statements which are an integral part of the financial statements.
9 Invesco Pacific Growth Fund
| | | | | | | | | |
| | | Shares | | Value |
| |
Japan–(continued)
| | | | |
| | | | | | | | | |
| Fujitsu Ltd. | | | 177,000 | | | $ | 945,307 | |
| |
| Furukawa Electric Co. Ltd. | | | 145,000 | | | | 405,614 | |
| |
| Hitachi Capital Corp. | | | 42,400 | | | | 519,641 | |
| |
| Hitachi High-Technologies Corp. | | | 19,200 | | | | 401,367 | |
| |
| Hitachi Ltd. | | | 181,000 | | | | 971,468 | |
| |
| House Foods Corp. | | | 16,700 | | | | 302,651 | |
| |
| Kaneka Corp. | | | 84,000 | | | | 455,197 | |
| |
| Kurita Water Industries Ltd. | | | 18,700 | | | | 515,676 | |
| |
| Kyocera Corp. | | | 11,800 | | | | 1,039,082 | |
| |
| Kyudenko Corp. | | | 28,000 | | | | 169,395 | |
| |
| Lintec Corp. | | | 23,200 | | | | 489,061 | |
| |
| Maeda Road Construction Co. Ltd. | | | 24,000 | | | | 237,206 | |
| |
| Marubeni Corp. | | | 136,000 | | | | 787,630 | |
| |
| Minebea Co. Ltd. | | | 100,000 | | | | 356,560 | |
| |
| Mitsubishi Chemical Holdings Corp. | | | 111,500 | | | | 677,755 | |
| |
| Mitsubishi Corp. | | | 63,800 | | | | 1,313,279 | |
| |
| Mitsubishi Estate Co. Ltd. | | | 38,000 | | | | 643,663 | |
| |
| Mitsubishi Heavy Industries Ltd. | | | 269,000 | | | | 1,099,140 | |
| |
| Mitsui Mining & Smelting Co. Ltd. | | | 204,000 | | | | 558,718 | |
| |
| Mitsumi Electric Co. Ltd. | | | 14,800 | | | | 118,232 | |
| |
| Nagase & Co. Ltd. | | | 28,000 | | | | 315,052 | |
| |
NEC Corp.(a) | | | 142,000 | | | | 317,923 | |
| |
| Nifco Inc. | | | 22,100 | | | | 578,662 | |
| |
| Nintendo Co., Ltd. | | | 4,300 | | | | 650,354 | |
| |
| Nippon Meat Packers Inc. | | | 29,000 | | | | 362,367 | |
| |
| Nippon Sheet Glass Co. Ltd. | | | 182,000 | | | | 391,851 | |
| |
| Nippon Steel Corp. | | | 75,000 | | | | 195,969 | |
| |
| Nippon Telegraph & Telephone Corp. | | | 15,600 | | | | 797,517 | |
| |
| Nissan Motor Co., Ltd. | | | 132,100 | | | | 1,217,019 | |
| |
| Nisshinbo Holdings Inc. | | | 40,000 | | | | 363,738 | |
| |
| Obayashi Corp. | | | 139,000 | | | | 632,828 | |
| |
| Ono Pharmaceutical Co. Ltd. | | | 15,000 | | | | 785,185 | |
| |
| Panasonic Corp. | | | 77,200 | | | | 786,533 | |
| |
| Ricoh Co. Ltd. | | | 57,000 | | | | 467,584 | |
| |
| Rohm Co. Ltd. | | | 9,700 | | | | 494,128 | |
| |
| Ryosan Co. Ltd. | | | 10,100 | | | | 207,948 | |
| |
| Sanki Engineering Co. Ltd. | | | 32,000 | | | | 171,881 | |
| |
| Sanwa Holdings Corp. | | | 112,000 | | | | 334,230 | |
| |
| Sekisui Chemical Co. Ltd. | | | 95,000 | | | | 744,805 | |
| |
| Sekisui House Ltd. | | | 27,000 | | | | 240,412 | |
| |
| Shin-Etsu Polymer Co. Ltd. | | | 50,000 | | | | 241,699 | |
| |
| Sony Corp. | | | 28,900 | | | | 607,698 | |
| |
| Sumitomo Metal Mining Co., Ltd. | | | 42,000 | | | | 578,687 | |
| |
| Suzuki Motor Corp. | | | 36,100 | | | | 769,769 | |
| |
| TDK Corp. | | | 14,700 | | | | 600,966 | |
| |
| Teijin Ltd. | | | 158,000 | | | | 552,920 | |
| |
| Toho Co. Ltd. | | | 11,700 | | | | 202,164 | |
| |
| Toshiba Corp. | | | 236,000 | | | | 1,039,304 | |
| |
| Toyo Ink SC Holdings Co., Ltd. | | | 83,000 | | | | 329,181 | |
| |
| Toyoda Gosei Co. Ltd. | | | 15,900 | | | | 282,618 | |
| |
| Toyota Motor Corp. | | | 33,900 | | | | 1,133,469 | |
| |
| Tsubakimoto Chain Co. | | | 85,000 | | | | 438,740 | |
| |
| Yamaha Corp. | | | 38,400 | | | | 389,697 | |
| |
| Yamaha Motor Co. Ltd. | | | 30,400 | | | | 434,021 | |
| |
| | | | | | | | 38,779,674 | |
| |
Jersey–0.29%
| | | | |
| Henderson Group PLC | | | 151,603 | | | | 292,903 | |
| |
Malaysia–0.91%
| | | | |
| Axiata Group Berhad | | | 233,900 | | | | 370,965 | |
| |
| IJM Corp Berhad | | | 299,100 | | | | 552,303 | |
| |
| | | | | | | | 923,268 | |
| |
Philippines–0.34%
| | | | |
| Energy Development Corp. | | | 1,407,300 | | | | 199,316 | |
| |
Puregold Price Club, Inc.(a) | | | 496,500 | | | | 144,095 | |
| |
| | | | | | | | 343,411 | |
| |
Singapore–4.23%
| | | | |
| Capitaland Ltd. | | | 415,000 | | | | 892,626 | |
| |
Genting Singapore PLC(a) | | | 633,000 | | | | 864,153 | |
| |
| Keppel Corp. Ltd. | | | 172,000 | | | | 1,284,970 | |
| |
| Singapore Telecommunications Ltd. | | | 331,000 | | | | 838,215 | |
| |
| Wilmar International Ltd. | | | 101,000 | | | | 433,472 | |
| |
| | | | | | | | 4,313,436 | |
| |
South Korea–7.00%
| | | | |
| CJ CheilJedang Corp. | | | 3,852 | | | | 1,059,538 | |
| |
| Hyundai Department Store Co., Ltd. | | | 6,219 | | | | 888,229 | |
| |
| Hyundai Mobis | | | 3,684 | | | | 1,061,041 | |
| |
| Hyundai Motor Co. | | | 5,850 | | | | 1,184,488 | |
| |
| LG Chem Ltd. | | | 1,835 | | | | 590,191 | |
| |
| LG Fashion Corp. | | | 6,868 | | | | 276,335 | |
| |
| Mando Corp. | | | 3,933 | | | | 673,794 | |
| |
| Samsung Electronics Co., Ltd. | | | 1,610 | | | | 1,394,045 | |
| |
| | | | | | | | 7,127,661 | |
| |
Taiwan–7.98%
| | | | |
| Cheng Shin Rubber Industry Co., Ltd. | | | 347,400 | | | | 793,490 | |
| |
| Chipbond Technology Corp. | | | 556,000 | | | | 496,326 | |
| |
| Hon Hai Precision Industry Co., Ltd. | | | 298,000 | | | | 820,174 | |
| |
| Largan Precision Co. Ltd. | | | 37,000 | | | | 821,234 | |
| |
| Mega Financial Holdings Co. Ltd. | | | 1,519,000 | | | | 1,172,995 | |
| |
| Standard Foods Corp. | | | 188,000 | | | | 610,654 | |
| |
See accompanying Notes to Financial Statements which are an integral part of the financial statements.
10 Invesco Pacific Growth Fund
| | | | | | | | | |
| | | Shares | | Value |
| |
Taiwan–(continued)
| | | | |
| | | | | | | | | |
| Taiwan Fertilizer Co., Ltd. | | | 311,000 | | | $ | 794,435 | |
| |
| Taiwan Semiconductor Manufacturing Co. Ltd. | | | 488,143 | | | | 1,190,495 | |
| |
| Teco Electric and Machinery Co. Ltd. | | | 1,286,000 | | | | 750,612 | |
| |
| Wistron Corp. | | | 584,000 | | | | 676,597 | |
| |
| | | | | | | | 8,127,012 | |
| |
Thailand–0.62%
| | | | |
| Bangchak Petroleum PCL | | | 544,400 | | | | 304,245 | |
| |
| Land and Houses PCL-NVDR | | | 1,760,200 | | | | 322,855 | |
| |
| | | | | | | | 627,100 | |
| |
| TOTAL INVESTMENTS–94.70% (Cost $102,402,026) | | | | | | | 96,459,645 | |
| |
| OTHER ASSETS LESS LIABILITIES–5.30% | | | | | | | 5,403,447 | |
| |
| NET ASSETS–100.00% | | | | | | $ | 101,863,092 | |
| |
Investment Abbreviations:
| | | |
| NVDR | | – Non-Voting Depositary Receipt |
Notes to Schedule of Investments:
| | |
| (a) | | Non-income producing security. |
| (b) | | Security purchased or received in a transaction exempt from registration under the Securities Act of 1933, as amended. The security may be resold pursuant to an exemption from registration under the 1933 Act, typically to qualified institutional buyers. The value of this security at October 31, 2011 represented less than 1% of the Fund’s Net Assets. |
See accompanying Notes to Financial Statements which are an integral part of the financial statements.
11 Invesco Pacific Growth Fund
Statement of Assets and Liabilities
October 31, 2011
| | | | | |
Assets:
|
| Investments, at value (Cost $102,402,026) | | $ | 96,459,645 | |
| |
| Foreign currencies, at value (Cost $9,119,758) | | | 8,978,331 | |
| |
| Receivable for: | | | | |
| Investments sold | | | 3,202,909 | |
| |
| Fund shares sold | | | 86,001 | |
| |
| Dividends | | | 576,942 | |
| |
| Investment for trustee deferred compensation and retirement plans | | | 12,056 | |
| |
| Other assets | | | 26,504 | |
| |
| Total assets | | | 109,342,388 | |
| |
Liabilities:
|
| Payable for: | | | | |
| Investments purchased | | | 6,826,615 | |
| |
| Fund shares reacquired | | | 143,244 | |
| |
| Amount due custodian | | | 124,021 | |
| |
| Accrued fees to affiliates | | | 191,881 | |
| |
| Accrued other operating expenses | | | 119,422 | |
| |
| Trustee deferred compensation and retirement plans | | | 74,113 | |
| |
| Total liabilities | | | 7,479,296 | |
| |
| Net assets applicable to shares outstanding | | $ | 101,863,092 | |
| |
Net assets consist of:
|
| Shares of beneficial interest | | $ | 127,986,475 | |
| |
| Undistributed net investment income | | | 1,246,031 | |
| |
| Undistributed net realized gain (loss) | | | (21,286,172 | ) |
| |
| Unrealized appreciation (depreciation) | | | (6,083,242 | ) |
| |
| | | $ | 101,863,092 | |
| |
Net Assets:
|
| Class A | | $ | 83,778,594 | |
| |
| Class B | | $ | 4,375,522 | |
| |
| Class C | | $ | 5,571,800 | |
| |
| Class R | | $ | 128,655 | |
| |
| Class Y | | $ | 7,997,864 | |
| |
| Institutional Class | | $ | 10,657 | |
| |
Shares outstanding, $0.01 par value per share, with an unlimited number of shares authorized:
|
| Class A | | | 4,179,244 | |
| |
| Class B | | | 231,347 | |
| |
| Class C | | | 294,131 | |
| |
| Class R | | | 6,447.3 | |
| |
| Class Y | | | 392,644 | |
| |
| Institutional Class | | | 522.7 | |
| |
| Class A: | | | | |
| Net asset value per share | | $ | 20.05 | |
| |
Maximum offering price per share
(Net asset value of $20.05 divided by 94.50%) | | $ | 21.22 | |
| |
| Class B: | | | | |
| Net asset value and offering price per share | | $ | 18.91 | |
| |
| Class C: | | | | |
| Net asset value and offering price per share | | $ | 18.94 | |
| |
| Class R: | | | | |
| Net asset value and offering price per share | | $ | 19.95 | |
| |
| Class Y: | | | | |
| Net asset value and offering price per share | | $ | 20.37 | |
| |
| Institutional Class: | | | | |
| Net asset value and offering price per share | | $ | 20.39 | |
| |
See accompanying Notes to Financial Statements which are an integral part of the financial statements.
12 Invesco Pacific Growth Fund
Statement of Operations
For the year ended October 31, 2011
| | | | | |
Investment income:
|
| Dividends (net of foreign withholding taxes of $228,753) | | $ | 3,350,650 | |
| |
| Dividends from affiliated money market funds (includes securities lending income of $1,024) | | | 1,663 | |
| |
| Total investment income | | | 3,352,313 | |
| |
Expenses:
|
| Advisory fees | | | 1,075,184 | |
| |
| Administrative services fees | | | 50,000 | |
| |
| Custodian fees | | | 107,258 | |
| |
| Distribution fees: | | | | |
| Class A | | | 251,179 | |
| |
| Class B | | | 71,427 | |
| |
| Class C | | | 61,485 | |
| |
| Class R | | | 393 | |
| |
| Transfer agent fees — A, B, C, R and Y | | | 260,208 | |
| |
| Transfer agent fees — Institutional | | | 12 | |
| |
| Trustees’ and officers’ fees and benefits | | | 22,283 | |
| |
| Other | | | 256,819 | |
| |
| Total expenses | | | 2,156,248 | |
| |
| Less: Fees waived and expense offset arrangement(s) | | | (1,149 | ) |
| |
| Net expenses | | | 2,155,099 | |
| |
| Net investment income | | | 1,197,214 | |
| |
Realized and unrealized gain (loss) from:
|
| Net realized gain from: | | | | |
| Investment securities (Net of foreign taxes of $83,595) | | | 8,027,423 | |
| |
| Foreign currencies | | | 283,260 | |
| |
| | | | 8,310,683 | |
| |
| Change in net unrealized appreciation (depreciation) of: | | | | |
| Investment securities (net of foreign taxes on holdings of $(30,591)) | | | (19,165,780 | ) |
| |
| Foreign currencies | | | (151,026 | ) |
| |
| | | | (19,316,806 | ) |
| |
| Net realized and unrealized gain (loss) | | | (11,006,123 | ) |
| |
| Net increase (decrease) in net assets resulting from operations | | $ | (9,808,909 | ) |
| |
See accompanying Notes to Financial Statements which are an integral part of the financial statements.
13 Invesco Pacific Growth Fund
Statement of Changes in Net Assets
For the years ended October 31, 2011 and 2010
| | | | | | | | | |
| | | 2011 | | 2010 |
| |
Operations:
|
| Net investment income | | $ | 1,197,214 | | | $ | 297,292 | |
| |
| Net realized gain | | | 8,310,683 | | | | 12,743,735 | |
| |
| Change in net unrealized appreciation (depreciation) | | | (19,316,806 | ) | | | 3,929,661 | |
| |
| Net increase (decrease) in net assets resulting from operations | | | (9,808,909 | ) | | | 16,970,688 | |
| |
Distributions to shareholders from net investment income:
|
| Class A | | | (904,495 | ) | | | (265,258 | ) |
| |
| Class B | | | (13,561 | ) | | | — | |
| |
| Class C | | | (9,939 | ) | | | — | |
| |
| Class R | | | (249 | ) | | | (43 | ) |
| |
| Class Y | | | (108,260 | ) | | | (8,390 | ) |
| |
| Total distributions from net investment income | | | (1,036,504 | ) | | | (273,691 | ) |
| |
Share transactions–net:
|
| Class A | | | (12,876,671 | ) | | | (15,783,002 | ) |
| |
| Class B | | | (3,435,021 | ) | | | (4,085,157 | ) |
| |
| Class C | | | 362,503 | | | | (409,733 | ) |
| |
| Class R | | | 108,582 | | | | (58,712 | ) |
| |
| Class Y | | | (712,783 | ) | | | 8,116,610 | |
| |
| Institutional Class | | | 13,632 | | | | — | |
| |
| Net increase (decrease) in net assets resulting from share transactions | | | (16,539,758 | ) | | | (12,219,994 | ) |
| |
| Net increase (decrease) in net assets | | | (27,385,171 | ) | | | 4,477,003 | |
| |
Net assets:
|
| Beginning of year | | | 129,248,263 | | | | 124,771,260 | |
| |
| End of year (includes undistributed net investment income of $1,246,031 and $534,007, respectively) | | $ | 101,863,092 | | | $ | 129,248,263 | |
| |
Notes to Financial Statements
October 31, 2011
NOTE 1—Significant Accounting Policies
Invesco Pacific Growth Fund (the “Fund”) is a series portfolio of AIM Investment Funds (Invesco Investment Funds) (the “Trust”). The Trust is organized as a Delaware statutory trust and is registered under the Investment Company Act of 1940, as amended (the “1940 Act”), as an open-end series management investment company consisting of thirteen separate series portfolios, each authorized to issue an unlimited number of shares of beneficial interest. The assets, liabilities and operations of each portfolio are accounted for separately. Information presented in these financial statements pertains only to the Fund. Matters affecting each portfolio or class will be voted on exclusively by the shareholders of such portfolio or class.
The Fund’s investment objective is to maximize the capital appreciation of its investments.
The Fund currently consists of six different classes of shares: Class A, Class B, Class C, Class R, Class Y and Institutional Class. Class A shares are sold with a front-end sales charge unless certain waiver criteria are met and under certain circumstances load waived shares may be subject to contingent deferred sales charges (“CDSC”). Class C shares are sold with a CDSC. Class R, Class Y and Institutional Class shares are sold at net asset value. Effective November 30, 2010, new or additional investments in Class B shares are no longer permitted. Existing shareholders of Class B shares may continue to reinvest dividends and capital gains distributions in Class B shares until they convert. Also, shareholders in Class B shares will be able to exchange those shares for Class B shares of other Invesco Funds offering such shares until they convert. Generally, Class B shares will automatically convert to Class A shares on or about the month-end which is at least eight years after the date of purchase. Redemption of Class B shares prior to conversion date will be subject to a CDSC.
The following is a summary of the significant accounting policies followed by the Fund in the preparation of its financial statements.
| | |
| A. | | Security Valuations — Securities, including restricted securities, are valued according to the following policy. |
| | A security listed or traded on an exchange (except convertible bonds) is valued at its last sales price or official closing price as of the close of the customary trading session on the exchange where the security is principally traded, or lacking any sales or official closing price on a particular day, the |
14 Invesco Pacific Growth Fund
| | |
| | security may be valued at the closing bid price on that day. Securities traded in the over-the-counter market are valued based on prices furnished by independent pricing services or market makers. When such securities are valued by an independent pricing service they may be considered fair valued. Futures contracts are valued at the final settlement price set by an exchange on which they are principally traded. Listed options are valued at the mean between the last bid and ask prices from the exchange on which they are principally traded. Options not listed on an exchange are valued by an independent source at the mean between the last bid and ask prices. For purposes of determining net asset value per share, futures and option contracts generally are valued 15 minutes after the close of the customary trading session of the New York Stock Exchange (“NYSE”). |
| | Investments in open-end and closed-end registered investment companies that do not trade on an exchange are valued at the end of day net asset value per share. Investments in open-end and closed-end registered investment companies that trade on an exchange are valued at the last sales price or official closing price as of the close of the customary trading session on the exchange where the security is principally traded. |
| | Debt obligations (including convertible bonds) and unlisted equities are fair valued using an evaluated quote provided by an independent pricing service. Evaluated quotes provided by the pricing service may be determined without exclusive reliance on quoted prices, and may reflect appropriate factors such as institution-size trading in similar groups of securities, developments related to specific securities, dividend rate, yield, quality, type of issue, coupon rate, maturity, individual trading characteristics and other market data. Debt securities are subject to interest rate and credit risks. In addition, all debt securities involve some risk of default with respect to interest and/or principal payments. |
| | Foreign securities (including foreign exchange contracts) are converted into U.S. dollar amounts using the applicable exchange rates as of the close of the NYSE. If market quotations are available and reliable for foreign exchange traded equity securities, the securities will be valued at the market quotations. Because trading hours for certain foreign securities end before the close of the NYSE, closing market quotations may become unreliable. If between the time trading ends on a particular security and the close of the customary trading session on the NYSE, events occur that are significant and make the closing price unreliable, the Fund may fair value the security. If the event is likely to have affected the closing price of the security, the security will be valued at fair value in good faith using procedures approved by the Board of Trustees. Adjustments to closing prices to reflect fair value may also be based on a screening process of an independent pricing service to indicate the degree of certainty, based on historical data, that the closing price in the principal market where a foreign security trade is not the current value as of the close of the NYSE. Foreign securities meeting the approved degree of certainty that the price is not reflective of current value will be priced at the indication of fair value from the independent pricing service. Multiple factors may be considered by the independent pricing service in determining adjustments to reflect fair value and may include information relating to sector indices, American Depositary Receipts and domestic and foreign index futures. Foreign securities may have additional risks including exchange rate changes, potential for sharply devalued currencies and high inflation, political and economic upheaval, the relative lack of issuer information, relatively low market liquidity and the potential lack of strict financial and accounting controls and standards. |
| | Securities for which market prices are not provided by any of the above methods may be valued based upon quotes furnished by independent sources. The last bid price may be used to value equity securities. The mean between the last bid and asked prices is used to value debt obligations, including Corporate Loans. |
| | Securities for which market quotations are not readily available or are unreliable are valued at fair value as determined in good faith by or under the supervision of the Trust’s officers following procedures approved by the Board of Trustees. Issuer specific events, market trends, bid/ask quotes of brokers and information providers and other market data may be reviewed in the course of making a good faith determination of a security’s fair value. |
| | Valuations change in response to many factors including the historical and prospective earnings of the issuer, the value of the issuer’s assets, general economic conditions, interest rates, investor perceptions and market liquidity. Because of the inherent uncertainties of valuation, the values reflected in the financial statements may materially differ from the value received upon actual sale of those investments. |
| B. | | Securities Transactions and Investment Income — Securities transactions are accounted for on a trade date basis. Realized gains or losses on sales are computed on the basis of specific identification of the securities sold. Interest income is recorded on the accrual basis from settlement date. Dividend income (net of withholding tax, if any) is recorded on the ex-dividend date. |
| | The Fund may periodically participate in litigation related to Fund investments. As such, the Fund may receive proceeds from litigation settlements. Any proceeds received are included in the Statement of Operations as realized gain (loss) for investments no longer held and as unrealized gain (loss) for investments still held. |
| | Brokerage commissions and mark ups are considered transaction costs and are recorded as an increase to the cost basis of securities purchased and/or a reduction of proceeds on a sale of securities. Such transaction costs are included in the determination of net realized and unrealized gain (loss) from investment securities reported in the Statement of Operations and the Statement of Changes in Net Assets and the net realized and unrealized gains (losses) on securities per share in the Financial Highlights. Transaction costs are included in the calculation of the Fund’s net asset value and, accordingly, they reduce the Fund’s total returns. These transaction costs are not considered operating expenses and are not reflected in net investment income reported in the Statement of Operations and Statement of Changes in Net Assets, or the net investment income per share and ratios of expenses and net investment income reported in the Financial Highlights, nor are they limited by any expense limitation arrangements between the Fund and the investment adviser. |
| | The Fund allocates income and realized and unrealized capital gains and losses to a class based on the relative net assets of each class. |
| C. | | Country Determination — For the purposes of making investment selection decisions and presentation in the Schedule of Investments, the investment adviser may determine the country in which an issuer is located and/or credit risk exposure based on various factors. These factors include the laws of the country under which the issuer is organized, where the issuer maintains a principal office, the country in which the issuer derives 50% or more of its total revenues and the country that has the primary market for the issuer’s securities, as well as other criteria. Among the other criteria that may be evaluated for making this determination are the country in which the issuer maintains 50% or more of its assets, the type of security, financial guarantees and enhancements, the nature of the collateral and the sponsor organization. Country of issuer and/or credit risk exposure has been determined to be the United States of America, unless otherwise noted. |
| D. | | Distributions — Distributions from income and net realized capital gain, if any, are generally paid annually and recorded on ex-dividend date. The Fund may elect to treat a portion of the proceeds from redemptions as distributions for federal income tax purposes. |
15 Invesco Pacific Growth Fund
| | |
| E. | | Federal Income Taxes — The Fund intends to comply with the requirements of Subchapter M of the Internal Revenue Code necessary to qualify as a regulated investment company and to distribute substantially all of the Fund’s taxable earnings to shareholders. As such, the Fund will not be subject to federal income taxes on otherwise taxable income (including net realized capital gain) that is distributed to shareholders. Therefore, no provision for federal income taxes is recorded in the financial statements. |
| | The Fund files tax returns in the U.S. Federal jurisdiction and certain other jurisdictions. Generally, the Fund is subject to examinations by such taxing authorities for up to three years after the filing of the return for the tax period. |
| F. | | Expenses — Fees provided for under the Rule 12b-1 plan of a particular class of the Fund and which are directly attributable to that class are charged to the operations of such class. All other expenses are allocated among the classes based on relative net assets. |
| G. | | Accounting Estimates — The preparation of financial statements in conformity with accounting principles generally accepted in the United States of America (“GAAP”) requires management to make estimates and assumptions that affect the reported amounts of assets and liabilities at the date of the financial statements and the reported amounts of revenues and expenses during the reporting period including estimates and assumptions related to taxation. Actual results could differ from those estimates by a significant amount. In addition, the Fund monitors for material events or transactions that may occur or become known after the period-end date and before the date the financial statements are released to print. |
| H. | | Indemnifications — Under the Trust’s organizational documents, each Trustee, officer, employee or other agent of the Trust is indemnified against certain liabilities that may arise out of performance of their duties to the Fund. Additionally, in the normal course of business, the Fund enters into contracts, including the Fund’s servicing agreements that contain a variety of indemnification clauses. The Fund’s maximum exposure under these arrangements is unknown as this would involve future claims that may be made against the Fund that have not yet occurred. The risk of material loss as a result of such indemnification claims is considered remote. |
| I. | | Redemption Fees — The Fund has a 2% redemption fee that is to be retained by the Fund to offset transaction costs and other expenses associated with short-term redemptions and exchanges. The fee, subject to certain exceptions, is imposed on certain redemptions or exchanges of shares within 31 days of purchase. The redemption fee is recorded as an increase in shareholder capital and is allocated among the share classes based on the relative net assets of each class. Effective January 1, 2012, the Fund will eliminate the 2% redemption fee, if applicable, assessed on shares of the Fund redeemed or exchanged within 31 days of purchase. |
| J. | | Securities Lending — The Fund may lend portfolio securities having a market value up to one-third of the Fund’s total assets. Such loans are secured by collateral equal to no less than the market value of the loaned securities determined daily by the securities lending provider. Such collateral will be cash or debt securities issued or guaranteed by the U.S. Government or any of its sponsored agencies. Cash collateral received in connection with these loans is invested in short-term money market instruments or affiliated money market funds and is shown as such on the Schedule of Investments. It is the Fund’s policy to obtain additional collateral from or return excess collateral to the borrower by the end of the next business day, following the valuation date of the securities loaned. Therefore, the value of the collateral held may be temporarily less than the value of the securities on loan. Lending securities entails a risk of loss to the Fund if and to the extent that the market value of the securities loaned were to increase and the borrower did not increase the collateral accordingly, and the borrower fails to return the securities. Upon the failure of the borrower to return the securities, collateral may be liquidated and the securities may be purchased on the open market to replace the loaned securities. The Fund could experience delays and costs in gaining access to the collateral. The Fund bears the risk of any deficiency in the amount of the collateral available for return to the borrower due to any loss on the collateral invested. Dividends received on cash collateral investments for securities lending transactions, which are net of compensation to counterparties, is included in Dividends from affiliates on the Statement of Operations. The aggregate value of securities out on loan is shown as a footnote on the Statement of Assets and Liabilities, if any. |
| K. | | Foreign Currency Translations — Foreign currency is valued at the close of the NYSE based on quotations posted by banks and major currency dealers. Portfolio securities and other assets and liabilities denominated in foreign currencies are translated into U.S. dollar amounts at date of valuation. Purchases and sales of portfolio securities (net of foreign taxes withheld on disposition) and income items denominated in foreign currencies are translated into U.S. dollar amounts on the respective dates of such transactions. The Fund does not separately account for the portion of the results of operations resulting from changes in foreign exchange rates on investments and the fluctuations arising from changes in market prices of securities held. The combined results of changes in foreign exchange rates and the fluctuation of market prices on investments (net of estimated foreign tax withholding) are included with the net realized and unrealized gain or loss from investments in the Statement of Operations. Reported net realized foreign currency gains or losses arise from (1) sales of foreign currencies, (2) currency gains or losses realized between the trade and settlement dates on securities transactions, and (3) the difference between the amounts of dividends, interest, and foreign withholding taxes recorded on the Fund’s books and the U.S. dollar equivalent of the amounts actually received or paid. Net unrealized foreign currency gains and losses arise from changes in the fair values of assets and liabilities, other than investments in securities at fiscal period end, resulting from changes in exchange rates. |
| | The Fund may invest in foreign securities which may be subject to foreign taxes on income, gains on investments or currency repatriation, a portion of which may be recoverable. |
| L. | | Foreign Currency Contracts — The Fund may enter into foreign currency contracts to manage or minimize currency or exchange rate risk. The Fund may also enter into foreign currency contracts for the purchase or sale of a security denominated in a foreign currency in order to “lock in” the U.S. dollar price of that security. A foreign currency contract is an obligation to purchase or sell a specific currency for an agreed-upon price at a future date. The use of foreign currency contracts does not eliminate fluctuations in the price of the underlying securities the Fund owns or intends to acquire but establishes a rate of exchange in advance. Fluctuations in the value of these contracts are measured by the difference in the contract date and reporting date exchange rates and are recorded as unrealized appreciation (depreciation) until the contracts are closed. When the contracts are closed, realized gains (losses) are recorded. Realized and unrealized gains (losses) on the contracts are included in the Statement of Operations. The primary risks associated with foreign currency contracts include failure of the counterparty to meet the terms of the contract and the value of the foreign currency changing unfavorably. These risks may be in excess of the amounts reflected in the Statement of Assets and Liabilities. |
16 Invesco Pacific Growth Fund
NOTE 2—Advisory Fees and Other Fees Paid to Affiliates
The Trust has entered into a master investment advisory agreement with Invesco Advisers, Inc. (the “Adviser” or “Invesco”). Under the terms of the investment advisory agreement, the Fund pays an advisory fee to the Adviser based on the annual rate of the Fund’s average daily net assets as follows:
| | | | | |
| Average Net Assets | | Rate |
| |
| First $1 billion | | | 0 | .87% |
| |
| Next $1 billion | | | 0 | .82% |
| |
| Over $2 billion | | | 0 | .77% |
| |
Under the terms of a master sub-advisory agreement between the Adviser and each of Invesco Asset Management Deutschland GmbH, Invesco Asset Management Limited, Invesco Asset Management (Japan) Limited, Invesco Australia Limited, Invesco Hong Kong Limited, Invesco Senior Secured Management, Inc. and Invesco Canada Ltd. (collectively, the “Affiliated Sub-Advisers”) the Adviser, not the Fund, may pay 40% of the fees paid to the Adviser to any such Affiliated Sub-Adviser(s) that provide discretionary investment management services to the Fund based on the percentage of assets allocated to such Sub-Adviser(s).
The Adviser has contractually agreed, through at least June 30, 2012, to waive advisory fees and/or reimburse expenses of all shares to the extent necessary to limit total annual fund operating expenses after fee waiver and/or expense reimbursement (excluding certain items discussed below) of Class A, Class B, Class C, Class R, Class Y and Institutional Class shares to 1.88%, 2.63%, 2.63%, 2.13%, 1.63% and 1.63%, respectively, of average daily net assets. In determining the Adviser’s obligation to waive advisory fees and/or reimburse expenses, the following expenses are not taken into account, and could cause the total annual fund operating expenses after fee waiver and/or expense reimbursement to exceed the numbers reflected above: (1) interest, facilities and maintenance fees; (2) taxes; (3) dividend expense on short sales; (4) extraordinary or non-routine items; and (5) expenses that the Fund has incurred but did not actually pay because of an expense offset arrangement. Unless the Board of the Trustees and Invesco mutually agree to amend or continue the fee waiver agreement, it will terminate on June 30, 2012. The Advisor did not waive fees and/or reimburse expenses during the period under this expense limitation.
Further, the Adviser has contractually agreed, through at least June 30, 2012, to waive the advisory fee payable by the Fund in an amount equal to 100% of the net advisory fees the Adviser receives from the affiliated money market funds on investments by the Fund of uninvested cash in such affiliated money market funds.
For the year ended October 31, 2011, the Adviser waived advisory fees of $963.
The Trust has entered into a master administrative services agreement with Invesco pursuant to which the Fund has agreed to pay Invesco for certain administrative costs incurred in providing accounting services to the Fund. For the year ended October 31, 2011, expenses incurred under the agreement are shown in the Statement of Operations as administrative services fees.
The Trust has entered into a transfer agency and service agreement with Invesco Investment Services, Inc. (“IIS”) pursuant to which the Fund has agreed to pay IIS a fee for providing transfer agency and shareholder services to the Fund and reimburse IIS for certain expenses incurred by IIS in the course of providing such services. IIS may make payments to intermediaries that provide omnibus account services, sub-accounting services and/or networking services. All fees payable by IIS to intermediaries that provide omnibus account services or sub-accounting are charged back to the Fund, subject to certain limitations approved by the Trust’s Board of Trustees. For the year ended October 31, 2011, expenses incurred under the agreement are shown in the Statement of Operations as transfer agent fees.
Shares of the Fund are distributed by Invesco Distributors, Inc. (“IDI”), an affiliate of the Adviser. The Fund has adopted a Plan of Distribution (the “Plan”) pursuant to Rule 12b-1 under the 1940 Act. The Plan provides that the Fund will reimburse IDI for distribution related expenses that IDI incurs up to a maximum of the following annual rates: (1) Class A — up to 0.25% of the average daily net assets of Class A shares; (2) Class B — up to 1.00% of the average daily net assets of Class B shares; (3) Class C — up to 1.00% of the average daily net assets of Class C shares; and (4) Class R — up to 0.50% of the average daily net assets of Class R shares.
In the case of Class B and Class C shares, provided that the Plan continues in effect, any cumulative expenses incurred by IDI, but not yet reimbursed to IDI, may be recovered through the payment of future distribution fees from the Fund pursuant to the Plan and contingent deferred sales charges paid by investors upon redemption of Class B and Class C shares.
For the year ended October 31, 2011, expenses incurred under these agreements are shown in the Statement of Operations as distribution fees.
Front-end sales commissions and CDSC (collectively, the “sales charges”) are not recorded as expenses of the Fund. Front-end sales commissions are deducted from proceeds from the sales of Fund shares prior to investment in Class A shares of the Fund. CDSC are deducted from redemption proceeds prior to remittance to the shareholder. During the year ended October 31, 2011, IDI advised the Fund that IDI retained $4,284 in front-end sales commissions from the sale of Class A shares and $0, $1,723 and $860 from Class A, Class B and Class C shares, respectively, for CDSC imposed on redemptions by shareholders.
Certain officers and trustees of the Trust are officers and directors of the Adviser, Invesco Ltd., IIS and/or IDI.
NOTE 3—Additional Valuation Information
GAAP defines fair value as the price that would be received to sell an asset or paid to transfer a liability in an orderly transaction between market participants at the measurement date, under current market conditions. GAAP establishes a hierarchy that prioritizes the inputs to valuation methods giving the highest priority to readily available unadjusted quoted prices in an active market for identical assets (Level 1) and the lowest priority to significant unobservable inputs (Level 3) generally when market prices are not readily available or are unreliable. Based on the valuation inputs, the securities or other investments are tiered into one of three levels. Changes in valuation methods may result in transfers in or out of an investment’s assigned level:
| | |
| | Level 1 — | Prices are determined using quoted prices in an active market for identical assets. |
17 Invesco Pacific Growth Fund
| | |
| | Level 2 — | Prices are determined using other significant observable inputs. Observable inputs are inputs that other market participants may use in pricing a security. These may include quoted prices for similar securities, interest rates, prepayment speeds, credit risk, yield curves, loss severities, default rates, discount rates, volatilities and others. |
| | Level 3 — | Prices are determined using significant unobservable inputs. In situations where quoted prices or observable inputs are unavailable (for example, when there is little or no market activity for an investment at the end of the period), unobservable inputs may be used. Unobservable inputs reflect the Fund’s own assumptions about the factors market participants would use in determining fair value of the securities or instruments and would be based on the best available information. |
The following is a summary of the tiered valuation input levels, as of October 31, 2011. The level assigned to the securities valuations may not be an indication of the risk or liquidity associated with investing in those securities. Because of the inherent uncertainties of valuation, the values reflected in the financial statements may materially differ from the value received upon actual sale of those investments.
| | | | | | | | | | | | | | | | | |
| | | Level 1* | | Level 2* | | Level 3 | | Total |
| |
| Australia | | $ | — | | | $ | 13,550,495 | | | $ | — | | | $ | 13,550,495 | |
| |
| China | | | — | | | | 10,296,741 | | | | 0 | | | | 10,296,741 | |
| |
| Hong Kong | | | — | | | | 5,411,014 | | | | — | | | | 5,411,014 | |
| |
| India | | | — | | | | 3,946,199 | | | | — | | | | 3,946,199 | |
| |
| Indonesia | | | — | | | | 2,720,731 | | | | — | | | | 2,720,731 | |
| |
| Japan | | | — | | | | 38,779,674 | | | | — | | | | 38,779,674 | |
| |
| Jersey | | | — | | | | 292,903 | | | | — | | | | 292,903 | |
| |
| Malaysia | | | — | | | | 923,268 | | | | — | | | | 923,268 | |
| |
| Philippines | | | 144,095 | | | | 199,316 | | | | — | | | | 343,411 | |
| |
| Singapore | | | — | | | | 4,313,436 | | | | — | | | | 4,313,436 | |
| |
| South Korea | | | — | | | | 7,127,661 | | | | — | | | | 7,127,661 | |
| |
| Taiwan | | | — | | | | 8,127,012 | | | | — | | | | 8,127,012 | |
| |
| Thailand | | | — | | | | 627,100 | | | | — | | | | 627,100 | |
| |
| | | $ | 144,095 | | | $ | 96,315,550 | | | $ | 0 | | | $ | 96,459,645 | |
| |
| |
| * | Transfers occurred between Level 1 and Level 2 due to foreign fair value adjustments. |
NOTE 4—Expense Offset Arrangement(s)
The expense offset arrangement is comprised of transfer agency credits which result from balances in Demand Deposit Accounts (DDA) used by the transfer agent for clearing shareholder transactions. For the year ended October 31, 2011, the Fund received credits from this arrangement, which resulted in the reduction of the Fund’s total expenses of $186.
NOTE 5—Trustees’ and Officers’ Fees and Benefits
“Trustees’ and Officers’ Fees and Benefits” include amounts accrued by the Fund to pay remuneration to certain Trustees and Officers of the Fund. Trustees have the option to defer compensation payable by the Fund, and “Trustees’ and Officers’ Fees and Benefits” also include amounts accrued by the Fund to fund such deferred compensation amounts. Those Trustees who defer compensation have the option to select various Invesco Funds in which their deferral accounts shall be deemed to be invested. Finally, certain current Trustees are eligible to participate in a retirement plan that provides for benefits to be paid upon retirement to Trustees over a period of time based on the number of years of service. The Fund may have certain former Trustees who also participate in a retirement plan and receive benefits under such plan. “Trustees’ and Officers’ Fees and Benefits” include amounts accrued by the Fund to fund such retirement benefits. Obligations under the deferred compensation and retirement plans represent unsecured claims against the general assets of the Fund.
During the year ended October 31, 2011, the Fund paid legal fees of $1,678 for services rendered by Kramer, Levin, Naftalis & Frankel LLP as counsel to the Independent Trustees. A partner of that firm is a Trustee of the Trust.
NOTE 6—Cash Balances
The Fund is permitted to temporarily carry a negative or overdrawn balance in its account with State Street Bank and Trust Company, the custodian bank. To compensate the custodian bank for such overdrafts, the overdrawn Fund may either (1) leave funds as a compensating balance in the account so the custodian bank can be compensated by earning the additional interest; or (2) compensate by paying the custodian bank at a rate agreed upon by the custodian bank and Invesco, not to exceed the contractually agreed upon rate.
18 Invesco Pacific Growth Fund
NOTE 7—Distributions to Shareholders and Tax Components of Net Assets
Tax Character of Distributions to Shareholders Paid During the Years Ended October 31, 2011 and 2010:
| | | | | | | | | |
| | | 2011 | | 2010 |
| |
| Ordinary income | | $ | 1,036,504 | | | $ | 273,691 | |
| |
Tax Components of Net Assets at Period-End:
| | | | | |
| | | 2011 |
| |
| Undistributed ordinary income | | $ | 1,579,140 | |
| |
| Net unrealized appreciation (depreciation) — investments | | | (9,914,143 | ) |
| |
| Net unrealized appreciation (depreciation) — other investments | | | (140,861 | ) |
| |
| Temporary book/tax differences | | | (72,586 | ) |
| |
| Capital loss carryforward | | | (17,574,933 | ) |
| |
| Shares of beneficial interest | | | 127,986,475 | |
| |
| Total net assets | | $ | 101,863,092 | |
| |
The difference between book-basis and tax-basis unrealized appreciation (depreciation) is due to differences in the timing of recognition of gains and losses on investments for tax and book purposes. The Fund’s net unrealized appreciation (depreciation) difference is attributable primarily to wash sales and the recognition for tax purposes of unrealized gains on passive foreign investment companies.
The temporary book/tax differences are a result of timing differences between book and tax recognition of income and/or expenses. The Fund’s temporary book/tax differences are the result of the trustee deferral of compensation and retirement plan benefits.
Capital loss carryforward is calculated and reported as of a specific date. Results of transactions and other activity after that date may affect the amount of capital loss carryforward actually available for the Fund to utilize. The ability to utilize capital loss carryforward in the future may be limited under the Internal Revenue Code and related regulations based on the results of future transactions. Under these limitation rules, the Fund is limited to utilizing $16,221,024 of capital loss carryforward in the fiscal year ending October 31, 2012.
The Fund utilized $8,042,159 of capital loss carryforward in the current period to offset net realized capital gain for federal income tax purposes. The Fund has a capital loss carryforward as of October 31, 2011, which expires as follows:
| | | | | |
| | | Capital Loss
|
| Expiration | | Carryforward* |
| |
| October 31, 2015 | | $ | 362,147 | |
| |
| October 31, 2016 | | | 1,247,693 | |
| |
| October 31, 2017 | | | 15,965,093 | |
| |
| Total capital loss carryforward | | $ | 17,574,933 | |
| |
| |
| * | Capital loss carryforward as of the date listed above is reduced for limitations, if any, to the extent required by the Internal Revenue Code. To the extent that unrealized gains as of May 23, 2011, the date of reorganization of Invesco Japan Fund into the Fund and realized on securities held in each fund at such date of reorganization, the capital loss carryforward may be further limited for up to five years from the date of the reorganization. |
NOTE 8—Investment Securities
The aggregate amount of investment securities (other than short-term securities, U.S. Treasury obligations and money market funds, if any) purchased and sold by the Fund during the year ended October 31, 2011 was $132,174,063 and $154,658,584, respectively. Cost of investments on a tax basis includes the adjustments for financial reporting purposes as of the most recently completed Federal income tax reporting period-end.
| | | | | |
| Unrealized Appreciation (Depreciation) of Investment Securities on a Tax Basis |
| |
| Aggregate unrealized appreciation of investment securities | | $ | 6,529,921 | |
| |
| Aggregate unrealized (depreciation) of investment securities | | | (16,444,064 | ) |
| |
| Net unrealized appreciation (depreciation) of investment securities | | $ | (9,914,143 | ) |
| |
| Cost of investments for tax purposes is $106,373,788. |
19 Invesco Pacific Growth Fund
NOTE 9—Reclassification of Permanent Differences
Primarily as a result of differing book/tax treatment of foreign currency transactions, capital loss carryforward and passive foreign investment companies, on October 31, 2011, undistributed net investment income was increased by $584,876, undistributed net realized gain (loss) was increased by $5,425,474 and shares of beneficial interest decreased by $6,010,350.
Further, as a result of tax deferrals and capital loss carryford acquired in the reorganization of Invesco Japan Fund into the Fund, on May 23, 2011, undistributed net investment income was decreased by $33,562, undistributed net realized gain (loss) was decreased by $4,617,700 and shares of beneficial interest increased by $4,651,262. This reclassification had no effect on the net assets of the Fund.
NOTE 10—Share Information
| | | | | | | | | | | | | | | | | |
| | | Summary of Share Activity |
| |
| | | Year ended October 31, |
| | | 2011(a) | | 2010 |
| | | Shares | | Amount | | Shares | | Amount |
| |
| Sold: | | | | | | | | | | | | | | | | |
| Class A | | | 158,488 | | | $ | 3,590,708 | | | | 354,460 | | | $ | 7,252,727 | |
| |
| Class B | | | 6,451 | | | | 136,705 | | | | 36,404 | | | | 719,378 | |
| |
| Class C | | | 31,052 | | | | 671,489 | | | | 34,476 | | | | 668,145 | |
| |
| Class R | | | 5,192 | | | | 116,975 | | | | 938 | | | | 19,054 | |
| |
| Class Y | | | 66,411 | | | | 1,533,907 | | | | 421,980 | | | | 8,726,968 | |
| |
| Issued as reinvestment of dividends: | | | | | | | | | | | | | | | | |
| Class A | | | 38,181 | | | | 871,290 | | | | 12,782 | | | | 258,580 | |
| |
| Class B | | | 602 | | | | 13,057 | | | | — | | | | — | |
| |
| Class C | | | 449 | | | | 9,753 | | | | — | | | | — | |
| |
| Class R | | | 6 | | | | 145 | | | | — | | | | — | |
| |
| Class Y | | | 4,636 | | | | 107,272 | | | | 393 | | | | 8,050 | |
| |
Issued in connection with acquisitions:(b) | | | | | | | | | | | | | | | | |
| Class A | | | 128,344 | | | | 2,971,581 | | | | — | | | | — | |
| |
| Class B | | | 24,269 | | | | 532,863 | | | | — | | | | — | |
| |
| Class C | | | 78,631 | | | | 1,727,654 | | | | — | | | | — | |
| |
| Class Y | | | 37,302 | | | | 876,903 | | | | — | | | | — | |
| |
Institutional Class(c) | | | 16,741 | | | | 393,565 | | | | — | | | | — | |
| |
| Automatic conversion of Class B shares to Class A shares: | | | | | | | | | | | | | | | | |
| Class A | | | 112,336 | | | | 2,498,935 | | | | 36,335 | | | | 742,949 | |
| |
| Class B | | | (118,750 | ) | | | (2,498,935 | ) | | | (38,391 | ) | | | (742,949 | ) |
| |
Reacquired:(d) | | | | | | | | | | | | | | | | |
| Class A | | | (1,004,442 | ) | | | (22,809,185 | ) | | | (1,159,369 | ) | | | (24,037,258 | ) |
| |
| Class B | | | (76,024 | ) | | | (1,618,711 | ) | | | (210,160 | ) | | | (4,061,586 | ) |
| |
| Class C | | | (99,536 | ) | | | (2,046,393 | ) | | | (56,191 | ) | | | (1,077,878 | ) |
| |
| Class R | | | (423 | ) | | | (8,538 | ) | | | (3,597 | ) | | | (77,766 | ) |
| |
| Class Y | | | (139,055 | ) | | | (3,230,865 | ) | | | (30,210 | ) | | | (618,408 | ) |
| |
Institutional Class(c) | | | (16,218 | ) | | | (379,933 | ) | | | — | | | | — | |
| |
| Net increase (decrease) in share activity | | | (745,357 | ) | | $ | (16,539,758 | ) | | | (600,150 | ) | | $ | (12,219,994 | ) |
| |
| | |
| (a) | | There are entities that are record owners of more than 5% of the outstanding shares of the Fund and in the aggregate own 72% of the outstanding shares of the Fund. IDI has an agreement with these entities to sell Fund shares. The Fund, Invesco and/or Invesco affiliates may make payments to these entities, which are considered to be related to the Fund, for providing services to the Fund, Invesco and/or Invesco affiliates including but not limited to services such as securities brokerage, distribution, third party record keeping and account servicing. The Fund has no knowledge as to whether all or any portion of the shares owned of record by these entities are also owned beneficially. |
| (b) | | As of the open of business on May 23, 2011, the Fund acquired all the net assets of Invesco Japan Fund pursuant to a plan of reorganization approved by the Trustees of the Fund on November 10, 2010 and by the shareholders of Invesco Japan Fund on April 14, 2011. The acquisition was accomplished by a tax free exchange of 285,287 shares of the Fund for 1,270,808 shares outstanding of Invesco Japan Fund as of the close of business on May 20, 2011. Each class of Invesco Japan Fund was exchanged for the like class of shares of the Fund based on the relative net asset value of Invesco Japan Fund to the net asset value of the Fund on the close of business, May 20, 2011. Invesco Japan Fund net assets at that date of $6,502,566 including $361,589 of unrealized appreciation, was combined with those of the Fund. The net assets of the Fund immediately before the acquisition were $124,500,950. The net assets of the Fund immediately following the acquisition were $131,003,517. |
| (c) | | Commencement date of May 23, 2011. |
| (d) | | Net of redemption fees of $1,167 allocated among the classes based on relative net assets of each class for the year ended October 31, 2011. |
20 Invesco Pacific Growth Fund
NOTE 11—Financial Highlights
The following schedule presents financial highlights for a share of the Fund outstanding throughout the periods indicated.
| | | | | | | | | | | | | | | | | | | | | | | | | | | | | | | | | | | | | | | | | | | | | | | | | | | | | |
| | | | | | | | | | | | | | | | | | | Ratio of
| | Ratio of
| | | | | | |
| | | | | | | Net gains
| | | | | | | | | | | | expenses
| | expenses
| | | | | | |
| | | | | | | (losses) on
| | | | | | | | | | | | to average
| | to average net
| | Ratio of net
| | | | |
| | | Net asset
| | | | securities
| | | | Dividends
| | | | | | | | net assets
| | assets without
| | investment
| | | | |
| | | value,
| | Net
| | (both
| | Total from
| | from net
| | Net asset
| | | | Net assets,
| | with fee waivers
| | fee waivers
| | income (loss)
| | Rebate from
| | |
| | | beginning
| | investment
| | realized and
| | investment
| | investment
| | value, end
| | Total
| | end of period
| | and/or expenses
| | and/or expenses
| | to average
| | Morgan Stanley
| | Portfolio
|
| | | of period | | income(a) | | unrealized) | | operations | | income | | of period | | Return(b) | | (000s omitted) | | absorbed | | absorbed | | net assets | | Affiliate | | turnover(c) |
| |
| Class A | | | | | | | | | | | | | | | | | | | | | | | | | | | | | | | | | | | | | | | | | | | | | | | | | | | | |
| Year ended 10/31/11 | | $ | 22.21 | | | $ | 0.23 | | | $ | (2.20 | ) | | $ | (1.97 | ) | | $ | (0.19 | ) | | $ | 20.05 | (d) | | | (8.95 | )% | | $ | 83,779 | | | | 1.68 | %(e) | | | 1.68 | %(e) | | | 1.03 | %(e) | | | N/A | | | | 109 | % |
| Year ended 10/31/10 | | | 19.48 | | | | 0.06 | | | | 2.72 | | | | 2.78 | | | | (0.05 | ) | | | 22.21 | | | | 14.29 | | | | 105,428 | | | | 1.78 | (f) | | | 1.78 | (f) | | | 0.31 | (f) | | | 0.00 | %(g) | | | 76 | |
| Year ended 10/31/09 | | | 14.61 | | | | 0.06 | | | | 4.94 | | | | 5.00 | | | | (0.13 | ) | | | 19.48 | | | | 34.66 | | | | 107,103 | | | | 1.88 | (f) | | | 1.88 | (f) | | | 0.37 | (f) | | | 0.00 | (g) | | | 33 | |
| Year ended 10/31/08 | | | 29.20 | | | | 0.16 | | | | (14.66 | ) | | | (14.50 | ) | | | (0.09 | ) | | | 14.61 | | | | (49.79 | ) | | | 89,605 | | | | 1.72 | (f) | | | 1.72 | (f) | | | 0.67 | (f) | | | 0.00 | (g) | | | 42 | |
| Year ended 10/31/07 | | | 19.55 | | | | 0.02 | | | | 9.66 | | | | 9.68 | | | | (0.03 | ) | | | 29.20 | | | | 49.59 | | | | 193,477 | | | | 1.67 | (f) | | | 1.67 | (f) | | | 0.10 | (f) | | | 0.00 | (g) | | | 50 | |
| |
| Class B |
| Year ended 10/31/11 | | | 20.97 | | | | 0.06 | | | | (2.08 | ) | | | (2.02 | ) | | | (0.04 | ) | | | 18.91 | (d) | | | (9.68 | ) | | | 4,376 | | | | 2.43 | (e) | | | 2.43 | (e) | | | 0.28 | (e) | | | N/A | | | | 109 | |
| Year ended 10/31/10 | | | 18.49 | | | | (0.09 | ) | | | 2.57 | | | | 2.48 | | | | — | | | | 20.97 | | | | 13.41 | | | | 8,279 | | | | 2.53 | (f) | | | 2.53 | (f) | | | (0.44 | )(f) | | | 0.00 | (g) | | | 76 | |
| Year ended 10/31/09 | | | 13.83 | | | | (0.06 | ) | | | 4.72 | | | | 4.66 | | | | — | | | | 18.49 | | | | 33.69 | | | | 11,221 | | | | 2.63 | (f) | | | 2.63 | (f) | | | (0.38 | )(f) | | | 0.00 | (g) | | | 33 | |
| Year ended 10/31/08 | | | 27.75 | | | | (0.04 | ) | | | (13.88 | ) | | | (13.92 | ) | | | — | | | | 13.83 | | | | (50.16 | ) | | | 12,198 | | | | 2.47 | (f) | | | 2.47 | (f) | | | (0.17 | )(f) | | | 0.00 | (g) | | | 42 | |
| Year ended 10/31/07 | | | 18.70 | | | | (0.15 | ) | | | 9.20 | | | | 9.05 | | | | — | | | | 27.75 | | | | 48.40 | | | | 39,328 | | | | 2.43 | (f) | | | 2.43 | (f) | | | (0.66 | )(f) | | | 0.00 | (g) | | | 50 | |
| |
| Class C |
| Year ended 10/31/11 | | | 20.99 | | | | 0.07 | | | | (2.08 | ) | | | (2.01 | ) | | | (0.04 | ) | | | 18.94 | (d) | | | (9.62 | )(k) | | | 5,572 | | | | 2.39 | (e)(k) | | | 2.39 | (e)(k) | | | 0.32 | (e)(k) | | | N/A | | | | 109 | |
| Year ended 10/31/10 | | | 18.51 | | | | (0.09 | ) | | | 2.57 | | | | 2.48 | | | | — | | | | 20.99 | | | | 13.40 | | | | 5,951 | | | | 2.53 | (f) | | | 2.53 | (f) | | | (0.44 | )(f) | | | 0.00 | (g) | | | 76 | |
| Year ended 10/31/09 | | | 13.85 | | | | (0.06 | ) | | | 4.72 | | | | 4.66 | | | | — | | | | 18.51 | | | | 33.65 | | | | 5,649 | | | | 2.63 | (f) | | | 2.63 | (f) | | | (0.38 | )(f) | | | 0.00 | (g) | | | 33 | |
| Year ended 10/31/08 | | | 27.77 | | | | (0.00 | ) | | | (13.92 | ) | | | (13.92 | ) | | | — | | | | 13.85 | | | | (50.13 | ) | | | 4,506 | | | | 2.38 | (f) | | | 2.38 | (f) | | | (0.01 | )(f) | | | 0.00 | (g) | | | 42 | |
| Year ended 10/31/07 | | | 18.71 | | | | (0.14 | ) | | | 9.20 | | | | 9.06 | | | | — | | | | 27.77 | | | | 48.42 | | | | 10,995 | | | | 2.43 | (f) | | | 2.43 | (f) | | | (0.66 | )(f) | | | 0.00 | (g) | | | 50 | |
| |
| Class R |
| Year ended 10/31/11 | | | 22.11 | | | | 0.17 | | | | (2.19 | ) | | | (2.02 | ) | | | (0.14 | ) | | | 19.95 | (d) | | | (9.21 | ) | | | 129 | | | | 1.93 | (e) | | | 1.93 | (e) | | | 0.78 | (e) | | | N/A | | | | 109 | |
| Year ended 10/31/10 | | | 19.41 | | | | 0.01 | | | | 2.70 | | | | 2.71 | | | | (0.01 | ) | | | 22.11 | | | | 13.97 | | | | 37 | | | | 2.03 | (f) | | | 2.03 | (f) | | | 0.06 | (f) | | | 0.00 | (g) | | | 76 | |
| Year ended 10/31/09 | | | 14.58 | | | | 0.02 | | | | 4.94 | | | | 4.96 | | | | (0.13 | ) | | | 19.41 | | | | 34.35 | | | | 84 | | | | 2.13 | (f) | | | 2.13 | (f) | | | 0.12 | (f) | | | 0.00 | (g) | | | 33 | |
| Year ended 10/31/08(h) | | | 23.52 | | | | 0.09 | | | | (9.03 | ) | | | (8.94 | ) | | | — | | | | 14.58 | | | | (38.01 | ) | | | 62 | | | | 2.01 | (f)(i) | | | 2.01 | (f)(i) | | | 0.71 | (f)(i) | | | 0.00 | (g) | | | 42 | |
| |
| Class Y(j) |
| Year ended 10/31/11 | | | 22.57 | | | | 0.29 | | | | (2.24 | ) | | | (1.95 | ) | | | (0.25 | ) | | | 20.37 | (d) | | | (8.77 | ) | | | 7,998 | | | | 1.43 | (e) | | | 1.43 | (e) | | | 1.28 | (e) | | | N/A | | | | 109 | |
| Year ended 10/31/10 | | | 19.77 | | | | 0.12 | | | | 2.77 | | | | 2.89 | | | | (0.09 | ) | | | 22.57 | | | | 14.67 | | | | 9,553 | | | | 1.53 | (f) | | | 1.53 | (f) | | | 0.56 | (f) | | | 0.00 | (g) | | | 76 | |
| Year ended 10/31/09 | | | 14.83 | | | | 0.11 | | | | 5.02 | | | | 5.13 | | | | (0.19 | ) | | | 19.77 | | | | 35.11 | | | | 616 | | | | 1.63 | (f) | | | 1.63 | (f) | | | 0.62 | (f) | | | 0.00 | (g) | | | 33 | |
| Year ended 10/31/08 | | | 29.64 | | | | 0.22 | | | | (14.88 | ) | | | (14.66 | ) | | | (0.15 | ) | | | 14.83 | | | | (49.69 | ) | | | 373 | | | | 1.48 | (f) | | | 1.48 | (f) | | | 0.93 | (f) | | | 0.00 | (g) | | | 42 | |
| Year ended 10/31/07 | | | 19.85 | | | | 0.09 | | | | 9.78 | | | | 9.87 | | | | (0.08 | ) | | | 29.64 | | | | 49.89 | | | | 1,291 | | | | 1.43 | (f) | | | 1.43 | (f) | | | 0.34 | (f) | | | 0.00 | (g) | | | 50 | |
| |
| Institutional Class |
| Year ended 10/31/11(h) | | | 23.52 | | | | 0.35 | | | | (3.48 | ) | | | (3.13 | ) | | | — | | | | 20.39 | (d) | | | (13.31 | ) | | | 11 | | | | 1.22 | (e)(i) | | | 1.22 | (e)(i) | | | 1.49 | (e)(i) | | | N/A | | | | 109 | |
| |
| | |
| (a) | | Calculated using average shares outstanding. |
| (b) | | Includes adjustments in accordance with accounting principles generally accepted in the United States of America and as such, the net asset value for financial reporting purposes and the returns based upon those net asset values may differ from the net asset value and returns for shareholder transactions. Does not include sales charges and is not annualized for periods less than one year, if applicable. |
| (c) | | Portfolio turnover is calculated at the fund level and is not annualized for periods less than one year, if applicable. For the period ended October 31, 2011, the portfolio turnover calculation excludes the value of securities purchased of $5,980,249 and sold of $4,944,271 in effect to realign the Fund’s portfolio holdings after the reorganization of Invesco Japan Fund into the Fund. |
| (d) | | Includes redemption fees added to shares of beneficial interest which were less than $0.005 per share. |
| (e) | | Ratios are based on average daily net assets (000’s omitted) of $100,472, $7,143, $6,455, $79, $9,354 and $82 for Class A, Class B, Class C, Class R, Class Y and Institutional Class shares, respectively. |
| (f) | | The ratios reflect the rebate of certain Fund expenses in connection with investments in a Morgan Stanley affiliate during the period. The effect of the rebate on the ratios is disclosed in the above table as “Rebate from Morgan Stanley affiliate”. |
| (g) | | Amount is less than 0.005% |
| (h) | | Commencement date of March 31, 2008 and May 23, 2011 for Class R and Institutional Class shares, respectively. |
| (i) | | Annualized. |
| (j) | | On June 1, 2010, the Fund’s former Class I shares were reorganized into Class Y shares. |
| (k) | | The total return, ratio of expenses to average net assets and ratio of net investment income to average net assets reflect actual 12b-1 fees of 0.95% for the year ended October 31, 2011. |
21 Invesco Pacific Growth Fund
Report of Independent Registered Public Accounting Firm
To the Board of Trustees of AIM Investment Funds (Invesco Investment Funds)
and Shareholders of Invesco Pacific Growth Fund:
In our opinion, the accompanying statement of assets and liabilities, including the schedule of investments, and the related statements of operations and of changes in net assets and the financial highlights present fairly, in all material respects, the financial position of Invesco Pacific Growth Fund (one of the funds constituting AIM Investment Funds (Invesco Investment Funds), hereafter referred to as the “Fund”) at October 31, 2011, the results of its operations for the year then ended, and the changes in its net assets and the financial highlights for each of the two years in the period then ended, in conformity with accounting principles generally accepted in the United States of America. These financial statements and financial highlights (hereafter referred to as “financial statements”) are the responsibility of the Fund’s management; our responsibility is to express an opinion on these financial statements based on our audits. We conducted our audits of these financial statements in accordance with the standards of the Public Company Accounting Oversight Board (United States). Those standards require that we plan and perform the audit to obtain reasonable assurance about whether the financial statements are free of material misstatement. An audit includes examining, on a test basis, evidence supporting the amounts and disclosures in the financial statements, assessing the accounting principles used and significant estimates made by management, and evaluating the overall financial statement presentation. We believe that our audits, which included confirmation of securities at October 31, 2011 by correspondence with the custodian and brokers, provide a reasonable basis for our opinion. The financial highlights of the Fund for the periods ended October 31, 2009 and prior were audited by another independent registered public accounting firm whose report dated December 28, 2009 expressed an unqualified opinion on those statements.
PRICEWATERHOUSECOOPERS LLP
Houston, Texas
December 21, 2011
22 Invesco Pacific Growth Fund
Calculating your ongoing Fund expenses
Example
As a shareholder of the Fund, you incur two types of costs: (1) transaction costs, which may include sales charges (loads) on purchase payments or contingent deferred sales charges on redemptions, and redemption fees, if any; and (2) ongoing costs, including management fees, distribution and/or service (12b-1) fees, and other Fund expenses. This example is intended to help you understand your ongoing costs (in dollars) of investing in the Fund and to compare these costs with ongoing costs of investing in other mutual funds. The example is based on an investment of $1,000 invested at the beginning of the period and held for the entire period May 1, 2011 through October 31, 2011.
Actual expenses
The table below provides information about actual account values and actual expenses. You may use the information in this table, together with the amount you invested, to estimate the expenses that you paid over the period. Simply divide your account value by $1,000 (for example, an $8,600 account value divided by $1,000 = 8.6), then multiply the result by the number in the table under the heading entitled “Actual Expenses Paid During Period” to estimate the expenses you paid on your account during this period.
Hypothetical example for comparison purposes
The table below also provides information about hypothetical account values and hypothetical expenses based on the Fund’s actual expense ratio and an assumed rate of return of 5% per year before expenses, which is not the Fund’s actual return.
The hypothetical account values and expenses may not be used to estimate the actual ending account balance or expenses you paid for the period. You may use this information to compare the ongoing costs of investing in the Fund and other funds. To do so, compare this 5% hypothetical example with the 5% hypothetical examples that appear in the shareholder reports of the other funds.
Please note that the expenses shown in the table are meant to highlight your ongoing costs only and do not reflect any transaction costs, such as sales charges (loads) on purchase payments, contingent deferred sales charges on redemptions, and redemption fees, if any. Therefore, the hypothetical information is useful in comparing ongoing costs only, and will not help you determine the relative total costs of owning different funds. In addition, if these transaction costs were included, your costs would have been higher.
| | | | | | | | | | | | | | | | | | | | | | | | | | | | | | | |
| | | | | | | | | | HYPOTHETICAL
| | | |
| | | | | | | ACTUAL | | | (5% annual return before expenses) | | | |
| | | | Beginning
| | | Ending
| | | Expenses
| | | Ending
| | | Expenses
| | | Annualized
|
| | | | Account Value
| | | Account Value
| | | Paid During
| | | Account Value
| | | Paid During
| | | Expense
|
| Class | | | (05/01/11) | | | (10/31/11)1 | | | Period2 | | | (10/31/11) | | | Period2,3 | | | Ratio |
| A | | | $ | 1,000.00 | | | | $ | 832.60 | | | | $ | 8.04 | | | | $ | 1,016.43 | | | | $ | 8.84 | | | | | 1.74 | % |
| | | | | | | | | | | | | | | | | | | | | | | | | | | | | | | |
| B | | | | 1,000.00 | | | | | 829.50 | | | | | 11.48 | | | | | 1,012.65 | | | | | 12.63 | | | | | 2.49 | |
| | | | | | | | | | | | | | | | | | | | | | | | | | | | | | | |
| C | | | | 1,000.00 | | | | | 830.00 | | | | | 11.07 | | | | | 1,013.11 | | | | | 12.18 | | | | | 2.40 | |
| | | | | | | | | | | | | | | | | | | | | | | | | | | | | | | |
| R | | | | 1,000.00 | | | | | 831.70 | | | | | 9.19 | | | | | 1,015.17 | | | | | 10.11 | | | | | 1.99 | |
| | | | | | | | | | | | | | | | | | | | | | | | | | | | | | | |
| Y | | | | 1,000.00 | | | | | 833.50 | | | | | 6.89 | | | | | 1,017.69 | | | | | 7.58 | | | | | 1.49 | |
| | | | | | | | | | | | | | | | | | | | | | | | | | | | | | | |
| Institutional | | | | 1,000.00 | | | | | 866.90 | | | | | 5.06 | | | | | 1,019.05 | | | | | 6.21 | | | | | 1.22 | |
| | | | | | | | | | | | | | | | | | | | | | | | | | | | | | | |
| |
| 1 | The actual ending account value is based on the actual total return of the Fund for the period May 1, 2011 through October 31, 2011 (as of close of business May 23, 2011 through October 31, 2011 for the Institutional Class shares), after actual expenses and will differ from the hypothetical ending account value which is based on the Fund’s expense ratio and a hypothetical annual return of 5% before expenses. |
| 2 | Expenses are equal to the Fund’s annualized expense ratio as indicated above multiplied by the average account value over the period, multiplied by 184/365 to reflect the most recent fiscal half year. For the Institutional Class shares actual expenses are equal to the annualized expense ratio indicated above multiplied by the average account value over the period, multiplied by 162 (as of close of business May 23, 2011 through October 31, 2011)/365. Because the Institutional Class shares have not been in existence for a full six month period, the actual ending account value and expense information shown may not provide a meaningful comparison to fund expense information of classes that show such data for a full six month period and, because the actual ending account value and expense information in the expense example covers a short time period, return and expense data may not be indicative of return and expense data for longer time periods. |
| 3 | Hypothetical expenses are equal to the annualized expense ratio indicated above multiplied by the average account value over the period, multiplied by 184/365 to reflect a one-half year period. The hypothetical ending account value and expenses may be used to compare ongoing costs of investing in Institutional Class shares of the Fund and other funds because such data is based on a full six month period. |
23 Invesco Pacific Growth Fund
| |
| Approval of Investment Advisory and Sub-Advisory Contracts |
The Board of Trustees (the Board) of AIM Investment Funds (Invesco Investment Funds) is required under the Investment Company Act of 1940, as amended, to approve annually the renewal of the Invesco Pacific Growth Fund (the Fund) investment advisory agreement with Invesco Advisers, Inc. (Invesco Advisers) and the Master Intergroup Sub-Advisory Contract for Mutual Funds (the sub-advisory contracts) with Invesco Asset Management Deutschland GmbH, Invesco Asset Management Limited, Invesco Asset Management (Japan) Limited, Invesco Australia Limited, Invesco Hong Kong Limited, Invesco Senior Secured Management, Inc. and Invesco Canada Ltd. (collectively, the Affiliated Sub-Advisers). During contract renewal meetings held on June 14-15, 2011, the Board as a whole, and the disinterested or “independent” Trustees, who comprise 80% of the Board, voting separately, approved the continuance of the Fund’s investment advisory agreement and the sub-advisory contracts for another year, effective July 1, 2011. In doing so, the Board considered the process that it follows in reviewing and approving the Fund’s investment advisory agreement and sub-advisory contracts and the information that it is provided. The Board determined that the Fund’s investment advisory agreement and the sub-advisory contracts are in the best interests of the Fund and its shareholders and the compensation to Invesco Advisers and the Affiliated Sub-Advisers under the agreements is fair and reasonable.
The Board’s Fund Evaluation Process
The Board’s Investments Committee has established three Sub-Committees, each of which is responsible for overseeing the management of a number of the series portfolios of the funds advised by Invesco Advisers (the Invesco Funds). The Sub-Committees meet throughout the year to review the performance of their assigned funds, including reviewing materials prepared under the direction of the independent Senior Officer, an officer of the Invesco Funds who reports directly to the independent Trustees. Over the course of each year, the Sub-Committees meet with portfolio managers for their assigned Invesco Funds and other members of management to review the performance, investment objective(s), policies, strategies and limitations and investment risks of these funds. The Sub-Committees meet regularly and at designated contract renewal meetings each year to conduct a review of the performance, fees, expenses and other matters related to their assigned Invesco Funds. Each Sub-Committee recommends to the Investments Committee, which in turn recommends to the full Board, whether to approve the continuance of each Invesco Fund’s investment advisory agreement and sub-advisory contracts for another year.
During the contract renewal process, the Trustees receive comparative performance and fee data regarding the Invesco Funds prepared by Invesco Advisers and an independent company, Lipper, Inc. (Lipper). The Trustees also receive an independent written evaluation from the Senior Officer. The Senior Officer’s evaluation is prepared as part of his responsibility to manage the process by which the Invesco Funds’ proposed management fees are negotiated during the annual contract renewal process to ensure they are negotiated in a manner that is at arms’ length and reasonable. The independent Trustees are assisted in their annual evaluation of the Fund’s investment advisory agreement by the Senior Officer and by independent legal counsel. The independent Trustees also discuss the continuance of the investment advisory agreement and sub-advisory contracts in private sessions with the Senior Officer and counsel.
In evaluating the fairness and reasonableness of the Fund’s investment advisory agreement and sub-advisory contracts, the Board considered, among other things, the factors discussed below. The Trustees also considered information provided in connection with fund acquisitions approved by the Trustees to rationalize the Invesco Funds product range following the acquisition of the retail mutual fund business of Morgan Stanley (the Morgan Stanley Transaction). The Trustees recognized that the advisory fees for the Invesco Funds include advisory fees that are the result of years of review and negotiation between the Trustees and Invesco Advisers as well as advisory fees inherited from Morgan Stanley and Van Kampen funds acquired in the Morgan Stanley Transaction. The Trustees’ deliberations and conclusions in a particular year may be based in part on their deliberations and conclusions regarding these same arrangements throughout the year and in prior years. One Trustee may have weighed a particular piece of information differently than another Trustee.
The discussion below serves as the Senior Officer’s independent written evaluation with respect to the Fund’s investment advisory agreement as well as a discussion of the material factors and related conclusions that formed the basis for the Board’s approval of the Fund’s investment advisory agreement and sub-advisory contracts. Unless otherwise stated, this information is current as of June 15, 2011, and may not reflect consideration of factors that became known to the Board after that date, including, for example, changes to the Fund’s performance, advisory fees, expense limitations and/or fee waivers.
Factors and Conclusions and Summary of Independent Written Fee Evaluation
| |
| A. | Nature, Extent and Quality of Services Provided by Invesco Advisers and the Affiliated Sub-Advisers |
The Board reviewed the advisory services provided to the Fund by Invesco Advisers under the Fund’s investment advisory agreement, the performance of Invesco Advisers in providing these services, and the credentials and experience of the officers and employees of Invesco Advisers who provide these services, including the Fund’s portfolio manager or managers, with whom the Board met during the year. The Board’s review of the qualifications of Invesco Advisers to provide advisory services included the Board’s consideration of Invesco Advisers’ performance and investment process oversight, independent credit analysis and investment risk management.
In determining whether to continue the Fund’s investment advisory agreement, the Board considered the prior relationship between Invesco Advisers and the Fund, as well as the Board’s knowledge of Invesco Advisers’ operations, and concluded that it is beneficial to maintain the current relationship, in part, because of such knowledge. The Board also considered services that Invesco Advisers and its affiliates provide to the Invesco Funds such as various back office support functions, equity and fixed income trading operations, internal audit, distribution and legal and compliance. The Board concluded that the nature, extent and quality of the services provided to the Fund by Invesco Advisers are appropriate and satisfactory and the advisory services are provided in accordance with the terms of the Fund’s investment advisory agreement.
The Board reviewed the services provided by the Affiliated Sub-Advisers under the sub-advisory contracts and the credentials and experience of the officers and employees of the Affiliated Sub-Advisers who provide these services. The Board noted that the Affiliated Sub-Advisers have offices and personnel that are located in financial centers around the world. As a result, the Affiliated Sub-Advisers can provide research and investment analysis on the markets and economies of various countries in which the Fund invests and make recommendations on securities of companies located in such countries. The Board concluded that the sub-advisory contracts benefit the Fund and its shareholders by permitting Invesco Advisers to use the resources and talents of the Affiliated Sub-Advisers in managing the Fund. The Board concluded that the nature, extent and quality of the services provided by the Affiliated Sub-Advisers are appropriate and satisfactory and in accordance with the terms of the Fund’s sub-advisory contracts.
The Board considered Fund performance as a relevant factor in considering whether to approve the investment advisory agreement as well as the sub-advisory contracts for the Fund, as Invesco Asset Management (Japan) Limited and Invesco Hong Kong Limited currently manage assets of the Fund.
The Board compared the Fund’s performance during the past one, three and five calendar years to the performance of funds in the Lipper performance universe and against the Lipper Pacific
24 Invesco Pacific Growth Fund
Region Funds Index. The Board noted that performance of Class A shares of the Fund was in the third quintile of the universe for the one and three year periods and the first quintile for the five year period (the first quintile being the best performing funds and the fifth quintile being the worst performing funds). The Board noted that performance of Class A shares of the Fund was below the performance of the Index for the one and three year periods and above the performance of the Index for the five year period. Although the independent written evaluation of the Fund’s Senior Officer only considered Fund performance through the most recent calendar year, the Trustees also reviewed more recent Fund performance and this review did not change their conclusions.
| |
| C. | Advisory and Sub-Advisory Fees and Fee Waivers |
The Board compared the Fund’s contractual advisory fee rate to the contractual advisory fee rates of funds in the Fund’s Lipper expense group at a common asset level. The Board noted that the contractual advisory fee rate for Class A shares of the Fund was below the median contractual advisory fee rate of funds in the expense group. The Board also reviewed the methodology used by Lipper in providing expense group information, which includes using audited financial data from the most recent annual report of each fund in the expense group that was publicly available as of the end of the past calendar year and including only one fund per investment adviser. The Board noted that comparative data is as of varying dates, which may affect the comparability of data during times of market volatility.
The Board also compared the Fund’s effective fee rate (the advisory fee after advisory fee waivers and before expense limitations/waivers) to the advisory fee rates of other funds advised by Invesco Advisers and its affiliates with investment strategies comparable to those of the Fund. The Board noted that the Fund’s effective fee rate was above the rates of two offshore funds subadvised by one of the Affiliated Sub-Advisers, both of which were subject to fee waivers that were impacting the effective fee rate.
The Board noted that Invesco Advisers has contractually agreed to waive fees and/or limit expenses of the Fund through at least June 30, 2012 in an amount necessary to limit total annual operating expenses to a specified percentage of average daily net assets for each class of the Fund. The Board noted that at the current expense ratio for the Fund, this expense waiver does not have any impact.
The Board also considered the services provided by the Affiliated Sub-Advisers pursuant to the sub-advisory contracts, as well as the allocation of fees between Invesco Advisers and the Affiliated Sub-Advisers pursuant to the sub-advisory contracts. The Board noted that Invesco Advisers provides services to sub-advised Invesco Funds, including oversight of the Affiliated Sub-Advisers as well as the additional services described above other than day-to-day portfolio management. The Board also noted that the sub-advisory fees have no direct effect on the Fund or its shareholders, as they are paid by Invesco Advisers to the Affiliated Sub-Advisers.
Based upon the information and considerations described above, the Board concluded that the Fund’s advisory and sub-advisory fees are fair and reasonable.
| |
| D. | Economies of Scale and Breakpoints |
The Board considered the extent to which there are economies of scale in the provision of advisory services to the Fund. The Board also considered whether the Fund benefits from economies of scale through contractual breakpoints in the Fund’s advisory fee schedule. The Board also noted that the Fund shares directly in economies of scale through lower fees charged by third party service providers based on the combined size of the Invesco Funds and other clients advised by Invesco Advisers.
| |
| E. | Profitability and Financial Resources |
The Board reviewed information from Invesco Advisers concerning the costs of the advisory and other services that Invesco Advisers and its affiliates provide to the Fund and the profitability of Invesco Advisers and its affiliates in providing these services. The Board reviewed with Invesco Advisers the methodology used to prepare the profitability information. The Board considered the profitability of Invesco Advisers in connection with managing the Fund and the Invesco Funds. The Board noted that Invesco Advisers continues to operate at a net profit from services Invesco Advisers and its subsidiaries provide to the Fund and the Invesco Funds. The Board concluded that the level of profits realized by Invesco Advisers and its affiliates from providing services to the Fund is not excessive given the nature, quality and extent of the services provided to the Invesco Funds. The Board considered whether Invesco Advisers and each Affiliated Sub-Adviser are financially sound and have the resources necessary to perform their obligations under the investment advisory agreement and sub-advisory contracts. The Board concluded that Invesco Advisers and each Affiliated Sub-Adviser have the financial resources necessary to fulfill these obligations.
| |
| F. | Collateral Benefits to Invesco Advisers and its Affiliates |
The Board considered various other benefits received by Invesco Advisers and its affiliates from the relationship with the Fund, including the fees received for their provision of administrative, transfer agency and distribution services to the Fund. The Board considered the performance of Invesco Advisers and its affiliates in providing these services and the organizational structure employed to provide these services. The Board also considered that these services are provided to the Fund pursuant to written contracts that are reviewed and approved on an annual basis by the Board; that the services are required for the operation of the Fund; that Invesco Advisers and its affiliates can provide services, the nature and quality of which are at least equal to those provided by others offering the same or similar services; and that the fees for such services are fair and reasonable in light of the usual and customary charges by others for services of the same nature and quality.
The Board considered the benefits realized by Invesco Advisers and the Affiliated Sub-Advisers as a result of portfolio brokerage transactions executed through “soft dollar” arrangements. The Board noted that soft dollar arrangements shift the payment obligation for research and execution services from Invesco Advisers and the Affiliated Sub-Advisers to the Invesco Funds and therefore may reduce Invesco Advisers’ and the Affiliated Sub-Advisers’ expenses. The Board concluded that the soft dollar arrangements are appropriate. The Board also concluded that, based on their review and representations made by the Chief Compliance Officer of the Invesco Funds, these arrangements are consistent with regulatory requirements.
The Board considered that the Fund’s uninvested cash and cash collateral from any securities lending arrangements may be invested in money market funds advised by Invesco Advisers pursuant to procedures approved by the Board. The Board noted that Invesco Advisers receives advisory fees from these affiliated money market funds attributable to such investments, although Invesco Advisers has contractually agreed to waive through varying periods the advisory fees payable by the Invesco Funds. The waiver is in an amount equal to 100% of the net advisory fee Invesco Advisers receives from the affiliated money market funds with respect to the Fund’s investment in the affiliated money market funds of uninvested cash, but not cash collateral. The Board concluded that the Fund’s investment of uninvested cash and cash collateral from any securities lending arrangements in the affiliated money market funds is in the best interests of the Fund and its shareholders.
25 Invesco Pacific Growth Fund
Tax Information
Form 1099-DIV, Form 1042-S and other year-end tax information provide shareholders with actual calendar year amounts that should be included in their tax returns. Shareholders should consult their tax advisors.
The following distribution information is being provided as required by the Internal Revenue Code or to meet a specific state’s requirement.
The Fund designates the following amounts or, if subsequently determined to be different, the maximum amount allowable for its fiscal year ended October 31, 2011:
| | | | | |
Federal and State Income Tax | | |
| |
| Qualified Dividend Income* | | | 100% | |
| Corporate Dividends Received Deduction* | | | 0.01% | |
| Foreign Taxes | | $ | 0.0426 per share | |
| Foreign Source Income | | $ | 0.7152 per share | |
| | |
| | * | The above percentages are based on ordinary income dividends paid to shareholders during the Fund’s fiscal year. |
26 Invesco Pacific Growth Fund
Trustees and Officers
The address of each trustee and officer is AIM Investment Funds (Invesco Investment Funds) (the “Trust”), 11 Greenway Plaza, Suite 2500, Houston, Texas 77046-1173. The trustees serve for the life of the Trust, subject to their earlier death, incapacitation, resignation, retirement or removal as more specifically provided in the Trust’s organizational documents. Each officer serves for a one year term or until their successors are elected and qualified. Column two below includes length of time served with predecessor entities, if any.
| | | | | | | | | |
| | | | | | | Number of
| | |
| | | | | | | Funds in
| | |
| | | | | | | Fund Complex
| | |
Name, Year of Birth and
| | Trustee and/
| | Principal Occupation(s)
| | Overseen by
| | Other Directorship(s)
|
| Position(s) Held with the Trust | | or Officer Since | | During Past 5 Years | | Trustee | | Held by Trustee |
| | | | | | | | | |
| | | | | | | | | |
| Interested Persons | | | | | | | | |
| | | | | | | | | |
| | | | | | | | | |
| | | | | | | | | |
Martin L. Flanagan1 — 1960
Trustee | | 2007 | | Executive Director, Chief Executive Officer and President, Invesco Ltd. (ultimate parent of Invesco and a global investment management firm); Advisor to the Board, Invesco Advisers, Inc. (formerly known as Invesco Institutional (N.A.), Inc.); Trustee, The Invesco Funds; Vice Chair, Investment Company Institute; and Member of Executive Board, SMU Cox School of Business
Formerly: Chairman, Invesco Advisers, Inc. (registered investment adviser); Director, Chairman, Chief Executive Officer and President, IVZ Inc. (holding company), INVESCO Group Services, Inc. (service provider) and Invesco North American Holdings, Inc. (holding company); Director, Chief Executive Officer and President, Invesco Holding Company Limited (parent of Invesco and a global investment management firm); Director, Invesco Ltd.; Chairman, Investment Company Institute and President, Co-Chief Executive Officer, Co-President, Chief Operating Officer and Chief Financial Officer, Franklin Resources, Inc. (global investment management organization) | | 141 | | None |
| | | | | | | | | |
| | | | | | | | | |
| | | | | | | | | |
Philip A. Taylor2 — 1954
Trustee, President and
Principal Executive Officer | | 2006 | | Head of North American Retail and Senior Managing Director, Invesco Ltd.; Director, Co-Chairman, Co-President and Co-Chief Executive Officer, Invesco Advisers, Inc. (formerly known as Invesco Institutional (N.A.), Inc.) (registered investment adviser); Director, Chairman, Chief Executive Officer and President, Invesco Management Group, Inc. (formerly Invesco Aim Management Group, Inc.) (financial services holding company); Director and President, INVESCO Funds Group, Inc. (registered investment adviser and registered transfer agent); Director and Chairman, Invesco Investment Services, Inc. (formerly known as Invesco Aim Investment Services, Inc.) (registered transfer agent) and IVZ Distributors, Inc. (formerly known as INVESCO Distributors, Inc.) (registered broker dealer); Director, President and Chairman, Invesco Inc. (holding company) and Invesco Canada Holdings Inc. (holding company); Chief Executive Officer, Invesco Corporate Class Inc. (corporate mutual fund company) and Invesco Canada Fund Inc. (corporate mutual fund company); Director, Chairman and Chief Executive Officer, Invesco Canada Ltd. (formerly known as Invesco Trimark Ltd./Invesco Trimark Ltèe) (registered investment adviser and registered transfer agent); Trustee, President and Principal Executive Officer, The Invesco Funds (other than AIM Treasurer’s Series Trust (Invesco Treasurer’s Series Trust) and Short-Term Investments Trust); Trustee and Executive Vice President, The Invesco Funds (AIM Treasurer’s Series Trust (Invesco Treasurer’s Series Trust) and Short-Term Investments Trust only); Director, Invesco Investment Advisers LLC (formerly known as Van Kampen Asset Management); Director, Chief Executive Officer and President, Van Kampen Exchange Corp.
Formerly: Director and Chairman, Van Kampen Investor Services Inc.: Director, Chief Executive Officer and President, 1371 Preferred Inc. (holding company); and Van Kampen Investments Inc.; Director and President, AIM GP Canada Inc. (general partner for limited partnerships); and Van Kampen Advisors, Inc.; Director and Chief Executive Officer, Invesco Trimark Dealer Inc. (registered broker dealer); Director, Invesco Distributors, Inc. (formerly known as Invesco Aim Distributors, Inc.) (registered broker dealer); Manager, Invesco PowerShares Capital Management LLC; Director, Chief Executive Officer and President, Invesco Advisers, Inc.; Director, Chairman, Chief Executive Officer and President, Invesco Aim Capital Management, Inc.; President, Invesco Trimark Dealer Inc. and Invesco Trimark Ltd./Invesco Trimark Ltèe; Director and President, AIM Trimark Corporate Class Inc. and AIM Trimark Canada Fund Inc.; Senior Managing Director, Invesco Holding Company Limited; Trustee and Executive Vice President, Tax-Free Investments Trust; Director and Chairman, Fund Management Company (former registered broker dealer); President and Principal Executive Officer, The Invesco Funds (AIM Treasurer’s Series Trust (Invesco Treasurer’s Series Trust), Short-Term Investments Trust and Tax-Free Investments Trust only); President, AIM Trimark Global Fund Inc. and AIM Trimark Canada Fund Inc. | | 141 | | None |
| | | | | | | | | |
| | | | | | | | | |
| | | | | | | | | |
Wayne W. Whalen3 — 1939
Trustee | | 2010 | | Of Counsel, and prior to 2010, partner in the law firm of Skadden, Arps, Slate, Meagher & Flom LLP, legal counsel to funds in the Fund Complex | | 159 | | Director of the Abraham Lincoln Presidential Library Foundation |
| | | | | | | | | |
| | | | | | | | | |
| | | | | | | | | |
| Independent Trustees | | | | | | | | |
| | | | | | | | | |
| | | | | | | | | |
| | | | | | | | | |
Bruce L. Crockett — 1944
Trustee and Chair | | 2001 | | Chairman, Crockett Technology Associates (technology consulting company)
Formerly: Director, Captaris (unified messaging provider); Director, President and Chief Executive Officer COMSAT Corporation; and Chairman, Board of Governors of INTELSAT (international communications company) | | 141 | | ACE Limited (insurance company); and Investment Company Institute |
| | | | | | | | | |
| | | | | | | | | |
| | | | | | | | | |
David C. Arch — 1945
Trustee | | 2010 | | Chairman and Chief Executive Officer of Blistex Inc., a consumer health care products manufacturer. | | 159 | | Member of the Heartland Alliance Advisory Board, a nonprofit organization serving human needs based in Chicago. Board member of the Illinois Manufacturers’ Association. Member of the Board of Visitors, Institute for the Humanities, University of Michigan |
| | | | | | | | | |
| |
| 1 | Mr. Flanagan is considered an interested person of the Trust because he is an officer of the adviser to the Trust, and an officer and a director of Invesco Ltd., ultimate parent of the adviser to the Trust. |
| 2 | Mr. Taylor is considered an interested person of the Trust because he is an officer and a director of the adviser to, and a director of the principal underwriter of, the Trust. |
| 3 | Mr. Whalen has been deemed to be an interested person of the Trust because of his prior service as counsel to the predecessor funds of certain Invesco open-end funds and his affiliation with the law firm that served as counsel to such predecessor funds and continues to serve as counsel to the Invesco Van Kampen closed-end funds. |
T-1 Invesco Pacific Growth Fund
Trustees and Officers—(continued)
The address of each trustee and officer is AIM Investment Funds (Invesco Investment Funds) (the “Trust”), 11 Greenway Plaza, Suite 2500, Houston, Texas 77046-1173. The trustees serve for the life of the Trust, subject to their earlier death, incapacitation, resignation, retirement or removal as more specifically provided in the Trust’s organizational documents. Each officer serves for a one year term or until their successors are elected and qualified. Column two below includes length of time served with predecessor entities, if any.
| | | | | | | | | |
| | | | | | | Number of
| | |
| | | | | | | Funds in
| | |
| | | | | | | Fund Complex
| | |
Name, Year of Birth and
| | Trustee and/
| | Principal Occupation(s)
| | Overseen by
| | Other Directorship(s)
|
| Position(s) Held with the Trust | | or Officer Since | | During Past 5 Years | | Trustee | | Held by Trustee |
| | | | | | | | | |
| | | | | | | | | |
| Independent Trustees—(continued) | | | | | | | | |
| | | | | | | | | |
| | | | | | | | | |
| | | | | | | | | |
Bob R. Baker — 1936
Trustee | | 2003 | | Retired
Formerly: President and Chief Executive Officer, AMC Cancer Research Center; and Chairman and Chief Executive Officer, First Columbia Financial Corporation | | 141 | | None |
| | | | | | | | | |
| | | | | | | | | |
| | | | | | | | | |
Frank S. Bayley — 1939
Trustee | | 1987 | | Retired
Formerly: Director, Badgley Funds, Inc. (registered investment company) (2 portfolios) and Partner, law firm of Baker & McKenzie | | 141 | | Director and Chairman, C.D. Stimson Company (a real estate investment company) |
| | | | | | | | | |
| | | | | | | | | |
| | | | | | | | | |
James T. Bunch — 1942
Trustee | | 2003 | | Founder, Green, Manning & Bunch Ltd. (investment banking firm)
Formerly: Executive Committee, United States Golf Association; and Director, Policy Studies, Inc. and Van Gilder Insurance Corporation | | 141 | | Vice Chairman, Board of Governors, Western Golf Association/Evans Scholars Foundation and Director, Denver Film Society |
| | | | | | | | | |
| | | | | | | | | |
| | | | | | | | | |
Rodney F. Dammeyer — 1940
Trustee | | 2010 | | President of CAC, LLC, a private company offering capital investment and management advisory services.
Formerly: Prior to January 2004, Director of TeleTech Holdings Inc.; Prior to 2002, Director of Arris Group, Inc.; Prior to 2001, Managing Partner at Equity Group Corporate Investments. Prior to 1995, Vice Chairman of Anixter International. Prior to 1985, experience includes Senior Vice President and Chief Financial Officer of Household International, Inc, Executive Vice President and Chief Financial Officer of Northwest Industries, Inc. and Partner of Arthur Andersen & Co. | | 159 | | Director of Quidel Corporation and Stericycle, Inc. Prior to May 2008, Trustee of The Scripps Research Institute. Prior to February 2008, Director of Ventana Medical Systems, Inc. Prior to April 2007, Director of GATX Corporation. Prior to April 2004, Director of TheraSense, Inc. |
| | | | | | | | | |
| | | | | | | | | |
| | | | | | | | | |
Albert R. Dowden — 1941
Trustee | | 2001 | | Director of a number of public and private business corporations, including the Boss Group, Ltd. (private investment and management); Reich & Tang Funds (5 portfolios) (registered investment company); and Homeowners of America Holding Corporation/ Homeowners of America Insurance Company (property casualty company)
Formerly: Director, Continental Energy Services, LLC (oil and gas pipeline service); Director, CompuDyne Corporation (provider of product and services to the public security market) and Director, Annuity and Life Re (Holdings), Ltd. (reinsurance company); Director, President and Chief Executive Officer, Volvo Group North America, Inc.; Senior Vice President, AB Volvo; Director of various public and private corporations; Chairman, DHJ Media, Inc.; Director Magellan Insurance Company; and Director, The Hertz Corporation, Genmar Corporation (boat manufacturer), National Media Corporation; Advisory Board of Rotary Power International (designer, manufacturer, and seller of rotary power engines); and Chairman, Cortland Trust, Inc. (registered investment company) | | 141 | | Board of Nature’s Sunshine Products, Inc. |
| | | | | | | | | |
| | | | | | | | | |
| | | | | | | | | |
Jack M. Fields — 1952
Trustee | | 2001 | | Chief Executive Officer, Twenty First Century Group, Inc. (government affairs company); and Owner and Chief Executive Officer, Dos Angelos Ranch, L.P. (cattle, hunting, corporate entertainment), Discovery Global Education Fund (non-profit) and Cross Timbers Quail Research Ranch (non-profit)
Formerly: Chief Executive Officer, Texana Timber LP (sustainable forestry company) and member of the U.S. House of Representatives | | 141 | | Administaff |
| | | | | | | | | |
| | | | | | | | | |
| | | | | | | | | |
Carl Frischling — 1937
Trustee | | 2001 | | Partner, law firm of Kramer Levin Naftalis and Frankel LLP | | 141 | | Director, Reich & Tang Funds (6 portfolios) |
| | | | | | | | | |
| | | | | | | | | |
| | | | | | | | | |
Prema Mathai-Davis — 1950
Trustee | | 2001 | | Retired
Formerly: Chief Executive Officer, YWCA of the U.S.A. | | 141 | | None |
| | | | | | | | | |
| | | | | | | | | |
| | | | | | | | | |
Larry Soll — 1942
Trustee | | 2003 | | Retired
Formerly, Chairman, Chief Executive Officer and President, Synergen Corp. (a biotechnology company) | | 141 | | None |
| | | | | | | | | |
| | | | | | | | | |
| | | | | | | | | |
Hugo F. Sonnenschein — 1940
Trustee | | 2010 | | President Emeritus and Honorary Trustee of the University of Chicago and the Adam Smith Distinguished Service Professor in the Department of Economics at the University of Chicago. Prior to July 2000, President of the University of Chicago. | | 159 | | Trustee of the University of Rochester and a member of its investment committee. Member of the National Academy of Sciences, the American Philosophical Society and a fellow of the American Academy of Arts and Sciences |
| | | | | | | | | |
| | | | | | | | | |
| | | | | | | | | |
Raymond Stickel, Jr. — 1944
Trustee | | 2005 | | Retired
Formerly: Director, Mainstay VP Series Funds, Inc. (25 portfolios) and Partner, Deloitte & Touche | | 141 | | Director of Long Cove Club Owners’ Association (home owner’s association) |
| | | | | | | | | |
T-2 Invesco Pacific Growth Fund
Trustees and Officers—(continued)
The address of each trustee and officer is AIM Investment Funds (Invesco Investment Funds) (the “Trust”), 11 Greenway Plaza, Suite 2500, Houston, Texas 77046-1173. The trustees serve for the life of the Trust, subject to their earlier death, incapacitation, resignation, retirement or removal as more specifically provided in the Trust’s organizational documents. Each officer serves for a one year term or until their successors are elected and qualified. Column two below includes length of time served with predecessor entities, if any.
| | | | | | | | | |
| | | | | | | Number of
| | |
| | | | | | | Funds in
| | |
| | | | | | | Fund Complex
| | |
Name, Year of Birth and
| | Trustee and/
| | Principal Occupation(s)
| | Overseen by
| | Other Directorship(s)
|
| Position(s) Held with the Trust | | or Officer Since | | During Past 5 Years | | Trustee | | Held by Trustee |
| | | | | | | | | |
| | | | | | | | | |
| Other Officers | | | | | | | | |
| | | | | | | | | |
| | | | | | | | | |
| | | | | | | | | |
Russell C. Burk — 1958
Senior Vice President and Senior Officer | | 2005 | | Senior Vice President and Senior Officer of Invesco Funds | | N/A | | N/A |
| | | | | | | | | |
| | | | | | | | | |
| | | | | | | | | |
John M. Zerr — 1962
Senior Vice President, Chief Legal Officer and Secretary | | 2006 | | Director, Senior Vice President, Secretary and General Counsel, Invesco Management Group, Inc. (formerly known as Invesco Aim Management Group, Inc.) and Van Kampen Exchange Corp.; Senior Vice President, Invesco Advisers, Inc. (formerly known as Invesco Institutional (N.A.), Inc.) (registered investment adviser); Senior Vice President and Secretary, Invesco Distributors, Inc. (formerly known as Invesco Aim Distributors, Inc.); Director, Vice President and Secretary, Invesco Investment Services, Inc. (formerly known as Invesco Aim Investment Services, Inc.) and IVZ Distributors, Inc. (formerly known as INVESCO Distributors, Inc.); Director and Vice President, INVESCO Funds Group, Inc.; Senior Vice President, Chief Legal Officer and Secretary, The Invesco Funds; Manager, Invesco PowerShares Capital Management LLC; Director, Secretary and General Counsel, Invesco Investment Advisers LLC (formerly known as Van Kampen Asset Management); Secretary and General Counsel, Van Kampen Funds Inc. and Chief Legal Officer, PowerShares Exchange-Traded Fund Trust, PowerShares Exchange-Traded Fund Trust II, PowerShares India Exchange-Traded Fund Trust and PowerShares Actively Managed Exchange-Traded Fund Trust
Formerly: Director and Secretary, Van Kampen Advisors Inc.; Director Vice President, Secretary and General Counsel Van Kampen Investor Services Inc.; Director, Invesco Distributors, Inc. (formerly known as Invesco Aim Distributors, Inc.); Director, Senior Vice President, General Counsel and Secretary, Invesco Advisers, Inc.; and Van Kampen Investments Inc.; Director, Vice President and Secretary, Fund Management Company; Director, Senior Vice President, Secretary, General Counsel and Vice President, Invesco Aim Capital Management, Inc.; Chief Operating Officer and General Counsel, Liberty Ridge Capital, Inc. (an investment adviser); Vice President and Secretary, PBHG Funds (an investment company) and PBHG Insurance Series Fund (an investment company); Chief Operating Officer, General Counsel and Secretary, Old Mutual Investment Partners (a broker-dealer); General Counsel and Secretary, Old Mutual Fund Services (an administrator) and Old Mutual Shareholder Services (a shareholder servicing center); Executive Vice President, General Counsel and Secretary, Old Mutual Capital, Inc. (an investment adviser); and Vice President and Secretary, Old Mutual Advisors Funds (an investment company) | | N/A | | N/A |
| | | | | | | | | |
| | | | | | | | | |
| | | | | | | | | |
Lisa O. Brinkley — 1959
Vice President | | 2004 | | Global Compliance Director, Invesco Ltd.; Chief Compliance Officer, Invesco Investment Services, Inc.(formerly known as Invesco Aim Investment Services, Inc.); and Vice President, The Invesco Funds
Formerly: Chief Compliance Officer, Invesco Distributors, Inc. (formerly known as Invesco Aim Distributors, Inc.) and Van Kampen Investor Services Inc.; Senior Vice President, Invesco Management Group, Inc.; Senior Vice President and Chief Compliance Officer, Invesco Advisers, Inc. and The Invesco Funds; Vice President and Chief Compliance Officer, Invesco Aim Capital Management, Inc. and Invesco Distributors, Inc.; Vice President, Invesco Investment Services, Inc. and Fund Management Company | | N/A | | N/A |
| | | | | | | | | |
| | | | | | | | | |
| | | | | | | | | |
Sheri Morris — 1964
Vice President, Treasurer and Principal Financial Officer | | 1999 | | Vice President, Treasurer and Principal Financial Officer, The Invesco Funds; and Vice President, Invesco Advisers, Inc. (formerly known as Invesco Institutional (N.A.), Inc.) (registered investment adviser).
Formerly: Treasurer, PowerShares Exchange-Traded Fund Trust, PowerShares Exchange--Traded Fund Trust II, PowerShares India Exchange-Traded Fund Trust and PowerShares Actively Managed Exchange-Traded Fund Trust; Vice President, Invesco Advisers, Inc., Invesco Aim Capital Management, Inc. and Invesco Aim Private Asset Management, Inc.; Assistant Vice President and Assistant Treasurer, The Invesco Funds and Assistant Vice President, Invesco Advisers, Inc., Invesco Aim Capital Management, Inc. and Invesco Aim Private Asset Management, Inc. | | N/A | | N/A |
| | | | | | | | | |
| | | | | | | | | |
| | | | | | | | | |
Karen Dunn Kelley — 1960
Vice President | | 2004 | | Head of Invesco’s World Wide Fixed Income and Cash Management Group; Senior Vice President, Invesco Advisers, Inc. (formerly known as Invesco Institutional (N.A.), Inc.) (registered investment adviser); Executive Vice President, Invesco Distributors, Inc. (formerly known as Invesco Aim Distributors, Inc.); Senior Vice President, Invesco Management Group, Inc. (formerly known as Invesco Aim Management Group, Inc.); and Director, Invesco Mortgage Capital Inc.; Vice President, The Invesco Funds (other than AIM Treasurer’s Series Trust (Invesco Treasurer’s Series Trust) and Short-Term Investments Trust); President and Principal Executive Officer, The Invesco Funds (AIM Treasurer’s Series Trust (Invesco Treasurer’s Series Trust) and Short-Term Investments Trust only).
Formerly: Senior Vice President, Van Kampen Investments Inc.; Vice President, Invesco Advisers, Inc. (formerly known as Invesco Institutional (N.A.), Inc.); Director of Cash Management and Senior Vice President, Invesco Advisers, Inc. and Invesco Aim Capital Management, Inc.; President and Principal Executive Officer, Tax-Free Investments Trust; Director and President, Fund Management Company; Chief Cash Management Officer, Director of Cash Management, Senior Vice President, and Managing Director, Invesco Aim Capital Management, Inc.; Director of Cash Management, Senior Vice President, and Vice President, Invesco Advisers, Inc. and The Invesco Funds (AIM Treasurer’s Series Trust (Invesco Treasurer’s Series Trust), Short-Term Investments Trust and Tax-Free Investments Trust only) | | N/A | | N/A |
| | | | | | | | | |
T-3 Invesco Pacific Growth Fund
Trustees and Officers—(continued)
The address of each trustee and officer is AIM Investment Funds (Invesco Investment Funds) (the “Trust”), 11 Greenway Plaza, Suite 2500, Houston, Texas 77046-1173. The trustees serve for the life of the Trust, subject to their earlier death, incapacitation, resignation, retirement or removal as more specifically provided in the Trust’s organizational documents. Each officer serves for a one year term or until their successors are elected and qualified. Column two below includes length of time served with predecessor entities, if any.
| | | | | | | | | |
| | | | | | | Number of
| | |
| | | | | | | Funds in
| | |
| | | | | | | Fund Complex
| | |
Name, Year of Birth and
| | Trustee and/
| | Principal Occupation(s)
| | Overseen by
| | Other Directorship(s)
|
| Position(s) Held with the Trust | | or Officer Since | | During Past 5 Years | | Trustee | | Held by Trustee |
| | | | | | | | | |
| | | | | | | | | |
| Other Officers—(continued) | | | | | | | | |
| | | | | | | | | |
| | | | | | | | | |
| | | | | | | | | |
Lance A. Rejsek — 1967
Anti-Money Laundering Compliance Officer | | 2005 | | Anti-Money Laundering Compliance Officer, Invesco Advisers, Inc. (formerly known as Invesco Institutional (N.A.), Inc.) (registered investment adviser); Invesco Distributors, Inc. (formerly known as Invesco Aim Distributors, Inc.), Invesco Investment Services, Inc. (formerly known as Invesco Aim Investment Services, Inc.), The Invesco Funds, PowerShares Exchange-Traded Fund Trust, PowerShares Exchange-Traded Fund Trust II, PowerShares India Exchange-Traded Fund Trust, PowerShares Actively Managed Exchange-Traded Fund Trust, Invesco Investment Advisers LLC (formerly known as Van Kampen Asset Management) and Van Kampen Funds Inc.
Formerly: Anti-Money Laundering Compliance Officer, Van Kampen Investor Services Inc., Fund Management Company, Invesco Advisers, Inc., Invesco Aim Capital Management, Inc. and Invesco Aim Private Asset Management, Inc. | | N/A | | N/A |
| | | | | | | | | |
| | | | | | | | | |
| | | | | | | | | |
Todd L. Spillane — 1958
Chief Compliance Officer | | 2006 | | Senior Vice President, Invesco Management Group, Inc. (formerly known as Invesco Aim Management Group, Inc.) and Van Kampen Exchange Corp.; Senior Vice President and Chief Compliance Officer, Invesco Advisers, Inc. (registered investment adviser) (formerly known as Invesco Institutional (N.A.), Inc.); Chief Compliance Officer, The Invesco Funds, PowerShares Exchange-Traded Fund Trust, PowerShares Exchange-Traded Fund Trust II, PowerShares India Exchange-Traded Fund Trust, PowerShares Actively Managed Exchange-Traded Fund Trust, INVESCO Private Capital Investments, Inc. (holding company) and Invesco Private Capital, Inc. (registered investment adviser); Vice President, Invesco Distributors, Inc. (formerly known as Invesco Aim Distributors, Inc.) and Invesco Investment Services, Inc. (formerly known as Invesco Aim Investment Services, Inc.).
Formerly: Chief Compliance Officer, Invesco Van Kampen Closed-End Funds; Senior Vice President, Van Kampen Investments Inc.; Senior Vice President and Chief Compliance Officer, Invesco Advisers, Inc. and Invesco Aim Capital Management, Inc.; Chief Compliance Officer, Invesco Global Asset Management (N.A.), Inc., Invesco Senior Secured Management, Inc. (registered investment adviser) and Van Kampen Investor Services Inc.; Vice President, Invesco Aim Capital Management, Inc. and Fund Management Company | | N/A | | N/A |
| | | | | | | | | |
The Statement of Additional Information of the Trust includes additional information about the Fund’s Trustees and is available upon request, without charge, by calling 1.800.959.4246. Please refer to the Fund’s prospectus for information on the Fund’s sub-advisers.
| | | | | | | |
Office of the Fund
11 Greenway Plaza, Suite 2500
Houston, TX 77046-1173 | | Investment Adviser
Invesco Advisers, Inc.
1555 Peachtree Street, N.E.
Atlanta, GA 30309 | | Distributor
Invesco Distributors, Inc.
11 Greenway Plaza, Suite 2500
Houston, TX 77046-1173 | | Auditors
PricewaterhouseCoopers LLP
1201 Louisiana Street, Suite 2900
Houston, TX 77002-5678 |
| | | | | | | |
| | | | | | | |
Counsel to the Fund
Stradley Ronon Stevens & Young, LLP
2600 One Commerce Square
Philadelphia, PA 19103 | | Counsel to the Independent Trustees
Kramer, Levin, Naftalis & Frankel LLP
1177 Avenue of the Americas
New York, NY 10036-2714 | | Transfer Agent
Invesco Investment Services, Inc.
11 Greenway Plaza, Suite 2500
Houston, TX 77046-1173 | | Custodian
State Street Bank and Trust Company
225 Franklin
Boston, MA 02110-2801 |
T-4 Invesco Pacific Growth Fund
Invesco mailing information
Send general correspondence to Invesco Investment Services, Inc., P.O. Box 219078, Kansas City, MO 64121-9078.
Invesco privacy policy
You share personal and financial information with us that is necessary for your transactions and your account records. We take very seriously the obligation to keep that information confidential and private.
Invesco collects nonpublic personal information about you from account applications or other forms you complete and from your transactions with us or our affiliates. We do not disclose information about you or our former customers to service providers or other third parties except to the extent necessary to service your account and in other limited circumstances as permitted by law. For example, we use this information to facilitate the delivery of transaction confirmations, financial reports, prospectuses and tax forms.
Even within Invesco, only people involved in the servicing of your accounts and compliance monitoring have access to your information. To ensure the highest level of confidentiality and security, Invesco maintains physical, electronic and procedural safeguards that meet or exceed federal standards. Special measures, such as data encryption and authentication, apply to your communications with us on our website. More detail is available to you at invesco.com/privacy.
Important notice regarding delivery of security holder documents
To reduce Fund expenses, only one copy of most shareholder documents may be mailed to shareholders with multiple accounts at the same address (Householding). Mailing of your shareholder documents may be householded indefinitely unless you instruct us otherwise. If you do not want the mailing of these documents to be combined with those for other members of your household, please contact Invesco Investment Services, Inc. at 800 959 4246 or contact your financial institution. We will begin sending you individual copies for each account within 30 days after receiving your request.
Fund holdings and proxy voting information
The Fund provides a complete list of its holdings four times in each fiscal year, at the quarter-ends. For the second and fourth quarters, the lists appear in the Fund’s semiannual and annual reports to shareholders. For the first and third quarters, the Fund files the lists with the Securities and Exchange Commission (SEC) on Form N-Q. The most recent list of portfolio holdings is available at invesco.com/completeqtrholdings. Shareholders can also look up the Fund’s Forms N-Q on the SEC website at sec.gov. Copies of the Fund’s Forms N-Q may be reviewed and copied at the SEC Public Reference Room in Washington, D.C. You can obtain information on the operation of the Public Reference Room, including information about duplicating fee charges, by calling 202 551 8090 or 800 732 0330, or by electronic request at the following email address: publicinfo@sec.gov. The SEC file numbers for the Fund are 811-05426 and 033-19338.
A description of the policies and procedures that the Fund uses to determine how to vote proxies relating to portfolio securities is available without charge, upon request, from our Client Services department at 800 959 4246 or at invesco.com/proxyguidelines. The information is also available on the SEC website, sec.gov.
Information regarding how the Fund voted proxies related to its portfolio securities during the 12 months ended June 30, 2011, is available at invesco.com/proxysearch. The information is also available on the SEC website, sec.gov.
Invesco Advisers, Inc. is an investment adviser; it provides investment advisory services to individual and institutional clients and does not sell securities. Invesco Distributors, Inc. is the U.S. distributor for Invesco Ltd.’s retail mutual funds, exchange-traded funds and institutional money market funds. Both are wholly owned, indirect subsidiaries of Invesco Ltd.
MS-PGRO-AR-1 Invesco Distributors, Inc.
| | | |
|
| |
Annual Report to Shareholders | | October 31, 2011 |
Invesco Small Companies Fund
Nasdaq:
A: ATIAX § B: ATIBX § C: ATICX § R: ATIRX § Y: ATIYX § Institutional: ATIIX
| | | |
|
| |
| 2 | | Letters to Shareholders |
| 4 | | Performance Summary |
| 4 | | Management Discussion |
| 6 | | Long-Term Fund Performance |
| 8 | | Supplemental Information |
| 9 | | Schedule of Investments |
| 11 | | Financial Statements |
| 13 | | Notes to Financial Statements |
| 20 | | Financial Highlights |
| 21 | | Auditor’s Report |
| 22 | | Fund Expenses |
| 23 | | Approval of Investment Advisory and Sub-Advisory Agreements |
| T-1 | | Trustees and Officers |
Letters to Shareholders

Philip Taylor
Dear Shareholders:
Enclosed is important information about your Fund and its performance. I encourage you to read this report to learn more about your Fund’s short- and long-term performance and its holdings as of the close of the reporting period. This report also includes useful information about your Fund’s management team and a discussion of how your Fund was managed during the reporting period.
Investors are likely to confront both opportunities and challenges in 2012 – just as we did in 2011. After all, changes in market sentiment never do investors the courtesy of announcing their impending arrival, and your goals and needs may have changed, requiring changes in your financial strategy.
That’s why the start of a new year is always a good time to catch up with your financial adviser. He or she can explain how your investments performed in the year just ended – how each performed individually, and more important, how they performed as a diversified portfolio. Of course, it’s important to remember that an investment’s long-term performance is more important than its short-term performance. Looking ahead to the new year and evaluating your individual situation, your financial adviser can provide valuable insight into whether your investments are still appropriate for your individual needs, goals and risk tolerance.
For current information about your Fund
In addition to meeting with your financial adviser to discuss your individual situation at the start of the new year, you also may find it helpful to stay abreast of market trends and developments. Doing so may provide reassurance in times of economic uncertainty and market volatility such as we saw in 2011 – and are likely to see again in 2012.
Invesco can help you stay informed about your investments and market trends. On our website, invesco.com/us, we provide timely market updates and commentary from many of our fund managers and other investment professionals. Also on our website, you can obtain information about your account at any hour of the day or night. I invite you to visit and explore the tools and information we offer at invesco.com/us.
Our commitment to investment excellence
As we’ve seen over the last several years, market conditions can change – often suddenly and dramatically. That’s one reason financial advisers typically advise their clients to be well diversified and to maintain a long-term investment focus. While diversification can’t guarantee a profit or protect against loss, it may cushion the impact of dramatic market moves. Maintaining a long-term investment focus for your long-term goals – financing your retirement or your children’s education, for example – may help you avoid making rash investment decisions based on short-term market swings.
Likewise, Invesco’s investment professionals maintain a long-term focus. Across our broad array of investment products, investment excellence is our ultimate goal. Each of our funds is managed by specialized teams of investment professionals, and as a company, we maintain a single focus – investment management – that allows our fund managers to concentrate on doing what they do best: managing your money.
Our funds are managed strictly according to their stated investment objectives and strategies, with robust risk oversight using consistent, repeatable investment processes that don’t change in response to short-term market events. This disciplined approach can’t guarantee a profit; no investment can do that, since all involve some measure of risk. But it can ensure that your money is managed the way we said it would be – according to your Fund’s objective and strategies.
Our adherence to stated investment objectives and strategies allows your financial adviser to build a diversified portfolio that meets your individual risk tolerance and financial goals. It also means that when your goals change, your financial adviser will be able to find an Invesco fund that’s appropriate for your needs.
Questions?
If you have questions about your account, please contact one of our client service representatives at 800 959 4246. If you have a general Invesco-related question or comment for me, I invite you to email me directly at phil@invesco.com.
All of us at Invesco look forward to serving your investment management needs for many years to come. Thank you for investing with us.
Sincerely,
Philip Taylor
Senior Managing Director, Invesco Ltd.
2 Invesco Small Companies Fund

Bruce Crockett
Dear Fellow Shareholders:
Although the world’s economies are gradually recovering from the financial crisis, it has not been a smooth path. Unrest in the Middle East, persistently weak job and housing markets in the U.S. and continued government balance sheet repair in Europe are contributing to a slow, labored march toward global recovery.
In this environment, investors face risks that could make it more difficult to achieve their long-term financial goals – a secure retirement, home ownership, a child’s college education. Although the markets are complex and dynamic, there are ways to simplify the process and potentially increase your odds of achieving your goals. The best approach is to create a solid financial plan that helps you save and invest in ways that anticipate your needs over the long term.
Your financial adviser can help you define your financial plan, develop an appropriate investment strategy and put you in a better position to achieve your financial goals over the long term. This can take some of the guesswork out of the process and help you make thoughtful investments. Your financial adviser also can help you better understand your tolerance for risk, so that your investment approach lets you sleep at night while getting you closer to your goals. Lastly, your financial adviser can develop an asset allocation strategy that seeks to balance your investment approach, providing some protection against a decline in the markets while allowing you to participate in rising markets. Invesco calls this type of approach “intentional investing.” It means thinking carefully, planning thoughtfully and acting deliberately.
While no investment can guarantee favorable returns, your Board remains committed to managing costs and enhancing the performance of Invesco’s funds as part of our Investor First orientation. We continue to oversee the funds with the same strong sense of responsibility for your money and your continued trust that we’ve always maintained.
Thanks to the approval of our fund shareholders, Invesco has made great progress in realigning our U.S. mutual fund product line following our acquisition of Morgan Stanley’s retail asset management business, including Van Kampen Investments. When completed, the realignment will reduce overlap in the product lineup, enhance efficiency across our product line and build a solid foundation for further growth to meet client and shareholder needs. I would like to thank those of you who voted your proxy, and I hope our shareholders haven’t been too inconvenienced by the process.
As always, please contact me at bruce@brucecrockett.com with any questions or concerns you may have. On behalf of your Board, we look forward to continuing to represent your interests and serving your needs.
Sincerely,
Bruce L. Crockett
Independent Chair
Invesco Funds Board of Trustees
3 Invesco Small Companies Fund
Management’s Discussion of Fund Performance
Performance summary
For the 12 months ended October 31, 2011, all share classes of Invesco Small Companies Fund, at net asset value (NAV), outperformed the Fund’s broad market, style-specific and peer group indexes.
Drivers of performance were largely stock specific. We attribute the Fund’s out performance versus its indexes mainly to above-market returns from select investments in the information technology (IT) and health care sectors. Select holdings in the consumer discretionary and materials sectors were among the largest detractors from performance.
Your Fund’s long-term performance appears later in this report.
Fund vs. Indexes
Total returns, 10/31/10 to 10/31/11, at net asset value (NAV). Performance shown does not include applicable contingent deferred sales charges (CDSC) or front-end sales charges, which would have reduced performance.
| | | | | |
|
| Class A Shares | | | 22.39 | % |
| |
| Class B Shares | | | 21.45 | |
| |
| Class C Shares | | | 21.48 | |
| |
| Class R Shares | | | 22.04 | |
| |
| Class Y Shares | | | 22.70 | |
| |
| Institutional Class Shares | | | 22.87 | |
| |
S&P 500 Index▼(Broad Market Index) | | | 8.07 | |
| |
Russell 2000 Index▼(Style-Specific Index) | | | 6.71 | |
| |
Lipper Small-Cap Core Funds Index▼(Peer Group Index) | | | 7.85 | |
Source(s): ▼Lipper Inc. | | | | |
How we invest
We view ourselves as business people buying businesses, and we consider the purchase of a stock as an ownership interest in a business. We strive to develop a proprietary view of a business through in-depth, fundamental research that includes careful financial statement analysis and meetings with company management teams. We then seek to purchase businesses whose stock prices are below what we have calculated to be the true value of the companies based on their future cash flows, management performance and business fundamentals.
In conducting a comprehensive analysis of a company, we strive to identify primarily U.S. stocks which have:
| n | | Sustainable competitive advantages. |
| |
| n | | Strong growth prospects. |
| n | | High barriers to entry. |
| |
| n | | Honest and capable management teams. |
When considering stocks, we do so with an investment horizon of three to five years. We use this long-term approach because we believe good business strategies usually take that amount of time to implement and to potentially produce strong earnings growth. We also use a concentrated portfolio approach, constructing a portfolio of about 25 to 35 stocks. We believe this allows each investment opportunity to materially affect the Fund’s performance.
While deliberate efforts are made to reduce risk through industry diversification, our primary method of attempting to reduce risk is to purchase businesses that are trading below their estimated intrinsic value.
| | | Holdings are considered for sale if: |
| |
| n | | A more attractive investment opportunity exists. |
| |
| n | | Full value of the investment is deemed to have been realized. |
Holdings are also considered for sale if the original thesis for buying the company changes due to a fundamental negative change in management strategy or a fundamental negative change in the competitive environment.
Market conditions and your Fund
The fiscal year began with equity markets on an upward trend through the first quarter of 2011. Corporate fundamentals continued to advance as cost controls and improving revenues helped produce strong margins and earnings. However, in the latter half of the fiscal year, investor focus shifted from fundamentals to global macroeconomic concerns. Market volatility drastically increased due to civil unrest in Egypt and Libya and a devastating earthquake and tsunami in Japan. At the same time, the sovereign debt crisis intensified in the eurozone and growth in developed economies slowed, prompting fears of a global recession. Despite significant volatility, major equity indexes managed positive returns for the fiscal year.
Our investment approach focuses on individual businesses rather than market sectors. Therefore, your Fund shares little in common with sector weightings of various market indexes. However, if we were to broadly categorize businesses with which we had the most success during the fiscal year, our investments in select IT and health care stocks were among the largest contributors to Fund performance. Select holdings in the consumer discretionary and materials sectors were among the largest detractors. In addition, our cash position helped the Fund’s performance relative to the Russell 2000 Index in a volatile market environment.
Portfolio Composition
By sector
| | | | | |
|
| Information Technology | | | 27.2 | % |
| |
| Health Care | | | 13.0 | |
| |
| Consumer Discretionary | | | 12.3 | |
| |
| Materials | | | 7.4 | |
| |
| Utilities | | | 4.0 | |
| |
| Financials | | | 3.9 | |
| |
| Industrials | | | 2.0 | |
| |
Money Market Funds | | | | |
Plus Other Assets Less Liabilities | | | 30.2 | |
Top 10 Equity Holdings*
| | | | | | | | | |
|
| | 1. | | | International Rectifier Corp. | | | 7.3 | % |
| |
| | 2. | | | Solutia Inc. | | | 5.7 | |
| |
| | 3. | | | Brightpoint, Inc. | | | 5.2 | |
| |
| | 4. | | | Synaptics Inc. | | | 4.6 | |
| |
| | 5. | | | Alliance Data Systems Corp. | | | 4.4 | |
| |
| | 6. | | | Kinetic Concepts, Inc. | | | 4.1 | |
| |
| | 7. | | | Generac Holdings, Inc. | | | 4.0 | |
| |
| | 8. | | | John Wiley & Sons, Inc.-Class A | | | 4.0 | |
| |
| | 9. | | | Alere, Inc. | | | 4.0 | |
| |
| | 10. | | | FirstService Corp. | | | 3.6 | |
Top Five Industries
| | | | | | | | | |
|
| | 1. | | | Semiconductors | | | 8.6 | % |
| |
| | 2. | | | Data Processing & Outsourced Services | | | 7.6 | |
| |
| | 3. | | | Health Care Supplies | | | 5.9 | |
| |
| | 4. | | | Diversified Chemicals | | | 5.7 | |
| |
| | 5. | | | Technology Distributors | | | 5.2 | |
| | | | |
|
| Total Net Assets | | $798.6 million |
| | | | | |
| Total Number of Holdings* | | | 29 | |
The Fund’s holdings are subject to change, and there is no assurance that the Fund will continue to hold any particular security.
*Excluding money market fund holdings.
4 Invesco Small Companies Fund
Health care company Kinetic Concepts was the largest contributor to Fund results during the fiscal year. Kinetic Concepts is a global leader in “negative pressure wound therapy” that helps heal wounds faster than if they were treated with gauze dressings. A significant segment of the company is its regenerative tissue business; Kinetic Concepts has an industry-leading product in this segment that we believe has great potential to increase its sales in Europe and around the world. Overall, we believe the company has innovative technologies, superior distribution and a highly efficient billing system. Shares of the company appreciated during most of the reporting period, especially after it received a takeover offer from a private equity firm in mid-July.
Another top contributor to Fund performance was IT company Brightpoint. Brightpoint’s principal activity is distributing wireless devices and accessories, as well as providing logistics services to the wireless industry. Smart phones, which generally require more handling and logistics, represent approximately 25% of the cell phone market.1 This segment is expected to grow significantly over the next five years, positioning Brightpoint to potentially benefit as the company’s addressable market increases.
Brightpoint’s share price appreciated toward the end of the reporting period after the company reported operating results that beat analysts’ expectations due to increased demand for smart phones, that have higher margins.
Among the largest detractors from Fund performance during the fiscal year were NutriSystem and Solutia.
NutriSystem is the second-largest weight-loss company in North America. The company provides a comprehensive weight management program that consists of support for dieters and pre-packaged food. The strength of the business is its direct-to-consumer business model and strong brand. Shares of the company declined during the reporting period after management provided weak guidance for the first quarter of 2011, citing among other factors, weak consumer spending. The first quarter of the year is the most important quarter for the diet business, since companies often attract many new clients at the start of the year. At the end of the reporting period, the company had net cash on its balance sheet and its valuation remained attractive.
Solutia is a specialty chemicals producer with the number-one or number-two positions in segments that account
for the majority of its revenues. The company’s two main products are specialty films and insoluble sulfur. Its specialty films are used in products ranging from autos to e-readers; its insoluble sulfur business has a leading market share in the global tire industry. Shares of the company fell after Solutia announced lower forward earnings guidance that was largely the result of a slowdown in the automotive industry. We believe the market still perceives Solutia as the debt-laden business it was prior to its bankruptcy several years ago; we disagree with that perception. Solutia emerged from bankruptcy after selling its commodity businesses. It used the proceeds to pay down debt and reinvest in the company’s highly differentiated operations with global leadership positions. As of the close of the reporting period , the company’s shares traded at just seven times forward consensus earnings, and Solutia’s internal goal is to more than double the company’s earnings over the next five years.
Increased market volatility during the fiscal year presented some select buying opportunities. We took advantage of this market situation by making some new investments and adding to some of our existing holdings. We also sold several holdings based mainly on valuations. Several of the Fund’s holdings also were acquired during the period.
During the fiscal year, we continued to focus on finding quality businesses trading at attractive values relative to what we believe are their long-term prospects. In contrast, the market is often driven by short-term events or outlooks in both good times and bad. Market volatility during the reporting period allowed us to take advantage of investment opportunities we believe may benefit your Fund in the long term. Given this volatility, we would like to caution investors against making investment decisions based on short-term performance.
While we can never predict future Fund performance, we pledge to you that we will adhere to our discipline of being business people who buy businesses – and we will continually strive to upgrade the quality of your Fund’s portfolio.
As always, we thank you for your investment in Invesco Small Companies Fund and for sharing our long-term investment perspective.
1 Source: HIS iSuppli
The views and opinions expressed in management’s discussion of Fund performance are those of Invesco Advisers, Inc. These views and opinions are subject to change at any time based on factors such as market and economic conditions. These views and opinions may not be relied upon as investment advice or recommendations, or as an offer for a particular security. The information is not a complete analysis of every aspect of any market, country, industry, security or the Fund. Statements of fact are from sources considered reliable, but Invesco Advisers, Inc. makes no representation or warranty as to their completeness or accuracy. Although historical performance is no guarantee of future results, these insights may help you understand our investment management philosophy.
See important Fund and, if applicable, index disclosures later in this report.
Robert Mikalachki
Chartered Financial Analyst, portfolio manager, is lead manager of Invesco Small Companies Fund. He joined Invesco in 1999. Mr. Mikalachki earned an undergraduate degree in business at Wilfrid Laurier University.
Virginia Au
Chartered Financial Analyst, portfolio manager, is manager of Invesco Small Companies Fund. She joined Invesco in 2006. Ms. Au earned a bachelor of commerce degree in finance from the University of British Columbia.
Jason Whiting
Chartered Financial Analyst, portfolio manager, is manager of Invesco Small Companies Fund. He joined Invesco in 2003. Mr. Whiting earned a B.B.A. with honors from Wilfrid Laurier University.
5 Invesco Small Companies Fund
Your Fund’s Long-Term Performance
Results of a $10,000 Investment – Oldest Share Classes since Inception
Index data from 10/31/03, Fund data from 11/4/03
Past performance cannot guarantee comparable future results.
The data shown in the chart include reinvested distributions, applicable sales charges and Fund expenses including management fees. Results for Class B shares are calculated as if a hypothetical shareholder had liquidated his entire investment in the Fund at the close of the reporting period and paid the contingent deferred sales charges, if applicable. Index results include reinvested dividends, but they do not reflect sales
charges. Performance of the peer group, if applicable, reflects fund expenses and management fees; performance of a market index does not. Performance shown in the chart and table(s) does not reflect deduction of taxes a shareholder would pay on Fund distributions or sale of Fund shares.
This chart, which is a logarithmic chart, presents the fluctuations in the value of the Fund and its indexes. We believe that a logarithmic chart is more effective than other types of charts in illustrating
changes in value during the early years shown in the chart. The vertical axis, the one that indicates the dollar value of an investment, is constructed with each segment representing a percent change in the value of the investment. In this chart, each segment represents a doubling, or 100% change, in the value of the investment. In other words, the space between $5,000 and $10,000 is the same size as the space between $10,000 and $20,000, and so on.
6 Invesco Small Companies Fund
Average Annual Total Returns
As of 10/31/11, including maximum applicable
sales charges
| | | | | | | | | |
|
| Class A Shares | | | | |
| |
| Inception (11/4/03) | | | 9.89 | % |
| |
| | 5 | | | Years | | | 5.26 | |
| |
| | 1 | | | Year | | | 15.67 | |
| |
| Class B Shares | | | | |
| |
| Inception (11/4/03) | | | 9.87 | % |
| |
| | 5 | | | Years | | | 5.34 | |
| |
| | 1 | | | Year | | | 16.45 | |
| |
| Class C Shares | | | | |
| |
| Inception (11/4/03) | | | 9.86 | % |
| |
| | 5 | | | Years | | | 5.66 | |
| |
| | 1 | | | Year | | | 20.48 | |
| |
| Class R Shares | | | | |
| |
| Inception | | | 10.41 | % |
| |
| | 5 | | | Years | | | 6.20 | |
| |
| | 1 | | | Year | | | 22.04 | |
| |
| Class Y Shares | | | | |
| |
| Inception | | | 10.76 | % |
| |
| | 5 | | | Years | | | 6.61 | |
| |
| | 1 | | | Year | | | 22.70 | |
| |
| Institutional Class Shares | | | | |
| |
| Inception | | | 11.15 | % |
| |
| | 5 | | | Years | | | 6.95 | |
| |
| | 1 | | | Year | | | 22.87 | |
Class R shares incepted on April 30, 2004. Performance shown prior to that date is that of Class A shares, restated to reflect the higher 12b-1 fees applicable to Class R shares. Class A share performance reflects any applicable fee waivers or expense reimbursements.
Class Y shares incepted on October 3, 2008. Performance shown prior to that date is that of Class A shares and includes the 12b-1 fees applicable to Class A shares. Class A share performance reflects any applicable fee waivers or expense reimbursements.
Institutional Class shares incepted on April 30, 2004. Performance shown prior to that date is that of Class A shares and includes the 12b-1 fees applicable to Class A shares. Class A share performance reflects any applicable fee waivers or expense reimbursements.
The performance data quoted represent past performance and cannot guarantee comparable future results; current performance may be lower or higher. Please visit invesco.com/performance for the most recent month-end performance.
Average Annual Total Returns
As of 9/30/11, the most recent calendar quarter-end, including maximum applicable sales charges
| | | | | | | | | |
|
| Class A Shares | | | | |
| |
| Inception (11/4/03) | | | 8.40 | % |
| |
| | 5 | | | Years | | | 3.83 | |
| |
| | 1 | | | Year | | | 8.26 | |
| |
| Class B Shares | | | | |
| |
| Inception (11/4/03) | | | 8.40 | % |
| |
| | 5 | | | Years | | | 3.88 | |
| |
| | 1 | | | Year | | | 8.64 | |
| |
| Class C Shares | | | | |
| |
| Inception (11/4/03) | | | 8.39 | % |
| |
| | 5 | | | Years | | | 4.22 | |
| |
| | 1 | | | Year | | | 12.73 | |
| |
| Class R Shares | | | | |
| |
| Inception | | | 8.93 | % |
| |
| | 5 | | | Years | | | 4.75 | |
| |
| | 1 | | | Year | | | 14.22 | |
| |
| Class Y Shares | | | | |
| |
| Inception | | | 9.27 | % |
| |
| | 5 | | | Years | | | 5.15 | |
| |
| | 1 | | | Year | | | 14.84 | |
| |
| Institutional Class Shares | | | | |
| |
| Inception | | | 9.65 | % |
| |
| | 5 | | | Years | | | 5.49 | |
| |
| | 1 | | | Year | | | 15.01 | |
Performance figures reflect reinvested distributions, changes in net asset value and the effect of the maximum sales charge unless otherwise stated. Investment return and principal value will fluctuate so that you may have a gain or loss when you sell shares.
The total annual Fund operating expense ratio set forth in the most recent Fund prospectus as of the date of this report for Class A, Class B, Class C, Class R, Class Y and Institutional Class shares was 1.33%, 2.08%, 2.08%, 1.58%, 1.08% and 0.88%, respectively. The expense ratios presented above may vary from the expense ratios presented in other sections of this report that are based on expenses incurred during the period covered by this report.
Class A share performance reflects the maximum 5.50% sales charge, and Class B and Class C share performance reflects the applicable contingent deferred sales charge (CDSC) for the period involved. The CDSC on Class B shares declines from 5% beginning at the time of purchase to 0% at the beginning of the seventh year. The
CDSC on Class C shares is 1% for the first year after purchase. Class R, Class Y and Institutional Class shares do not have a front-end sales charge or a CDSC; therefore, performance is at net asset value.
The performance of the Fund’s share classes will differ primarily due to different sales charge structures and class expenses.
7 Invesco Small Companies Fund
Invesco Small Companies Fund’s investment objective is long-term growth of capital.
| n | | Unless otherwise stated, information presented in this report is as of October 31, 2011, and is based on total net assets. |
| |
| n | | Unless otherwise noted, all data provided by Invesco. |
| |
| n | | To access your Fund’s reports/prospectus, visit invesco.com/fundreports. |
About share classes
| n | | Class B shares may not be purchased or acquired by exchange from share classes other than Class B shares. Please see the prospectus for more information. |
| |
| n | | Class R shares are available only to certain retirement plans. Please see the prospectus for more information. |
| |
| n | | Class Y shares are available to only certain investors. Please see the prospectus for more information. |
| |
| n | | Institutional Class shares are offered exclusively to institutional investors, including defined contribution plans that meet certain criteria. Please see the prospectus for more information. |
Principal risks of investing in the Fund
| n | | Debt securities risk. The Fund may invest in debt securities that are affected by changing interest rates and changes in their effective maturities and credit quality. |
| |
| n | | Foreign securities risk. The Fund’s foreign investments may be affected by changes in a foreign country’s exchange rates; political and social instability; changes in economic or taxation policies; difficulties when enforcing obligations; decreased liquidity; and increased volatility. Foreign companies may be subject to less regulation resulting in less publicly available information about the companies. |
| |
| n | | Management risk. The investment techniques and risk analysis used by the Fund’s portfolio managers may not produce the desired results. |
| |
| n | | Market risk. The prices of and the income generated by the Fund’s securities may decline in response to, among other things, investor sentiment; general economic and market conditions; regional or global instability; and currency and interest rate fluctuations. |
| |
| n | | Small- and mid-capitalization risk. Stocks of small and mid-sized companies tend to be more vulnerable to |
| | | adverse developments in the above factors and may have little or no operating history or track record of success, and limited product lines, markets, management and financial resources. The securities of small and mid-sized companies may be more volatile due to less market interest and less publicly available information about the issuer. They also may be illiquid or restricted as to resale, or may trade less frequently and in smaller volumes, all of which may cause difficulty when establishing or closing a position at a desirable price. |
| |
| n | | U.S. government obligations risk. Obligations issued by U.S. government agencies and instrumentalities may receive varying levels of support from the government, which could affect the Fund’s ability to recover should they default. |
About indexes used in this report
| n | | The S&P 500® Index is an unmanaged index considered representative of the U.S. stock market. |
| |
| n | | The Russell 2000® Index is an unmanaged index considered representative of small-cap stocks. The Russell 2000 Index is a trademark/service mark of the Frank Russell Co. Russell® is a trademark of the Frank Russell Co. |
| |
| n | | The Lipper Small-Cap Core Funds Index is an unmanaged index considered representative of small-cap core funds tracked by Lipper. |
| |
| n | | The Fund is not managed to track the performance of any particular index, including the index(es) defined here, and consequently, the performance of the Fund may deviate significantly from the performance of the index(es). |
| |
| n | | A direct investment cannot be made in an index. Unless otherwise indicated, index results include reinvested dividends, and they do not reflect sales charges. Performance of the peer group, if applicable, reflects fund expenses; performance of a market index does not. |
Other information
| n | | The Chartered Financial Analyst® (CFA®) designation is globally recognized and attests to a charterholder’s success in a rigorous and comprehensive study program in the field of investment management and research analysis. |
| |
| n | | The returns shown in management’s discussion of Fund performance are based on net asset values calculated for shareholder transactions. Generally accepted accounting principles require adjustments to be made to the net assets of the Fund at period end for financial reporting purposes, and as such, the net asset values for shareholder transactions and the returns based on those net asset values may differ from the net asset values and returns reported in the Financial Highlights. |
| |
| n | | Industry classifications used in this report are generally according to the Global Industry Classification Standard, which was developed by and is the exclusive property and a service mark of MSCI Inc. and Standard & Poor’s. |
This report must be accompanied or preceded by a currently effective Fund prospectus, which contains more complete information, including sales charges and expenses. Investors should read it carefully before investing.
NOT FDIC INSURED | MAY LOSE VALUE | NO BANK GUARANTEE
Fund Nasdaq Symbols
| | | | |
|
| Class A Shares | | ATIAX |
| Class B Shares | | ATIBX |
| Class C Shares | | ATICX |
| Class R Shares | | ATIRX |
| Class Y Shares | | ATIYX |
| Institutional Class Shares | | ATIIX |
8 Invesco Small Companies Fund
Schedule of Investments(a)
October 31, 2011
| | | | | | | | | |
| | | Shares | | Value |
| |
Common Stocks & Other Equity Interests–68.79%
|
Advertising–1.61%
| | | | |
| Arbitron Inc. | | | 322,819 | | | $ | 12,825,599 | |
| |
Aluminum–0.02%
| | | | |
Cymat Technologies Ltd. (Canada)(b) | | | 2,497,500 | | | | 125,163 | |
| |
Apparel Retail–0.48%
| | | | |
Collective Brands, Inc.(b) | | | 259,600 | | | | 3,792,756 | |
| |
Apparel, Accessories & Luxury Goods–0.21%
| | | | |
Hampshire Group, Ltd.(b)(c) | | | 592,824 | | | | 1,689,548 | |
| |
Automotive Retail–2.27%
| | | | |
Lithia Motors, Inc.–Class A(c) | | | 882,369 | | | | 18,150,330 | |
| |
Biotechnology–0.74%
| | | | |
Grifols S.A.–ADR (Spain)(b) | | | 924,890 | | | | 5,928,545 | |
| |
Commodity Chemicals–1.74%
| | | | |
Chemtrade Logistics Income Fund (Canada)(c) | | | 1,045,784 | | | | 13,899,064 | |
| |
Computer Storage & Peripherals–4.56%
| | | | |
Synaptics Inc.(b) | | | 1,077,848 | | | | 36,420,484 | |
| |
Data Processing & Outsourced Services–7.64%
| | | | |
Alliance Data Systems Corp.(b) | | | 342,354 | | | | 35,070,744 | |
| |
| Lender Processing Services, Inc. | | | 1,478,877 | | | | 25,954,291 | |
| |
| | | | | | | | 61,025,035 | |
| |
Diversified Chemicals–5.66%
| | | | |
Solutia Inc.(b) | | | 2,780,248 | | | | 45,179,030 | |
| |
Electric Utilities–3.99%
| | | | |
Generac Holdings, Inc.(b) | | | 1,394,958 | | | | 31,888,740 | |
| |
Health Care Equipment–4.08%
| | | | |
Kinetic Concepts, Inc.(b) | | | 476,892 | | | | 32,614,644 | |
| |
Health Care Supplies–5.91%
| | | | |
Alere, Inc.(b) | | | 1,212,693 | | | | 31,602,780 | |
| |
| Cooper Cos., Inc. (The) | | | 224,883 | | | | 15,584,392 | |
| |
| | | | | | | | 47,187,172 | |
| |
Internet Retail–1.32%
| | | | |
| Nutrisystem, Inc. | | | 852,502 | | | | 10,536,925 | |
| |
IT Consulting & Other Services–1.25%
| | | | |
NCI, Inc.–Class A(b)(c) | | | 728,285 | | | | 9,941,090 | |
| |
Leisure Products–1.62%
| | | | |
MEGA Brands Inc. (Canada)(b)(c) | | | 1,246,438 | | | | 10,806,540 | |
| |
MEGA Brands Inc.–Wts. Expiring 03/30/15 (Canada)(b) | | | 12,488,000 | | | | 2,127,854 | |
| |
| | | | | | | | 12,934,394 | |
| |
Life Sciences Tools & Services–2.27%
| | | | |
Charles River Laboratories International, Inc.(b) | | | 561,088 | | | | 18,111,921 | |
| |
Oil & Gas Exploration & Production–0.00%
| | | | |
Brompton Corp. (Canada)(b) | | | 69,374 | | | | 0 | |
| |
Publishing–3.98%
| | | | |
| John Wiley & Sons, Inc.–Class A | | | 669,074 | | | | 31,821,159 | |
| |
Real Estate Services–3.62%
| | | | |
FirstService Corp. (Canada)(b) | | | 1,034,409 | | | | 28,874,703 | |
| |
Semiconductors–8.64%
| | | | |
Advanced Analogic Technologies, Inc.(b)(c) | | | 2,454,000 | | | | 10,699,440 | |
| |
International Rectifier Corp.(b) | | | 2,401,190 | | | | 58,324,905 | |
| |
| | | | | | | | 69,024,345 | |
| |
Technology Distributors–5.15%
| | | | |
Brightpoint, Inc.(b)(c) | | | 4,053,096 | | | | 41,138,924 | |
| |
Trucking–2.03%
| | | | |
| Con-way Inc. | | | 550,873 | | | | 16,234,227 | |
| |
| Total Common Stocks & Other Equity Interests (Cost $513,586,858) | | | | | | | 549,343,798 | |
| |
| | | | | | | | | |
| | | Principal
| | |
| | | Amount | | |
Non-U.S. Dollar Denominated Bonds & Notes–0.83%
|
Canada–0.83%
| | | | |
MEGA Brands Inc.–Class A, Sr. Sec. Gtd. Deb., 10.00%, 03/31/15(d) (Cost $6,082,213) | | CAD | 6,244,000 | | | | 6,602,606 | |
| |
| | | | | | | | | |
| | | Shares | | |
Preferred Stocks–0.24%
|
Real Estate Services–0.24%
| | | | |
| FirstService Corp.(Canada), Series 1, 7.00% Pfd. (Cost $1,880,000) | | | 75,200 | | | | 1,898,800 | |
| |
| | | | | | | | | |
| | | | | | | | | |
See accompanying Notes to Financial Statements which are an integral part of the financial statements.
9 Invesco Small Companies Fund
| | | | | | | | | |
| | | Shares | | Value |
| |
Money Market Funds–28.95%
|
Liquid Assets Portfolio–Institutional Class(e) | | | 115,621,350 | | | $ | 115,621,350 | |
| |
Premier Portfolio–Institutional Class(e) | | | 115,621,349 | | | | 115,621,349 | |
| |
| Total Money Market Funds (Cost $231,242,699) | | | | | | | 231,242,699 | |
| |
| TOTAL INVESTMENTS–98.81% (Cost $752,791,770) | | | | | | | 789,087,903 | |
| |
| OTHER ASSETS LESS LIABILITIES–1.19% | | | | | | | 9,524,453 | |
| |
| NET ASSETS–100.00% | | | | | | $ | 798,612,356 | |
| |
Investment Abbreviations:
| | | |
| ADR | | – American Depositary Receipt |
| CAD | | – Canadian Dollar |
| Deb. | | – Debentures |
| Gtd. | | – Guaranteed |
| Pfd. | | – Preferred |
| Sec. | | – Secured |
| Sr. | | – Senior |
| Wts. | | – Warrants |
Notes to Schedule of Investments:
| | |
| (a) | | Industry and/or sector classifications used in this report are generally according to the Global Industry Classification Standard, which was developed by and is the exclusive property and a service mark of MSCI Inc. and Standard & Poor’s. |
| (b) | | Non-income producing security. |
| (c) | | Affiliated company during the period. The Investment Company Act of 1940 defines affiliates as those companies in which a fund holds 5% or more of the outstanding voting securities. The Fund has not owned enough of the outstanding voting securities of the issuer to have control (as defined in the Investment Company Act of 1940) of that issuer. The aggregate value of these securities as of October 31, 2011 was $106,324,936, which represented 13.31% of the Fund’s Net Assets. See Note 4. |
| (d) | | Foreign denominated security. Principal amount is denominated in currency indicated. |
| (e) | | The money market fund and the Fund are affiliated by having the same investment adviser. |
See accompanying Notes to Financial Statements which are an integral part of the financial statements.
10 Invesco Small Companies Fund
Statement of Assets and Liabilities
October 31, 2011
| | | | | |
Assets:
|
| Investments, at value (Cost $398,875,370) | | $ | 483,569,662 | |
| |
| Investments in affiliates, at value (Cost $353,916,400) | | | 305,518,241 | |
| |
| Total investments, at value (Cost $752,791,770) | | | 789,087,903 | |
| |
| Foreign currencies, at value (Cost $95,301) | | | 94,840 | |
| |
| Receivable for: | | | | |
| Fund shares sold | | | 13,736,525 | |
| |
| Dividends and interest | | | 317,811 | |
| |
| Investment for trustee deferred compensation and retirement plans | | | 18,272 | |
| |
| Other assets | | | 38,285 | |
| |
| Total assets | | | 803,293,636 | |
| |
Liabilities:
|
| Payable for: | | | | |
| Investments purchased | | | 2,820,705 | |
| |
| Fund shares reacquired | | | 1,223,315 | |
| |
| Accrued fees to affiliates | | | 506,782 | |
| |
| Accrued other operating expenses | | | 74,954 | |
| |
| Trustee deferred compensation and retirement plans | | | 55,524 | |
| |
| Total liabilities | | | 4,681,280 | |
| |
| Net assets applicable to shares outstanding | | $ | 798,612,356 | |
| |
Net assets consist of:
|
| Shares of beneficial interest | | $ | 795,741,192 | |
| |
| Undistributed net investment income (loss) | | | (53,208 | ) |
| |
| Undistributed net realized gain (loss) | | | (33,369,713 | ) |
| |
| Unrealized appreciation | | | 36,294,085 | |
| |
| | | $ | 798,612,356 | |
| |
Net Assets:
|
| Class A | | $ | 485,608,916 | |
| |
| Class B | | $ | 15,478,313 | |
| |
| Class C | | $ | 123,286,267 | |
| |
| Class R | | $ | 62,111,516 | |
| |
| Class Y | | $ | 41,475,803 | |
| |
| Institutional Class | | $ | 70,651,541 | |
| |
Shares outstanding, $0.01 par value per share, with an unlimited number of shares authorized:
|
| Class A | | | 25,601,529 | |
| |
| Class B | | | 862,311 | |
| |
| Class C | | | 6,875,711 | |
| |
| Class R | | | 3,327,960 | |
| |
| Class Y | | | 2,179,214 | |
| |
| Institutional Class | | | 3,633,102 | |
| |
| Class A: | | | | |
| Net asset value per share | | $ | 18.97 | |
| |
| Maximum offering price per share | | | | |
| (Net asset value of $18.97 divided by 94.50%) | | $ | 20.07 | |
| |
| Class B: | | | | |
| Net asset value and offering price per share | | $ | 17.95 | |
| |
| Class C: | | | | |
| Net asset value and offering price per share | | $ | 17.93 | |
| |
| Class R: | | | | |
| Net asset value and offering price per share | | $ | 18.66 | |
| |
| Class Y: | | | | |
| Net asset value and offering price per share | | $ | 19.03 | |
| |
| Institutional Class: | | | | |
| Net asset value and offering price per share | | $ | 19.45 | |
| |
See accompanying Notes to Financial Statements which are an integral part of the financial statements.
11 Invesco Small Companies Fund
Statement of Operations
For the year ended October 31, 2011
| | | | | |
Investment income:
|
| Dividends (net of foreign withholding taxes of $323,628) | | $ | 1,473,962 | |
| |
| Dividends from affiliates | | | 1,517,719 | |
| |
| Interest | | | 633,328 | |
| |
| Total investment income | | | 3,625,009 | |
| |
Expenses:
|
| Advisory fees | | | 4,427,294 | |
| |
| Administrative services fees | | | 188,798 | |
| |
| Custodian fees | | | 30,829 | |
| |
| Distribution fees: | | | | |
| Class A | | | 901,762 | |
| |
| Class B | | | 154,862 | |
| |
| Class C | | | 1,068,219 | |
| |
| Class R | | | 259,155 | |
| |
| Transfer agent fees — A, B, C, R and Y | | | 1,156,089 | |
| |
| Transfer agent fees — Institutional | | | 20,620 | |
| |
| Trustees’ and officers’ fees and benefits | | | 31,941 | |
| |
| Other | | | 234,266 | |
| |
| Total expenses | | | 8,473,835 | |
| |
| Less: Fees waived, expenses reimbursed and expense offset arrangement(s) | | | (175,993 | ) |
| |
| Net expenses | | | 8,297,842 | |
| |
| Net investment income (loss) | | | (4,672,833 | ) |
| |
Realized and unrealized gain from:
|
| Net realized gain from: | | | | |
| Investment securities | | | 46,795,209 | |
| |
| Foreign currencies | | | 108,784 | |
| |
| | | | 46,903,993 | |
| |
| Change in net unrealized appreciation (depreciation) of: | | | | |
| Investment securities | | | 64,391,604 | |
| |
| Foreign currencies | | | (5,830 | ) |
| |
| | | | 64,385,774 | |
| |
| Net realized and unrealized gain | | | 111,289,767 | |
| |
| Net increase in net assets resulting from operations | | $ | 106,616,934 | |
| |
See accompanying Notes to Financial Statements which are an integral part of the financial statements.
12 Invesco Small Companies Fund
Statement of Changes in Net Assets
For the years ended October 31, 2011 and 2010
| | | | | | | | | |
| | | 2011 | | 2010 |
| |
Operations:
|
| Net investment income (loss) | | $ | (4,672,833 | ) | | $ | (1,312,019 | ) |
| |
| Net realized gain | | | 46,903,993 | | | | 13,351,774 | |
| |
| Change in net unrealized appreciation | | | 64,385,774 | | | | 86,592,538 | |
| |
| Net increase in net assets resulting from operations | | | 106,616,934 | | | | 98,632,293 | |
| |
Distributions to shareholders from net investment income:
|
| Class A | | | — | | | | (130,070 | ) |
| |
| Class R | | | — | | | | (3,596 | ) |
| |
| Class Y | | | — | | | | (7,454 | ) |
| |
| Institutional Class | | | — | | | | (61,833 | ) |
| |
| Total distributions from net investment income | | | — | | | | (202,953 | ) |
| |
Share transactions–net:
|
| Class A | | | 143,911,524 | | | | 10,030,208 | |
| |
| Class B | | | (1,434,017 | ) | | | (2,326,899 | ) |
| |
| Class C | | | 17,633,640 | | | | 4,529,339 | |
| |
| Class R | | | 21,849,983 | | | | 9,331,855 | |
| |
| Class Y | | | 26,131,930 | | | | 3,695,997 | |
| |
| Institutional Class | | | 33,079,310 | | | | (27,127,108 | ) |
| |
| Net increase (decrease) in net assets resulting from share transactions | | | 241,172,370 | | | | (1,866,608 | ) |
| |
| Net increase in net assets | | | 347,789,304 | | | | 96,562,732 | |
| |
Net assets:
|
| Beginning of year | | | 450,823,052 | | | | 354,260,320 | |
| |
| End of year (includes undistributed net investment income (loss) of $(53,208) and $(43,009), respectively) | | $ | 798,612,356 | | | $ | 450,823,052 | |
| |
Notes to Financial Statements
October 31, 2011
NOTE 1—Significant Accounting Policies
Invesco Small Companies Fund (the “Fund”) is a series portfolio of AIM Investment Funds (Invesco Investment Funds) (the “Trust”). The Trust is organized as a Delaware statutory trust and is registered under the Investment Company Act of 1940, as amended (the “1940 Act”), as an open-end series management investment company consisting of thirteen separate series portfolios, each authorized to issue an unlimited number of shares of beneficial interest. The assets, liabilities and operations of each portfolio are accounted for separately. Information presented in these financial statements pertains only to the Fund. Matters affecting each portfolio or class will be voted on exclusively by the shareholders of such portfolio or class.
The Fund’s investment objective is long-term growth of capital.
The Fund currently consists of six different classes of shares: Class A, Class B, Class C, Class R, Class Y and Institutional Class. Class A shares are sold with a front-end sales charge unless certain waiver criteria are met and under certain circumstances load waived shares may be subject to contingent deferred sales charges (“CDSC”). Class C shares are sold with a CDSC. Class R, Class Y and Institutional Class shares are sold at net asset value. Effective November 30, 2010, new or additional investments in Class B shares are no longer permitted. Existing shareholders of Class B shares may continue to reinvest dividends and capital gains distributions in Class B shares until they convert. Also, shareholders in Class B shares will be able to exchange those shares for Class B shares of other Invesco Funds offering such shares until they convert. Generally, Class B shares will automatically convert to Class A shares on or about the month-end which is at least eight years after the date of purchase. Redemption of Class B shares prior to conversion date will be subject to a CDSC.
The following is a summary of the significant accounting policies followed by the Fund in the preparation of its financial statements.
| | |
| A. | | Security Valuations — Securities, including restricted securities, are valued according to the following policy. |
| | A security listed or traded on an exchange (except convertible bonds) is valued at its last sales price or official closing price as of the close of the customary trading session on the exchange where the security is principally traded, or lacking any sales or official closing price on a particular day, the security may be valued at the closing bid price on that day. Securities traded in the over-the-counter market are valued based on prices furnished by |
13 Invesco Small Companies Fund
| | |
| | independent pricing services or market makers. When such securities are valued by an independent pricing service they may be considered fair valued. Futures contracts are valued at the final settlement price set by an exchange on which they are principally traded. Listed options are valued at the mean between the last bid and ask prices from the exchange on which they are principally traded. Options not listed on an exchange are valued by an independent source at the mean between the last bid and ask prices. For purposes of determining net asset value per share, futures and option contracts generally are valued 15 minutes after the close of the customary trading session of the New York Stock Exchange (“NYSE”). |
| | Investments in open-end and closed-end registered investment companies that do not trade on an exchange are valued at the end of day net asset value per share. Investments in open-end and closed-end registered investment companies that trade on an exchange are valued at the last sales price or official closing price as of the close of the customary trading session on the exchange where the security is principally traded. |
| | Debt obligations (including convertible bonds) and unlisted equities are fair valued using an evaluated quote provided by an independent pricing service. Evaluated quotes provided by the pricing service may be determined without exclusive reliance on quoted prices, and may reflect appropriate factors such as institution-size trading in similar groups of securities, developments related to specific securities, dividend rate, yield, quality, type of issue, coupon rate, maturity, individual trading characteristics and other market data. Debt securities are subject to interest rate and credit risks. In addition, all debt securities involve some risk of default with respect to interest and/or principal payments. |
| | Foreign securities (including foreign exchange contracts) are converted into U.S. dollar amounts using the applicable exchange rates as of the close of the NYSE. If market quotations are available and reliable for foreign exchange traded equity securities, the securities will be valued at the market quotations. Because trading hours for certain foreign securities end before the close of the NYSE, closing market quotations may become unreliable. If between the time trading ends on a particular security and the close of the customary trading session on the NYSE, events occur that are significant and make the closing price unreliable, the Fund may fair value the security. If the event is likely to have affected the closing price of the security, the security will be valued at fair value in good faith using procedures approved by the Board of Trustees. Adjustments to closing prices to reflect fair value may also be based on a screening process of an independent pricing service to indicate the degree of certainty, based on historical data, that the closing price in the principal market where a foreign security trade is not the current value as of the close of the NYSE. Foreign securities meeting the approved degree of certainty that the price is not reflective of current value will be priced at the indication of fair value from the independent pricing service. Multiple factors may be considered by the independent pricing service in determining adjustments to reflect fair value and may include information relating to sector indices, American Depositary Receipts and domestic and foreign index futures. Foreign securities may have additional risks including exchange rate changes, potential for sharply devalued currencies and high inflation, political and economical upheaval, the relative lack of issuer information, relatively low market liquidity and the potential lack of strict financial and accounting controls and standards. |
| | Securities for which market prices are not provided by any of the above methods may be valued based upon quotes furnished by independent sources. The last bid price may be used to value equity securities. The mean between the last bid and asked prices is used to value debt obligations, including Corporate Loans. |
| | Securities for which market quotations are not readily available or are unreliable are valued at fair value as determined in good faith by or under the supervision of the Trust’s officers following procedures approved by the Board of Trustees. Issuer specific events, market trends, bid/ask quotes of brokers and information providers and other market data may be reviewed in the course of making a good faith determination of a security’s fair value. |
| | Valuations change in response to many factors including the historical and prospective earnings of the issuer, the value of the issuer’s assets, general economic conditions, interest rates, investor perceptions and market liquidity. Because of the inherent uncertainties of valuation, the values reflected in the financial statements may materially differ from the value received upon actual sale of those investments. |
| B. | | Securities Transactions and Investment Income — Securities transactions are accounted for on a trade date basis. Realized gains or losses on sales are computed on the basis of specific identification of the securities sold. Interest income is recorded on the accrual basis from settlement date. Dividend income (net of withholding tax, if any) is recorded on the ex-dividend date. Bond premiums and discounts are amortized and/or accreted for financial reporting purposes. |
| | The Fund may periodically participate in litigation related to Fund investments. As such, the Fund may receive proceeds from litigation settlements. Any proceeds received are included in the Statement of Operations as realized gain (loss) for investments no longer held and as unrealized gain (loss) for investments still held. |
| | Brokerage commissions and mark ups are considered transaction costs and are recorded as an increase to the cost basis of securities purchased and/or a reduction of proceeds on a sale of securities. Such transaction costs are included in the determination of net realized and unrealized gain (loss) from investment securities reported in the Statement of Operations and the Statement of Changes in Net Assets and the net realized and unrealized gains (losses) on securities per share in the Financial Highlights. Transaction costs are included in the calculation of the Fund’s net asset value and, accordingly, they reduce the Fund’s total returns. These transaction costs are not considered operating expenses and are not reflected in net investment income reported in the Statement of Operations and Statement of Changes in Net Assets, or the net investment income per share and ratios of expenses and net investment income reported in the Financial Highlights, nor are they limited by any expense limitation arrangements between the Fund and the investment adviser. |
| | The Fund allocates income and realized and unrealized capital gains and losses to a class based on the relative net assets of each class. |
| C. | | Country Determination — For the purposes of making investment selection decisions and presentation in the Schedule of Investments, the investment adviser may determine the country in which an issuer is located and/or credit risk exposure based on various factors. These factors include the laws of the country under which the issuer is organized, where the issuer maintains a principal office, the country in which the issuer derives 50% or more of its total revenues and the country that has the primary market for the issuer’s securities, as well as other criteria. Among the other criteria that may be evaluated for making this determination are the country in which the issuer maintains 50% or more of its assets, the type of security, financial guarantees and enhancements, the nature of the collateral and the sponsor organization. Country of issuer and/or credit risk exposure has been determined to be the United States of America, unless otherwise noted. |
| D. | | Distributions — Distributions from income and net realized capital gain, if any, are generally paid annually and recorded on ex-dividend date. The Fund may elect to treat a portion of the proceeds from redemptions as distributions for federal income tax purposes. |
14 Invesco Small Companies Fund
| | |
| E. | | Federal Income Taxes — The Fund intends to comply with the requirements of Subchapter M of the Internal Revenue Code necessary to qualify as a regulated investment company and to distribute substantially all of the Fund’s taxable earnings to shareholders. As such, the Fund will not be subject to federal income taxes on otherwise taxable income (including net realized capital gain) that is distributed to shareholders. Therefore, no provision for federal income taxes is recorded in the financial statements. |
| | The Fund files tax returns in the U.S. Federal jurisdiction and certain other jurisdictions. Generally, the Fund is subject to examinations by such taxing authorities for up to three years after the filing of the return for the tax period. |
| F. | | Expenses — Fees provided for under the Rule 12b-1 plan of a particular class of the Fund are charged to the operations of such class. Transfer agency fees and expenses and other shareholder recordkeeping fees and expenses attributable to the Institutional Class are charged to such class. Transfer agency fees and expenses and other shareholder recordkeeping fees and expenses relating to all other classes are allocated among those classes based on relative net assets. All other expenses are allocated among the classes based on relative net assets. |
| G. | | Accounting Estimates — The preparation of financial statements in conformity with accounting principles generally accepted in the United States of America (“GAAP”) requires management to make estimates and assumptions that affect the reported amounts of assets and liabilities at the date of the financial statements and the reported amounts of revenues and expenses during the reporting period including estimates and assumptions related to taxation. Actual results could differ from those estimates by a significant amount. In addition, the Fund monitors for material events or transactions that may occur or become known after the period-end date and before the date the financial statements are released to print. |
| H. | | Indemnifications — Under the Trust’s organizational documents, each Trustee, officer, employee or other agent of the Trust is indemnified against certain liabilities that may arise out of performance of their duties to the Fund. Additionally, in the normal course of business, the Fund enters into contracts, including the Fund’s servicing agreements that contain a variety of indemnification clauses. The Fund’s maximum exposure under these arrangements is unknown as this would involve future claims that may be made against the Fund that have not yet occurred. The risk of material loss as a result of such indemnification claims is considered remote. |
| I. | | Foreign Currency Translations — Foreign currency is valued at the close of the NYSE based on quotations posted by banks and major currency dealers. Portfolio securities and other assets and liabilities denominated in foreign currencies are translated into U.S. dollar amounts at date of valuation. Purchases and sales of portfolio securities (net of foreign taxes withheld on disposition) and income items denominated in foreign currencies are translated into U.S. dollar amounts on the respective dates of such transactions. The Fund does not separately account for the portion of the results of operations resulting from changes in foreign exchange rates on investments and the fluctuations arising from changes in market prices of securities held. The combined results of changes in foreign exchange rates and the fluctuation of market prices on investments (net of estimated foreign tax withholding) are included with the net realized and unrealized gain or loss from investments in the Statement of Operations. Reported net realized foreign currency gains or losses arise from (1) sales of foreign currencies, (2) currency gains or losses realized between the trade and settlement dates on securities transactions, and (3) the difference between the amounts of dividends, interest, and foreign withholding taxes recorded on the Fund’s books and the U.S. dollar equivalent of the amounts actually received or paid. Net unrealized foreign currency gains and losses arise from changes in the fair values of assets and liabilities, other than investments in securities at fiscal period end, resulting from changes in exchange rates. |
| | The Fund may invest in foreign securities which may be subject to foreign taxes on income, gains on investments or currency repatriation, a portion of which may be recoverable. |
| J. | | Foreign Currency Contracts — The Fund may enter into foreign currency contracts to manage or minimize currency or exchange rate risk. The Fund may also enter into foreign currency contracts for the purchase or sale of a security denominated in a foreign currency in order to “lock in” the U.S. dollar price of that security. A foreign currency contract is an obligation to purchase or sell a specific currency for an agreed-upon price at a future date. The use of foreign currency contracts does not eliminate fluctuations in the price of the underlying securities the Fund owns or intends to acquire but establishes a rate of exchange in advance. Fluctuations in the value of these contracts are measured by the difference in the contract date and reporting date exchange rates and are recorded as unrealized appreciation (depreciation) until the contracts are closed. When the contracts are closed, realized gains (losses) are recorded. Realized and unrealized gains (losses) on the contracts are included in the Statement of Operations. The primary risks associated with foreign currency contracts include failure of the counterparty to meet the terms of the contract and the value of the foreign currency changing unfavorably. These risks may be in excess of the amounts reflected in the Statement of Assets and Liabilities. |
NOTE 2—Advisory Fees and Other Fees Paid to Affiliates
The Trust has entered into a master investment advisory agreement with Invesco Advisers, Inc. (the “Adviser” or “Invesco”). Under the terms of the investment advisory agreement, the Fund pays an advisory fee to the Adviser based on the annual rate of the Fund’s average daily net assets as follows:
| | | | | |
| Average Net Assets | | Rate |
| |
| First $250 million | | | 0 | .745% |
| |
| Next $250 million | | | 0 | .73% |
| |
| Next $500 million | | | 0 | .715% |
| |
| Next $1.5 billion | | | 0 | .70% |
| |
| Next $2.5 billion | | | 0 | .685% |
| |
| Next $2.5 billion | | | 0 | .67% |
| |
| Next $2.5 billion | | | 0 | .655% |
| |
| Over $10 billion | | | 0 | .64% |
| |
15 Invesco Small Companies Fund
Under the terms of a master sub-advisory agreement between the Adviser and each of Invesco Asset Management Deutschland GmbH, Invesco Asset Management Limited, Invesco Asset Management (Japan) Limited, Invesco Australia Limited, Invesco Hong Kong Limited, Invesco Senior Secured Management, Inc. and Invesco Canada Ltd. (collectively, the “Affiliated Sub-Advisers”) the Adviser, not the Fund, may pay 40% of the fees paid to the Adviser to any such Affiliated Sub-Adviser(s) that provide discretionary investment management services to the Fund based on the percentage of assets allocated to such Sub-Adviser(s).
The Advisor has contractually agreed, through at least February 28, 2013, to waive advisory fees and/or reimburse expenses to the extent necessary to limit total annual operating expenses after fee waiver and/or expense reimbursement (excluding certain items discussed below) of Class A, Class B, Class C, Class R, Class Y and Institutional Class shares to 2.00%, 2.75%, 2.75%, 2.25%, 1.75% and 1.75% of average daily net assets, respectively. In determining the Adviser’s obligation to waive advisory fees and/or reimburse expenses, the following expenses are not taken into account, and could cause the total annual operating expenses after fee waiver and/or expense reimbursement to exceed the numbers reflected above: (1) interest; (2) taxes; (3) dividend expense on short sales; (4) extraordinary or non-routine items; and (5) expenses that the Fund has incurred but did not actually pay because of an expense offset arrangement. Unless the Board of the Trustees and Invesco mutually agree to amend or continue the fee waiver agreement, it will terminate on February 28, 2013. The Advisor did not waive fees and/or reimburse expenses during the period under this expense limitation.
Further, the Adviser has contractually agreed, through at least June 30, 2012, to waive the advisory fee payable by the Fund in an amount equal to 100% of the net advisory fees the Adviser receives from the affiliated money market funds on investments by the Fund of uninvested cash in such affiliated money market funds.
For the year ended October 31, 2011, the Adviser waived advisory fees of $173,235.
At the request of the Trustees of the Trust, Invesco Ltd. agreed to reimburse expenses incurred by the Fund in connection with market timing matters in the Invesco Funds, which may include legal, audit, shareholder reporting, communications and trustee expenses. These expenses along with the related expense reimbursement are included in the Statement of Operations. For the year ended October 31, 2011, Invesco Ltd. reimbursed expenses of the Fund in the amount of $1,053.
The Trust has entered into a master administrative services agreement with Invesco pursuant to which the Fund has agreed to pay Invesco for certain administrative costs incurred in providing accounting services to the Fund. For the year ended October 31, 2011, expenses incurred under the agreement are shown in the Statement of Operations as administrative services fees.
The Trust has entered into a transfer agency and service agreement with Invesco Investment Services, Inc. (“IIS”) pursuant to which the Fund has agreed to pay IIS a fee for providing transfer agency and shareholder services to the Fund and reimburse IIS for certain expenses incurred by IIS in the course of providing such services. IIS may make payments to intermediaries that provide omnibus account services, sub-accounting services and/or networking services. All fees payable by IIS to intermediaries that provide omnibus account services or sub-accounting are charged back to the Fund, subject to certain limitations approved by the Trust’s Board of Trustees. For the year ended October 31, 2011, expenses incurred under the agreement are shown in the Statement of Operations as transfer agent fees.
The Trust has entered into master distribution agreements with Invesco Distributors, Inc. (“IDI”) to serve as the distributor for the Class A, Class B, Class C, Class R, Class Y and Institutional Class shares of the Fund. The Trust has adopted plans pursuant to Rule 12b-1 under the 1940 Act with respect to the Fund’s Class A, Class B, Class C and Class R shares (collectively, the “Plans”). The Fund, pursuant to the Plans, pays IDI compensation at the annual rate of 0.25% of the Fund’s average daily net assets of Class A shares, 1.00% of the average daily net assets of Class B and Class C shares and 0.50% of the average daily net assets of Class R shares. Of the Plan payments, up to 0.25% of the average daily net assets of each class of shares may be paid to furnish continuing personal shareholder services to customers who purchase and own shares of such classes. Any amounts not paid as a service fee under the Plans would constitute an asset-based sales charge. Rules of the Financial Industry Regulatory Authority (“FINRA”) impose a cap on the total sales charges, including asset-based sales charges that may be paid by any class of shares of the Fund. For the year ended October 31, 2011, expenses incurred under the Plans are shown in the Statement of Operations as distribution fees.
Front-end sales commissions and CDSC (collectively, the “sales charges”) are not recorded as expenses of the Fund. Front-end sales commissions are deducted from proceeds from the sales of Fund shares prior to investment in Class A shares of the Fund. CDSC are deducted from redemption proceeds prior to remittance to the shareholder. During the year ended October 31, 2011, IDI advised the Fund that IDI retained $102,872 in front-end sales commissions from the sale of Class A shares and $23, $23,000 and $14,163 from Class A, Class B and Class C shares, respectively, for CDSC imposed on redemptions by shareholders.
Certain officers and trustees of the Trust are officers and directors of the Adviser, Invesco Ltd., IIS and/or IDI.
NOTE 3—Additional Valuation Information
GAAP defines fair value as the price that would be received to sell an asset or paid to transfer a liability in an orderly transaction between market participants at the measurement date, under current market conditions. GAAP establishes a hierarchy that prioritizes the inputs to valuation methods giving the highest priority to readily available unadjusted quoted prices in an active market for identical assets (Level 1) and the lowest priority to significant unobservable inputs (Level 3) generally when market prices are not readily available or are unreliable. Based on the valuation inputs, the securities or other investments are tiered into one of three levels. Changes in valuation methods may result in transfers in or out of an investment’s assigned level:
| | |
| | Level 1 — | Prices are determined using quoted prices in an active market for identical assets. |
| | Level 2 — | Prices are determined using other significant observable inputs. Observable inputs are inputs that other market participants may use in pricing a security. These may include quoted prices for similar securities, interest rates, prepayment speeds, credit risk, yield curves, loss severities, default rates, discount rates, volatilities and others. |
| | Level 3 — | Prices are determined using significant unobservable inputs. In situations where quoted prices or observable inputs are unavailable (for example, when there is little or no market activity for an investment at the end of the period), unobservable inputs may be used. Unobservable inputs reflect the Fund’s own assumptions about the factors market participants would use in determining fair value of the securities or instruments and would be based on the best available information. |
16 Invesco Small Companies Fund
The following is a summary of the tiered valuation input levels, as of October 31, 2011. The level assigned to the securities valuations may not be an indication of the risk or liquidity associated with investing in those securities. Because of the inherent uncertainties of valuation, the values reflected in the financial statements may materially differ from the value received upon actual sale of those investments.
During the year ended October 31, 2011, there were no significant transfers between investment levels.
| | | | | | | | | | | | | | | | | |
| | | Level 1 | | Level 2 | | Level 3 | | Total |
| |
| Equity Securities | | $ | 782,485,297 | | | $ | — | | | $ | — | | | $ | 782,485,297 | |
| |
| Corporate Debt Securities | | | — | | | | 6,602,606 | | | | — | | | | 6,602,606 | |
| |
| Total Investments | | $ | 782,485,297 | | | $ | 6,602,606 | | | $ | — | | | $ | 789,087,903 | |
| |
NOTE 4—Investments in Other Affiliates
The Investment Company Act of 1940 defines affiliates as those issuances in which a fund holds 5% or more of the outstanding voting securities. The Fund has not owned enough of the outstanding voting securities of the issuer to have control (as defined in the Investment Company Act of 1940) of that issuer. The following is a summary of the investments in affiliates for the year ended October 31, 2011.
| | | | | | | | | | | | | | | | | | | | | | | | | | | | | |
| | | | | | | | | Change in
| | | | | | |
| | | | | | | | | Unrealized
| | | | | | |
| | | Value
| | Purchases
| | Proceeds
| | Appreciation
| | Realized
| | Value
| | Dividend
|
| | | 10/31/10 | | at Cost | | from Sales | | (Depreciation) | | Gain (Loss) | | 10/31/11 | | Income |
| |
| | | | | | | | | | | | | | | | | | | | | | | | | | | | | |
| Advanced Analogic Technologies Inc. | | $ | 9,227,040 | | | $ | — | | | $ | — | | | $ | 1,472,400 | | | $ | — | | | $ | 10,699,440 | | | $ | — | |
| |
| Brightpoint, Inc. | | | 20,073,530 | | | | 11,895,461 | | | | (30,934 | ) | | | 9,189,911 | | | | 10,956 | | | | 41,138,924 | | | | — | |
| |
Chemtrade Logistics Income Fund(a) | | | 20,502,092 | | | | — | | | | (8,073,112 | ) | | | (2,087,592 | ) | | | 3,557,676 | | | | 13,899,064 | | | | 1,226,623 | |
| |
| Hampshire Group, Ltd. | | | 2,371,296 | | | | — | | | | — | | | | (681,748 | ) | | | — | | | | 1,689,548 | | | | — | |
| |
Lithia Motors, Inc.(a) | | | 10,183,478 | | | | 3,323,913 | | | | (3,962,535 | ) | | | 9,062,102 | | | | (456,628 | ) | | | 18,150,330 | | | | 170,682 | |
| |
| MEGA Brands Inc. | | | 9,945,339 | | | | 4,342,758 | | | | — | | | | (3,481,557 | ) | | | — | | | | 10,806,540 | | | | — | |
| |
| NCI, Inc.–Class A | | | — | | | | 13,278,032 | | | | — | | | | (3,336,942 | ) | | | — | | | | 9,941,090 | | | | — | |
| |
| Smart Modular Technologies | | | 33,444,531 | | | | — | | | | (41,433,357 | ) | | | 952,971 | | | | 7,035,855 | | | | — | | | | — | |
| |
| Total | | $ | 105,747,306 | | | $ | 32,840,164 | | | $ | (53,499,938 | ) | | $ | 11,089,545 | | | $ | 10,147,859 | | | $ | 106,324,936 | | | $ | 1,397,305 | |
| |
| | |
| (a) | | As of October 31, 2011, this security is no longer considered an affiliate of the Fund. |
NOTE 5—Expense Offset Arrangement(s)
The expense offset arrangement is comprised of transfer agency credits which result from balances in Demand Deposit Accounts (DDA) used by the transfer agent for clearing shareholder transactions. For the year ended October 31, 2011, the Fund received credits from this arrangement, which resulted in the reduction of the Fund’s total expenses of $1,705.
NOTE 6—Trustees’ and Officers’ Fees and Benefits
“Trustees’ and Officers’ Fees and Benefits” include amounts accrued by the Fund to pay remuneration to certain Trustees and Officers of the Fund. Trustees have the option to defer compensation payable by the Fund, and “Trustees’ and Officers’ Fees and Benefits” also include amounts accrued by the Fund to fund such deferred compensation amounts. Those Trustees who defer compensation have the option to select various Invesco Funds in which their deferral accounts shall be deemed to be invested. Finally, certain current Trustees are eligible to participate in a retirement plan that provides for benefits to be paid upon retirement to Trustees over a period of time based on the number of years of service. The Fund may have certain former Trustees who also participate in a retirement plan and receive benefits under such plan. “Trustees’ and Officers’ Fees and Benefits” include amounts accrued by the Fund to fund such retirement benefits. Obligations under the deferred compensation and retirement plans represent unsecured claims against the general assets of the Fund.
During the year ended October 31, 2011, the Fund paid legal fees of $2,334 for services rendered by Kramer, Levin, Naftalis & Frankel LLP as counsel to the Independent Trustees. A partner of that firm is a Trustee of the Trust.
NOTE 7—Cash Balances
The Fund is permitted to temporarily carry a negative or overdrawn balance in its account with The State Street Bank and Trust Company, the custodian bank. To compensate the custodian bank for such overdrafts, the overdrawn Fund may either (1) leave funds as a compensating balance in the account so the custodian bank can be compensated by earning the additional interest; or (2) compensate by paying the custodian bank at a rate agreed upon by the custodian bank and Invesco, not to exceed the contractually agreed upon rate.
17 Invesco Small Companies Fund
NOTE 8—Distributions to Shareholders and Tax Components of Net Assets
Tax Character of Distributions to Shareholders Paid During the Years Ended October 31, 2011 and 2010:
| | | | | | | | | |
| | | 2011 | | 2010 |
| |
| Ordinary income | | $ | — | | | $ | 202,953 | |
| |
Tax Components of Net Assets at Period-End:
| | | | | |
| | | 2011 |
| |
| Net unrealized appreciation — investments | | $ | 32,337,825 | |
| |
| Net unrealized appreciation (depreciation) — other investments | | | (2,048 | ) |
| |
| Temporary book/tax differences | | | (53,209 | ) |
| |
| Capital loss carryforward | | | (29,411,404 | ) |
| |
| Shares of beneficial interest | | | 795,741,192 | |
| |
| Total net assets | | $ | 798,612,356 | |
| |
The difference between book-basis and tax-basis unrealized appreciation (depreciation) is due to differences in the timing of recognition of gains and losses on investments for tax and book purposes. The Fund’s net unrealized appreciation difference is attributable primarily to wash sales.
The temporary book/tax differences are a result of timing differences between book and tax recognition of income and/or expenses. The Fund’s temporary book/tax differences are the result of the trustee deferral of compensation and retirement plan benefits.
Capital loss carryforward is calculated and reported as of a specific date. Results of transactions and other activity after that date may affect the amount of capital loss carryforward actually available for the Fund to utilize. The ability to utilize capital loss carryforward in the future may be limited under the Internal Revenue Code and related regulations based on the results of future transactions.
The Fund utilized $46,795,210 of capital loss carryforward in the current period to offset net realized capital gain for federal income tax purposes. The Fund has a capital loss carryforward as of October 31, 2011, which expires as follows:
| | | | | |
| | | Capital Loss
|
| Expiration | | Carryforward* |
| |
| October 31, 2017 | | $ | 29,411,404 | |
| |
| |
| * | Capital loss carryforward as of the date listed above is reduced for limitations, if any, to the extent required by the Internal Revenue Code. |
NOTE 9—Investment Securities
The aggregate amount of investment securities (other than short-term securities, U.S. Treasury obligations and money market funds, if any) purchased and sold by the Fund during the year ended October 31, 2011 was $210,032,444 and $182,999,462, respectively. Cost of investments on a tax basis includes the adjustments for financial reporting purposes as of the most recently completed Federal income tax reporting period-end.
| | | | | |
| Unrealized Appreciation (Depreciation) of Investment Securities on a Tax Basis |
| |
| Aggregate unrealized appreciation of investment securities | | $ | 115,439,801 | |
| |
| Aggregate unrealized (depreciation) of investment securities | | | (83,101,976 | ) |
| |
| Net unrealized appreciation of investment securities | | $ | 32,337,825 | |
| |
| Cost of investments for tax purposes is $756,750,078. | | | | |
18 Invesco Small Companies Fund
NOTE 10—Reclassification of Permanent Differences
Primarily as a result of differing book/tax treatment of foreign currency transactions and net operating losses, on October 31, 2011, undistributed net investment income (loss) was increased by $4,662,634, undistributed net realized gain (loss) was decreased by $108,784 and shares of beneficial interest decreased by $4,553,850. This reclassification had no effect on the net assets of the Fund.
NOTE 11—Share Information
| | | | | | | | | | | | | | | | | |
| | | Summary of Share Activity |
| |
| | | Year ended
| | Year ended
|
| | | October 31, 2011(a) | | October 31, 2010 |
| | | Shares | | Amount | | Shares | | Amount |
| |
| Sold: | | | | | | | | | | | | | | | | |
| Class A | | | 14,278,326 | | | $ | 261,735,932 | | | | 9,922,690 | | | $ | 141,822,288 | |
| |
| Class B | | | 163,425 | | | | 2,827,116 | | | | 178,816 | | | | 2,465,392 | |
| |
| Class C | | | 2,477,925 | | | | 43,049,778 | | | | 1,663,355 | | | | 22,758,841 | |
| |
| Class R | | | 2,411,619 | | | | 43,295,088 | | | | 1,465,148 | | | | 20,768,297 | |
| |
| Class Y | | | 2,489,800 | | | | 46,671,152 | | | | 574,086 | | | | 8,197,298 | |
| |
| Institutional Class | | | 2,293,579 | | | | 42,909,551 | | | | 922,043 | | | | 13,340,963 | |
| |
| Issued as reinvestment of dividends: | | | | | | | | | | | | | | | | |
| Class A | | | — | | | | — | | | | 9,074 | | | | 121,685 | |
| |
| Class R | | | — | | | | — | | | | 271 | | | | 3,596 | |
| |
| Class Y | | | — | | | | — | | | | 484 | | | | 6,482 | |
| |
| Institutional Class | | | — | | | | — | | | | 3,226 | | | | 44,006 | |
| |
| Automatic conversion of Class B shares to Class A shares: | | | | | | | | | | | | | | | | |
| Class A | | | 91,315 | | | | 1,681,928 | | | | 100,515 | | | | 1,441,725 | |
| |
| Class B | | | (96,144 | ) | | | (1,681,928 | ) | | | (105,028 | ) | | | (1,441,725 | ) |
| |
| Reacquired: | | | | | | | | | | | | | | | | |
| Class A | | | (6,562,130 | ) | | | (119,506,336 | ) | | | (9,365,748 | ) | | | (133,355,490 | ) |
| |
| Class B | | | (149,111 | ) | | | (2,579,205 | ) | | | (245,302 | ) | | | (3,350,566 | ) |
| |
| Class C | | | (1,468,255 | ) | | | (25,416,138 | ) | | | (1,348,488 | ) | | | (18,229,502 | ) |
| |
| Class R | | | (1,194,364 | ) | | | (21,445,105 | ) | | | (812,433 | ) | | | (11,440,038 | ) |
| |
| Class Y | | | (1,131,630 | ) | | | (20,539,222 | ) | | | (313,691 | ) | | | (4,507,783 | ) |
| |
| Institutional Class | | | (524,725 | ) | | | (9,830,241 | ) | | | (2,774,641 | ) | | | (40,512,077 | ) |
| |
| Net increase (decrease) in share activity | | | 13,079,630 | | | $ | 241,172,370 | | | | (125,623 | ) | | $ | (1,866,608 | ) |
| |
| | |
| (a) | | There are entities that are record owners of more than 5% of the outstanding shares of the Fund and in the aggregate own 24% of the outstanding shares of the Fund. IDI has an agreement with these entities to sell Fund shares. The Fund, Invesco and/or Invesco affiliates may make payments to these entities, which are considered to be related to the Fund, for providing services to the Fund, Invesco and/or Invesco affiliates including but not limited to services such as securities brokerage, distribution, third party record keeping and account servicing. The Fund has no knowledge as to whether all or any portion of the shares owned of record by these entities are also owned beneficially. |
19 Invesco Small Companies Fund
NOTE 12—Financial Highlights
The following schedule presents financial highlights for a share of the Fund outstanding throughout the periods indicated.
| | | | | | | | | | | | | | | | | | | | | | | | | | | | | | | | | | | | | | | | | | | | | | | | | | | | | | | | | |
| | | | | | | | | | | | | | | | | | | | | | | Ratio of
| | Ratio of
| | | | |
| | | | | | | Net gains
| | | | | | | | | | | | | | | | expenses
| | expenses
| | | | |
| | | | | | | (losses) on
| | | | | | | | | | | | | | | | to average
| | to average net
| | Ratio of net
| | |
| | | Net asset
| | Net
| | securities
| | | | Dividends
| | Distributions
| | | | | | | | | | net assets
| | assets without
| | investment
| | |
| | | value,
| | investment
| | (both
| | Total from
| | from net
| | from net
| | | | Net asset
| | | | Net assets,
| | with fee waivers
| | fee waivers
| | income (loss)
| | |
| | | beginning
| | income
| | realized and
| | investment
| | investment
| | realized
| | Total
| | value, end
| | Total
| | end of period
| | and/or expenses
| | and/or expenses
| | to average
| | Portfolio
|
| | | of period | | (loss)(a) | | unrealized) | | operations | | income | | gains | | Distributions | | of period | | Return(b) | | (000s omitted) | | absorbed | | absorbed | | net assets | | turnover(c) |
| |
| Class A |
| Year ended 10/31/11 | | $ | 15.50 | | | $ | (0.12 | ) | | $ | 3.59 | | | $ | 3.47 | | | $ | — | | | $ | — | | | $ | — | | | $ | 18.97 | | | | 22.39 | % | | $ | 485,609 | | | | 1.24 | %(d) | | | 1.27 | %(d) | | | (0.64 | )%(d) | | | 38 | % |
| Year ended 10/31/10 | | | 12.09 | | | | (0.02 | ) | | | 3.44 | | | | 3.42 | | | | (0.01 | ) | | | — | | | | (0.01 | ) | | | 15.50 | | | | 28.28 | | | | 275,777 | | | | 1.31 | | | | 1.33 | | | | (0.18 | ) | | | 50 | |
| Year ended 10/31/09 | | | 9.21 | | | | 0.06 | | | | 2.94 | | | | 3.00 | | | | — | | | | (0.12 | ) | | | (0.12 | ) | | | 12.09 | | | | 33.26 | | | | 207,084 | | | | 1.47 | | | | 1.48 | | | | 0.69 | | | | 27 | |
| Year ended 10/31/08 | | | 16.71 | | | | 0.03 | | | | (6.71 | ) | | | (6.68 | ) | | | (0.09 | ) | | | (0.73 | ) | | | (0.82 | ) | | | 9.21 | | | | (41.70 | ) | | | 188,482 | | | | 1.37 | | | | 1.38 | | | | 0.28 | | | | 41 | |
| Year ended 10/31/07 | | | 16.07 | | | | 0.17 | | | | 1.64 | | | | 1.81 | | | | — | | | | (1.17 | ) | | | (1.17 | ) | | | 16.71 | | | | 12.10 | | | | 458,286 | | | | 1.27 | | | | 1.34 | | | | 1.06 | | | | 44 | |
| |
| Class B |
| Year ended 10/31/11 | | | 14.78 | | | | (0.24 | ) | | | 3.41 | | | | 3.17 | | | | — | | | | — | | | | — | | | | 17.95 | | | | 21.45 | | | | 15,478 | | | | 1.99 | (d) | | | 2.02 | (d) | | | (1.39 | )(d) | | | 38 | |
| Year ended 10/31/10 | | | 11.61 | | | | (0.13 | ) | | | 3.30 | | | | 3.17 | | | | — | | | | — | | | | — | | | | 14.78 | | | | 27.30 | | | | 13,952 | | | | 2.06 | | | | 2.08 | | | | (0.93 | ) | | | 50 | |
| Year ended 10/31/09 | | | 8.92 | | | | (0.00 | ) | | | 2.81 | | | | 2.81 | | | | — | | | | (0.12 | ) | | | (0.12 | ) | | | 11.61 | | | | 32.20 | | | | 12,951 | | | | 2.22 | | | | 2.23 | | | | (0.06 | ) | | | 27 | |
| Year ended 10/31/08 | | | 16.24 | | | | (0.06 | ) | | | (6.52 | ) | | | (6.58 | ) | | | (0.01 | ) | | | (0.73 | ) | | | (0.74 | ) | | | 8.92 | | | | (42.12 | ) | | | 12,304 | | | | 2.12 | | | | 2.13 | | | | (0.47 | ) | | | 41 | |
| Year ended 10/31/07 | | | 15.75 | | | | 0.05 | | | | 1.61 | | | | 1.66 | | | | — | | | | (1.17 | ) | | | (1.17 | ) | | | 16.24 | | | | 11.35 | | | | 31,025 | | | | 2.02 | | | | 2.09 | | | | 0.31 | | | | 44 | |
| |
| Class C |
| Year ended 10/31/11 | | | 14.76 | | | | (0.24 | ) | | | 3.41 | | | | 3.17 | | | | — | | | | — | | | | — | | | | 17.93 | | | | 21.48 | | | | 123,286 | | | | 1.99 | (d) | | | 2.02 | (d) | | | (1.39 | )(d) | | | 38 | |
| Year ended 10/31/10 | | | 11.60 | | | | (0.13 | ) | | | 3.29 | | | | 3.16 | | | | — | | | | — | | | | — | | | | 14.76 | | | | 27.24 | | | | 86,591 | | | | 2.06 | | | | 2.08 | | | | (0.93 | ) | | | 50 | |
| Year ended 10/31/09 | | | 8.91 | | | | (0.00 | ) | | | 2.81 | | | | 2.81 | | | | — | | | | (0.12 | ) | | | (0.12 | ) | | | 11.60 | | | | 32.23 | | | | 64,368 | | | | 2.22 | | | | 2.23 | | | | (0.06 | ) | | | 27 | |
| Year ended 10/31/08 | | | 16.22 | | | | (0.06 | ) | | | (6.51 | ) | | | (6.57 | ) | | | (0.01 | ) | | | (0.73 | ) | | | (0.74 | ) | | | 8.91 | | | | (42.12 | ) | | | 59,806 | | | | 2.12 | | | | 2.13 | | | | (0.47 | ) | | | 41 | |
| Year ended 10/31/07 | | | 15.74 | | | | 0.05 | | | | 1.60 | | | | 1.65 | | | | — | | | | (1.17 | ) | | | (1.17 | ) | | | 16.22 | | | | 11.28 | | | | 116,625 | | | | 2.02 | | | | 2.09 | | | | 0.31 | | | | 44 | |
| |
| Class R |
| Year ended 10/31/11 | | | 15.29 | | | | (0.16 | ) | | | 3.53 | | | | 3.37 | | | | — | | | | — | | | | — | | | | 18.66 | | | | 22.04 | | | | 62,112 | | | | 1.49 | (d) | | | 1.52 | (d) | | | (0.89 | )(d) | | | 38 | |
| Year ended 10/31/10 | | | 11.95 | | | | (0.06 | ) | | | 3.40 | | | | 3.34 | | | | (0.00 | ) | | | — | | | | (0.00 | ) | | | 15.29 | | | | 27.97 | | | | 32,270 | | | | 1.56 | | | | 1.58 | | | | (0.43 | ) | | | 50 | |
| Year ended 10/31/09 | | | 9.13 | | | | 0.04 | | | | 2.90 | | | | 2.94 | | | | — | | | | (0.12 | ) | | | (0.12 | ) | | | 11.95 | | | | 32.89 | | | | 17,423 | | | | 1.72 | | | | 1.73 | | | | 0.44 | | | | 27 | |
| Year ended 10/31/08 | | | 16.58 | | | | 0.01 | | | | (6.66 | ) | | | (6.65 | ) | | | (0.07 | ) | | | (0.73 | ) | | | (0.80 | ) | | | 9.13 | | | | (41.82 | ) | | | 13,541 | | | | 1.62 | | | | 1.63 | | | | 0.03 | | | | 41 | |
| Year ended 10/31/07 | | | 15.98 | | | | 0.13 | | | | 1.64 | | | | 1.77 | | | | — | | | | (1.17 | ) | | | (1.17 | ) | | | 16.58 | | | | 11.90 | | | | 10,073 | | | | 1.52 | | | | 1.59 | | | | 0.81 | | | | 44 | |
| |
| Class Y |
| Year ended 10/31/11 | | | 15.51 | | | | (0.07 | ) | | | 3.59 | | | | 3.52 | | | | — | | | | — | | | | — | | | | 19.03 | | | | 22.70 | | | | 41,476 | | | | 0.99 | (d) | | | 1.02 | (d) | | | (0.39 | )(d) | | | 38 | |
| Year ended 10/31/10 | | | 12.07 | | | | 0.01 | | | | 3.44 | | | | 3.45 | | | | (0.01 | ) | | | — | | | | (0.01 | ) | | | 15.51 | | | | 28.62 | | | | 12,735 | | | | 1.06 | | | | 1.08 | | | | 0.07 | | | | 50 | |
| Year ended 10/31/09 | | | 9.21 | | | | 0.10 | | | | 2.91 | | | | 3.01 | | | | (0.03 | ) | | | (0.12 | ) | | | (0.15 | ) | | | 12.07 | | | | 33.49 | | | | 6,763 | | | | 1.22 | | | | 1.23 | | | | 0.94 | | | | 27 | |
| Year ended 10/31/08(e) | | | 10.58 | | | | 0.00 | | | | (1.37 | ) | | | (1.37 | ) | | | — | | | | — | | | | — | | | | 9.21 | | | | (12.95 | ) | | | 511 | | | | 1.17 | (f) | | | 1.17 | (f) | | | 0.48 | (f) | | | 41 | |
| |
| Institutional Class |
| Year ended 10/31/11 | | | 15.82 | | | | (0.04 | ) | | | 3.67 | | | | 3.63 | | | | — | | | | — | | | | — | | | | 19.45 | | | | 22.95 | | | | 70,652 | | | | 0.83 | (d) | | | 0.86 | (d) | | | (0.23 | )(d) | | | 38 | |
| Year ended 10/31/10 | | | 12.30 | | | | 0.04 | | | | 3.50 | | | | 3.54 | | | | (0.02 | ) | | | — | | | | (0.02 | ) | | | 15.82 | | | | 28.79 | | | | 29,499 | | | | 0.86 | | | | 0.88 | | | | 0.27 | | | | 50 | |
| Year ended 10/31/09 | | | 9.39 | | | | 0.11 | | | | 2.99 | | | | 3.10 | | | | (0.07 | ) | | | (0.12 | ) | | | (0.19 | ) | | | 12.30 | | | | 34.05 | | | | 45,672 | | | | 0.94 | | | | 0.95 | | | | 1.22 | | | | 27 | |
| Year ended 10/31/08 | | | 17.00 | | | | 0.10 | | | | (6.84 | ) | | | (6.74 | ) | | | (0.14 | ) | | | (0.73 | ) | | | (0.87 | ) | | | 9.39 | | | | (41.45 | ) | | | 147,944 | | | | 0.90 | | | | 0.91 | | | | 0.75 | | | | 41 | |
| Year ended 10/31/07 | | | 16.26 | | | | 0.25 | | | | 1.66 | | | | 1.91 | | | | — | | | | (1.17 | ) | | | (1.17 | ) | | | 17.00 | | | | 12.60 | | | | 169,019 | | | | 0.86 | | | | 0.93 | | | | 1.47 | | | | 44 | |
| |
| | |
| (a) | | Calculated using average shares outstanding. |
| (b) | | Includes adjustments in accordance with accounting principles generally accepted in the United States of America and as such, the net asset value for financial reporting purposes and the returns based upon those net asset values may differ from the net asset value and returns for shareholder transactions. Does not include sales charges and is not annualized for periods less than one year, if applicable. |
| (c) | | Portfolio turnover is calculated at the fund level and is not annualized for periods less than one year, if applicable. |
| (d) | | Ratios are based on average daily net assets (000’s) of $360,705, $15,486, $106,822, $51,831, $22,730 and $45,893 for Class A, Class B, Class C, Class R, Class Y and Institutional Class shares, respectively. |
| (e) | | Commencement date of October 3, 2008. |
| (f) | | Annualized. |
20 Invesco Small Companies Fund
Report of Independent Registered Public Accounting Firm
To the Board of Trustees of AIM Investment Funds (Invesco Investment Funds)
and Shareholders of Invesco Small Companies Fund:
In our opinion, the accompanying statement of assets and liabilities, including the schedule of investments, and the related statements of operations and of changes in net assets and the financial highlights present fairly, in all material respects, the financial position of Invesco Small Companies Fund (one of the funds constituting AIM Investment Funds (Invesco Investment Funds), hereafter referred to as the “Fund”) at October 31, 2011, the results of its operations for the year then ended, the changes in its net assets for each of the two years in the period then ended and the financial highlights for each of the five years in the period then ended, in conformity with accounting principles generally accepted in the United States of America. These financial statements and financial highlights (hereafter referred to as “financial statements”) are the responsibility of the Fund’s management; our responsibility is to express an opinion on these financial statements based on our audits. We conducted our audits of these financial statements in accordance with the standards of the Public Company Accounting Oversight Board (United States). Those standards require that we plan and perform the audit to obtain reasonable assurance about whether the financial statements are free of material misstatement. An audit includes examining, on a test basis, evidence supporting the amounts and disclosures in the financial statements, assessing the accounting principles used and significant estimates made by management, and evaluating the overall financial statement presentation. We believe that our audits, which included confirmation of securities at October 31, 2011 by correspondence with the custodian and brokers, provide a reasonable basis for our opinion.
PRICEWATERHOUSECOOPERS LLP
Houston, Texas
December 21, 2011
21 Invesco Small Companies Fund
Calculating your ongoing Fund expenses
Example
As a shareholder of the Fund, you incur two types of costs: (1) transaction costs, which may include sales charges (loads) on purchase payments or contingent deferred sales charges on redemptions, and redemption fees, if any; and (2) ongoing costs, including management fees, distribution and/or service (12b-1) fees, and other Fund expenses. This example is intended to help you understand your ongoing costs (in dollars) of investing in the Fund and to compare these costs with ongoing costs of investing in other mutual funds. The example is based on an investment of $1,000 invested at the beginning of the period and held for the entire period May 1, 2011 through October 31, 2011.
Actual expenses
The table below provides information about actual account values and actual expenses. You may use the information in this table, together with the amount you invested, to estimate the expenses that you paid over the period. Simply divide your account value by $1,000 (for example, an $8,600 account value divided by $1,000 = 8.6), then multiply the result by the number in the table under the heading entitled “Actual Expenses Paid During Period” to estimate the expenses you paid on your account during this period.
Hypothetical example for comparison purposes
The table below also provides information about hypothetical account values and hypothetical expenses based on the Fund’s actual expense ratio and an assumed rate of return of 5% per year before expenses, which is not the Fund’s actual return.
The hypothetical account values and expenses may not be used to estimate the actual ending account balance or expenses you paid for the period. You may use this information to compare the ongoing costs of investing in the Fund and other funds. To do so, compare this 5% hypothetical example with the 5% hypothetical examples that appear in the shareholder reports of the other funds.
Please note that the expenses shown in the table are meant to highlight your ongoing costs only and do not reflect any transaction costs, such as sales charges (loads) on purchase payments, contingent deferred sales charges on redemptions, and redemption fees, if any. Therefore, the hypothetical information is useful in comparing ongoing costs only, and will not help you determine the relative total costs of owning different funds. In addition, if these transaction costs were included, your costs would have been higher.
| | | | | | | | | | | | | | | | | | | | | | | | | | | | | | | |
| | | | | | | | | | HYPOTHETICAL
| | | |
| | | | | | | ACTUAL | | | (5% annual return before expenses) | | | |
| | | | Beginning
| | | Ending
| | | Expenses
| | | Ending
| | | Expenses
| | | Annualized
|
| | | | Account Value
| | | Account Value
| | | Paid During
| | | Account Value
| | | Paid During
| | | Expense
|
| Class | | | (05/01/11) | | | (10/31/11)1 | | | Period2 | | | (10/31/11) | | | Period2 | | | Ratio |
| Class A | | | $ | 1,000.00 | | | | $ | 956.60 | | | | $ | 6.12 | | | | $ | 1,018.95 | | | | $ | 6.31 | | | | | 1.24 | % |
| | | | | | | | | | | | | | | | | | | | | | | | | | | | | | | |
| Class B | | | | 1,000.00 | | | | | 952.80 | | | | | 9.80 | | | | | 1,015.17 | | | | | 10.11 | | | | | 1.99 | |
| | | | | | | | | | | | | | | | | | | | | | | | | | | | | | | |
| Class C | | | | 1,000.00 | | | | | 952.70 | | | | | 9.79 | | | | | 1,015.17 | | | | | 10.11 | | | | | 1.99 | |
| | | | | | | | | | | | | | | | | | | | | | | | | | | | | | | |
| Class R | | | | 1,000.00 | | | | | 955.00 | | | | | 7.34 | | | | | 1,017.69 | | | | | 7.58 | | | | | 1.49 | |
| | | | | | | | | | | | | | | | | | | | | | | | | | | | | | | |
| Class Y | | | | 1,000.00 | | | | | 957.70 | | | | | 4.89 | | | | | 1,020.21 | | | | | 5.04 | | | | | 0.99 | |
| | | | | | | | | | | | | | | | | | | | | | | | | | | | | | | |
| Institutional | | | | 1,000.00 | | | | | 958.60 | | | | | 4.00 | | | | | 1,021.12 | | | | | 4.13 | | | | | 0.81 | |
| | | | | | | | | | | | | | | | | | | | | | | | | | | | | | | |
| |
| 1 | The actual ending account value is based on the actual total return of the Fund for the period May 1, 2011 through October 31, 2011, after actual expenses and will differ from the hypothetical ending account value which is based on the Fund’s expense ratio and a hypothetical annual return of 5% before expenses. |
| 2 | Expenses are equal to the Fund’s annualized expense ratio as indicated above multiplied by the average account value over the period, multiplied by 184/365 to reflect the most recent fiscal half year. |
22 Invesco Small Companies Fund
Approval of Investment Advisory and Sub-Advisory Contracts
The Board of Trustees (the Board) of AIM Investment Funds (Invesco Investment Funds) is required under the Investment Company Act of 1940, as amended, to approve annually the renewal of the Invesco Small Companies Fund (the Fund) investment advisory agreement with Invesco Advisers, Inc. (Invesco Advisers) and the Master Intergroup Sub-Advisory Contract for Mutual Funds (the sub-advisory contracts) with Invesco Asset Management Deutschland GmbH, Invesco Asset Management Limited, Invesco Asset Management (Japan) Limited, Invesco Australia Limited, Invesco Hong Kong Limited, Invesco Senior Secured Management, Inc. and Invesco Canada Ltd. (collectively, the Affiliated Sub-Advisers). During contract renewal meetings held on June 14-15, 2011, the Board as a whole, and the disinterested or “independent” Trustees, who comprise 80% of the Board, voting separately, approved the continuance of the Fund’s investment advisory agreement and the sub-advisory contracts for another year, effective July 1, 2011. In doing so, the Board considered the process that it follows in reviewing and approving the Fund’s investment advisory agreement and sub-advisory contracts and the information that it is provided. The Board determined that the Fund’s investment advisory agreement and the sub-advisory contracts are in the best interests of the Fund and its shareholders and the compensation to Invesco Advisers and the Affiliated Sub-Advisers under the agreements is fair and reasonable.
The Board’s Fund Evaluation Process
The Board’s Investments Committee has established three Sub-Committees, each of which is responsible for overseeing the management of a number of the series portfolios of the funds advised by Invesco Advisers (the Invesco Funds). The Sub-Committees meet throughout the year to review the performance of their assigned funds, including reviewing materials prepared under the direction of the independent Senior Officer, an officer of the Invesco Funds who reports directly to the independent Trustees. Over the course of each year, the Sub-Committees meet with portfolio managers for their assigned Invesco Funds and other members of management to review the performance, investment objective(s), policies, strategies and limitations and investment risks of these funds. The Sub-Committees meet regularly and at designated contract renewal meetings each year to conduct a review of the performance, fees, expenses and other matters related to their assigned Invesco Funds. Each Sub-Committee recommends to the Investments Committee, which in turn recommends to the full Board, whether to approve the continuance of each Invesco Fund’s investment advisory agreement and sub-advisory contracts for another year.
During the contract renewal process, the Trustees receive comparative performance and fee data regarding the Invesco Funds prepared by Invesco Advisers and an independent company, Lipper, Inc. (Lipper). The Trustees also receive an independent written evaluation from the Senior Officer. The Senior Officer’s evaluation is prepared as part of his responsibility to manage the process by which the Invesco Funds’ proposed management fees are negotiated during the annual contract renewal process to ensure they are negotiated in a manner that is at arms’ length and reasonable. The independent Trustees are assisted in their annual evaluation of the Fund’s investment advisory agreement by the Senior Officer and by independent legal counsel. The independent Trustees also discuss the continuance of the investment advisory agreement and sub-advisory contracts in private sessions with the Senior Officer and counsel.
In evaluating the fairness and reasonableness of the Fund’s investment advisory agreement and sub-advisory contracts, the Board considered, among other things, the factors discussed below. The Trustees also considered information provided in connection with fund acquisitions approved by the Trustees to rationalize the Invesco Funds product range following the acquisition of the retail mutual fund business of Morgan Stanley (the Morgan Stanley Transaction). The Trustees recognized that the advisory fees for the Invesco Funds include advisory fees that are the result of years of review and negotiation between the Trustees and Invesco Advisers as well as advisory fees inherited from Morgan Stanley and Van Kampen funds acquired in the Morgan Stanley Transaction. The Trustees’ deliberations and conclusions in a particular year may be based in part on their deliberations and conclusions regarding these same arrangements throughout the year and in prior years. One Trustee may have weighed a particular piece of information differently than another Trustee.
The discussion below serves as the Senior Officer’s independent written evaluation with respect to the Fund’s investment advisory agreement as well as a discussion of the material factors and related conclusions that formed the basis for the Board’s approval of the Fund’s investment advisory agreement and sub-advisory contracts. Unless otherwise stated, this information is current as of June 15, 2011, and may not reflect consideration of factors that became known to the Board after that date, including, for example, changes to the Fund’s performance, advisory fees, expense limitations and/or fee waivers.
Factors and Conclusions and Summary of Independent Written Fee Evaluation
| |
| A. | Nature, Extent and Quality of Services Provided by Invesco Advisers and the Affiliated Sub-Advisers |
The Board reviewed the advisory services provided to the Fund by Invesco Advisers under the Fund’s investment advisory agreement, the performance of Invesco Advisers in providing these services, and the credentials and experience of the officers and employees of Invesco Advisers who provide these services, including the Fund’s portfolio manager or managers, with whom the Board met during the year. The Board’s review of the qualifications of Invesco Advisers to provide advisory services included the Board’s consideration of Invesco Advisers’ performance and investment process oversight, independent credit analysis and investment risk management.
In determining whether to continue the Fund’s investment advisory agreement, the Board considered the prior relationship between Invesco Advisers and the Fund, as well as the Board’s knowledge of Invesco Advisers’ operations, and concluded that it is beneficial to maintain the current relationship, in part, because of such knowledge. The Board also considered services that Invesco Advisers and its affiliates provide to the Invesco Funds such as various back office support functions, equity and fixed income trading operations, internal audit, distribution and legal and compliance. The Board concluded that the nature, extent and quality of the services provided to the Fund by Invesco Advisers are appropriate and satisfactory and the advisory services are provided in accordance with the terms of the Fund’s investment advisory agreement.
The Board reviewed the services provided by the Affiliated Sub-Advisers under the sub-advisory contracts and the credentials and experience of the officers and employees of the Affiliated Sub-Advisers who provide these services. The Board noted that the Affiliated Sub-Advisers have offices and personnel that are located in financial centers around the world. As a result, the Affiliated Sub-Advisers can provide research and investment analysis on the markets and economies of various countries in which the Fund invests and make recommendations on securities of companies located in such countries. The Board concluded that the sub-advisory contracts benefit the Fund and its shareholders by permitting Invesco Advisers to use the resources and talents of the Affiliated Sub-Advisers in managing the Fund. The Board concluded that the nature, extent and quality of the services provided by the Affiliated Sub-Advisers are appropriate and satisfactory and in accordance with the terms of the Fund’s sub-advisory contracts.
The Board considered Fund performance as a relevant factor in considering whether to approve the investment advisory agreement as well as the sub-advisory contracts for the Fund, as Invesco Canada Ltd. currently manages assets of the Fund.
The Board compared the Fund’s performance during the past one, three and five calendar years to the performance of funds in the Lipper performance universe and against the Lipper Small-Cap Core Funds Index. The Board noted that performance of Class A shares of the Fund was in the
23 Invesco Small Companies Fund
fourth quintile of the performance universe for the one year period and the first quintile for the three and five year periods (the first quintile being the best performing funds and the fifth quintile being the worst performing funds). The Board noted that performance of Class A shares of the Fund was below the performance of the Index for the one year period and above the performance of the Index for the three and five year periods. Invesco Advisers advised the Board that the Fund typically invests in 30 different stocks on average and the Fund’s process has significant biases in the stock selection process relative to its peers, which are likely to impact future performance as well. Although the independent written evaluation of the Fund’s Senior Officer only considered Fund performance through the most recent calendar year, the Trustees also reviewed more recent Fund performance and this review did not change their conclusions.
| |
| C. | Advisory and Sub-Advisory Fees and Fee Waivers |
The Board compared the Fund’s contractual advisory fee rate to the contractual advisory fee rates of funds in the Fund’s Lipper expense group at a common asset level. The Board noted that the contractual advisory fee rate for Class A shares of the Fund was below the median contractual advisory fee rate of funds in the expense group. The Board also reviewed the methodology used by Lipper in providing expense group information, which includes using audited financial data from the most recent annual report of each fund in the expense group that was publicly available as of the end of the past calendar year and including only one fund per investment adviser. The Board noted that comparative data is as of varying dates, which may affect the comparability of data during times of market volatility.
The Board noted that Invesco Advisers and the Affiliated Sub-Advisers do not manage other mutual funds or client accounts in a manner substantially similar to the management of the Fund.
The Board also noted that Invesco Advisers has contractually agreed to waive fees and/or limit expenses of the Fund through at least February 28, 2012 in an amount necessary to limit total annual operating expenses to a specified percentage of average daily net assets for each class of the Fund. The Board noted that Invesco Advisers and the Affiliated Sub-Advisers do not advise other client accounts with investment strategies comparable to those of the Fund.
The Board also considered the services provided by the Affiliated Sub-Advisers pursuant to the sub-advisory contracts, as well as the allocation of fees between Invesco Advisers and the Affiliated Sub-Advisers pursuant to the sub-advisory contracts. The Board noted that Invesco Advisers provides services to sub-advised Invesco Funds, including oversight of the Affiliated Sub-Advisers as well as the additional services described above other than day-to-day portfolio management. The Board also noted that the sub-advisory fees have no direct effect on the Fund or its shareholders, as they are paid by Invesco Advisers to the Affiliated Sub-Advisers.
Based upon the information and considerations described above, the Board concluded that the Fund’s advisory and sub-advisory fees are fair and reasonable.
| |
| D. | Economies of Scale and Breakpoints |
The Board considered the extent to which there are economies of scale in the provision of advisory services to the Fund. The Board also considered whether the Fund benefits from economies of scale through contractual breakpoints in the Fund’s advisory fee schedule. The Board also noted that the Fund shares directly in economies of scale through lower fees charged by third party service providers based on the combined size of the Invesco Funds and other clients advised by Invesco Advisers.
| |
| E. | Profitability and Financial Resources |
The Board reviewed information from Invesco Advisers concerning the costs of the advisory and other services that Invesco Advisers and its affiliates provide to the Fund and the profitability of Invesco Advisers and its affiliates in providing these services. The Board reviewed with Invesco Advisers the methodology used to prepare the profitability information. The Board considered the profitability of Invesco Advisers in connection with managing the Fund and the Invesco Funds. The Board noted that Invesco Advisers continues to operate at a net profit from services Invesco Advisers and its subsidiaries provide to the Fund and the Invesco Funds. The Board concluded that the level of profits realized by Invesco Advisers and its affiliates from providing services to the Fund is not excessive given the nature, quality and extent of the services provided to the Invesco Funds. The Board considered whether Invesco Advisers and each Affiliated Sub-Adviser are financially sound and have the resources necessary to perform their obligations under the investment advisory agreement and sub-advisory contracts. The Board concluded that Invesco Advisers and each Affiliated Sub-Adviser have the financial resources necessary to fulfill these obligations.
| |
| F. | Collateral Benefits to Invesco Advisers and its Affiliates |
The Board considered various other benefits received by Invesco Advisers and its affiliates from the relationship with the Fund, including the fees received for their provision of administrative, transfer agency and distribution services to the Fund. The Board considered the performance of Invesco Advisers and its affiliates in providing these services and the organizational structure employed to provide these services. The Board also considered that these services are provided to the Fund pursuant to written contracts that are reviewed and approved on an annual basis by the Board; that the services are required for the operation of the Fund; that Invesco Advisers and its affiliates can provide services, the nature and quality of which are at least equal to those provided by others offering the same or similar services; and that the fees for such services are fair and reasonable in light of the usual and customary charges by others for services of the same nature and quality.
The Board considered the benefits realized by Invesco Advisers and the Affiliated Sub-Advisers as a result of portfolio brokerage transactions executed through “soft dollar” arrangements. The Board noted that soft dollar arrangements shift the payment obligation for research and execution services from Invesco Advisers and the Affiliated Sub-Advisers to the Invesco Funds and therefore may reduce Invesco Advisers’ and the Affiliated Sub-Advisers’ expenses. The Board concluded that the soft dollar arrangements are appropriate. The Board also concluded that, based on their review and representations made by the Chief Compliance Officer of the Invesco Funds, these arrangements are consistent with regulatory requirements.
The Board considered that the Fund’s uninvested cash and cash collateral from any securities lending arrangements may be invested in money market funds advised by Invesco Advisers pursuant to procedures approved by the Board. The Board noted that Invesco Advisers receives advisory fees from these affiliated money market funds attributable to such investments, although Invesco Advisers has contractually agreed to waive through varying periods the advisory fees payable by the Invesco Funds. The waiver is in an amount equal to 100% of the net advisory fee Invesco Advisers receives from the affiliated money market funds with respect to the Fund’s investment in the affiliated money market funds of uninvested cash, but not cash collateral. The Board concluded that the Fund’s investment of uninvested cash and cash collateral from any securities lending arrangements in the affiliated money market funds is in the best interests of the Fund and its shareholders.
24 Invesco Small Companies Fund
Trustees and Officers
The address of each trustee and officer is AIM Investment Funds (Invesco Investment Funds) (the “Trust”), 11 Greenway Plaza, Suite 2500, Houston, Texas 77046-1173. The trustees serve for the life of the Trust, subject to their earlier death, incapacitation, resignation, retirement or removal as more specifically provided in the Trust’s organizational documents. Each officer serves for a one year term or until their successors are elected and qualified. Column two below includes length of time served with predecessor entities, if any.
| | | | | | | | | |
| | | | | | | Number of
| | |
| | | | | | | Funds in
| | |
| | | | | | | Fund Complex
| | |
Name, Year of Birth and
| | Trustee and/
| | Principal Occupation(s)
| | Overseen by
| | Other Directorship(s)
|
| Position(s) Held with the Trust | | or Officer Since | | During Past 5 Years | | Trustee | | Held by Trustee |
| | | | | | | | | |
| | | | | | | | | |
| Interested Persons | | | | | | | | |
| | | | | | | | | |
| | | | | | | | | |
| | | | | | | | | |
Martin L. Flanagan1 — 1960
Trustee | | 2007 | | Executive Director, Chief Executive Officer and President, Invesco Ltd. (ultimate parent of Invesco and a global investment management firm); Advisor to the Board, Invesco Advisers, Inc. (formerly known as Invesco Institutional (N.A.), Inc.); Trustee, The Invesco Funds; Vice Chair, Investment Company Institute; and Member of Executive Board, SMU Cox School of Business
Formerly: Chairman, Invesco Advisers, Inc. (registered investment adviser); Director, Chairman, Chief Executive Officer and President, IVZ Inc. (holding company), INVESCO Group Services, Inc. (service provider) and Invesco North American Holdings, Inc. (holding company); Director, Chief Executive Officer and President, Invesco Holding Company Limited (parent of Invesco and a global investment management firm); Director, Invesco Ltd.; Chairman, Investment Company Institute and President, Co-Chief Executive Officer, Co-President, Chief Operating Officer and Chief Financial Officer, Franklin Resources, Inc. (global investment management organization) | | 141 | | None |
| | | | | | | | | |
| | | | | | | | | |
| | | | | | | | | |
Philip A. Taylor2 — 1954
Trustee, President and
Principal Executive Officer | | 2006 | | Head of North American Retail and Senior Managing Director, Invesco Ltd.; Director, Co-Chairman, Co-President and Co-Chief Executive Officer, Invesco Advisers, Inc. (formerly known as Invesco Institutional (N.A.), Inc.) (registered investment adviser); Director, Chairman, Chief Executive Officer and President, Invesco Management Group, Inc. (formerly Invesco Aim Management Group, Inc.) (financial services holding company); Director and President, INVESCO Funds Group, Inc. (registered investment adviser and registered transfer agent); Director and Chairman, Invesco Investment Services, Inc. (formerly known as Invesco Aim Investment Services, Inc.) (registered transfer agent) and IVZ Distributors, Inc. (formerly known as INVESCO Distributors, Inc.) (registered broker dealer); Director, President and Chairman, Invesco Inc. (holding company) and Invesco Canada Holdings Inc. (holding company); Chief Executive Officer, Invesco Corporate Class Inc. (corporate mutual fund company) and Invesco Canada Fund Inc. (corporate mutual fund company); Director, Chairman and Chief Executive Officer, Invesco Canada Ltd. (formerly known as Invesco Trimark Ltd./Invesco Trimark Ltèe) (registered investment adviser and registered transfer agent); Trustee, President and Principal Executive Officer, The Invesco Funds (other than AIM Treasurer’s Series Trust (Invesco Treasurer’s Series Trust) and Short-Term Investments Trust); Trustee and Executive Vice President, The Invesco Funds (AIM Treasurer’s Series Trust (Invesco Treasurer’s Series Trust) and Short-Term Investments Trust only); Director, Invesco Investment Advisers LLC (formerly known as Van Kampen Asset Management); Director, Chief Executive Officer and President, Van Kampen Exchange Corp.
Formerly: Director and Chairman, Van Kampen Investor Services Inc.: Director, Chief Executive Officer and President, 1371 Preferred Inc. (holding company); and Van Kampen Investments Inc.; Director and President, AIM GP Canada Inc. (general partner for limited partnerships); and Van Kampen Advisors, Inc.; Director and Chief Executive Officer, Invesco Trimark Dealer Inc. (registered broker dealer); Director, Invesco Distributors, Inc. (formerly known as Invesco Aim Distributors, Inc.) (registered broker dealer); Manager, Invesco PowerShares Capital Management LLC; Director, Chief Executive Officer and President, Invesco Advisers, Inc.; Director, Chairman, Chief Executive Officer and President, Invesco Aim Capital Management, Inc.; President, Invesco Trimark Dealer Inc. and Invesco Trimark Ltd./Invesco Trimark Ltèe; Director and President, AIM Trimark Corporate Class Inc. and AIM Trimark Canada Fund Inc.; Senior Managing Director, Invesco Holding Company Limited; Trustee and Executive Vice President, Tax-Free Investments Trust; Director and Chairman, Fund Management Company (former registered broker dealer); President and Principal Executive Officer, The Invesco Funds (AIM Treasurer’s Series Trust (Invesco Treasurer’s Series Trust), Short-Term Investments Trust and Tax-Free Investments Trust only); President, AIM Trimark Global Fund Inc. and AIM Trimark Canada Fund Inc. | | 141 | | None |
| | | | | | | | | |
| | | | | | | | | |
| | | | | | | | | |
Wayne W. Whalen3 — 1939
Trustee | | 2010 | | Of Counsel, and prior to 2010, partner in the law firm of Skadden, Arps, Slate, Meagher & Flom LLP, legal counsel to funds in the Fund Complex | | 159 | | Director of the Abraham Lincoln Presidential Library Foundation |
| | | | | | | | | |
| | | | | | | | | |
| | | | | | | | | |
| Independent Trustees | | | | | | | | |
| | | | | | | | | |
| | | | | | | | | |
| | | | | | | | | |
Bruce L. Crockett — 1944
Trustee and Chair | | 2001 | | Chairman, Crockett Technology Associates (technology consulting company)
Formerly: Director, Captaris (unified messaging provider); Director, President and Chief Executive Officer COMSAT Corporation; and Chairman, Board of Governors of INTELSAT (international communications company) | | 141 | | ACE Limited (insurance company); and Investment Company Institute |
| | | | | | | | | |
| | | | | | | | | |
| | | | | | | | | |
David C. Arch — 1945
Trustee | | 2010 | | Chairman and Chief Executive Officer of Blistex Inc., a consumer health care products manufacturer. | | 159 | | Member of the Heartland Alliance Advisory Board, a nonprofit organization serving human needs based in Chicago. Board member of the Illinois Manufacturers’ Association. Member of the Board of Visitors, Institute for the Humanities, University of Michigan |
| | | | | | | | | |
| |
| 1 | Mr. Flanagan is considered an interested person of the Trust because he is an officer of the adviser to the Trust, and an officer and a director of Invesco Ltd., ultimate parent of the adviser to the Trust. |
| 2 | Mr. Taylor is considered an interested person of the Trust because he is an officer and a director of the adviser to, and a director of the principal underwriter of, the Trust. |
| 3 | Mr. Whalen has been deemed to be an interested person of the Trust because of his prior service as counsel to the predecessor funds of certain Invesco open-end funds and his affiliation with the law firm that served as counsel to such predecessor funds and continues to serve as counsel to the Invesco Van Kampen closed-end funds. |
T-1 Invesco Small Companies Fund
Trustees and Officers—(continued)
The address of each trustee and officer is AIM Investment Funds (Invesco Investment Funds) (the “Trust”), 11 Greenway Plaza, Suite 2500, Houston, Texas 77046-1173. The trustees serve for the life of the Trust, subject to their earlier death, incapacitation, resignation, retirement or removal as more specifically provided in the Trust’s organizational documents. Each officer serves for a one year term or until their successors are elected and qualified. Column two below includes length of time served with predecessor entities, if any.
| | | | | | | | | |
| | | | | | | Number of
| | |
| | | | | | | Funds in
| | |
| | | | | | | Fund Complex
| | |
Name, Year of Birth and
| | Trustee and/
| | Principal Occupation(s)
| | Overseen by
| | Other Directorship(s)
|
| Position(s) Held with the Trust | | or Officer Since | | During Past 5 Years | | Trustee | | Held by Trustee |
| | | | | | | | | |
| | | | | | | | | |
| Independent Trustees—(continued) | | | | | | | | |
| | | | | | | | | |
| | | | | | | | | |
| | | | | | | | | |
Bob R. Baker — 1936
Trustee | | 2003 | | Retired
Formerly: President and Chief Executive Officer, AMC Cancer Research Center; and Chairman and Chief Executive Officer, First Columbia Financial Corporation | | 141 | | None |
| | | | | | | | | |
| | | | | | | | | |
| | | | | | | | | |
Frank S. Bayley — 1939
Trustee | | 1987 | | Retired
Formerly: Director, Badgley Funds, Inc. (registered investment company) (2 portfolios) and Partner, law firm of Baker & McKenzie | | 141 | | Director and Chairman, C.D. Stimson Company (a real estate investment company) |
| | | | | | | | | |
| | | | | | | | | |
| | | | | | | | | |
James T. Bunch — 1942
Trustee | | 2003 | | Founder, Green, Manning & Bunch Ltd. (investment banking firm)
Formerly: Executive Committee, United States Golf Association; and Director, Policy Studies, Inc. and Van Gilder Insurance Corporation | | 141 | | Vice Chairman, Board of Governors, Western Golf Association/Evans Scholars Foundation and Director, Denver Film Society |
| | | | | | | | | |
| | | | | | | | | |
| | | | | | | | | |
Rodney F. Dammeyer — 1940
Trustee | | 2010 | | President of CAC, LLC, a private company offering capital investment and management advisory services.
Formerly: Prior to January 2004, Director of TeleTech Holdings Inc.; Prior to 2002, Director of Arris Group, Inc.; Prior to 2001, Managing Partner at Equity Group Corporate Investments. Prior to 1995, Vice Chairman of Anixter International. Prior to 1985, experience includes Senior Vice President and Chief Financial Officer of Household International, Inc, Executive Vice President and Chief Financial Officer of Northwest Industries, Inc. and Partner of Arthur Andersen & Co. | | 159 | | Director of Quidel Corporation and Stericycle, Inc. Prior to May 2008, Trustee of The Scripps Research Institute. Prior to February 2008, Director of Ventana Medical Systems, Inc. Prior to April 2007, Director of GATX Corporation. Prior to April 2004, Director of TheraSense, Inc. |
| | | | | | | | | |
| | | | | | | | | |
| | | | | | | | | |
Albert R. Dowden — 1941
Trustee | | 2001 | | Director of a number of public and private business corporations, including the Boss Group, Ltd. (private investment and management); Reich & Tang Funds (5 portfolios) (registered investment company); and Homeowners of America Holding Corporation/ Homeowners of America Insurance Company (property casualty company)
Formerly: Director, Continental Energy Services, LLC (oil and gas pipeline service); Director, CompuDyne Corporation (provider of product and services to the public security market) and Director, Annuity and Life Re (Holdings), Ltd. (reinsurance company); Director, President and Chief Executive Officer, Volvo Group North America, Inc.; Senior Vice President, AB Volvo; Director of various public and private corporations; Chairman, DHJ Media, Inc.; Director Magellan Insurance Company; and Director, The Hertz Corporation, Genmar Corporation (boat manufacturer), National Media Corporation; Advisory Board of Rotary Power International (designer, manufacturer, and seller of rotary power engines); and Chairman, Cortland Trust, Inc. (registered investment company) | | 141 | | Board of Nature’s Sunshine Products, Inc. |
| | | | | | | | | |
| | | | | | | | | |
| | | | | | | | | |
Jack M. Fields — 1952
Trustee | | 2001 | | Chief Executive Officer, Twenty First Century Group, Inc. (government affairs company); and Owner and Chief Executive Officer, Dos Angelos Ranch, L.P. (cattle, hunting, corporate entertainment), Discovery Global Education Fund (non-profit) and Cross Timbers Quail Research Ranch (non-profit)
Formerly: Chief Executive Officer, Texana Timber LP (sustainable forestry company) and member of the U.S. House of Representatives | | 141 | | Administaff |
| | | | | | | | | |
| | | | | | | | | |
| | | | | | | | | |
Carl Frischling — 1937
Trustee | | 2001 | | Partner, law firm of Kramer Levin Naftalis and Frankel LLP | | 141 | | Director, Reich & Tang Funds (6 portfolios) |
| | | | | | | | | |
| | | | | | | | | |
| | | | | | | | | |
Prema Mathai-Davis — 1950
Trustee | | 2001 | | Retired
Formerly: Chief Executive Officer, YWCA of the U.S.A. | | 141 | | None |
| | | | | | | | | |
| | | | | | | | | |
| | | | | | | | | |
Larry Soll — 1942
Trustee | | 2003 | | Retired
Formerly, Chairman, Chief Executive Officer and President, Synergen Corp. (a biotechnology company) | | 141 | | None |
| | | | | | | | | |
| | | | | | | | | |
| | | | | | | | | |
Hugo F. Sonnenschein — 1940
Trustee | | 2010 | | President Emeritus and Honorary Trustee of the University of Chicago and the Adam Smith Distinguished Service Professor in the Department of Economics at the University of Chicago. Prior to July 2000, President of the University of Chicago. | | 159 | | Trustee of the University of Rochester and a member of its investment committee. Member of the National Academy of Sciences, the American Philosophical Society and a fellow of the American Academy of Arts and Sciences |
| | | | | | | | | |
| | | | | | | | | |
| | | | | | | | | |
Raymond Stickel, Jr. — 1944
Trustee | | 2005 | | Retired
Formerly: Director, Mainstay VP Series Funds, Inc. (25 portfolios) and Partner, Deloitte & Touche | | 141 | | Director of Long Cove Club Owners’ Association (home owner’s association) |
| | | | | | | | | |
T-2 Invesco Small Companies Fund
Trustees and Officers—(continued)
The address of each trustee and officer is AIM Investment Funds (Invesco Investment Funds) (the “Trust”), 11 Greenway Plaza, Suite 2500, Houston, Texas 77046-1173. The trustees serve for the life of the Trust, subject to their earlier death, incapacitation, resignation, retirement or removal as more specifically provided in the Trust’s organizational documents. Each officer serves for a one year term or until their successors are elected and qualified. Column two below includes length of time served with predecessor entities, if any.
| | | | | | | | | |
| | | | | | | Number of
| | |
| | | | | | | Funds in
| | |
| | | | | | | Fund Complex
| | |
Name, Year of Birth and
| | Trustee and/
| | Principal Occupation(s)
| | Overseen by
| | Other Directorship(s)
|
| Position(s) Held with the Trust | | or Officer Since | | During Past 5 Years | | Trustee | | Held by Trustee |
| | | | | | | | | |
| | | | | | | | | |
| Other Officers | | | | | | | | |
| | | | | | | | | |
| | | | | | | | | |
| | | | | | | | | |
Russell C. Burk — 1958
Senior Vice President and Senior Officer | | 2005 | | Senior Vice President and Senior Officer of Invesco Funds | | N/A | | N/A |
| | | | | | | | | |
| | | | | | | | | |
| | | | | | | | | |
John M. Zerr — 1962
Senior Vice President, Chief Legal Officer and Secretary | | 2006 | | Director, Senior Vice President, Secretary and General Counsel, Invesco Management Group, Inc. (formerly known as Invesco Aim Management Group, Inc.) and Van Kampen Exchange Corp.; Senior Vice President, Invesco Advisers, Inc. (formerly known as Invesco Institutional (N.A.), Inc.) (registered investment adviser); Senior Vice President and Secretary, Invesco Distributors, Inc. (formerly known as Invesco Aim Distributors, Inc.); Director, Vice President and Secretary, Invesco Investment Services, Inc. (formerly known as Invesco Aim Investment Services, Inc.) and IVZ Distributors, Inc. (formerly known as INVESCO Distributors, Inc.); Director and Vice President, INVESCO Funds Group, Inc.; Senior Vice President, Chief Legal Officer and Secretary, The Invesco Funds; Manager, Invesco PowerShares Capital Management LLC; Director, Secretary and General Counsel, Invesco Investment Advisers LLC (formerly known as Van Kampen Asset Management); Secretary and General Counsel, Van Kampen Funds Inc. and Chief Legal Officer, PowerShares Exchange-Traded Fund Trust, PowerShares Exchange-Traded Fund Trust II, PowerShares India Exchange-Traded Fund Trust and PowerShares Actively Managed Exchange-Traded Fund Trust
Formerly: Director and Secretary, Van Kampen Advisors Inc.; Director Vice President, Secretary and General Counsel Van Kampen Investor Services Inc.; Director, Invesco Distributors, Inc. (formerly known as Invesco Aim Distributors, Inc.); Director, Senior Vice President, General Counsel and Secretary, Invesco Advisers, Inc.; and Van Kampen Investments Inc.; Director, Vice President and Secretary, Fund Management Company; Director, Senior Vice President, Secretary, General Counsel and Vice President, Invesco Aim Capital Management, Inc.; Chief Operating Officer and General Counsel, Liberty Ridge Capital, Inc. (an investment adviser); Vice President and Secretary, PBHG Funds (an investment company) and PBHG Insurance Series Fund (an investment company); Chief Operating Officer, General Counsel and Secretary, Old Mutual Investment Partners (a broker-dealer); General Counsel and Secretary, Old Mutual Fund Services (an administrator) and Old Mutual Shareholder Services (a shareholder servicing center); Executive Vice President, General Counsel and Secretary, Old Mutual Capital, Inc. (an investment adviser); and Vice President and Secretary, Old Mutual Advisors Funds (an investment company) | | N/A | | N/A |
| | | | | | | | | |
| | | | | | | | | |
| | | | | | | | | |
Lisa O. Brinkley — 1959
Vice President | | 2004 | | Global Compliance Director, Invesco Ltd.; Chief Compliance Officer, Invesco Investment Services, Inc.(formerly known as Invesco Aim Investment Services, Inc.); and Vice President, The Invesco Funds
Formerly: Chief Compliance Officer, Invesco Distributors, Inc. (formerly known as Invesco Aim Distributors, Inc.) and Van Kampen Investor Services Inc.; Senior Vice President, Invesco Management Group, Inc.; Senior Vice President and Chief Compliance Officer, Invesco Advisers, Inc. and The Invesco Funds; Vice President and Chief Compliance Officer, Invesco Aim Capital Management, Inc. and Invesco Distributors, Inc.; Vice President, Invesco Investment Services, Inc. and Fund Management Company | | N/A | | N/A |
| | | | | | | | | |
| | | | | | | | | |
| | | | | | | | | |
Sheri Morris — 1964
Vice President, Treasurer and Principal Financial Officer | | 1999 | | Vice President, Treasurer and Principal Financial Officer, The Invesco Funds; and Vice President, Invesco Advisers, Inc. (formerly known as Invesco Institutional (N.A.), Inc.) (registered investment adviser).
Formerly: Treasurer, PowerShares Exchange-Traded Fund Trust, PowerShares Exchange--Traded Fund Trust II, PowerShares India Exchange-Traded Fund Trust and PowerShares Actively Managed Exchange-Traded Fund Trust; Vice President, Invesco Advisers, Inc., Invesco Aim Capital Management, Inc. and Invesco Aim Private Asset Management, Inc.; Assistant Vice President and Assistant Treasurer, The Invesco Funds and Assistant Vice President, Invesco Advisers, Inc., Invesco Aim Capital Management, Inc. and Invesco Aim Private Asset Management, Inc. | | N/A | | N/A |
| | | | | | | | | |
| | | | | | | | | |
| | | | | | | | | |
Karen Dunn Kelley — 1960
Vice President | | 2004 | | Head of Invesco’s World Wide Fixed Income and Cash Management Group; Senior Vice President, Invesco Advisers, Inc. (formerly known as Invesco Institutional (N.A.), Inc.) (registered investment adviser); Executive Vice President, Invesco Distributors, Inc. (formerly known as Invesco Aim Distributors, Inc.); Senior Vice President, Invesco Management Group, Inc. (formerly known as Invesco Aim Management Group, Inc.); and Director, Invesco Mortgage Capital Inc.; Vice President, The Invesco Funds (other than AIM Treasurer’s Series Trust (Invesco Treasurer’s Series Trust) and Short-Term Investments Trust); President and Principal Executive Officer, The Invesco Funds (AIM Treasurer’s Series Trust (Invesco Treasurer’s Series Trust) and Short-Term Investments Trust only).
Formerly: Senior Vice President, Van Kampen Investments Inc.; Vice President, Invesco Advisers, Inc. (formerly known as Invesco Institutional (N.A.), Inc.); Director of Cash Management and Senior Vice President, Invesco Advisers, Inc. and Invesco Aim Capital Management, Inc.; President and Principal Executive Officer, Tax-Free Investments Trust; Director and President, Fund Management Company; Chief Cash Management Officer, Director of Cash Management, Senior Vice President, and Managing Director, Invesco Aim Capital Management, Inc.; Director of Cash Management, Senior Vice President, and Vice President, Invesco Advisers, Inc. and The Invesco Funds (AIM Treasurer’s Series Trust (Invesco Treasurer’s Series Trust), Short-Term Investments Trust and Tax-Free Investments Trust only) | | N/A | | N/A |
| | | | | | | | | |
T-3 Invesco Small Companies Fund
Trustees and Officers—(continued)
The address of each trustee and officer is AIM Investment Funds (Invesco Investment Funds) (the “Trust”), 11 Greenway Plaza, Suite 2500, Houston, Texas 77046-1173. The trustees serve for the life of the Trust, subject to their earlier death, incapacitation, resignation, retirement or removal as more specifically provided in the Trust’s organizational documents. Each officer serves for a one year term or until their successors are elected and qualified. Column two below includes length of time served with predecessor entities, if any.
| | | | | | | | | |
| | | | | | | Number of
| | |
| | | | | | | Funds in
| | |
| | | | | | | Fund Complex
| | |
Name, Year of Birth and
| | Trustee and/
| | Principal Occupation(s)
| | Overseen by
| | Other Directorship(s)
|
| Position(s) Held with the Trust | | or Officer Since | | During Past 5 Years | | Trustee | | Held by Trustee |
| | | | | | | | | |
| | | | | | | | | |
| Other Officers—(continued) | | | | | | | | |
| | | | | | | | | |
| | | | | | | | | |
| | | | | | | | | |
Lance A. Rejsek — 1967
Anti-Money Laundering Compliance Officer | | 2005 | | Anti-Money Laundering Compliance Officer, Invesco Advisers, Inc. (formerly known as Invesco Institutional (N.A.), Inc.) (registered investment adviser); Invesco Distributors, Inc. (formerly known as Invesco Aim Distributors, Inc.), Invesco Investment Services, Inc. (formerly known as Invesco Aim Investment Services, Inc.), The Invesco Funds, PowerShares Exchange-Traded Fund Trust, PowerShares Exchange-Traded Fund Trust II, PowerShares India Exchange-Traded Fund Trust, PowerShares Actively Managed Exchange-Traded Fund Trust, Invesco Investment Advisers LLC (formerly known as Van Kampen Asset Management) and Van Kampen Funds Inc.
Formerly: Anti-Money Laundering Compliance Officer, Van Kampen Investor Services Inc., Fund Management Company, Invesco Advisers, Inc., Invesco Aim Capital Management, Inc. and Invesco Aim Private Asset Management, Inc. | | N/A | | N/A |
| | | | | | | | | |
| | | | | | | | | |
| | | | | | | | | |
Todd L. Spillane — 1958
Chief Compliance Officer | | 2006 | | Senior Vice President, Invesco Management Group, Inc. (formerly known as Invesco Aim Management Group, Inc.) and Van Kampen Exchange Corp.; Senior Vice President and Chief Compliance Officer, Invesco Advisers, Inc. (registered investment adviser) (formerly known as Invesco Institutional (N.A.), Inc.); Chief Compliance Officer, The Invesco Funds, PowerShares Exchange-Traded Fund Trust, PowerShares Exchange-Traded Fund Trust II, PowerShares India Exchange-Traded Fund Trust, PowerShares Actively Managed Exchange-Traded Fund Trust, INVESCO Private Capital Investments, Inc. (holding company) and Invesco Private Capital, Inc. (registered investment adviser); Vice President, Invesco Distributors, Inc. (formerly known as Invesco Aim Distributors, Inc.) and Invesco Investment Services, Inc. (formerly known as Invesco Aim Investment Services, Inc.).
Formerly: Chief Compliance Officer, Invesco Van Kampen Closed-End Funds; Senior Vice President, Van Kampen Investments Inc.; Senior Vice President and Chief Compliance Officer, Invesco Advisers, Inc. and Invesco Aim Capital Management, Inc.; Chief Compliance Officer, Invesco Global Asset Management (N.A.), Inc., Invesco Senior Secured Management, Inc. (registered investment adviser) and Van Kampen Investor Services Inc.; Vice President, Invesco Aim Capital Management, Inc. and Fund Management Company | | N/A | | N/A |
| | | | | | | | | |
The Statement of Additional Information of the Trust includes additional information about the Fund’s Trustees and is available upon request, without charge, by calling 1.800.959.4246. Please refer to the Fund’s prospectus for information on the Fund’s sub-advisers.
| | | | | | | |
Office of the Fund
11 Greenway Plaza, Suite 2500
Houston, TX 77046-1173 | | Investment Adviser
Invesco Advisers, Inc.
1555 Peachtree Street, N.E.
Atlanta, GA 30309 | | Distributor
Invesco Distributors, Inc.
11 Greenway Plaza, Suite 2500
Houston, TX 77046-1173 | | Auditors
PricewaterhouseCoopers LLP
1201 Louisiana Street, Suite 2900
Houston, TX 77002-5678 |
| | | | | | | |
| | | | | | | |
Counsel to the Fund
Stradley Ronon Stevens & Young, LLP
2600 One Commerce Square
Philadelphia, PA 19103 | | Counsel to the Independent Trustees
Kramer, Levin, Naftalis & Frankel LLP
1177 Avenue of the Americas
New York, NY 10036-2714 | | Transfer Agent
Invesco Investment Services, Inc. 11 Greenway Plaza, Suite 2500
Houston, TX 77046-1173 | | Custodian
State Street Bank and Trust Company
225 Franklin
Boston, MA 02110-2801 |
T-4 Invesco Small Companies Fund
Invesco mailing information
Send general correspondence to Invesco Investment Services, Inc., P.O. Box 219078, Kansas City, MO 64121-9078.
Invesco privacy policy
You share personal and financial information with us that is necessary for your transactions and your account records. We take very seriously the obligation to keep that information confidential and private.
Invesco collects nonpublic personal information about you from account applications or other forms you complete and from your transactions with us or our affiliates. We do not disclose information about you or our former customers to service providers or other third parties except to the extent necessary to service your account and in other limited circumstances as permitted by law. For example, we use this information to facilitate the delivery of transaction confirmations, financial reports, prospectuses and tax forms.
Even within Invesco, only people involved in the servicing of your accounts and compliance monitoring have access to your information. To ensure the highest level of confidentiality and security, Invesco maintains physical, electronic and procedural safeguards that meet or exceed federal standards. Special measures, such as data encryption and authentication, apply to your communications with us on our website. More detail is available to you at invesco.com/privacy.
Important notice regarding delivery of security holder documents
To reduce Fund expenses, only one copy of most shareholder documents may be mailed to shareholders with multiple accounts at the same address (Householding). Mailing of your shareholder documents may be householded indefinitely unless you instruct us otherwise. If you do not want the mailing of these documents to be combined with those for other members of your household, please contact Invesco Investment Services, Inc. at 800 959 4246 or contact your financial institution. We will begin sending you individual copies for each account within 30 days after receiving your request.
Fund holdings and proxy voting information
The Fund provides a complete list of its holdings four times in each fiscal year, at the quarter-ends. For the second and fourth quarters, the lists appear in the Fund’s semiannual and annual reports to shareholders. For the first and third quarters, the Fund files the lists with the Securities and Exchange Commission (SEC) on Form N-Q. The most recent list of portfolio holdings is available at invesco.com/completeqtrholdings. Shareholders can also look up the Fund’s Forms N-Q on the SEC website at sec.gov. Copies of the Fund’s Forms N-Q may be reviewed and copied at the SEC Public Reference Room in Washington, D.C. You can obtain information on the operation of the Public Reference Room, including information about duplicating fee charges, by calling 202 551 8090 or 800 732 0330, or by electronic request at the following email address: publicinfo@sec.gov. The SEC file numbers for the Fund are 811-05426 and 033-19338.
A description of the policies and procedures that the Fund uses to determine how to vote proxies relating to portfolio securities is available without charge, upon request, from our Client Services department at 800 959 4246 or at invesco.com/proxyguidelines. The information is also available on the SEC website, sec.gov.
Information regarding how the Fund voted proxies related to its portfolio securities during the 12 months ended June 30, 2011, is available at invesco.com/proxysearch. The information is also available on the SEC website, sec.gov.
Invesco Advisers, Inc. is an investment adviser; it provides investment advisory services to individual and institutional clients and does not sell securities. Invesco Distributors, Inc. is the U.S. distributor for Invesco Ltd.’s retail mutual funds, exchange-traded funds and institutional money market funds. Both are wholly owned, indirect subsidiaries of Invesco Ltd.
SCO-AR-1 Invesco Distributors, Inc.
ITEM 2. CODE OF ETHICS.
| | | | The Registrant did not grant any waivers, including implicit waivers, from any provisions of the Code to the PEO or PFO during the period covered by this report. |
ITEM 3. AUDIT COMMITTEE FINANCIAL EXPERT.
| | | | The Board of Trustees has determined that the Registrant has at least one audit committee financial expert serving on its Audit Committee. The Audit Committee financial expert is Raymond Stickel, Jr. Mr. Stickel is “independent” within the meaning of that term as used in Form N-CSR. |
ITEM 4. PRINCIPAL ACCOUNTANT FEES AND SERVICES.
Fees Billed by Principal Accountant Related to the Registrant
PWC billed the Registrant aggregate fees for services rendered to the Registrant for the last two fiscal years as follows:
| | | | | | | | | | | | | | | | | |
| | | | | | | Percentage of Fees | | | | | | | Percentage of Fees | |
| | | | | | | Billed Applicable to | | | | | | | Billed Applicable to | |
| | | | | | | Non-Audit Services | | | | | | | Non-Audit Services | |
| | | Fees Billed for | | | Provided for fiscal | | | Fees Billed for | | | Provided for fiscal | |
| | | Services Rendered to | | | year end 10/31/2011 | | | Services Rendered to | | | year end 10/31/2010 | |
| | | the Registrant for | | | Pursuant to Waiver of | | | the Registrant for | | | Pursuant to Waiver of | |
| | | fiscal year end | | | Pre-Approval | | | fiscal year end | | | Pre-Approval | |
| | | 10/31/2011 | | | Requirement(1) | | | 10/31/2010 | | | Requirement(1) | |
| Audit Fees | | $ | 413,480 | | | | N/A | | | $ | 386,000 | | | | N/A | |
Audit-Related Fees(2) | | $ | 12,750 | | | | 0 | % | | $ | 0 | | | | 0 | % |
Tax Fees(3) | | $ | 123,400 | | | | 0 | % | | $ | 79,700 | | | | 0 | % |
| All Other Fees | | $ | 0 | | | | 0 | % | | $ | 0 | | | | 0 | % |
| | | | | | | | | | | | | | | |
| Total Fees | | $ | 549,630 | | | | 0 | % | | $ | 465,700 | | | | 0 | % |
PWC billed the Registrant aggregate non-audit fees of $136,150 for the fiscal year ended October 31, 2011, and $79,700 for the fiscal year ended October 31, 2010, for non-audit services rendered to the Registrant.
| | |
| (1) | | With respect to the provision of non-audit services, the pre-approval requirement is waived pursuant to a de minimis exception if (i) such services were not recognized as non-audit services by the Registrant at the time of engagement, (ii) the aggregate amount of all such services provided is no more than 5% of the aggregate audit and non-audit fees paid by the Registrant to PWC during a fiscal year; and (iii) such services are promptly brought to the attention of the Registrant’s Audit Committee and approved by the Registrant’s Audit Committee prior to the completion of the audit. |
| |
| (2) | | Audit-Related fees for the fiscal year end October 31, 2011 includes fees billed for agreed upon procedures related to fund mergers. |
| |
| (3) | | Tax fees for the fiscal year end October 31, 2011 includes fees billed for reviewing tax returns. Tax fees for the fiscal year end October 31, 2010 includes fees billed for reviewing tax returns. |
Fees Billed by PWC Related to Invesco and Invesco Affiliates
PWC billed Invesco Advisers, Inc. (“Invesco”), the Registrant’s adviser, and any entity controlling, controlled by or under common control with Invesco that provides ongoing services to the Registrant (“Invesco Affiliates”) aggregate fees for pre-approved non-audit services rendered to Invesco and Invesco Affiliates for the last two fiscal years as follows:
| | | | | | | | | | | | | | | | | |
| | | Fees Billed for Non- | | | | | | | Fees Billed for Non- | | | | |
| | | Audit Services | | | | | | | Audit Services | | | | |
| | | Rendered to Invesco | | | Percentage of Fees | | | Rendered to Invesco | | | Percentage of Fees | |
| | | and Invesco Affiliates | | | Billed Applicable to | | | and Invesco Affiliates | | | Billed Applicable to | |
| | | for fiscal year end | | | Non-Audit Services | | | for fiscal year end | | | Non-Audit Services | |
| | | 10/31/2011 That Were | | | Provided for fiscal year | | | 10/31/2010 That Were | | | Provided for fiscal year | |
| | | Required | | | end 10/31/2011 | | | Required | | | end 10/31/2010 | |
| | | to be Pre-Approved | | | Pursuant to Waiver of | | | to be Pre-Approved | | | Pursuant to Waiver of | |
| | | by the Registrant’s | | | Pre-Approval | | | by the Registrant’s | | | Pre-Approval | |
| | | Audit Committee | | | Requirement(1) | | | Audit Committee | | | Requirement(1) | |
| Audit-Related Fees | | $ | 0 | | | | 0 | % | | $ | 0 | | | | 0 | % |
| Tax Fees | | $ | 0 | | | | 0 | % | | $ | 0 | | | | 0 | % |
| All Other Fees | | $ | 0 | | | | 0 | % | | $ | 0 | | | | 0 | % |
| | | | | | | | | | | | | | | |
Total Fees(2) | | $ | 0 | | | | 0 | % | | $ | 0 | | | | 0 | % |
| | |
| (1) | | With respect to the provision of non-audit services, the pre-approval requirement is waived pursuant to a de minimis exception if (i) such services were not recognized as non-audit services by the Registrant at the time of engagement, (ii) the aggregate amount of all such services provided is no more than 5% of the aggregate audit and non-audit fees paid by the Registrant, Invesco and Invesco Affiliates to PWC during a fiscal year; and (iii) such services are promptly brought to the attention of the Registrant’s Audit Committee and approved by the Registrant’s Audit Committee prior to the completion of the audit. |
| |
| (2) | | Including the fees for services not required to be pre-approved by the registrant’s audit committee, PWC billed Invesco and Invesco Affiliates aggregate non-audit fees of $0 for the fiscal year ended October 31, 2011, and $0 for the fiscal year ended October 31, 2010, for non-audit services rendered to Invesco and Invesco Affiliates. |
| |
| | | The Audit Committee also has considered whether the provision of non-audit services that were rendered to Invesco and Invesco Affiliates that were not required to be pre-approved pursuant to SEC regulations, if any, is compatible with maintaining PWC’s independence. To the extent that such services were provided, the Audit Committee determined that the provision of such services is compatible with PWC maintaining independence with respect to the Registrant. |
PRE-APPROVAL OF AUDIT AND NON-AUDIT SERVICES
POLICIES AND PROCEDURES
As adopted by the Audit Committees of
the Invesco Funds (the “Funds”)
Last Amended May 4, 2010
Statement of Principles
Under the Sarbanes-Oxley Act of 2002 and rules adopted by the Securities and Exchange Commission (“SEC”) (“Rules”), the Audit Committees of the Funds’ (the “Audit Committees”) Board of Trustees (the “Board”) are responsible for the appointment, compensation and oversight of the work of independent accountants (an “Auditor”). As part of this responsibility and to assure that the Auditor’s independence is not impaired, the Audit Committees pre-approve the audit and non-audit services provided to the Funds by each Auditor, as well as all non-audit services provided by the Auditor to the Funds’ investment adviser and to affiliates of the adviser that provide ongoing services to the Funds (“Service Affiliates”) if the services directly impact the Funds’ operations or financial reporting. The SEC Rules also specify the types of services that an Auditor may not provide to its audit client. The following policies and procedures comply with the requirements for pre-approval and provide a mechanism by which management of the Funds may request and secure pre-approval of audit and non-audit services in an orderly manner with minimal disruption to normal business operations.
Proposed services either may be pre-approved without consideration of specific case-by-case services by the Audit Committees (“general pre-approval”) or require the specific pre-approval of the Audit Committees (“specific pre-approval”). As set forth in these policies and procedures, unless a type of service has received general pre-approval, it will require specific pre-approval by the Audit Committees. Additionally, any fees exceeding 110% of estimated pre-approved fee levels provided at the time the service was pre-approved will also require specific approval by the Audit Committees before payment is made. The Audit Committees will also consider the impact of additional fees on the Auditor’s independence when determining whether to approve any additional fees for previously pre-approved services.
The Audit Committees will annually review and generally pre-approve the services that may be provided by each Auditor without obtaining specific pre-approval from the Audit Committee generally on an annual basis. The term of any general pre-approval runs from the date of such pre-approval through September 30th of the following year, unless the Audit Committees consider a different period and state otherwise. The Audit Committees will add to or subtract from the list of general pre-approved services from time to time, based on subsequent determinations.
The purpose of these policies and procedures is to set forth the guidelines to assist the Audit Committees in fulfilling their responsibilities.
Delegation
The Audit Committees may from time to time delegate pre-approval authority to one or more of its members who are Independent Trustees. All decisions to pre-approve a service by a delegated member shall be reported to the Audit Committees at the next quarterly meeting.
Audit Services
The annual audit services engagement terms will be subject to specific pre-approval of the Audit Committees. Audit services include the annual financial statement audit and other procedures such as tax provision work that is required to be performed by the independent auditor to be able to form an opinion on the Funds’ financial statements. The Audit Committees will obtain, review and consider sufficient information concerning the proposed Auditor to make a reasonable evaluation of the Auditor’s qualifications and independence.
In addition to the annual Audit services engagement, the Audit Committees may grant either general or specific pre-approval of other audit services, which are those services that only the independent auditor reasonably can provide. Other Audit services may include services such as issuing consents for the
inclusion of audited financial statements with SEC registration statements, periodic reports and other documents filed with the SEC or other documents issued in connection with securities offerings.
Non-Audit Services
The Audit Committees may provide either general or specific pre-approval of any non-audit services to the Funds and its Service Affiliates if the Audit Committees believe that the provision of the service will not impair the independence of the Auditor, is consistent with the SEC’s Rules on auditor independence, and otherwise conforms to the Audit Committees’ general principles and policies as set forth herein.
Audit-Related Services
“Audit-related services” are assurance and related services that are reasonably related to the performance of the audit or review of the Fund’s financial statements or that are traditionally performed by the independent auditor. Audit-related services include, among others, accounting consultations related to accounting, financial reporting or disclosure matters not classified as “Audit services”; assistance with understanding and implementing new accounting and financial reporting guidance from rulemaking authorities; and agreed-upon procedures related to mergers, compliance with ratings agency requirements and interfund lending activities.
Tax Services
“Tax services” include, but are not limited to, the review and signing of the Funds’ federal tax returns, the review of required distributions by the Funds and consultations regarding tax matters such as the tax treatment of new investments or the impact of new regulations. The Audit Committees will scrutinize carefully the retention of the Auditor in connection with a transaction initially recommended by the Auditor, the major business purpose of which may be tax avoidance or the tax treatment of which may not be supported in the Internal Revenue Code and related regulations. The Audit Committees will consult with the Funds’ Treasurer (or his or her designee) and may consult with outside counsel or advisors as necessary to ensure the consistency of Tax services rendered by the Auditor with the foregoing policy.
No Auditor shall represent any Fund or any Service Affiliate before a tax court, district court or federal court of claims.
Under rules adopted by the Public Company Accounting Oversight Board and approved by the SEC, in connection with seeking Audit Committees’ pre-approval of permissible Tax services, the Auditor shall:
| | 1. | | Describe in writing to the Audit Committees, which writing may be in the form of the proposed engagement letter: |
| | a. | | The scope of the service, the fee structure for the engagement, and any side letter or amendment to the engagement letter, or any other agreement between the Auditor and the Fund, relating to the service; and |
| |
| | b. | | Any compensation arrangement or other agreement, such as a referral agreement, a referral fee or fee-sharing arrangement, between the Auditor and any person (other than the Fund) with respect to the promoting, marketing, or recommending of a transaction covered by the service; |
| | 2. | | Discuss with the Audit Committees the potential effects of the services on the independence of the Auditor; and |
| |
| | 3. | | Document the substance of its discussion with the Audit Committees. |
All Other Auditor Services
The Audit Committees may pre-approve non-audit services classified as “All other services” that are not categorically prohibited by the SEC, as listed in Exhibit 1 to this policy.
Pre-Approval Fee Levels or Established Amounts
Pre-approval of estimated fees or established amounts for services to be provided by the Auditor under general or specific pre-approval policies will be set periodically by the Audit Committees. Any proposed fees exceeding 110% of the maximum estimated pre-approved fees or established amounts for pre-approved audit and non-audit services will be reported to the Audit Committees at the quarterly Audit Committees meeting and will require specific approval by the Audit Committees before payment is made. The Audit Committees will always factor in the overall relationship of fees for audit and non-audit services in determining whether to pre-approve any such services and in determining whether to approve any additional fees exceeding 110% of the maximum pre-approved fees or established amounts for previously pre-approved services.
Procedures
Generally on an annual basis, Invesco Advisers, Inc. (“Invesco”) will submit to the Audit Committees for general pre-approval, a list of non-audit services that the Funds or Service Affiliates of the Funds may request from the Auditor. The list will describe the non-audit services in reasonable detail and will include an estimated range of fees and such other information as the Audit Committee may request.
Each request for services to be provided by the Auditor under the general pre-approval of the Audit Committees will be submitted to the Funds’ Treasurer (or his or her designee) and must include a detailed description of the services to be rendered. The Treasurer or his or her designee will ensure that such services are included within the list of services that have received the general pre-approval of the Audit Committees. The Audit Committees will be informed at the next quarterly scheduled Audit Committees meeting of any such services for which the Auditor rendered an invoice and whether such services and fees had been pre-approved and if so, by what means.
Each request to provide services that require specific approval by the Audit Committees shall be submitted to the Audit Committees jointly by the Fund’s Treasurer or his or her designee and the Auditor, and must include a joint statement that, in their view, such request is consistent with the policies and procedures and the SEC Rules.
Each request to provide tax services under either the general or specific pre-approval of the Audit Committees will describe in writing: (i) the scope of the service, the fee structure for the engagement, and any side letter or amendment to the engagement letter, or any other agreement between the Auditor and the audit client, relating to the service; and (ii) any compensation arrangement or other agreement between the Auditor and any person (other than the audit client) with respect to the promoting, marketing, or recommending of a transaction covered by the service. The Auditor will discuss with the Audit Committees the potential effects of the services on the Auditor’s independence and will document the substance of the discussion.
Non-audit services pursuant to the de minimis exception provided by the SEC Rules will be promptly brought to the attention of the Audit Committees for approval, including documentation that each of the conditions for this exception, as set forth in the SEC Rules, has been satisfied.
On at least an annual basis, the Auditor will prepare a summary of all the services provided to any entity in the investment company complex as defined in section 2-01(f)(14) of Regulation S-X in sufficient detail as to the nature of the engagement and the fees associated with those services.
The Audit Committees have designated the Funds’ Treasurer to monitor the performance of all services provided by the Auditor and to ensure such services are in compliance with these policies and procedures. The Funds’ Treasurer will report to the Audit Committees on a periodic basis as to the results of such monitoring. Both the Funds’ Treasurer and management of Invesco will immediately report to the chairman of the Audit Committees any breach of these policies and procedures that comes to the attention of the Funds’ Treasurer or senior management of Invesco.
Exhibit 1 to Pre-Approval of Audit and Non-Audit Services Policies and Procedures
Conditionally Prohibited Non-Audit Services (not prohibited if the Fund can reasonably conclude that the results of the service would not be subject to audit procedures in connection with the audit of the Fund’s financial statements)
| | • | | Bookkeeping or other services related to the accounting records or financial statements of the audit client |
| |
| | • | | Financial information systems design and implementation |
| |
| | • | | Appraisal or valuation services, fairness opinions, or contribution-in-kind reports |
| |
| | • | | Actuarial services |
| |
| | • | | Internal audit outsourcing services |
Categorically Prohibited Non-Audit Services
| | • | | Management functions |
| |
| | • | | Human resources |
| |
| | • | | Broker-dealer, investment adviser, or investment banking services |
| |
| | • | | Legal services |
| |
| | • | | Expert services unrelated to the audit |
| |
| | • | | Any service or product provided for a contingent fee or a commission |
| |
| | • | | Services related to marketing, planning, or opining in favor of the tax treatment of confidential transactions or aggressive tax position transactions, a significant purpose of which is tax avoidance |
| |
| | • | | Tax services for persons in financial reporting oversight roles at the Fund |
| |
| | • | | Any other service that the Public Company Oversight Board determines by regulation is impermissible. |
ITEM 5. AUDIT COMMITTEE OF LISTED REGISTRANTS.
ITEM 6. SCHEDULE OF INVESTMENTS.
| | | | Investments in securities of unaffiliated issuers is included as part of the reports to stockholders filed under Item 1 of this Form. |
ITEM 7. DISCLOSURE OF PROXY VOTING POLICIES AND PROCEDURES FOR CLOSED-END MANAGEMENT INVESTMENT COMPANIES.
ITEM 8. PORTFOLIO MANAGERS OF CLOSED-END MANAGEMENT COMPANIES.
ITEM 9. PURCHASES OF EQUITY SECURITIES BY CLOSED-END MANAGEMENT INVESTMENT COMPANY AND AFFILIATED PURCHASERS.
ITEM 10. SUBMISSION OF MATTERS TO A VOTE OF SECURITY HOLDERS.
ITEM 11. CONTROLS AND PROCEDURES.
| (a) | | As of December 15, 2011, an evaluation was performed under the supervision and with the participation of the officers of the Registrant, including the PEO and PFO, to assess |
| | | the effectiveness of the Registrant’s disclosure controls and procedures, as that term is defined in Rule 30a-3(c) under the Investment Company Act of 1940 (the “Act”), as amended. Based on that evaluation, the Registrant’s officers, including the PEO and PFO, concluded that, as of December 15, 2011, the Registrant’s disclosure controls and procedures were reasonably designed to ensure: (1) that information required to be disclosed by the Registrant on Form N-CSR is recorded, processed, summarized and reported within the time periods specified by the rules and forms of the Securities and Exchange Commission; and (2) that material information relating to the Registrant is made known to the PEO and PFO as appropriate to allow timely decisions regarding required disclosure. |
| |
| (b) | | There have been no changes in the Registrant’s internal control over financial reporting (as defined in Rule 30a-3(d) under the Act) that occurred during the second fiscal quarter of the period covered by this report that have materially affected, or are reasonably likely to materially affect, the Registrant’s internal control over financial reporting. |
ITEM 12. EXHIBITS.
| 12(a) (1) | | Code of Ethics. |
| |
| 12(a) (2) | | Certifications of principal executive officer and principal financial officer as required by Rule 30a-2(a) under the Investment Company Act of 1940. |
| |
| 12(a) (3) | | Not applicable. |
| |
| 12(b) | | Certifications of principal executive officer and principal financial officer as required by Rule 30a-2(b) under the Investment Company Act of 1940. |
SIGNATURES
Pursuant to the requirements of the Securities Exchange Act of 1934 and the Investment Company Act of 1940, the Registrant has duly caused this report to be signed on its behalf by the undersigned, thereunto duly authorized.
| | | | | |
|
| Registrant: AIM Investment Funds (Invesco Investment Funds) |
| | | | | |
| By: | | /s/ Philip A. Taylor Philip A. Taylor | | |
| | | Principal Executive Officer | | |
| | | | | |
| Date: | | January 9, 2012 | | |
Pursuant to the requirements of the Securities and Exchange Act of 1934 and the Investment Company Act of 1940, this report has been signed below by the following persons on behalf of the Registrant and in the capacities and on the dates indicated.
| | | | | |
|
| By: | | /s/ Philip A. Taylor Philip A. Taylor | | |
| | | Principal Executive Officer | | |
| | | | | |
| Date: | | January 9, 2012 | | |
| | | | | |
| By: | | /s/ Sheri Morris Sheri Morris | | |
| | | Principal Financial Officer | | |
| | | | | |
| Date: | | January 9, 2012 | | |
EXHIBIT INDEX
| | | |
| 12(a)(1) | | Code of Ethics. |
| | | |
| 12(a)(2) | | Certifications of principal executive officer and principal Financial officer as required by Rule 30a-2(a) under the Investment Company Act of 1940. |
| | | |
| 12(a)(3) | | Not applicable. |
| | | |
| 12(b) | | Certifications of principal executive officer and principal financial officer as required by Rule 30a-2(b) under the Investment Company Act of 1940. |