| | | | |
OMB APPROVAL |
| OMB Number: | | 3235-0570 |
| Expires: | | January 31, 2017 |
| Estimated average burden |
| hours per response: | | 20.6 |
UNITED STATES
SECURITIES AND EXCHANGE COMMISSION
Washington, D.C. 20549
FORM N-CSR
CERTIFIED SHAREHOLDER REPORT OF REGISTERED
MANAGEMENT INVESTMENT COMPANIES
Investment Company Act file number 811-05426
AIM Investment Funds (Invesco Investment Funds)
(Exact name of registrant as specified in charter)
11 Greenway Plaza,
Suite 1000 Houston, Texas 77046
(Address of principal executive offices) (Zip code)
Philip A. Taylor
11 Greenway Plaza,
Suite 1000 Houston, Texas 77046
(Name and address of agent for service)
Registrant’s telephone number, including area code: (713) 626-1919
Date of fiscal year end: 10/31
Date of reporting period: 10/31/14
Item 1. Report to Stockholders.

Letters to Shareholders
| | | | |

Philip Taylor | | | | Dear Shareholders: This annual report includes information about your Fund, including performance data and a complete list of its investments as of the close of the reporting period. Inside, your Fund’s portfolio managers discuss how they managed your Fund and the factors that affected its performance during the reporting period. I hope you find this report of interest. During the reporting period covered by this report, the US economy showed signs of continued improvement. After contracting in the first quarter of 2014, the economy expanded strongly in the second quarter and unemployment trended lower. Much of the credit for this improvement goes to the US Federal Reserve (the Fed), which undertook an extraordinary asset purchase program following the global financial crisis. The Fed’s goal was to jumpstart the economy by encouraging banks to lend more, businesses to hire more and consumers to spend more. Signs of a stronger US economy prompted the Fed to reduce, or “taper,” its asset |
purchase program. Despite this, interest rates remained near historical low levels due largely to heavy investor demand for bonds. While signs of economic improvement were evident in the US, European economies showed signs of weakening. That, together with geopolitical uncertainty and worries about the first diagnosed cases of Ebola outside of Africa, caused increased volatility in US and European equities.
Extended periods of market strength can lull investors into complacency – just as prolonged periods of market weakness or volatility can discourage investors from initiating long-term investment plans. That’s why Invesco has always encouraged investors to work with a professional financial adviser who can stress the importance of starting to save and invest early and the importance of adhering to a disciplined investment plan – when times are good and when they’re uncertain. A financial adviser who knows your unique financial situation, investment goals and risk tolerance can be an invaluable partner as you seek to achieve your financial goals. He or she can offer a long-term perspective when markets are volatile and time-tested advice and guidance when your financial situation or investment goals change.
Timely information when and where you want it
Invesco’s efforts to help investors achieve their financial objectives include providing individual investors and financial professionals with timely information about the markets, the economy and investing – whenever and wherever they want it.
Our website, invesco.com/us, offers a wide range of market insights and investment perspectives. On the website, you’ll find detailed information about our funds, including prices, performance, holdings and portfolio manager commentaries. You can access information about your individual Invesco account whenever it’s convenient for you; just complete a simple, secure online registration. Use the “Log In” box on our home page to get started.
Invesco’s mobile app for iPad® (available free from the App StoreSM) allows you to obtain the same detailed information about your Fund and the same investment insights from our investment leaders, market strategists, economists and retirement experts on the go. You also can watch portfolio manager videos and have instant access to Invesco news and updates wherever you may be.
In addition to the resources accessible on our website and through our mobile app, you can obtain timely updates to help you stay informed about the markets, the economy and investing by connecting with Invesco on Twitter, LinkedIn or Facebook. You can access our blog at blog.invesco.us.com. Our goal is to provide you the information you want, when and where you want it.
Have questions?
For questions about your account, feel free to contact an Invesco client services representative at 800 959 4246. For Invesco-related questions or comments, please email me directly at phil@invesco.com.
All of us at Invesco look forward to serving your investment management needs for many years to come. Thank you for investing with us.
Sincerely,

Philip Taylor
Senior Managing Director, Invesco Ltd.
iPad is a trademark of Apple Inc., registered in the US and other countries. App Store is a service mark of Apple Inc. Invesco Distributors, Inc. is not affiliated with Apple Inc.
|
| 2 Invesco All Cap Market Neutral Fund |
| | | | |

Bruce Crockett | | | | Dear Fellow Shareholders: There are a variety of factors that can impact investment performance, many of which are uncontrollable by us as investors. These factors can include various economic trends and geopolitical developments. While the members of the Invesco Funds Board, which I chair, can’t dictate the performance of the Invesco funds, be assured that your Board works diligently throughout the year to focus on how your investments are managed. Our job is to represent you and your interests on a variety of fund management-related matters. We regularly monitor how the portfolio management teams of the Invesco funds are performing in light of ever-changing and often unpredictable economic and market conditions. We review the investment strategies and investment process employed by each fund’s management team as explained in the fund’s prospectus. Perhaps our most significant responsibility is conducting the annual review of the funds’ |
advisory and sub-advisory contracts with Invesco Advisers and its affiliates. This annual review, which is required by the Investment Company Act of 1940, focuses on the nature and quality of the services Invesco provides as the adviser to the Invesco funds and the reasonableness of the fees that it charges for those services. Each year, we spend months carefully reviewing information from Invesco that allows us to evaluate the quality of its services and the reasonableness of its fees. We also use information from a variety of independent sources, including materials provided by the independent senior officer of the Invesco funds, who reports directly to the independent trustees on the Board. Additionally, we meet with legal counsel and review performance and fee data prepared for us by Lipper Inc., an independent, third-party firm widely recognized as a leader in its field.
After a careful review, the members of the Invesco Funds Board approved the continuation of advisory and sub-advisory contracts with Invesco Advisers and its affiliates. Be assured that your Board will continue working on behalf of fund shareholders, keeping your needs and interests uppermost in our minds.
As always, please contact me at bruce@brucecrockett.com with any questions or concerns you may have. On behalf of the Board, we look forward to continuing to represent your interests and serving your needs.
Sincerely,

Bruce L. Crockett
Independent Chair
Invesco Funds Board of Trustees
|
| 3 Invesco All Cap Market Neutral Fund |
Management’s Discussion of Fund Performance
Performance summary
Invesco All Cap Market Neutral Fund incepted on December 17, 2013. From the Fund’s inception to the end of the reporting period, the Fund outperformed the Citi US T-Bill 3 Month Index and the Lipper Alternative Equity Market Neutral Index, its broad market/style-specific and its peer group benchmarks, respectively. Stock selection added to total return in six of 10 sectors, led by health care and information technology (IT). The largest detractor from Fund results was stock selection in the energy sector.
Additional performance information for your Fund appears later in this report.
Fund vs. Indexes
Cumulative total returns, 12/17/13 to 10/31/14, at net asset value (NAV). Performance shown does not include applicable contingent deferred sales charges (CDSC) or front-end sales charges, which would have reduced performance.
| | | | | |
| Class A Shares | | | | 7.00 | % |
| Class C Shares | | | | 6.40 | |
| Class R Shares | | | | 6.80 | |
| Class Y Shares | | | | 7.20 | |
| Class R5 Shares | | | | 7.20 | |
| Class R6 Shares | | | | 7.20 | |
| Citi US T-Bill 3 Month Index‚ (Broad Market/Style-Specific Index) | | | | 0.03 | |
| Lipper Alternative Equity Market Neutral Indexn (Peer Group Index) | | | | 0.69 | |
Source(s): ‚FactSet Research Systems Inc.; nLipper Inc.
Market conditions and your Fund
The US economy remained “good but not great” during the reporting period ended October 31, 2014. Slow but steady growth, helped by historically low interest rates, generally led US equity markets higher during the reporting period.
The reporting period began with renewed optimism after it became apparent that a two-week federal government shutdown had not derailed the economy. Evidence of economic improvement caused the US equity market to rally in late 2013
despite the announcement by the US Federal Reserve (the Fed) in December that it would begin reducing the scope of its asset purchase program in early 2014.
The US stock market turned volatile in the first months of 2014 as investors began to worry that stocks may have risen too far, too fast. Unusually cold winter weather negatively affected consumers, and the US economy contracted in the first quarter before rebounding strongly in the second quarter. While corporate earnings were generally resilient throughout the reporting period, driven by strong profitability across many sectors,
investors worried about political developments in Ukraine and signs of economic sluggishness in China. Toward the end of the reporting period, a sharp drop in global oil prices, evidence of economic stagnation in Europe and concern about the first cases of Ebola in the US increased market volatility.
The Fund seeks to add value by capturing the performance spread between its long and short holdings. We implement this strategy by purchasing equity securities we believe are undervalued and selling short securities we believe are over-valued. The offsetting exposures of these securities (e.g. – industry, market capitalization, style) are intended to lead to beta1 neutrality at the Fund level.
The Fund’s largest contributors to positive performance for the reporting period were stock selections in the IT, health care and industrials sectors. Within the IT sector, the Fund benefited from short positions in the semiconductor and communications equipment industries that performed poorly compared to industry peers.
Within the health care sector, both long and short positions in pharmaceuticals, biotechnology and health care equipment aided Fund performance.
In the industrials sector, the Fund benefited mostly from long positions in the capital goods and non-airline transportation industries.
Stock selection in the energy sector detracted from Fund performance for the reporting period. The Fund was hampered by its long positions in both the oil and gas exploration and energy equipment industries.
| | | | | |
| Portfolio Composition | | |
| By sector, based on total value of securities held long | |
| |
| Health Care | | | | 20.9 | % |
| Information Technology | | | | 18.0 | |
| Energy | | | | 16.7 | |
| Consumer Discretionary | | | | 9.6 | |
| Industrials | | | | 4.0 | |
| Consumer Staples | | | | 3.3 | |
| Materials | | | | 2.9 | |
| Financials | | | | 2.1 | |
| Telecommunication Services | | | | 0.6 | |
| Utilities | | | | 0.1 | |
| Money Market Funds | | | | 21.8 | |
| | | | | |
| Portfolio Composition | | |
| By sector, based on total value of securities sold short | |
| |
| Health Care | | | | 27.1 | % |
| Information Technology | | | | 22.0 | |
| Energy | | | | 19.6 | |
| Consumer Discretionary | | | | 13.8 | |
| Financials | | | | 5.6 | |
| Consumer Staples | | | | 4.9 | |
| Industrials | | | | 3.7 | |
| Materials | | | | 2.3 | |
| Telecommunication Services | | | | 1.0 | |
| | | | | |
Total Net Assets | | | | $26.5 million | |
| | | | | |
| |
Total Number of Holdings* | | | | 278 | |
| | | | | |
| Top Five Long Equity Holdings* | | |
Based on total value of securities held long | | | | | |
| 1. Lannett Co., Inc. | | | | 1.5 | % |
| 2. Tesoro Corp. | | | | 1.5 | |
| 3. United States Steel Corp. | | | | 1.4 | |
| 4. Pilgrim’s Pride Corp. | | | | 1.4 | |
| 5. Marathon Petroleum Corp. | | | | 1.4 | |
| | | | | |
| Top Five Short Equity Holdings* | | |
| Based on total value of securities sold short | | | | | |
| |
| 1. Groupon, Inc. | | | | 1.7 | % |
| 2. SolarCity Corp. | | | | 1.5 | |
| 3. ViaSat, Inc. | | | | 1.4 | |
| 4. Golar LNG Ltd. | | | | 1.4 | |
| 5. Sanchez Energy Corp. | | | | 1.4 | |
The Fund’s holdings are subject to change, and there is no assurance that the Fund will continue to
hold any particular security.
*Excluding money market fund holdings.
|
| 4 Invesco All Cap Market Neutral Fund |
In addition, short positions held in the media and automobile industries within the consumer discretionary sector hurt Fund performance for the reporting period. The retail industry struggled with both long and short positions detracting from Fund performance.
At the end of the reporting period, the largest gross sector exposures were in the health care, IT, energy and consumer discretionary sectors.
Please note that the Fund may utilize derivative instruments that include equity total return swaps or futures contracts to help implement its strategy. During the reporting period, the Fund did not utilize equity total return swaps or futures contracts.
Thank you for your investment in Invesco All Cap Market Neutral Fund.
| 1 | Beta is a measure of risk representing how a security is expected to respond to general market movements. |
The views and opinions expressed in management’s discussion of Fund performance are those of Invesco Advisers, Inc. These views and opinions are subject to change at any time based on factors such as market and economic conditions. These views and opinions may not be relied upon as investment advice or recommendations, or as an offer for a particular security. The information is not a complete analysis of every aspect of any market, country, industry, security or the Fund. Statements of fact are from sources considered reliable, but Invesco Advisers, Inc. makes no representation or warranty as to their completeness or accuracy. Although historical performance is no guarantee of future results, these insights may help you understand our investment management philosophy.
See important Fund and, if applicable, index disclosures later in this report.
| | |
 | | Michael Abata Chartered Financial Analyst, Portfolio Manager, is manager of Invesco All Cap Market Neutral Fund. |
| He joined Invesco in 2011. Mr. Abata earned a BA in economics from Binghamton University. |
| | |
 | | Charles Ko Chartered Financial Analyst, Portfolio Manager, is manager of Invesco All Cap Market Neutral Fund. |
| He joined Invesco in 2012. Mr. Ko earned a BS from MIT and an MBA from Yale University. |
| | |
 | | Anthony Munchak Chartered Financial Analyst, Portfolio Manager, is manager of Invesco All Cap Market Neutral Fund. |
| He joined Invesco in 2000. Mr. Munchak earned a BS and an MS in finance from Boston College and an MBA from Bentley College. |
| | |
 | | Glen Murphy Chartered Financial Analyst, Portfolio Manager, is manager of Invesco All Cap Market Neutral Fund. |
| He joined Invesco in 1995. Mr. Murphy earned a BA in business administration from the University of Massachusetts Amherst and an MS in finance from Boston College. |
| | |
 | | Francis Orlando Chartered Financial Analyst, Portfolio Manager, is manager of Invesco All Cap Market Neutral Fund. |
| He joined Invesco in 1987. Mr. Orlando earned a BA in business administration from Merrimack College and an MBA from Boston University. |
| | |
 | | Andrew Waisburd Portfolio Manager, is manager of Invesco All Cap Market Neutral Fund. He joined Invesco in 2008. |
| Mr. Waisburd earned a BS in statistics from Cornell University and an MS and a PhD in finance from Indiana University. |
|
| 5 Invesco All Cap Market Neutral Fund |
Your Fund’s Performance
Results of a $10,000 Investment – Oldest Share Class(es) since Inception
Fund and index data from 12/17/13
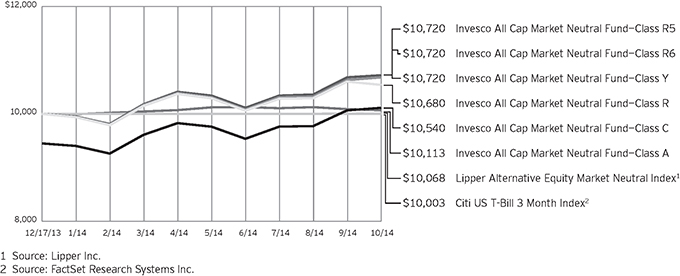
Past performance cannot guarantee comparable future results.
The data shown in the chart include reinvested distributions, applicable sales charges and Fund expenses including
management fees. Index results include reinvested dividends, but they do not reflect sales charges. Performance of the peer group, if applicable, reflects fund expenses and management fees;
performance of a market index does not. Performance shown in the chart and table(s) does not reflect deduction of taxes a shareholder would pay on Fund distributions or sale of Fund shares.
continued from page 8
About indexes used in this report
| n | | The Citi US T-Bill 3 Month Index is an unmanaged index representative of three-month Treasury bills. |
| n | | The Lipper Alternative Equity Market Neutral Index is an unmanaged index considered representative of funds that employ portfolio strategies generating consistent returns in both up and down markets by selecting positions with a total net market exposure of zero. |
| n | | The Fund is not managed to track the performance of any particular index, including the index(es) described here, and consequently, the performance of the Fund may deviate significantly from the performance of the
index(es). |
| n | | A direct investment cannot be made in an index. Unless otherwise indicated, index results include reinvested dividends, and they do not reflect sales charges. Performance of the peer group, if applicable, reflects fund expenses; performance of a market index does not. |
Other information
| n | | The returns shown in management’s discussion of Fund performance are based on net asset values (NAVs) calculated for shareholder transactions. Generally accepted accounting principles require adjustments to be made to the net assets of the Fund at period end for financial reporting purposes, and as such, the NAVs for shareholder transactions and the returns based on those NAVs may differ from the NAVs and returns reported in the Financial Highlights. |
| n | | Industry classifications used in this report are generally according to the Global Industry Classification Standard, which was developed by and is the exclusive property and a service mark of MSCI Inc. and Standard & Poor’s. |
|
| 6 Invesco All Cap Market Neutral Fund |
| | | | | |
Cumulative Total Returns | | | | | |
| As of 10/31/14, including maximum applicable sales charges | | | | | |
| |
| Class A Shares | | | | | |
| Inception (12/17/13) | | | | 1.13 | % |
| |
| Class C Shares | | | | | |
| Inception (12/17/13) | | | | 5.40 | % |
| |
| Class R Shares | | | | | |
| Inception (12/17/13) | | | | 6.80 | % |
| |
| Class Y Shares | | | | | |
| Inception (12/17/13) | | | | 7.20 | % |
| |
| Class R5 Shares | | | | | |
| Inception (12/17/13) | | | | 7.20 | % |
| |
| Class R6 Shares | | | | | |
| Inception (12/17/13) | | | | 7.20 | % |
The performance data quoted represent past performance and cannot guarantee comparable future results; current performance may be lower or higher. Please visit invesco.com/performance for the most recent month-end performance. Performance figures reflect reinvested distributions, changes in net asset value and the effect of the maximum sales charge unless otherwise stated. Investment return and principal value will fluctuate so that you may have a gain or loss when you sell shares.
The net annual Fund operating expense ratio set forth in the most recent Fund prospectus as of the date of this report for Class A, Class C, Class R, Class Y, Class R5 and Class R6 shares was 4.11%, 4.86%, 4.36%, 3.86%, 3.86% and 3.86%, respectively.1 The total annual Fund operating expense ratio set forth in the most recent Fund prospectus as of the date of this report for Class A, Class C, Class R, Class Y, Class R5 and Class R6 shares was 5.79%, 6.54%, 6.04%, 5.54%, 5.43% and 5.38%, respectively. The expense ratios presented above may vary from the expense ratios presented in other sections of this report that are based on expenses incurred during the period covered by this report.
| | | | | |
Cumulative Total Returns | | | | | |
| As of 9/30/14, the most recent calendar quarter end, including maximum applicable sales charges | | | | | |
| |
| Class A Shares | | | | | |
| Inception (12/17/13) | | | | 0.66 | % |
| |
| Class C Shares | | | | | |
| Inception (12/17/13) | | | | 5.00 | % |
| |
| Class R Shares | | | | | |
| Inception (12/17/13) | | | | 6.30 | % |
| |
| Class Y Shares | | | | | |
| Inception (12/17/13) | | | | 6.70 | % |
| |
| Class R5 Shares | | | | | |
| Inception (12/17/13) | | | | 6.80 | % |
| |
| Class R6 Shares | | | | | |
| Inception (12/17/13) | | | | 6.70 | % |
Class A share performance reflects the maximum 5.50% sales charge, and Class C share performance reflects the applicable contingent deferred sales charge (CDSC) for the period involved. The CDSC on Class C shares is 1% for the first year after purchase. Class R, Class Y, Class R5 and Class R6 class shares do not have a front-end sales charge or a CDSC; therefore, performance is at net asset value.
The performance of the Fund’s share classes will differ primarily due to different sales charge structures and class expenses.
Had the adviser not waived fees and/or reimbursed expenses, performance would have been lower.
| 1 | Total annual Fund operating expenses after any contractual fee waivers and/or expense reimbursements by the adviser in effect through at least February 29, 2016. See current prospectus for more information. |
|
| 7 Invesco All Cap Market Neutral Fund |
Invesco All Cap Market Neutral Fund’s investment objective is to seek to provide a positive return over a full market cycle from a broadly diversified portfolio of stocks while seeking to limit exposure to the general risks associated with stock market investing.
| n | | Unless otherwise stated, information presented in this report is as of October 31, 2014, and is based on total net assets. |
| n | | Unless otherwise noted, all data provided by Invesco. |
| n | | To access your Fund’s reports/prospectus, visit invesco.com/fundreports. |
About share classes
| n | | Class R shares are generally available only to employer sponsored retirement and benefit plans. Please see the prospectus for more information. |
| n | | Class Y shares are available only to certain investors. Please see the prospectus for more information. |
| n | | Class R5 shares and Class R6 shares are primarily intended for employer sponsored retirement and benefit plans that meet certain standards and for institutional investors. Please see the prospectus for more information. |
Principal risks of investing in the Fund
| n | | Active trading risk. The Fund engages in frequent trading of portfolio securities. Active trading results in added expenses and may result in a lower return and increased tax liability. |
| n | | Derivatives risk. The value of a derivative instrument depends largely on (and is derived from) the value of an underlying security, currency, commodity, interest rate, index or other asset (each referred to as an underlying asset). In addition to risks relating to the underlying assets, the use of derivatives may include other, possibly greater, risks, including counterparty, leverage and liquidity risks. Counterparty risk is the risk that the counterparty to the derivative contract will default on its obligation to pay the Fund the amount owed or otherwise perform under the derivative contract. Derivatives create leverage risk because they do not require payment up front equal to the economic exposure created by owning the derivative. As a result, an adverse change in the value of the underlying asset could result in the Fund sustaining a loss that is substantially greater than the amount invested in the derivative, which may make the Fund’s returns more volatile and increase the risk of loss. Derivative instruments may also |
be less liquid than more traditional investments and the Fund may be unable to sell or close out its derivative positions at a desirable time or price. This risk may be more acute under adverse market conditions, during which the Fund may be most in need of liquidating its derivative positions. Derivatives may also be harder to value, less tax efficient and subject to changing government regulation that could impact the Fund’s ability to use certain derivatives or their cost. Also, derivatives used for hedging or to gain or limit exposure to a particular market segment may not provide the expected benefits, particularly during adverse market conditions. These risks are greater for the Fund than mutual funds that do not use derivative instruments or that use derivative instruments to a lesser extent than the Fund to implement their investment strategy.
| n | | Large capitalization company risk. Larger, more established companies may be unable to respond quickly to new competitive challenges such as changes in consumer tastes or innovative smaller competitors. Returns on investments in large capitalization companies could trail the returns on investments in smaller companies. |
| n | | Management risk. The investment techniques and risk analysis used by the Fund’s portfolio managers may not produce the desired results. In particular, there is no guarantee that the portfolio manager’s stock selection process will produce a market neutral portfolio that reduces or eliminates the Fund’s exposure to general U.S. stock market risk, sector or industry-specific risk or market capitalization risk. In addition, the Fund’s market neutral investment strategy will likely cause the Fund to underperform the broader U.S. equity market during market rallies. Such underperformance could be significant during sudden or significant market rallies. Although the Fund seeks to provide a positive return, investors may |
| | | lose money by investing in the Fund. |
| n | | Market risk. The prices of and the income generated by the Fund’s securities may decline in response to, among other things, investor sentiment, general economic and market conditions, regional or global instability, and currency and interest rate fluctuations. |
| n | | Short sales risk. Short sales may cause the Fund to repurchase a security at a higher price, thereby causing a loss. A short position in a security poses more risk than holding the same security long. As there is no limit on how much the price of the security can increase, the Fund’s exposure is unlimited. In order to establish a short position in a security, the Fund must borrow the security from a broker. The Fund may not always be able to borrow a security the Fund seeks to sell short at a particular time or at an acceptable price. The Fund also may not always be able to close out the short position by replacing the borrowed securities at a particular time or at an acceptable price. The Fund will incur increased transaction costs associated with selling securities short. In addition, taking short positions in securities results in a form of leverage which may cause the Fund to be volatile. |
| n | | Small- and mid-capitalization risks. Stocks of small- and mid-sized companies tend to be more vulnerable to adverse developments and may have little or no operating history or track record of success, and limited product lines, markets, management and financial resources. The securities of small- and mid-sized companies may be more volatile due to less market interest and less publicly available information about the issuer. They also may be illiquid or restricted as to resale, or may trade less frequently and in smaller volumes, all of which may cause difficulty when establishing or closing a position at a desirable price. |
continued on page 6
|
This report must be accompanied or preceded by a currently effective Fund prospectus, which contains more complete information, including sales charges and expenses. Investors should read it carefully before investing. |
|
|
| NOT FDIC INSURED | MAY LOSE VALUE | NO BANK GUARANTEE |
|
| 8 Invesco All Cap Market Neutral Fund |
Schedule of Investments(a)
October 31, 2014
| | | | | | | | |
| | | Shares | | | Value | |
Common Stocks & Other Equity Interests–92.35% | |
| Aerospace & Defense–0.39% | | | | | | | | |
Ducommun Inc.(b) | | | 3,920 | | | $ | 103,527 | |
| | |
| Agricultural Products–0.16% | | | | | | | | |
Archer-Daniels-Midland Co.(c) | | | 910 | | | | 42,770 | |
| | |
| Alternative Carriers–0.65% | | | | | | | | |
Inteliquent, Inc.(c) | | | 10,260 | | | | 172,676 | |
| | |
| Aluminum–0.71% | | | | | | | | |
Alcoa Inc.(c) | | | 11,280 | | | | 189,053 | |
| | |
| Apparel Retail–0.47% | | | | | | | | |
Abercrombie & Fitch Co.–Class A | | | 3,260 | | | | 109,145 | |
Guess?, Inc.(c) | | | 700 | | | | 15,519 | |
| | | | | | | | 124,664 | |
| | |
| Auto Parts & Equipment–1.10% | | | | | | | | |
China Automotive Systems, Inc. (China) | | | 8,560 | | | | 78,666 | |
Tower International Inc.(b)(c) | | | 8,780 | | | | 213,354 | |
| | | | | | | | 292,020 | |
| | |
| Biotechnology–14.08% | | | | | | | | |
Acorda Therapeutics Inc.(b)(c) | | | 7,090 | | | | 246,874 | |
Bluebird Bio, Inc.(b)(c) | | | 7,720 | | | | 324,163 | |
Emergent Biosolutions, Inc.(b)(c) | | | 9,060 | | | | 204,937 | |
Enanta Pharmaceuticals, Inc.(b)(c) | | | 6,680 | | | | 287,240 | |
Epizyme, Inc.(b)(c) | | | 11,180 | | | | 296,606 | |
Gilead Sciences, Inc.(b) | | | 3,240 | | | | 362,880 | |
Medivation Inc.(b)(c) | | | 3,140 | | | | 331,898 | |
Myriad Genetics, Inc.(b)(c) | | | 6,670 | | | | 263,398 | |
Prothena Corp. PLC (Ireland)(b)(c) | | | 6,840 | | | | 150,001 | |
Regeneron Pharmaceuticals, Inc.(b) | | | 900 | | | | 354,348 | |
Repligen Corp.(b)(c) | | | 11,740 | | | | 296,083 | |
Sangamo BioSciences, Inc.(b)(c) | | | 20,900 | | | | 253,726 | |
United Therapeutics Corp.(b) | | | 2,760 | | | | 361,477 | |
| | | | | | | | 3,733,631 | |
| | |
| Casinos & Gaming–0.59% | | | | | | | | |
Isle of Capri Casinos, Inc.(b)(c) | | | 16,910 | | | | 125,641 | |
Penn National Gaming, Inc.(b) | | | 2,320 | | | | 30,369 | |
| | | | | | | | 156,010 | |
| | |
| Coal & Consumable Fuels–1.28% | | | | | | | | |
Peabody Energy Corp. | | | 32,580 | | | | 339,809 | |
| | |
| Commercial Printing–1.07% | | | | | | | | |
Deluxe Corp. | | | 1,110 | | | | 67,488 | |
R. R. Donnelley & Sons Co.(c) | | | 12,330 | | | | 215,159 | |
| | | | | | | | 282,647 | |
| | |
| Commodity Chemicals–0.85% | | | | | | | | |
LyondellBasell Industries N.V.–Class A | | | 2,460 | | | | 225,410 | |
| | | | | | | | |
| | | Shares | | | Value | |
| Communications Equipment–3.60% | | | | | | | | |
Black Box Corp.(c) | | | 4,790 | | | $ | 105,332 | |
Brocade Communications Systems, Inc.(c) | | | 34,070 | | | | 365,571 | |
Cisco Systems, Inc. | | | 14,980 | | | | 366,561 | |
Polycom, Inc.(b) | | | 9,060 | | | | 118,505 | |
| | | | | | | | 955,969 | |
|
| Computer & Electronics Retail–2.38% | |
Best Buy Co., Inc.(c) | | | 10,050 | | | | 343,107 | |
GameStop Corp.–Class A(c) | | | 6,760 | | | | 289,058 | |
| | | | | | | | 632,165 | |
| | |
| Construction & Engineering–0.68% | | | | | | | | |
Argan, Inc. | | | 5,200 | | | | 181,012 | |
|
| Construction Machinery & Heavy Trucks–0.61% | |
Caterpillar Inc.(c) | | | 1,600 | | | | 162,256 | |
| | |
| Consumer Electronics–1.56% | | | | | | | | |
Harman International Industries, Inc.(c) | | | 2,400 | | | | 257,616 | |
Skullcandy Inc.(b) | | | 8,340 | | | | 69,556 | |
ZAGG Inc.(b) | | | 12,850 | | | | 86,352 | |
| | | | | | | | 413,524 | |
| | |
| Consumer Finance–0.40% | | | | | | | | |
Nelnet, Inc.–Class A(c) | | | 2,250 | | | | 107,078 | |
|
| Data Processing & Outsourced Services–1.42% | |
Computer Sciences Corp. | | | 4,150 | | | | 250,660 | |
Information Services Group, Inc.(b) | | | 11,670 | | | | 49,364 | |
Xerox Corp. | | | 5,710 | | | | 75,829 | |
| | | | | | | | 375,853 | |
| | |
| Distillers & Vintners–0.32% | | | | | | | | |
MGP Ingredients, Inc. | | | 6,880 | | | | 84,968 | |
| | |
| Diversified Metals & Mining–0.15% | | | | | | | | |
U.S. Silica Holdings, Inc. | | | 890 | | | | 39,961 | |
|
| Electrical Components & Equipment–0.13% | |
SL Industries, Inc.(b) | | | 740 | | | | 33,300 | |
| | |
| Electronic Components–0.04% | | | | | | | | |
Knowles Corp.(b) | | | 490 | | | | 9,535 | |
|
| Electronic Manufacturing Services–1.39% | |
Sanmina Corp.(b) | | | 14,710 | | | | 368,780 | |
| | |
| Gas Utilities–0.08% | | | | | | | | |
New Jersey Resources Corp. | | | 370 | | | | 21,638 | |
|
| General Merchandise Stores–1.23% | |
Big Lots, Inc.(c) | | | 7,130 | | | | 325,484 | |
| | |
| Gold–0.34% | | | | | | | | |
Gold Resource Corp. | | | 22,960 | | | | 89,314 | |
See accompanying Notes to Financial Statements which are an integral part of the financial statements.
9 Invesco All Cap Market Neutral Fund
| | | | | | | | |
| | | Shares | | | Value | |
| Health Care Equipment–0.55% | | | | | | | | |
Exactech, Inc.(b) | | | 540 | | | $ | 11,502 | |
Symmetry Medical Inc.(b) | | | 13,510 | | | | 133,749 | |
| | | | | | | | 145,251 | |
| | |
| Health Care Facilities–1.09% | | | | | | | | |
HCA Holdings, Inc.(b) | | | 3,090 | | | | 216,454 | |
Skilled Healthcare Group Inc.–Class A(b) | | | 10,430 | | | | 72,280 | |
| | | | | | | | 288,734 | |
| | |
| Health Care Services–1.20% | | | | | | | | |
Addus HomeCare Corp.(b)(c) | | | 2,040 | | | | 40,535 | |
Alliance HealthCare Services, Inc.(b)(c) | | | 4,550 | | | | 109,791 | |
Radnet, Inc.(b)(c) | | | 18,080 | | | | 168,144 | |
| | | | | | | | 318,470 | |
|
| Home Entertainment Software–2.60% | |
Electronic Arts Inc.(b) | | | 8,500 | | | | 348,245 | |
Take-Two Interactive Software, Inc.(b)(c) | | | 12,910 | | | | 341,469 | |
| | | | | | | | 689,714 | |
|
| Hotels, Resorts & Cruise Lines–1.40% | |
Royal Caribbean Cruises Ltd.(c) | | | 5,470 | | | | 371,796 | |
| | |
| Household Products–0.50% | | | | | | | | |
Central Garden & Pet Co.–Class A(b) | | | 15,450 | | | | 132,716 | |
| | |
| Internet Retail–1.79% | | | | | | | | |
Lands’ End, Inc.(b) | | | 680 | | | | 32,260 | |
Liberty Ventures–Series A(b)(c) | | | 7,650 | | | | 268,515 | |
Nutrisystem, Inc.(c) | | | 10,360 | | | | 174,462 | |
| | | | | | | | 475,237 | |
| |
| Internet Software & Services–1.33% | | | | | |
Constant Contact, Inc.(b)(c) | | | 6,640 | | | | 234,790 | |
TechTarget Inc.(b) | | | 12,420 | | | | 118,487 | |
| | | | | | | | 353,277 | |
| |
| Investment Banking & Brokerage–0.05% | | | | | |
E*TRADE Financial Corp.(b)(c) | | | 630 | | | | 14,049 | |
|
| IT Consulting & Other Services–0.10% | |
NCI, Inc.–Class A(b) | | | 2,720 | | | | 27,690 | |
|
| Life Sciences Tools & Services–0.19% | |
Enzo Biochem, Inc.(b) | | | 9,560 | | | | 49,903 | |
| | |
| Managed Health Care–1.98% | | | | | | | | |
Centene Corp.(b)(c) | | | 1,700 | | | | 157,539 | |
Health Net Inc.(b)(c) | | | 7,730 | | | | 367,252 | |
| | | | | | | | 524,791 | |
| | |
| Office Services & Supplies–1.13% | | | | | | | | |
Pitney Bowes Inc.(c) | | | 12,120 | | | | 299,849 | |
| | |
| Oil & Gas Drilling–0.94% | | | | | | | | |
Pioneer Energy Services Corp.(b) | | | 27,040 | | | | 248,227 | |
| | | | | | | | |
| | | Shares | | | Value | |
| Oil & Gas Equipment & Services–2.77% | |
Helix Energy Solutions Group Inc.(b) | | | 13,420 | | | $ | 357,509 | |
Seventy Seven Energy Inc.(b) | | | 800 | | | | 10,456 | |
Superior Energy Services, Inc. | | | 14,590 | | | | 366,938 | |
| | | | | | | | 734,903 | |
|
| Oil & Gas Exploration & Production–9.67% | |
Abraxas Petroleum Corp.(b)(c) | | | 37,910 | | | | 156,568 | |
Chesapeake Energy Corp.(c) | | | 16,680 | | | | 369,962 | |
Clayton Williams Energy, Inc.(b)(c) | | | 3,000 | | | | 249,420 | |
Encana Corp. (Canada) | | | 19,550 | | | | 364,217 | |
Enerplus Corp. (Canada)(c) | | | 24,650 | | | | 352,495 | |
Gran Tierra Energy, Inc. (Canada)(b)(c) | | | 22,350 | | | | 101,916 | |
Kosmos Energy Ltd.(b)(c) | | | 22,870 | | | | 213,377 | |
Penn West Petroleum Ltd. (Canada) | | | 62,740 | | | | 283,585 | |
SM Energy Co.(c) | | | 3,370 | | | | 189,731 | |
VAALCO Energy, Inc.(b) | | | 24,130 | | | | 179,045 | |
Warren Resources Inc.(b)(c) | | | 30,440 | | | | 105,322 | |
| | | | | | | | 2,565,638 | |
|
| Oil & Gas Refining & Marketing–5.10% | |
Adams Resources & Energy, Inc. | | | 1,250 | | | | 52,562 | |
Green Plains Inc.(c) | | | 7,940 | | | | 271,548 | |
Marathon Petroleum Corp.(c) | | | 4,130 | | | | 375,417 | |
REX American Resources Corp.(b)(c) | | | 3,460 | | | | 251,750 | |
Tesoro Corp.(c) | | | 5,630 | | | | 402,038 | |
| | | | | | | | 1,353,315 | |
| | |
| Packaged Foods & Meats–2.89% | | | | | | | | |
Farmer Brothers Co.(b) | | | 1,260 | | | | 36,742 | |
Omega Protein Corp.(b) | | | 8,940 | | | | 129,183 | |
Pilgrim’s Pride Corp.(b)(c) | | | 13,240 | | | | 376,148 | |
Sanderson Farms, Inc. | | | 2,680 | | | | 225,066 | |
| | | | | | | | 767,139 | |
| | |
| Pharmaceuticals–5.63% | | | | | | | | |
ANI Pharmaceuticals, Inc.(b) | | | 3,340 | | | | 113,426 | |
Cumberland Pharmaceuticals Inc.(b)(c) | | | 1,650 | | | | 8,085 | |
DepoMed, Inc.(b)(c) | | | 23,340 | | | | 359,436 | |
Lannett Co., Inc.(b)(c) | | | 7,220 | | | | 409,518 | |
Pernix Therapeutics Holdings, Inc.(b)(c) | | | 13,690 | | | | 133,478 | |
POZEN Inc.(b) | | | 13,360 | | | | 121,175 | |
Sagent Pharmaceuticals Inc.(b) | | | 6,570 | | | | 207,875 | |
SciClone Pharmaceuticals, Inc.(b) | | | 18,390 | | | | 140,500 | |
| | | | | | | | 1,493,493 | |
|
| Property & Casualty Insurance–1.81% | |
Federated National Holding Co. | | | 4,970 | | | | 166,296 | |
United Insurance Holdings Corp.(c) | | | 6,050 | | | | 118,580 | |
Universal Insurance Holdings, Inc.(c) | | | 11,080 | | | | 193,900 | |
| | | | | | | | 478,776 | |
| | |
| Publishing–0.06% | | | | | | | | |
Time Inc.(b) | | | 700 | | | | 15,813 | |
See accompanying Notes to Financial Statements which are an integral part of the financial statements.
10 Invesco All Cap Market Neutral Fund
| | | | | | | | |
| | | Shares | | | Value | |
| Regional Banks–0.10% | | | | | | | | |
Century Bancorp, Inc.–Class A | | | 300 | | | $ | 11,394 | |
Orrstown Financial Services, Inc.(b) | | | 910 | | | | 15,233 | |
| | | | | | | | 26,627 | |
|
| Research & Consulting Services–0.17% | |
VSE Corp. | | | 760 | | | | 45,813 | |
| | |
| Residential REIT’s–0.05% | | | | | | | | |
Starwood Waypoint Residential Trust | | | 500 | | | | 13,090 | |
| | |
| Semiconductors–4.51% | | | | | | | | |
Fairchild Semiconductor International, Inc.(b) | | | 12,960 | | | | 198,936 | |
Integrated Device Technology, Inc.(b) | | | 17,830 | | | | 292,590 | |
IXYS Corp. | | | 3,930 | | | | 45,863 | |
Marvell Technology Group Ltd. | | | 22,410 | | | | 301,191 | |
Skyworks Solutions, Inc.(c) | | | 6,120 | | | | 356,429 | |
| | | | | | | | 1,195,009 | |
| | |
| Specialized REIT’s–0.06% | | | | | | | | |
American Tower Corp. | | | 170 | | | | 16,575 | |
| | |
| Specialty Stores–0.74% | | | | | | | | |
Staples, Inc.(c) | | | 15,390 | | | | 195,145 | |
| | |
| Steel–1.43% | | | | | | | | |
United States Steel Corp. | | | 9,440 | | | | 377,978 | |
| | |
| Systems Software–1.36% | | | | | | | | |
VASCO Data Security International, Inc.(b)(c) | | | 14,280 | | | | 361,570 | |
|
| Technology Hardware, Storage & Peripherals–4.88% | |
Apple Inc.(c) | | | 3,030 | | | | 327,240 | |
Hewlett-Packard Co.(c) | | | 10,140 | | | | 363,823 | |
Lexmark International, Inc.–Class A(c) | | | 6,710 | | | | 289,604 | |
NetApp, Inc. | | | 7,300 | | | | 312,440 | |
| | | | | | | | 1,293,107 | |
|
| Thrifts & Mortgage Finance–0.07% | |
BBX Capital Corp.–Class A(b) | | | 1,010 | | | | 18,584 | |
|
| Trading Companies & Distributors–0.06% | |
NOW Inc.(b) | | | 520 | | | | 15,651 | |
| | |
| Trucking–0.46% | | | | | | | | |
Covenant Transport Group, Inc.–Class A(b) | | | 2,800 | | | | 58,072 | |
P.A.M. Transportation Services, Inc.(b) | | | 260 | | | | 11,175 | |
USA Truck Inc.(b) | | | 3,140 | | | | 53,066 | |
| | | | | | | | 122,313 | |
Total Common Stocks & Other Equity Interests
(Cost $23,406,469) | | | | 24,493,297 | |
|
Money Market Funds–25.73% | |
Liquid Assets Portfolio–Institutional Class(d) | | | 3,412,001 | | | | 3,412,001 | |
Premier Portfolio–Institutional Class(d) | | | 3,412,002 | | | | 3,412,002 | |
Total Money Market Funds
(Cost $6,824,003) | | | | 6,824,003 | |
TOTAL INVESTMENTS–118.08%
(Cost $30,230,472) | | | | 31,317,300 | |
OTHER ASSETS LESS LIABILITIES–(18.08)% | | | | (4,795,797 | ) |
NET ASSETS–100.00% | | | $ | 26,521,503 | |
Securities Sold Short
| | | | | | | | |
| | | Shares | | | Value | |
Common Stocks–91.63% | |
| Aerospace & Defense–0.09% | |
DigitalGlobe Inc.(b) | | | 500 | | | $ | 14,295 | |
Erickson Inc.(b) | | | 650 | | | | 9,126 | |
| | | | | | | | 23,421 | |
| | |
| Agricultural Products–0.87% | | | | | | | | |
Darling International Inc.(b) | | | 13,160 | | | | 231,616 | |
| | |
| Apparel Retail–0.90% | | | | | | | | |
Aeropostale, Inc.(b) | | | 4,050 | | | | 12,190 | |
American Eagle Outfitters, Inc. | | | 17,680 | | | | 227,542 | |
| | | | | | | | 239,732 | |
| | |
| Application Software–2.69% | | | | | | | | |
Datawatch Corp.(b) | | | 4,740 | | | | 52,377 | |
Qlik Technologies Inc.(b) | | | 2,180 | | | | 61,803 | |
Splunk Inc.(b) | | | 5,480 | | | | 362,118 | |
Ultimate Software Group, Inc. (The)(b) | | | 700 | | | | 105,357 | |
VirnetX Holding Corp.(b) | | | 22,450 | | | | 131,782 | |
| | | | | | | | 713,437 | |
|
| Asset Management & Custody Banks–0.26% | |
Financial Engines Inc. | | | 1,700 | | | | 67,779 | |
| | |
| Automobile Manufacturers–0.37% | | | | | | | | |
Tesla Motors, Inc.(b) | | | 400 | | | | 96,680 | |
| | |
| Automotive Retail–1.06% | | | | | | | | |
CarMax, Inc.(b) | | | 5,040 | | | | 281,786 | |
|
| Biotechnology–14.68% | |
ACADIA Pharmaceuticals Inc.(b) | | | 9,050 | | | | 250,685 | |
Alnylam Pharmaceuticals Inc.(b) | | | 3,810 | | | | 353,339 | |
ARIAD Pharmaceuticals, Inc.(b) | | | 60,280 | | | | 359,269 | |
Arrowhead Research Corp.(b) | | | 23,030 | | | | 150,156 | |
Biogen Idec Inc.(b) | | | 920 | | | | 295,394 | |
CytRx Corp.(b) | | | 16,210 | | | | 46,361 | |
Galectin Therapeutics Inc.(b) | | | 4,310 | | | | 23,360 | |
Intercept Pharmaceuticals, Inc.(b) | | | 1,450 | | | | 374,666 | |
Keryx Biopharmaceuticals, Inc.(b) | | | 21,890 | | | | 368,846 | |
KYTHERA Biopharmaceuticals, Inc.(b) | | | 1,500 | | | | 52,875 | |
La Jolla Pharmaceutical Co.(b) | | | 4,530 | | | | 49,785 | |
Mirati Therapeutics, Inc. (Canada)(b) | | | 3,430 | | | | 57,521 | |
Navidea Biopharmaceuticals Inc.(b) | | | 38,800 | | | | 52,380 | |
NeoStem, Inc.(b) | | | 12,730 | | | | 65,305 | |
Northwest Biotherapeutics, Inc.(b) | | | 26,890 | | | | 141,441 | |
Ohr Pharmaceutical, Inc.(b) | | | 6,830 | | | | 49,517 | |
Orexigen Therapeutics Inc.(b) | | | 36,140 | | | | 146,728 | |
Organovo Holdings, Inc.(b) | | | 32,640 | | | | 213,466 | |
Raptor Pharmaceuticals Corp.(b) | | | 18,880 | | | | 181,437 | |
Senomyx, Inc.(b) | | | 18,670 | | | | 147,866 | |
Sorrento Therapeutics, Inc.(b) | | | 10,280 | | | | 43,382 | |
Synta Pharmaceuticals Corp.(b) | | | 27,960 | | | | 82,762 | |
See accompanying Notes to Financial Statements which are an integral part of the financial statements.
11 Invesco All Cap Market Neutral Fund
| | | | | | | | |
| | | Shares | | | Value | |
| Biotechnology–(continued) | |
Theravance, Inc. | | | 15,020 | | | $ | 240,620 | |
Vanda Pharmaceuticals Inc.(b) | | | 12,220 | | | | 146,762 | |
| | | | | 3,893,923 | |
| | |
| Brewers–0.61% | | | | | | | | |
Boston Beer Co., Inc. (The)–Class A(b) | | | 650 | | | | 161,850 | |
| | |
| Building Products–0.37% | | | | | | | | |
Armstrong World Industries, Inc.(b) | | | 2,020 | | | | 97,808 | |
| | |
| Casinos & Gaming–0.72% | | | | | | | | |
Caesars Entertainment Corp.(b) | | | 15,610 | | | | 190,286 | |
| | |
| Coal & Consumable Fuels–0.66% | | | | | | | | |
Solazyme Inc.(b) | | | 22,960 | | | | 176,103 | |
|
| Communications Equipment–4.21% | |
Ciena Corp.(b) | | | 13,920 | | | | 233,299 | |
Finisar Corp.(b) | | | 13,000 | | | | 217,360 | |
JDS Uniphase Corp.(b) | | | 21,060 | | | | 283,468 | |
ViaSat, Inc.(b) | | | 6,100 | | | | 382,104 | |
| | | | | 1,116,231 | |
| | |
| Consumer Electronics–0.03% | | | | | | | | |
Turtle Beach Corp.(b) | | | 1,370 | | | | 7,919 | |
| | |
| Department Stores–1.95% | | | | | | | | |
J. C. Penney Co., Inc.(b) | | | 23,730 | | | | 180,586 | |
Sears Holdings Corp.(b) | | | 9,610 | | | | 335,581 | |
| | | | | 516,167 | |
|
| Electrical Components & Equipment–1.45% | |
SolarCity Corp.(b) | | | 6,510 | | | | 385,262 | |
|
| Electronic Equipment Manufacturers–0.16% | |
CUI Global, Inc.(b) | | | 5,160 | | | | 42,209 | |
|
| Electronic Manufacturing Services–0.90% | |
IPG Photonics Corp.(b) | | | 3,230 | | | | 237,114 | |
|
| Fertilizers & Agricultural Chemicals–0.55% | |
American Vanguard Corp. | | | 12,660 | | | | 146,096 | |
| | |
| Food Retail–0.50% | | | | | | | | |
Whole Foods Market, Inc. | | | 3,390 | | | | 133,329 | |
| | |
| Footwear–0.54% | | | | | | | | |
NIKE, Inc.–Class B | | | 1,540 | | | | 143,174 | |
| | |
| Forest Products–0.65% | | | | | | | | |
Louisiana-Pacific Corp.(b) | | | 11,800 | | | | 172,299 | |
|
| General Merchandise Stores–0.25% | |
Conn’s, Inc.(b) | | | 2,160 | | | | 67,198 | |
| | |
| Health Care Equipment–1.10% | | | | | | | | |
GenMark Diagnostics Inc.(b) | | | 12,320 | | | | 140,448 | |
Insulet Corp.(b) | | | 1,990 | | | | 85,908 | |
Rockwell Medical, Inc.(b) | | | 7,470 | | | | 65,139 | |
| | | | | 291,495 | |
| | | | | | | | |
| | | Shares | | | Value | |
| | |
| Health Care Services–0.49% | | | | | | | | |
BioScrip Inc.(b) | | | 20,230 | | | $ | 130,686 | |
| | |
| Health Care Supplies–0.89% | | | | | | | | |
Cerus Corp.(b) | | | 32,240 | | | | 134,118 | |
TearLab Corp.(b) | | | 7,410 | | | | 21,415 | |
Unilife Corp.(b) | | | 22,010 | | | | 80,777 | |
| | | | | 236,310 | |
| | |
| Health Care Technology–2.16% | | | | | | | | |
athenahealth Inc.(b) | | | 3,010 | | | | 368,725 | |
Medidata Solutions, Inc.(b) | | | 4,540 | | | | 204,799 | |
| | | | | 573,524 | |
| | |
| Home Improvement Retail–0.49% | | | | | | | | |
Tile Shop Holdings, Inc.(b) | | | 15,100 | | | | 130,011 | |
| | |
| Homebuilding–1.38% | | | | | | | | |
KB Home | | | 9,930 | | | | 156,298 | |
Ryland Group, Inc. (The) | | | 4,150 | | | | 148,612 | |
Taylor Morrison Home Corp.–Class A(b) | | | 3,560 | | | | 61,374 | |
| | | | | 366,284 | |
| | |
| Industrial Machinery–0.70% | | | | | | | | |
Chart Industries, Inc.(b) | | | 3,980 | | | | 185,269 | |
| | |
| Insurance Brokers–0.91% | | | | | | | | |
Brown & Brown, Inc. | | | 2,830 | | | | 90,164 | |
eHealth, Inc.(b) | | | 6,010 | | | | 149,949 | |
| | | | | 240,113 | |
|
| Internet Retail–2.64% | |
Amazon.com, Inc.(b) | | | 860 | | | | 262,695 | |
Groupon, Inc.(b) | | | 59,980 | | | | 438,454 | |
| | | | | 701,149 | |
|
| Internet Software & Services–1.59% | |
ChannelAdvisor Corp.(b) | | | 7,640 | | | | 106,120 | |
Cornerstone OnDemand, Inc.(b) | | | 6,970 | | | | 252,802 | |
Millennial Media Inc.(b) | | | 26,490 | | | | 54,304 | |
Spark Networks, Inc.(b) | | | 1,910 | | | | 8,079 | |
| | | | | 421,305 | |
|
| Investment Banking & Brokerage–0.86% | |
FXCM, Inc.–Class A | | | 13,920 | | | | 229,123 | |
| | |
| Leisure Facilities–1.07% | | | | | | | | |
Life Time Fitness, Inc.(b) | | | 5,100 | | | | 284,427 | |
| | |
| Leisure Products–0.06% | | | | | | | | |
Black Diamond, Inc.(b) | | | 2,100 | | | | 16,296 | |
|
| Life Sciences Tools & Services–0.21% | |
NanoString Technologies, Inc.(b) | | | 5,310 | | | | 56,551 | |
| Managed Health Care–0.69% | | | | | | | | |
WellCare Health Plans Inc.(b) | | | 2,710 | | | | 183,928 | |
| | |
| Mortgage REIT’s–1.48% | | | | | | | | |
Altisource Asset Management Corp.(b) | | | 620 | | | | 334,800 | |
Altisource Residential Corp. | | | 2,470 | | | | 57,353 | |
| | | | | 392,153 | |
See accompanying Notes to Financial Statements which are an integral part of the financial statements.
12 Invesco All Cap Market Neutral Fund
| | | | | | | | |
| | | Shares | | | Value | |
| | |
| Motorcycle Manufacturers–0.70% | | | | | | | | |
Kandi Technologies Group Inc. (China)(b) | | | 11,190 | | | $ | 184,859 | |
| | |
| Movies & Entertainment–0.12% | | | | | | | | |
Imax Corp. (Canada)(b) | | | 1,080 | | | | 31,817 | |
| | |
| Oil & Gas Drilling–0.85% | | | | | | | | |
Diamond Offshore Drilling, Inc. | | | 5,960 | | | | 224,752 | |
|
| Oil & Gas Equipment & Services–1.74% | |
Bristow Group, Inc. | | | 1,420 | | | | 104,938 | |
CARBO Ceramics Inc. | | | 3,010 | | | | 155,527 | |
McDermott International, Inc.(b) | | | 50,610 | | | | 194,342 | |
Nuverra Environmental Solutions, Inc.(b) | | | 790 | | | | 7,481 | |
| | | | | 462,288 | |
|
| Oil & Gas Exploration & Production–9.34% | |
American Eagle Energy Corp.(b) | | | 6,480 | | | | 11,275 | |
Cobalt International Energy, Inc.(b) | | | 22,440 | | | | 262,772 | |
Diamondback Energy Inc.(b) | | | 5,300 | | | | 362,732 | |
Emerald Oil, Inc.(b) | | | 23,970 | | | | 76,225 | |
Gastar Exploration Inc.(b) | | | 18,210 | | | | 72,840 | |
Gulfport Energy Corp.(b) | | | 7,420 | | | | 372,336 | |
Halcon Resources Corp.(b) | | | 35,720 | | | | 111,089 | |
Midstates Petroleum Co. Inc.(b) | | | 20,510 | | | | 60,915 | |
Miller Energy Resources Inc.(b) | | | 16,690 | | | | 58,081 | |
Oasis Petroleum Inc.(b) | | | 7,650 | | | | 229,194 | |
PDC Energy, Inc.(b) | | | 3,340 | | | | 146,025 | |
Ring Energy Inc.(b) | | | 11,190 | | | | 192,468 | |
Sanchez Energy Corp.(b) | | | 22,070 | | | | 376,735 | |
Triangle Petroleum Corp.(b) | | | 18,520 | | | | 143,530 | |
| | | | | 2,476,217 | |
|
| Oil & Gas Storage & Transportation–6.13% | |
Cheniere Energy, Inc.(b) | | | 2,910 | | | | 218,250 | |
Enbridge Inc. (Canada) | | | 7,540 | | | | 357,094 | |
Golar LNG Ltd. (Norway) | | | 6,780 | | | | 380,426 | |
SemGroup Corp.–Class A | | | 3,910 | | | | 300,092 | |
Williams Cos. Inc. (The) | | | 6,650 | | | | 369,142 | |
| | | | | 1,625,004 | |
| | |
| Packaged Foods & Meats–1.04% | | | | | | | | |
B&G Foods Inc. | | | 1,940 | | | | 57,152 | |
Post Holdings Inc.(b) | | | 5,850 | | | | 219,375 | |
| | | | | 276,527 | |
| | |
| Personal Products–1.50% | | | | | | | | |
Elizabeth Arden, Inc.(b) | | | 8,120 | | | | 133,168 | |
Nu Skin Enterprises, Inc.–Class A | | | 4,980 | | | | 263,093 | |
| | | | | 396,261 | |
| | |
| Pharmaceuticals–4.59% | | | | | | | | |
Adamis Pharmaceuticals Corp.(b) | | | 1,710 | | | | 8,020 | |
Alimera Sciences Inc.(b) | | | 18,710 | | | | 106,647 | |
| | | | | | | | |
| | | Shares | | | Value | |
| Pharmaceuticals–(continued) | |
Ampio Pharmaceuticals, Inc.(b) | | | 14,650 | | | $ | 56,842 | |
Bristol-Myers Squibb Co. | | | 2,060 | | | | 119,871 | |
Cempra Holdings Inc.(b) | | | 9,800 | | | | 133,280 | |
Omeros Corp.(b) | | | 14,800 | | | | 245,236 | |
Supernus Pharmaceuticals Inc.(b) | | | 15,470 | | | | 124,224 | |
TherapeuticsMD, Inc.(b) | | | 67,830 | | | | 301,165 | |
Xenoport Inc.(b) | | | 18,070 | | | | 122,515 | |
| | | | | 1,217,800 | |
|
| Property & Casualty Insurance–0.18% | |
FNF Group | | | 1,590 | | | | 47,446 | |
| | |
| Real Estate Development–0.33% | | | | | | | | |
Howard Hughes Corp.(b) | | | 600 | | | | 88,428 | |
|
| Real Estate Management & Development–0.51% | |
Alexander & Baldwin Inc. | | | 3,380 | | | | 135,301 | |
| | |
| Restaurants–0.35% | | | | | | | | |
Bob Evans Farms, Inc. | | | 1,900 | | | | 92,815 | |
|
| Semiconductor Equipment–1.55% | |
Rubicon Technology, Inc.(b) | | | 9,420 | | | | 41,730 | |
SunEdison, Inc.(b) | | | 18,880 | | | | 368,349 | |
| | | | | 410,079 | |
|
| Semiconductors–2.64% | |
Applied Micro Circuits Corp.(b) | | | 22,990 | | | | 148,745 | |
Cree, Inc.(b) | | | 11,190 | | | | 352,261 | |
InvenSense Inc.(b) | | | 8,710 | | | | 141,189 | |
MoSys, Inc.(b) | | | 5,250 | | | | 14,123 | |
QuickLogic Corp.(b) | | | 15,310 | | | | 44,093 | |
| | | | | 700,411 | |
| | |
| Specialized Finance–0.10% | | | | | | | | |
Gain Capital Holdings, Inc. | | | 3,200 | | | | 27,392 | |
| | |
| Steel–0.92% | | | | | | | | |
Carpenter Technology Corp. | | | 4,690 | | | | 234,735 | |
A.M. Castle & Co.(b) | | | 1,240 | | | | 9,114 | |
| | | | | 243,849 | |
| | |
| Systems Software–2.90% | | | | | | | | |
CommVault Systems, Inc.(b) | | | 4,000 | | | | 177,360 | |
FireEye, Inc.(b) | | | 10,690 | | | | 363,353 | |
NetSuite Inc.(b) | | | 2,090 | | | | 227,100 | |
| | | | | 767,813 | |
| | |
| Technology Distributors–0.81% | | | | | | | | |
SYNNEX Corp. | | | 3,120 | | | | 215,842 | |
| Technology Hardware, Storage & Peripherals–2.73% | |
3D Systems Corp.(b) | | | 6,390 | | | | 241,542 | |
Silicon Graphics International Corp.(b) | | | 1,940 | | | | 16,839 | |
Stratasys Ltd.(b) | | | 2,250 | | | | 270,810 | |
Violin Memory, Inc.(b) | | | 40,080 | | | | 193,987 | |
| | | | | 723,178 | |
See accompanying Notes to Financial Statements which are an integral part of the financial statements.
13 Invesco All Cap Market Neutral Fund
| | | | | | | | |
| | | Shares | | | Value | |
|
| Thrifts & Mortgage Finance–0.48% | |
Nationstar Mortgage Holdings, Inc.(b) | | | 3,630 | | | $ | 127,486 | |
| | | | | | | | |
| | | Shares | | | Value | |
| Wireless Telecommunication Services–0.93% | |
RingCentral, Inc.–Class A(b) | | | 18,820 | | | $ | 247,315 | |
Total Securities Sold Short
(Total Proceeds $24,804,082) | | | $ | 24,302,923 | |
Investment Abbreviations:
| | |
| REIT | | – Real Estate Investment Trust |
Notes to Schedule of Investments:
| (a) | Industry and/or sector classifications used in this report are generally according to the Global Industry Classification Standard, which was developed by and is the exclusive property and a service mark of MSCI Inc. and Standard & Poor’s. |
| (b) | Non-income producing security. |
| (c) | All or a portion of this security was pledged as collateral to cover margin requirements for securities sold short. The aggregate value of collateral was segregated by the Fund was $32,331,933, which represents 133.04% of the value of securities sold short. |
| (d) | The money market fund and the Fund are affiliated by having the same investment adviser. |
See accompanying Notes to Financial Statements which are an integral part of the financial statements.
14 Invesco All Cap Market Neutral Fund
Statement of Assets and Liabilities
October 31, 2014
| | | | |
Assets: | |
Investments, at value (Cost $23,406,469) | | $ | 24,493,297 | |
Investments in affiliated money market funds, at value and cost | | | 6,824,003 | |
Total investments, at value (Cost $30,230,472) | | | 31,317,300 | |
Receivable for: | | | | |
Short positions covered | | | 144,626 | |
Deposits with brokers for securities sold short | | | 23,783,610 | |
Investments sold | | | 1,100,222 | |
Fund shares sold | | | 182,297 | |
Dividends and interest | | | 14,544 | |
Fund expenses absorbed | | | 20,844 | |
Investment for trustee deferred compensation and retirement plans | | | 1,887 | |
Other assets | | | 12,272 | |
Total assets | | | 56,577,602 | |
|
Liabilities: | |
Securities sold short, at value (proceeds $24,804,082) | | | 24,302,923 | |
Payable for: | | | | |
Investments purchased | | | 5,346,293 | |
Fund shares reacquired | | | 292,059 | |
Dividends for securities sold short | | | 2,187 | |
Accrued fees to affiliates | | | 2,544 | |
Accrued trustees’ and officers’ fees and benefits | | | 1,954 | |
Accrued other operating expenses | | | 106,252 | |
Trustee deferred compensation and retirement plans | | | 1,887 | |
Total liabilities | | | 30,056,099 | |
Net assets applicable to shares outstanding | | $ | 26,521,503 | |
|
Net assets consist of: | |
Shares of beneficial interest | | $ | 25,323,394 | |
Undistributed net investment income (loss) | | | (1,547 | ) |
Undistributed net realized gain (loss) | | | (388,331 | ) |
Net unrealized appreciation | | | 1,587,987 | |
| | | $ | 26,521,503 | |
| | | | |
Net Assets: | |
Class A | | $ | 9,741,574 | |
Class C | | $ | 857,096 | |
Class R | | $ | 39,640 | |
Class Y | | $ | 14,651,220 | |
Class R5 | | $ | 647,599 | |
Class R6 | | $ | 584,374 | |
|
Shares outstanding, $0.01 par value per share,
with an unlimited number of shares authorized: | |
Class A | | | 910,403 | |
Class C | | | 80,599 | |
Class R | | | 3,713 | |
Class Y | | | 1,366,392 | |
Class R5 | | | 60,387 | |
Class R6 | | | 54,496 | |
Class A: | | | | |
Net asset value per share | | $ | 10.70 | |
Maximum offering price per share | | | | |
(Net asset value of $10.70 ¸ 94.50%) | | $ | 11.32 | |
Class C: | | | | |
Net asset value and offering price per share | | $ | 10.63 | |
Class R: | | | | |
Net asset value and offering price per share | | $ | 10.68 | |
Class Y: | | | | |
Net asset value and offering price per share | | $ | 10.72 | |
Class R5: | | | | |
Net asset value and offering price per share | | $ | 10.72 | |
Class R6: | | | | |
Net asset value and offering price per share | | $ | 10.72 | |
See accompanying Notes to Financial Statements which are an integral part of the financial statements.
15 Invesco All Cap Market Neutral Fund
Statement of Operations
For the period December 17, 2013 (commencement date) through October 31, 2014
| | | | |
Investment income: | |
Dividends (net of foreign withholding taxes of $1,374) | | $ | 109,638 | |
Dividends from affiliated money market funds | | | 644 | |
Short stock rebates | | | 53,258 | |
Total investment income | | | 163,540 | |
| |
Expenses: | | | | |
Advisory fees | | | 135,902 | |
Administrative services fees | | | 43,699 | |
Custodian fees | | | 4,724 | |
Distribution fees: | | | | |
Class A | | | 11,976 | |
Class C | | | 1,889 | |
Class R | | | 71 | |
Dividends on short sales | | | 56,754 | |
Interest and line of credit fees | | | 261,277 | |
Transfer agent fees — A, C, R and Y | | | 4,622 | |
Transfer agent fees — R5 | | | 84 | |
Transfer agent fees — R6 | | | 22 | |
Trustees’ and officers’ fees and benefits | | | 18,435 | |
Registration and filing fees | | | 87,477 | |
Professional services fees | | | 129,713 | |
Other | | | 21,287 | |
Total expenses | | | 777,932 | |
Less: Fees waived and expenses reimbursed | | | (299,060 | ) |
Net expenses | | | 478,872 | |
Net investment income (loss) | | | (315,332 | ) |
| |
Realized and unrealized gain (loss) from: | | | | |
Net realized gain (loss) from: | | | | |
Investment securities | | | 320,336 | |
Securities sold short | | | (707,500 | ) |
| | | | (387,164 | ) |
Change in net unrealized appreciation of: | | | | |
Investment securities | | | 1,086,828 | |
Securities sold short | | | 501,159 | |
| | | | 1,587,987 | |
Net realized and unrealized gain | | | 1,200,823 | |
Net increase in net assets resulting from operations | | $ | 885,491 | |
See accompanying Notes to Financial Statements which are an integral part of the financial statements.
16 Invesco All Cap Market Neutral Fund
Statement of Changes in Net Assets
For the period December 17, 2013 (commencement date) through October 31, 2014
| | | | |
| | | 2014 | |
Operations: | | | | |
Net investment income (loss) | | $ | (315,332 | ) |
Net realized gain (loss) | | | (387,164 | ) |
Change in net unrealized appreciation | | | 1,587,987 | |
Net increase in net assets resulting from operations | | | 885,491 | |
| |
Share transactions–net: | | | | |
Class A | | | 9,349,083 | |
Class C | | | 848,820 | |
Class R | | | 38,619 | |
Class Y | | | 14,247,251 | |
Class R5 | | | 604,228 | |
Class R6 | | | 548,011 | |
Net increase in net assets resulting from share transactions | | | 25,636,012 | |
Net increase in net assets | | | 26,521,503 | |
| |
Net assets: | | | | |
Beginning of period | | | — | |
End of period (includes undistributed net investment income (loss) of $(1,547)) | | $ | 26,521,503 | |
Notes to Financial Statements
October 31, 2014
NOTE 1—Significant Accounting Policies
Invesco All Cap Market Neutral Fund (the “Fund”) is a series portfolio of AIM Investment Funds (Invesco Investment Funds) (the “Trust”). The Trust is organized as a Delaware statutory trust and is registered under the Investment Company Act of 1940, as amended (the “1940 Act”), as an open-end series management investment company consisting of twenty-four separate series portfolios, each authorized to issue an unlimited number of shares of beneficial interest. The assets, liabilities and operations of each portfolio are accounted for separately. Information presented in these financial statements pertains only to the Fund. Matters affecting each portfolio or class will be voted on exclusively by the shareholders of such portfolio or class.
The Fund’s investment objective is to provide a positive return over a full market cycle from a broadly diversified portfolio of stocks while seeking to limit exposure to the general risks associated with stock market investing.
The Fund currently consists of six different classes of shares: Class A, Class C, Class R, Class Y, Class R5 and Class R6. Class A shares are sold with a front-end sales charge unless certain waiver criteria are met and under certain circumstances load waived shares may be subject to contingent deferred sales charges (“CDSC”). Class C shares are sold with a CDSC. Class R, Class Y, Class R5 and Class R6 shares are sold at net asset value.
The following is a summary of the significant accounting policies followed by the Fund in the preparation of its financial statements.
| A. | Security Valuations — Securities, including restricted securities, are valued according to the following policy. |
A security listed or traded on an exchange (except convertible securities) is valued at its last sales price or official closing price as of the close of the customary trading session on the exchange where the security is principally traded, or lacking any sales or official closing price on a particular day, the security may be valued at the closing bid price on that day. Securities traded in the over-the-counter market are valued based on prices furnished by independent pricing services or market makers. When such securities are valued by an independent pricing service they may be considered fair valued. Futures contracts are valued at the final settlement price set by an exchange on which they are principally traded. Listed options are valued at the mean between the last bid and ask prices from the exchange on which they are principally traded. Options not listed on an exchange are valued by an independent source at the mean between the last bid and ask prices. For purposes of determining net asset value per share, futures and option contracts generally are valued 15 minutes after the close of the customary trading session of the New York Stock Exchange (“NYSE”).
Investments in open-end and closed-end registered investment companies that do not trade on an exchange are valued at the end of day net asset value per share. Investments in open-end and closed-end registered investment companies that trade on an exchange are valued at the last sales price or official closing price as of the close of the customary trading session on the exchange where the security is principally traded.
Debt obligations (including convertible securities) and unlisted equities are fair valued using an evaluated quote provided by an independent pricing service. Evaluated quotes provided by the pricing service may be determined without exclusive reliance on quoted prices, and may reflect appropriate factors such as institution-size trading in similar groups of securities, developments related to specific securities, dividend rate (for unlisted equities), yield (for debt obligations), quality, type of issue, coupon rate (for debt obligations), maturity (for debt obligations), individual trading characteristics and other market data. Debt obligations are subject to interest rate and credit risks. In addition, all debt obligations involve some risk of default with respect to interest and/or principal payments.
17 Invesco All Cap Market Neutral Fund
Foreign securities’ (including foreign exchange contracts) prices are converted into U.S. dollar amounts using the applicable exchange rates as of the close of the NYSE. If market quotations are available and reliable for foreign exchange-traded equity securities, the securities will be valued at the market quotations. Because trading hours for certain foreign securities end before the close of the NYSE, closing market quotations may become unreliable. If between the time trading ends on a particular security and the close of the customary trading session on the NYSE, events occur that the Adviser determines are significant and make the closing price unreliable, the Fund may fair value the security. If the event is likely to have affected the closing price of the security, the security will be valued at fair value in good faith using procedures approved by the Board of Trustees. Adjustments to closing prices to reflect fair value may also be based on a screening process of an independent pricing service to indicate the degree of certainty, based on historical data, that the closing price in the principal market where a foreign security trades is not the current value as of the close of the NYSE. Foreign securities’ prices meeting the approved degree of certainty that the price is not reflective of current value will be priced at the indication of fair value from the independent pricing service. Multiple factors may be considered by the independent pricing service in determining adjustments to reflect fair value and may include information relating to sector indices, American Depositary Receipts and domestic and foreign index futures. Foreign securities may have additional risks including exchange rate changes, potential for sharply devalued currencies and high inflation, political and economic upheaval, the relative lack of issuer information, relatively low market liquidity and the potential lack of strict financial and accounting controls and standards.
Securities for which market prices are not provided by any of the above methods may be valued based upon quotes furnished by independent sources. The last bid price may be used to value equity securities. The mean between the last bid and ask prices is used to value debt obligations, including corporate loans.
Securities for which market quotations are not readily available or became unreliable are valued at fair value as determined in good faith by or under the supervision of the Trust’s officers following procedures approved by the Board of Trustees. Issuer specific events, market trends, bid/ask quotes of brokers and information providers and other market data may be reviewed in the course of making a good faith determination of a security’s fair value.
The Fund may invest in securities that are subject to interest rate risk, meaning the risk that the prices will generally fall as interest rates rise and, conversely, the prices will generally rise as interest rates fall. Specific securities differ in their sensitivity to changes in interest rates depending on their individual characteristics. Changes in interest rates may result in increased market volatility, which may affect the value and/or liquidity of certain of the Fund’s investments.
Valuations change in response to many factors including the historical and prospective earnings of the issuer, the value of the issuer’s assets, general economic conditions, interest rates, investor perceptions and market liquidity. Because of the inherent uncertainties of valuation, the values reflected in the financial statements may materially differ from the value received upon actual sale of those investments.
| B. | Securities Transactions and Investment Income — Securities transactions are accounted for on a trade date basis. Realized gains or losses on sales are computed on the basis of specific identification of the securities sold. Interest income and short stock rebate income are recorded on the accrual basis. Dividend income and dividend expense on short sales are recorded on the ex-dividend date. Premiums and discounts are amortized and/or accreted for financial reporting purposes. |
The Fund may periodically participate in litigation related to Fund investments. As such, the Fund may receive proceeds from litigation settlements. Any proceeds received are included in the Statement of Operations as realized gain (loss) for investments no longer held and as unrealized gain (loss) for investments still held.
Brokerage commissions and mark ups are considered transaction costs and are recorded as an increase to the cost basis of securities purchased and/or a reduction of proceeds on a sale of securities. Such transaction costs are included in the determination of net realized and unrealized gain (loss) from investment securities reported in the Statement of Operations and the Statement of Changes in Net Assets and the net realized and unrealized gains (losses) on securities per share in the Financial Highlights. Transaction costs are included in the calculation of the Fund’s net asset value and, accordingly, they reduce the Fund’s total returns. These transaction costs are not considered operating expenses and are not reflected in net investment income reported in the Statement of Operations and Statement of Changes in Net Assets, or the net investment income per share and ratios of expenses and net investment income reported in the Financial Highlights, nor are they limited by any expense limitation arrangements between the Fund and the investment adviser.
The Fund allocates income and realized and unrealized capital gains and losses to a class based on the relative net assets of each class.
| C. | Country Determination — For the purposes of making investment selection decisions and presentation in the Schedule of Investments, the investment adviser may determine the country in which an issuer is located and/or credit risk exposure based on various factors. These factors include the laws of the country under which the issuer is organized, where the issuer maintains a principal office, the country in which the issuer derives 50% or more of its total revenues and the country that has the primary market for the issuer’s securities, as well as other criteria. Among the other criteria that may be evaluated for making this determination are the country in which the issuer maintains 50% or more of its assets, the type of security, financial guarantees and enhancements, the nature of the collateral and the sponsor organization. Country of issuer and/or credit risk exposure has been determined to be the United States of America, unless otherwise noted. |
| D. | Distributions — Distributions from net investment income and net realized capital gain, if any, are generally declared and paid annually and recorded on the ex-dividend date. The Fund may elect to treat a portion of the proceeds from redemptions as distributions for federal income tax purposes. |
| E. | Federal Income Taxes — The Fund intends to comply with the requirements of Subchapter M of the Internal Revenue Code of 1986, as amended (the “Internal Revenue Code”), necessary to qualify as a regulated investment company and to distribute substantially all of the Fund’s taxable earnings to shareholders. As such, the Fund will not be subject to federal income taxes on otherwise taxable income (including net realized capital gain) that is distributed to shareholders. Therefore, no provision for federal income taxes is recorded in the financial statements. |
The Fund recognizes the tax benefits of uncertain tax positions only when the position is more likely than not to be sustained. Management has analyzed the Fund’s uncertain tax positions and concluded that no liability for unrecognized tax benefits should be recorded related to uncertain tax positions. Management is not aware of any tax positions for which it is reasonably possible that the total amounts of unrecognized tax benefits will change materially in the next 12 months.
The Fund files tax returns in the U.S. Federal jurisdiction and certain other jurisdictions. Generally, the Fund is subject to examinations by such taxing authorities for up to three years after the filing of the return for the tax period.
18 Invesco All Cap Market Neutral Fund
| F. | Expenses — Fees provided for under the Rule 12b-1 plan of a particular class of the Fund are charged to the operations of such class. Transfer agency fees and expenses and other shareholder recordkeeping fees and expenses attributable to Class R5 and Class R6 are allocated to each share class based on relative net assets. Sub-accounting fees attributable to Class R5 are charged to the operations of the class. Transfer agency fees and expenses and other shareholder recordkeeping fees and expenses relating to all other classes are allocated among those classes based on relative net assets. All other expenses are allocated among the classes based on relative net assets. |
| G. | Accounting Estimates — The preparation of financial statements in conformity with accounting principles generally accepted in the United States of America (“GAAP”) requires management to make estimates and assumptions that affect the reported amounts of assets and liabilities at the date of the financial statements and the reported amounts of revenues and expenses during the reporting period including estimates and assumptions related to taxation. Actual results could differ from those estimates by a significant amount. In addition, the Fund monitors for material events or transactions that may occur or become known after the period-end date and before the date the financial statements are released to print. |
| H. | Indemnifications — Under the Trust’s organizational documents, each Trustee, officer, employee or other agent of the Trust is indemnified against certain liabilities that may arise out of the performance of their duties to the Fund. Additionally, in the normal course of business, the Fund enters into contracts, including the Fund’s servicing agreements, that contain a variety of indemnification clauses. The Fund’s maximum exposure under these arrangements is unknown as this would involve future claims that may be made against the Fund that have not yet occurred. The risk of material loss as a result of such indemnification claims is considered remote. |
| I. | Securities Sold Short — The Fund may enter into short sales of securities which it concurrently holds (“covered”) or for which it holds no corresponding position (“not covered”). Securities sold short represent a liability of the Fund to acquire specific securities at prevailing market prices at a future date in order to satisfy the obligation to deliver the securities sold. The liability is recorded on the books of the Fund at the market value of the common stock determined each day in accordance with the Fund’s security valuations policy. The Fund will incur a loss if the price of the security increases between the date of short sale and the date on which the Fund replaces the borrowed security. The Fund realizes a gain if the price of the security declines between those dates. For positions not covered, there is no ceiling on the ultimate price paid for the securities to cover the short position and therefore, the loss could exceed the amount of proceeds received. A short position in a security poses more risk than holding the same security long. As there is no limit on how much the price of the security can increase, the Fund’s exposure is unlimited. |
The Fund is required to segregate cash or securities as collateral in margin accounts with the broker at a level that is equal to the obligation to the broker who delivered such securities to the buyer on behalf of the Fund. The short stock rebate presented in the Statement of Operations represents the net income earned on short sale proceeds held on deposit with the broker and margin interest earned or incurred on short sale transactions. The Fund may also earn or incur margin interest on short sale transactions. Margin interest is the income earned (or expenses incurred) as a result of the market value of securities sold short being less than (or greater than) the proceeds received on the short sales.
| J. | Leverage Risk — Leverage exists when a Fund can lose more than it originally invests because it purchases or sells an instrument or enters into a transaction without investing an amount equal to the full economic exposure of the instrument or transaction. |
| K. | Collateral — To the extent the Fund has designated or segregated a security as collateral and that security is subsequently sold, it is the Fund’s practice to replace such collateral no later than the next business day. |
NOTE 2—Advisory Fees and Other Fees Paid to Affiliates
The Trust has entered into a master investment advisory agreement with Invesco Advisers, Inc. (the “Adviser” or “Invesco”). Under the terms of the investment advisory agreement, the Fund pays an advisory fee to the Adviser based on the annual rate of the Fund’s average daily net assets as follows:
| | | | |
| Average Daily Net Assets | | Rate | |
First $10 billion | | | 1.25% | |
Over $10 billion | | | 1.15% | |
For the period December 17, 2013 (commencement date) through October 31, 2014, the effective advisory fees incurred by the Fund was 1.25%.
Under the terms of a master sub-advisory agreement between the Adviser and each of Invesco Asset Management Deutschland GmbH, Invesco Asset Management Limited, Invesco Asset Management (Japan) Limited, Invesco Australia Limited, Invesco Hong Kong Limited, Invesco Senior Secured Management, Inc., Invesco Canada Ltd. and Invesco Power Shares Capital Management LLC (collectively, the “Affiliated Sub-Advisers”) the Adviser, not the Fund, may pay 40% of the fees paid to the Adviser to any such Affiliated Sub-Adviser(s) that provide(s) discretionary investment management services to the Fund based on the percentage of assets allocated to such Sub-Adviser(s).
The Adviser has contractually agreed, through at least February 29, 2016, to waive advisory fees and/or reimburse expenses to the extent necessary to limit total annual fund operating expenses after fee waiver and/or expense reimbursement (excluding certain items discussed below) of Class A, Class C, Class R, Class Y, Class R5 and Class R6 shares to 1.62%, 2.37%, 1.87%, 1.37%, 1.37% and 1.37% of average daily net assets, respectively. In determining the Adviser’s obligation to waive advisory fees and/or reimburse expenses, the following expenses are not taken into account, and could cause total annual fund operating expenses after fee waiver and/or expense reimbursement to exceed the numbers reflected above: (1) interest; (2) taxes; (3) dividend expense on short sales; (4) extraordinary or non-routine items, including litigation expenses; and (5) expenses that the Fund has incurred but did not actually pay because of an expense offset arrangement. Unless Invesco continues the fee waiver agreement, it will terminate on February 29, 2016. The fee waiver agreement cannot be terminated during its term.
Further, the Adviser has contractually agreed, through at least June 30, 2016, to waive the advisory fee payable by the Fund in an amount equal to 100% of the net advisory fees the Adviser receives from the affiliated money market funds on investments by the Fund of uninvested cash in such affiliated money market funds.
For the period December 17, 2013 (commencement date) through October 31, 2014, the Adviser waived advisory fees and reimbursed fund level expenses of $294,332 and reimbursed class level expenses of $2,232, $88, $7, $2,295, $84 and $22 for Class A, Class C, Class R, Class Y, Class R5 and Class R6 shares, respectively.
19 Invesco All Cap Market Neutral Fund
The Trust has entered into a master administrative services agreement with Invesco pursuant to which the Fund has agreed to pay Invesco for certain administrative costs incurred in providing accounting services to the Fund. For the period December 17, 2013 (commencement date) through October 31, 2014, expenses incurred under the agreement are shown in the Statement of Operations as Administrative services fees.
The Trust has entered into a transfer agency and service agreement with Invesco Investment Services, Inc. (“IIS”) pursuant to which the Fund has agreed to pay IIS a fee for providing transfer agency and shareholder services to the Fund and reimburse IIS for certain expenses incurred by IIS in the course of providing such services. IIS may make payments to intermediaries that provide omnibus account services, sub-accounting services and/or networking services. All fees payable by IIS to intermediaries that provide omnibus account services or sub-accounting are charged back to the Fund, subject to certain limitations approved by the Trust’s Board of Trustees. For the period December 17, 2013 (commencement date) through October 31, 2014, expenses incurred under the agreement are shown in the Statement of Operations as Transfer agent fees.
The Trust has entered into master distribution agreements with Invesco Distributors, Inc. (“IDI”) to serve as the distributor for the Class A, Class C, Class R, Class Y, Class R5 and Class R6 shares of the Fund. The Trust has adopted plans pursuant to Rule 12b-1 under the 1940 Act with respect to the Fund’s Class A, Class C and Class R shares (collectively the “Plans”). The Fund, pursuant to the Plans, pays IDI compensation at the annual rate of 0.25% of the Fund’s average daily net assets of Class A shares, 1.00% of the average daily net assets of Class C shares and 0.50% of the average daily net assets of Class R shares. Of the Plan payments, up to 0.25% of the average daily net assets of each class of shares may be paid to furnish continuing personal shareholder services to customers who purchase and own shares of such classes. Any amounts not paid as a service fee under the Plans would constitute an asset-based sales charge. Rules of the Financial Industry Regulatory Authority (“FINRA”) impose a cap on the total sales charges, including asset-based sales charges, that may be paid by any class of shares of the Fund. For the period December 17, 2013 (commencement date) through October 31, 2014, expenses incurred under the Plans are shown in the Statement of Operations as Distribution fees.
Front-end sales commissions and CDSC (collectively, the “sales charges”) are not recorded as expenses of the Fund. Front-end sales commissions are deducted from proceeds from the sales of Fund shares prior to investment in Class A shares of the Fund. CDSC are deducted from redemption proceeds prior to remittance to the shareholder. During the period December 17, 2013 (commencement date) through October 31, 2014, IDI advised the Fund that IDI retained $2,254 in front-end sales commissions from the sale of Class A shares.
Certain officers and trustees of the Trust are officers and directors of the Adviser, IIS and/or IDI.
NOTE 3—Additional Valuation Information
GAAP defines fair value as the price that would be received to sell an asset or paid to transfer a liability in an orderly transaction between market participants at the measurement date, under current market conditions. GAAP establishes a hierarchy that prioritizes the inputs to valuation methods, giving the highest priority to readily available unadjusted quoted prices in an active market for identical assets (Level 1) and the lowest priority to significant unobservable inputs (Level 3), generally when market prices are not readily available or are unreliable. Based on the valuation inputs, the securities or other investments are tiered into one of three levels. Changes in valuation methods may result in transfers in or out of an investment’s assigned level:
| | Level 1 — | Prices are determined using quoted prices in an active market for identical assets. |
| | Level 2 — | Prices are determined using other significant observable inputs. Observable inputs are inputs that other market participants may use in pricing a security. These may include quoted prices for similar securities, interest rates, prepayment speeds, credit risk, yield curves, loss severities, default rates, discount rates, volatilities and others. |
| | Level 3 — | Prices are determined using significant unobservable inputs. In situations where quoted prices or observable inputs are unavailable (for example, when there is little or no market activity for an investment at the end of the period), unobservable inputs may be used. Unobservable inputs reflect the Fund’s own assumptions about the factors market participants would use in determining fair value of the securities or instruments and would be based on the best available information. |
The following is a summary of the tiered valuation input levels, as of October 31, 2014. The level assigned to the securities valuations may not be an indication of the risk or liquidity associated with investing in those securities. Because of the inherent uncertainties of valuation, the values reflected in the financial statements may materially differ from the value received upon actual sale of those investments.
| | | | | | | | | | | | | | | | |
| | | Level 1 | | | Level 2 | | | Level 3 | | | Total | |
Equity Securities | | $ | 31,317,300 | | | $ | — | | | $ | — | | | $ | 31,317,300 | |
Securities Sold Short | | | (24,302,923 | ) | | | — | | | | — | | | | (24,302,923 | ) |
Total Investments | | $ | 7,014,377 | | | $ | — | | | $ | — | | | $ | 7,014,377 | |
NOTE 4—Trustees’ and Officers’ Fees and Benefits
Trustees’ and Officers’ Fees and Benefits include amounts accrued by the Fund to pay remuneration to certain Trustees and Officers of the Fund. Trustees have the option to defer compensation payable by the Fund, and Trustees’ and Officers’ Fees and Benefits also include amounts accrued by the Fund to fund such deferred compensation amounts. Those Trustees who defer compensation have the option to select various Invesco Funds in which their deferral accounts shall be deemed to be invested. Obligations under the deferred compensation plan represents unsecured claims against the general assets of the Fund.
NOTE 5—Cash Balances
The Fund is permitted to temporarily carry a negative or overdrawn balance in its account with State Street Bank and Trust Company, the custodian bank. Such balances, if any at period end, are shown in the Statement of Assets and Liabilities under the payable caption Amount due custodian. To compensate the custodian bank for such overdrafts, the overdrawn Fund may either (1) leave funds as a compensating balance in the account so the custodian bank can be compensated by earning the additional interest; or (2) compensate by paying the custodian bank at a rate agreed upon by the custodian bank and Invesco, not to exceed the contractually agreed upon rate.
20 Invesco All Cap Market Neutral Fund
NOTE 6—Distributions to Shareholders and Tax Components of Net Assets
There were no ordinary income and long-term gain distributions paid during the period December 17, 2013 (commencement date) through October 31, 2014.
Tax Components of Net Assets at Period-End:
| | | | |
| | | 2014 | |
Net unrealized appreciation — investments | | $ | 1,393,236 | |
Temporary book/tax differences | | | (1,547 | ) |
Capital loss carryforward | | | (193,580 | ) |
Shares of beneficial interest | | | 25,323,394 | |
Total net assets | | $ | 26,521,503 | |
The difference between book-basis and tax-basis unrealized appreciation (depreciation) is due to differences in the timing of recognition of gains and losses on investments for tax and book purposes. The Fund’s net unrealized appreciation difference is attributable primarily to wash sales.
The temporary book/tax differences are a result of timing differences between book and tax recognition of income and/or expenses. The Fund’s temporary book/tax differences are the result of the trustee deferral of compensation and retirement plan benefits.
Capital loss carryforward is calculated and reported as of a specific date. Results of transactions and other activity after that date may affect the amount of capital loss carryforward actually available for the Fund to utilize. The ability to utilize capital loss carryforward in the future may be limited under the Internal Revenue Code and related regulations based on the results of future transactions.
The Fund has a capital loss carryforward as of October 31, 2014:
| | | | | | | | | | | | |
| Capital Loss Carryforward* | |
| Expiration | | Short-Term | | | Long-Term | | | Total | |
Not subject to expiration | | $ | 193,580 | | | $ | — | | | $ | 193,580 | |
| * | Capital loss carryforward as of the date listed above is reduced for limitations, if any, to the extent required by the Internal Revenue Code and may be further limited depending upon a variety of factors, including the realization of net unrealized gains or losses as of the date of any reorganization. |
NOTE 7—Investment Securities
The aggregate amount of investment securities (other than short-term securities, U.S. Treasury obligations and money market funds, if any) purchased and sold by the Fund during December 17, 2013 (commencement date) through October 31, 2014 was $35,352,356 and $12,256,861, respectively. Cost of investments on a tax basis includes the adjustments for financial reporting purposes as of the most recently completed federal income tax reporting period-end.
| | | | |
| Unrealized Appreciation (Depreciation) of Investment Securities on a Tax Basis | |
Aggregate unrealized appreciation of: | | | | |
Investment securities | | $ | 1,716,190 | |
Securities sold short | | | 1,715,010 | |
Aggregate unrealized (depreciation) of: | | | | |
Investment securities | | | (772,555 | ) |
Securities sold short | | | (1,265,409 | ) |
Net unrealized appreciation of investment securities | | $ | 1,393,236 | |
Cost of investments for tax purposes is $30,373,665.
Proceeds from securities sold short for tax purposes are $(24,752,524).
NOTE 8—Reclassification of Permanent Differences
Primarily as a result of differing book/tax treatment of net operating loss and nondeductible organizational expenses, on October 31, 2014, undistributed net investment income (loss) was increased by $313,785, undistributed net realized gain (loss) was decreased by $1,167 and shares of beneficial interest was decreased by $312,618. This reclassification had no effect on the net assets of the Fund.
21 Invesco All Cap Market Neutral Fund
NOTE 9—Share Information
| | | | | | | | |
| | | Summary of Share Activity | |
| | | December 17, 2013
(commencement date) through
October 31, 2014(a) | |
| | | Shares | | | Amount | |
Sold: | | | | | | | | |
Class A | | | 951,991 | | | $ | 9,785,091 | |
Class C | | | 130,154 | | | | 1,361,251 | |
Class R | | | 3,713 | | | | 38,619 | |
Class Y | | | 1,373,449 | | | | 14,321,343 | |
Class R5 | | | 60,560 | | | | 606,027 | |
Class R6 | | | 54,496 | | | | 548,011 | |
| | |
Reacquired: | | | | | | | | |
Class A | | | (41,588 | ) | | | (436,008 | ) |
Class C | | | (49,555 | ) | | | (512,431 | ) |
Class Y | | | (7,057 | ) | | | (74,092 | ) |
Class R5 | | | (173 | ) | | | (1,799 | ) |
Net increase in share activity | | | 2,475,990 | | | $ | 25,636,012 | |
| (a) | There are entities that are record owners of more than 5% of the outstanding shares of the Fund and in the aggregate own 50% of the outstanding shares of the Fund. IDI has an agreement with these entities to sell Fund shares. The Fund, Invesco and/or Invesco affiliates may make payments to these entities, which are considered to be related to the Fund, for providing services to the Fund, Invesco and/or Invesco affiliates including but not limited to services such as securities brokerage, distribution, third party record keeping and account servicing. The Fund has no knowledge as to whether all or any portion of the shares owned of record by these entities are also owned beneficially. |
| | In addition, 40% of the outstanding shares of the Fund are owned by affiliated mutual funds. Affiliated mutual funds are other mutual funds that are also advised by Invesco. |
NOTE 10—Financial Highlights
The following schedule presents financial highlights for a share of the Fund outstanding throughout the periods indicated.
| | | | | | | | | | | | | | | | | | | | | | | | | | | | | | | | | | | | | | | | | | | | | | | | | | | | | | | | |
| | | Net asset
value,
beginning
of period | | | Net
investment
income
(loss)(a) | | | Net gains
on securities
(both
realized and
unrealized) | | | Total from
investment
operations | | | Net asset
value, end
of period | | | Total
return(b) | | | Net assets,
end of period
(000’s omitted) | | | Ratio of
expenses
to average
net assets
(including
interest
expense and
dividends on
short sales
expense)
with fee waivers
and/or expenses
absorbed | | | Ratio of
expenses
to average
net assets
(including
interest
expense and
dividends on
short sales
expense)
without fee waivers
and/or expenses
absorbed | | | Ratio of
expenses
to average
net assets
(excluding
interest
expense and
dividends on
short sales
expense)
with fee waivers
and/or expenses
absorbed | | | Ratio of
expenses
to average
net assets
(excluding
interest
expense and
dividends on
short sales
expense)
without fee waivers
and/or expenses
absorbed | | | Ratio of net
investment
income (loss)
to average
net assets | | | Ratio of
interest
expense and
dividends on
short sales
to average
net assets | | | Portfolio
turnover(c) | |
Class A | | | | | | | | | | | | | | | | | | | | | |
Year ended 10/31/14(d) | | $ | 10.00 | | | $ | (0.27 | ) | | $ | 0.97 | | | $ | 0.70 | | | $ | 10.70 | | | | 7.00 | % | | $ | 9,742 | | | | 4.53 | %(e) | | | 7.28 | %(e) | | | 1.60 | %(e) | | | 4.35 | %(e) | | | (3.03 | )%(e) | | | 2.93 | %(e) | | | 105 | % |
Class C | |
Year ended 10/31/14(d) | | | 10.00 | | | | (0.34 | ) | | | 0.97 | | | | 0.63 | | | | 10.63 | | | | 6.30 | | | | 857 | | | | 5.28 | (e) | | | 8.03 | (e) | | | 2.35 | (e) | | | 5.10 | (e) | | | (3.78 | )(e) | | | 2.93 | (e) | | | 105 | |
Class R | |
Year ended 10/31/14(d) | | | 10.00 | | | | (0.29 | ) | | | 0.97 | | | | 0.68 | | | | 10.68 | | | | 6.80 | | | | 40 | | | | 4.78 | (e) | | | 7.53 | (e) | | | 1.85 | (e) | | | 4.60 | (e) | | | (3.28 | )(e) | | | 2.93 | (e) | | | 105 | |
Class Y | |
Year ended 10/31/14(d) | | | 10.00 | | | | (0.25 | ) | | | 0.97 | | | | 0.72 | | | | 10.72 | | | | 7.20 | | | | 14,651 | | | | 4.28 | (e) | | | 7.03 | (e) | | | 1.35 | (e) | | | 4.10 | (e) | | | (2.78 | )(e) | | | 2.93 | (e) | | | 105 | |
Class R5 | |
Year ended 10/31/14(d) | | | 10.00 | | | | (0.25 | ) | | | 0.97 | | | | 0.72 | | | | 10.72 | | | | 7.20 | | | | 648 | | | | 4.28 | (e) | | | 7.00 | (e) | | | 1.35 | (e) | | | 4.07 | (e) | | | (2.78 | )(e) | | | 2.93 | (e) | | | 105 | |
Class R6 | |
Year ended 10/31/14(d) | | | 10.00 | | | | (0.25 | ) | | | 0.97 | | | | 0.72 | | | | 10.72 | | | | 7.20 | | | | 584 | | | | 4.28 | (e) | | | 6.99 | (e) | | | 1.35 | (e) | | | 4.06 | (e) | | | (2.78 | )(e) | | | 2.93 | (e) | | | 105 | |
| (a) | Calculated using average shares outstanding. |
| (b) | Includes adjustments in accordance with accounting principles generally accepted in the United States of America and as such, the net asset value for financial reporting purposes and the returns based upon those net asset values may differ from the net asset value and returns for shareholder transactions. Does not include sales charges and is not annualized for periods less than one year, if applicable. |
| (c) | Portfolio turnover is calculated at the fund level and is not annualized for periods less than one year, if applicable. |
| (d) | Commencement date of December 17, 2013. |
| (e) | Ratios are annualized and based on average daily net assets (000’s omitted) of $5,481, $216, $16, $5,635, $577 and $515 for Class A, Class C, Class R, Class Y, Class R5 and Class R6 shares, respectively. |
22 Invesco All Cap Market Neutral Fund
Report of Independent Registered Public Accounting Firm
To the Board of Trustees of AIM Investment Funds (Invesco Investment Funds)
and Shareholders of Invesco All Cap Market Neutral Fund:
In our opinion, the accompanying statement of assets and liabilities, including the schedule of investments, and the related statements of operations and of changes in net assets and the financial highlights present fairly, in all material respects, the financial position of Invesco All Cap Market Neutral Fund (one of the funds constituting AIM Investment Funds (Invesco Investment Funds), hereafter referred to as the “Fund”) at October 31, 2014, and the results of its operations, the changes in its net assets and the financial highlights for the period December 17, 2013 (commencement of operations) through October 31, 2014, in conformity with accounting principles generally accepted in the United States of America. These financial statements and financial highlights (hereafter referred to as “financial statements”) are the responsibility of the Fund’s management. Our responsibility is to express an opinion on these financial statements based on our audit. We conducted our audit of these financial statements in accordance with the standards of the Public Company Accounting Oversight Board (United States). Those standards require that we plan and perform the audit to obtain reasonable assurance about whether the financial statements are free of material misstatement. An audit includes examining, on a test basis, evidence supporting the amounts and disclosures in the financial statements, assessing the accounting principles used and significant estimates made by management, and evaluating the overall financial statement presentation. We believe that our audit, which included confirmation of securities at October 31, 2014 by correspondence with the custodian and brokers and the application of alternative auditing procedures where confirmations of security purchases have not been received, provides a reasonable basis for our opinion.
PRICEWATERHOUSECOOPERS LLP
December 23, 2014
Houston, Texas
23 Invesco All Cap Market Neutral Fund
Calculating your ongoing Fund expenses
Example
As a shareholder of the Fund, you incur two types of costs: (1) transaction costs, which may include sales charges (loads) on purchase payments or contingent deferred sales charges on redemptions, if any; and (2) ongoing costs, including management fees, distribution and/or service (12b-1) fees, and other Fund expenses. This example is intended to help you understand your ongoing costs (in dollars) of investing in the Fund and to compare these costs with ongoing costs of investing in other mutual funds. The example is based on an investment of $1,000 invested at the beginning of the period and held for the entire period May 1, 2014 through October 31, 2014.
Actual expenses
The table below provides information about actual account values and actual expenses. You may use the information in this table, together with the amount you invested, to estimate the expenses that you paid over the period. Simply divide your account value by $1,000 (for example, an $8,600 account value divided by $1,000 = 8.6), then multiply the result by the number in the table under the heading entitled “Actual Expenses Paid During Period” to estimate the expenses you paid on your account during this period.
Hypothetical example for comparison purposes
The table below also provides information about hypothetical account values and hypothetical expenses based on the Fund’s actual expense ratio and an assumed rate of return of 5% per year before expenses, which is not the Fund’s actual return.
The hypothetical account values and expenses may not be used to estimate the actual ending account balance or expenses you paid for the period. You may use this information to compare the ongoing costs of investing in the Fund and other funds. To do so, compare this 5% hypothetical example with the 5% hypothetical examples that appear in the shareholder reports of the other funds.
Please note that the expenses shown in the table are meant to highlight your ongoing costs only and do not reflect any transaction costs, such as sales charges (loads) on purchase payments or contingent deferred sales charges on redemptions, if any. Therefore, the hypothetical information is useful in comparing ongoing costs only, and will not help you determine the relative total costs of owning different funds. In addition, if these transaction costs were included, your costs would have been higher.
| | | | | | | | | | | | | | | | | | | | | | | | |
| Class | | Beginning
Account Value
(05/01/14) | | | ACTUAL | | | HYPOTHETICAL (5% annual return before
expenses) | | | Annualized
Expense
Ratio | |
| | | Ending
Account Value
(10/31/14)1 | | | Expenses
Paid During
Period2 | | | Ending
Account Value
(10/31/14) | | | Expenses
Paid During
Period2 | | |
| A | | $ | 1,000.00 | | | $ | 1,028.80 | | | $ | 23.37 | | | $ | 1,002.17 | | | $ | 23.06 | | | | 4.57 | % |
| C | | | 1,000.00 | | | | 1,026.00 | | | | 27.17 | | | | 998.39 | | | | 26.80 | | | | 5.32 | |
| R | | | 1,000.00 | | | | 1,027.90 | | | | 24.64 | | | | 1,000.91 | | | | 24.31 | | | | 4.82 | |
| Y | | | 1,000.00 | | | | 1,029.80 | | | | 22.10 | | | | 1,003.43 | | | | 21.81 | | | | 4.32 | |
| R5 | | | 1,000.00 | | | | 1,029.80 | | | | 22.10 | | | | 1,003.43 | | | | 21.81 | | | | 4.32 | |
| R6 | | | 1,000.00 | | | | 1,029.80 | | | | 22.10 | | | | 1,003.43 | | | | 21.81 | | | | 4.32 | |
| 1 | The actual ending account value is based on the actual total return of the Fund for the period May 1, 2014 through October 31, 2014, after actual expenses and will differ from the hypothetical ending account value which is based on the Fund’s expense ratio and a hypothetical annual return of 5% before expenses. |
| 2 | Expenses are equal to the Fund’s annualized expense ratio as indicated above multiplied by the average account value over the period, multiplied by 184/365 to reflect the most recent fiscal half year. |
24 Invesco All Cap Market Neutral Fund
Approval of Investment Advisory and Sub-Advisory Contracts
The Board of Trustees (the Board) of AIM Investment Funds (Invesco Investment Funds) is required under the Investment Company Act of 1940, as amended, to approve annually the renewal of Invesco All Cap Market Neutral Fund’s (the Fund) investment advisory agreements. During contract renewal meetings held on June 16-17, 2014, the Board as a whole, and the disinterested or “independent” Trustees, who comprise over 75% of the Board, voting separately, approved the continuance for the Fund of the Master Investment Advisory Agreement with Invesco Advisers, Inc. (Invesco Advisers and the investment advisory agreement) and the Master Intergroup Sub-Advisory Contract for Mutual Funds with Invesco Asset Management Deutschland GmbH, Invesco Asset Management Limited, Invesco Asset Management (Japan) Limited, Invesco Australia Limited, Invesco Hong Kong Limited, Invesco Senior Secured Management, Inc., Invesco Canada Ltd. and Invesco PowerShares Capital Management LLC (collectively, the Affiliated Sub-Advisers and the sub-advisory contracts) for another year, effective July 1, 2014.
In evaluating the fairness and reasonableness of compensation under the Fund’s investment advisory agreement and sub-advisory contracts, the Board considered, among other things, the factors discussed below. The Board determined that the continuation of the Fund’s investment advisory agreement and the sub-advisory contracts are in the best interest of the Fund and its shareholders and that the compensation payable to Invesco Advisers and the Affiliated Sub-Advisers under the agreements is fair and reasonable.
The Board’s Fund Evaluation Process
The Board’s Investments Committee has established three Sub-Committees, each of which is primarily responsible for overseeing the management of a number of the funds advised by Invesco Advisers (the Invesco Funds). The Sub-Committees meet throughout the year to review the performance of their assigned Invesco Funds, including reviewing materials prepared under the direction of the independent Senior Officer, an officer of the Invesco Funds who reports directly to the independent Trustees. Over the course of each year, the Sub-Committees meet with portfolio managers for their assigned Invesco Funds and other members of management to review the performance, investment objective(s), policies, strategies, limitations and investment risks of these funds. The Sub-Committees meet regularly and at designated contract renewal meetings each year to conduct a review of the performance, fees, expenses and other matters related to their assigned Invesco Funds. Each Sub-Committee recommends to the Investments Committee, which in turn recommends to the full Board, whether and on what terms to
approve the continuance of each Invesco Fund’s investment advisory agreement and sub-advisory contracts for another year.
During the contract renewal process, the Trustees receive comparative performance and fee data regarding the Invesco Funds prepared by Invesco Advisers and Lipper Inc. (Lipper), an independent provider of investment company data. The Trustees also receive an independent written evaluation from the Senior Officer. The Senior Officer’s evaluation is prepared as part of his responsibility to manage the process by which the Invesco Funds’ proposed management fees are negotiated during the annual contract renewal process to ensure they are negotiated in a manner that is at arms’ length and reasonable. In addition to meetings with Invesco Advisers and fund counsel, the independent Trustees also discuss the continuance of the investment advisory agreement and sub-advisory contracts in separate sessions with the Senior Officer and with independent legal counsel.
The Trustees recognized that the advisory fee rates for the Invesco Funds are, in many cases, the result of years of review and negotiation. The Trustees’ deliberations and conclusions in a particular year may be based in part on their deliberations and conclusions regarding these arrangements throughout the year and in prior years. The Trustees’ review and conclusions are based on the comprehensive consideration of all information presented to them and are not the result of any single determinative factor. Moreover, one Trustee may have weighed a particular piece of information or factor differently than another Trustee.
The discussion below serves as the Senior Officer’s independent written evaluation with respect to the Fund’s investment advisory agreement as well as a discussion of the material factors and related conclusions that formed the basis for the Board’s approval of the Fund’s investment advisory agreement and sub-advisory contracts. Unless otherwise stated, this information is current as of June 17, 2014, and may not reflect consideration of factors that became known to the Board after that date.
Factors and Conclusions and Summary of Independent Written Fee Evaluation
| A. | Nature, Extent and Quality of Services Provided by Invesco Advisers and the Affiliated Sub-Advisers |
The Board reviewed the advisory services provided to the Fund by Invesco Advisers under the Fund’s investment advisory agreement, the performance of Invesco Advisers in providing these services, and the credentials and experience of the officers and employees of Invesco Advisers who provide these services, including the Fund’s portfolio manager or managers, with whom the Sub-Committees met
during the year. The Board’s review of the qualifications of Invesco Advisers to provide advisory services included the Board’s consideration of Invesco Advisers’ investment process oversight, independent credit analysis and investment risk management. The Board also considered non-advisory services that Invesco Advisers and its affiliates provide to the Invesco Funds such as various back office support functions, equity and fixed income trading operations, internal audit, distribution and legal and compliance.
In determining whether to continue the Fund’s investment advisory agreement, the Board considered the benefits of reapproving an existing relationship and the greater uncertainty that may be associated with entering into a new relationship. The Board concluded that the nature, extent and quality of the services provided to the Fund by Invesco Advisers are appropriate and satisfactory and consistent with the terms of the Fund’s investment advisory agreement.
The Board reviewed the services that may be provided by the Affiliated Sub-Advisers under the sub-advisory contracts and the credentials and experience of the officers and employees of the Affiliated Sub-Advisers who provide these services. The Board noted that the Affiliated Sub-Advisers have offices and personnel that are located in financial centers around the world. As a result, the Affiliated Sub-Advisers can provide research and investment analysis on the markets and economies of various countries in which the Fund may invest, make recommendations regarding securities and assist with security trades. The Board concluded that the sub-advisory contracts benefit the Fund and its shareholders by permitting Invesco Advisers to use the resources and talents of the Affiliated Sub-Advisers in managing the Fund. The Board concluded that the nature, extent and quality of the services that may be provided by the Affiliated Sub-Advisers are appropriate and satisfactory and consistent with the terms of the Fund’s sub-advisory contracts.
The Board noted that the Fund recently began operations and that no comparative performance data was available.
| C. | Advisory and Sub-Advisory Fees |
The Board noted that no comparative fee information was available for the Fund.
The Board noted that Invesco Advisers has contractually agreed to waive fees and/or limit expenses of the Fund through at least December 31, 2015 in an amount necessary to limit total annual operating expenses to a specified percentage of average daily net assets for each class of the Fund.
The Board also compared the Fund’s effective advisory fee rate (the advisory fee rate after advisory fee waivers and before other expense limitations/waivers) to the effective advisory fee
25 �� Invesco All Cap Market Neutral Fund
rates of other mutual funds advised by Invesco Advisers and its affiliates that are managed using an investment process substantially similar to the investment process used for the Fund. The Board noted that the Fund’s effective advisory fee rate was the same as the effective advisory fee rate of one mutual fund with a similar investment process. The Board noted that Invesco Advisers and the Affiliated Sub-Advisers do not manage other client accounts using a substantially similar investment process.
The Board also considered the services that may be provided by the Affiliated Sub-Advisers pursuant to the sub-advisory contracts, as well as the fees payable by Invesco Advisers to the Affiliated Sub-Advisers pursuant to the sub-advisory contracts. The Board also noted that the sub-advisory fees are not paid directly by the Fund, but rather, are payable by Invesco Advisers to the Affiliated Sub-Advisers.
| D. | Economies of Scale and Breakpoints |
The Board considered the extent to which there are economies of scale in the provision of advisory services to the Fund. The Board also considered whether the Fund benefits from economies of scale through contractual breakpoints in the Fund’s advisory fee schedule and was assisted in this review by a report from the Senior Officer. The Board also noted that the Fund shares directly in economies of scale through lower fees charged by third party service providers based on the combined size of the Invesco Funds and other clients advised by Invesco Advisers.
| E. | Profitability and Financial Resources |
The Board reviewed information from Invesco Advisers concerning the costs of the advisory and other services that Invesco Advisers and its affiliates provide to the Fund and the profitability of Invesco Advisers and its affiliates in providing these services for the year ended December 31, 2013. The Board received information from Invesco Advisers about the methodology used to prepare the profitability information. The Board considered the profitability of Invesco Advisers in managing the Fund and the Invesco Funds. The Board noted that Invesco Advisers continues to operate at a net profit from services Invesco Advisers and its subsidiaries provide to the Invesco Funds. The Board noted that Invesco Advisers and its subsidiaries did not make a profit from managing the Fund because the Fund did not have a full year of operations. The Board received and accepted information from Invesco Advisers demonstrating that Invesco Advisers and each Affiliated Sub-Adviser are financially sound and have the resources necessary to perform their obligations under the investment advisory agreement and sub-advisory contracts.
| F. | Collateral Benefits to Invesco Advisers and its Affiliates |
The Board considered various other benefits received by Invesco Advisers and its affiliates from the relationship with the Fund, including the fees received for their provision of transfer agency and distribution services to the Fund.
The Board considered the performance of Invesco Advisers and its affiliates in providing these services and the organizational structure employed to provide these services. The Board also considered that these services are provided to the Fund pursuant to written contracts that are reviewed and approved on an annual basis by the Board; that the services are required for the operation of the Fund; that Invesco Advisers and its affiliates can provide services, the nature and quality of which are at least equal to those provided by others offering the same or similar services; and that the fees for such services are fair and reasonable in light of the usual and customary charges by others for services of the same nature and quality.
The Board considered the benefits realized by Invesco Advisers and the Affiliated Sub-Advisers as a result of portfolio brokerage transactions executed through “soft dollar” arrangements. The Board noted that soft dollar arrangements shift the payment obligation for research services from Invesco Advisers and the Affiliated Sub-Advisers to the Invesco Funds and that the research received may be used with other clients of Invesco Advisers and may reduce Invesco Advisers’ and the Affiliated Sub-Advisers’ expenses. The Board also considered that it receives periodic reports from the Chief Compliance Officer of the Invesco Funds demonstrating that these arrangements are consistent with regulatory requirements. The Board did not deem the soft dollar arrangements to be inappropriate.
The Board considered that the Fund’s uninvested cash and cash collateral from any securities lending arrangements may be invested in money market funds advised by Invesco Advisers pursuant to procedures approved by the Board. The Board noted that Invesco Advisers receives advisory fees from these affiliated money market funds attributable to such investments, although Invesco Advisers has contractually agreed to waive through varying periods the advisory fees payable by the Invesco Funds with respect to investments in the affiliated money market funds. The waiver is in an amount equal to 100% of the net advisory fee Invesco Advisers receives from the affiliated money market funds with respect to the Fund’s investment in the affiliated money market funds of uninvested cash, but not cash collateral. The Board concluded that the amount of advisory fees received by Invesco Advisors from the Fund’s investment of uninvested cash and cash collateral from any securities lending arrangements in the affiliated money market funds are fair and reasonable.
The Board also considered the Fund may use an affiliated broker to execute certain trades for the Fund to among other things, control information leakage, and were advised that such trades would be executed in compliance with rules under the Investment Company Act of 1940, as amended.
26 Invesco All Cap Market Neutral Fund
Trustees and Officers
The address of each trustee and officer is AIM Investment Funds (Invesco Investment Funds) (the “Trust”), 11 Greenway Plaza, Suite 1000, Houston, Texas 77046-1173. The trustees serve for the life of the Trust, subject to their earlier death, incapacitation, resignation, retirement or removal as more specifically provided in the Trust’s organizational documents. Each officer serves for a one year term or until their successors are elected and qualified. Column two below includes length of time served with predecessor entities, if any.
| | | | | | | | |
Name, Year of Birth and Position(s) Held with the Trust | | Trustee and/
or Officer Since | | Principal Occupation(s) During Past 5 Years | | Number of Funds in Fund Complex Overseen by Trustee | | Other Directorship(s) Held by Trustee During Past 5 Years |
| Interested Persons | | | | | | | | |
| Martin L. Flanagan1 — 1960 Trustee | | 2007 | | Executive Director, Chief Executive Officer and President, Invesco Ltd. (ultimate parent of Invesco and a global investment management firm); Advisor to the Board, Invesco Advisers, Inc. (formerly known as Invesco Institutional (N.A.), Inc.); Trustee, The Invesco Funds; Vice Chair, Investment Company Institute; and Member of Executive Board, SMU Cox School of Business Formerly: Chairman and Chief Executive Officer, Invesco Advisers, Inc. (registered investment adviser); Director, Chairman, Chief Executive Officer and President, IVZ Inc. (holding company), INVESCO Group Services, Inc. (service provider) and Invesco North American Holdings, Inc. (holding company); Director, Chief Executive Officer and President, Invesco Holding Company Limited (parent of Invesco and a global investment management firm); Director, Invesco Ltd.; Chairman, Investment Company Institute and President, Co-Chief Executive Officer, Co-President, Chief Operating Officer and Chief Financial Officer, Franklin Resources, Inc. (global investment management organization). | | 144 | | None |
Philip A. Taylor2 — 1954 Trustee, President and Principal Executive Officer | | 2006 | | Head of North American Retail and Senior Managing Director, Invesco Ltd.; Director, Co-Chairman, Co-President and Co-Chief Executive Officer, Invesco Advisers, Inc. (formerly known as Invesco Institutional (N.A.), Inc.) (registered investment adviser); Director, Chairman, Chief Executive Officer and President, Invesco Management Group, Inc. (formerly known as Invesco Aim Management Group, Inc.) (financial services holding company); Director and President, INVESCO Funds Group, Inc. (registered investment adviser and registered transfer agent); Director and Chairman, Invesco Investment Services, Inc. (formerly known as Invesco Aim Investment Services, Inc.) (registered transfer agent) and IVZ Distributors, Inc. (formerly known as INVESCO Distributors, Inc.) (registered broker dealer); Director, President and Chairman, Invesco Inc. (holding company) and Invesco Canada Holdings Inc. (holding company); Chief Executive Officer, Invesco Corporate Class Inc. (corporate mutual fund company) and Invesco Canada Fund Inc. (corporate mutual fund company); Director, Chairman and Chief Executive Officer, Invesco Canada Ltd. (formerly known as Invesco Trimark Ltd./Invesco Trimark Ltèe) (registered investment adviser and registered transfer agent); Trustee, President and Principal Executive Officer, The Invesco Funds (other than AIM Treasurer’s Series Trust (Invesco Treasurer’s Series Trust) and Short-Term Investments Trust); Trustee and Executive Vice President, The Invesco Funds (AIM Treasurer’s Series Trust (Invesco Treasurer’s Series Trust) and Short-Term Investments Trust only); Director, Invesco Investment Advisers LLC (formerly known as Van Kampen Asset Management); Director, Chief Executive Officer and President, Van Kampen Exchange Corp. Formerly: Director and Chairman, Van Kampen Investor Services Inc.; Director, Chief Executive Officer and President, 1371 Preferred Inc. (holding company) and Van Kampen Investments Inc.; Director and President, AIM GP Canada Inc. (general partner for limited partnerships) and Van Kampen Advisors, Inc.; Director and Chief Executive Officer, Invesco Trimark Dealer Inc. (registered broker dealer); Director, Invesco Distributors, Inc. (formerly known as Invesco Aim Distributors, Inc.) (registered broker dealer); Manager, Invesco PowerShares Capital Management LLC; Director, Chief Executive Officer and President, Invesco Advisers, Inc.; Director, Chairman, Chief Executive Officer and President, Invesco Aim Capital Management, Inc.; President, Invesco Trimark Dealer Inc. and Invesco Trimark Ltd./Invesco Trimark Ltèe; Director and President, AIM Trimark Corporate Class Inc. and AIM Trimark Canada Fund Inc.; Senior Managing Director, Invesco Holding Company Limited; Director and Chairman, Fund Management Company (former registered broker dealer); President and Principal Executive Officer, The Invesco Funds (AIM Treasurer’s Series Trust (Invesco Treasurer’s Series Trust), and Short-Term Investments Trust only); President, AIM Trimark Global Fund Inc. and AIM Trimark Canada Fund Inc. | | 144 | | None |
Wayne W. Whalen3 — 1939 Trustee | | 2010 | | Of Counsel, and prior to 2010, partner in the law firm of Skadden, Arps, Slate, Meagher & Flom LLP, legal counsel to certain funds in the Fund Complex | | 144 | | Director of the Mutual fund Directors Forum, a nonprofit membership organization for investment directors; Chairman and Director of the Abraham Lincoln Presidential Library Foundation; and Director of the Stevenson Center for Democracy |
| 1 | Mr. Flanagan is considered an interested person (within the meaning of Section 2(a)(19) of the 1940 Act) of the Trust because he is an officer of the Adviser to the Trust, and an officer and a director of Invesco Ltd., ultimate parent of the Adviser. |
| 2 | Mr. Taylor is considered an interested person (within the meaning of Section 2(a)(19) of the 1940 Act) of the Trust because he is an officer and a director of the Adviser. |
| 3 | Mr. Whalen is retiring effective December 31, 2014. He has been deemed to be an interested person of the Trust because of his prior service as counsel to the predecessor funds of certain Invesco open-end funds and his affiliation with the law firm that served as counsel to such predecessor funds and the Invesco closed-end funds. |
T-1 Invesco All Cap Market Neutral Fund
Trustees and Officers—(continued)
| | | | | | | | |
Name, Year of Birth and Position(s) Held with the Trust | | Trustee and/
or Officer Since | | Principal Occupation(s) During Past 5 Years | | Number of Funds in Fund Complex Overseen by Trustee | | Other Directorship(s) Held by Trustee During Past 5 Years |
| Independent Trustees | | | | | | | | |
Bruce L. Crockett — 1944 Trustee and Chair | | 2001 | | Chairman, Crockett Technologies Associates (technology consulting company) Formerly: Director, Captaris (unified messaging provider); Director, President and Chief Executive Officer, COMSAT Corporation; Chairman, Board of Governors of INTELSAT (international communications company); ACE Limited (insurance company); and Investment Company Institute | | 144 | | ALPS (Attorneys Liability Protection Society) (insurance company) |
David C. Arch — 1945 Trustee | | 2010 | | Chairman of Blistex Inc., a consumer health care products manufacturer | | 144 | | Board member of the Illinois Manufacturers’ Association; Member of the Board of Visitors, Institute for the Humanities, University of Michigan; Member of the Audit Committee of the Edward-Elmhurst Hospital |
Frank S. Bayley — 1939 Trustee | | 1987 | | Retired. Formerly: Director, Badgley Funds Inc. (registered investment company) (2 portfolios) and General Partner and Of Counsel, law firm of Baker & McKenzie, LLP | | 144 | | Director and Chairman, C.D. Stimson Company (a real estate investment company); Trustee, The Curtis Institute of Music |
James T. Bunch — 1942 Trustee | | 2003 | | Managing Member, Grumman Hill Group LLC (family office private equity investments) Formerly: Founder, Green Manning & Bunch Ltd. (investment banking firm) (1988-2010); Executive Committee, United States Golf Association; and Director, Policy Studies, Inc. and Van Gilder Insurance Corporation | | 144 | | Chairman, Board of Governors, Western Golf Association; Chairman, Evans Scholars Foundation; and Director, Denver Film Society |
Rodney F. Dammeyer — 1940 Trustee | | 2010 | | Chairman of CAC,LLC, (private company offering capital investment and management advisory services) Formerly: Prior to 2001, Managing Partner at Equity Group Corporate Investments; Prior to 1995, Chief Executive Officer of Itel Corporation (formerly Anixter International); Prior to 1985, experience includes Senior Vice President and Chief Financial Officer of Household International, Inc., Executive Vice President and Chief Financial Officer of Northwest Industries, Inc. and Partner of Arthur Andersen & Co.; From 1987 to 2010, Director/Trustee of investment companies in the Van Kampen Funds complex | | 144 | | Director of Quidel Corporation and Stericycle, Inc. |
Albert R. Dowden — 1941 Trustee | | 2001 | | Director of a number of public and private business corporations, including the Boss Group, Ltd. (private investment and management); Nature’s Sunshine Products, Inc. and Reich & Tang Funds (5 portfolios) (registered investment company) Formerly: Director, Homeowners of America Holding Corporation/Homeowners of America Insurance Company (property casualty company); Director, Continental Energy Services, LLC (oil and gas pipeline service); Director, CompuDyne Corporation (provider of product and services to the public security market) and Director, Annuity and Life Re (Holdings), Ltd. (reinsurance company); Director, President and Chief Executive Officer, Volvo Group North America, Inc.; Senior Vice President, AB Volvo; Director of various public and private corporations; Chairman, DHJ Media, Inc.; Director, Magellan Insurance Company; and Director, The Hertz Corporation, Genmar Corporation (boat manufacturer), National Media Corporation; Advisory Board of Rotary Power International (designer, manufacturer, and seller of rotary power engines); and Chairman, Cortland Trust, Inc. (registered investment company) | | 144 | | Director of: Nature’s Sunshine Products, Inc., Reich & Tang Funds, Homeowners of America Holding Corporation/ Homeowners of America Insurance Company, the Boss Group |
Jack M. Fields — 1952 Trustee | | 2001 | | Chief Executive Officer, Twenty First Century Group, Inc. (government affairs company); Owner and Chief Executive Officer, Dos Angeles Ranch, L.P. (cattle, hunting, corporate entertainment); and Discovery Global Education Fund (non-profit) Formerly: Chief Executive Officer, Texana Timber LP (sustainable forestry company); Director of Cross Timbers Quail Research Ranch (non-profit); and member of the U.S. House of Representatives | | 144 | | Insperity, Inc. (formerly known as Administaff) |
Prema Mathai-Davis — 1950 Trustee | | 2001 | | Retired. Formerly: Chief Executive Officer, YWCA of the U.S.A. | | 144 | | None |
Larry Soll — 1942 Trustee | | 2003 | | Retired. Formerly: Chairman, Chief Executive Officer and President, Synergen Corp. (a biotechnology company) | | 144 | | None |
Hugo F. Sonnenschein — 1940 Trustee | | 2010 | | President Emeritus and Honorary Trustee of the University of Chicago and the Adam Smith Distinguished Service Professor in the Department of Economics at the University of Chicago. Prior to 2000, President of the University of Chicago | | 144 | | Trustee of the University of Rochester and a member of its investment committee; Member of the National Academy of Sciences and the American Philosophical Society; Fellow of the American Academy of Arts and Sciences |
T-2 Invesco All Cap Market Neutral Fund
Trustees and Officers—(continued)
| | | | | | | | |
Name, Year of Birth and Position(s) Held with the Trust | | Trustee and/
or Officer Since | | Principal Occupation(s) During Past 5 Years | | Number of Funds in Fund Complex Overseen by Trustee | | Other Directorship(s) Held by Trustee During Past 5 Years |
| Independent Trustees—(continued) |
Raymond Stickel, Jr. — 1944 Trustee | | 2005 | | Retired. Formerly: Director, Mainstay VP Series Funds, Inc. (25 portfolios) and Partner, Deloitte & Touche | | 144 | | None |
Suzanne H. Woolsey — 1941 Trustee | | 2014 | | Chief Executive Officer of Woolsey Partners LLC | | 144 | | Emeritus Chair of the Board of Trustees of the Institute for Defense Analyses; Trustee of Colorado College; Trustee of California Institute of Technology; Prior to 2014, Director of Fluor Corp.; Prior to 2010, Trustee of the German Marshall Fund of the United States; Prior to 2010 Trustee of the Rocky Mountain Institute |
| Other Officers | | | | | | | | |
Russell C. Burk — 1958 Senior Vice President and Senior Officer | | 2005 | | Senior Vice President and Senior Officer, The Invesco Funds | | N/A | | N/A |
John M. Zerr — 1962 Senior Vice President, Chief Legal Officer and Secretary | | 2006 | | Director, Senior Vice President, Secretary and General Counsel, Invesco Management Group, Inc. (formerly known as Invesco Aim Management Group, Inc.) and Van Kampen Exchange Corp.; Senior Vice President, Invesco Advisers, Inc. (formerly known as Invesco Institutional (N.A.), Inc.) (registered investment adviser); Senior Vice President and Secretary, Invesco Distributors, Inc. (formerly known as Invesco Aim Distributors, Inc.); Director, Vice President and Secretary, Invesco Investment Services, Inc. (formerly known as Invesco Aim Investment Services, Inc.) and IVZ Distributors, Inc. (formerly known as INVESCO Distributors, Inc.); Director and Vice President, INVESCO Funds Group, Inc.; Senior Vice President, Chief Legal Officer and Secretary, The Invesco Funds; Manager, Invesco PowerShares Capital Management LLC; Director, Secretary and General Counsel, Invesco Investment Advisers LLC (formerly known as Van Kampen Asset Management); Secretary and General Counsel, Invesco Capital Markets, Inc. (formerly known as Van Kampen Funds Inc.) and Chief Legal Officer, PowerShares Exchange-Traded Fund Trust, PowerShares Exchange-Traded Fund Trust II, PowerShares India Exchange-Traded Fund Trust, PowerShares Actively Managed Exchange-Traded Fund Trust; and PowerShares Actively Managed Exchange-Traded Commodity Fund Trust Formerly: Director and Vice President, Van Kampen Advisors Inc.; Director, Vice President, Secretary and General Counsel, Van Kampen Investor Services Inc.; Director, Invesco Distributors, Inc. (formerly known as Invesco Aim Distributors, Inc.); Director, Senior Vice President, General Counsel and Secretary, Invesco Aim Advisers, Inc. and Van Kampen Investments Inc.; Director, Vice President and Secretary, Fund Management Company; Director, Senior Vice President, Secretary, General Counsel and Vice President, Invesco Aim Capital Management, Inc.; Chief Operating Officer and General Counsel, Liberty Ridge Capital, Inc. (an investment adviser); Vice President and Secretary, PBHG Funds (an investment company) and PBHG Insurance Series Fund (an investment company); Chief Operating Officer, General Counsel and Secretary, Old Mutual Investment Partners (a broker-dealer); General Counsel and Secretary, Old Mutual Fund Services (an administrator) and Old Mutual Shareholder Services (a shareholder servicing center); Executive Vice President, General Counsel and Secretary, Old Mutual Capital, Inc. (an investment adviser); and Vice President and Secretary, Old Mutual Advisors Funds (an investment company) | | N/A | | N/A |
Sheri Morris — 1964 Vice President, Treasurer and Principal Financial Officer | | 1999 | | Vice President, Treasurer and Principal Financial Officer, The Invesco Funds; Vice President, Invesco Advisers, Inc. (formerly known as Invesco Institutional (N.A.), Inc.) (registered investment adviser); and Vice President, PowerShares Exchange-Traded Fund Trust, PowerShares Exchange-Traded Fund Trust II, PowerShares India Exchange-Traded Fund Trust, PowerShares Actively Managed Exchange-Traded Fund Trust, and PowerShares Actively Managed Exchange-Traded Commodity Fund Trust Formerly: Vice President, Invesco Aim Advisers, Inc., Invesco Aim Capital Management, Inc. and Invesco Aim Private Asset Management, Inc.; Assistant Vice President and Assistant Treasurer, The Invesco Funds and Assistant Vice President, Invesco Advisers, Inc., Invesco Aim Capital Management, Inc. and Invesco Aim Private Asset Management, Inc.; and Treasurer, PowerShares Exchange-Traded Fund Trust, PowerShares Exchange-Traded Fund Trust II, PowerShares India Exchange-Traded Fund Trust and PowerShares Actively Managed Exchange-Traded Fund Trust | | N/A | | N/A |
T-3 Invesco All Cap Market Neutral Fund
Trustees and Officers—(continued)
| | | | | | | | |
Name, Year of Birth and Position(s) Held with the Trust | | Trustee and/
or Officer Since | | Principal Occupation(s) During Past 5 Years | | Number of Funds in Fund Complex Overseen by Trustee | | Other Directorship(s) Held by Trustee During Past 5 Years |
| Other Officers—(continued) | | | | | | | | |
Karen Dunn Kelley — 1960 Vice President | | 2004 | | Senior Managing Director, Investments; Director, Co-President, Co-Chief Executive Officer, and Co-Chairman, Invesco Advisers, Inc. (formerly known as Invesco Institutional (N.A.), Inc.) (registered investment adviser); Chairman, Invesco Senior Secured Management, Inc.; Senior Vice President, Invesco Management Group, Inc. (formerly known as Invesco Aim Management Group, Inc.); Executive Vice President, Invesco Distributors, Inc. (formerly known as Invesco Aim Distributors, Inc.); Director, Invesco Mortgage Capital Inc. and Invesco Management Company Limited; Director and President, INVESCO Asset Management (Bermuda) Ltd., Vice President, The Invesco Funds (other than AIM Treasurer’s Series Trust (Invesco Treasurer’s Series Trust) and Short-Term Investments Trust); and President and Principal Executive Officer, The Invesco Funds (AIM Treasurer’s Series Trust (Invesco Treasurer’s Series Trust) and Short-Term Investments Trust only) Formerly: Director, INVESCO Global Asset Management Limited and INVESCO Management S.A.; Senior Vice President, Van Kampen Investments Inc. and Invesco Advisers, Inc. (formerly known as Invesco Institutional (N.A.), Inc.) (registered investment adviser); Vice President, Invesco Advisers, Inc. (formerly known as Invesco Institutional (N.A.), Inc.); Director of Cash Management and Senior Vice President, Invesco Advisers, Inc. and Invesco Aim Capital Management, Inc.; Director and President, Fund Management Company; Chief Cash Management Officer, Director of Cash Management, Senior Vice President, and Managing Director, Invesco Aim Capital Management, Inc.; Director of Cash Management, Senior Vice President, and Vice President, Invesco Advisers, Inc. and The Invesco Funds (AIM Treasurer’s Series Trust (Invesco Treasurer’s Series Trust), and Short-Term Investments Trust only) | | N/A | | N/A |
Crissie M. Wisdom — 1969 Anti-Money Laundering Compliance Officer | | 2013 | | Anti-Money Laundering Compliance Officer, Invesco Advisers, Inc. (formerly known as Invesco Institutional (N.A.), Inc.) (registered investment adviser), Invesco Capital Markets, Inc. (formerly known as Van Kampen Funds Inc.), Invesco Distributors, Inc., Invesco Investment Services, Inc., Invesco Management Group, Inc., Van Kampen Exchange Corp., The Invesco Funds, and PowerShares Exchange-Traded Fund Trust, PowerShares Exchange-Traded Fund Trust II, PowerShares India Exchange-Traded Fund Trust, PowerShares Actively Managed Exchange-Traded Fund Trust and PowerShares Actively Managed Exchange-Traded Commodity Fund Trust; and Fraud Prevention Manager and Controls and Risk Analysis Manager for Invesco Investment Services, Inc. | | N/A | | N/A |
Todd L. Spillane — 1958 Chief Compliance Officer | | 2006 | | Senior Vice President, Invesco Management Group, Inc. (formerly known as Invesco Aim Management Group, Inc.) and Van Kampen Exchange Corp.; Senior Vice President and Chief Compliance Officer, Invesco Advisers, Inc. (registered investment adviser) (formerly known as Invesco Institutional (N.A.), Inc.); Chief Compliance Officer, The Invesco Funds; Vice President, Invesco Distributors, Inc. (formerly known as Invesco Aim Distributors, Inc.) and Invesco Investment Services, Inc. (formerly known as Invesco Aim Investment Services, Inc.) Formerly: Chief Compliance Officer, Invesco Funds (Chicago); Senior Vice President, Van Kampen Investments Inc.; Senior Vice President and Chief Compliance Officer, Invesco Aim Advisers, Inc. and Invesco Aim Capital Management, Inc.; Chief Compliance Officer, INVESCO Private Capital Investments, Inc. (holding company), Invesco Private Capital, Inc. (registered investment adviser), Invesco Global Asset Management (N.A.), Inc., Invesco Senior Secured Management, Inc. (registered investment adviser), Van Kampen Investor Services Inc., PowerShares Exchange-Traded Fund Trust, PowerShares Exchange-Traded Fund Trust II, PowerShares India Exchange-Traded Fund Trust and PowerShares Actively Managed Exchange-Traded Fund Trust; and Vice President, Invesco Aim Capital Management, Inc. and Fund Management Company | | N/A | | N/A |
The Statement of Additional Information of the Trust includes additional information about the Fund’s Trustees and is available upon request, without charge, by calling 1.800.959.4246. Please refer to the Fund’s prospectus for information on the Fund’s sub-advisers.
| | | | | | |
Office of the Fund 11 Greenway Plaza, Suite 1000 Houston, TX 77046-1173 | | Investment Adviser Invesco Advisers, Inc. 1555 Peachtree Street, N.E. Atlanta, GA 30309 | | Distributor Invesco Distributors, Inc. 11 Greenway Plaza, Suite 1000 Houston, TX 77046-1173 | | Auditors PricewaterhouseCoopers LLP 1000 Louisiana Street, Suite 5800 Houston, TX 77002-5678 |
| | | |
| | | | | | |
Counsel to the Fund Stradley Ronon Stevens & Young, LLP 2005 Market Street, Suite 2600 Philadelphia, PA 19103-7018 | | Counsel to the Independent Trustees Goodwin Procter LLP 901 New York Avenue, N.W. Washington, D.C. 20001 | | Transfer Agent Invesco Investment Services, Inc. 11 Greenway Plaza, Suite 1000 Houston, TX 77046-1173 | | Custodian State Street Bank and Trust Company 225 Franklin Street Boston, MA 02110-2801 |
T-4 Invesco All Cap Market Neutral Fund

Invesco mailing information
Send general correspondence to Invesco Investment Services, Inc., P.O. Box 219078, Kansas City, MO 64121-9078.
Important notice regarding delivery of security holder documents
To reduce Fund expenses, only one copy of most shareholder documents may be mailed to shareholders with multiple accounts at the same address (Householding). Mailing of your shareholder documents may be householded indefinitely unless you instruct us otherwise. If you do not want the mailing of these documents to be combined with those for other members of your household, please contact Invesco Investment Services, Inc. at 800 959 4246 or contact your financial institution. We will begin sending you individual copies for each account within 30 days after receiving your request.
Fund holdings and proxy voting information
The Fund provides a complete list of its holdings four times in each fiscal year, at the quarter ends. For the second and fourth quarters, the lists appear in the Fund’s semiannual and annual reports to shareholders. For the first and third quarters, the Fund files the lists with the Securities and Exchange Commission (SEC) on Form N-Q. The most recent list of portfolio holdings is available at invesco.com/completeqtrholdings. Shareholders can also look up the Fund’s Forms N-Q on the SEC website at sec.gov. Copies of the Fund’s Forms N-Q may be reviewed and copied at the SEC Public Reference Room in Washington, D.C. You can obtain information on the operation of the Public Reference Room, including information about duplicating fee charges, by calling 202 551 8090 or 800 732 0330, or by electronic request at the following email address: publicinfo@sec.gov. The SEC file numbers for the Fund are shown below.
A description of the policies and procedures that the Fund uses to determine how to vote proxies relating to portfolio securities is available without charge, upon request, from our Client Services department at 800 959 4246 or at invesco.com/proxyguidelines. The information is also available on the SEC website, sec.gov.
| | |
Information regarding how the Fund voted proxies related to its portfolio securities during the most recent 12-month period ended June 30 is available at invesco.com/proxysearch. The information is also available on the SEC website, sec.gov. Invesco Advisers, Inc. is an investment adviser; it provides investment advisory services to individual and institutional clients and does not sell securities. Invesco Distributors, Inc. is the US distributor for Invesco Ltd.’s retail mutual funds, exchange-traded funds and institutional money market funds. Both are wholly owned, indirect subsidiaries of Invesco Ltd. | |  |
SEC file numbers: 811-05426 and 033-19338 ACMN-AR-1 Invesco Distributors, Inc.

Letters to Shareholders
| | |

Philip Taylor | | Dear Shareholders: This annual report includes information about your Fund, including performance data and a complete list of its investments as of the close of the reporting period. Inside, your Fund’s portfolio managers discuss how they managed your Fund and the factors that affected its performance during the reporting period. I hope you find this report of interest. During the reporting period covered by this report, the US economy showed signs of continued improvement. After contracting in the first quarter of 2014, the economy expanded strongly in the second quarter and unemployment trended lower. Much of the credit for this improvement goes to the US Federal Reserve (the Fed), which undertook an extraordinary asset purchase program following the global financial crisis. The Fed’s goal was to jumpstart the economy by encouraging banks to lend more, businesses to hire more and consumers to spend more. Signs of a stronger US economy prompted the Fed to reduce, or “taper,” its asset purchase program. Despite this, interest rates remained near historical low levels due largely |
| to heavy investor demand for bonds. While signs of economic improvement were evident in the US, European economies showed signs of weakening. That, together with geopolitical uncertainty and worries about the first diagnosed cases of Ebola outside of Africa, caused increased volatility in US and European equities. |
Extended periods of market strength can lull investors into complacency – just as prolonged periods of market weakness or volatility can discourage investors from initiating long-term investment plans. That’s why Invesco has always encouraged investors to work with a professional financial adviser who can stress the importance of starting to save and invest early and the importance of adhering to a disciplined investment plan – when times are good and when they’re uncertain. A financial adviser who knows your unique financial situation, investment goals and risk tolerance can be an invaluable partner as you seek to achieve your financial goals. He or she can offer a long-term perspective when markets are volatile and time-tested advice and guidance when your financial situation or investment goals change.
Timely information when and where you want it
Invesco’s efforts to help investors achieve their financial objectives include providing individual investors and financial professionals with timely information about the markets, the economy and investing – whenever and wherever they want it.
Our website, invesco.com/us, offers a wide range of market insights and investment perspectives. On the website, you’ll find detailed information about our funds, including prices, performance, holdings and portfolio manager commentaries. You can access information about your individual Invesco account whenever it’s convenient for you; just complete a simple, secure online registration. Use the “Log In” box on our home page to get started.
Invesco’s mobile app for iPad® (available free from the App StoreSM) allows you to obtain the same detailed information about your Fund and the same investment insights from our investment leaders, market strategists, economists and retirement experts on the go. You also can watch portfolio manager videos and have instant access to Invesco news and updates wherever you may be.
In addition to the resources accessible on our website and through our mobile app, you can obtain timely updates to help you stay informed about the markets, the economy and investing by connecting with Invesco on Twitter, LinkedIn or Facebook. You can access our blog at blog.invesco.us.com. Our goal is to provide you the information you want, when and where you want it.
Have questions?
For questions about your account, feel free to contact an Invesco client services representative at 800 959 4246. For Invesco-related questions or comments, please email me directly at phil@invesco.com.
All of us at Invesco look forward to serving your investment management needs for many years to come. Thank you for investing with us.
Sincerely,

Philip Taylor
Senior Managing Director, Invesco Ltd.
iPad is a trademark of Apple Inc., registered in the US and other countries. App Store is a service mark of Apple Inc. Invesco Distributors, Inc. is not affiliated with Apple Inc.
2 Invesco Balanced-Risk Allocation Fund
| | |

Bruce Crockett | | Dear Fellow Shareholders: There are a variety of factors that can impact investment performance, many of which are uncontrollable by us as investors. These factors can include various economic trends and geopolitical developments. While the members of the Invesco Funds Board, which I chair, can’t dictate the performance of the Invesco funds, be assured that your Board works diligently throughout the year to focus on how your investments are managed. Our job is to represent you and your interests on a variety of fund management-related matters. We regularly monitor how the portfolio management teams of the Invesco funds are performing in light of ever-changing and often unpredictable economic and market conditions. We review the investment strategies and investment process employed by each fund’s management team as explained in the fund’s prospectus. Perhaps our most significant responsibility is conducting the annual review of the funds’ |
advisory and sub-advisory contracts with Invesco Advisers and its affiliates. This annual review, which is required by the Investment Company Act of 1940, focuses on the nature and quality of the services Invesco provides as the adviser to the Invesco funds and the reasonableness of the fees that it charges for those services. Each year, we spend months carefully reviewing information from Invesco that allows us to evaluate the quality of its services and the reasonableness of its fees. We also use information from a variety of independent sources, including materials provided by the independent senior officer of the Invesco funds, who reports directly to the independent trustees on the Board. Additionally, we meet with legal counsel and review performance and fee data prepared for us by Lipper Inc., an independent, third-party firm widely recognized as a leader in its field.
After a careful review, the members of the Invesco Funds Board approved the continuation of advisory and sub-advisory contracts with Invesco Advisers and its affiliates. Be assured that your Board will continue working on behalf of fund shareholders, keeping your needs and interests uppermost in our minds.
As always, please contact me at bruce@brucecrockett.com with any questions or concerns you may have. On behalf of the Board, we look forward to continuing to represent your interests and serving your needs.
Sincerely,

Bruce L. Crockett
Independent Chair
Invesco Funds Board of Trustees
3 Invesco Balanced-Risk Allocation Fund
Management’s Discussion of Fund Performance
Performance summary
For the fiscal year ended October 31, 2014, Invesco Balanced-Risk Allocation Fund underperformed its custom style-specific benchmarks, the Custom Balanced Risk Allocation Broad Index and the Custom Balanced Risk Allocation Style Index. Positive absolute performance at net asset value (NAV) from strategic equity and fixed income positioning drove results for the reporting period.
Your Fund’s long-term performance appears later in this report.
Fund vs. Indexes
Total returns, 10/31/13 to 10/31/14, at net asset value (NAV). Performance shown does not include applicable contingent deferred sales charges (CDSC) or front-end sales charges, which would have reduced performance.
| | | | |
Class A Shares | | | 3.52 | % |
Class B Shares | | | 2.85 | |
Class C Shares | | | 2.77 | |
Class R Shares | | | 3.30 | |
Class Y Shares | | | 3.81 | |
Class R5 Shares | | | 3.81 | |
Class R6 Shares | | | 3.97 | |
S&P 500 Indexq (Broad Market Index) | | | 17.27 | |
Custom Balanced Risk Allocation Broad Indexn (Style-Specific Index) | | | 12.03 | |
Custom Balanced Risk Allocation Style Indexn (Style-Specific Index) | | | 6.96 | |
Lipper Alternative Global Macro Funds Index¿ (Peer Group Index) | | | 3.87 | |
Source(s): qFactSet Research Systems Inc.; nInvesco, FactSet Research Systems Inc.; ¿Lipper Inc.
Market conditions and your Fund
During the fiscal year ended October 31, 2014, global markets produced mixed results due to volatility from a variety of geopolitical issues, but at NAV the Fund ended the reporting period in positive territory. Tactical positioning within fixed income through the use of swaps and futures boosted results while active positioning through the use of swaps and futures within commodities and equities slightly hurt results. The net effect was a positive contribution from our tactical allocation.
Developed equity markets began the reporting period on a positive note, helped by central bank stimulus. Bond markets drifted lower as investors preferred risky assets over perceived “safe-
haven” assets.1 Commodity prices began the reporting period mixed, with agricultural and energy commodities posting mild gains while industrial and precious metals prices retreated.
Equities were largely negative during the first quarter of 2014 with only select markets, such as Europe and the US, breaking into positive territory at the end of March. Overall, equities started the new year on their weakest note since 2009. Government bonds generated attractive returns as investors avoided the volatility in equity and commodity markets and geopolitical uncertainty. Commodities started 2014 with mixed results, with precious metals and the agricultural complexes up strongly, while industrial metals prices languished.
The Fund finished the first half of 2014 strongly as all three asset classes posted positive results for the second quarter. Bond markets saw yields decline as geopolitical concerns out of Russia and the Middle East created greater demand for perceived “safe-haven” assets. Contraction in the US economy and generally weak European economic data also benefited bonds. Equities posted strong results as investors continued to overlook weaker-than-expected fundamental data and the potential for geopolitical issues to erupt into wider conflicts. Across the commodity complexes, energy led results as uncertainty in the Middle East drove crude oil prices higher. Precious metals prices also advanced, benefiting from safe-haven demand.
Performance in the third quarter of 2014 was mixed. Investments in government bond futures led results as all six markets in which the Fund was invested (Australia, Canada, Germany, Japan, the UK and the US) ended in positive territory for the quarter. Factors driving bond yields lower included ongoing geopolitical concerns resulting from the conflict between Russia and Ukraine, as well as heightened terrorist activity in Iraq. Investments in developed-market equity futures delivered mixed results for the quarter as Japanese, European and US large cap equities generally rose while US small cap, UK and Hong Kong stocks generally declined. Investments in commodities through swaps and futures weighed heavily on Fund results for the quarter, with the asset class underperforming bonds and equities. Agricultural commodities were particularly weak, driven by substantial price declines in soybeans, soymeal and soybean oil, the result of expected increases in global production.
| | | | |
| Target Risk Allocation and Notional Asset Weights† |
By asset class | | | | |
| | Risk | | % of Total Net Assets |
Asset Class | | Allocation* | | as of 10/31/14** |
| | |
Equities | | 29.95% | | 28.17% |
Fixed Income | | 49.98 | | 89.33 |
Commodities | | 20.07 | | 23.06 |
| † | Risk contribution is measured as the standard deviation of each asset class as a percentage of total portfolio standard deviation. The risk contribution of each underlying asset determines the dollar-weighting of the asset. Standard deviation measures a fund’s range of total returns and fluctuations over a defined period of time. |
| * | Based on the expected market exposure. |
| ** | Due to the use of leverage, the percentages may not equal 100%. |
| | | | |
Total Net Assets | | $ | 9.3 billion | |
4 Invesco Balanced-Risk Allocation Fund
The fiscal year ended with significant volatility across asset classes, the result of central bank actions and economic data releases. Investments in bond futures were the top contributor to results as yields across all six markets in which the Fund invests fell during October 2014. Bonds produced gains as investors sought refuge from volatility, Ebola pandemic fears and economic uncertainty. Investments in equity futures also contributed to results, but not uniformly. European and UK issues declined while equities in the US and developed Asia posted gains. Commodities finished flat for the month on mixed results across complexes. Agriculture was the clear leader as prices climbed on strong demand, especially for soybeans and soymeal. Industrial metals also saw prices rise while precious metals prices pulled back. Energy prices declined in October 2014, the result of excess supply and waning demand. Saudi Arabia further complicated matters by cutting the price of oil sold to the US, a move widely believed to be targeted at making oil production from shale less attractive.
Please note that our strategy is principally implemented with derivative instruments that include futures, commodity-linked notes and total return swaps. Therefore, all or most of the performance of the strategy, both positive and negative, can be attributed to these instruments. Derivatives can be a cost-effective way to gain exposure to asset classes. However, derivatives may amplify traditional investment risks through the creation of leverage and may be less liquid than traditional securities.
Thank you for your continued commitment to Invesco Balanced-Risk Allocation Fund.
| 1 | So-called “safe-haven” assets do not imply risk-free investing. |
The views and opinions expressed in management’s discussion of Fund performance are those of Invesco Advisers, Inc. These views and opinions are subject to change at any time based on factors such as market and economic conditions. These views and opinions may not be relied upon as investment advice or recommendations, or as an offer for a particular security. The information is not a complete analysis of every aspect of any market, country, industry, security or the Fund. Statements of fact are from sources considered reliable, but Invesco Advisers, Inc. makes no representation or warranty as to their completeness or accuracy. Although historical performance is no guarantee of future results, these insights may help you understand our investment management philosophy.
See important Fund and, if applicable, index disclosures later in this report.
| | |
 | | Mark Ahnrud Chartered Financial Analyst, Portfolio Manager, is manager of Invesco Balanced-Risk Allocation Fund. |
| He joined Invesco in 2000. Mr. Ahnrud earned a BS in finance and investments from Babson College and an MBA from Duke University Fuqua School of Business. |
| | |
 | | Chris Devine Chartered Financial Analyst, Portfolio Manager, is manager of Invesco Balanced-Risk Allocation Fund. |
| He joined Invesco in 1998. Mr. Devine earned a BA in economics from Wake Forest University and an MBA from the University of Georgia. |
| | |
 | | Scott Hixon Chartered Financial Analyst, Portfolio Manager, is manager of Invesco Balanced-Risk Allocation Fund. |
| He joined Invesco in 1994. Mr. Hixon earned a BBA in finance from Georgia Southern University and an MBA in finance from Georgia State University. |
| | |
 | | Christian Ulrich Chartered Financial Analyst, Portfolio Manager, is manager of Invesco Balanced-Risk Allocation Fund. |
| He joined Invesco in 2000. Mr. Ulrich earned the equivalent of a BBA from the KV Zurich Business School in Zurich, Switzerland. |
| | |
 | | Scott Wolle Chartered Financial Analyst, Portfolio Manager, is manager of Invesco Balanced-Risk Allocation Fund. |
He joined Invesco in 1999. Mr. Wolle earned a BS in finance from Virginia Polytechnic Institute and State University and an MBA from Duke University Fuqua School of Business. Assisted by the Invesco Global Asset Allocation Team |
5 Invesco Balanced-Risk Allocation Fund
Your Fund’s Long-Term Performance
Results of a $10,000 Investment – Oldest Share Class(es) since Inception
Fund data from 6/2/09; index data from 5/31/09
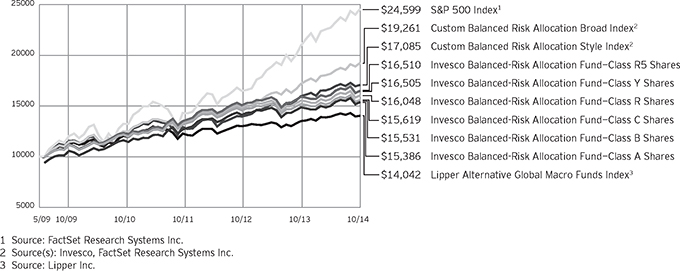
Past performance cannot guarantee comparable future results.
The data shown in the chart include reinvested distributions, applicable sales charges and Fund expenses including management fees. Results for Class B shares are calculated as if a hypothetical
shareholder had liquidated his entire investment in the Fund at the close of the reporting period and paid the contingent deferred sales charges, if applicable. Index results include reinvested dividends, but they do not reflect sales charges. Performance of the peer group,
if applicable, reflects fund expenses and management fees; performance of a market index does not. Performance shown in the chart and table(s) does not reflect deduction of taxes a shareholder would pay on Fund distributions or sale of Fund shares.
continued from page 9
About indexes used in this report
| n | | The S&P 500® Index is an unmanaged index considered representative of the US stock market. |
| n | | The Custom Balanced Risk Allocation Broad Index consists of 60% S&P 500 Index and 40% Barclays U.S. Aggregate Index. |
| n | | The Custom Balanced Risk Allocation Style Index consists of 60% MSCI World Index and 40% Barclays U.S. Aggregate Index. |
| n | | The Lipper Alternative Global Macro Funds Index is an unmanaged index considered representative of alternative global macro funds tracked by Lipper. |
| n | | The Barclays U.S. Aggregate Index is an unmanaged index considered representative of the US investment grade, fixed-rate bond market. |
| n | | The MSCI World IndexSM is an unmanaged index considered representative of stocks of developed countries. The index return is computed using the net return, which withholds applicable taxes for non-resident investors. |
| n | | The Fund is not managed to track the performance of any particular index, including the index(es) described here, and consequently, the performance of the Fund may deviate significantly from the performance of the
index(es). |
| n | | A direct investment cannot be made in an index. Unless otherwise indicated, index results include reinvested dividends, and they do not reflect sales charges. Performance of the peer group, if applicable, reflects fund expenses; performance of a market index does not. |
Other information
| n | | The returns shown in management’s discussion of Fund performance are based on net asset values (NAVs) calculated for shareholder transactions. Generally accepted accounting principles require adjustments to be made to the net assets of the Fund at period end for financial reporting purposes, and as such, the NAVs for shareholder transactions and the returns based on those NAVs may differ from the NAVs and returns reported in the Financial Highlights. |
6 Invesco Balanced-Risk Allocation Fund
| | | | |
Average Annual Total Returns As of 10/31/14, including maximum applicable sales charges | |
Class A Shares | | | | |
Inception (6/2/09) | | | 8.28 | % |
5 Years | | | 7.50 | |
1 Year | | | -2.18 | |
| |
Class B Shares | | | | |
Inception (6/2/09) | | | 8.47 | % |
5 Years | | | 7.62 | |
1 Year | | | -1.90 | |
| |
Class C Shares | | | | |
Inception (6/2/09) | | | 8.59 | % |
5 Years | | | 7.88 | |
1 Year | | | 1.81 | |
| |
Class R Shares | | | | |
Inception (6/2/09) | | | 9.13 | % |
5 Years | | | 8.42 | |
1 Year | | | 3.30 | |
| |
Class Y Shares | | | | |
Inception (6/2/09) | | | 9.70 | % |
5 Years | | | 8.99 | |
1 Year | | | 3.81 | |
| |
Class R5 Shares | | | | |
Inception (6/2/09) | | | 9.70 | % |
5 Years | | | 9.00 | |
1 Year | | | 3.81 | |
| |
Class R6 Shares | | | | |
Inception | | | 9.57 | % |
5 Years | | | 8.88 | |
1 Year | | | 3.97 | |
Class R6 shares incepted on September 24, 2012. Performance shown prior to that date is that of Class A shares and includes the 12b-1 fees applicable to Class A shares. Class A share performance reflects any applicable fee waivers or expense reimbursements.
The performance data quoted represent past performance and cannot guarantee comparable future results; current performance may be lower or higher. Please visit invesco.com/performance for the most recent month-end performance. Performance figures reflect reinvested distributions, changes in net asset value and the effect of the maximum sales charge unless otherwise stated. Investment return and principal value will fluctuate so that you may have a gain or loss when you sell shares.
The net annual Fund operating expense ratio set forth in the most recent Fund prospectus as of the date of this report for Class A, Class B,
| | | | |
Average Annual Total Returns As of 9/30/14, the most recent calendar quarter end, including maximum applicable sales charges | |
Class A Shares | | | | |
Inception (6/2/09) | | | 8.16 | % |
5 Years | | | 7.16 | |
1 Year | | | -1.79 | |
| |
Class B Shares | | | | |
Inception (6/2/09) | | | 8.34 | % |
5 Years | | | 7.26 | |
1 Year | | | -1.65 | |
| |
Class C Shares | | | | |
Inception (6/2/09) | | | 8.47 | % |
5 Years | | | 7.57 | |
1 Year | | | 2.16 | |
| |
Class R Shares | | | | |
Inception (6/2/09) | | | 9.01 | % |
5 Years | | | 8.10 | |
1 Year | | | 3.66 | |
| |
Class Y Shares | | | | |
Inception (6/2/09) | | | 9.58 | % |
5 Years | | | 8.68 | |
1 Year | | | 4.25 | |
| |
Class R5 Shares | | | | |
Inception (6/2/09) | | | 9.58 | % |
5 Years | | | 8.68 | |
1 Year | | | 4.25 | |
| |
Class R6 Shares | | | | |
Inception | | | 9.45 | % |
5 Years | | | 8.54 | |
1 Year | | | 4.33 | |
Class C, Class R, Class Y, Class R5 and Class R6 shares was 1.22%, 1.97%, 1.97%, 1.47%, 0.97%, 0.94% and 0.87%, respectively.1,2 The total annual Fund operating expense ratio set forth in the most recent Fund prospectus as of the date of this report for Class A, Class B, Class C, Class R, Class Y, Class R5 and Class R6 shares was 1.29%, 2.04%, 2.04%, 1.54%, 1.04%, 1.01% and 0.94%, respectively.1 The expense ratios presented above may vary from the expense ratios presented in other sections of this report that are based on expenses incurred during the period covered by this report.
Class A share performance reflects the maximum 5.50% sales charge, and Class B and Class C share performance reflects the applicable contingent deferred sales charge (CDSC) for the period involved. The CDSC on Class B shares declines from 5% beginning at the time of purchase to 0% at the beginning of the seventh year. The
CDSC on Class C shares is 1% for the first year after purchase. Class R, Class Y, Class R5 and Class R6 shares do not have a front-end sales charge or a CDSC; therefore, performance is at net asset value.
The performance of the Fund’s share classes will differ primarily due to different sales charge structures and class expenses.
Had the adviser not waived fees and/or reimbursed expenses in the past, performance would have been lower.
| 1 | The expense ratio includes acquired fund fees and expenses of the underlying funds in which the Fund invests of 0.08% for Invesco Balanced-Risk Allocation Fund. |
| 2 | Total annual Fund operating expenses after any contractual fee waivers and/or expense reimbursements by the adviser in effect through at least June 30, 2016. See current prospectus for more information. |
7 Invesco Balanced-Risk Allocation Fund
Invesco Balanced-Risk Allocation Fund’s investment objective is to provide a total return with a low to moderate correlation to traditional financial market indices.
| n | | Unless otherwise stated, information presented in this report is as of October 31, 2014, and is based on total net assets. |
| n | | Unless otherwise noted, all data provided by Invesco. |
| n | | To access your Fund’s reports/prospectus, visit invesco.com/fundreports. |
About share classes
| n | | Class B shares may not be purchased for new or additional investments. Please see the prospectus for more information. |
| n | | Class R shares are generally available only to employer sponsored retirement and benefit plans. Please see the prospectus for more information. |
| n | | Class Y shares are available only to certain investors. Please see the prospectus for more information. |
| n | | Class R5 shares and Class R6 shares are primarily intended for employer sponsored retirement and benefit plans that meet certain standards and for institutional investors. Please see the prospectus for more information. |
Principal risks of investing in the Fund
| n | | Commodities tax risk. The tax treatment of commodity-linked derivative instruments may be adversely affected by changes in legislation, regulations or other legally binding authority. If, as a result of any such adverse action, the income of the Fund from certain commodity-linked derivatives was treated as non-qualifying income, the Fund might fail to qualify as a regulated investment company and be subject to federal income tax at the Fund level. The Fund has received private letter rulings from the Internal Revenue Service confirming that income derived from the Fund’s investments in the Subsidiary and a form of commodity-linked note constitutes qualifying income to the Fund. However, the Internal Revenue Service suspended issuance in July 2011 of any further private letter rulings pending a review of its position. Should the Internal Revenue Service issue guidance, or Congress enact legislation, that adversely affects the tax treatment of the Fund’s use of commodity-linked notes, or the Subsidiary, it could limit the Fund’s ability to pursue its investment strategy. In this event, the Fund’s Board of Trustees may authorize a significant change in |
| | | investment strategy or Fund liquidation. The Fund also may incur transaction and other costs to comply with any new or additional guidance from the Internal Revenue Service. |
| n | | Commodity-linked notes risk. The Fund’s investments in commodity-linked notes may involve substantial risks, including risk of loss of a significant portion of their principal value. In addition to risks associated with the underlying commodities, they may be subject to additional special risks, such as the lack of a secondary trading market and temporary price distortions due to speculators and/or the continuous rolling over of futures contracts underlying the notes. Commodity-linked notes are also subject to counterparty risk, which is the risk that the other party to the contract will not fulfill its contractual obligation to complete the transaction with the Fund. |
| n | | Commodity risk. The Fund’s significant investment exposure to the commodities markets and/or a particular sector of the commodities markets, which may subject the Fund to greater volatility than investments in traditional securities, such as stocks and bonds. The commodities markets may fluctuate widely based on a variety of factors, including changes in overall market movements, domestic and foreign political and economic events and policies, war, acts of terrorism, changes in domestic or foreign interest rates and/or investor expectations concerning interest rates, domestic and foreign inflation rates and investment and trading activities of mutual funds, hedge funds and commodities funds. Prices of various commodities may also be affected by factors such as drought, floods, weather, livestock disease, embargoes, tariffs and other regulatory developments. The prices of commodities can also fluctuate widely due to supply and demand disruptions in major producing or consuming regions. Because the Fund’s performance is linked to the performance of potentially volatile commodities, investors |
| | | should be willing to assume the risks of potentially significant fluctuations in the value of the Fund’s shares. |
| n | | Correlation risk. Changes in the value of two investments or asset classes may not track or offset each other in the manner anticipated by the portfolio managers. Because the Fund’s investment strategy seeks to balance risk across three asset classes and, within each asset class, to balance risk across different countries and commodities, to the extent either the three asset classes or the selected countries and commodities are correlated in a way not anticipated by the portfolio managers the Fund’s risk allocation process may not succeed in achieving its investment objective. |
| n | | Credit risk. The issuer of instruments in which the Fund invests may be unable to meet interest and/or principal payments, thereby causing its instruments to decrease in value and lowering the issuer’s credit rating. |
| n | | Currency/exchange rate risk. The dollar value of the Fund’s foreign investments will be affected by changes in the exchange rates between the dollar and the currencies in which those investments are traded. |
| n | | Derivatives risk. The value of a derivative instrument depends largely on (and is derived from) the value of an underlying security, currency, commodity, interest rate, index or other asset (each referred to as an underlying asset). In addition to risks relating to the underlying assets, the use of derivatives may include other, possibly greater, risks, including counterparty, leverage and liquidity risks. Counterparty risk is the risk that the counterparty to the derivative contract will default on its obligation to pay the Fund the amount owed or otherwise perform under the derivative contract. Derivatives create leverage risk because they do not require payment up front equal to the economic exposure created by owning the derivative. As a result, an adverse change in the value of the underlying asset could result in the Fund sustaining a loss that is substantially greater than the amount invested in the derivative, which may make the Fund’s returns more volatile and increase the risk of loss. Derivative instruments may also be less liquid than more traditional investments and |
This report must be accompanied or preceded by a currently effective Fund prospectus, which contains more complete information, including sales charges and expenses. Investors should read it carefully before investing.
NOT FDIC INSURED | MAY LOSE VALUE | NO BANK GUARANTEE
8 Invesco Balanced-Risk Allocation Fund
the Fund may be unable to sell or close out its derivative positions at a desirable time or price. This risk may be more acute under adverse market conditions, during which the Fund may be most in need of liquidating its derivative positions. Derivatives may also be harder to value, less tax efficient and subject to changing government regulation that could impact the Fund’s ability to use certain derivatives or their cost. Also, derivatives used for hedging or to gain or limit exposure to a particular market segment may not provide the expected benefits, particularly during adverse market conditions. These risks are greater for the Fund than most other mutual funds because the Fund will implement its investment strategy primarily through derivative instruments rather than direct investments in stocks and bonds.
| n | | Developing/emerging markets securities risk. The prices of securities issued by foreign companies and governments located in developing/emerging market countries may be affected more negatively by inflation, devaluation of their currencies, higher transaction costs, delays in settlement, adverse political developments, the introduction of capital controls, withholding taxes, nationalization of private assets, expropriation, social unrest, war or lack of timely information than those in developed countries. |
| n | | Exchange-traded funds risk. An investment by the Fund in exchange-traded funds generally presents the same primary risks as an investment in a mutual fund. In addition, an exchange-traded fund may be subject to the following: (1) a discount of the exchange-traded fund’s shares to its net asset value; (2) failure to develop an active trading market for the exchange-traded fund’s shares; (3) the listing exchange halting trading of the exchange-traded fund’s shares; (4) failure of the exchange-traded fund’s shares to track the referenced asset; and (5) holding troubled securities in the referenced index or basket of investments. Investments in exchange-traded funds may involve duplication of management fees and certain other expenses, as the Fund indirectly bears its proportionate share of any expenses paid by the exchange-traded funds in which it invests. Further, certain of the exchange-traded funds in which the Fund may invest are leveraged. The more the Fund invests in such leveraged exchange-traded funds, the more this leverage will magnify any losses on those investments. |
| n | | Exchange-traded notes risk. Exchange-traded notes are subject to credit risk, including the credit risk of the issuer, and the value of the exchange-traded note may drop due to a downgrade in the issuer’s credit rating, despite the underlying market benchmark or strategy remaining unchanged. The value of an exchange-traded note may also be influenced by time to maturity, level of supply and demand for the exchange-traded note, volatility and lack of liquidity in the underlying market, changes in the applicable interest rates, changes in the issuer’s credit rating, and economic, legal, political, or geographic events that affect the referenced underlying market or strategy. Exchange-traded notes are also subject to the risk that the other party to the contract will not fulfill its contractual obligations, which may cause losses or additional costs to the Fund. |
| n | | Foreign government debt risk. Investments in foreign government debt obligations involve certain risks in addition to those relating to foreign securities or debt securities generally. The issuer of the debt or the governmental authorities that control the repayment of the debt may be unable or unwilling to repay principal or interest when due in accordance with the terms of such debt, and the Fund may have limited recourse in the event of a default against the defaulting government. Without the approval of debt holders, some governmental debtors have in the past been able to reschedule or restructure their debt payments or declare moratoria on payments. |
| n | | Foreign securities risk. The Fund’s foreign investments may be affected by changes in a foreign country’s exchange rates, political and social instability, changes in economic or taxation policies, difficulties when enforcing obligations, decreased liquidity, and increased volatility. Foreign companies may be subject to less regulation resulting in less publicly available information about the companies. |
| n | | Interest rate risk. Interest rate risk refers to the risk that bond prices generally fall as interest rates rise; conversely, bond prices generally rise as interest rates fall. Specific bonds differ in their sensitivity to changes in interest rates depending on their individual characteristics, including duration. The risk may be magnified due to the Fund’s use of derivatives that provided leveraged exposure to government bonds. |
| n | | Liquidity risk. The Fund may hold illiquid securities that may be unable to sell at the preferred time or price and could lose its entire investment in such securities. The Fund’s significant use of derivative instruments may cause liquidity risk to be greater than other mutual funds that invest in more traditional assets such as stocks and bonds, which trade on markets with more market participants. |
| n | | Management risk. The investment techniques and risk analysis used by the Fund’s portfolio managers may not produce the desired results. Because the Fund’s investment process relies heavily on its asset allocation process, market movements that are counter to the portfolio managers’ expectations may have a significant adverse effect on the Fund’s net asset value. Further, the portfolio managers’ use of instruments that provide economic leverage increases the volatility of the Fund’s net asset value, which increases the potential of greater losses that may cause the Fund to liquidate positions when it may not be advantageous to do so. |
| n | | Market risk. The prices of and the income generated by the Fund’s securities may decline in response to, among other things, investor sentiment, general economic and market conditions, regional or global instability, and currency and interest rate fluctuations. |
| n | | Subsidiary risk. By investing in the Subsidiary, the Fund is indirectly exposed to risks associated with the Subsidiary’s investments. The Subsidiary is not registered under the Investment Company Act of 1940, as amended (1940 Act), and, except as otherwise noted in this prospectus is not subject to the investor protections of the 1940 Act. Changes in the laws of the United States and/or the Cayman Islands, under which the Fund and the Subsidiary, respectively, are organized, could result in the inability of the Fund and/or the Subsidiary to operate as described in this prospectus and could negatively affect the Fund and its shareholders. |
| n | | US government obligations risk. The Fund may invest in obligations issued by US government agencies and instrumentalities that may receive varying levels of support from the government, which could affect the Fund’s ability to recover should they default. |
| n | | Volatility risk. The Fund may have investments that appreciate or decrease significantly in value over short periods of time. This may cause the Fund’s net asset value per share to experience significant increases or declines in value over short periods of time. |
continued on page 6
9 Invesco Balanced-Risk Allocation Fund
Consolidated Schedule of Investments
October 31, 2014
| | | | | | | | | | | | | | | | |
| | | Interest Rate | | | Maturity Date | | | Principal Amount | | | Value | |
U.S. Treasury Securities–34.96% | |
| U.S. Treasury Bills–16.59%(a) | |
U.S. Treasury Bills(b) | | | 0.05 | % | | | 12/04/14 | | | $ | 48,160,000 | | | $ | 48,159,997 | |
U.S. Treasury Bills | | | 0.05 | % | | | 12/04/14 | | | | 124,890,000 | | | | 124,889,992 | |
U.S. Treasury Bills(b)(c) | | | 0.05 | % | | | 12/11/14 | | | | 35,150,000 | | | | 35,149,812 | |
U.S. Treasury Bills(c) | | | 0.05 | % | | | 12/11/14 | | | | 145,400,000 | | | | 145,399,222 | |
U.S. Treasury Bills(b) | | | 0.02 | % | | | 12/18/14 | | | | 33,472,000 | | | | 33,471,788 | |
U.S. Treasury Bills(b) | | | 0.04 | % | | | 12/18/14 | | | | 32,358,000 | | | | 32,357,795 | |
U.S. Treasury Bills | | | 0.04 | % | | | 12/18/14 | | | | 133,580,000 | | | | 133,579,154 | |
U.S. Treasury Bills(b)(c) | | | 0.10 | % | | | 01/08/15 | | | | 37,600,000 | | | | 37,599,651 | |
U.S. Treasury Bills(c) | | | 0.10 | % | | | 01/08/15 | | | | 155,800,000 | | | | 155,798,553 | |
U.S. Treasury Bills(b) | | | 0.05 | % | | | 01/15/15 | | | | 56,400,000 | | | | 56,399,420 | |
U.S. Treasury Bills(c) | | | 0.05 | % | | | 01/15/15 | | | | 233,700,000 | | | | 233,697,597 | |
U.S. Treasury Bills(b) | | | 0.05 | % | | | 01/22/15 | | | | 52,640,000 | | | | 52,639,992 | |
U.S. Treasury Bills | | | 0.05 | % | | | 01/22/15 | | | | 218,120,000 | | | | 218,119,967 | |
U.S. Treasury Bills(b)(c) | | | 0.06 | % | | | 01/29/15 | | | | 64,900,000 | | | | 64,899,205 | |
U.S. Treasury Bills(c) | | | 0.06 | % | | | 01/29/15 | | | | 168,280,000 | | | | 168,277,939 | |
| | | | | | | | | | | | | | | | 1,540,440,084 | |
|
| U.S. Treasury Notes–18.37% | |
U.S. Treasury Notes(d) | | | 0.07 | % | | | 01/31/16 | | | | 413,350,000 | | | | 413,356,464 | |
U.S. Treasury Notes(b)(d) | | | 0.07 | % | | | 01/31/16 | | | | 128,630,000 | | | | 128,632,270 | |
U.S. Treasury Notes(b)(c)(d) | | | 0.09 | % | | | 04/30/16 | | | | 213,526,000 | | | | 213,597,997 | |
U.S. Treasury Notes(c)(d) | | | 0.09 | % | | | 04/30/16 | | | | 346,240,000 | | | | 346,356,745 | |
U.S. Treasury Notes(d) | | | 0.09 | % | | | 07/31/16 | | | | 475,520,000 | | | | 475,716,690 | |
U.S. Treasury Notes(b)(d) | | | 0.09 | % | | | 07/31/16 | | | | 127,900,000 | | | | 127,952,903 | |
| | | | | | | | | | | | | | | | 1,705,613,069 | |
Total U.S. Treasury Securities (Cost $3,245,812,309) | | | | | | | | | | | | | | | 3,246,053,153 | |
| | | | |
| | | | | | Expiration
Date | | | | | | | |
Commodity-Linked Securities–2.93% | | | | | | | | | | | | | | | | |
Canadian Imperial Bank of Commerce EMTN, U.S. Federal Funds Effective Rate minus 0.04% (linked to the CIBC Custom 2 Agriculture Commodity Index, multiplied by 2)(b)(e) | | | | | | | 09/28/15 | | | | 83,000,000 | | | | 83,577,639 | |
Cargill, Inc. Commodity Linked Notes, one month LIBOR rate minus 0.10% (linked to the Monthly Rebalance Commodity Excess Return Index, multiplied by 2)(b)(e) | | | | | | | 09/17/15 | | | | 71,000,000 | | | | 70,275,249 | |
Cargill, Inc. Commodity Linked Notes, one month LIBOR rate minus 0.10% (linked to the Monthly Rebalance Commodity Excess Return Index, multiplied by 2)(b)(e) | | | | | | | 10/07/15 | | | | 83,800,000 | | �� | | 85,377,777 | |
RBC Capital Markets Commodity Linked Notes, U.S. Federal Funds Effective Rate minus 0.04% (linked to the RBC Enhanced Agricultural Basket 01 Excess Return Index, multiplied by 2)(b)(e) | | | | | | | 08/24/15 | | | | 35,500,000 | | | | 33,052,358 | |
Total Commodity-Linked Securities (Cost $273,300,000) | | | | | | | | | | | | | | | 272,283,023 | |
| | | | |
| | | | | | | | | Shares | | | | |
Money Market Funds–55.12% | | | | | | | | | | | | | | | | |
Liquid Assets Portfolio–Institutional Class(f) | | | | | | | | | | | 475,113,036 | | | | 475,113,036 | |
Premier Portfolio–Institutional Class(f) | | | | | | | | | | | 475,113,036 | | | | 475,113,036 | |
STIC (Global Series) PLC–U.S. Dollar Liquidity Portfolio (Ireland)–Institutional Class(b)(f) | | | | | | | | | | | 994,221,261 | | | | 994,221,261 | |
Treasury Portfolio–Institutional Class(f) | | | | | | | | | | | 3,173,352,697 | | | | 3,173,352,697 | |
Total Money Market Funds (Cost $5,117,800,030) | | | | | | | | | | | | | | | 5,117,800,030 | |
TOTAL INVESTMENTS–93.01% (Cost $8,636,912,339) | | | | | | | | | | | | | | | 8,636,136,206 | |
OTHER ASSETS LESS LIABILITIES–6.99% | | | | | | | | | | | | | | | 649,464,793 | |
NET ASSETS–100.00% | | | | | | | | | | | | | | $ | 9,285,600,999 | |
See accompanying Notes to Consolidated Financial Statements which are an integral part of the financial statements.
10 Invesco Balanced-Risk Allocation Fund
| | | | | | | | | | | | | | | | | | | | | | |
| Open Futures Contracts(g) | |
| Futures Contracts | | Type of
Contract | | | | | Number of
Contracts | | | Expiration
Month | | | Notional
Value | | | Unrealized Appreciation (Depreciation) | |
Brent Crude(b) | | | Long | | | | | | 1,430 | | | | April-2015 | | | $ | 125,639,800 | | | $ | (12,918,790 | ) |
Gas Oil(b) | | | Long | | | | | | 325 | | | | December-2014 | | | | 24,090,625 | | | | 102,958 | |
Gasoline Reformulated Blendstock Oxygenate Blending(b) | | | Long | | | | | | 1,630 | | | | December-2014 | | | | 147,038,388 | | | | (824,097 | ) |
Heating Oil(b) | | | Long | | | | | | 27 | | | | April-2015 | | | | 2,820,371 | | | | (213,941 | ) |
Silver(b) | | | Long | | | | | | 2,110 | | | | December-2014 | | | | 169,918,300 | | | | (35,907,505 | ) |
WTI Crude(b) | | | Long | | | | | | 1,650 | | | | December-2014 | | | | 132,891,000 | | | | (16,640,400 | ) |
Subtotal — Commodity Risk | | | | | | | | | | | | | | | | | | | | $ | (66,401,775 | ) |
| | | | | | |
| | | | | | | | | | | | | | | | | | | | | | |
Australian 10 Year Bonds | | | Long | | | | | | 14,750 | | | | December-2014 | | | $ | 1,593,822,767 | | | $ | 42,618,026 | |
Canada 10 Year Bonds | | | Long | | | | | | 12,880 | | | | December-2014 | | | | 1,566,196,113 | | | | 7,671,956 | |
Euro Bonds | | | Long | | | | | | 8,130 | | | | December-2014 | | | | 1,537,426,260 | | | | 19,211,999 | |
Japan 10 Year Bonds | | | Long | | | | | | 839 | | | | December-2014 | | | | 1,094,636,898 | | | | 6,332,434 | |
Long Gilt | | | Long | | | | | | 8,280 | | | | December-2014 | | | | 1,524,654,194 | | | | 34,638,624 | |
U.S. Treasury 20 Year Bonds | | | Long | | | | | | 5,430 | | | | December-2014 | | | | 766,139,063 | | | | 10,122,128 | |
Subtotal — Interest Rate Risk | | | | | | | | | | | | | | | | | | | | $ | 120,595,167 | |
| | | | | | |
| | | | | | | | | | | | | | | | | | | | | | |
Dow Jones EURO STOXX 50 Index | | | Long | | | | | | 14,300 | | | | December-2014 | | | $ | 555,678,423 | | | $ | (20,534,731 | ) |
E-Mini S&P 500 Index | | | Long | | | | | | 3,050 | | | | December-2014 | | | | 306,738,500 | | | | 4,214,508 | |
FTSE 100 Index | | | Long | | | | | | 5,060 | | | | December-2014 | | | | 526,619,444 | | | | (21,387,831 | ) |
Hang Seng Index | | | Long | | | | | | 3,300 | | | | November-2014 | | | | 509,418,963 | | | | 12,357,842 | |
Russell 2000 Index Mini | | | Long | | | | | | 2,060 | | | | December-2014 | | | | 241,226,000 | | | | 2,330,599 | |
Tokyo Stock Price Index | | | Long | | | | | | 3,670 | | | | December-2014 | | | | 436,896,982 | | | | 14,439,473 | |
Subtotal — Market Risk | | | | | | | | | | | | | | | | | | | | $ | (8,580,140 | ) |
Total Future Contracts | | | | | | | | | | | | | | | | | | | | $ | 45,613,252 | |
| | | | | | |
| | | | | | | | | | | | | | | | | | | | | | |
| Open Over-The-Counter Total Return Swap Agreements | |
| Long Swap Agreements | | Type of
Contract | | | Counterparty | | Number of
Contracts | | | Termination
Date | | | Notional
Value | | | Unrealized
Appreciation
(Depreciation) | |
Receive a return equal to Barclays Commodity Strategy 1452 Excess Return Index and pay the product of (i) 0.33% of the Notional value multiplied by (ii) days in the period divided by 365(b) | | | Long | | | Barclays Bank PLC | | | 346,000 | | | | May-2015 | | | $ | 184,494,708 | | | $ | 2,294,326 | |
Receive a return equal to CIBC Dynamic Roll LME Copper Excess Return Index and pay the product of (i) 0.30% of the Notional value multiplied by (ii) days in the period divided by 365(b) | | | Long | | | Canadian Imperial Bank of Commerce | | | 2,195,000 | | | | April-2015 | | | | 185,494,621 | | | | (61,241 | ) |
Receive a return equal to Single Commodity Index Excess Return and pay the product of (i) 0.12% of the Notional Value multiplied by (ii) days in the period divided by 365(b) | | | Long | | | Cargill, Inc. | | | 36,500 | | | | May-2015 | | | | 30,675,929 | | | | 0 | |
Receive a return equal to Goldman Sachs Alpha Basket B765 Excess Return Strategy and pay the product of (i) 0.45% of the Notional Value multiplied by (ii) days in the period divided by 365(b) | | | Long | | | Goldman Sachs International | | | 151,000 | | | | June-2015 | | | | 80,769,658 | | | | 0 | |
Receive a return equal to J.P. Morgan Bespoke Commodity Index and pay the product of (i) 0.49% of the Notional Value multiplied by (ii) days in the period divided by 365(b) | | | Long | | | J.P. Morgan Chase Bank, N.A. | | | 2,000 | | | | June-2015 | | | | 1,255,859 | | | | 83,247 | |
Receive a return equal to S&P GSCI Gold Index Excess Return and pay the product of (i) 0.09% of the Notional Value multiplied by (ii) days in the period divided by 365(b) | | | Long | | | J.P. Morgan Chase Bank, N.A. | | | 1,280,000 | | | | April-2015 | | | | 133,961,728 | | | | (7,948,544 | ) |
See accompanying Notes to Consolidated Financial Statements which are an integral part of the financial statements.
11 Invesco Balanced-Risk Allocation Fund
| | | | | | | | | | | | | | | | | | | | | | |
| Long Swap Agreements | | Type of
Contract | | | Counterparty | | Number of
Contracts | | | Termination
Date | | | Notional
Value | | | Unrealized
Appreciation
(Depreciation) | |
Receive a return equal to Macquarie Commodity Customized Product 118E Index and pay the product of (i) 0.33% of the Notional Value multiplied by (ii) days in the period divided
by 365(b) | | | Long | | | Macquarie Bank
Limited | | | 463,000 | | | | July-2015 | | | $ | 151,352,200 | | | $ | 2,618,821 | |
Receive a return equal to MLCX Dynamic Enhanced Copper Excess Return Index and pay the product of (i) 0.25% of the Notional Value multiplied by (ii) days in the period divided by 365(b) | | | Long | | | Merrill Lynch
International | | | 257,000 | | | | May-2015 | | | | 168,802,406 | | | | 0 | |
Receive a return equal to Merrill Lynch Gold Excess Return Index and pay the product of (i) 0.14% of the Notional Value multiplied by (ii) days in the period divided
by 365(b) | | | Long | | | Merrill Lynch
International | | | 1,020,000 | | | | June-2015 | | | | 157,374,882 | | | | 0 | |
Receive a return equal to S&P GSCI Aluminum Dynamic Roll Index Excess Return and pay the product of (i) 0.38% of the Notional Value multiplied by (ii) days in the period divided by 365(b) | | | Long | | | Morgan Stanley
Capital Services LLC | | | 290,000 | | | | October-2015 | | | | 32,807,149 | | | | 1,817,981 | |
Subtotal — Commodity Risk | | | | | | | | | | | | | | | | | | | | $ | (1,195,410 | ) |
Receive a return equal to the LIFFE Long Gilt Futures multiplied by 0.01% of the Notional Value | | | Long | | | Goldman Sachs
International | | | 1,080 | | | | December-2014 | | | | 198,867,938 | | | $ | 3,934,665 | |
Subtotal — Interest Rate Risk | | | | | | | | | | | | | | | | | | | | $ | 3,934,665 | |
Receive a return equal to Hang Seng Index Futures multiplied by the Notional Value | | | Long | | | Goldman Sachs
International | | | 310 | | | | November-2014 | | | | 47,854,509 | | | $ | 1,403,372 | |
Subtotal — Market Risk | | | | | | | | | | | | | | | | | | | | $ | 1,403,372 | |
Total Swap Agreements | | | | | | | | | | | | | | | | | | | | $ | 4,142,627 | |
Investment Abbreviations:
| | |
| EMTN | | – Euro Medium Term Notes |
| LIBOR | | – London Interbank Offered Rate |
| LIFFE | | – London International Financial Futures and Options Exchange |
Index Information:
| | |
| CIBC Custom 2 Agriculture Commodity Index | | – a commodity index composed of futures contracts on Sugar, Soybeans, Soybean Meal and Cotton. |
| Monthly Rebalance Commodity Excess Return Index | | – a commodity index composed of futures contracts on Soybean Meal, Soybeans, Sugar No. 11 and Cotton No. 2. |
| RBC Enhanced Agricultural Basket 01 Excess Return Index | | – a commodity index composed of futures contracts on Cotton, Soybeans, Soybean Meal and Sugar. |
| Barclays Commodity Strategy 1452 Excess Return Index | | – a commodity index that provide exposure to future contracts on copper. |
| CIBC Dynamic Roll LME Copper Excess Return Index | | – a commodity index composed of future contracts on copper. |
| Single Commodity Excess Return Index | | – a commodity index composed of future contracts on gold. |
| Goldman Sachs Alpha Basket B765 Excess Return Strategy | | – a basket of four indices that provide exposure to various components of the agriculture markets. The underlying commodities comprising the indices are: Sugar, Soybeans, Soybean Meal and Live Cattle. |
| JP Morgan Bespoke Commodity Index | | – an index comprised of four commodity indices that provide exposure to various components of the agriculture markets. The underlying commodities comprising the indices are: Sugar, Soybeans, Soybean Meal and Live Cattle. |
| S&P GSCI Gold Index Excess Return | | – a commodity index composed of future contracts on gold. |
| Macquarie Commodity Customized Product 118E Index | | – a basket of four indices that provide exposure to various components of the agriculture markets. The underlying commodities comprising the indices are: Sugar, Cotton, Soybeans and Soybean Meal. |
| MLCX Dynamic Enhanced Copper Excess Return Index | | – a commodity index composed of future contracts on copper. |
| Merrill Lynch Gold Excess Return Index | | – a commodity index composed of future contracts on gold. |
| S&P GSCI Aluminum Dynamic Roll Index Excess Return | | – a commodity index composed of future contracts on aluminum. |
Notes to Consolidated Schedule of Investments:
| (a) | Security traded on a discount basis. The interest rate shown represents the discount rate at the time of purchase by the Fund. |
| (b) | The investment is owned by the Subsidiary. See Note 5. |
| (c) | All or a portion of the value was pledged as collateral to cover margin requirements for swap agreements. See Note 1L and Note 4. |
| (d) | Interest or dividend rate is redetermined periodically. Rate shown is the rate in effect on October 31, 2014. |
| (e) | Security purchased or received in a transaction exempt from registration under the Securities Act of 1933, as amended (the “1933 Act”). The security may be resold pursuant to an exemption from registration under the 1933 Act, typically to qualified institutional buyers. The aggregate value of these securities at October 31, 2014 was $272,283,023, which represented 2.93% of the Fund’s Net Assets. |
| (f) | The money market fund and the Fund are affiliated by having the same investment adviser. |
| (g) | Futures collateralized by $609,220,000 cash held with Bank of America Merrill Lynch, the futures commission merchant. |
See accompanying Notes to Consolidated Financial Statements which are an integral part of the financial statements.
12 Invesco Balanced-Risk Allocation Fund
Consolidated Statement of Assets and Liabilities
October 31, 2014
| | | | |
Assets: | | | | |
Investments, at value (Cost $3,519,112,309) | | $ | 3,518,336,176 | |
Investments in affiliated money market funds, at value and cost | | | 5,117,800,030 | |
Total investments, at value (Cost $8,636,912,339) | | | 8,636,136,206 | |
Receivable for: | | | | |
Deposits with brokers for open futures contracts | | | 609,220,000 | |
Variation margin — futures | | | 50,043,081 | |
Fund shares sold | | | 14,973,140 | |
Dividends and interest | | | 77,925 | |
Swaps receivables | | | 3,075,672 | |
Unrealized appreciation on swap agreements — OTC | | | 12,152,412 | |
Investment for trustee deferred compensation and retirement plans | | | 551,267 | |
Other assets | | | 170,512 | |
Total assets | | | 9,326,400,215 | |
| |
Liabilities: | | | | |
Payable for: | | | | |
Fund shares reacquired | | | 20,826,675 | |
Variation margin — futures | | | 5,875,954 | |
Accrued fees to affiliates | | | 5,415,479 | |
Accrued trustees’ and officers’ fees and benefits | | | 13,083 | |
Trustee deferred compensation and retirement plans | | | 658,240 | |
Unrealized depreciation on swap agreements — OTC | | | 8,009,785 | |
Total liabilities | | | 40,799,216 | |
Net assets applicable to shares outstanding | | $ | 9,285,600,999 | |
| |
Net assets consist of: | | | | |
Shares of beneficial interest | | $ | 8,535,653,534 | |
Undistributed net investment income (loss) | | | 177,753,382 | |
Undistributed net realized gain | | | 523,214,337 | |
Net unrealized appreciation | | | 48,979,746 | |
| | | $ | 9,285,600,999 | |
| | | | |
Net Assets: | | | | |
Class A | | $ | 2,938,956,680 | |
Class B | | $ | 20,853,430 | |
Class C | | $ | 1,930,317,975 | |
Class R | | $ | 28,166,205 | |
Class Y | | $ | 3,699,737,739 | |
Class R5 | | $ | 186,943,298 | |
Class R6 | | $ | 480,625,672 | |
|
Shares outstanding, $0.01 par value per share,
with an unlimited number of shares authorized: | |
Class A | | | 237,726,326 | |
Class B | | | 1,750,136 | |
Class C | | | 162,014,523 | |
Class R | | | 2,308,544 | |
Class Y | | | 295,817,586 | |
Class R5 | | | 14,941,965 | |
Class R6 | | | 38,359,152 | |
Class A: | | | | |
Net asset value per share | | $ | 12.36 | |
Maximum offering price per share | | | | |
(Net asset value of $12.36 ¸ 94.50%) | | $ | 13.08 | |
Class B: | | | | |
Net asset value and offering price per share | | $ | 11.92 | |
Class C: | | | | |
Net asset value and offering price per share | | $ | 11.91 | |
Class R: | | | | |
Net asset value and offering price per share | | $ | 12.20 | |
Class Y: | | | | |
Net asset value and offering price per share | | $ | 12.51 | |
Class R5: | | | | |
Net asset value and offering price per share | | $ | 12.51 | |
Class R6: | | | | |
Net asset value and offering price per share | | $ | 12.53 | |
See accompanying Notes to Consolidated Financial Statements which are an integral part of the financial statements.
13 Invesco Balanced-Risk Allocation Fund
Consolidated Statement of Operations
For the year ended October 31, 2014
| | | | |
Investment income: | |
Dividends from affiliated money market funds | | $ | 1,371,390 | |
Interest | | | 2,274,404 | |
Total investment income | | | 3,645,794 | |
| |
Expenses: | | | | |
Advisory fees | | | 84,967,962 | |
Administrative services fees | | | 783,021 | |
Custodian fees | | | 224,986 | |
Distribution fees: | | | | |
Class A | | | 8,559,789 | |
Class B | | | 256,161 | |
Class C | | | 21,201,111 | |
Class R | | | 139,780 | |
Transfer agent fees — A, B, C, R and Y | | | 10,940,314 | |
Transfer agent fees — R5 | | | 181,483 | |
Transfer agent fees — R6 | | | 7,987 | |
Trustees’ and officers’ fees and benefits | | | 300,009 | |
Other | | | 1,839,206 | |
Total expenses | | | 129,401,809 | |
Less: Fees waived and expense offset arrangement(s) | | | (4,443,826 | ) |
Net expenses | | | 124,957,983 | |
Net investment income (loss) | | | (121,312,189 | ) |
| |
Realized and unrealized gain (loss) from: | | | | |
Net realized gain (loss) from: | | | | |
Investment securities | | | (2,287,678 | ) |
Foreign currencies | | | (5,211,753 | ) |
Futures contracts | | | 891,623,921 | |
Swap agreements | | | (125,706,737 | ) |
| | | | 758,417,753 | |
Change in net unrealized appreciation (depreciation) of: | | | | |
Investment securities | | | 2,837,428 | |
Futures contracts | | | (364,161,734 | ) |
Swap agreements | | | 24,215,518 | |
| | | | (337,108,788 | ) |
Net realized and unrealized gain | | | 421,308,965 | |
Net increase in net assets resulting from operations | | $ | 299,996,776 | |
See accompanying Notes to Consolidated Financial Statements which are an integral part of the financial statements.
14 Invesco Balanced-Risk Allocation Fund
Consolidated Statement of Changes in Net Assets
For the years ended October 31, 2014 and 2013
| | | | | | | | |
| | | 2014 | | | 2013 | |
Operations: | | | | | | | | |
Net investment income (loss) | | $ | (121,312,189 | ) | | $ | (138,184,938 | ) |
Net realized gain | | | 758,417,753 | | | | 262,938,472 | |
Change in net unrealized appreciation (depreciation) | | | (337,108,788 | ) | | | 423,024,058 | |
Net increase in net assets resulting from operations | | | 299,996,776 | | | | 547,777,592 | |
| | |
Distributions to shareholders from net investment income: | | | | | | | | |
Class A | | | — | | | | (85,274,352 | ) |
Class B | | | — | | | | (623,804 | ) |
Class C | | | — | | | | (38,451,102 | ) |
Class R | | | — | | | | (361,248 | ) |
Class Y | | | — | | | | (97,691,876 | ) |
Class R5 | | | — | | | | (4,028,603 | ) |
Class R6 | | | — | | | | (13,606,471 | ) |
Total distributions from net investment income | | | — | | | | (240,037,456 | ) |
| | |
Distributions to shareholders from net realized gains: | | | | | | | | |
Class A | | | (283,367,752 | ) | | | (103,295,156 | ) |
Class B | | | (2,208,248 | ) | | | (915,226 | ) |
Class C | | | (178,493,603 | ) | | | (56,414,248 | ) |
Class R | | | (2,094,860 | ) | | | (464,538 | ) |
Class Y | | | (320,352,034 | ) | | | (111,375,724 | ) |
Class R5 | | | (13,942,287 | ) | | | (4,532,501 | ) |
Class R6 | | | (37,054,031 | ) | | | (15,201,114 | ) |
Total distributions from net realized gains | | | (837,512,815 | ) | | | (292,198,507 | ) |
| | |
Share transactions–net: | | | | | | | | |
Class A | | | (1,118,220,825 | ) | | | 628,074,162 | |
Class B | | | (8,976,629 | ) | | | (678,530 | ) |
Class C | | | (491,595,208 | ) | | | 655,024,401 | |
Class R | | | (557,151 | ) | | | 14,096,504 | |
Class Y | | | (938,385,675 | ) | | | 931,481,236 | |
Class R5 | | | (12,756,282 | ) | | | 40,617,078 | |
Class R6 | | | (22,311,912 | ) | | | (34,823,907 | ) |
Net increase (decrease) in net assets resulting from share transactions | | | (2,592,803,682 | ) | | | 2,233,790,944 | |
Net increase (decrease) in net assets | | | (3,130,319,721 | ) | | | 2,249,332,573 | |
| | |
Net assets: | | | | | | | | |
Beginning of year | | | 12,415,920,720 | | | | 10,166,588,147 | |
End of year (includes undistributed net investment income (loss) of $177,753,382 and $19,598,243, respectively) | | $ | 9,285,600,999 | | | $ | 12,415,920,720 | |
Notes to Consolidated Financial Statements
October 31, 2014
NOTE 1—Significant Accounting Policies
Invesco Balanced-Risk Allocation Fund (the “Fund”) is a series portfolio of AIM Investment Funds (Invesco Investment Funds) (the “Trust”). The Trust is organized as a Delaware statutory trust and is registered under the Investment Company Act of 1940, as amended (the “1940 Act”), as an open-end series management investment company consisting of twenty-four separate series portfolios, each authorized to issue an unlimited number of shares of beneficial interest. The assets, liabilities and operations of each portfolio are accounted for separately. Information presented in these consolidated financial statements pertains only to the Fund. Matters affecting each portfolio or class will be voted on exclusively by the shareholders of such portfolio or class.
The Fund will seek to gain exposure to the commodity markets primarily through investments in the Invesco Cayman Commodity Fund I Ltd. (the “Subsidiary”), a wholly-owned subsidiary of the Fund organized under the laws of the Cayman Islands. The Subsidiary was organized by the Fund to invest in commodity-linked derivatives. The Fund may invest up to 25% of its total assets in the Subsidiary.
15 Invesco Balanced-Risk Allocation Fund
The Fund’s investment objective is to provide total return with a low to moderate correlation to traditional financial market indices.
The Fund currently consists of seven different classes of shares: Class A, Class B, Class C, Class R, Class Y, Class R5 and Class R6. Class A shares are sold with a front-end sales charge unless certain waiver criteria are met and under certain circumstances load waived shares may be subject to contingent deferred sales charges (“CDSC”). Class C shares are sold with a CDSC. Class R, Class Y, Class R5 and Class R6 shares are sold at net asset value. Effective November 30, 2010, new or additional investments in Class B shares are no longer permitted. Existing shareholders of Class B shares may continue to reinvest dividends and capital gains distributions in Class B shares until they convert to Class A shares. Also, shareholders in Class B shares will be able to exchange those shares for Class B shares of other Invesco Funds offering such shares until they convert to Class A shares. Generally, Class B shares will automatically convert to Class A shares on or about the month-end, which is at least eight years after the date of purchase. Redemption of Class B shares prior to the conversion date will be subject to a CDSC.
The following is a summary of the significant accounting policies followed by the Fund in the preparation of its consolidated financial statements.
| A. | Security Valuations — Securities, including restricted securities, are valued according to the following policy. |
Debt obligations (including convertible securities) and unlisted equities are fair valued using an evaluated quote provided by an independent pricing service. Evaluated quotes provided by the pricing service may be determined without exclusive reliance on quoted prices, and may reflect appropriate factors such as institution-size trading in similar groups of securities, developments related to specific securities, dividend rate (for unlisted equities), yield (for debt obligations), quality, type of issue, coupon rate (for debt obligations), maturity (for debt obligations), individual trading characteristics and other market data. Debt obligations are subject to interest rate and credit risks. In addition, all debt obligations involve some risk of default with respect to interest and/or principal payments.
A security listed or traded on an exchange (except convertible securities) is valued at its last sales price or official closing price as of the close of the customary trading session on the exchange where the security is principally traded, or lacking any sales or official closing price on a particular day, the security may be valued at the closing bid price on that day. Securities traded in the over-the-counter market are valued based on prices furnished by independent pricing services or market makers. When such securities are valued by an independent pricing service they may be considered fair valued. Futures contracts are valued at the final settlement price set by an exchange on which they are principally traded. Listed options are valued at the mean between the last bid and ask prices from the exchange on which they are principally traded. Options not listed on an exchange are valued by an independent source at the mean between the last bid and ask prices. For purposes of determining net asset value per share, futures and option contracts generally are valued 15 minutes after the close of the customary trading session of the New York Stock Exchange (“NYSE”).
Investments in open-end and closed-end registered investment companies that do not trade on an exchange are valued at the end of day net asset value per share. Investments in open-end and closed-end registered investment companies that trade on an exchange are valued at the last sales price or official closing price as of the close of the customary trading session on the exchange where the security is principally traded.
Swap agreements are fair valued using an evaluated quote provided by an independent pricing service. Evaluated quotes provided by the pricing service are valued based on a model which may include end of day net present values, spreads, ratings, industry, and company performance.
Foreign securities’ (including foreign exchange contracts) prices are converted into U.S. dollar amounts using the applicable exchange rates as of the close of the NYSE. If market quotations are available and reliable for foreign exchange-traded equity securities, the securities will be valued at the market quotations. Because trading hours for certain foreign securities end before the close of the NYSE, closing market quotations may become unreliable. If between the time trading ends on a particular security and the close of the customary trading session on the NYSE, events occur that the Adviser determines are significant and make the closing price unreliable, the Fund may fair value the security. If the event is likely to have affected the closing price of the security, the security will be valued at fair value in good faith using procedures approved by the Board of Trustees. Adjustments to closing prices to reflect fair value may also be based on a screening process of an independent pricing service to indicate the degree of certainty, based on historical data, that the closing price in the principal market where a foreign security trades is not the current value as of the close of the NYSE. Foreign securities’ prices meeting the approved degree of certainty that the price is not reflective of current value will be priced at the indication of fair value from the independent pricing service. Multiple factors may be considered by the independent pricing service in determining adjustments to reflect fair value and may include information relating to sector indices, American Depositary Receipts and domestic and foreign index futures. Foreign securities may have additional risks including exchange rate changes, potential for sharply devalued currencies and high inflation, political and economic upheaval, the relative lack of issuer information, relatively low market liquidity and the potential lack of strict financial and accounting controls and standards.
Securities for which market prices are not provided by any of the above methods may be valued based upon quotes furnished by independent sources. The last bid price may be used to value equity securities. The mean between the last bid and ask prices is used to value debt obligations, including corporate loans.
Securities for which market quotations are not readily available or became unreliable are valued at fair value as determined in good faith by or under the supervision of the Trust’s officers following procedures approved by the Board of Trustees. Issuer specific events, market trends, bid/ask quotes of brokers and information providers and other market data may be reviewed in the course of making a good faith determination of a security’s fair value.
The Fund may invest in securities that are subject to interest rate risk, meaning the risk that the prices will generally fall as interest rates rise and, conversely, the prices will generally rise as interest rates fall. Specific securities differ in their sensitivity to changes in interest rates depending on their individual characteristics. Changes in interest rates may result in increased market volatility, which may affect the value and/or liquidity of certain of the Fund’s investments.
Valuations change in response to many factors including the historical and prospective earnings of the issuer, the value of the issuer’s assets, general economic conditions, interest rates, investor perceptions and market liquidity. Because of the inherent uncertainties of valuation, the values reflected in the consolidated financial statements may materially differ from the value received upon actual sale of those investments.
| B. | Securities Transactions and Investment Income — Securities transactions are accounted for on a trade date basis. Realized gains or losses on sales are computed on the basis of specific identification of the securities sold. Interest income (net of withholding tax, if any) is recorded on the accrual basis from settlement date. Dividend income (net of withholding tax, if any) is recorded on the ex-dividend date. Bond premiums and discounts are amortized and/or accreted for financial reporting purposes. |
16 Invesco Balanced-Risk Allocation Fund
The Fund may periodically participate in litigation related to Fund investments. As such, the Fund may receive proceeds from litigation settlements. Any proceeds received are included in the Consolidated Statement of Operations as realized gain (loss) for investments no longer held and as unrealized gain (loss) for investments still held.
Brokerage commissions and mark ups are considered transaction costs and are recorded as an increase to the cost basis of securities purchased and/or a reduction of proceeds on a sale of securities. Such transaction costs are included in the determination of net realized and unrealized gain (loss) from investment securities reported in the Consolidated Statement of Operations and the Consolidated Statement of Changes in Net Assets and the net realized and unrealized gains (losses) on securities per share in the Consolidated Financial Highlights. Transaction costs are included in the calculation of the Fund’s net asset value and, accordingly, they reduce the Fund’s total returns. These transaction costs are not considered operating expenses and are not reflected in net investment income reported in the Consolidated Statement of Operations and Consolidated Statement of Changes in Net Assets, or the net investment income per share and ratios of expenses and net investment income reported in the Consolidated Financial Highlights, nor are they limited by any expense limitation arrangements between the Fund and the investment adviser.
The Fund allocates income and realized and unrealized capital gains and losses to a class based on the relative net assets of each class.
| C. | Country Determination — For the purposes of making investment selection decisions and presentation in the Consolidated Schedule of Investments, the investment adviser may determine the country in which an issuer is located and/or credit risk exposure based on various factors. These factors include the laws of the country under which the issuer is organized, where the issuer maintains a principal office, the country in which the issuer derives 50% or more of its total revenues and the country that has the primary market for the issuer’s securities, as well as other criteria. Among the other criteria that may be evaluated for making this determination are the country in which the issuer maintains 50% or more of its assets, the type of security, financial guarantees and enhancements, the nature of the collateral and the sponsor organization. Country of issuer and/or credit risk exposure has been determined to be the United States of America, unless otherwise noted. |
| D. | Distributions — Distributions from net investment income and net realized capital gain, if any, are generally declared and paid annually and recorded on the ex-dividend date. The Fund may elect to treat a portion of the proceeds from redemptions as distributions for federal income tax purposes. |
| E. | Federal Income Taxes — The Fund intends to comply with the requirements of Subchapter M of the Internal Revenue Code of 1986, as amended (the “Internal Revenue Code”), necessary to qualify as a regulated investment company and to distribute substantially all of the Fund’s taxable earnings to shareholders. As such, the Fund will not be subject to federal income taxes on otherwise taxable income (including net realized capital gain) that is distributed to shareholders. Therefore, no provision for federal income taxes is recorded in the consolidated financial statements. |
The Fund recognizes the tax benefits of uncertain tax positions only when the position is more likely than not to be sustained. Management has analyzed the Fund’s uncertain tax positions and concluded that no liability for unrecognized tax benefits should be recorded related to uncertain tax positions. Management is not aware of any tax positions for which it is reasonably possible that the total amounts of unrecognized tax benefits will change materially in the next 12 months.
The Subsidiary is classified as a controlled foreign corporation under Subchapter N of the Internal Revenue Code. Therefore, the Fund is required to increase its taxable income by its share of the Subsidiary’s income. Net investment losses of the Subsidiary cannot be deducted by the Fund in the current period nor carried forward to offset taxable income in future periods.
The Fund files tax returns in the U.S. Federal jurisdiction and certain other jurisdictions. Generally the Fund is subject to examinations by such taxing authorities for up to three years after the filing of the return for the tax period.
| F. | Expenses — Fees provided for under the Rule 12b-1 plan of a particular class of the Fund are charged to the operations of such class. Transfer agency fees and expenses and other shareholder recordkeeping fees and expenses attributable to Class R5 and Class R6 are allocated to each share class based on relative net assets. Sub-accounting fees attributable to Class R5 are charged to the operations of the class. Transfer agency fees and expenses and other shareholder recordkeeping fees and expenses relating to all other classes are allocated among those classes based on relative net assets. All other expenses are allocated among the classes based on relative net assets. |
| G. | Accounting Estimates — The financial statements are prepared on a consolidated basis in conformity with accounting principles generally accepted in the United States of America (“GAAP”), which requires management to make estimates and assumptions that affect the reported amounts of assets and liabilities at the date of the financial statements and the reported amounts of revenues and expenses during the reporting period including estimates and assumptions related to taxation. Actual results could differ from those estimates by a significant amount. The accompanying financial statements reflect the financial position of the Fund and its Subsidiary and the results of operations on a consolidated basis. All inter-company accounts and transactions have been eliminated in consolidation. |
In addition, the Fund monitors for material events or transactions that may occur or become known after the period-end date and before the date the consolidated financial statements are released to print.
| H. | Indemnifications — Under the Trust’s organizational documents, each Trustee, officer, employee or other agent of the Trust, and under the Subsidiary’s organizational documents, the directors and officers of the Subsidiary, are indemnified against certain liabilities that may arise out of the performance of their duties to the Fund and/or the Subsidiary, respectively. Additionally, in the normal course of business, the Fund enters into contracts, including the Fund’s servicing agreements, that contain a variety of indemnification clauses. The Fund’s maximum exposure under these arrangements is unknown as this would involve future claims that may be made against the Fund that have not yet occurred. The risk of material loss as a result of such indemnification claims is considered remote. |
| I. | Structured Securities — The Fund may invest in structured securities. Structured securities are a type of derivative security whose value is determined by reference to changes in the value of underlying securities, currencies, interest rates, commodities, indices or other financial indicators (“reference instruments”). Most structured securities are fixed-income securities that have maturities of three years or less. Structured securities may be positively or negatively indexed (i.e., their principal value or interest rates may increase or decrease if the underlying reference instrument appreciates) and may have return characteristics similar to direct investments in the underlying reference instrument. |
Structured securities may entail a greater degree of market risk than other types of debt securities because the investor bears the risk of the reference instruments. In addition to the credit risk of structured securities and the normal risks of price changes in response to changes in interest rates, the principal amount of structured notes or indexed securities may decrease as a result of changes in the value of the underlying
17 Invesco Balanced-Risk Allocation Fund
reference instruments. Changes in the daily value of structured securities are recorded as unrealized gains (losses) in the Consolidated Statement of Operations. When the structured securities mature or are sold, the Fund recognizes a realized gain (loss) on the Consolidated Statement of Operations.
| J. | Foreign Currency Translations — Foreign currency is valued at the close of the NYSE based on quotations posted by banks and major currency dealers. Portfolio securities and other assets and liabilities denominated in foreign currencies are translated into U.S. dollar amounts at date of valuation. Purchases and sales of portfolio securities (net of foreign taxes withheld on disposition) and income items denominated in foreign currencies are translated into U.S. dollar amounts on the respective dates of such transactions. The Fund does not separately account for the portion of the results of operations resulting from changes in foreign exchange rates on investments and the fluctuations arising from changes in market prices of securities held. The combined results of changes in foreign exchange rates and the fluctuation of market prices on investments (net of estimated foreign tax withholding) are included with the net realized and unrealized gain or loss from investments in the Consolidated Statement of Operations. Reported net realized foreign currency gains or losses arise from (1) sales of foreign currencies, (2) currency gains or losses realized between the trade and settlement dates on securities transactions, and (3) the difference between the amounts of dividends, interest, and foreign withholding taxes recorded on the Fund’s books and the U.S. dollar equivalent of the amounts actually received or paid. Net unrealized foreign currency gains and losses arise from changes in the fair values of assets and liabilities, other than investments in securities at fiscal period end, resulting from changes in exchange rates. |
The Fund may invest in foreign securities, which may be subject to foreign taxes on income, gains on investments or currency repatriation, a portion of which may be recoverable. Foreign taxes, if any, are recorded based on the tax regulations and rates that exist in the foreign markets in which the Fund invests and are shown in the Consolidated Statement of Operations.
| K. | Futures Contracts — The Fund may enter into futures contracts to manage exposure to interest rate, equity and market price movements and/or currency risks. A futures contract is an agreement between two parties (“Counterparties”) to purchase or sell a specified underlying security, currency or commodity (or delivery of a cash settlement price, in the case of an index future) for a fixed price at a future date. The Fund currently invests only in exchange-traded futures and they are standardized as to maturity date and underlying financial instrument. Initial margin deposits required upon entering into futures contracts are satisfied by the segregation of specific securities or cash as collateral at the futures commission merchant (broker). During the period the futures contracts are open, changes in the value of the contracts are recognized as unrealized gains or losses by recalculating the value of the contracts on a daily basis. Subsequent or variation margin payments are received or made depending upon whether unrealized gains or losses are incurred. These amounts are reflected as receivables or payables on the Consolidated Statement of Assets and Liabilities. When the contracts are closed or expire, the Fund recognizes a realized gain or loss equal to the difference between the proceeds from, or cost of, the closing transaction and the Fund’s basis in the contract. The net realized gain (loss) and the change in unrealized gain (loss) on futures contracts held during the period is included on the Consolidated Statement of Operations. The primary risks associated with futures contracts are market risk and the absence of a liquid secondary market. If the Fund were unable to liquidate a futures contract and/or enter into an offsetting closing transaction, the Fund would continue to be subject to market risk with respect to the value of the contracts and continue to be required to maintain the margin deposits on the futures contracts. Futures contracts have minimal Counterparty risk since the exchange’s clearinghouse, as Counterparty to all exchange-traded futures, guarantees the futures against default. Risks may exceed amounts recognized in the Consolidated Statement of Assets and Liabilities. |
| L. | Swap Agreements — The Fund may enter into various swap transactions, including interest rate, total return, index, currency and credit default swap contracts (“CDS”) for investment purposes or to manage interest rate, currency or credit risk. Such transactions are agreements between two parties. These agreements may contain among other conditions, events of default and termination events, and various covenants and representations such as provisions that require the Fund to maintain a pre-determined level of net assets, and/or provide limits regarding the decline of the Fund’s NAV over specific periods of time. If the Fund were to trigger such provisions and have open derivative positions at that time, the Counterparty may be able to terminate such agreement and request immediate payment in an amount equal to the net liability positions, if any. |
Interest rate, total return, index, and currency swap agreements are two-party contracts entered into primarily to exchange the returns (or differentials in rates of returns) earned or realized on particular predetermined investments or instruments. The gross returns to be exchanged or “swapped” between the parties are calculated with respect to a notional amount, i.e., the return on or increase in value of a particular dollar amount invested at a particular interest rate or return of an underlying asset, in a particular foreign currency, or in a “basket” of securities representing a particular index.
Changes in the value of swap agreements are recognized as unrealized gains (losses) in the Consolidated Statement of Operations by “marking to market” on a daily basis to reflect the value of the swap agreement at the end of each trading day. Payments received or paid at the beginning of the agreement are reflected as such on the Consolidated Statement of Assets and Liabilities and may be referred to as upfront payments. The Fund accrues for the fixed payment stream and amortizes upfront payments, if any, on swap agreements on a daily basis with the net amount, recorded as a component of realized gain (loss) on the Consolidated Statement of Operations. A liquidation payment received or made at the termination of a swap agreement is recorded as realized gain (loss) on the Consolidated Statement of Operations. The Fund segregates liquid securities having a value at least equal to the amount of the potential obligation of a Fund under any swap transaction. Entering into these agreements involves, to varying degrees, lack of liquidity and elements of credit, market, and Counterparty risk in excess of amounts recognized on the Consolidated Statement of Assets and Liabilities. Such risks involve the possibility that a swap is difficult to sell or liquidate; the Counterparty does not honor its obligations under the agreement and unfavorable interest rates and market fluctuations. It is possible that developments in the swaps market, including potential government regulation, could adversely affect the Fund’s ability to terminate existing swap agreements or to realize amounts to be received under such agreements. A short position in a security poses more risk than holding the same security long. As there is no limit on how much the price of the security can increase, the Fund’s exposure is unlimited.
| M. | Other Risks — The Fund will seek to gain exposure to commodity markets primarily through an investment in the Subsidiary and through investments in exchange traded funds and commodity-linked derivatives. The Subsidiary, unlike the Fund, may invest without limitation in commodities, commodity-linked derivatives and other securities, such as exchange traded notes, that may provide leverage and non-leveraged exposure to commodity markets. The Fund is indirectly exposed to the risks associated with the Subsidiary’s investments. |
The Fund is non-diversified and may invest in securities of fewer issuers than if it were diversified. Thus, the value of the Fund’s shares may vary more widely and the Fund may be subject to greater market and credit risk than if the Fund invested more broadly.
18 Invesco Balanced-Risk Allocation Fund
| N. | Leverage Risk — Leverage exists when a Fund can lose more than it originally invests because it purchases or sells an instrument or enters into a transaction without investing an amount equal to the full economic exposure of the instrument or transaction. |
| O. | Collateral — To the extent the Fund has designated or segregated a security as collateral and that security is subsequently sold, it is the Fund’s practice to replace such collateral no later than the next business day. |
NOTE 2—Advisory Fees and Other Fees Paid to Affiliates
The Trust has entered into a master investment advisory agreement with Invesco Advisers, Inc. (the “Adviser” or “Invesco”). Under the terms of the investment advisory agreement, the Fund pays an advisory fee to the Adviser less the amount paid by the Subsidiary to the Adviser based on the annual rate of the Fund’s average daily net assets as follows:
| | | | | | |
| Average Daily Net Assets | | Rate |
First $250 million | | | 0 | .95% | | |
Next $250 million | | | 0 | .925% | | |
Next $500 million | | | 0 | .90% | | |
Next $1.5 billion | | | 0 | .875% | | |
Next $2.5 billion | | | 0 | .85% | | |
Next $2.5 billion | | | 0 | .825% | | |
Next $2.5 billion | | | 0 | .80% | | |
Over $10 billion | | | 0 | .775% | | |
For the year ended October 31, 2014, the effective advisory fees incurred by the Fund was 0.84%.
The Subsidiary has entered into a separate contract with the Adviser whereby the Adviser provides investment advisory and other services to the Subsidiary. In consideration of these services, the Subsidiary pays an advisory fee to the Adviser based on the annual rate of the Subsidiary’s average daily net assets as set forth in the table above.
Under the terms of a master sub-advisory agreement between the Adviser and each of Invesco Asset Management Deutschland GmbH, Invesco Asset Management Limited, Invesco Asset Management (Japan) Limited, Invesco Australia Limited, Invesco Hong Kong Limited, Invesco Senior Secured Management, Inc. and Invesco Canada Ltd. (collectively, the “Affiliated Sub-Advisers”) the Adviser, not the Fund, may pay 40% of the fees paid to the Adviser to any such Affiliated Sub-Adviser(s) that provide(s) discretionary investment management services to the Fund based on the percentage of assets allocated to such Sub-Adviser(s).
The Adviser has contractually agreed, through at least June 30, 2015, to waive advisory fees and/or reimburse expenses to the extent necessary to limit total annual fund operating expenses after fee waiver and/or expense reimbursement (excluding certain items discussed below) of Class A, Class B, Class C, Class R, Class Y, Class R5 and Class R6 shares to 2.00%, 2.75%, 2.75%, 2.25%, 1.75%, 1.75% and 1.75% of average daily net assets, respectively. In determining the Adviser’s obligation to waive advisory fees and/or reimburse expenses, the following expenses are not taken into account, and could cause the total annual fund operating expenses after fee waiver and/or reimbursement to exceed the numbers reflected above: (1) interest; (2) taxes; (3) dividend expense on short sales; (4) extraordinary or non-routine items, including litigation expenses; and (5) expenses that the Fund has incurred but did not actually pay because of an expense offset arrangement. Acquired Fund Fees and Expenses are not operating expenses of a Fund directly, but are fees and expenses, including management fees of the investment companies in which a Fund invests. As a result, the total annual fund operating expenses after expense reimbursement may exceed the expense limits above. Unless Invesco continues the fee waiver agreement, it will terminate on June 30, 2015. The fee waiver agreement cannot be terminated during its term. The Adviser did not waive fees and/or reimburse expenses during the period under this expense limitation.
Further, the Adviser has contractually agreed, through at least June 30, 2016, to waive the advisory fee payable by the Fund in an amount equal to 100% of the net advisory fees the Adviser receives from the affiliated money market funds on investments by the Fund of uninvested cash in such affiliated money market funds.
For the year ended October 31, 2014, the Adviser waived advisory fees of $4,428,565.
The Trust has entered into a master administrative services agreement with Invesco pursuant to which the Fund has agreed to pay Invesco for certain administrative costs incurred in providing accounting services to the Fund. For the year ended October 31, 2014, expenses incurred under the agreement are shown in the Consolidated Statement of Operations as Administrative services fees.
The Trust has entered into a transfer agency and service agreement with Invesco Investment Services, Inc. (“IIS”) pursuant to which the Fund has agreed to pay IIS a fee for providing transfer agency and shareholder services to the Fund and reimburse IIS for certain expenses incurred by IIS in the course of providing such services. IIS may make payments to intermediaries that provide omnibus account services, sub-accounting services and/or networking services. All fees payable by IIS to intermediaries that provide omnibus account services or sub-accounting are charged back to the Fund, subject to certain limitations approved by the Trust’s Board of Trustees. For the year ended October 31, 2014, expenses incurred under the agreement are shown in the Consolidated Statement of Operations as Transfer agent fees.
The Trust has entered into master distribution agreements with Invesco Distributors, Inc. (“IDI”) to serve as the distributor for the Class A, Class B, Class C, Class R, Class Y, Class R5 and Class R6 shares of the Fund. The Trust has adopted plans pursuant to Rule 12b-1 under the 1940 Act with respect to the Fund’s Class A, Class B, Class C and Class R shares (collectively, the “Plans”). The Fund, pursuant to the Plans, pays IDI compensation at the annual rate of 0.25% of the Fund’s average daily net assets of Class A shares, 1.00% of the average daily net assets of Class B and Class C shares and 0.50% of the average daily net assets of Class R shares. Of the Plan payments, up to 0.25% of the average daily net assets of each class of shares may be paid to furnish continuing personal shareholder services to customers who purchase and own shares of such classes. Any amounts not paid as a service fee under the Plans would constitute an asset-based sales charge. Rules of the Financial Industry Regulatory Authority (“FINRA”) impose a cap on the total sales charges, including asset-based sales charges, that may be paid by any class of shares of the Fund. For the year ended October 31, 2014, expenses incurred under the Plans are shown in the Consolidated Statement of Operations as Distribution fees.
Front-end sales commissions and CDSC (collectively, the “sales charges”) are not recorded as expenses of the Fund. Front-end sales commissions are deducted from proceeds from the sales of Fund shares prior to investment in Class A shares of the Fund. CDSC are deducted from redemption
19 Invesco Balanced-Risk Allocation Fund
proceeds prior to remittance to the shareholder. During the year ended October 31, 2014, IDI advised the Fund that IDI retained $892,271 in front-end sales commissions from the sale of Class A shares and $231,373, $24,422 and $511,645 from Class A, Class B and Class C shares, respectively, for CDSC imposed on redemptions by shareholders.
Certain officers and trustees of the Trust are officers and directors of the Adviser, IIS and/or IDI.
NOTE 3—Additional Valuation Information
GAAP defines fair value as the price that would be received to sell an asset or paid to transfer a liability in an orderly transaction between market participants at the measurement date, under current market conditions. GAAP establishes a hierarchy that prioritizes the inputs to valuation methods, giving the highest priority to readily available unadjusted quoted prices in an active market for identical assets (Level 1) and the lowest priority to significant unobservable inputs (Level 3), generally when market prices are not readily available or are unreliable. Based on the valuation inputs, the securities or other investments are tiered into one of three levels. Changes in valuation methods may result in transfers in or out of an investment’s assigned level:
| | Level 1 — | Prices are determined using quoted prices in an active market for identical assets. |
| | Level 2 — | Prices are determined using other significant observable inputs. Observable inputs are inputs that other market participants may use in pricing a security. These may include quoted prices for similar securities, interest rates, prepayment speeds, credit risk, yield curves, loss severities, default rates, discount rates, volatilities and others. |
| | Level 3 — | Prices are determined using significant unobservable inputs. In situations where quoted prices or observable inputs are unavailable (for example, when there is little or no market activity for an investment at the end of the period), unobservable inputs may be used. Unobservable inputs reflect the Fund’s own assumptions about the factors market participants would use in determining fair value of the securities or instruments and would be based on the best available information. |
The following is a summary of the tiered valuation input levels, as of October 31, 2014. The level assigned to the securities valuations may not be an indication of the risk or liquidity associated with investing in those securities. Because of the inherent uncertainties of valuation, the values reflected in the financial statements may materially differ from the value received upon actual sale of those investments.
| | | | | | | | | | | | | | | | |
| | | Level 1 | | | Level 2 | | | Level 3 | | | Total | |
Money Market Funds | | $ | 5,117,800,030 | | | $ | — | | | $ | — | | | $ | 5,117,800,030 | |
U.S. Treasury Securities | | | — | | | | 3,246,053,153 | | | | — | | | | 3,246,053,153 | |
Commodity-Linked Securities | | | — | | | | 272,283,023 | | | | — | | | | 272,283,023 | |
| | | | 5,117,800,030 | | | | 3,518,336,176 | | | | — | | | | 8,636,136,206 | |
Futures* | | | 45,613,252 | | | | — | | | | — | | | | 45,613,252 | |
Swap Agreements* | | | — | | | | 4,142,627 | | | | — | | | | 4,142,627 | |
Total Investments | | $ | 5,163,413,282 | | | $ | 3,522,478,803 | | | $ | — | | | $ | 8,685,892,085 | |
| * | Unrealized appreciation. |
NOTE 4—Derivative Investments
Value of Derivative Investments at Period-End
The table below summarizes the value of the Fund’s derivative investments, detailed by primary risk exposure, held as of October 31, 2014:
| | | | | | | | |
| | | Value | |
| Risk Exposure/Derivative Type | | Assets | | | Liabilities | |
Commodity risk: | | | | | | | | |
Futures contracts(a) | | $ | 102,958 | | | $ | (66,504,733 | ) |
Swap agreements(b) | | | 6,814,375 | | | | (8,009,785 | ) |
Interest rate risk: | | | | | | | | |
Futures contracts(a) | | | 120,595,167 | | | | — | |
Swap agreements(b) | | | 3,934,665 | | | | — | |
Market risk: | | | | | | | | |
Futures contracts(a) | | | 33,342,422 | | | | (41,922,562 | ) |
Swap agreements(b) | | | 1,403,372 | | | | — | |
Total | | $ | 166,192,959 | | | $ | (116,437,080 | ) |
| (a) | Includes cumulative appreciation (depreciation) of futures contracts. Only current day’s variation margin receivable (payable) is reported within the Consolidated Statement of Assets and Liabilities. |
| (b) | Values are disclosed on the Consolidated Statement of Assets and Liabilities under the caption Unrealized appreciation on swap agreements — OTC and Unrealized depreciation on swap agreements — OTC. |
20 Invesco Balanced-Risk Allocation Fund
Effect of Derivative Investments for the year ended October 31, 2014
The table below summarizes the gains (losses) on derivative investments, detailed by primary risk exposure, recognized in earnings during the period:
| | | | | | | | |
| | | Location of Gain (Loss) on
Consolidated Statement of Operations | |
| | | Futures
Contracts | | | Swap
Agreements | |
Realized Gain (Loss): | | | | | | | | |
Commodity risk | | $ | (125,614,476 | ) | | $ | (142,424,485 | ) |
Interest rate risk | | | 658,759,605 | | | | 24,434,294 | |
Market risk | | | 358,478,792 | | | | (7,716,546 | ) |
Change in Unrealized Appreciation (Depreciation): | | | | | | | | |
Commodity risk | | | (50,817,527 | ) | | | 18,877,481 | |
Interest rate risk | | | (126,984,758 | ) | | | 3,934,665 | |
Market risk | | | (186,359,449 | ) | | | 1,403,372 | |
Total | | $ | 527,462,187 | | | $ | (101,491,219 | ) |
The table below summarizes the average notional value of futures contracts and swap agreements outstanding during the period.
| | | | | | | | |
| | | Futures
Contracts | | | Swap
Agreements | |
Average notional value | | $ | 13,450,532,988 | | | $ | 1,852,934,001 | |
Offsetting Assets and Liabilities
Accounting Standards Update (“ASU”) No. 2011-11, Disclosures about Offsetting Assets and Liabilities, which was subsequently clarified in Financial Accounting Standards Board ASU 2013-01 “Clarifying the Scope of Disclosures about Offsetting Assets and Liabilities” is intended to enhance disclosures about financial instruments and derivative instruments that are subject to offsetting arrangements on the Consolidated Statement of Assets and Liabilities and to enable investors to better understand the effect of those arrangements on its financial position. In order for an arrangement to be eligible for netting, the Fund must have a basis to conclude that such netting arrangements are legally enforceable. The Fund enters into netting agreements and collateral agreements in an attempt to reduce the Fund’s Counterparty credit risk by providing for a single net settlement with a Counterparty of all financial transactions covered by the agreement in an event of default as defined under such agreement.
There were no derivative instruments subject to a netting agreement for which the Fund is not currently netting. The following tables present derivative instruments that are either subject to an enforceable netting agreement or offset by collateral arrangements as of October 31, 2014.
| | | | | | | | | | | | | | | | | | | | | | | | |
| Assets: | | | | | | | | | | | | | | | | | | |
| Counterparty | | Gross amounts
presented in
Consolidated
Statement of
Assets & Liabilities | | | Gross amounts
offset in
Consolidated
Statement of
Assets & Liabilities | | | Net amounts of assets
presented in
Consolidated
Statement of Assets
and Liabilities | | | Collateral Received | | | Net
Amount(a) | |
| | | | | Financial
Instruments | | | Cash | | |
| Fund | | | | | | | | | | | | | | | | | | |
Goldman Sachs International | | $ | 5,335,407 | | | $ | — | | | $ | 5,335,407 | | | $ | (4,231,583 | ) | | $ | — | | | $ | 1,103,824 | |
| | | | | | |
| | | | | | | | | | | | | | | | | | | | | | | | |
| Subsidiary | | | | | | | | | | | | | | | | | | |
Barclays Bank PLC | | | 2,276,088 | | | | — | | | | 2,276,088 | | | | — | | | | — | | | | 2,276,088 | |
Goldman Sachs International | | | 9,506,580 | | | | — | | | | 9,506,580 | | | | (9,506,580 | ) | | | — | | | | — | |
J.P. Morgan Chase Bank, N.A. | | | 83,078 | | | | (83,078 | ) | | | — | | | | — | | | | — | | | | — | |
Macquarie Bank, Limited | | | 2,611,979 | | | | — | | | | 2,611,979 | | | | — | | | | — | | | | 2,611,979 | |
Merrill Lynch International | | | 78,292 | | | | (78,292 | ) | | | — | | | | — | | | | — | | | | — | |
Morgan Stanley Capital Services LLC | | | 1,812,516 | | | | — | | | | 1,812,516 | | | | (1,669,477 | ) | | | — | | | | 143,039 | |
Subtotal — Subsidiary | | | 16,368,533 | | | | (161,370 | ) | | | 16,207,163 | | | | (11,176,057 | ) | | | — | | | | 5,031,106 | |
Total | | $ | 21,703,940 | | | $ | (161,370 | ) | | $ | 21,542,570 | | | $ | (15,407,640 | ) | | $ | — | | | $ | 6,134,930 | |
| | | | | | |
| | | | | | | | | | | | | | | | | | | | | | | | |
| Liabilities: | |
| | | Gross amounts
presented in
Consolidated
Statement of
Assets & Liabilities | | | Gross amounts
offset in
Consolidated
Statement of
Assets & Liabilities | | | Net amounts of liabilities
presented in
Consolidated
Statement of Assets
and Liabilities | | | Collateral Pledged | | | | |
| Counterparty | | | | | Financial
Instruments | | | Cash | | | Net
Amount(a) | |
| Subsidiary | | | | | | | | | | | | | | | | | | |
Canadian Imperial Bank of Commerce | | $ | 90,208 | | | $ | — | | | $ | 90,208 | | | $ | (90,208 | ) | | $ | — | | | $ | — | |
Cargill, Inc. | | | 1,050,658 | | | | — | | | | 1,050,658 | | | | (361,107 | ) | | | — | | | | 689,551 | |
J.P. Morgan Chase Bank, N.A. | | | 7,951,847 | | | | (83,078 | ) | | | 7,868,769 | | | | (7,868,769 | ) | | | — | | | | — | |
Merrill Lynch International | | | 5,392,928 | | | | (78,292 | ) | | | 5,314,636 | | | | (5,314,636 | ) | | | — | | | | — | |
Subtotal — Subsidiary | | $ | 14,485,641 | | | $ | (161,370 | ) | | $ | 14,324,271 | | | $ | (13,634,720 | ) | | $ | — | | | $ | 689,551 | |
| (a) | The Fund and the Subsidiary are recognized as separate legal entities and as such are subject to separate netting arrangements with the Counterparty. |
21 Invesco Balanced-Risk Allocation Fund
NOTE 5—Subsidiary Information
The Fund’s Consolidated Schedule of Investments includes the holdings, including any investments in derivatives, of both the Fund and the Subsidiary. The Fund’s Consolidated Statement of Assets and Liabilities, Consolidated Statement of Operations and Consolidated Statement of Changes in Net Assets include the account balances of both the Fund and the Subsidiary and all interfund transactions have been eliminated.
The table below summarizes the financial information of the Subsidiary recognized in the consolidated financial statements referred to above.
| | | | |
| Selected Financial Information | | Invesco Cayman
Commodity Fund I Ltd.
(the “Subsidiary”) | |
Total assets | | $ | 2,201,512,790 | |
Total liabilities | | | (13,896,989 | ) |
Net assets | | | 2,187,615,801 | |
Total investment income | | | 939,122 | |
Net investment income (loss) | | | (20,395,164 | ) |
Net realized gain (loss) from: | | | | |
Investment securities | | | (2,334,175 | ) |
Futures contracts | | | (125,614,476 | ) |
Swap agreements | | | (142,424,484 | ) |
Change in net unrealized appreciation (depreciation) of: | | | | |
Investment securities | | | 2,916,873 | |
Futures contracts | | | (50,817,527 | ) |
Swap agreements | | | 18,877,481 | |
Net increase (decrease) in net assets resulting from operations | | $ | (319,791,472 | ) |
NOTE 6—Expense Offset Arrangement(s)
The expense offset arrangement is comprised of transfer agency credits which result from balances in demand deposit accounts used by the transfer agent for clearing shareholder transactions. For the year ended October 31, 2014, the Fund received credits from this arrangement, which resulted in the reduction of the Fund’s total expenses of $15,261.
NOTE 7—Trustees’ and Officers’ Fees and Benefits
Trustees’ and Officers’ Fees and Benefits include amounts accrued by the Fund to pay remuneration to certain Trustees and Officers of the Fund. Trustees have the option to defer compensation payable by the Fund, and Trustees’ and Officers’ Fees and Benefits also include amounts accrued by the Fund to fund such deferred compensation amounts. Those Trustees who defer compensation have the option to select various Invesco Funds in which their deferral accounts shall be deemed to be invested. Finally, certain current Trustees were eligible to participate in a retirement plan that provided for benefits to be paid upon retirement to Trustees over a period of time based on the number of years of service. The Fund may have certain former Trustees who also participate in a retirement plan and receive benefits under such plan. Trustees’ and Officers’ Fees and Benefits include amounts accrued by the Fund to fund such retirement benefits. Obligations under the deferred compensation and retirement plans represent unsecured claims against the general assets of the Fund.
NOTE 8—Cash Balances
The Fund is permitted to temporarily carry a negative or overdrawn balance in its account with State Street Bank and Trust Company, the custodian bank. Such balances, if any at period end, are shown in the Consolidated Statement of Assets and Liabilities under the payable caption Amount due custodian. To compensate the custodian bank for such overdrafts, the overdrawn Fund may either (1) leave funds as a compensating balance in the account so the custodian bank can be compensated by earning the additional interest; or (2) compensate by paying the custodian bank at a rate agreed upon by the custodian bank and Invesco, not to exceed the contractually agreed upon rate.
22 Invesco Balanced-Risk Allocation Fund
NOTE 9—Distributions to Shareholders and Tax Components of Net Assets
Tax Character of Distributions to Shareholders Paid During the Fiscal Years Ended October 31, 2014 and 2013:
| | | | | | | | |
| | | 2014 | | | 2013 | |
Ordinary income | | $ | 472,187,821 | | | $ | 416,122,618 | |
Long-term capital gain | | | 365,324,994 | | | | 116,113,345 | |
Total distributions | | $ | 837,512,815 | | | $ | 532,235,963 | |
Tax Components of Net Assets at Period-End:
| | | | |
| | | 2014 | |
Undistributed ordinary income | | $ | 424,147,481 | |
Undistributed long-term gain | | | 238,406,748 | |
Net unrealized appreciation (depreciation) — investments | | | (776,941 | ) |
Net unrealized appreciation — other investments | | | 88,794,016 | |
Temporary book/tax differences | | | (623,839 | ) |
Shares of beneficial interest | | | 8,535,653,534 | |
Total net assets | | $ | 9,285,600,999 | |
The difference between book-basis and tax-basis unrealized appreciation (depreciation) is due to differences in the timing of recognition of gains and losses on investments for tax and book purposes. The Fund’s net unrealized appreciation (depreciation) difference is attributable primarily to wash sales.
The temporary book/tax differences are a result of timing differences between book and tax recognition of income and/or expenses. The Fund’s temporary book/tax differences are the result of the trustee deferral of compensation and retirement plan benefits.
Capital loss carryforward is calculated and reported as of a specific date. Results of transactions and other activity after that date may affect the amount of capital loss carryforward actually available for the Fund to utilize. Capital losses generated in years beginning after December 22, 2010 can be carried forward for an unlimited period, whereas previous losses expire in eight tax years. Capital losses with an expiration period may not be used to offset capital gains until all net capital losses without an expiration date have been utilized. Capital loss carryforwards with no expiration date will retain their character as either short-term or long-term capital losses instead of as short-term capital losses as under prior law. The ability to utilize capital loss carryforwards in the future may be limited under the Internal Revenue Code and related regulations based on the results of future transactions.
The Fund does not have a capital loss carryforward as of October 31, 2014.
NOTE 10—Investment Securities
The aggregate amount of investment securities (other than short-term securities, U.S. Treasury obligations and money market funds, if any) purchased and sold by the Fund during the year ended October 31, 2014 was $517,458,940 and $477,571,788, respectively. During the same period, purchases and sales of U.S. Treasury obligations were $1,705,543,133 and $0, respectively. Cost of investments on a tax basis includes the adjustments for financial reporting purposes as of the most recently completed federal income tax reporting period-end.
| | | | |
| Unrealized Appreciation (Depreciation) of Investment Securities on a Tax Basis | |
Aggregate unrealized appreciation of investment securities | | $ | 2,434,442 | |
Aggregate unrealized (depreciation) of investment securities | | | (3,211,383 | ) |
Net unrealized appreciation (depreciation) of investment securities | | $ | (776,941 | ) |
Cost of investments for tax purposes is $8,636,913,147.
NOTE 11—Reclassification of Permanent Differences
Primarily as a result of differing book/tax treatment of swap income, futures contracts and foreign currency transactions, on October 31, 2014, undistributed net investment income was increased by $279,467,328, undistributed net realized gain was increased by $43,203,649 and shares of beneficial interest was decreased by $322,670,977. This reclassification had no effect on the net assets of the Fund.
23 Invesco Balanced-Risk Allocation Fund
NOTE 12—Share Information
| | | | | | | | | | | | | | | | |
| | | Summary of Share Activity | |
| | | Years ended October 31, | |
| | | 2014(a) | | | 2013 | |
| | | Shares | | | Amount | | | Shares | | | Amount | |
Sold: | | | | | | | | | | | | | | | | |
Class A | | | 51,806,417 | | | $ | 632,415,865 | | | | 194,356,645 | | | $ | 2,453,794,943 | |
Class B | | | 140,674 | | | | 1,658,625 | | | | 830,841 | | | | 10,261,565 | |
Class C | | | 21,791,794 | | | | 258,168,002 | | | | 94,883,829 | | | | 1,171,789,462 | |
Class R | | | 662,774 | | | | 7,969,161 | | | | 1,872,161 | | | | 23,391,609 | |
Class Y | | | 121,129,080 | | | | 1,500,251,125 | | | | 271,364,647 | | | | 3,444,593,798 | |
Class R5 | | | 2,925,655 | | | | 35,680,316 | | | | 5,780,992 | | | | 73,002,236 | |
Class R6 | | | 2,635,178 | | | | 32,603,862 | | | | 13,812,861 | | | | 174,181,433 | |
| | | | |
Issued as reinvestment of dividends: | | | | | | | | | | | | | | | | |
Class A | | | 21,748,196 | | | | 252,496,557 | | | | 13,022,134 | | | | 161,995,364 | |
Class B | | | 185,614 | | | | 2,090,018 | | | | 119,764 | | | | 1,459,920 | |
Class C | | | 14,422,261 | | | | 162,394,677 | | | | 6,979,031 | | | | 85,074,386 | |
Class R | | | 181,423 | | | | 2,082,729 | | | | 66,582 | | | | 822,296 | |
Class Y | | | 17,088,467 | | | | 200,276,835 | | | | 10,988,091 | | | | 137,570,894 | |
Class R5 | | | 1,112,677 | | | | 13,040,575 | | | | 607,174 | | | | 7,601,812 | |
Class R6 | | | 3,157,016 | | | | 37,031,793 | | | | 2,302,765 | | | | 28,807,585 | |
| | | | |
Automatic conversion of Class B shares to Class A shares: | | | | | | | | | | | | | | | | |
Class A | | | 443,300 | | | | 5,425,537 | | | | 458,303 | | | | 5,793,524 | |
Class B | | | (458,284 | ) | | | (5,425,537 | ) | | | (469,307 | ) | | | (5,793,524 | ) |
| | | | |
Reacquired: | | | | | | | | | | | | | | | | |
Class A | | | (164,742,314 | ) | | | (2,008,558,784 | ) | | | (158,980,154 | ) | | | (1,993,509,669 | ) |
Class B | | | (621,650 | ) | | | (7,299,735 | ) | | | (538,731 | ) | | | (6,606,491 | ) |
Class C | | | (77,686,916 | ) | | | (912,157,887 | ) | | | (49,153,410 | ) | | | (601,839,447 | ) |
Class R | | | (885,517 | ) | | | (10,609,041 | ) | | | (810,862 | ) | | | (10,117,401 | ) |
Class Y | | | (215,629,161 | ) | | | (2,638,913,635 | ) | | | (209,968,791 | ) | | | (2,650,683,456 | ) |
Class R5 | | | (5,001,408 | ) | | | (61,477,173 | ) | | | (3,157,072 | ) | | | (39,986,970 | ) |
Class R6 | | | (7,536,409 | ) | | | (91,947,567 | ) | | | (18,771,982 | ) | | | (237,812,925 | ) |
Net increase (decrease) in share activity | | | (213,131,133 | ) | | $ | (2,592,803,682 | ) | | | 175,595,511 | | | $ | 2,233,790,944 | |
| (a) | There are entities that are record owners of more than 5% of the outstanding shares of the Fund and in the aggregate own 33% of the outstanding shares of the Fund. IDI has an agreement with these entities to sell Fund shares. The Fund, Invesco and/or Invesco affiliates may make payments to these entities, which are considered to be related to the Fund, for providing services to the Fund, Invesco and/or Invesco affiliates including but not limited to services such as securities brokerage, distribution, third party record keeping and account servicing. The Fund has no knowledge as to whether all or any portion of the shares owned of record by these entities are also owned beneficially. |
24 Invesco Balanced-Risk Allocation Fund
NOTE 13—Consolidated Financial Highlights
The following schedule presents financial highlights for a share of the Fund outstanding throughout the periods indicated.
| | | | | | | | | | | | | | | | | | | | | | | | | | | | | | | | | | | | | | | | | | | | | | | | | | | | | | | | | | | | | | | | | | | | | | |
| | | Net asset
value,
beginning
of period | | Net
investment
income
(loss)(a) | | Net gains
(losses)
on securities
(both
realized and
unrealized) | | Total from
investment
operations | | Dividends
from net
investment
income | | Distributions
from net
realized
gains | | Total
distributions | | Net asset
value, end
of period | | Total
return(b) | | Net assets,
end of period
(000’s omitted) | | Ratio of
expenses
to average
net assets
with fee waivers
and/or expenses
absorbed | | Ratio of
expenses
to average net
assets without
fee waivers
and/or expenses
absorbed | | Ratio of net
investment
income (loss)
to average
net assets | | Portfolio
turnover(c) |
Class A | |
Year ended 10/31/14 | | | $ | 12.88 | | | | $ | (0.14 | ) | | | $ | 0.53 | | | | $ | 0.39 | | | | $ | — | | | | $ | (0.91 | ) | | | $ | (0.91 | ) | | | $ | 12.36 | | | | | 3.52 | % | | | $ | 2,938,957 | | | | | 1.20 | %(d) | | | | 1.24 | %(d) | | | | (1.16 | )%(d) | | | | 72 | % |
Year ended 10/31/13 | | | | 12.88 | | | | | (0.14 | ) | | | | 0.78 | | | | | 0.64 | | | | | (0.29 | ) | | | | (0.35 | ) | | | | (0.64 | ) | | | | 12.88 | | | | | 5.15 | | | | | 4,229,859 | | | | | 1.14 | | | | | 1.21 | | | | | (1.07 | ) | | | | 0 | |
Year ended 10/31/12 | | | | 12.01 | | | | | (0.13 | ) | | | | 1.46 | | | | | 1.33 | | | | | (0.34 | ) | | | | (0.12 | ) | | | | (0.46 | ) | | | �� | 12.88 | | | | | 11.39 | | | | | 3,600,577 | | | | | 1.10 | | | | | 1.22 | | | | | (1.00 | ) | | | | 282 | |
Year ended 10/31/11 | | | | 11.68 | | | | | (0.11 | ) | | | | 1.11 | | | | | 1.00 | | | | | (0.47 | ) | | | | (0.20 | ) | | | | (0.67 | ) | | | | 12.01 | | | | | 9.13 | | | | | 1,001,088 | | | | | 1.04 | | | | | 1.31 | | | | | (0.95 | ) | | | | 163 | (e) |
Year ended 10/31/10 | | | | 10.72 | | | | | (0.10 | ) | | | | 1.61 | | | | | 1.51 | | | | | (0.21 | ) | | | | (0.34 | ) | | | | (0.55 | ) | | | | 11.68 | | | | | 14.76 | | | | | 207,600 | | | | | 1.04 | | | | | 1.42 | | | | | (0.93 | ) | | | | 33 | (e) |
Class B | |
Year ended 10/31/14 | | | | 12.53 | | | | | (0.23 | ) | | | | 0.53 | | | | | 0.30 | | | | | — | | | | | (0.91 | ) | | | | (0.91 | ) | | | | 11.92 | | | | | 2.85 | | | | | 20,853 | | | | | 1.95 | (d) | | | | 1.99 | (d) | | | | (1.91 | )(d) | | | | 72 | |
Year ended 10/31/13 | | | | 12.59 | | | | | (0.22 | ) | | | | 0.75 | | | | | 0.53 | | | | | (0.24 | ) | | | | (0.35 | ) | | | | (0.59 | ) | | | | 12.53 | | | | | 4.34 | | | | | 31,381 | | | | | 1.89 | | | | | 1.96 | | | | | (1.82 | ) | | | | 0 | |
Year ended 10/31/12 | | | | 11.81 | | | | | (0.21 | ) | | | | 1.42 | | | | | 1.21 | | | | | (0.31 | ) | | | | (0.12 | ) | | | | (0.43 | ) | | | | 12.59 | | | | | 10.52 | | | | | 32,246 | | | | | 1.85 | | | | | 1.97 | | | | | (1.75 | ) | | | | 282 | |
Year ended 10/31/11 | | | | 11.56 | | | | | (0.19 | ) | | | | 1.09 | | | | | 0.90 | | | | | (0.45 | ) | | | | (0.20 | ) | | | | (0.65 | ) | | | | 11.81 | | | | | 8.30 | | | | | 17,722 | | | | | 1.79 | | | | | 2.06 | | | | | (1.70 | ) | | | | 163 | (e) |
Year ended 10/31/10 | | | | 10.68 | | | | | (0.19 | ) | | | | 1.61 | | | | | 1.42 | | | | | (0.20 | ) | | | | (0.34 | ) | | | | (0.54 | ) | | | | 11.56 | | | | | 13.95 | | | | | 9,707 | | | | | 1.79 | | | | | 2.17 | | | | | (1.68 | ) | | | | 33 | (e) |
Class C | |
Year ended 10/31/14 | | | | 12.53 | | | | | (0.23 | ) | | | | 0.52 | | | | | 0.29 | | | | | — | | | | | (0.91 | ) | | | | (0.91 | ) | | | | 11.91 | | | | | 2.77 | | | | | 1,930,318 | | | | | 1.95 | (d) | | | | 1.99 | (d) | | | | (1.91 | )(d) | | | | 72 | |
Year ended 10/31/13 | | | | 12.59 | | | | | (0.22 | ) | | | | 0.75 | | | | | 0.53 | | | | | (0.24 | ) | | | | (0.35 | ) | | | | (0.59 | ) | | | | 12.53 | | | | | 4.34 | | | | | 2,550,094 | | | | | 1.89 | | | | | 1.96 | | | | | (1.82 | ) | | | | 0 | |
Year ended 10/31/12 | | | | 11.80 | | | | | (0.21 | ) | | | | 1.43 | | | | | 1.22 | | | | | (0.31 | ) | | | | (0.12 | ) | | | | (0.43 | ) | | | | 12.59 | | | | | 10.61 | | | | | 1,898,066 | | | | | 1.85 | | | | | 1.97 | | | | | (1.75 | ) | | | | 282 | |
Year ended 10/31/11 | | | | 11.56 | | | | | (0.19 | ) | | | | 1.08 | | | | | 0.89 | | | | | (0.45 | ) | | | | (0.20 | ) | | | | (0.65 | ) | | | | 11.80 | | | | | 8.21 | | | | | 383,786 | | | | | 1.79 | | | | | 2.06 | | | | | (1.70 | ) | | | | 163 | (e) |
Year ended 10/31/10 | | | | 10.68 | | | | | (0.19 | ) | | | | 1.61 | | | | | 1.42 | | | | | (0.20 | ) | | | | (0.34 | ) | | | | (0.54 | ) | | | | 11.56 | | | | | 13.95 | | | | | 58,377 | | | | | 1.79 | | | | | 2.17 | | | | | (1.68 | ) | | | | 33 | (e) |
Class R | |
Year ended 10/31/14 | | | | 12.75 | | | | | (0.17 | ) | | | | 0.53 | | | | | 0.36 | | | | | — | | | | | (0.91 | ) | | | | (0.91 | ) | | | | 12.20 | | | | | 3.30 | | | | | 28,166 | | | | | 1.45 | (d) | | | | 1.49 | (d) | | | | (1.41 | )(d) | | | | 72 | |
Year ended 10/31/13 | | | | 12.77 | | | | | (0.17 | ) | | | | 0.77 | | | | | 0.60 | | | | | (0.27 | ) | | | | (0.35 | ) | | | | (0.62 | ) | | | | 12.75 | | | | | 4.89 | | | | | 29,964 | | | | | 1.39 | | | | | 1.46 | | | | | (1.32 | ) | | | | 0 | |
Year ended 10/31/12 | | | | 11.93 | | | | | (0.15 | ) | | | | 1.44 | | | | | 1.29 | | | | | (0.33 | ) | | | | (0.12 | ) | | | | (0.45 | ) | | | | 12.77 | | | | | 11.12 | | | | | 15,605 | | | | | 1.35 | | | | | 1.47 | | | | | (1.25 | ) | | | | 282 | |
Year ended 10/31/11 | | | | 11.63 | | | | | (0.14 | ) | | | | 1.10 | | | | | 0.96 | | | | | (0.46 | ) | | | | (0.20 | ) | | | | (0.66 | ) | | | | 11.93 | | | | | 8.84 | | | | | 2,956 | | | | | 1.29 | | | | | 1.56 | | | | | (1.20 | ) | | | | 163 | (e) |
Year ended 10/31/10 | | | | 10.71 | | | | | (0.13 | ) | | | | 1.60 | | | | | 1.47 | | | | | (0.21 | ) | | | | (0.34 | ) | | | | (0.55 | ) | | | | 11.63 | | | | | 14.36 | | | | | 597 | | | | | 1.29 | | | | | 1.67 | | | | | (1.18 | ) | | | | 33 | (e) |
Class Y | |
Year ended 10/31/14 | | | | 12.99 | | | | | (0.11 | ) | | | | 0.54 | | | | | 0.43 | | | | | — | | | | | (0.91 | ) | | | | (0.91 | ) | | | | 12.51 | | | | | 3.81 | | | | | 3,699,738 | | | | | 0.95 | (d) | | | | 0.99 | (d) | | | | (0.91 | )(d) | | | | 72 | |
Year ended 10/31/13 | | | | 12.97 | | | | | (0.10 | ) | | | | 0.78 | | | | | 0.68 | | | | | (0.31 | ) | | | | (0.35 | ) | | | | (0.66 | ) | | | | 12.99 | | | | | 5.42 | | | | | 4,846,950 | | | | | 0.89 | | | | | 0.96 | | | | | (0.82 | ) | | | | 0 | |
Year ended 10/31/12 | | | | 12.07 | | | | | (0.10 | ) | | | | 1.47 | | | | | 1.37 | | | | | (0.35 | ) | | | | (0.12 | ) | | | | (0.47 | ) | | | | 12.97 | | | | | 11.69 | | | | | 3,901,165 | | | | | 0.85 | | | | | 0.97 | | | | | (0.75 | ) | | | | 282 | |
Year ended 10/31/11 | | | | 11.71 | | | | | (0.08 | ) | | | | 1.11 | | | | | 1.03 | | | | | (0.47 | ) | | | | (0.20 | ) | | | | (0.67 | ) | | | | 12.07 | | | | | 9.45 | | | | | 553,001 | | | | | 0.79 | | | | | 1.06 | | | | | (0.70 | ) | | | | 163 | (e) |
Year ended 10/31/10 | | | | 10.73 | | | | | (0.08 | ) | | | | 1.61 | | | | | 1.53 | | | | | (0.21 | ) | | | | (0.34 | ) | | | | (0.55 | ) | | | | 11.71 | | | | | 14.97 | | | | | 64,428 | | | | | 0.79 | | | | | 1.17 | | | | | (0.68 | ) | | | | 33 | (e) |
Class R5 | |
Year ended 10/31/14 | | | | 12.99 | | | | | (0.11 | ) | | | | 0.54 | | | | | 0.43 | | | | | — | | | | | (0.91 | ) | | | | (0.91 | ) | | | | 12.51 | | | | | 3.81 | | | | | 186,943 | | | | | 0.93 | (d) | | | | 0.97 | (d) | | | | (0.89 | )(d) | | | | 72 | |
Year ended 10/31/13 | | | | 12.97 | | | | | (0.10 | ) | | | | 0.78 | | | | | 0.68 | | | | | (0.31 | ) | | | | (0.35 | ) | | | | (0.66 | ) | | | | 12.99 | | | | | 5.45 | | | | | 206,573 | | | | | 0.86 | | | | | 0.93 | | | | | (0.79 | ) | | | | 0 | |
Year ended 10/31/12 | | | | 12.07 | | | | | (0.08 | ) | | | | 1.45 | | | | | 1.37 | | | | | (0.35 | ) | | | | (0.12 | ) | | | | (0.47 | ) | | | | 12.97 | | | | | 11.69 | | | | | 164,371 | | | | | 0.79 | | | | | 0.90 | | | | | (0.69 | ) | | | | 282 | |
Year ended 10/31/11 | | | | 11.72 | | | | | (0.08 | ) | | | | 1.11 | | | | | 1.03 | | | | | (0.48 | ) | | | | (0.20 | ) | | | | (0.68 | ) | | | | 12.07 | | | | | 9.36 | | | | | 449,380 | | | | | 0.79 | | | | | 0.97 | | | | | (0.70 | ) | | | | 163 | (e) |
Year ended 10/31/10 | | | | 10.73 | | | | | (0.08 | ) | | | | 1.62 | | | | | 1.54 | | | | | (0.21 | ) | | | | (0.34 | ) | | | | (0.55 | ) | | | | 11.72 | | | | | 15.06 | | | | | 467,441 | | | | | 0.79 | | | | | 1.04 | | | | | (0.68 | ) | | | | 33 | (e) |
Class R6 | |
Year ended 10/31/14 | | | | 12.99 | | | | | (0.10 | ) | | | | 0.55 | | | | | 0.45 | | | | | — | | | | | (0.91 | ) | | | | (0.91 | ) | | | | 12.53 | | | | | 3.97 | | | | | 480,626 | | | | | 0.83 | (d) | | | | 0.87 | (d) | | | | (0.79 | )(d) | | | | 72 | |
Year ended 10/31/13 | | | | 12.97 | | | | | (0.09 | ) | | | | 0.77 | | | | | 0.68 | | | | | (0.31 | ) | | | | (0.35 | ) | | | | (0.66 | ) | | | | 12.99 | | | | | 5.48 | | | | | 521,099 | | | | | 0.79 | | | | | 0.86 | | | | | (0.72 | ) | | | | 0 | |
Year ended 10/31/12(f) | | | | 13.13 | | | | | (0.01 | ) | | | | (0.15 | ) | | | | (0.16 | ) | | | | — | | | | | — | | | | | — | | | | | 12.97 | | | | | (3.14 | ) | | | | 554,557 | | | | | 0.76 | (g) | | | | 0.85 | (g) | | | | (0.66 | )(g) | | | | 282 | |
| (a) | Calculated using average shares outstanding. |
| (b) | Includes adjustments in accordance with accounting principles generally accepted in the United States of America and as such, the net asset value for financial reporting purposes and the returns based upon those net asset values may differ from the net asset value and returns for shareholder transactions. Does not include sales charges and is not annualized for periods less than one year, if applicable. |
| (c) | Portfolio turnover is calculated at the fund level and is not annualized for periods less than one year, if applicable. |
| (d) | Ratios are based on average daily net assets (000’s omitted) of $3,423,916, $25,616, $2,120,111, $27,956, $3,816,444, $192,465 and $494,197 for Class A, Class B, Class C, Class R, Class Y, Class R5 and Class R6 shares, respectively. |
| (e) | Subsequent to issuance of its October 31, 2011 financial statements, the Fund revised the calculation of portfolio turnover as reflected in the financial highlights above. |
| (f) | Commencement date of September 24, 2012 for Class R6 shares. |
25 Invesco Balanced-Risk Allocation Fund
Report of Independent Registered Public Accounting Firm
To the Board of Trustees of AIM Investment Funds (Invesco Investment Funds)
and Shareholders of Invesco Balanced-Risk Allocation Fund:
In our opinion, the accompanying consolidated statement of assets and liabilities, including the consolidated schedule of investments, and the related consolidated statements of operations and of changes in net assets and the financial highlights present fairly, in all material respects, the consolidated financial position of Invesco Balanced-Risk Allocation Fund (one of the funds constituting AIM Investment Funds (Invesco Investment Funds), hereafter referred to as the “Fund”) at October 31, 2014, the results of its operations for the year then ended, the changes in its net assets for each of the two years in the period then ended and the financial highlights for each period indicated, in conformity with accounting principles generally accepted in the United States of America. These consolidated financial statements and financial highlights (hereafter referred to as “financial statements”) are the responsibility of the Fund’s management. Our responsibility is to express an opinion on these financial statements based on our audits. We conducted our audits of these financial statements in accordance with the standards of the Public Company Accounting Oversight Board (United States). Those standards require that we plan and perform the audit to obtain reasonable assurance about whether the financial statements are free of material misstatement. An audit includes examining, on a test basis, evidence supporting the amounts and disclosures in the financial statements, assessing the accounting principles used and significant estimates made by management, and evaluating the overall financial statement presentation. We believe that our audits, which included confirmation of securities at October 31, 2014 by correspondence with the custodian and brokers, and the application of alternative auditing procedures where confirmations of security purchases have not been received, provide a reasonable basis for our opinion.
PRICEWATERHOUSECOOPERS LLP
December 29, 2014
Houston, Texas
26 Invesco Balanced-Risk Allocation Fund
Calculating your ongoing Fund expenses
Example
As a shareholder of the Fund, you incur two types of costs: (1) transaction costs, which may include sales charges (loads) on purchase payments or contingent deferred sales charges on redemptions, if any; and (2) ongoing costs, including distribution and/or service (12b-1) fees, and other Fund expenses. This example is intended to help you understand your ongoing costs (in dollars) of investing in the Fund and to compare these costs with ongoing costs of investing in other mutual funds. The example is based on an investment of $1,000 invested at the beginning of the period and held for the entire period May 1, 2014, through October 31, 2014.
In addition to the fees and expenses which the Fund bears directly, the Fund indirectly bears a pro rata share of the fees and expenses of the underlying funds in which your Fund invests. The amount of fees and expenses incurred indirectly by your Fund will vary because the underlying funds have varied expenses and fee levels and the Fund may own different proportions of the underlying funds at different times. Estimated underlying fund expenses are not expenses that are incurred directly by your Fund. They are expenses that are incurred directly by the underlying funds and are deducted from the value of the underlying funds your Fund invests in. The effect of the estimated underlying fund expenses that you bear indirectly are included in your Fund’s total return.
Actual expenses
The table below provides information about actual account values and actual expenses. You may use the information in this table, together with the amount you invested, to estimate the expenses that you paid over the period. Simply divide your account value by $1,000 (for example, an $8,600 account value divided by $1,000 = 8.6), then multiply the result by the number in the table under the heading entitled “Actual Expenses Paid During Period” to estimate the expenses you paid on your account during this period.
Hypothetical example for comparison purposes
The table below also provides information about hypothetical account values and hypothetical expenses based on the Fund’s actual expense ratio and an assumed rate of return of 5% per year before expenses, which is not the Fund’s actual return.
The hypothetical account values and expenses may not be used to estimate the actual ending account balance or expenses you paid for the period. You may use this information to compare the ongoing costs of investing in the Fund and other funds. To do so, compare this 5% hypothetical example with the 5% hypothetical examples that appear in the shareholder reports of the other funds.
Please note that the expenses shown in the table are meant to highlight your ongoing costs only and do not reflect any transaction costs, such as sales charges (loads) on purchase payments or contingent deferred sales charges on redemptions, if any. Therefore, the hypothetical information is useful in comparing ongoing costs only, and will not help you determine the relative total costs of owning different funds. In addition, expenses shown in the table do not include the expenses of the underlying funds, which are borne indirectly by the Fund. If transaction costs and indirect expenses were included, your costs would have been higher.
| | | | | | | | | | | | | | | | | | | | | | | | |
| Class | | Beginning
Account Value
(05/01/14) | | | ACTUAL | | | HYPOTHETICAL (5% annual return before
expenses) | | | Annualized
Expense
Ratio | |
| | | Ending
Account Value
(10/31/14)1 | | | Expenses
Paid During
Period2 | | | Ending
Account Value
(10/31/14) | | | Expenses
Paid During
Period2 | | |
| A | | $ | 1,000.00 | | | $ | 1,024.90 | | | $ | 6.18 | | | $ | 1,019.11 | | | $ | 6.16 | | | | 1.21 | % |
| B | | | 1,000.00 | | | | 1,021.40 | | | | 9.99 | | | | 1,015.32 | | | | 9.96 | | | | 1.96 | |
| C | | | 1,000.00 | | | | 1,020.60 | | | | 9.98 | | | | 1,015.32 | | | | 9.96 | | | | 1.96 | |
| R | | | 1,000.00 | | | | 1,023.50 | | | | 7.45 | | | | 1,017.85 | | | | 7.43 | | | | 1.46 | |
| Y | | | 1,000.00 | | | | 1,026.20 | | | | 4.90 | | | | 1,020.37 | | | | 4.89 | | | | 0.96 | |
| R5 | | | 1,000.00 | | | | 1,026.20 | | | | 4.75 | | | | 1,020.52 | | | | 4.74 | | | | 0.93 | |
| R6 | | | 1,000.00 | | | | 1,027.00 | | | | 4.29 | | | | 1,020.97 | | | | 4.28 | | | | 0.84 | |
| 1 | The actual ending account value is based on the actual total return of the Fund for the period May 1, 2014 through October 31, 2014, after actual expenses and will differ from the hypothetical ending account value which is based on the Fund’s expense ratio and a hypothetical annual return of 5% before expenses. |
| 2 | Expenses are equal to the Fund’s annualized expense ratio as indicated above multiplied by the average account value over the period, multiplied by 184/365 to reflect the most recent fiscal half year. |
27 Invesco Balanced-Risk Allocation Fund
Approval of Investment Advisory and Sub-Advisory Contracts
The Board of Trustees (the Board) of AIM Investment Funds (Invesco Investment Funds) Series is required under the Investment Company Act of 1940, as amended, to approve annually the renewal of Invesco Balanced-Risk Allocation Fund’s (the Fund) investment advisory agreements. During contract renewal meetings held on June 16-17, 2014, the Board as a whole, and the disinterested or “independent” Trustees, who comprise over 75% of the Board, voting separately, approved the continuance for the Fund of the Master Investment Advisory Agreement with Invesco Advisers, Inc. (Invesco Advisers and the investment advisory agreement) and the Master Intergroup Sub-Advisory Contract for Mutual Funds with Invesco Asset Management Deutschland GmbH, Invesco Asset Management Limited, Invesco Asset Management (Japan) Limited, Invesco Australia Limited, Invesco Hong Kong Limited, Invesco Senior Secured Management, Inc. and Invesco Canada Ltd. (collectively, the Affiliated Sub-Advisers and the sub-advisory contracts) for another year, effective July 1, 2014.
In evaluating the fairness and reasonableness of compensation under the Fund’s investment advisory agreement and sub-advisory contracts, the Board considered, among other things, the factors discussed below. The Board determined that continuation of the Fund’s investment advisory agreement and the sub-advisory contracts are in the best interest of the Fund and its shareholders and that the compensation payable to Invesco Advisers and the Affiliated Sub-Advisers under the agreements is fair and reasonable.
The Board’s Fund Evaluation Process
The Board’s Investments Committee has established three Sub-Committees, each of which is primarily responsible for overseeing the management of a number of the funds advised by Invesco Advisers (the Invesco Funds). The Sub-Committees meet throughout the year to review the performance of their assigned Invesco Funds, including reviewing materials prepared under the direction of the independent Senior Officer, an officer of the Invesco Funds who reports directly to the independent Trustees. Over the course of each year, the Sub-Committees meet with portfolio managers for their assigned Invesco Funds and other members of management to review the performance, investment objective(s), policies, strategies, limitations and investment risks of these funds. The Sub-Committees meet regularly and at designated contract renewal meetings each year to conduct a review of the performance, fees, expenses, and other matters related to their assigned Invesco Funds. Each Sub-Committee recommends to the Investments Committee, which in turn recommends to the full Board, whether and on what terms to approve the continuance of each Invesco Fund’s investment advisory agreement and sub-advisory contracts for another year.
During the contract renewal process, the Trustees receive comparative performance and fee data regarding the Invesco Funds prepared by Invesco Advisers and Lipper Inc. (Lipper), an independent provider of investment company data. The Trustees also receive an independent written evaluation from the Senior Officer. The Senior Officer’s evaluation is prepared as part of his responsibility to manage the process by which the Invesco Funds’ proposed management fees are negotiated during the annual contract renewal process to ensure they are negotiated in a manner that is at arms’ length and reasonable. In addition to meetings with Invesco Advisers and fund counsel, the independent Trustees also discuss the continuance of the investment advisory agreement and sub-advisory contracts in separate sessions with the Senior Officer and with independent legal counsel.
The Trustees recognized that the advisory fee rates for the Invesco Funds are, in many cases, the result of years of review and negotiation. The Trustees’ deliberations and conclusions in a particular year may be based in part on their deliberations and conclusions regarding these same arrangements throughout the year and in prior years. The Trustees’ review and conclusions are based on the comprehensive consideration of all information presented to them and are not the result of any single determinative factor. Moreover, one Trustee may have weighed a particular piece of information or factor differently than another Trustee.
The discussion below serves as the Senior Officer’s independent written evaluation with respect to the Fund’s investment advisory agreement as well as a discussion of the material factors and related conclusions that formed the basis for the Board’s approval of the Fund’s investment advisory agreement and sub-advisory contracts. Unless otherwise stated, this information is current as of June 17, 2014, and may not reflect consideration of factors that became known to the Board after that date.
Factors and Conclusions and Summary of Independent Written Fee Evaluation
| A. | Nature, Extent and Quality of Services Provided by Invesco Advisers and the Affiliated Sub-Advisers |
The Board reviewed the advisory services provided to the Fund by Invesco Advisers under the Fund’s investment advisory agreement, the performance of Invesco Advisers in providing these services, and the credentials and experience of the officers and employees of Invesco Advisers who provide these services, including the Fund’s portfolio manager or managers, with whom the Sub-Committees met during the year. The Board’s review of the qualifications of Invesco Advisers to provide advisory services included the Board’s consideration of Invesco Advisers’ investment process oversight, independent credit analysis
and investment risk management. The Board also considered non-advisory services that Invesco Advisers and its affiliates provide to the Invesco Funds such as various back office support functions, equity and fixed income trading operations, internal audit, distribution and legal and compliance.
In determining whether to continue the Fund’s investment advisory agreement, the Board considered the benefits of reapproving an existing relationship and the greater uncertainty that may be associated with entering into a new relationship. The Board concluded that the nature, extent and quality of the services provided to the Fund by Invesco Advisers are appropriate and satisfactory and consistent with the terms of the Fund’s investment advisory agreement.
The Board reviewed the services that may be provided by the Affiliated Sub-Advisers under the sub-advisory contracts and the credentials and experience of the officers and employees of the Affiliated Sub-Advisers who provide these services. The Board noted that the Affiliated Sub-Advisers have offices and personnel that are located in financial centers around the world. As a result, the Affiliated Sub-Advisers can provide research and investment analysis on the markets and economies of various countries in which the Fund may invest, make recommendations regarding securities and assist with security trades. The Board concluded that the sub-advisory contracts benefit the Fund and its shareholders by permitting Invesco Advisers to use the resources and talents of the Affiliated Sub-Advisers in managing the Fund. The Board concluded that the nature, extent and quality of the services that may be provided by the Affiliated Sub-Advisers are appropriate and satisfactory and consistent with the terms of the Fund’s sub-advisory contracts.
The Board considered Fund performance as a relevant factor in considering whether to approve the investment advisory agreement. The Board did not view Fund performance as a relevant factor in considering whether to approve the sub-advisory contracts for the Fund, as no Affiliated Sub-Adviser currently manages assets of the Fund.
The Board noted that comparative performance data for only the past four calendar years was available. The Board compared the Fund’s performance during the past one, three and four calendar years to the performance of funds in the Lipper performance universe and against the Lipper Global Flexible Funds Index. The Board noted that performance of Class A shares of the Fund was in the fourth quintile of its performance universe for the one year period and the second quintile for the three and four year periods (the first quintile being the best performing funds and the fifth quintile being the worst performing funds). The Board noted that
28 Invesco Balanced-Risk Allocation Fund
performance of Class A shares of the Fund was below the performance of the Index for the one year period and above the performance of the Index for the three and four year periods. Invesco Advisers noted that being underweight equities and overweight commodities versus the Fund’s Lipper peers affected performance. The Trustees also reviewed more recent Fund performance and this review did not change their conclusions.
| C. | Advisory and Sub-Advisory Fees |
The Board compared the Fund’s contractual management fee rate to the contractual management fee rates of funds in the Fund’s Lipper expense group at a common asset level. The Board noted that the contractual management fee rate for Class A shares of the Fund was above the median contractual management fee rate of funds in the expense group. The Board noted that the term “contractual management fee” may include both advisory and certain administrative services fees, but that Lipper does not provide information on a fund by fund basis as to what is included. The Board noted that Invesco Advisers does not charge the Invesco Funds for the administrative services included in the term as defined by Lipper. The Board also reviewed the methodology used by Lipper in providing expense group information, which includes using each fund’s contractual management fee schedule (including any applicable breakpoints) as reported in the most recent prospectus or statement of additional information for each fund in the expense group.
The Board noted that Invesco Advisers has contractually agreed to waive fees and/or limit expenses of the Fund through at least June 30, 2015 in an amount necessary to limit total annual operating expenses to a specified percentage of average daily net assets for each class of the Fund.
The Board compared the Fund’s effective advisory fee rate (the advisory fee rate after advisory fee waivers and before other expense limitations/waivers) to the effective advisory fee rates of other mutual funds advised by Invesco Advisers and its affiliates that are managed using an investment process substantially similar to the investment process used for the Fund. The Board noted that the effective advisory fee rate of the Fund was lower than the effective advisory fee rate of two mutual funds and two off-shore funds advised by Invesco Advisers and higher than the effective advisory fee rate of two off-shore funds advised by Invesco Advisers and higher than the sub-adviser effective fee rate of a mutual fund sub-advised by Invesco Advisers managed using a similar investment process.
The Board also considered the fees charged by Invesco Advisers and the Affiliated Sub-Advisers to other client accounts that are managed using an investment process substantially similar to the investment process used for the Fund. The Board noted that Invesco Advisers or the Affiliated Sub-Advisers may charge lower fees to large institutional clients. Invesco Advisers reviewed with the Board the significantly greater
scope of services it provides to the Invesco Funds relative to certain other client accounts. These additional services include provision of administrative services, officers and office space, oversight of service providers, preparation of annual registration statement updates and financial information and regulatory compliance under the Investment Company Act of 1940, as amended. Invesco Advisers also reviewed generally the higher frequency of shareholder purchases and redemptions in the Invesco Funds relative to the flow of assets for other client accounts. Invesco Advisers advised the Board that advance notice of redemptions is often provided to Invesco Advisers by institutional clients. The Board did note that sub-advisory fee rates charged by the Affiliated Sub-Advisers to manage the Invesco Funds and to manage other client accounts tended to be more comparable, reflecting a more comparable scope of services. The Board concluded that the aggregate services provided to the Invesco Funds were sufficiently different from those provided to institutional clients to support the difference in fees.
The Board also considered the services that may be provided by the Affiliated Sub-Advisers pursuant to the sub-advisory contracts, as well as the fees payable by Invesco Advisers to the Affiliated Sub-Advisers pursuant to the sub-advisory contracts. The Board also noted that the sub-advisory fees are not paid directly by the Fund, but rather, are payable by Invesco Advisers to the Affiliated Sub-Advisers.
| D. | Economies of Scale and Breakpoints |
The Board considered the extent to which there are economies of scale in the provision of advisory services to the Fund. The Board also considered whether the Fund benefits from economies of scale through contractual breakpoints in the Fund’s advisory fee schedule and was assisted in this review by a report from the Senior Officer. The Board also noted that the Fund shares directly in economies of scale through lower fees charged by third party service providers based on the combined size of the Invesco Funds and other clients advised by Invesco Advisers.
| E. | Profitability and Financial Resources |
The Board reviewed information from Invesco Advisers concerning the costs of the advisory and other services that Invesco Advisers and its affiliates provide to the Fund and the profitability of Invesco Advisers and its affiliates in providing these services for the year ended December 31, 2013. The Board received information from Invesco Advisers about the methodology used to prepare the profitability information. The Board considered the profitability of Invesco Advisers in managing the Fund and the Invesco Funds. The Board noted that Invesco Advisers continues to operate at a net profit from services Invesco Advisers and its subsidiaries provide to the Invesco Funds and the Fund. The Board did not deem the level of profits realized by Invesco Advisers and its affiliates from providing services to the Fund to be excessive given the nature, quality and extent of
the services provided to the Invesco Funds. The Board received and accepted information from Invesco Advisers demonstrating that Invesco Advisers and each Affiliated Sub-Adviser are financially sound and have the resources necessary to perform their obligations under the investment advisory agreement and sub-advisory contracts.
| F. | Collateral Benefits to Invesco Advisers and its Affiliates |
The Board considered various other benefits received by Invesco Advisers and its affiliates from the relationship with the Fund, including the fees received for their provision of transfer agency and distribution services to the Fund. The Board considered comparative information regarding fees charged for these services, including information provided by Lipper and other independent sources. The Board considered the performance of Invesco Advisers and its affiliates in providing these services and the organizational structure employed to provide these services. The Board also considered that these services are provided to the Fund pursuant to written contracts that are reviewed and approved on an annual basis by the Board; that the services are required for the operation of the Fund; that Invesco Advisers and its affiliates can provide services, the nature and quality of which are at least equal to those provided by others offering the same or similar services; and that the fees for such services are fair and reasonable in light of the usual and customary charges by others for services of the same nature and quality.
The Board considered the benefits realized by Invesco Advisers and the Affiliated Sub-Advisers as a result of portfolio brokerage transactions executed through “soft dollar” arrangements. Invesco Advisers noted that the Fund does not execute brokerage transaction through “soft dollar” arrangements to any significant degree.
The Board considered that the Fund’s uninvested cash and cash collateral from any securities lending arrangements may be invested in money market funds advised by Invesco Advisers pursuant to procedures approved by the Board. The Board noted that Invesco Advisers receives advisory fees from these affiliated money market funds attributable to such investments, although Invesco Advisers has contractually agreed to waive through varying periods the advisory fees payable by the Invesco Funds with respect to investments in the affiliated money market funds. The waiver is in an amount equal to 100% of the net advisory fee Invesco Advisers receives from the affiliated money market funds with respect to the Fund’s investment in the affiliated money market funds of uninvested cash, but not cash collateral. The Board concluded that the amount of advisory fees received by Invesco Advisors from the Fund’s investment of uninvested cash and cash collateral from any securities lending arrangements in the affiliated money market funds are fair and reasonable.
29 Invesco Balanced-Risk Allocation Fund
Tax Information
Form 1099-DIV, Form 1042-S and other year-end tax information provide shareholders with actual calendar year amounts that should be included in their tax returns. Shareholders should consult their tax advisors.
The following distribution information is being provided as required by the Internal Revenue Code or to meet a specific state’s requirement.
The Fund designates the following amounts or, if subsequently determined to be different, the maximum amount allowable for its fiscal year ended October 31, 2014:
| | | | |
Federal and State Income Tax | |
Long-Term Capital Gain Distributions | | $ | 365,324,994 | |
Qualified Dividend Income* | | | 0.00 | % |
Corporate Dividends Received Deduction* | | | 0.00 | % |
U.S. Treasury Obligations* | | | 17.32 | % |
| | * | The above percentages are based on ordinary income dividends paid to shareholders during the Fund’s fiscal year. |
| | | | |
Non-Resident Alien Shareholders | |
Qualified Short-Term Gains | | $ | 472,187,821 | |
30 Invesco Balanced-Risk Allocation Fund
Trustees and Officers
The address of each trustee and officer is AIM Investment Funds (Invesco Investment Funds) (the “Trust”), 11 Greenway Plaza, Suite 1000, Houston, Texas 77046-1173. The trustees serve for the life of the Trust, subject to their earlier death, incapacitation, resignation, retirement or removal as more specifically provided in the Trust’s organizational documents. Each officer serves for a one year term or until their successors are elected and qualified. Column two below includes length of time served with predecessor entities, if any.
| | | | | | | | |
Name, Year of Birth and Position(s) Held with the Trust | | Trustee and/
or Officer Since | | Principal Occupation(s) During Past 5 Years | | Number of Funds in Fund Complex Overseen by Trustee | | Other Directorship(s) Held by Trustee During Past 5 Years |
| Interested Persons | | | | | | | | |
| Martin L. Flanagan1 — 1960 Trustee | | 2007 | | Executive Director, Chief Executive Officer and President, Invesco Ltd. (ultimate parent of Invesco and a global investment management firm); Advisor to the Board, Invesco Advisers, Inc. (formerly known as Invesco Institutional (N.A.), Inc.); Trustee, The Invesco Funds; Vice Chair, Investment Company Institute; and Member of Executive Board, SMU Cox School of Business Formerly: Chairman and Chief Executive Officer, Invesco Advisers, Inc. (registered investment adviser); Director, Chairman, Chief Executive Officer and President, IVZ Inc. (holding company), INVESCO Group Services, Inc. (service provider) and Invesco North American Holdings, Inc. (holding company); Director, Chief Executive Officer and President, Invesco Holding Company Limited (parent of Invesco and a global investment management firm); Director, Invesco Ltd.; Chairman, Investment Company Institute and President, Co-Chief Executive Officer, Co-President, Chief Operating Officer and Chief Financial Officer, Franklin Resources, Inc. (global investment management organization). | | 144 | | None |
Philip A. Taylor2 — 1954 Trustee, President and Principal Executive Officer | | 2006 | | Head of North American Retail and Senior Managing Director, Invesco Ltd.; Director, Co-Chairman, Co-President and Co-Chief Executive Officer, Invesco Advisers, Inc. (formerly known as Invesco Institutional (N.A.), Inc.) (registered investment adviser); Director, Chairman, Chief Executive Officer and President, Invesco Management Group, Inc. (formerly known as Invesco Aim Management Group, Inc.) (financial services holding company); Director and President, INVESCO Funds Group, Inc. (registered investment adviser and registered transfer agent); Director and Chairman, Invesco Investment Services, Inc. (formerly known as Invesco Aim Investment Services, Inc.) (registered transfer agent) and IVZ Distributors, Inc. (formerly known as INVESCO Distributors, Inc.) (registered broker dealer); Director, President and Chairman, Invesco Inc. (holding company) and Invesco Canada Holdings Inc. (holding company); Chief Executive Officer, Invesco Corporate Class Inc. (corporate mutual fund company) and Invesco Canada Fund Inc. (corporate mutual fund company); Director, Chairman and Chief Executive Officer, Invesco Canada Ltd. (formerly known as Invesco Trimark Ltd./Invesco Trimark Ltèe) (registered investment adviser and registered transfer agent); Trustee, President and Principal Executive Officer, The Invesco Funds (other than AIM Treasurer’s Series Trust (Invesco Treasurer’s Series Trust) and Short-Term Investments Trust); Trustee and Executive Vice President, The Invesco Funds (AIM Treasurer’s Series Trust (Invesco Treasurer’s Series Trust) and Short-Term Investments Trust only); Director, Invesco Investment Advisers LLC (formerly known as Van Kampen Asset Management); Director, Chief Executive Officer and President, Van Kampen Exchange Corp. Formerly: Director and Chairman, Van Kampen Investor Services Inc.; Director, Chief Executive Officer and President, 1371 Preferred Inc. (holding company) and Van Kampen Investments Inc.; Director and President, AIM GP Canada Inc. (general partner for limited partnerships) and Van Kampen Advisors, Inc.; Director and Chief Executive Officer, Invesco Trimark Dealer Inc. (registered broker dealer); Director, Invesco Distributors, Inc. (formerly known as Invesco Aim Distributors, Inc.) (registered broker dealer); Manager, Invesco PowerShares Capital Management LLC; Director, Chief Executive Officer and President, Invesco Advisers, Inc.; Director, Chairman, Chief Executive Officer and President, Invesco Aim Capital Management, Inc.; President, Invesco Trimark Dealer Inc. and Invesco Trimark Ltd./Invesco Trimark Ltèe; Director and President, AIM Trimark Corporate Class Inc. and AIM Trimark Canada Fund Inc.; Senior Managing Director, Invesco Holding Company Limited; Director and Chairman, Fund Management Company (former registered broker dealer); President and Principal Executive Officer, The Invesco Funds (AIM Treasurer’s Series Trust (Invesco Treasurer’s Series Trust), and Short-Term Investments Trust only); President, AIM Trimark Global Fund Inc. and AIM Trimark Canada Fund Inc. | | 144 | | None |
Wayne W. Whalen3 — 1939 Trustee | | 2010 | | Of Counsel, and prior to 2010, partner in the law firm of Skadden, Arps, Slate, Meagher & Flom LLP, legal counsel to certain funds in the Fund Complex | | 144 | | Director of the Mutual fund Directors Forum, a nonprofit membership organization for investment directors; Chairman and Director of the Abraham Lincoln Presidential Library Foundation; and Director of the Stevenson Center for Democracy |
| 1 | Mr. Flanagan is considered an interested person (within the meaning of Section 2(a)(19) of the 1940 Act) of the Trust because he is an officer of the Adviser to the Trust, and an officer and a director of Invesco Ltd., ultimate parent of the Adviser. |
| 2 | Mr. Taylor is considered an interested person (within the meaning of Section 2(a)(19) of the 1940 Act) of the Trust because he is an officer and a director of the Adviser. |
| 3 | Mr. Whalen is retiring effective December 31, 2014. He has been deemed to be an interested person of the Trust because of his prior service as counsel to the predecessor funds of certain Invesco open-end funds and his affiliation with the law firm that served as counsel to such predecessor funds and the Invesco closed-end funds. |
T-1 Invesco Balanced-Risk Allocation Fund
Trustees and Officers—(continued)
| | | | | | | | |
Name, Year of Birth and Position(s) Held with the Trust | | Trustee and/
or Officer Since | | Principal Occupation(s) During Past 5 Years | | Number of Funds in Fund Complex Overseen by Trustee | | Other Directorship(s) Held by Trustee During Past 5 Years |
| Independent Trustees | | | | | | | | |
Bruce L. Crockett — 1944 Trustee and Chair | | 2001 | | Chairman, Crockett Technologies Associates (technology consulting company) Formerly: Director, Captaris (unified messaging provider); Director, President and Chief Executive Officer, COMSAT Corporation; Chairman, Board of Governors of INTELSAT (international communications company); ACE Limited (insurance company); and Investment Company Institute | | 144 | | ALPS (Attorneys Liability Protection Society) (insurance company) |
David C. Arch — 1945 Trustee | | 2010 | | Chairman of Blistex Inc., a consumer health care products manufacturer | | 144 | | Board member of the Illinois Manufacturers’ Association; Member of the Board of Visitors, Institute for the Humanities, University of Michigan; Member of the Audit Committee of the Edward-Elmhurst Hospital |
Frank S. Bayley — 1939 Trustee | | 1987 | | Retired. Formerly: Director, Badgley Funds Inc. (registered investment company) (2 portfolios) and General Partner and Of Counsel, law firm of Baker & McKenzie, LLP | | 144 | | Director and Chairman, C.D. Stimson Company (a real estate investment company); Trustee, The Curtis Institute of Music |
James T. Bunch — 1942 Trustee | | 2003 | | Managing Member, Grumman Hill Group LLC (family office private equity investments) Formerly: Founder, Green Manning & Bunch Ltd. (investment banking firm) (1988-2010); Executive Committee, United States Golf Association; and Director, Policy Studies, Inc. and Van Gilder Insurance Corporation | | 144 | | Chairman, Board of Governors, Western Golf Association; Chairman, Evans Scholars Foundation; and Director, Denver Film Society |
Rodney F. Dammeyer — 1940 Trustee | | 2010 | | Chairman of CAC,LLC, (private company offering capital investment and management advisory services) Formerly: Prior to 2001, Managing Partner at Equity Group Corporate Investments; Prior to 1995, Chief Executive Officer of Itel Corporation (formerly Anixter International); Prior to 1985, experience includes Senior Vice President and Chief Financial Officer of Household International, Inc., Executive Vice President and Chief Financial Officer of Northwest Industries, Inc. and Partner of Arthur Andersen & Co.; From 1987 to 2010, Director/Trustee of investment companies in the Van Kampen Funds complex | | 144 | | Director of Quidel Corporation and Stericycle, Inc. |
Albert R. Dowden — 1941 Trustee | | 2001 | | Director of a number of public and private business corporations, including the Boss Group, Ltd. (private investment and management); Nature’s Sunshine Products, Inc. and Reich & Tang Funds (5 portfolios) (registered investment company) Formerly: Director, Homeowners of America Holding Corporation/Homeowners of America Insurance Company (property casualty company); Director, Continental Energy Services, LLC (oil and gas pipeline service); Director, CompuDyne Corporation (provider of product and services to the public security market) and Director, Annuity and Life Re (Holdings), Ltd. (reinsurance company); Director, President and Chief Executive Officer, Volvo Group North America, Inc.; Senior Vice President, AB Volvo; Director of various public and private corporations; Chairman, DHJ Media, Inc.; Director, Magellan Insurance Company; and Director, The Hertz Corporation, Genmar Corporation (boat manufacturer), National Media Corporation; Advisory Board of Rotary Power International (designer, manufacturer, and seller of rotary power engines); and Chairman, Cortland Trust, Inc. (registered investment company) | | 144 | | Director of: Nature’s Sunshine Products, Inc., Reich & Tang Funds, Homeowners of America Holding Corporation/ Homeowners of America Insurance Company, the Boss Group |
Jack M. Fields — 1952 Trustee | | 2001 | | Chief Executive Officer, Twenty First Century Group, Inc. (government affairs company); Owner and Chief Executive Officer, Dos Angeles Ranch, L.P. (cattle, hunting, corporate entertainment); and Discovery Global Education Fund (non-profit) Formerly: Chief Executive Officer, Texana Timber LP (sustainable forestry company); Director of Cross Timbers Quail Research Ranch (non-profit); and member of the U.S. House of Representatives | | 144 | | Insperity, Inc. (formerly known as Administaff) |
Prema Mathai-Davis — 1950 Trustee | | 2001 | | Retired. Formerly: Chief Executive Officer, YWCA of the U.S.A. | | 144 | | None |
Larry Soll — 1942 Trustee | | 2003 | | Retired. Formerly: Chairman, Chief Executive Officer and President, Synergen Corp. (a biotechnology company) | | 144 | | None |
Hugo F. Sonnenschein — 1940 Trustee | | 2010 | | President Emeritus and Honorary Trustee of the University of Chicago and the Adam Smith Distinguished Service Professor in the Department of Economics at the University of Chicago. Prior to 2000, President of the University of Chicago | | 144 | | Trustee of the University of Rochester and a member of its investment committee; Member of the National Academy of Sciences and the American Philosophical Society; Fellow of the American Academy of Arts and Sciences |
T-2 Invesco Balanced-Risk Allocation Fund
Trustees and Officers—(continued)
| | | | | | | | |
Name, Year of Birth and Position(s) Held with the Trust | | Trustee and/
or Officer Since | | Principal Occupation(s) During Past 5 Years | | Number of Funds in Fund Complex Overseen by Trustee | | Other Directorship(s) Held by Trustee During Past 5 Years |
| Independent Trustees—(continued) |
Raymond Stickel, Jr. — 1944 Trustee | | 2005 | | Retired. Formerly: Director, Mainstay VP Series Funds, Inc. (25 portfolios) and Partner, Deloitte & Touche | | 144 | | None |
Suzanne H. Woolsey — 1941 Trustee | | 2014 | | Chief Executive Officer of Woolsey Partners LLC | | 144 | | Emeritus Chair of the Board of Trustees of the Institute for Defense Analyses; Trustee of Colorado College; Trustee of California Institute of Technology; Prior to 2014, Director of Fluor Corp.; Prior to 2010, Trustee of the German Marshall Fund of the United States; Prior to 2010 Trustee of the Rocky Mountain Institute |
| Other Officers | | | | | | | | |
Russell C. Burk — 1958 Senior Vice President and Senior Officer | | 2005 | | Senior Vice President and Senior Officer, The Invesco Funds | | N/A | | N/A |
John M. Zerr — 1962 Senior Vice President, Chief Legal Officer and Secretary | | 2006 | | Director, Senior Vice President, Secretary and General Counsel, Invesco Management Group, Inc. (formerly known as Invesco Aim Management Group, Inc.) and Van Kampen Exchange Corp.; Senior Vice President, Invesco Advisers, Inc. (formerly known as Invesco Institutional (N.A.), Inc.) (registered investment adviser); Senior Vice President and Secretary, Invesco Distributors, Inc. (formerly known as Invesco Aim Distributors, Inc.); Director, Vice President and Secretary, Invesco Investment Services, Inc. (formerly known as Invesco Aim Investment Services, Inc.) and IVZ Distributors, Inc. (formerly known as INVESCO Distributors, Inc.); Director and Vice President, INVESCO Funds Group, Inc.; Senior Vice President, Chief Legal Officer and Secretary, The Invesco Funds; Manager, Invesco PowerShares Capital Management LLC; Director, Secretary and General Counsel, Invesco Investment Advisers LLC (formerly known as Van Kampen Asset Management); Secretary and General Counsel, Invesco Capital Markets, Inc. (formerly known as Van Kampen Funds Inc.) and Chief Legal Officer, PowerShares Exchange-Traded Fund Trust, PowerShares Exchange-Traded Fund Trust II, PowerShares India Exchange-Traded Fund Trust, PowerShares Actively Managed Exchange-Traded Fund Trust; and PowerShares Actively Managed Exchange-Traded Commodity Fund Trust Formerly: Director and Vice President, Van Kampen Advisors Inc.; Director, Vice President, Secretary and General Counsel, Van Kampen Investor Services Inc.; Director, Invesco Distributors, Inc. (formerly known as Invesco Aim Distributors, Inc.); Director, Senior Vice President, General Counsel and Secretary, Invesco Aim Advisers, Inc. and Van Kampen Investments Inc.; Director, Vice President and Secretary, Fund Management Company; Director, Senior Vice President, Secretary, General Counsel and Vice President, Invesco Aim Capital Management, Inc.; Chief Operating Officer and General Counsel, Liberty Ridge Capital, Inc. (an investment adviser); Vice President and Secretary, PBHG Funds (an investment company) and PBHG Insurance Series Fund (an investment company); Chief Operating Officer, General Counsel and Secretary, Old Mutual Investment Partners (a broker-dealer); General Counsel and Secretary, Old Mutual Fund Services (an administrator) and Old Mutual Shareholder Services (a shareholder servicing center); Executive Vice President, General Counsel and Secretary, Old Mutual Capital, Inc. (an investment adviser); and Vice President and Secretary, Old Mutual Advisors Funds (an investment company) | | N/A | | N/A |
Sheri Morris — 1964 Vice President, Treasurer and Principal Financial Officer | | 1999 | | Vice President, Treasurer and Principal Financial Officer, The Invesco Funds; Vice President, Invesco Advisers, Inc. (formerly known as Invesco Institutional (N.A.), Inc.) (registered investment adviser); and Vice President, PowerShares Exchange-Traded Fund Trust, PowerShares Exchange-Traded Fund Trust II, PowerShares India Exchange-Traded Fund Trust, PowerShares Actively Managed Exchange-Traded Fund Trust, and PowerShares Actively Managed Exchange-Traded Commodity Fund Trust Formerly: Vice President, Invesco Aim Advisers, Inc., Invesco Aim Capital Management, Inc. and Invesco Aim Private Asset Management, Inc.; Assistant Vice President and Assistant Treasurer, The Invesco Funds and Assistant Vice President, Invesco Advisers, Inc., Invesco Aim Capital Management, Inc. and Invesco Aim Private Asset Management, Inc.; and Treasurer, PowerShares Exchange-Traded Fund Trust, PowerShares Exchange-Traded Fund Trust II, PowerShares India Exchange-Traded Fund Trust and PowerShares Actively Managed Exchange-Traded Fund Trust | | N/A | | N/A |
T-3 Invesco Balanced-Risk Allocation Fund
Trustees and Officers—(continued)
| | | | | | | | |
Name, Year of Birth and Position(s) Held with the Trust | | Trustee and/
or Officer Since | | Principal Occupation(s) During Past 5 Years | | Number of Funds in Fund Complex Overseen by Trustee | | Other Directorship(s) Held by Trustee During Past 5 Years |
| Other Officers—(continued) | | | | | | | | |
Karen Dunn Kelley — 1960 Vice President | | 2004 | | Senior Managing Director, Investments; Director, Co-President, Co-Chief Executive Officer, and Co-Chairman, Invesco Advisers, Inc. (formerly known as Invesco Institutional (N.A.), Inc.) (registered investment adviser); Chairman, Invesco Senior Secured Management, Inc.; Senior Vice President, Invesco Management Group, Inc. (formerly known as Invesco Aim Management Group, Inc.); Executive Vice President, Invesco Distributors, Inc. (formerly known as Invesco Aim Distributors, Inc.); Director, Invesco Mortgage Capital Inc. and Invesco Management Company Limited; Director and President, INVESCO Asset Management (Bermuda) Ltd., Vice President, The Invesco Funds (other than AIM Treasurer’s Series Trust (Invesco Treasurer’s Series Trust) and Short-Term Investments Trust); and President and Principal Executive Officer, The Invesco Funds (AIM Treasurer’s Series Trust (Invesco Treasurer’s Series Trust) and Short-Term Investments Trust only) Formerly: Director, INVESCO Global Asset Management Limited and INVESCO Management S.A.; Senior Vice President, Van Kampen Investments Inc. and Invesco Advisers, Inc. (formerly known as Invesco Institutional (N.A.), Inc.) (registered investment adviser); Vice President, Invesco Advisers, Inc. (formerly known as Invesco Institutional (N.A.), Inc.); Director of Cash Management and Senior Vice President, Invesco Advisers, Inc. and Invesco Aim Capital Management, Inc.; Director and President, Fund Management Company; Chief Cash Management Officer, Director of Cash Management, Senior Vice President, and Managing Director, Invesco Aim Capital Management, Inc.; Director of Cash Management, Senior Vice President, and Vice President, Invesco Advisers, Inc. and The Invesco Funds (AIM Treasurer’s Series Trust (Invesco Treasurer’s Series Trust), and Short-Term Investments Trust only) | | N/A | | N/A |
Crissie M. Wisdom — 1969 Anti-Money Laundering Compliance Officer | | 2013 | | Anti-Money Laundering Compliance Officer, Invesco Advisers, Inc. (formerly known as Invesco Institutional (N.A.), Inc.) (registered investment adviser), Invesco Capital Markets, Inc. (formerly known as Van Kampen Funds Inc.), Invesco Distributors, Inc., Invesco Investment Services, Inc., Invesco Management Group, Inc., Van Kampen Exchange Corp., The Invesco Funds, and PowerShares Exchange-Traded Fund Trust, PowerShares Exchange-Traded Fund Trust II, PowerShares India Exchange-Traded Fund Trust, PowerShares Actively Managed Exchange-Traded Fund Trust and PowerShares Actively Managed Exchange-Traded Commodity Fund Trust; and Fraud Prevention Manager and Controls and Risk Analysis Manager for Invesco Investment Services, Inc. | | N/A | | N/A |
Todd L. Spillane — 1958 Chief Compliance Officer | | 2006 | | Senior Vice President, Invesco Management Group, Inc. (formerly known as Invesco Aim Management Group, Inc.) and Van Kampen Exchange Corp.; Senior Vice President and Chief Compliance Officer, Invesco Advisers, Inc. (registered investment adviser) (formerly known as Invesco Institutional (N.A.), Inc.); Chief Compliance Officer, The Invesco Funds; Vice President, Invesco Distributors, Inc. (formerly known as Invesco Aim Distributors, Inc.) and Invesco Investment Services, Inc. (formerly known as Invesco Aim Investment Services, Inc.) Formerly: Chief Compliance Officer, Invesco Funds (Chicago); Senior Vice President, Van Kampen Investments Inc.; Senior Vice President and Chief Compliance Officer, Invesco Aim Advisers, Inc. and Invesco Aim Capital Management, Inc.; Chief Compliance Officer, INVESCO Private Capital Investments, Inc. (holding company), Invesco Private Capital, Inc. (registered investment adviser), Invesco Global Asset Management (N.A.), Inc., Invesco Senior Secured Management, Inc. (registered investment adviser), Van Kampen Investor Services Inc., PowerShares Exchange-Traded Fund Trust, PowerShares Exchange-Traded Fund Trust II, PowerShares India Exchange-Traded Fund Trust and PowerShares Actively Managed Exchange-Traded Fund Trust; and Vice President, Invesco Aim Capital Management, Inc. and Fund Management Company | | N/A | | N/A |
The Statement of Additional Information of the Trust includes additional information about the Fund’s Trustees and is available upon request, without charge, by calling 1.800.959.4246. Please refer to the Fund’s prospectus for information on the Fund’s sub-advisers.
| | | | | | |
Office of the Fund 11 Greenway Plaza, Suite 1000 Houston, TX 77046-1173 | | Investment Adviser Invesco Advisers, Inc. 1555 Peachtree Street, N.E. Atlanta, GA 30309 | | Distributor Invesco Distributors, Inc. 11 Greenway Plaza, Suite 1000 Houston, TX 77046-1173 | | Auditors PricewaterhouseCoopers LLP 1000 Louisiana Street, Suite 5800 Houston, TX 77002-5678 |
| | | |
| | | | | | |
Counsel to the Fund Stradley Ronon Stevens & Young, LLP 2005 Market Street, Suite 2600 Philadelphia, PA 19103-7018 | | Counsel to the Independent Trustees Goodwin Procter LLP 901 New York Avenue, N.W. Washington, D.C. 20001 | | Transfer Agent Invesco Investment Services, Inc. 11 Greenway Plaza, Suite 1000 Houston, TX 77046-1173 | | Custodian State Street Bank and Trust Company 225 Franklin Street Boston, MA 02110-2801 |
T-4 Invesco Balanced-Risk Allocation Fund

Invesco mailing information
Send general correspondence to Invesco Investment Services, Inc., P.O. Box 219078, Kansas City, MO 64121-9078.
Important notice regarding delivery of security holder documents
To reduce Fund expenses, only one copy of most shareholder documents may be mailed to shareholders with multiple accounts at the same address (Householding). Mailing of your shareholder documents may be householded indefinitely unless you instruct us otherwise. If you do not want the mailing of these documents to be combined with those for other members of your household, please contact Invesco Investment Services, Inc. at 800 959 4246 or contact your financial institution. We will begin sending you individual copies for each account within 30 days after receiving your request.
Fund holdings and proxy voting information
The Fund provides a complete list of its holdings four times in each fiscal year, at the quarter ends. For the second and fourth quarters, the lists appear in the Fund’s semiannual and annual reports to shareholders. For the first and third quarters, the Fund files the lists with the Securities and Exchange Commission (SEC) on Form N-Q. The most recent list of portfolio holdings is available at invesco.com/completeqtrholdings. Shareholders can also look up the Fund’s Forms N-Q on the SEC website at sec.gov. Copies of the Fund’s Forms N-Q may be reviewed and copied at the SEC Public Reference Room in Washington, D.C. You can obtain information on the operation of the Public Reference Room, including information about duplicating fee charges, by calling 202 551 8090 or 800 732 0330, or by electronic request at the following email address: publicinfo@sec.gov. The SEC file numbers for the Fund are shown below.
A description of the policies and procedures that the Fund uses to determine how to vote proxies relating to portfolio securities is available without charge, upon request, from our Client Services department at 800 959 4246 or at invesco.com/proxyguidelines. The information is also available on the SEC website, sec.gov.
| | |
Information regarding how the Fund voted proxies related to its portfolio securities during the most recent 12-month period ended June 30 is available at invesco.com/proxysearch. The information is also available on the SEC website, sec.gov. Invesco Advisers, Inc. is an investment adviser; it provides investment advisory services to individual and institutional clients and does not sell securities. Invesco Distributors, Inc. is the US distributor for Invesco Ltd.’s retail mutual funds, exchange-traded funds and institutional money market funds. Both are wholly owned, indirect subsidiaries of Invesco Ltd. | |  |
| | | | |
| SEC file numbers: 811-05426 and 033-19338 | | IBRA-AR-1 | | Invesco Distributors, Inc. |
Letters to Shareholders
| | |

Philip Taylor | | Dear Shareholders: This annual report includes information about your Fund, including performance data and a complete list of its investments as of the close of the reporting period. Inside, your Fund’s portfolio managers discuss how they managed your Fund and the factors that affected its performance during the reporting period. I hope you find this report of interest. During the reporting period covered by this report, the US economy showed signs of continued improvement. After contracting in the first quarter of 2014, the economy expanded strongly in the second quarter and unemployment trended lower. Much of the credit for this improvement goes to the US Federal Reserve (the Fed), which undertook an extraordinary asset purchase program following the global financial crisis. The Fed’s goal was to jumpstart the economy by encouraging banks to lend more, businesses to hire more and consumers to spend more. Signs of a stronger US economy prompted the Fed to reduce, or “taper,” its |
asset purchase program. Despite this, interest rates remained near historical low levels due largely to heavy investor demand for bonds. While signs of economic improvement were evident in the US, European economies showed signs of weakening. That, together with geopolitical uncertainty and worries about the first diagnosed cases of Ebola outside of Africa, caused increased volatility in US and European equities.
Extended periods of market strength can lull investors into complacency – just as prolonged periods of market weakness or volatility can discourage investors from initiating long-term investment plans. That’s why Invesco has always encouraged investors to work with a professional financial adviser who can stress the importance of starting to save and invest early and the importance of adhering to a disciplined investment plan – when times are good and when they’re uncertain. A financial adviser who knows your unique financial situation, investment goals and risk tolerance can be an invaluable partner as you seek to achieve your financial goals. He or she can offer a long-term perspective when markets are volatile and time-tested advice and guidance when your financial situation or investment goals change.
Timely information when and where you want it
Invesco’s efforts to help investors achieve their financial objectives include providing individual investors and financial professionals with timely information about the markets, the economy and investing – whenever and wherever they want it.
Our website, invesco.com/us, offers a wide range of market insights and investment perspectives. On the website, you’ll find detailed information about our funds, including prices, performance, holdings and portfolio manager commentaries. You can access information about your individual Invesco account whenever it’s convenient for you; just complete a simple, secure online registration. Use the “Log In” box on our home page to get started.
Invesco’s mobile app for iPad® (available free from the App StoreSM) allows you to obtain the same detailed information about your Fund and the same investment insights from our investment leaders, market strategists, economists and retirement experts on the go. You also can watch portfolio manager videos and have instant access to Invesco news and updates wherever you may be.
In addition to the resources accessible on our website and through our mobile app, you can obtain timely updates to help you stay informed about the markets, the economy and investing by connecting with Invesco on Twitter, LinkedIn or Facebook. You can access our blog at blog.invesco.us.com. Our goal is to provide you the information you want, when and where you want it.
Have questions?
For questions about your account, feel free to contact an Invesco client services representative at 800 959 4246. For Invesco-related questions or comments, please email me directly at phil@invesco.com.
All of us at Invesco look forward to serving your investment management needs for many years to come. Thank you for investing with us.
Sincerely,

Philip Taylor
Senior Managing Director, Invesco Ltd.
iPad is a trademark of Apple Inc., registered in the US and other countries. App Store is a service mark of Apple Inc. Invesco Distributors, Inc. is not affiliated with Apple Inc.
2 Invesco Balanced-Risk Commodity Strategy Fund
| | |

Bruce Crockett | | Dear Fellow Shareholders: There are a variety of factors that can impact investment performance, many of which are uncontrollable by us as investors. These factors can include various economic trends and geopolitical developments. While the members of the Invesco Funds Board, which I chair, can’t dictate the performance of the Invesco funds, be assured that your Board works diligently throughout the year to focus on how your investments are managed. Our job is to represent you and your interests on a variety of fund management-related matters. We regularly monitor how the portfolio management teams of the Invesco funds are performing in light of ever-changing and often unpredictable economic and market conditions. We review the investment strategies and investment process employed by each fund’s management team as explained in the fund’s prospectus. Perhaps our most significant responsibility is conducting the annual review of the funds’ |
advisory and sub-advisory contracts with Invesco Advisers and its affiliates. This annual review, which is required by the Investment Company Act of 1940, focuses on the nature and quality of the services Invesco provides as the adviser to the Invesco funds and the reasonableness of the fees that it charges for those services. Each year, we spend months carefully reviewing information from Invesco that allows us to evaluate the quality of its services and the reasonableness of its fees. We also use information from a variety of independent sources, including materials provided by the independent senior officer of the Invesco funds, who reports directly to the independent trustees on the Board. Additionally, we meet with legal counsel and review performance and fee data prepared for us by Lipper Inc., an independent, third-party firm widely recognized as a leader in its field.
After a careful review, the members of the Invesco Funds Board approved the continuation of advisory and sub-advisory contracts with Invesco Advisers and its affiliates. Be assured that your Board will continue working on behalf of fund shareholders, keeping your needs and interests uppermost in our minds.
As always, please contact me at bruce@brucecrockett.com with any questions or concerns you may have. On behalf of the Board, we look forward to continuing to represent your interests and serving your needs.
Sincerely,

Bruce L. Crockett
Independent Chair
Invesco Funds Board of Trustees
3 Invesco Balanced-Risk Commodity Strategy Fund
Management’s Discussion of Fund Performance
Performance summary
For the fiscal year ended October 31, 2014, Invesco Balanced-Risk Commodity Strategy Fund underperformed the Bloomberg Commodity Index, the Fund’s broad market/style-specific benchmark. The Fund’s performance for the reporting period was negative.
Your Fund’s long-term performance appears later in this report.
Fund vs. Indexes
Total returns, 10/31/13 to 10/31/14, at net asset value (NAV). Performance shown does not include applicable contingent deferred sales charges (CDSC) or front-end sales charges, which would have reduced performance.
| | | | |
Class A Shares | | | -11.16 | % |
Class B Shares | | | -11.90 | |
Class C Shares | | | -11.81 | |
Class R Shares | | | -11.42 | |
Class Y Shares | | | -10.95 | |
Class R5 Shares | | | -10.95 | |
Class R6 Shares | | | -10.95 | |
Bloomberg Commodity Indexq (Broad Market/Style-Specific Index)* | | | -5.94 | |
Source(s): qBloomberg LP
| * | During the reporting period, the Fund’s broad market/style-specific index changed its name from the Dow Jones-USB Commodity Total Return Index to the Bloomberg Commodity Index. |
Market conditions and your Fund
The fiscal year ended October 31, 2014, was a difficult one for commodities; all four complexes – agriculture, energy, precious metals and industrial metals – posted negative results. Tactical positioning within energy through the use of swaps and futures was the only positive contributor to Fund performance for the reporting period.
Commodity markets struggled early in the reporting period as losses in precious metals and agriculture overshadowed gains in energy and industrial metals. The US Federal Reserve’s (the Fed) announcement in December that it would begin to cut back, or taper, its extraordinary asset purchase program was a negative for gold, which had its worst calendar-year performance since 1981.
Fund performance improved in the first quarter of 2014 due to favorable results across all four of the commodity complexes. Returns on commodities exceeded returns for stocks, bonds and currencies. It was the first time since 2012 that commodities outperformed the other three asset classes on a quarterly basis. The Fund’s first-quarter performance was driven to a large degree by geopolitical and weather events; collectively, those events resulted in gains for energy, agriculture and precious metals. Industrial metals, particularly copper, declined as slowing growth trends in the leading emerging markets and concerns about copper collateralized loans in China weighed on prices.
Commodities were positive in the second quarter as well, although positive
results in energy, industrial metals and precious metals were offset somewhat by declines in agricultural commodities. Violence in Iraq and dovish comments from the Fed aided energy and precious metals prices. Industrial metals prices gained due to falling copper supplies and a more stable growth outlook for China. Agricultural prices sold off during the quarter due to improved weather conditions and higher inventories. The Fund’s overweight exposure (relative to its benchmark) through swaps and futures to both industrial and precious metals benefited relative performance as prices for both rose during the quarter. Relative to its braod market/style-specific index, the Fund had underweight exposure through the use of swaps and futures to natural gas; this positioning aided Fund performance in the energy complex, as natural gas prices trailed prices for both oil and distillates. In agriculture, our relative underweight exposure, through the use of swaps and futures, to corn, cotton wheat and coffee benefited performance as prices for those commodities softened due to improving weather conditions.
A strengthening US dollar and weaker economic data from China and Europe both weighed on commodity prices in the third quarter of 2014. The US dollar climbed versus most major currencies due to stronger relative economic growth and expectations of an interest rate hike in 2015. Within agriculture, grain prices softened on bumper harvests, while worries about a credit bubble and weaker economic activity in China hit industrial metals. Within the energy complex, oil prices fell as concern rose about conflict in the Middle East and Ukraine and
| | | | | | | | | | |
| Target Risk Allocation and Notional Asset Weights† | |
By asset class | |
| Asset Class | | Risk
Allocation* | | % of Total Net Assets
as of 10/31/14** |
| | |
Agriculture | | | | 24.96 | % | | | | 22.37 | % |
Energy | | | | 22.25 | | | | | 15.34 | |
Industrial Metals | | | | 27.91 | | | | | 22.95 | |
Precious Metals | | | | 24.88 | | | | | 21.54 | |
| † | Risk contribution is measured as the standard deviation of each asset class as a percentage of total portfolio standard deviation. The risk contribution of each underlying asset determines the dollar-weighting of the asset. Standard deviation measures a fund’s range of total returns and fluctuations over a defined period of time. |
| * | Based on the expected market exposure. |
| ** | Due to the use of leverage, the percentages may not equal 100%. |
| | | | |
Total Net Assets | | $ | 720.5 million | |
4 Invesco Balanced-Risk Commodity Strategy Fund
decreased global demand. Our strategic positioning through the use of swaps and futures within agriculture and energy were the primary drivers of the Fund’s relative performance for the quarter. Below-benchmark allocations to corn, wheat and soybean oil proved beneficial; strategic underweight exposure to natural gas aided relative results within the energy complex.
The Fund finished the reporting period with a gain in October. On an absolute basis, investments in agricultural commodity swaps and futures were the primary contributor for the month as wet weather delayed the US grain harvest and dry weather impacted production in Brazil, Russia and Australia. Soybeans and soymeal were top performers due to rising export demand, primarily from China. Industrial metals prices increased on better-than-expected Chinese manufacturing data and signs of lower inventory levels in warehouses. Aluminum outperformed copper as aluminum producers continued to reduce production levels. Precious metals declined during the month due to the rising US dollar, hawkish comments from the Fed and robust US economic growth in the third quarter. Silver continued to be weak, with its price falling even more than gold’s. The energy complex suffered significant losses due to rising supplies, softening global demand and the rising US dollar. All of the Fund’s strategic energy exposure, achieved through the use of swaps and futures, declined in value during the month, with gasoline and West Texas Intermediate crude oil being the worst performers.
Please note that our strategy is principally implemented with derivative instruments that include futures, commodity-linked notes and total return swaps. Therefore, all or most of the performance of the strategy, both positive and negative, can be attributed to these instruments. Derivatives can be a cost-effective way to gain exposure to asset classes. However, derivatives may amplify traditional investment risks through the creation of leverage and may be less liquid than traditional securities.
Thank you for your continued commitment to Invesco Balanced-Risk Commodity Strategy Fund.
The views and opinions expressed in management’s discussion of Fund performance are those of Invesco Advisers, Inc. These views and opinions are subject to change at any time based on factors such as market and economic conditions. These views and opinions may not be relied upon as investment advice or recommendations, or as an offer for a particular security. The information is not a complete analysis of every aspect of any market, country, industry, security or the Fund. Statements of fact are from sources considered reliable, but Invesco Advisers, Inc. makes no representation or warranty as to their completeness or accuracy. Although historical performance is no guarantee of future results, these insights may help you understand our investment management philosophy.
See important Fund and, if applicable, index disclosures later in this report.
| | |

| | Mark Ahnrud Chartered Financial Analyst, Portfolio Manager, is manager of Invesco Balanced-Risk Commodity |
Strategy Fund. He joined Invesco in 2000. Mr. Ahnrud earned a BS in finance and investments from Babson College and an MBA from Duke University Fuqua School of Business.
| | |

| | Chris Devine Chartered Financial Analyst, Portfolio Manager, is manager of Invesco Balanced-Risk Commodity |
Strategy Fund. He joined Invesco in 1998. Mr. Devine earned a BA in economics from Wake Forest University and an MBA from the University of Georgia.
| | |

| | Scott Hixon Chartered Financial Analyst, Portfolio Manager, is manager of Invesco Balanced-Risk Commodity |
Strategy Fund. He joined Invesco in 1994. Mr. Hixon earned a BBA in finance from Georgia Southern University and an MBA in finance from Georgia State University.
| | |

| | Christian Ulrich Chartered Financial Analyst, Portfolio Manager, is manager of Invesco Balanced-Risk Commodity |
Strategy Fund. He joined Invesco in 2000. Mr. Ulrich earned the equivalent of a BBA from the KV Zurich Business School in Zurich, Switzerland.
| | |

| | Scott Wolle Chartered Financial Analyst, Portfolio Manager, is manager of Invesco Balanced-Risk Commodity |
Strategy Fund. He joined Invesco in 1999. Mr. Wolle earned a BS in finance from Virginia Polytechnic Institute and State University and an MBA from Duke University Fuqua School of Business.
Assisted by the Invesco Global Asset Allocation Team
5 Invesco Balanced-Risk Commodity Strategy Fund
Your Fund’s Long-Term Performance
Results of a $10,000 Investment – Oldest Share Class(es) since Inception
Fund and index data from 11/30/10
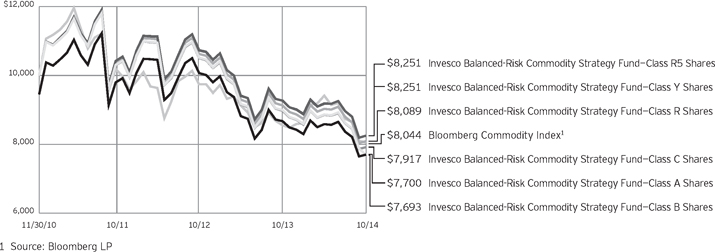
Past performance cannot guarantee comparable future results.
The data shown in the chart include reinvested distributions, applicable sales charges and Fund expenses including management fees. Results for Class B shares are calculated as if a hypothetical shareholder had liquidated his entire investment in the Fund at the close of the reporting period and paid the contingent deferred sales charges, if applicable.
Index results include reinvested dividends, but they do not reflect sales charges. Performance of the peer group, if applicable, reflects fund expenses and management fees; performance of a market index does not. Performance shown in the chart and table(s) does not reflect deduction of taxes a shareholder would pay on Fund distributions or sale of Fund shares.
6 Invesco Balanced-Risk Commodity Strategy Fund
| | | | |
| Average Annual Total Returns | |
| As of 10/31/14, including maximum applicable sales charges | |
| |
Class A Shares | | | | |
Inception (11/30/10) | | | -6.45 | % |
1 Year | | | -16.08 | |
| |
Class B Shares | | | | |
Inception (11/30/10) | | | -6.48 | % |
1 Year | | | -16.30 | |
| |
Class C Shares | | | | |
Inception (11/30/10) | | | -5.79 | % |
1 Year | | | -12.69 | |
| |
Class R Shares | | | | |
Inception (11/30/10) | | | -5.27 | % |
1 Year | | | -11.42 | |
| |
Class Y Shares | | | | |
Inception (11/30/10) | | | -4.79 | % |
1 Year | | | -10.95 | |
| |
Class R5 Shares | | | | |
Inception (11/30/10) | | | -4.79 | % |
1 Year | | | -10.95 | |
| |
Class R6 Shares | | | | |
Inception | | | -4.96 | % |
1 Year | | | -10.95 | |
Class R6 shares incepted on September 24, 2012. Performance shown prior to that date is that of Class A shares and includes the 12b-1 fees applicable to Class A shares. Class A share performance reflects any applicable fee waivers or expense reimbursements.
The performance data quoted represent past performance and cannot guarantee comparable future results; current performance may be lower or higher. Please visit invesco.com/performance for the most recent month-end performance. Performance figures reflect reinvested distributions, changes in net asset value and the effect of the maximum sales charge unless otherwise stated. Investment return and principal value will fluctuate so that you may have a gain or loss when you sell shares.
The net annual Fund operating expense ratio set forth in the most recent Fund prospectus as of the date of this report for Class A, Class B, Class C, Class R, Class Y, Class R5 and Class R6 shares was 1.48%, 2.23%, 2.23%, 1.73%, 1.23%, 1.21% and 1.13%, respectively.1,2 The total annual Fund operating expense ratio set forth
| | | | |
| Average Annual Total Returns | |
| As of 9/30/14, the most recent calendar quarter end, including maximum applicable sales charges | |
| |
Class A Shares | | | | |
Inception (11/30/10) | | | -6.77 | % |
1 Year | | | -17.13 | |
| |
Class B Shares | | | | |
Inception (11/30/10) | | | -6.77 | % |
1 Year | | | -17.30 | |
| |
Class C Shares | | | | |
Inception (11/30/10) | | | -6.07 | % |
1 Year | | | -13.83 | |
| |
Class R Shares | | | | |
Inception (11/30/10) | | | -5.54 | % |
1 Year | | | -12.56 | |
| |
Class Y Shares | | | | |
Inception (11/30/10) | | | -5.08 | % |
1 Year | | | -12.09 | |
| |
Class R5 Shares | | | | |
Inception (11/30/10) | | | -5.08 | % |
1 Year | | | -12.09 | |
| |
Class R6 Shares | | | | |
Inception | | | -5.22 | % |
1 Year | | | -11.98 | |
in the most recent Fund prospectus as of the date of this report for Class A, Class B, Class C, Class R, Class Y, Class R5 and Class R6 shares was 1.52%, 2.27%, 2.27%, 1.77%, 1.27%, 1.25% and 1.17%, respectively. The expense ratios presented above may vary from the expense ratios presented in other sections of this report that are based on expenses incurred during the period covered by this report.
Class A share performance reflects the maximum 5.50% sales charge, and Class B and Class C share performance reflects the applicable contingent deferred sales charge (CDSC) for the period involved. The CDSC on Class B shares declines from 5% beginning at the time of purchase to 0% at the beginning of the seventh year. The CDSC on Class C shares is 1% for the first year after purchase. Class R, Class Y, Class R5 and Class R6 shares do not have a front-end sales charge or a CDSC; therefore, performance is at net asset value.
The performance of the Fund’s share classes will differ primarily due to different sales charge structures and class expenses.
Had the adviser not waived fees and/or reimbursed expenses in the past, performance would have been lower.
| 1 | Total annual Fund operating expenses after any contractual fee waivers and/or expense reimbursements by the adviser in effect through at least June 30, 2015. See current prospectus for more information. |
| 2 | Total annual Fund operating expenses after any contractual fee waivers and/or expense reimbursements by the adviser in effect through at least June 30, 2016. See current prospectus for more information. |
7 Invesco Balanced-Risk Commodity Strategy Fund
Invesco Balanced-Risk Commodity Strategy Fund’s investment objective is to provide total return.
| n | | Unless otherwise stated, information presented in this report is as of October 31, 2014, and is based on total net assets. |
| n | | Unless otherwise noted, all data provided by Invesco. |
| n | | To access your Fund’s reports/prospectus, visit invesco.com/fundreports. |
About share classes
| n | | Class B shares may not be purchased for new or additional investments. Please see the prospectus for more information. |
| n | | Class R shares are generally available only to employer sponsored retirement and benefit plans. Please see the prospectus for more information. |
| n | | Class Y shares are available only to certain investors. Please see the prospectus for more information. |
| n | | Class R5 shares and Class R6 shares are primarily intended for employer sponsored retirement and benefit plans that meet certain standards and for institutional investors. Please see the prospectus for more information. |
Principal risks of investing in the Fund
| n | | Commodities tax risk. The tax treatment of commodity-linked derivative instruments may be adversely affected by changes in legislation, regulations or other legally binding authority. If, as a result of any such adverse action, the income of the Fund from certain commodity-linked derivatives was treated as non-qualifying income, the Fund might fail to qualify as a regulated investment company and be subject to federal income tax at the Fund level. The Fund has received a private letter ruling from the Internal Revenue Service confirming that income derived from the Fund’s investment in a form of commodity-linked note constitutes qualifying income to the Fund. The Fund also has applied to the IRS for a private letter ruling relating to the Subsidiary. The Internal Revenue Service has issued a number of similar letter rulings, including to another Invesco fund (upon which only the fund that received the private letter ruling can rely), which indicate that income from a mutual fund’s investment in a wholly owned foreign subsidiary that invests in commodity-linked derivatives, such as the Subsidiary, constitutes qualifying income. |
However, the Internal Revenue Service suspended issuance in July 2011 of any further private letter rulings pending a review of its position. Should the Internal Revenue Service issue guidance, or Congress enact legislation, that adversely affects the tax treatment of the Fund’s use of commodity-linked notes or the Subsidiary (which guidance might be applied retroactively to the Fund’s investment in the Subsidiary), it could limit the Fund’s ability to pursue its investment strategy and the Fund might not qualify as a regulated investment company for one or more years. In this event, the Fund’s Board of Trustees may authorize a significant change in investment strategy or Fund liquidation. The Fund also may incur transaction and other costs to comply with any new or additional guidance from the Internal Revenue Service.
| n | | Commodity-linked notes risk. The Fund’s investments in commodity-linked notes may involve substantial risks, including risk of loss of a significant portion of their principal value. In addition to risks associated with the underlying commodities, they may be subject to additional special risks, such as the lack of a secondary trading market and temporary price distortions due to speculators and/or the continuous rolling over of futures contracts underlying the notes. Commodity-linked notes are also subject to counterparty risk, which is the risk that the other party to the contract will not fulfill its contractual obligation to complete the transaction with the Fund. |
| n | | Commodity risk. The Fund will concentrate its investments in commodities markets. The Fund’s significant investment exposure to the commodities markets and/or a particular sector of the commodities markets, which may subject the Fund to greater volatility than investments in traditional securities, such as stocks and bonds. The commodities markets may fluctuate widely based on a variety of factors, including |
changes in overall market movements, domestic and foreign political and economic events and policies, war, acts of terrorism, changes in domestic or foreign interest rates and/or investor expectations concerning interest rates, domestic and foreign inflation rates and investment and trading activities of mutual funds, hedge funds and commodities funds. Prices of various commodities may also be affected by factors such as drought, floods, weather, livestock disease, embargoes, tariffs and other regulatory developments. The prices of commodities can also fluctuate widely due to supply and demand disruptions in major producing or consuming regions. Because the Fund’s performance is linked to the performance of potentially volatile commodities, investors should be willing to assume the risks of potentially significant fluctuations in the value of the Fund’s shares.
| n | | Correlation risk. Changes in the value of two investments or asset classes may not track or offset each other in the manner anticipated by the portfolio managers. Because the Fund’s investment strategy seeks to balance risk across the four sectors of the commodities markets and, within each commodity sector, to balance risk across different commodities, to the extent either the four sectors of the commodities markets or the selected commodities are correlated in a way not anticipated by the portfolio managers the Fund’s risk allocation process may not succeed in achieving its investment objective. |
| n | | Credit risk. The issuer of instruments in which the Fund invests may be unable to meet interest and/or principal payments, thereby causing its instruments to decrease in value and lowering the issuer’s credit rating. |
| n | | Derivatives risk. The value of a derivative instrument depends largely on (and is derived from) the value of an underlying security, currency, commodity, interest rate, index or other asset (each referred to as an underlying asset). In addition to risks relating to the underlying assets, the use of derivatives may include other, possibly greater, risks, including counterparty, leverage and liquidity risks. Counterparty risk is the risk that the counterparty to the derivative contract will default on its |
continued on page 9
This report must be accompanied or preceded by a currently effective Fund prospectus, which contains more complete information, including sales charges and expenses. Investors should read it carefully before investing.
NOT FDIC INSURED | MAY LOSE VALUE | NO BANK GUARANTEE
8 Invesco Balanced-Risk Commodity Strategy Fund
obligation to pay an underlying fund the amount owed or otherwise perform under the derivative contract. Derivatives create leverage risk because they do not require payment up front equal to the economic exposure created by owning the derivative. As a result, an adverse change in the value of the underlying asset could result in an underlying fund sustaining a loss that is substantially greater than the amount invested in the derivative, which may make an underlying fund’s returns more volatile and increase the risk of loss. Derivative instruments may also be less liquid than more traditional investments and the underlying fund may be unable to sell or close out its derivative positions at a desirable time or price. This risk may be more acute under adverse market conditions, during which an underlying fund may be most in need of liquidating its derivative positions. Derivatives may also be harder to value, less tax efficient and subject to changing government regulation that could impact an underlying fund’s ability to use certain derivatives or their cost. Also, derivatives used for hedging or to gain or limit exposure to a particular market segment may not provide the expected benefits, particularly during adverse market conditions. These risks are greater for certain underlying funds than mutual funds that do not use derivative instruments or that use derivative instruments to a lesser extent than certain underlying funds to implement their investment strategy.
| n | | Exchange-traded funds risk. An investment by the Fund in exchange-traded funds generally presents the same primary risks as an investment in a mutual fund. In addition, an exchange-traded fund may be subject to the following: (1) a discount of the exchange-traded fund’s shares to its net asset value; (2) failure to develop an active trading market for the exchange-traded fund’s shares; (3) the listing exchange halting trading of the exchange-traded fund’s shares; (4) failure of the exchange-traded fund’s shares to track the referenced asset; and (5) holding troubled securities in the referenced index or basket of investments. Investments in exchange-traded funds may involve duplication of management fees and certain other expenses, as the Fund indirectly bears its proportionate share of any expenses paid by the exchange-traded funds in which it invests. Further, certain of the exchange-traded funds in which the Fund may invest are leveraged. The more the Fund invests |
in such leveraged exchange-traded funds, the more this leverage will magnify any losses on those investments.
| n | | Exchange-traded notes risk. Exchange-traded notes are subject to credit risk, including the credit risk of the issuer, and the value of the exchange-traded note may drop due to a downgrade in the issuer’s credit rating, despite the underlying market benchmark or strategy remaining unchanged. The value of an exchange-traded note may also be influenced by time to maturity, level of supply and demand for the exchange-traded note, volatility and lack of liquidity in the underlying market, changes in the applicable interest rates, changes in the issuer’s credit rating, and economic, legal, political, or geographic events that affect the referenced underlying market or strategy. Exchange-traded notes are also subject to the risk that the other party to the contract will not fulfill its contractual obligations, which may cause losses or additional costs to the Fund. |
| n | | Interest rate risk. Interest rate risk refers to the risk that bond prices generally fall as interest rates rise; conversely, bond prices generally rise as interest rates fall. Specific bonds differ in their sensitivity to changes in interest rates depending on their individual characteristics, including duration. |
| n | | Liquidity risk. The Fund may hold illiquid securities that may be unable to sell at the preferred time or price and could lose its entire investment in such securities. The Fund’s significant use of derivative instruments may cause liquidity risk to be greater than other mutual funds that invest in more traditional assets such as stocks and bonds, which trade on markets with more market participants. |
| n | | Management risk. The investment techniques and risk analysis used by the Fund’s and the underlying funds’ portfolio managers may not produce the desired results. |
| n | | Market risk. The prices of and the income generated by the Fund’s securities may decline in response to, among other things, investor sentiment, general economic and market conditions, regional or global instability, and currency and interest rate fluctuations. |
| n | | Subsidiary risk. By investing in the Subsidiary, the Fund is indirectly exposed to risks associated with the Subsidiary’s investments. The Subsidiary is not registered under the Investment Company Act of 1940, as amended (1940 Act), and, except as otherwise noted in this prospectus is not subject to the investor |
| | | protections of the 1940 Act. Changes in the laws of the United States and/or the Cayman Islands, under which the Fund and the Subsidiary, respectively, are organized, could result in the inability of the Fund and/or the Subsidiary to operate as described in this prospectus and could negatively affect the Fund and its shareholders. |
| n | | US government obligations risk. The Fund may invest in obligations issued by US government agencies and instrumentalities that may receive varying levels of support from the government, which could affect the Fund’s ability to recover should they default. |
| n | | Volatility risk. The Fund may have investments that appreciate or decrease significantly in value over short periods of time. This may cause the Fund’s net asset value per share to experience significant increases or declines in value over short periods of time. |
About indexes used in this report
| n | | The Bloomberg Commodity Index is an unmanaged index designed to be a highly liquid and diversified benchmark for the commodity futures market. |
| n | | The Fund is not managed to track the performance of any particular index, including the index(es) described here, and consequently, the performance of the Fund may deviate significantly from the performance of the index(es). |
| n | | A direct investment cannot be made in an index. Unless otherwise indicated, index results include reinvested dividends, and they do not reflect sales charges. Performance of the peer group, if applicable, reflects fund expenses; performance of a market index does not. |
Other information
| n | | The returns shown in management’s discussion of Fund performance are based on net asset values (NAVs) calculated for shareholder transactions. Generally accepted accounting principles require adjustments to be made to the net assets of the Fund at period end for financial reporting purposes, and as such, the NAVs for shareholder transactions and the returns based on those NAVs may differ from the NAVs and returns reported in the Financial Highlights. |
9 Invesco Balanced-Risk Commodity Strategy Fund
Consolidated Schedule of Investments
October 31, 2014
| | | | | | | | | | | | | | | | |
| | | Interest
Rate | | | Maturity
Date | | | Principal
Amount | | | Value | |
U.S. Treasury Securities–64.69%(a) | |
| U.S. Treasury Bills–27.99% | |
U.S. Treasury Bills | | | 0.05 | % | | | 12/04/14 | | | $ | 31,950,000 | | | $ | 31,949,998 | |
U.S. Treasury Bills(b)(c) | | | 0.05 | % | | | 12/04/14 | | | | 6,440,000 | | | | 6,440,000 | |
U.S. Treasury Bills | | | 0.05 | % | | | 12/11/14 | | | | 8,190,000 | | | | 8,189,956 | |
U.S. Treasury Bills(c) | | | 0.06 | % | | | 12/11/14 | | | | 2,210,000 | | | | 2,209,988 | |
U.S. Treasury Bills(c)(d) | | | 0.02 | % | | | 12/18/14 | | | | 2,080,000 | | | | 2,079,987 | |
U.S. Treasury Bills | | | 0.02 | % | | | 12/18/14 | | | | 7,464,000 | | | | 7,463,953 | |
U.S. Treasury Bills(c)(d) | | | 0.04 | % | | | 12/18/14 | | | | 2,010,000 | | | | 2,009,987 | |
U.S. Treasury Bills | | | 0.04 | % | | | 12/18/14 | | | | 7,216,000 | | | | 7,215,954 | |
U.S. Treasury Bills | | | 0.10 | % | | | 01/08/15 | | | | 8,400,000 | | | | 8,399,922 | |
U.S. Treasury Bills(c)(d) | | | 0.10 | % | | | 01/08/15 | | | | 8,400,000 | | | | 8,399,922 | |
U.S. Treasury Bills(c)(d) | | | 0.05 | % | | | 01/15/15 | | | | 27,600,000 | | | | 27,599,716 | |
U.S. Treasury Bills | | | 0.05 | % | | | 01/15/15 | | | | 12,600,000 | | | | 12,599,871 | |
U.S. Treasury Bills | | | 0.05 | % | | | 01/22/15 | | | | 11,760,000 | | | | 11,759,998 | |
U.S. Treasury Bills(c)(d) | | | 0.05 | % | | | 01/22/15 | | | | 11,760,000 | | | | 11,759,998 | |
U.S. Treasury Bills | | | 0.06 | % | | | 01/29/15 | | | | 43,060,000 | | | | 43,059,473 | |
U.S. Treasury Bills(c)(d) | | | 0.06 | % | | | 01/29/15 | | | | 10,550,000 | | | | 10,549,871 | |
| | | | | | | | | | | | | | | | 201,688,594 | |
|
| U.S. Treasury Notes–36.70% | |
U.S. Treasury Notes(b)(c)(d)(e) | | | 0.07 | % | | | 01/31/16 | | | | 15,410,000 | | | | 15,410,272 | |
U.S. Treasury Notes(e) | | | 0.07 | % | | | 01/31/16 | | | | 62,880,000 | | | | 62,881,110 | |
U.S. Treasury Notes(c)(d)(e) | | | 0.09 | % | | | 04/30/16 | | | | 16,180,000 | | | | 16,185,456 | |
U.S. Treasury Notes(e) | | | 0.09 | % | | | 04/30/16 | | | | 114,510,000 | | | | 114,548,610 | |
U.S. Treasury Notes(c)(e) | | | 0.09 | % | | | 07/31/16 | | | | 11,450,000 | | | | 11,454,736 | |
U.S. Treasury Notes(e) | | | 0.09 | % | | | 07/31/16 | | | | 43,910,000 | | | | 43,928,162 | |
| | | | | | | | | | | | | | | | 264,408,346 | |
Total U.S. Treasury Securities (Cost $466,047,455) | | | | | | | | | | | | | | | 466,096,940 | |
| | | | |
| | | | | | | | | Shares | | | | |
Exchange Traded Funds–2.92% | | | | | | | | | | | | | | | | |
PowerShares DB Gold Fund (Cost $28,788,689)(f) | | | | | | | | | | | 542,000 | | | | 21,024,180 | |
| | | | |
| | | | | | Expiration
Date | | | Principal
Amount | | | | |
Commodity-Linked Securities–1.78% | | | | | | | | | | | | | | | | |
Barclays Bank PLC, Series 1, U.S. Federal Funds (Effective) rate minus 0.06% (linked to the Barclays Diversified Energy-Metals Total Return Index, multiplied by 3) (Cost $20,150,000)(g) | | | | | | | 09/29/15 | | | $ | 20,150,000 | | | | 12,805,255 | |
| | | | |
| | | | | | | | | Shares | | | | |
Money Market Funds–28.82% | | | | | | | | | | | | | | | | |
Liquid Assets Portfolio–Institutional Class(h) | | | | | | | | | | | 85,507,064 | | | | 85,507,064 | |
Premier Portfolio–Institutional Class(h) | | | | | | | | | | | 85,507,065 | | | | 85,507,065 | |
STIC (Global Series) PLC–U.S. Dollar Liquidity Portfolio (Ireland)–Institutional Class(c)(h) | | | | | | | | | | | 36,655,939 | | | | 36,655,939 | |
Total Money Market Funds (Cost $207,670,068) | | | | | | | | | | | | | | | 207,670,068 | |
TOTAL INVESTMENTS–98.21% (Cost $722,656,212) | | | | | | | | | | | | | | | 707,596,443 | |
OTHER ASSETS LESS LIABILITIES–1.79% | | | | | | | | | | | | | | | 12,909,907 | |
NET ASSETS–100.00% | | | | | | | | | | | | | | $ | 720,506,350 | |
See accompanying Notes to Consolidated Financial Statements which are an integral part of the financial statements.
10 Invesco Balanced-Risk Commodity Strategy Fund
| | | | | | | | | | | | | | | | | | | | |
| Open Futures Contracts(i) | |
| Futures Contracts | | Type of
Contract | | | | Number of
Contracts | | | Expiration Month | | | Notional Value | | | Unrealized Appreciation (Depreciation) | |
Coffee C(c) | | Short | | | | | 41 | | | | December-2014 | | | $ | (2,890,500 | ) | | $ | 188,922 | |
Corn(c) | | Short | | | | | 382 | | | | December-2014 | | | | (7,195,925 | ) | | | 1,272,880 | |
Cotton No. 2(c) | | Long | | | | | 357 | | | | December-2014 | | | | 11,504,325 | | | | 229,699 | |
NYH RBOB Gasoline (Globex)(c) | | Long | | | | | 310 | | | | December-2014 | | | | 27,964,356 | | | | (172,627 | ) |
Soybean(c) | | Long | | | | | 1,231 | | | | January-2015 | | | | 64,581,338 | | | | 4,735,209 | |
Soybean Oil(c) | | Short | | | | | 274 | | | | December-2014 | | | | (5,721,120 | ) | | | 384,995 | |
Wheat(c) | | Short | | | | | 225 | | | | December-2014 | | | | (5,990,625 | ) | | | 302,334 | |
Total Futures Contracts — Commodity Risk | | | $ | 6,941,412 | |
| | | | | | |
| | | | | | | | | | | | | | | | | | | | |
| Open Total Return Swap Agreements | |
| Swap Agreements | | Type of
Contract | | Counterparty | | Number of
Contracts | | | Termination
Date | | | Notional Value | | | Unrealized Appreciation (Depreciation) | |
Receive a return equal to the Barclays Brent Crude Roll Yield Excess Return Index and pay the product of (i) 0.35% of the Notional Amount multiplied by (ii) days in the period divided by 365(c) | | Long | | Barclays
Bank PLC | | | 41,900 | | | | March-2015 | | | $ | 22,675,425 | | | $ | 464,679 | |
Receive a return equal to the Barclays Silver Nearby Excess Return Index and pay the product of (i) 0.19% of the Notional Amount multiplied by (ii) days in the period divided by 365(c) | | Long | | Barclays
Bank PLC | | | 216,600 | | | | June-2015 | | | | 49,844,663 | | | | (3,875,949 | ) |
Receive a return equal to the Barclays WTI Crude Roll Yield Excess Return Index and pay the product of (i) 0.35% of the Notional Amount multiplied by (ii) days in the period divided by 365(c) | | Long | | Barclays
Bank PLC | | | 47,700 | | | | March-2015 | | | | 24,193,187 | | | | (119,560 | ) |
Pay/Receive a floating rate equal to the Optimum GSCI Heating Oil Roll Yield 9m Excess Return Index and pay the product of (i) 0.37% of the Notional Amount multiplied by (ii) days in the period divided by 365(c) | | Short | | Barclays
Bank PLC | | | 14,000 | | | | August-2015 | | | | (5,452,525 | ) | | | (115,979 | ) |
Pay/Receive a floating rate equal to the Optimum GSCI Live Cattle Roll Yield 9m Excess Return Index and pay the product of (i) 0.47% of the Notional Amount multiplied by (ii) days in the period divided by 365(c) | | Short | | Barclays
Bank PLC | | | 9,700 | | | | October-2015 | | | | (1,493,047 | ) | | | (35,840 | ) |
Receive a return equal to the CIBC Dynamic Roll LME Copper Excess Return Index 2 and pay the product of (i) 0.30% of the Notional Amount multiplied by (ii) days in the period divided by 365(c) | | Long | | Canadian Imperial
Bank of Commerce | | | 906,800 | | | | April-2015 | | | | 76,631,673 | | | | (25,300 | ) |
Receive a return equal to the Enhanced Strategy Sugar A141 on the S&P GSCI Sugar Excess Return Index and pay the product of (i) 0.37% of the Notional Amount multiplied by (ii) days in the period divided by 365(c) | | Long | | Goldman Sachs
International | | | 124,350 | | | | March-2015 | | | | 34,555,423 | | | | (2,008,787 | ) |
Pay/Receive a floating rate equal to the S&P GSCI Brent Crude 1 Month Forward Index Excess Return and pay the product of (i) 0.12% of the Notional Amount multiplied by (ii) days in the period divided by 365(c) | | Short | | Goldman Sachs
International | | | 5,870 | | | | February-2015 | | | | (6,592,215 | ) | | | 0 | |
Receive a return equal to the S&P GSCI Crude Oil 1 Month Forward Index Excess Return and pay the product of (i) 0.12% of the Notional Amount multiplied by (ii) days in the period divided by 365(c) | | Long | | Goldman Sachs
International | | | 30,100 | | | | February-2015 | | | | 16,367,230 | | | | 0 | |
Pay/Receive a floating rate equal to the S&P GSCI Gasoil 1 Month Forward Index Excess Return and pay the product of (i) 0.12% of the Notional Amount multiplied by (ii) days in the period divided by 365(c) | | Short | | Goldman Sachs
International | | | 700 | | | | November-2015 | | | | (553,187 | ) | | | 0 | |
Pay/Receive a floating rate equal to the S&P GSCI Heating Oil 1 Month Forward Index Excess Return and pay the product of (i) 0.12% of the Notional Amount multiplied by (ii) days in the period divided by 365(c) | | Short | | Goldman Sachs
International | | | 51,300 | | | | February-2015 | | | | (20,664,769 | ) | | | 0 | |
Receive a return equal to the S&P GSCI Natural Gas 1 Month Forward Index Excess Return and pay the product of (i) 0.12% of the Notional Amount multiplied by (ii) days in the period divided by 365(c) | | Long | | Goldman
Sachs
International | | | 1,218,000 | | | | January-2015 | | | | 10,146,549 | | | | 0 | |
See accompanying Notes to Consolidated Financial Statements which are an integral part of the financial statements.
11 Invesco Balanced-Risk Commodity Strategy Fund
| | | | | | | | | | | | | | | | | | | | | | |
| Swap Agreements | | Type of
Contract | | Counterparty | | | Number of
Contracts | | | Termination
Date | | | Notional Value | | | Unrealized Appreciation (Depreciation) | |
Receive a return equal to the S&P GSCI Soybean Meal Excess Return Index and pay the product of (i) 0.30% of the Notional Amount multiplied by (ii) days in the period divided by 365(c) | | Long | |
| Goldman Sachs
International |
| | | 62,630 | | | | September-2015 | | | $ | 76,772,731 | | | $ | 0 | |
Receive a return equal to the S&P GSCI Gold Index Excess Return and pay the product of (i) 0.09% of the Notional Amount multiplied by (ii) days in the period divided by 365(c) | | Long | |
| JPMorgan
Chase Bank, N.A. |
| | | 497,000 | | | | April-2015 | | | | 52,014,827 | | | | (3,086,270 | ) |
Receive a return equal to Modified Macquarie Single Commodity Sugar type A Excess Return Index and pay the product of (i) 0.34% of the Notional Amount multiplied by (ii) days in the period divided by 365(c) | | Long | |
| Macquarie
Bank Ltd. |
| | | 95,500 | | | | March-2015 | | | | 22,079,972 | | | | 13,771 | |
Receive a return equal to the Merrill Lynch Gold Excess Return Index and pay the product of (i) 0.14% of the Notional Amount multiplied by (ii) days in the period divided by 365(c) | | Long | |
| Merrill Lynch
International |
| | | 108,600 | | | | June-2015 | | | | 16,755,796 | | | | 0 | |
Receive a return equal to the MLCX Aluminum Annual Excess Return Index and pay the product of (i) 0.28% of the Notional Amount multiplied by (ii) days in the period divided by 365(c) | | Long | |
| Merrill Lynch
International |
| | | 109,700 | | �� | | September-2015 | | | | 13,428,344 | | | | 0 | |
Receive a return equal to the MLCX Dynamic Enhanced Copper Excess Return Index and pay the product of (i) 0.25% of the Notional Amount multiplied by (ii) days in the period divided by 365(c) | | Long | |
| Merrill Lynch
International |
| | | 102,190 | | | | May-2015 | | | | 67,120,303 | | | | 0 | |
Total Swap Agreements — Commodity Risk | | | | | | | | | | | | | | | | | | | | $ | (8,789,235 | ) |
Index Information:
| | |
Barclays Diversified Energy-Metals Total Return Index | | – a basket of indices that provide exposure to various components of the energy and metals markets. The underlying commodities comprising the indices are: gold, silver, copper, Brent Crude oil, WTI Crude oil, gasoil and unleaded gasoline. |
Barclays Brent Crude Roll Yield Excess Return Index | | – a commodity index composed of futures contracts on Brent Crude oil. |
Barclays Silver Nearby Excess Return Index | | – a commodity index composed of futures contracts on silver. |
Barclays WTI Crude Roll Yield Excess Return Index | | – a commodity index composed of futures contracts on WTI Crude oil. |
Optimum GSCI Heating Oil Roll Yield 9m Excess Return Index | | – a commodity index composed of futures contracts on heating oil. |
Optimum GSCI Live Cattle Roll Yield 9m Excess Return Index | | – a commodity index composed of futures contracts on live cattle |
CIBC Dynamic Roll LME Copper Excess Return Index 2 | | – a commodity index composed of futures contracts on copper. |
Enhanced Strategy Sugar A141 on the S&P GSCI Sugar Excess Return Index | | – a commodity index composed of futures contracts on sugar. |
S&P GSCI Brent Crude 1 Month Forward Index Excess Return | | – a commodity index composed of futures contracts on Brent Crude oil. |
S&P GSCI Crude Oil 1 Month Forward Index Excess Return | | – a commodity index composed of futures contracts on crude oil. |
S&P GSCI Gasoil 1 Month Forward Index Excess Return | | – a commodity index composed of futures contracts on gasoil. |
S&P GSCI Heating Oil 1 Month Forward Index Excess Return | | – a commodity index composed of futures contracts on heating oil. |
S&P GSCI Natural Gas 1 Month Forward Index Excess Return | | – a commodity index composed of futures contracts on natural gas. |
S&P GSCI Soybean Meal Excess Return Index | | – a commodity index composed of futures contracts on soybean meal. |
S&P GSCI Gold Index Excess Return | | – a commodity index composed of futures contracts on gold. |
Modified Macquarie Single Commodity Sugar type A Excess Return Index | | – a commodity index composed of futures contracts on sugar. |
Merrill Lynch Gold Excess Return Index | | – a commodity index composed of futures contracts on gold. |
MLCX Aluminum Annual Excess Return Index | | – a commodity index composed of futures contracts on aluminum. |
MLCX Dynamic Enhanced Copper Excess Return Index | | – a commodity index composed of futures contracts on copper. |
Notes to Schedule of Investments:
| (a) | Security traded on a discount basis. The interest rate shown represents the discount rate at the time of purchase by the Fund. |
| (b) | All or a portion of the value was pledged as collateral to cover margin requirements for open futures contracts. See Note 1J and Note 4. |
| (c) | The investment is owned by the Subsidiary. See Note 5. |
| (d) | All or a portion of the value was designated as collateral for swap agreements. See Note 1K and Note 4. |
| (e) | Interest or dividend rate is redetermined periodically. Rate shown is the rate in effect on October 31, 2014. |
| (f) | Affiliated company during the period. The Investment Company Act of 1940 defines affiliates as those issuances in which a fund holds 5% or more of the outstanding voting securities. The Fund has not owned enough of the outstanding voting securities of the issuer to have control (as defined in the Investment Company Act of 1940) of that issuer. The value of this security as of October 31, 2014 represented 2.92% of the Fund’s Net Assets. See Note 6. |
| (g) | Security purchased or received in transaction exempt from registration under the Securities Act of 1933, as amended (the “1933 Act”). The security may be resold pursuant to an exemption from registration under the 1933 Act, typically to qualified institutional buyers. The value of this security at October 31, 2014 represented 1.78% of the Fund’s Net Assets. |
| (h) | The money market fund and the Fund are affiliated by having the same investment adviser. |
| (i) | Futures contracts collateralized by $4,210,000 cash held with Goldman Sachs & Co., the futures commission merchant. |
See accompanying Notes to Consolidated Financial Statements which are an integral part of the financial statements.
12 Invesco Balanced-Risk Commodity Strategy Fund
Consolidated Statement of Assets and Liabilities
October 31, 2014
| | | | |
Assets: | |
Investments, at value (Cost $486,197,455) | | $ | 478,902,195 | |
Investments in affiliates, at value (Cost $236,458,757) | | | 228,694,248 | |
Total investments, at value (Cost $722,656,212) | | | 707,596,443 | |
Receivable for: | | | | |
Deposits with brokers for open futures contracts | | | 4,210,000 | |
Variation margin — futures | | | 919,580 | |
Fund shares sold | | | 2,844,324 | |
Dividends and interest | | | 7,584 | |
Swaps receivables | | | 16,912,814 | |
Unrealized appreciation on swap transactions — OTC | | | 478,450 | |
Investment for trustee deferred compensation and retirement plans | | | 65,353 | |
Other assets | | | 10,983 | |
Total assets | | | 733,045,531 | |
|
Liabilities: | |
Payable for: | | | | |
Fund shares reacquired | | | 2,803,319 | |
Accrued fees to affiliates | | | 239,522 | |
Accrued trustees’ and officers’ fees and benefits | | | 2,765 | |
Accrued other operating expenses | | | 93,095 | |
Trustee deferred compensation and retirement plans | | | 132,795 | |
Unrealized depreciation on swap transactions — OTC | | | 9,267,685 | |
Total liabilities | | | 12,539,181 | |
Net assets applicable to shares outstanding | | $ | 720,506,350 | |
|
Net assets consist of: | |
Shares of beneficial interest | | $ | 757,166,460 | |
Undistributed net investment income | | | 10,708,705 | |
Undistributed net realized gain (loss) | | | (30,461,223 | ) |
Net unrealized appreciation (depreciation) | | | (16,907,592 | ) |
| | | $ | 720,506,350 | |
| | | | |
Net Assets: | |
Class A | | $ | 47,338,644 | |
Class B | | $ | 513,756 | |
Class C | | $ | 3,611,869 | |
Class R | | $ | 370,580 | |
Class Y | | $ | 268,106,149 | |
Class R5 | | $ | 269,489,780 | |
Class R6 | | $ | 131,075,572 | |
|
Shares outstanding, $0.01 par value per share,
with an unlimited number of shares authorized: | |
Class A | | | 5,890,191 | |
Class B | | | 65,457 | |
Class C | | | 460,816 | |
Class R | | | 46,372 | |
Class Y | | | 32,975,843 | |
Class R5 | | | 33,144,776 | |
Class R6 | | | 16,113,650 | |
Class A: | | | | |
Net asset value per share | | $ | 8.04 | |
Maximum offering price per share | | | | |
(Net asset value of $8.04 ¸ 94.50%) | | $ | 8.51 | |
Class B: | | | | |
Net asset value and offering price per share | | $ | 7.85 | |
Class C: | | | | |
Net asset value and offering price per share | | $ | 7.84 | |
Class R: | | | | |
Net asset value and offering price per share | | $ | 7.99 | |
Class Y: | | | | |
Net asset value and offering price per share | | $ | 8.13 | |
Class R5: | | | | |
Net asset value and offering price per share | | $ | 8.13 | |
Class R6: | | | | |
Net asset value and offering price per share | | $ | 8.13 | |
See accompanying Notes to Consolidated Financial Statements which are an integral part of the financial statements.
13 Invesco Balanced-Risk Commodity Strategy Fund
Consolidated Statement of Operations
For the year ended October 31, 2014
| | | | |
Investment income: | |
Dividends from affiliates | | $ | 102,064 | |
Interest | | | 299,177 | |
Total investment income | | | 401,241 | |
| |
Expenses: | | | | |
Advisory fees | | | 7,887,512 | |
Administrative services fees | | | 207,100 | |
Custodian fees | | | 23,350 | |
Distribution fees: | | | | |
Class A | | | 149,995 | |
Class B | | | 7,387 | |
Class C | | | 41,998 | |
Class R | | | 1,996 | |
Transfer agent fees — A, B, C, R and Y | | | 801,864 | |
Transfer agent fees — R5 | | | 252,825 | |
Transfer agent fees — R6 | | | 228 | |
Trustees’ and officers’ fees and benefits | | | 46,235 | |
Other | | | 342,650 | |
Total expenses | | | 9,763,140 | |
Less: Fees waived, expenses reimbursed and expense offset arrangement(s) | | | (1,608,110 | ) |
Net expenses | | | 8,155,030 | |
Net investment income (loss) | | | (7,753,789 | ) |
| |
Realized and unrealized gain (loss) from: | | | | |
Net realized gain (loss) from: | | | | |
Investment securities | | | (2,592,703 | ) |
Futures contracts | | | (19,176,930 | ) |
Swap agreements | | | (51,412,255 | ) |
| | | | (73,181,888 | ) |
Change in net unrealized appreciation (depreciation) of: | | | | |
Investment securities | | | (9,844,246 | ) |
Futures contracts | | | 7,906,430 | |
Swap agreements | | | (4,039,999 | ) |
| | | | (5,977,815 | ) |
Net realized and unrealized gain (loss) | | | (79,159,703 | ) |
Net increase (decrease) in net assets resulting from operations | | $ | (86,913,492 | ) |
See accompanying Notes to Consolidated Financial Statements which are an integral part of the financial statements.
14 Invesco Balanced-Risk Commodity Strategy Fund
Consolidated Statement of Changes in Net Assets
For the years ended October 31, 2014 and 2013
| | | | | | | | |
| | | 2014 | | | 2013 | |
Operations: | | | | | | | | |
Net investment income (loss) | | $ | (7,753,789 | ) | | $ | (6,698,531 | ) |
Net realized gain (loss) | | | (73,181,888 | ) | | | (93,272,211 | ) |
Change in net unrealized appreciation (depreciation) | | | (5,977,815 | ) | | | (6,200,698 | ) |
Net increase (decrease) in net assets resulting from operations | | | (86,913,492 | ) | | | (106,171,440 | ) |
| | |
Distributions to shareholders from net investment income: | | | | | | | | |
Class A | | | — | | | | (2,068,417 | ) |
Class B | | | — | | | | (52,414 | ) |
Class C | | | — | | | | (132,315 | ) |
Class R | | | — | | | | (7,899 | ) |
Class Y | | | — | | | | (5,447,206 | ) |
Class R5 | | | — | | | | (5,160,504 | ) |
Class R6 | | | — | | | | (2,147,727 | ) |
Total distributions from net investment income | | | — | | | | (15,016,482 | ) |
| | |
Share transactions–net: | | | | | | | | |
Class A | | | (15,519,112 | ) | | | (14,386,021 | ) |
Class B | | | (497,940 | ) | | | (2,239,255 | ) |
Class C | | | (814,012 | ) | | | (2,412,304 | ) |
Class R | | | (84,233 | ) | | | 201,350 | |
Class Y | | | 49,824,052 | | | | 56,744,501 | |
Class R5 | | | 36,076,794 | | | | 67,679,089 | |
Class R6 | | | 21,545,333 | | | | 39,704,723 | |
Net increase in net assets resulting from share transactions | | | 90,530,882 | | | | 145,292,083 | |
Net increase in net assets | | | 3,617,390 | | | | 24,104,161 | |
| | |
Net assets: | | | | | | | | |
Beginning of year | | | 716,888,960 | | | | 692,784,799 | |
End of year (includes undistributed net investment income of $10,708,705 and $4,648,375, respectively) | | $ | 720,506,350 | | | $ | 716,888,960 | |
Notes to Consolidated Financial Statements
October 31, 2014
NOTE 1—Significant Accounting Policies
Invesco Balanced-Risk Commodity Strategy Fund (the “Fund”) is a series portfolio of AIM Investment Funds (Invesco Investment Funds) (the “Trust”). The Trust is organized as a Delaware statutory trust and is registered under the Investment Company Act of 1940, as amended (the “1940 Act”), as an open-end series management investment company consisting of twenty-four separate series portfolios, each authorized to issue an unlimited number of shares of beneficial interest. The assets, liabilities and operations of each portfolio are accounted for separately. Information presented in these consolidated financial statements pertains only to the Fund. Matters affecting each portfolio or class will be voted on exclusively by the shareholders of such portfolio or class.
The Fund will seek to gain exposure to the commodity markets primarily through investments in the Invesco Cayman Commodity Fund III Ltd. (the “Subsidiary”), a wholly-owned subsidiary of the Fund organized under the laws of the Cayman Islands. The Subsidiary was organized by the Fund to invest in commodity-linked derivatives. The Fund may invest up to 25% of its total assets in the Subsidiary.
The Fund’s investment objective is to provide total return.
The Fund currently consists of seven different classes of shares: Class A, Class B, Class C, Class R, Class Y, Class R5 and Class R6. Class A shares are sold with a front-end sales charge unless certain waiver criteria are met and under certain circumstances load waived shares may be subject to contingent deferred sales charges (“CDSC”). Class C shares are sold with a CDSC. Class R, Class Y, Class R5 and Class R6 shares are sold at net asset value. Effective November 30, 2010, new or additional investments in Class B shares are no longer permitted. Existing shareholders of Class B shares may continue to reinvest dividends and capital gains distributions in Class B shares until they convert to Class A shares. Also, shareholders in Class B shares will be able to exchange those shares for Class B shares of other Invesco Funds offering such shares until they convert to Class A shares. Generally, Class B shares will automatically convert to Class A shares on or about the month-end, which is at least eight years after the date of purchase. Redemption of Class B shares prior to the conversion date will be subject to a CDSC.
15 Invesco Balanced-Risk Commodity Strategy Fund
The following is a summary of the significant accounting policies followed by the Fund in the preparation of its consolidated financial statements.
| A. | Security Valuations — Securities, including restricted securities, are valued according to the following policy. |
Debt obligations (including convertible securities) and unlisted equities are fair valued using an evaluated quote provided by an independent pricing service. Evaluated quotes provided by the pricing service may be determined without exclusive reliance on quoted prices, and may reflect appropriate factors such as institution-size trading in similar groups of securities, developments related to specific securities, dividend rate (for unlisted equities), yield (for debt obligations), quality, type of issue, coupon rate (for debt obligations), maturity (for debt obligations), individual trading characteristics and other market data. Debt obligations are subject to interest rate and credit risks. In addition, all debt obligations involve some risk of default with respect to interest and/or principal payments.
A security listed or traded on an exchange (except convertible securities) is valued at its last sales price or official closing price as of the close of the customary trading session on the exchange where the security is principally traded, or lacking any sales or official closing price on a particular day, the security may be valued at the closing bid price on that day. Securities traded in the over-the-counter market are valued based on prices furnished by independent pricing services or market makers. When such securities are valued by an independent pricing service they may be considered fair valued. Futures contracts are valued at the final settlement price set by an exchange on which they are principally traded. Listed options are valued at the mean between the last bid and ask prices from the exchange on which they are principally traded. Options not listed on an exchange are valued by an independent source at the mean between the last bid and ask prices. For purposes of determining net asset value per share, futures and option contracts generally are valued 15 minutes after the close of the customary trading session of the New York Stock Exchange (“NYSE”).
Investments in open-end and closed-end registered investment companies that do not trade on an exchange are valued at the end of day net asset value per share. Investments in open-end and closed-end registered investment companies that trade on an exchange are valued at the last sales price or official closing price as of the close of the customary trading session on the exchange where the security is principally traded.
Swap agreements are fair valued using an evaluated quote provided by an independent pricing service. Evaluated quotes provided by the pricing service are valued based on a model which may include end of day net present values, spreads, ratings, industry, and company performance.
Foreign securities’ (including foreign exchange contracts) prices are converted into U.S. dollar amounts using the applicable exchange rates as of the close of the NYSE. If market quotations are available and reliable for foreign exchange-traded equity securities, the securities will be valued at the market quotations. Because trading hours for certain foreign securities end before the close of the NYSE, closing market quotations may become unreliable. If between the time trading ends on a particular security and the close of the customary trading session on the NYSE, events occur that the Adviser determines are significant and make the closing price unreliable, the Fund may fair value the security. If the event is likely to have affected the closing price of the security, the security will be valued at fair value in good faith using procedures approved by the Board of Trustees. Adjustments to closing prices to reflect fair value may also be based on a screening process of an independent pricing service to indicate the degree of certainty, based on historical data, that the closing price in the principal market where a foreign security trades is not the current value as of the close of the NYSE. Foreign securities’ prices meeting the approved degree of certainty that the price is not reflective of current value will be priced at the indication of fair value from the independent pricing service. Multiple factors may be considered by the independent pricing service in determining adjustments to reflect fair value and may include information relating to sector indices, American Depositary Receipts and domestic and foreign index futures. Foreign securities may have additional risks including exchange rate changes, potential for sharply devalued currencies and high inflation, political and economic upheaval, the relative lack of issuer information, relatively low market liquidity and the potential lack of strict financial and accounting controls and standards.
Securities for which market prices are not provided by any of the above methods may be valued based upon quotes furnished by independent sources. The last bid price may be used to value equity securities. The mean between the last bid and ask prices is used to value debt obligations, including corporate loans.
Securities for which market quotations are not readily available or became unreliable are valued at fair value as determined in good faith by or under the supervision of the Trust’s officers following procedures approved by the Board of Trustees. Issuer specific events, market trends, bid/ask quotes of brokers and information providers and other market data may be reviewed in the course of making a good faith determination of a security’s fair value.
The Fund may invest in securities that are subject to interest rate risk, meaning the risk that the prices will generally fall as interest rates rise and, conversely, the prices will generally rise as interest rates fall. Specific securities differ in their sensitivity to changes in interest rates depending on their individual characteristics. Changes in interest rates may result in increased market volatility, which may affect the value and/or liquidity of certain of the Fund’s investments.
Valuations change in response to many factors including the historical and prospective earnings of the issuer, the value of the issuer’s assets, general economic conditions, interest rates, investor perceptions and market liquidity. Because of the inherent uncertainties of valuation, the values reflected in the consolidated financial statements may materially differ from the value received upon actual sale of those investments.
| B. | Securities Transactions and Investment Income — Securities transactions are accounted for on a trade date basis. Realized gains or losses on sales are computed on the basis of specific identification of the securities sold. Interest income (net of withholding tax, if any) is recorded on the accrual basis from settlement date. Dividend income (net of withholding tax, if any) is recorded on the ex-dividend date. Bond premiums and discounts are amortized and/or accreted for financial reporting purposes. |
The Fund may periodically participate in litigation related to Fund investments. As such, the Fund may receive proceeds from litigation settlements. Any proceeds received are included in the Consolidated Statement of Operations as realized gain (loss) for investments no longer held and as unrealized gain (loss) for investments still held.
Brokerage commissions and mark ups are considered transaction costs and are recorded as an increase to the cost basis of securities purchased and/or a reduction of proceeds on a sale of securities. Such transaction costs are included in the determination of net realized and unrealized gain (loss) from investment securities reported in the Consolidated Statement of Operations and the Consolidated Statement of Changes in Net Assets and the net realized and unrealized gains (losses) on securities per share in the Consolidated Financial Highlights. Transaction costs are included in the calculation of the Fund’s net asset value and, accordingly, they reduce the Fund’s total returns. These transaction costs are not considered operating expenses and are not reflected in net investment income reported in the Consolidated Statement
16 Invesco Balanced-Risk Commodity Strategy Fund
of Operations and Consolidated Statement of Changes in Net Assets, or the net investment income per share and ratios of expenses and net investment income reported in the Consolidated Financial Highlights, nor are they limited by any expense limitation arrangements between the Fund and the investment adviser.
The Fund allocates income and realized and unrealized capital gains and losses to a class based on the relative net assets of each class.
| C. | Country Determination — For the purposes of making investment selection decisions and presentation in the Consolidated Schedule of Investments, the investment adviser may determine the country in which an issuer is located and/or credit risk exposure based on various factors. These factors include the laws of the country under which the issuer is organized, where the issuer maintains a principal office, the country in which the issuer derives 50% or more of its total revenues and the country that has the primary market for the issuer’s securities, as well as other criteria. Among the other criteria that may be evaluated for making this determination are the country in which the issuer maintains 50% or more of its assets, the type of security, financial guarantees and enhancements, the nature of the collateral and the sponsor organization. Country of issuer and/or credit risk exposure has been determined to be the United States of America, unless otherwise noted. |
| D. | Distributions — Distributions from net investment income and net realized capital gain, if any, are generally declared and paid annually and recorded on the ex-dividend date. The Fund may elect to treat a portion of the proceeds from redemptions as distributions for federal income tax purposes. |
| E. | Federal Income Taxes — The Fund intends to comply with the requirements of Subchapter M of the Internal Revenue Code of 1986, as amended (the “Internal Revenue Code”), necessary to qualify as a regulated investment company and to distribute substantially all of the Fund’s taxable earnings to shareholders. As such, the Fund will not be subject to federal income taxes on otherwise taxable income (including net realized capital gain) that is distributed to shareholders. Therefore, no provision for federal income taxes is recorded in the consolidated financial statements. |
The Fund recognizes the tax benefits of uncertain tax positions only when the position is more likely than not to be sustained. Management has analyzed the Fund’s uncertain tax positions and concluded that no liability for unrecognized tax benefits should be recorded related to uncertain tax positions. Management is not aware of any tax positions for which it is reasonably possible that the total amounts of unrecognized tax benefits will change materially in the next 12 months.
The Subsidiary is classified as a controlled foreign corporation under Subchapter N of the Internal Revenue Code. Therefore, the Fund is required to increase its taxable income by its share of the Subsidiary’s income. Net investment losses of the Subsidiary cannot be deducted by the Fund in the current period nor carried forward to offset taxable income in future periods.
The Fund files tax returns in the U.S. Federal jurisdiction and certain other jurisdictions. Generally the Fund is subject to examinations by such taxing authorities for up to three years after the filing of the return for the tax period.
| F. | Expenses — Fees provided for under the Rule 12b-1 plan of a particular class of the Fund are charged to the operations of such class. Transfer agency fees and expenses and other shareholder recordkeeping fees and expenses attributable to Class R5 and Class R6 are allocated to each share class based on relative net assets. Sub-accounting fees attributable to Class R5 are charged to the operations of the class. Transfer agency fees and expenses and other shareholder recordkeeping fees and expenses relating to all other classes are allocated among those classes based on relative net assets. All other expenses are allocated among the classes based on relative net assets. |
| G. | Accounting Estimates — The financial statements are prepared on a consolidated basis in conformity with accounting principles generally accepted in the United States of America (“GAAP”), which requires management to make estimates and assumptions that affect the reported amounts of assets and liabilities at the date of the financial statements and the reported amounts of revenues and expenses during the reporting period including estimates and assumptions related to taxation. Actual results could differ from those estimates by a significant amount. The accompanying financial statements reflect the financial position of the Fund and its Subsidiary and the results of operations on a consolidated basis. All inter-company accounts and transactions have been eliminated in consolidation. |
In addition, the Fund monitors for material events or transactions that may occur or become known after the period-end date and before the date the consolidated financial statements are released to print.
| H. | Indemnifications — Under the Trust’s organizational documents, each Trustee, officer, employee or other agent of the Trust, and under the Subsidiary’s organizational documents, the directors and officers of the Subsidiary, are indemnified against certain liabilities that may arise out of the performance of their duties to the Fund and/or the Subsidiary, respectively. Additionally, in the normal course of business, the Fund enters into contracts, including the Fund’s servicing agreements, that contain a variety of indemnification clauses. The Fund’s maximum exposure under these arrangements is unknown as this would involve future claims that may be made against the Fund that have not yet occurred. The risk of material loss as a result of such indemnification claims is considered remote. |
| I. | Structured Securities — The Fund may invest in structured securities. Structured securities are a type of derivative security whose value is determined by reference to changes in the value of underlying securities, currencies, interest rates, commodities, indices or other financial indicators (“reference instruments”). Most structured securities are fixed-income securities that have maturities of three years or less. Structured securities may be positively or negatively indexed (i.e., their principal value or interest rates may increase or decrease if the underlying reference instrument appreciates) and may have return characteristics similar to direct investments in the underlying reference instrument. |
Structured securities may entail a greater degree of market risk than other types of debt securities because the investor bears the risk of the reference instruments. In addition to the credit risk of structured securities and the normal risks of price changes in response to changes in interest rates, the principal amount of structured notes or indexed securities may decrease as a result of changes in the value of the underlying reference instruments. Changes in the daily value of structured securities are recorded as unrealized gains (losses) in the Consolidated Statement of Operations. When the structured securities mature or are sold, the Fund recognizes a realized gain (loss) on the Consolidated Statement of Operations.
| J. | Futures Contracts — The Fund may enter into futures contracts to manage exposure to interest rate, equity and market price movements and/or currency risks. A futures contract is an agreement between two parties (“Counterparties”) to purchase or sell a specified underlying security, currency or commodity (or delivery of a cash settlement price, in the case of an index future) for a fixed price at a future date. The Fund currently invests only in exchange-traded futures and they are standardized as to maturity date and underlying financial instrument. Initial margin deposits required upon entering into futures contracts are satisfied by the segregation of specific securities or cash as collateral at the futures commission merchant (broker). During the period the futures contracts are open, changes in the value of the contracts are recognized as |
17 Invesco Balanced-Risk Commodity Strategy Fund
| | unrealized gains or losses by recalculating the value of the contracts on a daily basis. Subsequent or variation margin payments are received or made depending upon whether unrealized gains or losses are incurred. These amounts are reflected as receivables or payables on the Consolidated Statement of Assets and Liabilities. When the contracts are closed or expire, the Fund recognizes a realized gain or loss equal to the difference between the proceeds from, or cost of, the closing transaction and the Fund’s basis in the contract. The net realized gain (loss) and the change in unrealized gain (loss) on futures contracts held during the period is included on the Consolidated Statement of Operations. The primary risks associated with futures contracts are market risk and the absence of a liquid secondary market. If the Fund were unable to liquidate a futures contract and/or enter into an offsetting closing transaction, the Fund would continue to be subject to market risk with respect to the value of the contracts and continue to be required to maintain the margin deposits on the futures contracts. Futures contracts have minimal Counterparty risk since the exchange’s clearinghouse, as Counterparty to all exchange-traded futures, guarantees the futures against default. Risks may exceed amounts recognized in the Consolidated Statement of Assets and Liabilities. |
| K. | Swap Agreements — The Fund may enter into various swap transactions, including interest rate, total return, index, currency and credit default swap contracts (“CDS”) for investment purposes or to manage interest rate, currency or credit risk. Such transactions are agreements between two parties (“Counterparties”). These agreements may contain among other conditions, events of default and termination events, and various covenants and representations such as provisions that require the Fund to maintain a pre-determined level of net assets, and/or provide limits regarding the decline of the Fund’s NAV over specific periods of time. If the Fund were to trigger such provisions and have open derivative positions at that time, the Counterparty may be able to terminate such agreement and request immediate payment in an amount equal to the net liability positions, if any. |
Interest rate, total return, index, and currency swap agreements are two-party contracts entered into primarily to exchange the returns (or differentials in rates of returns) earned or realized on particular predetermined investments or instruments. The gross returns to be exchanged or “swapped” between the parties are calculated with respect to a notional amount, i.e., the return on or increase in value of a particular dollar amount invested at a particular interest rate or return of an underlying asset, in a particular foreign currency, or in a “basket” of securities representing a particular index.
Changes in the value of swap agreements are recognized as unrealized gains (losses) in the Consolidated Statement of Operations by “marking to market” on a daily basis to reflect the value of the swap agreement at the end of each trading day. Payments received or paid at the beginning of the agreement are reflected as such on the Consolidated Statement of Assets and Liabilities and may be referred to as upfront payments. The Fund accrues for the fixed payment stream and amortizes upfront payments, if any, on swap agreements on a daily basis with the net amount, recorded as a component of realized gain (loss) on the Consolidated Statement of Operations. A liquidation payment received or made at the termination of a swap agreement is recorded as realized gain (loss) on the Consolidated Statement of Operations. The Fund segregates liquid securities having a value at least equal to the amount of the potential obligation of a Fund under any swap transaction. Entering into these agreements involves, to varying degrees, lack of liquidity and elements of credit, market, and Counterparty risk in excess of amounts recognized on the Consolidated Statement of Assets and Liabilities. Such risks involve the possibility that a swap is difficult to sell or liquidate; the Counterparty does not honor its obligations under the agreement and unfavorable interest rates and market fluctuations. It is possible that developments in the swaps market, including potential government regulation, could adversely affect the Fund’s ability to terminate existing swap agreements or to realize amounts to be received under such agreements. A short position in a security possesses more risk than holding the same security long. As there is no limit on how much the price of the security can increase, the Fund’s exposure is unlimited.
| L. | Other Risks — The Fund will seek to gain exposure to commodity markets primarily through an investment in the Subsidiary and through investments in exchange traded funds and commodity-linked derivatives. The Subsidiary, unlike the Fund, may invest without limitation in commodities, commodity-linked derivatives and other securities, such as exchange traded notes, that may provide leverage and non-leveraged exposure to commodity markets. The Fund is indirectly exposed to the risks associated with the Subsidiary’s investments. |
The Fund is non-diversified and may invest in securities of fewer issuers than if it were diversified. Thus, the value of the Fund’s shares may vary more widely and the Fund may be subject to greater market and credit risk than if the Fund invested more broadly.
| M. | Leverage Risk — Leverage exists when a Fund can lose more than it originally invests because it purchases or sells an instrument or enters into a transaction without investing an amount equal to the full economic exposure of the instrument or transaction. |
| N. | Collateral — To the extent the Fund has designated or segregated a security as collateral and that security is subsequently sold, it is the Fund’s practice to replace such collateral no later than the next business day. |
NOTE 2—Advisory Fees and Other Fees Paid to Affiliates
The Trust has entered into a master investment advisory agreement with Invesco Advisers, Inc. (the “Adviser” or “Invesco”). Under the terms of the investment advisory agreement, the Fund pays an advisory fee to the Adviser less the amount paid by the Subsidiary to the Adviser based on the annual rate of the Fund’s average daily net assets as follows:
| | | | | | |
| Average Daily Net Assets | | Rate |
First $250 million | | | 1 | .05% | | |
Next $250 million | | | 1 | .025% | | |
Next $500 million | | | 1 | .00% | | |
Next $1.5 billion | | | 0 | .975% | | |
Next $2.5 billion | | | 0 | .95% | | |
Next $2.5 billion | | | 0 | .925% | | |
Next $2.5 billion | | | 0 | .90% | | |
Over $10 billion | | | 0 | .875% | | |
For the year ended October 31, 2014, the effective advisory fees incurred by the Fund was 1.02%.
18 Invesco Balanced-Risk Commodity Strategy Fund
The Subsidiary has entered into a separate contract with the Adviser whereby the Adviser provides investment advisory and other services to the Subsidiary. In consideration of these services, the Subsidiary pays an advisory fee to the Adviser based on the annual rate of the Subsidiary’s average daily net assets as set forth in the table above.
Under the terms of a master sub-advisory agreement between the Adviser and each of Invesco Asset Management Deutschland GmbH, Invesco Asset Management Limited, Invesco Asset Management (Japan) Limited, Invesco Australia Limited, Invesco Hong Kong Limited, Invesco Senior Secured Management, Inc., Invesco Canada Ltd. and Invesco PowerShares Capital Management LLC (collectively, the “Affiliated Sub-Advisers”) the Adviser, not the Fund, may pay 40% of the fees paid to the Adviser to any such Affiliated Sub-Adviser(s) that provide(s) discretionary investment management services to the Fund based on the percentage of assets allocated to such Sub-Adviser(s).
Effective July 1, 2014, the Adviser has contractually agreed, through at least June 30, 2015, to waive advisory fees and/or reimburse expenses to the extent necessary to limit total annual fund operating expenses after fee waivers and/or reimbursements (excluding certain items discussed below) of Class A, Class B, Class C, Class R, Class Y, Class R5 and Class R6 shares to 2.00%, 2.75%, 2.75%, 2.25%, 1.75%, 1.75% and 1.75% of average daily net assets, respectively. Prior to July 1, 2014, the Adviser had contractually agreed to waive advisory fees and/or reimburse expenses to the extent necessary to limit total annual fund operating expenses after fee waiver and/or expense reimbursement (excluding certain items discussed below) of Class A, Class B, Class C, Class R, Class Y, Class R5 and Class R6 shares to 1.22%, 1.97%, 1.97%, 1.47%, 0.97%, 0.97% and 0.97% of average daily net assets, respectively. In determining the Adviser’s obligation to waive advisory fees and/or reimburse expenses, the following expenses are not taken into account, and could cause total annual fund operating expenses after fee waiver and/or expense reimbursement to exceed the numbers reflected above: (1) interest; (2) taxes; (3) dividend expense on short sales; (4) extraordinary or non-routine items, including litigation expenses; and (5) expenses that the Fund has incurred but did not actually pay because of an expense offset arrangement. Acquired Fund Fees and Expenses are not operating expenses of a Fund directly, but are fees and expenses, including management fees of the investment companies in which a Fund invests. As a result, the total annual fund operating expenses after expense reimbursement may exceed the expense limits above. Unless Invesco continues the fee waiver agreement, it will terminate on June 30, 2015. The fee waiver agreement cannot be terminated during its term.
Further, the Adviser has contractually agreed, through at least June 30, 2016, to waive the advisory fee payable by the Fund in an amount equal to 100% of the net advisory fees the Adviser receives from the affiliated money market funds on investments by the Fund of uninvested cash in such affiliated money market funds.
For the year ended October 31, 2014, the Adviser waived advisory fees of $862,007 and reimbursed class level expenses of $94,637, $1,165, $6,625, $630, $471,705, $169,316 and $228 of Class A, Class B, Class C, Class R, Class Y, Class R5 and Class R6 shares, respectively.
The Trust has entered into a master administrative services agreement with Invesco pursuant to which the Fund has agreed to pay Invesco for certain administrative costs incurred in providing accounting services to the Fund. For the year ended October 31, 2014, expenses incurred under the agreement are shown in the Consolidated Statement of Operations as Administrative services fees.
The Trust has entered into a transfer agency and service agreement with Invesco Investment Services, Inc. (“IIS”) pursuant to which the Fund has agreed to pay IIS a fee for providing transfer agency and shareholder services to the Fund and reimburse IIS for certain expenses incurred by IIS in the course of providing such services. IIS may make payments to intermediaries that provide omnibus account services, sub-accounting services and/or networking services. All fees payable by IIS to intermediaries that provide omnibus account services or sub-accounting are charged back to the Fund, subject to certain limitations approved by the Trust’s Board of Trustees. For the year ended October 31, 2014, expenses incurred under the agreement are shown in the Consolidated Statement of Operations as Transfer agent fees.
The Trust has entered into master distribution agreements with Invesco Distributors, Inc. (“IDI”) to serve as the distributor for the Class A, Class B, Class C, Class R, Class Y, Class R5 and Class R6 shares of the Fund. The Trust has adopted plans pursuant to Rule 12b-1 under the 1940 Act with respect to the Fund’s Class A, Class B, Class C and Class R shares (collectively, the “Plans”). The Fund, pursuant to the Plans, pays IDI compensation at the annual rate of 0.25% of the Fund’s average daily net assets of Class A shares, 1.00% of the average daily net assets of Class B and Class C shares and 0.50% of the average daily net assets of Class R shares. Of the Plan payments, up to 0.25% of the average daily net assets of each class of shares may be paid to furnish continuing personal shareholder services to customers who purchase and own shares of such classes. Any amounts not paid as a service fee under the Plans would constitute an asset-based sales charge. Rules of the Financial Industry Regulatory Authority (“FINRA”) impose a cap on the total sales charges, including asset-based sales charges, that may be paid by any class of shares of the Fund. For the year ended October 31, 2014, expenses incurred under the Plans are shown in the Consolidated Statement of Operations as Distribution fees.
Front-end sales commissions and CDSC (collectively, the “sales charges”) are not recorded as expenses of the Fund. Front-end sales commissions are deducted from proceeds from the sales of Fund shares prior to investment in Class A shares of the Fund. CDSC are deducted from redemption proceeds prior to remittance to the shareholder. During the year ended October 31, 2014, IDI advised the Fund that IDI retained $5,077 in front-end sales commissions from the sale of Class A shares and $110, $366 and $139 from Class A, Class B and Class C shares, respectively, for CDSC imposed on redemptions by shareholders.
Certain officers and trustees of the Trust are officers and directors of the Adviser, IIS and/or IDI.
NOTE 3—Additional Valuation Information
GAAP defines fair value as the price that would be received to sell an asset or paid to transfer a liability in an orderly transaction between market participants at the measurement date, under current market conditions. GAAP establishes a hierarchy that prioritizes the inputs to valuation methods, giving the highest priority to readily available unadjusted quoted prices in an active market for identical assets (Level 1) and the lowest priority to significant unobservable inputs (Level 3), generally when market prices are not readily available or are unreliable. Based on the valuation inputs, the securities or other investments are tiered into one of three levels. Changes in valuation methods may result in transfers in or out of an investment’s assigned level:
| | Level 1 — | Prices are determined using quoted prices in an active market for identical assets. |
| | Level 2 — | Prices are determined using other significant observable inputs. Observable inputs are inputs that other market participants may use in pricing a security. These may include quoted prices for similar securities, interest rates, prepayment speeds, credit risk, yield curves, loss severities, default rates, discount rates, volatilities and others. |
19 Invesco Balanced-Risk Commodity Strategy Fund
| | Level 3 — | Prices are determined using significant unobservable inputs. In situations where quoted prices or observable inputs are unavailable (for example, when there is little or no market activity for an investment at the end of the period), unobservable inputs may be used. Unobservable inputs reflect the Fund’s own assumptions about the factors market participants would use in determining fair value of the securities or instruments and would be based on the best available information. |
The following is a summary of the tiered valuation input levels, as of October 31, 2014. The level assigned to the securities valuations may not be an indication of the risk or liquidity associated with investing in those securities. Because of the inherent uncertainties of valuation, the values reflected in the financial statements may materially differ from the value received upon actual sale of those investments.
| | | | | | | | | | | | | | | | |
| | | Level 1 | | | Level 2 | | | Level 3 | | | Total | |
Commodity-Linked Securities | | $ | — | | | $ | 12,805,255 | | | $ | — | | | $ | 12,805,255 | |
Exchange Traded Fund | | | 21,024,180 | | | | — | | | | — | | | | 21,024,180 | |
U.S. Treasury Securities | | | — | | | | 466,096,940 | | | | — | | | | 466,096,940 | |
Money Market Funds | | | 207,670,068 | | | | — | | | | — | | | | 207,670,068 | |
| | | | 228,694,248 | | | | 478,902,195 | | | | — | | | | 707,596,443 | |
Futures* | | | 6,941,412 | | | | — | | | | — | | | | 6,941,412 | |
Swap Agreements* | | | — | | | | (8,789,235 | ) | | | — | | | | (8,789,235 | ) |
Total Investments | | $ | 235,635,660 | | | $ | 470,112,960 | | | $ | — | | | $ | 705,748,620 | |
| * | Unrealized appreciation (depreciation). |
NOTE 4—Derivative Investments
Value of Derivative Investments at Period-End
The table below summarizes the value of the Fund’s derivative investments, detailed by primary risk exposure, held as of October 31, 2014:
| | | | | | | | |
| | | Value | |
| Risk Exposure/Derivative Type | | Assets | | | Liabilities | |
Commodity risk: | | | | | | | | |
Futures contracts(a) | | $ | 7,114,039 | | | $ | (172,627 | ) |
Swap agreements(b) | | | 478,450 | | | | (9,267,685 | ) |
Total | | $ | 7,592,489 | | | $ | (9,440,312 | ) |
| (a) | Includes cumulative appreciation (depreciation) of futures contracts. Only current day’s variation margin receivable is reported within the Consolidated Statement of Assets and Liabilities. |
| (b) | Values are disclosed on the Consolidated Statement of Assets and Liabilities under the captions Unrealized appreciation on swap agreements and Unrealized depreciation on swap agreements. |
Effect of Derivative Investments for the year ended October 31, 2014
The table below summarizes the gains (losses) on derivative investments, detailed by primary risk exposure, recognized in earnings during the period:
| | | | | | | | |
| | | Location of Gain (Loss) on
Consolidated Statement of Operations | |
| | | Futures
Contracts | | | Swap
Agreements | |
Realized Gain (Loss): | | | | | | | | |
Commodity risk | | $ | (19,176,930 | ) | | $ | (51,412,255 | ) |
Change in Unrealized Appreciation (Depreciation): | | | | | | | | |
Commodity risk | | | 7,906,430 | | | | (4,039,999 | ) |
Total | | $ | (11,270,500 | ) | | $ | (55,452,254 | ) |
The table below summarizes the average notional value of futures contracts and swap agreements outstanding during the period.
| | | | | | | | |
| | | Futures Contracts | | | Swap Agreements | |
Average notional value | | $ | 155,936,206 | | | $ | 713,665,968 | |
Offsetting Assets and Liabilities
Accounting Standards Update (“ASU”) No. 2011-11, Disclosures about Offsetting Assets and Liabilities, which was subsequently clarified in Financial Accounting Standards Board ASU 2013-01 “Clarifying the Scope of Disclosures about Offsetting Assets and Liabilities” is intended to enhance disclosures about financial instruments and derivative instruments that are subject to offsetting arrangements on the Consolidated Statement of Assets and Liabilities and to enable investors to better understand the effect of those arrangements on its financial position. In order for an arrangement to be eligible for netting, the Fund must have a basis to conclude that such netting arrangements are legally enforceable. The Fund enters into netting agreements and collateral agreements in an attempt to reduce the Fund’s Counterparty credit risk by providing for a single net settlement with a Counterparty of all financial transactions covered by the agreement in an event of default as defined under such agreement.
20 Invesco Balanced-Risk Commodity Strategy Fund
There were no derivative instruments subject to a netting agreement for which the Fund is not currently netting. The following tables present derivative instruments that are either subject to an enforceable netting agreement or offset by collateral arrangements as of October 31, 2014.
| | | | | | | | | | | | | | | | | | | | | | | | |
| Assets: | |
| | | Gross amounts presented in Consolidated Statement of Assets & Liabilities | | | Gross amounts offset in Consolidated Statement of Assets & Liabilities | | | Net amounts of assets presented in Consolidated Statement of Assets and Liabilities | | | Collateral Received | | | | |
| Counterparty | | | | | Financial Instruments | | | Cash | | | Net Amount | |
Subsidiary | | | | | | | | | | | | | | | | | | | | | | | | |
Barclays Bank PLC | | $ | 464,679 | | | $ | (464,679 | ) | | $ | — | | | $ | — | | | $ | — | | | $ | — | |
Goldman Sachs International | | | 19,750,579 | | | | (4,739,223 | ) | | | 15,011,356 | | | | — | | | | — | | | | 15,011,356 | |
Macquarie Bank Ltd. | | | 13,771 | | | | — | | | | 13,771 | | | | — | | | | — | | | | 13,771 | |
Merrill Lynch International | | | 464,732 | | | | (464,732 | ) | | | — | | | | — | | | | — | | | | — | |
Total | | $ | 20,693,761 | | | | (5,668,634 | ) | | $ | 15,025,127 | | | $ | — | | | $ | — | | | $ | 15,025,127 | |
| | | | | |
| | | | | | | | | | | | | | | | | | | | |
| Liabilities: | | | | | | | | | | | | | | | |
| | | Gross amounts presented in Consolidated Statement of Assets & Liabilities | | | Gross amounts offset in Consolidated Statement of Assets & Liabilities | | | Net amounts of liabilities presented in Consolidated Statement of Assets and Liabilities | | | Collateral Pledged | | | | |
| Counterparty | | | | | Financial Instruments | | | Cash | | | Net Amount | |
Subsidiary | | | | | | | | | | | | | | | | | | | | | | | | |
Barclays Bank PLC | | $ | 4,147,328 | | | $ | (464,679 | ) | | $ | 3,682,649 | | | $ | (3,682,649 | ) | | $ | — | | | $ | — | |
Canadian Imperial Bank of Commerce | | | 25,300 | | | | — | | | | 25,300 | | | | (25,300 | ) | | | — | | | | — | |
Goldman Sachs International | | | 4,739,223 | | | | (4,739,223 | ) | | | — | | | | — | | | | — | | | | — | |
JPMorgan Chase Bank, N.A. | | | 3,086,270 | | | | — | | | | 3,086,270 | | | | (3,086,270 | ) | | | — | | | | — | |
Merrill Lynch International | | | 572,061 | | | | (464,732 | ) | | | 107,329 | | | | (107,329 | ) | | | — | | | | — | |
Total | | $ | 12,570,182 | | | $ | (5,668,634 | ) | | $ | 6,901,548 | | | $ | (6,901,548 | ) | | $ | — | | | $ | — | |
NOTE 5—Subsidiary Information
The Fund’s Consolidated Schedule of Investments includes the holdings, including any investments in derivatives, of both the Fund and the Subsidiary. The Fund’s Consolidated Statement of Assets and Liabilities, Consolidated Statement of Operations and Consolidated Statement of Changes in Net Assets include the account balances of both the Fund and the Subsidiary and all interfund transactions have been eliminated.
The table below summarizes the financial information of the Subsidiary recognized in the consolidated financial statements referred to above.
| | | | |
| Selected Financial Information | | Invesco Cayman Commodity Fund III Ltd. (the “Subsidiary”) | |
Total assets | | $ | 173,278,419 | |
Total liabilities | | | (9,272,807 | ) |
Net assets | | | 164,005,612 | |
Total investment income | | | 87,295 | |
Net investment income (loss) | | | (1,802,080 | ) |
Net realized gain (loss) from: | | | | |
Investment securities | | | 328 | |
Futures contracts | | | (19,176,930 | ) |
Swap agreements | | | (51,412,255 | ) |
Change in net unrealized appreciation (depreciation) of: | | | | |
Investment securities | | | 6,188 | |
Futures contracts | | | 7,906,430 | |
Swap agreements | | | (4,039,999 | ) |
Increase (decrease) in net assets resulting from operations | | $ | (68,518,318 | ) |
NOTE 6—Investments in Other Affiliates
The 1940 Act defines affiliates as those issuances in which a fund holds 5% or more of the outstanding voting securities. The Fund has not owned enough of the outstanding voting securities of the issuer to have control (as defined in the 1940 Act) of that issuer. The following is a summary of the investments in other affiliates for the year ended October 31, 2014.
| | | | | | | | | | | | | | | | | | | | | | | | | | | | |
| | | Value 10/31/13 | | | Purchases at Cost | | | Proceeds from Sales | | | Change in Unrealized Appreciation (Depreciation) | | | Realized Gain (Loss) | | | Value 10/31/14 | | | Dividend Income | |
PowerShares DB Gold Fund | | $ | 25,321,440 | | | $ | 2,392,512 | | | $ | (3,514,795 | ) | | $ | (1,930,365 | ) | | $ | (1,244,612 | ) | | $ | 21,024,180 | | | $ | — | |
21 Invesco Balanced-Risk Commodity Strategy Fund
NOTE 7—Expense Offset Arrangement(s)
The expense offset arrangement is comprised of transfer agency credits which result from balances in demand deposit accounts used by the transfer agent for clearing shareholder transactions. For the year ended October 31, 2014, the Fund received credits from this arrangement, which resulted in the reduction of the Fund’s total expenses of $1,797.
NOTE 8—Trustees’ and Officers’ Fees and Benefits
Trustees’ and Officers’ Fees and Benefits include amounts accrued by the Fund to pay remuneration to certain Trustees and Officers of the Fund. Trustees have the option to defer compensation payable by the Fund, and Trustees’ and Officers’ Fees and Benefits also include amounts accrued by the Fund to fund such deferred compensation amounts. Those Trustees who defer compensation have the option to select various Invesco Funds in which their deferral accounts shall be deemed to be invested. Finally, certain current Trustees were eligible to participate in a retirement plan that provided for benefits to be paid upon retirement to Trustees over a period of time based on the number of years of service. The Fund may have certain former Trustees who also participate in a retirement plan and receive benefits under such plan. Trustees’ and Officers’ Fees and Benefits include amounts accrued by the Fund to fund such retirement benefits. Obligations under the deferred compensation and retirement plans represent unsecured claims against the general assets of the Fund.
NOTE 9—Cash Balances
The Fund is permitted to temporarily carry a negative or overdrawn balance in its account with State Street Bank and Trust Company, the custodian bank. Such balances, if any at period end, are shown in the Consolidated Statement of Assets and Liabilities under the payable caption Amount due custodian. To compensate the custodian bank for such overdrafts, the overdrawn Fund may either (1) leave funds as a compensating balance in the account so the custodian bank can be compensated by earning the additional interest; or (2) compensate by paying the custodian bank at a rate agreed upon by the custodian bank and Invesco, not to exceed the contractually agreed upon rate.
NOTE 10—Distributions to Shareholders and Tax Components of Net Assets
Tax Character of Distributions to Shareholders Paid During the Fiscal Years Ended October 31, 2014 and 2013:
| | | | | | | | |
| | | 2014 | | | 2013 | |
Ordinary income | | $ | — | | | $ | 15,016,482 | |
Tax Components of Net Assets at Period-End:
| | | | |
| | | 2014 | |
Net unrealized appreciation (depreciation) — investments | | $ | (8,458,052 | ) |
Temporary book/tax differences | | | (125,720 | ) |
Capital loss carryforward | | | (22,866,015 | ) |
Late-year ordinary loss deferral | | | (5,210,323 | ) |
Shares of beneficial interest | | | 757,166,460 | |
Total net assets | | $ | 720,506,350 | |
The difference between book-basis and tax-basis unrealized appreciation (depreciation) is due to differences in the timing of recognition of gains and losses on investments for tax and book purposes. The Fund’s net unrealized appreciation (depreciation) difference is attributable primarily to wash sales and partnership adjustments.
The temporary book/tax differences are a result of timing differences between book and tax recognition of income and/or expenses. The Fund’s temporary book/tax differences are the result of the trustee deferral of compensation and retirement plan benefits.
Capital loss carryforward is calculated and reported as of a specific date. Results of transactions and other activity after that date may affect the amount of capital loss carryforward actually available for the Fund to utilize. Capital losses generated in years beginning after December 22, 2010 can be carried forward for an unlimited period, whereas previous losses expire in eight tax years. Capital losses with an expiration period may not be used to offset capital gains until all net capital losses without an expiration date have been utilized. Capital loss carryforwards with no expiration date will retain their character as either short-term or long-term capital losses instead of as short-term capital losses as under prior law. The ability to utilize capital loss carryforwards in the future may be limited under the Internal Revenue Code and related regulations based on the results of future transactions.
The Fund has a capital loss carryforward as of October 31, 2014, which expires as follows:
| | | | | | | | | | | | |
| Capital Loss Carryforward* | |
| Expiration | | Short-Term | | | Long-Term | | | Total | |
October 31, 2015 | | $ | 2,394,859 | | | $ | — | | | $ | 2,394,859 | |
October 31, 2016 | | | 276,503 | | | | — | | | | 276,503 | |
Not subject to expiration | | | 12,990,329 | | | | 7,204,324 | | | | 20,194,653 | |
| | | $ | 15,661,691 | | | $ | 7,204,324 | | | $ | 22,866,015 | |
| * | Capital loss carryforward as of the date listed above is reduced for limitations, if any, to the extent required by the Internal Revenue Code and may be further limited depending upon a variety of factors, including the realization of net unrealized gains or losses as of the date of any reorganization. |
22 Invesco Balanced-Risk Commodity Strategy Fund
NOTE 11—Investment Securities
The aggregate amount of investment securities (other than short-term securities, U.S. Treasury obligations and money market funds, if any) purchased and sold by the Fund during the year ended October 31, 2014 was $22,542,512 and $22,529,666, respectively. During the same period, purchases and sales of U.S. Treasury obligations were $264,382,087 and $0, respectively. Cost of investments on a tax basis includes the adjustments for financial reporting purposes as of the most recently completed federal income tax reporting period-end.”
| | | | |
| Unrealized Appreciation (Depreciation) of Investment Securities on a Tax Basis | |
Aggregate unrealized appreciation of investment securities | | $ | 49,485 | |
Aggregate unrealized (depreciation) of investment securities | | | (8,507,537 | ) |
Net unrealized appreciation (depreciation) of investment securities | | $ | (8,458,052 | ) |
Cost of investments for tax purposes is $716,054,495.
NOTE 12—Reclassification of Permanent Differences
Primarily as a result of differing book/tax treatment of swap agreement income, net operating losses and net investment losses from subsidiary, on October 31, 2014, undistributed net investment income was increased by $13,814,119, undistributed net realized gain (loss) was increased by $55,597,197 and shares of beneficial interest was decreased by $69,411,316. This reclassification had no effect on the net assets of the Fund.
NOTE 13—Share Information
| | | | | | | | | | | | | | | | |
| | | Summary of Share Activity | |
| | | Years ended October 31, | |
| | | 2014(a) | | | 2013 | |
| | | Shares | | | Amount | | | Shares | | | Amount | |
Sold: | | | | | | | | | | | | | | | | |
Class A | | | 2,976,484 | | | $ | 26,030,155 | | | | 3,242,215 | | | $ | 31,871,128 | |
Class B | | | 904 | | | | 7,902 | | | | 2,089 | | | | 21,181 | |
Class C | | | 95,677 | | | | 824,090 | | | | 32,181 | | | | 317,106 | |
Class R | | | 15,425 | | | | 135,101 | | | | 29,603 | | | | 295,450 | |
Class Y | | | 33,970,673 | | | | 301,075,976 | | | | 23,021,225 | | | | 223,157,442 | |
Class R5 | | | 6,288,265 | | | | 55,370,590 | | | | 8,552,227 | | | | 81,321,320 | |
Class R6 | | | 3,104,708 | | | | 27,058,977 | | | | 5,383,293 | | | | 50,562,789 | |
| | | | |
Issued as reinvestment of dividends: | | | | | | | | | | | | | | | | |
Class A | | | — | | | | — | | | | 183,695 | | | | 1,899,098 | |
Class B | | | — | | | | — | | | | 4,712 | | | | 48,335 | |
Class C | | | — | | | | — | | | | 11,826 | | | | 120,889 | |
Class R | | | — | | | | — | | | | 744 | | | | 7,684 | |
Class Y | | | — | | | | — | | | | 193,880 | | | | 2,008,312 | |
Class R5 | | | — | | | | — | | | | 490,774 | | | | 5,103,801 | |
Class R6 | | | — | | | | — | | | | 206,575 | | | | 2,147,727 | |
| | | | |
Automatic conversion of Class B shares to Class A shares: | | | | | | | | | | | | | | | | |
Class A | | | 36,589 | | | | 323,416 | | | | 169,574 | | | | 1,648,151 | |
Class B | | | (37,280 | ) | | | (323,416 | ) | | | (171,769 | ) | | | (1,648,151 | ) |
| | | | |
Reacquired: | | | | | | | | | | | | | | | | |
Class A | | | (4,784,440 | ) | | | (41,872,683 | ) | | | (5,218,062 | ) | | | (49,804,398 | ) |
Class B | | | (21,273 | ) | | | (182,426 | ) | | | (68,219 | ) | | | (660,620 | ) |
Class C | | | (191,231 | ) | | | (1,638,102 | ) | | | (299,424 | ) | | | (2,850,299 | ) |
Class R | | | (24,847 | ) | | | (219,334 | ) | | | (10,640 | ) | | | (101,784 | ) |
Class Y | | | (28,413,450 | ) | | | (251,251,924 | ) | | | (18,039,750 | ) | | | (168,421,253 | ) |
Class R5 | | | (2,277,011 | ) | | | (19,293,796 | ) | | | (2,005,389 | ) | | | (18,746,032 | ) |
Class R6 | | | (622,491 | ) | | | (5,513,644 | ) | | | (1,338,335 | ) | | | (13,005,793 | ) |
Net increase in share activity | | | 10,116,702 | | | $ | 90,530,882 | | | | 14,373,025 | | | $ | 145,292,083 | |
| (a) | There is an entity that is a record owner of more than 5% of the outstanding shares of the Fund and owns 34% of the outstanding shares of the Fund. IDI has an agreement with this entity to sell Fund shares. The Fund, Invesco and/or Invesco affiliates may make payments to this entity, which is considered to be related to the Fund, for providing services to the Fund, Invesco and/or Invesco affiliates including but not limited to services such as securities brokerage, distribution, third party record keeping and account servicing. The Trust has no knowledge as to whether all or any portion of the shares owned of record by this entity are also owned beneficially. |
| | In addition, 18% of the outstanding shares of the Fund are owned by affiliated mutual funds. Affiliated mutual funds are mutual funds that are advised by Invesco. |
23 Invesco Balanced-Risk Commodity Strategy Fund
NOTE 14—Consolidated Financial Highlights
The following schedule presents financial highlights for a share of the Fund outstanding throughout the periods indicated.
| | | | | | | | | | | | | | | | | | | | | | | | | | | | | | | | | | | | | | | | | | | | | | | | |
| | | Net asset
value,
beginning
of period | | | Net
investment
income (loss)(a) | | | Net gains
(losses) on securities (both
realized and
unrealized) | | | Total from
investment operations | | | Dividends
from net
investment income | | | Net asset value, end of period | | | Total return(b) | | | Net assets,
end of period (000’s omitted) | | | Ratio of
expenses to average net assets
with fee waivers
and/or expenses absorbed | | | Ratio of
expenses
to average net assets without fee waivers
and/or expenses
absorbed | | | Ratio of net
investment
income (loss) to average
net assets | | | Portfolio turnover(c) | |
Class A | | | | | | | | | | | | | | | | | | | | | | | | | | | | | | | | | | | | | | | | | | | | | | | | |
Year ended 10/31/14 | | $ | 9.05 | | | $ | (0.11 | ) | | $ | (0.90 | ) | | $ | (1.01 | ) | | $ | — | | | $ | 8.04 | | | | (11.16 | )% | | $ | 47,339 | | | | 1.30 | %(d) | | | 1.57 | %(d) | | | (1.25 | )%(d) | | | 21 | % |
Year ended 10/31/13 | | | 10.73 | | | | (0.11 | ) | | | (1.35 | ) | | | (1.46 | ) | | | (0.22 | ) | | | 9.05 | | | | (13.89 | ) | | | 69,350 | | | | 1.22 | | | | 1.47 | | | | (1.14 | ) | | | 47 | |
Year ended 10/31/12 | | | 10.42 | | | | (0.12 | ) | | | 0.43 | | | | 0.31 | | | | — | | | | 10.73 | | | | 2.97 | | | | 99,577 | | | | 1.22 | | | | 1.46 | | | | (1.13 | ) | | | 152 | |
Year ended 10/31/11(e) | | | 10.00 | | | | (0.12 | ) | | | 0.54 | | | | 0.42 | | | | — | | | | 10.42 | | | | 4.20 | | | | 7,659 | | | | 1.22 | (f) | | | 1.54 | (f) | | | (1.13 | )(f) | | | 0 | |
Class B | | | | | | | | | | | | | | | | | | | | | | | | | | | | | | | | | | | | | | | | | | | | | | | | |
Year ended 10/31/14 | | | 8.91 | | | | (0.17 | ) | | | (0.89 | ) | | | (1.06 | ) | | | — | | | | 7.85 | | | | (11.90 | ) | | | 514 | | | | 2.05 | (d) | | | 2.32 | (d) | | | (2.00 | )(d) | | | 21 | |
Year ended 10/31/13 | | | 10.59 | | | | (0.18 | ) | | | (1.33 | ) | | | (1.51 | ) | | | (0.17 | ) | | | 8.91 | | | | (14.44 | ) | | | 1,096 | | | | 1.97 | | | | 2.22 | | | | (1.89 | ) | | | 47 | |
Year ended 10/31/12 | | | 10.36 | | | | (0.20 | ) | | | 0.43 | | | | 0.23 | | | | — | | | | 10.59 | | | | 2.22 | | | | 3,773 | | | | 1.97 | | | | 2.21 | | | | (1.88 | ) | | | 152 | |
Year ended 10/31/11(e) | | | 10.00 | | | | (0.19 | ) | | | 0.55 | | | | 0.36 | | | | — | | | | 10.36 | | | | 3.60 | | | | 277 | | | | 1.97 | (f) | | | 2.29 | (f) | | | (1.88 | )(f) | | | 0 | |
Class C | | | | | | | | | | | | | | | | | | | | | | | | | | | | | | | | | | | | | | | | | | | | | | | | |
Year ended 10/31/14 | | | 8.89 | | | | (0.17 | ) | | | (0.88 | ) | | | (1.05 | ) | | | — | | | | 7.84 | | | | (11.81 | ) | | | 3,612 | | | | 2.05 | (d) | | | 2.32 | (d) | | | (2.00 | )(d) | | | 21 | |
Year ended 10/31/13 | | | 10.58 | | | | (0.18 | ) | | | (1.34 | ) | | | (1.52 | ) | | | (0.17 | ) | | | 8.89 | | | | (14.55 | ) | | | 4,948 | | | | 1.97 | | | | 2.22 | | | | (1.89 | ) | | | 47 | |
Year ended 10/31/12 | | | 10.35 | | | | (0.20 | ) | | | 0.43 | | | | 0.23 | | | | — | | | | 10.58 | | | | 2.22 | | | | 8,585 | | | | 1.97 | | | | 2.21 | | | | (1.88 | ) | | | 152 | |
Year ended 10/31/11(e) | | | 10.00 | | | | (0.19 | ) | | | 0.54 | | | | 0.35 | | | | — | | | | 10.35 | | | | 3.50 | | | | 1,822 | | | | 1.97 | (f) | | | 2.29 | (f) | | | (1.88 | )(f) | | | 0 | |
Class R | | | | | | | | | | | | | | | | | | | | | | | | | | | | | | | | | | | | | | | | | | | | | | | | |
Year ended 10/31/14 | | | 9.02 | | | | (0.13 | ) | | | (0.90 | ) | | | (1.03 | ) | | | — | | | | 7.99 | | | | (11.42 | ) | | | 371 | | | | 1.55 | (d) | | | 1.82 | (d) | | | (1.50 | )(d) | | | 21 | |
Year ended 10/31/13 | | | 10.71 | | | | (0.13 | ) | | | (1.36 | ) | | | (1.49 | ) | | | (0.20 | ) | | | 9.02 | | | | (14.13 | ) | | | 504 | | | | 1.47 | | | | 1.72 | | | | (1.39 | ) | | | 47 | |
Year ended 10/31/12 | | | 10.42 | | | | (0.15 | ) | | | 0.44 | | | | 0.29 | | | | — | | | | 10.71 | | | | 2.78 | | | | 386 | | | | 1.47 | | | | 1.71 | | | | (1.38 | ) | | | 152 | |
Year ended 10/31/11(e) | | | 10.00 | | | | (0.14 | ) | | | 0.56 | | | | 0.42 | | | | — | | | | 10.42 | | | | 4.20 | | | | 111 | | | | 1.47 | (f) | | | 1.79 | (f) | | | (1.38 | )(f) | | | 0 | |
Class Y | | | | | | | | | | | | | | | | | | | | | | | | | | | | | | | | | | | | | | | | | | | | | | | | |
Year ended 10/31/14 | | | 9.13 | | | | (0.09 | ) | | | (0.91 | ) | | | (1.00 | ) | | | — | | | | 8.13 | | | | (10.95 | ) | | | 268,106 | | | | 1.05 | (d) | | | 1.32 | (d) | | | (1.00 | )(d) | | | 21 | |
Year ended 10/31/13 | | | 10.81 | | | | (0.09 | ) | | | (1.36 | ) | | | (1.45 | ) | | | (0.23 | ) | | | 9.13 | | | | (13.69 | ) | | | 250,463 | | | | 0.97 | | | | 1.22 | | | | (0.89 | ) | | | 47 | |
Year ended 10/31/12 | | | 10.47 | | | | (0.09 | ) | | | 0.43 | | | | 0.34 | | | | — | | | | 10.81 | | | | 3.25 | | | | 240,404 | | | | 0.97 | | | | 1.21 | | | | (0.88 | ) | | | 152 | |
Year ended 10/31/11(e) | | | 10.00 | | | | (0.09 | ) | | | 0.56 | | | | 0.47 | | | | — | | | | 10.47 | | | | 4.70 | | | | 59,063 | | | | 0.97 | (f) | | | 1.29 | (f) | | | (0.88 | )(f) | | | 0 | |
Class R5 | | | | | | | | | | | | | | | | | | | | | | | | | | | | | | | | | | | | | | | | | | | | | | | | |
Year ended 10/31/14 | | | 9.13 | | | | (0.09 | ) | | | (0.91 | ) | | | (1.00 | ) | | | — | | | | 8.13 | | | | (10.95 | ) | | | 269,490 | | | | 1.02 | (d) | | | 1.19 | (d) | | | (0.97 | )(d) | | | 21 | |
Year ended 10/31/13 | | | 10.80 | | | | (0.09 | ) | | | (1.35 | ) | | | (1.44 | ) | | | (0.23 | ) | | | 9.13 | | | | (13.61 | ) | | | 266,031 | | | | 0.97 | | | | 1.20 | | | | (0.89 | ) | | | 47 | |
Year ended 10/31/12 | | | 10.47 | | | | (0.09 | ) | | | 0.42 | | | | 0.33 | | | | — | | | | 10.80 | | | | 3.15 | | | | 238,710 | | | | 0.97 | | | | 1.14 | | | | (0.88 | ) | | | 152 | |
Year ended 10/31/11(e) | | | 10.00 | | | | (0.09 | ) | | | 0.56 | | | | 0.47 | | | | — | | | | 10.47 | | | | 4.70 | | | | 102,857 | | | | 0.97 | (f) | | | 1.21 | (f) | | | (0.88 | )(f) | | | 0 | |
Class R6 | | | | | | | | | | | | | | | | | | | | | | | | | | | | | | | | | | | | | | | | | | | | | | | | |
Year ended 10/31/14 | | | 9.13 | | | | (0.08 | ) | | | (0.92 | ) | | | (1.00 | ) | | | — | | | | 8.13 | | | | (10.95 | ) | | | 131,076 | | | | 0.99 | (d) | | | 1.10 | (d) | | | (0.94 | )(d) | | | 21 | |
Year ended 10/31/13 | | | 10.80 | | | | (0.08 | ) | | | (1.36 | ) | | | (1.44 | ) | | | (0.23 | ) | | | 9.13 | | | | (13.61 | ) | | | 124,497 | | | | 0.97 | | | | 1.12 | | | | (0.89 | ) | | | 47 | |
Year ended 10/31/12(e) | | | 11.15 | | | | (0.01 | ) | | | (0.34 | ) | | | (0.35 | ) | | | — | | | | 10.80 | | | | (3.14 | ) | | | 101,349 | | | | 0.97 | (f) | | | 1.15 | (f) | | | (0.88 | )(f) | | | 152 | |
| (a) | Calculated using average shares outstanding. |
| (b) | Includes adjustments in accordance with accounting principles generally accepted in the United States of America and as such, the net asset value for financial reporting purposes and the returns based upon those net asset values may differ from the net asset value and returns for shareholder transactions. Does not include sales charges and is not annualized for periods less than one year, if applicable. |
| (c) | Portfolio turnover is calculated at the fund level and is not annualized for periods less than one year, if applicable. For the period ended October 31, 2012, the portfolio turnover calculation excludes the value of securities purchased of $32,276,528 and sold of $14,234,590 in the effort to realign the Fund’s portfolio holdings after the reorganization of Invesco Commodities Strategy Fund into the Fund. |
| (d) | Ratios are based on average daily net assets (000’s omitted) of $59,998, $739, $4,200, $399, $299,050, $275,508 and $130,107 for Class A, Class B, Class C, Class R, Class Y, Class R5 and Class R6 shares, respectively. |
| (e) | Commencement date of November 30, 2010 for Class A, Class B, Class C, Class R, Class Y and Class R5 shares. Commencement date of September 24, 2012 for Class R6 shares. |
24 Invesco Balanced-Risk Commodity Strategy Fund
Report of Independent Registered Public Accounting Firm
To the Board of Trustees of AIM Investment Funds (Invesco Investment Funds)
and Shareholders of Invesco Balanced-Risk Commodity Strategy Fund:
In our opinion, the accompanying consolidated statement of assets and liabilities, including the consolidated schedule of investments, and the related consolidated statements of operations and of changes in net assets and the financial highlights present fairly, in all material respects, the consolidated financial position of Invesco Balanced-Risk Commodity Strategy Fund (one of the funds constituting AIM Investment Funds (Invesco Investment Funds), hereafter referred to as the “Fund”) at October 31, 2014, the results of its operations for the year then ended, the changes in its net assets for each of the two years in the period then ended and the financial highlights for each of the three years then ended and for the period November 30, 2010 (commencement of operations) through October 31, 2011, in conformity with accounting principles generally accepted in the United States of America. These consolidated financial statements and financial highlights (hereafter referred to as “financial statements”) are the responsibility of the Fund’s management. Our responsibility is to express an opinion on these financial statements based on our audits. We conducted our audits of these financial statements in accordance with the standards of the Public Company Accounting Oversight Board (United States). Those standards require that we plan and perform the audit to obtain reasonable assurance about whether the financial statements are free of material misstatement. An audit includes examining, on a test basis, evidence supporting the amounts and disclosures in the financial statements, assessing the accounting principles used and significant estimates made by management, and evaluating the overall financial statement presentation. We believe that our audits, which included confirmation of securities at October 31, 2014 by correspondence with the custodian and brokers and the application of alternative auditing procedures where confirmations of security purchases have not been received, provide a reasonable basis for our opinion.
PRICEWATERHOUSECOOPERS LLP
December 29, 2014
Houston, Texas
25 Invesco Balanced-Risk Commodity Strategy Fund
Calculating your ongoing Fund expenses
Example
As a shareholder of the Fund, you incur two types of costs: (1) transaction costs, which may include sales charges (loads) on purchase payments or contingent deferred sales charges on redemptions, if any; and (2) ongoing costs, including distribution and/or service (12b-1) fees, and other Fund expenses. This example is intended to help you understand your ongoing costs (in dollars) of investing in the Fund and to compare these costs with ongoing costs of investing in other mutual funds. The example is based on an investment of $1,000 invested at the beginning of the period and held for the entire period May 1, 2014, through October 31, 2014.
In addition to the fees and expenses which the Fund bears directly, the Fund indirectly bears a pro rata share of the fees and expenses of the underlying funds in which your Fund invests. The amount of fees and expenses incurred indirectly by your Fund will vary because the underlying funds have varied expenses and fee levels and the Fund may own different proportions of the underlying funds at different times. Estimated underlying fund expenses are not expenses that are incurred directly by your Fund. They are expenses that are incurred directly by the underlying funds and are deducted from the value of the underlying funds your Fund invests in. The effect of the estimated underlying fund expenses that you bear indirectly are included in your Fund’s total return.
Actual expenses
The table below provides information about actual account values and actual expenses. You may use the information in this table, together with the amount you invested, to estimate the expenses that you paid over the period. Simply divide your account value by $1,000 (for example, an $8,600 account value divided by $1,000 = 8.6), then multiply the result by the number in the table under the heading entitled “Actual Expenses Paid During Period” to estimate the expenses you paid on your account during this period.
Hypothetical example for comparison purposes
The table below also provides information about hypothetical account values and hypothetical expenses based on the Fund’s actual expense ratio and an assumed rate of return of 5% per year before expenses, which is not the Fund’s actual return.
The hypothetical account values and expenses may not be used to estimate the actual ending account balance or expenses you paid for the period. You may use this information to compare the ongoing costs of investing in the Fund and other funds. To do so, compare this 5% hypothetical example with the 5% hypothetical examples that appear in the shareholder reports of the other funds.
Please note that the expenses shown in the table are meant to highlight your ongoing costs only and do not reflect any transaction costs, such as sales charges (loads) on purchase payments or contingent deferred sales charges on redemptions, if any. Therefore, the hypothetical information is useful in comparing ongoing costs only, and will not help you determine the relative total costs of owning different funds. In addition, expenses shown in the table do not include the expenses of the underlying funds, which are borne indirectly by the Fund. If transaction costs and indirect expenses were included, your costs would have been higher.
| | | | | | | | | | | | | | | | | | | | | | | | |
| Class | | Beginning Account Value (05/01/14) | | | ACTUAL | | | HYPOTHETICAL (5% annual return before expenses) | | | Annualized Expense Ratio2 | |
| | | Ending Account Value (10/31/14)1 | | | Expenses Paid During Period3 | | | Ending Account Value (10/31/14) | | | Expenses Paid During Period4 | | |
| A | | $ | 1,000.00 | | | $ | 897.30 | | | $ | 6.65 | | | $ | 1,018.20 | | | $ | 7.07 | | | | 1.39 | % |
| B | | | 1,000.00 | | | | 894.10 | | | | 10.22 | | | | 1,014.42 | | | | 10.87 | | | | 2.14 | |
| C | | | 1,000.00 | | | | 894.00 | | | | 10.22 | | | | 1,014.42 | | | | 10.87 | | | | 2.14 | |
| R | | | 1,000.00 | | | | 895.70 | | | | 7.84 | | | | 1,016.94 | | | | 8.34 | | | | 1.64 | |
| Y | | | 1,000.00 | | | | 898.30 | | | | 5.45 | | | | 1,019.46 | | | | 5.80 | | | | 1.14 | |
| R5 | | | 1,000.00 | | | | 899.30 | | | | 5.12 | | | | 1,019.81 | | | | 5.45 | | | | 1.07 | |
| R6 | | | 1,000.00 | | | | 898.30 | | | | 4.83 | | | | 1,020.11 | | | | 5.14 | | | | 1.01 | |
| 1 | The actual ending account value is based on the actual total return of the Fund for the period May 1, 2014 through October 31, 2014, after actual expenses and will differ from the hypothetical ending account value which is based on the Fund’s expense ratio and a hypothetical annual return of 5% before expenses. |
| 2 | Expenses are equal to the Fund’s annualized expense ratio as indicated above multiplied by the average account value over the period, multiplied by 184/365 to reflect the most recent fiscal half year. Effective July 1, 2014, the Fund’s adviser has contractually agreed to waive advisory fees and/or reimburse expenses to the extent necessary to limit total annual fund operating expense of Class A, Class B, Class C, Class R, Class Y, Class R5 and Class R6 shares to 2.00%, 2.75%, 2.75%, 2.25%, 1.75%, 1.75% and 1.75% of average daily net assets, respectively. The annualized expense ratios restated as if these agreements had been in effect throughout the entire most recent fiscal half year are 1.50%, 2.25%, 2.25%, 1.75%, 1.25%, 1.13% and 1.04% for Class A, Class B, Class C, Class R, Class Y, Class R5 and Class R6 shares, respectively. |
| 3 | The actual expenses paid restated as if the changes discussed above had been in effect throughout the entire most recent fiscal half year are $7.17, $10.74, $10.74, $8.36, $5.98, $5.41 and $4.98 for Class A, Class B, Class C, Class R, Class Y, Class R5 and Class R6 shares, respectively. |
| 4 | The hypothetical expenses paid restated as if the changes discussed above had been in effect throughout the entire most recent fiscal half year are $7.63, $11.42, $11.42, $8.89, $6.36, $5.75 and $5.30 for Class A, Class B, Class C, Class R, Class Y, Class R5 and Class R6 shares, respectively. |
26 Invesco Balanced-Risk Commodity Strategy Fund
Approval of Investment Advisory and Sub-Advisory Contracts
The Board of Trustees (the Board) of AIM Investment Funds (Invesco Investment Funds) is required under the Investment Company Act of 1940, as amended, to approve annually the renewal of Invesco Balanced-Risk Commodity Strategy Fund’s (the Fund) investment advisory agreements. During contract renewal meetings held on June 16-17, 2014, the Board as a whole, and the disinterested or “independent” Trustees, who comprise over 75% of the Board, voting separately, approved the continuance for the Fund of the Master Investment Advisory Agreement with Invesco Advisers, Inc. (Invesco Advisers and the investment advisory agreement) and the Master Intergroup Sub-Advisory Contract for Mutual Funds with Invesco Asset Management Deutschland GmbH, Invesco Asset Management Limited, Invesco Asset Management (Japan) Limited, Invesco Australia Limited, Invesco Hong Kong Limited, Invesco Senior Secured Management, Inc. and Invesco Canada Ltd. (collectively, the Affiliated Sub-Advisers and the sub-advisory contracts) for another year, effective July 1, 2014.
In evaluating the fairness and reasonableness of compensation under the Fund’s investment advisory agreement and sub-advisory contracts, the Board considered, among other things, the factors discussed below. The Board determined that continuation of the Fund’s investment advisory agreement and the sub-advisory contracts are in the best interest of the Fund and its shareholders and that the compensation payable to Invesco Advisers and the Affiliated Sub-Advisers under the agreements is fair and reasonable.
The Board’s Fund Evaluation Process
The Board’s Investments Committee has established three Sub-Committees, each of which is primarily responsible for overseeing the management of a number of the funds advised by Invesco Advisers (the Invesco Funds). The Sub-Committees meet throughout the year to review the performance of their assigned Invesco Funds, including reviewing materials prepared under the direction of the independent Senior Officer, an officer of the Invesco Funds who reports directly to the independent Trustees. Over the course of each year, the Sub-Committees meet with portfolio managers for their assigned Invesco Funds and other members of management to review the performance, investment objective(s), policies, strategies, limitations and investment risks of these funds. The Sub-Committees meet regularly and at designated contract renewal meetings each year to conduct a review of the performance, fees, expenses and other matters related to their assigned Invesco Funds. Each Sub-Committee recommends to the Investments Committee, which in turn recommends to the full Board, whether and on what terms to approve the continuance of each Invesco Fund’s
investment advisory agreement and sub-advisory contracts for another year.
During the contract renewal process, the Trustees receive comparative performance and fee data regarding the Invesco Funds prepared by Invesco Advisers and Lipper Inc. (Lipper), an independent provider of investment company data. The Trustees also receive an independent written evaluation from the Senior Officer. The Senior Officer’s evaluation is prepared as part of his responsibility to manage the process by which the Invesco Funds’ proposed management fees are negotiated during the annual contract renewal process to ensure they are negotiated in a manner that is at arms’ length and reasonable. In addition to meetings with Invesco Advisers and fund counsel, the independent Trustees also discuss the continuance of the investment advisory agreement and sub-advisory contracts in separate sessions with the Senior Officer and with independent legal counsel.
The Trustees recognized that the advisory fee rates for the Invesco Funds are, in many cases, the result of years of review and negotiation. The Trustees’ deliberations and conclusions in a particular year may be based in part on their deliberations and conclusions regarding these same arrangements throughout the year and in prior years. The Trustees’ review and conclusions are based on the comprehensive consideration of all information presented to them and are not the result of any single determinative factor. Moreover, one Trustee may have weighed a particular piece of information or factor differently than another Trustee.
The discussion below serves as the Senior Officer’s independent written evaluation with respect to the Fund’s investment advisory agreement as well as a discussion of the material factors and related conclusions that formed the basis for the Board’s approval of the Fund’s investment advisory agreement and sub-advisory contracts. Unless otherwise stated, this information is current as of June 17, 2014, and may not reflect consideration of factors that became known to the Board after that date.
Factors and Conclusions and Summary of Independent Written Fee Evaluation
| A. | Nature, Extent and Quality of Services Provided by Invesco Advisers and the Affiliated Sub-Advisers |
The Board reviewed the advisory services provided to the Fund by Invesco Advisers under the Fund’s investment advisory agreement, the performance of Invesco Advisers in providing these services, and the credentials and experience of the officers and employees of Invesco Advisers who provide these services, including the Fund’s portfolio manager or managers, with whom the Sub-Committees met
during the year. The Board’s review of the qualifications of Invesco Advisers to provide advisory services included the Board’s consideration of Invesco Advisers’ investment process oversight, independent credit analysis and investment risk management. The Board also considered non-advisory services that Invesco Advisers and its affiliates provide to the Invesco Funds such as various back office support functions, equity and fixed income trading operations, internal audit, distribution and legal and compliance.
In determining whether to continue the Fund’s investment advisory agreement, the Board considered the benefits of reapproving an existing relationship and the greater uncertainty that may be associated with entering into a new relationship. The Board concluded that the nature, extent and quality of the services provided to the Fund by Invesco Advisers are appropriate and satisfactory and consistent with the terms of the Fund’s investment advisory agreement.
The Board reviewed the services that may be provided by the Affiliated Sub-Advisers under the sub-advisory contracts and the credentials and experience of the officers and employees of the Affiliated Sub-Advisers who provide these services. The Board noted that the Affiliated Sub-Advisers have offices and personnel that are located in financial centers around the world. As a result, the Affiliated Sub-Advisers can provide research and investment analysis on the markets and economies of various countries in which the Fund may invest, make recommendations regarding securities and assist with security trades. The Board concluded that the sub-advisory contracts benefit the Fund and its shareholders by permitting Invesco Advisers to use the resources and talents of the Affiliated Sub-Advisers in managing the Fund. The Board concluded that the nature, extent and quality of the services that may be provided by the Affiliated Sub-Advisers are appropriate and satisfactory and consistent with the terms of the Fund’s sub-advisory contracts.
The Board considered Fund performance as a relevant factor in considering whether to approve the investment advisory agreement. The Board did not view Fund performance as a relevant factor in considering whether to approve the sub-advisory contracts for the Fund, as no Affiliated Sub-Adviser currently manages assets of the Fund.
The Board noted that only three calendar years of comparative performance data was available for the Fund. The Board compared the Fund’s performance during the past one and three calendar years to the performance of funds in the Lipper performance universe and against the Lipper Commodities General Funds Index. The Board noted that performance of Class A shares of the Fund was in the fifth
27 Invesco Balanced-Risk Commodity Strategy Fund
quintile of its performance universe for the one year period and the third quintile for the three year period (the first quintile being the best performing funds and the fifth quintile being the worst performing funds). The Board noted that performance of Class A shares of the Fund was below the performance of the Index for the one and three year periods. The Trustees also reviewed more recent Fund performance and this review did not change their conclusions.
| C. | Advisory and Sub-Advisory Fees |
The Board compared the Fund’s contractual management fee rate to the contractual management fee rates of funds in the Fund’s Lipper expense group at a common asset level. The Board noted that the contractual management fee rate for Class A shares of the Fund was at the median contractual management fee rate of funds in the expense group. The Board noted that the term “contractual management fee” may include both advisory and certain administrative services fees, but that Lipper does not provide information on a fund by fund basis as to what is included. The Board noted that Invesco Advisers does not charge the Invesco Funds for the administrative services included in the term as defined by Lipper. The Board also reviewed the methodology used by Lipper in providing expense group information, which includes using each fund’s contractual management fee schedule (including any applicable breakpoints) as reported in the most recent prospectus or statement of additional information for each fund in the expense group.
The Board noted that Invesco Advisers has contractually agreed to waive fees and/or limit expenses of the Fund through at least June 30, 2015 in an amount necessary to limit total annual operating expenses to a specified percentage of average daily net assets for each class of the Fund.
The Board noted that Invesco Advisers and its affiliates do not manage other mutual funds using an investment process substantially similar to the investment process used for the Fund.
The Board did consider the fees charged by Invesco Advisers and the Affiliated Sub-Advisers to other client accounts that are managed using an investment process substantially similar to the investment process use for the Fund. The Board noted that Invesco Advisers or the Affiliated Sub-Advisers may charge lower fees to large institutional clients. Invesco Advisers reviewed with the Board the significantly greater scope of services it provides to the Invesco Funds relative to certain other client accounts. These additional services include provision of administrative services, officers and office space, oversight of service providers, preparation of annual registration statement updates and financial information and regulatory compliance under the Investment Company Act of 1940, as amended. Invesco Advisers also reviewed generally the higher frequency of shareholder purchases and redemptions in the Invesco Funds relative to the
flow of assets for other client accounts. Invesco Advisers advised the Board that advance notice of redemptions is often provided to Invesco Advisers by institutional clients. The Board did note that sub-advisory fee rates charged by the Affiliated Sub-Advisers to manage the Invesco Funds and to manage other client accounts tended to be more comparable, reflecting a more comparable scope of services. The Board concluded that the aggregate services provided to the Invesco Funds were sufficiently different from those provided to institutional clients to support the difference in fees.
The Board also considered the services that may be provided by the Affiliated Sub-Advisers pursuant to the sub-advisory contracts, as well as the fees payable by Invesco Advisers to the Affiliated Sub-Advisers pursuant to the sub-advisory contracts. The Board also noted that the sub-advisory fees are not paid directly by the Fund, but rather, are payable by Invesco Advisers to the Affiliated Sub-Advisers.
| D. | Economies of Scale and Breakpoints |
The Board considered the extent to which there are economies of scale in the provision of advisory services to the Fund. The Board also considered whether the Fund benefits from economies of scale through contractual breakpoints in the Fund’s advisory fee schedule and was assisted in this review by a report from the Senior Officer. The Board also noted that the Fund shares directly in economies of scale through lower fees charged by third party service providers based on the combined size of the Invesco Funds and other clients advised by Invesco Advisers.
| E. | Profitability and Financial Resources |
The Board reviewed information from Invesco Advisers concerning the costs of the advisory and other services that Invesco Advisers and its affiliates provide to the Fund and the profitability of Invesco Advisers and its affiliates in providing these services for the year ended December 31, 2013. The Board received information from Invesco Advisers about the methodology used to prepare the profitability information. The Board considered the profitability of Invesco Advisers in managing the Fund and the Invesco Funds. The Board noted that Invesco Advisers continues to operate at a net profit from services Invesco Advisers and its subsidiaries provide to the Invesco Funds and the Fund. The Board did not deem the level of profits realized by Invesco Advisers and its affiliates from providing services to the Fund to be excessive given the nature, quality and extent of the services provided to the Invesco Funds. The Board received and accepted information from Invesco Advisers demonstrating that Invesco Advisers and each Affiliated Sub-Adviser are financially sound and have the resources necessary to perform their obligations under the investment advisory agreement and sub-advisory contracts.
| F. | Collateral Benefits to Invesco Advisers and its Affiliates |
The Board considered various other benefits received by Invesco Advisers and its affiliates
from the relationship with the Fund, including the fees received for their provision of transfer agency and distribution services to the Fund. The Board considered comparative information regarding fees charged for these services, including information provided by Lipper and other independent sources. The Board considered the performance of Invesco Advisers and its affiliates in providing these services and the organizational structure employed to provide these services. The Board also considered that these services are provided to the Fund pursuant to written contracts that are reviewed and approved on an annual basis by the Board; that the services are required for the operation of the Fund; that Invesco Advisers and its affiliates can provide services, the nature and quality of which are at least equal to those provided by others offering the same or similar services; and that the fees for such services are fair and reasonable in light of the usual and customary charges by others for services of the same nature and quality.
The Board considered the benefits realized by Invesco Advisers and the Affiliated Sub-Advisers as a result of portfolio brokerage transactions executed through “soft dollar” arrangements. Invesco Advisers noted that the Fund does not execute brokerage transaction through “soft dollar” arrangements to any significant degree.
The Board considered that the Fund’s uninvested cash and cash collateral from any securities lending arrangements may be invested in money market funds advised by Invesco Advisers pursuant to procedures approved by the Board. The Board noted that Invesco Advisers receives advisory fees from these affiliated money market funds attributable to such investments, although Invesco Advisers has contractually agreed to waive through varying periods the advisory fees payable by the Invesco Funds with respect to investments in the affiliated money market funds. The waiver is in an amount equal to 100% of the net advisory fee Invesco Advisers receives from the affiliated money market funds with respect to the Fund’s investment in the affiliated money market funds of uninvested cash, but not cash collateral. The Board concluded that the amount of advisory fees received by Invesco Advisors from the Fund’s investment of uninvested cash and cash collateral from any securities lending arrangements in the affiliated money market funds are fair and reasonable.
28 Invesco Balanced-Risk Commodity Strategy Fund
Trustees and Officers
The address of each trustee and officer is AIM Investment Funds (Invesco Investment Funds) (the “Trust”), 11 Greenway Plaza, Suite 1000, Houston, Texas 77046-1173. The trustees serve for the life of the Trust, subject to their earlier death, incapacitation, resignation, retirement or removal as more specifically provided in the Trust’s organizational documents. Each officer serves for a one year term or until their successors are elected and qualified. Column two below includes length of time served with predecessor entities, if any.
| | | | | | | | |
Name, Year of Birth and Position(s) Held with the Trust | | Trustee and/
or Officer Since | | Principal Occupation(s) During Past 5 Years | | Number of Funds in Fund Complex Overseen by Trustee | | Other Directorship(s) Held by Trustee During Past 5 Years |
| Interested Persons | | | | | | | | |
| Martin L. Flanagan1 — 1960 Trustee | | 2007 | | Executive Director, Chief Executive Officer and President, Invesco Ltd. (ultimate parent of Invesco and a global investment management firm); Advisor to the Board, Invesco Advisers, Inc. (formerly known as Invesco Institutional (N.A.), Inc.); Trustee, The Invesco Funds; Vice Chair, Investment Company Institute; and Member of Executive Board, SMU Cox School of Business Formerly: Chairman and Chief Executive Officer, Invesco Advisers, Inc. (registered investment adviser); Director, Chairman, Chief Executive Officer and President, IVZ Inc. (holding company), INVESCO Group Services, Inc. (service provider) and Invesco North American Holdings, Inc. (holding company); Director, Chief Executive Officer and President, Invesco Holding Company Limited (parent of Invesco and a global investment management firm); Director, Invesco Ltd.; Chairman, Investment Company Institute and President, Co-Chief Executive Officer, Co-President, Chief Operating Officer and Chief Financial Officer, Franklin Resources, Inc. (global investment management organization). | | 144 | | None |
Philip A. Taylor2 — 1954 Trustee, President and Principal Executive Officer | | 2006 | | Head of North American Retail and Senior Managing Director, Invesco Ltd.; Director, Co-Chairman, Co-President and Co-Chief Executive Officer, Invesco Advisers, Inc. (formerly known as Invesco Institutional (N.A.), Inc.) (registered investment adviser); Director, Chairman, Chief Executive Officer and President, Invesco Management Group, Inc. (formerly known as Invesco Aim Management Group, Inc.) (financial services holding company); Director and President, INVESCO Funds Group, Inc. (registered investment adviser and registered transfer agent); Director and Chairman, Invesco Investment Services, Inc. (formerly known as Invesco Aim Investment Services, Inc.) (registered transfer agent) and IVZ Distributors, Inc. (formerly known as INVESCO Distributors, Inc.) (registered broker dealer); Director, President and Chairman, Invesco Inc. (holding company) and Invesco Canada Holdings Inc. (holding company); Chief Executive Officer, Invesco Corporate Class Inc. (corporate mutual fund company) and Invesco Canada Fund Inc. (corporate mutual fund company); Director, Chairman and Chief Executive Officer, Invesco Canada Ltd. (formerly known as Invesco Trimark Ltd./Invesco Trimark Ltèe) (registered investment adviser and registered transfer agent); Trustee, President and Principal Executive Officer, The Invesco Funds (other than AIM Treasurer’s Series Trust (Invesco Treasurer’s Series Trust) and Short-Term Investments Trust); Trustee and Executive Vice President, The Invesco Funds (AIM Treasurer’s Series Trust (Invesco Treasurer’s Series Trust) and Short-Term Investments Trust only); Director, Invesco Investment Advisers LLC (formerly known as Van Kampen Asset Management); Director, Chief Executive Officer and President, Van Kampen Exchange Corp. Formerly: Director and Chairman, Van Kampen Investor Services Inc.; Director, Chief Executive Officer and President, 1371 Preferred Inc. (holding company) and Van Kampen Investments Inc.; Director and President, AIM GP Canada Inc. (general partner for limited partnerships) and Van Kampen Advisors, Inc.; Director and Chief Executive Officer, Invesco Trimark Dealer Inc. (registered broker dealer); Director, Invesco Distributors, Inc. (formerly known as Invesco Aim Distributors, Inc.) (registered broker dealer); Manager, Invesco PowerShares Capital Management LLC; Director, Chief Executive Officer and President, Invesco Advisers, Inc.; Director, Chairman, Chief Executive Officer and President, Invesco Aim Capital Management, Inc.; President, Invesco Trimark Dealer Inc. and Invesco Trimark Ltd./Invesco Trimark Ltèe; Director and President, AIM Trimark Corporate Class Inc. and AIM Trimark Canada Fund Inc.; Senior Managing Director, Invesco Holding Company Limited; Director and Chairman, Fund Management Company (former registered broker dealer); President and Principal Executive Officer, The Invesco Funds (AIM Treasurer’s Series Trust (Invesco Treasurer’s Series Trust), and Short-Term Investments Trust only); President, AIM Trimark Global Fund Inc. and AIM Trimark Canada Fund Inc. | | 144 | | None |
Wayne W. Whalen3 — 1939 Trustee | | 2010 | | Of Counsel, and prior to 2010, partner in the law firm of Skadden, Arps, Slate, Meagher & Flom LLP, legal counsel to certain funds in the Fund Complex | | 144 | | Director of the Mutual fund Directors Forum, a nonprofit membership organization for investment directors; Chairman and Director of the Abraham Lincoln Presidential Library Foundation; and Director of the Stevenson Center for Democracy |
| 1 | Mr. Flanagan is considered an interested person (within the meaning of Section 2(a)(19) of the 1940 Act) of the Trust because he is an officer of the Adviser to the Trust, and an officer and a director of Invesco Ltd., ultimate parent of the Adviser. |
| 2 | Mr. Taylor is considered an interested person (within the meaning of Section 2(a)(19) of the 1940 Act) of the Trust because he is an officer and a director of the Adviser. |
| 3 | Mr. Whalen is retiring effective December 31, 2014. He has been deemed to be an interested person of the Trust because of his prior service as counsel to the predecessor funds of certain Invesco open-end funds and his affiliation with the law firm that served as counsel to such predecessor funds and the Invesco closed-end funds. |
T-1 Invesco Balanced-Risk Commodity Strategy Fund
Trustees and Officers—(continued)
| | | | | | | | |
Name, Year of Birth and Position(s) Held with the Trust | | Trustee and/
or Officer Since | | Principal Occupation(s) During Past 5 Years | | Number of Funds in Fund Complex Overseen by Trustee | | Other Directorship(s) Held by Trustee During Past 5 Years |
| Independent Trustees | | | | | | | | |
Bruce L. Crockett — 1944 Trustee and Chair | | 2001 | | Chairman, Crockett Technologies Associates (technology consulting company) Formerly: Director, Captaris (unified messaging provider); Director, President and Chief Executive Officer, COMSAT Corporation; Chairman, Board of Governors of INTELSAT (international communications company); ACE Limited (insurance company); and Investment Company Institute | | 144 | | ALPS (Attorneys Liability Protection Society) (insurance company) |
David C. Arch — 1945 Trustee | | 2010 | | Chairman of Blistex Inc., a consumer health care products manufacturer | | 144 | | Board member of the Illinois Manufacturers’ Association; Member of the Board of Visitors, Institute for the Humanities, University of Michigan; Member of the Audit Committee of the Edward-Elmhurst Hospital |
Frank S. Bayley — 1939 Trustee | | 1987 | | Retired. Formerly: Director, Badgley Funds Inc. (registered investment company) (2 portfolios) and General Partner and Of Counsel, law firm of Baker & McKenzie, LLP | | 144 | | Director and Chairman, C.D. Stimson Company (a real estate investment company); Trustee, The Curtis Institute of Music |
James T. Bunch — 1942 Trustee | | 2003 | | Managing Member, Grumman Hill Group LLC (family office private equity investments) Formerly: Founder, Green Manning & Bunch Ltd. (investment banking firm) (1988-2010); Executive Committee, United States Golf Association; and Director, Policy Studies, Inc. and Van Gilder Insurance Corporation | | 144 | | Chairman, Board of Governors, Western Golf Association; Chairman, Evans Scholars Foundation; and Director, Denver Film Society |
Rodney F. Dammeyer — 1940 Trustee | | 2010 | | Chairman of CAC,LLC, (private company offering capital investment and management advisory services) Formerly: Prior to 2001, Managing Partner at Equity Group Corporate Investments; Prior to 1995, Chief Executive Officer of Itel Corporation (formerly Anixter International); Prior to 1985, experience includes Senior Vice President and Chief Financial Officer of Household International, Inc., Executive Vice President and Chief Financial Officer of Northwest Industries, Inc. and Partner of Arthur Andersen & Co.; From 1987 to 2010, Director/Trustee of investment companies in the Van Kampen Funds complex | | 144 | | Director of Quidel Corporation and Stericycle, Inc. |
Albert R. Dowden — 1941 Trustee | | 2001 | | Director of a number of public and private business corporations, including the Boss Group, Ltd. (private investment and management); Nature’s Sunshine Products, Inc. and Reich & Tang Funds (5 portfolios) (registered investment company) Formerly: Director, Homeowners of America Holding Corporation/Homeowners of America Insurance Company (property casualty company); Director, Continental Energy Services, LLC (oil and gas pipeline service); Director, CompuDyne Corporation (provider of product and services to the public security market) and Director, Annuity and Life Re (Holdings), Ltd. (reinsurance company); Director, President and Chief Executive Officer, Volvo Group North America, Inc.; Senior Vice President, AB Volvo; Director of various public and private corporations; Chairman, DHJ Media, Inc.; Director, Magellan Insurance Company; and Director, The Hertz Corporation, Genmar Corporation (boat manufacturer), National Media Corporation; Advisory Board of Rotary Power International (designer, manufacturer, and seller of rotary power engines); and Chairman, Cortland Trust, Inc. (registered investment company) | | 144 | | Director of: Nature’s Sunshine Products, Inc., Reich & Tang Funds, Homeowners of America Holding Corporation/ Homeowners of America Insurance Company, the Boss Group |
Jack M. Fields — 1952 Trustee | | 2001 | | Chief Executive Officer, Twenty First Century Group, Inc. (government affairs company); Owner and Chief Executive Officer, Dos Angeles Ranch, L.P. (cattle, hunting, corporate entertainment); and Discovery Global Education Fund (non-profit) Formerly: Chief Executive Officer, Texana Timber LP (sustainable forestry company); Director of Cross Timbers Quail Research Ranch (non-profit); and member of the U.S. House of Representatives | | 144 | | Insperity, Inc. (formerly known as Administaff) |
Prema Mathai-Davis — 1950 Trustee | | 2001 | | Retired. Formerly: Chief Executive Officer, YWCA of the U.S.A. | | 144 | | None |
Larry Soll — 1942 Trustee | | 2003 | | Retired. Formerly: Chairman, Chief Executive Officer and President, Synergen Corp. (a biotechnology company) | | 144 | | None |
Hugo F. Sonnenschein — 1940 Trustee | | 2010 | | President Emeritus and Honorary Trustee of the University of Chicago and the Adam Smith Distinguished Service Professor in the Department of Economics at the University of Chicago. Prior to 2000, President of the University of Chicago | | 144 | | Trustee of the University of Rochester and a member of its investment committee; Member of the National Academy of Sciences and the American Philosophical Society; Fellow of the American Academy of Arts and Sciences |
T-2 Invesco Balanced-Risk Commodity Strategy Fund
Trustees and Officers—(continued)
| | | | | | | | |
Name, Year of Birth and Position(s) Held with the Trust | | Trustee and/
or Officer Since | | Principal Occupation(s) During Past 5 Years | | Number of Funds in Fund Complex Overseen by Trustee | | Other Directorship(s) Held by Trustee During Past 5 Years |
| Independent Trustees—(continued) |
Raymond Stickel, Jr. — 1944 Trustee | | 2005 | | Retired. Formerly: Director, Mainstay VP Series Funds, Inc. (25 portfolios) and Partner, Deloitte & Touche | | 144 | | None |
Suzanne H. Woolsey — 1941 Trustee | | 2014 | | Chief Executive Officer of Woolsey Partners LLC | | 144 | | Emeritus Chair of the Board of Trustees of the Institute for Defense Analyses; Trustee of Colorado College; Trustee of California Institute of Technology; Prior to 2014, Director of Fluor Corp.; Prior to 2010, Trustee of the German Marshall Fund of the United States; Prior to 2010 Trustee of the Rocky Mountain Institute |
| Other Officers | | | | | | | | |
Russell C. Burk — 1958 Senior Vice President and Senior Officer | | 2005 | | Senior Vice President and Senior Officer, The Invesco Funds | | N/A | | N/A |
John M. Zerr — 1962 Senior Vice President, Chief Legal Officer and Secretary | | 2006 | | Director, Senior Vice President, Secretary and General Counsel, Invesco Management Group, Inc. (formerly known as Invesco Aim Management Group, Inc.) and Van Kampen Exchange Corp.; Senior Vice President, Invesco Advisers, Inc. (formerly known as Invesco Institutional (N.A.), Inc.) (registered investment adviser); Senior Vice President and Secretary, Invesco Distributors, Inc. (formerly known as Invesco Aim Distributors, Inc.); Director, Vice President and Secretary, Invesco Investment Services, Inc. (formerly known as Invesco Aim Investment Services, Inc.) and IVZ Distributors, Inc. (formerly known as INVESCO Distributors, Inc.); Director and Vice President, INVESCO Funds Group, Inc.; Senior Vice President, Chief Legal Officer and Secretary, The Invesco Funds; Manager, Invesco PowerShares Capital Management LLC; Director, Secretary and General Counsel, Invesco Investment Advisers LLC (formerly known as Van Kampen Asset Management); Secretary and General Counsel, Invesco Capital Markets, Inc. (formerly known as Van Kampen Funds Inc.) and Chief Legal Officer, PowerShares Exchange-Traded Fund Trust, PowerShares Exchange-Traded Fund Trust II, PowerShares India Exchange-Traded Fund Trust, PowerShares Actively Managed Exchange-Traded Fund Trust; and PowerShares Actively Managed Exchange-Traded Commodity Fund Trust Formerly: Director and Vice President, Van Kampen Advisors Inc.; Director, Vice President, Secretary and General Counsel, Van Kampen Investor Services Inc.; Director, Invesco Distributors, Inc. (formerly known as Invesco Aim Distributors, Inc.); Director, Senior Vice President, General Counsel and Secretary, Invesco Aim Advisers, Inc. and Van Kampen Investments Inc.; Director, Vice President and Secretary, Fund Management Company; Director, Senior Vice President, Secretary, General Counsel and Vice President, Invesco Aim Capital Management, Inc.; Chief Operating Officer and General Counsel, Liberty Ridge Capital, Inc. (an investment adviser); Vice President and Secretary, PBHG Funds (an investment company) and PBHG Insurance Series Fund (an investment company); Chief Operating Officer, General Counsel and Secretary, Old Mutual Investment Partners (a broker-dealer); General Counsel and Secretary, Old Mutual Fund Services (an administrator) and Old Mutual Shareholder Services (a shareholder servicing center); Executive Vice President, General Counsel and Secretary, Old Mutual Capital, Inc. (an investment adviser); and Vice President and Secretary, Old Mutual Advisors Funds (an investment company) | | N/A | | N/A |
Sheri Morris — 1964 Vice President, Treasurer and Principal Financial Officer | | 1999 | | Vice President, Treasurer and Principal Financial Officer, The Invesco Funds; Vice President, Invesco Advisers, Inc. (formerly known as Invesco Institutional (N.A.), Inc.) (registered investment adviser); and Vice President, PowerShares Exchange-Traded Fund Trust, PowerShares Exchange-Traded Fund Trust II, PowerShares India Exchange-Traded Fund Trust, PowerShares Actively Managed Exchange-Traded Fund Trust, and PowerShares Actively Managed Exchange-Traded Commodity Fund Trust Formerly: Vice President, Invesco Aim Advisers, Inc., Invesco Aim Capital Management, Inc. and Invesco Aim Private Asset Management, Inc.; Assistant Vice President and Assistant Treasurer, The Invesco Funds and Assistant Vice President, Invesco Advisers, Inc., Invesco Aim Capital Management, Inc. and Invesco Aim Private Asset Management, Inc.; and Treasurer, PowerShares Exchange-Traded Fund Trust, PowerShares Exchange-Traded Fund Trust II, PowerShares India Exchange-Traded Fund Trust and PowerShares Actively Managed Exchange-Traded Fund Trust | | N/A | | N/A |
T-3 Invesco Balanced-Risk Commodity Strategy Fund
Trustees and Officers—(continued)
| | | | | | | | |
Name, Year of Birth and Position(s) Held with the Trust | | Trustee and/
or Officer Since | | Principal Occupation(s) During Past 5 Years | | Number of Funds in Fund Complex Overseen by Trustee | | Other Directorship(s) Held by Trustee During Past 5 Years |
| Other Officers—(continued) | | | | | | | | |
Karen Dunn Kelley — 1960 Vice President | | 2004 | | Senior Managing Director, Investments; Director, Co-President, Co-Chief Executive Officer, and Co-Chairman, Invesco Advisers, Inc. (formerly known as Invesco Institutional (N.A.), Inc.) (registered investment adviser); Chairman, Invesco Senior Secured Management, Inc.; Senior Vice President, Invesco Management Group, Inc. (formerly known as Invesco Aim Management Group, Inc.); Executive Vice President, Invesco Distributors, Inc. (formerly known as Invesco Aim Distributors, Inc.); Director, Invesco Mortgage Capital Inc. and Invesco Management Company Limited; Director and President, INVESCO Asset Management (Bermuda) Ltd., Vice President, The Invesco Funds (other than AIM Treasurer’s Series Trust (Invesco Treasurer’s Series Trust) and Short-Term Investments Trust); and President and Principal Executive Officer, The Invesco Funds (AIM Treasurer’s Series Trust (Invesco Treasurer’s Series Trust) and Short-Term Investments Trust only) Formerly: Director, INVESCO Global Asset Management Limited and INVESCO Management S.A.; Senior Vice President, Van Kampen Investments Inc. and Invesco Advisers, Inc. (formerly known as Invesco Institutional (N.A.), Inc.) (registered investment adviser); Vice President, Invesco Advisers, Inc. (formerly known as Invesco Institutional (N.A.), Inc.); Director of Cash Management and Senior Vice President, Invesco Advisers, Inc. and Invesco Aim Capital Management, Inc.; Director and President, Fund Management Company; Chief Cash Management Officer, Director of Cash Management, Senior Vice President, and Managing Director, Invesco Aim Capital Management, Inc.; Director of Cash Management, Senior Vice President, and Vice President, Invesco Advisers, Inc. and The Invesco Funds (AIM Treasurer’s Series Trust (Invesco Treasurer’s Series Trust), and Short-Term Investments Trust only) | | N/A | | N/A |
Crissie M. Wisdom — 1969 Anti-Money Laundering Compliance Officer | | 2013 | | Anti-Money Laundering Compliance Officer, Invesco Advisers, Inc. (formerly known as Invesco Institutional (N.A.), Inc.) (registered investment adviser), Invesco Capital Markets, Inc. (formerly known as Van Kampen Funds Inc.), Invesco Distributors, Inc., Invesco Investment Services, Inc., Invesco Management Group, Inc., Van Kampen Exchange Corp., The Invesco Funds, and PowerShares Exchange-Traded Fund Trust, PowerShares Exchange-Traded Fund Trust II, PowerShares India Exchange-Traded Fund Trust, PowerShares Actively Managed Exchange-Traded Fund Trust and PowerShares Actively Managed Exchange-Traded Commodity Fund Trust; and Fraud Prevention Manager and Controls and Risk Analysis Manager for Invesco Investment Services, Inc. | | N/A | | N/A |
Todd L. Spillane — 1958 Chief Compliance Officer | | 2006 | | Senior Vice President, Invesco Management Group, Inc. (formerly known as Invesco Aim Management Group, Inc.) and Van Kampen Exchange Corp.; Senior Vice President and Chief Compliance Officer, Invesco Advisers, Inc. (registered investment adviser) (formerly known as Invesco Institutional (N.A.), Inc.); Chief Compliance Officer, The Invesco Funds; Vice President, Invesco Distributors, Inc. (formerly known as Invesco Aim Distributors, Inc.) and Invesco Investment Services, Inc. (formerly known as Invesco Aim Investment Services, Inc.) Formerly: Chief Compliance Officer, Invesco Funds (Chicago); Senior Vice President, Van Kampen Investments Inc.; Senior Vice President and Chief Compliance Officer, Invesco Aim Advisers, Inc. and Invesco Aim Capital Management, Inc.; Chief Compliance Officer, INVESCO Private Capital Investments, Inc. (holding company), Invesco Private Capital, Inc. (registered investment adviser), Invesco Global Asset Management (N.A.), Inc., Invesco Senior Secured Management, Inc. (registered investment adviser), Van Kampen Investor Services Inc., PowerShares Exchange-Traded Fund Trust, PowerShares Exchange-Traded Fund Trust II, PowerShares India Exchange-Traded Fund Trust and PowerShares Actively Managed Exchange-Traded Fund Trust; and Vice President, Invesco Aim Capital Management, Inc. and Fund Management Company | | N/A | | N/A |
The Statement of Additional Information of the Trust includes additional information about the Fund’s Trustees and is available upon request, without charge, by calling 1.800.959.4246. Please refer to the Fund’s prospectus for information on the Fund’s sub-advisers.
| | | | | | |
Office of the Fund 11 Greenway Plaza, Suite 1000 Houston, TX 77046-1173 | | Investment Adviser Invesco Advisers, Inc. 1555 Peachtree Street, N.E. Atlanta, GA 30309 | | Distributor Invesco Distributors, Inc. 11 Greenway Plaza, Suite 1000 Houston, TX 77046-1173 | | Auditors PricewaterhouseCoopers LLP 1000 Louisiana Street, Suite 5800 Houston, TX 77002-5678 |
| | | |
| | | | | | |
Counsel to the Fund Stradley Ronon Stevens & Young, LLP 2005 Market Street, Suite 2600 Philadelphia, PA 19103-7018 | | Counsel to the Independent Trustees Goodwin Procter LLP 901 New York Avenue, N.W. Washington, D.C. 20001 | | Transfer Agent Invesco Investment Services, Inc. 11 Greenway Plaza, Suite 1000 Houston, TX 77046-1173 | | Custodian State Street Bank and Trust Company 225 Franklin Street Boston, MA 02110-2801 |
T-4 Invesco Balanced-Risk Commodity Strategy Fund

Invesco mailing information
Send general correspondence to Invesco Investment Services, Inc., P.O. Box 219078, Kansas City, MO 64121-9078.
Important notice regarding delivery of security holder documents
To reduce Fund expenses, only one copy of most shareholder documents may be mailed to shareholders with multiple accounts at the same address (Householding). Mailing of your shareholder documents may be householded indefinitely unless you instruct us otherwise. If you do not want the mailing of these documents to be combined with those for other members of your household, please contact Invesco Investment Services, Inc. at 800 959 4246 or contact your financial institution. We will begin sending you individual copies for each account within 30 days after receiving your request.
Fund holdings and proxy voting information
The Fund provides a complete list of its holdings four times in each fiscal year, at the quarter ends. For the second and fourth quarters, the lists appear in the Fund’s semiannual and annual reports to shareholders. For the first and third quarters, the Fund files the lists with the Securities and Exchange Commission (SEC) on Form N-Q. The most recent list of portfolio holdings is available at invesco.com/completeqtrholdings. Shareholders can also look up the Fund’s Forms N-Q on the SEC website at sec.gov. Copies of the Fund’s Forms N-Q may be reviewed and copied at the SEC Public Reference Room in Washington, D.C. You can obtain information on the operation of the Public Reference Room, including information about duplicating fee charges, by calling 202 551 8090 or 800 732 0330, or by electronic request at the following email address: publicinfo@sec.gov. The SEC file numbers for the Fund are shown below.
A description of the policies and procedures that the Fund uses to determine how to vote proxies relating to portfolio securities is available without charge, upon request, from our Client Services department at 800 959 4246 or at invesco.com/proxyguidelines. The information is also available on the SEC website, sec.gov.
| | |
Information regarding how the Fund voted proxies related to its portfolio securities during the most recent 12-month period ended June 30 is available at invesco.com/proxysearch. The information is also available on the SEC website, sec.gov. Invesco Advisers, Inc. is an investment adviser; it provides investment advisory services to individual and institutional clients and does not sell securities. Invesco Distributors, Inc. is the US distributor for Invesco Ltd.’s retail mutual funds, exchange-traded funds and institutional money market funds. Both are wholly owned, indirect subsidiaries of Invesco Ltd. | |  |
| | | | |
| SEC file numbers: 811-05426 and 033-19338 | | BRCS-AR-1 | | Invesco Distributors, Inc. |
Letters to Shareholders
| | |

Philip Taylor | | Dear Shareholders: This annual report includes information about your Fund, including performance data and a complete list of its investments as of the close of the reporting period. Inside, your Fund’s portfolio managers discuss how they managed your Fund and the factors that affected its performance during the reporting period. I hope you find this report of interest. During the reporting period covered by this report, the US economy showed signs of continued improvement. After contracting in the first quarter of 2014, the economy expanded strongly in the second quarter and unemployment trended lower. Much of the credit for this improvement goes to the US Federal Reserve (the Fed), which undertook an extraordinary asset purchase program following the global financial crisis. The Fed’s goal was to jumpstart the economy by encouraging banks to lend more, businesses to hire more and consumers to spend more. Signs of a stronger US economy prompted the Fed to reduce, or “taper,” its asset purchase program. Despite |
| this, interest rates remained near historical low levels due largely to heavy investor demand for bonds. While signs of economic improvement were evident in the US, European economies showed signs of weakening. That, together with geopolitical uncertainty and worries about the first diagnosed cases of Ebola outside of Africa, caused increased volatility in US and European equities. |
Extended periods of market strength can lull investors into complacency – just as prolonged periods of market weakness or volatility can discourage investors from initiating long-term investment plans. That’s why Invesco has always encouraged investors to work with a professional financial adviser who can stress the importance of starting to save and invest early and the importance of adhering to a disciplined investment plan – when times are good and when they’re uncertain. A financial adviser who knows your unique financial situation, investment goals and risk tolerance can be an invaluable partner as you seek to achieve your financial goals. He or she can offer a long-term perspective when markets are volatile and time-tested advice and guidance when your financial situation or investment goals change.
Timely information when and where you want it
Invesco’s efforts to help investors achieve their financial objectives include providing individual investors and financial professionals with timely information about the markets, the economy and investing – whenever and wherever they want it.
Our website, invesco.com/us, offers a wide range of market insights and investment perspectives. On the website, you’ll find detailed information about our funds, including prices, performance, holdings and portfolio manager commentaries. You can access information about your individual Invesco account whenever it’s convenient for you; just complete a simple, secure online registration. Use the “Log In” box on our home page to get started.
Invesco’s mobile app for iPad® (available free from the App StoreSM) allows you to obtain the same detailed information about your Fund and the same investment insights from our investment leaders, market strategists, economists and retirement experts on the go. You also can watch portfolio manager videos and have instant access to Invesco news and updates wherever you may be.
In addition to the resources accessible on our website and through our mobile app, you can obtain timely updates to help you stay informed about the markets, the economy and investing by connecting with Invesco on Twitter, LinkedIn or Facebook. You can access our blog at blog.invesco.us.com. Our goal is to provide you the information you want, when and where you want it.
Have questions?
For questions about your account, feel free to contact an Invesco client services representative at 800 959 4246. For Invesco-related questions or comments, please email me directly at phil@invesco.com.
All of us at Invesco look forward to serving your investment management needs for many years to come. Thank you for investing with us.
Sincerely,

Philip Taylor
Senior Managing Director, Invesco Ltd.
iPad is a trademark of Apple Inc., registered in the US and other countries. App Store is a service mark of Apple Inc. Invesco Distributors, Inc. is not affiliated with Apple Inc.
2 Invesco China Fund
| | |

Bruce Crockett | | Dear Fellow Shareholders: There are a variety of factors that can impact investment performance, many of which are uncontrollable by us as investors. These factors can include various economic trends and geopolitical developments. While the members of the Invesco Funds Board, which I chair, can’t dictate the performance of the Invesco funds, be assured that your Board works diligently throughout the year to focus on how your investments are managed. Our job is to represent you and your interests on a variety of fund management-related matters. We regularly monitor how the portfolio management teams of the Invesco funds are performing in light of ever-changing and often unpredictable economic and market conditions. We review the investment strategies and investment process employed by each fund’s management team as explained in the fund’s prospectus. |
| | Perhaps our most significant responsibility is conducting the annual review of the funds’ |
advisory and sub-advisory contracts with Invesco Advisers and its affiliates. This annual review, which is required by the Investment Company Act of 1940, focuses on the nature and quality of the services Invesco provides as the adviser to the Invesco funds and the reasonableness of the fees that it charges for those services. Each year, we spend months carefully reviewing information from Invesco that allows us to evaluate the quality of its services and the reasonableness of its fees. We also use information from a variety of independent sources, including materials provided by the independent senior officer of the Invesco funds, who reports directly to the independent trustees on the Board. Additionally, we meet with legal counsel and review performance and fee data prepared for us by Lipper Inc., an independent, third-party firm widely recognized as a leader in its field.
After a careful review, the members of the Invesco Funds Board approved the continuation of advisory and sub-advisory contracts with Invesco Advisers and its affiliates. Be assured that your Board will continue working on behalf of fund shareholders, keeping your needs and interests uppermost in our minds.
As always, please contact me at bruce@brucecrockett.com with any questions or concerns you may have. On behalf of the Board, we look forward to continuing to represent your interests and serving your needs.
Sincerely,

Bruce L. Crockett
Independent Chair
Invesco Funds Board of Trustees
3 Invesco China Fund
Management’s Discussion of Fund Performance
Performance summary
For the fiscal year ended October 31, 2014, Invesco China Fund underperformed its style-specific benchmark, the MSCI China 10/40 Index. Relative underperformance was driven by stock selection in the information technology (IT) sector and Fund holdings in the telecommunication services sector. Some of this underperformance was offset by overweight exposure to the health care sector and stock selection in the consumer staples sector which benefited Fund performance.
Your Fund’s long-term performance appears later in this report.
Fund vs. Indexes
Total returns, 10/31/13 to 10/31/14, at net asset value (NAV). Performance shown does not include applicable contingent deferred sales charges (CDSC) or front-end sales charges, which would have reduced performance.
| | | | |
Class A Shares | | | -0.92 | % |
Class B Shares | | | -1.66 | |
Class C Shares | | | -1.67 | |
Class Y Shares | | | -0.67 | |
Class R5 Shares | | | -0.46 | |
MSCI EAFE Indexq (Broad Market Index) | | | -0.60 | |
MSCI China 10/40 Indexq (Style-Specific Index) | | | 6.67 | |
Lipper China Region Funds Indexn (Peer Group Index) | | | 5.59 | |
Source(s): qFactSet Research Systems Inc.; nLipper Inc.
Market conditions and your Fund
Global equity markets generally rose during the fiscal year ended October 31, 2014, on signs that economic growth was accelerating as a result of the loose monetary policies of many developed countries’ central banks. While 2014 began on an optimistic note, global equity markets pulled back at various points in reaction to economic and geopolitical concerns.
These concerns included worries about potentially negative effects of the US Federal Reserve reducing the scope of its asset purchase program beginning in early 2014, an Argentine sovereign bond default and eurozone banking concerns. Global equity markets also fell as
geopolitical tensions in Ukraine and the Middle East weakened the outlook for global growth.
Equity market performance in emerging markets was mixed. China continued to face headwinds and struggled to balance structural reforms with its desire to maintain satisfactory growth, while many countries in Asia, including India, Indonesia and the Philippines, experienced strong positive gains.
For the reporting period, Invesco China Fund underperformed the MSCI China 10/40 Index due to stock selection in the IT sector and Fund holdings in the telecommunication services sector. Fund holdings in the industrials sector and stock selection in the financials sector also detracted from relative
performance. Conversely, overweight exposure to the health care sector and stock selection in the consumer staples sector contributed to Fund performance versus the style-specific index.
Within the IT sector, stock selection was the largest detractor from relative performance versus the style-specific index. HC International was the largest individual detractor from both absolute and relative performance during the reporting period. HC International is a leading domestic B2B e-commerce company that offers complete online and offline marketing services for small to medium enterprises. After the first quarter of 2014, the company suffered from the profit-taking activities in the IT software industry despite strong expected revenue growth. United Photovoltaics Group was another large detractor from relative performance. The company focuses on the development of large renewable energy power plants. After strong performance early in the fiscal year, the company suffered due to the resignation of its chief financial officer in April. However, a subsequent rebound in shares amid good earnings results partially offset some of the negative performance.
Fund holdings in the telecommunication services sector also detracted from relative performance for the reporting period. Not owning several strong-performing names held by the style-specific benchmark detracted from relative performance for the reporting period. Most notably, not owning China Mobile hurt relative results. China Mobile held a significant weight in the MSCI China 10/40 Index and had a strong positive return for the fiscal year.
| | | | |
| Portfolio Composition | | | |
| By sector | |
| | | | |
Financials | | | 30.4 | % |
Health Care | | | 13.9 | |
Information Technology | | | 13.9 | |
Energy | | | 11.6 | |
Utilities | | | 10.5 | |
Consumer Discretionary | | | 9.3 | |
Consumer Staples | | | 3.6 | |
Industrials | | | 3.2 | |
Telecommunication Services | | | 2.4 | |
Money Market Funds | | | | |
| Plus Other Assets Less Liabilities | | | 1.2 | |
| | | | | | |
Top 10 Equity Holdings* | | | |
| | | |
| 1. | | Beijing Enterprises Water
Group Ltd. | | | 6.3 | % |
| 2. | | Tencent Holdings Ltd. | | | 6.3 | |
| 3. | | China Construction Bank Corp.-Class H | | | 6.2 | |
| 4. | | Melco International Development Ltd. | | | 4.4 | |
| 5. | | China Life Insurance Co., Ltd.-Class H | | | 4.2 | |
| 6. | | Huaneng Renewables Corp. Ltd.-Class H | | | 4.2 | |
| 7. | | PetroChina Co. Ltd.-Class H | | | 4.2 | |
| 8. | | Industrial and Commercial Bank of China Ltd.-Class H | | | 4.1 | |
| 9. | | CSPC Pharmaceutical Group Ltd. | | | 3.6 | |
10. | | Guangzhou Baiyunshan Pharmaceutical Holdings Co., Ltd-Class H | | | 3.2 | |
| | | | |
| Total Net Assets | | $ | 88.8 million | |
| |
| Total Number of Holdings* | | | 41 | |
The Fund’s holdings are subject to change, and there is no assurance that the Fund will continue to hold any particular security.
*Excluding money market fund holdings.
4 Invesco China Fund
Fund holdings in the industrials sector and stock selection in the financials sector detracted from relative performance versus the style-specific index as well. In the industrials sector, Summit Ascent Holdings was the largest detractor from relative performance. The company has diversified its business from supplying building materials to operating a gaming and resort development project in Russia. Despite a drop in share price due to the delay of launching the casino hotel project, we maintained the stock position as it is a first-mover in the Russian gaming market and may enjoy a three-year monopoly until 2018. Not owning several strong-performing names in the railway segment within the industrials sector also hurt relative performance, as railway stocks rallied upon market expectation of China increasing the infrastructure budget.
In the financials sector, Bank of China was the largest detractor from relative Fund performance versus the style-specific index. Property developer Longfor Properties also detracted from relative performance as the property segment underperformed the financials sector. We sold our position in Longfor Properties during the reporting period.
Some of the Fund’s underperformance was offset by overweight exposure to the health care sector and stock selection in the consumer staples sector. In the health care sector, specialty pharmaceutical company Luye Pharma Group led relative performance since listing in July. CSPC Pharmaceuticals Group also contributed to relative performance in the sector.
In the consumer staples sector, Yashili International Holdings contributed to relative Fund performance versus the style-specific index. The company is primarily engaged in the manufacturing and selling of dairy and nourishment products. It recently introduced the French multinational food company, Danone (not a Fund holding), as a strategic investor. We expect further cooperation between the two companies in research and development, brands, channel and production management. We sold our position in Yashili International Holding as the company no longer met our investment thesis.
Over the fiscal year, we have seen progress in different reform aspects in China. On the fiscal front, the recent government guidance allowing provincial-level governments to raise funds is an encouraging sign in reducing the common use of shadow banking through local government financing vehicles. We
believe this will lower the systemic risk in the financial system over the long run.
Thank you for your continued investment in Invesco China Fund.
The views and opinions expressed in management’s discussion of Fund performance are those of Invesco Advisers, Inc. These views and opinions are subject to change at any time based on factors such as market and economic conditions. These views and opinions may not be relied upon as investment advice or recommendations, or as an offer for a particular security. The information is not a complete analysis of every aspect of any market, country, industry, security or the Fund. Statements of fact are from sources considered reliable, but Invesco Advisers, Inc. makes no representation or warranty as to their completeness or accuracy. Although historical performance is no guarantee of future results, these insights may help you understand our investment management philosophy.
See important Fund and, if applicable, index disclosures later in this report.
| | |
 | | Joseph Tang Portfolio Manager, is manager of Invesco China Fund. He joined Invesco in 2006. Mr. Tang |
| earned an MS in finance from the University of Lancaster, UK. |
5 Invesco China Fund
Your Fund’s Long-Term Performance
Results of a $10,000 Investment – Oldest Share Class(es) since Inception
Fund and index data from 3/31/06
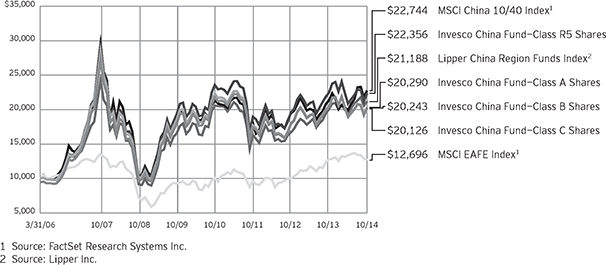
Past performance cannot guarantee comparable future results.
The data shown in the chart include reinvested distributions, applicable sales charges and Fund expenses including management fees. Results for Class B shares are calculated as if a hypothetical
shareholder had liquidated his entire investment in the Fund at the close of the reporting period and paid the contingent deferred sales charges, if applicable. Index results include reinvested dividends, but they do not reflect sales charges. Performance of the peer group,
if applicable, reflects fund expenses and management fees; performance of a market index does not. Performance shown in the chart and table(s) does not reflect deduction of taxes a shareholder would pay on Fund distributions or sale of Fund shares.
continued from page 8
performance in China, taking into consideration concentration constraints applicable to funds registered for sale in Europe pursuant to the UCITS III Directive. The index is computed using the net return, which withholds applicable taxes for non-resident investors.
| n | | The Lipper China Region Funds Index is an unmanaged index considered representative of China region funds tracked by Lipper. |
| n | | The Fund is not managed to track the performance of any particular index, including the index(es) described here, and consequently, the performance of the Fund may deviate significantly from the performance of the
index(es). |
| n | | A direct investment cannot be made in an index. Unless otherwise indicated, index results include reinvested dividends, and they do not reflect sales charges. Performance of the peer group, if applicable, reflects fund expenses; performance of a market index does not. |
Other information
| n | | The returns shown in management’s discussion of Fund performance are based on net asset values (NAVs) calculated for shareholder transactions. Generally accepted accounting principles require adjustments to be made to the net assets of the Fund at period end for financial reporting purposes, and as such, the NAVs for shareholder transactions and the returns based on those NAVs may differ from the NAVs and returns reported in the Financial Highlights. |
| n | | Industry classifications used in this report are generally according to the Global Industry Classification Standard, which was developed by and is the exclusive property and a service mark of MSCI Inc. and Standard & Poor’s. |
6 Invesco China Fund
| | | | |
| Average Annual Total Returns | |
As of 10/31/14, including maximum applicable sales charges | |
| Class A Shares | | | | |
| Inception (3/31/06) | | | 8.59 | % |
5 Years | | | 1.32 | |
1 Year | | | -6.36 | |
| |
| Class B Shares | | | | |
| Inception (3/31/06) | | | 8.56 | % |
5 Years | | | 1.35 | |
1 Year | | | -6.57 | |
| |
| Class C Shares | | | | |
| Inception (3/31/06) | | | 8.49 | % |
5 Years | | | 1.72 | |
1 Year | | | -2.65 | |
| |
| Class Y Shares | | | | |
| Inception | | | 9.49 | % |
5 Years | | | 2.74 | |
1 Year | | | -0.67 | |
| |
| Class R5 Shares | | | | |
| Inception (3/31/06) | | | 9.82 | % |
5 Years | | | 2.96 | |
1 Year | | | -0.46 | |
Class Y shares incepted on October 3, 2008. Performance shown prior to that date is that of Class A shares and includes the 12b-1 fees applicable to Class A shares. Class A share performance reflects any applicable fee waivers or expense reimbursements.
The performance data quoted represent past performance and cannot guarantee comparable future results; current performance may be lower or higher. Please visit invesco.com/performance for the most recent month-end performance. Performance figures reflect reinvested distributions, changes in net asset value and the effect of the maximum sales charge unless otherwise stated. Investment return and principal value will fluctuate so that you may have a gain or loss when you sell shares.
The total annual Fund operating expense ratio set forth in the most recent Fund prospectus as of the date of this report for Class A, Class B, Class C, Class Y and Class R5 shares was 1.78%, 2.53%, 2.53%, 1.53% and 1.33%, respectively. The expense ratios presented above may vary from the expense ratios presented in other sections of this report that are based on expenses incurred during the period covered by this report.
| | | | |
| Average Annual Total Returns | |
As of 9/30/14, the most recent calendar quarter end, including maximum applicable sales charges | |
Class A Shares | | | | |
Inception (3/31/06) | | | 8.02 | % |
5 Years | | | 1.40 | |
1 Year | | | -8.73 | |
| |
| Class B Shares | | | | |
Inception (3/31/06) | | | 7.99 | % |
5 Years | | | 1.42 | |
1 Year | | | -8.95 | |
| |
| Class C Shares | | | | |
Inception (3/31/06) | | | 7.92 | % |
5 Years | | | 1.79 | |
1 Year | | | -5.13 | |
| |
| Class Y Shares | | | | |
Inception | | | 8.92 | % |
5 Years | | | 2.81 | |
1 Year | | | -3.22 | |
| |
| Class R5 Shares | | | | |
Inception (3/31/06) | | | 9.24 | % |
5 Years | | | 3.02 | |
1 Year | | | -3.02 | |
Class A share performance reflects the maximum 5.50% sales charge, and Class B and Class C share performance reflects the applicable contingent deferred sales charge (CDSC) for the period involved. The CDSC on Class B shares declines from 5% beginning at the time of purchase to 0% at the beginning of the seventh year. The CDSC on Class C shares is 1% for the first year after purchase. Class Y and Class R5 shares do not have a front-end sales charge or a CDSC; therefore, performance is at net asset value.
The performance of the Fund’s share classes will differ primarily due to different sales charge structures and class expenses.
7 Invesco China Fund
Invesco China Fund’s investment objective is long-term growth of capital.
| n | | Unless otherwise stated, information presented in this report is as of October 31, 2014, and is based on total net assets. |
| n | | Unless otherwise noted, all data provided by Invesco. |
| n | | To access your Fund’s reports/prospectus, visit invesco.com/fundreports. |
About share classes
| n | | Class B shares may not be purchased for new or additional investments. Please see the prospectus for more information. |
| n | | Class Y shares are available to only certain investors. Please see the prospectus for more information. |
| n | | Class R5 shares are primarily intended for employer sponsored retirement and benefit plans that meet certain standards and for institutional investors. Please see the prospectus for more information. |
Principal risks of investing in the Fund
| n | | Active trading risk. The Fund engages in frequent trading of portfolio securities. Active trading results in added expenses and may result in a lower return and increased tax liability. |
| n | | Convertible securities risk. The Fund may own convertible securities, the value of which may be affected by market interest rates, the risk that the issuer will default, the value of the underlying stock or the right of the issuer to buy back the convertible securities. |
| n | | Depositary receipts risk. Depositary receipts involve many of the same risks as those associated with direct investment in foreign securities. In addition, the underlying issuers of certain depositary receipts, particularly unsponsored or unregistered depositary receipts, are under no obligation to distribute shareholder communications to the holders of such receipts or to pass through to them any voting rights with respect to the deposited securities. |
| n | | Developing/emerging markets securities risk. The prices of securities issued by foreign companies and governments located in developing/emerging market countries may be affected more negatively by inflation, devaluation of their currencies, higher transaction costs, delays in settlement, adverse political developments, the introduction of capital controls, withholding taxes, nationalization of private assets, |
| | | expropriation, social unrest, war or lack of timely information than those in developed countries. |
| n | | Foreign securities risk. The Fund’s foreign investments may be affected by changes in a foreign country’s exchange rates, political and social instability, changes in economic or taxation policies, difficulties when enforcing obligations, decreased liquidity, and increased volatility. Foreign companies may be subject to less regulation resulting in less publicly available information about the companies. |
| n | | Geographic focus risk. From time to time the Fund may invest a substantial amount of its assets in securities of issuers located in a single country or a limited number of countries. If the Fund focuses its investments in this manner, it assumes the risk that economic, political and social conditions in those countries will have a significant impact on its investment performance. The Fund’s investment performance may also be more volatile if it focuses its investments in certain countries, especially emerging markets countries. |
| n | | Management risk. The investment techniques and risk analysis used by the Fund’s portfolio managers may not produce the desired results. |
| n | | Market risk. The prices of and the income generated by the Fund’s securities may decline in response to, among other things, investor sentiment, general economic and market conditions, regional or global instability, and currency and interest rate fluctuations. |
| n | | Participation notes risk. Investments in participation notes involve the same risks associated with a direct investment in the underlying security, currency or market they seek to replicate. In addition, the Fund has no rights under participation notes against the issuer of the underlying security and is subject to the creditworthiness of the issuing bank or broker-dealer. |
| n | | Preferred securities risk. There are special risks associated with investing in preferred securities. Preferred securities |
| | | may include provisions that permit the issuer, in its discretion, to defer or omit distributions for a certain period of time. If the Fund owns a security that is deferring or omitting its distributions, the Fund may be required to report the distribution on its tax returns, even though it may not have received this income. Further, preferred securities may lose substantial value due to the omission or deferment of dividend payments. |
| n | | Small- and mid-capitalization risk. Stocks of small- and mid-sized companies tend to be more vulnerable to adverse developments and may have little or no operating history or track record of success, and limited product lines, markets, management and financial resources. The securities of small- and mid-sized companies may be more volatile due to less market interest and less publicly available information about the issuer. They also may be illiquid or restricted as to resale, or may trade less frequently and in smaller volumes, all of which may cause difficulty when establishing or closing a position at a desirable price. |
| n | | Unique economic and political risks of investing in China risk. China remains a totalitarian country with the following risks: nationalization, expropriation, or confiscation of property; difficulty in obtaining and/or enforcing judgments; alteration or discontinuation of economic reforms; military conflicts, either internal or with other countries; inflation, currency fluctuations and fluctuations in inflation and interest rates that may have negative effects on the economy and securities markets of China; and China’s dependency on the economies of other Asian countries, many of which are developing countries. |
About indexes used in this report
| n | | The MSCI EAFE® Index is an unmanaged index considered representative of stocks of Europe, Australasia and the Far East. The index is computed using the net return, which withholds applicable taxes for non-resident investors. |
| n | | The MSCI China 10/40 Index is a free float-adjusted market-capitalization index that measures equity market |
continued on page 6
This report must be accompanied or preceded by a currently effective Fund prospectus, which contains more complete information, including sales charges and expenses. Investors should read it carefully before investing.
NOT FDIC INSURED | MAY LOSE VALUE | NO BANK GUARANTEE
8 Invesco China Fund
Schedule of Investments(a)
October 31, 2014
| | | | | | | | |
| | | Shares | | | Value | |
Common Stocks & Other Equity
Interests–98.82%(b) | |
| Asset Management & Custody Banks–1.36% | |
China Cinda Asset Management Co. Ltd.–Class H(c) | | | 2,552,000 | | | $ | 1,207,701 | |
| | |
| Casinos & Gaming–6.83% | | | | | | | | |
Melco International Development Ltd. (Hong Kong) | | | 1,429,000 | | | | 3,869,583 | |
MGM China Holdings Ltd. (Macau) | | | 343,200 | | | | 1,122,957 | |
Sands China Ltd. (Hong Kong) | | | 173,200 | | | | 1,078,717 | |
| | | | | | | | 6,071,257 | |
|
| Coal & Consumable Fuels–4.73% | |
China Coal Energy Co. Ltd.–Class H | | | 2,464,000 | | | | 1,525,537 | |
China Shenhua Energy Co. Ltd.–Class H | | | 949,500 | | | | 2,675,217 | |
| | | | | | | | 4,200,754 | |
|
| Diversified Banks–13.96% | |
Agricultural Bank of China Ltd.–Class H | | | 4,093,000 | | | | 1,900,014 | |
China Construction Bank Corp.–Class H | | | 7,364,290 | | | | 5,488,723 | |
China Merchants Bank Co., Ltd.–Class H | | | 745,500 | | | | 1,380,431 | |
Industrial & Commercial Bank of China Ltd.–Class H | | | 5,495,000 | | | | 3,634,944 | |
| | | | | | | | 12,404,112 | |
|
| Education Services–0.96% | |
New Oriental Education & Technology Group, Inc.–ADR(c) | | | 39,334 | | | | 849,614 | |
|
| Food Retail–0.98% | |
China Resources Enterprise Ltd. | | | 366,000 | | | | 870,271 | |
|
| Health Care Distributors–2.87% | |
Shanghai Pharmaceuticals Holding Co., Ltd.–Class H | | | 1,019,300 | | | | 2,552,489 | |
|
| Industrial Conglomerates–2.23% | |
Beijing Enterprises Holdings Ltd. | | | 242,000 | | | | 1,983,714 | |
|
| Integrated Oil & Gas–4.15% | |
PetroChina Co. Ltd.–Class H | | | 2,936,000 | | | | 3,690,250 | |
|
| Integrated Telecommunication Services–2.43% | |
China Unicom (Hong Kong) Ltd. | | | 1,442,000 | | | | 2,162,245 | |
|
| Internet Software & Services–12.80% | |
21Vianet Group, Inc.–ADR(c) | | | 83,075 | | | | 1,737,929 | |
Baidu, Inc.–ADR(c) | | | 7,990 | | | | 1,907,772 | |
HC International, Inc.(c) | | | 1,112,000 | | | | 1,357,454 | |
Tencent Holdings Ltd. | | | 349,600 | | | | 5,571,890 | |
YY Inc.–ADR(c) | | | 9,558 | | | | 791,976 | |
| | | | | 11,367,021 | |
|
| IT Consulting & Other Services–0.64% | |
China Public Procurement Ltd.(c) | | | 16,236,000 | | | | 569,055 | |
| | | | | | | | |
| | | Shares | | | Value | |
| Life & Health Insurance–5.74% | |
China Life Insurance Co., Ltd.–Class H | | | 1,245,000 | | | $ | 3,716,453 | |
Ping An Insurance (Group) Co. of China Ltd.–Class H | | | 169,000 | | | | 1,384,051 | |
| | | | | 5,100,504 | |
|
| Multi-Line Insurance–2.40% | |
China Pacific Insurance (Group) Co., Ltd.–Class H | | | 568,200 | | | | 2,130,685 | |
|
| Oil & Gas Exploration & Production–2.68% | |
CNOOC Ltd. | | | 1,523,000 | | | | 2,384,170 | |
|
| Packaged Foods & Meats–2.58% | |
China Mengniu Dairy Co. Ltd. | | | 519,000 | | | | 2,292,137 | |
|
| Pharmaceuticals–11.07% | |
CSPC Pharmaceutical Group Ltd. | | | 3,476,000 | | | | 3,200,299 | |
Dawnrays Pharmaceutical (Holdings) Ltd. | | | 492,000 | | | | 489,432 | |
Guangzhou Baiyunshan Pharmaceutical Holdings Co., Ltd.–Class H | | | 818,000 | | | | 2,820,610 | |
Livzon Pharmaceutical Group Inc.–Class H | | | 131,900 | | | | 986,473 | |
Luye Pharma Group Ltd.(c) | | | 636,000 | | | | 918,518 | |
Tong Ren Tang Technologies Co. Ltd.–Class H | | | 1,052,000 | | | | 1,420,327 | |
| | | | | 9,835,659 | |
|
| Property & Casualty Insurance–1.06% | |
PICC Property and Casualty Co. Ltd.–Class H | | | 512,000 | | | | 938,820 | |
|
| Real Estate Development–4.36% | |
China Resources Land Ltd. | | | 866,000 | | | | 2,065,517 | |
Sunac China Holdings Ltd. | | | 2,085,000 | | | | 1,804,019 | |
| | | | | 3,869,536 | |
|
| Renewable Electricity–4.17% | |
Huaneng Renewables Corp. Ltd.–Class H | | | 10,284,000 | | | | 3,699,805 | |
|
| Semiconductors–2.03% | |
United Photovoltaics Group Ltd. (Hong Kong)(c) | | | 13,834,000 | | | | 1,801,697 | |
|
| Specialized Finance–1.48% | |
Far East Horizon Ltd. | | | 1,413,000 | | | | 1,311,859 | |
|
| Trading Companies & Distributors–0.98% | |
Summit Ascent Holdings Ltd.
(Hong Kong)(c) | | | 2,012,000 | | | | 874,148 | |
|
| Water Utilities–6.33% | |
Beijing Enterprises Water Group Ltd. | | | 7,854,000 | | | | 5,620,779 | |
Total Common Stocks & Other Equity Interests (Cost $88,138,960) | | | | | | | 87,788,282 | |
See accompanying Notes to Financial Statements which are an integral part of the financial statements.
9 Invesco China Fund
| | | | | | | | |
| | | Shares | | | Value | |
Money Market Funds–1.41% | | | | | | | | |
Liquid Assets Portfolio–Institutional Class(d) | | | 624,748 | | | $ | 624,748 | |
Premier Portfolio–Institutional Class(d) | | | 624,748 | | | | 624,748 | |
Total Money Market Funds (Cost $1,249,496) | | | | | | | 1,249,496 | |
TOTAL INVESTMENTS–100.23% (Cost $89,388,456) | | | | | | | 89,037,778 | |
OTHER ASSETS LESS LIABILITIES–(0.23)% | | | | | | | (202,600 | ) |
NET ASSETS–100.00% | | | | | | $ | 88,835,178 | |
Investment Abbreviations:
| | |
| ADR | | – American Depositary Receipt |
Notes to Schedule of Investments:
| (a) | Industry and/or sector classifications used in this report are generally according to the Global Industry Classification Standard, which was developed by and is the exclusive property and a service mark of MSCI Inc. and Standard & Poor’s. |
| (b) | Country of issuer and/or credit risk exposure listed in Common Stocks & Other Equity Interests has been determined to be China unless otherwise noted. |
| (c) | Non-income producing security. |
| (d) | The money market fund and the Fund are affiliated by having the same investment adviser. |
See accompanying Notes to Financial Statements which are an integral part of the financial statements.
10 Invesco China Fund
Statement of Assets and Liabilities
October 31, 2014
| | | | |
Assets: | | | | |
Investments, at value (Cost $88,138,960) | | $ | 87,788,282 | |
Investments in affiliated money market funds, at value and cost | | | 1,249,496 | |
Total investments, at value (Cost $89,388,456) | | | 89,037,778 | |
Receivable for: | | | | |
Investments sold | | | 268,128 | |
Fund shares sold | | | 44,957 | |
Dividends | | | 5,230 | |
Investment for trustee deferred compensation and retirement plans | | | 48,369 | |
Other assets | | | 17,003 | |
Total assets | | | 89,421,465 | |
| |
Liabilities: | | | | |
Payable for: | | | | |
Investments purchased | | | 234,645 | |
Fund shares reacquired | | | 121,193 | |
Accrued fees to affiliates | | | 84,109 | |
Accrued trustees’ and officers’ fees and benefits | | | 1,847 | |
Accrued other operating expenses | | | 90,919 | |
Trustee deferred compensation and retirement plans | | | 53,574 | |
Total liabilities | | | 586,287 | |
Net assets applicable to shares outstanding | | $ | 88,835,178 | |
| |
Net assets consist of: | | | | |
Shares of beneficial interest | | $ | 130,716,711 | |
Undistributed net investment income | | | 234,405 | |
Undistributed net realized gain (loss) | | | (41,765,229 | ) |
Net unrealized appreciation (depreciation) | | | (350,709 | ) |
| | | $ | 88,835,178 | |
| | | | |
Net Assets: | | | | |
Class A | | $ | 62,956,699 | |
Class B | | $ | 5,303,258 | |
Class C | | $ | 15,977,647 | |
Class Y | | $ | 4,493,926 | |
Class R5 | | $ | 103,648 | |
|
Shares outstanding, $0.01 par value per share,
with an unlimited number of shares authorized: | |
Class A | | | 3,159,149 | |
Class B | | | 274,083 | |
Class C | | | 827,128 | |
Class Y | | | 224,959 | |
Class R5 | | | 5,179 | |
Class A: | | | | |
Net asset value per share | | $ | 19.93 | |
Maximum offering price per share | | | | |
(Net asset value of $19.93 ¸ 94.50%) | | $ | 21.09 | |
Class B: | | | | |
Net asset value and offering price per share | | $ | 19.35 | |
Class C: | | | | |
Net asset value and offering price per share | | $ | 19.32 | |
Class Y: | | | | |
Net asset value and offering price per share | | $ | 19.98 | |
Class R5: | | | | |
Net asset value and offering price per share | | $ | 20.01 | |
See accompanying Notes to Financial Statements which are an integral part of the financial statements.
11 Invesco China Fund
Statement of Operations
For the year ended October 31, 2014
| | | | |
Investment income: | |
Dividends (net of foreign withholding taxes of $147,931) | | $ | 1,705,752 | |
Dividends from affiliated money market funds | | | 1,013 | |
Total investment income | | | 1,706,765 | |
| |
Expenses: | | | | |
Advisory fees | | | 936,849 | |
Administrative services fees | | | 50,000 | |
Custodian fees | | | 107,303 | |
Distribution fees: | | | | |
Class A | | | 175,866 | |
Class B | | | 63,437 | |
Class C | | | 188,591 | |
Transfer Agent Fees — A, B, C and Y | | | 306,358 | |
Transfer agent fees — R5 | | | 287 | |
Trustees’ and officers’ fees and benefits | | | 25,204 | |
Other | | | 176,513 | |
Total expenses | | | 2,030,408 | |
Less: Fees waived and expense offset arrangement(s) | | | (4,827 | ) |
Net expenses | | | 2,025,581 | |
Net investment income (loss) | | | (318,816 | ) |
| |
Realized and unrealized gain (loss) from: | | | | |
Net realized gain (loss) from: | | | | |
Investment securities | | | 12,286,582 | |
Foreign currencies | | | (1,573 | ) |
| | | | 12,285,009 | |
Change in net unrealized appreciation (depreciation) of: | | | | |
Investment securities | | | (13,395,544 | ) |
Foreign currencies | | | 165 | |
| | | | (13,395,379 | ) |
Net realized and unrealized gain (loss) | | | (1,110,370 | ) |
Net increase (decrease) in net assets resulting from operations | | $ | (1,429,186 | ) |
See accompanying Notes to Financial Statements which are an integral part of the financial statements.
12 Invesco China Fund
Statement of Changes in Net Assets
For the years ended October 31, 2014 and 2013
| | | | | | | | |
| | | 2014 | | | 2013 | |
Operations: | | | | | | | | |
Net investment income (loss) | | $ | (318,816 | ) | | $ | 359,122 | |
Net realized gain | | | 12,285,009 | | | | 20,322,076 | |
Change in net unrealized appreciation (depreciation) | | | (13,395,379 | ) | | | (5,966,943 | ) |
Net increase (decrease) in net assets resulting from operations | | | (1,429,186 | ) | | | 14,714,255 | |
| | |
Distributions to shareholders from net investment income: | | | | | | | | |
Class A | | | (846,845 | ) | | | (543,607 | ) |
Class B | | | (16,420 | ) | | | — | |
Class C | | | (47,698 | ) | | | — | |
Class Y | | | (59,852 | ) | | | (38,795 | ) |
Class R5 | | | (5,462 | ) | | | (8,770 | ) |
Total distributions from net investment income | | | (976,277 | ) | | | (591,172 | ) |
| | |
Share transactions–net: | | | | | | | | |
Class A | | | (11,916,527 | ) | | | (15,802,729 | ) |
Class B | | | (2,003,637 | ) | | | (3,356,303 | ) |
Class C | | | (4,995,375 | ) | | | (5,993,365 | ) |
Class Y | | | 52,909 | | | | (426,604 | ) |
Class R5 | | | (307,144 | ) | | | (418,844 | ) |
Net increase (decrease) in net assets resulting from share transactions | | | (19,169,774 | ) | | | (25,997,845 | ) |
Net increase (decrease) in net assets | | | (21,575,237 | ) | | | (11,874,762 | ) |
| | |
Net assets: | | | | | | | | |
Beginning of year | | | 110,410,415 | | | | 122,285,177 | |
End of year (includes undistributed net investment income of $234,405 and $915,503, respectively) | | $ | 88,835,178 | | | $ | 110,410,415 | |
Notes to Financial Statements
October 31, 2014
NOTE 1—Significant Accounting Policies
Invesco China Fund (the “Fund”) is a series portfolio of AIM Investment Funds (Invesco Investment Funds) (the “Trust”). The Trust is organized as a Delaware statutory trust and is registered under the Investment Company Act of 1940, as amended (the “1940 Act”), as an open-end series management investment company consisting of twenty-four separate series portfolios, each authorized to issue an unlimited number of shares of beneficial interest. The assets, liabilities and operations of each portfolio are accounted for separately. Information presented in these financial statements pertains only to the Fund. Matters affecting each portfolio or class will be voted on exclusively by the shareholders of such portfolio or class.
The Fund’s investment objective is long-term growth of capital.
The Fund currently consists of five different classes of shares: Class A, Class B, Class C, Class Y and Class R5. Class A shares are sold with a front-end sales charge unless certain waiver criteria are met and under certain circumstances load waived shares may be subject to contingent deferred sales charges (“CDSC”). Class C shares are sold with a CDSC. Class Y and Class R5 shares are sold at net asset value. Effective November 30, 2010, new or additional investments in Class B shares are no longer permitted. Existing shareholders of Class B shares may continue to reinvest dividends and capital gains distributions in Class B shares until they convert to Class A shares. Also, shareholders in Class B shares will be able to exchange those shares for Class B shares of other Invesco Funds offering such shares until they convert to Class A shares. Generally, Class B shares will automatically convert to Class A shares on or about the month-end, which is at least eight years after the date of purchase. Redemption of Class B shares prior to the conversion date will be subject to a CDSC.
The following is a summary of the significant accounting policies followed by the Fund in the preparation of its financial statements.
| A. | Security Valuations — Securities, including restricted securities, are valued according to the following policy. |
A security listed or traded on an exchange (except convertible securities) is valued at its last sales price or official closing price as of the close of the customary trading session on the exchange where the security is principally traded, or lacking any sales or official closing price on a particular day, the security may be valued at the closing bid price on that day. Securities traded in the over-the-counter market are valued based on prices furnished by independent pricing services or market makers. When such securities are valued by an independent pricing service they may be considered fair valued. Futures contracts are valued at the final settlement price set by an exchange on which they are principally traded. Listed options are valued at the mean between the last bid and ask prices from the exchange on which they are principally traded. Options not listed on an exchange are valued by an independent source at the mean between the last bid and ask prices. For purposes of determining net
13 Invesco China Fund
asset value per share, futures and option contracts generally are valued 15 minutes after the close of the customary trading session of the New York Stock Exchange (“NYSE”).
Investments in open-end and closed-end registered investment companies that do not trade on an exchange are valued at the end of day net asset value per share. Investments in open-end and closed-end registered investment companies that trade on an exchange are valued at the last sales price or official closing price as of the close of the customary trading session on the exchange where the security is principally traded.
Debt obligations (including convertible securities) and unlisted equities are fair valued using an evaluated quote provided by an independent pricing service. Evaluated quotes provided by the pricing service may be determined without exclusive reliance on quoted prices, and may reflect appropriate factors such as institution-size trading in similar groups of securities, developments related to specific securities, dividend rate (for unlisted equities), yield (for debt obligations), quality, type of issue, coupon rate (for debt obligations), maturity (for debt obligations), individual trading characteristics and other market data. Debt obligations are subject to interest rate and credit risks. In addition, all debt obligations involve some risk of default with respect to interest and/or principal payments.
Foreign securities’ (including foreign exchange contracts) prices are converted into U.S. dollar amounts using the applicable exchange rates as of the close of the NYSE. If market quotations are available and reliable for foreign exchange-traded equity securities, the securities will be valued at the market quotations. Because trading hours for certain foreign securities end before the close of the NYSE, closing market quotations may become unreliable. If between the time trading ends on a particular security and the close of the customary trading session on the NYSE, events occur that the Adviser determines are significant and make the closing price unreliable, the Fund may fair value the security. If the event is likely to have affected the closing price of the security, the security will be valued at fair value in good faith using procedures approved by the Board of Trustees. Adjustments to closing prices to reflect fair value may also be based on a screening process of an independent pricing service to indicate the degree of certainty, based on historical data, that the closing price in the principal market where a foreign security trades is not the current value as of the close of the NYSE. Foreign securities’ prices meeting the approved degree of certainty that the price is not reflective of current value will be priced at the indication of fair value from the independent pricing service. Multiple factors may be considered by the independent pricing service in determining adjustments to reflect fair value and may include information relating to sector indices, American Depositary Receipts and domestic and foreign index futures. Foreign securities may have additional risks including exchange rate changes, potential for sharply devalued currencies and high inflation, political and economic upheaval, the relative lack of issuer information, relatively low market liquidity and the potential lack of strict financial and accounting controls and standards.
Securities for which market prices are not provided by any of the above methods may be valued based upon quotes furnished by independent sources. The last bid price may be used to value equity securities. The mean between the last bid and ask prices is used to value debt obligations, including corporate loans.
Securities for which market quotations are not readily available or became unreliable are valued at fair value as determined in good faith by or under the supervision of the Trust’s officers following procedures approved by the Board of Trustees. Issuer specific events, market trends, bid/ask quotes of brokers and information providers and other market data may be reviewed in the course of making a good faith determination of a security’s fair value.
The Fund may invest in securities that are subject to interest rate risk, meaning the risk that the prices will generally fall as interest rates rise and, conversely, the prices will generally rise as interest rates fall. Specific securities differ in their sensitivity to changes in interest rates depending on their individual characteristics. Changes in interest rates may result in increased market volatility, which may affect the value and/or liquidity of certain of the Fund’s investments.
Valuations change in response to many factors including the historical and prospective earnings of the issuer, the value of the issuer’s assets, general economic conditions, interest rates, investor perceptions and market liquidity. Because of the inherent uncertainties of valuation, the values reflected in the financial statements may materially differ from the value received upon actual sale of those investments.
| B. | Securities Transactions and Investment Income — Securities transactions are accounted for on a trade date basis. Realized gains or losses on sales are computed on the basis of specific identification of the securities sold. Interest income (net of withholding tax, if any) is recorded on the accrual basis from settlement date. Dividend income (net of withholding tax, if any) is recorded on the ex-dividend date. |
The Fund may periodically participate in litigation related to Fund investments. As such, the Fund may receive proceeds from litigation settlements. Any proceeds received are included in the Statement of Operations as realized gain (loss) for investments no longer held and as unrealized gain (loss) for investments still held.
Brokerage commissions and mark ups are considered transaction costs and are recorded as an increase to the cost basis of securities purchased and/or a reduction of proceeds on a sale of securities. Such transaction costs are included in the determination of net realized and unrealized gain (loss) from investment securities reported in the Statement of Operations and the Statement of Changes in Net Assets and the net realized and unrealized gains (losses) on securities per share in the Financial Highlights. Transaction costs are included in the calculation of the Fund’s net asset value and, accordingly, they reduce the Fund’s total returns. These transaction costs are not considered operating expenses and are not reflected in net investment income reported in the Statement of Operations and Statement of Changes in Net Assets, or the net investment income per share and ratios of expenses and net investment income reported in the Financial Highlights, nor are they limited by any expense limitation arrangements between the Fund and the investment adviser.
The Fund allocates income and realized and unrealized capital gains and losses to a class based on the relative net assets of each class.
| C. | Country Determination — For the purposes of making investment selection decisions and presentation in the Schedule of Investments, the investment adviser may determine the country in which an issuer is located and/or credit risk exposure based on various factors. These factors include the laws of the country under which the issuer is organized, where the issuer maintains a principal office, the country in which the issuer derives 50% or more of its total revenues and the country that has the primary market for the issuer’s securities, as well as other criteria. Among the other criteria that may be evaluated for making this determination are the country in which the issuer maintains 50% or more of its assets, the type of security, financial guarantees and enhancements, the nature of the collateral and the sponsor organization. Country of issuer and/or credit risk exposure has been determined to be the United States of America, unless otherwise noted. |
| D. | Distributions — Distributions from net investment income and net realized capital gain, if any, are generally declared and paid annually and recorded on the ex-dividend date. The Fund may elect to treat a portion of the proceeds from redemptions as distributions for federal income tax purposes. |
14 Invesco China Fund
| E. | Federal Income Taxes — The Fund intends to comply with the requirements of Subchapter M of the Internal Revenue Code of 1986, as amended (the “Internal Revenue Code”), necessary to qualify as a regulated investment company and to distribute substantially all of the Fund’s taxable earnings to shareholders. As such, the Fund will not be subject to federal income taxes on otherwise taxable income (including net realized capital gain) that is distributed to shareholders. Therefore, no provision for federal income taxes is recorded in the financial statements. |
The Fund recognizes the tax benefits of uncertain tax positions only when the position is more likely than not to be sustained. Management has analyzed the Fund’s uncertain tax positions and concluded that no liability for unrecognized tax benefits should be recorded related to uncertain tax positions. Management is not aware of any tax positions for which it is reasonably possible that the total amounts of unrecognized tax benefits will change materially in the next 12 months.
The Fund files tax returns in the U.S. Federal jurisdiction and certain other jurisdictions. Generally, the Fund is subject to examinations by such taxing authorities for up to three years after the filing of the return for the tax period.
| F. | Expenses — Fees provided for under the Rule 12b-1 plan of a particular class of the Fund are charged to the operations of such class. Transfer agency fees and expenses and other shareholder recordkeeping fees and expenses attributable to Class R5 are charged to such class. Transfer agency fees and expenses and other shareholder recordkeeping fees and expenses relating to all other classes are allocated among those classes based on relative net assets. All other expenses are allocated among the classes based on relative net assets. |
| G. | Accounting Estimates — The preparation of financial statements in conformity with accounting principles generally accepted in the United States of America (“GAAP”) requires management to make estimates and assumptions that affect the reported amounts of assets and liabilities at the date of the financial statements and the reported amounts of revenues and expenses during the reporting period including estimates and assumptions related to taxation. Actual results could differ from those estimates by a significant amount. In addition, the Fund monitors for material events or transactions that may occur or become known after the period-end date and before the date the financial statements are released to print. |
| H. | Indemnifications — Under the Trust’s organizational documents, each Trustee, officer, employee or other agent of the Trust is indemnified against certain liabilities that may arise out of the performance of their duties to the Fund. Additionally, in the normal course of business, the Fund enters into contracts, including the Fund’s servicing agreements, that contain a variety of indemnification clauses. The Fund’s maximum exposure under these arrangements is unknown as this would involve future claims that may be made against the Fund that have not yet occurred. The risk of material loss as a result of such indemnification claims is considered remote. |
| I. | Foreign Currency Translations — Foreign currency is valued at the close of the NYSE based on quotations posted by banks and major currency dealers. Portfolio securities and other assets and liabilities denominated in foreign currencies are translated into U.S. dollar amounts at date of valuation. Purchases and sales of portfolio securities (net of foreign taxes withheld on disposition) and income items denominated in foreign currencies are translated into U.S. dollar amounts on the respective dates of such transactions. The Fund does not separately account for the portion of the results of operations resulting from changes in foreign exchange rates on investments and the fluctuations arising from changes in market prices of securities held. The combined results of changes in foreign exchange rates and the fluctuation of market prices on investments (net of estimated foreign tax withholding) are included with the net realized and unrealized gain or loss from investments in the Statement of Operations. Reported net realized foreign currency gains or losses arise from (1) sales of foreign currencies, (2) currency gains or losses realized between the trade and settlement dates on securities transactions, and (3) the difference between the amounts of dividends, interest, and foreign withholding taxes recorded on the Fund’s books and the U.S. dollar equivalent of the amounts actually received or paid. Net unrealized foreign currency gains and losses arise from changes in the fair values of assets and liabilities, other than investments in securities at fiscal period end, resulting from changes in exchange rates. |
The Fund may invest in foreign securities, which may be subject to foreign taxes on income, gains on investments or currency repatriation, a portion of which may be recoverable. Foreign taxes, if any, are recorded based on the tax regulations and rates that exist in the foreign markets in which the Fund invests and are shown in the Statement of Operations.
| J. | Forward Foreign Currency Contracts — The Fund may engage in foreign currency transactions either on a spot (i.e. for prompt delivery and settlement) basis or through forward foreign currency contracts to manage or minimize currency or exchange rate risk. |
The Fund may also enter into forward foreign currency contracts for the purchase or sale of a security denominated in a foreign currency in order to “lock in” the U.S. dollar price of that security, or the Fund may also enter into forward foreign currency contracts that do not provide for physical settlement of the two currencies, but instead are settled by a single cash payment calculated as the difference between the agreed upon exchange rate and the spot rate at settlement based upon an agreed upon notional amount (non-deliverable forwards). The Fund will set aside liquid assets in an amount equal to daily mark-to-market obligation for forward foreign currency contracts.
A forward foreign currency contract is an obligation between two parties (“Counterparties”) to purchase or sell a specific currency for an agreed-upon price at a future date. The use of forward foreign currency contracts does not eliminate fluctuations in the price of the underlying securities the Fund owns or intends to acquire but establishes a rate of exchange in advance. Fluctuations in the value of these contracts are measured by the difference in the contract date and reporting date exchange rates and are recorded as unrealized appreciation (depreciation) until the contracts are closed. When the contracts are closed, realized gains (losses) are recorded. Realized and unrealized gains (losses) on the contracts are included in the Statement of Operations. The primary risks associated with forward foreign currency contracts include failure of the Counterparty to meet the terms of the contract and the value of the foreign currency changing unfavorably. These risks may be in excess of the amounts reflected in the Statement of Assets and Liabilities.
| K. | Other Risks — Investing in a single-country mutual fund involves greater risk than investing in a more diversified fund due to lack of exposure to other countries. The political and economic conditions and changes in regulatory, tax or economic policy in a single country could significantly affect the market in that country and in surrounding or related countries. |
Investing in developing countries can add additional risk, such as high rates of inflation or sharply devalued currencies against the U.S. dollar.
Transaction costs are often higher and there may be delays in settlement procedures.
Certain securities issued by companies in China may be less liquid, harder to sell or more volatile than may U.S. securities.
15 Invesco China Fund
NOTE 2—Advisory Fees and Other Fees Paid to Affiliates
The Trust has entered into a master investment advisory agreement with Invesco Advisers, Inc. (the “Adviser” or “Invesco”). Under the terms of the investment advisory agreement, the Fund pays an advisory fee to the Adviser based on the annual rate of the Fund’s average daily net assets as follows:
| | | | | | |
| Average Daily Net Assets | | Rate |
First $250 million | | | 0 | .935% | | |
Next $250 million | | | 0 | .91% | | |
Next $500 million | | | 0 | .885% | | |
Next $1.5 billion | | | 0 | .86% | | |
Next $2.5 billion | | | 0 | .835% | | |
Next $2.5 billion | | | 0 | .81% | | |
Next $2.5 billion | | | 0 | .785% | | |
Over $10 billion | | | 0 | .76% | | |
For the year ended October 31, 2014, the effective advisory fees incurred by the Fund was 0.94%.
Under the terms of a master sub-advisory agreement between the Adviser and each of Invesco Asset Management Deutschland GmbH, Invesco Asset Management Limited, Invesco Asset Management (Japan) Limited, Invesco Australia Limited, Invesco Hong Kong Limited, Invesco Senior Secured Management, Inc. and Invesco Canada Ltd. (collectively, the “Affiliated Sub-Advisers”) the Adviser, not the Fund, may pay 40% of the fees paid to the Adviser to any such Affiliated Sub-Adviser(s) that provide(s) discretionary investment management services to the Fund based on the percentage of assets allocated to such Sub-Adviser(s).
The Adviser has contractually agreed, through at least June 30, 2015, to waive advisory fees and/or reimburse expenses to the extent necessary to limit total annual fund operating expenses after fee waiver and/or expense reimbursement (excluding certain items discussed below) of Class A, Class B, Class C, Class Y and Class R5 shares to 2.25%, 3.00%, 3.00%, 2.00% and 2.00% of average daily net assets, respectively. In determining the Adviser’s obligation to waive advisory fees and/or reimburse expenses, the following expenses are not taken into account, and could cause the total annual fund operating expenses after fee waiver and/or reimbursement to exceed the numbers reflected above: (1) interest; (2) taxes; (3) dividend expense on short sales; (4) extraordinary or non-routine items, including litigation expenses; and (5) expenses that the Fund has incurred but did not actually pay because of an expense offset arrangement. Unless Invesco continues the fee waiver agreement, it will terminate on June 30, 2015. The fee waiver agreement cannot be terminated during its term. The Adviser did not waive fees and/or reimburse expenses during the period under this expense limitation.
Further, the Adviser has contractually agreed, through at least June 30, 2016, to waive the advisory fee payable by the Fund in an amount equal to 100% of the net advisory fees the Adviser receives from the affiliated money market funds on investments by the Fund of uninvested cash in such affiliated money market funds.
For the year ended October 31, 2014, the Adviser waived advisory fees of $3,825.
The Trust has entered into a master administrative services agreement with Invesco pursuant to which the Fund has agreed to pay Invesco for certain administrative costs incurred in providing accounting services to the Fund. For the year ended October 31, 2014, expenses incurred under the agreement are shown in the Statement of Operations as Administrative services fees.
The Trust has entered into a transfer agency and service agreement with Invesco Investment Services, Inc. (“IIS”) pursuant to which the Fund has agreed to pay IIS a fee for providing transfer agency and shareholder services to the Fund and reimburse IIS for certain expenses incurred by IIS in the course of providing such services. IIS may make payments to intermediaries that provide omnibus account services, sub-accounting services and/or networking services. All fees payable by IIS to intermediaries that provide omnibus account services or sub-accounting are charged back to the Fund, subject to certain limitations approved by the Trust’s Board of Trustees. For the year ended October 31, 2014, expenses incurred under the agreement are shown in the Statement of Operations as Transfer agent fees.
The Trust has entered into master distribution agreements with Invesco Distributors, Inc. (“IDI”) to serve as the distributor for the Class A, Class B, Class C, Class Y and Class R5 shares of the Fund. The Trust has adopted plans pursuant to Rule 12b-1 under the 1940 Act with respect to the Fund’s Class A, Class B and Class C shares (collectively, the “Plans”). The Fund, pursuant to the Plans, pays IDI compensation at the annual rate of 0.25% of the Fund’s average daily net assets of Class A shares and 1.00% of the average daily net assets of Class B and Class C shares. Of the Plan payments, up to 0.25% of the average daily net assets of each class of shares may be paid to furnish continuing personal shareholder services to customers who purchase and own shares of such classes. Any amounts not paid as a service fee under the Plans would constitute an asset-based sales charge. Rules of the Financial Industry Regulatory Authority (“FINRA”) impose a cap on the total sales charges, including asset-based sales charges, that may be paid by any class of shares of the Fund. For the year ended October 31, 2014, expenses incurred under the Plans are shown in the Statement of Operations as Distribution fees.
Front-end sales commissions and CDSC (collectively, the “sales charges”) are not recorded as expenses of the Fund. Front-end sales commissions are deducted from proceeds from the sales of Fund shares prior to investment in Class A shares of the Fund. CDSC are deducted from redemption proceeds prior to remittance to the shareholder. During the year ended October 31, 2014, IDI advised the Fund that IDI retained $11,607 in front-end sales commissions from the sale of Class A shares and $221, $6,583 and $525 from Class A, Class B and Class C shares, respectively, for CDSC imposed on redemptions by shareholders.
Certain officers and trustees of the Trust are officers and directors of the Adviser, IIS and/or IDI.
16 Invesco China Fund
NOTE 3—Additional Valuation Information
GAAP defines fair value as the price that would be received to sell an asset or paid to transfer a liability in an orderly transaction between market participants at the measurement date, under current market conditions. GAAP establishes a hierarchy that prioritizes the inputs to valuation methods, giving the highest priority to readily available unadjusted quoted prices in an active market for identical assets (Level 1) and the lowest priority to significant unobservable inputs (Level 3), generally when market prices are not readily available or are unreliable. Based on the valuation inputs, the securities or other investments are tiered into one of three levels. Changes in valuation methods may result in transfers in or out of an investment’s assigned level:
| | Level 1 — | Prices are determined using quoted prices in an active market for identical assets. |
| | Level 2 — | Prices are determined using other significant observable inputs. Observable inputs are inputs that other market participants may use in pricing a security. These may include quoted prices for similar securities, interest rates, prepayment speeds, credit risk, yield curves, loss severities, default rates, discount rates, volatilities and others. |
| | Level 3 — | Prices are determined using significant unobservable inputs. In situations where quoted prices or observable inputs are unavailable (for example, when there is little or no market activity for an investment at the end of the period), unobservable inputs may be used. Unobservable inputs reflect the Fund’s own assumptions about the factors market participants would use in determining fair value of the securities or instruments and would be based on the best available information. |
The following is a summary of the tiered valuation input levels, as of October 31, 2014. The level assigned to the securities valuations may not be an indication of the risk or liquidity associated with investing in those securities. Because of the inherent uncertainties of valuation, the values reflected in the financial statements may materially differ from the value received upon actual sale of those investments.
During the year ended October 31, 2014, there were transfers from Level 1 to Level 2 of $3,373,433 and from Level 2 to Level 1 of $1,380,431, due to foreign fair value adjustments.
| | | | | | | | | | | | | | | | |
| | | Level 1 | | | Level 2 | | | Level 3 | | | Total | |
Consumer Discretionary | | $ | 5,797,914 | | | $ | 1,122,957 | | | $ | — | | | $ | 6,920,871 | |
Consumer Staples | | | 3,162,408 | | | | — | | | | — | | | | 3,162,408 | |
Energy | | | 2,675,217 | | | | 7,599,957 | | | | — | | | | 10,275,174 | |
Financials | | | 17,666,512 | | | | 9,296,705 | | | | — | | | | 26,963,217 | |
Health Care | | | 7,657,779 | | | | 4,730,369 | | | | — | | | | 12,388,148 | |
Industrials | | | — | | | | 2,857,862 | | | | — | | | | 2,857,862 | |
Information Technology | | | 11,811,264 | | | | 1,926,509 | | | | — | | | | 13,737,773 | |
Telecommunication Services | | | — | | | | 2,162,245 | | | | — | | | | 2,162,245 | |
Utilities | | | 9,320,584 | | | | — | | | | — | | | | 9,320,584 | |
Money Market Funds | | | 1,249,496 | | | | — | | | | — | | | | 1,249,496 | |
Total Investments | | $ | 59,341,174 | | | $ | 29,696,604 | | | $ | — | | | $ | 89,037,778 | |
NOTE 4—Expense Offset Arrangement(s)
The expense offset arrangement is comprised of transfer agency credits which result from balances in demand deposit accounts used by the transfer agent for clearing shareholder transactions. For the year ended October 31, 2014, the Fund received credits from this arrangement, which resulted in the reduction of the Fund’s total expenses of $1,002.
NOTE 5—Trustees’ and Officers’ Fees and Benefits
Trustees’ and Officers’ Fees and Benefits include amounts accrued by the Fund to pay remuneration to certain Trustees and Officers of the Fund. Trustees have the option to defer compensation payable by the Fund, and Trustees’ and Officers’ Fees and Benefits also include amounts accrued by the Fund to fund such deferred compensation amounts. Those Trustees who defer compensation have the option to select various Invesco Funds in which their deferral accounts shall be deemed to be invested. Finally, certain current Trustees were eligible to participate in a retirement plan that provided for benefits to be paid upon retirement to Trustees over a period of time based on the number of years of service. The Fund may have certain former Trustees who also participate in a retirement plan and receive benefits under such plan. Trustees’ and Officers’ Fees and Benefits include amounts accrued by the Fund to fund such retirement benefits. Obligations under the deferred compensation and retirement plans represent unsecured claims against the general assets of the Fund.
NOTE 6—Cash Balances
The Fund is permitted to temporarily carry a negative or overdrawn balance in its account with State Street Bank and Trust Company, the custodian bank. Such balances, if any at period end, are shown in the Statement of Assets and Liabilities under the payable caption Amount due custodian. To compensate the custodian bank for such overdrafts, the overdrawn Fund may either (1) leave funds as a compensating balance in the account so the custodian bank can be compensated by earning the additional interest; or (2) compensate by paying the custodian bank at a rate agreed upon by the custodian bank and Invesco, not to exceed the contractually agreed upon rate.
17 Invesco China Fund
NOTE 7—Distributions to Shareholders and Tax Components of Net Assets
Tax Character of Distributions to Shareholders Paid During the Fiscal Years Ended October 31, 2014 and 2013:
| | | | | | | | |
| | | 2014 | | | 2013 | |
Ordinary income | | $ | 976,277 | | | $ | 591,172 | |
Tax Components of Net Assets at Period-End:
| | | | |
| | | 2014 | |
Undistributed ordinary income | | $ | 285,500 | |
Net unrealized appreciation (depreciation) — investments | | | (412,134 | ) |
Net unrealized appreciation (depreciation) — other investments | | | (31 | ) |
Temporary book/tax differences | | | (47,518 | ) |
Capital loss carryforward | | | (41,707,350 | ) |
Shares of beneficial interest | | | 130,716,711 | |
Total net assets | | $ | 88,835,178 | |
The difference between book-basis and tax-basis unrealized appreciation (depreciation) is due to differences in the timing of recognition of gains and losses on investments for tax and book purposes. The Fund’s net unrealized appreciation (depreciation) difference is attributable primarily to wash sales.
The temporary book/tax differences are a result of timing differences between book and tax recognition of income and/or expenses. The Fund’s temporary book/tax differences are the result of the trustee deferral of compensation and retirement plan benefits.
Capital loss carryforward is calculated and reported as of a specific date. Results of transactions and other activity after that date may affect the amount of capital loss carryforward actually available for the Fund to utilize. Capital losses generated in years beginning after December 22, 2010 can be carried forward for an unlimited period, whereas previous losses expire in eight tax years. Capital losses with an expiration period may not be used to offset capital gains until all net capital losses without an expiration date have been utilized. Capital loss carryforwards with no expiration date will retain their character as either short-term or long-term capital losses instead of as short-term capital losses as under prior law. The ability to utilize capital loss carryforwards in the future may be limited under the Internal Revenue Code and related regulations based on the results of future transactions.
The Fund utilized $10,797,777 of capital loss carryforward in the current period to offset net realized capital gain for federal income tax purposes. The Fund has a capital loss carryforward as of October 31, 2014, which expires as follows:
| | | | | | | | | | | | |
| Capital Loss Carryforward* | |
| Expiration | | Short-Term | | | Long-Term | | | Total | |
October 31, 2016 | | $ | 30,359,492 | | | $ | — | | | $ | 30,359,492 | |
October 31, 2017 | | | 11,347,858 | | | | — | | | | 11,347,858 | |
| | | $ | 41,707,350 | | | $ | — | | | $ | 41,707,350 | |
| * | Capital loss carryforward as of the date listed above is reduced for limitations, if any, to the extent required by the Internal Revenue Code and may be further limited depending upon a variety of factors, including the realization of net unrealized gains or losses as of the date of any reorganization. |
NOTE 8—Investment Securities
The aggregate amount of investment securities (other than short-term securities, U.S. Treasury obligations and money market funds, if any) purchased and sold by the Fund during the year ended October 31, 2014 was $121,229,447 and $141,119,599, respectively. Cost of investments on a tax basis includes the adjustments for financial reporting purposes as of the most recently completed federal income tax reporting period-end.
| | | | |
| Unrealized Appreciation (Depreciation) of Investment Securities on a Tax Basis | |
Aggregate unrealized appreciation of investment securities | | $ | 7,984,606 | |
Aggregate unrealized (depreciation) of investment securities | | | (8,396,740 | ) |
Net unrealized appreciation (depreciation) of investment securities | | $ | (412,134 | ) |
Cost of investments for tax purposes is $89,449,912.
NOTE 9—Reclassification of Permanent Differences
Primarily as a result of differing book/tax treatment of passive foreign investment companies, on October 31, 2014, undistributed net investment income was increased by $613,995 and undistributed net realized gain (loss) was decreased by $613,995. This reclassification had no effect on the net assets of the Fund.
18 Invesco China Fund
NOTE 10—Share Information
| | | | | | | | | | | | | | | | |
| | | Summary of Share Activity | |
| | | Years ended October 31, | |
| | | 2014(a) | | | 2013 | |
| | | Shares | | | Amount | | | Shares | | | Amount | |
Sold: | | | | | | | | | | | | | | | | |
Class A | | | 720,306 | | | $ | 14,781,137 | | | | 1,043,759 | | | $ | 19,843,898 | |
Class B | | | 10,113 | | | | 199,431 | | | | 16,102 | | | | 303,355 | |
Class C | | | 55,095 | | | | 1,084,665 | | | | 285,330 | | | | 5,508,232 | |
Class Y | | | 105,131 | | | | 2,148,178 | | | | 247,603 | | | | 4,887,723 | |
Class R5 | | | 998 | | | | 19,651 | | | | 1,555 | | | | 29,172 | |
| | | | |
Issued as reinvestment of dividends: | | | | | | | | | | | | | | | | |
Class A | | | 36,522 | | | | 773,530 | | | | 27,473 | | | | 515,121 | |
Class B | | | 736 | | | | 15,234 | | | | — | | | | — | |
Class C | | | 2,087 | | | | 43,148 | | | | — | | | | — | |
Class Y | | | 2,588 | | | | 54,829 | | | | 1,723 | | | | 32,310 | |
Class R5 | | | 242 | | | | 5,129 | | | | 455 | | | | 8,524 | |
| | | | |
Automatic conversion of Class B shares to Class A shares: | | | | | | | | | | | | | | | | |
Class A | | | 28,520 | | | | 569,466 | | | | 41,329 | | | | 784,854 | |
Class B | | | (29,290 | ) | | | (569,466 | ) | | | (42,442 | ) | | | (784,854 | ) |
| | | | |
Reacquired: | | | | | | | | | | | | | | | | |
Class A | | | (1,401,485 | ) | | | (28,040,660 | ) | | | (1,957,410 | ) | | | (36,946,602 | ) |
Class B | | | (83,442 | ) | | | (1,648,836 | ) | | | (155,596 | ) | | | (2,874,804 | ) |
Class C | | | (315,673 | ) | | | (6,123,188 | ) | | | (623,804 | ) | | | (11,501,597 | ) |
Class Y | | | (105,289 | ) | | | (2,150,098 | ) | | | (271,100 | ) | | | (5,346,637 | ) |
Class R5 | | | (16,233 | ) | | | (331,924 | ) | | | (23,949 | ) | | | (456,540 | ) |
Net increase (decrease) in share activity | | | (989,074 | ) | | $ | (19,169,774 | ) | | | (1,408,972 | ) | | $ | (25,997,845 | ) |
| (a) | There are entities that are record owners of more than 5% of the outstanding shares of the Fund and in the aggregate own 25% of the outstanding shares of the Fund. IDI has an agreement with these entities to sell Fund shares. The Fund, Invesco and/or Invesco affiliates may make payments to these entities, which are considered to be related to the Fund, for providing services to the Fund, Invesco and/or Invesco affiliates including but not limited to services such as securities brokerage, distribution, third party record keeping and account servicing. The Fund has no knowledge as to whether all or any portion of the shares owned of record by these entities are also owned beneficially. |
19 Invesco China Fund
NOTE 11—Financial Highlights
The following schedule presents financial highlights for a share of the Fund outstanding throughout the periods indicated.
| | | | | | | | | | | | | | | | | | | | | | | | | | | | | | | | | | | | | | | | | | | | | | | | |
| | | Net asset
value,
beginning
of period | | | Net
investment
income
(loss)(a) | | | Net gains
(losses)
on securities
(both
realized and
unrealized) | | | Total from
investment
operations | | | Dividends
from net
investment
income | | | Net asset
value, end
of period(b) | | | Total
return(c) | | | Net assets,
end of period
(000’s omitted) | | | Ratio of
expenses
to average
net assets
with fee waivers
and/or expenses
absorbed | | | Ratio of
expenses
to average net
assets without
fee waivers
and/or expenses
absorbed | | | Ratio of net
investment
income (loss)
to average
net assets | | | Portfolio
turnover(d) | |
Class A | | | | | | | | | | | | | | | | | | | | | | | | | | | | | | | | | | | | | | | | | | | | | | | | |
Year ended 10/31/14 | | $ | 20.31 | | | $ | (0.03 | ) | | $ | (0.13 | ) | | $ | (0.16 | ) | | $ | (0.22 | ) | | $ | 19.93 | | | | (0.87 | )% | | $ | 62,957 | | | | 1.85 | %(e) | | | 1.85 | %(e) | | | (0.15 | )%(e) | | | 124 | % |
Year ended 10/31/13 | | | 17.90 | | | | 0.09 | | | | 2.44 | | | | 2.53 | | | | (0.12 | ) | | | 20.31 | | | | 14.18 | | | | 76,691 | | | | 1.78 | | | | 1.78 | | | | 0.50 | | | | 148 | |
Year ended 10/31/12 | | | 17.52 | | | | 0.11 | | | | 0.37 | | | | 0.48 | | | | (0.10 | ) | | | 17.90 | | | | 2.79 | | | | 82,713 | | | | 1.80 | | | | 1.80 | | | | 0.64 | | | | 109 | |
Year ended 10/31/11 | | | 21.93 | | | | 0.12 | | | | (4.49 | ) | | | (4.37 | ) | | | (0.04 | ) | | | 17.52 | | | | (19.96 | ) | | | 102,248 | | | | 1.67 | | | | 1.67 | | | | 0.57 | | | | 97 | |
Year ended 10/31/10 | | | 18.18 | | | | 0.06 | | | | 3.83 | | | | 3.89 | | | | (0.14 | ) | | | 21.93 | | | | 21.49 | | | | 166,662 | | | | 1.67 | | | | 1.67 | | | | 0.30 | | | | 100 | |
Class B | | | | | | | | | | | | | | | | | | | | | | | | | | | | | | | | | | | | | | | | | | | | | | | | |
Year ended 10/31/14 | | | 19.71 | | | | (0.18 | ) | | | (0.14 | ) | | | (0.32 | ) | | | (0.04 | ) | | | 19.35 | | | | (1.61 | ) | | | 5,303 | | | | 2.60 | (e) | | | 2.60 | (e) | | | (0.90 | )(e) | | | 124 | |
Year ended 10/31/13 | | | 17.39 | | | | (0.05 | ) | | | 2.37 | | | | 2.32 | | | | — | | | | 19.71 | | | | 13.34 | | | | 7,411 | | | | 2.53 | | | | 2.53 | | | | (0.25 | ) | | | 148 | |
Year ended 10/31/12 | | | 17.05 | | | | (0.02 | ) | | | 0.36 | | | | 0.34 | | | | — | | | | 17.39 | | | | 1.99 | | | | 9,703 | | | | 2.55 | | | | 2.55 | | | | (0.11 | ) | | | 109 | |
Year ended 10/31/11 | | | 21.46 | | | | (0.04 | ) | | | (4.37 | ) | | | (4.41 | ) | | | — | | | | 17.05 | | | | (20.55 | ) | | | 13,988 | | | | 2.42 | | | | 2.42 | | | | (0.18 | ) | | | 97 | |
Year ended 10/31/10 | | | 17.85 | | | | (0.09 | ) | | | 3.76 | | | | 3.67 | | | | (0.06 | ) | | | 21.46 | | | | 20.61 | | | | 23,945 | | | | 2.42 | | | | 2.42 | | | | (0.45 | ) | | | 100 | |
Class C | | | | | | | | | | | | | | | | | | | | | | | | | | | | | | | | | | | | | | | | | | | | | | | | |
Year ended 10/31/14 | | | 19.68 | | | | (0.18 | ) | | | (0.14 | ) | | | (0.32 | ) | | | (0.04 | ) | | | 19.32 | | | | (1.62 | ) | | | 15,978 | | | | 2.60 | (e) | | | 2.60 | (e) | | | (0.90 | )(e) | | | 124 | |
Year ended 10/31/13 | | | 17.36 | | | | (0.05 | ) | | | 2.37 | | | | 2.32 | | | | — | | | | 19.68 | | | | 13.36 | | | | 21,366 | | | | 2.53 | | | | 2.53 | | | | (0.25 | ) | | | 148 | |
Year ended 10/31/12 | | | 17.02 | | | | (0.02 | ) | | | 0.36 | | | | 0.34 | | | | — | | | | 17.36 | | | | 2.00 | | | | 24,728 | | | | 2.55 | | | | 2.55 | | | | (0.11 | ) | | | 109 | |
Year ended 10/31/11 | | | 21.43 | | | | (0.04 | ) | | | (4.37 | ) | | | (4.41 | ) | | | — | | | | 17.02 | | | | (20.58 | ) | | | 32,319 | | | | 2.42 | | | | 2.42 | | | | (0.18 | ) | | | 97 | |
Year ended 10/31/10 | | | 17.83 | | | | (0.09 | ) | | | 3.75 | | | | 3.66 | | | | (0.06 | ) | | | 21.43 | | | | 20.58 | | | | 59,812 | | | | 2.42 | | | | 2.42 | | | | (0.45 | ) | | | 100 | |
Class Y | | | | | | | | | | | | | | | | | | | | | | | | | | | | | | | | | | | | | | | | | | | | | | | | |
Year ended 10/31/14 | | | 20.36 | | | | 0.02 | | | | (0.13 | ) | | | (0.11 | ) | | | (0.27 | ) | | | 19.98 | | | | (0.62 | ) | | | 4,494 | | | | 1.60 | (e) | | | 1.60 | (e) | | | 0.10 | (e) | | | 124 | |
Year ended 10/31/13 | | | 17.95 | | | | 0.14 | | | | 2.44 | | | | 2.58 | | | | (0.17 | ) | | | 20.36 | | | | 14.43 | | | | 4,531 | | | | 1.53 | | | | 1.53 | | | | 0.75 | | | | 148 | |
Year ended 10/31/12 | | | 17.58 | | | | 0.15 | | | | 0.38 | | | | 0.53 | | | | (0.16 | ) | | | 17.95 | | | | 3.08 | | | | 4,384 | | | | 1.55 | | | | 1.55 | | | | 0.89 | | | | 109 | |
Year ended 10/31/11 | | | 22.01 | | | | 0.17 | | | | (4.51 | ) | | | (4.34 | ) | | | (0.09 | ) | | | 17.58 | | | | (19.78 | ) | | | 6,483 | | | | 1.42 | | | | 1.42 | | | | 0.82 | | | | 97 | |
Year ended 10/31/10 | | | 18.23 | | | | 0.10 | | | | 3.85 | | | | 3.95 | | | | (0.17 | ) | | | 22.01 | | | | 21.76 | | | | 11,638 | | | | 1.42 | | | | 1.42 | | | | 0.55 | | | | 100 | |
Class R5 | | | | | | | | | | | | | | | | | | | | | | | | | | | | | | | | | | | | | | | | | | | | | | | | |
Year ended 10/31/14 | | | 20.38 | | | | 0.06 | | | | (0.14 | ) | | | (0.08 | ) | | | (0.29 | ) | | | 20.01 | | | | (0.46 | ) | | | 104 | | | | 1.39 | (e) | | | 1.39 | (e) | | | 0.31 | (e) | | | 124 | |
Year ended 10/31/13 | | | 17.97 | | | | 0.18 | | | | 2.45 | | | | 2.63 | | | | (0.22 | ) | | | 20.38 | | | | 14.71 | | | | 411 | | | | 1.33 | | | | 1.33 | | | | 0.95 | | | | 148 | |
Year ended 10/31/12 | | | 17.61 | | | | 0.20 | | | | 0.37 | | | | 0.57 | | | | (0.21 | ) | | | 17.97 | | | | 3.29 | | | | 757 | | | | 1.30 | | | | 1.30 | | | | 1.14 | | | | 109 | |
Year ended 10/31/11 | | | 22.04 | | | | 0.21 | | | | (4.51 | ) | | | (4.30 | ) | | | (0.13 | ) | | | 17.61 | | | | (19.61 | ) | | | 770 | | | | 1.23 | | | | 1.23 | | | | 1.01 | | | | 97 | |
Year ended 10/31/10 | | | 18.25 | | | | 0.14 | | | | 3.86 | | | | 4.00 | | | | (0.21 | ) | | | 22.04 | | | | 22.04 | | | | 982 | | | | 1.25 | | | | 1.25 | | | | 0.72 | | | | 100 | |
| (a) | Calculated using average shares outstanding. |
| (b) | Includes redemption fees added to shares of beneficial interest which were less than $0.005 per share for the fiscal years ended October 31, 2012 and prior. |
| (c) | Includes adjustments in accordance with accounting principles generally accepted in the United States of America and as such, the net asset value for financial reporting purposes and the returns based upon those net asset values may differ from the net asset value and returns for shareholder transactions. Does not include sales charges and is not annualized for periods less than one year, if applicable. |
| (d) | Portfolio turnover is calculated at the fund level and is not annualized for periods less than one year, if applicable. |
| (e) | Ratios are based on average daily net assets (000’s omitted) of $70,346, $6,344, $18,859, $4,360 and $288 for Class A, Class B, Class C, Class Y and Class R5 shares, respectively. |
20 Invesco China Fund
Report of Independent Registered Public Accounting Firm
To the Board of Trustees of AIM Investment Funds (Invesco Investment Funds)
and Shareholders of Invesco China Fund:
In our opinion, the accompanying statement of assets and liabilities, including the schedule of investments, and the related statements of operations and of changes in net assets and the financial highlights present fairly, in all material respects, the financial position of Invesco China Fund (one of the funds constituting AIM Investment Funds (Invesco Investment Funds), hereafter referred to as the “Fund”) at October 31, 2014, the results of its operations for the year then ended, the changes in its net assets for each of the two years in the period then ended and the financial highlights for each of the five years in the period then ended, in conformity with accounting principles generally accepted in the United States of America. These financial statements and financial highlights (hereafter referred to as “financial statements”) are the responsibility of the Fund’s management. Our responsibility is to express an opinion on these financial statements based on our audits. We conducted our audits of these financial statements in accordance with the standards of the Public Company Accounting Oversight Board (United States). Those standards require that we plan and perform the audit to obtain reasonable assurance about whether the financial statements are free of material misstatement. An audit includes examining, on a test basis, evidence supporting the amounts and disclosures in the financial statements, assessing the accounting principles used and significant estimates made by management, and evaluating the overall financial statement presentation. We believe that our audits, which included confirmation of securities at October 31, 2014 by correspondence with the custodian and brokers, and the application of alternative auditing procedures where confirmations of security purchases have not been received, provide a reasonable basis for our opinion.
PRICEWATERHOUSECOOPERS LLP
December 23, 2014
Houston, Texas
21 Invesco China Fund
Calculating your ongoing Fund expenses
Example
As a shareholder of the Fund, you incur two types of costs: (1) transaction costs, which may include sales charges (loads) on purchase payments or contingent deferred sales charges on redemptions, if any; and (2) ongoing costs, including management fees, distribution and/or service (12b-1) fees, and other Fund expenses. This example is intended to help you understand your ongoing costs (in dollars) of investing in the Fund and to compare these costs with ongoing costs of investing in other mutual funds. The example is based on an investment of $1,000 invested at the beginning of the period and held for the entire period May 1, 2014 through October 31, 2014.
Actual expenses
The table below provides information about actual account values and actual expenses. You may use the information in this table, together with the amount you invested, to estimate the expenses that you paid over the period. Simply divide your account value by $1,000 (for example, an $8,600 account value divided by $1,000 = 8.6), then multiply the result by the number in the table under the heading entitled “Actual Expenses Paid During Period” to estimate the expenses you paid on your account during this period.
Hypothetical example for comparison purposes
The table below also provides information about hypothetical account values and hypothetical expenses based on the Fund’s actual expense ratio and an assumed rate of return of 5% per year before expenses, which is not the Fund’s actual return.
The hypothetical account values and expenses may not be used to estimate the actual ending account balance or expenses you paid for the period. You may use this information to compare the ongoing costs of investing in the Fund and other funds. To do so, compare this 5% hypothetical example with the 5% hypothetical examples that appear in the shareholder reports of the other funds.
Please note that the expenses shown in the table are meant to highlight your ongoing costs only and do not reflect any transaction costs, such as sales charges (loads) on purchase payments or contingent deferred sales charges on redemptions, if any. Therefore, the hypothetical information is useful in comparing ongoing costs only, and will not help you determine the relative total costs of owning different funds. In addition, if these transaction costs were included, your costs would have been higher.
| | | | | | | | | | | | | | | | | | | | | | | | |
| Class | | Beginning
Account Value
(05/01/14) | | | ACTUAL | | | HYPOTHETICAL (5% annual return before expenses) | | | Annualized
Expense
Ratio | |
| | | Ending
Account Value
(10/31/14)1 | | | Expenses Paid During
Period2 | | | Ending
Account Value
(10/31/14) | | | Expenses Paid During
Period2 | | |
| A | | $ | 1,000.00 | | | $ | 1,068.70 | | | $ | 9.59 | | | $ | 1,015.93 | | | $ | 9.35 | | | | 1.84 | % |
| B | | | 1,000.00 | | | | 1,065.00 | | | | 13.48 | | | | 1,012.15 | | | | 13.14 | | | | 2.59 | |
| C | | | 1,000.00 | | | | 1,065.10 | | | | 13.48 | | | | 1,012.15 | | | | 13.14 | | | | 2.59 | |
| Y | | | 1,000.00 | | | | 1,070.20 | | | | 8.30 | | | | 1,017.19 | | | | 8.08 | | | | 1.59 | |
| R5 | | | 1,000.00 | | | | 1,071.80 | | | | 7.15 | | | | 1,018.30 | | | | 6.97 | | | | 1.37 | |
| 1 | The actual ending account value is based on the actual total return of the Fund for the period May 1, 2014 through October 31, 2014, after actual expenses and will differ from the hypothetical ending account value which is based on the Fund’s expense ratio and a hypothetical annual return of 5% before expenses. |
| 2 | Expenses are equal to the Fund’s annualized expense ratio as indicated above multiplied by the average account value over the period, multiplied by 184/365 to reflect the most recent fiscal half year. |
22 Invesco China Fund
Approval of Investment Advisory and Sub-Advisory Contracts
The Board of Trustees (the Board) of AIM Investment Funds (Invesco Investment Funds) is required under the Investment Company Act of 1940, as amended, to approve annually the renewal of Invesco China Fund’s (the Fund) investment advisory agreements. During contract renewal meetings held on June 16-17, 2014, the Board as a whole, and the disinterested or “independent” Trustees, who comprise over 75% of the Board, voting separately, approved the continuance for the Fund of the Master Investment Advisory Agreement with Invesco Advisers, Inc. (Invesco Advisers and the investment advisory agreement) and the Master Intergroup Sub-Advisory Contract for Mutual Funds with Invesco Asset Management Deutschland GmbH, Invesco Asset Management Limited, Invesco Asset Management (Japan) Limited, Invesco Australia Limited, Invesco Hong Kong Limited, Invesco Senior Secured Management, Inc. and Invesco Canada Ltd. (collectively, the Affiliated Sub-Advisers and the sub-advisory contracts) for another year, effective July 1, 2014.
In evaluating the fairness and reasonableness of compensation under the Fund’s investment advisory agreement and sub-advisory contracts, the Board considered, among other things, the factors discussed below. The Board determined that the continuation of the Fund’s investment advisory agreement and the sub-advisory contracts are in the best interest of the Fund and its shareholders and that the compensation payable to Invesco Advisers and the Affiliated Sub-Advisers under the agreements is fair and reasonable.
The Board’s Fund Evaluation Process
The Board’s Investments Committee has established three Sub-Committees, each of which is primarily responsible for overseeing the management of a number of the funds advised by Invesco Advisers (the Invesco Funds). The Sub-Committees meet throughout the year to review the performance of their assigned Invesco Funds, including reviewing materials prepared under the direction of the independent Senior Officer, an officer of the Invesco Funds who reports directly to the independent Trustees. Over the course of each year, the Sub-Committees meet with portfolio managers for their assigned Invesco Funds and other members of management to review the performance, investment objective(s), policies, strategies, limitations and investment risks of these funds. The Sub-Committees meet regularly and at designated contract renewal meetings each year to conduct a review of the performance, fees, expenses and other matters related to their assigned Invesco Funds. Each Sub-Committee recommends to the Investments Committee, which in turn recommends to the full Board, whether and on what terms to approve the continuance of each Invesco Fund’s investment advisory agreement and sub-advisory contracts for another year.
During the contract renewal process, the Trustees receive comparative performance and fee
data regarding the Invesco Funds prepared by Invesco Advisers and Lipper Inc. (Lipper), an independent provider of investment company data. The Trustees also receive an independent written evaluation from the Senior Officer. The Senior Officer’s evaluation is prepared as part of his responsibility to manage the process by which the Invesco Funds’ proposed management fees are negotiated during the annual contract renewal process to ensure they are negotiated in a manner that is at arms’ length and reasonable. In addition to meetings with Invesco Advisers and fund counsel, the independent Trustees also discuss the continuance of the investment advisory agreement and sub-advisory contracts in separate sessions with the Senior Officer and with independent legal counsel.
The Trustees recognized that the advisory fee rates for the Invesco Funds are, in many cases, the result of years of review and negotiation. The Trustees’ deliberations and conclusions in a particular year may be based in part on their deliberations and conclusions regarding these arrangements throughout the year and in prior years. The Trustees’ review and conclusions are based on the comprehensive consideration of all information presented to them and are not the result of any single determinative factor. Moreover, one Trustee may have weighed a particular piece of information or factor differently than another Trustee.
The discussion below serves as the Senior Officer’s independent written evaluation with respect to the Fund’s investment advisory agreement as well as a discussion of the material factors and related conclusions that formed the basis for the Board’s approval of the Fund’s investment advisory agreement and sub-advisory contracts. Unless otherwise stated, this information is current as of June 17, 2014, and may not reflect consideration of factors that became known to the Board after that date.
Factors and Conclusions and Summary of Independent Written Fee Evaluation
| A. | Nature, Extent and Quality of Services Provided by Invesco Advisers and the Affiliated Sub-Advisers |
The Board reviewed the advisory services provided to the Fund by Invesco Advisers under the Fund’s investment advisory agreement, the performance of Invesco Advisers in providing these services, and the credentials and experience of the officers and employees of Invesco Advisers who provide these services, including the Fund’s portfolio manager or managers, with whom the Sub-Committees met during the year. The Board’s review of the qualifications of Invesco Advisers to provide advisory services included the Board’s consideration of Invesco Advisers’ investment process oversight, independent credit analysis and investment risk management. The Board also considered non-advisory services that Invesco Advisers and its affiliates provide to the Invesco
Funds such as various back office support functions, equity and fixed income trading operations, internal audit, distribution and legal and compliance.
In determining whether to continue the Fund’s investment advisory agreement, the Board considered the benefits of reapproving an existing relationship and the greater uncertainty that may be associated with entering into a new relationship. The Board concluded that the nature, extent and quality of the services provided to the Fund by Invesco Advisers are appropriate and satisfactory and consistent with the terms of the Fund’s investment advisory agreement.
The Board reviewed the services that may be provided by the Affiliated Sub-Advisers under the sub-advisory contracts and the credentials and experience of the officers and employees of the Affiliated Sub-Advisers who provide these services. The Board noted that the Affiliated Sub-Advisers have offices and personnel that are located in financial centers around the world. As a result, the Affiliated Sub-Advisers can provide research and investment analysis on the markets and economies of various countries in which the Fund may invest, make recommendations regarding securities and assist with security trades. The Board concluded that the sub-advisory contracts benefit the Fund and its shareholders by permitting Invesco Advisers to use the resources and talents of the Affiliated Sub-Advisers in managing the Fund. The Board concluded that the nature, extent and quality of the services provided by the Affiliated Sub-Advisers are appropriate and satisfactory and consistent with the terms of the Fund’s sub-advisory contracts.
The Board considered Fund performance as a relevant factor in considering whether to approve the investment advisory agreement as well as the sub-advisory contracts for the Fund, as Invesco Hong Kong Limited currently manages assets of the Fund.
The Board compared the Fund’s performance during the past one, three and five calendar years to the performance of funds in the Lipper performance universe and against the Lipper China Region Funds Index. The Board noted that performance of Class A shares of the Fund was in the third quintile of the performance universe for the one and three year periods and the second quintile for the five year period (the first quintile being the best performing funds and the fifth quintile being the worst performing funds). The Board noted that performance of Class A shares of the Fund was below the performance of the Index for the one and five year periods and above the performance of the index for the three year period. Invesco Advisers advised the Board that the lead portfolio manager for the Fund had changed in June 2012 and again in July 2013. The Trustees also reviewed more recent Fund performance and this review did not change their conclusions.
23 Invesco China Fund
| C. | Advisory and Sub-Advisory Fees |
The Board compared the Fund’s contractual management fee rate to the contractual management fee rates of funds in the Fund’s Lipper expense group at a common asset level. The Board noted that the contractual management fee rate for Class A shares of the Fund was below the median contractual management fee rate of funds in the expense group. The Board noted that the term “contractual management fee” may include both advisory and certain administrative services fees , but that Lipper does not provide information on a fund by fund basis as to what is included. The Board noted that Invesco does not charge the Invesco Funds for the administrative services included in the term as defined by Lipper. The Board also reviewed the methodology used by Lipper in providing expense group information, which includes using each fund’s contractual management fee schedule (including any applicable breakpoints) as reported in the most recent prospectus or statement of additional information for each fund in the expense group.
The Board noted that Invesco Advisers has contractually agreed to waive fees and/or limit expenses of the Fund through at least June 30, 2015 in an amount necessary to limit total annual operating expenses to a specified percentage of average daily net assets for each class of the Fund.
The Board also compared the Fund’s effective advisory fee rate (the advisory fee rate after advisory fee waivers and before other expense limitations/waivers) to the effective advisory fee rates of other funds advised by Invesco Advisers and its affiliates that are managed using an investment process substantially similar to the investment process used for the Fund. The Board noted that there were no other domestic mutual funds advised by Invesco Advisers using a similar investment process. However, the Board compared the Fund’s sub-advisory fee rate to the sub-advisory fee rates of other clients of Invesco Hong Kong Limited managed using with an investment process similar to the investment process used for the Fund. The Board noted that the Fund’s sub-advisory fee rate was below the rate of one offshore fund and above the rate of one off-shore fund sub-advised by Invesco Hong Kong Limited.
The Board also considered the fees charged by Invesco Advisers and the Affiliated Sub-Advisers to other client accounts that are managed using an investment process substantially similar to the investment process used for the Fund. The Board noted that Invesco Advisers or the Affiliated Sub-Advisers may charge lower fees to large institutional clients. Invesco Advisers reviewed with the Board the significantly greater scope of services it provides to the Invesco Funds relative to certain other client accounts. These additional services include provision of administrative services, officers and office space, oversight of service providers, preparation of annual registration statement updates and financial information and regulatory compliance under the Investment Company Act of 1940, as amended. Invesco Advisers also reviewed generally the higher frequency of shareholder purchases and
redemptions in the Invesco Funds relative to the flow of assets for other client accounts. Invesco Advisers advised the Board that advance notice of redemptions is often provided to Invesco Advisers by institutional clients. The Board did note that sub-advisory fee rates charged by the Affiliated Sub-Advisers to manage the Invesco Funds and to manage other client accounts tended to be more comparable, reflecting a more comparable scope of services. The Board concluded that the aggregate services provided to the Invesco Funds were sufficiently different from those provided to institutional clients to support the difference in fees.
The Board also considered the services provided by the Affiliated Sub-Advisers pursuant to the sub-advisory contracts, as well as the fees payable by Invesco Advisers to Affiliated Sub-Advisers pursuant to the sub-advisory contracts. The Board noted that Invesco Advisers retains overall responsibility for, and provides services to, sub-advised Invesco Funds, including oversight of the Affiliated Sub-Advisers as well as the additional services described herein other than day-to-day portfolio management. The Board also noted that the sub-advisory fees are not paid directly by the Fund, but rather, are payable by Invesco Advisers to the Affiliated Sub-Advisers.
| D. | Economies of Scale and Breakpoints |
The Board considered the extent to which there are economies of scale in the provision of advisory services to the Fund. The Board also considered whether the Fund benefits from economies of scale through contractual breakpoints in the Fund’s advisory fee schedule and was assisted in this review by a report from the Senior Officer. The Board also noted that the Fund shares directly in economies of scale through lower fees charged by third party service providers based on the combined size of the Invesco Funds and other clients advised by Invesco Advisers.
| E. | Profitability and Financial Resources |
The Board reviewed information from Invesco Advisers concerning the costs of the advisory and other services that Invesco Advisers and its affiliates provide to the Fund and the profitability of Invesco Advisers and its affiliates in providing these services for the year ended December 31, 2013. The Board received information from Invesco Advisers about the methodology used to prepare the profitability information. The Board considered the profitability of Invesco Advisers in managing the Fund and the Invesco Funds. The Board noted that Invesco Advisers continues to operate at a net profit from services Invesco Advisers and its subsidiaries provide to the Invesco Funds and the Fund. The Board did not deem the level of profits realized by Invesco Advisers and its affiliates from providing services to the Fund to be excessive given the nature, quality and extent of the services provided to the Invesco Funds. The Board received and accepted information from Invesco Advisers demonstrating that Invesco Advisers and each Affiliated Sub-Adviser are financially sound and have the resources necessary to perform their obligations under the investment advisory agreement and sub-advisory contracts.
| F. | Collateral Benefits to Invesco Advisers and its Affiliates |
The Board considered various other benefits received by Invesco Advisers and its affiliates from the relationship with the Fund, including the fees received for their provision of transfer agency and distribution services to the Fund. The Board considered comparative information regarding fees charged for these services, including information provided by Lipper and other independent sources. The Board considered the performance of Invesco Advisers and its affiliates in providing these services and the organizational structure employed to provide these services. The Board also considered that these services are provided to the Fund pursuant to written contracts that are reviewed and approved on an annual basis by the Board; that the services are required for the operation of the Fund; that Invesco Advisers and its affiliates can provide services, the nature and quality of which are at least equal to those provided by others offering the same or similar services; and that the fees for such services are fair and reasonable in light of the usual and customary charges by others for services of the same nature and quality.
The Board considered the benefits realized by Invesco Advisers and the Affiliated Sub-Advisers as a result of portfolio brokerage transactions executed through “soft dollar” arrangements. The Board noted that soft dollar arrangements shift the payment obligation for research services from Invesco Advisers and the Affiliated Sub-Advisers to the Invesco Funds and that the research received may be used with other clients of Invesco Advisers and may reduce Invesco Advisers’ and the Affiliated Sub-Advisers’ expenses. The Board also considered that it receives periodic reports from the Chief Compliance Officer of the Invesco Funds demonstrating that these arrangements are consistent with regulatory requirements. The Board did not deem the soft dollar arrangements to be inappropriate.
The Board considered that the Fund’s uninvested cash and cash collateral from any securities lending arrangements may be invested in money market funds advised by Invesco Advisers pursuant to procedures approved by the Board. The Board noted that Invesco Advisers receives advisory fees from these affiliated money market funds attributable to such investments, although Invesco Advisers has contractually agreed to waive through varying periods the advisory fees payable by the Invesco Funds with respect to investments in the affiliated money market funds. The waiver is in an amount equal to 100% of the net advisory fee Invesco Advisers receives from the affiliated money market funds with respect to the Fund’s investment in the affiliated money market funds of uninvested cash, but not cash collateral. The Board concluded that the amount of advisory fees received by Invesco Advisors from the Fund’s investment of uninvested cash and cash collateral from any securities lending arrangements in the affiliated money market funds are fair and reasonable.
The Board also considered the Fund may use an affiliated broker to execute certain trades for the Fund to among other things, control information leakage, and were advised such trades would be executed in compliance with rules under the Investment Company Act of 1940, as amended.
24 Invesco China Fund
Tax Information
Form 1099-DIV, Form 1042-S and other year–end tax information provide shareholders with actual calendar year amounts that should be included in their tax returns. Shareholders should consult their tax advisors.
The following distribution information is being provided as required by the Internal Revenue Code or to meet a specific state’s requirement.
The Fund designates the following amounts or, if subsequently determined to be different, the maximum amount allowable for its fiscal year ended October 31, 2014:
| | | | |
Federal and State Income Tax | |
Qualified Dividend Income* | | | 100 | % |
Corporate Dividends Received Deduction* | | | 0.01 | % |
U.S. Treasury Obligations* | | | 0 | % |
| | * | The above percentages are based on ordinary income dividends paid to shareholders during the Fund’s fiscal year. |
25 Invesco China Fund
Trustees and Officers
The address of each trustee and officer is AIM Investment Funds (Invesco Investment Funds) (the “Trust”), 11 Greenway Plaza, Suite 1000, Houston, Texas 77046-1173. The trustees serve for the life of the Trust, subject to their earlier death, incapacitation, resignation, retirement or removal as more specifically provided in the Trust’s organizational documents. Each officer serves for a one year term or until their successors are elected and qualified. Column two below includes length of time served with predecessor entities, if any.
| | | | | | | | |
Name, Year of Birth and Position(s) Held with the Trust | | Trustee and/
or Officer Since | | Principal Occupation(s) During Past 5 Years | | Number of Funds in Fund Complex Overseen by Trustee | | Other Directorship(s) Held by Trustee During Past 5 Years |
| Interested Persons | | | | | | | | |
| Martin L. Flanagan1 — 1960 Trustee | | 2007 | | Executive Director, Chief Executive Officer and President, Invesco Ltd. (ultimate parent of Invesco and a global investment management firm); Advisor to the Board, Invesco Advisers, Inc. (formerly known as Invesco Institutional (N.A.), Inc.); Trustee, The Invesco Funds; Vice Chair, Investment Company Institute; and Member of Executive Board, SMU Cox School of Business Formerly: Chairman and Chief Executive Officer, Invesco Advisers, Inc. (registered investment adviser); Director, Chairman, Chief Executive Officer and President, IVZ Inc. (holding company), INVESCO Group Services, Inc. (service provider) and Invesco North American Holdings, Inc. (holding company); Director, Chief Executive Officer and President, Invesco Holding Company Limited (parent of Invesco and a global investment management firm); Director, Invesco Ltd.; Chairman, Investment Company Institute and President, Co-Chief Executive Officer, Co-President, Chief Operating Officer and Chief Financial Officer, Franklin Resources, Inc. (global investment management organization). | | 144 | | None |
Philip A. Taylor2 — 1954 Trustee, President and Principal Executive Officer | | 2006 | | Head of North American Retail and Senior Managing Director, Invesco Ltd.; Director, Co-Chairman, Co-President and Co-Chief Executive Officer, Invesco Advisers, Inc. (formerly known as Invesco Institutional (N.A.), Inc.) (registered investment adviser); Director, Chairman, Chief Executive Officer and President, Invesco Management Group, Inc. (formerly known as Invesco Aim Management Group, Inc.) (financial services holding company); Director and President, INVESCO Funds Group, Inc. (registered investment adviser and registered transfer agent); Director and Chairman, Invesco Investment Services, Inc. (formerly known as Invesco Aim Investment Services, Inc.) (registered transfer agent) and IVZ Distributors, Inc. (formerly known as INVESCO Distributors, Inc.) (registered broker dealer); Director, President and Chairman, Invesco Inc. (holding company) and Invesco Canada Holdings Inc. (holding company); Chief Executive Officer, Invesco Corporate Class Inc. (corporate mutual fund company) and Invesco Canada Fund Inc. (corporate mutual fund company); Director, Chairman and Chief Executive Officer, Invesco Canada Ltd. (formerly known as Invesco Trimark Ltd./Invesco Trimark Ltèe) (registered investment adviser and registered transfer agent); Trustee, President and Principal Executive Officer, The Invesco Funds (other than AIM Treasurer’s Series Trust (Invesco Treasurer’s Series Trust) and Short-Term Investments Trust); Trustee and Executive Vice President, The Invesco Funds (AIM Treasurer’s Series Trust (Invesco Treasurer’s Series Trust) and Short-Term Investments Trust only); Director, Invesco Investment Advisers LLC (formerly known as Van Kampen Asset Management); Director, Chief Executive Officer and President, Van Kampen Exchange Corp. Formerly: Director and Chairman, Van Kampen Investor Services Inc.; Director, Chief Executive Officer and President, 1371 Preferred Inc. (holding company) and Van Kampen Investments Inc.; Director and President, AIM GP Canada Inc. (general partner for limited partnerships) and Van Kampen Advisors, Inc.; Director and Chief Executive Officer, Invesco Trimark Dealer Inc. (registered broker dealer); Director, Invesco Distributors, Inc. (formerly known as Invesco Aim Distributors, Inc.) (registered broker dealer); Manager, Invesco PowerShares Capital Management LLC; Director, Chief Executive Officer and President, Invesco Advisers, Inc.; Director, Chairman, Chief Executive Officer and President, Invesco Aim Capital Management, Inc.; President, Invesco Trimark Dealer Inc. and Invesco Trimark Ltd./Invesco Trimark Ltèe; Director and President, AIM Trimark Corporate Class Inc. and AIM Trimark Canada Fund Inc.; Senior Managing Director, Invesco Holding Company Limited; Director and Chairman, Fund Management Company (former registered broker dealer); President and Principal Executive Officer, The Invesco Funds (AIM Treasurer’s Series Trust (Invesco Treasurer’s Series Trust), and Short-Term Investments Trust only); President, AIM Trimark Global Fund Inc. and AIM Trimark Canada Fund Inc. | | 144 | | None |
Wayne W. Whalen3 — 1939 Trustee | | 2010 | | Of Counsel, and prior to 2010, partner in the law firm of Skadden, Arps, Slate, Meagher & Flom LLP, legal counsel to certain funds in the Fund Complex | | 144 | | Director of the Mutual fund Directors Forum, a nonprofit membership organization for investment directors; Chairman and Director of the Abraham Lincoln Presidential Library Foundation; and Director of the Stevenson Center for Democracy |
| 1 | Mr. Flanagan is considered an interested person (within the meaning of Section 2(a)(19) of the 1940 Act) of the Trust because he is an officer of the Adviser to the Trust, and an officer and a director of Invesco Ltd., ultimate parent of the Adviser. |
| 2 | Mr. Taylor is considered an interested person (within the meaning of Section 2(a)(19) of the 1940 Act) of the Trust because he is an officer and a director of the Adviser. |
| 3 | Mr. Whalen is retiring effective December 31, 2014. He has been deemed to be an interested person of the Trust because of his prior service as counsel to the predecessor funds of certain Invesco open-end funds and his affiliation with the law firm that served as counsel to such predecessor funds and the Invesco closed-end funds. |
T-1 Invesco China Fund
Trustees and Officers—(continued)
| | | | | | | | |
Name, Year of Birth and Position(s) Held with the Trust | | Trustee and/
or Officer Since | | Principal Occupation(s) During Past 5 Years | | Number of Funds in Fund Complex Overseen by Trustee | | Other Directorship(s) Held by Trustee During Past 5 Years |
| Independent Trustees | | | | | | | | |
Bruce L. Crockett — 1944 Trustee and Chair | | 2001 | | Chairman, Crockett Technologies Associates (technology consulting company) Formerly: Director, Captaris (unified messaging provider); Director, President and Chief Executive Officer, COMSAT Corporation; Chairman, Board of Governors of INTELSAT (international communications company); ACE Limited (insurance company); and Investment Company Institute | | 144 | | ALPS (Attorneys Liability Protection Society) (insurance company) |
David C. Arch — 1945 Trustee | | 2010 | | Chairman of Blistex Inc., a consumer health care products manufacturer | | 144 | | Board member of the Illinois Manufacturers’ Association; Member of the Board of Visitors, Institute for the Humanities, University of Michigan; Member of the Audit Committee of the Edward-Elmhurst Hospital |
Frank S. Bayley — 1939 Trustee | | 1987 | | Retired. Formerly: Director, Badgley Funds Inc. (registered investment company) (2 portfolios) and General Partner and Of Counsel, law firm of Baker & McKenzie, LLP | | 144 | | Director and Chairman, C.D. Stimson Company (a real estate investment company); Trustee, The Curtis Institute of Music |
James T. Bunch — 1942 Trustee | | 2003 | | Managing Member, Grumman Hill Group LLC (family office private equity investments) Formerly: Founder, Green Manning & Bunch Ltd. (investment banking firm) (1988-2010); Executive Committee, United States Golf Association; and Director, Policy Studies, Inc. and Van Gilder Insurance Corporation | | 144 | | Chairman, Board of Governors, Western Golf Association; Chairman, Evans Scholars Foundation; and Director, Denver Film Society |
Rodney F. Dammeyer — 1940 Trustee | | 2010 | | Chairman of CAC,LLC, (private company offering capital investment and management advisory services) Formerly: Prior to 2001, Managing Partner at Equity Group Corporate Investments; Prior to 1995, Chief Executive Officer of Itel Corporation (formerly Anixter International); Prior to 1985, experience includes Senior Vice President and Chief Financial Officer of Household International, Inc., Executive Vice President and Chief Financial Officer of Northwest Industries, Inc. and Partner of Arthur Andersen & Co.; From 1987 to 2010, Director/Trustee of investment companies in the Van Kampen Funds complex | | 144 | | Director of Quidel Corporation and Stericycle, Inc. |
Albert R. Dowden — 1941 Trustee | | 2001 | | Director of a number of public and private business corporations, including the Boss Group, Ltd. (private investment and management); Nature’s Sunshine Products, Inc. and Reich & Tang Funds (5 portfolios) (registered investment company) Formerly: Director, Homeowners of America Holding Corporation/Homeowners of America Insurance Company (property casualty company); Director, Continental Energy Services, LLC (oil and gas pipeline service); Director, CompuDyne Corporation (provider of product and services to the public security market) and Director, Annuity and Life Re (Holdings), Ltd. (reinsurance company); Director, President and Chief Executive Officer, Volvo Group North America, Inc.; Senior Vice President, AB Volvo; Director of various public and private corporations; Chairman, DHJ Media, Inc.; Director, Magellan Insurance Company; and Director, The Hertz Corporation, Genmar Corporation (boat manufacturer), National Media Corporation; Advisory Board of Rotary Power International (designer, manufacturer, and seller of rotary power engines); and Chairman, Cortland Trust, Inc. (registered investment company) | | 144 | | Director of: Nature’s Sunshine Products, Inc., Reich & Tang Funds, Homeowners of America Holding Corporation/ Homeowners of America Insurance Company, the Boss Group |
Jack M. Fields — 1952 Trustee | | 2001 | | Chief Executive Officer, Twenty First Century Group, Inc. (government affairs company); Owner and Chief Executive Officer, Dos Angeles Ranch, L.P. (cattle, hunting, corporate entertainment); and Discovery Global Education Fund (non-profit) Formerly: Chief Executive Officer, Texana Timber LP (sustainable forestry company); Director of Cross Timbers Quail Research Ranch (non-profit); and member of the U.S. House of Representatives | | 144 | | Insperity, Inc. (formerly known as Administaff) |
Prema Mathai-Davis — 1950 Trustee | | 2001 | | Retired. Formerly: Chief Executive Officer, YWCA of the U.S.A. | | 144 | | None |
Larry Soll — 1942 Trustee | | 2003 | | Retired. Formerly: Chairman, Chief Executive Officer and President, Synergen Corp. (a biotechnology company) | | 144 | | None |
Hugo F. Sonnenschein — 1940 Trustee | | 2010 | | President Emeritus and Honorary Trustee of the University of Chicago and the Adam Smith Distinguished Service Professor in the Department of Economics at the University of Chicago. Prior to 2000, President of the University of Chicago | | 144 | | Trustee of the University of Rochester and a member of its investment committee; Member of the National Academy of Sciences and the American Philosophical Society; Fellow of the American Academy of Arts and Sciences |
T-2 Invesco China Fund
Trustees and Officers—(continued)
| | | | | | | | |
Name, Year of Birth and Position(s) Held with the Trust | | Trustee and/
or Officer Since | | Principal Occupation(s) During Past 5 Years | | Number of Funds in Fund Complex Overseen by Trustee | | Other Directorship(s) Held by Trustee During Past 5 Years |
| Independent Trustees—(continued) |
Raymond Stickel, Jr. — 1944 Trustee | | 2005 | | Retired. Formerly: Director, Mainstay VP Series Funds, Inc. (25 portfolios) and Partner, Deloitte & Touche | | 144 | | None |
Suzanne H. Woolsey — 1941 Trustee | | 2014 | | Chief Executive Officer of Woolsey Partners LLC | | 144 | | Emeritus Chair of the Board of Trustees of the Institute for Defense Analyses; Trustee of Colorado College; Trustee of California Institute of Technology; Prior to 2014, Director of Fluor Corp.; Prior to 2010, Trustee of the German Marshall Fund of the United States; Prior to 2010 Trustee of the Rocky Mountain Institute |
| Other Officers | | | | | | | | |
Russell C. Burk — 1958 Senior Vice President and Senior Officer | | 2005 | | Senior Vice President and Senior Officer, The Invesco Funds | | N/A | | N/A |
John M. Zerr — 1962 Senior Vice President, Chief Legal Officer and Secretary | | 2006 | | Director, Senior Vice President, Secretary and General Counsel, Invesco Management Group, Inc. (formerly known as Invesco Aim Management Group, Inc.) and Van Kampen Exchange Corp.; Senior Vice President, Invesco Advisers, Inc. (formerly known as Invesco Institutional (N.A.), Inc.) (registered investment adviser); Senior Vice President and Secretary, Invesco Distributors, Inc. (formerly known as Invesco Aim Distributors, Inc.); Director, Vice President and Secretary, Invesco Investment Services, Inc. (formerly known as Invesco Aim Investment Services, Inc.) and IVZ Distributors, Inc. (formerly known as INVESCO Distributors, Inc.); Director and Vice President, INVESCO Funds Group, Inc.; Senior Vice President, Chief Legal Officer and Secretary, The Invesco Funds; Manager, Invesco PowerShares Capital Management LLC; Director, Secretary and General Counsel, Invesco Investment Advisers LLC (formerly known as Van Kampen Asset Management); Secretary and General Counsel, Invesco Capital Markets, Inc. (formerly known as Van Kampen Funds Inc.) and Chief Legal Officer, PowerShares Exchange-Traded Fund Trust, PowerShares Exchange-Traded Fund Trust II, PowerShares India Exchange-Traded Fund Trust, PowerShares Actively Managed Exchange-Traded Fund Trust; and PowerShares Actively Managed Exchange-Traded Commodity Fund Trust Formerly: Director and Vice President, Van Kampen Advisors Inc.; Director, Vice President, Secretary and General Counsel, Van Kampen Investor Services Inc.; Director, Invesco Distributors, Inc. (formerly known as Invesco Aim Distributors, Inc.); Director, Senior Vice President, General Counsel and Secretary, Invesco Aim Advisers, Inc. and Van Kampen Investments Inc.; Director, Vice President and Secretary, Fund Management Company; Director, Senior Vice President, Secretary, General Counsel and Vice President, Invesco Aim Capital Management, Inc.; Chief Operating Officer and General Counsel, Liberty Ridge Capital, Inc. (an investment adviser); Vice President and Secretary, PBHG Funds (an investment company) and PBHG Insurance Series Fund (an investment company); Chief Operating Officer, General Counsel and Secretary, Old Mutual Investment Partners (a broker-dealer); General Counsel and Secretary, Old Mutual Fund Services (an administrator) and Old Mutual Shareholder Services (a shareholder servicing center); Executive Vice President, General Counsel and Secretary, Old Mutual Capital, Inc. (an investment adviser); and Vice President and Secretary, Old Mutual Advisors Funds (an investment company) | | N/A | | N/A |
Sheri Morris — 1964 Vice President, Treasurer and Principal Financial Officer | | 1999 | | Vice President, Treasurer and Principal Financial Officer, The Invesco Funds; Vice President, Invesco Advisers, Inc. (formerly known as Invesco Institutional (N.A.), Inc.) (registered investment adviser); and Vice President, PowerShares Exchange-Traded Fund Trust, PowerShares Exchange-Traded Fund Trust II, PowerShares India Exchange-Traded Fund Trust, PowerShares Actively Managed Exchange-Traded Fund Trust, and PowerShares Actively Managed Exchange-Traded Commodity Fund Trust Formerly: Vice President, Invesco Aim Advisers, Inc., Invesco Aim Capital Management, Inc. and Invesco Aim Private Asset Management, Inc.; Assistant Vice President and Assistant Treasurer, The Invesco Funds and Assistant Vice President, Invesco Advisers, Inc., Invesco Aim Capital Management, Inc. and Invesco Aim Private Asset Management, Inc.; and Treasurer, PowerShares Exchange-Traded Fund Trust, PowerShares Exchange-Traded Fund Trust II, PowerShares India Exchange-Traded Fund Trust and PowerShares Actively Managed Exchange-Traded Fund Trust | | N/A | | N/A |
T-3 Invesco China Fund
Trustees and Officers—(continued)
| | | | | | | | |
Name, Year of Birth and Position(s) Held with the Trust | | Trustee and/
or Officer Since | | Principal Occupation(s) During Past 5 Years | | Number of Funds in Fund Complex Overseen by Trustee | | Other Directorship(s) Held by Trustee During Past 5 Years |
| Other Officers—(continued) | | | | | | | | |
Karen Dunn Kelley — 1960 Vice President | | 2004 | | Senior Managing Director, Investments; Director, Co-President, Co-Chief Executive Officer, and Co-Chairman, Invesco Advisers, Inc. (formerly known as Invesco Institutional (N.A.), Inc.) (registered investment adviser); Chairman, Invesco Senior Secured Management, Inc.; Senior Vice President, Invesco Management Group, Inc. (formerly known as Invesco Aim Management Group, Inc.); Executive Vice President, Invesco Distributors, Inc. (formerly known as Invesco Aim Distributors, Inc.); Director, Invesco Mortgage Capital Inc. and Invesco Management Company Limited; Director and President, INVESCO Asset Management (Bermuda) Ltd., Vice President, The Invesco Funds (other than AIM Treasurer’s Series Trust (Invesco Treasurer’s Series Trust) and Short-Term Investments Trust); and President and Principal Executive Officer, The Invesco Funds (AIM Treasurer’s Series Trust (Invesco Treasurer’s Series Trust) and Short-Term Investments Trust only) Formerly: Director, INVESCO Global Asset Management Limited and INVESCO Management S.A.; Senior Vice President, Van Kampen Investments Inc. and Invesco Advisers, Inc. (formerly known as Invesco Institutional (N.A.), Inc.) (registered investment adviser); Vice President, Invesco Advisers, Inc. (formerly known as Invesco Institutional (N.A.), Inc.); Director of Cash Management and Senior Vice President, Invesco Advisers, Inc. and Invesco Aim Capital Management, Inc.; Director and President, Fund Management Company; Chief Cash Management Officer, Director of Cash Management, Senior Vice President, and Managing Director, Invesco Aim Capital Management, Inc.; Director of Cash Management, Senior Vice President, and Vice President, Invesco Advisers, Inc. and The Invesco Funds (AIM Treasurer’s Series Trust (Invesco Treasurer’s Series Trust), and Short-Term Investments Trust only) | | N/A | | N/A |
Crissie M. Wisdom — 1969 Anti-Money Laundering Compliance Officer | | 2013 | | Anti-Money Laundering Compliance Officer, Invesco Advisers, Inc. (formerly known as Invesco Institutional (N.A.), Inc.) (registered investment adviser), Invesco Capital Markets, Inc. (formerly known as Van Kampen Funds Inc.), Invesco Distributors, Inc., Invesco Investment Services, Inc., Invesco Management Group, Inc., Van Kampen Exchange Corp., The Invesco Funds, and PowerShares Exchange-Traded Fund Trust, PowerShares Exchange-Traded Fund Trust II, PowerShares India Exchange-Traded Fund Trust, PowerShares Actively Managed Exchange-Traded Fund Trust and PowerShares Actively Managed Exchange-Traded Commodity Fund Trust; and Fraud Prevention Manager and Controls and Risk Analysis Manager for Invesco Investment Services, Inc. | | N/A | | N/A |
Todd L. Spillane — 1958 Chief Compliance Officer | | 2006 | | Senior Vice President, Invesco Management Group, Inc. (formerly known as Invesco Aim Management Group, Inc.) and Van Kampen Exchange Corp.; Senior Vice President and Chief Compliance Officer, Invesco Advisers, Inc. (registered investment adviser) (formerly known as Invesco Institutional (N.A.), Inc.); Chief Compliance Officer, The Invesco Funds; Vice President, Invesco Distributors, Inc. (formerly known as Invesco Aim Distributors, Inc.) and Invesco Investment Services, Inc. (formerly known as Invesco Aim Investment Services, Inc.) Formerly: Chief Compliance Officer, Invesco Funds (Chicago); Senior Vice President, Van Kampen Investments Inc.; Senior Vice President and Chief Compliance Officer, Invesco Aim Advisers, Inc. and Invesco Aim Capital Management, Inc.; Chief Compliance Officer, INVESCO Private Capital Investments, Inc. (holding company), Invesco Private Capital, Inc. (registered investment adviser), Invesco Global Asset Management (N.A.), Inc., Invesco Senior Secured Management, Inc. (registered investment adviser), Van Kampen Investor Services Inc., PowerShares Exchange-Traded Fund Trust, PowerShares Exchange-Traded Fund Trust II, PowerShares India Exchange-Traded Fund Trust and PowerShares Actively Managed Exchange-Traded Fund Trust; and Vice President, Invesco Aim Capital Management, Inc. and Fund Management Company | | N/A | | N/A |
The Statement of Additional Information of the Trust includes additional information about the Fund’s Trustees and is available upon request, without charge, by calling 1.800.959.4246. Please refer to the Fund’s prospectus for information on the Fund’s sub-advisers.
| | | | | | |
Office of the Fund 11 Greenway Plaza, Suite 1000 Houston, TX 77046-1173 | | Investment Adviser Invesco Advisers, Inc. 1555 Peachtree Street, N.E. Atlanta, GA 30309 | | Distributor Invesco Distributors, Inc. 11 Greenway Plaza, Suite 1000 Houston, TX 77046-1173 | | Auditors PricewaterhouseCoopers LLP 1000 Louisiana Street, Suite 5800 Houston, TX 77002-5678 |
| | | |
| | | | | | |
Counsel to the Fund Stradley Ronon Stevens & Young, LLP 2005 Market Street, Suite 2600 Philadelphia, PA 19103-7018 | | Counsel to the Independent Trustees Goodwin Procter LLP 901 New York Avenue, N.W. Washington, D.C. 20001 | | Transfer Agent Invesco Investment Services, Inc. 11 Greenway Plaza, Suite 1000 Houston, TX 77046-1173 | | Custodian State Street Bank and Trust Company 225 Franklin Street Boston, MA 02110-2801 |
T-4 Invesco China Fund

Invesco mailing information
Send general correspondence to Invesco Investment Services, Inc., P.O. Box 219078, Kansas City, MO 64121-9078.
Important notice regarding delivery of security holder documents
To reduce Fund expenses, only one copy of most shareholder documents may be mailed to shareholders with multiple accounts at the same address (Householding). Mailing of your shareholder documents may be householded indefinitely unless you instruct us otherwise. If you do not want the mailing of these documents to be combined with those for other members of your household, please contact Invesco Investment Services, Inc. at 800 959 4246 or contact your financial institution. We will begin sending you individual copies for each account within 30 days after receiving your request.
Fund holdings and proxy voting information
The Fund provides a complete list of its holdings four times in each fiscal year, at the quarter ends. For the second and fourth quarters, the lists appear in the Fund’s semiannual and annual reports to shareholders. For the first and third quarters, the Fund files the lists with the Securities and Exchange Commission (SEC) on Form N-Q. The most recent list of portfolio holdings is available at invesco.com/completeqtrholdings. Shareholders can also look up the Fund’s Forms
N-Q on the SEC website at sec.gov. Copies of the Fund’s Forms N-Q may be reviewed and copied at the SEC Public Reference Room in Washington, D.C. You can obtain information on the operation of the Public Reference Room, including information about duplicating fee charges, by calling 202 551 8090 or 800 732 0330, or by electronic request at the following email address: publicinfo@sec.gov. The SEC file numbers for the Fund are shown below.
A description of the policies and procedures that the Fund uses to determine how to vote proxies relating to portfolio securities is available without charge, upon request, from our Client Services department at 800 959 4246 or at invesco.com/proxyguidelines. The information is also available on the SEC website, sec.gov.
| | |
Information regarding how the Fund voted proxies related to its portfolio securities during the most recent 12-month period ended June 30 is available at invesco.com/proxysearch. The information is also available on the SEC website, sec.gov. Invesco Advisers, Inc. is an investment adviser; it provides investment advisory services to individual and institutional clients and does not sell securities. Invesco Distributors, Inc. is the US distributor for Invesco Ltd.’s retail mutual funds, exchange-traded funds and institutional money market funds. Both are wholly owned, indirect subsidiaries of Invesco Ltd. | |  |
| | | | |
| SEC file numbers: 811-05426 and 033-19338 | | CHI-AR-1 | | Invesco Distributors, Inc. |

Letters to Shareholders
| | |

Philip Taylor | | Dear Shareholders: This annual report includes information about your Fund, including performance data and a complete list of its investments as of the close of the reporting period. Inside, your Fund’s portfolio managers discuss how they managed your Fund and the factors that affected its performance during the reporting period. I hope you find this report of interest. During the reporting period covered by this report, the US economy showed signs of continued improvement. After contracting in the first quarter of 2014, the economy expanded strongly in the second quarter and unemployment trended lower. Much of the credit for this improvement goes to the US Federal Reserve (the Fed), which undertook an extraordinary asset purchase program following the global financial crisis. The Fed’s goal was to jumpstart the economy by encouraging banks to lend more, businesses to hire more and consumers to spend more. Signs of a stronger US economy prompted the Fed to reduce, or “taper,” its |
asset purchase program. Despite this, interest rates remained near historical low levels due largely to heavy investor demand for bonds. While signs of economic improvement were evident in the US, European economies showed signs of weakening. That, together with geopolitical uncertainty and worries about the first diagnosed cases of Ebola outside of Africa, caused increased volatility in US and European equities.
Extended periods of market strength can lull investors into complacency – just as prolonged periods of market weakness or volatility can discourage investors from initiating long-term investment plans. That’s why Invesco has always encouraged investors to work with a professional financial adviser who can stress the importance of starting to save and invest early and the importance of adhering to a disciplined investment plan – when times are good and when they’re uncertain. A financial adviser who knows your unique financial situation, investment goals and risk tolerance can be an invaluable partner as you seek to achieve your financial goals. He or she can offer a long-term perspective when markets are volatile and time-tested advice and guidance when your financial situation or investment goals change.
Timely information when and where you want it
Invesco’s efforts to help investors achieve their financial objectives include providing individual investors and financial professionals with timely information about the markets, the economy and investing – whenever and wherever they want it.
Our website, invesco.com/us, offers a wide range of market insights and investment perspectives. On the website, you’ll find detailed information about our funds, including prices, performance, holdings and portfolio manager commentaries. You can access information about your individual Invesco account whenever it’s convenient for you; just complete a simple, secure online registration. Use the “Log In” box on our home page to get started.
Invesco’s mobile app for iPad® (available free from the App StoreSM) allows you to obtain the same detailed information about your Fund and the same investment insights from our investment leaders, market strategists, economists and retirement experts on the go. You also can watch portfolio manager videos and have instant access to Invesco news and updates wherever you may be.
In addition to the resources accessible on our website and through our mobile app, you can obtain timely updates to help you stay informed about the markets, the economy and investing by connecting with Invesco on Twitter, LinkedIn or Facebook. You can access our blog at blog.invesco.us.com. Our goal is to provide you the information you want, when and where you want it.
Have questions?
For questions about your account, feel free to contact an Invesco client services representative at 800 959 4246. For Invesco-related questions or comments, please email me directly at phil@invesco.com.
All of us at Invesco look forward to serving your investment management needs for many years to come. Thank you for investing with us.
Sincerely,

Philip Taylor
Senior Managing Director, Invesco Ltd.
iPad is a trademark of Apple Inc., registered in the US and other countries. App Store is a service mark of Apple Inc. Invesco Distributors, Inc. is not affiliated with Apple Inc.
2 Invesco Developing Markets Fund
| | |

Bruce Crockett | | Dear Fellow Shareholders: There are a variety of factors that can impact investment performance, many of which are uncontrollable by us as investors. These factors can include various economic trends and geopolitical developments. While the members of the Invesco Funds Board, which I chair, can’t dictate the performance of the Invesco funds, be assured that your Board works diligently throughout the year to focus on how your investments are managed. Our job is to represent you and your interests on a variety of fund management-related matters. We regularly monitor how the portfolio management teams of the Invesco funds are performing in light of ever-changing and often unpredictable economic and market conditions. We review the investment strategies and investment process employed by each fund’s management team as explained in the fund’s prospectus. |
| | Perhaps our most significant responsibility is conducting the annual review of the funds’ |
advisory and sub-advisory contracts with Invesco Advisers and its affiliates. This annual review, which is required by the Investment Company Act of 1940, focuses on the nature and quality of the services Invesco provides as the adviser to the Invesco funds and the reasonableness of the fees that it charges for those services. Each year, we spend months carefully reviewing information from Invesco that allows us to evaluate the quality of its services and the reasonableness of its fees. We also use information from a variety of independent sources, including materials provided by the independent senior officer of the Invesco funds, who reports directly to the independent trustees on the Board. Additionally, we meet with legal counsel and review performance and fee data prepared for us by Lipper Inc., an independent, third-party firm widely recognized as a leader in its field.
After a careful review, the members of the Invesco Funds Board approved the continuation of advisory and sub-advisory contracts with Invesco Advisers and its affiliates. Be assured that your Board will continue working on behalf of fund shareholders, keeping your needs and interests uppermost in our minds.
As always, please contact me at bruce@brucecrockett.com with any questions or concerns you may have. On behalf of the Board, we look forward to continuing to represent your interests and serving your needs.
Sincerely,

Bruce L. Crockett
Independent Chair
Invesco Funds Board of Trustees
3 Invesco Developing Markets Fund
Management’s Discussion of Fund Performance
Performance summary
For the fiscal year ended October 31, 2014, Invesco Developing Markets Fund, at net asset value (NAV), delivered negative returns and underperformed its style-specific index, the MSCI Emerging Markets Index. The Fund’s relative performance was driven by underweight exposure in the information technology (IT) sector relative to the style-specific index and having no exposure to India. Some of this underperformance was offset by underweight exposure in the energy sector and overweight exposure in Indonesia relative to the MSCI Emerging Markets Index.
Your Fund’s long-term performance appears later in this report.
Fund vs. Indexes
Total returns, 10/31/13 to 10/31/14, at net asset value (NAV). Performance shown does not include applicable contingent deferred sales charges (CDSC) or front-end sales charges, which would have reduced performance.
| | | | |
Class A Shares | | | -0.76 | % |
Class B Shares | | | -1.49 | |
Class C Shares | | | -1.50 | |
Class Y Shares | | | -0.50 | |
Class R5 Shares | | | -0.35 | |
Class R6 Shares | | | -0.31 | |
MSCI EAFE Indexq (Broad Market Index) | | | -0.60 | |
MSCI Emerging Markets Indexq (Style-Specific Index) | | | 0.64 | |
Lipper Emerging Market Funds Indexn (Peer Group Index) | | | 1.20 | |
| Source(s): qFactSet Research Systems Inc.; nLipper Inc. | | | | |
Market conditions and your Fund
Global equity markets generally rose during the fiscal year ended October 31, 2014, on signs that economic growth was accelerating as a result of the loose monetary policies of many developed countries’ central banks. While 2014 began on an optimistic note, global equity markets pulled back at various points in reaction to economic and geopolitical concerns.
These concerns included worries about potentially negative effects of the US Federal Reserve reducing the scope of its asset purchase program beginning in early 2014, an Argentine sovereign bond default and eurozone banking concerns. Global equity markets also fell as
geopolitical tensions in Ukraine and the Middle East weakened the outlook for global growth.
Equity market performance in emerging markets was mixed. China continued to face headwinds and struggled to balance structural reforms with its desire to maintain satisfactory growth, while many countries in Asia, including India, Indonesia and the Philippines, experienced strong positive gains.
In this challenging environment, the Fund, at NAV, delivered negative overall returns. At the sector level, relative underperformance versus the style-specific index was driven by underweight exposure in the IT sector. Fund holdings in the consumer discretionary, financials
and health care sectors also detracted from relative performance.
In the IT sector, Samsung Electronics, the world’s largest smartphone maker, was the largest individual detractor from Fund performance during the reporting period. Samsung was negatively impacted by greater competition in the Chinese low-end smartphone market and relatively weak sales of the new high-end Galaxy S5 phone. However, we believe that new products, including the Galaxy Note 4, will help reinvigorate sales for Samsung. Not owning several strong performing names held by the Fund’s style-specific index in the IT sector also hurt relative performance.
In the consumer discretionary sector, Arcos Dorados was a large detractor from relative performance. Arcos Dorados is a franchisee of an American fast-food burger restaurant operating primarily in the Caribbean and Central and South America. The company was downgraded by analysts during the reporting period as the company’s earnings per share declined in the second quarter of this year.
Geographically, Fund exposure in Europe and underweight exposure in the Asia/Pacific region detracted from relative Fund performance. At the country level, not having any exposure to India was the largest detractor from Fund performance versus the style-specific index. Fund exposure in Russia and Hong Kong also hurt relative performance.
Some of the Fund’s underperformance was offset by underweight exposure relative to the style-specific index in the energy sector. Stock selection in the telecommunication services, utilities and
| | | | |
Portfolio Composition | |
By sector | |
| |
Financials | | | 35.5 | % |
Information Technology | | | 12.0 | |
Consumer Discretionary | | | 9.4 | |
Telecommunication Services | | | 8.0 | |
Consumer Staples | | | 6.6 | |
Health Care | | | 4.9 | |
Energy | | | 4.4 | |
Materials | | | 4.2 | |
Utilities | | | 3.8 | |
Industrials | | | 0.9 | |
Money Market Funds Plus Other Assets Less Liabilities | | | 10.3 | |
| | | | | | | | |
| | Top 10 Equity Holdings* | |
| | |
| | 1. | | | Banco Bradesco S.A.–ADR | | | 4.0 | % |
| | 2. | | | Kasikornbank PCL | | | 3.7 | |
| | 3. | | | Industrial and Commercial | | | | |
| | | | | Bank of China Ltd.–Class H | | | 2.9 | |
| | 4. | | | BM&FBovespa S.A. | | | 2.8 | |
| | 5. | | | Grupo Televisa S.A.B.–ADR | | | 2.8 | |
| | 6. | | | PT Bank Mandiri Persero Tbk | | | 2.8 | |
| | 7. | | | Taiwan Semiconductor | | | | |
| | | | | Manufacturing Co. Ltd. | | | 2.7 | |
| | 8. | | | Haci Omer Sabanci Holding A.S. | | | 2.6 | |
| | 9. | | | Credicorp Ltd. | | | 2.6 | |
| | 10. | | | CETIP S.A.–Mercados Organizados | | | 2.5 | |
| | | | |
Total Net Assets | | | $3.7 billion | |
| |
Total Number of Holdings* | | | 63 | |
The Fund’s holdings are subject to change, and there is no assurance that the Fund will continue to hold any particular security.
*Excluding money market fund holdings.
4 Invesco Developing Markets Fund
consumer staples sectors also contributed to relative performance.
In the energy sector, not owning several poor performing names was the largest contributor to Fund performance versus the MSCI Emerging Markets Index. Sasol, an integrated oil and gas company based in South Africa, was the largest contributor to Fund performance for the fiscal year.
In the telecommunication services sector, stock section contributed to relative performance. Philippine domestic and international long-distance cellular service provider Philippine Long Distance Telephone was the largest contributor to Fund performance in the sector. Indonesian domestic telecommunication services provider Telekomunikasi Indonesia Persero Tbk, was also a large contributor to relative Fund performance.
From a geographic perspective, stock selection in the Latin American and Africa/Mideast regions led relative Fund performance. Overweight exposure in Indonesia and underweight exposure in South Korea relative to the Fund’s style-specific index contributed to relative performance. Stock selection in Thailand and overweight exposure in the Philippines relative to the MSCI Emerging Markets Index also contributed to relative Fund performance.
The Fund’s positioning is driven by our stock selection process, as opposed to any top-down or macro-based allocation criteria. At fiscal year end, the portfolio was overweight relative to the MSCI Emerging Markets Index in the financials, health care, consumer discretionary, utilities and telecommunication services sectors, while it was underweight in the industrials, energy, IT, materials and consumer staples sectors. Geographically, the Fund finished the fiscal year with meaningful overweight exposure relative to the style-specific index in Brazil, Indonesia, the Philippines and Turkey while meaningfully underweight in South Korea, Taiwan, India and South Africa.
As always, regardless of the macroeconomic environment, we remain focused on a bottom-up investment approach of identifying attractive companies that fit our EQV-focused (earnings, quality and valuation) investment process. We continue to look for high-quality growth companies that exhibit the following characteristics: strong organic revenue
growth, high returns on capital, pricing power, strong balance sheets, cash generation and reasonable valuations. In addition, we continue to favor companies that are able to consistently generate cash during weak economic environments. We believe that this balanced EQV-focused approach may help deliver attractive returns over the long term.
We thank you for your continued investment in Invesco Developing Markets Fund.
The views and opinions expressed in management’s discussion of Fund performance are those of Invesco Advisers, Inc. These views and opinions are subject to change at any time based on factors such as market and economic conditions. These views and opinions may not be relied upon as investment advice or recommendations, or as an offer for a particular security. The information is not a complete analysis of every aspect of any market, country, industry, security or the Fund. Statements of fact are from sources considered reliable, but Invesco Advisers, Inc. makes no representation or warranty as to their completeness or accuracy. Although historical performance is no guarantee of future results, these insights may help you understand our investment management philosophy.
See important Fund and, if applicable, index disclosures later in this report.
| | |
 | | Shuxin (Steve) Cao Chartered Financial Analyst, Portfolio Manager, is lead manager of Invesco Developing Markets |
Fund with respect to the Fund’s investments in Asia Pacific and Latin America. He joined Invesco in 1997. Mr. Cao earned a BA in English from the Tianjin Foreign Language Institute and an MBA from Texas A&M University. He is also a Certified Public Accountant.
| | |
 | | Borge Endresen Chartered Financial Analyst, Portfolio Manager, is lead manager of Invesco Developing Markets |
Fund with respect to the Fund’s investments in Europe, Africa and the Middle East. He joined Invesco in 1999. Mr. Endresen earned a BS in finance from the University of Oregon and an MBA from The University of Texas at Austin.
| | |
 | | Brent Bates Chartered Financial Analyst, Portfolio Manager, is manager of Invesco Developing Markets Fund. He |
joined Invesco in 1996. Mr. Bates earned a BBA from Texas A&M University and is a Certified Public Accountant.
| | |
 | | Mark Jason Chartered Financial Analyst, Portfolio Manager, is manager of Invesco Developing Markets Fund. He |
joined Invesco in 2001. Mr. Jason earned a BS in finance and a BS in real estate from California State University, Northridge.
5 Invesco Developing Markets Fund
Your Fund’s Long-Term Performance
Results of a $10,000 Investment – Oldest Share Class(es)
Fund and index data from 10/31/04
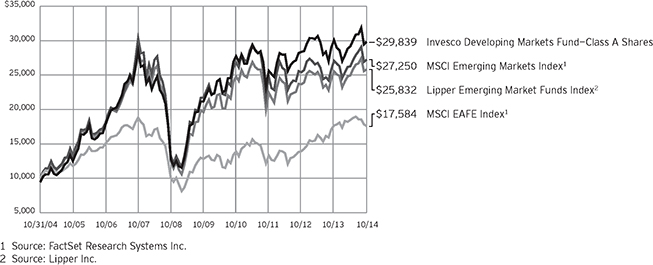
Past performance cannot guarantee comparable future results.
The data shown in the chart include reinvested distributions, applicable sales charges and Fund expenses including
management fees. Index results include reinvested dividends, but they do not reflect sales charges. Performance of the peer group, if applicable, reflects fund expenses and management fees;
performance of a market index does not. Performance shown in the chart and table(s) does not reflect deduction of taxes a shareholder would pay on Fund distributions or sale of Fund shares.
continued from page 8
About indexes used in this report
| n | | The MSCI EAFE® Index is an unmanaged index considered representative of stocks of Europe, Australasia and the Far East. The index is computed using the net return, which withholds applicable taxes for non-resident investors. |
| n | | The MSCI Emerging Markets IndexSM is an unmanaged index considered representative of stocks of developing countries. The index is computed using the net return, which withholds applicable taxes for non-resident investors. |
| n | | The Lipper Emerging Market Funds Index is an unmanaged index considered representative of emerging market funds tracked by Lipper. |
| n | | The Fund is not managed to track the performance of any particular index, including the index(es) described here, and consequently, the performance of the Fund may deviate significantly from the performance of the
index(es). |
| n | | A direct investment cannot be made in an index. Unless otherwise indicated, index results include reinvested dividends, and they do not reflect sales charges. Performance of the peer group, if applicable, reflects fund expenses; performance of a market index does not. |
Other information
| n | | CPA® and Certified Public Accountant® are trademarks owned by the American Institute of Certified Public Accountants. |
| n | | The returns shown in management’s discussion of Fund performance are based on net asset values (NAVs) calculated for shareholder transactions. Generally accepted accounting principles require adjustments to be made to the net assets of the Fund at period end for financial reporting purposes, and as such, the NAVs for shareholder transactions and the returns based on those NAVs may differ from the NAVs and returns reported in the Financial Highlights. |
| n | | Industry classifications used in this report are generally according to the Global Industry Classification Standard, which was developed by and is the exclusive property and a service mark of MSCI Inc. and Standard & Poor’s. |
6 Invesco Developing Markets Fund
| | | | |
| Average Annual Total Returns | |
| As of 10/31/14, including maximum applicable sales charges | |
| |
Class A Shares | | | | |
Inception (1/11/94) | | | 5.66 | % |
10 Years | | | 11.55 | |
5 Years | | | 5.92 | |
1 Year | | | -6.21 | |
| |
Class B Shares | | | | |
Inception (11/3/97) | | | 7.09 | % |
10 Years | | | 11.53 | |
5 Years | | | 6.02 | |
1 Year | | | -6.40 | |
| |
Class C Shares | | | | |
Inception (3/1/99) | | | 10.71 | % |
10 Years | | | 11.36 | |
5 Years | | | 6.32 | |
1 Year | | | -2.48 | |
| |
Class Y Shares | | | | |
10 Years | | | 12.36 | % |
5 Years | | | 7.40 | |
1 Year | | | -0.50 | |
| |
Class R5 Shares | | | | |
10 Years | | | 12.63 | % |
5 Years | | | 7.56 | |
1 Year | | | -0.35 | |
| |
Class R6 Shares | | | | |
10 Years | | | 12.29 | % |
5 Years | | | 7.32 | |
1 Year | | | -0.31 | |
Class Y shares incepted on October 3, 2008. Performance shown prior to that date is that of Class A shares and includes the 12b-1 fees applicable to Class A shares. Class A share performance reflects any applicable fee waivers or expense reimbursements.
Class R5 shares incepted on October 25, 2005. Performance shown prior to that date is that of Class A shares and includes the 12b-1 fees applicable to Class A shares. Class A share performance reflects any applicable fee waivers or expense reimbursements.
Class R6 shares incepted on September 24, 2012. Performance shown prior to that date is that of Class A shares and includes the 12b-1 fees applicable to Class A shares. Class A share performance reflects any applicable fee waivers or expense reimbursements.
The performance data quoted represent past performance and cannot guarantee comparable future results; current performance may be lower or higher. Please visit invesco.com/performance for the most recent month-
| | | | |
| Average Annual Total Returns | |
| As of 9/30/14, the most recent calendar quarter end, including maximum applicable sales charges | |
| |
Class A Shares | | | | |
Inception (1/11/94) | | | 5.62 | % |
10 Years | | | 11.89 | |
5 Years | | | 5.63 | |
1 Year | | | -4.09 | |
| |
Class B Shares | | | | |
Inception (11/3/97) | | | 7.04 | % |
10 Years | | | 11.87 | |
5 Years | | | 5.71 | |
1 Year | | | -4.28 | |
| |
Class C Shares | | | | |
Inception (3/1/99) | | | 10.68 | % |
10 Years | | | 11.71 | |
5 Years | | | 6.02 | |
1 Year | | | -0.31 | |
| |
Class Y Shares | | | | |
10 Years | | | 12.70 | % |
5 Years | | | 7.10 | |
1 Year | | | 1.74 | |
| |
Class R5 Shares | | | | |
10 Years | | | 12.97 | % |
5 Years | | | 7.26 | |
1 Year | | | 1.87 | |
| |
Class R6 Shares | | | | |
10 Years | | | 12.63 | % |
5 Years | | | 7.01 | |
1 Year | | | 1.88 | |
end performance. Performance figures reflect reinvested distributions, changes in net asset value and the effect of the maximum sales charge unless otherwise stated. Investment return and principal value will fluctuate so that you may have a gain or loss when you sell shares.
The net annual Fund operating expense ratio set forth in the most recent Fund prospectus as of the date of this report for Class A, Class B, Class C, Class Y, Class R5 and Class R6 shares was 1.40%, 2.15%, 2.15%, 1.15%, 1.03% and 0.99%, respectively.1 The total annual Fund operating expense ratio set forth in the most recent Fund prospectus as of the date of this report for Class A, Class B, Class C, Class Y, Class R5 and Class R6 shares was 1.42%, 2.17%, 2.17%, 1.17%, 1.05% and 1.01%, respectively. The expense ratios presented above may vary from the expense ratios presented in other sections of this report that are based on expenses incurred during the period covered by this report.
Class A share performance reflects the maximum 5.50% sales charge, and Class B and Class C share performance reflects the applicable contingent deferred sales charge (CDSC) for the period involved. The CDSC on Class B shares declines from 5% beginning at the time of purchase to 0% at the beginning of the seventh year. The CDSC on Class C shares is 1% for the first year after purchase. Class Y, Class R5 and Class R6 shares do not have a front-end sales charge or a CDSC; therefore, performance is at net asset value.
The performance of the Fund’s share classes will differ primarily due to different sales charge structures and class expenses.
Had the adviser not waived fees and/or reimbursed expenses in the past, performance would have been lower.
| 1 | Total annual Fund operating expenses after any contractual fee waivers and/or expense reimbursements by the adviser in effect through at least June 30, 2016. See current prospectus for more information. |
7 Invesco Developing Markets Fund
Invesco Developing Markets Fund’s investment objective is long-term growth of capital.
| n | | Unless otherwise stated, information presented in this report is as of October 31, 2014, and is based on total net assets. |
| n | | Unless otherwise noted, all data provided by Invesco. |
| n | | To access your Fund’s reports/prospectus, visit invesco.com/fundreports. |
About share classes
| n | | Class B shares may not be purchased for new or additional investments. Please see the prospectus for more information. |
| n | | Class Y shares are available to only certain investors. Please see the prospectus for more information. |
| n | | Class R5 shares and Class R6 shares are primarily intended for employer sponsored retirement and benefit plans that meet certain standards and for institutional investors. Please see the prospectus for more information. |
Principal risks of investing in the Fund
| n | | Depositary receipts risk. Depositary receipts involve many of the same risks as those associated with direct investment in foreign securities. In addition, the underlying issuers of certain depositary receipts, particularly unsponsored or unregistered depositary receipts, are under no obligation to distribute shareholder communications to the holders of such receipts or to pass through to them any voting rights with respect to the deposited securities. |
| n | | Derivatives risk. The value of a derivative instrument depends largely on (and is derived from) the value of an underlying security, currency, commodity, interest rate, index or other asset (each referred to as an underlying asset). In addition to risks relating to the underlying assets, the use of derivatives may include other, possibly greater, risks, including counterparty, leverage and liquidity risks. |
Counterparty risk is the risk that the counterparty to the derivative contract will default on its obligation to pay the Fund the amount owed or otherwise perform under the derivative contract. Derivatives create leverage risk because they do not require payment up front equal to the economic exposure created by owning the derivative. As a result, an adverse change in the value of the underlying asset could result in the Fund sustaining a loss that is
substantially greater than the amount invested in the derivative, which may make the Fund’s returns more volatile and increase the risk of loss. Derivative instruments may also be less liquid than more traditional investments and the Fund may be unable to sell or close out its derivative positions at a desirable time or price. This risk may be more acute under adverse market conditions, during which the Fund may be most in need of liquidating its derivative positions. Derivatives may also be harder to value, less tax efficient and subject to changing government regulation that could impact the Fund’s ability to use certain derivatives or their cost. Also, derivatives used for hedging or to gain or limit exposure to a particular market segment may not provide the expected benefits, particularly during adverse market conditions.
| n | | Developing/emerging markets securities risk. The prices of securities issued by foreign companies and governments located in developing/emerging market countries may be affected more negatively by inflation, devaluation of their currencies, higher transaction costs, delays in settlement, adverse political developments, the introduction of capital controls, withholding taxes, nationalization of private assets, expropriation, social unrest, war or lack of timely information than those in developed countries. |
| n | | Foreign securities risk. The Fund’s foreign investments may be affected by changes in a foreign country’s exchange rates, political and social instability, changes in economic or taxation policies, difficulties when enforcing obligations, decreased liquidity, and increased volatility. Foreign companies may be subject to less regulation resulting in less publicly available information about the companies. |
| n | | Geographic focus risk. From time to time the Fund may invest a substantial amount of its assets in securities of issuers located in a single country or a limited number of countries. If the Fund |
focuses its investments in this manner, it assumes the risk that economic, political and social conditions in those countries will have a significant impact on its investment performance. The Fund’s investment performance may also be more volatile if it focuses its investments in certain countries, especially emerging markets countries.
| n | | Growth investing risk. Growth stocks tend to be more expensive relative to their earnings or assets compared with other types of stock. As a result they tend to be more sensitive to changes in their earnings and can be more volatile. |
| n | | Management risk. The investment techniques and risk analysis used by the Fund’s portfolio managers may not produce the desired results. |
| n | | Market risk. The prices of and the income generated by the Fund’s securities may decline in response to, among other things, investor sentiment, general economic and market conditions, regional or global instability, and currency and interest rate fluctuations. |
| n | | Preferred securities risk. Preferred securities may include provisions that permit the issuer, in its discretion, to defer or omit distributions for a certain period of time. If the Fund owns a security that is deferring or omitting its distributions, the Fund may be required to report the distribution on its tax returns, even though it may not have received this income. Further, preferred securities may lose substantial value due to the omission or deferment of dividend payments. |
| n | | Small- and mid-capitalization risks. Stocks of small- and mid-sized companies tend to be more vulnerable to adverse developments and may have little or no operating history or track record of success, and limited product lines, markets, management and financial resources. The securities of small- and mid-sized companies may be more volatile due to less market interest and less publicly available information about the issuer. They also may be illiquid or restricted as to resale, or may trade less frequently and in smaller volumes, all of which may cause difficulty when establishing or closing a position at a desirable price. |
This report must be accompanied or preceded by a currently effective Fund prospectus, which contains more complete information, including sales charges and expenses. Investors should read it carefully before investing.
NOT FDIC INSURED | MAY LOSE VALUE | NO BANK GUARANTEE
8 Invesco Developing Markets Fund
Schedule of Investments
October 31, 2014
| | | | | | | | |
| | | Shares | | | Value | |
Common Stocks & Other Equity Interests–89.72% | |
| Bermuda–0.37% | | | | | | | | |
Wilson Sons Ltd.–BDR | | | 962,600 | | | $ | 13,596,045 | |
|
| Brazil–20.84% | |
Arcos Dorados Holdings, Inc.–Class A | | | 5,088,427 | | | | 31,344,710 | |
Banco Bradesco S.A.–ADR | | | 9,977,820 | | | | 149,467,744 | |
BM&FBovespa S.A. | | | 24,230,600 | | | | 106,583,349 | |
BR Malls Participacoes S.A. | | | 9,819,500 | | | | 78,857,163 | |
BRF S.A. | | | 1,293,240 | | | | 33,656,597 | |
CETIP S.A.–Mercados Organizados | | | 7,318,586 | | | | 92,737,530 | |
Cielo S.A. | | | 5,431,214 | | | | 89,183,252 | |
Diagnosticos da America S.A. | | | 3,880,000 | | | | 16,550,282 | |
Duratex S.A. | | | 16,549,196 | | | | 59,438,194 | |
Fleury S.A.(a) | | | 8,702,000 | | | | 57,697,280 | |
Petroleo Brasileiro S.A.–ADR | | | 1,939,231 | | | | 23,716,795 | |
Totvs S.A. | | | 2,845,000 | | | | 41,469,492 | |
| | | | | | | | 780,702,388 | |
|
| China–15.16% | |
Baidu, Inc.–ADR(b) | | | 323,223 | | | | 77,175,956 | |
Belle International Holdings Ltd. | | | 50,669,000 | | | | 64,486,987 | |
China Mobile Ltd. | | | 4,774,500 | | | | 59,411,129 | |
CNOOC Ltd. | | | 21,600,000 | | | | 33,813,581 | |
Golden Eagle Retail Group Ltd. | | | 30,301,000 | | | | 37,118,735 | |
Industrial and Commercial Bank of China Ltd.–Class H | | | 164,848,000 | | | | 109,046,981 | |
Lee & Man Paper Manufacturing Ltd. | | | 80,495,000 | | | | 44,217,186 | |
NetEase, Inc.–ADR | | | 387,185 | | | | 36,674,163 | |
Stella International Holdings Ltd. | | | 11,189,000 | | | | 32,285,725 | |
Want Want China Holdings Ltd. | | | 53,267,000 | | | | 73,609,633 | |
| | | | | | | | 567,840,076 | |
|
| Czech Republic–0.57% | |
CEZ A.S. | | | 776,574 | | | | 21,478,992 | |
|
| Egypt–0.34% | |
Egyptian Financial Group–Hermes Holding(b) | | | 5,456,990 | | | | 12,845,279 | |
|
| Hong Kong–1.20% | |
Galaxy Entertainment Group Ltd. | | | 6,601,000 | | | | 45,070,076 | |
|
| Hungary–1.28% | |
Richter Gedeon Nyrt | | | 3,147,000 | | | | 48,034,370 | |
|
| Indonesia–8.18% | |
PT Bank Central Asia Tbk | | | 24,954,000 | | | | 26,998,637 | |
PT Bank Mandiri Persero Tbk | | | 121,601,000 | | | | 104,359,487 | |
PT Indocement Tunggal Prakarsa Tbk | | | 8,758,300 | | | | 17,639,670 | |
PT Perusahaan Gas Negara Persero Tbk | | | 159,818,500 | | | | 78,685,981 | |
PT Telekomunikasi Indonesia Persero Tbk | | | 343,247,400 | | | | 78,784,949 | |
| | | | | | | | 306,468,724 | |
| | | | | | | | |
| | | Shares | | | Value | |
| Israel–2.26% | |
Israel Chemicals Ltd. | | | 5,276,457 | | | $ | 35,588,333 | |
Teva Pharmaceutical Industries Ltd.–ADR | | | 868,015 | | | | 49,016,807 | |
| | | | | | | | 84,605,140 | |
|
| Malaysia–1.71% | |
Public Bank Berhad | | | 11,351,900 | | | | 64,058,221 | |
|
| Mexico–6.81% | |
America Movil S.A.B. de C.V.–Series L–ADR | | | 1,743,391 | | | | 42,556,174 | |
Fomento Economico Mexicano, S.A.B. de C.V.–ADR | | | 682,829 | | | | 65,715,463 | |
Grupo Televisa S.A.B.–ADR | | | 2,948,316 | | | | 106,552,140 | |
Kimberly-Clark de Mexico, S.A.B. de C.V.–Class A | | | 17,356,970 | | | | 40,395,022 | |
| | | | | | | | 255,218,799 | |
|
| Nigeria–1.51% | |
Zenith Bank PLC | | | 440,151,377 | | | | 56,347,882 | |
|
| Peru–2.60% | |
Credicorp Ltd. | | | 605,820 | | | | 97,537,020 | |
|
| Philippines–5.56% | |
Ayala Corp. | | | 1,169,042 | | | | 17,973,239 | |
Energy Development Corp. | | | 246,329,900 | | | | 42,358,588 | |
Philippine Long Distance Telephone Co. | | | 1,303,750 | | | | 90,988,994 | |
SM Investments Corp. | | | 1,278,910 | | | | 22,326,782 | |
SM Prime Holdings Inc. | | | 88,714,700 | | | | 34,674,811 | |
| | | | | | | | 208,322,414 | |
|
| Russia–5.30% | |
Gazprom OAO–ADR | | | 4,879,035 | | | | 32,381,674 | |
Mobile TeleSystems OJSC–ADR | | | 1,859,782 | | | | 26,594,883 | |
Sberbank of Russia(b) | | | 37,218,144 | | | | 65,965,401 | |
Sberbank of Russia–Preference Shares(b) | | | 21,470,146 | | | | 28,404,230 | |
Yandex NV–Class A(b) | | | 1,576,500 | | | | 45,119,430 | |
| | | | | | | | 198,465,618 | |
|
| South Africa–0.56% | |
Sasol Ltd. | | | 418,828 | | | | 20,932,133 | |
|
| South Korea–2.54% | |
Hyundai Department Store Co., Ltd. | | | 272,521 | | | | 34,457,003 | |
Samsung Electronics Co., Ltd. | | | 52,425 | | | | 60,727,034 | |
| | | | | | | | 95,184,037 | |
|
| Taiwan–2.66% | |
Taiwan Semiconductor Manufacturing Co. Ltd. | | | 23,082,000 | | | | 99,509,159 | |
|
| Thailand–4.95% | |
Kasikornbank PCL | | | 18,741,700 | | | | 137,245,843 | |
See accompanying Notes to Financial Statements which are an integral part of the financial statements.
9 Invesco Developing Markets Fund
| | | | | | | | |
| | | Shares | | | Value | |
| Thailand–(continued) | |
Siam Commercial Bank PCL (The) | | | 8,852,600 | | | $ | 48,241,042 | |
| | | | | | | | 185,486,885 | |
|
| Turkey–4.45% | |
Anadolu Efes Biracilik ve Malt Sanayii A.S.(b) | | | 2,888,185 | | | | 33,786,021 | |
Eczacibasi Ilac Sanayi ve Ticaret A.S. | | | 12,515,924 | | | | 13,213,397 | |
Haci Omer Sabanci Holding A.S. | | | 21,661,048 | | | | 98,920,020 | |
Tupras-Turkiye Petrol Rafinerileri A.S. | | | 962,408 | | | | 20,892,732 | |
| | | | | | | | 166,812,170 | |
|
| Turkmenistan–0.87% | |
Dragon Oil PLC | | | 3,798,634 | | | | 32,664,169 | |
Total Common Stocks & Other Equity Interests
(Cost $2,925,855,274) | | | | 3,361,179,597 | |
| | | | | | | | |
| | | Shares | | | Value | |
Money Market Funds–9.21% | | | | | | | | |
Liquid Assets Portfolio–Institutional Class(c) | | | 172,498,107 | | | $ | 172,498,107 | |
Premier Portfolio–Institutional Class(c) | | | 172,498,106 | | | | 172,498,106 | |
Total Money Market Funds
(Cost $344,996,213) | | | | 344,996,213 | |
TOTAL INVESTMENTS–98.93%
(Cost $3,270,851,487) | | | | 3,706,175,810 | |
OTHER ASSETS LESS LIABILITIES–1.07% | | | | 40,255,111 | |
NET ASSETS–100.00% | | | $ | 3,746,430,921 | |
Investment Abbreviations:
| | |
| ADR | | – American Depositary Receipt |
| BDR | | – British Deposit Receipt |
Notes to Schedule of Investments:
| (a) | Affiliated company during the period. The Investment Company Act of 1940 defines affiliates as those issuances in which a fund holds 5% or more of the outstanding voting securities. The Fund has not owned enough of the outstanding voting securities of the issuer to have control (as defined in the Investment Company Act of 1940) of that issuer. The value of this security as of October 31, 2014 represented 1.54% of the Fund’s Net Assets. See Note 4. |
| (b) | Non-income producing security. |
| (c) | The money market fund and the Fund are affiliated by having the same investment adviser. |
See accompanying Notes to Financial Statements which are an integral part of the financial statements.
10 Invesco Developing Markets Fund
Statement of Assets and Liabilities
October 31, 2014
| | | | |
Assets: | |
Investments, at value (Cost $2,849,176,647) | | $ | 3,303,482,317 | |
Investments in affiliates, at value (Cost $421,674,840) | | | 402,693,493 | |
Total investments, at value (Cost $3,270,851,487) | | | 3,706,175,810 | |
Foreign currencies, at value (Cost $52,985,531) | | | 52,174,383 | |
Receivable for: | | | | |
Investments sold | | | 707,278 | |
Fund shares sold | | | 9,552,086 | |
Dividends | | | 1,261,937 | |
Investment for trustee deferred compensation and retirement plans | | | 325,601 | |
Other assets | | | 120,207 | |
Total assets | | | 3,770,317,302 | |
|
Liabilities: | |
Payable for: | | | | |
Fund shares reacquired | | | 4,923,062 | |
Accrued foreign taxes | | | 15,593,483 | |
Accrued fees to affiliates | | | 1,922,261 | |
Accrued trustees’ and officers’ fees and benefits | | | 6,245 | |
Accrued other operating expenses | | | 1,060,318 | |
Trustee deferred compensation and retirement plans | | | 381,012 | |
Total liabilities | | | 23,886,381 | |
Net assets applicable to shares outstanding | | $ | 3,746,430,921 | |
|
Net assets consist of: | |
Shares of beneficial interest | | $ | 3,279,660,814 | |
Undistributed net investment income | | | 43,759,663 | |
Undistributed net realized gain (loss) | | | (11,483,981 | ) |
Net unrealized appreciation | | | 434,494,425 | |
| | | $ | 3,746,430,921 | |
| | | | |
Net Assets: | |
Class A | | $ | 1,251,017,831 | |
Class B | | $ | 28,313,596 | |
Class C | | $ | 137,867,445 | |
Class Y | | $ | 1,463,585,699 | |
Class R5 | | $ | 686,179,765 | |
Class R6 | | $ | 179,466,585 | |
|
Shares outstanding, $0.01 par value per share,
with an unlimited number of shares authorized: | |
Class A | | | 37,044,446 | |
Class B | | | 865,356 | |
Class C | | | 4,218,772 | |
Class Y | | | 43,179,465 | |
Class R5 | | | 20,256,821 | |
Class R6 | | | 5,299,241 | |
Class A: | | | | |
Net asset value per share | | $ | 33.77 | |
Maximum offering price per share | | | | |
(Net asset value of $33.77 ¸ 94.50%) | | $ | 35.74 | |
Class B: | | | | |
Net asset value and offering price per share | | $ | 32.72 | |
Class C: | | | | |
Net asset value and offering price per share | | $ | 32.68 | |
Class Y: | | | | |
Net asset value and offering price per share | | $ | 33.90 | |
Class R5 | | | | |
Net asset value and offering price per share | | $ | 33.87 | |
Class R6: | | | | |
Net asset value and offering price per share | | $ | 33.87 | |
See accompanying Notes to Financial Statements which are an integral part of the financial statements.
11 Invesco Developing Markets Fund
Statement of Operations
For the year ended October 31, 2014
| | | | |
Investment income: | |
Dividends (net of foreign withholding taxes of $9,845,959) | | $ | 89,036,056 | |
Dividends from affiliates | | | 3,139,844 | |
Interest | | | 28,616 | |
Total investment income | | | 92,204,516 | |
| |
Expenses: | | | | |
Advisory fees | | | 31,605,025 | |
Administrative services fees | | | 584,734 | |
Custodian fees | | | 2,919,479 | |
Distribution fees: | | | | |
Class A | | | 3,423,740 | |
Class B | | | 348,283 | |
Class C | | | 1,480,948 | |
Transfer agent fees — A, B, C and Y | | | 4,972,231 | |
Transfer agent fees — R5 | | | 160,691 | |
Transfer agent fees — R6 | | | 1,645 | |
Trustees’ and officers’ fees and benefits | | | 107,485 | |
Other | | | 753,834 | |
Total expenses | | | 46,358,095 | |
Less: Fees waived and expense offset arrangement(s) | | | (566,978 | ) |
Net expenses | | | 45,791,117 | |
Net investment income | | | 46,413,399 | |
| |
Realized and unrealized gain (loss) from: | | | | |
Net realized gain (loss) from: | | | | |
Investment securities | | | 83,852,548 | |
Foreign currencies | | | (1,840,998 | ) |
| | | | 82,011,550 | |
Change in net unrealized appreciation (depreciation) of: | | | | |
Investment securities (net of foreign taxes on holdings of $4,191,180) | | | (152,029,401 | ) |
Foreign currencies | | | (835,495 | ) |
| | | | (152,864,896 | ) |
Net realized and unrealized gain (loss) | | | (70,853,346 | ) |
Net increase (decrease) in net assets resulting from operations | | $ | (24,439,947 | ) |
See accompanying Notes to Financial Statements which are an integral part of the financial statements.
12 Invesco Developing Markets Fund
Statement of Changes in Net Assets
For the years ended October 31, 2014 and 2013
| | | | | | | | |
| | | 2014 | | | 2013 | |
Operations: | | | | | |
Net investment income | | $ | 46,413,399 | | | $ | 33,302,925 | |
Net realized gain | | | 82,011,550 | | | | 38,490,425 | |
Change in net unrealized appreciation (depreciation) | | | (152,864,896 | ) | | | 114,865,251 | |
Net increase (decrease) in net assets resulting from operations | | | (24,439,947 | ) | | | 186,658,601 | |
| | |
Distributions to shareholders from net investment income: | | | | | | | | |
Class A | | | (12,047,271 | ) | | | (10,042,214 | ) |
Class B | | | (2,825 | ) | | | — | |
Class C | | | (10,919 | ) | | | — | |
Class Y | | | (12,316,478 | ) | | | (7,277,493 | ) |
Class R5 | | | (7,997,307 | ) | | | (6,238,180 | ) |
Class R6 | | | (1,920,886 | ) | | | (1,453,668 | ) |
Total distributions from net investment income | | | (34,295,686 | ) | | | (25,011,555 | ) |
| | |
Distributions to shareholders from net realized gains: | | | | | | | | |
Class A | | | (4,079,975 | ) | | | — | |
Class B | | | (122,369 | ) | | | — | |
Class C | | | (472,989 | ) | | | — | |
Class Y | | | (3,205,244 | ) | | | — | |
Class R5 | | | (1,883,230 | ) | | | — | |
Class R6 | | | (437,629 | ) | | | — | |
Total distributions from net realized gains | | | (10,201,436 | ) | | | — | |
| | |
Share transactions–net: | | | | | | | | |
Class A | | | (216,412,571 | ) | | | 51,176,713 | |
Class B | | | (14,987,379 | ) | | | (17,875,643 | ) |
Class C | | | (26,665,246 | ) | | | (29,641,996 | ) |
Class Y | | | 312,954,650 | | | | 404,590,310 | |
Class R5 | | | 30,137,043 | | | | 123,742,735 | |
Class R6 | | | 27,066,204 | | | | 23,839,674 | |
Net increase in net assets resulting from share transactions | | | 112,092,701 | | | | 555,831,793 | |
Net increase in net assets | | | 43,155,632 | | | | 717,478,839 | |
| | |
Net assets: | | | | | | | | |
Beginning of year | | | 3,703,275,289 | | | | 2,985,796,450 | |
End of year (includes undistributed net investment income of $43,759,663 and $30,120,842, respectively) | | $ | 3,746,430,921 | | | $ | 3,703,275,289 | |
Notes to Financial Statements
October 31, 2014
NOTE 1—Significant Accounting Policies
Invesco Developing Markets Fund (the “Fund”) is a series portfolio of AIM Investment Funds (Invesco Investment Funds) (the “Trust”). The Trust is organized as a Delaware statutory trust and is registered under the Investment Company Act of 1940, as amended (the “1940 Act”), as an open-end series management investment company consisting of twenty-four separate series portfolios, each authorized to issue an unlimited number of shares of beneficial interest. The assets, liabilities and operations of each portfolio are accounted for separately. Information presented in these financial statements pertains only to the Fund. Matters affecting each portfolio or class will be voted on exclusively by the shareholders of such portfolio or class.
The Fund’s investment objective is long-term growth of capital.
The Fund currently consists of six different classes of shares: Class A, Class B, Class C, Class Y, Class R5 and Class R6. Class A shares are sold with a front-end sales charge unless certain waiver criteria are met and under certain circumstances load waived shares may be subject to contingent deferred sales charges (“CDSC”). Class C shares are sold with a CDSC. Class Y, Class R5 and Class R6 shares are sold at net asset value. Effective November 30, 2010, new or additional investments in Class B shares are no longer permitted. Existing shareholders of Class B shares may continue to reinvest dividends and capital gains distributions in Class B shares until they convert to Class A shares. Also, shareholders in Class B shares will be
13 Invesco Developing Markets Fund
able to exchange those shares for Class B shares of other Invesco Funds offering such shares until they convert to Class A shares. Generally, Class B shares will automatically convert to Class A shares on or about the month-end, which is at least eight years after the date of purchase. Redemption of Class B shares prior to the conversion date will be subject to a CDSC.
The following is a summary of the significant accounting policies followed by the Fund in the preparation of its financial statements.
| A. | Security Valuations — Securities, including restricted securities, are valued according to the following policy. |
A security listed or traded on an exchange (except convertible securities) is valued at its last sales price or official closing price as of the close of the customary trading session on the exchange where the security is principally traded, or lacking any sales or official closing price on a particular day, the security may be valued at the closing bid price on that day. Securities traded in the over-the-counter market are valued based on prices furnished by independent pricing services or market makers. When such securities are valued by an independent pricing service they may be considered fair valued. Futures contracts are valued at the final settlement price set by an exchange on which they are principally traded. Listed options are valued at the mean between the last bid and ask prices from the exchange on which they are principally traded. Options not listed on an exchange are valued by an independent source at the mean between the last bid and ask prices. For purposes of determining net asset value per share, futures and option contracts generally are valued 15 minutes after the close of the customary trading session of the New York Stock Exchange (“NYSE”).
Investments in open-end and closed-end registered investment companies that do not trade on an exchange are valued at the end of day net asset value per share. Investments in open-end and closed-end registered investment companies that trade on an exchange are valued at the last sales price or official closing price as of the close of the customary trading session on the exchange where the security is principally traded.
Debt obligations (including convertible securities) and unlisted equities are fair valued using an evaluated quote provided by an independent pricing service. Evaluated quotes provided by the pricing service may be determined without exclusive reliance on quoted prices, and may reflect appropriate factors such as institution-size trading in similar groups of securities, developments related to specific securities, dividend rate (for unlisted equities), yield (for debt obligations), quality, type of issue, coupon rate (for debt obligations), maturity (for debt obligations), individual trading characteristics and other market data. Debt obligations are subject to interest rate and credit risks. In addition, all debt obligations involve some risk of default with respect to interest and/or principal payments.
Foreign securities’ (including foreign exchange contracts) prices are converted into U.S. dollar amounts using the applicable exchange rates as of the close of the NYSE. If market quotations are available and reliable for foreign exchange-traded equity securities, the securities will be valued at the market quotations. Because trading hours for certain foreign securities end before the close of the NYSE, closing market quotations may become unreliable. If between the time trading ends on a particular security and the close of the customary trading session on the NYSE, events occur that the Adviser determines are significant and make the closing price unreliable, the Fund may fair value the security. If the event is likely to have affected the closing price of the security, the security will be valued at fair value in good faith using procedures approved by the Board of Trustees. Adjustments to closing prices to reflect fair value may also be based on a screening process of an independent pricing service to indicate the degree of certainty, based on historical data, that the closing price in the principal market where a foreign security trades is not the current value as of the close of the NYSE. Foreign securities’ prices meeting the approved degree of certainty that the price is not reflective of current value will be priced at the indication of fair value from the independent pricing service. Multiple factors may be considered by the independent pricing service in determining adjustments to reflect fair value and may include information relating to sector indices, American Depositary Receipts and domestic and foreign index futures. Foreign securities may have additional risks including exchange rate changes, potential for sharply devalued currencies and high inflation, political and economic upheaval, the relative lack of issuer information, relatively low market liquidity and the potential lack of strict financial and accounting controls and standards.
Securities for which market prices are not provided by any of the above methods may be valued based upon quotes furnished by independent sources. The last bid price may be used to value equity securities. The mean between the last bid and ask prices is used to value debt obligations, including corporate loans.
Securities for which market quotations are not readily available or became unreliable are valued at fair value as determined in good faith by or under the supervision of the Trust’s officers following procedures approved by the Board of Trustees. Issuer specific events, market trends, bid/ask quotes of brokers and information providers and other market data may be reviewed in the course of making a good faith determination of a security’s fair value.
The Fund may invest in securities that are subject to interest rate risk, meaning the risk that the prices will generally fall as interest rates rise and, conversely, the prices will generally rise as interest rates fall. Specific securities differ in their sensitivity to changes in interest rates depending on their individual characteristics. Changes in interest rates may result in increased market volatility, which may affect the value and/or liquidity of certain of the Fund’s investments.
Valuations change in response to many factors including the historical and prospective earnings of the issuer, the value of the issuer’s assets, general economic conditions, interest rates, investor perceptions and market liquidity. Because of the inherent uncertainties of valuation, the values reflected in the financial statements may materially differ from the value received upon actual sale of those investments.
| B. | Securities Transactions and Investment Income — Securities transactions are accounted for on a trade date basis. Realized gains or losses on sales are computed on the basis of specific identification of the securities sold. Interest income (net of withholding tax, if any) is recorded on the accrual basis from settlement date. Dividend income (net of withholding tax, if any) is recorded on the ex-dividend date. |
The Fund may periodically participate in litigation related to Fund investments. As such, the Fund may receive proceeds from litigation settlements. Any proceeds received are included in the Statement of Operations as realized gain (loss) for investments no longer held and as unrealized gain (loss) for investments still held.
Brokerage commissions and mark ups are considered transaction costs and are recorded as an increase to the cost basis of securities purchased and/or a reduction of proceeds on a sale of securities. Such transaction costs are included in the determination of net realized and unrealized gain (loss) from investment securities reported in the Statement of Operations and the Statement of Changes in Net Assets and the net realized and unrealized gains (losses) on securities per share in the Financial Highlights. Transaction costs are included in the calculation of the Fund’s net asset value and, accordingly, they reduce the Fund’s total returns. These transaction costs are not considered operating expenses and are not reflected in net investment income reported in the Statement of Operations and Statement of Changes in Net Assets, or the net investment
14 Invesco Developing Markets Fund
income per share and ratios of expenses and net investment income reported in the Financial Highlights, nor are they limited by any expense limitation arrangements between the Fund and the investment adviser.
The Fund allocates income and realized and unrealized capital gains and losses to a class based on the relative net assets of each class.
| C. | Country Determination — For the purposes of making investment selection decisions and presentation in the Schedule of Investments, the investment adviser may determine the country in which an issuer is located and/or credit risk exposure based on various factors. These factors include the laws of the country under which the issuer is organized, where the issuer maintains a principal office, the country in which the issuer derives 50% or more of its total revenues and the country that has the primary market for the issuer’s securities, as well as other criteria. Among the other criteria that may be evaluated for making this determination are the country in which the issuer maintains 50% or more of its assets, the type of security, financial guarantees and enhancements, the nature of the collateral and the sponsor organization. Country of issuer and/or credit risk exposure has been determined to be the United States of America, unless otherwise noted. |
| D. | Distributions — Distributions from net investment income and net realized capital gain, if any, are generally declared and paid annually and recorded on the ex-dividend date. The Fund may elect to treat a portion of the proceeds from redemptions as distributions for federal income tax purposes. |
| E. | Federal Income Taxes — The Fund intends to comply with the requirements of Subchapter M of the Internal Revenue Code of 1986, as amended (the “Internal Revenue Code”), necessary to qualify as a regulated investment company and to distribute substantially all of the Fund’s taxable earnings to shareholders. As such, the Fund will not be subject to federal income taxes on otherwise taxable income (including net realized capital gain) that is distributed to shareholders. Therefore, no provision for federal income taxes is recorded in the financial statements. |
The Fund recognizes the tax benefits of uncertain tax positions only when the position is more likely than not to be sustained. Management has analyzed the Fund’s uncertain tax positions and concluded that no liability for unrecognized tax benefits should be recorded related to uncertain tax positions. Management is not aware of any tax positions for which it is reasonably possible that the total amounts of unrecognized tax benefits will change materially in the next 12 months.
The Fund files tax returns in the U.S. Federal jurisdiction and certain other jurisdictions. Generally, the Fund is subject to examinations by such taxing authorities for up to three years after the filing of the return for the tax period.
| F. | Expenses — Fees provided for under the Rule 12b-1 plan of a particular class of the Fund are charged to the operations of such class. Transfer agency fees and expenses and other shareholder recordkeeping fees and expenses attributable to Class R5 and Class R6 are allocated to each share class based on relative net assets. Sub-accounting fees attributable to Class R5 are charged to the operations of the class. Transfer agency fees and expenses and other shareholder recordkeeping fees and expenses relating to all other classes are allocated among those classes based on relative net assets. All other expenses are allocated among the classes based on relative net assets. |
| G. | Accounting Estimates — The preparation of financial statements in conformity with accounting principles generally accepted in the United States of America (“GAAP”) requires management to make estimates and assumptions that affect the reported amounts of assets and liabilities at the date of the financial statements and the reported amounts of revenues and expenses during the reporting period including estimates and assumptions related to taxation. Actual results could differ from those estimates by a significant amount. In addition, the Fund monitors for material events or transactions that may occur or become known after the period-end date and before the date the financial statements are released to print. |
| H. | Indemnifications — Under the Trust’s organizational documents, each Trustee, officer, employee or other agent of the Trust is indemnified against certain liabilities that may arise out of the performance of their duties to the Fund. Additionally, in the normal course of business, the Fund enters into contracts, including the Fund’s servicing agreements, that contain a variety of indemnification clauses. The Fund’s maximum exposure under these arrangements is unknown as this would involve future claims that may be made against the Fund that have not yet occurred. The risk of material loss as a result of such indemnification claims is considered remote. |
| I. | Foreign Currency Translations — Foreign currency is valued at the close of the NYSE based on quotations posted by banks and major currency dealers. Portfolio securities and other assets and liabilities denominated in foreign currencies are translated into U.S. dollar amounts at date of valuation. Purchases and sales of portfolio securities (net of foreign taxes withheld on disposition) and income items denominated in foreign currencies are translated into U.S. dollar amounts on the respective dates of such transactions. The Fund does not separately account for the portion of the results of operations resulting from changes in foreign exchange rates on investments and the fluctuations arising from changes in market prices of securities held. The combined results of changes in foreign exchange rates and the fluctuation of market prices on investments (net of estimated foreign tax withholding) are included with the net realized and unrealized gain or loss from investments in the Statement of Operations. Reported net realized foreign currency gains or losses arise from (1) sales of foreign currencies, (2) currency gains or losses realized between the trade and settlement dates on securities transactions, and (3) the difference between the amounts of dividends, interest, and foreign withholding taxes recorded on the Fund’s books and the U.S. dollar equivalent of the amounts actually received or paid. Net unrealized foreign currency gains and losses arise from changes in the fair values of assets and liabilities, other than investments in securities at fiscal period end, resulting from changes in exchange rates. |
The Fund may invest in foreign securities, which may be subject to foreign taxes on income, gains on investments or currency repatriation, a portion of which may be recoverable. Foreign taxes, if any, are recorded based on the tax regulations and rates that exist in the foreign markets in which the Fund invests and are shown in the Statement of Operations.
| J. | Forward Foreign Currency Contracts — The Fund may engage in foreign currency transactions either on a spot (i.e. for prompt delivery and settlement) basis or through forward foreign currency contracts to manage or minimize currency or exchange rate risk. |
The Fund may also enter into forward foreign currency contracts for the purchase or sale of a security denominated in a foreign currency in order to “lock in” the U.S. dollar price of that security, or the Fund may also enter into forward foreign currency contracts that do not provide for physical settlement of the two currencies, but instead are settled by a single cash payment calculated as the difference between the agreed upon exchange rate and the spot rate at settlement based upon an agreed upon notional amount (non-deliverable forwards). The Fund will set aside liquid assets in an amount equal to daily mark-to-market obligation for forward foreign currency contracts.
A forward foreign currency contract is an obligation between two parties (“Counterparties”) to purchase or sell a specific currency for an agreed-upon price at a future date. The use of forward foreign currency contracts does not eliminate fluctuations in the price of the underlying securities the Fund owns or intends to acquire but establishes a rate of exchange in advance. Fluctuations in the value of these contracts are
15 Invesco Developing Markets Fund
measured by the difference in the contract date and reporting date exchange rates and are recorded as unrealized appreciation (depreciation) until the contracts are closed. When the contracts are closed, realized gains (losses) are recorded. Realized and unrealized gains (losses) on the contracts are included in the Statement of Operations. The primary risks associated with forward foreign currency contracts include failure of the Counterparty to meet the terms of the contract and the value of the foreign currency changing unfavorably. These risks may be in excess of the amounts reflected in the Statement of Assets and Liabilities.
NOTE 2—Advisory Fees and Other Fees Paid to Affiliates
The Trust has entered into a master investment advisory agreement with Invesco Advisers, Inc. (the “Adviser” or “Invesco”). Under the terms of the investment advisory agreement, the Fund pays an advisory fee to the Adviser based on the annual rate of the Fund’s average daily net assets as follows:
| | | | | | |
| Average Daily Net Assets | | Rate |
First $250 million | | | 0 | .935% | | |
Next $250 million | | | 0 | .91% | | |
Next $500 million | | | 0 | .885% | | |
Next $1.5 billion | | | 0 | .86% | | |
Next $2.5 billion | | | 0 | .835% | | |
Next $2.5 billion | | | 0 | .81% | | |
Next $2.5 billion | | | 0 | .785% | | |
Over $10 billion | | | 0 | .76% | | |
For the year ended October 31, 2014, the effective advisory fees incurred by the Fund was 0.86%.
Under the terms of a master sub-advisory agreement between the Adviser and each of Invesco Asset Management Deutschland GmbH, Invesco Asset Management Limited, Invesco Asset Management (Japan) Limited, Invesco Australia Limited, Invesco Hong Kong Limited, Invesco Senior Secured Management, Inc. and Invesco Canada Ltd. (collectively, the “Affiliated Sub-Advisers”) the Adviser, not the Fund, may pay 40% of the fees paid to the Adviser to any such Affiliated Sub-Adviser(s) that provide(s) discretionary investment management services to the Fund based on the percentage of assets allocated to such Sub-Adviser(s).
The Adviser has contractually agreed, through at least June 30, 2015, to waive advisory fees and/or reimburse expenses to the extent necessary to limit total annual fund operating expenses after fee waivers and/or reimbursements (excluding certain items discussed below) of Class A, Class B, Class C, Class Y, Class R5 and Class R6 shares to 2.25%, 3.00%, 3.00%, 2.00%, 2.00% and 2.00% of average daily net assets, respectively. In determining the Adviser’s obligation to waive advisory fees and/or reimburse expenses, the following expenses are not taken into account, and could cause total annual fund operating expenses to exceed the numbers reflected above: (1) interest; (2) taxes; (3) dividend expense on short sales; (4) extraordinary or non-routine items, including litigation expenses; and (5) expenses that the Fund has incurred but did not actually pay because of an expense offset arrangement. Unless Invesco continues the fee waiver agreement, it will terminate on June 30, 2015. The fee waiver agreement cannot be terminated during its term. The Adviser did not waive fees and/or reimburse expenses during the period under this expense limitation.
Further, the Adviser has contractually agreed, through at least June 30, 2016, to waive the advisory fee payable by the Fund in an amount equal to 100% of the net advisory fees the Adviser receives from the affiliated money market funds on investments by the Fund of uninvested cash in such affiliated money market funds.
For the year ended October 31, 2014, the Adviser waived advisory fees of $563,148.
The Trust has entered into a master administrative services agreement with Invesco pursuant to which the Fund has agreed to pay Invesco for certain administrative costs incurred in providing accounting services to the Fund. For the year ended October 31, 2014, expenses incurred under the agreement are shown in the Statement of Operations as Administrative services fees.
The Trust has entered into a transfer agency and service agreement with Invesco Investment Services, Inc. (“IIS”) pursuant to which the Fund has agreed to pay IIS a fee for providing transfer agency and shareholder services to the Fund and reimburse IIS for certain expenses incurred by IIS in the course of providing such services. IIS may make payments to intermediaries that provide omnibus account services, sub-accounting services and/or networking services. All fees payable by IIS to intermediaries that provide omnibus account services or sub-accounting are charged back to the Fund, subject to certain limitations approved by the Trust’s Board of Trustees. For the year ended October 31, 2014, expenses incurred under the agreement are shown in the Statement of Operations as Transfer agent fees.
The Trust has entered into master distribution agreements with Invesco Distributors, Inc. (“IDI”) to serve as the distributor for the Class A, Class B, Class C, Class Y, Class R5 and Class R6 shares of the Fund. The Trust has adopted plans pursuant to Rule 12b-1 under the 1940 Act with respect to the Fund’s Class A, Class B and Class C shares (collectively, the “Plans”). The Fund, pursuant to the Plans, pays IDI compensation at the annual rate of 0.25% of the Fund’s average daily net assets of Class A shares and 1.00% of the average daily net assets of Class B and Class C shares. Of the Plan payments, up to 0.25% of the average daily net assets of each class of shares may be paid to furnish continuing personal shareholder services to customers who purchase and own shares of such classes. Any amounts not paid as a service fee under the Plans would constitute an asset-based sales charge. Rules of the Financial Industry Regulatory Authority (“FINRA”) impose a cap on the total sales charges, including asset-based sales charges, that may be paid by any class of shares of the Fund. For the year ended October 31, 2014, expenses incurred under the Plans are shown in the Statement of Operations as Distribution fees.
Front-end sales commissions and CDSC (collectively, the “sales charges”) are not recorded as expenses of the Fund. Front-end sales commissions are deducted from proceeds from the sales of Fund shares prior to investment in Class A shares of the Fund. CDSC are deducted from redemption proceeds prior to remittance to the shareholder. During the year ended October 31, 2014, IDI advised the Fund that IDI retained $37,728 in front-end sales commissions from the sale of Class A shares and $1,642, $28,027 and $3,969 from Class A, Class B and Class C shares, respectively, for CDSC imposed on redemptions by shareholders.
Certain officers and trustees of the Trust are officers and directors of the Adviser, IIS and/or IDI.
16 Invesco Developing Markets Fund
NOTE 3—Additional Valuation Information
GAAP defines fair value as the price that would be received to sell an asset or paid to transfer a liability in an orderly transaction between market participants at the measurement date, under current market conditions. GAAP establishes a hierarchy that prioritizes the inputs to valuation methods, giving the highest priority to readily available unadjusted quoted prices in an active market for identical assets (Level 1) and the lowest priority to significant unobservable inputs (Level 3), generally when market prices are not readily available or are unreliable. Based on the valuation inputs, the securities or other investments are tiered into one of three levels. Changes in valuation methods may result in transfers in or out of an investment’s assigned level:
| | Level 1 — | Prices are determined using quoted prices in an active market for identical assets. |
| | Level 2 — | Prices are determined using other significant observable inputs. Observable inputs are inputs that other market participants may use in pricing a security. These may include quoted prices for similar securities, interest rates, prepayment speeds, credit risk, yield curves, loss severities, default rates, discount rates, volatilities and others. |
| | Level 3 — | Prices are determined using significant unobservable inputs. In situations where quoted prices or observable inputs are unavailable (for example, when there is little or no market activity for an investment at the end of the period), unobservable inputs may be used. Unobservable inputs reflect the Fund’s own assumptions about the factors market participants would use in determining fair value of the securities or instruments and would be based on the best available information. |
The following is a summary of the tiered valuation input levels, as of October 31, 2014. The level assigned to the securities valuations may not be an indication of the risk or liquidity associated with investing in those securities. Because of the inherent uncertainties of valuation, the values reflected in the financial statements may materially differ from the value received upon actual sale of those investments.
During the year ended October 31, 2014, there were transfers from Level 1 to Level 2 of $406,092,707 and from Level 2 to Level 1 of $366,557,537, due to foreign fair value adjustments; additionally, there were transfers from Level 1 to Level 2 of $65,965,401, due to security low volume trading.
| | | | | | | | | | | | | | | | |
| | | Level 1 | | | Level 2 | | | Level 3 | | | Total | |
Bermuda | | $ | 13,596,045 | | | $ | — | | | $ | — | | | $ | 13,596,045 | |
Brazil | | | 780,702,388 | | | | — | | | | — | | | | 780,702,388 | |
China | | | 428,131,137 | | | | 139,708,939 | | | | — | | | | 567,840,076 | |
Czech Republic | | | 21,478,992 | | | | — | | | | — | | | | 21,478,992 | |
Egypt | | | — | | | | 12,845,279 | | | | — | | | | 12,845,279 | |
Hong Kong | | | 45,070,076 | | | | — | | | | — | | | | 45,070,076 | |
Hungary | | | 48,034,370 | | | | — | | | | — | | | | 48,034,370 | |
Indonesia | | | 78,685,981 | | | | 227,782,743 | | | | — | | | | 306,468,724 | |
Israel | | | 49,016,807 | | | | 35,588,333 | | | | — | | | | 84,605,140 | |
Malaysia | | | — | | | | 64,058,221 | | | | — | | | | 64,058,221 | |
Mexico | | | 255,218,799 | | | | — | | | | — | | | | 255,218,799 | |
Nigeria | | | 56,347,882 | | | | — | | | | — | | | | 56,347,882 | |
Peru | | | 97,537,020 | | | | — | | | | — | | | | 97,537,020 | |
Philippines | | | 40,300,021 | | | | 168,022,393 | | | | — | | | | 208,322,414 | |
Russia | | | 71,714,313 | | | | 126,751,305 | | | | — | | | | 198,465,618 | |
South Africa | | | — | | | | 20,932,133 | | | | — | | | | 20,932,133 | |
South Korea | | | — | | | | 95,184,037 | | | | — | | | | 95,184,037 | |
Taiwan | | | — | | | | 99,509,159 | | | | — | | | | 99,509,159 | |
Thailand | | | — | | | | 185,486,885 | | | | — | | | | 185,486,885 | |
Turkey | | | 153,598,773 | | | | 13,213,397 | | | | — | | | | 166,812,170 | |
Turkmenistan | | | 32,664,169 | | | | — | | | | — | | | | 32,664,169 | |
United States | | | 344,996,213 | | | | — | | | | — | | | | 344,996,213 | |
Total Investments | | $ | 2,517,092,986 | | | $ | 1,189,082,824 | | | $ | — | | | $ | 3,706,175,810 | |
NOTE 4—Investments in Other Affiliates
The 1940 Act defines affiliates as those issuances in which a fund holds 5% or more of the outstanding voting securities. The Fund has not owned enough of the outstanding voting securities of the issuer to have control (as defined in the 1940 Act) of that issuer. The following is a summary of the investments in other affiliates for the year ended October 31, 2014.
| | | | | | | | | | | | | | | | | | | | | | | | | | | | |
| | | Value 10/31/13 | | | Purchases
at Cost | | | Proceeds
from Sales | | | Change in
Unrealized
Appreciation
(Depreciation) | | | Realized
Gain (Loss) | | | Value 10/31/14 | | | Dividend
Income | |
Fleury S.A. | | $ | 54,676,746 | | | $ | 11,855,824 | | | $ | — | | | $ | (8,835,290 | ) | | $ | — | | | $ | 57,697,280 | | | $ | 2,984,240 | |
NOTE 5—Expense Offset Arrangement(s)
The expense offset arrangement is comprised of transfer agency credits which result from balances in demand deposit accounts used by the transfer agent for clearing shareholder transactions. For the year ended October 31, 2014, the Fund received credits from this arrangement, which resulted in the reduction of the Fund’s total expenses of $3,830.
17 Invesco Developing Markets Fund
NOTE 6—Trustees’ and Officers’ Fees and Benefits
Trustees’ and Officers’ Fees and Benefits include amounts accrued by the Fund to pay remuneration to certain Trustees and Officers of the Fund. Trustees have the option to defer compensation payable by the Fund, and Trustees’ and Officers’ Fees and Benefits also include amounts accrued by the Fund to fund such deferred compensation amounts. Those Trustees who defer compensation have the option to select various Invesco Funds in which their deferral accounts shall be deemed to be invested. Finally, certain current Trustees were eligible to participate in a retirement plan that provided for benefits to be paid upon retirement to Trustees over a period of time based on the number of years of service. The Fund may have certain former Trustees who also participate in a retirement plan and receive benefits under such plan. Trustees’ and Officers’ Fees and Benefits include amounts accrued by the Fund to fund such retirement benefits. Obligations under the deferred compensation and retirement plans represent unsecured claims against the general assets of the Fund.
NOTE 7—Cash Balances
The Fund is permitted to temporarily carry a negative or overdrawn balance in its account with State Street Bank and Trust Company, the custodian bank. Such balances, if any at period end, are shown in the Statement of Assets and Liabilities under the payable caption Amount due custodian. To compensate the custodian bank for such overdrafts, the overdrawn Fund may either (1) leave funds as a compensating balance in the account so the custodian bank can be compensated by earning the additional interest; or (2) compensate by paying the custodian bank at a rate agreed upon by the custodian bank and Invesco, not to exceed the contractually agreed upon rate.
NOTE 8—Distributions to Shareholders and Tax Components of Net Assets
Tax Character of Distributions to Shareholders Paid During the Fiscal Years Ended October 31, 2014 and 2013:
| | | | | | | | |
| | | 2014 | | | 2013 | |
Ordinary income | | $ | 34,295,686 | | | $ | 25,011,555 | |
Long-term capital gain | | | 10,201,436 | | | | — | |
Total distributions | | $ | 44,497,122 | | | $ | 25,011,555 | |
Tax Components of Net Assets at Period-End:
| | | | |
| | | 2014 | |
Undistributed ordinary income | | $ | 44,152,586 | |
Undistributed long-term gain | | | 62,165,266 | |
Net unrealized appreciation — investments | | | 430,798,417 | |
Net unrealized appreciation (depreciation) — other investments | | | (829,896 | ) |
Temporary book/tax differences | | | (355,970 | ) |
Capital loss carryforward | | | (69,160,296 | ) |
Shares of beneficial interest | | | 3,279,660,814 | |
Total net assets | | $ | 3,746,430,921 | |
The difference between book-basis and tax-basis unrealized appreciation (depreciation) is due to differences in the timing of recognition of gains and losses on investments for tax and book purposes. The Fund’s net unrealized appreciation (depreciation) difference is attributable primarily to wash sales and passive foreign investment companies.
The temporary book/tax differences are a result of timing differences between book and tax recognition of income and/or expenses. The Fund’s temporary book/tax differences are the result of the trustee deferral of compensation and retirement plan benefits.
Capital loss carryforward is calculated and reported as of a specific date. Results of transactions and other activity after that date may affect the amount of capital loss carryforward actually available for the Fund to utilize. Capital losses generated in years beginning after December 22, 2010 can be carried forward for an unlimited period, whereas previous losses expire in 8 tax years. Capital losses with an expiration period may not be used to offset capital gains until all net capital losses without an expiration date have been utilized. Capital loss carryforwards with no expiration date will retain their character as either short-term or long-term capital losses instead of as short-term capital losses as under prior law. The ability to utilize capital loss carryforwards in the future may be limited under the Internal Revenue Code and related regulations based on the results of future transactions.
The Fund utilized $18,301,828 of capital loss carryforward in the current period to offset net realized capital gain for federal income tax purposes. The Fund has a capital loss carryforward as of October 31, 2014, which expires as follows:
| | | | | | | | | | | | |
| Capital Loss Carryforward* | |
| Expiration | | Short-Term | | | Long-Term | | | Total | |
October 31, 2017 | | $ | 69,160,296 | | | $ | — | | | $ | 69,160,296 | |
| * | Capital loss carryforward as of the date listed above is reduced for limitations, if any, to the extent required by the Internal Revenue Code and may be further limited depending upon a variety of factors, including the realization of net unrealized gains or losses as of the date of any reorganization. |
18 Invesco Developing Markets Fund
NOTE 9—Investment Securities
The aggregate amount of investment securities (other than short-term securities, U.S. Treasury obligations and money market funds, if any) purchased and sold by the Fund during the year ended October 31, 2014 was $528,227,076 and $414,804,775, respectively. Cost of investments on a tax basis includes the adjustments for financial reporting purposes as of the most recently completed federal income tax reporting period-end.
| | | | |
| Unrealized Appreciation (Depreciation) of Investment Securities on a Tax Basis | |
Aggregate unrealized appreciation of investment securities | | $ | 749,187,290 | |
Aggregate unrealized (depreciation) of investment securities | | | (318,388,873 | ) |
Net unrealized appreciation of investment securities | | $ | 430,798,417 | |
Cost of investments for tax purposes is $3,275,377,393.
NOTE 10—Reclassification of Permanent Differences
Primarily as a result of differing book/tax treatment of foreign currency transactions and passive foreign investment companies, on October 31, 2014, undistributed net investment income was increased by $1,521,108 and undistributed net realized gain (loss) was decreased by $1,521,108. This reclassification had no effect on the net assets of the Fund.
NOTE 11—Share Information
| | | | | | | | | | | | | | | | |
| | | Summary of Share Activity | |
| | | Years ended October 31, | |
| | | 2014(a) | | | 2013 | |
| | | Shares | | | Amount | | | Shares | | | Amount | |
Sold: | | | | | | | | | | | | | | | | |
Class A | | | 8,257,632 | | | $ | 273,541,592 | | | | 12,052,015 | | | $ | 405,816,341 | |
Class B | | | 10,861 | | | | 347,856 | | | | 18,996 | | | | 627,834 | |
Class C | | | 226,474 | | | | 7,313,496 | | | | 393,494 | | | | 12,925,100 | |
Class Y | | | 22,344,096 | | | | 748,475,518 | | | | 22,555,535 | | | | 762,209,002 | |
Class R5 | | | 5,637,496 | | | | 186,296,539 | | | | 7,950,954 | | | | 268,564,997 | |
Class R6 | | | 1,385,050 | | | | 46,296,571 | | | | 1,072,976 | | | | 35,481,727 | |
| | | | |
Issued as reinvestment of dividends: | | | | | | | | | | | | | | | | |
Class A | | | 486,238 | | | | 15,549,891 | | | | 290,404 | | | | 9,589,136 | |
Class B | | | 3,822 | | | | 119,198 | | | | — | | | | — | |
Class C | | | 13,377 | | | | 416,707 | | | | — | | | | — | |
Class Y | | | 424,903 | | | | 13,609,646 | | | | 195,908 | | | | 6,478,681 | |
Class R5 | | | 218,548 | | | | 6,984,793 | | | | 150,837 | | | | 4,979,131 | |
Class R6 | | | 73,819 | | | | 2,358,515 | | | | 44,064 | | | | 1,453,668 | |
| | | | |
Automatic conversion of Class B shares to Class A shares: | | | | | | | | | | | | | | | | |
Class A | | | 236,223 | | | | 7,818,467 | | | | 248,431 | | | | 8,389,944 | |
Class B | | | (243,026 | ) | | | (7,818,467 | ) | | | (255,778 | ) | | | (8,389,944 | ) |
| | | | |
Reacquired: | | | | | | | | | | | | | | | | |
Class A | | | (15,350,377 | ) | | | (513,322,521 | ) | | | (11,112,672 | ) | | | (372,618,708 | ) |
Class B | | | (239,213 | ) | | | (7,635,966 | ) | | | (311,135 | ) | | | (10,113,533 | ) |
Class C | | | (1,079,625 | ) | | | (34,395,449 | ) | | | (1,317,137 | ) | | | (42,567,096 | ) |
Class Y | | | (13,596,039 | ) | | | (449,130,514 | ) | | | (10,953,566 | ) | | | (364,097,373 | ) |
Class R5 | | | (4,914,751 | ) | | | (163,144,289 | ) | | | (4,452,673 | ) | | | (149,801,393 | ) |
Class R6 | | | (631,854 | ) | | | (21,588,882 | ) | | | (386,363 | ) | | | (13,095,721 | ) |
Net increase in share activity | | | 3,263,654 | | | $ | 112,092,701 | | | | 16,184,290 | | | $ | 555,831,793 | |
| (a) | There are entities that are record owners of more than 5% of the outstanding shares of the Fund and in the aggregate own 43% of the outstanding shares of the Fund. IDI has an agreement with these entities to sell Fund shares. The Fund, Invesco and/or Invesco affiliates may make payments to these entities, which are considered to be related to the Fund, for providing services to the Fund, Invesco and/or Invesco affiliates including but not limited to services such as securities brokerage, distribution, third party record keeping and account servicing. The Fund has no knowledge as to whether all or any portion of the shares owned of record by these entities are also owned beneficially. |
19 Invesco Developing Markets Fund
NOTE 12—Financial Highlights
The following schedule presents financial highlights for a share of the Fund outstanding throughout the periods indicated.
| | | | | | | | | | | | | | | | | | | | | | | | | | | | | | | | | | | | | | | | | | | | | | | | | | | | | | | | |
| | | Net asset
value,
beginning
of period | | | Net
investment
income(a) | | | Net gains
(losses)
on securities
(both
realized and
unrealized)(b) | | | Total from
investment
operations | | | Dividends
from net
investment
income | | | Distributions
from net
realized
gains | | | Total
distributions | | | Net asset
value, end
of period | | | Total
return(c) | | | Net assets,
end of period
(000’s omitted) | | | Ratio of
expenses
to average
net assets
with fee waivers
and/or expenses
absorbed | | | Ratio of
expenses
to average net
assets without
fee waivers
and/or expenses
absorbed | | | Ratio of net
investment
income
to average
net assets | | | Portfolio
turnover(d) | |
Class A | | | | | | | | | | | | | | | | | | | | | | | | | | | | | | | | | | | | | | | | | | | | | | | | | | | | | | | | |
Year ended 10/31/14 | | $ | 34.42 | | | $ | 0.38 | | | $ | (0.65 | ) | | $ | (0.27 | ) | | $ | (0.28 | ) | | $ | (0.10 | ) | | $ | (0.38 | ) | | $ | 33.77 | | | | (0.73 | )% | | $ | 1,251,018 | | | | 1.39 | %(e) | | | 1.41 | %(e) | | | 1.13 | %(e) | | | 13 | % |
Year ended 10/31/13 | | | 32.70 | | | | 0.30 | | | | 1.66 | | | | 1.96 | | | | (0.24 | ) | | | — | | | | (0.24 | ) | | | 34.42 | | | | 6.03 | | | | 1,494,412 | | | | 1.38 | | | | 1.40 | | | | 0.89 | | | | 14 | |
Year ended 10/31/12 | | | 30.38 | | | | 0.29 | | | | 2.86 | | | | 3.15 | | | | (0.23 | ) | | | (0.60 | ) | | | (0.83 | ) | | | 32.70 | | | | 10.72 | | | | 1,371,476 | | | | 1.44 | | | | 1.45 | | | | 0.93 | | | | 19 | |
Year ended 10/31/11 | | | 33.15 | | | | 0.36 | | | | (2.87 | ) | | | (2.51 | ) | | | (0.23 | ) | | | (0.03 | ) | | | (0.26 | ) | | | 30.38 | | | | (7.62 | ) | | | 1,388,008 | | | | 1.45 | | | | 1.47 | | | | 1.11 | | | | 17 | |
Year ended 10/31/10 | | | 25.61 | | | | 0.33 | | | | 7.54 | | | | 7.87 | | | | (0.33 | ) | | | — | | | | (0.33 | ) | | | 33.15 | | | | 31.04 | | | | 1,355,604 | | | | 1.52 | | | | 1.53 | | | | 1.17 | | | | 22 | |
Class B | | | | | | | | | | | | | | | | | | | | | | | | | | | | | | | | | | | | | | | | | | | | | | | | | | | | | | | | |
Year ended 10/31/14 | | | 33.31 | | | | 0.12 | | | | (0.61 | ) | | | (0.49 | ) | | | (0.00 | ) | | | (0.10 | ) | | | (0.10 | ) | | | 32.72 | | | | (1.46 | ) | | | 28,314 | | | | 2.14 | (e) | | | 2.16 | (e) | | | 0.38 | (e) | | | 13 | |
Year ended 10/31/13 | | | 31.66 | | | | 0.04 | | | | 1.61 | | | | 1.65 | | | | — | | | | — | | | | — | | | | 33.31 | | | | 5.21 | | | | 44,403 | | | | 2.13 | | | | 2.15 | | | | 0.14 | | | | 14 | |
Year ended 10/31/12 | | | 29.42 | | | | 0.06 | | | | 2.78 | | | | 2.84 | | | | — | | | | (0.60 | ) | | | (0.60 | ) | | | 31.66 | | | | 9.89 | | | | 59,539 | | | | 2.19 | | | | 2.20 | | | | 0.18 | | | | 19 | |
Year ended 10/31/11 | | | 32.16 | | | | 0.11 | | | | (2.78 | ) | | | (2.67 | ) | | | (0.04 | ) | | | (0.03 | ) | | | (0.07 | ) | | | 29.42 | | | | (8.30 | ) | | | 71,066 | | | | 2.20 | | | | 2.22 | | | | 0.36 | | | | 17 | |
Year ended 10/31/10 | | | 24.92 | | | | 0.12 | | | | 7.33 | | | | 7.45 | | | | (0.21 | ) | | | — | | | | (0.21 | ) | | | 32.16 | | | | 30.07 | | | | 60,657 | | | | 2.27 | | | | 2.28 | | | | 0.42 | | | | 22 | |
Class C | | | | | | | | | | | | | | | | | | | | | | | | | | | | | | | | | | | | | | | | | | | | | | | | | | | | | | | | |
Year ended 10/31/14 | | | 33.27 | | | | 0.12 | | | | (0.61 | ) | | | (0.49 | ) | | | (0.00 | ) | | | (0.10 | ) | | | (0.10 | ) | | | 32.68 | | | | (1.47 | ) | | | 137,867 | | | | 2.14 | (e) | | | 2.16 | (e) | | | 0.38 | (e) | | | 13 | |
Year ended 10/31/13 | | | 31.62 | | | | 0.04 | | | | 1.61 | | | | 1.65 | | | | — | | | | — | | | | — | | | | 33.27 | | | | 5.22 | | | | 168,313 | | | | 2.13 | | | | 2.15 | | | | 0.14 | | | | 14 | |
Year ended 10/31/12 | | | 29.38 | | | | 0.06 | | | | 2.78 | | | | 2.84 | | | | — | | | | (0.60 | ) | | | (0.60 | ) | | | 31.62 | | | | 9.90 | | | | 189,142 | | | | 2.19 | | | | 2.20 | | | | 0.18 | | | | 19 | |
Year ended 10/31/11 | | | 32.12 | | | | 0.11 | | | | (2.78 | ) | | | (2.67 | ) | | | (0.04 | ) | | | (0.03 | ) | | | (0.07 | ) | | | 29.38 | | | | (8.31 | ) | | | 213,879 | | | | 2.20 | | | | 2.22 | | | | 0.36 | | | | 17 | |
Year ended 10/31/10 | | | 24.89 | | | | 0.12 | | | | 7.32 | | | | 7.44 | | | | (0.21 | ) | | | — | | | | (0.21 | ) | | | 32.12 | | | | 30.07 | | | | 222,634 | | | | 2.27 | | | | 2.28 | | | | 0.42 | | | | 22 | |
Class Y | | | | | | | | | | | | | | | | | | | | | | | | | | | | | | | | | | | | | | | | | | | | | | | | | | | | | | | | |
Year ended 10/31/14 | | | 34.55 | | | | 0.46 | | | | (0.64 | ) | | | (0.18 | ) | | | (0.37 | ) | | | (0.10 | ) | | | (0.47 | ) | | | 33.90 | | | | (0.47 | ) | | | 1,463,586 | | | | 1.14 | (e) | | | 1.16 | (e) | | | 1.38 | (e) | | | 13 | |
Year ended 10/31/13 | | | 32.83 | | | | 0.38 | | | | 1.66 | | | | 2.04 | | | | (0.32 | ) | | | — | | | | (0.32 | ) | | | 34.55 | | | | 6.27 | | | | 1,175,003 | | | | 1.13 | | | | 1.15 | | | | 1.14 | | | | 14 | |
Year ended 10/31/12 | | | 30.50 | | | | 0.37 | | | | 2.87 | | | | 3.24 | | | | (0.31 | ) | | | (0.60 | ) | | | (0.91 | ) | | | 32.83 | | | | 11.01 | | | | 729,007 | | | | 1.19 | | | | 1.20 | | | | 1.18 | | | | 19 | |
Year ended 10/31/11 | | | 33.26 | | | | 0.44 | | | | (2.88 | ) | | | (2.44 | ) | | | (0.29 | ) | | | (0.03 | ) | | | (0.32 | ) | | | 30.50 | | | | (7.39 | ) | | | 364,320 | | | | 1.20 | | | | 1.22 | | | | 1.36 | | | | 17 | |
Year ended 10/31/10 | | | 25.66 | | | | 0.41 | | | | 7.56 | | | | 7.97 | | | | (0.37 | ) | | | — | | | | (0.37 | ) | | | 33.26 | | | | 31.41 | | | | 203,884 | | | | 1.27 | | | | 1.28 | | | | 1.42 | | | | 22 | |
Class R5 | | | | | | | | | | | | | | | | | | | | | | | | | | | | | | | | | | | | | | | | | | | | | | | | | | | | | | | | |
Year ended 10/31/14 | | | 34.52 | | | | 0.51 | | | | (0.66 | ) | | | (0.15 | ) | | | (0.40 | ) | | | (0.10 | ) | | | (0.50 | ) | | | 33.87 | | | | (0.35 | ) | | | 686,180 | | | | 0.99 | (e) | | | 1.01 | (e) | | | 1.53 | (e) | | | 13 | |
Year ended 10/31/13 | | | 32.80 | | | | 0.42 | | | | 1.67 | | | | 2.09 | | | | (0.37 | ) | | | — | | | | (0.37 | ) | | | 34.52 | | | | 6.43 | | | | 666,769 | | | | 1.01 | | | | 1.03 | | | | 1.26 | | | | 14 | |
Year ended 10/31/12 | | | 30.48 | | | | 0.42 | | | | 2.86 | | | | 3.28 | | | | (0.36 | ) | | | (0.60 | ) | | | (0.96 | ) | | | 32.80 | | | | 11.19 | | | | 513,884 | | | | 1.03 | | | | 1.04 | | | | 1.34 | | | | 19 | |
Year ended 10/31/11 | | | 33.22 | | | | 0.49 | | | | (2.87 | ) | | | (2.38 | ) | | | (0.33 | ) | | | (0.03 | ) | | | (0.36 | ) | | | 30.48 | | | | (7.24 | ) | | | 472,161 | | | | 1.02 | | | | 1.04 | | | | 1.54 | | | | 17 | |
Year ended 10/31/10 | | | 25.63 | | | | 0.48 | | | | 7.52 | | | | 8.00 | | | | (0.41 | ) | | | — | | | | (0.41 | ) | | | 33.22 | | | | 31.59 | | | | 309,491 | | | | 1.11 | | | | 1.12 | | | | 1.58 | | | | 22 | |
Class R6 | | | | | | | | | | | | | | | | | | | | | | | | | | | | | | | | | | | | | | | | | | | | | | | | | | | | | | | | |
Year ended 10/31/14 | | | 34.52 | | | | 0.52 | | | | (0.65 | ) | | | (0.13 | ) | | | (0.42 | ) | | | (0.10 | ) | | | (0.52 | ) | | | 33.87 | | | | (0.31 | ) | | | 179,467 | | | | 0.97 | (e) | | | 0.99 | (e) | | | 1.55 | (e) | | | 13 | |
Year ended 10/31/13 | | | 32.81 | | | | 0.44 | | | | 1.66 | | | | 2.10 | | | | (0.39 | ) | | | — | | | | (0.39 | ) | | | 34.52 | | | | 6.46 | | | | 154,375 | | | | 0.97 | | | | 0.99 | | | | 1.30 | | | | 14 | |
Year ended 10/31/12(f) | | | 32.73 | | | | 0.05 | | | | 0.03 | | | | 0.08 | | | | — | | | | — | | | | — | | | | 32.81 | | | | 0.24 | | | | 122,749 | | | | 0.96 | (g) | | | 0.98 | (g) | | | 1.41 | (g) | | | 19 | |
| (a) | Calculated using average shares outstanding. |
| (b) | Includes redemption fees added to shares of beneficial interest for Class A, Class B, Class C, Class Y and Class R5 shares, which were less than $0.005 per share for the fiscal years ended October 31, 2012 and prior. |
| (c) | Includes adjustments in accordance with accounting principles generally accepted in the United States of America and as such, the net asset value for financial reporting purposes and the returns based upon those net asset values may differ from the net asset value and returns for shareholder transactions. Does not include sales charges and is not annualized for periods less than one year, if applicable. |
| (d) | Portfolio turnover is calculated at the fund level and is not annualized for periods less than one year, if applicable. For the year ended October 31, 2011, the portfolio turnover calculation excludes the value of securities purchased of $179,562,130 and sold of $23,686,059 in the effort to realign the Fund’s portfolio holdings after the reorganization of Invesco Van Kampen Emerging Markets Fund into the Fund. |
| (e) | Ratios are based on average daily net assets (000’s omitted) of $1,369,496, $34,828, $148,095, $1,258,429, $681,961 and $164,979 for Class A, Class B, Class C, Class Y, Class R5 and Class R6 shares, respectively. |
| (f) | Commencement date of September 24, 2012. |
20 Invesco Developing Markets Fund
Report of Independent Registered Public Accounting Firm
To the Board of Trustees of AIM Investment Funds (Invesco Investment Funds)
and Shareholders of Invesco Developing Markets Fund:
In our opinion, the accompanying statement of assets and liabilities, including the schedule of investments, and the related statements of operations and of changes in net assets and the financial highlights present fairly, in all material respects, the financial position of Invesco Developing Markets Fund (one of the funds constituting AIM Investment Funds (Invesco Investment Funds), hereafter referred to as the “Fund”) at October 31, 2014, the results of its operations for the year then ended, the changes in its net assets for each of the two years in the period then ended and the financial highlights for each of the five years in the period then ended, in conformity with accounting principles generally accepted in the United States of America. These financial statements and financial highlights (hereafter referred to as “financial statements”) are the responsibility of the Fund’s management. Our responsibility is to express an opinion on these financial statements based on our audits. We conducted our audits of these financial statements in accordance with the standards of the Public Company Accounting Oversight Board (United States). Those standards require that we plan and perform the audit to obtain reasonable assurance about whether the financial statements are free of material misstatement. An audit includes examining, on a test basis, evidence supporting the amounts and disclosures in the financial statements, assessing the accounting principles used and significant estimates made by management, and evaluating the overall financial statement presentation. We believe that our audits, which included confirmation of securities at October 31, 2014 by correspondence with the custodian, provide a reasonable basis for our opinion.
PRICEWATERHOUSECOOPERS LLP
December 23, 2014
Houston, Texas
21 Invesco Developing Markets Fund
Calculating your ongoing Fund expenses
Example
As a shareholder of the Fund, you incur two types of costs: (1) transaction costs, which may include sales charges (loads) on purchase payments or contingent deferred sales charges on redemptions, if any; and (2) ongoing costs, including management fees, distribution and/or service (12b-1) fees, and other Fund expenses. This example is intended to help you understand your ongoing costs (in dollars) of investing in the Fund and to compare these costs with ongoing costs of investing in other mutual funds. The example is based on an investment of $1,000 invested at the beginning of the period and held for the entire period May 1, 2014 through October 31, 2014.
Actual expenses
The table below provides information about actual account values and actual expenses. You may use the information in this table, together with the amount you invested, to estimate the expenses that you paid over the period. Simply divide your account value by $1,000 (for example, an $8,600 account value divided by $1,000 = 8.6), then multiply the result by the number in the table under the heading entitled “Actual Expenses Paid During Period” to estimate the expenses you paid on your account during this period.
Hypothetical example for comparison purposes
The table below also provides information about hypothetical account values and hypothetical expenses based on the Fund’s actual expense ratio and an assumed rate of return of 5% per year before expenses, which is not the Fund’s actual return.
The hypothetical account values and expenses may not be used to estimate the actual ending account balance or expenses you paid for the period. You may use this information to compare the ongoing costs of investing in the Fund and other funds. To do so, compare this 5% hypothetical example with the 5% hypothetical examples that appear in the shareholder reports of the other funds.
Please note that the expenses shown in the table are meant to highlight your ongoing costs only and do not reflect any transaction costs, such as sales charges (loads) on purchase payments or contingent deferred sales charges on redemptions, if any. Therefore, the hypothetical information is useful in comparing ongoing costs only, and will not help you determine the relative total costs of owning different funds. In addition, if these transaction costs were included, your costs would have been higher.
| | | | | | | | | | | | | | | | | | | | | | | | |
| Class | | Beginning
Account Value
(05/01/14) | | | ACTUAL | | | HYPOTHETICAL (5% annual return before
expenses) | | | Annualized
Expense
Ratio | |
| | | Ending
Account Value (10/31/14)1 | | | Expenses
Paid During
Period2 | | | Ending
Account Value
(10/31/14) | | | Expenses
Paid During
Period2 | | |
| A | | $ | 1,000.00 | | | $ | 1,023.30 | | | $ | 7.09 | | | $ | 1,018.20 | | | $ | 7.07 | | | | 1.39 | % |
| B | | | 1,000.00 | | | | 1,019.30 | | | | 10.89 | | | | 1,014.42 | | | | 10.87 | | | | 2.14 | |
| C | | | 1,000.00 | | | | 1,019.40 | | | | 10.89 | | | | 1,014.42 | | | | 10.87 | | | | 2.14 | |
| Y | | | 1,000.00 | | | | 1,024.80 | | | | 5.82 | | | | 1,019.46 | | | | 5.80 | | | | 1.14 | |
| R5 | | | 1,000.00 | | | | 1,025.40 | | | | 5.05 | | | | 1,020.21 | | | | 5.04 | | | | 0.99 | |
| R6 | | | 1,000.00 | | | | 1,025.80 | | | | 4.95 | | | | 1,020.32 | | | | 4.94 | | | | 0.97 | |
| 1 | The actual ending account value is based on the actual total return of the Fund for the period May 1, 2014 through October 31, 2014, after actual expenses and will differ from the hypothetical ending account value which is based on the Fund’s expense ratio and a hypothetical annual return of 5% before expenses. |
| 2 | Expenses are equal to the Fund’s annualized expense ratio as indicated above multiplied by the average account value over the period, multiplied by 184/365 to reflect the most recent fiscal half year. |
22 Invesco Developing Markets Fund
Approval of Investment Advisory and Sub-Advisory Contracts
The Board of Trustees (the Board) of AIM Investment Funds (Invesco Investment Funds) is required under the Investment Company Act of 1940, as amended, to approve annually the renewal of Invesco Developing Markets Fund’s (the Fund) investment advisory agreements. During contract renewal meetings held on June 16-17, 2014, the Board as a whole, and the disinterested or “independent” Trustees, who comprise over 75% of the Board, voting separately, approved the continuance for the Fund of the Master Investment Advisory Agreement with Invesco Advisers, Inc. (Invesco Advisers and the investment advisory agreement) and the Master Intergroup Sub-Advisory Contract for Mutual Funds with Invesco Asset Management Deutschland GmbH, Invesco Asset Management Limited, Invesco Asset Management (Japan) Limited, Invesco Australia Limited, Invesco Hong Kong Limited, Invesco Senior Secured Management, Inc. and Invesco Canada Ltd. (collectively, the Affiliated Sub-Advisers and the sub-advisory contracts) for another year, effective July 1, 2014.
In evaluating the fairness and reasonableness of compensation under the Fund’s investment advisory agreement and sub-advisory contracts, the Board considered, among other things, the factors discussed below. The Board determined that the continuation of the Fund’s investment advisory agreement and the sub-advisory contracts are in the best interest of the Fund and its shareholders and that the compensation payable to Invesco Advisers and the Affiliated Sub-Advisers under the agreements is fair and reasonable.
The Board’s Fund Evaluation Process
The Board’s Investments Committee has established three Sub-Committees, each of which is primarily responsible for overseeing the management of a number of the funds advised by Invesco Advisers (the Invesco Funds). The Sub-Committees meet throughout the year to review the performance of their assigned Invesco Funds, including reviewing materials prepared under the direction of the independent Senior Officer, an officer of the Invesco Funds who reports directly to the independent Trustees. Over the course of each year, the Sub-Committees meet with portfolio managers for their assigned Invesco Funds and other members of management to review the performance, investment objective(s), policies, strategies, limitations and investment risks of these funds. The Sub-Committees meet regularly and at designated contract renewal meetings each year to conduct a review of the performance, fees, expenses and other matters related to their assigned Invesco Funds. Each Sub-Committee recommends to the Investments Committee, which in turn recommends to the full Board, whether and on what terms to approve the continuance of each Invesco Fund’s investment advisory agreement and sub-advisory contracts for another year.
During the contract renewal process, the Trustees receive comparative performance and fee data regarding the Invesco Funds prepared by Invesco Advisers and Lipper Inc. (Lipper), an independent provider of investment company data. The Trustees also receive an independent written evaluation from the Senior Officer. The Senior Officer’s evaluation is prepared as part of his responsibility to manage the process by which the Invesco Funds’ proposed management fees are negotiated during the annual contract renewal process to ensure they are negotiated in a manner that is at arms’ length and reasonable. In addition to meetings with Invesco Advisers and fund counsel, the independent Trustees also discuss the continuance of the investment advisory agreement and sub-advisory contracts in separate sessions with the Senior Officer and with independent legal counsel.
The Trustees recognized that the advisory fee rates for the Invesco Funds are, in many cases, the result of years of review and negotiation. The Trustees’ deliberations and conclusions in a particular year may be based in part on their deliberations and conclusions regarding these arrangements throughout the year and in prior years. The Trustees’ review and conclusions are based on the comprehensive consideration of all information presented to them and are not the result of any single determinative factor. Moreover, one Trustee may have weighed a particular piece of information or factor differently than another Trustee.
The discussion below serves as the Senior Officer’s independent written evaluation with respect to the Fund’s investment advisory agreement as well as a discussion of the material factors and related conclusions that formed the basis for the Board’s approval of the Fund’s investment advisory agreement and sub-advisory contracts. Unless otherwise stated, this information is current as of June 17, 2014, and may not reflect consideration of factors that became known to the Board after that date.
Factors and Conclusions and Summary of Independent Written Fee Evaluation
| A. | Nature, Extent and Quality of Services Provided by Invesco Advisers and the Affiliated Sub-Advisers |
The Board reviewed the advisory services provided to the Fund by Invesco Advisers under the Fund’s investment advisory agreement, the performance of Invesco Advisers in providing these services, and the credentials and experience of the officers and employees of Invesco Advisers who provide these services, including the Fund’s portfolio manager or managers, with whom the Sub-Committees met during the year. The Board’s review of the qualifications of Invesco Advisers to provide advisory services included the Board’s consideration of Invesco Advisers’ investment process oversight, independent credit analysis and investment risk management. The Board also
considered non-advisory services that Invesco Advisers and its affiliates provide to the Invesco Funds such as various back office support functions, equity and fixed income trading operations, internal audit, distribution and legal and compliance.
In determining whether to continue the Fund’s investment advisory agreement, the Board considered the benefits of reapproving an existing relationship and the greater uncertainty that may be associated with entering into a new relationship. The Board concluded that the nature, extent and quality of the services provided to the Fund by Invesco Advisers are appropriate and satisfactory and consistent with the terms of the Fund’s investment advisory agreement.
The Board reviewed the services that may be provided by the Affiliated Sub-Advisers under the sub-advisory contracts and the credentials and experience of the officers and employees of the Affiliated Sub-Advisers who provide these services. The Board noted that the Affiliated Sub-Advisers have offices and personnel that are located in financial centers around the world. As a result, the Affiliated Sub-Advisers can provide research and investment analysis on the markets and economies of various countries in which the Fund may invest, make recommendations regarding securities and assist with security trades. The Board concluded that the sub-advisory contracts benefit the Fund and its shareholders by permitting Invesco Advisers to use the resources and talents of the Affiliated Sub-Advisers in managing the Fund. The Board concluded that the nature, extent and quality of the services that may be provided by the Affiliated Sub-Advisers are appropriate and satisfactory and consistent with the terms of the Fund’s sub-advisory contracts.
The Board considered Fund performance as a relevant factor in considering whether to approve the investment advisory agreement. The Board did not view Fund performance as a relevant factor in considering whether to approve the sub-advisory contracts for the Fund, as no Affiliated Sub-Adviser currently manages assets of the Fund.
The Board compared the Fund’s performance during the past one, three and five calendar years to the performance of funds in the Lipper performance universe and against the Lipper Emerging Market Funds Index. The Board noted that performance of Class A shares of the Fund was in the fourth quintile of the performance universe for the one year period and the first quintile for the three and five year periods (the first quintile being the best performing funds and the fifth quintile being the worst performing funds). The Board noted that performance of Class A shares of the Fund was below the performance of the Index for the one year period and above the performance of the Index for the
23 Invesco Developing Markets Fund
three and five year periods. The Trustees also reviewed more recent Fund performance and this review did not change their conclusions.
| C. | Advisory and Sub-Advisory Fees |
The Board compared the Fund’s contractual management fee rate to the contractual management fee rates of funds in the Fund’s Lipper expense group at a common asset level. The Board noted that the contractual management fee rate for Class A shares of the Fund was below the median contractual management fee rate of funds in the expense group. The Board noted that the term “contractual management fee” may include both advisory and certain administrative services fees, but that Lipper does not provide information on a fund by fund basis as to what is included. The Board noted that Invesco does not charge the Invesco Funds for the administrative services included in the term as defined by Lipper. The Board also reviewed the methodology used by Lipper in providing expense group information, which includes using each fund’s contractual management fee schedule (including any applicable breakpoints) as reported in the most recent prospectus or statement of additional information for each fund in the expense group.
The Board noted that Invesco Advisers has contractually agreed to waive fees and/or limit expenses of the Fund through at least June 30, 2015 in an amount necessary to limit total annual operating expenses to a specified percentage of average daily net assets for each class of the Fund.
The Board also compared the Fund’s effective advisory fee rate (the advisory fee rate after advisory fee waivers and before other expense limitations/waivers) to the effective advisory fee rates of other mutual funds advised by Invesco Advisers and its affiliates that are managed using an investment process substantially similar to the investment process used for the Fund. The Board noted that the Fund’s effective advisory fee rate was below the effective advisory fee rate of two mutual funds advised by Invesco Advisers using a similar investment process.
The Board also considered the fees charged by Invesco Advisers and the Affiliated Sub-Advisers to other client accounts that are managed using an investment process substantially similar to the investment process used for the Fund. The Board noted that Invesco Advisers or the Affiliated Sub-Advisers may charge lower fees to large institutional clients. Invesco Advisers reviewed with the Board the significantly greater scope of services it provides to the Invesco Funds relative to certain other client accounts. These additional services include provision of administrative services, officers and office space, oversight of service providers, preparation of annual registration statement updates and financial information and regulatory compliance under the Investment Company Act of 1940, as amended. Invesco Advisers also reviewed generally the higher frequency of shareholder purchases and redemptions in the Invesco Funds relative to the flow of assets for other client accounts. Invesco Advisers advised the Board that advance notice of
redemptions is often provided to Invesco Advisers by institutional clients. The Board did note that sub-advisory fee rates charged by the Affiliated Sub-Advisers to manage the Invesco Funds and to manage other client accounts tended to be more comparable, reflecting a more comparable scope of services. The Board concluded that the aggregate services provided to the Invesco Funds were sufficiently different from those provided to institutional clients to support the difference in fees.
The Board also considered the services that may be provided by the Affiliated Sub-Advisers pursuant to the sub-advisory contracts, as well as the fees payable by Invesco Advisers to the Affiliated Sub-Advisers pursuant to the sub-advisory contracts. The Board also noted that the sub-advisory fees are not paid directly by the Fund, but rather, are payable by Invesco Advisers to the Affiliated Sub-Advisers.
| D. | Economies of Scale and Breakpoints |
The Board considered the extent to which there are economies of scale in the provision of advisory services to the Fund. The Board also considered whether the Fund benefits from economies of scale through contractual breakpoints in the Fund’s advisory fee schedule and was assisted in this review by a report from the Senior Officer. The Board also noted that the Fund shares directly in economies of scale through lower fees charged by third party service providers based on the combined size of the Invesco Funds and other clients advised by Invesco Advisers.
| E. | Profitability and Financial Resources |
The Board reviewed information from Invesco Advisers concerning the costs of the advisory and other services that Invesco Advisers and its affiliates provide to the Fund and the profitability of Invesco Advisers and its affiliates in providing these services for the year ended December 31, 2013. The Board received information from Invesco Advisers about the methodology used to prepare the profitability information. The Board considered the profitability of Invesco Advisers in managing the Fund and the Invesco Funds. The Board noted that Invesco Advisers continues to operate at a net profit from services Invesco Advisers and its subsidiaries provide to the Invesco Funds and the Fund. The Board did not deem the level of profits realized by Invesco Advisers and its affiliates from providing services to the Fund to be excessive given the nature, quality and extent of the services provided to the Invesco Funds. The Board received and accepted information from Invesco Advisers demonstrating that Invesco Advisers and each Affiliated Sub-Adviser are financially sound and have the resources necessary to perform their obligations under the investment advisory agreement and sub-advisory contracts.
| F. | Collateral Benefits to Invesco Advisers and its Affiliates |
The Board considered various other benefits received by Invesco Advisers and its affiliates from the relationship with the Fund, including the fees received for their provision of transfer agency and distribution services to the Fund. The
Board considered comparative information regarding fees charged for these services, including information provided by Lipper and other independent sources. The Board considered the performance of Invesco Advisers and its affiliates in providing these services and the organizational structure employed to provide these services. The Board also considered that these services are provided to the Fund pursuant to written contracts that are reviewed and approved on an annual basis by the Board; that the services are required for the operation of the Fund; that Invesco Advisers and its affiliates can provide services, the nature and quality of which are at least equal to those provided by others offering the same or similar services; and that the fees for such services are fair and reasonable in light of the usual and customary charges by others for services of the same nature and quality.
The Board considered the benefits realized by Invesco Advisers and the Affiliated Sub-Advisers as a result of portfolio brokerage transactions executed through “soft dollar” arrangements. The Board noted that soft dollar arrangements shift the payment obligation for research services from Invesco Advisers and the Affiliated Sub-Advisers to the Invesco Funds and that the research received may be used with other clients of Invesco Advisers and may reduce Invesco Advisers’ and the Affiliated Sub-Advisers’ expenses. The Board also considered that it receives periodic reports from the Chief Compliance Officer of the Invesco Funds demonstrating that these arrangements are consistent with regulatory requirements. The Board did not deem the soft dollar arrangements to be inappropriate.
The Board considered that the Fund’s uninvested cash and cash collateral from any securities lending arrangements may be invested in money market funds advised by Invesco Advisers pursuant to procedures approved by the Board. The Board noted that Invesco Advisers receives advisory fees from these affiliated money market funds attributable to such investments, although Invesco Advisers has contractually agreed to waive through varying periods the advisory fees payable by the Invesco Funds with respect to investments in the affiliated money market funds. The waiver is in an amount equal to 100% of the net advisory fee Invesco Advisers receives from the affiliated money market funds with respect to the Fund’s investment in the affiliated money market funds of uninvested cash, but not cash collateral. The Board concluded that the amount of advisory fees received by Invesco Advisors from the Fund’s investment of uninvested cash and cash collateral from any securities lending arrangements in the affiliated money market funds are fair and reasonable.
The Board also considered the Fund may use an affiliated broker to execute certain trades for the Fund to among other things, control information leakage, and were advised that such trades would be executed in compliance with rules under the Investment Company Act of 1940, as amended.
24 Invesco Developing Markets Fund
Tax Information
Form 1099-DIV, Form 1042-S and other year–end tax information provide shareholders with actual calendar year amounts that should be included in their tax returns. Shareholders should consult their tax advisors.
The following distribution information is being provided as required by the Internal Revenue Code or to meet a specific state’s requirement.
The Fund designates the following amounts or, if subsequently determined to be different, the maximum amount allowable for its fiscal year ended October 31, 2014:
| | | | |
Federal and State Income Tax | |
Long-Term Capital Gain Distributions | | $ | 10,201,436 | |
Qualified Dividend Income* | | | 100 | % |
Corporate Dividends Received Deduction* | | | 0 | % |
U.S. Treasury Obligations* | | | 0 | % |
Foreign Taxes | | $ | 0.0884 | per share |
Foreign Source Income | | $ | 0.9147 | per share |
| | * | The above percentages are based on ordinary income dividends paid to shareholders during the Fund’s fiscal year. |
25 Invesco Developing Markets Fund
Trustees and Officers
The address of each trustee and officer is AIM Investment Funds (Invesco Investment Funds) (the “Trust”), 11 Greenway Plaza, Suite 1000, Houston, Texas 77046-1173. The trustees serve for the life of the Trust, subject to their earlier death, incapacitation, resignation, retirement or removal as more specifically provided in the Trust’s organizational documents. Each officer serves for a one year term or until their successors are elected and qualified. Column two below includes length of time served with predecessor entities, if any.
| | | | | | | | |
Name, Year of Birth and Position(s) Held with the Trust | | Trustee and/
or Officer Since | | Principal Occupation(s) During Past 5 Years | | Number of Funds in Fund Complex Overseen by Trustee | | Other Directorship(s) Held by Trustee During Past 5 Years |
| Interested Persons | | | | | | | | |
| Martin L. Flanagan1 — 1960 Trustee | | 2007 | | Executive Director, Chief Executive Officer and President, Invesco Ltd. (ultimate parent of Invesco and a global investment management firm); Advisor to the Board, Invesco Advisers, Inc. (formerly known as Invesco Institutional (N.A.), Inc.); Trustee, The Invesco Funds; Vice Chair, Investment Company Institute; and Member of Executive Board, SMU Cox School of Business Formerly: Chairman and Chief Executive Officer, Invesco Advisers, Inc. (registered investment adviser); Director, Chairman, Chief Executive Officer and President, IVZ Inc. (holding company), INVESCO Group Services, Inc. (service provider) and Invesco North American Holdings, Inc. (holding company); Director, Chief Executive Officer and President, Invesco Holding Company Limited (parent of Invesco and a global investment management firm); Director, Invesco Ltd.; Chairman, Investment Company Institute and President, Co-Chief Executive Officer, Co-President, Chief Operating Officer and Chief Financial Officer, Franklin Resources, Inc. (global investment management organization). | | 144 | | None |
Philip A. Taylor2 — 1954 Trustee, President and Principal Executive Officer | | 2006 | | Head of North American Retail and Senior Managing Director, Invesco Ltd.; Director, Co-Chairman, Co-President and Co-Chief Executive Officer, Invesco Advisers, Inc. (formerly known as Invesco Institutional (N.A.), Inc.) (registered investment adviser); Director, Chairman, Chief Executive Officer and President, Invesco Management Group, Inc. (formerly known as Invesco Aim Management Group, Inc.) (financial services holding company); Director and President, INVESCO Funds Group, Inc. (registered investment adviser and registered transfer agent); Director and Chairman, Invesco Investment Services, Inc. (formerly known as Invesco Aim Investment Services, Inc.) (registered transfer agent) and IVZ Distributors, Inc. (formerly known as INVESCO Distributors, Inc.) (registered broker dealer); Director, President and Chairman, Invesco Inc. (holding company) and Invesco Canada Holdings Inc. (holding company); Chief Executive Officer, Invesco Corporate Class Inc. (corporate mutual fund company) and Invesco Canada Fund Inc. (corporate mutual fund company); Director, Chairman and Chief Executive Officer, Invesco Canada Ltd. (formerly known as Invesco Trimark Ltd./Invesco Trimark Ltèe) (registered investment adviser and registered transfer agent); Trustee, President and Principal Executive Officer, The Invesco Funds (other than AIM Treasurer’s Series Trust (Invesco Treasurer’s Series Trust) and Short-Term Investments Trust); Trustee and Executive Vice President, The Invesco Funds (AIM Treasurer’s Series Trust (Invesco Treasurer’s Series Trust) and Short-Term Investments Trust only); Director, Invesco Investment Advisers LLC (formerly known as Van Kampen Asset Management); Director, Chief Executive Officer and President, Van Kampen Exchange Corp. Formerly: Director and Chairman, Van Kampen Investor Services Inc.; Director, Chief Executive Officer and President, 1371 Preferred Inc. (holding company) and Van Kampen Investments Inc.; Director and President, AIM GP Canada Inc. (general partner for limited partnerships) and Van Kampen Advisors, Inc.; Director and Chief Executive Officer, Invesco Trimark Dealer Inc. (registered broker dealer); Director, Invesco Distributors, Inc. (formerly known as Invesco Aim Distributors, Inc.) (registered broker dealer); Manager, Invesco PowerShares Capital Management LLC; Director, Chief Executive Officer and President, Invesco Advisers, Inc.; Director, Chairman, Chief Executive Officer and President, Invesco Aim Capital Management, Inc.; President, Invesco Trimark Dealer Inc. and Invesco Trimark Ltd./Invesco Trimark Ltèe; Director and President, AIM Trimark Corporate Class Inc. and AIM Trimark Canada Fund Inc.; Senior Managing Director, Invesco Holding Company Limited; Director and Chairman, Fund Management Company (former registered broker dealer); President and Principal Executive Officer, The Invesco Funds (AIM Treasurer’s Series Trust (Invesco Treasurer’s Series Trust), and Short-Term Investments Trust only); President, AIM Trimark Global Fund Inc. and AIM Trimark Canada Fund Inc. | | 144 | | None |
Wayne W. Whalen3 — 1939 Trustee | | 2010 | | Of Counsel, and prior to 2010, partner in the law firm of Skadden, Arps, Slate, Meagher & Flom LLP, legal counsel to certain funds in the Fund Complex | | 144 | | Director of the Mutual fund Directors Forum, a nonprofit membership organization for investment directors; Chairman and Director of the Abraham Lincoln Presidential Library Foundation; and Director of the Stevenson Center for Democracy |
| 1 | Mr. Flanagan is considered an interested person (within the meaning of Section 2(a)(19) of the 1940 Act) of the Trust because he is an officer of the Adviser to the Trust, and an officer and a director of Invesco Ltd., ultimate parent of the Adviser. |
| 2 | Mr. Taylor is considered an interested person (within the meaning of Section 2(a)(19) of the 1940 Act) of the Trust because he is an officer and a director of the Adviser. |
| 3 | Mr. Whalen is retiring effective December 31, 2014. He has been deemed to be an interested person of the Trust because of his prior service as counsel to the predecessor funds of certain Invesco open-end funds and his affiliation with the law firm that served as counsel to such predecessor funds and the Invesco closed-end funds. |
T-1 Invesco Developing Markets Fund
Trustees and Officers—(continued)
| | | | | | | | |
Name, Year of Birth and Position(s) Held with the Trust | | Trustee and/
or Officer Since | | Principal Occupation(s) During Past 5 Years | | Number of Funds in Fund Complex Overseen by Trustee | | Other Directorship(s) Held by Trustee During Past 5 Years |
| Independent Trustees | | | | | | | | |
Bruce L. Crockett — 1944 Trustee and Chair | | 2001 | | Chairman, Crockett Technologies Associates (technology consulting company) Formerly: Director, Captaris (unified messaging provider); Director, President and Chief Executive Officer, COMSAT Corporation; Chairman, Board of Governors of INTELSAT (international communications company); ACE Limited (insurance company); and Investment Company Institute | | 144 | | ALPS (Attorneys Liability Protection Society) (insurance company) |
David C. Arch — 1945 Trustee | | 2010 | | Chairman of Blistex Inc., a consumer health care products manufacturer | | 144 | | Board member of the Illinois Manufacturers’ Association; Member of the Board of Visitors, Institute for the Humanities, University of Michigan; Member of the Audit Committee of the Edward-Elmhurst Hospital |
Frank S. Bayley — 1939 Trustee | | 1987 | | Retired. Formerly: Director, Badgley Funds Inc. (registered investment company) (2 portfolios) and General Partner and Of Counsel, law firm of Baker & McKenzie, LLP | | 144 | | Director and Chairman, C.D. Stimson Company (a real estate investment company); Trustee, The Curtis Institute of Music |
James T. Bunch — 1942 Trustee | | 2003 | | Managing Member, Grumman Hill Group LLC (family office private equity investments) Formerly: Founder, Green Manning & Bunch Ltd. (investment banking firm) (1988-2010); Executive Committee, United States Golf Association; and Director, Policy Studies, Inc. and Van Gilder Insurance Corporation | | 144 | | Chairman, Board of Governors, Western Golf Association; Chairman, Evans Scholars Foundation; and Director, Denver Film Society |
Rodney F. Dammeyer — 1940 Trustee | | 2010 | | Chairman of CAC,LLC, (private company offering capital investment and management advisory services) Formerly: Prior to 2001, Managing Partner at Equity Group Corporate Investments; Prior to 1995, Chief Executive Officer of Itel Corporation (formerly Anixter International); Prior to 1985, experience includes Senior Vice President and Chief Financial Officer of Household International, Inc., Executive Vice President and Chief Financial Officer of Northwest Industries, Inc. and Partner of Arthur Andersen & Co.; From 1987 to 2010, Director/Trustee of investment companies in the Van Kampen Funds complex | | 144 | | Director of Quidel Corporation and Stericycle, Inc. |
Albert R. Dowden — 1941 Trustee | | 2001 | | Director of a number of public and private business corporations, including the Boss Group, Ltd. (private investment and management); Nature’s Sunshine Products, Inc. and Reich & Tang Funds (5 portfolios) (registered investment company) Formerly: Director, Homeowners of America Holding Corporation/Homeowners of America Insurance Company (property casualty company); Director, Continental Energy Services, LLC (oil and gas pipeline service); Director, CompuDyne Corporation (provider of product and services to the public security market) and Director, Annuity and Life Re (Holdings), Ltd. (reinsurance company); Director, President and Chief Executive Officer, Volvo Group North America, Inc.; Senior Vice President, AB Volvo; Director of various public and private corporations; Chairman, DHJ Media, Inc.; Director, Magellan Insurance Company; and Director, The Hertz Corporation, Genmar Corporation (boat manufacturer), National Media Corporation; Advisory Board of Rotary Power International (designer, manufacturer, and seller of rotary power engines); and Chairman, Cortland Trust, Inc. (registered investment company) | | 144 | | Director of: Nature’s Sunshine Products, Inc., Reich & Tang Funds, Homeowners of America Holding Corporation/ Homeowners of America Insurance Company, the Boss Group |
Jack M. Fields — 1952 Trustee | | 2001 | | Chief Executive Officer, Twenty First Century Group, Inc. (government affairs company); Owner and Chief Executive Officer, Dos Angeles Ranch, L.P. (cattle, hunting, corporate entertainment); and Discovery Global Education Fund (non-profit) Formerly: Chief Executive Officer, Texana Timber LP (sustainable forestry company); Director of Cross Timbers Quail Research Ranch (non-profit); and member of the U.S. House of Representatives | | 144 | | Insperity, Inc. (formerly known as Administaff) |
Prema Mathai-Davis — 1950 Trustee | | 2001 | | Retired. Formerly: Chief Executive Officer, YWCA of the U.S.A. | | 144 | | None |
Larry Soll — 1942 Trustee | | 2003 | | Retired. Formerly: Chairman, Chief Executive Officer and President, Synergen Corp. (a biotechnology company) | | 144 | | None |
Hugo F. Sonnenschein — 1940 Trustee | | 2010 | | President Emeritus and Honorary Trustee of the University of Chicago and the Adam Smith Distinguished Service Professor in the Department of Economics at the University of Chicago. Prior to 2000, President of the University of Chicago | | 144 | | Trustee of the University of Rochester and a member of its investment committee; Member of the National Academy of Sciences and the American Philosophical Society; Fellow of the American Academy of Arts and Sciences |
T-2 Invesco Developing Markets Fund
Trustees and Officers—(continued)
| | | | | | | | |
Name, Year of Birth and Position(s) Held with the Trust | | Trustee and/
or Officer Since | | Principal Occupation(s) During Past 5 Years | | Number of Funds in Fund Complex Overseen by Trustee | | Other Directorship(s) Held by Trustee During Past 5 Years |
| Independent Trustees—(continued) |
Raymond Stickel, Jr. — 1944 Trustee | | 2005 | | Retired. Formerly: Director, Mainstay VP Series Funds, Inc. (25 portfolios) and Partner, Deloitte & Touche | | 144 | | None |
Suzanne H. Woolsey — 1941 Trustee | | 2014 | | Chief Executive Officer of Woolsey Partners LLC | | 144 | | Emeritus Chair of the Board of Trustees of the Institute for Defense Analyses; Trustee of Colorado College; Trustee of California Institute of Technology; Prior to 2014, Director of Fluor Corp.; Prior to 2010, Trustee of the German Marshall Fund of the United States; Prior to 2010 Trustee of the Rocky Mountain Institute |
| Other Officers | | | | | | | | |
Russell C. Burk — 1958 Senior Vice President and Senior Officer | | 2005 | | Senior Vice President and Senior Officer, The Invesco Funds | | N/A | | N/A |
John M. Zerr — 1962 Senior Vice President, Chief Legal Officer and Secretary | | 2006 | | Director, Senior Vice President, Secretary and General Counsel, Invesco Management Group, Inc. (formerly known as Invesco Aim Management Group, Inc.) and Van Kampen Exchange Corp.; Senior Vice President, Invesco Advisers, Inc. (formerly known as Invesco Institutional (N.A.), Inc.) (registered investment adviser); Senior Vice President and Secretary, Invesco Distributors, Inc. (formerly known as Invesco Aim Distributors, Inc.); Director, Vice President and Secretary, Invesco Investment Services, Inc. (formerly known as Invesco Aim Investment Services, Inc.) and IVZ Distributors, Inc. (formerly known as INVESCO Distributors, Inc.); Director and Vice President, INVESCO Funds Group, Inc.; Senior Vice President, Chief Legal Officer and Secretary, The Invesco Funds; Manager, Invesco PowerShares Capital Management LLC; Director, Secretary and General Counsel, Invesco Investment Advisers LLC (formerly known as Van Kampen Asset Management); Secretary and General Counsel, Invesco Capital Markets, Inc. (formerly known as Van Kampen Funds Inc.) and Chief Legal Officer, PowerShares Exchange-Traded Fund Trust, PowerShares Exchange-Traded Fund Trust II, PowerShares India Exchange-Traded Fund Trust, PowerShares Actively Managed Exchange-Traded Fund Trust; and PowerShares Actively Managed Exchange-Traded Commodity Fund Trust Formerly: Director and Vice President, Van Kampen Advisors Inc.; Director, Vice President, Secretary and General Counsel, Van Kampen Investor Services Inc.; Director, Invesco Distributors, Inc. (formerly known as Invesco Aim Distributors, Inc.); Director, Senior Vice President, General Counsel and Secretary, Invesco Aim Advisers, Inc. and Van Kampen Investments Inc.; Director, Vice President and Secretary, Fund Management Company; Director, Senior Vice President, Secretary, General Counsel and Vice President, Invesco Aim Capital Management, Inc.; Chief Operating Officer and General Counsel, Liberty Ridge Capital, Inc. (an investment adviser); Vice President and Secretary, PBHG Funds (an investment company) and PBHG Insurance Series Fund (an investment company); Chief Operating Officer, General Counsel and Secretary, Old Mutual Investment Partners (a broker-dealer); General Counsel and Secretary, Old Mutual Fund Services (an administrator) and Old Mutual Shareholder Services (a shareholder servicing center); Executive Vice President, General Counsel and Secretary, Old Mutual Capital, Inc. (an investment adviser); and Vice President and Secretary, Old Mutual Advisors Funds (an investment company) | | N/A | | N/A |
Sheri Morris — 1964 Vice President, Treasurer and Principal Financial Officer | | 1999 | | Vice President, Treasurer and Principal Financial Officer, The Invesco Funds; Vice President, Invesco Advisers, Inc. (formerly known as Invesco Institutional (N.A.), Inc.) (registered investment adviser); and Vice President, PowerShares Exchange-Traded Fund Trust, PowerShares Exchange-Traded Fund Trust II, PowerShares India Exchange-Traded Fund Trust, PowerShares Actively Managed Exchange-Traded Fund Trust, and PowerShares Actively Managed Exchange-Traded Commodity Fund Trust Formerly: Vice President, Invesco Aim Advisers, Inc., Invesco Aim Capital Management, Inc. and Invesco Aim Private Asset Management, Inc.; Assistant Vice President and Assistant Treasurer, The Invesco Funds and Assistant Vice President, Invesco Advisers, Inc., Invesco Aim Capital Management, Inc. and Invesco Aim Private Asset Management, Inc.; and Treasurer, PowerShares Exchange-Traded Fund Trust, PowerShares Exchange-Traded Fund Trust II, PowerShares India Exchange-Traded Fund Trust and PowerShares Actively Managed Exchange-Traded Fund Trust | | N/A | | N/A |
T-3 Invesco Developing Markets Fund
Trustees and Officers—(continued)
| | | | | | | | |
Name, Year of Birth and Position(s) Held with the Trust | | Trustee and/
or Officer Since | | Principal Occupation(s) During Past 5 Years | | Number of Funds in Fund Complex Overseen by Trustee | | Other Directorship(s) Held by Trustee During Past 5 Years |
| Other Officers—(continued) | | | | | | | | |
Karen Dunn Kelley — 1960 Vice President | | 2004 | | Senior Managing Director, Investments; Director, Co-President, Co-Chief Executive Officer, and Co-Chairman, Invesco Advisers, Inc. (formerly known as Invesco Institutional (N.A.), Inc.) (registered investment adviser); Chairman, Invesco Senior Secured Management, Inc.; Senior Vice President, Invesco Management Group, Inc. (formerly known as Invesco Aim Management Group, Inc.); Executive Vice President, Invesco Distributors, Inc. (formerly known as Invesco Aim Distributors, Inc.); Director, Invesco Mortgage Capital Inc. and Invesco Management Company Limited; Director and President, INVESCO Asset Management (Bermuda) Ltd., Vice President, The Invesco Funds (other than AIM Treasurer’s Series Trust (Invesco Treasurer’s Series Trust) and Short-Term Investments Trust); and President and Principal Executive Officer, The Invesco Funds (AIM Treasurer’s Series Trust (Invesco Treasurer’s Series Trust) and Short-Term Investments Trust only) Formerly: Director, INVESCO Global Asset Management Limited and INVESCO Management S.A.; Senior Vice President, Van Kampen Investments Inc. and Invesco Advisers, Inc. (formerly known as Invesco Institutional (N.A.), Inc.) (registered investment adviser); Vice President, Invesco Advisers, Inc. (formerly known as Invesco Institutional (N.A.), Inc.); Director of Cash Management and Senior Vice President, Invesco Advisers, Inc. and Invesco Aim Capital Management, Inc.; Director and President, Fund Management Company; Chief Cash Management Officer, Director of Cash Management, Senior Vice President, and Managing Director, Invesco Aim Capital Management, Inc.; Director of Cash Management, Senior Vice President, and Vice President, Invesco Advisers, Inc. and The Invesco Funds (AIM Treasurer’s Series Trust (Invesco Treasurer’s Series Trust), and Short-Term Investments Trust only) | | N/A | | N/A |
Crissie M. Wisdom — 1969 Anti-Money Laundering Compliance Officer | | 2013 | | Anti-Money Laundering Compliance Officer, Invesco Advisers, Inc. (formerly known as Invesco Institutional (N.A.), Inc.) (registered investment adviser), Invesco Capital Markets, Inc. (formerly known as Van Kampen Funds Inc.), Invesco Distributors, Inc., Invesco Investment Services, Inc., Invesco Management Group, Inc., Van Kampen Exchange Corp., The Invesco Funds, and PowerShares Exchange-Traded Fund Trust, PowerShares Exchange-Traded Fund Trust II, PowerShares India Exchange-Traded Fund Trust, PowerShares Actively Managed Exchange-Traded Fund Trust and PowerShares Actively Managed Exchange-Traded Commodity Fund Trust; and Fraud Prevention Manager and Controls and Risk Analysis Manager for Invesco Investment Services, Inc. | | N/A | | N/A |
Todd L. Spillane — 1958 Chief Compliance Officer | | 2006 | | Senior Vice President, Invesco Management Group, Inc. (formerly known as Invesco Aim Management Group, Inc.) and Van Kampen Exchange Corp.; Senior Vice President and Chief Compliance Officer, Invesco Advisers, Inc. (registered investment adviser) (formerly known as Invesco Institutional (N.A.), Inc.); Chief Compliance Officer, The Invesco Funds; Vice President, Invesco Distributors, Inc. (formerly known as Invesco Aim Distributors, Inc.) and Invesco Investment Services, Inc. (formerly known as Invesco Aim Investment Services, Inc.) Formerly: Chief Compliance Officer, Invesco Funds (Chicago); Senior Vice President, Van Kampen Investments Inc.; Senior Vice President and Chief Compliance Officer, Invesco Aim Advisers, Inc. and Invesco Aim Capital Management, Inc.; Chief Compliance Officer, INVESCO Private Capital Investments, Inc. (holding company), Invesco Private Capital, Inc. (registered investment adviser), Invesco Global Asset Management (N.A.), Inc., Invesco Senior Secured Management, Inc. (registered investment adviser), Van Kampen Investor Services Inc., PowerShares Exchange-Traded Fund Trust, PowerShares Exchange-Traded Fund Trust II, PowerShares India Exchange-Traded Fund Trust and PowerShares Actively Managed Exchange-Traded Fund Trust; and Vice President, Invesco Aim Capital Management, Inc. and Fund Management Company | | N/A | | N/A |
The Statement of Additional Information of the Trust includes additional information about the Fund’s Trustees and is available upon request, without charge, by calling 1.800.959.4246. Please refer to the Fund’s prospectus for information on the Fund’s sub-advisers.
| | | | | | |
Office of the Fund 11 Greenway Plaza, Suite 1000 Houston, TX 77046-1173 | | Investment Adviser Invesco Advisers, Inc. 1555 Peachtree Street, N.E. Atlanta, GA 30309 | | Distributor Invesco Distributors, Inc. 11 Greenway Plaza, Suite 1000 Houston, TX 77046-1173 | | Auditors PricewaterhouseCoopers LLP 1000 Louisiana Street, Suite 5800 Houston, TX 77002-5678 |
| | | |
| | | | | | |
Counsel to the Fund Stradley Ronon Stevens & Young, LLP 2005 Market Street, Suite 2600 Philadelphia, PA 19103-7018 | | Counsel to the Independent Trustees Goodwin Procter LLP 901 New York Avenue, N.W. Washington, D.C. 20001 | | Transfer Agent Invesco Investment Services, Inc. 11 Greenway Plaza, Suite 1000 Houston, TX 77046-1173 | | Custodian State Street Bank and Trust Company 225 Franklin Street Boston, MA 02110-2801 |
T-4 Invesco Developing Markets Fund

Invesco mailing information
Send general correspondence to Invesco Investment Services, Inc., P.O. Box 219078, Kansas City, MO 64121-9078.
Important notice regarding delivery of security holder documents
To reduce Fund expenses, only one copy of most shareholder documents may be mailed to shareholders with multiple accounts at the same address (Householding). Mailing of your shareholder documents may be householded indefinitely unless you instruct us otherwise. If you do not want the mailing of these documents to be combined with those for other members of your household, please contact Invesco Investment Services, Inc. at 800 959 4246 or contact your financial institution. We will begin sending you individual copies for each account within 30 days after receiving your request.
Fund holdings and proxy voting information
The Fund provides a complete list of its holdings four times in each fiscal year, at the quarter ends. For the second and fourth quarters, the lists appear in the Fund’s semiannual and annual reports to shareholders. For the first and third quarters, the Fund files the lists with the Securities and Exchange Commission (SEC) on Form N-Q. The most recent list of portfolio holdings is available at invesco.com/completeqtrholdings. Shareholders can also look up the Fund’s Forms N-Q on the SEC website at sec.gov. Copies of the Fund’s Forms N-Q may be reviewed and copied at the SEC Public Reference Room in Washington, D.C. You can obtain information on the operation of the Public Reference Room, including information about duplicating fee charges, by calling 202 551 8090 or 800 732 0330, or by electronic request at the following email address: publicinfo@sec.gov. The SEC file numbers for the Fund are shown below.
A description of the policies and procedures that the Fund uses to determine how to vote proxies relating to portfolio securities is available without charge, upon request, from our Client Services department at 800 959 4246 or at invesco.com/proxyguidelines. The information is also available on the SEC website, sec.gov.
| | |
Information regarding how the Fund voted proxies related to its portfolio securities during the most recent 12-month period ended June 30 is available at invesco.com/proxysearch. The information is also available on the SEC website, sec.gov. Invesco Advisers, Inc. is an investment adviser; it provides investment advisory services to individual and institutional clients and does not sell securities. Invesco Distributors, Inc. is the US distributor for Invesco Ltd.’s retail mutual funds, exchange-traded funds and institutional money market funds. Both are wholly owned, indirect subsidiaries of Invesco Ltd. | |  |
| | | | |
| SEC file numbers: 811-05426 and 033-19338 | | DVM-AR-1 | | Invesco Distributors, Inc. |
Letters to Shareholders
| | |

Philip Taylor | | Dear Shareholders: This annual report includes information about your Fund, including performance data and a complete list of its investments as of the close of the reporting period. Inside, your Fund’s portfolio managers discuss how they managed your Fund and the factors that affected its performance during the reporting period. I hope you find this report of interest. During the reporting period covered by this report, the US economy showed signs of continued improvement. After contracting in the first quarter of 2014, the economy expanded strongly in the second quarter and unemployment trended lower. Much of the credit for this improvement goes to the US Federal Reserve (the Fed), which undertook an extraordinary asset purchase program following the global financial crisis. The Fed’s goal was to jumpstart the economy by encouraging banks to lend more, businesses to hire more and consumers to spend more. Signs of a stronger US economy prompted the Fed to reduce, or “taper,” its asset purchase program. Despite this, interest rates remained near historical low levels due largely |
| to heavy investor demand for bonds. While signs of economic improvement were evident in the US, European economies showed signs of weakening. That, together with geopolitical uncertainty and worries about the first diagnosed cases of Ebola outside of Africa, caused increased volatility in US and European equities. |
Extended periods of market strength can lull investors into complacency – just as prolonged periods of market weakness or volatility can discourage investors from initiating long-term investment plans. That’s why Invesco has always encouraged investors to work with a professional financial adviser who can stress the importance of starting to save and invest early and the importance of adhering to a disciplined investment plan – when times are good and when they’re uncertain. A financial adviser who knows your unique financial situation, investment goals and risk tolerance can be an invaluable partner as you seek to achieve your financial goals. He or she can offer a long-term perspective when markets are volatile and time-tested advice and guidance when your financial situation or investment goals change.
Timely information when and where you want it
Invesco’s efforts to help investors achieve their financial objectives include providing individual investors and financial professionals with timely information about the markets, the economy and investing – whenever and wherever they want it.
Our website, invesco.com/us, offers a wide range of market insights and investment perspectives. On the website, you’ll find detailed information about our funds, including prices, performance, holdings and portfolio manager commentaries. You can access information about your individual Invesco account whenever it’s convenient for you; just complete a simple, secure online registration. Use the “Log In” box on our home page to get started.
Invesco’s mobile app for iPad® (available free from the App StoreSM) allows you to obtain the same detailed information about your Fund and the same investment insights from our investment leaders, market strategists, economists and retirement experts on the go. You also can watch portfolio manager videos and have instant access to Invesco news and updates wherever you may be.
In addition to the resources accessible on our website and through our mobile app, you can obtain timely updates to help you stay informed about the markets, the economy and investing by connecting with Invesco on Twitter, LinkedIn or Facebook. You can access our blog at blog.invesco.us.com. Our goal is to provide you the information you want, when and where you want it.
Have questions?
For questions about your account, feel free to contact an Invesco client services representative at 800 959 4246. For Invesco-related questions or comments, please email me directly at phil@invesco.com.
All of us at Invesco look forward to serving your investment management needs for many years to come. Thank you for investing with us.
Sincerely,

Philip Taylor
Senior Managing Director, Invesco Ltd.
iPad is a trademark of Apple Inc., registered in the US and other countries. App Store is a service mark of Apple Inc. Invesco Distributors, Inc. is not affiliated with Apple Inc.
2 Invesco Emerging Market Local Currency Debt Fund
| | |

Bruce Crockett | | Dear Fellow Shareholders: There are a variety of factors that can impact investment performance, many of which are uncontrollable by us as investors. These factors can include various economic trends and geopolitical developments. While the members of the Invesco Funds Board, which I chair, can’t dictate the performance of the Invesco funds, be assured that your Board works diligently throughout the year to focus on how your investments are managed. Our job is to represent you and your interests on a variety of fund management-related matters. We regularly monitor how the portfolio management teams of the Invesco funds are performing in light of ever-changing and often unpredictable economic and market conditions. We review the investment strategies and investment process employed by each fund’s management team as explained in the fund’s prospectus. |
| | Perhaps our most significant responsibility is conducting the annual review of the funds’ |
advisory and sub-advisory contracts with Invesco Advisers and its affiliates. This annual review, which is required by the Investment Company Act of 1940, focuses on the nature and quality of the services Invesco provides as the adviser to the Invesco funds and the reasonableness of the fees that it charges for those services. Each year, we spend months carefully reviewing information from Invesco that allows us to evaluate the quality of its services and the reasonableness of its fees. We also use information from a variety of independent sources, including materials provided by the independent senior officer of the Invesco funds, who reports directly to the independent trustees on the Board. Additionally, we meet with legal counsel and review performance and fee data prepared for us by Lipper Inc., an independent, third-party firm widely recognized as a leader in its field.
After a careful review, the members of the Invesco Funds Board approved the continuation of advisory and sub-advisory contracts with Invesco Advisers and its affiliates. Be assured that your Board will continue working on behalf of fund shareholders, keeping your needs and interests uppermost in our minds.
As always, please contact me at bruce@brucecrockett.com with any questions or concerns you may have. On behalf of the Board, we look forward to continuing to represent your interests and serving your needs.
Sincerely,

Bruce L. Crockett
Independent Chair
Invesco Funds Board of Trustees
3 Invesco Emerging Market Local Currency Debt Fund
Management’s Discussion of Fund Performance
Performance summary
For the fiscal year ended October 31, 2014, Invesco Emerging Market Local Currency Debt Fund underperformed the JP Morgan Government Bond Index-Emerging Markets Global Diversified Index, the Fund’s broad market/style-specific index.
Your Fund’s long-term performance appears later in this report.
Fund vs. Indexes
Total returns, 10/31/13 to 10/31/14, at net asset value (NAV). Performance shown does not include applicable contingent deferred sales charges (CDSC) or front-end sales charges, which would have reduced performance.
| | | | |
Class A Shares | | | -3.44 | % |
Class B Shares | | | -4.17 | |
Class C Shares | | | -4.16 | |
Class R Shares | | | -3.69 | |
Class Y Shares | | | -3.20 | |
Class R5 Shares | | | -3.20 | |
Class R6 Shares | | | -3.21 | |
| JP Morgan Government Bond Index-Emerging Markets Global Diversified Indexq (Broad Market/Style-Specific Index) | | | -2.68 | |
Lipper Emerging Markets Debt Funds Indexn (Peer Group Index) | | | 5.17 | |
Source(s): qFactSet Research Systems Inc.; nLipper Inc.
Market conditions and your Fund
During the fiscal year ended October 31, 2014, emerging market local currency bonds continued to exhibit volatility. Local rates and price appreciations were more than offset by depreciations of emerging market currencies (EMFX) versus the US dollar. At the start of the fiscal year, the emerging market local debt asset class, as measured by the Fund’s broad market/style-specific index, was yielding 6.40%1 and for the fiscal year, it returned 6.95%1 in local currency terms or 55 basis points in excess of starting yields. However, EMFX weakened substantially leading to -2.68%1 annual return in US dollar terms.
In the second half of calendar year 2013, both developed and emerging market fixed income returns were driven by expectations of higher interest rates and an end to quantitative easing in the US. These expectations negatively impacted the emerging local currency market during the first months of the Fund’s fiscal year, primarily through weaker EMFX. Technical indicators for the emerging market local debt asset class exacerbated negative returns as investors continued to shift money out of fixed income and into the US equity market.
Emerging markets faced several head-winds at the outset of 2014 and local currency bonds declined in January. During the month, the primary contributor to
emerging markets’ volatility shifted from concern over US rates to a slowdown in China. Also, investors moved out of risk assets and into the relative safety of US dollar-denominated investment-grade bonds. However, after a dramatic start to the calendar year, the emerging market local debt asset class recovered, posting posting strong returns for the remainder of the fiscal year. Mixed economic data in developed markets proved positive for emerging markets during the reporting period. The US economy’s contraction in the first quarter of 2014, combined with improving employment but low inflation, allayed concerns over near-term interest rate hikes. Combined with dovish monetary policy in developed Europe and Japan, EMFX improved and investors were able to earn a high level of carry with lower volatility during the middle portion of the fiscal year.
Toward the end of the fiscal year, volatility returned to the market. Several idiosyncratic events impacted emerging markets including Russia/Ukraine tensions, loss of confidence in Venezuela’s ability to repay its debts, impending elections in Brazil, and a sharp decline in oil prices. The result was a rapid strengthening of the US dollar versus EMFX as well as a more moderate sell-off in local rates. While local rates rallied in the final months of the fiscal year, the US dollar continued to strengthen, albeit more gradually.
For the reporting period, the primary contributors to the Fund’s performance versus its broad market/style-specific index were its overweight position in Indonesia and an off-index position in US dollar-denominated emerging market corporate bonds.
| | | | |
| Portfolio Composition | |
By industry | | | | |
Sovereign Debt | | | 64.4 | % |
| Diversified Banks | | | 14.7 | |
| Investment Banking & Brokerage | | | 2.8 | |
| Diversified Capital Markets | | | 2.7 | |
| Diversified REITs | | | 2.6 | |
| Wireless Telecommunication Services | | | 2.5 | |
| Independent Power Producers & Energy Traders | | | 1.9 | |
| Electric Utilities | | | 1.0 | |
| Integrated Telecommunication Services | | | 1.0 | |
| Semiconductors | | | 1.0 | |
Real Estate Development
Money Market Funds | | | 0.6 | |
| Plus Other Assets Less Liabilities | | | 4.8 | |
| | | | | | |
Top Five Fixed Income Issuers* | |
| | |
1. | | Malaysia Government Bond | | | 8.5 | % |
2. | | Poland Government Bond | | | 7.3 | |
3. | | Standard Chartered Bank | | | 6.3 | |
4. | | Turkey Government Bond | | | 6.2 | |
5. | | Russia Federal Bond | | | 5.8 | |
| | | | |
Total Net Assets | | | $55.1 million | |
| |
Total Number of Holdings* | | | 61 | |
The Fund’s holdings are subject to change, and there is no assurance that the Fund will continue to hold any particular security.
*Excluding money market fund holdings.
4 Invesco Emerging Market Local Currency Debt Fund
In addition, overweight positions in Russia and Brazil versus the Fund’s broad market/style-specific index were significant detractors from Fund performance during the reporting period.
We expect potential key drivers of near-term performance to be the path of the US dollar versus EMFX, developed market central banks’ policy decisions and commodity prices. Over the longer term, our fundamental outlook for the emerging market local debt asset class remains positive given indications of higher growth prospects relative to developed economies, improving balance sheets, low financing needs and abundant liquidity from developed market central banks.
We expect continued divergence among developing economies as well as emerging markets. Investors face a complex landscape where rising rates in the US may coincide with continued dovish policies in Europe and Japan. Emerging economies will likely also be impacted differently by macro forces such as commodity prices. In this environment, we stress the importance of projecting the future path of EMFX and local rates on a country by country basis. The usefulness of currency adjustments and/or tighter domestic fiscal and monetary policy could have noticeably differing impacts on macro imbalances in each country given a myriad of other factors including trade openness and other balance of payment items such as the capital account.
In our opinion, the key to unlocking excess return could be bottom-up sovereign analysis to identify local markets that could benefit from structural reforms and favorable political developments aimed at improving sovereign ability to attract capital flows. Likewise, it could become increasingly important to take advantage of dislocations owing to market overshoots.
Thank you for your investment in Invesco Emerging Market Local Currency Debt Fund.
The views and opinions expressed in management’s discussion of Fund performance are those of Invesco Advisers, Inc. These views and opinions are subject to change at any time based on factors such as market and economic conditions. These views and opinions may not be relied upon as investment advice or recommendations, or as an offer for a particular security. The information is not a complete analysis of every aspect of any market, country, industry, security or the Fund. Statements of fact are from sources considered reliable, but Invesco Advisers, Inc. makes no representation or warranty as to their completeness or accuracy. Although historical performance is no guarantee of future results, these
insights may help you understand our investment management philosophy.
See important Fund and, if applicable, index disclosures later in this report.
| | |

| | Jack Deino Chartered Financial Analyst, Portfolio Manager, is manager of Invesco Emerging Market Local Currency |
| Debt Fund. He joined Invesco in 2006. Mr. Deino earned a BA in Latin American studies from The University of Texas at Austin. |
| | |

| | Joseph Portera Portfolio Manager, is manager of Invesco Emerging Market Local Currency Debt Fund. He joined |
| Invesco in 2012. Mr. Portera earned BA and MA degrees in Soviet studies and an MA in international political economy and development from Fordham University. |
5 Invesco Emerging Market Local Currency Debt Fund
Your Fund’s Long-Term Performance
Results of a $10,000 Investment – Oldest Share Class(es) since Inception
Fund data from 6/16/10; index data from 6/30/10
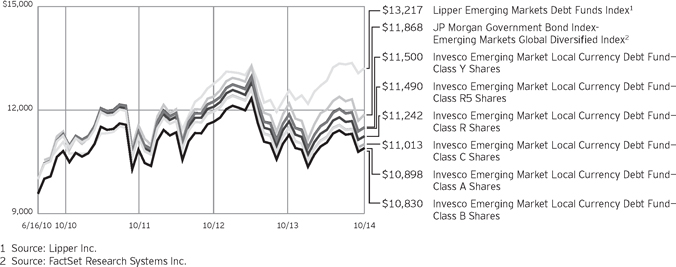
Past performance cannot guarantee comparable future results.
The data shown in the chart include reinvested distributions, applicable sales charges and Fund expenses including management fees. Results for Class B shares are calculated as if a hypothetical
shareholder had liquidated his entire investment in the Fund at the close of the reporting period and paid the contingent deferred sales charges, if applicable. Index results include reinvested dividends, but they do not reflect sales charges. Performance of the peer group,
if applicable, reflects fund expenses and management fees; performance of a market index does not. Performance shown in the chart and table(s) does not reflect deduction of taxes a shareholder would pay on Fund distributions or sale of Fund shares.
continued from page 8
changes in a foreign country’s exchange rates, political and social instability, changes in economic or taxation policies, difficulties when enforcing obligations, decreased liquidity, and increased volatility. Foreign companies may be subject to less regulation resulting in less publicly available information about the companies.
| n | | Geographic focus risk. From time to time the Fund may invest a substantial amount of its assets in securities of issuers located in a single country or a limited number of countries. If the Fund focuses its investments in this manner, it assumes the risk that economic, political and social conditions in those countries will have a significant impact on its investment performance. The Fund’s investment performance may also be more volatile if it focuses its investments in certain countries, especially emerging markets countries. |
| n | | High yield bond (junk bond) risk. Junk bonds involve a greater risk of default or price changes due to changes in the credit quality of the issuer. The values |
| | | of junk bonds fluctuate more than those of high- quality bonds in response to company, political, regulatory or economic developments. Values of junk bonds can decline significantly over short periods of time. |
| n | | Interest rate risk. Interest rate risk refers to the risk that bond prices generally fall as interest rates rise; conversely, bond prices generally rise as interest rates fall. Specific bonds differ in their sensitivity to changes in interest rates depending on their individual characteristics, including duration. |
| n | | Management risk. The investment techniques and risk analysis used by the Fund’s portfolio managers may not produce the desired results. |
| n | | Market risk. The prices of and the income generated by the Fund’s securities may decline in response to, among other things, investor sentiment, general economic and market conditions, regional or global instability, and currency and interest rate fluctuations. |
| n | | Non-diversification risk. The Fund is non-diversified and can invest a greater |
| | | portion of its assets in a small number of issuers or a single issuer. A change in the value of the issuer could affect the value of the Fund more than if it was a diversified fund. |
| n | | Reinvestment risk. Reinvestment risk is the risk that a bond’s cash flows (coupon income and principal repayment) will be reinvested at an interest rate below that on the original bond. |
| n | | Sovereign debt risk. Investments in foreign sovereign debt obligations involve certain risks in addition to those relating to foreign securities or debt securities generally. The issuer of the debt or the governmental authorities that control the repayment of the debt may be unable or unwilling to repay principal or interest when due in accordance with the terms of such debt, and the Fund may have limited recourse in the event of a default against the defaulting government. Without the approval of debt holders, some governmental debtors have in the past been able to reschedule or restructure their debt payments or declare moratoria on payments. |
continued on page 7
6 Invesco Emerging Market Local Currency Debt Fund
| | | | |
| Average Annual Total Returns | |
| As of 10/31/14, including maximum applicable sales charges | |
| |
Class A Shares | | | | |
Inception (6/16/10) | | | 1.99 | % |
1 Year | | | -7.57 | |
| |
Class B Shares | | | | |
Inception (6/16/10) | | | 1.84 | % |
1 Year | | | -8.80 | |
| |
Class C Shares | | | | |
Inception (6/16/10) | | | 2.23 | % |
1 Year | | | -5.09 | |
| |
Class R Shares | | | | |
Inception (6/16/10) | | | 2.71 | % |
1 Year | | | -3.69 | |
| |
Class Y Shares | | | | |
Inception (6/16/10) | | | 3.25 | % |
1 Year | | | -3.20 | |
| |
Class R5 Shares | | | | |
Inception (6/16/10) | | | 3.23 | % |
1 Year | | | -3.20 | |
| |
Class R6 Shares | | | | |
Inception | | | 3.09 | % |
1 Year | | | -3.21 | |
Class R6 shares incepted on September 24, 2012. Performance shown prior to that date is that of Class A shares and includes the 12b-1 fees applicable to Class A shares. Class A share performance reflects any applicable fee waivers or expense reimbursements.
The performance data quoted represent past performance and cannot guarantee comparable future results; current performance may be lower or higher. Please visit invesco.com/performance for the most recent month-end performance. Performance figures reflect reinvested
| | | | |
| Average Annual Total Returns | |
| As of 9/30/14, the most recent calendar quarter end, including maximum applicable sales charges | |
| |
Class A Shares | | | | |
Inception (6/16/10) | | | 1.80 | % |
1 Year | | | -6.29 | |
| |
Class B Shares | | | | |
Inception (6/16/10) | | | 1.66 | % |
1 Year | | | -7.55 | |
| |
Class C Shares | | | | |
Inception (6/16/10) | | | 2.06 | % |
1 Year | | | -3.79 | |
| |
Class R Shares | | | | |
Inception (6/16/10) | | | 2.54 | % |
1 Year | | | -2.48 | |
| |
Class Y Shares | | | | |
Inception (6/16/10) | | | 3.08 | % |
1 Year | | | -1.88 | |
| |
Class R5 Shares | | | | |
Inception (6/16/10) | | | 3.06 | % |
1 Year | | | -1.88 | |
| |
Class R6 Shares | | | | |
Inception | | | 2.92 | % |
1 Year | | | -1.88 | |
distributions, changes in net asset value and the effect of the maximum sales charge unless otherwise stated. Performance figures do not reflect deduction of taxes a shareholder would pay on Fund distributions or sale of Fund shares. Investment return and principal value will fluctuate so that you may have a gain or loss when you sell shares.
The net annual Fund operating expense ratio set forth in the most recent Fund prospectus as of the date of this report for Class A, Class B, Class C, Class R, Class Y, Class R5 and
Class R6 shares was 1.24%, 1.99%, 1.99%, 1.49%, 0.99%, 0.99% and 0.99%, respectively.1 The total annual Fund operating expense ratio set forth in the most recent Fund prospectus as of the date of this report for Class A, Class B, Class C, Class R, Class Y, Class R5 and Class R6 shares was 1.77%, 2.52%, 2.52%, 2.02%, 1.52%, 1.36% and 1.29%, respectively. The expense ratios presented above may vary from the expense ratios presented in other sections of this report that are based on expenses incurred during the period covered by this report.
Class A share performance reflects the maximum 4.25% sales charge, and Class B and Class C share performance reflects the applicable contingent deferred sales charge (CDSC) for the period involved. The CDSC on Class B shares declines from 5% beginning at the time of purchase to 0% at the beginning of the seventh year. The CDSC on Class C shares is 1% for the first year after purchase. Class R, Class Y, Class R5 and Class R6 shares do not have a front-end sales charge or a CDSC; therefore, performance is at net asset value.
The performance of the Fund’s share classes will differ primarily due to different sales charge structures and class expenses.
Had the adviser not waived fees and/or reimbursed expenses, performance would have been lower.
| 1 | Total annual Fund operating expenses after any contractual fee waivers and/or expense reimbursements by the adviser in effect through at least February 29, 2016. See current prospectus for more information. |
continued from page 6
About indexes used in this report
| n | | The JP Morgan Government Bond Index-Emerging Markets Global Diversified Index is a comprehensive global local emerging markets index comprising liquid, fixed-rate, domestic currency government bonds. |
| n | | The Lipper Emerging Markets Debt Funds Index is an unmanaged index considered representative of emerging market debt funds tracked by Lipper. |
| n | | The Fund is not managed to track the performance of any particular index, including the index(es) described here, and consequently, the performance of |
| | | the Fund may deviate significantly from the performance of the
index(es). |
| n | | A direct investment cannot be made in an index. Unless otherwise indicated, index results include reinvested dividends, and they do not reflect sales charges. Performance of the peer group, if applicable, reflects fund expenses; performance of a market index does not. |
Other information
| n | | The returns shown in management’s discussion of Fund performance are based on net asset values (NAVs) calculated for shareholder transactions. |
| | | Generally accepted accounting principles require adjustments to be made to the net assets of the Fund at period end for financial reporting purposes, and as such, the NAVs for shareholder transactions and the returns based on those NAVs may differ from the NAVs and returns reported in the Financial Highlights. |
| n | | Industry classifications used in this report are generally according to the Global Industry Classification Standard, which was developed by and is the exclusive property and a service mark of MSCI Inc. and Standard & Poor’s. |
7 Invesco Emerging Market Local Currency Debt Fund
Invesco Emerging Market Local Currency Debt Fund’s investment objective is total return through growth of capital and current income.
| n | | Unless otherwise stated, information presented in this report is as of October 31, 2014, and is based on total net assets. |
| n | | Unless otherwise noted, all data provided by Invesco. |
| n | | To access your Fund’s reports/prospectus, visit invesco.com/fundreports. |
About share classes
| n | | Class B shares may not be purchased for new or additional investments. Please see the prospectus for more information. |
| n | | Class R shares are generally available only to employer sponsored retirement and benefit plans. Please see the prospectus for more information. |
| n | | Class Y shares are available only to certain investors. Please see the prospectus for more information. |
| n | | Class R5 shares and Class R6 shares are primarily intended for employer sponsored retirement and benefit plans that meet certain standards and for institutional investors. Please see the prospectus for more information. |
Principal risks of investing in the Fund
| n | | Cash/cash equivalents risk. Holding cash or cash equivalents may negatively affect performance. |
| n | | Changing fixed income market conditions risk. The current historically low interest rate environment was created in part by the Federal Reserve Board (FRB) and certain foreign central banks keeping the federal funds and equivalent foreign rates at or near zero. There is a risk that interest rates will rise when the FRB and central banks raise these rates. This risk is heightened due to the “tapering” of the FRB’s quantitative easing program and other similar foreign central bank actions. This tapering and eventual increase in the federal funds and equivalent foreign rates may expose fixed income markets to heightened volatility and reduced liquidity for certain fixed income investments, particularly those with longer maturities. In addition, decreases in fixed income dealer market-making capacity may also potentially lead to heightened volatility and reduced liquidity in the fixed income markets. As a result, the value of the Fund’s investments and share price may decline. Changes in central bank policies could |
| | | also result in higher than normal shareholder redemptions, which could potentially increase portfolio turnover and the Fund’s transaction costs. |
| n | | Credit linked notes risk. Risks of credit linked notes include those risks associated with the underlying reference obligation including but not limited to market risk, interest rate risk, credit risk, default risk and foreign currency risk. In the case of a credit linked note created with credit default swaps, the structure will be “funded” such that the par amount of the security will represent the maximum loss that could be incurred on the investment and no leverage is introduced. An investor in a credit linked note bears counterparty risk or the risk that the issuer of the credit linked note will default or become bankrupt and not make timely payment of principal and interest of the structured security. |
| n | | Credit risk. The issuer of instruments in which the Fund invests may be unable to meet interest and/or principal payments, thereby causing its instruments to decrease in value and lowering the issuer’s credit rating. |
| n | | Currency/exchange rate risk. The dollar value of the Fund’s foreign investments will be affected by changes in the exchange rates between the dollar and the currencies in which those investments are traded. |
| n | | Derivatives risk. The value of a derivative instrument depends largely on (and is derived from) the value of an underlying security, currency, commodity, interest rate, index or other asset (each referred to as an underlying asset). In addition to risks relating to the underlying assets, the use of derivatives may include other, possibly greater, risks, including counterparty, leverage and liquidity risks. Counterparty risk is the risk that the counterparty to the derivative contract will default on its obligation to pay the Fund the amount owed or otherwise perform under the derivative contract. Derivatives |
| | | create leverage risk because they do not require payment up front equal to the economic exposure created by owning the derivative. As a result, an adverse change in the value of the underlying asset could result in the Fund sustaining a loss that is substantially greater than the amount invested in the derivative, which may make the Fund’s returns more volatile and increase the risk of loss. Derivative instruments may also be less liquid than more traditional investments and the Fund may be unable to sell or close out its derivative positions at a desirable time or price. This risk may be more acute under adverse market conditions, during which the Fund may be most in need of liquidating its derivative positions. Derivatives may also be harder to value, less tax efficient and subject to changing government regulation that could impact the Fund’s ability to use certain derivatives or their cost. Also, derivatives used for hedging or to gain or limit exposure to a particular market segment may not provide the expected benefits, particularly during adverse market conditions. |
| n | | Developing/emerging markets securities risk. The prices of securities issued by foreign companies and governments located in developing/emerging market countries may be affected more negatively by inflation, devaluation of their currencies, higher transaction costs, delays in settlement, adverse political developments, the introduction of capital controls, withholding taxes, nationalization of private assets, expropriation, social unrest, war or lack of timely information than those in developed countries. |
| n | | Foreign currency tax risk. If the US Treasury Department were to exercise its authority to issue regulations that exclude from the definition of “qualifying income” foreign currency gains not directly related to the Fund’s business of investing in securities, the Fund may be unable to qualify as a regulated investment company for one or more years. In this event, the Fund’s Board of Trustees may authorize a significant change in investment strategy or Fund liquidation. |
| n | | Foreign securities risk. The Fund’s foreign investments may be affected by |
continued on page 6
|
This report must be accompanied or preceded by a currently effective Fund prospectus, which contains more complete information, including sales charges and expenses. Investors should read it carefully before investing. |
|
|
| NOT FDIC INSURED | MAY LOSE VALUE | NO BANK GUARANTEE |
8 Invesco Emerging Market Local Currency Debt Fund
Schedule of Investments
October 31, 2014
| | | | | | | | |
| | | Principal
Amount | | | Value | |
Non U.S. Dollar Denominated Bonds &
Notes–92.53%(a) | |
| Brazil–10.63% | |
Banco Safra S.A.,
Sr. Unsec. Notes, 10.25%, 08/08/16(b) | | BRL | 956,000 | | | $ | 371,328 | |
REGS, Sr. Unsec. Euro Notes, | | | | | | | | |
10.25%, 08/08/16(b) | | BRL | 680,000 | | | | 264,124 | |
Brazil Letras do Tesouro Nacional, Unsec. Bonds,
0.00%, 07/01/16(c) | | BRL | 4,600,000 | | | | 1,531,926 | |
Brazil Notas do Tesouro Nacional, | | | | | | | | |
Series B, Unsec. Notes, | | | | | | | | |
6.00%, 08/15/50 | | BRL | 617,500 | (d) | | | 252,103 | |
Series F, Sr. Unsec. Notes, | | | | | | | | |
10.00%, 01/01/17 | | BRL | 1,900,000 | | | | 732,088 | |
Unsec. Notes, | | | | | | | | |
10.00%, 01/01/21 | | BRL | 4,758,000 | | | | 1,751,148 | |
10.00%, 01/01/23 | | BRL | 600,000 | | | | 216,395 | |
Itau Unibanco Holding S.A., | | | | | | | | |
Sr. Unsec. Notes, | | | | | | | | |
10.50%, 11/23/15(b) | | BRL | 1,150,000 | | | | 461,764 | |
REGS, Sr. Unsec. Euro Notes, | | | | | | | | |
10.50%, 11/23/15(b) | | BRL | 702,000 | | | | 281,877 | |
| | | | | | | | 5,862,753 | |
|
| China–2.68% | |
China Electronics Corp Holdings Co Ltd., Class H, Sr. Unsec. Medium-Term Euro Bonds, 4.70%, 01/16/17 | | CNY | 3,500,000 | | | | 575,392 | |
China Unicom Hong Kong Ltd., Sr. Unsec. Medium-Term Euro Notes, 4.00%, 04/16/17 | | CNY | 3,500,000 | | | | 572,082 | |
Longfor Properties Co. Ltd., Sr. Unsec. Gtd. Euro Notes, 6.75%, 05/28/18 | | CNY | 2,000,000 | | | | 328,055 | |
| | | | | | | | 1,475,529 | |
|
| Colombia–6.93% | |
Colombia Government International Bond, Sr. Unsec. Global Bonds, | | | | | | | | |
4.38%, 03/21/23 | | COP | 4,313,000,000 | | | | 1,860,317 | |
9.85%, 06/28/27 | | COP | 633,000,000 | | | | 395,225 | |
Empresas Publicas de
Medellin ESP,
Sr. Unsec. Notes, | | | | | | | | |
8.38%, 02/01/21(b) | | COP | 1,000,000,000 | | | | 521,238 | |
REGS, Sr. Unsec. Euro Notes, | | | | | | | | |
8.38%, 02/01/21(b) | | COP | 2,000,000,000 | | | | 1,042,477 | |
| | | | | | | | 3,819,257 | |
|
| Costa Rica–1.49% | |
Costa Rica Government International Bond, Unsec. Bonds, | | | | | | | | |
9.43%, 06/29/22(b) | | CRC | 200,000,000 | | | | 355,313 | |
11.04%, 09/27/17(b) | | CRC | 237,500,000 | | | | 467,277 | |
| | | | | | | | 822,590 | |
| | | | | | | | |
| | | Principal
Amount | | | Value | |
| Germany–2.71% | |
Deutsche Bank A.G., Sr. Unsec. Medium-Term Euro Notes, 8.38%, 03/17/34(b) | | IDR | 18,300,000,000 | | | $ | 1,497,048 | |
|
| Hungary–2.85% | |
Hungary Government Bond, | | | | | | | | |
Series 17/A, Unsec. Bonds, | | | | | | | | |
6.75%, 11/24/17 | | HUF | 158,000,000 | | | | 721,804 | |
Series 17/B, Unsec. Bonds, | | | | | | | | |
6.75%, 02/24/17 | | HUF | 190,500,000 | | | | 848,749 | |
| | | | | | | | 1,570,553 | |
|
| Luxembourg–1.55% | |
Bank of New York Mellon Luxembourg S.A. (The), Series NG5, Sec. Medium-Term Euro Notes, 10.70%, 06/05/18(b) | | NGN | 150,000,000 | | | | 855,869 | |
|
| Malaysia–8.54% | |
Malaysia Government Bond, | | | | | | | | |
Series 0111, Sr. Unsec. Bonds, | | | | | | | | |
4.16%, 07/15/21 | | MYR | 5,681,000 | | | | 1,767,186 | |
Series 0112, Sr. Unsec. Bonds, | | | | | | | | |
3.42%, 08/15/22 | | MYR | 2,000,000 | | | | 591,886 | |
Series 0902, Sr. Unsec. Bonds, | | | | | | | | |
4.38%, 11/29/19 | | MYR | 7,500,000 | | | | 2,352,355 | |
| | | | | | | | 4,711,427 | |
|
| Mexico–7.20% | |
America Movil S.A.B. de C.V., Sr. Unsec. Euro Notes,
7.13%, 12/09/24 | | MXN | 2,000,000 | | | | 150,167 | |
Sr. Unsec. Gtd. Global Notes, | | | | | | | | |
8.46%, 12/18/36 | | MXN | 17,000,000 | | | | 1,248,536 | |
Mexican Bonos, | | | | | | | | |
Series M, Unsec. Bonds, | | | | | | | | |
7.75%, 11/13/42 | | MXN | 100,000 | | | | 8,324 | |
8.00%, 12/07/23 | | MXN | 11,300,000 | | | | 964,599 | |
Series M20, Sr. Unsec. Bonds, | | | | | | | | |
10.00%, 12/05/24 | | MXN | 16,451,100 | | | | 1,600,037 | |
| | | | | | | | 3,971,663 | |
|
| Peru–1.88% | |
Peruvian Government International Bond,
Sr. Unsec. Bonds,
5.70%, 08/12/24(b) | | PEN | 300,000 | | | | 102,317 | |
Sr. Unsec. Notes, | | | | | | | | |
8.20%, 08/12/26(b) | | PEN | 1,496,000 | | | | 628,689 | |
REGS, Sr. Unsec. Global Notes, | | | | | | | | |
6.95%, 08/12/31(b) | | PEN | 834,000 | | | | 305,042 | |
| | | | | | | | 1,036,048 | |
See accompanying Notes to Financial Statements which are an integral part of the financial statements.
9 Invesco Emerging Market Local Currency Debt Fund
| | | | | | | | |
| | | Principal
Amount | | | Value | |
| Philippines–0.39% | |
Philippine Government International Bond, Sr. Unsec. Global Bonds, 3.90%, 11/26/22 | | PHP | 10,000,000 | | | $ | 217,803 | |
|
| Poland–7.30% | |
Poland Government Bond, | | | | | | | | |
Series 1020, Unsec. Bonds, | | | | | | | | |
5.25%, 10/25/20 | | PLN | 1,600,000 | | | | 558,643 | |
Series 1021, Unsec. Bonds, | | | | | | | | |
5.75%, 10/25/21 | | PLN | 1,015,000 | | | | 369,224 | |
Series 1023, Unsec. Bonds, | | | | | | | | |
4.00%, 10/25/23 | | PLN | 3,482,000 | | | | 1,161,206 | |
Series DS1017, Unsec. Bonds, | | | | | | | | |
5.25%, 10/25/17 | | PLN | 5,935,000 | | | | 1,935,585 | |
| | | | | | | | 4,024,658 | |
|
| Romania–1.44% | |
Romania Government Bond, Series 5Y, Unsec. Bonds, 5.90%, 07/26/17 | | RON | 2,550,000 | | | | 793,645 | |
|
| Russia–5.76% | |
Russian Federal Bond–OFZ, Series 5080, Unsec. Bonds, 7.40%, 04/19/17 | | RUB | 11,500,000 | | | | 253,880 | |
Series 6208, Unsec. Bonds, | | | | | | | | |
7.50%, 02/27/19 | | RUB | 68,372,000 | | | | 1,460,135 | |
Series 6215, Unsec. Bonds, | | | | | | | | |
7.00%, 08/16/23 | | RUB | 74,000,000 | | | | 1,460,747 | |
| | | | | | | | 3,174,762 | |
|
| South Africa–4.11% | |
South Africa Government Bond, Series 2023, Unsec. Bonds, 7.75%, 02/28/23 | | ZAR | 24,892,000 | | | | 2,268,407 | |
|
| Supranational–4.02% | |
European Bank for Reconstruction & Development, Sr. Unsec. Medium-Term Euro Notes, 0.00%, 12/31/18(c) | | ZAR | 5,600,000 | | | | 379,794 | |
International Bank for Reconstruction & Development, Sr. Unsec. Medium-Term Euro Notes, 7.00%, 06/07/23 | | ZAR | 17,000,000 | | | | 1,444,978 | |
Series GDIF, Sr. Unsec. Medium-Term Euro Notes, | | | | | | | | |
7.68%, 08/10/16 | | ZAR | 4,250,000 | | | | 389,621 | |
| | | | | | | | 2,214,393 | |
|
| Thailand–4.82% | |
Thailand Government Bond, | | | | | | | | |
Sr. Unsec. Bonds, | | | | | | | | |
3.65%, 12/17/21 | | THB | 51,600,000 | | | | 1,651,338 | |
3.88%, 06/13/19 | | THB | 31,175,000 | | | | 1,006,266 | |
| | | | | | | | 2,657,604 | |
| | | | | | | | |
| | | Principal
Amount | | | Value | |
| Turkey–6.21% | |
Turkey Government Bond, | | | | | | | | |
Unsec. Bonds, | | | | | | | | |
8.80%, 09/27/23 | | TRY | 1,735,000 | | | $ | 794,278 | |
9.00%, 07/24/24 | | TRY | 1,250,000 | | | | 583,776 | |
Series CPI, Unsec. Bonds, | | | | | | | | |
3.00%, 02/23/22 | | TRY | 3,271,847 | (d) | | | 1,592,791 | |
4.00%, 04/01/20 | | TRY | 903,193 | (d) | | | 455,538 | |
| | | | | | | | 3,426,383 | |
|
| United Kingdom–8.61% | |
Barclays Bank PLC, Series FR52, Sr. Unsec. Medium-Term Euro Notes, 10.50%, 08/19/30 | | IDR | 13,200,000,000 | | | | 1,292,391 | |
Standard Chartered Bank, Sr. Unsec. Medium-Term Euro Notes, | | | | | | | | |
7.80%, 05/05/20 | | INR | 33,600,000 | | | | 533,581 | |
8.12%, 12/14/20 | | INR | 40,000,000 | | | | 646,212 | |
8.28%, 09/23/27 | | INR | 58,000,000 | | | | 940,977 | |
8.38%, 03/17/34 | | IDR | 16,304,000,000 | | | | 1,333,771 | |
| | | | | | | | 4,746,932 | |
|
| United States–3.41% | |
JP Morgan Chase Bank N.A., Unsec. Medium-Term Euro Notes, 8.25%, 06/17/32(b) | | IDR | 4,000,000,000 | | | | 324,139 | |
Morgan Stanley, Series G, Sr. Unsec. Medium-Term Euro Notes, 8.44%, 12/28/15 | | MXN | 20,000,000 | | | | 1,553,935 | |
| | | | | | | | 1,878,074 | |
Total Non U.S. Dollar Denominated Bonds & Notes
(Cost $54,849,457) | | | | 51,025,398 | |
|
U.S. Dollar Denominated Bonds & Notes–2.71% | |
| Hungary–0.68% | |
Hungary Government International Bond,
Sr. Unsec. Global Notes, 5.38%, 03/25/24 | | $ | 350,000 | | | | 375,410 | |
|
| Russia–2.03% | |
Russian Foreign Bond, REGS, Sr. Unsec. Euro Bonds, 7.50%, 03/31/30(b)(e) | | | 982,500 | | | | 1,117,093 | |
Total U.S. Dollar Denominated Bonds & Notes
(Cost $1,450,963) | | | | 1,492,503 | |
| | |
| | | Shares | | | | |
Money Market Funds–2.21% | |
Liquid Assets Portfolio–Institutional Class(f) | | | 610,862 | | | | 610,862 | |
Premier Portfolio–Institutional Class(f) | | | 610,862 | | | | 610,862 | |
Total Money Market Funds
(Cost $1,221,724) | | | | 1,221,724 | |
TOTAL INVESTMENTS–97.45%
(Cost $57,522,144) | | | | 53,739,625 | |
OTHER ASSETS LESS LIABILITIES–2.55% | | | | 1,406,888 | |
NET ASSETS–100.00% | | | $ | 55,146,513 | |
See accompanying Notes to Financial Statements which are an integral part of the financial statements.
10 Invesco Emerging Market Local Currency Debt Fund
Investment Abbreviations:
| | |
| BRL | | – Brazilian Real |
| CNY | | – Chinese Yuan Renminbi |
| COP | | – Colombian Peso |
| CPI | | – Consumer Price Index |
| CRC | | – Costa Rican Colon |
| Gtd. | | – Guaranteed |
| HUF | | – Hungary Forint |
| IDR | | – Indonesian Rupiah |
| INR | | – Indian Rupees |
| MXN | | – Mexican Peso |
| MYR | | – Malaysian Ringgit |
| NGN | | – Nigerian Naira |
| PEN | | – Peru Nuevo Sol |
| PHP | | – Philippines Peso |
| PLN | | – Poland Zloty |
| REGS | | – Regulation S |
| RON | | – Romanian Leu |
| RUB | | – Russian Rouble |
| Sec. | | – Secured |
| Sr. | | – Senior |
| THB | | – Thailand Baht |
| TRY | | – New Turkish Lire |
| Unsec. | | – Unsecured |
| ZAR | | – South African Rand |
Notes to Schedule of Investments:
| (a) | Foreign denominated security. Principal amount is denominated in the currency indicated. |
| (b) | Security purchased or received in a transaction exempt from registration under the Securities Act of 1933, as amended (the “1933 Act”). The security may be resold pursuant to an exemption from registration under the 1933 Act, typically to qualified institutional buyers. The aggregate value of these securities at October 31, 2014 was $8,595,595, which represented 15.59% of the Fund’s Net Assets. |
| (c) | Zero coupon bond issued at a discount. |
| (d) | Principal amount of security and interest payments are adjusted for inflation. |
| (e) | Step coupon bond. The interest rate represents the coupon rate at which the bond will accrue at a specified future date. |
| (f) | The money market fund and the Fund are affiliated by having the same investment adviser. |
See accompanying Notes to Financial Statements which are an integral part of the financial statements.
11 Invesco Emerging Market Local Currency Debt Fund
Statement of Assets and Liabilities
October 31, 2014
| | | | |
Assets: | | | | |
Investments, at value (Cost $56,300,420) | | $ | 52,517,901 | |
Investments in affiliated money market funds, at value and cost | | | 1,221,724 | |
Total investments, at value (Cost $57,522,144) | | | 53,739,625 | |
Foreign currencies, at value (Cost $223,316) | | | 196,465 | |
Receivable for: | | | | |
Fund shares sold | | | 242,276 | |
Dividends and interest | | | 1,076,990 | |
Forward foreign currency contracts outstanding | | | 74,407 | |
Investment for trustee deferred compensation and retirement plans | | | 22,218 | |
Other assets | | | 29,055 | |
Total assets | | | 55,381,036 | |
|
Liabilities: | |
Payable for: | | | | |
Investments purchased | | | 102,388 | |
Fund shares reacquired | | | 18,385 | |
Accrued fees to affiliates | | | 11,696 | |
Accrued trustees’ and officers’ fees and benefits | | | 1,943 | |
Accrued other operating expenses | | | 76,892 | |
Trustee deferred compensation and retirement plans | | | 23,219 | |
Total liabilities | | | 234,523 | |
Net assets applicable to shares outstanding | | $ | 55,146,513 | |
|
Net assets consist of: | |
Shares of beneficial interest | | $ | 59,812,153 | |
Undistributed net investment income | | | (19,724 | ) |
Undistributed net realized gain (loss) | | | (870,224 | ) |
Net unrealized appreciation (depreciation) | | | (3,775,692 | ) |
| | | $ | 55,146,513 | |
| | | | |
Net Assets: | |
Class A | | $ | 9,378,993 | |
Class B | | $ | 349,199 | |
Class C | | $ | 2,243,803 | |
Class R | | $ | 460,469 | |
Class Y | | $ | 2,911,194 | |
Class R5 | | $ | 185,735 | |
Class R6 | | $ | 39,617,120 | |
|
Shares outstanding, $0.01 par value per share,
with an unlimited number of shares authorized: | |
Class A | | | 1,104,543 | |
Class B | | | 41,175 | |
Class C | | | 264,277 | |
Class R | | | 54,301 | |
Class Y | | | 342,831 | |
Class R5 | | | 21,908 | |
Class R6 | | | 4,670,582 | |
Class A: | | | | |
Net asset value per share | | $ | 8.49 | |
Maximum offering price per share | | | | |
(Net asset value of $8.49 ¸ 95.75%) | | $ | 8.87 | |
Class B: | | | | |
Net asset value and offering price per share | | $ | 8.48 | |
Class C: | | | | |
Net asset value and offering price per share | | $ | 8.49 | |
Class R: | | | | |
Net asset value and offering price per share | | $ | 8.48 | |
Class Y: | | | | |
Net asset value and offering price per share | | $ | 8.49 | |
Class R5 | | | | |
Net asset value and offering price per share | | $ | 8.48 | |
Class R6: | | | | |
Net asset value and offering price per share | | $ | 8.48 | |
See accompanying Notes to Financial Statements which are an integral part of the financial statements.
12 Invesco Emerging Market Local Currency Debt Fund
Statement of Operations
For the year ended October 31, 2014
| | | | |
Investment income: | |
Interest (net of foreign withholding taxes of $ 29,591) | | $ | 3,521,980 | |
Dividends from affiliated money market funds | | | 597 | |
Total investment income | | | 3,522,577 | |
| |
Expenses: | | | | |
Advisory fees | | | 404,296 | |
Administrative services fees | | | 50,000 | |
Custodian fees | | | 48,766 | |
Distribution fees: | | | | |
Class A | | | 25,783 | |
Class B | | | 4,481 | |
Class C | | | 26,262 | |
Class R | | | 2,989 | |
Transfer agent fees — A, B, C, R and Y | | | 46,985 | |
Transfer agent fees — R5 | | | 24 | |
Transfer agent fees — R6 | | | 152 | |
Trustees’ and officers’ fees and benefits | | | 23,872 | |
Registration and filing fees | | | 78,184 | |
Professional services fees | | | 56,492 | |
Other | | | 41,620 | |
Total expenses | | | 809,906 | |
Less: Fees waived, expenses reimbursed and expense offset arrangement(s) | | | (216,240 | ) |
Net expenses | | | 593,666 | |
Net investment income | | | 2,928,911 | |
| |
Realized and unrealized gain (loss) from: | | | | |
Net realized gain (loss) from: | | | | |
Investment securities | | | (3,660,868 | ) |
Foreign currencies | | | (226,085 | ) |
| | | | (3,886,953 | ) |
Change in net unrealized appreciation (depreciation) of: | | | | |
Investment securities (net of foreign taxes on holdings of $12,174) | | | (677,923 | ) |
Foreign currencies | | | (44,219 | ) |
Forward foreign currency contracts | | | 74,407 | |
| | | | (647,735 | ) |
Net realized and unrealized gain (loss) | | | (4,534,688 | ) |
Net increase (decrease) in net assets resulting from operations | | $ | (1,605,777 | ) |
See accompanying Notes to Financial Statements which are an integral part of the financial statements.
13 Invesco Emerging Market Local Currency Debt Fund
Statement of Changes in Net Assets
For the years ended October 31, 2014 and 2013
| | | | | | | | |
| | | 2014 | | | 2013 | |
Operations: | | | | | | | | |
Net investment income | | $ | 2,928,911 | | | $ | 2,883,711 | |
Net realized gain (loss) | | | (3,886,953 | ) | | | (1,350,657 | ) |
Change in net unrealized appreciation (depreciation) | | | (647,735 | ) | | | (3,675,975 | ) |
Net increase (decrease) in net assets resulting from operations | | | (1,605,777 | ) | | | (2,142,921 | ) |
| | |
Distributions to shareholders from net investment income: | | | | | | | | |
Class A | | | (94,246 | ) | | | (513,979 | ) |
Class B | | | (2,855 | ) | | | (17,697 | ) |
Class C | | | (9,449 | ) | | | (97,142 | ) |
Class R | | | (6,808 | ) | | | (21,062 | ) |
Class Y | | | (717 | ) | | | (78,673 | ) |
Class R5 | | | (3,164 | ) | | | (13,807 | ) |
Class R6 | | | (241,187 | ) | | | (1,024,411 | ) |
Total distributions from net investment income | | | (358,426 | ) | | | (1,766,771 | ) |
| | |
Return of capital: | | | | | | | | |
Class A | | | (337,513 | ) | | | (196,001 | ) |
Class B | | | (12,582 | ) | | | (9,010 | ) |
Class C | | | (80,754 | ) | | | (49,873 | ) |
Class R | | | (16,593 | ) | | | (9,168 | ) |
Class Y | | | (104,758 | ) | | | (27,619 | ) |
Class R5 | | | (6,694 | ) | | | (4,929 | ) |
Class R6 | | | (1,427,178 | ) | | | (367,935 | ) |
Total return of capital | | | (1,986,072 | ) | | | (664,535 | ) |
| | |
Share transactions–net: | | | | | | | | |
Class A | | | (2,698,730 | ) | | | (29,568 | ) |
Class B | | | (182,834 | ) | | | (227,157 | ) |
Class C | | | (1,043,278 | ) | | | (27,294 | ) |
Class R | | | (268,622 | ) | | | (107,790 | ) |
Class Y | | | 1,522,783 | | | | (92,115 | ) |
Class R5 | | | (87,031 | ) | | | (132,646 | ) |
Class R6 | | | 9,033,125 | | | | 5,022,774 | |
Net increase in net assets resulting from share transactions | | | 6,275,413 | | | | 4,406,204 | |
Net increase (decrease) in net assets | | | 2,325,138 | | | | (168,023 | ) |
| | |
Net assets: | | | | | | | | |
Beginning of year | | | 52,821,375 | | | | 52,989,398 | |
End of year (includes undistributed net investment income of $(19,724) and $(15,989), respectively) | | $ | 55,146,513 | | | $ | 52,821,375 | |
Notes to Financial Statements
October 31, 2014
NOTE 1—Significant Accounting Policies
Invesco Emerging Market Local Currency Debt Fund (the “Fund”) is a series portfolio of AIM Investment Funds (Invesco Investment Funds) (the “Trust”). The Trust is organized as a Delaware statutory trust and is registered under the Investment Company Act of 1940, as amended (the “1940 Act”), as an open-end series management investment company consisting of twenty-four separate series portfolios, each authorized to issue an unlimited number of shares of beneficial interest. The assets, liabilities and operations of each portfolio are accounted for separately. Information presented in these financial statements pertains only to the Fund. Matters affecting each portfolio or class will be voted on exclusively by the shareholders of such portfolio or class.
The Fund’s investment objective is total return through growth of capital and current income.
14 Invesco Emerging Market Local Currency Debt Fund
The Fund currently consists of seven different classes of shares: Class A, Class B, Class C, Class R, Class Y, Class R5 and Class R6. Class A shares are sold with a front-end sales charge unless certain waiver criteria are met and under certain circumstances load waived shares may be subject to contingent deferred sales charges (“CDSC”). Class C shares are sold with a CDSC. Class R, Class Y, Class R5 and Class R6 shares are sold at net asset value. Effective November 30, 2010, new or additional investments in Class B shares are no longer permitted. Existing shareholders of Class B shares may continue to reinvest dividends and capital gains distributions in Class B shares until they convert to Class A shares. Also, shareholders in Class B shares will be able to exchange those shares for Class B shares of other Invesco Funds offering such shares until they convert to Class A shares. Generally, Class B shares will automatically convert to Class A shares on or about the month-end, which is at least eight years after the date of purchase. Redemption of Class B shares prior to the conversion date will be subject to a CDSC.
The following is a summary of the significant accounting policies followed by the Fund in the preparation of its financial statements.
| A. | Security Valuations — Securities, including restricted securities, are valued according to the following policy. |
A security listed or traded on an exchange (except convertible securities) is valued at its last sales price or official closing price as of the close of the customary trading session on the exchange where the security is principally traded, or lacking any sales or official closing price on a particular day, the security may be valued at the closing bid price on that day. Securities traded in the over-the-counter market are valued based on prices furnished by independent pricing services or market makers. When such securities are valued by an independent pricing service they may be considered fair valued. Futures contracts are valued at the final settlement price set by an exchange on which they are principally traded. Listed options are valued at the mean between the last bid and ask prices from the exchange on which they are principally traded. Options not listed on an exchange are valued by an independent source at the mean between the last bid and ask prices. For purposes of determining net asset value per share, futures and option contracts generally are valued 15 minutes after the close of the customary trading session of the New York Stock Exchange (“NYSE”).
Investments in open-end and closed-end registered investment companies that do not trade on an exchange are valued at the end of day net asset value per share. Investments in open-end and closed-end registered investment companies that trade on an exchange are valued at the last sales price or official closing price as of the close of the customary trading session on the exchange where the security is principally traded.
Debt obligations (including convertible securities) and unlisted equities are fair valued using an evaluated quote provided by an independent pricing service. Evaluated quotes provided by the pricing service may be determined without exclusive reliance on quoted prices, and may reflect appropriate factors such as institution-size trading in similar groups of securities, developments related to specific securities, dividend rate (for unlisted equities), yield (for debt obligations), quality, type of issue, coupon rate (for debt obligations), maturity (for debt obligations), individual trading characteristics and other market data. Debt obligations are subject to interest rate and credit risks. In addition, all debt obligations involve some risk of default with respect to interest and/or principal payments.
Foreign securities’ (including foreign exchange contracts) prices are converted into U.S. dollar amounts using the applicable exchange rates as of the close of the NYSE. If market quotations are available and reliable for foreign exchange-traded equity securities, the securities will be valued at the market quotations. Because trading hours for certain foreign securities end before the close of the NYSE, closing market quotations may become unreliable. If between the time trading ends on a particular security and the close of the customary trading session on the NYSE, events occur that the Adviser determines are significant and make the closing price unreliable, the Fund may fair value the security. If the event is likely to have affected the closing price of the security, the security will be valued at fair value in good faith using procedures approved by the Board of Trustees. Adjustments to closing prices to reflect fair value may also be based on a screening process of an independent pricing service to indicate the degree of certainty, based on historical data, that the closing price in the principal market where a foreign security trades is not the current value as of the close of the NYSE. Foreign securities’ prices meeting the approved degree of certainty that the price is not reflective of current value will be priced at the indication of fair value from the independent pricing service. Multiple factors may be considered by the independent pricing service in determining adjustments to reflect fair value and may include information relating to sector indices, American Depositary Receipts and domestic and foreign index futures. Foreign securities may have additional risks including exchange rate changes, potential for sharply devalued currencies and high inflation, political and economic upheaval, the relative lack of issuer information, relatively low market liquidity and the potential lack of strict financial and accounting controls and standards.
Securities for which market prices are not provided by any of the above methods may be valued based upon quotes furnished by independent sources. The last bid price may be used to value equity securities. The mean between the last bid and ask prices is used to value debt obligations, including corporate loans.
Securities for which market quotations are not readily available or became unreliable are valued at fair value as determined in good faith by or under the supervision of the Trust’s officers following procedures approved by the Board of Trustees. Issuer specific events, market trends, bid/ask quotes of brokers and information providers and other market data may be reviewed in the course of making a good faith determination of a security’s fair value.
The Fund may invest in securities that are subject to interest rate risk, meaning the risk that the prices will generally fall as interest rates rise and, conversely, the prices will generally rise as interest rates fall. Specific securities differ in their sensitivity to changes in interest rates depending on their individual characteristics. Changes in interest rates may result in increased market volatility, which may affect the value and/or liquidity of certain of the Fund’s investments.
Valuations change in response to many factors including the historical and prospective earnings of the issuer, the value of the issuer’s assets, general economic conditions, interest rates, investor perceptions and market liquidity. Because of the inherent uncertainties of valuation, the values reflected in the financial statements may materially differ from the value received upon actual sale of those investments.
| B. | Securities Transactions and Investment Income — Securities transactions are accounted for on a trade date basis. Realized gains or losses on sales are computed on the basis of specific identification of the securities sold. Interest income (net of withholding tax, if any) is recorded on the accrual basis from settlement date. Dividend income (net of withholding tax, if any) is recorded on the ex-dividend date. Bond premiums and discounts are amortized and/or accreted for financial reporting purposes. |
The Fund may periodically participate in litigation related to Fund investments. As such, the Fund may receive proceeds from litigation settlements. Any proceeds received are included in the Statement of Operations as realized gain (loss) for investments no longer held and as unrealized gain (loss) for investments still held.
15 Invesco Emerging Market Local Currency Debt Fund
Brokerage commissions and mark ups are considered transaction costs and are recorded as an increase to the cost basis of securities purchased and/or a reduction of proceeds on a sale of securities. Such transaction costs are included in the determination of net realized and unrealized gain (loss) from investment securities reported in the Statement of Operations and the Statement of Changes in Net Assets and the net realized and unrealized gains (losses) on securities per share in the Financial Highlights. Transaction costs are included in the calculation of the Fund’s net asset value and, accordingly, they reduce the Fund’s total returns. These transaction costs are not considered operating expenses and are not reflected in net investment income reported in the Statement of Operations and Statement of Changes in Net Assets, or the net investment income per share and ratios of expenses and net investment income reported in the Financial Highlights, nor are they limited by any expense limitation arrangements between the Fund and the investment adviser.
The Fund allocates income and realized and unrealized capital gains and losses to a class based on the relative net assets of each class.
| C. | Country Determination — For the purposes of making investment selection decisions and presentation in the Schedule of Investments, the investment adviser may determine the country in which an issuer is located and/or credit risk exposure based on various factors. These factors include the laws of the country under which the issuer is organized, where the issuer maintains a principal office, the country in which the issuer derives 50% or more of its total revenues and the country that has the primary market for the issuer’s securities, as well as other criteria. Among the other criteria that may be evaluated for making this determination are the country in which the issuer maintains 50% or more of its assets, the type of security, financial guarantees and enhancements, the nature of the collateral and the sponsor organization. Country of issuer and/or credit risk exposure has been determined to be the United States of America, unless otherwise noted. |
| D. | Distributions — Distributions from net investment income, if any, are declared and paid monthly. Distributions from net realized capital gain, if any, are generally declared and paid annually and recorded on the ex-dividend date. The Fund may elect to treat a portion of the proceeds from redemptions as distributions for federal income tax purposes. |
| E. | Federal Income Taxes — The Fund intends to comply with the requirements of Subchapter M of the Internal Revenue Code of 1986, as amended (the “Internal Revenue Code”), necessary to qualify as a regulated investment company and to distribute substantially all of the Fund’s taxable earnings to shareholders. As such, the Fund will not be subject to federal income taxes on otherwise taxable income (including net realized capital gain) that is distributed to shareholders. Therefore, no provision for federal income taxes is recorded in the financial statements. |
The Fund recognizes the tax benefits of uncertain tax positions only when the position is more likely than not to be sustained. Management has analyzed the Fund’s uncertain tax positions and concluded that no liability for unrecognized tax benefits should be recorded related to uncertain tax positions. Management is not aware of any tax positions for which it is reasonably possible that the total amounts of unrecognized tax benefits will change materially in the next 12 months.
The Fund files tax returns in the U.S. Federal jurisdiction and certain other jurisdictions. Generally, the Fund is subject to examinations by such taxing authorities for up to three years after the filing of the return for the tax period.
| F. | Expenses — Fees provided for under the Rule 12b-1 plan of a particular class of the Fund are charged to the operations of such class. Transfer agency fees and expenses and other shareholder recordkeeping fees and expenses attributable to Class R5 and Class R6 are allocated to each share class based on relative net assets. Sub-accounting fees attributable to Class R5 are charged to the operations of the class. Transfer agency fees and expenses and other shareholder recordkeeping fees and expenses relating to all other classes are allocated among those classes based on relative net assets. All other expenses are allocated among the classes based on relative net assets. |
| G. | Accounting Estimates — The preparation of financial statements in conformity with accounting principles generally accepted in the United States of America (“GAAP”) requires management to make estimates and assumptions that affect the reported amounts of assets and liabilities at the date of the financial statements and the reported amounts of revenues and expenses during the reporting period including estimates and assumptions related to taxation. Actual results could differ from those estimates by a significant amount. In addition, the Fund monitors for material events or transactions that may occur or become known after the period-end date and before the date the financial statements are released to print. |
| H. | Indemnifications — Under the Trust’s organizational documents, each Trustee, officer, employee or other agent of the Trust is indemnified against certain liabilities that may arise out of the performance of their duties to the Fund. Additionally, in the normal course of business, the Fund enters into contracts, including the Fund’s servicing agreements, that contain a variety of indemnification clauses. The Fund’s maximum exposure under these arrangements is unknown as this would involve future claims that may be made against the Fund that have not yet occurred. The risk of material loss as a result of such indemnification claims is considered remote. |
| I. | Treasury Inflation-Protected Securities — The Fund may invest in Treasury Inflation-Protected Securities (“TIPS”). TIPS are fixed income securities whose principal value is periodically adjusted to the rate of inflation. The principal value of TIPS will be adjusted upward or downward, and any increase or decrease in the principal amount of TIPS will be included as interest income in the Statement of Operations, even though investors do not receive their principal until maturity. |
| J. | Foreign Currency Translations — Foreign currency is valued at the close of the NYSE based on quotations posted by banks and major currency dealers. Portfolio securities and other assets and liabilities denominated in foreign currencies are translated into U.S. dollar amounts at date of valuation. Purchases and sales of portfolio securities (net of foreign taxes withheld on disposition) and income items denominated in foreign currencies are translated into U.S. dollar amounts on the respective dates of such transactions. The Fund does not separately account for the portion of the results of operations resulting from changes in foreign exchange rates on investments and the fluctuations arising from changes in market prices of securities held. The combined results of changes in foreign exchange rates and the fluctuation of market prices on investments (net of estimated foreign tax withholding) are included with the net realized and unrealized gain or loss from investments in the Statement of Operations. Reported net realized foreign currency gains or losses arise from (1) sales of foreign currencies, (2) currency gains or losses realized between the trade and settlement dates on securities transactions, and (3) the difference between the amounts of dividends, interest, and foreign withholding taxes recorded on the Fund’s books and the U.S. dollar equivalent of the amounts actually received or paid. Net unrealized foreign currency gains and losses arise from changes in the fair values of assets and liabilities, other than investments in securities at fiscal period end, resulting from changes in exchange rates. |
The Fund may invest in foreign securities, which may be subject to foreign taxes on income, gains on investments or currency repatriation, a portion of which may be recoverable. Foreign taxes, if any, are recorded based on the tax regulations and rates that exist in the foreign markets in which the Fund invests and are shown in the Statement of Operations.
16 Invesco Emerging Market Local Currency Debt Fund
| K. | Forward Foreign Currency Contracts — The Fund may engage in foreign currency transactions either on a spot (i.e. for prompt delivery and settlement) basis or through forward foreign currency contracts to manage or minimize currency or exchange rate risk. |
The Fund may also enter into forward foreign currency contracts for the purchase or sale of a security denominated in a foreign currency in order to “lock in” the U.S. dollar price of that security, or the Fund may also enter into forward foreign currency contracts that do not provide for physical settlement of the two currencies, but instead are settled by a single cash payment calculated as the difference between the agreed upon exchange rate and the spot rate at settlement based upon an agreed upon notional amount (non-deliverable forwards). The Fund will set aside liquid assets in an amount equal to daily mark-to-market obligation for forward foreign currency contracts.
A forward foreign currency contract is an obligation between two parties (“Counterparties”) to purchase or sell a specific currency for an agreed-upon price at a future date. The use of forward foreign currency contracts does not eliminate fluctuations in the price of the underlying securities the Fund owns or intends to acquire but establishes a rate of exchange in advance. Fluctuations in the value of these contracts are measured by the difference in the contract date and reporting date exchange rates and are recorded as unrealized appreciation (depreciation) until the contracts are closed. When the contracts are closed, realized gains (losses) are recorded. Realized and unrealized gains (losses) on the contracts are included in the Statement of Operations. The primary risks associated with forward foreign currency contracts include failure of the Counterparty to meet the terms of the contract and the value of the foreign currency changing unfavorably. These risks may be in excess of the amounts reflected in the Statement of Assets and Liabilities.
NOTE 2—Advisory Fees and Other Fees Paid to Affiliates
The Trust has entered into a master investment advisory agreement with Invesco Advisers, Inc. (the “Adviser” or “Invesco”). Under the terms of the investment advisory agreement, the Fund pays an advisory fee to the Adviser based on the annual rate of the Fund’s average daily net assets as follows:
| | | | |
| Average Daily Net Assets | | Rate | |
First $500 million | | | 0.75% | |
Next $500 million | | | 0.70% | |
Next $500 million | | | 0.67% | |
Over $1.5 billion | | | 0.65% | |
For the year ended October 31, 2014, the effective advisory fees incurred by the Fund was 0.75%.
Under the terms of a master sub-advisory agreement between the Adviser and each of Invesco Asset Management Deutschland GmbH, Invesco Asset Management Limited, Invesco Asset Management (Japan) Limited, Invesco Australia Limited, Invesco Hong Kong Limited, Invesco Senior Secured Management, Inc. and Invesco Canada Ltd. (collectively, the “Affiliated Sub-Advisers”) the Adviser, not the Fund, may pay 40% of the fees paid to the Adviser to any such Affiliated Sub-Adviser(s) that provide(s) discretionary investment management services to the Fund based on the percentage of assets allocated to such Sub-Adviser(s).
The Adviser has contractually agreed, through at least February 29, 2016, to waive advisory fees and/or reimburse expenses to the extent necessary to limit total annual fund operating expenses after fee waiver and/or expense reimbursement (excluding certain items discussed below) of Class A, Class B, Class C, Class R, Class Y, Class R5 and Class R6 shares to 1.24%, 1.99%, 1.99%, 1.49%, 0.99%, 0.99% and 0.99% of average daily net assets, respectively. In determining the Adviser’s obligation to waive advisory fees and/or reimburse expenses, the following expenses are not taken into account, and could cause the total annual fund operating expenses after fee waiver and/or expense reimbursement to exceed the numbers reflected above: (1) interest; (2) taxes; (3) dividend expense on short sales; (4) extraordinary or non-routine items, including litigation expenses; and (5) expenses that the Fund has incurred but did not actually pay because of an expense offset arrangement. Unless Invesco continues the fee waiver agreement, it will terminate on February 29, 2016. The fee waiver agreement cannot be terminated during its term.
Further, the Adviser has contractually agreed, through at least June 30, 2016, to waive the advisory fee payable by the Fund in an amount equal to 100% of the net advisory fees the Adviser receives from the affiliated money market funds on investments by the Fund of uninvested cash in such affiliated money market funds.
For the year ended October 31, 2014, the Adviser waived advisory fees of $169,080 and reimbursed class level expenses of $29,735, $1,292, $7,572, $1,724, $6,562, $24 and $151 for Class A, Class B, Class C, Class R, Class Y, Class R5 and Class R6 shares, respectively.
The Trust has entered into a master administrative services agreement with Invesco pursuant to which the Fund has agreed to pay Invesco for certain administrative costs incurred in providing accounting services to the Fund. For the year ended October 31, 2014, expenses incurred under the agreement are shown in the Statement of Operations as Administrative services fees.
The Trust has entered into a transfer agency and service agreement with Invesco Investment Services, Inc. (“IIS”) pursuant to which the Fund has agreed to pay IIS a fee for providing transfer agency and shareholder services to the Fund and reimburse IIS for certain expenses incurred by IIS in the course of providing such services. IIS may make payments to intermediaries that provide omnibus account services, sub-accounting services and/or networking services. All fees payable by IIS to intermediaries that provide omnibus account services or sub-accounting are charged back to the Fund, subject to certain limitations approved by the Trust’s Board of Trustees. For the year ended October 31, 2014, expenses incurred under the agreement are shown in the Statement of Operations as Transfer agent fees.
The Trust has entered into master distribution agreements with Invesco Distributors, Inc. (“IDI”) to serve as the distributor for the Class A, Class B, Class C, Class R, Class Y, Class R5 and Class R6 shares of the Fund. The Trust has adopted plans pursuant to Rule 12b-1 under the 1940 Act with respect to the Fund’s Class A, Class B, Class C and Class R shares (collectively, the “Plans”). The Fund, pursuant to the Plans, pays IDI compensation at the annual rate of 0.25% of the Fund’s average daily net assets of Class A shares, 1.00% of the average daily net assets of Class B and Class C shares and 0.50% of the average daily net assets of Class R shares. Of the Plan payments, up to 0.25% of the average daily net assets of each class of shares may be paid to furnish continuing personal shareholder services to customers who purchase and own shares of such classes. Any amounts not paid as a service fee under the Plans would constitute an asset-based sales charge. Rules of the Financial Industry Regulatory Authority (“FINRA”) impose a cap on the total sales charges, including asset-based sales charges, that may be paid by any class of shares of the Fund. For the year ended October 31, 2014, expenses incurred under the Plans are shown in the Statement of Operations as Distribution fees.
17 Invesco Emerging Market Local Currency Debt Fund
Front-end sales commissions and CDSC (collectively, the “sales charges”) are not recorded as expenses of the Fund. Front-end sales commissions are deducted from proceeds from the sales of Fund shares prior to investment in Class A shares of the Fund. CDSC are deducted from redemption proceeds prior to remittance to the shareholder. During the year ended October 31, 2014, IDI advised the Fund that IDI retained $1,389 in front-end sales commissions from the sale of Class A shares and $321, $659 and $140 from Class A, Class B and Class C shares, respectively, for CDSC imposed on redemptions by shareholders.
Certain officers and trustees of the Trust are officers and directors of the Adviser, IIS and/or IDI.
NOTE 3—Additional Valuation Information
GAAP defines fair value as the price that would be received to sell an asset or paid to transfer a liability in an orderly transaction between market participants at the measurement date, under current market conditions. GAAP establishes a hierarchy that prioritizes the inputs to valuation methods, giving the highest priority to readily available unadjusted quoted prices in an active market for identical assets (Level 1) and the lowest priority to significant unobservable inputs (Level 3), generally when market prices are not readily available or are unreliable. Based on the valuation inputs, the securities or other investments are tiered into one of three levels. Changes in valuation methods may result in transfers in or out of an investment’s assigned level:
| | Level 1 — | Prices are determined using quoted prices in an active market for identical assets. |
| | Level 2 — | Prices are determined using other significant observable inputs. Observable inputs are inputs that other market participants may use in pricing a security. These may include quoted prices for similar securities, interest rates, prepayment speeds, credit risk, yield curves, loss severities, default rates, discount rates, volatilities and others. |
| | Level 3 — | Prices are determined using significant unobservable inputs. In situations where quoted prices or observable inputs are unavailable (for example, when there is little or no market activity for an investment at the end of the period), unobservable inputs may be used. Unobservable inputs reflect the Fund’s own assumptions about the factors market participants would use in determining fair value of the securities or instruments and would be based on the best available information. |
The following is a summary of the tiered valuation input levels, as of October 31, 2014. The level assigned to the securities valuations may not be an indication of the risk or liquidity associated with investing in those securities. Because of the inherent uncertainties of valuation, the values reflected in the financial statements may materially differ from the value received upon actual sale of those investments.
| | | | | | | | | | | | | | | | |
| | | Level 1 | | | Level 2 | | | Level 3 | | | Total | |
Money Market Funds | | $ | 1,221,724 | | | $ | — | | | $ | — | | | $ | 1,221,724 | |
Corporate Debt Securities | | | — | | | | 1,878,074 | | | | — | | | | 1,878,074 | |
Foreign Debt Securities | | | — | | | | 14,754,848 | | | | — | | | | 14,754,848 | |
Foreign Sovereign Debt Securities | | | — | | | | 35,884,979 | | | | — | | | | 35,884,979 | |
| | | | 1,221,724 | | | | 52,517,901 | | | | — | | | | 53,739,625 | |
Forward Foreign Currency Contracts* | | | — | | | | 74,407 | | | | — | | | | 74,407 | |
Total Investments | | $ | 1,221,724 | | | $ | 52,592,308 | | | $ | — | | | $ | 53,814,032 | |
| * | Unrealized appreciation. |
NOTE 4—Derivative Investments
Value of Derivative Investments at Period-End
The table below summarizes the value of the Fund’s derivative investments, detailed by primary risk exposure, held as of October 31, 2014:
| | | | | | | | |
| | | Value | |
| Risk Exposure/Derivative Type | | Assets | | | Liabilities | |
Currency risk: | | | | | | | | |
Forward foreign currency contracts(a) | | $ | 75,016 | | | $ | (609 | ) |
| (a) | Values are disclosed on the Statement of Assets and Liabilities under the caption Forward foreign currency contracts outstanding. |
Effect of Derivative Investments for the year ended October 31, 2014
The table below summarizes the gains on derivative investments, detailed by primary risk exposure, recognized in earnings during the period:
| | | | |
| | | Location of Gain on
Statement of Operations | |
| | Forward Foreign
Currency Contracts | |
Change in Unrealized Appreciation: | | | | |
Currency risk | | $ | 74,407 | |
The table below summarizes the average notional value of forward foreign currency contracts outstanding during the period.
| | | | |
| | | Forward Foreign
Currency Contracts | |
Average notional value | | $ | 2,548,052 | |
18 Invesco Emerging Market Local Currency Debt Fund
| | | | | | | | | | | | | | | | | | | | | | | | | | |
| Open Forward Foreign Currency Contracts | |
Settlement
Date | | Counterparty | | Contract to | | | Notional
Value | | | Unrealized
Appreciation
(Depreciation) | |
| | | Deliver | | | Receive | | | |
11/24/2014 | | Barclays Bank PLC | | | USD | | | | 550,000 | | | | ZAR | | | | 6,096,035 | | | $ | 550,700 | | | $ | 700 | |
11/24/2014 | | Barclays Bank PLC | | | USD | | | | 550,000 | | | | TRY | | | | 1,240,910 | | | | 555,234 | | | | 5,234 | |
11/28/2014 | | Barclays Bank PLC | | | USD | | | | 550,000 | | | | CLP | | | | 319,605,000 | | | | 551,415 | | | | 1,415 | |
11/28/2014 | | Barclays Bank PLC | | | EUR | | | | 860,000 | | | | PLN | | | | 3,634,670 | | | | 1,093,199 | | | | (609 | ) |
11/28/2014 | | J.P. Morgan Securities Inc. | | | EUR | | | | 1,000,000 | | | | USD | | | | 1,321,039 | | | | 1,253,372 | | | | 67,667 | |
Total open forward foreign currency contracts — Currency Risk | | | | | | | | | | | | | | | | | | | | | | $ | 74,407 | |
Currency Abbreviations:
| | |
| CLP | | – Chilean Peso |
| PLN | | – Poland Zloty |
| | |
| USD | | – U.S. Dollar |
| EUR | | – Euro |
| | |
| TRY | | – Turkish Lira |
| ZAR | | – South African Rand |
Offsetting Assets and Liabilities
Accounting Standards Update (“ASU”) No. 2011-11, Disclosures about Offsetting Assets and Liabilities, which was subsequently clarified in Financial Accounting Standards Board ASU 2013-01 “Clarifying the Scope of Disclosures about Offsetting Assets and Liabilities” is intended to enhance disclosures about financial instruments and derivative instruments that are subject to offsetting arrangements on the Statement of Assets and Liabilities and to enable investors to better understand the effect of those arrangements on its financial position. In order for an arrangement to be eligible for netting, the Fund must have a basis to conclude that such netting arrangements are legally enforceable. The Fund enters into netting agreements and collateral agreements in an attempt to reduce the Fund’s Counterparty credit risk by providing for a single net settlement with a Counterparty of all financial transactions covered by the agreement in an event of default as defined under such agreement.
There were no derivative instruments subject to a netting agreement for which the Fund is not currently netting. The following tables present derivative instruments that are either subject to an enforceable netting agreement or offset by collateral arrangements as of October 31, 2014.
| | | | | | | | | | | | | | | | | | | | | | | | |
| Assets: | |
| | | Gross amounts
presented in
Statement of
Assets & Liabilities | | | Gross amounts
offset in
Statement of
Assets & Liabilities | | | Net amounts of assets
presented in the
Statement of Assets &
Liabilities | | | Collateral Received | | | | |
| Counterparty | | | | | Financial
Instruments | | | Cash | | | Net
Amount | |
Barclays Bank PLC | | $ | 7,349 | | | $ | (609 | ) | | $ | 6,740 | | | $ | — | | | $ | — | | | $ | 6,740 | |
J.P. Morgan Securities Inc. | | | 67,667 | | | | — | | | | 67,667 | | | | — | | | | — | | | | 67,667 | |
Total | | $ | 75,016 | | | $ | (609 | ) | | $ | 74,407 | | | $ | — | | | $ | — | | | $ | 74,407 | |
| | | | | | |
| | | | | | | | | | | | | | | | | | | | | | | | |
| Liabilities: | |
| | | Gross amounts
presented in
Statement of
Assets & Liabilities | | | Gross amounts
offset in
Statement of
Assets & Liabilities | | | Net amounts of liabilities
presented in the
Statement of Assets &
Liabilities | | | Collateral Pledged | | | | |
| Counterparty | | | | | Financial
Instruments | | | Cash | | | Net
Amount | |
Barclays Bank PLC | | $ | 609 | | | $ | (609 | ) | | $ | — | | | $ | — | | | $ | — | | | $ | — | |
NOTE 5—Expense Offset Arrangement(s)
The expense offset arrangement is comprised of transfer agency credits which result from balances in demand deposit accounts used by the transfer agent for clearing shareholder transactions. For the year ended October 31, 2014, the Fund received credits from this arrangement, which resulted in the reduction of the Fund’s total expenses of $100.
NOTE 6—Trustees’ and Officers’ Fees and Benefits
Trustees’ and Officers’ Fees and Benefits include amounts accrued by the Fund to pay remuneration to certain Trustees and Officers of the Fund. Trustees have the option to defer compensation payable by the Fund, and Trustees’ and Officers’ Fees and Benefits also include amounts accrued by the Fund to fund such deferred compensation amounts. Those Trustees who defer compensation have the option to select various Invesco Funds in which their deferral accounts shall be deemed to be invested. Finally, certain current Trustees were eligible to participate in a retirement plan that provided for benefits to be paid upon retirement to Trustees over a period of time based on the number of years of service. The Fund may have certain former Trustees who also participate in a retirement plan and receive benefits under such plan. Trustees’ and Officers’ Fees and Benefits include amounts accrued by the Fund to fund such retirement benefits. Obligations under the deferred compensation and retirement plans represent unsecured claims against the general assets of the Fund.
NOTE 7—Cash Balances
The Fund is permitted to temporarily carry a negative or overdrawn balance in its account with State Street Bank and Trust Company, the custodian bank. Such balances, if any at period end, are shown in the Statement of Assets and Liabilities under the payable caption Amount due custodian. To compensate the custodian bank for such overdrafts, the overdrawn Fund may either (1) leave funds as a compensating balance in the account so the custodian bank can be compensated by earning the additional interest; or (2) compensate by paying the custodian bank at a rate agreed upon by the custodian bank and Invesco, not to exceed the contractually agreed upon rate.
19 Invesco Emerging Market Local Currency Debt Fund
NOTE 8—Distributions to Shareholders and Tax Components of Net Assets
Tax Character of Distributions to Shareholders Paid During the Fiscal Years Ended October 31, 2014 and 2013:
| | | | | | | | |
| | | 2014 | | | 2013 | |
Ordinary income | | $ | 358,426 | | | $ | 1,766,771 | |
Return of Capital | | | 1,986,072 | | | | 664,535 | |
Total distributions | | $ | 2,344,498 | | | $ | 2,431,306 | |
Tax Components of Net Assets at Period-End:
| | | | |
| | | 2014 | |
Net unrealized appreciation (depreciation) — investments | | $ | (3,788,401 | ) |
Net unrealized appreciation (depreciation) — other investments | | | (66,166 | ) |
Temporary book/tax differences | | | (19,724 | ) |
Capital loss carryforward | | | (791,349 | ) |
Shares of beneficial interest | | | 59,812,153 | |
Total net assets | | $ | 55,146,513 | |
The difference between book-basis and tax-basis unrealized appreciation (depreciation) is due to differences in the timing of recognition of gains and losses on investments for tax and book purposes. The Fund’s net unrealized appreciation difference is attributable primarily to wash sales.
The temporary book/tax differences are a result of timing differences between book and tax recognition of income and/or expenses. The Fund’s temporary book/tax differences are the result of the trustee deferral of compensation and retirement plan benefits.
Capital loss carryforward is calculated and reported as of a specific date. Results of transactions and other activity after that date may affect the amount of capital loss carryforward actually available for the Fund to utilize. Capital losses generated in years beginning after December 22, 2010 can be carried forward for an unlimited period, whereas previous losses expire in 8 tax years. Capital losses with an expiration period may not be used to offset capital gains until all net capital losses without an expiration date have been utilized. Capital loss carryforwards with no expiration date will retain their character as either short-term or long-term capital losses instead of as short-term capital losses as under prior law. The ability to utilize capital loss carryforwards in the future may be limited under the Internal Revenue Code and related regulations based on the results of future transactions.
The Fund has a capital loss carryforward as of October 31, 2014, which expires as follows:
| | | | | | | | | | | | |
| Capital Loss Carryforward* | |
| Expiration | | Short-Term | | | Long-Term | | | Total | |
Not subject to expiration | | $ | 442,811 | | | $ | 348,538 | | | $ | 791,349 | |
| * | Capital loss carryforward as of the date listed above is reduced for limitations, if any, to the extent required by the Internal Revenue Code and may be further limited depending upon a variety of factors, including the realization of net unrealized gains or losses as of the date of any reorganization. |
NOTE 9—Investment Securities
The aggregate amount of investment securities (other than short-term securities, U.S. Treasury obligations and money market funds, if any) purchased and sold by the Fund during the year ended October 31, 2014 was $41,225,180 and $35,441,710, respectively. Cost of investments on a tax basis includes the adjustments for financial reporting purposes as of the most recently completed federal income tax reporting period-end.
| | | | |
| Unrealized Appreciation (Depreciation) of Investment Securities on a Tax Basis | |
Aggregate unrealized appreciation of investment securities | | $ | 873,798 | |
Aggregate unrealized (depreciation) of investment securities | | | (4,662,199 | ) |
Net unrealized appreciation (depreciation) of investment securities | | $ | (3,788,401 | ) |
Cost of investments for tax purposes is $57,528,026.
NOTE 10—Reclassification of Permanent Differences
Primarily as a result of differing book/tax treatment of foreign currency transactions and return of capital distributions, on October 31, 2014, undistributed net investment income was decreased by $588,148, undistributed net realized gain (loss) was increased by $3,242,966 and shares of beneficial interest was decreased by $2,654,818. This reclassification had no effect on the net assets of the Fund.
20 Invesco Emerging Market Local Currency Debt Fund
NOTE 11—Share Information
| | | | | | | | | | | | | | | | |
| | | Summary of Share Activity | |
| | | Years ended October 31, | |
| | | 2014(a) | | | 2013 | |
| | | Shares | | | Amount | | | Shares | | | Amount | |
Sold: | | | | | | | | | | | | | | | | |
Class A | | | 321,070 | | | $ | 2,828,536 | | | | 1,107,025 | | | $ | 11,008,113 | |
Class B | | | 1,439 | | | | 12,454 | | | | 28,496 | | | | 283,509 | |
Class C | | | 45,525 | | | | 401,566 | | | | 209,537 | | | | 2,082,129 | |
Class R | | | 4,893 | | | | 42,740 | | | | 29,870 | | | | 297,718 | |
Class Y | | | 431,545 | | | | 3,732,173 | | | | 309,720 | | | | 3,109,464 | |
Class R5 | | | 10,888 | | | | 94,010 | | | | 22,179 | | | | 221,299 | |
Class R6 | | | 1,094,766 | | | | 9,395,035 | | | | 572,154 | | | | 5,356,845 | |
| | | | |
Issued as reinvestment of dividends: | | | | | | | | | | | | | | | | |
Class A | | | 37,699 | | | | 329,768 | | | | 52,555 | | | | 510,456 | |
Class B | | | 1,571 | | | | 13,739 | | | | 2,370 | | | | 23,056 | |
Class C | | | 8,028 | | | | 70,247 | | | | 12,046 | | | | 116,746 | |
Class R | | | 2,638 | | | | 23,048 | | | | 3,086 | | | | 29,844 | |
Class Y | | | 3,740 | | | | 32,713 | | | | 7,308 | | | | 71,356 | |
Class R5 | | | 1,081 | | | | 9,459 | | | | 1,878 | | | | 18,246 | |
Class R6 | | | 191,001 | | | | 1,668,365 | | | | 144,242 | | | | 1,392,346 | |
| | | | |
Automatic conversion of Class B shares to Class A shares: | | | | | | | | | | | | | | | | |
Class A | | | 5,777 | | | | 50,624 | | | | 9,278 | | | | 91,044 | |
Class B | | | (5,783 | ) | | | (50,624 | ) | | | (9,288 | ) | | | (91,044 | ) |
| | | | |
Reacquired: | | | | | | | | | | | | | | | | |
Class A | | | (677,777 | ) | | | (5,907,658 | ) | | | (1,224,108 | ) | | | (11,639,181 | ) |
Class B | | | (18,311 | ) | | | (158,403 | ) | | | (46,089 | ) | | | (442,678 | ) |
Class C | | | (174,584 | ) | | | (1,515,091 | ) | | | (235,033 | ) | | | (2,226,169 | ) |
Class R | | | (37,933 | ) | | | (334,410 | ) | | | (44,080 | ) | | | (435,352 | ) |
Class Y | | | (259,214 | ) | | | (2,242,103 | ) | | | (339,280 | ) | | | (3,272,935 | ) |
Class R5 | | | (21,876 | ) | | | (190,500 | ) | | | (38,602 | ) | | | (372,191 | ) |
Class R6 | | | (231,999 | ) | | | (2,030,275 | ) | | | (177,689 | ) | | | (1,726,417 | ) |
Net increase in share activity | | | 734,184 | | | $ | 6,275,413 | | | | 397,575 | | | $ | 4,406,204 | |
| (a) | 72% of the outstanding shares of the Fund are owned by affiliated mutual funds. Affiliated mutual funds are other mutual funds that are also advised by Invesco. |
21 Invesco Emerging Market Local Currency Debt Fund
NOTE 12—Financial Highlights
The following schedule presents financial highlights for a share of the Fund outstanding throughout the periods indicated.
| | | | | | | | | | | | | | | | | | | | | | | | | | | | | | | | | | | | | | | | | | | | | | | | | | | | | | | | | | | | |
| | | Net asset
value,
beginning
of period | | | Net
investment
income(a) | | | Net gains
(losses)
on securities
(both
realized and
unrealized) | | | Total from
investment
operations | | | Dividends
from net
investment
income | | | Distributions
from net
realized
gains | | | Return
of capital | | | Total
distributions | | | Net asset
value, end
of period(b) | | | Total
return(c) | | | Net assets,
end of period
(000’s omitted) | | | Ratio of
expenses
to average
net assets
with fee waivers
and/or expenses
absorbed | | | Ratio of
expenses
to average net
assets without
fee waivers
and/or expenses
absorbed | | | Ratio of net
investment
income
to average
net assets | | | Portfolio
turnover(d) | |
Class A | | | | | | | | | | | | | | | | | | | | | | | | | | | | | | | | | | | | | | | | | | | | | | | | | | | | | | | | | | | | |
Year ended 10/31/14 | | $ | 9.17 | | | $ | 0.46 | | | $ | (0.77 | ) | | $ | (0.31 | ) | | $ | (0.06 | ) | | $ | — | | | $ | (0.31 | ) | | $ | (0.37 | ) | | $ | 8.49 | | | | (3.44 | )% | | $ | 9,379 | | | | 1.24 | %(e) | | | 1.84 | %(e) | | | 5.29 | %(e) | | | 69 | % |
Year ended 10/31/13 | | | 9.88 | | | | 0.48 | | | | (0.79 | ) | | | (0.31 | ) | | | (0.29 | ) | | | — | | | | (0.11 | ) | | | (0.40 | ) | | | 9.17 | | | | (3.25 | ) | | | 12,998 | | | | 1.24 | | | | 1.77 | | | | 4.96 | | | | 31 | |
Year ended 10/31/12 | | | 10.36 | | | | 0.50 | | | | 0.17 | | | | 0.67 | | | | (0.88 | ) | | | (0.24 | ) | | | (0.03 | ) | | | (1.15 | ) | | | 9.88 | | | | 7.50 | | | | 14,549 | | | | 1.24 | | | | 1.79 | | | | 5.17 | | | | 30 | |
Year ended 10/31/11 | | | 11.11 | | | | 0.53 | | | | (0.49 | ) | | | 0.04 | | | | (0.63 | ) | | | (0.16 | ) | | | — | | | | (0.79 | ) | | | 10.36 | | | | 0.34 | | | | 12,886 | | | | 1.23 | | | | 1.86 | | | | 4.97 | | | | 106 | |
Year ended 10/31/10(f) | | | 10.00 | | | | 0.21 | | | | 1.07 | | | | 1.28 | | | | (0.17 | ) | | | — | | | | — | | | | (0.17 | ) | | | 11.11 | | | | 12.90 | | | | 1,776 | | | | 1.24 | (g) | | | 1.76 | (g) | | | 5.06 | (g) | | | 22 | |
Class B | | | | | | | | | | | | | | | | | | | | | | | | | | | | | | | | | | | | | | | | | | | | | | | | | | | | | | | | | | | | |
Year ended 10/31/14 | | | 9.16 | | | | 0.40 | | | | (0.78 | ) | | | (0.38 | ) | | | (0.05 | ) | | | — | | | | (0.25 | ) | | | (0.30 | ) | | | 8.48 | | | | (4.17 | ) | | | 349 | | | | 1.99 | (e) | | | 2.59 | (e) | | | 4.54 | (e) | | | 69 | |
Year ended 10/31/13 | | | 9.87 | | | | 0.41 | | | | (0.79 | ) | | | (0.38 | ) | | | (0.22 | ) | | | — | | | | (0.11 | ) | | | (0.33 | ) | | | 9.16 | | | | (3.98 | ) | | | 570 | | | | 1.99 | | | | 2.52 | | | | 4.21 | | | | 31 | |
Year ended 10/31/12 | | | 10.35 | | | | 0.43 | | | | 0.17 | | | | 0.60 | | | | (0.81 | ) | | | (0.24 | ) | | | (0.03 | ) | | | (1.08 | ) | | | 9.87 | | | | 6.70 | | | | 856 | | | | 1.99 | | | | 2.54 | | | | 4.42 | | | | 30 | |
Year ended 10/31/11 | | | 11.10 | | | | 0.45 | | | | (0.49 | ) | | | (0.04 | ) | | | (0.55 | ) | | | (0.16 | ) | | | — | | | | (0.71 | ) | | | 10.35 | | | | (0.42 | ) | | | 843 | | | | 1.98 | | | | 2.61 | | | | 4.22 | | | | 106 | |
Year ended 10/31/10(f) | | | 10.00 | | | | 0.18 | | | | 1.07 | | | | 1.25 | | | | (0.15 | ) | | | — | | | | — | | | | (0.15 | ) | | | 11.10 | | | | 12.52 | | | | 455 | | | | 1.99 | (g) | | | 2.51 | (g) | | | 4.31 | (g) | | | 22 | |
Class C | | | | | | | | | | | | | | | | | | | | | | | | | | | | | | | | | | | | | | | | | | | | | | | | | | | | | | | | | | | | |
Year ended 10/31/14 | | | 9.17 | | | | 0.40 | | | | (0.78 | ) | | | (0.38 | ) | | | (0.05 | ) | | | — | | | | (0.25 | ) | | | (0.30 | ) | | | 8.49 | | | | (4.16 | ) | | | 2,244 | | | | 1.99 | (e) | | | 2.59 | (e) | | | 4.54 | (e) | | | 69 | |
Year ended 10/31/13 | | | 9.88 | | | | 0.41 | | | | (0.79 | ) | | | (0.38 | ) | | | (0.22 | ) | | | — | | | | (0.11 | ) | | | (0.33 | ) | | | 9.17 | | | | (3.97 | ) | | | 3,532 | | | | 1.99 | | | | 2.52 | | | | 4.21 | | | | 31 | |
Year ended 10/31/12 | | | 10.36 | | | | 0.43 | | | | 0.17 | | | | 0.60 | | | | (0.81 | ) | | | (0.24 | ) | | | (0.03 | ) | | | (1.08 | ) | | | 9.88 | | | | 6.70 | | | | 3,938 | | | | 1.99 | | | | 2.54 | | | | 4.42 | | | | 30 | |
Year ended 10/31/11 | | | 11.10 | | | | 0.45 | | | | (0.48 | ) | | | (0.03 | ) | | | (0.55 | ) | | | (0.16 | ) | | | — | | | | (0.71 | ) | | | 10.36 | | | | (0.33 | ) | | | 3,079 | | | | 1.98 | | | | 2.61 | | | | 4.22 | | | | 106 | |
Year ended 10/31/10(f) | | | 10.00 | | | | 0.18 | | | | 1.07 | | | | 1.25 | | | | (0.15 | ) | | | — | | | | — | | | | (0.15 | ) | | | 11.10 | | | | 12.52 | | | | 314 | | | | 1.99 | (g) | | | 2.51 | (g) | | | 4.31 | (g) | | | 22 | |
Class R | | | | | | | | | | | | | | | | | | | | | | | | | | | | | | | | | | | | | | | | | | | | | | | | | | | | | | | | | | | | |
Year ended 10/31/14 | | | 9.17 | | | | 0.44 | | | | (0.78 | ) | | | (0.34 | ) | | | (0.06 | ) | | | — | | | | (0.29 | ) | | | (0.35 | ) | | | 8.48 | | | | (3.79 | ) | | | 460 | | | | 1.49 | (e) | | | 2.09 | (e) | | | 5.04 | (e) | | | 69 | |
Year ended 10/31/13 | | | 9.87 | | | | 0.46 | | | | (0.78 | ) | | | (0.32 | ) | | | (0.27 | ) | | | — | | | | (0.11 | ) | | | (0.38 | ) | | | 9.17 | | | | (3.39 | ) | | | 776 | | | | 1.49 | | | | 2.02 | | | | 4.71 | | | | 31 | |
Year ended 10/31/12 | | | 10.36 | | | | 0.48 | | | | 0.16 | | | | 0.64 | | | | (0.86 | ) | | | (0.24 | ) | | | (0.03 | ) | | | (1.13 | ) | | | 9.87 | | | | 7.13 | | | | 946 | | | | 1.49 | | | | 2.04 | | | | 4.92 | | | | 30 | |
Year ended 10/31/11 | | | 11.11 | | | | 0.49 | | | | (0.48 | ) | | | 0.01 | | | | (0.60 | ) | | | (0.16 | ) | | | — | | | | (0.76 | ) | | | 10.36 | | | | 0.09 | | | | 386 | | | | 1.48 | | | | 2.11 | | | | 4.72 | | | | 106 | |
Year ended 10/31/10(f) | | | 10.00 | | | | 0.20 | | | | 1.07 | | | | 1.27 | | | | (0.16 | ) | | | — | | | | — | | | | (0.16 | ) | | | 11.11 | | | | 12.81 | | | | 44 | | | | 1.49 | (g) | | | 2.01 | (g) | | | 4.81 | (g) | | | 22 | |
Class Y | | | | | | | | | | | | | | | | | | | | | | | | | | | | | | | | | | | | | | | | | | | | | | | | | | | | | | | | | | | | |
Year ended 10/31/14 | | | 9.17 | | | | 0.49 | | | | (0.78 | ) | | | (0.29 | ) | | | (0.06 | ) | | | — | | | | (0.33 | ) | | | (0.39 | ) | | | 8.49 | | | | (3.20 | ) | | | 2,911 | | | | 0.99 | (e) | | | 1.59 | (e) | | | 5.54 | (e) | | | 69 | |
Year ended 10/31/13 | | | 9.88 | | | | 0.51 | | | | (0.79 | ) | | | (0.28 | ) | | | (0.32 | ) | | | — | | | | (0.11 | ) | | | (0.43 | ) | | | 9.17 | | | | (3.01 | ) | | | 1,529 | | | | 0.99 | | | | 1.52 | | | | 5.21 | | | | 31 | |
Year ended 10/31/12 | | | 10.37 | | | | 0.52 | | | | 0.17 | | | | 0.69 | | | | (0.91 | ) | | | (0.24 | ) | | | (0.03 | ) | | | (1.18 | ) | | | 9.88 | | | | 7.67 | | | | 1,867 | | | | 0.99 | | | | 1.54 | | | | 5.42 | | | | 30 | |
Year ended 10/31/11 | | | 11.11 | | | | 0.56 | | | | (0.49 | ) | | | 0.07 | | | | (0.65 | ) | | | (0.16 | ) | | | — | | | | (0.81 | ) | | | 10.37 | | | | 0.69 | | | | 1,131 | | | | 0.98 | | | | 1.61 | | | | 5.22 | | | | 106 | |
Year ended 10/31/10(f) | | | 10.00 | | | | 0.22 | | | | 1.07 | | | | 1.29 | | | | (0.18 | ) | | | — | | | | — | | | | (0.18 | ) | | | 11.11 | | | | 13.00 | | | | 432 | | | | 0.99 | (g) | | | 1.51 | (g) | | | 5.31 | (g) | | | 22 | |
Class R5 | | | | | | | | | | | | | | | | | | | | | | | | | | | | | | | | | | | | | | | | | | | | | | | | | | | | | | | | | | | | |
Year ended 10/31/14 | | | 9.16 | | | | 0.49 | | | | (0.78 | ) | | | (0.29 | ) | | | (0.06 | ) | | | — | | | | (0.33 | ) | | | (0.39 | ) | | | 8.48 | | | | (3.20 | ) | | | 186 | | | | 0.99 | (e) | | | 1.31 | (e) | | | 5.54 | (e) | | | 69 | |
Year ended 10/31/13 | �� | | 9.87 | | | | 0.51 | | | | (0.79 | ) | | | (0.28 | ) | | | (0.32 | ) | | | — | | | | (0.11 | ) | | | (0.43 | ) | | | 9.16 | | | | (3.01 | ) | | | 291 | | | | 0.99 | | | | 1.36 | | | | 5.21 | | | | 31 | |
Year ended 10/31/12 | | | 10.35 | | | | 0.52 | | | | 0.18 | | | | 0.70 | | | | (0.91 | ) | | | (0.24 | ) | | | (0.03 | ) | | | (1.18 | ) | | | 9.87 | | | | 7.78 | | | | 457 | | | | 0.99 | | | | 1.28 | | | | 5.42 | | | | 30 | |
Year ended 10/31/11 | | | 11.11 | | | | 0.56 | | | | (0.51 | ) | | | 0.05 | | | | (0.65 | ) | | | (0.16 | ) | | | — | | | | (0.81 | ) | | | 10.35 | | | | 0.50 | | | | 28,952 | | | | 0.98 | | | | 1.36 | | | | 5.22 | | | | 106 | |
Year ended 10/31/10(f) | | | 10.00 | | | | 0.21 | | | | 1.08 | | | | 1.29 | | | | (0.18 | ) | | | — | | | | — | | | | (0.18 | ) | | | 11.11 | | | | 13.00 | | | | 70,233 | | | | 0.99 | (g) | | | 1.29 | (g) | | | 5.31 | (g) | | | 22 | |
Class R6 | | | | | | | | | | | | | | | | | | | | | | | | | | | | | | | | | | | | | | | | | | | | | | | | | | | | | | | | | | | | |
Year ended 10/31/14 | | | 9.16 | | | | 0.49 | | | | (0.78 | ) | | | (0.29 | ) | | | (0.06 | ) | | | — | | | | (0.33 | ) | | | (0.39 | ) | | | 8.48 | | | | (3.21 | ) | | | 39,617 | | | | 0.99 | (e) | | | 1.30 | (e) | | | 5.54 | (e) | | | 69 | |
Year ended 10/31/13 | | | 9.87 | | | | 0.50 | | | | (0.78 | ) | | | (0.28 | ) | | | (0.32 | ) | | | — | | | | (0.11 | ) | | | (0.43 | ) | | | 9.16 | | | | (3.01 | ) | | | 33,125 | | | | 0.99 | | | | 1.29 | | | | 5.21 | | | | 31 | |
Year ended 10/31/12(f) | | | 9.83 | | | | 0.06 | | | | 0.01 | | | | 0.07 | | | | (0.00 | ) | | | — | | | | (0.03 | ) | | | (0.03 | ) | | | 9.87 | | | | 0.66 | | | | 30,375 | | | | 0.99 | (g) | | | 1.26 | (g) | | | 5.42 | (g) | | | 30 | |
| (a) | Calculated using average shares outstanding. |
| (b) | Includes redemption fees added to shares of beneficial interest for Class A, Class B, Class C, Class R, Class Y and Class R5 shares, which were less than $0.005 per share, for fiscal years ended October 31, 2012 and prior. |
| (c) | Includes adjustments in accordance with accounting principles generally accepted in the United States of America and as such, the net asset value for financial reporting purposes and the returns based upon those net asset values may differ from the net asset value and returns for shareholder transactions. Does not include sales charges and is not annualized for periods less than one year, if applicable. |
| (d) | Portfolio turnover is calculated at the fund level and is not annualized for periods less than one year, if applicable. |
| (e) | Ratios are based on average daily net assets (000’s omitted) of $10,313, $448, $2,626, $598, $2,276, $220 and $37,424 for Class A, Class B, Class C, Class R, Class Y, Class R5 and Class R6 shares, respectively. |
| (f) | Commencement date of June 16, 2010 for Class A, Class B, Class C, Class R, Class Y and Class R5 and September 24, 2012 for Class R6 shares, respectively. |
22 Invesco Emerging Market Local Currency Debt Fund
Report of Independent Registered Public Accounting Firm
To the Board of Trustees of AIM Investment Funds (Invesco Investment Funds)
and Shareholders of Invesco Emerging Markets Local Currency Debt Fund:
In our opinion, the accompanying statement of assets and liabilities, including the schedule of investments, and the related statements of operations and of changes in net assets and the financial highlights present fairly, in all material respects, the financial position of Invesco Emerging Markets Local Currency Debt Fund (one of the funds constituting AIM Investment Funds (Invesco Investment Funds), hereafter referred to as the “Fund”) at October 31, 2014, the results of its operations for the year then ended, the changes in its net assets for each of the two years in the period then ended and the financial highlights for each of the four years in the period then ended and for the period June 10, 2010 (commencement of operations) through October 31, 2010, in conformity with accounting principles generally accepted in the United States of America. These financial statements and financial highlights (hereafter referred to as “financial statements”) are the responsibility of the Fund’s management. Our responsibility is to express an opinion on these financial statements based on our audits. We conducted our audits of these financial statements in accordance with the standards of the Public Company Accounting Oversight Board (United States). Those standards require that we plan and perform the audit to obtain reasonable assurance about whether the financial statements are free of material misstatement. An audit includes examining, on a test basis, evidence supporting the amounts and disclosures in the financial statements, assessing the accounting principles used and significant estimates made by management, and evaluating the overall financial statement presentation. We believe that our audits, which included confirmation of securities at October 31, 2014 by correspondence with the custodian and brokers, and the application of alternative auditing procedures where confirmations of security purchases have not been received, provide a reasonable basis for our opinion.
PRICEWATERHOUSECOOPERS LLP
December 23, 2014
Houston, Texas
23 Invesco Emerging Market Local Currency Debt Fund
Calculating your ongoing Fund expenses
Example
As a shareholder of the Fund, you incur two types of costs: (1) transaction costs, which may include sales charges (loads) on purchase payments or contingent deferred sales charges on redemptions, if any; and (2) ongoing costs, including management fees, distribution and/or service (12b-1) fees, and other Fund expenses. This example is intended to help you understand your ongoing costs (in dollars) of investing in the Fund and to compare these costs with ongoing costs of investing in other mutual funds. The example is based on an investment of $1,000 invested at the beginning of the period and held for the entire period May 1, 2014 through October 31, 2014.
Actual expenses
The table below provides information about actual account values and actual expenses. You may use the information in this table, together with the amount you invested, to estimate the expenses that you paid over the period. Simply divide your account value by $1,000 (for example, an $8,600 account value divided by $1,000 = 8.6), then multiply the result by the number in the table under the heading entitled “Actual Expenses Paid During Period” to estimate the expenses you paid on your account during this period.
Hypothetical example for comparison purposes
The table below also provides information about hypothetical account values and hypothetical expenses based on the Fund’s actual expense ratio and an assumed rate of return of 5% per year before expenses, which is not the Fund’s actual return.
The hypothetical account values and expenses may not be used to estimate the actual ending account balance or expenses you paid for the period. You may use this information to compare the ongoing costs of investing in the Fund and other funds. To do so, compare this 5% hypothetical example with the 5% hypothetical examples that appear in the shareholder reports of the other funds.
Please note that the expenses shown in the table are meant to highlight your ongoing costs only and do not reflect any transaction costs, such as sales charges (loads) on purchase payments or contingent deferred sales charges on redemptions, if any. Therefore, the hypothetical information is useful in comparing ongoing costs only, and will not help you determine the relative total costs of owning different funds. In addition, if these transaction costs were included, your costs would have been higher.
| | | | | | | | | | | | | | | | | | | | | | | | |
| Class | | Beginning
Account Value
(05/01/14) | | | ACTUAL | | | HYPOTHETICAL (5% annual return before
expenses) | | | Annualized
Expense
Ratio | |
| | | Ending
Account Value
(10/31/14)1 | | | Expenses
Paid During
Period2 | | | Ending
Account Value
(10/31/14) | | | Expenses
Paid During
Period2 | | |
| A | | $ | 1,000.00 | | | $ | 985.20 | | | $ | 6.20 | | | $ | 1,018.95 | | | $ | 6.31 | | | | 1.24 | % |
| B | | | 1,000.00 | | | | 981.40 | | | | 9.94 | | | | 1,015.17 | | | | 10.11 | | | | 1.99 | |
| C | | | 1,000.00 | | | | 981.50 | | | | 9.94 | | | | 1,015.17 | | | | 10.11 | | | | 1.99 | |
| R | | | 1,000.00 | | | | 983.90 | | | | 7.45 | | | | 1,017.69 | | | | 7.58 | | | | 1.49 | |
| Y | | | 1,000.00 | | | | 986.40 | | | | 4.96 | | | | 1,020.21 | | | | 5.04 | | | | 0.99 | |
| R5 | | | 1,000.00 | | | | 986.40 | | | | 4.96 | | | | 1,020.21 | | | | 5.04 | | | | 0.99 | |
| R6 | | | 1,000.00 | | | | 986.40 | | | | 4.96 | | | | 1,020.21 | | | | 5.04 | | | | 0.99 | |
| 1 | The actual ending account value is based on the actual total return of the Fund for the period May 1, 2014 through October 31, 2014, after actual expenses and will differ from the hypothetical ending account value which is based on the Fund’s expense ratio and a hypothetical annual return of 5% before expenses. |
| 2 | Expenses are equal to the Fund’s annualized expense ratio as indicated above multiplied by the average account value over the period, multiplied by 184/365 to reflect the most recent fiscal half year. |
24 Invesco Emerging Market Local Currency Debt Fund
Approval of Investment Advisory and Sub-Advisory Contracts
The Board of Trustees (the Board) of AIM Investment Funds (Invesco Investment Funds) is required under the Investment Company Act of 1940, as amended, to approve annually the renewal of Invesco Emerging Market Local Currency Debt Fund’s (the Fund) investment advisory agreements. During contract renewal meetings held on June 16-17, 2014, the Board as a whole, and the disinterested or “independent” Trustees, who comprise over 75% of the Board, voting separately, approved the continuance for the Fund of the Master Investment Advisory Agreement with Invesco Advisers, Inc. (Invesco Advisers and the investment advisory agreement) and the Master Intergroup Sub-Advisory Contract for Mutual Funds with Invesco Asset Management Deutschland GmbH, Invesco Asset Management Limited, Invesco Asset Management (Japan) Limited, Invesco Australia Limited, Invesco Hong Kong Limited, Invesco Senior Secured Management, Inc. and Invesco Canada Ltd. (collectively, the Affiliated Sub-Advisers and the sub-advisory contracts) for another year, effective July 1, 2014.
In evaluating the fairness and reasonableness of compensation under the Fund’s investment advisory agreement and sub-advisory contracts, the Board considered, among other things, the factors discussed below. The Board determined that continuation of the Fund’s investment advisory agreement and the sub-advisory contracts are in the best interest of the Fund and its shareholders and that the compensation payable to Invesco Advisers and the Affiliated Sub-Advisers under the agreements is fair and reasonable.
The Board’s Fund Evaluation Process
The Board’s Investments Committee has established three Sub-Committees, each of which is primarily responsible for overseeing the management of a number of the funds advised by Invesco Advisers (the Invesco Funds). The Sub-Committees meet throughout the year to review the performance of their assigned Invesco Funds, including reviewing materials prepared under the direction of the independent Senior Officer, an officer of the Invesco Funds who reports directly to the independent Trustees. Over the course of each year, the Sub-Committees meet with portfolio managers for their assigned Invesco Funds and other members of management to review the performance, investment objective(s), policies, strategies, limitations and investment risks of these funds. The Sub-Committees meet regularly and at designated contract renewal meetings each year to conduct a review of the performance, fees, expenses and other matters related to their assigned Invesco Funds. Each Sub-Committee recommends to the Investments Committee, which in turn recommends to the full Board, whether and on what terms to
approve the continuance of each Invesco Fund’s investment advisory agreement and sub-advisory contracts for another year.
During the contract renewal process, the Trustees receive comparative performance and fee data regarding the Invesco Funds prepared by Invesco Advisers and Lipper Inc. (Lipper), an independent provider of investment company data. The Trustees also receive an independent written evaluation from the Senior Officer. The Senior Officer’s evaluation is prepared as part of his responsibility to manage the process by which the Invesco Funds’ proposed management fees are negotiated during the annual contract renewal process to ensure they are negotiated in a manner that is at arms’ length and reasonable. In addition to meetings with Invesco Advisers and fund counsel, the independent Trustees also discuss the continuance of the investment advisory agreement and sub-advisory contracts in separate sessions with the Senior Officer and with independent legal counsel.
The Trustees recognized that the advisory fee rates for the Invesco Funds are, in many cases, the result of years of review and negotiation. The Trustees’ deliberations and conclusions in a particular year may be based in part on their deliberations and conclusions regarding these arrangements throughout the year and in prior years. The Trustees’ review and conclusions are based on the comprehensive consideration of all information presented to them and are not the result of any single determinative factor. Moreover, one Trustee may have weighed a particular piece of information or factor differently than another Trustee.
The discussion below serves as the Senior Officer’s independent written evaluation with respect to the Fund’s investment advisory agreement as well as a discussion of the material factors and related conclusions that formed the basis for the Board’s approval of the Fund’s investment advisory agreement and sub-advisory contracts. Unless otherwise stated, this information is current as of June 17, 2014, and may not reflect consideration of factors that became known to the Board after that date.
Factors and Conclusions and Summary of Independent Written Fee Evaluation
| A. | Nature, Extent and Quality of Services Provided by Invesco Advisers and the Affiliated Sub-Advisers |
The Board reviewed the advisory services provided to the Fund by Invesco Advisers under the Fund’s investment advisory agreement, the performance of Invesco Advisers in providing these services, and the credentials and experience of the officers and employees of Invesco Advisers who provide these services, including the Fund’s portfolio manager or managers, with whom the Sub-Committees met during the year. The Board’s review of the
qualifications of Invesco Advisers to provide advisory services included the Board’s consideration of Invesco Advisers’ investment process oversight, independent credit analysis and investment risk management. The Board also considered non-advisory services that Invesco Advisers and its affiliates provide to the Invesco Funds such as various back office support functions, equity and fixed income trading operations, internal audit, distribution and legal and compliance.
In determining whether to continue the Fund’s investment advisory agreement, the Board considered the benefits of reapproving an existing relationship and the greater uncertainty that may be associated with entering into a new relationship. The Board concluded that the nature, extent and quality of the services provided to the Fund by Invesco Advisers are appropriate and satisfactory and consistent with the terms of the Fund’s investment advisory agreement.
The Board reviewed the services that may be provided by the Affiliated Sub-Advisers under the sub-advisory contracts and the credentials and experience of the officers and employees of the Affiliated Sub-Advisers who provide these services. The Board noted that the Affiliated Sub-Advisers have offices and personnel that are located in financial centers around the world. As a result, the Affiliated Sub-Advisers can provide research and investment analysis on the markets and economies of various countries in which the Fund may invest, make recommendations regarding securities and assist with security trades. The Board concluded that the sub-advisory contracts benefit the Fund and its shareholders by permitting Invesco Advisers to use the resources and talents of the Affiliated Sub-Advisers in managing the Fund. The Board concluded that the nature, extent and quality of the services that may be provided by the Affiliated Sub-Advisers are appropriate and satisfactory and consistent with the terms of the Fund’s sub-advisory contracts.
The Board considered Fund performance as a relevant factor in considering whether to approve the investment advisory agreement. The Board did not view Fund performance as a relevant factor in considering whether to approve the sub-advisory contracts for the Fund, as no Affiliated Sub-Adviser currently manages assets of the Fund.
The Board noted that only three calendar years of comparative performance data was available for the Fund. The Board compared the Fund’s performance during the past one and three calendar years to the performance of funds in the Lipper performance universe and against the Lipper Emerging Markets Local Currency Debt Funds Index. The Board noted that performance of Class A shares of the Fund was in the second quintile of its performance
25 Invesco Emerging Market Local Currency Debt Fund
universe for the one year period and the fourth quintile for the three year period (the first quintile being the best performing funds and the fifth quintile being the worst performing funds. The Board noted that performance of Class A shares of the Fund was below the performance of the Index for the one year period (there being no three year performance data for the Index). The Trustees also reviewed more recent Fund performance and this review did not change their conclusions.
| C. | Advisory and Sub-Advisory Fees |
The Board compared the Fund’s contractual management fee rate to the contractual management fee rates of funds in the Fund’s Lipper expense group at a common asset level. The Board noted that the contractual management fee rate for Class A shares of the Fund was below the median contractual management fee rate of funds in its expense group. The Board noted that the term “contractual management fee” may include both advisory and certain administrative services fees, but that Lipper does not provide information on a fund by fund basis as to what is included. The Board noted that Invesco Advisers does not charge the Invesco Funds for the administrative services included in the term as defined by Lipper. The Board also reviewed the methodology used by Lipper in providing expense group information, which includes using each fund’s contractual management fee schedule (including any applicable breakpoints) as reported in the most recent prospectus or statement of additional information for each fund in the expense group.
The Board noted that Invesco Advisers has contractually agreed to waive fees and/or limit expenses of the Fund through at least February 23, 2015 in an amount necessary to limit total annual operating expenses to a specified percentage of average daily net assets for each class of the Fund.
The Board also compared the Fund’s effective advisory fee rate (the advisory fee rate after advisory fee waivers and before other expense limitations/waivers) to the effective advisory fee rates of other funds advised by Invesco Advisers and its affiliates that are managed using an investment process substantially similar to the investment process used for the Fund. The Board noted that Invesco Advisers and the Affiliated Sub-Advisers manage no other mutual funds, but do manage five off-shore funds using an investment process substantially similar to the investment process used for the Fund and that the Fund’s rate was lower than the effective advisory fee rate of three funds and above the effective advisory fee rate of two funds.
The Board also considered the fees charged by Invesco Advisers and the Affiliated Sub-Advisers to a client account with investment strategies comparable to those of the Fund. The Board noted that Invesco Advisers or the Affiliated Sub-Advisers may charge lower fees to large institutional clients. Invesco Advisers reviewed with the Board the significantly greater scope of services it provides to the
Invesco Funds relative to certain other client accounts. These additional services include provision of administrative services, officers and office space, oversight of service providers, preparation of annual registration statement updates and financial information and regulatory compliance under the Investment Company Act of 1940, as amended. Invesco Advisers also reviewed generally the higher frequency of shareholder purchases and redemptions in the Invesco Funds relative to the flow of assets for other client accounts. Invesco Advisers advised the Board that advance notice of redemptions is often provided to Invesco Advisers by institutional clients. The Board did note that sub-advisory fee rates charged by the Affiliated Sub-Advisers to manage the Invesco Funds and to manage other client accounts tended to be more comparable, reflecting a more comparable scope of services. The Board concluded that the aggregate services provided to the Invesco Funds were sufficiently different from those provided to institutional clients to support the difference in fees.
The Board also considered the services that may be provided by the Affiliated Sub-Advisers pursuant to the sub-advisory contracts, as well as the fees payable by Invesco Advisers to the Affiliated Sub-Advisers pursuant to the sub-advisory contracts. The Board also noted that the sub-advisory fees are not paid directly by the Fund, but rather, are payable by Invesco Advisers to the Affiliated Sub-Advisers.
| D. | Economies of Scale and Breakpoints |
The Board considered the extent to which there are economies of scale in the provision of advisory services to the Fund. The Board also considered whether the Fund benefits from economies of scale through contractual breakpoints in the Fund’s advisory fee schedule and was assisted in this review by a report from the Senior Officer. The Board also noted that the Fund shares directly in economies of scale through lower fees charged by third party service providers based on the combined size of the Invesco Funds and other clients advised by Invesco Advisers.
| E. | Profitability and Financial Resources |
The Board reviewed information from Invesco Advisers concerning the costs of the advisory and other services that Invesco Advisers and its affiliates provide to the Fund and the profitability of Invesco Advisers and its affiliates in providing these services for the year ended December 31, 2013. The Board received information from Invesco Advisers about the methodology used to prepare the profitability information. The Board considered the profitability of Invesco Advisers in managing the Fund and the Invesco Funds. The Board noted that Invesco Advisers continues to operate at a net profit from services Invesco Advisers and its subsidiaries provide to the Invesco Funds. The Board noted that Invesco Advisers and its subsidiaries did not make a profit from managing the Fund as a result of fee and expense waivers. The Board received and accepted information from Invesco Advisers
demonstrating that Invesco Advisers and each Affiliated Sub-Adviser are financially sound and have the resources necessary to perform their obligations under the investment advisory agreement and sub-advisory contracts.
| F. | Collateral Benefits to Invesco Advisers and its Affiliates |
The Board considered various other benefits received by Invesco Advisers and its affiliates from the relationship with the Fund, including the fees received for their provision of transfer agency and distribution services to the Fund. The Board considered comparative information regarding fees charged for these services, including information provided by Lipper and other independent sources. The Board considered the performance of Invesco Advisers and its affiliates in providing these services and the organizational structure employed to provide these services. The Board also considered that these services are provided to the Fund pursuant to written contracts that are reviewed and approved on an annual basis by the Board; that the services are required for the operation of the Fund; that Invesco Advisers and its affiliates can provide services, the nature and quality of which are at least equal to those provided by others offering the same or similar services; and that the fees for such services are fair and reasonable in light of the usual and customary charges by others for services of the same nature and quality.
The Board considered the benefits realized by Invesco Advisers and the Affiliated Sub-Advisers as a result of portfolio brokerage transactions executed through “soft dollar” arrangements. Invesco Advisers noted that the Fund does not execute brokerage transactions through “soft dollar” arrangements to any significant degree.
The Board considered that the Fund’s uninvested cash and cash collateral from any securities lending arrangements may be invested in money market funds advised by Invesco Advisers pursuant to procedures approved by the Board. The Board noted that Invesco Advisers receives advisory fees from these affiliated money market funds attributable to such investments, although Invesco Advisers has contractually agreed to waive through varying periods the advisory fees payable by the Invesco Funds with respect to investments in the affiliated money market funds. The waiver is in an amount equal to 100% of the net advisory fee Invesco Advisers receives from the affiliated money market funds with respect to the Fund’s investment in the affiliated money market funds of uninvested cash, but not cash collateral. The Board concluded that the amount of advisory fees received by Invesco Advisors from the Fund’s investment of uninvested cash and cash collateral from any securities lending arrangements in the affiliated money market funds are fair and reasonable.
26 Invesco Emerging Market Local Currency Debt Fund
Tax Information
Form 1099-DIV, Form 1042-S and other year–end tax information provide shareholders with actual calendar year amounts that should be included in their tax returns. Shareholders should consult their tax advisors.
The following distribution information is being provided as required by the Internal Revenue Code or to meet a specific state’s requirement.
The Fund designates the following amounts or, if subsequently determined to be different, the maximum amount allowable for its fiscal year ended October 31, 2014:
| | | | |
Federal and State Income Tax | |
Qualified Dividend Income* | | | 0.00 | % |
Corporate Dividends Received Deduction* | | | 0.00 | % |
U.S. Treasury Obligations* | | | 0.00 | % |
| | * | The above percentages are based on ordinary income dividends paid to shareholders during the Fund’s fiscal year. |
27 Invesco Emerging Market Local Currency Debt Fund
Trustees and Officers
The address of each trustee and officer is AIM Investment Funds (Invesco Investment Funds) (the “Trust”), 11 Greenway Plaza, Suite 1000, Houston, Texas 77046-1173. The trustees serve for the life of the Trust, subject to their earlier death, incapacitation, resignation, retirement or removal as more specifically provided in the Trust’s organizational documents. Each officer serves for a one year term or until their successors are elected and qualified. Column two below includes length of time served with predecessor entities, if any.
| | | | | | | | |
Name, Year of Birth and Position(s) Held with the Trust | | Trustee and/
or Officer Since | | Principal Occupation(s) During Past 5 Years | | Number of Funds in Fund Complex Overseen by Trustee | | Other Directorship(s) Held by Trustee During Past 5 Years |
| Interested Persons | | | | | | | | |
| Martin L. Flanagan1 — 1960 Trustee | | 2007 | | Executive Director, Chief Executive Officer and President, Invesco Ltd. (ultimate parent of Invesco and a global investment management firm); Advisor to the Board, Invesco Advisers, Inc. (formerly known as Invesco Institutional (N.A.), Inc.); Trustee, The Invesco Funds; Vice Chair, Investment Company Institute; and Member of Executive Board, SMU Cox School of Business Formerly: Chairman and Chief Executive Officer, Invesco Advisers, Inc. (registered investment adviser); Director, Chairman, Chief Executive Officer and President, IVZ Inc. (holding company), INVESCO Group Services, Inc. (service provider) and Invesco North American Holdings, Inc. (holding company); Director, Chief Executive Officer and President, Invesco Holding Company Limited (parent of Invesco and a global investment management firm); Director, Invesco Ltd.; Chairman, Investment Company Institute and President, Co-Chief Executive Officer, Co-President, Chief Operating Officer and Chief Financial Officer, Franklin Resources, Inc. (global investment management organization). | | 144 | | None |
Philip A. Taylor2 — 1954 Trustee, President and Principal Executive Officer | | 2006 | | Head of North American Retail and Senior Managing Director, Invesco Ltd.; Director, Co-Chairman, Co-President and Co-Chief Executive Officer, Invesco Advisers, Inc. (formerly known as Invesco Institutional (N.A.), Inc.) (registered investment adviser); Director, Chairman, Chief Executive Officer and President, Invesco Management Group, Inc. (formerly known as Invesco Aim Management Group, Inc.) (financial services holding company); Director and President, INVESCO Funds Group, Inc. (registered investment adviser and registered transfer agent); Director and Chairman, Invesco Investment Services, Inc. (formerly known as Invesco Aim Investment Services, Inc.) (registered transfer agent) and IVZ Distributors, Inc. (formerly known as INVESCO Distributors, Inc.) (registered broker dealer); Director, President and Chairman, Invesco Inc. (holding company) and Invesco Canada Holdings Inc. (holding company); Chief Executive Officer, Invesco Corporate Class Inc. (corporate mutual fund company) and Invesco Canada Fund Inc. (corporate mutual fund company); Director, Chairman and Chief Executive Officer, Invesco Canada Ltd. (formerly known as Invesco Trimark Ltd./Invesco Trimark Ltèe) (registered investment adviser and registered transfer agent); Trustee, President and Principal Executive Officer, The Invesco Funds (other than AIM Treasurer’s Series Trust (Invesco Treasurer’s Series Trust) and Short-Term Investments Trust); Trustee and Executive Vice President, The Invesco Funds (AIM Treasurer’s Series Trust (Invesco Treasurer’s Series Trust) and Short-Term Investments Trust only); Director, Invesco Investment Advisers LLC (formerly known as Van Kampen Asset Management); Director, Chief Executive Officer and President, Van Kampen Exchange Corp. Formerly: Director and Chairman, Van Kampen Investor Services Inc.; Director, Chief Executive Officer and President, 1371 Preferred Inc. (holding company) and Van Kampen Investments Inc.; Director and President, AIM GP Canada Inc. (general partner for limited partnerships) and Van Kampen Advisors, Inc.; Director and Chief Executive Officer, Invesco Trimark Dealer Inc. (registered broker dealer); Director, Invesco Distributors, Inc. (formerly known as Invesco Aim Distributors, Inc.) (registered broker dealer); Manager, Invesco PowerShares Capital Management LLC; Director, Chief Executive Officer and President, Invesco Advisers, Inc.; Director, Chairman, Chief Executive Officer and President, Invesco Aim Capital Management, Inc.; President, Invesco Trimark Dealer Inc. and Invesco Trimark Ltd./Invesco Trimark Ltèe; Director and President, AIM Trimark Corporate Class Inc. and AIM Trimark Canada Fund Inc.; Senior Managing Director, Invesco Holding Company Limited; Director and Chairman, Fund Management Company (former registered broker dealer); President and Principal Executive Officer, The Invesco Funds (AIM Treasurer’s Series Trust (Invesco Treasurer’s Series Trust), and Short-Term Investments Trust only); President, AIM Trimark Global Fund Inc. and AIM Trimark Canada Fund Inc. | | 144 | | None |
Wayne W. Whalen3 — 1939 Trustee | | 2010 | | Of Counsel, and prior to 2010, partner in the law firm of Skadden, Arps, Slate, Meagher & Flom LLP, legal counsel to certain funds in the Fund Complex | | 144 | | Director of the Mutual fund Directors Forum, a nonprofit membership organization for investment directors; Chairman and Director of the Abraham Lincoln Presidential Library Foundation; and Director of the Stevenson Center for Democracy |
| 1 | Mr. Flanagan is considered an interested person (within the meaning of Section 2(a)(19) of the 1940 Act) of the Trust because he is an officer of the Adviser to the Trust, and an officer and a director of Invesco Ltd., ultimate parent of the Adviser. |
| 2 | Mr. Taylor is considered an interested person (within the meaning of Section 2(a)(19) of the 1940 Act) of the Trust because he is an officer and a director of the Adviser. |
| 3 | Mr. Whalen is retiring effective December 31, 2014. He has been deemed to be an interested person of the Trust because of his prior service as counsel to the predecessor funds of certain Invesco open-end funds and his affiliation with the law firm that served as counsel to such predecessor funds and the Invesco closed-end funds. |
T-1 Invesco Emerging Market Local Currency Debt Fund
Trustees and Officers—(continued)
| | | | | | | | |
Name, Year of Birth and Position(s) Held with the Trust | | Trustee and/
or Officer Since | | Principal Occupation(s) During Past 5 Years | | Number of Funds in Fund Complex Overseen by Trustee | | Other Directorship(s) Held by Trustee During Past 5 Years |
| Independent Trustees | | | | | | | | |
Bruce L. Crockett — 1944 Trustee and Chair | | 2001 | | Chairman, Crockett Technologies Associates (technology consulting company) Formerly: Director, Captaris (unified messaging provider); Director, President and Chief Executive Officer, COMSAT Corporation; Chairman, Board of Governors of INTELSAT (international communications company); ACE Limited (insurance company); and Investment Company Institute | | 144 | | ALPS (Attorneys Liability Protection Society) (insurance company) |
David C. Arch — 1945 Trustee | | 2010 | | Chairman of Blistex Inc., a consumer health care products manufacturer | | 144 | | Board member of the Illinois Manufacturers’ Association; Member of the Board of Visitors, Institute for the Humanities, University of Michigan; Member of the Audit Committee of the Edward-Elmhurst Hospital |
Frank S. Bayley — 1939 Trustee | | 1987 | | Retired. Formerly: Director, Badgley Funds Inc. (registered investment company) (2 portfolios) and General Partner and Of Counsel, law firm of Baker & McKenzie, LLP | | 144 | | Director and Chairman, C.D. Stimson Company (a real estate investment company); Trustee, The Curtis Institute of Music |
James T. Bunch — 1942 Trustee | | 2003 | | Managing Member, Grumman Hill Group LLC (family office private equity investments) Formerly: Founder, Green Manning & Bunch Ltd. (investment banking firm) (1988-2010); Executive Committee, United States Golf Association; and Director, Policy Studies, Inc. and Van Gilder Insurance Corporation | | 144 | | Chairman, Board of Governors, Western Golf Association; Chairman, Evans Scholars Foundation; and Director, Denver Film Society |
Rodney F. Dammeyer — 1940 Trustee | | 2010 | | Chairman of CAC,LLC, (private company offering capital investment and management advisory services) Formerly: Prior to 2001, Managing Partner at Equity Group Corporate Investments; Prior to 1995, Chief Executive Officer of Itel Corporation (formerly Anixter International); Prior to 1985, experience includes Senior Vice President and Chief Financial Officer of Household International, Inc., Executive Vice President and Chief Financial Officer of Northwest Industries, Inc. and Partner of Arthur Andersen & Co.; From 1987 to 2010, Director/Trustee of investment companies in the Van Kampen Funds complex | | 144 | | Director of Quidel Corporation and Stericycle, Inc. |
Albert R. Dowden — 1941 Trustee | | 2001 | | Director of a number of public and private business corporations, including the Boss Group, Ltd. (private investment and management); Nature’s Sunshine Products, Inc. and Reich & Tang Funds (5 portfolios) (registered investment company) Formerly: Director, Homeowners of America Holding Corporation/Homeowners of America Insurance Company (property casualty company); Director, Continental Energy Services, LLC (oil and gas pipeline service); Director, CompuDyne Corporation (provider of product and services to the public security market) and Director, Annuity and Life Re (Holdings), Ltd. (reinsurance company); Director, President and Chief Executive Officer, Volvo Group North America, Inc.; Senior Vice President, AB Volvo; Director of various public and private corporations; Chairman, DHJ Media, Inc.; Director, Magellan Insurance Company; and Director, The Hertz Corporation, Genmar Corporation (boat manufacturer), National Media Corporation; Advisory Board of Rotary Power International (designer, manufacturer, and seller of rotary power engines); and Chairman, Cortland Trust, Inc. (registered investment company) | | 144 | | Director of: Nature’s Sunshine Products, Inc., Reich & Tang Funds, Homeowners of America Holding Corporation/ Homeowners of America Insurance Company, the Boss Group |
Jack M. Fields — 1952 Trustee | | 2001 | | Chief Executive Officer, Twenty First Century Group, Inc. (government affairs company); Owner and Chief Executive Officer, Dos Angeles Ranch, L.P. (cattle, hunting, corporate entertainment); and Discovery Global Education Fund (non-profit) Formerly: Chief Executive Officer, Texana Timber LP (sustainable forestry company); Director of Cross Timbers Quail Research Ranch (non-profit); and member of the U.S. House of Representatives | | 144 | | Insperity, Inc. (formerly known as Administaff) |
Prema Mathai-Davis — 1950 Trustee | | 2001 | | Retired. Formerly: Chief Executive Officer, YWCA of the U.S.A. | | 144 | | None |
Larry Soll — 1942 Trustee | | 2003 | | Retired. Formerly: Chairman, Chief Executive Officer and President, Synergen Corp. (a biotechnology company) | | 144 | | None |
Hugo F. Sonnenschein — 1940 Trustee | | 2010 | | President Emeritus and Honorary Trustee of the University of Chicago and the Adam Smith Distinguished Service Professor in the Department of Economics at the University of Chicago. Prior to 2000, President of the University of Chicago | | 144 | | Trustee of the University of Rochester and a member of its investment committee; Member of the National Academy of Sciences and the American Philosophical Society; Fellow of the American Academy of Arts and Sciences |
T-2 Invesco Emerging Market Local Currency Debt Fund
Trustees and Officers—(continued)
| | | | | | | | |
Name, Year of Birth and Position(s) Held with the Trust | | Trustee and/
or Officer Since | | Principal Occupation(s) During Past 5 Years | | Number of Funds in Fund Complex Overseen by Trustee | | Other Directorship(s) Held by Trustee During Past 5 Years |
| Independent Trustees—(continued) |
Raymond Stickel, Jr. — 1944 Trustee | | 2005 | | Retired. Formerly: Director, Mainstay VP Series Funds, Inc. (25 portfolios) and Partner, Deloitte & Touche | | 144 | | None |
Suzanne H. Woolsey — 1941 Trustee | | 2014 | | Chief Executive Officer of Woolsey Partners LLC | | 144 | | Emeritus Chair of the Board of Trustees of the Institute for Defense Analyses; Trustee of Colorado College; Trustee of California Institute of Technology; Prior to 2014, Director of Fluor Corp.; Prior to 2010, Trustee of the German Marshall Fund of the United States; Prior to 2010 Trustee of the Rocky Mountain Institute |
| Other Officers | | | | | | | | |
Russell C. Burk — 1958 Senior Vice President and Senior Officer | | 2005 | | Senior Vice President and Senior Officer, The Invesco Funds | | N/A | | N/A |
John M. Zerr — 1962 Senior Vice President, Chief Legal Officer and Secretary | | 2006 | | Director, Senior Vice President, Secretary and General Counsel, Invesco Management Group, Inc. (formerly known as Invesco Aim Management Group, Inc.) and Van Kampen Exchange Corp.; Senior Vice President, Invesco Advisers, Inc. (formerly known as Invesco Institutional (N.A.), Inc.) (registered investment adviser); Senior Vice President and Secretary, Invesco Distributors, Inc. (formerly known as Invesco Aim Distributors, Inc.); Director, Vice President and Secretary, Invesco Investment Services, Inc. (formerly known as Invesco Aim Investment Services, Inc.) and IVZ Distributors, Inc. (formerly known as INVESCO Distributors, Inc.); Director and Vice President, INVESCO Funds Group, Inc.; Senior Vice President, Chief Legal Officer and Secretary, The Invesco Funds; Manager, Invesco PowerShares Capital Management LLC; Director, Secretary and General Counsel, Invesco Investment Advisers LLC (formerly known as Van Kampen Asset Management); Secretary and General Counsel, Invesco Capital Markets, Inc. (formerly known as Van Kampen Funds Inc.) and Chief Legal Officer, PowerShares Exchange-Traded Fund Trust, PowerShares Exchange-Traded Fund Trust II, PowerShares India Exchange-Traded Fund Trust, PowerShares Actively Managed Exchange-Traded Fund Trust; and PowerShares Actively Managed Exchange-Traded Commodity Fund Trust Formerly: Director and Vice President, Van Kampen Advisors Inc.; Director, Vice President, Secretary and General Counsel, Van Kampen Investor Services Inc.; Director, Invesco Distributors, Inc. (formerly known as Invesco Aim Distributors, Inc.); Director, Senior Vice President, General Counsel and Secretary, Invesco Aim Advisers, Inc. and Van Kampen Investments Inc.; Director, Vice President and Secretary, Fund Management Company; Director, Senior Vice President, Secretary, General Counsel and Vice President, Invesco Aim Capital Management, Inc.; Chief Operating Officer and General Counsel, Liberty Ridge Capital, Inc. (an investment adviser); Vice President and Secretary, PBHG Funds (an investment company) and PBHG Insurance Series Fund (an investment company); Chief Operating Officer, General Counsel and Secretary, Old Mutual Investment Partners (a broker-dealer); General Counsel and Secretary, Old Mutual Fund Services (an administrator) and Old Mutual Shareholder Services (a shareholder servicing center); Executive Vice President, General Counsel and Secretary, Old Mutual Capital, Inc. (an investment adviser); and Vice President and Secretary, Old Mutual Advisors Funds (an investment company) | | N/A | | N/A |
Sheri Morris — 1964 Vice President, Treasurer and Principal Financial Officer | | 1999 | | Vice President, Treasurer and Principal Financial Officer, The Invesco Funds; Vice President, Invesco Advisers, Inc. (formerly known as Invesco Institutional (N.A.), Inc.) (registered investment adviser); and Vice President, PowerShares Exchange-Traded Fund Trust, PowerShares Exchange-Traded Fund Trust II, PowerShares India Exchange-Traded Fund Trust, PowerShares Actively Managed Exchange-Traded Fund Trust, and PowerShares Actively Managed Exchange-Traded Commodity Fund Trust Formerly: Vice President, Invesco Aim Advisers, Inc., Invesco Aim Capital Management, Inc. and Invesco Aim Private Asset Management, Inc.; Assistant Vice President and Assistant Treasurer, The Invesco Funds and Assistant Vice President, Invesco Advisers, Inc., Invesco Aim Capital Management, Inc. and Invesco Aim Private Asset Management, Inc.; and Treasurer, PowerShares Exchange-Traded Fund Trust, PowerShares Exchange-Traded Fund Trust II, PowerShares India Exchange-Traded Fund Trust and PowerShares Actively Managed Exchange-Traded Fund Trust | | N/A | | N/A |
T-3 Invesco Emerging Market Local Currency Debt Fund
Trustees and Officers—(continued)
| | | | | | | | |
Name, Year of Birth and Position(s) Held with the Trust | | Trustee and/
or Officer Since | | Principal Occupation(s) During Past 5 Years | | Number of Funds in Fund Complex Overseen by Trustee | | Other Directorship(s) Held by Trustee During Past 5 Years |
| Other Officers—(continued) | | | | | | | | |
Karen Dunn Kelley — 1960 Vice President | | 2004 | | Senior Managing Director, Investments; Director, Co-President, Co-Chief Executive Officer, and Co-Chairman, Invesco Advisers, Inc. (formerly known as Invesco Institutional (N.A.), Inc.) (registered investment adviser); Chairman, Invesco Senior Secured Management, Inc.; Senior Vice President, Invesco Management Group, Inc. (formerly known as Invesco Aim Management Group, Inc.); Executive Vice President, Invesco Distributors, Inc. (formerly known as Invesco Aim Distributors, Inc.); Director, Invesco Mortgage Capital Inc. and Invesco Management Company Limited; Director and President, INVESCO Asset Management (Bermuda) Ltd., Vice President, The Invesco Funds (other than AIM Treasurer’s Series Trust (Invesco Treasurer’s Series Trust) and Short-Term Investments Trust); and President and Principal Executive Officer, The Invesco Funds (AIM Treasurer’s Series Trust (Invesco Treasurer’s Series Trust) and Short-Term Investments Trust only) Formerly: Director, INVESCO Global Asset Management Limited and INVESCO Management S.A.; Senior Vice President, Van Kampen Investments Inc. and Invesco Advisers, Inc. (formerly known as Invesco Institutional (N.A.), Inc.) (registered investment adviser); Vice President, Invesco Advisers, Inc. (formerly known as Invesco Institutional (N.A.), Inc.); Director of Cash Management and Senior Vice President, Invesco Advisers, Inc. and Invesco Aim Capital Management, Inc.; Director and President, Fund Management Company; Chief Cash Management Officer, Director of Cash Management, Senior Vice President, and Managing Director, Invesco Aim Capital Management, Inc.; Director of Cash Management, Senior Vice President, and Vice President, Invesco Advisers, Inc. and The Invesco Funds (AIM Treasurer’s Series Trust (Invesco Treasurer’s Series Trust), and Short-Term Investments Trust only) | | N/A | | N/A |
Crissie M. Wisdom — 1969 Anti-Money Laundering Compliance Officer | | 2013 | | Anti-Money Laundering Compliance Officer, Invesco Advisers, Inc. (formerly known as Invesco Institutional (N.A.), Inc.) (registered investment adviser), Invesco Capital Markets, Inc. (formerly known as Van Kampen Funds Inc.), Invesco Distributors, Inc., Invesco Investment Services, Inc., Invesco Management Group, Inc., Van Kampen Exchange Corp., The Invesco Funds, and PowerShares Exchange-Traded Fund Trust, PowerShares Exchange-Traded Fund Trust II, PowerShares India Exchange-Traded Fund Trust, PowerShares Actively Managed Exchange-Traded Fund Trust and PowerShares Actively Managed Exchange-Traded Commodity Fund Trust; and Fraud Prevention Manager and Controls and Risk Analysis Manager for Invesco Investment Services, Inc. | | N/A | | N/A |
Todd L. Spillane — 1958 Chief Compliance Officer | | 2006 | | Senior Vice President, Invesco Management Group, Inc. (formerly known as Invesco Aim Management Group, Inc.) and Van Kampen Exchange Corp.; Senior Vice President and Chief Compliance Officer, Invesco Advisers, Inc. (registered investment adviser) (formerly known as Invesco Institutional (N.A.), Inc.); Chief Compliance Officer, The Invesco Funds; Vice President, Invesco Distributors, Inc. (formerly known as Invesco Aim Distributors, Inc.) and Invesco Investment Services, Inc. (formerly known as Invesco Aim Investment Services, Inc.) Formerly: Chief Compliance Officer, Invesco Funds (Chicago); Senior Vice President, Van Kampen Investments Inc.; Senior Vice President and Chief Compliance Officer, Invesco Aim Advisers, Inc. and Invesco Aim Capital Management, Inc.; Chief Compliance Officer, INVESCO Private Capital Investments, Inc. (holding company), Invesco Private Capital, Inc. (registered investment adviser), Invesco Global Asset Management (N.A.), Inc., Invesco Senior Secured Management, Inc. (registered investment adviser), Van Kampen Investor Services Inc., PowerShares Exchange-Traded Fund Trust, PowerShares Exchange-Traded Fund Trust II, PowerShares India Exchange-Traded Fund Trust and PowerShares Actively Managed Exchange-Traded Fund Trust; and Vice President, Invesco Aim Capital Management, Inc. and Fund Management Company | | N/A | | N/A |
The Statement of Additional Information of the Trust includes additional information about the Fund’s Trustees and is available upon request, without charge, by calling 1.800.959.4246. Please refer to the Fund’s prospectus for information on the Fund’s sub-advisers.
| | | | | | |
Office of the Fund 11 Greenway Plaza, Suite 1000 Houston, TX 77046-1173 | | Investment Adviser Invesco Advisers, Inc. 1555 Peachtree Street, N.E. Atlanta, GA 30309 | | Distributor Invesco Distributors, Inc. 11 Greenway Plaza, Suite 1000 Houston, TX 77046-1173 | | Auditors PricewaterhouseCoopers LLP 1000 Louisiana Street, Suite 5800 Houston, TX 77002-5678 |
| | | |
| | | | | | |
Counsel to the Fund Stradley Ronon Stevens & Young, LLP 2005 Market Street, Suite 2600 Philadelphia, PA 19103-7018 | | Counsel to the Independent Trustees Goodwin Procter LLP 901 New York Avenue, N.W. Washington, D.C. 20001 | | Transfer Agent Invesco Investment Services, Inc. 11 Greenway Plaza, Suite 1000 Houston, TX 77046-1173 | | Custodian State Street Bank and Trust Company 225 Franklin Street Boston, MA 02110-2801 |
T-4 Invesco Emerging Market Local Currency Debt Fund

Invesco mailing information
Send general correspondence to Invesco Investment Services, Inc., P.O. Box 219078, Kansas City, MO 64121-9078.
Important notice regarding delivery of security holder documents
To reduce Fund expenses, only one copy of most shareholder documents may be mailed to shareholders with multiple accounts at the same address (Householding). Mailing of your shareholder documents may be householded indefinitely unless you instruct us otherwise. If you do not want the mailing of these documents to be combined with those for other members of your household, please contact Invesco Investment Services, Inc. at 800 959 4246 or contact your financial institution. We will begin sending you individual copies for each account within 30 days after receiving your request.
Fund holdings and proxy voting information
The Fund provides a complete list of its holdings four times in each fiscal year, at the quarter ends. For the second and fourth quarters, the lists appear in the Fund’s semiannual and annual reports to shareholders. For the first and third quarters, the Fund files the lists with the Securities and Exchange Commission (SEC) on Form N-Q. The most recent list of portfolio holdings is available at invesco.com/completeqtrholdings. Shareholders can also look up the Fund’s Forms N-Q on the SEC website at sec.gov. Copies of the Fund’s Forms N-Q may be reviewed and copied at the SEC Public Reference Room in Washington, D.C. You can obtain information on the operation of the Public Reference Room, including information about duplicating fee charges, by calling 202 551 8090 or 800 732 0330, or by electronic request at the following email address: publicinfo@sec.gov. The SEC file numbers for the Fund are shown below.
A description of the policies and procedures that the Fund uses to determine how to vote proxies relating to portfolio securities is available without charge, upon request, from our Client Services department at 800 959 4246 or at invesco.com/proxyguidelines. The information is also available on the SEC website, sec.gov.
| | |
Information regarding how the Fund voted proxies related to its portfolio securities during the most recent 12-month period ended June 30 is available at invesco.com/proxysearch. The information is also available on the SEC website, sec.gov. | |  |
Invesco Advisers, Inc. is an investment adviser; it provides investment advisory services to individual and institutional clients and does not sell securities. Invesco Distributors, Inc. is the US distributor for Invesco Ltd.’s retail mutual funds, exchange-traded funds and institutional money market funds. Both are wholly owned, indirect subsidiaries of Invesco Ltd. | |
| | | | |
| SEC file numbers: 811-05426 and 033-19338 | | EMLCD-AR-1 | | Invesco Distributors, Inc. |

Letters to Shareholders
| | |

Philip Taylor | | Dear Shareholders: This annual report includes information about your Fund, including performance data and a complete list of its investments as of the close of the reporting period. Inside, your Fund’s portfolio managers discuss how they managed your Fund and the factors that affected its performance during the reporting period. I hope you find this report of interest. During the reporting period covered by this report, the US economy showed signs of continued improvement. After contracting in the first quarter of 2014, the economy expanded strongly in the second quarter and unemployment trended lower. Much of the credit for this improvement goes to the US Federal Reserve (the Fed), which undertook an extraordinary asset purchase program following the global financial crisis. The Fed’s goal was to jumpstart the economy by encouraging banks to lend more, businesses to hire more and consumers to spend more. Signs of a stronger US economy prompted the Fed to reduce, or “taper,” its asset purchase program. Despite |
| this, interest rates remained near historical low levels due largely to heavy investor demand for bonds. While signs of economic improvement were evident in the US, European economies showed signs of weakening. That, together with geopolitical uncertainty and worries about the first diagnosed cases of Ebola outside of Africa, caused increased volatility in US and European equities. |
Extended periods of market strength can lull investors into complacency – just as prolonged periods of market weakness or volatility can discourage investors from initiating long-term investment plans. That’s why Invesco has always encouraged investors to work with a professional financial adviser who can stress the importance of starting to save and invest early and the importance of adhering to a disciplined investment plan – when times are good and when they’re uncertain. A financial adviser who knows your unique financial situation, investment goals and risk tolerance can be an invaluable partner as you seek to achieve your financial goals. He or she can offer a long-term perspective when markets are volatile and time-tested advice and guidance when your financial situation or investment goals change.
Timely information when and where you want it
Invesco’s efforts to help investors achieve their financial objectives include providing individual investors and financial professionals with timely information about the markets, the economy and investing – whenever and wherever they want it.
Our website, invesco.com/us, offers a wide range of market insights and investment perspectives. On the website, you’ll find detailed information about our funds, including prices, performance, holdings and portfolio manager commentaries. You can access information about your individual Invesco account whenever it’s convenient for you; just complete a simple, secure online registration. Use the “Log In” box on our home page to get started.
Invesco’s mobile app for iPad® (available free from the App StoreSM) allows you to obtain the same detailed information about your Fund and the same investment insights from our investment leaders, market strategists, economists and retirement experts on the go. You also can watch portfolio manager videos and have instant access to Invesco news and updates wherever you may be.
In addition to the resources accessible on our website and through our mobile app, you can obtain timely updates to help you stay informed about the markets, the economy and investing by connecting with Invesco on Twitter, LinkedIn or Facebook. You can access our blog at blog.invesco.us.com. Our goal is to provide you the information you want, when and where you want it.
Have questions?
For questions about your account, feel free to contact an Invesco client services representative at 800 959 4246. For Invesco-related questions or comments, please email me directly at phil@invesco.com.
All of us at Invesco look forward to serving your investment management needs for many years to come. Thank you for investing with us.
Sincerely,

Philip Taylor
Senior Managing Director, Invesco Ltd.
iPad is a trademark of Apple Inc., registered in the US and other countries. App Store is a service mark of Apple Inc. Invesco Distributors, Inc. is not affiliated with Apple Inc.
2 Invesco Emerging Markets Equity Fund
| | |

Bruce Crockett | | Dear Fellow Shareholders: There are a variety of factors that can impact investment performance, many of which are uncontrollable by us as investors. These factors can include various economic trends and geopolitical developments. While the members of the Invesco Funds Board, which I chair, can’t dictate the performance of the Invesco funds, be assured that your Board works diligently throughout the year to focus on how your investments are managed. Our job is to represent you and your interests on a variety of fund management-related matters. We regularly monitor how the portfolio management teams of the Invesco funds are performing in light of ever-changing and often unpredictable economic and market conditions. We review the investment strategies and investment process employed by each fund’s management team as explained in the fund’s prospectus. |
| | Perhaps our most significant responsibility is conducting the annual review of the funds’ |
advisory and sub-advisory contracts with Invesco Advisers and its affiliates. This annual review, which is required by the Investment Company Act of 1940, focuses on the nature and quality of the services Invesco provides as the adviser to the Invesco funds and the reasonableness of the fees that it charges for those services. Each year, we spend months carefully reviewing information from Invesco that allows us to evaluate the quality of its services and the reasonableness of its fees. We also use information from a variety of independent sources, including materials provided by the independent senior officer of the Invesco funds, who reports directly to the independent trustees on the Board. Additionally, we meet with legal counsel and review performance and fee data prepared for us by Lipper Inc., an independent, third-party firm widely recognized as a leader in its field.
After a careful review, the members of the Invesco Funds Board approved the continuation of advisory and sub-advisory contracts with Invesco Advisers and its affiliates. Be assured that your Board will continue working on behalf of fund shareholders, keeping your needs and interests uppermost in our minds.
As always, please contact me at bruce@brucecrockett.com with any questions or concerns you may have. On behalf of the Board, we look forward to continuing to represent your interests and serving your needs.
Sincerely,

Bruce L. Crockett
Independent Chair
Invesco Funds Board of Trustees
3 Invesco Emerging Markets Equity Fund
Management’s Discussion of Fund Performance
Performance summary
For the fiscal year ended October 31, 2014, Class A shares of Invesco Emerging Markets Fund, at net asset value, slightly underperformed its style-specific benchmark, the MSCI Emerging Markets Index. Stock selection in the consumer discretionary, consumer staples, energy, industrials and materials sectors contributed to performance, while holdings in the financials, information technology (IT), health care and utilities sectors detracted from performance for the reporting period.
Your Fund’s long-term performance appears later in this report.
Fund vs. Indexes
Total returns, 10/31/13 to 10/31/14, at net asset value (NAV). Performance shown does not include applicable contingent deferred sales charges (CDSC) or front-end sales charges, which would have reduced performance.
| | | | |
Class A Shares | | | 0.57 | % |
Class C Shares | | | -0.27 | |
Class R Shares | | | 0.17 | |
Class Y Shares | | | 0.74 | |
Class R5 Shares | | | 0.74 | |
Class R6 Shares | | | 0.87 | |
MSCI EAFE Indexq (Broad Market Index) | | | -0.60 | |
MSCI Emerging Markets Indexq (Style-Specific Index) | | | 0.64 | |
Lipper Emerging Market Funds Indexn (Peer Group Index) | | | 1.20 | |
Source(s): qFactSet Research Systems Inc.; nLipper Inc.
Market conditions and your Fund
Global equity markets generally rose during the fiscal year ended October 31, 2014, on signs that economic growth was accelerating as a result of the loose monetary policies of many developed countries’ central banks. While 2014 began on an optimistic note, global equity markets pulled back at various points in reaction to economic and geopolitical concerns.
These concerns included worries about potentially negative effects of the US Federal Reserve reducing the scope of its asset purchase program beginning in early 2014, an Argentine sovereign bond default and eurozone banking concerns.
Global equity markets also fell as geopolitical tensions in Ukraine and the Middle East weakened the outlook for global growth.
Advanced economies such as the UK and US saw a modest but stronger rebound than Europe, where a nascent recovery has stalled. A more supportive monetary policy in the eurozone may be positive for equity markets there, and we have seen evidence of earnings recovery coming through.
Meanwhile, the Bank of Japan remained committed to extraordinary monetary stimulus. Consumer spending in Japan has been weak for some time, and retail sales and household spending increased only gradually during the reporting period
– although improved corporate earnings were an encouraging sign.
Equity market performance in emerging markets was mixed. China continued to face headwinds and struggled to balance structural reforms with its desire to maintain satisfactory growth, while many countries in Asia, including India, Indonesia and the Philippines, experienced strong positive gains.
The Fund stayed true to its process by emphasizing its quality orientation in stock selection. Our stock selection in the consumer discretionary, consumer staples, energy, industrials and materials sectors made the largest contribution to the Fund’s results versus its style-specific benchmark.
From a geographic perspective, the Fund’s Asia/Pacific and Africa/Mideast holdings contributed most significantly to performance during the reporting period. Specifically, stock selection in China, India, Indonesia, South Korea, Malaysia and Russia positively affected Fund performance. Conversely, stock selection in Brazil, Hong Kong, and Mexico hampered Fund performance versus the Fund’s style-specific benchmark.
Both Tata Motors and Grasim Industries benefited from the strength of the Indian market following the election of Prime Minister Modi. While Tata has continued to grow its automobile business by capitalizing on an attractive pipeline of new models, Grasim, a building materials and manufacturing company, is expected to benefit from the new government’s plans for significant infrastructure investment.
| | | | |
| Portfolio Composition | | | |
| By sector | |
| | | | |
Financials | | | 22.0 | % |
Consumer Discretionary | | | 20.1 | |
Consumer Staples | | | 13.7 | |
Industrials | | | 12.5 | |
Information Technology | | | 11.0 | |
Energy | | | 6.4 | |
Health Care | | | 4.3 | |
Materials | | | 3.7 | |
Telecommunication Services | | | 3.2 | |
Money Market Funds | | | | |
| Plus Other Assets Less Liabilities | | | 3.1 | |
| | | | | | |
Top 10 Equity Holdings* | | | |
| | | |
| 1. | | Taiwan Semiconductor
Manufacturing Co. Ltd. | | | 4.4 | % |
| 2. | | China Construction Bank Corp.-
Class H | | | 2.9 | |
| 3. | | Magnit OJSC-GDR | | | 2.7 | |
| 4. | | Shenzhou International Group
Holdings Ltd. | | | 2.7 | |
| 5. | | Samsung Electronics Co., Ltd. | | | 2.7 | |
| 6. | | Life Healthcare Group
Holdings Ltd. | | | 2.2 | |
| 7. | | Bank of Georgia Holdings PLC | | | 2.2 | |
| 8. | | Zhuzhou CSR Times Electric
Co., Ltd.-Class H | | | 2.2 | |
| 9. | | Cosan Ltd.-Class A | | | 2.1 | |
| 10. | | Kossan Rubber Industries Berhad | | | 2.1 | |
| | | | | | |
Top Five Countries | | | |
| 1. | | China | | | 15.0 | % |
| 2. | | Brazil | | | 13.6 | |
| 3. | | South Korea | | | 10.8 | |
| 4. | | India | | | 8.9 | |
| 5. | | Taiwan | | | 8.1 | |
| | | | |
| Total Net Assets | | $ | 27.1 million | |
| |
| Total Number of Holdings* | | | 55 | |
The Fund’s holdings are subject to change, and there is no assurance that the Fund will continue to hold any particular security.
*Excluding money market fund holdings.
4 Invesco Emerging Markets Equity Fund
Within the Asia/Pacific region, Hon Hai Precision and Taiwan Semiconductor, leading suppliers in the IT sector, continued to benefit from the growth of Apple’s (not a Fund holding) smartphone business.
Conversely, Hyundai Motor reported weaker sales due in part to a strengthening Korean won and a weaker Japanese yen, which made Hyundai’s sales more challenging. Hyundai also disappointed investors with a lower-than-expected dividend.
Also detracting from Fund performance was Russian bank Sberbank. The bank lagged the market due to ongoing tension between Russia and Ukraine. We sold our position in Sberbank during the reporting period. In addition, Eurobank Ergasias stock fell as investor concern regarding capitalization and political questions arose in Greece and the eurozone.
Relative to its style-specific benchmark, the Fund had overweight positions in the consumer staples, utilities and industrials sectors and underweight positions in the financials, IT, consumer discretionary, energy, telecommunication services and materials sectors at the close of the reporting period.
Geographically, the Fund maintained overweight positions in Brazil, China, and Indonesia, but underweight positions in Hong Kong, Mexico, South Africa and Taiwan throughout the reporting period.
Market volatility increased near the end of the fiscal year, and we believe it is likely to continue. While there are segments of the market that we continue to find attractive, particularly with a long-term perspective, valuations for the broader market are not inexpensive. We remain cautious, mindful of our mandate to provide protection in challenging markets, and are focused on high-quality companies with attractive valuations.
Thank you for your investment in Invesco Emerging Markets Equity Fund.
The views and opinions expressed in management’s discussion of Fund performance are those of Invesco Advisers, Inc. These views and opinions are subject to change at any time based on factors such as market and economic conditions. These views and opinions may not be relied upon as investment advice or recommendations, or as an offer for a particular security. The information is not a complete analysis of every aspect of any market, country, industry, security or the Fund. Statements of fact are from sources considered reliable, but Invesco Advisers, Inc. makes no representation or warranty as to their completeness or accuracy. Although historical performance is no guarantee of future results, these insights may help you understand our investment management philosophy.
See important Fund and, if applicable, index disclosures later in this report.
| | |
 | | Ingrid Baker Chartered Financial Analyst, Portfolio Manager, is manager of Invesco Emerging Markets Equity Fund. |
| She joined Invesco in 1999. Ms. Baker earned a BA in international politics from Oberlin College and an MBA in finance from the University of Navarra. |
Assisted by Invesco’s Global Core Equity Team
5 Invesco Emerging Markets Equity Fund
Your Fund’s Long-Term Performance
Results of a $10,000 Investment – Oldest Share Class(es) since Inception
Fund and index data from 5/31/11
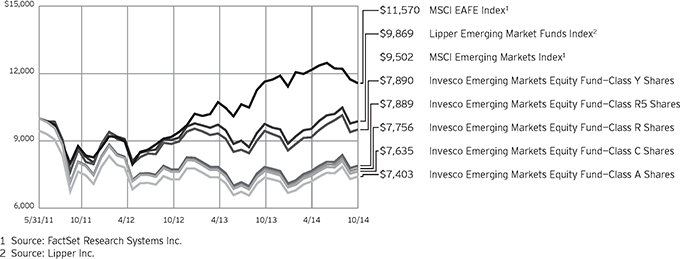
Past performance cannot guarantee comparable future results.
The data shown in the chart include reinvested distributions, applicable sales charges and Fund expenses including
management fees. Index results include reinvested dividends, but they do not reflect sales charges. Performance of the peer group, if applicable, reflects fund expenses and management fees;
performance of a market index does not. Performance shown in the chart and table(s) does not reflect deduction of taxes a shareholder would pay on Fund distributions or sale of Fund shares.
6 Invesco Emerging Markets Equity Fund
| | | | |
| Average Annual Total Returns | |
As of 10/31/14, including maximum applicable sales charges | |
| Class A Shares | | | | |
| Inception (5/31/11) | | | -8.42 | % |
| 1 Year | | | -4.93 | |
| |
| Class C Shares | | | | |
| Inception (5/31/11) | | | -7.59 | % |
| 1 Year | | | -1.26 | |
| |
| Class R Shares | | | | |
| Inception (5/31/11) | | | -7.16 | % |
| 1 Year | | | 0.17 | |
| |
| Class Y Shares | | | | |
| Inception (5/31/11) | | | -6.70 | % |
| 1 Year | | | 0.74 | |
| |
| Class R5 Shares | | | | |
| Inception (5/31/11) | | | -6.70 | % |
| 1 Year | | | 0.74 | |
| |
| Class R6 Shares | | | | |
| Inception | | | -6.75 | % |
| 1 Year | | | 0.87 | |
Class R6 shares incepted on September 24, 2012. Performance shown prior to that date is that of Class A shares and includes the 12b-1 fees applicable to Class A shares. Class A share performance reflects any applicable fee waivers or expense reimbursements.
The performance data quoted represent past performance and cannot guarantee comparable future results; current performance may be lower or higher. Please visit invesco.com/performance for the most recent month-end performance. Performance figures reflect reinvested distributions, changes in net asset value and the effect of the maximum sales charge unless otherwise stated. Investment return and principal value will fluctuate so that you may have a gain or loss when you sell shares.
The net annual Fund operating expense ratio set forth in the most recent Fund prospectus as of the date of this report for Class A, Class C, Class R, Class Y, Class R5 and Class R6 shares was 1.90%, 2.65%, 2.15%, 1.65%, 1.65% and 1.65%, respectively.1,2 The total annual Fund operating expense ratio set forth in the most recent Fund prospectus as of the date of this report for Class A, Class C, Class R, Class Y, Class R5 and Class R6 shares was 2.80%, 3.55%, 3.05%, 2.55%, 2.31% and 2.26%, respectively. The expense ratios presented
| | | | |
| Average Annual Total Returns | |
As of 9/30/14, the most recent calendar quarter end, including maximum applicable sales charges | |
Class A Shares | | | | |
Inception (5/31/11) | | | -8.99 | % |
1 Year | | | -2.67 | |
| |
Class C Shares | | | | |
Inception (5/31/11) | | | -8.11 | % |
1 Year | | | 1.33 | |
| |
Class R Shares | | | | |
Inception (5/31/11) | | | -7.67 | % |
1 Year | | | 2.77 | |
| |
Class Y Shares | | | | |
Inception (5/31/11) | | | -7.23 | % |
1 Year | | | 3.34 | |
| |
Class R5 Shares | | | | |
Inception (5/31/11) | | | -7.23 | % |
1 Year | | | 3.34 | |
| |
Class R6 Shares | | | | |
Inception | | | -7.29 | % |
1 Year | | | 3.34 | |
above may vary from the expense ratios presented in other sections of this report that are based on expenses incurred during the period covered by this report.
Class A share performance reflects the maximum 5.50% sales charge, and Class C share performance reflects the applicable contingent deferred sales charge (CDSC) for the period involved. The CDSC on Class C shares is 1% for the first year after purchase. Class R, Class Y, Class R5 and Class R6 shares do not have a front-end sales charge or a CDSC; therefore, performance is at net asset value.
The performance of the Fund’s share classes will differ primarily due to different sales charge structures and class expenses.
Had the adviser not waived fees and/or reimbursed expenses, performance would have been lower.
| 1 | Total annual Fund operating expenses after any contractual fee waivers and/or expense reimbursements by the adviser in effect through at least June 30, 2016. See current prospectus for more information. |
| 2 | Total annual Fund operating expenses after any contractual fee waivers and/or expense reimbursements by the adviser in effect through at least February 29, 2016. See current prospectus for more information. |
7 Invesco Emerging Markets Equity Fund
Invesco Emerging Markets Equity Fund’s investment objective is long-term growth of capital.
| n | | Unless otherwise stated, information presented in this report is as of October 31, 2014, and is based on total net assets. |
| n | | Unless otherwise noted, all data provided by Invesco. |
| n | | To access your Fund’s reports/prospectus, visit invesco.com/fundreports. |
About share classes
| n | | Class R shares are generally available only to employer sponsored retirement and benefit plans. Please see the prospectus for more information. |
| n | | Class Y shares are available only to certain investors. Please see the prospectus for more information. |
| n | | Class R5 shares and Class R6 shares are primarily intended for employer sponsored retirement and benefit plans that meet certain standards and for institutional investors. Please see the prospectus for more information. |
Principal risks of investing in the Fund
| n | | Depositary receipts risk. Depositary receipts involve many of the same risks as those associated with direct investment in foreign securities. In addition, the underlying issuers of certain depositary receipts, particularly unsponsored or unregistered depositary receipts, are under no obligation to distribute shareholder communications to the holders of such receipts or to pass through to them any voting rights with respect to the deposited securities. |
| n | | Developing/emerging markets securities risk. The prices of securities issued by foreign companies and governments located in developing/emerging market countries may be affected more negatively by inflation, devaluation of their currencies, higher transaction costs, delays in settlement, adverse political developments, the introduction of capital controls, withholding taxes, nationalization of private assets, expropriation, social unrest, war or lack of timely information than those in developed countries. |
| n | | Foreign securities risk. The Fund’s foreign investments may be affected by changes in a foreign country’s exchange rates, political and social instability, changes in economic or taxation policies, difficulties when enforcing obligations, decreased liquidity, and increased volatility. Foreign companies may be subject to less regulation resulting |
| | in less publicly available information about the companies. |
| n | | Geographic focus risk. From time to time the Fund may invest a substantial amount of its assets in securities of issuers located in a single country or a limited number of countries. If the Fund focuses its investments in this manner, it assumes the risk that economic, political and social conditions in those countries will have a significant impact on its investment performance. The Fund’s investment performance may also be more volatile if it focuses its investments in certain countries, especially emerging markets countries. |
| n | | Management risk. The investment techniques and risk analysis used by the Fund’s portfolio managers may not produce the desired results. |
| n | | Market risk. The prices of and the income generated by the Fund’s securities may decline in response to, among other things, investor sentiment, general economic and market conditions, regional or global instability, and currency and interest rate fluctuations. |
| n | | Preferred securities risk. Preferred securities may include provisions that permit the issuer, in its discretion, to defer or omit distributions for a certain period of time. If the Fund owns a security that is deferring or omitting its distributions, the Fund may be required to report the distribution on its tax returns, even though it may not have received this income. Further, preferred securities may lose substantial value due to the omission or deferment of dividend payments. |
| n | | Small- and mid-capitalization risks. Stocks of small- and mid-sized companies tend to be more vulnerable to adverse developments and may have little or no operating history or track record of success, and limited product lines, markets, management and financial resources. The securities of small- and mid-sized companies may be more volatile due to less market interest and less publicly available information about the issuer. They also may be illiquid or restricted as to resale, or may |
| | trade less frequently and in smaller volumes, all of which may cause difficulty when establishing or closing a position at a desirable price. |
About indexes used in this report
| n | | The MSCI EAFE® Index is an unmanaged index considered representative of stocks of Europe, Australasia and the Far East. The index is computed using the net return, which withholds applicable taxes for non-resident investors. |
| n | | The MSCI Emerging Markets IndexSM is an unmanaged index considered representative of stocks of developing countries. The index is computed using the net return, which withholds applicable taxes for non-resident investors. |
| n | | The Lipper Emerging Market Funds Index is an unmanaged index considered representative of emerging market funds tracked by Lipper. |
| n | | The Fund is not managed to track the performance of any particular index, including the index(es) described here, and consequently, the performance of the Fund may deviate significantly from the performance of the
index(es). |
| n | | A direct investment cannot be made in an index. Unless otherwise indicated, index results include reinvested dividends, and they do not reflect sales charges. Performance of the peer group, if applicable, reflects fund expenses; performance of a market index does not. |
Other information
| n | | The returns shown in management’s discussion of Fund performance are based on net asset values (NAVs) calculated for shareholder transactions. Generally accepted accounting principles require adjustments to be made to the net assets of the Fund at period end for financial reporting purposes, and as such, the NAVs for shareholder transactions and the returns based on those NAVs may differ from the NAVs and returns reported in the Financial Highlights. |
| n | | Industry classifications used in this report are generally according to the Global Industry Classification Standard, which was developed by and is the exclusive property and a service mark of MSCI Inc. and Standard & Poor’s. |
This report must be accompanied or preceded by a currently effective Fund prospectus, which contains more complete information, including sales charges and expenses. Investors should read it carefully before investing.
NOT FDIC INSURED | MAY LOSE VALUE | NO BANK GUARANTEE
8 Invesco Emerging Markets Equity Fund
Schedule of Investments
October 31, 2014
| | | | | | | | |
| | | Shares | | | Value | |
Common Stocks & Other Equity Interests–96.91% | |
| Brazil–13.59% | |
BB Seguridade Participacoes S.A. | | | 33,700 | | | $ | 449,605 | |
Cielo S.A. | | | 30,900 | | | | 507,393 | |
Cosan Ltd.–Class A | | | 54,675 | | | | 579,008 | |
Cyrela Brazil Realty S.A. Empreendimentos e Participacoes | | | 54,900 | | | | 272,949 | |
Grendene S.A. | | | 80,000 | | | | 564,649 | |
M Dias Branco S.A. | | | 12,000 | | | | 466,634 | |
Marcopolo S.A.–Preference Shares | | | 283,900 | | | | 485,769 | |
Petroleo Brasileiro S.A.–ADR | | | 30,871 | | | | 361,191 | |
| | | | | | | | 3,687,198 | |
|
| Chile–3.26% | |
Banco de Credito e Inversiones (BCI) | | | 7,153 | | | | 398,447 | |
Empresa Nacional de Telecomunicaciones S.A. | | | 45,416 | | | | 487,111 | |
| | | | | | | | 885,558 | |
|
| China–15.04% | |
China Construction Bank Corp.–Class H | | | 1,043,000 | | | | 777,365 | |
CNOOC Ltd. | | | 272,000 | | | | 425,801 | |
Dongfeng Motor Group Co. Ltd.–Class H | | | 170,000 | | | | 262,614 | |
Haitian International Holdings Ltd. | | | 175,000 | | | | 375,495 | |
Shenzhou International Group Holdings Ltd. | | | 213,000 | | | | 734,710 | |
Sun Art Retail Group Ltd. | | | 346,500 | | | | 371,605 | |
Want Want China Holdings Ltd. | | | 393,000 | | | | 543,086 | |
Zhuzhou CSR Times Electric Co., Ltd.–Class H | | | 137,000 | | | | 589,154 | |
| | | | | | | | 4,079,830 | |
|
| France–1.19% | |
Edenred | | | 11,599 | | | | 321,741 | |
|
| Georgia–2.21% | |
Bank of Georgia Holdings PLC | | | 14,632 | | | | 599,252 | |
|
| Greece–1.97% | |
Eurobank Ergasias S.A.(a) | | | 1,537,468 | | | | 533,669 | |
|
| India–8.93% | |
Axis Bank Ltd. | | | 70,163 | | | | 503,208 | |
Grasim Industries Ltd. | | | 8,992 | | | | 514,045 | |
Motherson Sumi Systems Ltd. | | | 78,871 | | | | 544,436 | |
Tata Consultancy Services Ltd. | | | 11,854 | | | | 508,714 | |
Tata Motors Ltd.–ADR | | | 7,462 | | | | 351,460 | |
| | | | | | | | 2,421,863 | |
|
| Indonesia–4.95% | |
PT Bank Rakyat Indonesia (Persero) Tbk | | | 503,800 | | | | 463,056 | |
PT Indocement Tunggal Prakarsa Tbk | | | 241,600 | | | | 486,595 | |
PT Matahari Department Store Tbk | | | 320,300 | | | | 392,455 | |
| | | | | | | | 1,342,106 | |
|
| Malaysia–2.09% | |
Kossan Rubber Industries Berhad | | | 405,900 | | | | 567,606 | |
| | | | | | | | |
| | | Shares | | | Value | |
| Mexico–7.06% | |
Fibra Uno Administracion S.A. de C.V. | | | 118,800 | | | $ | 412,344 | |
Grupo Financiero Banorte S.A.B. de C.V.–Class O | | | 76,300 | | | | 488,979 | |
Grupo Financiero Inbursa, SAB de C.V.–Class O | | | 188,000 | | | | 567,231 | |
Kimberly-Clark de Mexico, S.A.B. de C.V.–Class A | | | 191,700 | | | | 446,145 | |
| | | | | | | | 1,914,699 | |
|
| Russia–2.72% | |
Magnit PJSC–GDR | | | 11,014 | | | | 737,938 | |
|
| South Africa–7.08% | |
Life Healthcare Group Holdings Ltd. | | | 158,667 | | | | 600,063 | |
Mr. Price Group Ltd. | | | 26,072 | | | | 539,472 | |
MTN Group Ltd. | | | 16,546 | | | | 366,148 | |
Tiger Brands Ltd. | | | 13,803 | | | | 415,122 | |
| | | | | | | | 1,920,805 | |
|
| South Korea–10.75% | |
CJ CGV Co., Ltd. | | | 8,571 | | | | 420,202 | |
Coway Co., Ltd. | | | 4,217 | | | | 320,789 | |
Grand Korea Leisure Co., Ltd. | | | 13,796 | | | | 492,018 | |
Hyundai Motor Co. | | | 3,463 | | | | 552,262 | |
Samsung Electronics Co., Ltd. | | | 624 | | | | 722,817 | |
Shinhan Financial Group Co., Ltd. | | | 8,682 | | | | 408,586 | |
| | | | | | | | 2,916,674 | |
|
| Taiwan–8.09% | |
Hon Hai Precision Industry Co., Ltd. | | | 19,848 | | | | 62,736 | |
King Slide Works Co., Ltd. | | | 39,000 | | | | 512,178 | |
Taiwan Semiconductor Manufacturing Co. Ltd. | | | 275,000 | | | | 1,185,557 | |
Yungtay Engineering Co., Ltd. | | | 196,000 | | | | 435,085 | |
| | | | | | | | 2,195,556 | |
|
| Thailand–2.80% | |
Bangkok Bank PCL–NVDR | | | 58,400 | | | | 356,590 | |
CP ALL PCL | | | 288,000 | | | | 401,840 | |
| | | | | | | | 758,430 | |
|
| Turkey–1.21% | |
TAV Havalimanlari Holding A.S. | | | 39,240 | | | | 328,911 | |
|
| Turkmenistan–1.39% | |
Dragon Oil PLC | | | 43,792 | | | | 376,564 | |
|
| United Kingdom–1.26% | |
SABMiller PLC | | | 6,069 | | | | 342,801 | |
|
| United States–1.32% | |
Yum! Brands, Inc. | | | 4,997 | | | | 358,935 | |
Total Common Stocks & Other Equity Interests
(Cost $26,156,199) | | | | 26,290,136 | |
See accompanying Notes to Financial Statements which are an integral part of the financial statements.
9 Invesco Emerging Markets Equity Fund
| | | | | | | | |
| | | Shares | | | Value | |
Money Market Funds–3.66% | | | | | | | | |
Liquid Assets Portfolio–Institutional Class(b) | | | 495,742 | | | $ | 495,742 | |
Premier Portfolio–Institutional Class(b) | | | 495,741 | | | | 495,741 | |
Total Money Market Funds
(Cost $991,483) | | | | 991,483 | |
TOTAL INVESTMENTS–100.57%
(Cost $27,147,682) | | | | 27,281,619 | |
OTHER ASSETS LESS LIABILITIES–(0.57)% | | | | (153,707 | ) |
NET ASSETS–100.00% | | | $ | 27,127,912 | |
Investment Abbreviations:
| | |
| ADR | | – American Depositary Receipt |
| GDR | | – Global Depositary Receipt |
| NVDR | | – Non-Voting Depositary Receipt |
Notes to Schedule of Investments:
| (a) | Non-income producing security. |
| (b) | The money market fund and the Fund are affiliated by having the same investment adviser. |
See accompanying Notes to Financial Statements which are an integral part of the financial statements.
10 Invesco Emerging Markets Equity Fund
Statement of Assets and Liabilities
October 31, 2014
| | | | |
Assets: | | | | |
Investments, at value (Cost $26,156,199) | | $ | 26,290,136 | |
Investments in affiliated money market funds, at value and cost | | | 991,483 | |
Total investments, at value (Cost $27,147,682) | | | 27,281,619 | |
Foreign currencies, at value (Cost $179,384) | | | 177,563 | |
Receivable for: | | | | |
Fund shares sold | | | 20,155 | |
Dividends | | | 25,169 | |
Investment for trustee deferred compensation and retirement plans | | | 15,442 | |
Other assets | | | 21,793 | |
Total assets | | | 27,541,741 | |
| |
Liabilities: | | | | |
Payable for: | | | | |
Investments purchased | | | 233,764 | |
Fund shares reacquired | | | 20,493 | |
Accrued foreign taxes | | | 54,162 | |
Accrued fees to affiliates | | | 27,140 | |
Accrued trustees’ and officers’ fees and benefits | | | 1,887 | |
Accrued other operating expenses | | | 60,198 | |
Trustee deferred compensation and retirement plans | | | 16,185 | |
Total liabilities | | | 413,829 | |
Net assets applicable to shares outstanding | | $ | 27,127,912 | |
|
Net assets consist of: | |
Shares of beneficial interest | | $ | 29,528,201 | |
Undistributed net investment income | | | 122,868 | |
Undistributed net realized gain (loss) | | | (2,655,826 | ) |
Net unrealized appreciation | | | 132,669 | |
| | | $ | 27,127,912 | |
| | | | |
Net Assets: | | | | |
Class A | | $ | 10,654,192 | |
Class C | | $ | 2,825,325 | |
Class R | | $ | 1,341,312 | |
Class Y | | $ | 3,295,212 | |
Class R5 | | $ | 896,119 | |
Class R6 | | $ | 8,115,752 | |
|
Shares outstanding, $0.01 par value per share,
with an unlimited number of shares authorized: | |
Class A | | | 1,405,040 | |
Class C | | | 376,986 | |
Class R | | | 177,633 | |
Class Y | | | 433,991 | |
Class R5 | | | 117,968 | |
Class R6 | | | 1,067,644 | |
Class A: | | | | |
Net asset value per share | | $ | 7.58 | |
Maximum offering price per share | | | | |
(Net asset value of $7.58 ¸ 94.50%) | | $ | 8.02 | |
Class C: | | | | |
Net asset value and offering price per share | | $ | 7.49 | |
Class R: | | | | |
Net asset value and offering price per share | | $ | 7.55 | |
Class Y: | | | | |
Net asset value and offering price per share | | $ | 7.59 | |
Class R5: | | | | |
Net asset value and offering price per share | | $ | 7.60 | |
Class R6: | | | | |
Net asset value and offering price per share | | $ | 7.60 | |
See accompanying Notes to Financial Statements which are an integral part of the financial statements.
11 Invesco Emerging Markets Equity Fund
Statement of Operations
For the year ended October 31, 2014
| | | | |
Investment income: | | | | |
Dividends (net of foreign withholding taxes of $88,172) | | $ | 689,958 | |
Dividends from affiliated money market funds (includes securities lending income of $1,960) | | | 2,279 | |
Total investment income | | | 692,237 | |
| |
Expenses: | | | | |
Advisory fees | | | 249,678 | |
Administrative services fees | | | 50,000 | |
Custodian fees | | | 50,303 | |
Distribution fees: | | | | |
Class A | | | 32,964 | |
Class C | | | 25,395 | |
Class R | | | 5,361 | |
Transfer agent fees — A, C, R, and Y | | | 60,038 | |
Transfer agent fees — R5 | | | 127 | |
Transfer agent fees — R6 | | | 519 | |
Trustees’ and officers’ fees and benefits | | | 23,449 | |
Registration and filing fees | | | 71,403 | |
Professional services fees | | | 56,638 | |
Other | | | 29,652 | |
Total expenses | | | 655,527 | |
Less: Fees waived, expenses reimbursed and expense offset arrangement(s) | | | (165,890 | ) |
Net expenses | | | 489,637 | |
Net investment income | | | 202,600 | |
| |
Realized and unrealized gain (loss) from: | | | | |
Net realized gain (loss) from: | | | | |
Investment securities | | | (257,866 | ) |
Foreign currencies | | | (12,875 | ) |
| | | | (270,741 | ) |
Change in net unrealized appreciation (depreciation) of: | | | | |
Investment securities (net of foreign taxes on holdings of $2,182) | | | 124,536 | |
Foreign currencies | | | (1,605 | ) |
| | | | 122,931 | |
Net realized and unrealized gain (loss) | | | (147,810 | ) |
Net increase in net assets resulting from operations | | $ | 54,790 | |
See accompanying Notes to Financial Statements which are an integral part of the financial statements.
12 Invesco Emerging Markets Equity Fund
Statement of Changes in Net Assets
For the years ended October 31, 2014 and 2013
| | | | | | | | |
| | | 2014 | | | 2013 | |
Operations: | | | | | |
Net investment income | | $ | 202,600 | | | $ | 157,176 | |
Net realized gain (loss) | | | (270,741 | ) | | | (1,184,036 | ) |
Change in net unrealized appreciation | | | 122,931 | | | | 1,429,983 | |
Net increase in net assets resulting from operations | | | 54,790 | | | | 403,123 | |
| | |
Distributions to shareholders from net investment income: | | | | | | | | |
Class A | | | (121,978 | ) | | | (110,390 | ) |
Class C | | | (8,695 | ) | | | (4,715 | ) |
Class R | | | (5,311 | ) | | | (725 | ) |
Class Y | | | (4,449 | ) | | | (4,128 | ) |
Class R5 | | | (3,472 | ) | | | (1,534 | ) |
Class R6 | | | (81,720 | ) | | | (95,808 | ) |
Total distributions from net investment income | | | (225,625 | ) | | | (217,300 | ) |
| | |
Share transactions–net: | | | | | | | | |
Class A | | | (4,506,049 | ) | | | 5,087,620 | |
Class C | | | 640,555 | | | | 1,030,724 | |
Class R | | | 588,496 | | | | 665,003 | |
Class Y | | | 2,890,104 | | | | 162,026 | |
Class R5 | | | 516,559 | | | | 226,155 | |
Class R6 | | | (472,445 | ) | | | 982,733 | |
Net increase (decrease) in net assets resulting from share transactions | | | (342,780 | ) | | | 8,154,261 | |
Net increase (decrease) in net assets | | | (513,615 | ) | | | 8,340,084 | |
| | |
Net assets: | | | | | | | | |
Beginning of year | | | 27,641,527 | | | | 19,301,443 | |
End of year (includes undistributed net investment income of $122,868 and $196,666, respectively) | | $ | 27,127,912 | | | $ | 27,641,527 | |
Notes to Financial Statements
October 31, 2014
NOTE 1—Significant Accounting Policies
Invesco Emerging Markets Equity Fund (the “Fund”) is a series portfolio of AIM Investment Funds (Invesco Investment Funds) (the “Trust”). The Trust is organized as a Delaware statutory trust and is registered under the Investment Company Act of 1940, as amended (the “1940 Act”), as an open-end series management investment company consisting of twenty-four separate series portfolios, each authorized to issue an unlimited number of shares of beneficial interest. The assets, liabilities and operations of each portfolio are accounted for separately. Information presented in these financial statements pertains only to the Fund. Matters affecting each portfolio or class will be voted on exclusively by the shareholders of such portfolio or class.
The Fund’s investment objective is long-term growth of capital.
The Fund currently consists of six different classes of shares: Class A, Class C, Class R, Class Y, Class R5 and Class R6. Class A shares are sold with a front-end sales charge unless certain waiver criteria are met and under certain circumstances load waived shares may be subject to contingent deferred sales charges (“CDSC”). Class C shares are sold with a CDSC. Class R, Class Y, Class R5 and Class R6 shares are sold at net asset value.
The following is a summary of the significant accounting policies followed by the Fund in the preparation of its financial statements.
| A. | Security Valuations — Securities, including restricted securities, are valued according to the following policy. |
A security listed or traded on an exchange (except convertible securities) is valued at its last sales price or official closing price as of the close of the customary trading session on the exchange where the security is principally traded, or lacking any sales or official closing price on a particular day, the security may be valued at the closing bid price on that day. Securities traded in the over-the-counter market are valued based on prices furnished by independent pricing services or market makers. When such securities are valued by an independent pricing service they may be considered fair valued. Futures contracts are valued at the final settlement price set by an exchange on which they are principally traded. Listed options are valued at the mean between the last bid and ask prices from the exchange on which they are principally traded. Options not listed on an exchange are valued by an independent source at the mean between the last bid and ask prices. For purposes of determining net
13 Invesco Emerging Markets Equity Fund
asset value per share, futures and option contracts generally are valued 15 minutes after the close of the customary trading session of the New York Stock Exchange (“NYSE”).
Investments in open-end and closed-end registered investment companies that do not trade on an exchange are valued at the end of day net asset value per share. Investments in open-end and closed-end registered investment companies that trade on an exchange are valued at the last sales price or official closing price as of the close of the customary trading session on the exchange where the security is principally traded.
Debt obligations (including convertible securities) and unlisted equities are fair valued using an evaluated quote provided by an independent pricing service. Evaluated quotes provided by the pricing service may be determined without exclusive reliance on quoted prices, and may reflect appropriate factors such as institution-size trading in similar groups of securities, developments related to specific securities, dividend rate (for unlisted equities), yield (for debt obligations), quality, type of issue, coupon rate (for debt obligations), maturity (for debt obligations), individual trading characteristics and other market data. Debt obligations are subject to interest rate and credit risks. In addition, all debt obligations involve some risk of default with respect to interest and/or principal payments.
Foreign securities’ (including foreign exchange contracts) prices are converted into U.S. dollar amounts using the applicable exchange rates as of the close of the NYSE. If market quotations are available and reliable for foreign exchange-traded equity securities, the securities will be valued at the market quotations. Because trading hours for certain foreign securities end before the close of the NYSE, closing market quotations may become unreliable. If between the time trading ends on a particular security and the close of the customary trading session on the NYSE, events occur that the Adviser determines are significant and make the closing price unreliable, the Fund may fair value the security. If the event is likely to have affected the closing price of the security, the security will be valued at fair value in good faith using procedures approved by the Board of Trustees. Adjustments to closing prices to reflect fair value may also be based on a screening process of an independent pricing service to indicate the degree of certainty, based on historical data, that the closing price in the principal market where a foreign security trades is not the current value as of the close of the NYSE. Foreign securities’ prices meeting the approved degree of certainty that the price is not reflective of current value will be priced at the indication of fair value from the independent pricing service. Multiple factors may be considered by the independent pricing service in determining adjustments to reflect fair value and may include information relating to sector indices, American Depositary Receipts and domestic and foreign index futures. Foreign securities may have additional risks including exchange rate changes, potential for sharply devalued currencies and high inflation, political and economic upheaval, the relative lack of issuer information, relatively low market liquidity and the potential lack of strict financial and accounting controls and standards.
Securities for which market prices are not provided by any of the above methods may be valued based upon quotes furnished by independent sources. The last bid price may be used to value equity securities. The mean between the last bid and ask prices is used to value debt obligations, including corporate loans.
Securities for which market quotations are not readily available or became unreliable are valued at fair value as determined in good faith by or under the supervision of the Trust’s officers following procedures approved by the Board of Trustees. Issuer specific events, market trends, bid/ask quotes of brokers and information providers and other market data may be reviewed in the course of making a good faith determination of a security’s fair value.
The Fund may invest in securities that are subject to interest rate risk, meaning the risk that the prices will generally fall as interest rates rise and, conversely, the prices will generally rise as interest rates fall. Specific securities differ in their sensitivity to changes in interest rates depending on their individual characteristics. Changes in interest rates may result in increased market volatility, which may affect the value and/or liquidity of certain of the Fund’s investments.
Valuations change in response to many factors including the historical and prospective earnings of the issuer, the value of the issuer’s assets, general economic conditions, interest rates, investor perceptions and market liquidity. Because of the inherent uncertainties of valuation, the values reflected in the financial statements may materially differ from the value received upon actual sale of those investments.
| B. | Securities Transactions and Investment Income — Securities transactions are accounted for on a trade date basis. Realized gains or losses on sales are computed on the basis of specific identification of the securities sold. Interest income (net of withholding tax, if any) is recorded on the accrual basis from settlement date. Dividend income (net of withholding tax, if any) is recorded on the ex-dividend date. |
The Fund may periodically participate in litigation related to Fund investments. As such, the Fund may receive proceeds from litigation settlements. Any proceeds received are included in the Statement of Operations as realized gain (loss) for investments no longer held and as unrealized gain (loss) for investments still held.
Brokerage commissions and mark ups are considered transaction costs and are recorded as an increase to the cost basis of securities purchased and/or a reduction of proceeds on a sale of securities. Such transaction costs are included in the determination of net realized and unrealized gain (loss) from investment securities reported in the Statement of Operations and the Statement of Changes in Net Assets and the net realized and unrealized gains (losses) on securities per share in the Financial Highlights. Transaction costs are included in the calculation of the Fund’s net asset value and, accordingly, they reduce the Fund’s total returns. These transaction costs are not considered operating expenses and are not reflected in net investment income reported in the Statement of Operations and Statement of Changes in Net Assets, or the net investment income per share and ratios of expenses and net investment income reported in the Financial Highlights, nor are they limited by any expense limitation arrangements between the Fund and the investment adviser.
The Fund allocates income and realized and unrealized capital gains and losses to a class based on the relative net assets of each class.
| C. | Country Determination — For the purposes of making investment selection decisions and presentation in the Schedule of Investments, the investment adviser may determine the country in which an issuer is located and/or credit risk exposure based on various factors. These factors include the laws of the country under which the issuer is organized, where the issuer maintains a principal office, the country in which the issuer derives 50% or more of its total revenues and the country that has the primary market for the issuer’s securities, as well as other criteria. Among the other criteria that may be evaluated for making this determination are the country in which the issuer maintains 50% or more of its assets, the type of security, financial guarantees and enhancements, the nature of the collateral and the sponsor organization. Country of issuer and/or credit risk exposure has been determined to be the United States of America, unless otherwise noted. |
| D. | Distributions — Distributions from net investment income and net realized capital gain, if any, are generally declared and paid annually and recorded on the ex-dividend date. The Fund may elect to treat a portion of the proceeds from redemptions as distributions for federal income tax purposes. |
14 Invesco Emerging Markets Equity Fund
| E. | Federal Income Taxes — The Fund intends to comply with the requirements of Subchapter M of the Internal Revenue Code of 1986, as amended (the “Internal Revenue Code”), necessary to qualify as a regulated investment company and to distribute substantially all of the Fund’s taxable earnings to shareholders. As such, the Fund will not be subject to federal income taxes on otherwise taxable income (including net realized capital gain) that is distributed to shareholders. Therefore, no provision for federal income taxes is recorded in the financial statements. |
The Fund recognizes the tax benefits of uncertain tax positions only when the position is more likely than not to be sustained. Management has analyzed the Fund’s uncertain tax positions and concluded that no liability for unrecognized tax benefits should be recorded related to uncertain tax positions. Management is not aware of any tax positions for which it is reasonably possible that the total amounts of unrecognized tax benefits will change materially in the next 12 months.
The Fund files tax returns in the U.S. Federal jurisdiction and certain other jurisdictions. Generally, the Fund is subject to examinations by such taxing authorities for up to three years after the filing of the return for the tax period.
| F. | Expenses — Fees provided for under the Rule 12b-1 plan of a particular class of the Fund are charged to the operations of such class. Transfer agency fees and expenses and other shareholder recordkeeping fees and expenses attributable to Class R5 and Class R6 are allocated to each share class based on relative net assets. Sub-accounting fees attributable to Class R5 are charged to the operations of the class. Transfer agency fees and expenses and other shareholder recordkeeping fees and expenses relating to all other classes are allocated among those classes based on relative net assets. All other expenses are allocated among the classes based on relative net assets. |
| G. | Accounting Estimates — The preparation of financial statements in conformity with accounting principles generally accepted in the United States of America (“GAAP”) requires management to make estimates and assumptions that affect the reported amounts of assets and liabilities at the date of the financial statements and the reported amounts of revenues and expenses during the reporting period including estimates and assumptions related to taxation. Actual results could differ from those estimates by a significant amount. In addition, the Fund monitors for material events or transactions that may occur or become known after the period-end date and before the date the financial statements are released to print. |
| H. | Indemnifications — Under the Trust’s organizational documents, each Trustee, officer, employee or other agent of the Trust is indemnified against certain liabilities that may arise out of the performance of their duties to the Fund. Additionally, in the normal course of business, the Fund enters into contracts, including the Fund’s servicing agreements, that contain a variety of indemnification clauses. The Fund’s maximum exposure under these arrangements is unknown as this would involve future claims that may be made against the Fund that have not yet occurred. The risk of material loss as a result of such indemnification claims is considered remote. |
| I. | Securities Lending — The Fund may lend portfolio securities having a market value up to one-third of the Fund’s total assets. Such loans are secured by collateral equal to no less than the market value of the loaned securities determined daily by the securities lending provider. Such collateral will be cash or debt securities issued or guaranteed by the U.S. Government or any of its sponsored agencies. Cash collateral received in connection with these loans is invested in short-term money market instruments or affiliated money market funds and is shown as such on the Schedule of Investments. It is the Fund’s policy to obtain additional collateral from or return excess collateral to the borrower by the end of the next business day, following the valuation date of the securities loaned. Therefore, the value of the collateral held may be temporarily less than the value of the securities on loan. Lending securities entails a risk of loss to the Fund if, and to the extent that, the market value of the securities loaned were to increase and the borrower did not increase the collateral accordingly, and the borrower failed to return the securities. Upon the failure of the borrower to return the securities, collateral may be liquidated and the securities may be purchased on the open market to replace the loaned securities. The Fund could experience delays and costs in gaining access to the collateral. The Fund bears the risk of any deficiency in the amount of the collateral available for return to the borrower due to any loss on the collateral invested. Dividends received on cash collateral investments for securities lending transactions, which are net of compensation to counterparties, is included in Dividends from affiliated money market funds on the Statement of Operations. The aggregate value of securities out on loan is shown as a footnote on the Statement of Assets and Liabilities, if any. |
| J. | Foreign Currency Translations — Foreign currency is valued at the close of the NYSE based on quotations posted by banks and major currency dealers. Portfolio securities and other assets and liabilities denominated in foreign currencies are translated into U.S. dollar amounts at date of valuation. Purchases and sales of portfolio securities (net of foreign taxes withheld on disposition) and income items denominated in foreign currencies are translated into U.S. dollar amounts on the respective dates of such transactions. The Fund does not separately account for the portion of the results of operations resulting from changes in foreign exchange rates on investments and the fluctuations arising from changes in market prices of securities held. The combined results of changes in foreign exchange rates and the fluctuation of market prices on investments (net of estimated foreign tax withholding) are included with the net realized and unrealized gain or loss from investments in the Statement of Operations. Reported net realized foreign currency gains or losses arise from (1) sales of foreign currencies, (2) currency gains or losses realized between the trade and settlement dates on securities transactions, and (3) the difference between the amounts of dividends, interest, and foreign withholding taxes recorded on the Fund’s books and the U.S. dollar equivalent of the amounts actually received or paid. Net unrealized foreign currency gains and losses arise from changes in the fair values of assets and liabilities, other than investments in securities at fiscal period end, resulting from changes in exchange rates. |
The Fund may invest in foreign securities, which may be subject to foreign taxes on income, gains on investments or currency repatriation, a portion of which may be recoverable. Foreign taxes, if any, are recorded based on the tax regulations and rates that exist in the foreign markets in which the Fund invests and are shown in the Statement of Operations.
| K. | Forward Foreign Currency Contracts — The Fund may engage in foreign currency transactions either on a spot (i.e. for prompt delivery and settlement) basis or through forward foreign currency contracts to manage or minimize currency or exchange rate risk. |
The Fund may also enter into forward foreign currency contracts for the purchase or sale of a security denominated in a foreign currency in order to “lock in” the U.S. dollar price of that security, or the Fund may also enter into forward foreign currency contracts that do not provide for physical settlement of the two currencies, but instead are settled by a single cash payment calculated as the difference between the agreed upon exchange rate and the spot rate at settlement based upon an agreed upon notional amount (non-deliverable forwards). The Fund will set aside liquid assets in an amount equal to daily mark-to-market obligation for forward foreign currency contracts.
A forward foreign currency contract is an obligation between two parties (“Counterparties”) to purchase or sell a specific currency for an agreed-upon price at a future date. The use of forward foreign currency contracts does not eliminate fluctuations in the price of the underlying
15 Invesco Emerging Markets Equity Fund
securities the Fund owns or intends to acquire but establishes a rate of exchange in advance. Fluctuations in the value of these contracts are measured by the difference in the contract date and reporting date exchange rates and are recorded as unrealized appreciation (depreciation) until the contracts are closed. When the contracts are closed, realized gains (losses) are recorded. Realized and unrealized gains (losses) on the contracts are included in the Statement of Operations. The primary risks associated with forward foreign currency contracts include failure of the Counterparty to meet the terms of the contract and the value of the foreign currency changing unfavorably. These risks may be in excess of the amounts reflected in the Statement of Assets and Liabilities.
NOTE 2—Advisory Fees and Other Fees Paid to Affiliates
The Trust has entered into a master investment advisory agreement with Invesco Advisers, Inc. (the “Adviser” or “Invesco”). Under the terms of the investment advisory agreement, the Fund pays an advisory fee to the Adviser based on the annual rate of the Fund’s average daily net assets as follows:
| | | | | | |
| Average Daily Net Assets | | Rate |
First $250 million | | | 0 | .935% | | |
Next $250 million | | | 0 | .91% | | |
Next $500 million | | | 0 | .885% | | |
Next $1.5 billion | | | 0 | .86% | | |
Next $2.5 billion | | | 0 | .835% | | |
Next $2.5 billion | | | 0 | .81% | | |
Next $2.5 billion | | | 0 | .785% | | |
Over $10 billion | | | 0 | .76% | | |
For the year ended October 31, 2014, the effective advisory fees incurred by the Fund was 0.94%.
Under the terms of a master sub-advisory agreement between the Adviser and each of Invesco Asset Management Deutschland GmbH, Invesco Asset Management Limited, Invesco Asset Management (Japan) Limited, Invesco Australia Limited, Invesco Hong Kong Limited, Invesco Senior Secured Management, Inc. and Invesco Canada Ltd. (collectively, the “Affiliated Sub-Advisers”) the Adviser, not the Fund, may pay 40% of the fees paid to the Adviser to any such Affiliated Sub-Adviser(s) that provide(s) discretionary investment management services to the Fund based on the percentage of assets allocated to such Sub-Adviser(s).
The Adviser has contractually agreed, through at least February 29, 2016, to waive advisory fees and/or reimburse expenses to the extent necessary to limit total annual fund operating expenses after fee waiver and/or expense reimbursement (excluding certain items discussed below) of Class A, Class C, Class R, Class Y, Class R5 and Class R6 shares to 1.85%, 2.60%, 2.10%, 1.60%, 1.60% and 1.60% of average daily net assets, respectively. In determining the Adviser’s obligation to waive advisory fees and/or reimburse expenses, the following expenses are not taken into account, and could cause the total annual fund operating expenses after fee waiver and/or expense reimbursement to exceed the numbers reflected above: (1) interest; (2) taxes; (3) dividend expense on short sales; (4) extraordinary or non-routine items, including litigation expenses; and (5) expenses that the Fund has incurred but did not actually pay because of an expense offset arrangement. Unless Invesco continues the fee waiver agreement, it will terminate on February 29, 2016. The fee waiver agreement cannot be terminated during its term.
Further, the Adviser has contractually agreed, through at least June 30, 2016, to waive the advisory fee payable by the Fund in an amount equal to 100% of the net advisory fees the Adviser receives from the affiliated money market funds on investments by the Fund of uninvested cash (excluding investments of cash collateral from securities lending) in such affiliated money market funds.
For the year ended October 31, 2014, the Adviser waived advisory fees of $105,206 and reimbursed class level expenses of $44,043, $8,483, $3,581, $3,707, $127 and $519 for Class A, Class C, Class R, Class Y, Class R5 and Class R6 shares, respectively.
The Trust has entered into a master administrative services agreement with Invesco pursuant to which the Fund has agreed to pay Invesco for certain administrative costs incurred in providing accounting services to the Fund. For the year ended October 31, 2014, expenses incurred under the agreement are shown in the Statement of Operations as Administrative services fees.
The Trust has entered into a transfer agency and service agreement with Invesco Investment Services, Inc. (“IIS”) pursuant to which the Fund has agreed to pay IIS a fee for providing transfer agency and shareholder services to the Fund and reimburse IIS for certain expenses incurred by IIS in the course of providing such services. IIS may make payments to intermediaries that provide omnibus account services, sub-accounting services and/or networking services. All fees payable by IIS to intermediaries that provide omnibus account services or sub-accounting are charged back to the Fund, subject to certain limitations approved by the Trust’s Board of Trustees. For the year ended October 31, 2014, expenses incurred under the agreement are shown in the Statement of Operations as Transfer agent fees.
The Trust has entered into master distribution agreements with Invesco Distributors, Inc. (“IDI”) to serve as the distributor for the Class A, Class C, Class R, Class Y, Class R5 and Class R6 shares of the Fund. The Trust has adopted plans pursuant to Rule 12b-1 under the 1940 Act with respect to the Fund’s Class A, Class C and Class R shares (collectively the “Plans”). The Fund, pursuant to the Plans, pays IDI compensation at the annual rate of 0.25% of the Fund’s average daily net assets of Class A shares, 1.00% of the average daily net assets of Class C shares and 0.50% of the average daily net assets of Class R shares. Of the Plan payments, up to 0.25% of the average daily net assets of each class of shares may be paid to furnish continuing personal shareholder services to customers who purchase and own shares of such classes. Any amounts not paid as a service fee under the Plans would constitute an asset-based sales charge. Rules of the Financial Industry Regulatory Authority (“FINRA”) impose a cap on the total sales charges, including asset-based sales charges, that may be paid by any class of shares of the Fund. For the year ended October 31, 2014, expenses incurred under the Plans are shown in the Statement of Operations as Distribution fees.
Front-end sales commissions and CDSC (collectively, the “sales charges”) are not recorded as expenses of the Fund. Front-end sales commissions are deducted from proceeds from the sales of Fund shares prior to investment in Class A shares of the Fund. CDSC are deducted from redemption proceeds prior to remittance to the shareholder. During the year ended October 31, 2014, IDI advised the Fund that IDI retained $10,585 in front-end sales commissions from the sale of Class A shares and $48 and $587 from Class A and Class C shares, respectively, for CDSC imposed upon redemptions by shareholders.
Certain officers and trustees of the Trust are officers and directors of the Adviser, IIS and/or IDI.
16 Invesco Emerging Markets Equity Fund
NOTE 3—Additional Valuation Information
GAAP defines fair value as the price that would be received to sell an asset or paid to transfer a liability in an orderly transaction between market participants at the measurement date, under current market conditions. GAAP establishes a hierarchy that prioritizes the inputs to valuation methods, giving the highest priority to readily available unadjusted quoted prices in an active market for identical assets (Level 1) and the lowest priority to significant unobservable inputs (Level 3), generally when market prices are not readily available or are unreliable. Based on the valuation inputs, the securities or other investments are tiered into one of three levels. Changes in valuation methods may result in transfers in or out of an investment’s assigned level:
| | Level 1 — | Prices are determined using quoted prices in an active market for identical assets. |
| | Level 2 — | Prices are determined using other significant observable inputs. Observable inputs are inputs that other market participants may use in pricing a security. These may include quoted prices for similar securities, interest rates, prepayment speeds, credit risk, yield curves, loss severities, default rates, discount rates, volatilities and others. |
| | Level 3 — | Prices are determined using significant unobservable inputs. In situations where quoted prices or observable inputs are unavailable (for example, when there is little or no market activity for an investment at the end of the period), unobservable inputs may be used. Unobservable inputs reflect the Fund’s own assumptions about the factors market participants would use in determining fair value of the securities or instruments and would be based on the best available information. |
The following is a summary of the tiered valuation input levels, as of October 31, 2014. The level assigned to the securities valuations may not be an indication of the risk or liquidity associated with investing in those securities. Because of the inherent uncertainties of valuation, the values reflected in the financial statements may materially differ from the value received upon actual sale of those investments.
During the year ended October 31, 2014, there were transfers from Level 1 to Level 2 of $1,368,977 and from Level 2 to Level 1 of $408,586, due to foreign fair value adjustments.
| | | | | | | | | | | | | | | | |
| | | Level 1 | | | Level 2 | | | Level 3 | | | Total | |
Brazil | | $ | 3,687,198 | | | $ | — | | | $ | — | | | $ | 3,687,198 | |
Chile | | | 885,558 | | | | — | | | | — | | | | 885,558 | |
China | | | 2,150,184 | | | | 1,929,646 | | | | — | | | | 4,079,830 | |
France | | | — | | | | 321,741 | | | | — | | | | 321,741 | |
Georgia | | | 599,252 | | | | — | | | | — | | | | 599,252 | |
Greece | | | 533,669 | | | | — | | | | — | | | | 533,669 | |
India | | | 865,505 | | | | 1,556,358 | | | | — | | | | 2,421,863 | |
Indonesia | | | — | | | | 1,342,106 | | | | — | | | | 1,342,106 | |
Malaysia | | | 567,606 | | | | — | | | | — | | | | 567,606 | |
Mexico | | | 1,914,699 | | | | — | | | | — | | | | 1,914,699 | |
Russia | | | 737,938 | | | | — | | | | — | | | | 737,938 | |
South Africa | | | 1,920,805 | | | | — | | | | — | | | | 1,920,805 | |
South Korea | | | 828,788 | | | | 2,087,886 | | | | — | | | | 2,916,674 | |
Taiwan | | | — | | | | 2,195,556 | | | | — | | | | 2,195,556 | |
Thailand | | | 401,840 | | | | 356,590 | | | | — | | | | 758,430 | |
Turkey | | | — | | | | 328,911 | | | | — | | | | 328,911 | |
Turkmenistan | | | 376,564 | | | | — | | | | — | | | | 376,564 | |
United Kingdom | | | — | | | | 342,801 | | | | — | | | | 342,801 | |
United States | | | 1,350,418 | | | | — | | | | — | | | | 1,350,418 | |
| | | $ | 16,820,024 | | | $ | 10,461,595 | | | $ | — | | | $ | 27,281,619 | |
NOTE 4—Expense Offset Arrangement(s)
The expense offset arrangement is comprised of transfer agency credits which result from balances in demand deposit accounts used by the transfer agent for clearing shareholder transactions. For the year ended October 31, 2014, the Fund received credits from this arrangement, which resulted in the reduction of the Fund’s total expenses of $224.
NOTE 5—Trustees’ and Officers’ Fees and Benefits
Trustees’ and Officers’ Fees and Benefits include amounts accrued by the Fund to pay remuneration to certain Trustees and Officers of the Fund. Trustees have the option to defer compensation payable by the Fund, and Trustees’ and Officers’ Fees and Benefits also include amounts accrued by the Fund to fund such deferred compensation amounts. Those Trustees who defer compensation have the option to select various Invesco Funds in which their deferral accounts shall be deemed to be invested. Finally, certain current Trustees were eligible to participate in a retirement plan that provided for benefits to be paid upon retirement to Trustees over a period of time based on the number of years of service. The Fund may have certain former Trustees who also participate in a retirement plan and receive benefits under such plan. Trustees’ and Officers’ Fees and Benefits include amounts accrued by the Fund to fund such retirement benefits. Obligations under the deferred compensation and retirement plans represent unsecured claims against the general assets of the Fund.
17 Invesco Emerging Markets Equity Fund
NOTE 6—Cash Balances
The Fund is permitted to temporarily carry a negative or overdrawn balance in its account with State Street Bank and Trust Company, the custodian bank. Such balances, if any at period end, are shown in the Statement of Assets and Liabilities under the payable caption Amount due custodian. To compensate the custodian bank for such overdrafts, the overdrawn Fund may either (1) leave funds as a compensating balance in the account so the custodian bank can be compensated by earning the additional interest; or (2) compensate by paying the custodian bank at a rate agreed upon by the custodian bank and Invesco, not to exceed the contractually agreed upon rate.
NOTE 7—Distributions to Shareholders and Tax Components of Net Assets
Tax Character of Distributions to Shareholders Paid During the Fiscal Years Ended October 31, 2014 and 2013:
| | | | | | | | |
| | | 2014 | | | 2013 | |
Ordinary income | | $ | 225,625 | | | $ | 217,300 | |
Tax Components of Net Assets at Period-End:
| | | | |
| | | 2014 | |
Undistributed ordinary income | | $ | 136,269 | |
Net unrealized appreciation — investments | | | 76,786 | |
Net unrealized appreciation (depreciation) — other investments | | | (1,274 | ) |
Temporary book/tax differences | | | (13,400 | ) |
Capital loss carryforward | | | (2,598,670 | ) |
Shares of beneficial interest | | | 29,528,201 | |
Total net assets | | $ | 27,127,912 | |
The difference between book-basis and tax-basis unrealized appreciation (depreciation) is due to differences in the timing of recognition of gains and losses on investments for tax and book purposes. The Fund’s net unrealized appreciation (depreciation) difference is attributable primarily to wash sales.
The temporary book/tax differences are a result of timing differences between book and tax recognition of income and/or expenses. The Fund’s temporary book/tax differences are the result of the trustee deferral of compensation and retirement plan benefits.
Capital loss carryforward is calculated and reported as of a specific date. Results of transactions and other activity after that date may affect the amount of capital loss carryforward actually available for the Fund to utilize. Capital losses generated in years beginning after December 22, 2010 can be carried forward for an unlimited period, whereas previous losses expire in 8 tax years. Capital losses with an expiration period may not be used to offset capital gains until all net capital losses without an expiration date have been utilized. Capital loss carryforwards with no expiration date will retain their character as either short-term or long-term capital losses instead of as short-term capital losses as under prior law. The ability to utilize capital loss carryforwards in the future may be limited under the Internal Revenue Code and related regulations based on the results of future transactions.
The Fund has a capital loss carryforward as of October 31, 2014, which expires as follows:
| | | | | | | | | | | | |
| Capital Loss Carryforward* | |
| Expiration | | Short-Term | | | Long-Term | | | Total | |
Not subject to expiration | | $ | 851,527 | | | $ | 1,747,143 | | | $ | 2,598,670 | |
| * | Capital loss carryforward as of the date listed above is reduced for limitations, if any, to the extent required by the Internal Revenue Code and may be further limited depending upon a variety of factors, including the realization of net unrealized gains or losses as of the date of any reorganization. |
NOTE 8—Investment Securities
The aggregate amount of investment securities (other than short-term securities, U.S. Treasury obligations and money market funds, if any) purchased and sold by the Fund during the year ended October 31, 2014 was $24,255,044 and $24,376,184, respectively. Cost of investments on a tax basis includes the adjustments for financial reporting purposes as of the most recently completed federal income tax reporting period-end.
| | | | |
| Unrealized Appreciation (Depreciation) of Investment Securities on a Tax Basis | |
Aggregate unrealized appreciation of investment securities | | $ | 1,911,954 | |
Aggregate unrealized (depreciation) of investment securities | | | (1,835,168 | ) |
Net unrealized appreciation of investment securities | | $ | 76,786 | |
Cost of investments for tax purposes is $27,204,833.
18 Invesco Emerging Markets Equity Fund
NOTE 9—Reclassification of Permanent Differences
Primarily as a result of differing book/tax treatment of foreign currency transactions and foreign capital gain, on October 31, 2014, undistributed net investment income was decreased by $50,773 and undistributed net realized gain (loss) was increased by $50,773. This reclassification had no effect on the net assets of the Fund.
NOTE 10—Share Information
| | | | | | | | | | | | | | | | |
| | | Summary of Share Activity | |
| | | Years ended October 31, | |
| | | 2014(a) | | | 2013 | |
| | | Shares | | | Amount | | | Shares | | | Amount | |
Sold: | | | | | | | | | | | | | | | | |
Class A | | | 826,496 | | | $ | 6,210,865 | | | | 1,210,452 | | | $ | 9,144,959 | |
Class C | | | 179,248 | | | | 1,317,911 | | | | 209,861 | | | | 1,569,940 | |
Class R | | | 97,020 | | | | 714,181 | | | | 88,331 | | | | 673,041 | |
Class Y | | | 391,758 | | | | 3,010,217 | | | | 40,948 | | | | 310,733 | |
Class R5 | | | 69,420 | | | | 513,251 | | | | 33,120 | | | | 230,345 | |
Class R6 | | | 51,867 | | | | 386,284 | | | | 273,272 | | | | 1,930,118 | |
| | | | |
Issued as reinvestment of dividends: | | | | | | | | | | | | | | | | |
Class A | | | 13,876 | | | | 100,046 | | | | 11,199 | | | | 86,231 | |
Class C | | | 1,162 | | | | 8,339 | | | | 607 | | | | 4,665 | |
Class R | | | 730 | | | | 5,260 | | | | 86 | | | | 660 | |
Class Y | | | 607 | | | | 4,377 | | | | 524 | | | | 4,029 | |
Class R5 | | | 459 | | | | 3,308 | | | | 170 | | | | 1,310 | |
Class R6 | | | 11,319 | | | | 81,720 | | | | 12,443 | | | | 95,809 | |
| | | | |
Reacquired: | | | | | | | | | | | | | | | | |
Class A | | | (1,443,468 | ) | | | (10,816,960 | ) | | | (552,692 | ) | | | (4,143,570 | ) |
Class C | | | (93,773 | ) | | | (685,695 | ) | | | (72,480 | ) | | | (543,881 | ) |
Class R | | | (17,429 | ) | | | (130,945 | ) | | | (1,162 | ) | | | (8,698 | ) |
Class Y | | | (16,439 | ) | | | (124,490 | ) | | | (20,317 | ) | | | (152,736 | ) |
Class R5 | | | — | | | | — | | | | (733 | ) | | | (5,500 | ) |
Class R6 | | | (125,987 | ) | | | (940,449 | ) | | | (138,213 | ) | | | (1,043,194 | ) |
Net increase (decrease) in share activity | | | (53,134 | ) | | $ | (342,780 | ) | | | 1,095,416 | | | $ | 8,154,261 | |
| (a) | There are entities that are record owners of more than 5% of the outstanding shares of the Fund and in the aggregate own 25% of the outstanding shares of the Fund. IDI has an agreement with these entities to sell Fund shares. The Fund, Invesco and/or Invesco affiliates may make payments to these entities, which are considered to be related to the Fund, for providing services to the Fund, Invesco and/or Invesco affiliates including but not limited to services such as securities brokerage, distribution, third party record keeping and account servicing. The Fund has no knowledge as to whether all or any portion of the shares owned of record by these entities are also owned beneficially. |
| | In addition, 33% of the outstanding shares of the Fund are owned by affiliated mutual funds. Affiliated mutual funds are other mutual funds that are also advised by Invesco. |
19 Invesco Emerging Markets Equity Fund
NOTE 11—Financial Highlights
The following schedule presents financial highlights for a share of the Fund outstanding throughout the periods indicated.
| | | | | | | | | | | | | | | | | | | | | | | | | | | | | | | | | | | | | | | | | | | | | | | | | | | | | | | | |
| | | Net asset
value,
beginning
of period | | | Net
investment
income
(loss)(a) | | | Net gains
(losses)
on securities
(both
realized and
unrealized) | | | Total from
investment
operations | | | Dividends
from net
investment
income | | | Distributions
from net
realized
gains | | | Total
distributions | | | Net asset
value, end
of period | | | Total
return(b) | | | Net assets,
end of period
(000’s omitted) | | | Ratio of
expenses
to average
net assets
with fee waivers
and/or expenses
absorbed | | | Ratio of
expenses
to average net
assets without
fee waivers
and/or expenses
absorbed | | | Ratio of net
investment
income (loss)
to average
net assets | | | Portfolio
turnover(c) | |
Class A | | | | | | | | | | | | | | | | | | | | | | | | | | | | | | | | | | | | | | | | | | | | | | | | | | | | | | | | |
Year ended 10/31/14 | | $ | 7.61 | | | $ | 0.06 | | | $ | (0.03 | ) | | $ | 0.03 | | | $ | (0.06 | ) | | $ | — | | | $ | (0.06 | ) | | $ | 7.58 | | | | 0.44 | % | | $ | 10,654 | | | | 1.85 | %(d) | | | 2.57 | %(d) | | | 0.74 | %(d) | | | 94 | % |
Year ended 10/31/13 | | | 7.61 | | | | 0.05 | | | | 0.03 | | | | 0.08 | | | | (0.08 | ) | | | — | | | | (0.08 | ) | | | 7.61 | | | | 1.06 | | | | 15,284 | | | | 1.85 | | | | 2.75 | | | | 0.68 | | | | 41 | |
Year ended 10/31/12 | | | 8.07 | | | | 0.11 | | | | (0.47 | ) | | | (0.36 | ) | | | (0.07 | ) | | | (0.03 | ) | | | (0.10 | ) | | | 7.61 | | | | (4.51 | ) | | | 10,187 | | | | 1.85 | | | | 3.44 | | | | 1.36 | | | | 34 | |
Year ended 10/31/11(e) | | | 10.00 | | | | 0.03 | | | | (1.96 | ) | | | (1.93 | ) | | | — | | | | — | | | | — | | | | 8.07 | | | | (19.30 | ) | | | 4,019 | | | | 1.84 | (f) | | | 5.28 | (f) | | | 0.87 | (f) | | | 16 | |
Class C | | | | | | | | | | | | | | | | | | | | | | | | | | | | | | | | | | | | | | | | | | | | | | | | | | | | | | | | |
Year ended 10/31/14 | | | 7.55 | | | | — | | | | (0.03 | ) | | | (0.03 | ) | | | (0.03 | ) | | | — | | | | (0.03 | ) | | | 7.49 | | | | (0.40 | ) | | | 2,825 | | | | 2.60 | (d) | | | 3.32 | (d) | | | (0.01 | )(d) | | | 94 | |
Year ended 10/31/13 | | | 7.55 | | | | (0.01 | ) | | | 0.04 | | | | 0.03 | | | | (0.03 | ) | | | — | | | | (0.03 | ) | | | 7.55 | | | | 0.40 | | | | 2,191 | | | | 2.60 | | | | 3.50 | | | | (0.07 | ) | | | 41 | |
Year ended 10/31/12 | | | 8.05 | | | | 0.04 | | | | (0.47 | ) | | | (0.43 | ) | | | (0.04 | ) | | | (0.03 | ) | | | (0.07 | ) | | | 7.55 | | | | (5.28 | ) | | | 1,150 | | | | 2.60 | | | | 4.19 | | | | 0.61 | | | | 34 | |
Year ended 10/31/11(e) | | | 10.00 | | | | 0.00 | | | | (1.95 | ) | | | (1.95 | ) | | | — | | | | — | | | | — | | | | 8.05 | | | | (19.50 | ) | | | 236 | | | | 2.59 | (f) | | | 6.03 | (f) | | | 0.12 | (f) | | | 16 | |
Class R | | | | | | | | | | | | | | | | | | | | | | | | | | | | | | | | | | | | | | | | | | | | | | | | | | | | | | | | |
Year ended 10/31/14 | | | 7.59 | | | | 0.04 | | | | (0.03 | ) | | | 0.01 | | | | (0.05 | ) | | | — | | | | (0.05 | ) | | | 7.55 | | | | 0.17 | | | | 1,341 | | | | 2.10 | (d) | | | 2.82 | (d) | | | 0.49 | (d) | | | 94 | |
Year ended 10/31/13 | | | 7.58 | | | | 0.03 | | | | 0.04 | | | | 0.07 | | | | (0.06 | ) | | | — | | | | (0.06 | ) | | | 7.59 | | | | 0.97 | | | | 739 | | | | 2.10 | | | | 3.00 | | | | 0.43 | | | | 41 | |
Year ended 10/31/12 | | | 8.06 | | | | 0.08 | | | | (0.47 | ) | | | (0.39 | ) | | | (0.06 | ) | | | (0.03 | ) | | | (0.09 | ) | | | 7.58 | | | | (4.86 | ) | | | 76 | | | | 2.10 | | | | 3.69 | | | | 1.11 | | | | 34 | |
Year ended 10/31/11(e) | | | 10.00 | | | | 0.02 | | | | (1.96 | ) | | | (1.94 | ) | | | — | | | | — | | | | — | | | | 8.06 | | | | (19.40 | ) | | | 9 | | | | 2.09 | (f) | | | 5.53 | (f) | | | 0.62 | (f) | | | 16 | |
Class Y | | | | | | | | | | | | | | | | | | | | | | | | | | | | | | | | | | | | | | | | | | | | | | | | | | | | | | | | |
Year ended 10/31/14 | | | 7.62 | | | | 0.08 | | | | (0.04 | ) | | | 0.04 | | | | (0.07 | ) | | | — | | | | (0.07 | ) | | | 7.59 | | | | 0.60 | | | | 3,295 | | | | 1.60 | (d) | | | 2.32 | (d) | | | 0.99 | (d) | | | 94 | |
Year ended 10/31/13 | | | 7.61 | | | | 0.07 | | | | 0.04 | | | | 0.11 | | | | (0.10 | ) | | | — | | | | (0.10 | ) | | | 7.62 | | | | 1.42 | | | | 442 | | | | 1.60 | | | | 2.50 | | | | 0.93 | | | | 41 | |
Year ended 10/31/12 | | | 8.07 | | | | 0.12 | | | | (0.47 | ) | | | (0.35 | ) | | | (0.08 | ) | | | (0.03 | ) | | | (0.11 | ) | | | 7.61 | | | | (4.31 | ) | | | 281 | | | | 1.60 | | | | 3.19 | | | | 1.61 | | | | 34 | |
Year ended 10/31/11(e) | | | 10.00 | | | | 0.04 | | | | (1.97 | ) | | | (1.93 | ) | | | — | | | | — | | | | — | | | | 8.07 | | | | (19.30 | ) | | | 38 | | | | 1.59 | (f) | | | 5.03 | (f) | | | 1.12 | (f) | | | 16 | |
Class R5 | | | | | | | | | | | | | | | | | | | | | | | | | | | | | | | | | | | | | | | | | | | | | | | | | | | | | | | | |
Year ended 10/31/14 | | | 7.62 | | | | 0.07 | | | | (0.02 | ) | | | 0.05 | | | | (0.07 | ) | | | — | | | | (0.07 | ) | | | 7.60 | | | | 0.74 | | | | 896 | | | | 1.60 | (d) | | | 2.02 | (d) | | | 0.99 | (d) | | | 94 | |
Year ended 10/31/13 | | | 7.61 | | | | 0.07 | | | | 0.04 | | | | 0.11 | | | | (0.10 | ) | | | — | | | | (0.10 | ) | | | 7.62 | | | | 1.42 | | | | 366 | | | | 1.60 | | | | 2.26 | | | | 0.93 | | | | 41 | |
Year ended 10/31/12 | | | 8.07 | | | | 0.12 | | | | (0.47 | ) | | | (0.35 | ) | | | (0.08 | ) | | | (0.03 | ) | | | (0.11 | ) | | | 7.61 | | | | (4.31 | ) | | | 118 | | | | 1.60 | | | | 2.90 | | | | 1.61 | | | | 34 | |
Year ended 10/31/11(e) | | | 10.00 | | | | 0.04 | | | | (1.97 | ) | | | (1.93 | ) | | | — | | | | — | | | | — | | | | 8.07 | | | | (19.30 | ) | | | 7,720 | | | | 1.59 | (f) | | | 4.86 | (f) | | | 1.12 | (f) | | | 16 | |
Class R6 | | | | | | | | | | | | | | | | | | | | | | | | | | | | | | | | | | | | | | | | | | | | | | | | | | | | | | | | |
Year ended 10/31/14 | | | 7.62 | | | | 0.07 | | | | (0.02 | ) | | | 0.05 | | | | (0.07 | ) | | | — | | | | (0.07 | ) | | | 7.60 | | | | 0.73 | | | | 8,116 | | | | 1.60 | (d) | | | 2.00 | (d) | | | 0.99 | (d) | | | 94 | |
Year ended 10/31/13 | | | 7.62 | | | | 0.07 | | | | 0.03 | | | | 0.10 | | | | (0.10 | ) | | | — | | | | (0.10 | ) | | | 7.62 | | | | 1.28 | | | | 8,619 | | | | 1.60 | | | | 2.21 | | | | 0.93 | | | | 41 | |
Year ended 10/31/12(e) | | | 7.85 | | | | 0.01 | | | | (0.24 | ) | | | (0.23 | ) | | | — | | | | — | | | | — | | | | 7.62 | | | | (2.93 | ) | | | 7,488 | | | | 1.60 | (f) | | | 1.79 | (f) | | | 1.61 | (f) | | | 34 | |
| (a) | Calculated using average shares outstanding. |
| (b) | Includes adjustments in accordance with accounting principles generally accepted in the United States of America and as such, the net asset value for financial reporting purposes and the returns based upon those net asset values may differ from the net asset value and returns for shareholder transactions. Does not include sales charges and is not annualized for periods less than one year, if applicable. |
| (c) | Portfolio turnover is calculated at the fund level and is not annualized for periods less than one year, if applicable. |
| (d) | Ratios are annualized and based on average daily net assets (000’s omitted) of $13,186, $2,539, $1,072, $1,110, $482 and $8,315 for Class A, Class C, Class R, Class Y, Class R5 and Class R6 shares, respectively. |
| (e) | Commencement date May 31, 2011 for Class A, Class C, Class R, Class Y and Class R5 shares and September 24, 2012 for Class R6 shares. |
20 Invesco Emerging Markets Equity Fund
Report of Independent Registered Public Accounting Firm
To the Board of Trustees of AIM Investment Funds (Invesco Investment Funds)
and Shareholders of Invesco Emerging Markets Equity Fund:
In our opinion, the accompanying statement of assets and liabilities, including the schedule of investments, and the related statements of operations and of changes in net assets and the financial highlights present fairly, in all material respects, the financial position of Invesco Emerging Markets Equity Fund (one of the funds constituting AIM Investment Funds (Invesco Investment Funds), hereafter referred to as the “Fund”) at October 31, 2014, the results of its operations for the year then ended, the changes in its net assets for each of the two years in the period then ended and the financial highlights for each of the three years in the period then ended and for the period May 31, 2011 (commencement of operations) through October 31, 2011, in conformity with accounting principles generally accepted in the United States of America. These financial statements and financial highlights (hereafter referred to as “financial statements”) are the responsibility of the Fund’s management. Our responsibility is to express an opinion on these financial statements based on our audits. We conducted our audits of these financial statements in accordance with the standards of the Public Company Accounting Oversight Board (United States). Those standards require that we plan and perform the audit to obtain reasonable assurance about whether the financial statements are free of material misstatement. An audit includes examining, on a test basis, evidence supporting the amounts and disclosures in the financial statements, assessing the accounting principles used and significant estimates made by management, and evaluating the overall financial statement presentation. We believe that our audits, which included confirmation of securities at October 31, 2014 by correspondence with the custodian and brokers, and the application of alternative auditing procedures where confirmations of security purchases have not been received, provide a reasonable basis for our opinion.
PRICEWATERHOUSECOOPERS LLP
December 23, 2014
Houston, Texas
21 Invesco Emerging Markets Equity Fund
Calculating your ongoing Fund expenses
Example
As a shareholder of the Fund, you incur two types of costs: (1) transaction costs, which may include sales charges (loads) on purchase payments or contingent deferred sales charges on redemptions, if any; and (2) ongoing costs, including management fees, distribution and/or service (12b-1) fees, and other Fund expenses. This example is intended to help you understand your ongoing costs (in dollars) of investing in the Fund and to compare these costs with ongoing costs of investing in other mutual funds. The example is based on an investment of $1,000 invested at the beginning of the period and held for the entire period May 1, 2014 through October 31, 2014.
Actual expenses
The table below provides information about actual account values and actual expenses. You may use the information in this table, together with the amount you invested, to estimate the expenses that you paid over the period. Simply divide your account value by $1,000 (for example, an $8,600 account value divided by $1,000 = 8.6), then multiply the result by the number in the table under the heading entitled “Actual Expenses Paid During Period” to estimate the expenses you paid on your account during this period.
Hypothetical example for comparison purposes
The table below also provides information about hypothetical account values and hypothetical expenses based on the Fund’s actual expense ratio and an assumed rate of return of 5% per year before expenses, which is not the Fund’s actual return.
The hypothetical account values and expenses may not be used to estimate the actual ending account balance or expenses you paid for the period. You may use this information to compare the ongoing costs of investing in the Fund and other funds. To do so, compare this 5% hypothetical example with the 5% hypothetical examples that appear in the shareholder reports of the other funds.
Please note that the expenses shown in the table are meant to highlight your ongoing costs only and do not reflect any transaction costs, such as sales charges (loads) on purchase payments or contingent deferred sales charges on redemptions, if any. Therefore, the hypothetical information is useful in comparing ongoing costs only, and will not help you determine the relative total costs of owning different funds. In addition, if these transaction costs were included, your costs would have been higher.
| | | | | | | | | | | | | | | | | | | | | | | | |
| Class | | Beginning
Account Value
(05/01/14) | | | ACTUAL | | | HYPOTHETICAL (5% annual return before expenses) | | | Annualized
Expense
Ratio | |
| | | Ending
Account Value
(10/31/14)1 | | | Expenses
Paid During
Period2 | | | Ending
Account Value
(10/31/14) | | | Expenses
Paid During
Period2 | | |
A | | $ | 1,000.00 | | | $ | 1,029.80 | | | $ | 9.45 | | | $ | 1,015.89 | | | $ | 9.38 | | | | 1.85 | % |
C | | | 1,000.00 | | | | 1,026.00 | | | | 13.26 | | | | 1,012.11 | | | | 13.17 | | | | 2.60 | |
R | | | 1,000.00 | | | | 1,027.20 | | | | 10.71 | | | | 1,014.63 | | | | 10.65 | | | | 2.10 | |
Y | | | 1,000.00 | | | | 1,031.20 | | | | 8.18 | | | | 1,017.15 | | | | 8.12 | | | | 1.60 | |
R5 | | | 1,000.00 | | | | 1,031.20 | | | | 8.17 | | | | 1,017.16 | | | | 8.11 | | | | 1.60 | |
R6 | | | 1,000.00 | | | | 1,031.20 | | | | 8.19 | | | | 1,017.14 | | | | 8.13 | | | | 1.60 | |
| 1 | The actual ending account value is based on the actual total return of the Fund for the period May 1, 2014 through October 31, 2014, after actual expenses and will differ from the hypothetical ending account value which is based on the Fund’s expense ratio and a hypothetical annual return of 5% before expenses. |
| 2 | Expenses are equal to the Fund’s annualized expense ratio as indicated above multiplied by the average account value over the period, multiplied by 184/365 to reflect the most recent fiscal half year. |
22 Invesco Emerging Markets Equity Fund
Approval of Investment Advisory and Sub-Advisory Contracts
The Board of Trustees (the Board) of AIM Investment Funds (Invesco Investment Funds) is required under the Investment Company Act of 1940, as amended, to approve annually the renewal of Invesco Emerging Markets Equity Fund’s (the Fund) investment advisory agreements. During contract renewal meetings held on June 16-17, 2014, the Board as a whole, and the disinterested or “independent” Trustees, who comprise over 75% of the Board, voting separately, approved the continuance for the Fund of the Master Investment Advisory Agreement with Invesco Advisers, Inc. (Invesco Advisers and the investment advisory agreement) and the Master Intergroup Sub-Advisory Contract for Mutual Funds with Invesco Asset Management Deutschland GmbH, Invesco Asset Management Limited, Invesco Asset Management (Japan) Limited, Invesco Australia Limited, Invesco Hong Kong Limited, Invesco Senior Secured Management, Inc. and Invesco Canada Ltd. (collectively, the Affiliated Sub-Advisers and the sub-advisory contracts) for another year, effective July 1, 2014.
In evaluating the fairness and reasonableness of compensation under the Fund’s investment advisory agreement and sub-advisory contracts, the Board considered, among other things, the factors discussed below. The Board determined that continuation of the Fund’s investment advisory agreement and the sub-advisory contracts are in the best interest of the Fund and its shareholders and that the compensation payable to Invesco Advisers and the Affiliated Sub-Advisers under the agreements is fair and reasonable.
The Board’s Fund Evaluation Process
The Board’s Investments Committee has established three Sub-Committees, each of which is primarily responsible for overseeing the management of a number of the funds advised by Invesco Advisers (the Invesco Funds). The Sub-Committees meet throughout the year to review the performance of their assigned Invesco Funds, including reviewing materials prepared under the direction of the independent Senior Officer, an officer of the Invesco Funds who reports directly to the independent Trustees. Over the course of each year, the Sub-Committees meet with portfolio managers for their assigned Invesco Funds and other members of management to review the performance, investment objective(s), policies, strategies, limitations and investment risks of these funds. The Sub-Committees meet regularly and at designated contract renewal meetings each year to conduct a review of the performance, fees, expenses and other matters related to their assigned Invesco Funds. Each Sub-Committee recommends to the Investments Committee, which in turn recommends to the full Board, whether and on what terms to approve the continuance of each Invesco Fund’s investment advisory agreement and sub-advisory contracts for another year.
During the contract renewal process, the Trustees receive comparative performance and fee data regarding the Invesco Funds prepared by Invesco Advisers and Lipper Inc. (Lipper), an independent provider of investment company data. The Trustees also receive an independent written evaluation from the Senior Officer. The Senior Officer’s evaluation is prepared as part of his responsibility to manage the process by which the Invesco Funds’ proposed management fees are negotiated during the annual contract renewal process to ensure they are negotiated in a manner that is at arms’ length and reasonable. In addition to meetings with Invesco Advisers and fund counsel, the independent Trustees also discuss the continuance of the investment advisory agreement and sub-advisory contracts in separate sessions with the Senior Officer and with independent legal counsel.
The Trustees recognized that the advisory fee rates for the Invesco Funds are, in many cases, the result of years of review and negotiation. The Trustees’ deliberations and conclusions in a particular year may be based in part on their deliberations and conclusions regarding these same arrangements throughout the year and in prior years. The Trustees’ review and conclusions are based on the comprehensive consideration of all information presented to them and are not the result of any single determinative factor. Moreover, one Trustee may have weighed a particular piece of information or factor differently than another Trustee.
The discussion below serves as the Senior Officer’s independent written evaluation with respect to the Fund’s investment advisory agreement as well as a discussion of the material factors and related conclusions that formed the basis for the Board’s approval of the Fund’s investment advisory agreement and sub-advisory contracts. Unless otherwise stated, this information is current as of June 17, 2014, and may not reflect consideration of factors that became known to the Board after that date.
Factors and Conclusions and Summary of Independent Written Fee Evaluation
| A. | Nature, Extent and Quality of Services Provided by Invesco Advisers and the Affiliated Sub-Advisers |
The Board reviewed the advisory services provided to the Fund by Invesco Advisers under the Fund’s investment advisory agreement, the performance of Invesco Advisers in providing these services, and the credentials and experience of the officers and employees of Invesco Advisers who provide these services, including the Fund’s portfolio manager or managers, with whom the Sub-Committees met during the year. The Board’s review of the qualifications of Invesco Advisers to provide advisory services included the Board’s consideration of Invesco Advisers’ investment process oversight, independent credit analysis
and investment risk management. The Board also considered non-advisory services that Invesco Advisers and its affiliates provide to the Invesco Funds such as various back office support functions, equity and fixed income trading operations, internal audit, distribution and legal and compliance.
In determining whether to continue the Fund’s investment advisory agreement, the Board considered the benefits of reapproving an existing relationship and the greater uncertainty that may be associated with entering into a new relationship. The Board concluded that the nature, extent and quality of the services provided to the Fund by Invesco Advisers are appropriate and satisfactory and consistent with the terms of the Fund’s investment advisory agreement.
The Board reviewed the services that may be provided by the Affiliated Sub-Advisers under the sub-advisory contracts and the credentials and experience of the officers and employees of the Affiliated Sub-Advisers who provide these services. The Board noted that the Affiliated Sub-Advisers have offices and personnel that are located in financial centers around the world. As a result, the Affiliated Sub-Advisers can provide research and investment analysis on the markets and economies of various countries in which the Fund may invest, make recommendations regarding securities and assist with security trades. The Board concluded that the sub-advisory contracts benefit the Fund and its shareholders by permitting Invesco Advisers to use the resources and talents of the Affiliated Sub-Advisers in managing the Fund. The Board concluded that the nature, extent and quality of the services that may be provided by the Affiliated Sub-Advisers are appropriate and satisfactory and consistent with the terms of the Fund’s sub-advisory contracts.
The Board considered Fund performance as a relevant factor in considering whether to approve the investment advisory agreement. The Board did not view Fund performance as a relevant factor in considering whether to approve the sub-advisory contracts for the Fund, as no Affiliated Sub-Adviser currently manages assets of the Fund.
The Board noted that the Fund recently began operations and that comparative performance data for only the past two calendar years was available. The Board compared the Fund’s performance during the past two calendar years to the performance of funds in the Lipper performance universe and against the Lipper Emerging Markets Funds Index. The Board noted that the Fund’s performance of Class A shares of the Fund was in the fifth quintile of its performance universe for the one and two year periods (the first quintile being the best performing funds and the fifth quintile being the worst performing funds). The Board noted that performance of Class A shares of the Fund was
23 Invesco Emerging Markets Equity Fund
below the performance of the Index for the one and two year periods. Invesco Advisers noted that the portfolio management team had been reorganized in February 2014. The Trustees also reviewed more recent Fund performance and this review did not change their conclusions.
| C. | Advisory and Sub-Advisory Fees |
The Board compared the Fund’s contractual management fee rate to the contractual management fee rates of funds in the Fund’s Lipper expense group at a common asset level. The Board noted that the contractual management fee rate for Class A shares of the Fund was below the median contractual management fee rate of funds in the expense group. The Board noted that the term “contractual management fee” may include both advisory and certain administrative services fees, but that Lipper does not provide information on a fund by fund basis as to what is included. The Board noted that Invesco Advisers does not charge the Invesco Funds for the administrative services included in the term as defined by Lipper. The Board also reviewed the methodology used by Lipper in providing expense group information, which includes using each fund’s contractual management fee schedule (including any applicable breakpoints) as reported in the most recent prospectus or statement of additional information for each fund in the expense group.
The Board noted that Invesco Advisers has contractually agreed to waive fees and/or limit expenses of the Fund through at least February 28, 2015 in an amount necessary to limit total annual operating expenses to a specified percentage of average daily net assets for each class of the Fund.
The Board also compared the Fund’s effective advisory fee rate (the advisory fee rate after advisory fee waivers and before other expense limitations/waivers) to the effective advisory fee rates of other mutual funds advised by Invesco Advisers and its affiliates that are managed using an investment process substantially similar to the investment process used for the Fund. The Board noted that the Fund’s rate was above the rate of one such mutual fund and the same as the rate of another mutual fund.
The Board also considered the fees charged by Invesco Advisers and the Affiliated Sub-Advisers to a client account that is managed using an investment process substantially similar to the investment process used for the Fund. The Board noted that Invesco Advisers or the Affiliated Sub-Advisers may charge lower fees to large institutional clients. Invesco Advisers reviewed with the Board the significantly greater scope of services it provides to the Invesco Funds relative to certain other client accounts. These additional services include provision of administrative services, officers and office space, oversight of service providers, preparation of annual registration statement updates and financial information and regulatory compliance under the Investment Company Act of 1940, as amended. Invesco Advisers also reviewed generally the higher frequency of shareholder purchases and redemptions in the Invesco Funds relative to the
flow of assets for other client accounts. Invesco Advisers advised the Board that advance notice of redemptions is often provided to Invesco Advisers by institutional clients. The Board did note that sub-advisory fee rates charged by the Affiliated Sub-Advisers to manage the Invesco Funds and to manage other client accounts tended to be more comparable, reflecting a more comparable scope of services. The Board concluded that the aggregate services provided to the Invesco Funds were sufficiently different from those provided to institutional clients to support the difference in fees.
The Board also considered the services that may be provided by the Affiliated Sub-Advisers pursuant to the sub-advisory contracts, as well as the fees payable by Invesco Advisers to the Affiliated Sub-Advisers pursuant to the sub-advisory contracts. The Board also noted that the sub-advisory fees are not paid directly by the Fund, but rather, are payable by Invesco Advisers to the Affiliated Sub-Advisers.
| D. | Economies of Scale and Breakpoints |
The Board considered the extent to which there are economies of scale in the provision of advisory services to the Fund. The Board also considered whether the Fund benefits from economies of scale through contractual breakpoints in the Fund’s advisory fee schedule and was assisted in this review by a report from the Senior Officer. The Board also noted that the Fund shares directly in economies of scale through lower fees charged by third party service providers based on the combined size of the Invesco Funds and other clients advised by Invesco Advisers.
| E. | Profitability and Financial Resources |
The Board reviewed information from Invesco Advisers concerning the costs of the advisory and other services that Invesco Advisers and its affiliates provide to the Fund and the profitability of Invesco Advisers and its affiliates in providing these services for the year ended December 31, 2013. The Board received information from Invesco Advisers about the methodology used to prepare the profitability information. The Board considered the profitability of Invesco Advisers in managing the Fund and the Invesco Funds. The Board noted that Invesco Advisers continues to operate at a net profit from services Invesco Advisers and its subsidiaries provide to the Invesco Funds. The Board noted that Invesco Advisers and its subsidiaries did not make a profit from managing the Fund as a result of fee and expense waivers. The Board received and accepted information from Invesco Advisers demonstrating that Invesco Advisers and each Affiliated Sub-Adviser are financially sound and have the resources necessary to perform their obligations under the investment advisory agreement and sub-advisory contracts.
| F. | Collateral Benefits to Invesco Advisers and its Affiliates |
The Board considered various other benefits received by Invesco Advisers and its affiliates from the relationship with the Fund, including the fees received for their provision of transfer agency and distribution services to the Fund. The
Board considered comparative information regarding fees charged for these services, including information provided by Lipper and other independent sources. The Board considered the performance of Invesco Advisers and its affiliates in providing these services and the organizational structure employed to provide these services. The Board also considered that these services are provided to the Fund pursuant to written contracts that are reviewed and approved on an annual basis by the Board; that the services are required for the operation of the Fund; that Invesco Advisers and its affiliates can provide services, the nature and quality of which are at least equal to those provided by others offering the same or similar services; and that the fees for such services are fair and reasonable in light of the usual and customary charges by others for services of the same nature and quality.
The Board considered the benefits realized by Invesco Advisers and the Affiliated Sub-Advisers as a result of portfolio brokerage transactions executed through “soft dollar” arrangements. The Board noted that soft dollar arrangements shift the payment obligation for research services from Invesco Advisers and the Affiliated Sub-Advisers to the Invesco Funds and that the research received may be used with other clients of Invesco Advisers and may reduce Invesco Advisers’ and the Affiliated Sub-Advisers’ expenses. The Board also considered that it receives periodic reports from the Chief Compliance Officer of the Invesco Funds demonstrating that these arrangements are consistent with regulatory requirements. The Board did not deem the soft dollar arrangements to be inappropriate.
The Board considered that the Fund’s uninvested cash and cash collateral from any securities lending arrangements may be invested in money market funds advised by Invesco Advisers pursuant to procedures approved by the Board. The Board noted that Invesco Advisers receives advisory fees from these affiliated money market funds attributable to such investments, although Invesco Advisers has contractually agreed to waive through varying periods the advisory fees payable by the Invesco Funds with respect to investments in the affiliated money market funds. The waiver is in an amount equal to 100% of the net advisory fee Invesco Advisers receives from the affiliated money market funds with respect to the Fund’s investment in the affiliated money market funds of uninvested cash, but not cash collateral. The Board concluded that the amount of advisory fees received by Invesco Advisors from the Fund’s investment of uninvested cash and cash collateral from any securities lending arrangements in the affiliated money market funds are fair and reasonable.
The Board also considered the Fund may use an affiliated broker to execute certain trades for the Fund to among other things, control information leakage, and were advised that such trades would be executed in compliance with rules under the Investment Company Act of 1940, as amended.
24 Invesco Emerging Markets Equity Fund
Tax Information
Form 1099-DIV, Form 1042-S and other year–end tax information provide shareholders with actual calendar year amounts that should be included in their tax returns. Shareholders should consult their tax advisors.
The following distribution information is being provided as required by the Internal Revenue Code or to meet a specific state’s requirement.
The Fund designates the following amounts or, if subsequently determined to be different, the maximum amount allowable for its fiscal year ended October 31, 2014:
| | | | |
Federal and State Income Tax | |
Qualified Dividend Income* | | | 100 | % |
Corporate Dividends Received Deduction* | | | 0.05 | % |
U.S. Treasury Obligations* | | | 0 | % |
| | * | The above percentages are based on ordinary income dividends paid to shareholders during the Fund’s fiscal year. |
25 Invesco Emerging Markets Equity Fund
Trustees and Officers
The address of each trustee and officer is AIM Investment Funds (Invesco Investment Funds) (the “Trust”), 11 Greenway Plaza, Suite 1000, Houston, Texas 77046-1173. The trustees serve for the life of the Trust, subject to their earlier death, incapacitation, resignation, retirement or removal as more specifically provided in the Trust’s organizational documents. Each officer serves for a one year term or until their successors are elected and qualified. Column two below includes length of time served with predecessor entities, if any.
| | | | | | | | |
Name, Year of Birth and Position(s) Held with the Trust | | Trustee and/
or Officer Since | | Principal Occupation(s) During Past 5 Years | | Number of Funds in Fund Complex Overseen by Trustee | | Other Directorship(s) Held by Trustee During Past 5 Years |
| Interested Persons | | | | | | | | |
| Martin L. Flanagan1 — 1960 Trustee | | 2007 | | Executive Director, Chief Executive Officer and President, Invesco Ltd. (ultimate parent of Invesco and a global investment management firm); Advisor to the Board, Invesco Advisers, Inc. (formerly known as Invesco Institutional (N.A.), Inc.); Trustee, The Invesco Funds; Vice Chair, Investment Company Institute; and Member of Executive Board, SMU Cox School of Business Formerly: Chairman and Chief Executive Officer, Invesco Advisers, Inc. (registered investment adviser); Director, Chairman, Chief Executive Officer and President, IVZ Inc. (holding company), INVESCO Group Services, Inc. (service provider) and Invesco North American Holdings, Inc. (holding company); Director, Chief Executive Officer and President, Invesco Holding Company Limited (parent of Invesco and a global investment management firm); Director, Invesco Ltd.; Chairman, Investment Company Institute and President, Co-Chief Executive Officer, Co-President, Chief Operating Officer and Chief Financial Officer, Franklin Resources, Inc. (global investment management organization). | | 144 | | None |
Philip A. Taylor2 — 1954 Trustee, President and Principal Executive Officer | | 2006 | | Head of North American Retail and Senior Managing Director, Invesco Ltd.; Director, Co-Chairman, Co-President and Co-Chief Executive Officer, Invesco Advisers, Inc. (formerly known as Invesco Institutional (N.A.), Inc.) (registered investment adviser); Director, Chairman, Chief Executive Officer and President, Invesco Management Group, Inc. (formerly known as Invesco Aim Management Group, Inc.) (financial services holding company); Director and President, INVESCO Funds Group, Inc. (registered investment adviser and registered transfer agent); Director and Chairman, Invesco Investment Services, Inc. (formerly known as Invesco Aim Investment Services, Inc.) (registered transfer agent) and IVZ Distributors, Inc. (formerly known as INVESCO Distributors, Inc.) (registered broker dealer); Director, President and Chairman, Invesco Inc. (holding company) and Invesco Canada Holdings Inc. (holding company); Chief Executive Officer, Invesco Corporate Class Inc. (corporate mutual fund company) and Invesco Canada Fund Inc. (corporate mutual fund company); Director, Chairman and Chief Executive Officer, Invesco Canada Ltd. (formerly known as Invesco Trimark Ltd./Invesco Trimark Ltèe) (registered investment adviser and registered transfer agent); Trustee, President and Principal Executive Officer, The Invesco Funds (other than AIM Treasurer’s Series Trust (Invesco Treasurer’s Series Trust) and Short-Term Investments Trust); Trustee and Executive Vice President, The Invesco Funds (AIM Treasurer’s Series Trust (Invesco Treasurer’s Series Trust) and Short-Term Investments Trust only); Director, Invesco Investment Advisers LLC (formerly known as Van Kampen Asset Management); Director, Chief Executive Officer and President, Van Kampen Exchange Corp. Formerly: Director and Chairman, Van Kampen Investor Services Inc.; Director, Chief Executive Officer and President, 1371 Preferred Inc. (holding company) and Van Kampen Investments Inc.; Director and President, AIM GP Canada Inc. (general partner for limited partnerships) and Van Kampen Advisors, Inc.; Director and Chief Executive Officer, Invesco Trimark Dealer Inc. (registered broker dealer); Director, Invesco Distributors, Inc. (formerly known as Invesco Aim Distributors, Inc.) (registered broker dealer); Manager, Invesco PowerShares Capital Management LLC; Director, Chief Executive Officer and President, Invesco Advisers, Inc.; Director, Chairman, Chief Executive Officer and President, Invesco Aim Capital Management, Inc.; President, Invesco Trimark Dealer Inc. and Invesco Trimark Ltd./Invesco Trimark Ltèe; Director and President, AIM Trimark Corporate Class Inc. and AIM Trimark Canada Fund Inc.; Senior Managing Director, Invesco Holding Company Limited; Director and Chairman, Fund Management Company (former registered broker dealer); President and Principal Executive Officer, The Invesco Funds (AIM Treasurer’s Series Trust (Invesco Treasurer’s Series Trust), and Short-Term Investments Trust only); President, AIM Trimark Global Fund Inc. and AIM Trimark Canada Fund Inc. | | 144 | | None |
Wayne W. Whalen3 — 1939 Trustee | | 2010 | | Of Counsel, and prior to 2010, partner in the law firm of Skadden, Arps, Slate, Meagher & Flom LLP, legal counsel to certain funds in the Fund Complex | | 144 | | Director of the Mutual fund Directors Forum, a nonprofit membership organization for investment directors; Chairman and Director of the Abraham Lincoln Presidential Library Foundation; and Director of the Stevenson Center for Democracy |
| 1 | Mr. Flanagan is considered an interested person (within the meaning of Section 2(a)(19) of the 1940 Act) of the Trust because he is an officer of the Adviser to the Trust, and an officer and a director of Invesco Ltd., ultimate parent of the Adviser. |
| 2 | Mr. Taylor is considered an interested person (within the meaning of Section 2(a)(19) of the 1940 Act) of the Trust because he is an officer and a director of the Adviser. |
| 3 | Mr. Whalen is retiring effective December 31, 2014. He has been deemed to be an interested person of the Trust because of his prior service as counsel to the predecessor funds of certain Invesco open-end funds and his affiliation with the law firm that served as counsel to such predecessor funds and the Invesco closed-end funds. |
T-1 Invesco Emerging Markets Equity Fund
Trustees and Officers—(continued)
| | | | | | | | |
Name, Year of Birth and Position(s) Held with the Trust | | Trustee and/
or Officer Since | | Principal Occupation(s) During Past 5 Years | | Number of Funds in Fund Complex Overseen by Trustee | | Other Directorship(s) Held by Trustee During Past 5 Years |
| Independent Trustees | | | | | | | | |
Bruce L. Crockett — 1944 Trustee and Chair | | 2001 | | Chairman, Crockett Technologies Associates (technology consulting company) Formerly: Director, Captaris (unified messaging provider); Director, President and Chief Executive Officer, COMSAT Corporation; Chairman, Board of Governors of INTELSAT (international communications company); ACE Limited (insurance company); and Investment Company Institute | | 144 | | ALPS (Attorneys Liability Protection Society) (insurance company) |
David C. Arch — 1945 Trustee | | 2010 | | Chairman of Blistex Inc., a consumer health care products manufacturer | | 144 | | Board member of the Illinois Manufacturers’ Association; Member of the Board of Visitors, Institute for the Humanities, University of Michigan; Member of the Audit Committee of the Edward-Elmhurst Hospital |
Frank S. Bayley — 1939 Trustee | | 1987 | | Retired. Formerly: Director, Badgley Funds Inc. (registered investment company) (2 portfolios) and General Partner and Of Counsel, law firm of Baker & McKenzie, LLP | | 144 | | Director and Chairman, C.D. Stimson Company (a real estate investment company); Trustee, The Curtis Institute of Music |
James T. Bunch — 1942 Trustee | | 2003 | | Managing Member, Grumman Hill Group LLC (family office private equity investments) Formerly: Founder, Green Manning & Bunch Ltd. (investment banking firm) (1988-2010); Executive Committee, United States Golf Association; and Director, Policy Studies, Inc. and Van Gilder Insurance Corporation | | 144 | | Chairman, Board of Governors, Western Golf Association; Chairman, Evans Scholars Foundation; and Director, Denver Film Society |
Rodney F. Dammeyer — 1940 Trustee | | 2010 | | Chairman of CAC,LLC, (private company offering capital investment and management advisory services) Formerly: Prior to 2001, Managing Partner at Equity Group Corporate Investments; Prior to 1995, Chief Executive Officer of Itel Corporation (formerly Anixter International); Prior to 1985, experience includes Senior Vice President and Chief Financial Officer of Household International, Inc., Executive Vice President and Chief Financial Officer of Northwest Industries, Inc. and Partner of Arthur Andersen & Co.; From 1987 to 2010, Director/Trustee of investment companies in the Van Kampen Funds complex | | 144 | | Director of Quidel Corporation and Stericycle, Inc. |
Albert R. Dowden — 1941 Trustee | | 2001 | | Director of a number of public and private business corporations, including the Boss Group, Ltd. (private investment and management); Nature’s Sunshine Products, Inc. and Reich & Tang Funds (5 portfolios) (registered investment company) Formerly: Director, Homeowners of America Holding Corporation/Homeowners of America Insurance Company (property casualty company); Director, Continental Energy Services, LLC (oil and gas pipeline service); Director, CompuDyne Corporation (provider of product and services to the public security market) and Director, Annuity and Life Re (Holdings), Ltd. (reinsurance company); Director, President and Chief Executive Officer, Volvo Group North America, Inc.; Senior Vice President, AB Volvo; Director of various public and private corporations; Chairman, DHJ Media, Inc.; Director, Magellan Insurance Company; and Director, The Hertz Corporation, Genmar Corporation (boat manufacturer), National Media Corporation; Advisory Board of Rotary Power International (designer, manufacturer, and seller of rotary power engines); and Chairman, Cortland Trust, Inc. (registered investment company) | | 144 | | Director of: Nature’s Sunshine Products, Inc., Reich & Tang Funds, Homeowners of America Holding Corporation/ Homeowners of America Insurance Company, the Boss Group |
Jack M. Fields — 1952 Trustee | | 2001 | | Chief Executive Officer, Twenty First Century Group, Inc. (government affairs company); Owner and Chief Executive Officer, Dos Angeles Ranch, L.P. (cattle, hunting, corporate entertainment); and Discovery Global Education Fund (non-profit) Formerly: Chief Executive Officer, Texana Timber LP (sustainable forestry company); Director of Cross Timbers Quail Research Ranch (non-profit); and member of the U.S. House of Representatives | | 144 | | Insperity, Inc. (formerly known as Administaff) |
Prema Mathai-Davis — 1950 Trustee | | 2001 | | Retired. Formerly: Chief Executive Officer, YWCA of the U.S.A. | | 144 | | None |
Larry Soll — 1942 Trustee | | 2003 | | Retired. Formerly: Chairman, Chief Executive Officer and President, Synergen Corp. (a biotechnology company) | | 144 | | None |
Hugo F. Sonnenschein — 1940 Trustee | | 2010 | | President Emeritus and Honorary Trustee of the University of Chicago and the Adam Smith Distinguished Service Professor in the Department of Economics at the University of Chicago. Prior to 2000, President of the University of Chicago | | 144 | | Trustee of the University of Rochester and a member of its investment committee; Member of the National Academy of Sciences and the American Philosophical Society; Fellow of the American Academy of Arts and Sciences |
T-2 Invesco Emerging Markets Equity Fund
Trustees and Officers—(continued)
| | | | | | | | |
Name, Year of Birth and Position(s) Held with the Trust | | Trustee and/
or Officer Since | | Principal Occupation(s) During Past 5 Years | | Number of Funds in Fund Complex Overseen by Trustee | | Other Directorship(s) Held by Trustee During Past 5 Years |
| Independent Trustees—(continued) |
Raymond Stickel, Jr. — 1944 Trustee | | 2005 | | Retired. Formerly: Director, Mainstay VP Series Funds, Inc. (25 portfolios) and Partner, Deloitte & Touche | | 144 | | None |
Suzanne H. Woolsey — 1941 Trustee | | 2014 | | Chief Executive Officer of Woolsey Partners LLC | | 144 | | Emeritus Chair of the Board of Trustees of the Institute for Defense Analyses; Trustee of Colorado College; Trustee of California Institute of Technology; Prior to 2014, Director of Fluor Corp.; Prior to 2010, Trustee of the German Marshall Fund of the United States; Prior to 2010 Trustee of the Rocky Mountain Institute |
| Other Officers | | | | | | | | |
Russell C. Burk — 1958 Senior Vice President and Senior Officer | | 2005 | | Senior Vice President and Senior Officer, The Invesco Funds | | N/A | | N/A |
John M. Zerr — 1962 Senior Vice President, Chief Legal Officer and Secretary | | 2006 | | Director, Senior Vice President, Secretary and General Counsel, Invesco Management Group, Inc. (formerly known as Invesco Aim Management Group, Inc.) and Van Kampen Exchange Corp.; Senior Vice President, Invesco Advisers, Inc. (formerly known as Invesco Institutional (N.A.), Inc.) (registered investment adviser); Senior Vice President and Secretary, Invesco Distributors, Inc. (formerly known as Invesco Aim Distributors, Inc.); Director, Vice President and Secretary, Invesco Investment Services, Inc. (formerly known as Invesco Aim Investment Services, Inc.) and IVZ Distributors, Inc. (formerly known as INVESCO Distributors, Inc.); Director and Vice President, INVESCO Funds Group, Inc.; Senior Vice President, Chief Legal Officer and Secretary, The Invesco Funds; Manager, Invesco PowerShares Capital Management LLC; Director, Secretary and General Counsel, Invesco Investment Advisers LLC (formerly known as Van Kampen Asset Management); Secretary and General Counsel, Invesco Capital Markets, Inc. (formerly known as Van Kampen Funds Inc.) and Chief Legal Officer, PowerShares Exchange-Traded Fund Trust, PowerShares Exchange-Traded Fund Trust II, PowerShares India Exchange-Traded Fund Trust, PowerShares Actively Managed Exchange-Traded Fund Trust; and PowerShares Actively Managed Exchange-Traded Commodity Fund Trust Formerly: Director and Vice President, Van Kampen Advisors Inc.; Director, Vice President, Secretary and General Counsel, Van Kampen Investor Services Inc.; Director, Invesco Distributors, Inc. (formerly known as Invesco Aim Distributors, Inc.); Director, Senior Vice President, General Counsel and Secretary, Invesco Aim Advisers, Inc. and Van Kampen Investments Inc.; Director, Vice President and Secretary, Fund Management Company; Director, Senior Vice President, Secretary, General Counsel and Vice President, Invesco Aim Capital Management, Inc.; Chief Operating Officer and General Counsel, Liberty Ridge Capital, Inc. (an investment adviser); Vice President and Secretary, PBHG Funds (an investment company) and PBHG Insurance Series Fund (an investment company); Chief Operating Officer, General Counsel and Secretary, Old Mutual Investment Partners (a broker-dealer); General Counsel and Secretary, Old Mutual Fund Services (an administrator) and Old Mutual Shareholder Services (a shareholder servicing center); Executive Vice President, General Counsel and Secretary, Old Mutual Capital, Inc. (an investment adviser); and Vice President and Secretary, Old Mutual Advisors Funds (an investment company) | | N/A | | N/A |
Sheri Morris — 1964 Vice President, Treasurer and Principal Financial Officer | | 1999 | | Vice President, Treasurer and Principal Financial Officer, The Invesco Funds; Vice President, Invesco Advisers, Inc. (formerly known as Invesco Institutional (N.A.), Inc.) (registered investment adviser); and Vice President, PowerShares Exchange-Traded Fund Trust, PowerShares Exchange-Traded Fund Trust II, PowerShares India Exchange-Traded Fund Trust, PowerShares Actively Managed Exchange-Traded Fund Trust, and PowerShares Actively Managed Exchange-Traded Commodity Fund Trust Formerly: Vice President, Invesco Aim Advisers, Inc., Invesco Aim Capital Management, Inc. and Invesco Aim Private Asset Management, Inc.; Assistant Vice President and Assistant Treasurer, The Invesco Funds and Assistant Vice President, Invesco Advisers, Inc., Invesco Aim Capital Management, Inc. and Invesco Aim Private Asset Management, Inc.; and Treasurer, PowerShares Exchange-Traded Fund Trust, PowerShares Exchange-Traded Fund Trust II, PowerShares India Exchange-Traded Fund Trust and PowerShares Actively Managed Exchange-Traded Fund Trust | | N/A | | N/A |
T-3 Invesco Emerging Markets Equity Fund
Trustees and Officers—(continued)
| | | | | | | | |
Name, Year of Birth and Position(s) Held with the Trust | | Trustee and/
or Officer Since | | Principal Occupation(s) During Past 5 Years | | Number of Funds in Fund Complex Overseen by Trustee | | Other Directorship(s) Held by Trustee During Past 5 Years |
| Other Officers—(continued) | | | | | | | | |
Karen Dunn Kelley — 1960 Vice President | | 2004 | | Senior Managing Director, Investments; Director, Co-President, Co-Chief Executive Officer, and Co-Chairman, Invesco Advisers, Inc. (formerly known as Invesco Institutional (N.A.), Inc.) (registered investment adviser); Chairman, Invesco Senior Secured Management, Inc.; Senior Vice President, Invesco Management Group, Inc. (formerly known as Invesco Aim Management Group, Inc.); Executive Vice President, Invesco Distributors, Inc. (formerly known as Invesco Aim Distributors, Inc.); Director, Invesco Mortgage Capital Inc. and Invesco Management Company Limited; Director and President, INVESCO Asset Management (Bermuda) Ltd., Vice President, The Invesco Funds (other than AIM Treasurer’s Series Trust (Invesco Treasurer’s Series Trust) and Short-Term Investments Trust); and President and Principal Executive Officer, The Invesco Funds (AIM Treasurer’s Series Trust (Invesco Treasurer’s Series Trust) and Short-Term Investments Trust only) Formerly: Director, INVESCO Global Asset Management Limited and INVESCO Management S.A.; Senior Vice President, Van Kampen Investments Inc. and Invesco Advisers, Inc. (formerly known as Invesco Institutional (N.A.), Inc.) (registered investment adviser); Vice President, Invesco Advisers, Inc. (formerly known as Invesco Institutional (N.A.), Inc.); Director of Cash Management and Senior Vice President, Invesco Advisers, Inc. and Invesco Aim Capital Management, Inc.; Director and President, Fund Management Company; Chief Cash Management Officer, Director of Cash Management, Senior Vice President, and Managing Director, Invesco Aim Capital Management, Inc.; Director of Cash Management, Senior Vice President, and Vice President, Invesco Advisers, Inc. and The Invesco Funds (AIM Treasurer’s Series Trust (Invesco Treasurer’s Series Trust), and Short-Term Investments Trust only) | | N/A | | N/A |
Crissie M. Wisdom — 1969 Anti-Money Laundering Compliance Officer | | 2013 | | Anti-Money Laundering Compliance Officer, Invesco Advisers, Inc. (formerly known as Invesco Institutional (N.A.), Inc.) (registered investment adviser), Invesco Capital Markets, Inc. (formerly known as Van Kampen Funds Inc.), Invesco Distributors, Inc., Invesco Investment Services, Inc., Invesco Management Group, Inc., Van Kampen Exchange Corp., The Invesco Funds, and PowerShares Exchange-Traded Fund Trust, PowerShares Exchange-Traded Fund Trust II, PowerShares India Exchange-Traded Fund Trust, PowerShares Actively Managed Exchange-Traded Fund Trust and PowerShares Actively Managed Exchange-Traded Commodity Fund Trust; and Fraud Prevention Manager and Controls and Risk Analysis Manager for Invesco Investment Services, Inc. | | N/A | | N/A |
Todd L. Spillane — 1958 Chief Compliance Officer | | 2006 | | Senior Vice President, Invesco Management Group, Inc. (formerly known as Invesco Aim Management Group, Inc.) and Van Kampen Exchange Corp.; Senior Vice President and Chief Compliance Officer, Invesco Advisers, Inc. (registered investment adviser) (formerly known as Invesco Institutional (N.A.), Inc.); Chief Compliance Officer, The Invesco Funds; Vice President, Invesco Distributors, Inc. (formerly known as Invesco Aim Distributors, Inc.) and Invesco Investment Services, Inc. (formerly known as Invesco Aim Investment Services, Inc.) Formerly: Chief Compliance Officer, Invesco Funds (Chicago); Senior Vice President, Van Kampen Investments Inc.; Senior Vice President and Chief Compliance Officer, Invesco Aim Advisers, Inc. and Invesco Aim Capital Management, Inc.; Chief Compliance Officer, INVESCO Private Capital Investments, Inc. (holding company), Invesco Private Capital, Inc. (registered investment adviser), Invesco Global Asset Management (N.A.), Inc., Invesco Senior Secured Management, Inc. (registered investment adviser), Van Kampen Investor Services Inc., PowerShares Exchange-Traded Fund Trust, PowerShares Exchange-Traded Fund Trust II, PowerShares India Exchange-Traded Fund Trust and PowerShares Actively Managed Exchange-Traded Fund Trust; and Vice President, Invesco Aim Capital Management, Inc. and Fund Management Company | | N/A | | N/A |
The Statement of Additional Information of the Trust includes additional information about the Fund’s Trustees and is available upon request, without charge, by calling 1.800.959.4246. Please refer to the Fund’s prospectus for information on the Fund’s sub-advisers.
| | | | | | |
Office of the Fund 11 Greenway Plaza, Suite 1000 Houston, TX 77046-1173 | | Investment Adviser Invesco Advisers, Inc. 1555 Peachtree Street, N.E. Atlanta, GA 30309 | | Distributor Invesco Distributors, Inc. 11 Greenway Plaza, Suite 1000 Houston, TX 77046-1173 | | Auditors PricewaterhouseCoopers LLP 1000 Louisiana Street, Suite 5800 Houston, TX 77002-5678 |
| | | |
| | | | | | |
Counsel to the Fund Stradley Ronon Stevens & Young, LLP 2005 Market Street, Suite 2600 Philadelphia, PA 19103-7018 | | Counsel to the Independent Trustees Goodwin Procter LLP 901 New York Avenue, N.W. Washington, D.C. 20001 | | Transfer Agent Invesco Investment Services, Inc. 11 Greenway Plaza, Suite 1000 Houston, TX 77046-1173 | | Custodian State Street Bank and Trust Company 225 Franklin Street Boston, MA 02110-2801 |
T-4 Invesco Emerging Markets Equity Fund

Invesco mailing information
Send general correspondence to Invesco Investment Services, Inc., P.O. Box 219078, Kansas City, MO 64121-9078.
Important notice regarding delivery of security holder documents
To reduce Fund expenses, only one copy of most shareholder documents may be mailed to shareholders with multiple accounts at the same address (Householding). Mailing of your shareholder documents may be householded indefinitely unless you instruct us otherwise. If you do not want the mailing of these documents to be combined with those for other members of your household, please contact Invesco Investment Services, Inc. at 800 959 4246 or contact your financial institution. We will begin sending you individual copies for each account within 30 days after receiving your request.
Fund holdings and proxy voting information
The Fund provides a complete list of its holdings four times in each fiscal year, at the quarter ends. For the second and fourth quarters, the lists appear in the Fund’s semiannual and annual reports to shareholders. For the first and third quarters, the Fund files the lists with the Securities and Exchange Commission (SEC) on Form N-Q. The most recent list of portfolio holdings is available at invesco.com/completeqtrholdings. Shareholders can also look up the Fund’s Forms N-Q on the SEC website at sec.gov. Copies of the Fund’s Forms N-Q may be reviewed and copied at the SEC Public Reference Room in Washington, D.C. You can obtain information on the operation of the Public Reference Room, including information about duplicating fee charges, by calling 202 551 8090 or 800 732 0330, or by electronic request at the following email address: publicinfo@sec.gov. The SEC file numbers for the Fund are shown below.
A description of the policies and procedures that the Fund uses to determine how to vote proxies relating to portfolio securities is available without charge, upon request, from our Client Services department at 800 959 4246 or at invesco.com/proxyguidelines. The information is also available on the SEC website, sec.gov.
| | |
Information regarding how the Fund voted proxies related to its portfolio securities during the most recent 12-month period ended June 30 is available at invesco.com/proxysearch. The information is also available on the SEC website, sec.gov. | | 
|
Invesco Advisers, Inc. is an investment adviser; it provides investment advisory services to individual and institutional clients and does not sell securities. Invesco Distributors, Inc. is the US distributor for Invesco Ltd.’s retail mutual funds, exchange-traded funds and institutional money market funds. Both are wholly owned, indirect subsidiaries of Invesco Ltd. | |
| | | | |
| SEC file numbers: 811-05426 and 033-19338 | | EME-AR-1 | | Invesco Distributors, Inc. |

Letters to Shareholders
| | | | |

Philip Taylor | | | | Dear Shareholders: This annual report includes information about your Fund, including performance data and a complete list of its investments as of the close of the reporting period. Inside, your Fund’s portfolio managers discuss how they managed your Fund and the factors that affected its performance during the reporting period. I hope you find this report of interest. During the reporting period covered by this report, the US economy showed signs of continued improvement. After contracting in the first quarter of 2014, the economy expanded strongly in the second quarter and unemployment trended lower. Much of the credit for this improvement goes to the US Federal Reserve (the Fed), which undertook an extraordinary asset purchase program following the global financial crisis. The Fed’s goal was to jumpstart the economy by encouraging banks to lend more, businesses to hire more and consumers to spend more. Signs of a stronger US economy prompted the Fed to reduce, or “taper,” its |
asset purchase program. Despite this, interest rates remained near historical low levels due largely to heavy investor demand for bonds. While signs of economic improvement were evident in the US, European economies showed signs of weakening. That, together with geopolitical uncertainty and worries about the first diagnosed cases of Ebola outside of Africa, caused increased volatility in US and European equities.
Extended periods of market strength can lull investors into complacency – just as prolonged periods of market weakness or volatility can discourage investors from initiating long-term investment plans. That’s why Invesco has always encouraged investors to work with a professional financial adviser who can stress the importance of starting to save and invest early and the importance of adhering to a disciplined investment plan – when times are good and when they’re uncertain. A financial adviser who knows your unique financial situation, investment goals and risk tolerance can be an invaluable partner as you seek to achieve your financial goals. He or she can offer a long-term perspective when markets are volatile and time-tested advice and guidance when your financial situation or investment goals change.
Timely information when and where you want it
Invesco’s efforts to help investors achieve their financial objectives include providing individual investors and financial professionals with timely information about the markets, the economy and investing – whenever and wherever they want it.
Our website, invesco.com/us, offers a wide range of market insights and investment perspectives. On the website, you’ll find detailed information about our funds, including prices, performance, holdings and portfolio manager commentaries. You can access information about your individual Invesco account whenever it’s convenient for you; just complete a simple, secure online registration. Use the “Log In” box on our home page to get started.
Invesco’s mobile app for iPad® (available free from the App StoreSM) allows you to obtain the same detailed information about your Fund and the same investment insights from our investment leaders, market strategists, economists and retirement experts on the go. You also can watch portfolio manager videos and have instant access to Invesco news and updates wherever you may be.
In addition to the resources accessible on our website and through our mobile app, you can obtain timely updates to help you stay informed about the markets, the economy and investing by connecting with Invesco on Twitter, LinkedIn or Facebook. You can access our blog at blog.invesco.us.com. Our goal is to provide you the information you want, when and where you want it.
Have questions?
For questions about your account, feel free to contact an Invesco client services representative at 800 959 4246. For Invesco-related questions or comments, please email me directly at phil@invesco.com.
All of us at Invesco look forward to serving your investment management needs for many years to come. Thank you for investing with us.
Sincerely,

Philip Taylor
Senior Managing Director, Invesco Ltd.
iPad is a trademark of Apple Inc., registered in the US and other countries. App Store is a service mark of Apple Inc. Invesco Distributors, Inc. is not affiliated with Apple Inc.
| | | | |

Bruce Crockett | | | | Dear Fellow Shareholders: There are a variety of factors that can impact investment performance, many of which are uncontrollable by us as investors. These factors can include various economic trends and geopolitical developments. While the members of the Invesco Funds Board, which I chair, can’t dictate the performance of the Invesco funds, be assured that your Board works diligently throughout the year to focus on how your investments are managed. Our job is to represent you and your interests on a variety of fund management-related matters. We regularly monitor how the portfolio management teams of the Invesco funds are performing in light of ever-changing and often unpredictable economic and market conditions. We review the investment strategies and investment process employed by each fund’s management team as explained in the fund’s prospectus. Perhaps our most significant responsibility is conducting the annual review of the funds’ |
advisory and sub-advisory contracts with Invesco Advisers and its affiliates. This annual review, which is required by the Investment Company Act of 1940, focuses on the nature and quality of the services Invesco provides as the adviser to the Invesco funds and the reasonableness of the fees that it charges for those services. Each year, we spend months carefully reviewing information from Invesco that allows us to evaluate the quality of its services and the reasonableness of its fees. We also use information from a variety of independent sources, including materials provided by the independent senior officer of the Invesco funds, who reports directly to the independent trustees on the Board. Additionally, we meet with legal counsel and review performance and fee data prepared for us by Lipper Inc., an independent, third-party firm widely recognized as a leader in its field.
After a careful review, the members of the Invesco Funds Board approved the continuation of advisory and sub-advisory contracts with Invesco Advisers and its affiliates. Be assured that your Board will continue working on behalf of fund shareholders, keeping your needs and interests uppermost in our minds.
As always, please contact me at bruce@brucecrockett.com with any questions or concerns you may have. On behalf of the Board, we look forward to continuing to represent your interests and serving your needs.
Sincerely,

Bruce L. Crockett
Independent Chair
Invesco Funds Board of Trustees
Management’s Discussion of Fund Performance
Performance summary
For the fiscal year ended October 31, 2014, Invesco Endeavor Fund, at net asset value, underperformed its broad market, style-specific and peer group indexes.
We attribute the Fund’s underperformance versus its style-specific index mainly to the Fund’s high cash positions during the year, which detracted from relative performance in a rising market environment. Other performance drivers were largely stock-specific, with select investments in the information technology (IT) and industrials sectors contributing the most to performance, while select holdings in the consumer discretionary and industrials sectors were among the largest detractors.
Your Fund’s long-term performance appears later in this report.
Fund vs. Indexes
Total returns, 10/31/13 to 10/31/14, at net asset value (NAV). Performance shown does not include applicable contingent deferred sales charges (CDSC) or front-end sales charges, which would have reduced performance.
| | | | | |
| Class A Shares | | | | 11.13 | % |
| Class B Shares | | | | 10.27 | |
| Class C Shares | | | | 10.27 | |
| Class R Shares | | | | 10.89 | |
| Class Y Shares | | | | 11.39 | |
| Class R5 Shares | | | | 11.51 | |
| Class R6 Shares | | | | 11.62 | |
| S&P 500 Index‚ (Broad Market Index) | | | | 17.27 | |
| Russell Mipcap Index‚ (Style-Specific Index) | | | | 15.32 | |
| Lipper Mid-Cap Core Funds Indexn (Peer Group Index) | | | | 11.89 | |
Source(s): ‚FactSet Research Systems Inc.; nLipper Inc. | | | | | |
Market conditions and your Fund
The US economy remained “good but not great” during the fiscal year ended October 31, 2014. Slow but steady growth, helped by historically low interest rates, generally led US equity markets higher during the reporting period.
The fiscal year began with renewed optimism after it became apparent that a two-week federal government shutdown had not derailed the economy. Evidence of economic improvement caused the US equity market to rally in late 2013 despite the announcement by the US Federal Reserve (the Fed) in December that it would begin reducing the scope of its asset purchase program in early 2014.
The US stock market turned volatile in the first months of 2014 as investors began to worry that stocks may have risen too far, too fast. Unusually cold winter weather negatively affected consumers, and the US economy contracted in the first quarter before rebounding strongly in the second quarter. While corporate earnings were generally resilient throughout the fiscal year, driven by strong profitability across many sectors, investors worried about political developments in Ukraine and signs of economic sluggishness in China. Toward the end of the reporting period, a sharp drop in global oil prices, evidence of economic stagnation in Europe and concern about
the first cases of Ebola in the US increased market volatility.
Before we discuss the Fund’s results during the fiscal year, it is helpful to briefly explain how we manage the Fund for shareholders. We view ourselves as business people buying businesses, and we consider the purchase of a stock as an ownership interest in a business. We strive to develop a proprietary view of a business through in-depth, fundamental research that includes careful financial statement analysis and meetings with company management. We then seek to purchase businesses whose stock prices are below what we have calculated to be the true value of the company based on its future free cash flows.
Our investment approach focuses on individual businesses rather than market sectors. Therefore, your Fund shares little in common with sector weightings of the Fund’s indexes. Select IT and industrials stocks were among the largest contributors to Fund performance for the reporting period. Select holdings in the consumer discretionary and industrials sectors were among the largest detractors. The Fund’s cash position also hurt Fund performance versus its style-specific benchmark in a rising market environment.
IT company International Rectifier was the largest contributor to Fund performance during the fiscal year. International Rectifier has a
40-year history of leadership in making chips that reduce power consumption. The company specializes in semiconductors used in computers, as well as in energy-efficient appliances and automobiles. These semiconductors help reduce power consumption and improve both performance and efficiency. Toward the end of the fiscal year, the company’s share price rose after receiving a take-out offer from a
| | | | | |
| Portfolio Composition | | |
| By sector | |
| |
| Industrials | | | | 32.7 | % |
| Information Technology | | | | 13.6 | |
| Financials | | | | 9.1 | |
| Energy | | | | 8.8 | |
| Health Care | | | | 8.7 | |
| Consumer Discretionary | | | | 5.9 | |
| Consumer Staples | | | | 2.0 | |
| Materials | | | | 0.2 | |
Money Market Funds Plus Other Assets Less Liabilities | | | | 19.0 | |
| | | | | |
| Top 10 Equity Holdings* | | |
| | | | | |
| |
| 1. Pike Corp. | | | | 4.2 | % |
| 2. Orion Marine Group, Inc. | | | | 4.1 | |
| 3. Ultra Petroleum Corp. | | | | 4.1 | |
4. Brookfield Property Partners L.P. | | | | 4.0 | |
| 5. Ross Stores, Inc. | | | | 3.8 | |
| 6. Zimmer Holdings, Inc. | | | | 3.5 | |
| 7. Newalta Corp. | | | | 3.5 | |
| 8. Echo Global Logistics, Inc. | | | | 3.2 | |
9. Cognizant Technology Solutions Corp.- Class A | | | | 3.2 | |
| 10. Plantronics, Inc | | | | 3.1 | |
| | | | | |
Total Net Assets | | | $ | 507.0 million | |
| | | | | |
| |
Total Number of Holdings* | | | | 31 | |
| | | | | |
The Fund’s holdings are subject to change, and there is no assurance that the Fund will continue to hold any particular security. *Excluding money market fund holdings. |
competitor at a 51% premium to the previous day’s closing price. We sold our position in International Rectifier after the announcement.
Industrial company Echo Global Logistics was also a top contributor to Fund results. Echo is a leading provider of technology-enabled transportation and supply chain management services. Aside from the underlying growth of the transportation sector, Echo benefits from a trend toward increased transportation and logistics outsourcing. We believe the company is well positioned to compete and gain market share in this highly fragmented industry through its scale, sophisticated technology platform, and established shipper/carrier relationships. We were able to buy shares of the company in March and April of 2014 when the stock was being pressured by what we believed were temporary cyclical factors affecting business economics. Since then, Echo has reported strong financial results and the company’s shares have performed well. We sold some of our position in Echo toward the end of the fiscal year on this strength.
Consumer discretionary company Francescas Holdings was the largest detractor from Fund performance during the fiscal year. Francescas operates a chain of retail boutiques selling apparel, jewelry, accessories and gifts. Shares of the company declined, as did the retail industry in general, during the second half of the fiscal year. We initiated our position in Francescas in December 2013 and used this short-term weakness as an opportunity to add to our investment.
Industrial company Titan Machinery was also among the largest detractors from Fund performance during the quarter. Titan currently has a network of over 100 full-service agricultural and construction equipment dealerships in 11 states, as well as 13 European dealerships in Romania, Bulgaria and Serbia. Titan is the largest dealer worldwide for Case New Holland (not a Fund holding), a manufacturer of agricultural and construction equipment and enjoys significant scale in the highly fragmented industry. We believe Titan is well-positioned to grow through acquisitions. Titan’s scale of operations has resulted in a large distribution network, efficient inventory management and diversification of product offerings that mitigate the impact of crop and weather cyclicality. Titan’s share price was pressured by continuing softness in the construction business and pessimism about the agricultural industry, which allowed us to buy more Titan shares at an attractive price.
While the rising market environment made it difficult for us to find new investment opportunities, we did make some new investments and added to some of our existing holdings during periods of volatility. We also sold several holdings based on valuations and other factors. The Fund’s large cash position is a result of holdings being acquired over the past few years and a lack of opportunities as markets continued to rise. We believe the cash should act as a shock absorber in the next market correction, while providing us with the ability to invest in attractive opportunities as they present themselves.
We continued to focus on finding quality businesses trading at attractive values relative to what we believe are their long-term prospects. In contrast, the market is often driven by short-term events or outlooks in both good times and bad. Market volatility during the reporting period allowed us to take advantage of investment opportunities we believe may benefit your Fund in the long term.
While we can never predict future Fund performance, we pledge to you that we will adhere to our discipline of being business people who buy businesses – and we will continually strive to upgrade the quality of your Fund’s portfolio.
As always, we thank you for your investment in Invesco Endeavor Fund and for sharing our long-term investment perspective.
The views and opinions expressed in management’s discussion of Fund performance are those of Invesco Advisers, Inc. These views and opinions are subject to change at any time based on factors such as market and economic conditions. These views and opinions may not be relied upon as investment advice or recommendations, or as an offer for a particular security. The information is not a complete analysis of every aspect of any market, country, industry, security or the Fund. Statements of fact are from sources considered reliable, but Invesco Advisers, Inc. makes no representation or warranty as to their completeness or accuracy. Although historical performance is no guarantee of future results, these insights may help you understand our investment management philosophy.
See important Fund and, if applicable, index disclosures later in this report.
| | |
 | | Mark Uptigrove Chartered Financial Analyst, Portfolio Manager, is lead manager of Invesco Endeavor Fund. He |
| joined Invesco in 2005. Mr. Uptigrove earned a BA from the University of Western Ontario and an MBA from the Richard Ivey School of Business. |
| | |
 | | Clayton Zacharias Chartered Financial Analyst, Portfolio Manager, is manager of Invesco Endeavor Fund. He joined |
| Invesco in 2002. Mr. Zacharias earned a BBA from Simon Fraser University. |
Your Fund’s Long-Term Performance
Results of a $10,000 Investment – Oldest Share Class(es)
Fund and index data from 10/31/04
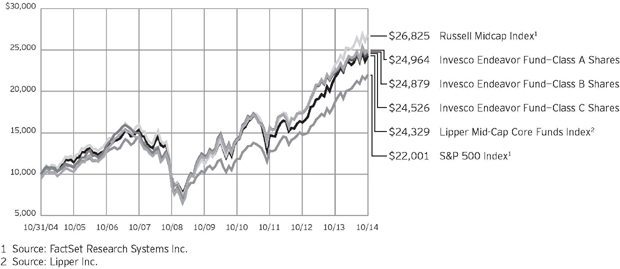
Past performance cannot guarantee comparable future results.
The data shown in the chart include reinvested distributions, applicable sales charges and Fund expenses including management fees. Results for Class B shares are calculated as if a hypothetical
shareholder had liquidated his entire investment in the Fund at the close of the reporting period and paid the contingent deferred sales charges, if applicable. Index results include reinvested dividends, but they do not reflect sales charges. Performance of the peer group,
if applicable, reflects fund expenses and management fees; performance of a market index does not. Performance shown in the chart and table(s) does not reflect deduction of taxes a shareholder would pay on Fund distributions or sale of Fund shares.
continued from page 8
Other information
| n | | The returns shown in management’s discussion of Fund performance are based on net asset values (NAVs) calculated for shareholder transactions. Generally accepted accounting principles require adjustments to be made to the net assets of the Fund at period end for financial reporting purposes, and as such, the NAVs for shareholder transactions and the returns based on those NAVs may differ from the NAVs and returns reported in the Financial Highlights. |
| n | | Industry classifications used in this report are generally according to the Global Industry Classification Standard, which was developed by and is the exclusive property and a service mark of MSCI Inc. and Standard & Poor’s. |
| | | | |
Average Annual Total Returns | |
As of 10/31/14, including maximum applicable sales charges | |
| |
| Class A Shares | | | | |
| Inception (11/4/03) | | | 10.10 | % |
| 10 Years | | | 9.58 | |
| 5 Years | | | 14.58 | |
| 1 Year | | | 5.03 | |
| |
| Class B Shares | | | | |
| Inception (11/4/03) | | | 10.08 | % |
| 10 Years | | | 9.54 | |
| 5 Years | | | 14.81 | |
| 1 Year | | | 5.27 | |
| |
| Class C Shares | | | | |
| Inception (11/4/03) | | | 9.87 | % |
| 10 Years | | | 9.39 | |
| 5 Years | | | 15.03 | |
| 1 Year | | | 9.27 | |
| |
| Class R Shares | | | | |
| Inception (4/30/04) | | | 10.03 | % |
| 10 Years | | | 9.95 | |
| 5 Years | | | 15.62 | |
| 1 Year | | | 10.89 | |
| |
| Class Y Shares | | | | |
| 10 Years | | | 10.38 | % |
| 5 Years | | | 16.18 | |
| 1 Year | | | 11.39 | |
| |
| Class R5 Shares | | | | |
| Inception (4/30/04) | | | 10.83 | % |
| 10 Years | | | 10.74 | |
| 5 Years | | | 16.43 | |
| 1 Year | | | 11.51 | |
| |
| Class R6 Shares | | | | |
| 10 Years | | | 10.30 | % |
| 5 Years | | | 16.11 | |
| 1 Year | | | 11.62 | |
Class Y shares incepted on October 3, 2008. Performance shown prior to that date is that of Class A shares and includes the 12b-1 fees applicable to Class A shares. Class A share performance reflects any applicable fee waivers or expense reimbursements.
Class R6 shares incepted on September 24, 2012. Performance shown prior to that date is that of Class A shares and includes the 12b-1 fees applicable to Class A shares. Class A share performance reflects any applicable fee waivers or expense reimbursements.
The performance data quoted represent past performance and cannot guarantee comparable future results; current performance may be lower or higher. Please visit invesco.com/performance for the
| | | | |
Average Annual Total Returns | |
| As of 9/30/14, the most recent calendar quarter end, including maximum applicable sales charges | |
| |
| Class A Shares | | | | |
| Inception (11/4/03) | | | 10.04 | % |
| 10 Years | | | 9.50 | |
| 5 Years | | | 13.77 | |
| 1 Year | | | 5.09 | |
| |
| Class B Shares | | | | |
| Inception (11/4/03) | | | 10.03 | % |
| 10 Years | | | 9.47 | |
| 5 Years | | | 13.97 | |
| 1 Year | | | 5.40 | |
| |
| Class C Shares | | | | |
| Inception (11/4/03) | | | 9.82 | % |
| 10 Years | | | 9.32 | |
| 5 Years | | | 14.20 | |
| 1 Year | | | 9.40 | |
| |
| Class R Shares | | | | |
| Inception (4/30/14) | | | 9.98 | % |
| 10 Years | | | 9.87 | |
| 5 Years | | | 14.79 | |
| 1 Year | | | 10.98 | |
| |
| Class Y Shares | | | | |
| 10 Years | | | 10.29 | % |
| 5 Years | | | 15.35 | |
| 1 Year | | | 11.49 | |
| |
| Class R5 Shares | | | | |
| Inception (4/30/04) | | | 10.78 | % |
| 10 Years | | | 10.67 | |
| 5 Years | | | 15.59 | |
| 1 Year | | | 11.66 | |
| |
| Class R6 Shares | | | | |
| 10 Years | | | 10.22 | % |
| 5 Years | | | 15.27 | |
| 1 Year | | | 11.77 | |
most recent month-end performance. Performance figures reflect reinvested distributions, changes in net asset value and the effect of the maximum sales charge unless otherwise stated. Investment return and principal value will fluctuate so that you may have a gain or loss when you sell shares.
The net annual Fund operating expense ratio set forth in the most recent Fund prospectus as of the date of this report for Class A, Class B, Class C, Class R, Class Y, Class R5 and Class R6 shares was 1.30%, 2.05%, 2.05%, 1.55%, 1.05%, 0.95% and 0.86%, respectively.1 The total annual Fund operating expense ratio set forth in the most recent Fund prospectus as of the date of this report for Class A, Class B, Class C, Class R, Class Y, Class R5 and Class R6 shares was
1.34%, 2.09%, 2.09%, 1.59%, 1.09%, 0.99% and 0.90%, respectively. The expense ratios presented above may vary from the expense ratios presented in other sections of this report that are based on expenses incurred during the period covered by this report.
Class A share performance reflects the maximum 5.50% sales charge, and Class B and Class C share performance reflects the applicable contingent deferred sales charge (CDSC) for the period involved. The CDSC on Class B shares declines from 5% beginning at the time of purchase to 0% at the beginning of the seventh year. The CDSC on Class C shares is 1% for the first year after purchase. Class R, Class Y, Class R5 and Class R6 shares do not have a front-end sales charge or a CDSC; therefore, performance is at net asset value.
The performance of the Fund’s share classes will differ primarily due to different sales charge structures and class expenses.
| 1 | Total annual Fund operating expenses after any contractual fee waivers and/or expense reimbursements by the adviser in effect through at least June 30, 2016. See current prospectus for more information. |
Invesco Endeavor Fund’s investment objective is long-term growth of capital.
| n | | Unless otherwise stated, information presented in this report is as of October 31, 2014, and is based on total net assets. |
| n | | Unless otherwise noted, all data provided by Invesco. |
| n | | To access your Fund’s reports/prospectus, visit invesco.com/fundreports. |
About share classes
| n | | Class B shares may not be purchased for new or additional investments. Please see the prospectus for more information. |
| n | | Class R shares are generally available only to employer sponsored retirement and benefit plans. Please see the prospectus for more information. |
| n | | Class Y shares are available only to certain investors. Please see the prospectus for more information. |
| n | | Class R5 shares and Class R6 shares are primarily intended for employer sponsored retirement and benefit plans that meet certain standards and for institutional investors. Please see the prospectus for more information. |
Principal risks of investing in the Fund
| n | | Cash/Cash Equivalent risk. Holding cash or cash equivalents may negatively affect performance. |
| n | | Debt securities risk. The Fund may invest in debt securities that are affected by changing interest rates and changes in their effective maturities and credit quality. |
| n | | Derivatives risk. The value of a derivative instrument depends largely on (and is derived from) the value of an underlying security, currency, commodity, interest rate, index or other asset (each referred to as an underlying asset). In addition to risks relating to the underlying assets, the use of derivatives may include other, possibly greater, risks, including counterparty, leverage and liquidity risks. Counterparty risk is the risk that the counterparty to the derivative contract will default on its obligation to pay the Fund the amount owed or otherwise perform under the derivative contract. Derivatives create leverage risk because they do not require payment up front equal to the economic exposure created by owning the derivative. As a result, an adverse change in the value of the underlying asset could result in |
| | | the Fund sustaining a loss that is substantially greater than the amount invested in the derivative, which may make the Fund’s returns more volatile and increase the risk of loss. Derivative instruments may also be less liquid than more traditional investments and the Fund may be unable to sell or close out its derivative positions at a desirable time or price. This risk may be more acute under adverse market conditions, during which the Fund may be most in need of liquidating its derivative positions. Derivatives may also be harder to value, less tax efficient and subject to changing government regulation that could impact the Fund’s ability to use certain derivatives or their cost. Also, derivatives used for hedging or to gain or limit exposure to a particular market segment may not provide the expected benefits, particularly during adverse market conditions. |
| n | | Foreign securities risk. The Fund’s foreign investments may be affected by changes in a foreign country’s exchange rates, political and social instability, changes in economic or taxation policies, difficulties when enforcing obligations, decreased liquidity, and increased volatility. Foreign companies may be subject to less regulation resulting in less publicly available information about the companies. |
| n | | Management risk. The investment techniques and risk analysis used by the Fund’s portfolio managers may not produce the desired results. |
| n | | Market risk. The prices of and the income generated by the Fund’s securities may decline in response to, among other things, investor sentiment, general economic and market conditions, regional or global instability, and currency and interest rate fluctuations. |
| n | | Small- and mid-capitalization risk. Stocks of small- and mid-sized companies tend to be more vulnerable to adverse developments and may have little or no operating history or track record of success, and limited product lines, markets, |
| | management and financial resources. The securities of small- and mid-sized companies may be more volatile due to less market interest and less publicly available information about the issuer. They also may be illiquid or restricted as to resale, or may trade less frequently and in smaller volumes, all of which may cause difficulty when establishing or closing a position at a desirable price. |
| n | | US government obligations risk. The Fund may invest in obligations issued by US government agencies and instrumentalities that may receive varying levels of support from the government, which could affect the Fund’s ability to recover should they default. |
| n | | Value investing style risk. The Fund emphasizes a value style of investing, which focuses on undervalued companies with characteristics for improved valuations. This style of investing is subject to the risk that the valuations never improve or that the returns on value equity securities are less than returns on other styles of investing or the overall stock market. Value stocks also may decline in price, even though in theory they are already underpriced. |
About indexes used in this report
| n | | The S&P 500® Index is an unmanaged index considered representative of the US stock market. |
| n | | The Russell Midcap® Index is an unmanaged index considered representative of mid-cap stocks. The Russell Midcap Index is a trademark/service mark of the Frank Russell Co. Russell® is a trademark of the Frank Russell Co. |
| n | | The Lipper Mid-Cap Core Funds Index is an unmanaged index considered representative of mid-cap core funds tracked by Lipper. |
| n | | The Fund is not managed to track the performance of any particular index, including the index(es) described here, and consequently, the performance of the Fund may deviate significantly from the performance of the
index(es). |
| n | | A direct investment cannot be made in an index. Unless otherwise indicated, index results include reinvested dividends, and they do not reflect sales charges. Performance of the peer group, if applicable, reflects fund expenses; performance of a market index does not. |
continued on page 6
|
This report must be accompanied or preceded by a currently effective Fund prospectus, which contains more complete information, including sales charges and expenses. Investors should read it carefully before investing. |
|
|
| NOT FDIC INSURED | MAY LOSE VALUE | NO BANK GUARANTEE |
Schedule of Investments(a)
October 31, 2014
| | | | | | | | | | |
| | | Shares | | | Value | |
Common Stocks & Other Equity Interests–81.00% | |
| Agricultural & Farm Machinery–2.06% | | | | | |
Deere & Co. | | | 121,873 | | | $ | 10,425,016 | |
| |
| Air Freight & Logistics–3.24% | | | | | |
Echo Global Logistics, Inc.(b) | | | 628,426 | | | | 16,420,771 | |
| |
| Airlines–1.63% | | | | | |
Ryanair Holdings PLC–ADR (Ireland)(b) | | | 148,800 | | | | 8,264,352 | |
| |
| Apparel Retail–5.92% | | | | | |
Francesca’s Holdings Corp.(b) | | | 921,703 | | | | 10,977,483 | |
Ross Stores, Inc. | | | 236,018 | | | | 19,051,373 | |
| | | | 30,028,856 | |
| |
| Brewers–2.03% | | | | | |
Molson Coors Brewing Co.–Class B | | | 138,455 | | | | 10,298,283 | |
| |
| Building Products–1.42% | | | | | |
Kingspan Group PLC (Ireland) | | | 461,678 | | | | 7,220,038 | |
| |
| Communications Equipment–3.12% | | | | | |
Plantronics, Inc. | | | 304,828 | | | | 15,811,428 | |
| |
| Construction & Engineering–9.01% | | | | | |
Orion Marine Group, Inc.(b)(c) | | | 1,884,474 | | | | 20,653,835 | |
Pike Corp.(b)(c) | | | 1,803,742 | | | | 21,536,680 | |
Quanta Services, Inc.(b) | | | 101,731 | | | | 3,466,992 | |
| | | | 45,657,507 | |
| |
| Environmental & Facilities Services–3.49% | | | | | |
Newalta Corp. (Canada) | | | 978,927 | | | | 17,677,846 | |
| |
| Health Care Distributors–2.21% | | | | | |
Patterson Cos. Inc. | | | 260,000 | | | | 11,208,600 | |
| |
| Health Care Equipment–3.54% | | | | | |
Zimmer Holdings, Inc. | | | 161,451 | | | | 17,959,809 | |
| |
| Home Entertainment Software–2.33% | | | | | |
Activision Blizzard, Inc. | | | 593,290 | | | | 11,836,136 | |
| |
| Industrial Conglomerates–2.81% | | | | | |
DCC PLC (Ireland) | | | 254,531 | | | | 14,250,528 | |
| |
| Integrated Oil & Gas–2.71% | | | | | |
Cenovus Energy Inc. (Canada) | | | 554,694 | | | | 13,728,295 | |
| |
| IT Consulting & Other Services–3.20% | | | | | |
Cognizant Technology Solutions Corp.–Class A(b) | | | 332,619 | | | | 16,248,438 | |
| | | | | | | | | | |
| | | Shares | | | Value | |
| Life & Health Insurance–2.61% | | | | | |
Unum Group | | | 394,920 | | | $ | 13,214,023 | |
| |
| Managed Health Care–2.91% | | | | | |
UnitedHealth Group Inc. | | | 155,306 | | | | 14,755,623 | |
| |
| Multi-Line Insurance–2.45% | | | | | |
Vienna Insurance Group AG Wiener Versicherung Gruppe (Austria) | | | 258,042 | | | | 12,403,799 | |
|
| Oil & Gas Exploration & Production–6.08% | |
Devon Energy Corp. | | | 170,289 | | | | 10,217,340 | |
Ultra Petroleum Corp.(b) | | | 904,021 | | | | 20,611,679 | |
| | | | 30,829,019 | |
| |
| Paper Products–0.21% | | | | | |
Fortress Paper Ltd.–Class A
(Canada)(b) | | | 575,700 | | | | 1,062,611 | |
|
| Real Estate Operating Companies–4.01% | |
Brookfield Property Partners L.P. | | | 893,740 | | | | 20,332,585 | |
| |
| Research & Consulting Services–2.59% | | | | | |
FTI Consulting, Inc.(b) | | | 325,661 | | | | 13,150,191 | |
| |
| Semiconductor Equipment–1.98% | | | | | |
Ultratech, Inc.(b) | | | 523,867 | | | | 10,021,576 | |
| |
| Technology Distributors–3.00% | | | | | |
CDW Corp. | | | 493,803 | | | | 15,228,885 | |
|
| Trading Companies & Distributors–4.43% | |
Grafton Group PLC (Ireland)(d) | | | 954,395 | | | | 9,726,538 | |
Titan Machinery, Inc.(b) | | | 925,357 | | | | 12,732,912 | |
| | | | 22,459,450 | |
| |
| Trucking–2.01% | | | | | |
Con-way Inc. | | | 234,804 | | | | 10,183,450 | |
Total Common Stocks & Other Equity Interests
(Cost $323,312,048) | | | | 410,677,115 | |
| |
Money Market Funds–18.93% | | | | | |
Liquid Assets Portfolio–Institutional Class(e) | | | 47,988,623 | | | | 47,988,623 | |
Premier Portfolio–Institutional Class(e) | | | 47,988,623 | | | | 47,988,623 | |
Total Money Market Funds
(Cost $95,977,246) | | | | 95,977,246 | |
TOTAL INVESTMENTS–99.93%
(Cost $419,289,294) | | | | | | | 506,654,361 | |
OTHER ASSETS LESS LIABILITIES–0.07% | | | | | | | 366,579 | |
NET ASSETS–100.00% | | | | | | $ | 507,020,940 | |
Investment Abbreviations:
| | |
| ADR | | – American Depositary Receipt |
Notes to Schedule of Investments:
| (a) | Industry and/or sector classifications used in this report are generally according to the Global Industry Classification Standard, which was developed by and is the exclusive property and a service mark of MSCI Inc. and Standard & Poor’s. |
| (b) | Non-income producing security. |
| (c) | Affiliated company during the period. The Investment Company Act of 1940 defines affiliates as those companies in which a fund holds 5% or more of the outstanding voting securities. The Fund has not owned enough of the outstanding voting securities of the issuer to have control (as defined in the Investment Company Act of 1940) of that issuer. The aggregate value of these securities as of October 31, 2014 was $42,190,515, which represented 8.32% of the Fund’s Net Assets. See Note 4. |
| (d) | Each unit represents one ordinary share, seventeen Class A shares and one Class C share. |
| (e) | The money market fund and the Fund are affiliated by having the same investment adviser. |
See accompanying Notes to Financial Statements which are an integral part of the financial statements.
9 Invesco Endeavor Fund
Statement of Assets and Liabilities
October 31, 2014
| | | | |
Assets: | | | | |
Investments, at value (Cost $289,645,347) | | $ | 368,486,600 | |
Investments in affiliates, at value (Cost $129,643,947) | | | 138,167,761 | |
Total investments, at value (Cost $419,289,294) | | | 506,654,361 | |
Foreign currencies, at value (Cost $211) | | | 207 | |
Receivable for: | | | | |
Investments sold | | | 2,319,344 | |
Fund shares sold | | | 450,491 | |
Dividends | | | 170,452 | |
Investment for trustee deferred compensation and retirement plans | | | 62,945 | |
Other assets | | | 43,312 | |
Total assets | | | 509,701,112 | |
|
Liabilities: | |
Payable for: | | | | |
Fund shares reacquired | | | 2,255,952 | |
Accrued fees to affiliates | | | 283,391 | |
Accrued trustees’ and officers’ fees and benefits | | | 2,457 | |
Accrued other operating expenses | | | 67,715 | |
Trustee deferred compensation and retirement plans | | | 70,657 | |
Total liabilities | | | 2,680,172 | |
Net assets applicable to shares outstanding | | $ | 507,020,940 | |
|
Net assets consist of: | |
Shares of beneficial interest | | $ | 375,194,472 | |
Undistributed net investment income (loss) | | | (25,096 | ) |
Undistributed net realized gain | | | 44,492,970 | |
Net unrealized appreciation | | | 87,358,594 | |
| | | $ | 507,020,940 | |
| | | | |
Net Assets: | | | | |
Class A | | $ | 192,326,077 | |
Class B | | $ | 4,854,906 | |
Class C | | $ | 53,542,043 | |
Class R | | $ | 34,633,978 | |
Class Y | | $ | 71,897,818 | |
Class R5 | | $ | 49,356,407 | |
Class R6 | | $ | 100,409,711 | |
|
Shares outstanding, $0.01 par value per share,
with an unlimited number of shares authorized: | |
Class A | | | 8,521,384 | |
Class B | | | 233,177 | |
Class C | | | 2,570,331 | |
Class R | | | 1,568,856 | |
Class Y | | | 3,138,566 | |
Class R5 | | | 2,116,381 | |
Class R6 | | | 4,299,630 | |
Class A: | | | | |
Net asset value per share | | $ | 22.57 | |
Maximum offering price per share | | | | |
(Net asset value of $22.57 ¸ 94.50%) | | $ | 23.88 | |
Class B: | | | | |
Net asset value and offering price per share | | $ | 20.82 | |
Class C: | | | | |
Net asset value and offering price per share | | $ | 20.83 | |
Class R: | | | | |
Net asset value and offering price per share | | $ | 22.08 | |
Class Y: | | | | |
Net asset value and offering price per share | | $ | 22.91 | |
Class R5 | | | | |
Net asset value and offering price per share | | $ | 23.32 | |
Class R6: | | | | |
Net asset value and offering price per share | | $ | 23.35 | |
See accompanying Notes to Financial Statements which are an integral part of the financial statements.
10 Invesco Endeavor Fund
Statement of Operations
For the year ended October 31, 2014
| | | | |
Investment income: | |
Dividends (net of foreign withholding taxes of $215,253) | | $ | 4,079,263 | |
Dividends from affiliates | | | 47,370 | |
Total investment income | | | 4,126,633 | |
| |
Expenses: | | | | |
Advisory fees | | | 3,671,608 | |
Administrative services fees | | | 144,499 | |
Custodian fees | | | 32,185 | |
Distribution fees: | | | | |
Class A | | | 478,350 | |
Class B | | | 54,125 | |
Class C | | | 520,817 | |
Class R | | | 181,419 | |
Transfer agent fees — A, B, C, R and Y | | | 752,536 | |
Transfer agent fees — R5 | | | 39,960 | |
Transfer agent fees — R6 | | | 5,496 | |
Trustees’ and officers’ fees and benefits | | | 34,096 | |
Other | | | 251,215 | |
Total expenses | | | 6,166,306 | |
Less: Fees waived and expense offset arrangement(s) | | | (172,480 | ) |
Net expenses | | | 5,993,826 | |
Net investment income (loss) | | | (1,867,193 | ) |
| |
Realized and unrealized gain from: | | | | |
Net realized gain from: | | | | |
Investment securities | | | 48,467,510 | |
Foreign currencies | | | 18,900 | |
| | | | 48,486,410 | |
Change in net unrealized appreciation (depreciation) of: | | | | |
Investment securities | | | 5,753,104 | |
Foreign currencies | | | (8,399 | ) |
| | | | 5,744,705 | |
Net realized and unrealized gain | | | 54,231,115 | |
Net increase in net assets resulting from operations | | $ | 52,363,922 | |
See accompanying Notes to Financial Statements which are an integral part of the financial statements.
11 Invesco Endeavor Fund
Statement of Changes in Net Assets
For the years ended October 31, 2014 and 2013
| | | | | | | | |
| | | 2014 | | | 2013 | |
Operations: | | | | | | | | |
Net investment income (loss) | | $ | (1,867,193 | ) | | $ | 118,639 | |
Net realized gain | | | 48,486,410 | | | | 19,840,548 | |
Change in net unrealized appreciation | | | 5,744,705 | | | | 66,527,606 | |
Net increase in net assets resulting from operations | | | 52,363,922 | | | | 86,486,793 | |
| | |
Distributions to shareholders from net investment income: | | | | | | | | |
Class A | | | (102,781 | ) | | | (375,232 | ) |
Class B | | | — | | | | (15,157 | ) |
Class C | | | — | | | | (68,381 | ) |
Class R | | | — | | | | (77,643 | ) |
Class Y | | | (236,467 | ) | | | (85,763 | ) |
Class R5 | | | (102,797 | ) | | | (66,393 | ) |
Class R6 | | | (360,531 | ) | | | (314,607 | ) |
Total distributions from net investment income | | | (802,576 | ) | | | (1,003,176 | ) |
| | |
Distributions to shareholders from net realized gains: | | | | | | | | |
Class A | | | (7,305,132 | ) | | | (9,759,796 | ) |
Class B | | | (250,992 | ) | | | (602,027 | ) |
Class C | | | (2,092,673 | ) | | | (2,667,268 | ) |
Class R | | | (1,486,839 | ) | | | (2,258,723 | ) |
Class Y | | | (3,765,978 | ) | | | (2,013,789 | ) |
Class R5 | | | (1,275,689 | ) | | | (1,523,823 | ) |
Class R6 | | | (3,726,638 | ) | | | (6,827,610 | ) |
Total distributions from net realized gains | | | (19,903,941 | ) | | | (25,653,036 | ) |
| | |
Share transactions–net: | | | | | | | | |
Class A | | | (772,225 | ) | | | 55,295,145 | |
Class B | | | (1,354,164 | ) | | | (1,189,516 | ) |
Class C | | | 1,283,102 | | | | 17,402,647 | |
Class R | | | (2,178,156 | ) | | | 6,797,911 | |
Class Y | | | (24,722,768 | ) | | | 60,785,747 | |
Class R5 | | | 15,279,456 | | | | 10,979,178 | |
Class R6 | | | 3,074,206 | | | | 2,506,012 | |
Net increase (decrease) in net assets resulting from share transactions | | | (9,390,549 | ) | | | 152,577,124 | |
Net increase in net assets | | | 22,266,856 | | | | 212,407,705 | |
| | |
Net assets: | | | | | | | | |
Beginning of year | | | 484,754,084 | | | | 272,346,379 | |
End of year (includes undistributed net investment income (loss) of $(25,096) and $(913,873), respectively) | | $ | 507,020,940 | | | $ | 484,754,084 | |
Notes to Financial Statements
October 31, 2014
NOTE 1—Significant Accounting Policies
Invesco Endeavor Fund (the “Fund”) is a series portfolio of AIM Investment Funds (Invesco Investment Funds) (the “Trust”). The Trust is organized as a Delaware statutory trust and is registered under the Investment Company Act of 1940, as amended (the “1940 Act”), as an open-end series management investment company consisting of twenty-four separate series portfolios, each authorized to issue an unlimited number of shares of beneficial interest. The assets, liabilities and operations of each portfolio are accounted for separately. Information presented in these financial statements pertains only to the Fund. Matters affecting each portfolio or class will be voted on exclusively by the shareholders of such portfolio or class.
The Fund’s investment objective is long-term growth of capital.
12 Invesco Endeavor Fund
The Fund currently consists of seven different classes of shares: Class A, Class B, Class C, Class R, Class Y, Class R5 and Class R6. Class A shares are sold with a front-end sales charge unless certain waiver criteria are met and under certain circumstances load waived shares may be subject to contingent deferred sales charges (“CDSC”). Class C shares are sold with a CDSC. Class R, Class Y, Class R5 and Class R6 shares are sold at net asset value. Effective November 30, 2010, new or additional investments in Class B shares are no longer permitted. Existing shareholders of Class B shares may continue to reinvest dividends and capital gains distributions in Class B shares until they convert to Class A shares. Also, shareholders in Class B shares will be able to exchange those shares for Class B shares of other Invesco Funds offering such shares until they convert to Class A shares. Generally, Class B shares will automatically convert to Class A shares on or about the month-end, which is at least eight years after the date of purchase. Redemption of Class B shares prior to the conversion date will be subject to a CDSC.
The following is a summary of the significant accounting policies followed by the Fund in the preparation of its financial statements.
| A. | Security Valuations — Securities, including restricted securities, are valued according to the following policy. |
A security listed or traded on an exchange (except convertible securities) is valued at its last sales price or official closing price as of the close of the customary trading session on the exchange where the security is principally traded, or lacking any sales or official closing price on a particular day, the security may be valued at the closing bid price on that day. Securities traded in the over-the-counter market are valued based on prices furnished by independent pricing services or market makers. When such securities are valued by an independent pricing service they may be considered fair valued. Futures contracts are valued at the final settlement price set by an exchange on which they are principally traded. Listed options are valued at the mean between the last bid and ask prices from the exchange on which they are principally traded. Options not listed on an exchange are valued by an independent source at the mean between the last bid and ask prices. For purposes of determining net asset value per share, futures and option contracts generally are valued 15 minutes after the close of the customary trading session of the New York Stock Exchange (“NYSE”).
Investments in open-end and closed-end registered investment companies that do not trade on an exchange are valued at the end of day net asset value per share. Investments in open-end and closed-end registered investment companies that trade on an exchange are valued at the last sales price or official closing price as of the close of the customary trading session on the exchange where the security is principally traded.
Debt obligations (including convertible securities) and unlisted equities are fair valued using an evaluated quote provided by an independent pricing service. Evaluated quotes provided by the pricing service may be determined without exclusive reliance on quoted prices, and may reflect appropriate factors such as institution-size trading in similar groups of securities, developments related to specific securities, dividend rate (for unlisted equities), yield (for debt obligations), quality, type of issue, coupon rate (for debt obligations), maturity (for debt obligations), individual trading characteristics and other market data. Debt obligations are subject to interest rate and credit risks. In addition, all debt obligations involve some risk of default with respect to interest and/or principal payments.
Foreign securities’ (including foreign exchange contracts) prices are converted into U.S. dollar amounts using the applicable exchange rates as of the close of the NYSE. If market quotations are available and reliable for foreign exchange-traded equity securities, the securities will be valued at the market quotations. Because trading hours for certain foreign securities end before the close of the NYSE, closing market quotations may become unreliable. If between the time trading ends on a particular security and the close of the customary trading session on the NYSE, events occur that the Adviser determines are significant and make the closing price unreliable, the Fund may fair value the security. If the event is likely to have affected the closing price of the security, the security will be valued at fair value in good faith using procedures approved by the Board of Trustees. Adjustments to closing prices to reflect fair value may also be based on a screening process of an independent pricing service to indicate the degree of certainty, based on historical data, that the closing price in the principal market where a foreign security trades is not the current value as of the close of the NYSE. Foreign securities’ prices meeting the approved degree of certainty that the price is not reflective of current value will be priced at the indication of fair value from the independent pricing service. Multiple factors may be considered by the independent pricing service in determining adjustments to reflect fair value and may include information relating to sector indices, American Depositary Receipts and domestic and foreign index futures. Foreign securities may have additional risks including exchange rate changes, potential for sharply devalued currencies and high inflation, political and economic upheaval, the relative lack of issuer information, relatively low market liquidity and the potential lack of strict financial and accounting controls and standards.
Securities for which market prices are not provided by any of the above methods may be valued based upon quotes furnished by independent sources. The last bid price may be used to value equity securities. The mean between the last bid and ask prices is used to value debt obligations, including corporate loans.
Securities for which market quotations are not readily available or became unreliable are valued at fair value as determined in good faith by or under the supervision of the Trust’s officers following procedures approved by the Board of Trustees. Issuer specific events, market trends, bid/ask quotes of brokers and information providers and other market data may be reviewed in the course of making a good faith determination of a security’s fair value.
The Fund may invest in securities that are subject to interest rate risk, meaning the risk that the prices will generally fall as interest rates rise and, conversely, the prices will generally rise as interest rates fall. Specific securities differ in their sensitivity to changes in interest rates depending on their individual characteristics. Changes in interest rates may result in increased market volatility, which may affect the value and/or liquidity of certain of the Fund’s investments.
Valuations change in response to many factors including the historical and prospective earnings of the issuer, the value of the issuer’s assets, general economic conditions, interest rates, investor perceptions and market liquidity. Because of the inherent uncertainties of valuation, the values reflected in the financial statements may materially differ from the value received upon actual sale of those investments.
| B. | Securities Transactions and Investment Income — Securities transactions are accounted for on a trade date basis. Realized gains or losses on sales are computed on the basis of specific identification of the securities sold. Interest income (net of withholding tax, if any) is recorded on the accrual basis from settlement date. Dividend income (net of withholding tax, if any) is recorded on the ex-dividend date. |
The Fund may periodically participate in litigation related to Fund investments. As such, the Fund may receive proceeds from litigation settlements. Any proceeds received are included in the Statement of Operations as realized gain (loss) for investments no longer held and as unrealized gain (loss) for investments still held.
Brokerage commissions and mark ups are considered transaction costs and are recorded as an increase to the cost basis of securities purchased and/or a reduction of proceeds on a sale of securities. Such transaction costs are included in the determination of net realized and
13 Invesco Endeavor Fund
unrealized gain (loss) from investment securities reported in the Statement of Operations and the Statement of Changes in Net Assets and the net realized and unrealized gains (losses) on securities per share in the Financial Highlights. Transaction costs are included in the calculation of the Fund’s net asset value and, accordingly, they reduce the Fund’s total returns. These transaction costs are not considered operating expenses and are not reflected in net investment income reported in the Statement of Operations and Statement of Changes in Net Assets, or the net investment income per share and ratios of expenses and net investment income reported in the Financial Highlights, nor are they limited by any expense limitation arrangements between the Fund and the investment adviser.
The Fund allocates income and realized and unrealized capital gains and losses to a class based on the relative net assets of each class.
| C. | Country Determination — For the purposes of making investment selection decisions and presentation in the Schedule of Investments, the investment adviser may determine the country in which an issuer is located and/or credit risk exposure based on various factors. These factors include the laws of the country under which the issuer is organized, where the issuer maintains a principal office, the country in which the issuer derives 50% or more of its total revenues and the country that has the primary market for the issuer’s securities, as well as other criteria. Among the other criteria that may be evaluated for making this determination are the country in which the issuer maintains 50% or more of its assets, the type of security, financial guarantees and enhancements, the nature of the collateral and the sponsor organization. Country of issuer and/or credit risk exposure has been determined to be the United States of America, unless otherwise noted. |
| D. | Distributions — Distributions from net investment income and net realized capital gain, if any, are generally declared and paid annually and recorded on the ex-dividend date. The Fund may elect to treat a portion of the proceeds from redemptions as distributions for federal income tax purposes. |
| E. | Federal Income Taxes — The Fund intends to comply with the requirements of Subchapter M of the Internal Revenue Code of 1986, as amended (the “Internal Revenue Code”), necessary to qualify as a regulated investment company and to distribute substantially all of the Fund’s taxable earnings to shareholders. As such, the Fund will not be subject to federal income taxes on otherwise taxable income (including net realized capital gain) that is distributed to shareholders. Therefore, no provision for federal income taxes is recorded in the financial statements. |
The Fund recognizes the tax benefits of uncertain tax positions only when the position is more likely than not to be sustained. Management has analyzed the Fund’s uncertain tax positions and concluded that no liability for unrecognized tax benefits should be recorded related to uncertain tax positions. Management is not aware of any tax positions for which it is reasonably possible that the total amounts of unrecognized tax benefits will change materially in the next 12 months.
The Fund files tax returns in the U.S. Federal jurisdiction and certain other jurisdictions. Generally, the Fund is subject to examinations by such taxing authorities for up to three years after the filing of the return for the tax period.
| F. | Expenses — Fees provided for under the Rule 12b-1 plan of a particular class of the Fund are charged to the operations of such class. Transfer agency fees and expenses and other shareholder recordkeeping fees and expenses attributable to Class R5 and Class R6 are allocated to each share class based on relative net assets. Sub-accounting fees attributable to Class R5 are charged to the operations of the class. Transfer agency fees and expenses and other shareholder recordkeeping fees and expenses relating to all other classes are allocated among those classes based on relative net assets. All other expenses are allocated among the classes based on relative net assets. |
| G. | Accounting Estimates — The preparation of financial statements in conformity with accounting principles generally accepted in the United States of America (“GAAP”) requires management to make estimates and assumptions that affect the reported amounts of assets and liabilities at the date of the financial statements and the reported amounts of revenues and expenses during the reporting period including estimates and assumptions related to taxation. Actual results could differ from those estimates by a significant amount. In addition, the Fund monitors for material events or transactions that may occur or become known after the period-end date and before the date the financial statements are released to print. |
| H. | Indemnifications — Under the Trust’s organizational documents, each Trustee, officer, employee or other agent of the Trust is indemnified against certain liabilities that may arise out of the performance of their duties to the Fund. Additionally, in the normal course of business, the Fund enters into contracts, including the Fund’s servicing agreements, that contain a variety of indemnification clauses. The Fund’s maximum exposure under these arrangements is unknown as this would involve future claims that may be made against the Fund that have not yet occurred. The risk of material loss as a result of such indemnification claims is considered remote. |
| I. | Foreign Currency Translations — Foreign currency is valued at the close of the NYSE based on quotations posted by banks and major currency dealers. Portfolio securities and other assets and liabilities denominated in foreign currencies are translated into U.S. dollar amounts at date of valuation. Purchases and sales of portfolio securities (net of foreign taxes withheld on disposition) and income items denominated in foreign currencies are translated into U.S. dollar amounts on the respective dates of such transactions. The Fund does not separately account for the portion of the results of operations resulting from changes in foreign exchange rates on investments and the fluctuations arising from changes in market prices of securities held. The combined results of changes in foreign exchange rates and the fluctuation of market prices on investments (net of estimated foreign tax withholding) are included with the net realized and unrealized gain or loss from investments in the Statement of Operations. Reported net realized foreign currency gains or losses arise from (1) sales of foreign currencies, (2) currency gains or losses realized between the trade and settlement dates on securities transactions, and (3) the difference between the amounts of dividends, interest, and foreign withholding taxes recorded on the Fund’s books and the U.S. dollar equivalent of the amounts actually received or paid. Net unrealized foreign currency gains and losses arise from changes in the fair values of assets and liabilities, other than investments in securities at fiscal period end, resulting from changes in exchange rates. |
The Fund may invest in foreign securities, which may be subject to foreign taxes on income, gains on investments or currency repatriation, a portion of which may be recoverable. Foreign taxes, if any, are recorded based on the tax regulations and rates that exist in the foreign markets in which the Fund invests and are shown in the Statement of Operations.
| J. | Forward Foreign Currency Contracts — The Fund may engage in foreign currency transactions either on a spot (i.e. for prompt delivery and settlement) basis or through forward foreign currency contracts to manage or minimize currency or exchange rate risk. |
The Fund may also enter into forward foreign currency contracts for the purchase or sale of a security denominated in a foreign currency in order to “lock in” the U.S. dollar price of that security, or the Fund may also enter into forward foreign currency contracts that do not provide for physical settlement of the two currencies, but instead are settled by a single cash payment calculated as the difference between the agreed upon exchange rate and the spot rate at settlement based upon an agreed upon notional amount (non-deliverable forwards). The Fund will set aside liquid assets in an amount equal to daily mark-to-market obligation for forward foreign currency contracts.
14 Invesco Endeavor Fund
A forward foreign currency contract is an obligation between two parties (“Counterparties”) to purchase or sell a specific currency for an agreed-upon price at a future date. The use of forward foreign currency contracts does not eliminate fluctuations in the price of the underlying securities the Fund owns or intends to acquire but establishes a rate of exchange in advance. Fluctuations in the value of these contracts are measured by the difference in the contract date and reporting date exchange rates and are recorded as unrealized appreciation (depreciation) until the contracts are closed. When the contracts are closed, realized gains (losses) are recorded. Realized and unrealized gains (losses) on the contracts are included in the Statement of Operations. The primary risks associated with forward foreign currency contracts include failure of the Counterparty to meet the terms of the contract and the value of the foreign currency changing unfavorably. These risks may be in excess of the amounts reflected in the Statement of Assets and Liabilities.
NOTE 2—Advisory Fees and Other Fees Paid to Affiliates
The Trust has entered into a master investment advisory agreement with Invesco Advisers, Inc. (the “Adviser” or “Invesco”). Under the terms of the investment advisory agreement, the Fund pays an advisory fee to the Adviser based on the annual rate of the Fund’s average daily net assets as follows:
| | | | | | |
| Average Daily Net Assets | | Rate |
First $250 million | | | 0 | .745% | | |
Next $250 million | | | 0 | .73% | | |
Next $500 million | | | 0 | .715% | | |
Next $1.5 billion | | | 0 | .70% | | |
Next $2.5 billion | | | 0 | .685% | | |
Next $2.5 billion | | | 0 | .67% | | |
Next $2.5 billion | | | 0 | .655% | | |
Over $10 billion | | | 0 | .64% | | |
For the year ended October 31, 2014, the effective advisory fees incurred by the Fund was 0.74%.
Under the terms of a master sub-advisory agreement between the Adviser and each of Invesco Asset Management Deutschland GmbH, Invesco Asset Management Limited, Invesco Asset Management (Japan) Limited, Invesco Australia Limited, Invesco Hong Kong Limited, Invesco Senior Secured Management, Inc. and Invesco Canada Ltd. (collectively, the “Affiliated Sub-Advisers”) the Adviser, not the Fund, may pay 40% of the fees paid to the Adviser to any such Affiliated Sub-Adviser(s) that provide(s) discretionary investment management services to the Fund based on the percentage of assets allocated to such Sub-Adviser(s).
The Adviser has contractually agreed, through at least June 30, 2015, to waive advisory fees and/or reimburse expenses to the extent necessary to limit total annual fund operating expenses after fee waiver and/or expense reimbursement (excluding certain items discussed below) of Class A, Class B, Class C, Class R, Class Y, Class R5 and Class R6 shares to 2.00%, 2.75%, 2.75%, 2.25%, 1.75%, 1.75% and 1.75% of average daily net assets, respectively. In determining the Adviser’s obligation to waive advisory fees and/or reimburse expenses, the following expenses are not taken into account, and could cause total annual fund operating expenses after fee waiver and/or expense reimbursement to exceed the numbers reflected above: (1) interest; (2) taxes; (3) dividend expense on short sales; (4) extraordinary or non-routine items, including litigation expenses; and (5) expenses that the Fund has incurred but did not actually pay because of an expense offset arrangement. Unless Invesco continues the fee waiver agreement, it will terminate on June 30, 2015. The fee waiver agreement cannot be terminated during its term. The Adviser did not waive fees and/or reimburse expenses during the period under this expense limitation.
Further, the Adviser has contractually agreed, through at least June 30, 2016, to waive the advisory fee payable by the Fund in an amount equal to 100% of the net advisory fees the Adviser receives from the affiliated money market funds on investments by the Fund of uninvested cash in such affiliated money market funds.
For the year ended October 31, 2014, the Adviser waived advisory fees of $171,124.
The Trust has entered into a master administrative services agreement with Invesco pursuant to which the Fund has agreed to pay Invesco for certain administrative costs incurred in providing accounting services to the Fund. For the year ended October 31, 2014, expenses incurred under the agreement are shown in the Statement of Operations as Administrative services fees.
The Trust has entered into a transfer agency and service agreement with Invesco Investment Services, Inc. (“IIS”) pursuant to which the Fund has agreed to pay IIS a fee for providing transfer agency and shareholder services to the Fund and reimburse IIS for certain expenses incurred by IIS in the course of providing such services. IIS may make payments to intermediaries that provide omnibus account services, sub-accounting services and/or networking services. All fees payable by IIS to intermediaries that provide omnibus account services or sub-accounting are charged back to the Fund, subject to certain limitations approved by the Trust’s Board of Trustees. For the year ended October 31, 2014, expenses incurred under the agreement are shown in the Statement of Operations as Transfer agent fees.
The Trust has entered into master distribution agreements with Invesco Distributors, Inc. (“IDI”) to serve as the distributor for the Class A, Class B, Class C, Class R, Class Y, Class R5 and Class R6 shares of the Fund. The Trust has adopted plans pursuant to Rule 12b-1 under the 1940 Act with respect to the Fund’s Class A, Class B, Class C and Class R shares (collectively, the “Plans”). The Fund, pursuant to the Plans, pays IDI compensation at the annual rate of 0.25% of the Fund’s average daily net assets of Class A shares, 1.00% of the average daily net assets of Class B and Class C shares and 0.50% of the average daily net assets of Class R shares. Of the Plan payments, up to 0.25% of the average daily net assets of each class of shares may be paid to furnish continuing personal shareholder services to customers who purchase and own shares of such classes. Any amounts not paid as a service fee under the Plans would constitute an asset-based sales charge. Rules of the Financial Industry Regulatory Authority (“FINRA”) impose a cap on the total sales charges, including asset-based sales charges, that may be paid by any class of shares of the Fund. For the year ended October 31, 2014, expenses incurred under the Plans are shown in the Statement of Operations as Distribution fees.
Front-end sales commissions and CDSC (collectively, the “sales charges”) are not recorded as expenses of the Fund. Front-end sales commissions are deducted from proceeds from the sales of Fund shares prior to investment in Class A shares of the Fund. CDSC are deducted from redemption proceeds prior to remittance to the shareholder. During the year ended October 31, 2014, IDI advised the Fund that IDI retained $72,467 in
15 Invesco Endeavor Fund
front-end sales commissions from the sale of Class A shares and $94, $1,445 and $6,297 from Class A, Class B and Class C shares, respectively, for CDSC imposed on redemptions by shareholders.
Certain officers and trustees of the Trust are officers and directors of the Adviser, IIS and/or IDI.
NOTE 3—Additional Valuation Information
GAAP defines fair value as the price that would be received to sell an asset or paid to transfer a liability in an orderly transaction between market participants at the measurement date, under current market conditions. GAAP establishes a hierarchy that prioritizes the inputs to valuation methods, giving the highest priority to readily available unadjusted quoted prices in an active market for identical assets (Level 1) and the lowest priority to significant unobservable inputs (Level 3), generally when market prices are not readily available or are unreliable. Based on the valuation inputs, the securities or other investments are tiered into one of three levels. Changes in valuation methods may result in transfers in or out of an investment’s assigned level:
| | Level 1 — | Prices are determined using quoted prices in an active market for identical assets. |
| | Level 2 — | Prices are determined using other significant observable inputs. Observable inputs are inputs that other market participants may use in pricing a security. These may include quoted prices for similar securities, interest rates, prepayment speeds, credit risk, yield curves, loss severities, default rates, discount rates, volatilities and others. |
| | Level 3 — | Prices are determined using significant unobservable inputs. In situations where quoted prices or observable inputs are unavailable (for example, when there is little or no market activity for an investment at the end of the period), unobservable inputs may be used. Unobservable inputs reflect the Fund’s own assumptions about the factors market participants would use in determining fair value of the securities or instruments and would be based on the best available information. |
The following is a summary of the tiered valuation input levels, as of October 31, 2014. The level assigned to the securities valuations may not be an indication of the risk or liquidity associated with investing in those securities. Because of the inherent uncertainties of valuation, the values reflected in the financial statements may materially differ from the value received upon actual sale of those investments.
During the year ended October 31, 2014, there were transfers from Level 1 to Level 2 of $23,977,066 and from Level 2 to Level 1 of $12,403,799, due to foreign fair value adjustments.
| | | | | | | | | | | | | | | | |
| | | Level 1 | | | Level 2 | | | Level 3 | | | Total | |
Equity Securities | | $ | 482,677,295 | | | $ | 23,977,066 | | | $ | — | | | $ | 506,654,361 | |
NOTE 4—Investments in Other Affiliates
The 1940 Act defines affiliates as those issuances in which a fund holds 5% or more of the outstanding voting securities. The Fund has not owned enough of the outstanding voting securities of the issuer to have control (as defined in the 1940 Act) of that issuer. The following is a summary of the investments in other affiliates for the year ended October 31, 2014.
| | | | | | | | | | | | | | | | | | | | | | | | | | | | |
| | | Value
10/31/13 | | | Purchases
at Cost | | | Proceeds
from Sales | | | Change in
Unrealized
Appreciation
(Depreciation) | | | Realized
Gain (Loss) | | | Value
10/31/14 | | | Interest/
Dividend
Income | |
Orion Marine Group, Inc. | | $ | 20,614,163 | | | $ | 2,246,137 | | | $ | — | | | $ | (2,206,465 | ) | | $ | — | | | $ | 20,653,835 | | | $ | — | |
Pike Corp. | | | 15,883,965 | | | | 3,031,294 | | | | — | | | | 2,621,421 | | | | — | | | | 21,536,680 | | | | — | |
Total | | $ | 36,498,128 | | | $ | 5,277,431 | | | $ | — | | | $ | 414,956 | | | $ | — | | | $ | 42,190,515 | | | $ | — | |
NOTE 5—Expense Offset Arrangement(s)
The expense offset arrangement is comprised of transfer agency credits which result from balances in demand deposit accounts used by the transfer agent for clearing shareholder transactions. For the year ended October 31, 2014, the Fund received credits from this arrangement, which resulted in the reduction of the Fund’s total expenses of $1,356.
NOTE 6—Trustees’ and Officers’ Fees and Benefits
Trustees’ and Officers’ Fees and Benefits include amounts accrued by the Fund to pay remuneration to certain Trustees and Officers of the Fund. Trustees have the option to defer compensation payable by the Fund, and Trustees’ and Officers’ Fees and Benefits also include amounts accrued by the Fund to fund such deferred compensation amounts. Those Trustees who defer compensation have the option to select various Invesco Funds in which their deferral accounts shall be deemed to be invested. Finally, certain current Trustees were eligible to participate in a retirement plan that provided for benefits to be paid upon retirement to Trustees over a period of time based on the number of years of service. The Fund may have certain former Trustees who also participate in a retirement plan and receive benefits under such plan. Trustees’ and Officers’ Fees and Benefits include amounts accrued by the Fund to fund such retirement benefits. Obligations under the deferred compensation and retirement plans represent unsecured claims against the general assets of the Fund.
16 Invesco Endeavor Fund
NOTE 7—Cash Balances
The Fund is permitted to temporarily carry a negative or overdrawn balance in its account with State Street Bank and Trust Company, the custodian bank. Such balances, if any at period end, are shown in the Statement of Assets and Liabilities under the payable caption Amount due custodian. To compensate the custodian bank for such overdrafts, the overdrawn Fund may either (1) leave funds as a compensating balance in the account so the custodian bank can be compensated by earning the additional interest; or (2) compensate by paying the custodian bank at a rate agreed upon by the custodian bank and Invesco, not to exceed the contractually agreed upon rate.
NOTE 8—Distributions to Shareholders and Tax Components of Net Assets
Tax Character of Distributions to Shareholders Paid During the Fiscal Years Ended October 31, 2014 and 2013:
| | | | | | | | |
| | | 2014 | | | 2013 | |
Ordinary income | | $ | 3,605,339 | | | $ | 13,904,060 | |
Long-term capital gain | | | 17,101,178 | | | | 12,752,152 | |
Total distributions | | $ | 20,706,517 | | | $ | 26,656,212 | |
Tax Components of Net Assets at Period-End:
| | | | |
| | | 2014 | |
Undistributed ordinary income | | $ | 3,639,056 | |
Undistributed long-term gain | | | 41,177,765 | |
Net unrealized appreciation — investments | | | 87,079,378 | |
Net unrealized appreciation (depreciation) — other investments | | | (6,473 | ) |
Temporary book/tax differences | | | (63,258 | ) |
Shares of beneficial interest | | | 375,194,472 | |
Total net assets | | $ | 507,020,940 | |
The difference between book-basis and tax-basis unrealized appreciation (depreciation) is due to differences in the timing of recognition of gains and losses on investments for tax and book purposes. The Fund’s net unrealized appreciation difference is attributable primarily to wash sales.
The temporary book/tax differences are a result of timing differences between book and tax recognition of income and/or expenses. The Fund’s temporary book/tax differences are the result of the trustee deferral of compensation and retirement plan benefits.
Capital loss carryforward is calculated and reported as of a specific date. Results of transactions and other activity after that date may affect the amount of capital loss carryforward actually available for the Fund to utilize. Capital losses generated in years beginning after December 22, 2010 can be carried forward for an unlimited period, whereas previous losses expire in 8 tax years. Capital losses with an expiration period may not be used to offset capital gains until all net capital losses without an expiration date have been utilized. Capital loss carryforwards with no expiration date will retain their character as either short-term or long-term capital losses instead of as short-term capital losses as under prior law. The ability to utilize capital loss carryforwards in the future may be limited under the Internal Revenue Code and related regulations based on the results of future transactions.
The Fund does not have a capital loss carryforward as of October 31, 2014.
NOTE 9—Investment Securities
The aggregate amount of investment securities (other than short-term securities, U.S. Treasury obligations and money market funds, if any) purchased and sold by the Fund during the year ended October 31, 2014 was $111,820,663 and $105,374,079, respectively. Cost of investments on a tax basis includes the adjustments for financial reporting purposes as of the most recently completed federal income tax reporting period-end.
| | | | |
| Unrealized Appreciation (Depreciation) of Investment Securities on a Tax Basis | |
Aggregate unrealized appreciation of investment securities | | $ | 115,147,569 | |
Aggregate unrealized (depreciation) of investment securities | | | (28,068,191 | ) |
Net unrealized appreciation of investment securities | | $ | 87,079,378 | |
Cost of investments for tax purposes is $419,574,983.
NOTE 10—Reclassification of Permanent Differences
Primarily as a result of differing book/tax treatment of net operating loss, on October 31, 2014, undistributed net investment income (loss) was increased by $3,558,546 and undistributed net realized gain was decreased by $3,558,546. This reclassification had no effect on the net assets of the Fund.
17 Invesco Endeavor Fund
NOTE 11—Share Information
| | | | | | | | | | | | | | | | |
| | | Summary of Share Activity | |
| | | Years ended October 31, | |
| | | 2014(a) | | | 2013 | |
| | | Shares | | | Amount | | | Shares | | | Amount | |
Sold: | | | | | | | | | | | | | | | | |
Class A | | | 2,202,819 | | | $ | 47,616,201 | | | | 4,356,681 | | | $ | 85,408,475 | |
Class B | | | 16,309 | | | | 322,237 | | | | 54,815 | | | | 1,005,463 | |
Class C | | | 625,657 | | | | 12,500,340 | | | | 1,227,762 | | | | 22,812,810 | |
Class R | | | 563,317 | | | | 11,918,520 | | | | 811,022 | | | | 15,729,271 | |
Class Y | | | 1,372,425 | | | | 30,187,144 | | | | 3,866,014 | | | | 76,762,205 | |
Class R5 | | | 1,479,829 | | | | 33,518,859 | | | | 859,635 | | | | 17,271,215 | |
Class R6 | | | 612,303 | | | | 13,557,403 | | | | 559,098 | | | | 11,748,286 | |
| | | | |
Issued as reinvestment of dividends: | | | | | | | | | | | | | | | | |
Class A | | | 337,777 | | | | 6,877,134 | | | | 555,806 | | | | 9,391,123 | |
Class B | | | 12,504 | | | | 236,332 | | | | 36,662 | | | | 580,516 | |
Class C | | | 105,401 | | | | 1,993,123 | | | | 164,582 | | | | 2,607,694 | |
Class R | | | 74,491 | | | | 1,486,839 | | | | 140,695 | | | | 2,336,366 | |
Class Y | | | 106,184 | | | | 2,189,519 | | | | 96,467 | | | | 1,650,165 | |
Class R5 | | | 54,806 | | | | 1,149,279 | | | | 63,222 | | | | 1,098,656 | |
Class R6 | | | 194,812 | | | | 4,087,168 | | | | 410,759 | | | | 7,142,217 | |
| | | | |
Automatic conversion of Class B shares to Class A shares: | | | | | | | | | | | | | | | | |
Class A | | | 45,124 | | | | 978,925 | | | | 85,727 | | | | 1,661,640 | |
Class B | | | (48,729 | ) | | | (978,925 | ) | | | (91,623 | ) | | | (1,661,640 | ) |
| | | | |
Reacquired: | | | | | | | | | | | | | | | | |
Class A | | | (2,589,180 | ) | | | (56,244,485 | ) | | | (2,108,945 | ) | | | (41,166,093 | ) |
Class B | | | (46,881 | ) | | | (933,808 | ) | | | (60,796 | ) | | | (1,113,855 | ) |
Class C | | | (659,583 | ) | | | (13,210,361 | ) | | | (437,455 | ) | | | (8,017,857 | ) |
Class R | | | (732,292 | ) | | | (15,583,515 | ) | | | (595,762 | ) | | | (11,267,726 | ) |
Class Y | | | (2,646,470 | ) | | | (57,099,431 | ) | | | (881,698 | ) | | | (17,626,623 | ) |
Class R5 | | | (864,925 | ) | | | (19,388,682 | ) | | | (370,412 | ) | | | (7,390,693 | ) |
Class R6 | | | (637,396 | ) | | | (14,570,365 | ) | | | (834,198 | ) | | | (16,384,491 | ) |
Net increase (decrease) in share activity | | | (421,698 | ) | | $ | (9,390,549 | ) | | | 7,908,058 | | | $ | 152,577,124 | |
| (a) | There are entities that are record owners of more than 5% of the outstanding shares of the Fund and in the aggregate own 13% of the outstanding shares of the Fund. IDI has an agreement with these entities to sell Fund shares. The Fund, Invesco and/or Invesco affiliates may make payments to these entities, which are considered to be related to the Fund, for providing services to the Fund, Invesco and/or Invesco affiliates including but not limited to services such as securities brokerage, distribution, third party record keeping and account servicing. The Fund has no knowledge as to whether all or any portion of the shares owned of record by these entities are also owned beneficially. |
| | In addition, 18% of the outstanding shares of the Fund are owned by affiliated mutual funds. Affiliated mutual funds are other mutual funds that are also advised by Invesco. |
18 Invesco Endeavor Fund
NOTE 12—Financial Highlights
The following schedule presents financial highlights for a share of the Fund outstanding throughout the periods indicated.
| | | | | | | | | | | | | | | | | | | | | | | | | | | | | | | | | | | | | | | | | | | | | | | | | | | | | | | | |
| | | Net asset
value,
beginning
of period | | | Net
investment
income
(loss)(a) | | | Net gains
(losses)
on securities
(both
realized and
unrealized) | | | Total from
investment
operations | | | Dividends
from net
investment
income | | | Distributions
from net
realized
gains | | | Total
distributions | | | Net asset
value, end
of period | | | Total
return(b) | | | Net assets,
end of period
(000’s omitted) | | | Ratio of
expenses
to average
net assets
with fee waivers
and/or expenses
absorbed | | | Ratio of
expenses
to average net
assets without
fee waivers
and/or expenses
absorbed | | | Ratio of net
investment
income (loss)
to average
net assets | | | Portfolio
turnover(c) | |
Class A | | | | | | | | | | | | | | | | | | | | | | | | | | | | | | | | | | | | | | | | | | | | | | | | | | | | | | | | |
Year ended 10/31/14 | | $ | 21.18 | | | $ | (0.09 | ) | | $ | 2.35 | | | $ | 2.26 | | | $ | (0.01 | ) | | $ | (0.86 | ) | | $ | (0.87 | ) | | $ | 22.57 | | | | 11.13 | % | | $ | 192,326 | | | | 1.26 | %(d) | | | 1.29 | %(d) | | | (0.43 | )%(d) | | | 27 | % |
Year ended 10/31/13 | | | 18.19 | | | | (0.00 | ) | | | 4.78 | | | | 4.78 | | | | (0.06 | ) | | | (1.73 | ) | | | (1.79 | ) | | | 21.18 | | | | 28.78 | | | | 180,568 | | | | 1.26 | | | | 1.30 | | | | (0.02 | ) | | | 20 | |
Year ended 10/31/12 | | | 16.36 | | | | (0.08 | ) | | | 1.98 | | | | 1.90 | | | | — | | | | (0.07 | ) | | | (0.07 | ) | | | 18.19 | | | | 11.70 | | | | 102,508 | | | | 1.34 | | | | 1.37 | | | | (0.41 | ) | | | 37 | |
Year ended 10/31/11 | | | 14.78 | | | | (0.08 | ) | | | 1.66 | | | | 1.58 | | | | — | | | | — | | | | — | | | | 16.36 | | | | 10.69 | | | | 91,975 | | | | 1.34 | | | | 1.37 | | | | (0.49 | ) | | | 30 | |
Year ended 10/31/10 | | | 12.51 | | | | (0.05 | ) | | | 2.32 | | | | 2.27 | | | | — | | | | — | | | | — | | | | 14.78 | | | | 18.15 | | | | 81,536 | | | | 1.45 | | | | 1.47 | | | | (0.36 | ) | | | 38 | |
Class B | |
Year ended 10/31/14 | | | 19.74 | | | | (0.24 | ) | | | 2.18 | | | | 1.94 | | | | — | | | | (0.86 | ) | | | (0.86 | ) | | | 20.82 | | | | 10.27 | | | | 4,855 | | | | 2.01 | (d) | | | 2.04 | (d) | | | (1.18 | )(d) | | | 27 | |
Year ended 10/31/13 | | | 17.16 | | | | (0.14 | ) | | | 4.49 | | | | 4.35 | | | | (0.04 | ) | | | (1.73 | ) | | | (1.77 | ) | | | 19.74 | | | | 27.89 | | | | 5,921 | | | | 2.01 | | | | 2.05 | | | | (0.77 | ) | | | 20 | |
Year ended 10/31/12 | | | 15.55 | | | | (0.19 | ) | | | 1.87 | | | | 1.68 | | | | — | | | | (0.07 | ) | | | (0.07 | ) | | | 17.16 | | | | 10.89 | | | | 6,195 | | | | 2.09 | | | | 2.12 | | | | (1.16 | ) | | | 37 | |
Year ended 10/31/11 | | | 14.16 | | | | (0.20 | ) | | | 1.59 | | | | 1.39 | | | | — | | | | — | | | | — | | | | 15.55 | | | | 9.82 | | | | 7,542 | | | | 2.09 | | | | 2.12 | | | | (1.24 | ) | | | 30 | |
Year ended 10/31/10 | | | 12.07 | | | | (0.15 | ) | | | 2.24 | | | | 2.09 | | | | — | | | | — | | | | — | | | | 14.16 | | | | 17.32 | | | | 9,025 | | | | 2.20 | | | | 2.22 | | | | (1.11 | ) | | | 38 | |
Class C | |
Year ended 10/31/14 | | | 19.75 | | | | (0.24 | ) | | | 2.18 | | | | 1.94 | | | | — | | | | (0.86 | ) | | | (0.86 | ) | | | 20.83 | | | | 10.27 | | | | 53,542 | | | | 2.01 | (d) | | | 2.04 | (d) | | | (1.18 | )(d) | | | 27 | |
Year ended 10/31/13 | | | 17.17 | | | | (0.14 | ) | | | 4.49 | | | | 4.35 | | | | (0.04 | ) | | | (1.73 | ) | | | (1.77 | ) | | | 19.75 | | | | 27.87 | | | | 49,344 | | | | 2.01 | | | | 2.05 | | | | (0.77 | ) | | | 20 | |
Year ended 10/31/12 | | | 15.56 | | | | (0.19 | ) | | | 1.87 | | | | 1.68 | | | | — | | | | (0.07 | ) | | | (0.07 | ) | | | 17.17 | | | | 10.88 | | | | 26,513 | | | | 2.09 | | | | 2.12 | | | | (1.16 | ) | | | 37 | |
Year ended 10/31/11 | | | 14.17 | | | | (0.20 | ) | | | 1.59 | | | | 1.39 | | | | — | | | | — | | | | — | | | | 15.56 | | | | 9.81 | | | | 20,710 | | | | 2.09 | | | | 2.12 | | | | (1.24 | ) | | | 30 | |
Year ended 10/31/10 | | | 12.08 | | | | (0.15 | ) | | | 2.24 | | | | 2.09 | | | | — | | | | — | | | | — | | | | 14.17 | | | | 17.30 | | | | 19,436 | | | | 2.20 | | | | 2.22 | | | | (1.11 | ) | | | 38 | |
Class R | |
Year ended 10/31/14 | | | 20.77 | | | | (0.14 | ) | | | 2.31 | | | | 2.17 | | | | — | | | | (0.86 | ) | | | (0.86 | ) | | | 22.08 | | | | 10.89 | | | | 34,634 | | | | 1.51 | (d) | | | 1.54 | (d) | | | (0.68 | )(d) | | | 27 | |
Year ended 10/31/13 | | | 17.91 | | | | (0.05 | ) | | | 4.69 | | | | 4.64 | | | | (0.05 | ) | | | (1.73 | ) | | | (1.78 | ) | | | 20.77 | | | | 28.43 | | | | 34,556 | | | | 1.51 | | | | 1.55 | | | | (0.27 | ) | | | 20 | |
Year ended 10/31/12 | | | 16.14 | | | | (0.11 | ) | | | 1.95 | | | | 1.84 | | | | — | | | | (0.07 | ) | | | (0.07 | ) | | | 17.91 | | | | 11.49 | | | | 23,412 | | | | 1.59 | | | | 1.62 | | | | (0.66 | ) | | | 37 | |
Year ended 10/31/11 | | | 14.63 | | | | (0.12 | ) | | | 1.63 | | | | 1.51 | | | | — | | | | — | | | | — | | | | 16.14 | | | | 10.32 | | | | 14,721 | | | | 1.59 | | | | 1.62 | | | | (0.74 | ) | | | 30 | |
Year ended 10/31/10 | | | 12.40 | | | | (0.08 | ) | | | 2.31 | | | | 2.23 | | | | — | | | | — | | | | — | | | | 14.63 | | | | 17.98 | | | | 12,850 | | | | 1.70 | | | | 1.72 | | | | (0.61 | ) | | | 38 | |
Class Y | |
Year ended 10/31/14 | | | 21.48 | | | | (0.04 | ) | | | 2.38 | | | | 2.34 | | | | (0.05 | ) | | | (0.86 | ) | | | (0.91 | ) | | | 22.91 | | | | 11.39 | | | | 71,898 | | | | 1.01 | (d) | | | 1.04 | (d) | | | (0.18 | )(d) | | | 27 | |
Year ended 10/31/13 | | | 18.38 | | | | 0.05 | | | | 4.84 | | | | 4.89 | | | | (0.06 | ) | | | (1.73 | ) | | | (1.79 | ) | | | 21.48 | | | | 29.15 | | | | 92,483 | | | | 1.01 | | | | 1.05 | | | | 0.23 | | | | 20 | |
Year ended 10/31/12 | | | 16.49 | | | | (0.03 | ) | | | 1.99 | | | | 1.96 | | | | — | | | | (0.07 | ) | | | (0.07 | ) | | | 18.38 | | | | 11.97 | | | | 22,529 | | | | 1.09 | | | | 1.12 | | | | (0.16 | ) | | | 37 | |
Year ended 10/31/11 | | | 14.86 | | | | (0.04 | ) | | | 1.67 | | | | 1.63 | | | | — | | | | — | | | | — | | | | 16.49 | | | | 10.97 | | | | 5,802 | | | | 1.09 | | | | 1.12 | | | | (0.24 | ) | | | 30 | |
Year ended 10/31/10 | | | 12.55 | | | | (0.01 | ) | | | 2.32 | | | | 2.31 | | | | — | | | | — | | | | — | | | | 14.86 | | | | 18.41 | | | | 4,150 | | | | 1.20 | | | | 1.22 | | | | (0.11 | ) | | | 38 | |
Class R5 | |
Year ended 10/31/14 | | | 21.84 | | | | (0.02 | ) | | | 2.43 | | | | 2.41 | | | | (0.07 | ) | | | (0.86 | ) | | | (0.93 | ) | | | 23.32 | | | | 11.51 | | | | 49,356 | | | | 0.90 | (d) | | | 0.93 | (d) | | | (0.07 | )(d) | | | 27 | |
Year ended 10/31/13 | | | 18.65 | | | | 0.07 | | | | 4.92 | | | | 4.99 | | | | (0.07 | ) | | | (1.73 | ) | | | (1.80 | ) | | | 21.84 | | | | 29.24 | | | | 31,593 | | | | 0.91 | | | | 0.95 | | | | 0.33 | | | | 20 | |
Year ended 10/31/12 | | | 16.69 | | | | 0.01 | | | | 2.02 | | | | 2.03 | | | | — | | | | (0.07 | ) | | | (0.07 | ) | | | 18.65 | | | | 12.25 | | | | 16,677 | | | | 0.87 | | | | 0.90 | | | | 0.06 | | | | 37 | |
Year ended 10/31/11 | | | 15.01 | | | | 0.00 | | | | 1.68 | | | | 1.68 | | | | — | | | | — | | | | — | | | | 16.69 | | | | 11.19 | | | | 87,733 | | | | 0.85 | | | | 0.88 | | | | 0.00 | | | | 30 | |
Year ended 10/31/10 | | | 12.62 | | | | 0.02 | | | | 2.37 | | | | 2.39 | | | | — | | | | — | | | | — | | | | 15.01 | | | | 18.94 | | | | 75,795 | | | | 0.94 | | | | 0.96 | | | | 0.16 | | | | 38 | |
Class R6 | |
Year ended 10/31/14 | | | 21.86 | | | | 0.01 | | | | 2.42 | | | | 2.43 | | | | (0.08 | ) | | | (0.86 | ) | | | (0.94 | ) | | | 23.35 | | | | 11.62 | | | | 100,410 | | | | 0.81 | (d) | | | 0.84 | (d) | | | 0.02 | (d) | | | 27 | |
Year ended 10/31/13 | | | 18.65 | | | | 0.08 | | | | 4.93 | | | | 5.01 | | | | (0.07 | ) | | | (1.73 | ) | | | (1.80 | ) | | | 21.86 | | | | 29.37 | | | | 90,291 | | | | 0.82 | | | | 0.86 | | | | 0.42 | | | | 20 | |
Year ended 10/31/12(e) | | | 18.97 | | | | 0.00 | | | | (0.32 | ) | | | (0.32 | ) | | | — | | | | — | | | | — | | | | 18.65 | | | | (1.69 | ) | | | 74,513 | | | | 0.83 | (f) | | | 0.86 | (f) | | | 0.10 | (f) | | | 37 | |
| (a) | Calculated using average shares outstanding. |
| (b) | Includes adjustments in accordance with accounting principles generally accepted in the United States of America and as such, the net asset value for financial reporting purposes and the returns based upon those net asset values may differ from the net asset value and returns for shareholder transactions. Does not include sales charges and is not annualized for periods less than one year, if applicable. |
| (c) | Portfolio turnover is calculated at the fund level and is not annualized for periods less than one year, if applicable. |
| (d) | Ratios are based on average daily net assets (000’s omitted) of $191,340, $5,412, $52,082, $36,284, $73,549, $39,981 and $99,175 for Class A, Class B, Class C, Class R, Class Y, Class R5 and Class R6 shares, respectively. |
| (e) | Commencement date of September 24, 2012. |
19 Invesco Endeavor Fund
Report of Independent Registered Public Accounting Firm
To the Board of Trustees of AIM Investment Funds (Invesco Investment Funds)
and Shareholders of Invesco Endeavor Fund:
In our opinion, the accompanying statement of assets and liabilities, including the schedule of investments, and the related statements of operations and of changes in net assets and the financial highlights present fairly, in all material respects, the financial position of Invesco Endeavor Fund (one of the funds constituting AIM Investment Funds (Invesco Investment Funds), hereafter referred to as the “Fund”) at October 31, 2014, the results of its operations for the year then ended, the changes in its net assets for each of the two years in the period then ended and the financial highlights for each of the five years in the period then ended, in conformity with accounting principles generally accepted in the United States of America. These financial statements and financial highlights (hereafter referred to as “financial statements”) are the responsibility of the Fund’s management. Our responsibility is to express an opinion on these financial statements based on our audits. We conducted our audits of these financial statements in accordance with the standards of the Public Company Accounting Oversight Board (United States). Those standards require that we plan and perform the audit to obtain reasonable assurance about whether the financial statements are free of material misstatement. An audit includes examining, on a test basis, evidence supporting the amounts and disclosures in the financial statements, assessing the accounting principles used and significant estimates made by management, and evaluating the overall financial statement presentation. We believe that our audits, which included confirmation of securities at October 31, 2014 by correspondence with the custodian, provide a reasonable basis for our opinion.
PRICEWATERHOUSECOOPERS LLP
December 23, 2014
Houston, Texas
20 Invesco Endeavor Fund
Calculating your ongoing Fund expenses
Example
As a shareholder of the Fund, you incur two types of costs: (1) transaction costs, which may include sales charges (loads) on purchase payments or contingent deferred sales charges on redemptions, if any; and (2) ongoing costs, including management fees, distribution and/or service (12b-1) fees, and other Fund expenses. This example is intended to help you understand your ongoing costs (in dollars) of investing in the Fund and to compare these costs with ongoing costs of investing in other mutual funds. The example is based on an investment of $1,000 invested at the beginning of the period and held for the entire period May 1, 2014 through October 31, 2014.
Actual expenses
The table below provides information about actual account values and actual expenses. You may use the information in this table, together with the amount you invested, to estimate the expenses that you paid over the period. Simply divide your account value by $1,000 (for example, an $8,600 account value divided by $1,000 = 8.6), then multiply the result by the number in the table under the heading entitled “Actual Expenses Paid During Period” to estimate the expenses you paid on your account during this period.
Hypothetical example for comparison purposes
The table below also provides information about hypothetical account values and hypothetical expenses based on the Fund’s actual expense ratio and an assumed rate of return of 5% per year before expenses, which is not the Fund’s actual return.
The hypothetical account values and expenses may not be used to estimate the actual ending account balance or expenses you paid for the period. You may use this information to compare the ongoing costs of investing in the Fund and other funds. To do so, compare this 5% hypothetical example with the 5% hypothetical examples that appear in the shareholder reports of the other funds.
Please note that the expenses shown in the table are meant to highlight your ongoing costs only and do not reflect any transaction costs, such as sales charges (loads) on purchase payments or contingent deferred sales charges on redemptions, if any. Therefore, the hypothetical information is useful in comparing ongoing costs only, and will not help you determine the relative total costs of owning different funds. In addition, if these transaction costs were included, your costs would have been higher.
| | | | | | | | | | | | | | | | | | | | | | | | |
| Class | | Beginning
Account Value
(05/01/14) | | | ACTUAL | | | HYPOTHETICAL (5% annual return before
expenses) | | | Annualized
Expense
Ratio | |
| | | Ending
Account Value
(10/31/14)1 | | | Expenses
Paid During
Period2 | | | Ending
Account Value
(10/31/14) | | | Expenses
Paid During
Period2 | | |
| A | | $ | 1,000.00 | | | $ | 1,036.80 | | | $ | 6.52 | | | $ | 1,018.80 | | | $ | 6.46 | | | | 1.27 | % |
| B | | | 1,000.00 | | | | 1,032.70 | | | | 10.35 | | | | 1,015.02 | | | | 10.26 | | | | 2.02 | |
| C | | | 1,000.00 | | | | 1,032.70 | | | | 10.35 | | | | 1,015.02 | | | | 10.26 | | | | 2.02 | |
| R | | | 1,000.00 | | | | 1,035.60 | | | | 7.80 | | | | 1,017.54 | | | | 7.73 | | | | 1.52 | |
| Y | | | 1,000.00 | | | | 1,038.10 | | | | 5.24 | | | | 1,020.06 | | | | 5.19 | | | | 1.02 | |
| R5 | | | 1,000.00 | | | | 1,038.30 | | | | 4.62 | | | | 1,020.67 | | | | 4.58 | | | | 0.90 | |
| R6 | | | 1,000.00 | | | | 1,038.70 | | | | 4.16 | | | | 1,021.12 | | | | 4.13 | | | | 0.81 | |
| 1 | The actual ending account value is based on the actual total return of the Fund for the period May 1, 2014 through October 31, 2014, after actual expenses and will differ from the hypothetical ending account value which is based on the Fund’s expense ratio and a hypothetical annual return of 5% before expenses. |
| 2 | Expenses are equal to the Fund’s annualized expense ratio as indicated above multiplied by the average account value over the period, multiplied by 184/365 to reflect the most recent fiscal half year. |
21 Invesco Endeavor Fund
Approval of Investment Advisory and Sub-Advisory Contracts
The Board of Trustees (the Board) of AIM Investment Funds (Invesco Investment Funds) is required under the Investment Company Act of 1940, as amended, to approve annually the renewal of Invesco Endeavor Fund’s (the Fund) investment advisory agreements. During contract renewal meetings held on June 16-17, 2014, the Board as a whole, and the disinterested or “independent” Trustees, who comprise over 75% of the Board, voting separately, approved the continuance for the Fund of the Master Investment Advisory Agreement with Invesco Advisers, Inc. (Invesco Advisers and the investment advisory agreement) and the Master Intergroup Sub-Advisory Contract for Mutual Funds with Invesco Asset Management Deutschland GmbH, Invesco Asset Management Limited, Invesco Asset Management (Japan) Limited, Invesco Australia Limited, Invesco Hong Kong Limited, Invesco Senior Secured Management, Inc. and Invesco Canada Ltd. (collectively, the Affiliated Sub-Advisers and the sub-advisory contracts) for another year, effective July 1, 2014.
In evaluating the fairness and reasonableness of compensation under the Fund’s investment advisory agreement and sub-advisory contracts, the Board considered, among other things, the factors discussed below. The Board determined that continuation of the Fund’s investment advisory agreement and the sub-advisory contracts are in the best interest of the Fund and its shareholders and that the compensation payable to Invesco Advisers and the Affiliated Sub-Advisers under the agreements is fair and reasonable.
The Board’s Fund Evaluation Process
The Board’s Investments Committee has established three Sub-Committees, each of which is primarily responsible for overseeing the management of a number of the funds advised by Invesco Advisers (the Invesco Funds). The Sub-Committees meet throughout the year to review the performance of their assigned Invesco Funds, including reviewing materials prepared under the direction of the independent Senior Officer, an officer of the Invesco Funds who reports directly to the independent Trustees. Over the course of each year, the Sub-Committees meet with portfolio managers for their assigned Invesco Funds and other members of management to review the performance, investment objective(s), policies, strategies, limitations and investment risks of these funds. The Sub-Committees meet regularly and at designated contract renewal meetings each year to conduct a review of the performance, fees, expenses and other matters related to their assigned Invesco Funds. Each Sub-Committee recommends to the Investments Committee, which in turn recommends to the full Board, whether and on what terms to approve the continuance of each Invesco Fund’s
investment advisory agreement and sub-advisory contracts for another year.
During the contract renewal process, the Trustees receive comparative performance and fee data regarding the Invesco Funds prepared by Invesco Advisers and Lipper Inc. (Lipper), an independent provider of investment company data. The Trustees also receive an independent written evaluation from the Senior Officer. The Senior Officer’s evaluation is prepared as part of his responsibility to manage the process by which the Invesco Funds’ proposed management fees are negotiated during the annual contract renewal process to ensure they are negotiated in a manner that is at arms’ length and reasonable. In addition to meetings with Invesco Advisers and fund counsel, the independent Trustees also discuss the continuance of the investment advisory agreement and sub-advisory contracts in separate sessions with the Senior Officer and with independent legal counsel.
The Trustees recognized that the advisory fee rates for the Invesco Funds are, in many cases, the result of years of review and negotiation. The Trustees’ deliberations and conclusions in a particular year may be based in part on their deliberations and conclusions regarding these same arrangements throughout the year and in prior years. The Trustees’ review and conclusions are based on the comprehensive consideration of all information presented to them and are not the result of any single determinative factor. Moreover, one Trustee may have weighed a particular piece of information or factor differently than another Trustee.
The discussion below serves as the Senior Officer’s independent written evaluation with respect to the Fund’s investment advisory agreement as well as a discussion of the material factors and related conclusions that formed the basis for the Board’s approval of the Fund’s investment advisory agreement and sub-advisory contracts. Unless otherwise stated, this information is current as of June 17, 2014, and may not reflect consideration of factors that became known to the Board after that date.
Factors and Conclusions and Summary of Independent Written Fee Evaluation
| A. | Nature, Extent and Quality of Services Provided by Invesco Advisers and the Affiliated Sub-Advisers |
The Board reviewed the advisory services provided to the Fund by Invesco Advisers under the Fund’s investment advisory agreement, the performance of Invesco Advisers in providing these services, and the credentials and experience of the officers and employees of Invesco Advisers who provide these services, including the Fund’s portfolio manager or managers, with whom the Sub-Committees met during the year. The Board’s review of the
qualifications of Invesco Advisers to provide advisory services included the Board’s consideration of Invesco Advisers’ investment process oversight, independent credit analysis and investment risk management. The Board also considered non-advisory services that Invesco Advisers and its affiliates provide to the Invesco Funds such as various back office support functions, equity and fixed income trading operations, internal audit, distribution and legal and compliance.
In determining whether to continue the Fund’s investment advisory agreement, the Board considered the benefits of reapproving an existing relationship and the greater uncertainty that may be associated with entering into a new relationship. The Board concluded that the nature, extent and quality of the services provided to the Fund by Invesco Advisers are appropriate and satisfactory and consistent with the terms of the Fund’s investment advisory agreement.
The Board reviewed the services that may be provided by the Affiliated Sub-Advisers under the sub-advisory contracts and the credentials and experience of the officers and employees of the Affiliated Sub-Advisers who provide these services. The Board noted that the Affiliated Sub-Advisers have offices and personnel that are located in financial centers around the world. As a result, the Affiliated Sub-Advisers can provide research and investment analysis on the markets and economies of various countries in which the Fund may invest, make recommendations regarding securities and assist with security trades. The Board concluded that the sub-advisory contracts benefit the Fund and its shareholders by permitting Invesco Advisers to use the resources and talents of the Affiliated Sub-Advisers in managing the Fund. The Board concluded that the nature, extent and quality of the services that may be provided by the Affiliated Sub-Advisers are appropriate and satisfactory and consistent with the terms of the Fund’s sub-advisory contracts.
The Board considered Fund performance as a relevant factor in considering whether to approve the investment advisory agreement as well as the sub-advisory contracts for the Fund, as Invesco Canada Ltd. currently manages assets of the Fund.
The Board compared the Fund’s performance during the past one, three and five calendar years to the performance of funds in the Lipper performance universe and against the Lipper Mid-Cap Core Funds Index. The Board noted that performance of Class A shares of the Fund was in the fifth quintile of its performance universe for the one year period, the fourth quintile for the three year period and the first quintile for the five year period (the first quintile being the best performing funds and the fifth quintile being the worst performing funds). The Board
22 Invesco Endeavor Fund
noted that performance of Class A shares of the Fund was below the performance of the Index for the one year period and above the performance of the Index for the three and five year periods. The Trustees also reviewed more recent Fund performance and this review did not change their conclusions.
| C. | Advisory and Sub-Advisory Fees |
The Board compared the Fund’s contractual management fee rate to the contractual management fee rates of funds in the Fund’s Lipper expense group at a common asset level. The Board noted that the contractual management fee rate for Class A shares of the Fund was below the median contractual management fee rate of funds in the expense group. The Board noted that the term “contractual management fee” may include both advisory and certain administrative services fees, but that Lipper does not provide information on a fund by fund basis as to what is included. The Board noted that Invesco Advisers does not charge the Invesco Funds for the administrative services included in the term as defined by Lipper. The Board also reviewed the methodology used by Lipper in providing expense group information, which includes using each fund’s contractual management fee schedule (including any applicable breakpoints) as reported in the most recent prospectus or statement of additional information for each fund in the expense group.
The Board noted that Invesco Advisers has contractually agreed to waive fees and/or limit expenses of the Fund through at least June 30, 2015 in an amount necessary to limit total annual operating expenses to a specified percentage of average daily net assets for each class of the Fund.
The Board noted that Invesco Advisers and the Affiliated Sub-Advisers do not advise other mutual funds or client accounts that are managed using an investment process substantially similar to the investment process used for the Fund.
The Board also considered the services provided by the Affiliated Sub-Advisers pursuant to the sub-advisory contracts, as well as the fees payable by Invesco Advisers to the Affiliated Sub-Advisers pursuant to the sub-advisory contracts. The Board noted that Invesco Advisers retains overall responsibility for, and provides services to, sub-advised Invesco Funds, including oversight of the Affiliated Sub-Advisers as well as the additional services described herein other than day-to-day portfolio management. The Board also noted that the sub-advisory fees are not paid directly by the Fund, but rather, are payable by Invesco Advisers to the Affiliated Sub-Advisers.
| D. | Economies of Scale and Breakpoints |
The Board considered the extent to which there are economies of scale in the provision of advisory services to the Fund. The Board also considered whether the Fund benefits from economies of scale through contractual breakpoints in the Fund’s advisory fee schedule and was assisted in this review by a report from
the Senior Officer. The Board also noted that the Fund shares directly in economies of scale through lower fees charged by third party service providers based on the combined size of the Invesco Funds and other clients advised by Invesco Advisers.
| E. | Profitability and Financial Resources |
The Board reviewed information from Invesco Advisers concerning the costs of the advisory and other services that Invesco Advisers and its affiliates provide to the Fund and the profitability of Invesco Advisers and its affiliates in providing these services for the year ended December 31, 2013. The Board received information from Invesco Advisers about the methodology used to prepare the profitability information. The Board considered the profitability of Invesco Advisers in managing the Fund and the Invesco Funds. The Board noted that Invesco Advisers continues to operate at a net profit from services Invesco Advisers and its subsidiaries provide to the Invesco Funds and the Fund. The Board did not deem the level of profits realized by Invesco Advisers and its affiliates from providing services to the Fund to be excessive given the nature, quality and extent of the services provided to the Invesco Funds. The Board received and accepted information from Invesco Advisers demonstrating that Invesco Advisers and each Affiliated Sub-Adviser are financially sound and have the resources necessary to perform their obligations under the investment advisory agreement and sub-advisory contracts.
| F. | Collateral Benefits to Invesco Advisers and its Affiliates |
The Board considered various other benefits received by Invesco Advisers and its affiliates from the relationship with the Fund, including the fees received for their provision of transfer agency and distribution services to the Fund. The Board considered comparative information regarding fees charged for these services, including information provided by Lipper and other independent sources. The Board considered the performance of Invesco Advisers and its affiliates in providing these services and the organizational structure employed to provide these services. The Board also considered that these services are provided to the Fund pursuant to written contracts that are reviewed and approved on an annual basis by the Board; that the services are required for the operation of the Fund; that Invesco Advisers and its affiliates can provide services, the nature and quality of which are at least equal to those provided by others offering the same or similar services; and that the fees for such services are fair and reasonable in light of the usual and customary charges by others for services of the same nature and quality.
The Board considered the benefits realized by Invesco Advisers and the Affiliated Sub-Advisers as a result of portfolio brokerage transactions executed through “soft dollar” arrangements. The Board noted that soft dollar arrangements shift the payment obligation for research services from Invesco Advisers and the
Affiliated Sub-Advisers to the Invesco Funds and that the research received may be used with other clients of Invesco Advisers and may reduce Invesco Advisers’ and the Affiliated Sub-Advisers’ expenses. The Board also considered that it receives periodic reports from the Chief Compliance Officer of the Invesco Funds demonstrating that these arrangements are consistent with regulatory requirements. The Board did not deem the soft dollar arrangements to be inappropriate.
The Board considered that the Fund’s uninvested cash and cash collateral from any securities lending arrangements may be invested in money market funds advised by Invesco Advisers pursuant to procedures approved by the Board. The Board noted that Invesco Advisers receives advisory fees from these affiliated money market funds attributable to such investments, although Invesco Advisers has contractually agreed to waive through varying periods the advisory fees payable by the Invesco Funds with respect to investments in the affiliated money market funds. The waiver is in an amount equal to 100% of the net advisory fee Invesco Advisers receives from the affiliated money market funds with respect to the Fund’s investment in the affiliated money market funds of uninvested cash, but not cash collateral. The Board concluded that the amount of advisory fees received by Invesco Advisors from the Fund’s investment of uninvested cash and cash collateral from any securities lending arrangements in the affiliated money market funds are fair and reasonable.
The Board also considered the Fund may use an affiliated broker to execute certain trades for the Fund to among other things, control information leakage, and were advised that such trades would be executed in compliance with rules under the Investment Company Act of 1940, as amended.
23 Invesco Endeavor Fund
Tax Information
Form 1099-DIV, Form 1042-S and other year–end tax information provide shareholders with actual calendar year amounts that should be included in their tax returns. Shareholders should consult their tax advisors.
The following distribution information is being provided as required by the Internal Revenue Code or to meet a specific state’s requirement.
The Fund designates the following amounts or, if subsequently determined to be different, the maximum amount allowable for its fiscal year ended October 31, 2014:
| | | | |
Federal and State Income Tax | |
Long-Term Capital Gain Distributions | | $ | 17,101,178 | |
Qualified Dividend Income* | | | 100.00 | % |
Corporate Dividends Received Deduction* | | | 67.00 | % |
U.S. Treasury Obligations* | | | 0.00 | % |
| | * | The above percentages are based on ordinary income dividends paid to shareholders during the Fund’s fiscal year. |
| | | | |
Non-Resident Alien Shareholders | |
Qualified Short-Term Gains | | $ | 2,809,357 | |
24 Invesco Endeavor Fund
Trustees and Officers
The address of each trustee and officer is AIM Investment Funds (Invesco Investment Funds) (the “Trust”), 11 Greenway Plaza, Suite 1000, Houston, Texas 77046-1173. The trustees serve for the life of the Trust, subject to their earlier death, incapacitation, resignation, retirement or removal as more specifically provided in the Trust’s organizational documents. Each officer serves for a one year term or until their successors are elected and qualified. Column two below includes length of time served with predecessor entities, if any.
| | | | | | | | |
Name, Year of Birth and Position(s) Held with the Trust | | Trustee and/
or Officer Since | | Principal Occupation(s) During Past 5 Years | | Number of Funds in Fund Complex Overseen by Trustee | | Other Directorship(s) Held by Trustee During Past 5 Years |
| Interested Persons | | | | | | | | |
| Martin L. Flanagan1 — 1960 Trustee | | 2007 | | Executive Director, Chief Executive Officer and President, Invesco Ltd. (ultimate parent of Invesco and a global investment management firm); Advisor to the Board, Invesco Advisers, Inc. (formerly known as Invesco Institutional (N.A.), Inc.); Trustee, The Invesco Funds; Vice Chair, Investment Company Institute; and Member of Executive Board, SMU Cox School of Business Formerly: Chairman and Chief Executive Officer, Invesco Advisers, Inc. (registered investment adviser); Director, Chairman, Chief Executive Officer and President, IVZ Inc. (holding company), INVESCO Group Services, Inc. (service provider) and Invesco North American Holdings, Inc. (holding company); Director, Chief Executive Officer and President, Invesco Holding Company Limited (parent of Invesco and a global investment management firm); Director, Invesco Ltd.; Chairman, Investment Company Institute and President, Co-Chief Executive Officer, Co-President, Chief Operating Officer and Chief Financial Officer, Franklin Resources, Inc. (global investment management organization). | | 144 | | None |
Philip A. Taylor2 — 1954 Trustee, President and Principal Executive Officer | | 2006 | | Head of North American Retail and Senior Managing Director, Invesco Ltd.; Director, Co-Chairman, Co-President and Co-Chief Executive Officer, Invesco Advisers, Inc. (formerly known as Invesco Institutional (N.A.), Inc.) (registered investment adviser); Director, Chairman, Chief Executive Officer and President, Invesco Management Group, Inc. (formerly known as Invesco Aim Management Group, Inc.) (financial services holding company); Director and President, INVESCO Funds Group, Inc. (registered investment adviser and registered transfer agent); Director and Chairman, Invesco Investment Services, Inc. (formerly known as Invesco Aim Investment Services, Inc.) (registered transfer agent) and IVZ Distributors, Inc. (formerly known as INVESCO Distributors, Inc.) (registered broker dealer); Director, President and Chairman, Invesco Inc. (holding company) and Invesco Canada Holdings Inc. (holding company); Chief Executive Officer, Invesco Corporate Class Inc. (corporate mutual fund company) and Invesco Canada Fund Inc. (corporate mutual fund company); Director, Chairman and Chief Executive Officer, Invesco Canada Ltd. (formerly known as Invesco Trimark Ltd./Invesco Trimark Ltèe) (registered investment adviser and registered transfer agent); Trustee, President and Principal Executive Officer, The Invesco Funds (other than AIM Treasurer’s Series Trust (Invesco Treasurer’s Series Trust) and Short-Term Investments Trust); Trustee and Executive Vice President, The Invesco Funds (AIM Treasurer’s Series Trust (Invesco Treasurer’s Series Trust) and Short-Term Investments Trust only); Director, Invesco Investment Advisers LLC (formerly known as Van Kampen Asset Management); Director, Chief Executive Officer and President, Van Kampen Exchange Corp. Formerly: Director and Chairman, Van Kampen Investor Services Inc.; Director, Chief Executive Officer and President, 1371 Preferred Inc. (holding company) and Van Kampen Investments Inc.; Director and President, AIM GP Canada Inc. (general partner for limited partnerships) and Van Kampen Advisors, Inc.; Director and Chief Executive Officer, Invesco Trimark Dealer Inc. (registered broker dealer); Director, Invesco Distributors, Inc. (formerly known as Invesco Aim Distributors, Inc.) (registered broker dealer); Manager, Invesco PowerShares Capital Management LLC; Director, Chief Executive Officer and President, Invesco Advisers, Inc.; Director, Chairman, Chief Executive Officer and President, Invesco Aim Capital Management, Inc.; President, Invesco Trimark Dealer Inc. and Invesco Trimark Ltd./Invesco Trimark Ltèe; Director and President, AIM Trimark Corporate Class Inc. and AIM Trimark Canada Fund Inc.; Senior Managing Director, Invesco Holding Company Limited; Director and Chairman, Fund Management Company (former registered broker dealer); President and Principal Executive Officer, The Invesco Funds (AIM Treasurer’s Series Trust (Invesco Treasurer’s Series Trust), and Short-Term Investments Trust only); President, AIM Trimark Global Fund Inc. and AIM Trimark Canada Fund Inc. | | 144 | | None |
Wayne W. Whalen3 — 1939 Trustee | | 2010 | | Of Counsel, and prior to 2010, partner in the law firm of Skadden, Arps, Slate, Meagher & Flom LLP, legal counsel to certain funds in the Fund Complex | | 144 | | Director of the Mutual fund Directors Forum, a nonprofit membership organization for investment directors; Chairman and Director of the Abraham Lincoln Presidential Library Foundation; and Director of the Stevenson Center for Democracy |
| 1 | Mr. Flanagan is considered an interested person (within the meaning of Section 2(a)(19) of the 1940 Act) of the Trust because he is an officer of the Adviser to the Trust, and an officer and a director of Invesco Ltd., ultimate parent of the Adviser. |
| 2 | Mr. Taylor is considered an interested person (within the meaning of Section 2(a)(19) of the 1940 Act) of the Trust because he is an officer and a director of the Adviser. |
| 3 | Mr. Whalen is retiring effective December 31, 2014. He has been deemed to be an interested person of the Trust because of his prior service as counsel to the predecessor funds of certain Invesco open-end funds and his affiliation with the law firm that served as counsel to such predecessor funds and the Invesco closed-end funds. |
T-1 Invesco Endeavor Fund
Trustees and Officers—(continued)
| | | | | | | | |
Name, Year of Birth and Position(s) Held with the Trust | | Trustee and/
or Officer Since | | Principal Occupation(s) During Past 5 Years | | Number of Funds in Fund Complex Overseen by Trustee | | Other Directorship(s) Held by Trustee During Past 5 Years |
| Independent Trustees | | | | | | | | |
Bruce L. Crockett — 1944 Trustee and Chair | | 2001 | | Chairman, Crockett Technologies Associates (technology consulting company) Formerly: Director, Captaris (unified messaging provider); Director, President and Chief Executive Officer, COMSAT Corporation; Chairman, Board of Governors of INTELSAT (international communications company); ACE Limited (insurance company); and Investment Company Institute | | 144 | | ALPS (Attorneys Liability Protection Society) (insurance company) |
David C. Arch — 1945 Trustee | | 2010 | | Chairman of Blistex Inc., a consumer health care products manufacturer | | 144 | | Board member of the Illinois Manufacturers’ Association; Member of the Board of Visitors, Institute for the Humanities, University of Michigan; Member of the Audit Committee of the Edward-Elmhurst Hospital |
Frank S. Bayley — 1939 Trustee | | 1987 | | Retired. Formerly: Director, Badgley Funds Inc. (registered investment company) (2 portfolios) and General Partner and Of Counsel, law firm of Baker & McKenzie, LLP | | 144 | | Director and Chairman, C.D. Stimson Company (a real estate investment company); Trustee, The Curtis Institute of Music |
James T. Bunch — 1942 Trustee | | 2003 | | Managing Member, Grumman Hill Group LLC (family office private equity investments) Formerly: Founder, Green Manning & Bunch Ltd. (investment banking firm) (1988-2010); Executive Committee, United States Golf Association; and Director, Policy Studies, Inc. and Van Gilder Insurance Corporation | | 144 | | Chairman, Board of Governors, Western Golf Association; Chairman, Evans Scholars Foundation; and Director, Denver Film Society |
Rodney F. Dammeyer — 1940 Trustee | | 2010 | | Chairman of CAC,LLC, (private company offering capital investment and management advisory services) Formerly: Prior to 2001, Managing Partner at Equity Group Corporate Investments; Prior to 1995, Chief Executive Officer of Itel Corporation (formerly Anixter International); Prior to 1985, experience includes Senior Vice President and Chief Financial Officer of Household International, Inc., Executive Vice President and Chief Financial Officer of Northwest Industries, Inc. and Partner of Arthur Andersen & Co.; From 1987 to 2010, Director/Trustee of investment companies in the Van Kampen Funds complex | | 144 | | Director of Quidel Corporation and Stericycle, Inc. |
Albert R. Dowden — 1941 Trustee | | 2001 | | Director of a number of public and private business corporations, including the Boss Group, Ltd. (private investment and management); Nature’s Sunshine Products, Inc. and Reich & Tang Funds (5 portfolios) (registered investment company) Formerly: Director, Homeowners of America Holding Corporation/Homeowners of America Insurance Company (property casualty company); Director, Continental Energy Services, LLC (oil and gas pipeline service); Director, CompuDyne Corporation (provider of product and services to the public security market) and Director, Annuity and Life Re (Holdings), Ltd. (reinsurance company); Director, President and Chief Executive Officer, Volvo Group North America, Inc.; Senior Vice President, AB Volvo; Director of various public and private corporations; Chairman, DHJ Media, Inc.; Director, Magellan Insurance Company; and Director, The Hertz Corporation, Genmar Corporation (boat manufacturer), National Media Corporation; Advisory Board of Rotary Power International (designer, manufacturer, and seller of rotary power engines); and Chairman, Cortland Trust, Inc. (registered investment company) | | 144 | | Director of: Nature’s Sunshine Products, Inc., Reich & Tang Funds, Homeowners of America Holding Corporation/ Homeowners of America Insurance Company, the Boss Group |
Jack M. Fields — 1952 Trustee | | 2001 | | Chief Executive Officer, Twenty First Century Group, Inc. (government affairs company); Owner and Chief Executive Officer, Dos Angeles Ranch, L.P. (cattle, hunting, corporate entertainment); and Discovery Global Education Fund (non-profit) Formerly: Chief Executive Officer, Texana Timber LP (sustainable forestry company); Director of Cross Timbers Quail Research Ranch (non-profit); and member of the U.S. House of Representatives | | 144 | | Insperity, Inc. (formerly known as Administaff) |
Prema Mathai-Davis — 1950 Trustee | | 2001 | | Retired. Formerly: Chief Executive Officer, YWCA of the U.S.A. | | 144 | | None |
Larry Soll — 1942 Trustee | | 2003 | | Retired. Formerly: Chairman, Chief Executive Officer and President, Synergen Corp. (a biotechnology company) | | 144 | | None |
Hugo F. Sonnenschein — 1940 Trustee | | 2010 | | President Emeritus and Honorary Trustee of the University of Chicago and the Adam Smith Distinguished Service Professor in the Department of Economics at the University of Chicago. Prior to 2000, President of the University of Chicago | | 144 | | Trustee of the University of Rochester and a member of its investment committee; Member of the National Academy of Sciences and the American Philosophical Society; Fellow of the American Academy of Arts and Sciences |
T-2 Invesco Endeavor Fund
Trustees and Officers—(continued)
| | | | | | | | |
Name, Year of Birth and Position(s) Held with the Trust | | Trustee and/
or Officer Since | | Principal Occupation(s) During Past 5 Years | | Number of Funds in Fund Complex Overseen by Trustee | | Other Directorship(s) Held by Trustee During Past 5 Years |
| Independent Trustees—(continued) |
Raymond Stickel, Jr. — 1944 Trustee | | 2005 | | Retired. Formerly: Director, Mainstay VP Series Funds, Inc. (25 portfolios) and Partner, Deloitte & Touche | | 144 | | None |
Suzanne H. Woolsey — 1941 Trustee | | 2014 | | Chief Executive Officer of Woolsey Partners LLC | | 144 | | Emeritus Chair of the Board of Trustees of the Institute for Defense Analyses; Trustee of Colorado College; Trustee of California Institute of Technology; Prior to 2014, Director of Fluor Corp.; Prior to 2010, Trustee of the German Marshall Fund of the United States; Prior to 2010 Trustee of the Rocky Mountain Institute |
| Other Officers | | | | | | | | |
Russell C. Burk — 1958 Senior Vice President and Senior Officer | | 2005 | | Senior Vice President and Senior Officer, The Invesco Funds | | N/A | | N/A |
John M. Zerr — 1962 Senior Vice President, Chief Legal Officer and Secretary | | 2006 | | Director, Senior Vice President, Secretary and General Counsel, Invesco Management Group, Inc. (formerly known as Invesco Aim Management Group, Inc.) and Van Kampen Exchange Corp.; Senior Vice President, Invesco Advisers, Inc. (formerly known as Invesco Institutional (N.A.), Inc.) (registered investment adviser); Senior Vice President and Secretary, Invesco Distributors, Inc. (formerly known as Invesco Aim Distributors, Inc.); Director, Vice President and Secretary, Invesco Investment Services, Inc. (formerly known as Invesco Aim Investment Services, Inc.) and IVZ Distributors, Inc. (formerly known as INVESCO Distributors, Inc.); Director and Vice President, INVESCO Funds Group, Inc.; Senior Vice President, Chief Legal Officer and Secretary, The Invesco Funds; Manager, Invesco PowerShares Capital Management LLC; Director, Secretary and General Counsel, Invesco Investment Advisers LLC (formerly known as Van Kampen Asset Management); Secretary and General Counsel, Invesco Capital Markets, Inc. (formerly known as Van Kampen Funds Inc.) and Chief Legal Officer, PowerShares Exchange-Traded Fund Trust, PowerShares Exchange-Traded Fund Trust II, PowerShares India Exchange-Traded Fund Trust, PowerShares Actively Managed Exchange-Traded Fund Trust; and PowerShares Actively Managed Exchange-Traded Commodity Fund Trust Formerly: Director and Vice President, Van Kampen Advisors Inc.; Director, Vice President, Secretary and General Counsel, Van Kampen Investor Services Inc.; Director, Invesco Distributors, Inc. (formerly known as Invesco Aim Distributors, Inc.); Director, Senior Vice President, General Counsel and Secretary, Invesco Aim Advisers, Inc. and Van Kampen Investments Inc.; Director, Vice President and Secretary, Fund Management Company; Director, Senior Vice President, Secretary, General Counsel and Vice President, Invesco Aim Capital Management, Inc.; Chief Operating Officer and General Counsel, Liberty Ridge Capital, Inc. (an investment adviser); Vice President and Secretary, PBHG Funds (an investment company) and PBHG Insurance Series Fund (an investment company); Chief Operating Officer, General Counsel and Secretary, Old Mutual Investment Partners (a broker-dealer); General Counsel and Secretary, Old Mutual Fund Services (an administrator) and Old Mutual Shareholder Services (a shareholder servicing center); Executive Vice President, General Counsel and Secretary, Old Mutual Capital, Inc. (an investment adviser); and Vice President and Secretary, Old Mutual Advisors Funds (an investment company) | | N/A | | N/A |
Sheri Morris — 1964 Vice President, Treasurer and Principal Financial Officer | | 1999 | | Vice President, Treasurer and Principal Financial Officer, The Invesco Funds; Vice President, Invesco Advisers, Inc. (formerly known as Invesco Institutional (N.A.), Inc.) (registered investment adviser); and Vice President, PowerShares Exchange-Traded Fund Trust, PowerShares Exchange-Traded Fund Trust II, PowerShares India Exchange-Traded Fund Trust, PowerShares Actively Managed Exchange-Traded Fund Trust, and PowerShares Actively Managed Exchange-Traded Commodity Fund Trust Formerly: Vice President, Invesco Aim Advisers, Inc., Invesco Aim Capital Management, Inc. and Invesco Aim Private Asset Management, Inc.; Assistant Vice President and Assistant Treasurer, The Invesco Funds and Assistant Vice President, Invesco Advisers, Inc., Invesco Aim Capital Management, Inc. and Invesco Aim Private Asset Management, Inc.; and Treasurer, PowerShares Exchange-Traded Fund Trust, PowerShares Exchange-Traded Fund Trust II, PowerShares India Exchange-Traded Fund Trust and PowerShares Actively Managed Exchange-Traded Fund Trust | | N/A | | N/A |
T-3 Invesco Endeavor Fund
Trustees and Officers—(continued)
| | | | | | | | |
Name, Year of Birth and Position(s) Held with the Trust | | Trustee and/
or Officer Since | | Principal Occupation(s) During Past 5 Years | | Number of Funds in Fund Complex Overseen by Trustee | | Other Directorship(s) Held by Trustee During Past 5 Years |
| Other Officers—(continued) | | | | | | | | |
Karen Dunn Kelley — 1960 Vice President | | 2004 | | Senior Managing Director, Investments; Director, Co-President, Co-Chief Executive Officer, and Co-Chairman, Invesco Advisers, Inc. (formerly known as Invesco Institutional (N.A.), Inc.) (registered investment adviser); Chairman, Invesco Senior Secured Management, Inc.; Senior Vice President, Invesco Management Group, Inc. (formerly known as Invesco Aim Management Group, Inc.); Executive Vice President, Invesco Distributors, Inc. (formerly known as Invesco Aim Distributors, Inc.); Director, Invesco Mortgage Capital Inc. and Invesco Management Company Limited; Director and President, INVESCO Asset Management (Bermuda) Ltd., Vice President, The Invesco Funds (other than AIM Treasurer’s Series Trust (Invesco Treasurer’s Series Trust) and Short-Term Investments Trust); and President and Principal Executive Officer, The Invesco Funds (AIM Treasurer’s Series Trust (Invesco Treasurer’s Series Trust) and Short-Term Investments Trust only) Formerly: Director, INVESCO Global Asset Management Limited and INVESCO Management S.A.; Senior Vice President, Van Kampen Investments Inc. and Invesco Advisers, Inc. (formerly known as Invesco Institutional (N.A.), Inc.) (registered investment adviser); Vice President, Invesco Advisers, Inc. (formerly known as Invesco Institutional (N.A.), Inc.); Director of Cash Management and Senior Vice President, Invesco Advisers, Inc. and Invesco Aim Capital Management, Inc.; Director and President, Fund Management Company; Chief Cash Management Officer, Director of Cash Management, Senior Vice President, and Managing Director, Invesco Aim Capital Management, Inc.; Director of Cash Management, Senior Vice President, and Vice President, Invesco Advisers, Inc. and The Invesco Funds (AIM Treasurer’s Series Trust (Invesco Treasurer’s Series Trust), and Short-Term Investments Trust only) | | N/A | | N/A |
Crissie M. Wisdom — 1969 Anti-Money Laundering Compliance Officer | | 2013 | | Anti-Money Laundering Compliance Officer, Invesco Advisers, Inc. (formerly known as Invesco Institutional (N.A.), Inc.) (registered investment adviser), Invesco Capital Markets, Inc. (formerly known as Van Kampen Funds Inc.), Invesco Distributors, Inc., Invesco Investment Services, Inc., Invesco Management Group, Inc., Van Kampen Exchange Corp., The Invesco Funds, and PowerShares Exchange-Traded Fund Trust, PowerShares Exchange-Traded Fund Trust II, PowerShares India Exchange-Traded Fund Trust, PowerShares Actively Managed Exchange-Traded Fund Trust and PowerShares Actively Managed Exchange-Traded Commodity Fund Trust; and Fraud Prevention Manager and Controls and Risk Analysis Manager for Invesco Investment Services, Inc. | | N/A | | N/A |
Todd L. Spillane — 1958 Chief Compliance Officer | | 2006 | | Senior Vice President, Invesco Management Group, Inc. (formerly known as Invesco Aim Management Group, Inc.) and Van Kampen Exchange Corp.; Senior Vice President and Chief Compliance Officer, Invesco Advisers, Inc. (registered investment adviser) (formerly known as Invesco Institutional (N.A.), Inc.); Chief Compliance Officer, The Invesco Funds; Vice President, Invesco Distributors, Inc. (formerly known as Invesco Aim Distributors, Inc.) and Invesco Investment Services, Inc. (formerly known as Invesco Aim Investment Services, Inc.) Formerly: Chief Compliance Officer, Invesco Funds (Chicago); Senior Vice President, Van Kampen Investments Inc.; Senior Vice President and Chief Compliance Officer, Invesco Aim Advisers, Inc. and Invesco Aim Capital Management, Inc.; Chief Compliance Officer, INVESCO Private Capital Investments, Inc. (holding company), Invesco Private Capital, Inc. (registered investment adviser), Invesco Global Asset Management (N.A.), Inc., Invesco Senior Secured Management, Inc. (registered investment adviser), Van Kampen Investor Services Inc., PowerShares Exchange-Traded Fund Trust, PowerShares Exchange-Traded Fund Trust II, PowerShares India Exchange-Traded Fund Trust and PowerShares Actively Managed Exchange-Traded Fund Trust; and Vice President, Invesco Aim Capital Management, Inc. and Fund Management Company | | N/A | | N/A |
The Statement of Additional Information of the Trust includes additional information about the Fund’s Trustees and is available upon request, without charge, by calling 1.800.959.4246. Please refer to the Fund’s prospectus for information on the Fund’s sub-advisers.
| | | | | | |
Office of the Fund 11 Greenway Plaza, Suite 1000 Houston, TX 77046-1173 | | Investment Adviser Invesco Advisers, Inc. 1555 Peachtree Street, N.E. Atlanta, GA 30309 | | Distributor Invesco Distributors, Inc. 11 Greenway Plaza, Suite 1000 Houston, TX 77046-1173 | | Auditors PricewaterhouseCoopers LLP 1000 Louisiana Street, Suite 5800 Houston, TX 77002-5678 |
| | | |
| | | | | | |
Counsel to the Fund Stradley Ronon Stevens & Young, LLP 2005 Market Street, Suite 2600 Philadelphia, PA 19103-7018 | | Counsel to the Independent Trustees Goodwin Procter LLP 901 New York Avenue, N.W. Washington, D.C. 20001 | | Transfer Agent Invesco Investment Services, Inc. 11 Greenway Plaza, Suite 1000 Houston, TX 77046-1173 | | Custodian State Street Bank and Trust Company 225 Franklin Street Boston, MA 02110-2801 |
T-4 Invesco Endeavor Fund

Invesco mailing information
Send general correspondence to Invesco Investment Services, Inc., P.O. Box 219078, Kansas City, MO 64121-9078.
Important notice regarding delivery of security holder documents
To reduce Fund expenses, only one copy of most shareholder documents may be mailed to shareholders with multiple accounts at the same address (Householding). Mailing of your shareholder documents may be householded indefinitely unless you instruct us otherwise. If you do not want the mailing of these documents to be combined with those for other members of your household, please contact Invesco Investment Services, Inc. at 800 959 4246 or contact your financial institution. We will begin sending you individual copies for each account within 30 days after receiving your request.
Fund holdings and proxy voting information
The Fund provides a complete list of its holdings four times in each fiscal year, at the quarter ends. For the second and fourth quarters, the lists appear in the Fund’s semiannual and annual reports to shareholders. For the first and third quarters, the Fund files the lists with the Securities and Exchange Commission (SEC) on Form N-Q. The most recent list of portfolio holdings is available at invesco.com/completeqtrholdings. Shareholders can also look up the Fund’s
Forms N-Q on the SEC website at sec.gov. Copies of the Fund’s Forms N-Q may be reviewed and copied at the SEC Public Reference Room in Washington, D.C. You can obtain information on the operation of the Public Reference Room, including information about duplicating fee charges, by calling 202 551 8090 or 800 732 0330, or by electronic request at the following email address: publicinfo@sec.gov. The SEC file numbers for the Fund are shown below.
A description of the policies and procedures that the Fund uses to determine how to vote proxies relating to portfolio securities is available without charge, upon request, from our Client Services department at 800 959 4246 or at invesco.com/proxyguidelines. The information is also available on the SEC website, sec.gov.
| | |
Information regarding how the Fund voted proxies related to its portfolio securities during the most recent 12-month period ended June 30 is available at invesco.com/proxysearch. The information is also available on the SEC website, sec.gov. Invesco Advisers, Inc. is an investment adviser; it provides investment advisory services to individual and institutional clients and does not sell securities. Invesco Distributors, Inc. is the US distributor for Invesco Ltd.’s retail mutual funds, exchange-traded funds and institutional money market funds. Both are wholly owned, indirect subsidiaries of Invesco Ltd. | |  |
SEC file numbers: 811-05426 and 033-19338 END-AR-1 Invesco Distributors, Inc.

Letters to Shareholders
| | | | |

Philip Taylor | | | | Dear Shareholders: This annual report includes information about your Fund, including performance data and a complete list of its investments as of the close of the reporting period. Inside, your Fund’s portfolio managers discuss how they managed your Fund and the factors that affected its performance during the reporting period. I hope you find this report of interest. During the reporting period covered by this report, the US economy showed signs of continued improvement. After contracting in the first quarter of 2014, the economy expanded strongly in the second quarter and unemployment trended lower. Much of the credit for this improvement goes to the US Federal Reserve (the Fed), which undertook an extraordinary asset purchase program following the global financial crisis. The Fed’s goal was to jumpstart the economy by encouraging banks to lend more, businesses to hire more and consumers to spend more. Signs of a stronger US economy prompted the Fed to reduce, or “taper,” its |
asset purchase program. Despite this, interest rates remained near historical low levels due largely to heavy investor demand for bonds. While signs of economic improvement were evident in the US, European economies showed signs of weakening. That, together with geopolitical uncertainty and worries about the first diagnosed cases of Ebola outside of Africa, caused increased volatility in US and European equities.
Extended periods of market strength can lull investors into complacency – just as prolonged periods of market weakness or volatility can discourage investors from initiating long-term investment plans. That’s why Invesco has always encouraged investors to work with a professional financial adviser who can stress the importance of starting to save and invest early and the importance of adhering to a disciplined investment plan – when times are good and when they’re uncertain. A financial adviser who knows your unique financial situation, investment goals and risk tolerance can be an invaluable partner as you seek to achieve your financial goals. He or she can offer a long-term perspective when markets are volatile and time-tested advice and guidance when your financial situation or investment goals change.
Timely information when and where you want it
Invesco’s efforts to help investors achieve their financial objectives include providing individual investors and financial professionals with timely information about the markets, the economy and investing – whenever and wherever they want it.
Our website, invesco.com/us, offers a wide range of market insights and investment perspectives. On the website, you’ll find detailed information about our funds, including prices, performance, holdings and portfolio manager commentaries. You can access information about your individual Invesco account whenever it’s convenient for you; just complete a simple, secure online registration. Use the “Log In” box on our home page to get started.
Invesco’s mobile app for iPad® (available free from the App StoreSM) allows you to obtain the same detailed information about your Fund and the same investment insights from our investment leaders, market strategists, economists and retirement experts on the go. You also can watch portfolio manager videos and have instant access to Invesco news and updates wherever you may be.
In addition to the resources accessible on our website and through our mobile app, you can obtain timely updates to help you stay informed about the markets, the economy and investing by connecting with Invesco on Twitter, LinkedIn or Facebook. You can access our blog at blog.invesco.us.com. Our goal is to provide you the information you want, when and where you want it.
Have questions?
For questions about your account, feel free to contact an Invesco client services representative at 800 959 4246. For Invesco-related questions or comments, please email me directly at phil@invesco.com.
All of us at Invesco look forward to serving your investment management needs for many years to come. Thank you for investing with us.
Sincerely,

Philip Taylor
Senior Managing Director, Invesco Ltd.
iPad is a trademark of Apple Inc., registered in the US and other countries. App Store is a service mark of Apple Inc. Invesco Distributors, Inc. is not affiliated with Apple Inc.
|
| 2 Invesco Global Health Care Fund |
| | | | |

Bruce Crockett | | | | Dear Fellow Shareholders: There are a variety of factors that can impact investment performance, many of which are uncontrollable by us as investors. These factors can include various economic trends and geopolitical developments. While the members of the Invesco Funds Board, which I chair, can’t dictate the performance of the Invesco funds, be assured that your Board works diligently throughout the year to focus on how your investments are managed. Our job is to represent you and your interests on a variety of fund management-related matters. We regularly monitor how the portfolio management teams of the Invesco funds are performing in light of ever-changing and often unpredictable economic and market conditions. We review the investment strategies and investment process employed by each fund’s management team as explained in the fund’s prospectus. Perhaps our most significant responsibility is conducting the annual review of the funds’ |
advisory and sub-advisory contracts with Invesco Advisers and its affiliates. This annual review, which is required by the Investment Company Act of 1940, focuses on the nature and quality of the services Invesco provides as the adviser to the Invesco funds and the reasonableness of the fees that it charges for those services. Each year, we spend months carefully reviewing information from Invesco that allows us to evaluate the quality of its services and the reasonableness of its fees. We also use information from a variety of independent sources, including materials provided by the independent senior officer of the Invesco funds, who reports directly to the independent trustees on the Board. Additionally, we meet with legal counsel and review performance and fee data prepared for us by Lipper Inc., an independent, third-party firm widely recognized as a leader in its field.
After a careful review, the members of the Invesco Funds Board approved the continuation of advisory and sub-advisory contracts with Invesco Advisers and its affiliates. Be assured that your Board will continue working on behalf of fund shareholders, keeping your needs and interests uppermost in our minds.
As always, please contact me at bruce@brucecrockett.com with any questions or concerns you may have. On behalf of the Board, we look forward to continuing to represent your interests and serving your needs.
Sincerely,

Bruce L. Crockett
Independent Chair
Invesco Funds Board of Trustees
|
| 3 Invesco Global Health Care Fund |
Management’s Discussion of Fund Performance
Performance summary
For the fiscal year ended October 31, 2014, Invesco Global Health Care Fund, at net asset value (NAV), outperformed the MSCI World Index and the MSCI World Health Care Index, the Fund’s broad market and style-specific benchmarks, respectively. The Fund’s results versus its style-specific benchmark were largely attributable to strong stock selection in the pharmaceuticals industry and an overweight position in the biotechnology industry. Together, these industries were the Fund’s top contributors on both a relative and absolute basis. The Fund’s cash position tempered relative results during the reporting period. Stock selection in the life sciences tools and services and managed health care industries detracted from results relative to the style-specific benchmark.
Your Fund’s long-term performance appears later in this report.
Fund vs. Indexes
Total returns, 10/31/13 to 10/31/14, at net asset value (NAV). Performance shown does not include applicable contingent deferred sales charges (CDSC) or front-end sales charges, which would have reduced performance.
| | | | | |
| Class A Shares | | | | 27.20 | % |
| Class B Shares | | | | 26.22 | |
| Class C Shares | | | | 26.26 | |
| Class Y Shares | | | | 27.52 | |
| Investor Class Shares | | | | 27.19 | |
| MSCI World Index‚ (Broad Market Index) | | | | 8.67 | |
| MSCI World Health Care Index‚ (Style-Specific Index) | | | | 23.18 | |
| Lipper Global Health/Biotechnology Funds Indexn (Peer Group Index) | | | | 29.62 | |
Source(s): ‚FactSet Research Systems Inc.; nLipper Inc. | | | | | |
Market conditions and your Fund
The US economy remained “good, but not great” during the fiscal year ended October 31, 2014. Slow but steady growth, helped by historically low interest rates, generally led US equity markets higher during the reporting period.
The fiscal year began with renewed optimism after it became apparent that a two-week federal government shutdown had not derailed the economy. Evidence of economic improvement caused the US equity market to rally in late 2013 despite the December announcement by the US Federal Reserve that it would begin reducing the scope of its asset purchase program in early 2014.
The US stock market turned volatile in the first months of 2014 as investors
began to worry that stocks may have risen too far, too fast. Unusually cold winter weather negatively affected consumers, and the US economy contracted in the first quarter before rebounding strongly in the second quarter. While corporate earnings were generally resilient throughout the fiscal year, driven by strong profitability across many sectors, investors worried about political developments in Ukraine and signs of economic sluggishness in China. Toward the end of the reporting period, a sharp drop in global oil prices, evidence of economic stagnation in Europe and concern about the first cases of Ebola in the US increased market volatility.
For the reporting period, most major domestic and global equity market
indexes delivered gains, though developed market equities generally outperformed emerging market equities. Nine of the 10 sectors of the MSCI World Index had positive returns, and the health care sector had the highest return among the group, while materials was the only sector that had a loss for the reporting period.
The biotechnology industry was the largest contributor to the Fund’s results, and a number of holdings within the industry were among the Fund’s top contributors, including Gilead Sciences and Alexion Pharmaceuticals. The largest contributor was Gilead Sciences, a biopharmaceutical company that specializes in therapeutics for the treatment of HIV and hepatitis-C. During the reporting period, the company reported strong revenues attributable to the launch of its new hepatitis-C drug, Sovaldi, which in turn, increased investors’ enthusiasm for the company’s overall hepatitis-C virus franchise.
Alexion Pharmaceuticals, a biopharmaceutical company that specializes in drugs for extremely rare or “orphan” diseases, was another key contributor to the Fund’s results. Robust sales of Soliris, its drug for the treatment of rare genetic blood disorders, contributed to strong earnings, which pushed shares of the stock higher during the reporting period.
Within the pharmaceuticals industry, Allergan was a strong contributor to Fund results. The company develops devices, pharmaceuticals and therapeutics for specialized applications including ophthalmic and cosmetic. Allergan also manufactures and markets the injectable neurotoxin, Botox, which currently holds a dominant share in the market. During the reporting period, Valeant Pharmaceuticals (not a Fund holding) targeted
| | | | | |
| Portfolio Composition | | |
| By sector | |
| |
| Health Care | | | | 90.8 | % |
| Consumer Staples | | | | 1.6 | |
| Industrials | | | | 0.4 | |
Money Market Funds Plus Other Assets Less Liabilities | | | | 7.2 | |
| | | | | |
| Top 10 Equity Holdings* | | |
| | | | | |
| |
| 1. Novartis AG-ADR | | | | 4.0 | % |
| 2. GlaxoSmithKline PLC-ADR | | | | 4.0 | |
| 3. Gilead Sciences, Inc. | | | | 4.0 | |
| 4. Roche Holding AG | | | | 3.9 | |
| 5. Sanofi-ADR | | | | 3.4 | |
| 6. HCA Holdings, Inc. | | | | 3.1 | |
| 7. Celgene Corp. | | | | 3.0 | |
| 8. Biogen Idec Inc. | | | | 2.9 | |
| 9. Alexion Pharmaceuticals, Inc. | | | | 2.7 | |
| 10. Bristol-Myers Squibb Co. | | | | 2.7 | |
| | | | | |
Total Net Assets | | | $ | 1.8 billion | |
| |
Total Number of Holdings* | | | | 58 | |
The Fund’s holdings are subject to change, and there is no assurance that the Fund will continue to hold any particular security.
*Excluding money market fund holdings.
|
| 4 Invesco Global Health Care Fund |
Allergan for acquisition, sending Allergan’s shares sharply higher. However, Allergan declined the offer and implemented a series of maneuvers including a “poison pill” to defend against a take-over. At the end of the reporting period, no deal had been reached between the two companies.
Though pharmaceuticals made a positive impact on overall performance, the industry contained some of the Fund’s largest detractors, as pricing pressures from pharmacy benefit managers and health insurers weighed on the industry. Amid these headwinds, Sanofi detracted from the Fund’s performance. Citing competitive pressures, the company reported weakening US sales of Lantus, the company’s insulin drug for the treatment of diabetes. Additionally, in late October, the company ousted its CEO in a move that surprised many investors and precipitated a sharp sell-off.
Horizon Pharma also detracted from Fund results. The company’s shares dropped sharply following the announcement that two of its key drugs were being removed from the formularies of Express Scripts and CVS Caremark (now CVS Health), two of the largest pharmacy benefits managers in the US. We eliminated our position in Horizon Pharma during the reporting period.
The Fund held derivative instruments in the form of forward foreign currency contracts in order to hedge its European currency exposure. The net cumulative effect of these derivative contracts was slightly positive for overall Fund performance during the fiscal year.
We were net sellers during the reporting period, and we eliminated positions that met their price targets, or when our investment thesis changed. We sold positions in the health care facilities, health care technology, pharmaceuticals and biotechnology industries. We added a holding in the life science tools and services industry. During the reporting period, we maintained an underweight position in large-cap pharmaceuticals versus the style-specific benchmark; however, it was the Fund’s largest absolute industry exposure over the course of the reporting period. The Fund’s largest overweight position relative to the style-specific benchmark was in the biotechnology industry.
We continue to emphasize specialty pharmaceuticals and biotechnology stocks based on their generally robust portfolios, compelling pipelines and our view that many of these companies could be targets of ongoing consolidation. We are primarily focused on companies with new product cycles, less reimbursement risk and less competition.
At the end of the reporting period, the Fund was primarily invested in US stocks, and the Fund’s non-US allocation was focused mainly on European large-cap pharmaceuticals, which had fewer patent expiration concerns than their US counterparts.
As always, thank you for your continued investment in Invesco Global Health Care Fund.
The views and opinions expressed in management’s discussion of Fund performance are those of Invesco Advisers, Inc. These views and opinions are subject to change at any time based on factors such as market and economic conditions. These views and opinions may not be relied upon as investment advice or recommendations, or as an offer for a particular security. The information is not a complete analysis of every aspect of any market, country, industry, security or the Fund. Statements of fact are from sources considered reliable, but Invesco Advisers, Inc. makes no representation or warranty as to their completeness or accuracy. Although historical performance is no guarantee of future results, these insights may help you understand our investment management philosophy.
See important Fund and, if applicable, index disclosures later in this report.
| | |
 | | Derek Taner Chartered Financial Analyst, Portfolio Manager, is manager of Invesco Global Health Care Fund. He |
| joined Invesco in 2005. Mr. Taner earned a BS in business administration with an emphasis in accounting and finance and an MBA from the University of California, Berkeley Haas School of Business. |
|
| 5 Invesco Global Health Care Fund |
Your Fund’s Long-Term Performance
Results of a $10,000 Investment – Oldest Share Class(es)
Fund and index data from 10/31/04
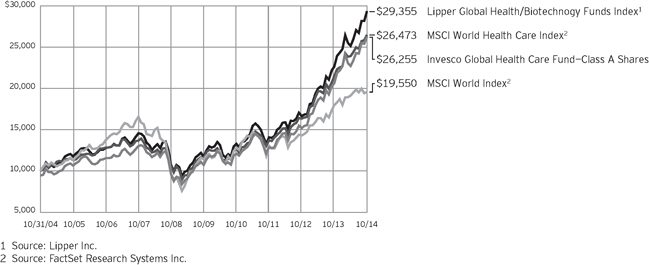
Past performance cannot guarantee comparable future results.
The data shown in the chart include reinvested distributions, applicable sales charges and Fund expenses including
management fees. Index results include reinvested dividends, but they do not reflect sales charges. Performance of the peer group, if applicable, reflects fund expenses and management fees;
performance of a market index does not. Performance shown in the chart and table(s) does not reflect deduction of taxes a shareholder would pay on Fund distributions or sale of Fund shares.
continued from page 8
| | volatile due to less market interest and less publicly available information about the issuer. They also may be illiquid or restricted as to resale, or may trade less frequently and in smaller volumes, all of which may cause difficulty when establishing or closing a position at a desirable price. |
About indexes used in this report
| n | | The MSCI World Index is an unmanaged index considered representative of stocks of developed countries. The index is computed using the net return, which withholds applicable taxes for non-resident investors. |
| n | | The MSCI World Health Care Index is an unmanaged index considered representative of health care stocks of developed countries. The index is computed using the net return, which withholds applicable taxes for non-resident investors. |
| n | | The Lipper Global Health/Biotechnology Funds Index is an unmanaged index considered representative of global health/biotechnology funds tracked by Lipper. |
| n | | The Fund is not managed to track the performance of any particular index, including the index(es) described here, and consequently, the performance of the Fund may deviate significantly from the performance of the
index(es). |
| n | | A direct investment cannot be made in an index. Unless otherwise indicated, index results include reinvested dividends, and they do not reflect sales charges. Performance of the peer group, if applicable, reflects fund expenses; performance of a market index does not. |
Other information
| n | | The returns shown in management’s discussion of Fund performance are based on net asset values (NAVs) calculated for shareholder transactions. Generally accepted accounting principles require adjustments to be made to the net assets of the Fund at period end for financial reporting purposes, and as such, the NAVs for shareholder transactions and the returns based on those NAVs may differ from the NAVs and returns reported in the Financial Highlights. |
| n | | Industry classifications used in this report are generally according to the Global Industry Classification Standard, which was developed by and is the exclusive property and a service mark of MSCI Inc. and Standard & Poor’s. |
|
| 6 Invesco Global Health Care Fund |
| | | | |
Average Annual Total Returns | |
As of 10/31/14, including maximum applicable sales charges | |
| |
| Class A Shares | | | | |
| Inception (8/7/89) | | | 11.52 | % |
| 10 Years | | | 10.13 | |
| 5 Years | | | 18.23 | |
| 1 Year | | | 20.20 | |
| |
| Class B Shares | | | | |
| Inception (4/1/93) | | | 11.88 | % |
| 10 Years | | | 10.11 | |
| 5 Years | | | 18.48 | |
| 1 Year | | | 21.22 | |
| |
| Class C Shares | | | | |
| Inception (3/1/99) | | | 9.26 | % |
| 10 Years | | | 9.94 | |
| 5 Years | | | 18.69 | |
| 1 Year | | | 25.26 | |
| |
| Class Y Shares | | | | |
| 10 Years | | | 10.93 | % |
| 5 Years | | | 19.88 | |
| 1 Year | | | 27.52 | |
| |
| Investor Class Shares | | | | |
| 10 Years | | | 10.76 | % |
| 5 Years | | | 19.58 | |
| 1 Year | | | 27.19 | |
Class Y shares incepted on October 3, 2008. Performance shown prior to that date is that of Class A shares and includes the 12b-1 fees applicable to Class A shares. Class A share performance reflects any applicable fee waivers or expense reimbursements.
Investor Class shares incepted on July 15, 2005. Performance shown prior to that date is that of Class A shares and includes the 12b-1 fees applicable to Class A shares. Class A share performance reflects any applicable fee waivers or expense reimbursements.
The performance data quoted represent past performance and cannot guarantee comparable future results; current performance may be lower or higher. Please visit invesco.com/performance for the most recent month-end performance. Performance figures reflect reinvested distributions, changes in net asset value and the effect of the maximum sales charge unless otherwise stated. Investment return and principal value will fluctuate so that you may have a gain or loss when you sell shares.
| | | | |
Average Annual Total Returns | |
| As of 9/30/14, the most recent calendar quarter end, including maximum applicable sales charges | |
| |
| Class A Shares | | | | |
| Inception (8/7/89) | | | 11.41 | % |
| 10 Years | | | 9.85 | |
| 5 Years | | | 16.69 | |
| 1 Year | | | 18.83 | |
| |
| Class B Shares | | | | |
| Inception (4/1/93) | | | 11.76 | % |
| 10 Years | | | 9.82 | |
| 5 Years | | | 16.93 | |
| 1 Year | | | 19.82 | |
| |
| Class C Shares | | | | |
| Inception (3/1/99) | | | 9.08 | % |
| 10 Years | | | 9.66 | |
| 5 Years | | | 17.14 | |
| 1 Year | | | 23.83 | |
| |
| Class Y Shares | | | | |
| 10 Years | | | 10.63 | % |
| 5 Years | | | 18.31 | |
| 1 Year | | | 26.06 | |
| |
| Investor Class Shares | | | | |
| 10 Years | | | 10.47 | % |
| 5 Years | | | 18.01 | |
| 1 Year | | | 25.73 | |
The net annual Fund operating expense ratio set forth in the most recent Fund prospectus as of the date of this report for Class A, Class B, Class C, Class Y and Investor Class shares was 1.11%, 1.86%, 1.86%, 0.86% and 1.11%, respectively.1 The total annual Fund operating expense ratio set forth in the most recent Fund prospectus as of the date of this report for Class A, Class B, Class C, Class Y and Investor Class shares was 1.12%, 1.87%, 1.87%, 0.87% and 1.12%, respectively. The expense ratios presented above may vary from the expense ratios presented in other sections of this report that are based on expenses incurred during the period covered by this report.
Class A share performance reflects the maximum 5.50% sales charge, and Class B and Class C share performance reflects the applicable contingent deferred sales charge (CDSC) for the period involved. The CDSC on Class B shares declines from 5% beginning at the time of purchase to 0% at the beginning of the seventh year. The CDSC on Class C shares is 1% for the first year after purchase. Class Y
shares and Investor Class shares do not have a front-end sales charge or a CDSC; therefore, performance is at net asset value.
The performance of the Fund’s share classes will differ primarily due to different sales charge structures and class expenses.
| 1 | Total annual Fund operating expenses after any contractual fee waivers and/or expense reimbursements by the adviser in effect through at least June 30, 2016. See current prospectus for more information. |
|
| 7 Invesco Global Health Care Fund |
Invesco Global Health Care Fund’s investment objective is long-term growth of capital.
| n | | Unless otherwise stated, information presented in this report is as of October 31, 2014, and is based on total net assets. |
| n | | Unless otherwise noted, all data provided by Invesco. |
| n | | To access your Fund’s reports/prospectus, visit invesco.com/fundreports. |
About share classes
| n | | Class B shares may not be purchased for new or additional investments. Please see the prospectus for more information. |
| n | | Class Y shares are available only to certain investors. Please see the prospectus for more information. |
| n | | Investor Class shares are closed to new investors. Contact your financial adviser about purchasing our other share classes. Please see the prospectus for more information. |
Principal risks of investing in the Fund
| n | | Convertible securities risk. The Fund may own convertible securities, the value of which may be affected by market interest rates, the risk that the issuer will default, the value of the underlying stock or the right of the issuer to buy back the convertible securities. |
| n | | Depositary receipts risk. Depositary receipts involve many of the same risks as those associated with direct investment in foreign securities. In addition, the underlying issuers of certain depositary receipts, particularly unsponsored or unregistered depositary receipts, are under no obligation to distribute shareholder communications to the holders of such receipts or to pass through to them any voting rights with respect to the deposited securities. |
| n | | Derivatives risk. The value of a derivative instrument depends largely on (and is derived from) the value of an underlying security, currency, commodity, interest rate, index or other asset (each referred to as an underlying asset). In addition to risks relating to the underlying assets, the use of derivatives may include other, possibly greater, risks, including counterparty, leverage and liquidity risks. Counterparty risk is the risk that the counterparty to the derivative contract will default on its obligation to pay the Fund the amount owed or otherwise perform under the derivative contract. Derivatives create leverage risk |
| | | because they do not require payment up front equal to the economic exposure created by owning the derivative. As a result, an adverse change in the value of the underlying asset could result in the Fund sustaining a loss that is substantially greater than the amount invested in the derivative, which may make the Fund’s returns more volatile and increase the risk of loss. Derivative instruments may also be less liquid than more traditional investments and the Fund may be unable to sell or close out its derivative positions at a desirable time or price. This risk may be more acute under adverse market conditions, during which the Fund may be most in need of liquidating its derivative positions. Derivatives may also be harder to value, less tax efficient and subject to changing government regulation that could impact the Fund’s ability to use certain derivatives or their cost. Also, derivatives used for hedging or to gain or limit exposure to a particular market segment may not provide the expected benefits, particularly during adverse market conditions. |
| n | | Developing/emerging markets securities risk. The prices of securities issued by foreign companies and governments located in developing/emerging market countries may be affected more negatively by inflation, devaluation of their currencies, higher transaction costs, delays in settlement, adverse political developments, the introduction of capital controls, withholding taxes, nationalization of private assets, expropriation, social unrest, war or lack of timely information than those in developed countries. |
| n | | Foreign securities risk. The Fund’s foreign investments may be affected by changes in a foreign country’s exchange rates, political and social instability, changes in economic or taxation policies, difficulties when enforcing obligations, decreased liquidity, and increased volatility. Foreign companies may be subject to less regulation resulting in less publicly available information about the companies. |
| n | | Geographic focus risk. From time to time the Fund may invest a substantial amount of its assets in securities of issuers located in a single country or a limited number of countries. If the Fund focuses its investments in this manner, it assumes the risk that economic, political and social conditions in those countries will have a significant impact on its investment performance. The Fund’s investment performance may also be more volatile if it focuses its investments in certain countries, especially emerging markets countries. |
| n | | Health care sector risk. The Fund will concentrate its investments in the securities of domestic and foreign issuers in the health care industry. The Fund’s performance is vulnerable to factors affecting the health care industry, including government regulation, obsolescence caused by scientific advances and technological innovations. |
| n | | Management risk. The investment techniques and risk analysis used by the Fund’s portfolio managers may not produce the desired results. |
| n | | Market risk. The prices of and the income generated by the Fund’s securities may decline in response to, among other things, investor sentiment, general economic and market conditions, regional or global instability, and currency and interest rate fluctuations. |
| n | | Preferred securities risk. Preferred securities may include provisions that permit the issuer, in its discretion, to defer or omit distributions for a certain period of time. If the Fund owns a security that is deferring or omitting its distributions, the Fund may be required to report the distribution on its tax returns, even though it may not have received this income. Further, preferred securities may lose substantial value due to the omission or deferment of dividend payments. |
| n | | Small- and mid-capitalization risks. Stocks of small- and mid-sized companies tend to be more vulnerable to adverse developments and may have little or no operating history or track record of success, and limited product lines, markets, management and financial resources. The securities of small- and mid-sized companies may be more |
continued on page 6
|
This report must be accompanied or preceded by a currently effective Fund prospectus, which contains more complete information, including sales charges and expenses. Investors should read it carefully before investing. |
|
|
| NOT FDIC INSURED | MAY LOSE VALUE | NO BANK GUARANTEE |
|
| 8 Invesco Global Health Care Fund |
Schedule of Investments(a)
October 31, 2014
| | | | | | | | |
| | | Shares | | | Value | |
Common Stocks & Other Equity Interests–92.82% | |
| Biotechnology–23.62% | |
ACADIA Pharmaceuticals Inc.(b) | | | 322,242 | | | $ | 8,926,103 | |
Alexion Pharmaceuticals, Inc.(b) | | | 248,816 | | | | 47,613,430 | |
Biogen Idec Inc.(b) | | | 157,754 | | | | 50,651,654 | |
BioMarin Pharmaceutical Inc.(b) | | | 432,579 | | | | 35,687,768 | |
Celgene Corp.(b) | | | 489,690 | | | | 52,440,902 | |
Celldex Therapeutics Inc.(b) | | | 398,967 | | | | 6,682,697 | |
Evolutionary Genomics/GenoPlex, Inc. (Acquired 09/15/97-05/25/12; Cost $408,490)(b)(c)(d) | | | 9,944 | | | | 29,832 | |
Exact Sciences Corp.(b) | | | 344,909 | | | | 8,301,960 | |
Gilead Sciences, Inc.(b) | | | 629,413 | | | | 70,494,256 | |
Incyte Corp.(b) | | | 474,933 | | | | 31,849,007 | |
Insmed, Inc.(b) | | | 267,100 | | | | 3,790,149 | |
Intercept Pharmaceuticals, Inc.(b) | | | 63,732 | | | | 16,467,712 | |
Keryx Biopharmaceuticals, Inc.(b) | | | 671,551 | | | | 11,315,634 | |
Medivation Inc.(b) | | | 173,936 | | | | 18,385,035 | |
NPS Pharmaceuticals, Inc.(b) | | | 499,178 | | | | 13,677,477 | |
Vanda Pharmaceuticals Inc.(b) | | | 865,662 | | | | 10,396,601 | |
Vertex Pharmaceuticals Inc.(b) | | | 264,816 | | | | 29,828,874 | |
| | | | | 416,539,091 | |
|
| Drug Retail–1.58% | |
CVS Health Corp. | | | 225,243 | | | | 19,328,102 | |
Raia Drogasil S.A. (Brazil) | | | 945,978 | | | | 8,585,571 | |
| | | | | 27,913,673 | |
|
| Health Care Distributors–3.00% | |
Cardinal Health, Inc. | | | 340,863 | | | | 26,750,928 | |
McKesson Corp. | | | 128,968 | | | | 26,233,381 | |
| | | | | 52,984,309 | |
|
| Health Care Equipment–7.40% | |
Abbott Laboratories | | | 535,140 | | | | 23,326,752 | |
DBV Technologies S.A.–ADR (France)(b) | | | 473,796 | | | | 11,968,087 | |
Olympus Corp. (Japan)(b) | | | 717,200 | | | | 26,228,047 | |
ResMed Inc. | | | 825,900 | | | | 43,128,498 | |
Wright Medical Group, Inc.(b) | | | 819,477 | | | | 25,911,863 | |
| | | | | 130,563,247 | |
|
| Health Care Facilities–8.60% | |
Community Health Systems Inc.(b) | | | 681,150 | | | | 37,442,816 | |
HCA Holdings, Inc.(b) | | | 770,750 | | | | 53,991,038 | |
Tenet Healthcare Corp.(b) | | | 630,482 | | | | 35,338,516 | |
Universal Health Services, Inc.–Class B | | | 240,616 | | | | 24,954,285 | |
| | | | | 151,726,655 | |
|
| Health Care Services–3.40% | |
Air Methods Corp.(b) | | | 309,568 | | | | 14,620,896 | |
Express Scripts Holding Co.(b) | | | 566,246 | | | | 43,499,018 | |
| | | | | | | | |
| | | Shares | | | Value | |
| Health Care Services–(continued) | |
InnovaCare Inc. (Puerto Rico)
(Acquired 12/12/12;
Cost $2,123,434)(b)(c) | | | 805,748 | | | $ | 1,812,933 | |
| | | | | 59,932,847 | |
|
| Life Sciences Tools & Services–2.31% | |
Agilent Technologies, Inc. | | | 292,823 | | | | 16,187,255 | |
Thermo Fisher Scientific, Inc. | | | 208,222 | | | | 24,480,661 | |
| | | �� | | 40,667,916 | |
|
| GilManaged Health Care–3.55% | |
Aetna Inc. | | | 319,666 | | | | 26,375,641 | |
Qualicorp S.A. (Brazil)(b) | | | 674,900 | | | | 6,863,390 | |
UnitedHealth Group Inc. | | | 308,879 | | | | 29,346,594 | |
| | | | | 62,585,625 | |
|
| Pharmaceuticals–39.36% | |
AbbVie Inc. | | | 734,660 | | | | 46,621,524 | |
Allergan, Inc. | | | 96,136 | | | | 18,271,608 | |
Bayer AG (Germany) | | | 312,053 | | | | 44,362,764 | |
Bristol-Myers Squibb Co. | | | 810,772 | | | | 47,178,823 | |
Endo International PLC(b) | | | 384,441 | | | | 25,726,792 | |
GlaxoSmithKline PLC–ADR (United Kingdom) | | | 1,550,411 | | | | 70,528,196 | |
Hikma Pharmaceuticals PLC
(United Kingdom) | | | 556,147 | | | | 16,883,199 | |
Jazz Pharmaceuticals PLC(b) | | | 158,510 | | | | 26,762,828 | |
Johnson & Johnson | | | 241,707 | | | | 26,051,181 | |
Locus Pharmaceuticals, Inc. (Acquired 11/21/00-05/09/07; Cost $6,852,940)(b)(c)(d) | | | 258,824 | | | | 0 | |
Mylan Inc.(b) | | | 519,669 | | | | 27,828,275 | |
Nippon Shinyaku Co., Ltd. (Japan) | | | 834,000 | | | | 24,904,439 | |
Novartis AG–ADR (Switzerland) | | | 762,457 | | | | 70,672,139 | |
Perrigo Co. PLC | | | 170,927 | | | | 27,596,164 | |
Pfizer Inc. | | | 1,485,174 | | | | 44,480,961 | |
Roche Holding AG (Switzerland) | | | 232,970 | | | | 68,805,611 | |
Sanofi–ADR (France) | | | 1,277,764 | | | | 59,083,807 | |
Shire PLC–ADR (Ireland) | | | 90,980 | | | | 18,177,805 | |
Teva Pharmaceutical Industries Ltd–ADR (Israel) | | | 536,922 | | | | 30,319,985 | |
| | | | | | | | 694,256,101 | |
Total Common Stocks & Other Equity Interests (Cost $922,101,082) | | | | 1,637,169,464 | |
|
Preferred Stock–0.00% | |
| Health Care Equipment–0.00% | |
Intact Medical Corp., Series C, Pfd. (Acquired 03/26/01; Cost $2,000,000)(b)(c)(d) | | | 2,439,026 | | | | 0 | |
See accompanying Notes to Financial Statements which are an integral part of the financial statements.
9 Invesco Global Health Care Fund
| | | | | | | | |
| | | Shares | | | Value | |
Money Market Funds–7.05% | |
Liquid Assets Portfolio–Institutional Class(e) | | | 62,171,775 | | | $ | 62,171,775 | |
Premier Portfolio–Institutional Class(e) | | | 62,171,775 | | | | 62,171,775 | |
Total Money Market Funds
(Cost $124,343,550) | | | | 124,343,550 | |
TOTAL INVESTMENTS–99.87%
(Cost $1,048,444,632) | | | | 1,761,513,014 | |
OTHER ASSETS LESS LIABILITIES–0.13% | | | | 2,319,723 | |
NET ASSETS–100.00% | | | $ | 1,763,832,737 | |
Investment Abbreviations:
| | |
| ADR | | – American Depositary Receipt |
| Pfd. | | – Preferred |
Notes to Schedule of Investments:
| (a) | Industry and/or sector classifications used in this report are generally according to the Global Industry Classification Standard, which was developed by and is the exclusive property and a service mark of MSCI Inc. and Standard & Poor’s. |
| (b) | Non-income producing security. |
| (c) | Security purchased or received in a transaction exempt from registration under the Securities Act of 1933, as amended (the “1933 Act”). The security may be resold pursuant to an exemption from registration under the 1933 Act, typically to qualified institutional buyers. The aggregate value of these securities at October 31, 2014 was $1,842,765, which represented less than 1% of the Fund’s Net Assets. |
| (d) | Security is considered venture capital. See Note 1K. |
| (e) | The money market fund and the Fund are affiliated by having the same investment adviser. |
See accompanying Notes to Financial Statements which are an integral part of the financial statements.
10 Invesco Global Health Care Fund
Statement of Assets and Liabilities
October 31, 2014
| | | | |
Assets: | |
Investments, at value (Cost $924,101,082) | | $ | 1,637,169,464 | |
Investments in affiliated money market funds, at value and cost | | | 124,343,550 | |
Total investments, at value (Cost $1,048,444,632) | | | 1,761,513,014 | |
Foreign currencies, at value (Cost $375,844) | | | 367,806 | |
Receivable for: | | | | |
Fund shares sold | | | 5,025,558 | |
Dividends | | | 1,540,476 | |
Forward foreign currency contracts outstanding | | | 375,845 | |
Investment for trustee deferred compensation and retirement plans | | | 265,608 | |
Other assets | | | 980,550 | |
Total assets | | | 1,770,068,857 | |
|
Liabilities: | |
Payable for: | | | | |
Investments purchased | | | 3,039,190 | |
Fund shares reacquired | | | 1,745,085 | |
Accrued fees to affiliates | | | 957,116 | |
Accrued trustees’ and officers’ fees and benefits | | | 3,695 | |
Accrued other operating expenses | | | 127,410 | |
Trustee deferred compensation and retirement plans | | | 363,624 | |
Total liabilities | | | 6,236,120 | |
Net assets applicable to shares outstanding | | $ | 1,763,832,737 | |
|
Net assets consist of: | |
Shares of beneficial interest | | $ | 862,559,879 | |
Undistributed net investment income | | | (330,610 | ) |
Undistributed net realized gain | | | 188,212,912 | |
Net unrealized appreciation | | | 713,390,556 | |
| | | $ | 1,763,832,737 | |
| | | | |
Net Assets: | |
Class A | | $ | 906,858,131 | |
Class B | | $ | 14,238,620 | |
Class C | | $ | 81,439,303 | |
Class Y | | $ | 31,016,465 | |
Investor Class | | $ | 730,280,218 | |
|
Shares outstanding, $0.01 par value per share,
with an unlimited number of shares authorized: | |
Class A | | | 19,260,739 | |
Class B | | | 379,735 | |
Class C | | | 2,169,490 | |
Class Y | | | 652,856 | |
Investor Class | | | 15,506,634 | |
Class A: | | | | |
Net asset value per share | | $ | 47.08 | |
Maximum offering price per share | | | | |
(Net asset value of $47.08 ¸ 94.50%) | | $ | 49.82 | |
Class B: | | | | |
Net asset value and offering price per share | | $ | 37.50 | |
Class C: | | | | |
Net asset value and offering price per share | | $ | 37.54 | |
Class Y: | | | | |
Net asset value and offering price per share | | $ | 47.51 | |
Investor Class: | | | | |
Net asset value and offering price per share | | $ | 47.09 | |
See accompanying Notes to Financial Statements which are an integral part of the financial statements.
11 Invesco Global Health Care Fund
Statement of Operations
For the year ended October 31, 2014
| | | | |
Investment income: | |
Dividends (net of foreign withholding taxes of $1,181,579) | | $ | 17,683,845 | |
Dividends from affiliated money market funds | | | 38,092 | |
Total investment income | | | 17,721,937 | |
| |
Expenses: | | | | |
Advisory fees | | | 9,817,515 | |
Administrative services fees | | | 377,232 | |
Custodian fees | | | 97,416 | |
Distribution fees: | | | | |
Class A | | | 2,052,185 | |
Class B | | | 158,897 | |
Class C | | | 700,990 | |
Investor Class | | | 1,667,157 | |
Transfer agent fees | | | 2,553,174 | |
Trustees’ and officers’ fees and benefits | | | 60,725 | |
Other | | | 313,187 | |
Total expenses | | | 17,798,478 | |
Less: Fees waived and expense offset arrangement(s) | | | (134,719 | ) |
Net expenses | | | 17,663,759 | |
Net investment income | | | 58,178 | |
| |
Realized and unrealized gain (loss) from: | | | | |
Net realized gain (loss) from: | | | | |
Investment securities | | | 184,885,804 | |
Foreign currencies | | | (52,622 | ) |
Forward foreign currency contracts | | | 3,564,705 | |
| | | | 188,397,887 | |
Change in net unrealized appreciation (depreciation) of: | | | | |
Investment securities | | | 190,089,315 | |
Foreign currencies | | | (58,953 | ) |
Forward foreign currency contracts | | | 2,176,798 | |
| | | | 192,207,160 | |
Net realized and unrealized gain | | | 380,605,047 | |
Net increase in net assets resulting from operations | | $ | 380,663,225 | |
See accompanying Notes to Financial Statements which are an integral part of the financial statements.
12 Invesco Global Health Care Fund
Statement of Changes in Net Assets
For the years ended October 31, 2014 and 2013
| | | | | | | | |
| | | 2014 | | | 2013 | |
Operations: | | | | | |
Net investment income | | $ | 58,178 | | | $ | 2,067,643 | |
Net realized gain | | | 188,397,887 | | | | 124,625,742 | |
Change in net unrealized appreciation | | | 192,207,160 | | | | 256,804,267 | |
Net increase in net assets resulting from operations | | | 380,663,225 | | | | 383,497,652 | |
| | |
Distributions to shareholders from net investment income: | | | | | | | | |
Class A | | | (230,447 | ) | | | (3,072,998 | ) |
Class Y | | | (38,777 | ) | | | (58,045 | ) |
Investor Class | | | (188,300 | ) | | | (2,600,231 | ) |
Total distributions from net investment income | | | (457,524 | ) | | | (5,731,274 | ) |
| | |
Distributions to shareholders from net realized gains: | | | | | | | | |
Class A | | | (63,185,146 | ) | | | (38,905,483 | ) |
Class B | | | (1,740,995 | ) | | | (1,591,032 | ) |
Class C | | | (6,192,771 | ) | | | (2,904,662 | ) |
Class Y | | | (1,299,385 | ) | | | (470,609 | ) |
Investor Class | | | (51,630,115 | ) | | | (33,330,549 | ) |
Total distributions from net realized gains | | | (124,048,412 | ) | | | (77,202,335 | ) |
| | |
Share transactions–net: | | | | | | | | |
Class A | | | 37,141,167 | | | | 19,080,722 | |
Class B | | | (4,813,537 | ) | | | (6,668,760 | ) |
Class C | | | 14,047,592 | | | | 11,833,934 | |
Class Y | | | 11,863,196 | | | | 6,346,850 | |
Investor Class | | | 14,818,302 | | | | (3,646,436 | ) |
Net increase in net assets resulting from share transactions | | | 73,056,720 | | | | 26,946,310 | |
Net increase in net assets | | | 329,214,009 | | | | 327,510,353 | |
| | |
Net assets: | | | | | | | | |
Beginning of year | | | 1,434,618,728 | | | | 1,107,108,375 | |
End of year (includes undistributed net investment income of $(330,610) and $121,358, respectively) | | $ | 1,763,832,737 | | | $ | 1,434,618,728 | |
Notes to Financial Statements
October 31, 2014
NOTE 1—Significant Accounting Policies
Invesco Global Health Care Fund (the “Fund”) is a series portfolio of AIM Investment Funds (Invesco Investment Funds) (the “Trust”). The Trust is organized as a Delaware statutory trust and is registered under the Investment Company Act of 1940, as amended (the “1940 Act”), as an open-end series management investment company consisting of twenty-four separate series portfolios, each authorized to issue an unlimited number of shares of beneficial interest. The assets, liabilities and operations of each portfolio are accounted for separately. Information presented in these financial statements pertains only to the Fund. Matters affecting each portfolio or class will be voted on exclusively by the shareholders of such portfolio or class.
The Fund’s investment objective is long-term growth of capital.
The Fund currently consists of five different classes of shares: Class A, Class B, Class C, Class Y and Investor Class. Investor Class shares of the Fund are offered only to certain grandfathered investors. Class A shares are sold with a front-end sales charge unless certain waiver criteria are met and under certain circumstances load waived shares may be subject to contingent deferred sales charges (“CDSC”). Class C shares are sold with a CDSC. Class Y and Investor Class shares are sold at net asset value. Effective November 30, 2010, new or additional investments in Class B shares are no longer permitted. Existing shareholders of Class B shares may continue to reinvest dividends and capital gains distributions in Class B shares until they convert to Class A shares. Also, shareholders in Class B shares will be able to exchange those shares for Class B shares of other Invesco Funds offering such shares until they convert to Class A shares. Generally, Class B shares will automatically convert to Class A shares on or about the month-end, which is at least eight years after the date of purchase. Redemption of Class B shares prior to the conversion date will be subject to a CDSC.
The following is a summary of the significant accounting policies followed by the Fund in the preparation of its financial statements.
| A. | Security Valuations — Securities, including restricted securities, are valued according to the following policy. |
13 Invesco Global Health Care Fund
A security listed or traded on an exchange (except convertible securities) is valued at its last sales price or official closing price as of the close of the customary trading session on the exchange where the security is principally traded, or lacking any sales or official closing price on a particular day, the security may be valued at the closing bid price on that day. Securities traded in the over-the-counter market are valued based on prices furnished by independent pricing services or market makers. When such securities are valued by an independent pricing service they may be considered fair valued. Futures contracts are valued at the final settlement price set by an exchange on which they are principally traded. Listed options are valued at the mean between the last bid and ask prices from the exchange on which they are principally traded. Options not listed on an exchange are valued by an independent source at the mean between the last bid and ask prices. For purposes of determining net asset value per share, futures and option contracts generally are valued 15 minutes after the close of the customary trading session of the New York Stock Exchange (“NYSE”).
Investments in open-end and closed-end registered investment companies that do not trade on an exchange are valued at the end of day net asset value per share. Investments in open-end and closed-end registered investment companies that trade on an exchange are valued at the last sales price or official closing price as of the close of the customary trading session on the exchange where the security is principally traded.
Debt obligations (including convertible securities) and unlisted equities are fair valued using an evaluated quote provided by an independent pricing service. Evaluated quotes provided by the pricing service may be determined without exclusive reliance on quoted prices, and may reflect appropriate factors such as institution-size trading in similar groups of securities, developments related to specific securities, dividend rate (for unlisted equities), yield (for debt obligations), quality, type of issue, coupon rate (for debt obligations), maturity (for debt obligations), individual trading characteristics and other market data. Debt obligations are subject to interest rate and credit risks. In addition, all debt obligations involve some risk of default with respect to interest and/or principal payments.
Foreign securities’ (including foreign exchange contracts) prices are converted into U.S. dollar amounts using the applicable exchange rates as of the close of the NYSE. If market quotations are available and reliable for foreign exchange-traded equity securities, the securities will be valued at the market quotations. Because trading hours for certain foreign securities end before the close of the NYSE, closing market quotations may become unreliable. If between the time trading ends on a particular security and the close of the customary trading session on the NYSE, events occur that the Adviser determines are significant and make the closing price unreliable, the Fund may fair value the security. If the event is likely to have affected the closing price of the security, the security will be valued at fair value in good faith using procedures approved by the Board of Trustees. Adjustments to closing prices to reflect fair value may also be based on a screening process of an independent pricing service to indicate the degree of certainty, based on historical data, that the closing price in the principal market where a foreign security trades is not the current value as of the close of the NYSE. Foreign securities’ prices meeting the approved degree of certainty that the price is not reflective of current value will be priced at the indication of fair value from the independent pricing service. Multiple factors may be considered by the independent pricing service in determining adjustments to reflect fair value and may include information relating to sector indices, American Depositary Receipts and domestic and foreign index futures. Foreign securities may have additional risks including exchange rate changes, potential for sharply devalued currencies and high inflation, political and economic upheaval, the relative lack of issuer information, relatively low market liquidity and the potential lack of strict financial and accounting controls and standards.
Securities for which market prices are not provided by any of the above methods may be valued based upon quotes furnished by independent sources. The last bid price may be used to value equity securities. The mean between the last bid and ask prices is used to value debt obligations, including corporate loans.
Securities for which market quotations are not readily available or became unreliable are valued at fair value as determined in good faith by or under the supervision of the Trust’s officers following procedures approved by the Board of Trustees. Issuer specific events, market trends, bid/ask quotes of brokers and information providers and other market data may be reviewed in the course of making a good faith determination of a security’s fair value.
The Fund may invest in securities that are subject to interest rate risk, meaning the risk that the prices will generally fall as interest rates rise and, conversely, the prices will generally rise as interest rates fall. Specific securities differ in their sensitivity to changes in interest rates depending on their individual characteristics. Changes in interest rates may result in increased market volatility, which may affect the value and/or liquidity of certain of the Fund’s investments.
Valuations change in response to many factors including the historical and prospective earnings of the issuer, the value of the issuer’s assets, general economic conditions, interest rates, investor perceptions and market liquidity. Because of the inherent uncertainties of valuation, the values reflected in the financial statements may materially differ from the value received upon actual sale of those investments.
| B. | Securities Transactions and Investment Income — Securities transactions are accounted for on a trade date basis. Realized gains or losses on sales are computed on the basis of specific identification of the securities sold. Interest income (net of withholding tax, if any) is recorded on the accrual basis from settlement date. Dividend income (net of withholding tax, if any) is recorded on the ex-dividend date. |
The Fund may periodically participate in litigation related to Fund investments. As such, the Fund may receive proceeds from litigation settlements. Any proceeds received are included in the Statement of Operations as realized gain (loss) for investments no longer held and as unrealized gain (loss) for investments still held.
Brokerage commissions and mark ups are considered transaction costs and are recorded as an increase to the cost basis of securities purchased and/or a reduction of proceeds on a sale of securities. Such transaction costs are included in the determination of net realized and unrealized gain (loss) from investment securities reported in the Statement of Operations and the Statement of Changes in Net Assets and the net realized and unrealized gains (losses) on securities per share in the Financial Highlights. Transaction costs are included in the calculation of the Fund’s net asset value and, accordingly, they reduce the Fund’s total returns. These transaction costs are not considered operating expenses and are not reflected in net investment income reported in the Statement of Operations and Statement of Changes in Net Assets, or the net investment income per share and ratios of expenses and net investment income reported in the Financial Highlights, nor are they limited by any expense limitation arrangements between the Fund and the investment adviser.
The Fund allocates income and realized and unrealized capital gains and losses to a class based on the relative net assets of each class.
| C. | Country Determination — For the purposes of making investment selection decisions and presentation in the Schedule of Investments, the investment adviser may determine the country in which an issuer is located and/or credit risk exposure based on various factors. These factors include the laws of the country under which the issuer is organized, where the issuer maintains a principal office, the country in which the issuer |
14 Invesco Global Health Care Fund
| | derives 50% or more of its total revenues and the country that has the primary market for the issuer’s securities, as well as other criteria. Among the other criteria that may be evaluated for making this determination are the country in which the issuer maintains 50% or more of its assets, the type of security, financial guarantees and enhancements, the nature of the collateral and the sponsor organization. Country of issuer and/or credit risk exposure has been determined to be the United States of America, unless otherwise noted. |
| D. | Distributions — Distributions from net investment income and net realized capital gain, if any, are generally declared and paid annually and recorded on the ex-dividend date. The Fund may elect to treat a portion of the proceeds from redemptions as distributions for federal income tax purposes. |
| E. | Federal Income Taxes — The Fund intends to comply with the requirements of Subchapter M of the Internal Revenue Code of 1986, as amended (the “Internal Revenue Code”), necessary to qualify as a regulated investment company and to distribute substantially all of the Fund’s taxable earnings to shareholders. As such, the Fund will not be subject to federal income taxes on otherwise taxable income (including net realized capital gain) that is distributed to shareholders. Therefore, no provision for federal income taxes is recorded in the financial statements. |
The Fund recognizes the tax benefits of uncertain tax positions only when the position is more likely than not to be sustained. Management has analyzed the Fund’s uncertain tax positions and concluded that no liability for unrecognized tax benefits should be recorded related to uncertain tax positions. Management is not aware of any tax positions for which it is reasonably possible that the total amounts of unrecognized tax benefits will change materially in the next 12 months.
The Fund files tax returns in the U.S. Federal jurisdiction and certain other jurisdictions. Generally, the Fund is subject to examinations by such taxing authorities for up to three years after the filing of the return for the tax period.
| F. | Expenses — Fees provided for under the Rule 12b-1 plan of a particular class of the Fund and which are directly attributable to that class are charged to the operations of such class. All other expenses are allocated among the classes based on relative net assets. |
| G. | Accounting Estimates — The preparation of financial statements in conformity with accounting principles generally accepted in the United States of America (“GAAP”) requires management to make estimates and assumptions that affect the reported amounts of assets and liabilities at the date of the financial statements and the reported amounts of revenues and expenses during the reporting period including estimates and assumptions related to taxation. Actual results could differ from those estimates by a significant amount. In addition, the Fund monitors for material events or transactions that may occur or become known after the period-end date and before the date the financial statements are released to print. |
| H. | Indemnifications — Under the Trust’s organizational documents, each Trustee, officer, employee or other agent of the Trust is indemnified against certain liabilities that may arise out of the performance of their duties to the Fund. Additionally, in the normal course of business, the Fund enters into contracts, including the Fund’s servicing agreements that contain a variety of indemnification clauses. The Fund’s maximum exposure under these arrangements is unknown as this would involve future claims that may be made against the Fund that have not yet occurred. The risk of material loss as a result of such indemnification claims is considered remote. |
| I. | Foreign Currency Translations — Foreign currency is valued at the close of the NYSE based on quotations posted by banks and major currency dealers. Portfolio securities and other assets and liabilities denominated in foreign currencies are translated into U.S. dollar amounts at date of valuation. Purchases and sales of portfolio securities (net of foreign taxes withheld on disposition) and income items denominated in foreign currencies are translated into U.S. dollar amounts on the respective dates of such transactions. The Fund does not separately account for the portion of the results of operations resulting from changes in foreign exchange rates on investments and the fluctuations arising from changes in market prices of securities held. The combined results of changes in foreign exchange rates and the fluctuation of market prices on investments (net of estimated foreign tax withholding) are included with the net realized and unrealized gain or loss from investments in the Statement of Operations. Reported net realized foreign currency gains or losses arise from (1) sales of foreign currencies, (2) currency gains or losses realized between the trade and settlement dates on securities transactions, and (3) the difference between the amounts of dividends, interest, and foreign withholding taxes recorded on the Fund’s books and the U.S. dollar equivalent of the amounts actually received or paid. Net unrealized foreign currency gains and losses arise from changes in the fair values of assets and liabilities, other than investments in securities at fiscal period end, resulting from changes in exchange rates. |
The Fund may invest in foreign securities, which may be subject to foreign taxes on income, gains on investments or currency repatriation, a portion of which may be recoverable. Foreign taxes, if any, are recorded based on the tax regulations and rates that exist in the foreign markets in which the Fund invests and are shown in the Statement of Operations.
| J. | Forward Foreign Currency Contracts — The Fund may engage in foreign currency transactions either on a spot (i.e. for prompt delivery and settlement) basis or through forward foreign currency contracts to manage or minimize currency or exchange rate risk. |
The Fund may also enter into forward foreign currency contracts for the purchase or sale of a security denominated in a foreign currency in order to “lock in” the U.S. dollar price of that security, or the Fund may also enter into forward foreign currency contracts that do not provide for physical settlement of the two currencies, but instead are settled by a single cash payment calculated as the difference between the agreed upon exchange rate and the spot rate at settlement based upon an agreed upon notional amount (non-deliverable forwards). The Fund will set aside liquid assets in an amount equal to daily mark-to-market obligation for forward foreign currency contracts.
A forward foreign currency contract is an obligation between two parties (“Counterparties”) to purchase or sell a specific currency for an agreed-upon price at a future date. The use of forward foreign currency contracts does not eliminate fluctuations in the price of the underlying securities the Fund owns or intends to acquire but establishes a rate of exchange in advance. Fluctuations in the value of these contracts are measured by the difference in the contract date and reporting date exchange rates and are recorded as unrealized appreciation (depreciation) until the contracts are closed. When the contracts are closed, realized gains (losses) are recorded. Realized and unrealized gains (losses) on the contracts are included in the Statement of Operations. The primary risks associated with forward foreign currency contracts include failure of the Counterparty to meet the terms of the contract and the value of the foreign currency changing unfavorably. These risks may be in excess of the amounts reflected in the Statement of Assets and Liabilities.
| K. | Other Risks — The Fund’s performance is vulnerable to factors affecting the health care industry, including government regulation, obsolescence caused by scientific advances and technological innovations. |
The Fund has invested in non-publicly traded companies, some of which are in the startup or development stages. These investments are inherently risky, as the market for the technologies or products these companies are developing are typically in the early stages and may never
15 Invesco Global Health Care Fund
materialize. The Fund could lose its entire investment in these companies. These investments are valued at fair value as determined in good faith in accordance with procedures approved by the Board of Trustees. Investments in privately held venture capital securities are illiquid.
NOTE 2—Advisory Fees and Other Fees Paid to Affiliates
The Trust has entered into a master investment advisory agreement with Invesco Advisers, Inc. (the “Adviser” or “Invesco”). Under the terms of the investment advisory agreement, the Fund pays an advisory fee to the Adviser based on the annual rate of the Fund’s average daily net assets as follows:
| | | | | | |
| Average Daily Net Assets | | Rate |
First $350 million | | | 0 | .75% | | |
Next $350 million | | | 0 | .65% | | |
Next $1.3 billion | | | 0 | .55% | | |
Next $2 billion | | | 0 | .45% | | |
Next $2 billion | | | 0 | .40% | | |
Next $2 billion | | | 0 | .375% | | |
Over $8 billion | | | 0 | .35% | | |
For the year ended October 31, 2014, the effective advisory fees incurred by the Fund was 0.62%.
Under the terms of a master sub-advisory agreement between the Adviser and each of Invesco Asset Management Deutschland GmbH, Invesco Asset Management Limited, Invesco Asset Management (Japan) Limited, Invesco Australia Limited, Invesco Hong Kong Limited, Invesco Senior Secured Management, Inc. and Invesco Canada Ltd. (collectively, the “Affiliated Sub-Advisers”) the Adviser, not the Fund, may pay 40% of the fees paid to the Adviser to any such Affiliated Sub-Adviser(s) that provide(s) discretionary investment management services to the Fund based on the percentage of assets allocated to such Sub-Adviser(s).
The Adviser has contractually agreed, through at least June 30, 2015, to waive advisory fees and/or reimburse expenses to the extent necessary to limit total annual fund operating expenses after fee waiver and/or expense reimbursement (excluding certain items discussed below) of Class A, Class B, Class C, Class Y and Investor Class shares to 2.00%, 2.75%, 2.75%, 1.75% and 2.00% of average daily net assets, respectively. In determining the Adviser’s obligation to waive advisory fees and/or reimburse expenses, the following expenses are not taken into account, and could cause total annual fund operating expenses after fee waiver and/or expense reimbursement to exceed the numbers reflected above: (1) interest; (2) taxes; (3) dividend expense on short sales; (4) extraordinary or non-routine items, including litigation expenses; and (5) expenses that the Fund has incurred but did not actually pay because of an expense offset arrangement. Unless Invesco continues the fee waiver agreement, it will terminate on June 30, 2015. The fee waiver agreement cannot be terminated during its term. The Adviser did not waive fees and/or reimburse expenses during the period under this expense limitation.
Further, the Adviser has contractually agreed, through at least June 30, 2016, to waive the advisory fee payable by the Fund in an amount equal to 100% of the net advisory fees the Adviser receives from the affiliated money market funds on investments by the Fund of uninvested cash in such affiliated money market funds.
For the year ended October 31, 2014, the Adviser waived advisory fees of $127,249.
The Trust has entered into a master administrative services agreement with Invesco pursuant to which the Fund has agreed to pay Invesco for certain administrative costs incurred in providing accounting services to the Fund. For the year ended October 31, 2014, expenses incurred under the agreement are shown in the Statement of Operations as Administrative services fees.
The Trust has entered into a transfer agency and service agreement with Invesco Investment Services, Inc. (“IIS”) pursuant to which the Fund has agreed to pay IIS a fee for providing transfer agency and shareholder services to the Fund and reimburse IIS for certain expenses incurred by IIS in the course of providing such services. IIS may make payments to intermediaries that provide omnibus account services, sub-accounting services and/or networking services. All fees payable by IIS to intermediaries that provide omnibus account services or sub-accounting are charged back to the Fund, subject to certain limitations approved by the Trust’s Board of Trustees. For the year ended October 31, 2014, the expenses incurred under the agreement are shown in the Statement of Operations as Transfer agent fees.
The Trust has entered into master distribution agreements with Invesco Distributors, Inc. (“IDI”) to serve as the distributor for the Class A, Class B, Class C, Class Y and Investor Class shares of the Fund. The Trust has adopted plans pursuant to Rule 12b-1 under the 1940 Act with respect to the Fund’s Class A, Class B, Class C and Investor Class shares (collectively, the “Plans”). The Fund, pursuant to the Plans, pays IDI compensation at the annual rate of 0.25% of the Fund’s average daily net assets of Class A shares, 1.00% of the average daily net assets of Class B and Class C shares and 0.25% of the average daily net assets of Investor Class shares. Of the Plan payments, up to 0.25% of the average daily net assets of each class of shares may be paid to furnish continuing personal shareholder services to customers who purchase and own shares of such classes. Any amounts not paid as a service fee under the Plans would constitute an asset-based sales charge. Rules of the Financial Industry Regulatory Authority (“FINRA”) impose a cap on the total sales charges, including asset-based sales charges, that may be paid by any class of shares of the Fund. For the year ended October 31, 2014, expenses incurred under the Plans are shown in the Statement of Operations as Distribution fees.
Front-end sales commissions and CDSC (collectively, the “sales charges”) are not recorded as expenses of the Fund. Front-end sales commissions are deducted from proceeds from the sales of Fund shares prior to investment in Class A shares of the Fund. CDSC are deducted from redemption proceeds prior to remittance to the shareholder. During the year ended October 31, 2014, IDI advised the Fund that IDI retained $130,074 in front-end sales commissions from the sale of Class A shares and $443, $4,961 and $4,277 from Class A, Class B and Class C shares, respectively, for CDSC imposed on redemptions by shareholders.
For the year ended October 31, 2014, the Fund incurred $3,578 in brokerage commissions with Invesco Capital Markets, Inc., an affiliate of the Adviser and IDI, for portfolio transactions executed on behalf of the Fund.
Certain officers and trustees of the Trust are officers and directors of the Adviser, IIS and/or IDI.
16 Invesco Global Health Care Fund
NOTE 3—Additional Valuation Information
GAAP defines fair value as the price that would be received to sell an asset or paid to transfer a liability in an orderly transaction between market participants at the measurement date, under current market conditions. GAAP establishes a hierarchy that prioritizes the inputs to valuation methods, giving the highest priority to readily available unadjusted quoted prices in an active market for identical assets (Level 1) and the lowest priority to significant unobservable inputs (Level 3), generally when market prices are not readily available or are unreliable. Based on the valuation inputs, the securities or other investments are tiered into one of three levels. Changes in valuation methods may result in transfers in or out of an investment’s assigned level:
| | Level 1 — | Prices are determined using quoted prices in an active market for identical assets. |
| | Level 2 — | Prices are determined using other significant observable inputs. Observable inputs are inputs that other market participants may use in pricing a security. These may include quoted prices for similar securities, interest rates, prepayment speeds, credit risk, yield curves, loss severities, default rates, discount rates, volatilities and others. |
| | Level 3 — | Prices are determined using significant unobservable inputs. In situations where quoted prices or observable inputs are unavailable (for example, when there is little or no market activity for an investment at the end of the period), unobservable inputs may be used. Unobservable inputs reflect the Fund’s own assumptions about the factors market participants would use in determining fair value of the securities or instruments and would be based on the best available information. |
The following is a summary of the tiered valuation input levels, as of October 31, 2014. The level assigned to the securities valuations may not be an indication of the risk or liquidity associated with investing in those securities. Because of the inherent uncertainties of valuation, the values reflected in the financial statements may materially differ from the value received upon actual sale of those investments.
| | | | | | | | | | | | | | | | |
| | | Level 1 | | | Level 2 | | | Level 3 | | | Total | |
Equity Securities | | $ | 1,622,848,953 | | | $ | 138,634,229 | | | $ | 29,832 | | | $ | 1,761,513,014 | |
Forward Foreign Currency Contracts* | | | — | | | | 375,845 | | | | — | | | | 375,845 | |
Total Investments | | $ | 1,622,848,953 | | | $ | 139,010,074 | | | $ | 29,832 | | | $ | 1,761,888,859 | |
| * | Unrealized appreciation. |
NOTE 4—Derivative Investments
Value of Derivative Investments at Period-End
The table below summarizes the value of the Fund’s derivative investments, detailed by primary risk exposure, held as of October 31, 2014:
| | | | | | | | |
| | | Value | |
| Risk Exposure/Derivative Type | | Assets | | | Liabilities | |
Currency risk: | | | | | | | | |
Forward foreign currency contracts(a) | | $ | 375,845 | | | $ | — | |
| (a) | Values are disclosed on the Statement of Assets and Liabilities under the caption Forward foreign currency contracts outstanding. |
Effect of Derivative Investments for the year ended October 31, 2014
The table below summarizes the gains on derivative investments, detailed by primary risk exposure, recognized in earnings during the period:
| | | | |
| | | Location of Gain on
Statement of Operations | |
| | | Forward Foreign Currency Contracts | |
Realized Gain: | | | | |
Currency risk | | $ | 3,564,705 | |
Change in Unrealized Appreciation: | | | | |
Currency risk | | | 2,176,798 | |
Total | | $ | 5,741,503 | |
The table below summarizes the average notional value of forward foreign currency contracts outstanding during the period.
| | | | |
| | | Forward Foreign Currency Contracts | |
Average notional value | | $ | 78,724,957 | |
17 Invesco Global Health Care Fund
| | | | | | | | | | | | | | | | | | | | | | | | | | |
| Open Forward Foreign Currency Contracts | |
Settlement
Date | | Counterparty | | Contract to | | | Notional
Value | | | Unrealized
Appreciation | |
| | | Deliver | | | Receive | | | |
11/07/2014 | | Citigroup Global Markets Inc. | | | CHF | | | | 41,664,000 | | | | USD | | | | 43,394,124 | | | $ | 43,303,468 | | | $ | 90,656 | |
11/07/2014 | | Citigroup Global Markets Inc. | | | EUR | | | | 30,204,000 | | | | USD | | | | 38,135,872 | | | | 37,850,683 | | | | 285,189 | |
Total open forward foreign currency contracts — Currency Risk | | | | | | | | | | | | | | | | | | | | | | $ | 375,845 | |
Currency Abbreviations:
| | |
| CHF | | — Swiss Franc |
| EUR | | — Euro |
| USD | | — U.S. Dollar |
Offsetting Assets and Liabilities
Accounting Standards Update (“ASU”) No. 2011-11, Disclosures about Offsetting Assets and Liabilities, which was subsequently clarified in Financial Accounting Standards Board ASU 2013-01 “Clarifying the Scope of Disclosures about Offsetting Assets and Liabilities” is intended to enhance disclosures about financial instruments and derivative instruments that are subject to offsetting arrangements on the Statement of Assets and Liabilities and to enable investors to better understand the effect of those arrangements on its financial position. In order for an arrangement to be eligible for netting, the Fund must have a basis to conclude that such netting arrangements are legally enforceable. The Fund enters into netting agreements and collateral agreements in an attempt to reduce the Fund’s Counterparty credit risk by providing for a single net settlement with a Counterparty of all financial transactions covered by the agreement in an event of default as defined under such agreement.
There were no derivative instruments subject to a netting agreement for which the Fund is not currently netting. The following tables present derivative instruments that are either subject to an enforceable netting agreement or offset by collateral arrangements as of October 31, 2014.
| | | | | | | | | | | | | | | | | | | | | | | | |
| Assets: | |
| | | Gross amounts
presented in
Statement of
Assets & Liabilities | | | Gross amounts
offset in
Statement of
Assets & Liabilities | | | Net amounts of assets
presented in the
Statement of Assets
& Liabilities | | | Collateral Received | | | | |
| Counterparty | | | | | Financial
Instruments | | | Cash | | | Net
Amount | |
Citigroup Global Markets Inc. | | $ | 375,845 | | | $ | — | | | $ | 375,845 | | | $ | — | | | $ | — | | | $ | 375,845 | |
NOTE 5—Expense Offset Arrangement(s)
The expense offset arrangement is comprised of transfer agency credits which result from balances in demand deposit accounts used by the transfer agent for clearing shareholder transactions. For the year ended October 31, 2014, the Fund received credits from this arrangement, which resulted in the reduction of the Fund’s total expenses of $7,470.
NOTE 6—Trustees’ and Officers’ Fees and Benefits
Trustees’ and Officers’ Fees and Benefits include amounts accrued by the Fund to pay remuneration to certain Trustees and Officers of the Fund. Trustees have the option to defer compensation payable by the Fund, and Trustees’ and Officers’ Fees and Benefits also include amounts accrued by the Fund to fund such deferred compensation amounts. Those Trustees who defer compensation have the option to select various Invesco Funds in which their deferral accounts shall be deemed to be invested. Finally, certain current Trustees were eligible to participate in a retirement plan that provided for benefits to be paid upon retirement to Trustees over a period of time based on the number of years of service. The Fund may have certain former Trustees who also participate in a retirement plan and receive benefits under such plan. Trustees’ and Officers’ Fees and Benefits include amounts accrued by the Fund to fund such retirement benefits. Obligations under the deferred compensation and retirement plans represent unsecured claims against the general assets of the Fund.
NOTE 7—Cash Balances
The Fund is permitted to temporarily carry a negative or overdrawn balance in its account with State Street Bank and Trust Company, the custodian bank. Such balances, if any at period end, are shown in the Statement of Assets and Liabilities under the payable caption Amount due custodian. To compensate the custodian bank for such overdrafts, the overdrawn Fund may either (1) leave funds as a compensating balance in the account so the custodian bank can be compensated by earning the additional interest; or (2) compensate by paying the custodian bank at a rate agreed upon by the custodian bank and Invesco, not to exceed the contractually agreed upon rate.
NOTE 8—Distributions to Shareholders and Tax Components of Net Assets
Tax Character of Distributions to Shareholders Paid During the Fiscal Years Ended October 31, 2014 and 2013:
| | | | | | | | |
| | | 2014 | | | 2013 | |
Ordinary income | | $ | 8,906,497 | | | $ | 5,731,274 | |
Long-term capital gain | | | 115,599,439 | | | | 77,202,335 | |
Total distributions | | $ | 124,505,936 | | | $ | 82,933,609 | |
18 Invesco Global Health Care Fund
Tax Components of Net Assets at Period-End:
| | | | |
| | | 2014 | |
Undistributed ordinary income | | $ | 269,167 | |
Undistributed long-term gain | | | 189,244,258 | |
Net unrealized appreciation — investments | | | 712,152,923 | |
Net unrealized appreciation (depreciation) — other investments | | | (53,671 | ) |
Temporary book/tax differences | | | (339,819 | ) |
Shares of beneficial interest | | | 862,559,879 | |
Total net assets | | $ | 1,763,832,737 | |
The difference between book-basis and tax-basis unrealized appreciation (depreciation) is due to differences in the timing of recognition of gains and losses on investments for tax and book purposes. The Fund’s net unrealized appreciation difference is attributable primarily to wash sales.
The temporary book/tax differences are a result of timing differences between book and tax recognition of income and/or expenses. The Fund’s temporary book/tax differences are the result of the trustee deferral of compensation and retirement plan benefits.
Capital loss carryforward is calculated and reported as of a specific date. Results of transactions and other activity after that date may affect the amount of capital loss carryforward actually available for the Fund to utilize. Capital losses generated in years beginning after December 22, 2010 can be carried forward for an unlimited period, whereas previous losses expire in 8 tax years. Capital losses with an expiration period may not be used to offset capital gains until all net capital losses without an expiration date have been utilized. Capital loss carryforwards with no expiration date will retain their character as either short-term or long-term capital losses instead of as short-term capital losses as under prior law. The ability to utilize capital loss carryforwards in the future may be limited under the Internal Revenue Code and related regulations based on the results of future transactions.
The Fund does not have a capital loss carryforward as of October 31, 2014.
NOTE 9—Investment Securities
The aggregate amount of investment securities (other than short-term securities, U.S. Treasury obligations and money market funds, if any) purchased and sold by the Fund during the year ended October 31, 2014 was $358,453,876 and $443,342,084, respectively. Cost of investments on a tax basis includes the adjustments for financial reporting purposes as of the most recently completed federal income tax reporting period-end.
| | | | |
| Unrealized Appreciation (Depreciation) of Investment Securities on a Tax Basis | |
Aggregate unrealized appreciation of investment securities | | $ | 729,400,588 | |
Aggregate unrealized (depreciation) of investment securities | | | (17,247,665 | ) |
Net unrealized appreciation of investment securities | | $ | 712,152,923 | |
Cost of investments for tax purposes is $1,049,360,091.
NOTE 10—Reclassification of Permanent Differences
Primarily as a result of differing book/tax treatment of foreign currency transactions, on October 31, 2014, undistributed net investment income was decreased by $52,622 and undistributed net realized gain was increased by $52,622. This reclassification had no effect on the net assets of the Fund.
19 Invesco Global Health Care Fund
NOTE 11—Share Information
| | | | | | | | | | | | | | | | |
| | | Summary of Share Activity | |
| | | Years ended October 31, | |
| | | 2014(a) | | | 2013 | |
| | | Shares | | | Amount | | | Shares | | | Amount | |
Sold: | | | | | | | | | | | | | | | | |
Class A | | | 2,715,150 | | | $ | 115,916,700 | | | | 2,418,013 | | | $ | 86,876,948 | |
Class B | | | 35,192 | | | | 1,190,462 | | | | 48,855 | | | | 1,440,981 | |
Class C | | | 603,693 | | | | 20,492,015 | | | | 650,872 | | | | 19,093,455 | |
Class Y | | | 450,295 | | | | 19,762,485 | | | | 273,260 | | | | 10,168,338 | |
Investor Class | | | 552,996 | | | | 23,531,976 | | | | 507,957 | | | | 17,986,445 | |
| | | | |
Issued as reinvestment of dividends: | | | | | | | | | | | | | | | | |
Class A | | | 1,509,701 | | | | 57,549,788 | | | | 1,234,359 | | | | 37,739,465 | |
Class B | | | 54,553 | | | | 1,667,133 | | | | 60,211 | | | | 1,507,085 | |
Class C | | | 191,750 | | | | 5,865,634 | | | | 110,091 | | | | 2,758,886 | |
Class Y | | | 29,989 | | | | 1,150,983 | | | | 14,131 | | | | 435,249 | |
Investor Class | | | 1,304,978 | | | | 49,758,810 | | | | 1,127,215 | | | | 34,467,211 | |
| | | | |
Automatic conversion of Class B shares to Class A shares: | | | | | | | | | | | | | | | | |
Class A | | | 120,598 | | | | 5,084,757 | | | | 174,926 | | | | 6,191,297 | |
Class B | | | (150,679 | ) | | | (5,084,757 | ) | | | (212,934 | ) | | | (6,191,297 | ) |
| | | | |
Reacquired: | | | | | | | | | | | | | | | | |
Class A | | | (3,336,720 | ) | | | (141,410,078 | ) | | | (3,142,855 | ) | | | (111,726,988 | ) |
Class B | | | (76,661 | ) | | | (2,586,375 | ) | | | (118,407 | ) | | | (3,425,529 | ) |
Class C | | | (364,711 | ) | | | (12,310,057 | ) | | | (345,142 | ) | | | (10,018,407 | ) |
Class Y | | | (208,192 | ) | | | (9,050,272 | ) | | | (115,951 | ) | | | (4,256,737 | ) |
Investor Class | | | (1,389,131 | ) | | | (58,472,484 | ) | | | (1,593,803 | ) | | | (56,100,092 | ) |
Net increase in share activity | | | 2,042,801 | | | $ | 73,056,720 | | | | 1,090,798 | | | $ | 26,946,310 | |
| (a) | There are entities that are record owners of more than 5% of the outstanding shares of the Fund and in the aggregate own 15% of the outstanding shares of the Fund. IDI has an agreement with these entities to sell Fund shares. The Fund, Invesco and/or Invesco affiliates may make payments to these entities, which are considered to be related to the Fund, for providing services to the Fund, Invesco and/or Invesco affiliates including but not limited to services such as securities brokerage, distribution, third party record keeping and account servicing. The Fund has no knowledge as to whether all or any portion of the shares owned of record by these entities are also owned beneficially. |
20 Invesco Global Health Care Fund
NOTE 12—Financial Highlights
The following schedule presents financial highlights for a share of the Fund outstanding throughout the periods indicated.
| | | | | | | | | | | | | | | | | | | | | | | | | | | | | | | | | | | | | | | | | | | | | | | | | | | | | | | | |
| | | Net asset
value,
beginning
of period | | | Net
investment
income
(loss)(a) | | | Net gains
on securities
(both
realized and
unrealized) | | | Total from
investment
operations | | | Dividends
from net
investment
income | | | Distributions
from net
realized
gains | | | Total
distributions | | | Net asset
value, end
of period(b) | | | Total
return(c) | | | Net
assets,
end of
period
(000’s
omitted) | | | Ratio of
expenses
to average
net assets
with fee
waivers
and/or
expenses
absorbed | | | Ratio of
expenses
to average net
assets without
fee waivers
and/or
expenses
absorbed | | | Ratio of net
investment
income (loss)
to average
net assets | | | Portfolio
turnover(d) | |
Class A | | | | | | | | | | | | | | | | | | | | | | | | | | | | | | | | | | | | | | | | | | | | | | | | | | | | | | | | |
Year ended 10/31/14 | | $ | 40.38 | | | $ | 0.01 | | | $ | 10.15 | | | $ | 10.16 | | | $ | (0.01 | ) | | $ | (3.45 | ) | | $ | (3.46 | ) | | $ | 47.08 | | | | 27.20 | % | | $ | 906,858 | | | | 1.07 | %(e) | | | 1.08 | %(e) | | | 0.04 | %(e) | | | 24 | % |
Year ended 10/31/13 | | | 32.09 | | | | 0.07 | | | | 10.63 | | | | 10.70 | | | | (0.17 | ) | | | (2.24 | ) | | | (2.41 | ) | | | 40.38 | | | | 35.79 | | | | 737,071 | | | | 1.10 | | | | 1.11 | | | | 0.21 | | | | 37 | |
Year ended 10/31/12 | | | 27.75 | | | | 0.12 | | | | 4.84 | | | | 4.96 | | | | (0.14 | ) | | | (0.48 | ) | | | (0.62 | ) | | | 32.09 | | | | 18.34 | | | | 563,802 | | | | 1.17 | | | | 1.18 | | | | 0.40 | | | | 39 | |
Year ended 10/31/11 | | | 26.15 | | | | (0.03 | ) | | | 1.63 | (f) | | | 1.60 | | | | — | | | | — | | | | — | | | | 27.75 | | | | 6.12 | (f) | | | 540,451 | | | | 1.20 | | | | 1.21 | | | | (0.09 | ) | | | 37 | |
Year ended 10/31/10 | | | 23.20 | | | | (0.07 | ) | | | 3.02 | (f) | | | 2.95 | | | | — | | | | — | | | | — | | | | 26.15 | | | | 12.71 | (f) | | | 439,402 | | | | 1.23 | | | | 1.23 | | | | (0.29 | ) | | | 16 | |
Class B | | | | | | | | | | | | | | | | | | | | | | | | | | | | | | | | | | | | | | | | | | | | | | | | | | | | | | | | |
Year ended 10/31/14 | | | 33.06 | | | | (0.24 | ) | | | 8.13 | | | | 7.89 | | | | — | | | | (3.45 | ) | | | (3.45 | ) | | | 37.50 | | | | 26.26 | | | | 14,239 | | | | 1.82 | (e) | | | 1.83 | (e) | | | (0.71 | )(e) | | | 24 | |
Year ended 10/31/13 | | | 26.72 | | | | (0.16 | ) | | | 8.74 | | | | 8.58 | | | | — | | | | (2.24 | ) | | | (2.24 | ) | | | 33.06 | | | | 34.81 | | | | 17,101 | | | | 1.85 | | | | 1.86 | | | | (0.54 | ) | | | 37 | |
Year ended 10/31/12 | | | 23.24 | | | | (0.09 | ) | | | 4.05 | | | | 3.96 | | | | — | | | | (0.48 | ) | | | (0.48 | ) | | | 26.72 | | | | 17.45 | | | | 19,765 | | | | 1.92 | | | | 1.93 | | | | (0.35 | ) | | | 39 | |
Year ended 10/31/11 | | | 22.07 | | | | (0.20 | ) | | | 1.37 | (f) | | | 1.17 | | | | — | | | | — | | | | — | | | | 23.24 | | | | 5.30 | (f) | | | 29,064 | | | | 1.95 | | | | 1.96 | | | | (0.84 | ) | | | 37 | |
Year ended 10/31/10 | | | 19.72 | | | | (0.22 | ) | | | 2.57 | (f) | | | 2.35 | | | | — | | | | — | | | | — | | | | 22.07 | | | | 11.92 | (f) | | | 30,872 | | | | 1.98 | | | | 1.98 | | | | (1.04 | ) | | | 16 | |
Class C | | | | | | | | | | | | | | | | | | | | | | | | | | | | | | | | | | | | | | | | | | | | | | | | | | | | | | | | |
Year ended 10/31/14 | | | 33.09 | | | | (0.24 | ) | | | 8.14 | | | | 7.90 | | | | — | | | | (3.45 | ) | | | (3.45 | ) | | | 37.54 | | | | 26.26 | | | | 81,439 | | | | 1.82 | (e) | | | 1.83 | (e) | | | (0.71 | )(e) | | | 24 | |
Year ended 10/31/13 | | | 26.75 | | | | (0.16 | ) | | | 8.74 | | | | 8.58 | | | | — | | | | (2.24 | ) | | | (2.24 | ) | | | 33.09 | | | | 34.76 | | | | 57,536 | | | | 1.85 | | | | 1.86 | | | | (0.54 | ) | | | 37 | |
Year ended 10/31/12 | | | 23.26 | | | | (0.09 | ) | | | 4.06 | | | | 3.97 | | | | — | | | | (0.48 | ) | | | (0.48 | ) | | | 26.75 | | | | 17.48 | | | | 35,388 | | | | 1.92 | | | | 1.93 | | | | (0.35 | ) | | | 39 | |
Year ended 10/31/11 | | | 22.09 | | | | (0.20 | ) | | | 1.37 | (f) | | | 1.17 | | | | — | | | | — | | | | — | | | | 23.26 | | | | 5.30 | (f) | | | 32,702 | | | | 1.95 | | | | 1.96 | | | | (0.84 | ) | | | 37 | |
Year ended 10/31/10 | | | 19.74 | | | | (0.22 | ) | | | 2.57 | (f) | | | 2.35 | | | | — | | | | — | | | | — | | | | 22.09 | | | | 11.91 | (f) | | | 24,390 | | | | 1.98 | | | | 1.98 | | | | (1.04 | ) | | | 16 | |
Class Y | | | | | | | | | | | | | | | | | | | | | | | | | | | | | | | | | | | | | | | | | | | | | | | | | | | | | | | | |
Year ended 10/31/14 | | | 40.71 | | | | 0.13 | | | | 10.22 | | | | 10.35 | | | | (0.10 | ) | | | (3.45 | ) | | | (3.55 | ) | | | 47.51 | | | | 27.52 | | | | 31,016 | | | | 0.82 | (e) | | | 0.83 | (e) | | | 0.29 | (e) | | | 24 | |
Year ended 10/31/13 | | | 32.34 | | | | 0.16 | | | | 10.70 | | | | 10.86 | | | | (0.25 | ) | | | (2.24 | ) | | | (2.49 | ) | | | 40.71 | | | | 36.10 | | | | 15,502 | | | | 0.85 | | | | 0.86 | | | | 0.46 | | | | 37 | |
Year ended 10/31/12 | | | 27.96 | | | | 0.20 | | | | 4.87 | | | | 5.07 | | | | (0.21 | ) | | | (0.48 | ) | | | (0.69 | ) | | | 32.34 | | | | 18.66 | | | | 6,769 | | | | 0.92 | | | | 0.93 | | | | 0.65 | | | | 39 | |
Year ended 10/31/11 | | | 26.28 | | | | 0.05 | | | | 1.63 | (f) | | | 1.68 | | | | — | | | | — | | | | — | | | | 27.96 | | | | 6.39 | (f) | | | 5,628 | | | | 0.95 | | | | 0.96 | | | | 0.16 | | | | 37 | |
Year ended 10/31/10 | | | 23.26 | | | | (0.01 | ) | | | 3.03 | (f) | | | 3.02 | | | | — | | | | — | | | | — | | | | 26.28 | | | | 12.98 | (f) | | | 4,635 | | | | 0.98 | | | | 0.98 | | | | (0.04 | ) | | | 16 | |
Investor Class | | | | | | | | | | | | | | | | | | | | | | | | | | | | | | | | | | | | | | | | | | | | | | | | | | | | | | | | |
Year ended 10/31/14 | | | 40.39 | | | | 0.01 | | | | 10.15 | | | | 10.16 | | | | (0.01 | ) | | | (3.45 | ) | | | (3.46 | ) | | | 47.09 | | | | 27.19 | | | | 730,280 | | | | 1.07 | (e) | | | 1.08 | (e) | | | 0.04 | (e) | | | 24 | |
Year ended 10/31/13 | | | 32.10 | | | | 0.07 | | | | 10.63 | | | | 10.70 | | | | (0.17 | ) | | | (2.24 | ) | | | (2.41 | ) | | | 40.39 | | | | 35.78 | | | | 607,408 | | | | 1.10 | | | | 1.11 | | | | 0.21 | | | | 37 | |
Year ended 10/31/12 | | | 27.76 | | | | 0.12 | | | | 4.84 | | | | 4.96 | | | | (0.14 | ) | | | (0.48 | ) | | | (0.62 | ) | | | 32.10 | | | | 18.34 | | | | 481,385 | | | | 1.17 | | | | 1.18 | | | | 0.40 | | | | 39 | |
Year ended 10/31/11 | | | 26.16 | | | | (0.03 | ) | | | 1.63 | (f) | | | 1.60 | | | | — | | | | — | | | | — | | | | 27.76 | | | | 6.12 | (f) | | | 446,149 | | | | 1.20 | | | | 1.21 | | | | (0.09 | ) | | | 37 | |
Year ended 10/31/10 | | | 23.20 | | | | (0.07 | ) | | | 3.03 | (f) | | | 2.96 | | | | — | | | | — | | | | — | | | | 26.16 | | | | 12.76 | (f) | | | 466,842 | | | | 1.23 | | | | 1.23 | | | | (0.29 | ) | | | 16 | |
| (a) | Calculated using average shares outstanding. |
| (b) | Includes redemption fees added to shares of beneficial interest for Class A, Class B, Class C, Class Y and Investor Class shares which were less than $0.005 per share, for fiscal years ended October 31, 2012 and prior. |
| (c) | Includes adjustments in accordance with accounting principles generally accepted in the United States of America and as such, the net asset value for financial reporting purposes and the returns based upon those net asset values may differ from the net asset value and returns for shareholder transactions. Does not include sales charges and is not annualized for periods less than one year, if applicable. |
| (d) | Portfolio turnover is calculated at the fund level and is not annualized for periods less than one year, if applicable. For the period ended October 31, 2011, the portfolio turnover calculation excludes the value of securities purchased of $121,012,126 and sold of $51,261,834 in the effort to realign the Fund’s portfolio holdings after the reorganization of Invesco Health Sciences Fund into the Fund. |
| (e) | Ratios are annualized and based on average daily net assets (000’s omitted) of $820,874, $15,890, $70,099, $20,368 and $666,863 for Class A, Class B, Class C, Class Y and Investor Class shares, respectively. |
| (f) | Includes litigation proceeds received during the period. Had the litigation proceeds not been received net gains on securities (both realized and unrealized) per share for the year ended October 31, 2011 would have been $1.44, $1.18, $1.18, $1.44 and $1.44 for Class A, Class B, Class C, Class Y and Investor Class shares, respectively, and total returns would have been lower; net gains on securities (both realized and unrealized) per share for the year ended October 31, 2010 would have been $2.90, $2.45, $2.45, $2.91 and $2.91 for Class A, Class B, Class C, Class Y and Investor Class shares, respectively, and total returns would have been lower. |
21 Invesco Global Health Care Fund
Report of Independent Registered Public Accounting Firm
To the Board of Trustees of AIM Investment Funds (Invesco Investment Funds)
and Shareholders of Invesco Global Health Care Fund:
In our opinion, the accompanying statement of assets and liabilities, including the schedule of investments, and the related statements of operations and of changes in net assets and the financial highlights present fairly, in all material respects, the financial position of Invesco Global Health Care Fund (one of the funds constituting AIM Investment Funds (Invesco Investment Funds), hereafter referred to as the “Fund”) at October 31, 2014, the results of its operations for the year then ended, the changes in its net assets for each of the two years in the period then ended and the financial highlights for each of the five years in the period then ended, in conformity with accounting principles generally accepted in the United States of America. These financial statements and financial highlights (hereafter referred to as “financial statements”) are the responsibility of the Fund’s management. Our responsibility is to express an opinion on these financial statements based on our audits. We conducted our audits of these financial statements in accordance with the standards of the Public Company Accounting Oversight Board (United States). Those standards require that we plan and perform the audit to obtain reasonable assurance about whether the financial statements are free of material misstatement. An audit includes examining, on a test basis, evidence supporting the amounts and disclosures in the financial statements, assessing the accounting principles used and significant estimates made by management, and evaluating the overall financial statement presentation. We believe that our audits, which included confirmation of securities at October 31, 2014 by correspondence with the custodian and brokers, and the application of alternative auditing procedures where confirmations of security purchases have not been received, provide a reasonable basis for our opinion.
PRICEWATERHOUSECOOPERS LLP
December 23, 2014
Houston, Texas
22 Invesco Global Health Care Fund
Calculating your ongoing Fund expenses
Example
As a shareholder of the Fund, you incur two types of costs: (1) transaction costs, which may include sales charges (loads) on purchase payments or contingent deferred sales charges on redemptions, if any; and (2) ongoing costs, including management fees, distribution and/or service (12b-1) fees, and other Fund expenses. This example is intended to help you understand your ongoing costs (in dollars) of investing in the Fund and to compare these costs with ongoing costs of investing in other mutual funds. The example is based on an investment of $1,000 invested at the beginning of the period and held for the entire period May 1, 2014 through October 31, 2014.
Actual expenses
The table below provides information about actual account values and actual expenses. You may use the information in this table, together with the amount you invested, to estimate the expenses that you paid over the period. Simply divide your account value by $1,000 (for example, an $8,600 account value divided by $1,000 = 8.6), then multiply the result by the number in the table under the heading entitled “Actual Expenses Paid During Period” to estimate the expenses you paid on your account during this period.
Hypothetical example for comparison purposes
The table below also provides information about hypothetical account values and hypothetical expenses based on the Fund’s actual expense ratio and an assumed rate of return of 5% per year before expenses, which is not the Fund’s actual return.
The hypothetical account values and expenses may not be used to estimate the actual ending account balance or expenses you paid for the period. You may use this information to compare the ongoing costs of investing in the Fund and other funds. To do so, compare this 5% hypothetical example with the 5% hypothetical examples that appear in the shareholder reports of the other funds.
Please note that the expenses shown in the table are meant to highlight your ongoing costs only and do not reflect any transaction costs, such as sales charges (loads) on purchase payments or contingent deferred sales charges on redemptions, if any. Therefore, the hypothetical information is useful in comparing ongoing costs only, and will not help you determine the relative total costs of owning different funds. In addition, if these transaction costs were included, your costs would have been higher.
| | | | | | | | | | | | | | | | | | | | | | | | |
| Class | | Beginning
Account Value
(05/01/14) | | | ACTUAL | | | HYPOTHETICAL (5% annual return before expenses) | | | Annualized
Expense
Ratio | |
| | | Ending
Account Value
(10/31/14)1 | | | Expenses
Paid During
Period2 | | | Ending
Account Value
(10/31/14) | | | Expenses
Paid During
Period2 | | |
| A | | $ | 1,000.00 | | | $ | 1,155.30 | | | $ | 5.76 | | | $ | 1,019.86 | | | $ | 5.40 | | | | 1.06 | % |
| B | | | 1,000.00 | | | | 1,150.70 | | | | 9.81 | | | | 1,016.08 | | | | 9.20 | | | | 1.81 | |
| C | | | 1,000.00 | | | | 1,151.20 | | | | 9.81 | | | | 1,016.08 | | | | 9.20 | | | | 1.81 | |
| Y | | | 1,000.00 | | | | 1,156.80 | | | | 4.40 | | | | 1,021.12 | | | | 4.13 | | | | 0.81 | |
| Investor | | | 1,000.00 | | | | 1,155.30 | | | | 5.76 | | | | 1,019.86 | | | | 5.40 | | | | 1.06 | |
| 1 | The actual ending account value is based on the actual total return of the Fund for the period May 1, 2014 through October 31, 2014, after actual expenses and will differ from the hypothetical ending account value which is based on the Fund’s expense ratio and a hypothetical annual return of 5% before expenses. |
| 2 | Expenses are equal to the Fund’s annualized expense ratio as indicated above multiplied by the average account value over the period, multiplied by 184/365 to reflect the most recent fiscal half year. |
23 Invesco Global Health Care Fund
Approval of Investment Advisory and Sub-Advisory Contracts
The Board of Trustees (the Board) of AIM Investment Funds (Invesco Investment Funds) is required under the Investment Company Act of 1940, as amended, to approve annually the renewal of Invesco Global Health Care Fund’s (the Fund) investment advisory agreements. During contract renewal meetings held on June 16-17, 2014, the Board as a whole, and the disinterested or “independent” Trustees, who comprise over 75% of the Board, voting separately, approved the continuance for the Fund of the Master Investment Advisory Agreement with Invesco Advisers, Inc. (Invesco Advisers and the investment advisory agreement) and the Master Intergroup Sub-Advisory Contract for Mutual Funds with Invesco Asset Management Deutschland GmbH, Invesco Asset Management Limited, Invesco Asset Management (Japan) Limited, Invesco Australia Limited, Invesco Hong Kong Limited, Invesco Senior Secured Management, Inc. and Invesco Canada Ltd. (collectively, the Affiliated Sub-Advisers and the sub-advisory contracts) for another year, effective July 1, 2014.
In evaluating the fairness and reasonableness of compensation under the Fund’s investment advisory agreement and sub-advisory contracts, the Board considered, among other things, the factors discussed below. The Board determined that continuation of the Fund’s investment advisory agreement and the sub-advisory contracts are in the best interest of the Fund and its shareholders and that the compensation payable to Invesco Advisers and the Affiliated Sub-Advisers under the agreements is fair and reasonable.
The Board’s Fund Evaluation Process
The Board’s Investments Committee has established three Sub-Committees, each of which is primarily responsible for overseeing the management of a number of the funds advised by Invesco Advisers (the Invesco Funds). The Sub-Committees meet throughout the year to review the performance of their assigned Invesco Funds, including reviewing materials prepared under the direction of the independent Senior Officer, an officer of the Invesco Funds who reports directly to the independent Trustees. Over the course of each year, the Sub-Committees meet with portfolio managers for their assigned Invesco Funds and other members of management to review the performance, investment objective(s), policies, strategies, limitations and investment risks of these funds. The Sub-Committees meet regularly and at designated contract renewal meetings each year to conduct a review of the performance, fees, expenses and other matters related to their assigned Invesco Funds. Each Sub-Committee recommends to the Investments Committee, which in turn recommends to the full Board, whether and on what terms to approve the continuance of each Invesco Fund’s
investment advisory agreement and sub-advisory contracts for another year.
During the contract renewal process, the Trustees receive comparative performance and fee data regarding the Invesco Funds prepared by Invesco Advisers and Lipper Inc. (Lipper), an independent provider of investment company data. The Trustees also receive an independent written evaluation from the Senior Officer. The Senior Officer’s evaluation is prepared as part of his responsibility to manage the process by which the Invesco Funds’ proposed management fees are negotiated during the annual contract renewal process to ensure they are negotiated in a manner that is at arms’ length and reasonable. In addition to meetings with Invesco Advisers and fund counsel, the independent Trustees also discuss the continuance of the investment advisory agreement and sub-advisory contracts in separate sessions with the Senior Officer and with independent legal counsel.
The Trustees recognized that the advisory fee rates for the Invesco Funds are, in many cases, the result of years of review and negotiation. The Trustees’ deliberations and conclusions in a particular year may be based in part on their deliberations and conclusions regarding these same arrangements throughout the year and in prior years. The Trustees’ review and conclusions are based on the comprehensive consideration of all information presented to them and are not the result of any single determinative factor. Moreover, one Trustee may have weighed a particular piece of information or factor differently than another Trustee.
The discussion below serves as the Senior Officer’s independent written evaluation with respect to the Fund’s investment advisory agreement as well as a discussion of the material factors and related conclusions that formed the basis for the Board’s approval of the Fund’s investment advisory agreement and sub-advisory contracts. Unless otherwise stated, this information is current as of June 17, 2014, and may not reflect consideration of factors that became known to the Board after that date.
Factors and Conclusions and Summary of Independent Written Fee Evaluation
| A. | Nature, Extent and Quality of Services Provided by Invesco Advisers and the Affiliated Sub-Advisers |
The Board reviewed the advisory services provided to the Fund by Invesco Advisers under the Fund’s investment advisory agreement, the performance of Invesco Advisers in providing these services, and the credentials and experience of the officers and employees of Invesco Advisers who provide these services, including the Fund’s portfolio manager or managers, with whom the Sub-Committees met during the year. The Board’s review of the
qualifications of Invesco Advisers to provide advisory services included the Board’s consideration of Invesco Advisers’ investment process oversight, independent credit analysis and investment risk management. The Board also considered non-advisory services that Invesco Advisers and its affiliates provide to the Invesco Funds such as various back office support functions, equity and fixed income trading operations, internal audit, distribution and legal and compliance.
In determining whether to continue the Fund’s investment advisory agreement, the Board considered the benefits of reapproving an existing relationship and the greater uncertainty that may be associated with entering into a new relationship. The Board concluded that the nature, extent and quality of the services provided to the Fund by Invesco Advisers are appropriate and satisfactory and consistent with the terms of the Fund’s investment advisory agreement.
The Board reviewed the services that may be provided by the Affiliated Sub-Advisers under the sub-advisory contracts and the credentials and experience of the officers and employees of the Affiliated Sub-Advisers who provide these services. The Board noted that the Affiliated Sub-Advisers have offices and personnel that are located in financial centers around the world. As a result, the Affiliated Sub-Advisers can provide research and investment analysis on the markets and economies of various countries in which the Fund may invest, make recommendations regarding securities and assist with security trades. The Board concluded that the sub-advisory contracts benefit the Fund and its shareholders by permitting Invesco Advisers to use the resources and talents of the Affiliated Sub-Advisers in managing the Fund. The Board concluded that the nature, extent and quality of the services that may be provided by the Affiliated Sub-Advisers are appropriate and satisfactory and consistent with the terms of the Fund’s sub-advisory contracts.
The Board considered Fund performance as a relevant factor in considering whether to approve the investment advisory agreement. The Board did not view Fund performance as a relevant factor in considering whether to approve the sub-advisory contracts for the Fund, as no Affiliated Sub-Adviser currently manages assets of the Fund.
The Board compared the Fund’s performance during the past one, three and five calendar years to the performance of funds in the Lipper performance universe and against the Lipper Global Health/Biotechnology Funds Index. The Board noted that performance of Class A shares of the Fund was in the fourth quintile of its performance universe for the one year period and the third quintile for the three and five year periods (the first quintile being the best
24 Invesco Global Health Care Fund
performing funds and the fifth quintile being the worst performing funds). The Board noted that performance of Class A shares of the Fund was below the performance of the Index for the one and three year periods and above the performance of the Index for the five year period. Invesco Advisers noted that changes had been made to the portfolio management team in February 2014. The Trustees also reviewed more recent Fund performance and this review did not change their conclusions.
| C. | Advisory and Sub-Advisory Fees |
The Board compared the Fund’s contractual management fee rate to the contractual management fee rates of funds in the Fund’s Lipper expense group at a common asset level. The Board noted that the contractual management fee rate for Class A shares of the Fund was below the median contractual management fee rate of funds in the expense group. The Board noted that the term “contractual management fee” may include both advisory and certain administrative services fees, but that Lipper does not provide information on a fund by fund basis as to what is included. The Board noted that Invesco Advisers does not charge the Invesco Funds for the administrative services included in the term as defined by Lipper. The Board also reviewed the methodology used by Lipper in providing expense group information, which includes using each fund’s contractual management fee schedule (including any applicable breakpoints) as reported in the most recent prospectus or statement of additional information for each fund in the expense group.
The Board noted that Invesco Advisers has contractually agreed to waive fees and/or limit expenses of the Fund through at least June 30, 2015 in an amount necessary to limit total annual operating expenses to a specified percentage of average daily net assets for each class of the Fund.
The Board also compared the Fund’s effective advisory fee rate (the advisory fee rate after advisory fee waivers and before other expense limitations/waivers) to the effective advisory fee rates of other mutual funds advised by Invesco Advisers and its affiliates that are managed using an investment process substantially similar to the investment process used for the Fund. The Board noted that the Fund’s rate was below the effective advisory fee rate, but the same as the internally allocated sub-advised rate, of one off-shore fund advised by Invesco Advisers using a similar investment process. The Board noted that Invesco Advisers and the Affiliated Sub-Advisers do not adviser other client accounts using an investment process substantially similar to the investment process used for the Fund.
The Board also considered the services that may be provided by the Affiliated Sub-Advisers pursuant to the sub-advisory contracts, as well as the fees payable by Invesco Advisers to the Affiliated Sub-Advisers pursuant to the sub-advisory contracts. The Board also noted that the sub-advisory fees are not paid directly
by the Fund, but rather, are payable by Invesco Advisers to the Affiliated Sub-Advisers.
| D. | Economies of Scale and Breakpoints |
The Board considered the extent to which there are economies of scale in the provision of advisory services to the Fund. The Board also considered whether the Fund benefits from economies of scale through contractual breakpoints in the Fund’s advisory fee schedule and was assisted in this review by a report from the Senior Officer. The Board also noted that the Fund shares directly in economies of scale through lower fees charged by third party service providers based on the combined size of the Invesco Funds and other clients advised by Invesco Advisers.
| E. | Profitability and Financial Resources |
The Board reviewed information from Invesco Advisers concerning the costs of the advisory and other services that Invesco Advisers and its affiliates provide to the Fund and the profitability of Invesco Advisers and its affiliates in providing these services for the year ended December 31, 2013. The Board received information from Invesco Advisers about the methodology used to prepare the profitability information. The Board considered the profitability of Invesco Advisers in managing the Fund and the Invesco Funds. The Board noted that Invesco Advisers continues to operate at a net profit from services Invesco Advisers and its subsidiaries provide to the Invesco Funds and the Fund. The Board did not deem the level of profits realized by Invesco Advisers and its affiliates from providing services to the Fund to be excessive given the nature, quality and extent of the services provided to the Invesco Funds. The Board received and accepted information from Invesco Advisers demonstrating that Invesco Advisers and each Affiliated Sub-Adviser are financially sound and have the resources necessary to perform their obligations under the investment advisory agreement and sub-advisory contracts.
| F. | Collateral Benefits to Invesco Advisers and its Affiliates |
The Board considered various other benefits received by Invesco Advisers and its affiliates from the relationship with the Fund, including the fees received for their provision of transfer agency and distribution services to the Fund. The Board considered comparative information regarding fees charged for these services, including information provided by Lipper and other independent sources. The Board considered the performance of Invesco Advisers and its affiliates in providing these services and the organizational structure employed to provide these services. The Board also considered that these services are provided to the Fund pursuant to written contracts that are reviewed and approved on an annual basis by the Board; that the services are required for the operation of the Fund; that Invesco Advisers and its affiliates can provide services, the nature and quality of which are at least equal to those provided by others offering the same or similar services; and that the fees for such
services are fair and reasonable in light of the usual and customary charges by others for services of the same nature and quality.
The Board considered the benefits realized by Invesco Advisers and the Affiliated Sub-Advisers as a result of portfolio brokerage transactions executed through ��soft dollar” arrangements. The Board noted that soft dollar arrangements shift the payment obligation for research services from Invesco Advisers and the Affiliated Sub-Advisers to the Invesco Funds and that the research received may be used with other clients of Invesco Advisers and may reduce Invesco Advisers’ and the Affiliated Sub-Advisers’ expenses. The Board also considered that it receives periodic reports from the Chief Compliance Officer of the Invesco Funds demonstrating that these arrangements are consistent with regulatory requirements. The Board did not deem the soft dollar arrangements to be inappropriate.
The Board considered that the Fund’s uninvested cash and cash collateral from any securities lending arrangements may be invested in money market funds advised by Invesco Advisers pursuant to procedures approved by the Board. The Board noted that Invesco Advisers receives advisory fees from these affiliated money market funds attributable to such investments, although Invesco Advisers has contractually agreed to waive through varying periods the advisory fees payable by the Invesco Funds with respect to investments in the affiliated money market funds. The waiver is in an amount equal to 100% of the net advisory fee Invesco Advisers receives from the affiliated money market funds with respect to the Fund’s investment in the affiliated money market funds of uninvested cash, but not cash collateral. The Board concluded that the amount of advisory fees received by Invesco Advisors from the Fund’s investment of uninvested cash and cash collateral from any securities lending arrangements in the affiliated money market funds are fair and reasonable.
The Board also considered the Fund may use an affiliated broker to execute certain trades for the Fund to among other things, control information leakage, and were advised that such trades would be executed in compliance with rules under the Investment Company Act of 1940, as amended.
25 Invesco Global Health Care Fund
Tax Information
Form 1099-DIV, Form 1042-S and other year–end tax information provide shareholders with actual calendar year amounts that should be included in their tax returns. Shareholders should consult their tax advisors.
The following distribution information is being provided as required by the Internal Revenue Code or to meet a specific state’s requirement.
The Fund designates the following amounts or, if subsequently determined to be different, the maximum amount allowable for its fiscal year ended October 31, 2014:
| | | | |
Federal and State Income Tax | |
Long-Term Capital Gain Distributions | | $ | 115,599,439 | |
Qualified Dividend Income* | | | 100 | % |
Corporate Dividends Received Deduction* | | | 100 | % |
U.S. Treasury Obligations* | | | 0 | % |
| | * | The above percentages are based on ordinary income dividends paid to shareholders during the Fund’s fiscal year. |
| | | | |
Non-Resident Alien Shareholders | |
Qualified Short-Term Gains | | $ | 8,448,973 | |
26 Invesco Global Health Care Fund
Trustees and Officers
The address of each trustee and officer is AIM Investment Funds (Invesco Investment Funds) (the “Trust”), 11 Greenway Plaza, Suite 1000, Houston, Texas 77046-1173. The trustees serve for the life of the Trust, subject to their earlier death, incapacitation, resignation, retirement or removal as more specifically provided in the Trust’s organizational documents. Each officer serves for a one year term or until their successors are elected and qualified. Column two below includes length of time served with predecessor entities, if any.
| | | | | | | | |
Name, Year of Birth and Position(s) Held with the Trust | | Trustee and/
or Officer Since | | Principal Occupation(s) During Past 5 Years | | Number of Funds in Fund Complex Overseen by Trustee | | Other Directorship(s) Held by Trustee During Past 5 Years |
| Interested Persons | | | | | | | | |
| Martin L. Flanagan1 — 1960 Trustee | | 2007 | | Executive Director, Chief Executive Officer and President, Invesco Ltd. (ultimate parent of Invesco and a global investment management firm); Advisor to the Board, Invesco Advisers, Inc. (formerly known as Invesco Institutional (N.A.), Inc.); Trustee, The Invesco Funds; Vice Chair, Investment Company Institute; and Member of Executive Board, SMU Cox School of Business Formerly: Chairman and Chief Executive Officer, Invesco Advisers, Inc. (registered investment adviser); Director, Chairman, Chief Executive Officer and President, IVZ Inc. (holding company), INVESCO Group Services, Inc. (service provider) and Invesco North American Holdings, Inc. (holding company); Director, Chief Executive Officer and President, Invesco Holding Company Limited (parent of Invesco and a global investment management firm); Director, Invesco Ltd.; Chairman, Investment Company Institute and President, Co-Chief Executive Officer, Co-President, Chief Operating Officer and Chief Financial Officer, Franklin Resources, Inc. (global investment management organization). | | 144 | | None |
Philip A. Taylor2 — 1954 Trustee, President and Principal Executive Officer | | 2006 | | Head of North American Retail and Senior Managing Director, Invesco Ltd.; Director, Co-Chairman, Co-President and Co-Chief Executive Officer, Invesco Advisers, Inc. (formerly known as Invesco Institutional (N.A.), Inc.) (registered investment adviser); Director, Chairman, Chief Executive Officer and President, Invesco Management Group, Inc. (formerly known as Invesco Aim Management Group, Inc.) (financial services holding company); Director and President, INVESCO Funds Group, Inc. (registered investment adviser and registered transfer agent); Director and Chairman, Invesco Investment Services, Inc. (formerly known as Invesco Aim Investment Services, Inc.) (registered transfer agent) and IVZ Distributors, Inc. (formerly known as INVESCO Distributors, Inc.) (registered broker dealer); Director, President and Chairman, Invesco Inc. (holding company) and Invesco Canada Holdings Inc. (holding company); Chief Executive Officer, Invesco Corporate Class Inc. (corporate mutual fund company) and Invesco Canada Fund Inc. (corporate mutual fund company); Director, Chairman and Chief Executive Officer, Invesco Canada Ltd. (formerly known as Invesco Trimark Ltd./Invesco Trimark Ltèe) (registered investment adviser and registered transfer agent); Trustee, President and Principal Executive Officer, The Invesco Funds (other than AIM Treasurer’s Series Trust (Invesco Treasurer’s Series Trust) and Short-Term Investments Trust); Trustee and Executive Vice President, The Invesco Funds (AIM Treasurer’s Series Trust (Invesco Treasurer’s Series Trust) and Short-Term Investments Trust only); Director, Invesco Investment Advisers LLC (formerly known as Van Kampen Asset Management); Director, Chief Executive Officer and President, Van Kampen Exchange Corp. Formerly: Director and Chairman, Van Kampen Investor Services Inc.; Director, Chief Executive Officer and President, 1371 Preferred Inc. (holding company) and Van Kampen Investments Inc.; Director and President, AIM GP Canada Inc. (general partner for limited partnerships) and Van Kampen Advisors, Inc.; Director and Chief Executive Officer, Invesco Trimark Dealer Inc. (registered broker dealer); Director, Invesco Distributors, Inc. (formerly known as Invesco Aim Distributors, Inc.) (registered broker dealer); Manager, Invesco PowerShares Capital Management LLC; Director, Chief Executive Officer and President, Invesco Advisers, Inc.; Director, Chairman, Chief Executive Officer and President, Invesco Aim Capital Management, Inc.; President, Invesco Trimark Dealer Inc. and Invesco Trimark Ltd./Invesco Trimark Ltèe; Director and President, AIM Trimark Corporate Class Inc. and AIM Trimark Canada Fund Inc.; Senior Managing Director, Invesco Holding Company Limited; Director and Chairman, Fund Management Company (former registered broker dealer); President and Principal Executive Officer, The Invesco Funds (AIM Treasurer’s Series Trust (Invesco Treasurer’s Series Trust), and Short-Term Investments Trust only); President, AIM Trimark Global Fund Inc. and AIM Trimark Canada Fund Inc. | | 144 | | None |
Wayne W. Whalen3 — 1939 Trustee | | 2010 | | Of Counsel, and prior to 2010, partner in the law firm of Skadden, Arps, Slate, Meagher & Flom LLP, legal counsel to certain funds in the Fund Complex | | 144 | | Director of the Mutual fund Directors Forum, a nonprofit membership organization for investment directors; Chairman and Director of the Abraham Lincoln Presidential Library Foundation; and Director of the Stevenson Center for Democracy |
| 1 | Mr. Flanagan is considered an interested person (within the meaning of Section 2(a)(19) of the 1940 Act) of the Trust because he is an officer of the Adviser to the Trust, and an officer and a director of Invesco Ltd., ultimate parent of the Adviser. |
| 2 | Mr. Taylor is considered an interested person (within the meaning of Section 2(a)(19) of the 1940 Act) of the Trust because he is an officer and a director of the Adviser. |
| 3 | Mr. Whalen is retiring effective December 31, 2014. He has been deemed to be an interested person of the Trust because of his prior service as counsel to the predecessor funds of certain Invesco open-end funds and his affiliation with the law firm that served as counsel to such predecessor funds and the Invesco closed-end funds. |
T-1 Invesco Global Health Care Fund
Trustees and Officers—(continued)
| | | | | | | | |
Name, Year of Birth and Position(s) Held with the Trust | | Trustee and/
or Officer Since | | Principal Occupation(s) During Past 5 Years | | Number of Funds in Fund Complex Overseen by Trustee | | Other Directorship(s) Held by Trustee During Past 5 Years |
| Independent Trustees | | | | | | | | |
Bruce L. Crockett — 1944 Trustee and Chair | | 2001 | | Chairman, Crockett Technologies Associates (technology consulting company) Formerly: Director, Captaris (unified messaging provider); Director, President and Chief Executive Officer, COMSAT Corporation; Chairman, Board of Governors of INTELSAT (international communications company); ACE Limited (insurance company); and Investment Company Institute | | 144 | | ALPS (Attorneys Liability Protection Society) (insurance company) |
David C. Arch — 1945 Trustee | | 2010 | | Chairman of Blistex Inc., a consumer health care products manufacturer | | 144 | | Board member of the Illinois Manufacturers’ Association; Member of the Board of Visitors, Institute for the Humanities, University of Michigan; Member of the Audit Committee of the Edward-Elmhurst Hospital |
Frank S. Bayley — 1939 Trustee | | 1987 | | Retired. Formerly: Director, Badgley Funds Inc. (registered investment company) (2 portfolios) and General Partner and Of Counsel, law firm of Baker & McKenzie, LLP | | 144 | | Director and Chairman, C.D. Stimson Company (a real estate investment company); Trustee, The Curtis Institute of Music |
James T. Bunch — 1942 Trustee | | 2003 | | Managing Member, Grumman Hill Group LLC (family office private equity investments) Formerly: Founder, Green Manning & Bunch Ltd. (investment banking firm) (1988-2010); Executive Committee, United States Golf Association; and Director, Policy Studies, Inc. and Van Gilder Insurance Corporation | | 144 | | Chairman, Board of Governors, Western Golf Association; Chairman, Evans Scholars Foundation; and Director, Denver Film Society |
Rodney F. Dammeyer — 1940 Trustee | | 2010 | | Chairman of CAC,LLC, (private company offering capital investment and management advisory services) Formerly: Prior to 2001, Managing Partner at Equity Group Corporate Investments; Prior to 1995, Chief Executive Officer of Itel Corporation (formerly Anixter International); Prior to 1985, experience includes Senior Vice President and Chief Financial Officer of Household International, Inc., Executive Vice President and Chief Financial Officer of Northwest Industries, Inc. and Partner of Arthur Andersen & Co.; From 1987 to 2010, Director/Trustee of investment companies in the Van Kampen Funds complex | | 144 | | Director of Quidel Corporation and Stericycle, Inc. |
Albert R. Dowden — 1941 Trustee | | 2001 | | Director of a number of public and private business corporations, including the Boss Group, Ltd. (private investment and management); Nature’s Sunshine Products, Inc. and Reich & Tang Funds (5 portfolios) (registered investment company) Formerly: Director, Homeowners of America Holding Corporation/Homeowners of America Insurance Company (property casualty company); Director, Continental Energy Services, LLC (oil and gas pipeline service); Director, CompuDyne Corporation (provider of product and services to the public security market) and Director, Annuity and Life Re (Holdings), Ltd. (reinsurance company); Director, President and Chief Executive Officer, Volvo Group North America, Inc.; Senior Vice President, AB Volvo; Director of various public and private corporations; Chairman, DHJ Media, Inc.; Director, Magellan Insurance Company; and Director, The Hertz Corporation, Genmar Corporation (boat manufacturer), National Media Corporation; Advisory Board of Rotary Power International (designer, manufacturer, and seller of rotary power engines); and Chairman, Cortland Trust, Inc. (registered investment company) | | 144 | | Director of: Nature’s Sunshine Products, Inc., Reich & Tang Funds, Homeowners of America Holding Corporation/ Homeowners of America Insurance Company, the Boss Group |
Jack M. Fields — 1952 Trustee | | 2001 | | Chief Executive Officer, Twenty First Century Group, Inc. (government affairs company); Owner and Chief Executive Officer, Dos Angeles Ranch, L.P. (cattle, hunting, corporate entertainment); and Discovery Global Education Fund (non-profit) Formerly: Chief Executive Officer, Texana Timber LP (sustainable forestry company); Director of Cross Timbers Quail Research Ranch (non-profit); and member of the U.S. House of Representatives | | 144 | | Insperity, Inc. (formerly known as Administaff) |
Prema Mathai-Davis — 1950 Trustee | | 2001 | | Retired. Formerly: Chief Executive Officer, YWCA of the U.S.A. | | 144 | | None |
Larry Soll — 1942 Trustee | | 2003 | | Retired. Formerly: Chairman, Chief Executive Officer and President, Synergen Corp. (a biotechnology company) | | 144 | | None |
Hugo F. Sonnenschein — 1940 Trustee | | 2010 | | President Emeritus and Honorary Trustee of the University of Chicago and the Adam Smith Distinguished Service Professor in the Department of Economics at the University of Chicago. Prior to 2000, President of the University of Chicago | | 144 | | Trustee of the University of Rochester and a member of its investment committee; Member of the National Academy of Sciences and the American Philosophical Society; Fellow of the American Academy of Arts and Sciences |
T-2 Invesco Global Health Care Fund
Trustees and Officers—(continued)
| | | | | | | | |
Name, Year of Birth and Position(s) Held with the Trust | | Trustee and/
or Officer Since | | Principal Occupation(s) During Past 5 Years | | Number of Funds in Fund Complex Overseen by Trustee | | Other Directorship(s) Held by Trustee During Past 5 Years |
| Independent Trustees—(continued) |
Raymond Stickel, Jr. — 1944 Trustee | | 2005 | | Retired. Formerly: Director, Mainstay VP Series Funds, Inc. (25 portfolios) and Partner, Deloitte & Touche | | 144 | | None |
Suzanne H. Woolsey — 1941 Trustee | | 2014 | | Chief Executive Officer of Woolsey Partners LLC | | 144 | | Emeritus Chair of the Board of Trustees of the Institute for Defense Analyses; Trustee of Colorado College; Trustee of California Institute of Technology; Prior to 2014, Director of Fluor Corp.; Prior to 2010, Trustee of the German Marshall Fund of the United States; Prior to 2010 Trustee of the Rocky Mountain Institute |
| Other Officers | | | | | | | | |
Russell C. Burk — 1958 Senior Vice President and Senior Officer | | 2005 | | Senior Vice President and Senior Officer, The Invesco Funds | | N/A | | N/A |
John M. Zerr — 1962 Senior Vice President, Chief Legal Officer and Secretary | | 2006 | | Director, Senior Vice President, Secretary and General Counsel, Invesco Management Group, Inc. (formerly known as Invesco Aim Management Group, Inc.) and Van Kampen Exchange Corp.; Senior Vice President, Invesco Advisers, Inc. (formerly known as Invesco Institutional (N.A.), Inc.) (registered investment adviser); Senior Vice President and Secretary, Invesco Distributors, Inc. (formerly known as Invesco Aim Distributors, Inc.); Director, Vice President and Secretary, Invesco Investment Services, Inc. (formerly known as Invesco Aim Investment Services, Inc.) and IVZ Distributors, Inc. (formerly known as INVESCO Distributors, Inc.); Director and Vice President, INVESCO Funds Group, Inc.; Senior Vice President, Chief Legal Officer and Secretary, The Invesco Funds; Manager, Invesco PowerShares Capital Management LLC; Director, Secretary and General Counsel, Invesco Investment Advisers LLC (formerly known as Van Kampen Asset Management); Secretary and General Counsel, Invesco Capital Markets, Inc. (formerly known as Van Kampen Funds Inc.) and Chief Legal Officer, PowerShares Exchange-Traded Fund Trust, PowerShares Exchange-Traded Fund Trust II, PowerShares India Exchange-Traded Fund Trust, PowerShares Actively Managed Exchange-Traded Fund Trust; and PowerShares Actively Managed Exchange-Traded Commodity Fund Trust Formerly: Director and Vice President, Van Kampen Advisors Inc.; Director, Vice President, Secretary and General Counsel, Van Kampen Investor Services Inc.; Director, Invesco Distributors, Inc. (formerly known as Invesco Aim Distributors, Inc.); Director, Senior Vice President, General Counsel and Secretary, Invesco Aim Advisers, Inc. and Van Kampen Investments Inc.; Director, Vice President and Secretary, Fund Management Company; Director, Senior Vice President, Secretary, General Counsel and Vice President, Invesco Aim Capital Management, Inc.; Chief Operating Officer and General Counsel, Liberty Ridge Capital, Inc. (an investment adviser); Vice President and Secretary, PBHG Funds (an investment company) and PBHG Insurance Series Fund (an investment company); Chief Operating Officer, General Counsel and Secretary, Old Mutual Investment Partners (a broker-dealer); General Counsel and Secretary, Old Mutual Fund Services (an administrator) and Old Mutual Shareholder Services (a shareholder servicing center); Executive Vice President, General Counsel and Secretary, Old Mutual Capital, Inc. (an investment adviser); and Vice President and Secretary, Old Mutual Advisors Funds (an investment company) | | N/A | | N/A |
Sheri Morris — 1964 Vice President, Treasurer and Principal Financial Officer | | 1999 | | Vice President, Treasurer and Principal Financial Officer, The Invesco Funds; Vice President, Invesco Advisers, Inc. (formerly known as Invesco Institutional (N.A.), Inc.) (registered investment adviser); and Vice President, PowerShares Exchange-Traded Fund Trust, PowerShares Exchange-Traded Fund Trust II, PowerShares India Exchange-Traded Fund Trust, PowerShares Actively Managed Exchange-Traded Fund Trust, and PowerShares Actively Managed Exchange-Traded Commodity Fund Trust Formerly: Vice President, Invesco Aim Advisers, Inc., Invesco Aim Capital Management, Inc. and Invesco Aim Private Asset Management, Inc.; Assistant Vice President and Assistant Treasurer, The Invesco Funds and Assistant Vice President, Invesco Advisers, Inc., Invesco Aim Capital Management, Inc. and Invesco Aim Private Asset Management, Inc.; and Treasurer, PowerShares Exchange-Traded Fund Trust, PowerShares Exchange-Traded Fund Trust II, PowerShares India Exchange-Traded Fund Trust and PowerShares Actively Managed Exchange-Traded Fund Trust | | N/A | | N/A |
T-3 Invesco Global Health Care Fund
Trustees and Officers—(continued)
| | | | | | | | |
Name, Year of Birth and Position(s) Held with the Trust | | Trustee and/
or Officer Since | | Principal Occupation(s) During Past 5 Years | | Number of Funds in Fund Complex Overseen by Trustee | | Other Directorship(s) Held by Trustee During Past 5 Years |
| Other Officers—(continued) | | | | | | | | |
Karen Dunn Kelley — 1960 Vice President | | 2004 | | Senior Managing Director, Investments; Director, Co-President, Co-Chief Executive Officer, and Co-Chairman, Invesco Advisers, Inc. (formerly known as Invesco Institutional (N.A.), Inc.) (registered investment adviser); Chairman, Invesco Senior Secured Management, Inc.; Senior Vice President, Invesco Management Group, Inc. (formerly known as Invesco Aim Management Group, Inc.); Executive Vice President, Invesco Distributors, Inc. (formerly known as Invesco Aim Distributors, Inc.); Director, Invesco Mortgage Capital Inc. and Invesco Management Company Limited; Director and President, INVESCO Asset Management (Bermuda) Ltd., Vice President, The Invesco Funds (other than AIM Treasurer’s Series Trust (Invesco Treasurer’s Series Trust) and Short-Term Investments Trust); and President and Principal Executive Officer, The Invesco Funds (AIM Treasurer’s Series Trust (Invesco Treasurer’s Series Trust) and Short-Term Investments Trust only) Formerly: Director, INVESCO Global Asset Management Limited and INVESCO Management S.A.; Senior Vice President, Van Kampen Investments Inc. and Invesco Advisers, Inc. (formerly known as Invesco Institutional (N.A.), Inc.) (registered investment adviser); Vice President, Invesco Advisers, Inc. (formerly known as Invesco Institutional (N.A.), Inc.); Director of Cash Management and Senior Vice President, Invesco Advisers, Inc. and Invesco Aim Capital Management, Inc.; Director and President, Fund Management Company; Chief Cash Management Officer, Director of Cash Management, Senior Vice President, and Managing Director, Invesco Aim Capital Management, Inc.; Director of Cash Management, Senior Vice President, and Vice President, Invesco Advisers, Inc. and The Invesco Funds (AIM Treasurer’s Series Trust (Invesco Treasurer’s Series Trust), and Short-Term Investments Trust only) | | N/A | | N/A |
Crissie M. Wisdom — 1969 Anti-Money Laundering Compliance Officer | | 2013 | | Anti-Money Laundering Compliance Officer, Invesco Advisers, Inc. (formerly known as Invesco Institutional (N.A.), Inc.) (registered investment adviser), Invesco Capital Markets, Inc. (formerly known as Van Kampen Funds Inc.), Invesco Distributors, Inc., Invesco Investment Services, Inc., Invesco Management Group, Inc., Van Kampen Exchange Corp., The Invesco Funds, and PowerShares Exchange-Traded Fund Trust, PowerShares Exchange-Traded Fund Trust II, PowerShares India Exchange-Traded Fund Trust, PowerShares Actively Managed Exchange-Traded Fund Trust and PowerShares Actively Managed Exchange-Traded Commodity Fund Trust; and Fraud Prevention Manager and Controls and Risk Analysis Manager for Invesco Investment Services, Inc. | | N/A | | N/A |
Todd L. Spillane — 1958 Chief Compliance Officer | | 2006 | | Senior Vice President, Invesco Management Group, Inc. (formerly known as Invesco Aim Management Group, Inc.) and Van Kampen Exchange Corp.; Senior Vice President and Chief Compliance Officer, Invesco Advisers, Inc. (registered investment adviser) (formerly known as Invesco Institutional (N.A.), Inc.); Chief Compliance Officer, The Invesco Funds; Vice President, Invesco Distributors, Inc. (formerly known as Invesco Aim Distributors, Inc.) and Invesco Investment Services, Inc. (formerly known as Invesco Aim Investment Services, Inc.) Formerly: Chief Compliance Officer, Invesco Funds (Chicago); Senior Vice President, Van Kampen Investments Inc.; Senior Vice President and Chief Compliance Officer, Invesco Aim Advisers, Inc. and Invesco Aim Capital Management, Inc.; Chief Compliance Officer, INVESCO Private Capital Investments, Inc. (holding company), Invesco Private Capital, Inc. (registered investment adviser), Invesco Global Asset Management (N.A.), Inc., Invesco Senior Secured Management, Inc. (registered investment adviser), Van Kampen Investor Services Inc., PowerShares Exchange-Traded Fund Trust, PowerShares Exchange-Traded Fund Trust II, PowerShares India Exchange-Traded Fund Trust and PowerShares Actively Managed Exchange-Traded Fund Trust; and Vice President, Invesco Aim Capital Management, Inc. and Fund Management Company | | N/A | | N/A |
The Statement of Additional Information of the Trust includes additional information about the Fund’s Trustees and is available upon request, without charge, by calling 1.800.959.4246. Please refer to the Fund’s prospectus for information on the Fund’s sub-advisers.
| | | | | | |
Office of the Fund 11 Greenway Plaza, Suite 1000 Houston, TX 77046-1173 | | Investment Adviser Invesco Advisers, Inc. 1555 Peachtree Street, N.E. Atlanta, GA 30309 | | Distributor Invesco Distributors, Inc. 11 Greenway Plaza, Suite 1000 Houston, TX 77046-1173 | | Auditors PricewaterhouseCoopers LLP 1000 Louisiana Street, Suite 5800 Houston, TX 77002-5678 |
| | | |
| | | | | | |
Counsel to the Fund Stradley Ronon Stevens & Young, LLP 2005 Market Street, Suite 2600 Philadelphia, PA 19103-7018 | | Counsel to the Independent Trustees Goodwin Procter LLP 901 New York Avenue, N.W. Washington, D.C. 20001 | | Transfer Agent Invesco Investment Services, Inc. 11 Greenway Plaza, Suite 1000 Houston, TX 77046-1173 | | Custodian State Street Bank and Trust Company 225 Franklin Street Boston, MA 02110-2801 |
T-4 Invesco Global Health Care Fund

Invesco mailing information
Send general correspondence to Invesco Investment Services, Inc., P.O. Box 219078, Kansas City, MO 64121-9078.
Important notice regarding delivery of security holder documents
To reduce Fund expenses, only one copy of most shareholder documents may be mailed to shareholders with multiple accounts at the same address (Householding). Mailing of your shareholder documents may be householded indefinitely unless you instruct us otherwise. If you do not want the mailing of these documents to be combined with those for other members of your household, please contact Invesco Investment Services, Inc. at 800 959 4246 or contact your financial institution. We will begin sending you individual copies for each account within 30 days after receiving your request.
Fund holdings and proxy voting information
The Fund provides a complete list of its holdings four times in each fiscal year, at the quarter ends. For the second and fourth quarters, the lists appear in the Fund’s semiannual and annual reports to shareholders. For the first and third quarters, the Fund files the lists with the Securities and Exchange Commission (SEC) on Form N-Q. The most recent list of portfolio holdings is available at invesco.com/completeqtrholdings. Shareholders can also look up the Fund’s Forms N-Q on the SEC website at sec.gov. Copies of the Fund’s Forms N-Q may be reviewed and copied at the SEC Public Reference Room in Washington, D.C. You can obtain information on the operation of the Public Reference Room, including information about duplicating fee charges, by calling 202 551 8090 or 800 732 0330, or by electronic request at the following email address: publicinfo@sec.gov. The SEC file numbers for the Fund are shown below.
A description of the policies and procedures that the Fund uses to determine how to vote proxies relating to portfolio securities is available without charge, upon request, from our Client Services department at 800 959 4246 or at invesco.com/proxyguidelines. The information is also available on the SEC website, sec.gov.
| | |
Information regarding how the Fund voted proxies related to its portfolio securities during the most recent 12-month period ended June 30 is available at invesco.com/proxysearch. The information is also available on the SEC website, sec.gov. Invesco Advisers, Inc. is an investment adviser; it provides investment advisory services to individual and institutional clients and does not sell securities. Invesco Distributors, Inc. is the US distributor for Invesco Ltd.’s retail mutual funds, exchange-traded funds and institutional money market funds. Both are wholly owned, indirect subsidiaries of Invesco Ltd. | |  |
| | | | |
| SEC file numbers: 811-05426 and 033-19338 | | GHC-AR-1 | | Invesco Distributors, Inc. |

Letters to Shareholders
| | |

Philip Taylor | | Dear Shareholders: This annual report includes information about your Fund, including performance data and a complete list of its investments as of the close of the reporting period. Inside, your Fund’s portfolio managers discuss how they managed your Fund and the factors that affected its performance during the reporting period. I hope you find this report of interest. During the reporting period covered by this report, the US economy showed signs of continued improvement. After contracting in the first quarter of 2014, the economy expanded strongly in the second quarter and unemployment trended lower. Much of the credit for this improvement goes to the US Federal Reserve (the Fed), which undertook an extraordinary asset purchase program following the global financial crisis. The Fed’s goal was to jumpstart the economy by encouraging banks to lend more, businesses to hire more and consumers to spend more. Signs of a stronger US economy prompted the Fed to reduce, or “taper,” its asset |
| purchase program. Despite this, interest rates remained near historical low levels due largely to heavy investor demand for bonds. While signs of economic improvement were evident in the US, European economies showed signs of weakening. That, together with geopolitical uncertainty and worries about the first diagnosed cases of Ebola outside of Africa, caused increased volatility in US and European equities. |
Extended periods of market strength can lull investors into complacency – just as prolonged periods of market weakness or volatility can discourage investors from initiating long-term investment plans. That’s why Invesco has always encouraged investors to work with a professional financial adviser who can stress the importance of starting to save and invest early and the importance of adhering to a disciplined investment plan – when times are good and when they’re uncertain. A financial adviser who knows your unique financial situation, investment goals and risk tolerance can be an invaluable partner as you seek to achieve your financial goals. He or she can offer a long-term perspective when markets are volatile and time-tested advice and guidance when your financial situation or investment goals change.
Timely information when and where you want it
Invesco’s efforts to help investors achieve their financial objectives include providing individual investors and financial professionals with timely information about the markets, the economy and investing – whenever and wherever they want it.
Our website, invesco.com/us, offers a wide range of market insights and investment perspectives. On the website, you’ll find detailed information about our funds, including prices, performance, holdings and portfolio manager commentaries. You can access information about your individual Invesco account whenever it’s convenient for you; just complete a simple, secure online registration. Use the “Log In” box on our home page to get started.
Invesco’s mobile app for iPad® (available free from the App StoreSM) allows you to obtain the same detailed information about your Fund and the same investment insights from our investment leaders, market strategists, economists and retirement experts on the go. You also can watch portfolio manager videos and have instant access to Invesco news and updates wherever you may be.
In addition to the resources accessible on our website and through our mobile app, you can obtain timely updates to help you stay informed about the markets, the economy and investing by connecting with Invesco on Twitter, LinkedIn or Facebook. You can access our blog at blog.invesco.us.com. Our goal is to provide you the information you want, when and where you want it.
Have questions?
For questions about your account, feel free to contact an Invesco client services representative at 800 959 4246. For Invesco-related questions or comments, please email me directly at phil@invesco.com.
All of us at Invesco look forward to serving your investment management needs for many years to come. Thank you for investing with us.
Sincerely,

Philip Taylor
Senior Managing Director, Invesco Ltd.
iPad is a trademark of Apple Inc., registered in the US and other countries. App Store is a service mark of Apple Inc. Invesco Distributors, Inc. is not affiliated with Apple Inc.
2 Invesco Global Infrastructure Fund
| | |

Bruce Crockett | | Dear Fellow Shareholders: There are a variety of factors that can impact investment performance, many of which are uncontrollable by us as investors. These factors can include various economic trends and geopolitical developments. While the members of the Invesco Funds Board, which I chair, can’t dictate the performance of the Invesco funds, be assured that your Board works diligently throughout the year to focus on how your investments are managed. Our job is to represent you and your interests on a variety of fund management-related matters. We regularly monitor how the portfolio management teams of the Invesco funds are performing in light of ever-changing and often unpredictable economic and market conditions. We review the investment strategies and investment process employed by each fund’s management team as explained in the fund’s prospectus. |
| | Perhaps our most significant responsibility is conducting the annual review of the funds’ |
advisory and sub-advisory contracts with Invesco Advisers and its affiliates. This annual review, which is required by the Investment Company Act of 1940, focuses on the nature and quality of the services Invesco provides as the adviser to the Invesco funds and the reasonableness of the fees that it charges for those services. Each year, we spend months carefully reviewing information from Invesco that allows us to evaluate the quality of its services and the reasonableness of its fees. We also use information from a variety of independent sources, including materials provided by the independent senior officer of the Invesco funds, who reports directly to the independent trustees on the Board. Additionally, we meet with legal counsel and review performance and fee data prepared for us by Lipper Inc., an independent, third-party firm widely recognized as a leader in its field.
After a careful review, the members of the Invesco Funds Board approved the continuation of advisory and sub-advisory contracts with Invesco Advisers and its affiliates. Be assured that your Board will continue working on behalf of fund shareholders, keeping your needs and interests uppermost in our minds.
As always, please contact me at bruce@brucecrockett.com with any questions or concerns you may have. On behalf of the Board, we look forward to continuing to represent your interests and serving your needs.
Sincerely,

Bruce L. Crockett
Independent Chair
Invesco Funds Board of Trustees
3 Invesco Global Infrastructure Fund
Management’s Discussion of Fund Performance
Performance summary
Invesco Global Infrastructure Fund incepted on May 2, 2014. From the Fund’s inception to the end of the reporting period on October 31, 2014, global infrastructure equities, as measured by the Dow Jones Brookfield Global Infrastructure Index, delivered positive returns and outperformed broad market global equities, as measured by the MSCI World Index. At net asset value (NAV), Invesco Global Infrastructure Fund generally performed in line with its style-specific benchmark, the Dow Jones Brookfield Global Infrastructure Index. Primary contributors to the Fund’s absolute performance included midstream services, gas distribution and electric utilities.
Additional information about your Fund’s performance appears later in this report.
Fund vs. Indexes
Cumulative total returns, 5/2/14 to 10/31/14, at net asset value (NAV). Performance shown does not include applicable contingent deferred sales charges (CDSC) or front-end sales charges, which would have reduced performance.
| | | | |
Class A Shares | | | 7.12 | % |
Class C Shares | | | 6.71 | |
Class R Shares | | | 7.05 | |
Class Y Shares | | | 7.29 | |
Class R5 Shares | | | 7.29 | |
Class R6 Shares | | | 7.29 | |
MSCI World Indexq (Broad Market Index) | | | 2.11 | |
Dow Jones Brookfield Global Infrastructure Indexq (Style-Specific Index) | | | 7.74 | |
Lipper Global Infrastructure Funds Classification Averagen (Peer Group) | | | 4.32 | |
Source(s): qFactSet Research Systems Inc.; nLipper Inc.
Market conditions and your Fund
Global equity markets rose modestly during the period from the Fund’s inception on May 2, 2014, to the close of the reporting period on October 31, 2014, as diverging paths for economic growth and monetary policy became evident across the globe. The US and the UK remained on a more positive trajectory, with improvements in employment and domestic demand. In fact, the US Federal Reserve ended its extraordinary bond-buying program, called quantitative easing, with a final purchase in October.
However, weakness in Europe caused speculation over the potential for further stimulus.
Elsewhere, slowing economic growth in China and concerns over levels of debt in the economy resulted in the People’s Bank of China injecting additional liquidity into the banking system. Weakening trends in Japan were met with the announcement of additional asset purchase-based quantitative easing. Political uncertainty in the Middle East and Russia added to market concerns. Investors’ risk appetite diminished and volatility spiked toward the end of the reporting period.
However, equity markets staged a recovery in the last few weeks of October.
Yields on 10-year US Treasuries and commodity prices were volatile and ended the reporting period lower, while the US dollar rose to a four-year high versus other major currencies. In general, global infrastructure stocks produced positive returns and outperformed broad market global equities during the reporting period. The Fund, at NAV, also produced positive returns and generally performed in line with its style-specific benchmark, the Dow Jones Brookfield Global Infrastructure Index.
On an absolute basis, diversified infrastructure in Spain and airports in New Zealand and France detracted from Fund performance. Midstream services stocks – stocks of companies that operate in the middle of the energy value chain, providing gathering, processing and transportation for crude oil and natural gas – were the largest contributors to absolute Fund performance, particularly in the US. Other key contributors included gas distribution, electric utilities, telecommunications and water.
From a country standpoint, US equities, which averaged approximately 50% of total net assets during the reporting period, were primary contributors to Fund performance. Equities in the UK, Canada and Australia were also key contributors. Conversely, equities in France and Italy were key detractors.
Top individual contributors to performance included Williams Companies and American Tower. Williams Companies is one of the largest providers of energy infrastructure in North America. With operations including deep-water Gulf of Mexico, US onshore and Canadian oil
| | | | |
| Portfolio Composition | | | |
| By infrastructure sectors | |
| | | | |
Midstream Services | | | 31.2 | % |
Gas Distribution | | | 25.6 | |
Telecommunications | | | 12.4 | |
Electric Utilities | | | 11.3 | |
Water | | | 4.9 | |
Tolls | | | 4.3 | |
Airports | | | 3.5 | |
Ports & Rail | | | 2.7 | |
Diversified | | | 1.5 | |
Money Market Funds | | | | |
Plus Other Assets Less Liabilities | | | 2.6 | |
| | | | | | |
Top 10 Equity Holdings* | | | |
| | | |
| 1. | | National Grid PLC | | | 7.6 | % |
| 2. | | Williams Cos. Inc. (The) | | | 5.8 | |
| 3. | | American Tower Corp. | | | 5.3 | |
| 4. | | Kinder Morgan Inc. | | | 4.0 | |
| 5. | | Sempra Energy | | | 3.7 | |
| 6. | | Enbridge Inc. | | | 3.6 | |
| 7. | | Energy Transfer Equity, L.P. | | | 2.8 | |
| 8. | | Crown Castle International Corp. | | | 2.8 | |
| 9. | | Pembina Pipeline Corp. | | | 2.4 | |
| 10. | | TransCanada Corp. | | | 2.3 | |
| | | | |
| Total Net Assets | | $ | 5.0 million | |
| |
| Total Number of Holdings* | | | 63 | |
The Fund’s holdings are subject to change, and there is no assurance that the Fund will continue to hold any particular security.
*Excluding money market fund holdings.
4 Invesco Global Infrastructure Fund
sands, its primary businesses include interstate natural gas pipelines, midstream gathering and processing, natural gas and natural gas liquids transportation, as well as olefins production for petrochemical feedstocks. American Tower, a real estate investment trust, is a global provider of wireless communications infrastructure. It operates in 12 countries across five continents and recently raised its outlook for 2014 revenue and earnings, given expectations for increased mobile data usage.
Individual detractors from performance included Atlantia and Ferrovial. Atlantia is an Italian company that owns and operates toll roads, primarily connecting major urban centers in Italy. The company also owns toll roads in Brazil, Chile, India and Poland as well as Rome’s airport network. We particularly liked the long length of its contracts, its diversified asset base, its current yield and its dividend distribution growth prospects. Ferrovial is a global leader in transportation infrastructure. It operates a diversified line of infrastructure assets and projects in more than 25 countries, including services for municipalities and highways, toll roads, construction and airports. Ferrovial manages key assets such as Canada’s 407 ETR highway and London’s Heath-row Airport.
During the reporting period, on average, the Fund had overweight exposure to midstream services, tolls, airports and telecommunications relative to its benchmark. The Fund had underweight exposure to electric utilities, gas distribution, ports and rail, water and diversified infrastructure. In general, the Fund had a bias toward higher quality assets, generally lower leveraged balance sheets and above-average growth prospects.
We thank you for your investment in Invesco Global Infrastructure Fund.
The views and opinions expressed in management’s discussion of Fund performance are those of Invesco Advisers, Inc. These views and opinions are subject to change at any time based on factors such as market and economic conditions. These views and opinions may not be relied upon as investment advice or recommendations, or as an offer for a particular security. The information is not a complete analysis of every aspect of any market, country, industry, security or the Fund. Statements of fact are from sources considered reliable, but Invesco Advisers, Inc. makes no representation or warranty as to their completeness or accuracy. Although historical performance is no guarantee of future results, these insights may help you understand our investment management philosophy.
See important Fund and, if applicable, index disclosures later in this report.
| | |
 | | Joe Rodriguez, Jr. Portfolio Manager, is lead manager of Invesco Global Infrastructure Fund. He is Head of Global |
| Securities with Invesco Real Estate, where he overseas all phases of the unit, including securities research and administration. Mr. Rodriguez joined Invesco in 1990. He earned a BBA in economics and finance and an MBA in finance from Baylor University. |
| | |
 | | Mark Blackburn Chartered Financial Analyst, Portfolio Manager, is manager of Invesco Global Infrastructure Fund. |
He joined Invesco in 1998. Mr. Blackburn earned a BS in accounting from Louisiana State University and an MBA from Southern Methodist University. |
| | |
 | | James Cowen Portfolio Manager, is manager of Invesco Global Infrastructure Fund. He joined Invesco in 2000. |
| Mr. Cowen earned a Master of Town and Country Planning degree from the University of Manchester and a Master of Philosophy degree in land economy from Cambridge University. |
| | |
 | | Paul Curbo Chartered Financial Analyst, Portfolio Manager, is manager of Invesco Global Infrastructure Fund. |
| He joined Invesco in 1998. Mr. Curbo earned a BBA in finance from The University of Texas at Austin. |
| | |
 | | Darin Turner Portfolio Manager, is manager of Invesco Global Infrastructure Fund. He joined Invesco in 2005. |
| Mr. Turner earned a BBA in finance from Baylor University, an MS in real estate from The University of Texas at Arlington and an MBA specializing in investments from Southern Methodist University. |
| | |
 | | Ping-Ying Wang Chartered Financial Analyst, Portfolio Manager, is manager of Invesco Global Infrastructure Fund. |
| She joined Invesco in 1998. Ms. Wang earned a BS in international finance from the People’s University of China and a PhD in finance from The University of Texas at Dallas. |
5 Invesco Global Infrastructure Fund
Your Fund’s Performance
| | | | |
| Cumulative Total Returns | |
As of 10/31/14, including maximum applicable sales charges | |
| Class A Shares | | | | |
| Inception (5/2/14) | | | 1.25 | % |
| |
| Class C Shares | | | | |
| Inception (5/2/14) | | | 5.71 | % |
| |
| Class R Shares | | | | |
| Inception (5/2/14) | | | 7.05 | % |
| |
| Class Y Shares | | | | |
| Inception (5/2/14) | | | 7.29 | % |
| |
| Class R5 Shares | | | | |
| Inception (5/2/14) | | | 7.29 | % |
| |
| Class R6 Shares | | | | |
| Inception (5/2/14) | | | 7.29 | % |
The performance data quoted represent past performance and cannot guarantee comparable future results; current performance may be lower or higher. Please visit invesco.com/performance for the most recent month-end performance. Performance figures reflect reinvested distributions, changes in net asset value and the effect of the maximum sales charge unless otherwise stated. Performance figures do not reflect deduction of taxes a shareholder would pay on Fund distributions or sale of Fund shares. Investment return and principal value will fluctuate so that you may have a gain or loss when you sell shares.
The net annual Fund operating expense ratio set forth in the most recent Fund prospectus as of the date of this report for Class A, Class C, Class R, Class Y, Class R5 and Class R6 shares was 1.40%, 2.15%, 1.65%, 1.15%, 1.15% and 1.15%, respectively.1 The total annual Fund operating expense ratio set forth in the most recent Fund prospectus as of the date of this report for Class A, Class C, Class R, Class Y, Class R5 and Class R6 shares was 3.04%, 3.79%, 3.29%, 2.79%, 2.68% and 2.63%, respectively. The expense ratios presented above may vary from the expense ratios presented in other sections of this report that are based on expenses incurred during the period covered by this report.
| | | | |
| Cumulative Total Returns | |
As of 9/30/14, the most recent calendar quarter end, including maximum applicable sales charges | |
| Class A Shares | | | | |
| Inception (5/2/14) | | | -0.65 | % |
| |
| Class C Shares | | | | |
| Inception (5/2/14) | | | 3.81 | % |
| |
| Class R Shares | | | | |
| Inception (5/2/14) | | | 5.04 | % |
| |
| Class Y Shares | | | | |
| Inception (5/2/14) | | | 5.17 | % |
| |
| Class R5 Shares | | | | |
| Inception (5/2/14) | | | 5.18 | % |
| |
| Class R6 Shares | | | | |
| Inception (5/2/14) | | | 5.18 | % |
Class A share performance reflects the maximum 5.50% sales charge, and Class C share performance reflects the applicable contingent deferred sales charge (CDSC) for the period involved. The CDSC on Class C shares is 1% for the first year after purchase. Class R, Class Y, Class R5 and Class R6 class shares do not have a front-end sales charge or a CDSC; therefore, performance is at net asset value.
The performance of the Fund’s share classes will differ primarily due to different sales charge structures and class expenses.
Had the adviser not waived fees and/ or reimbursed expenses, performance would have been lower.
| 1 | Total annual Fund operating expenses after any contractual fee waivers and/or expense reimbursements by the adviser in effect through at least February 29, 2016. See current prospectus for more information. |
6 Invesco Global Infrastructure Fund
Invesco Global Infrastructure Fund’s investment objective is total return through growth of capital and current income.
| n | | Unless otherwise stated, information presented in this report is as of October 31, 2014, and is based on total net assets. |
| n | | Unless otherwise noted, all data provided by Invesco. |
| n | | To access your Fund’s reports/prospectus, visit invesco.com/fundreports. |
About share classes
| n | | Class R shares are generally available only to employer sponsored retirement and benefit plans. Please see the prospectus for more information. |
| n | | Class Y shares are available only to certain investors. Please see the prospectus for more information. |
| n | | Class R5 shares and Class R6 shares are primarily intended for employer sponsored retirement and benefit plans that meet certain standards and for institutional investors. Please see the prospectus for more information. |
Principal risks of investing in the Fund
| n | | Currency/exchange rate risk. The dollar value of the Fund’s foreign investments will be affected by changes in the exchange rates between the dollar and the currencies in which those investments are traded. |
| n | | Depositary receipts risk. Depositary receipts involve many of the same risks as those associated with direct investment in foreign securities. In addition, the underlying issuers of certain depositary receipts, particularly unsponsored or unregistered depositary receipts, are under no obligation to distribute shareholder communications to the holders of such receipts or to pass through to them any voting rights with respect to the deposited securities. |
| n | | Derivatives risk. The value of a derivative instrument depends largely on (and is derived from) the value of an underlying security, currency, commodity, interest rate, index or other asset (each referred to as an underlying asset). In addition to risks relating to the underlying assets, the use of derivatives may include other, possibly greater, risks, including counterparty, leverage and liquidity risks. Counterparty risk is the risk that the counterparty to the derivative contract will default on its obligation to pay the Fund the amount owed or otherwise perform under the derivative contract. Derivatives create leverage risk because they do not require payment up |
front equal to the economic exposure created by owning the derivative. As a result, an adverse change in the value of the underlying asset could result in the Fund sustaining a loss that is substantially greater than the amount invested in the derivative, which may make the Fund’s returns more volatile and increase the risk of loss. Derivative instruments may also be less liquid than more traditional investments and the Fund may be unable to sell or close out its derivative positions at a desirable time or price. This risk may be more acute under adverse market conditions, during which the Fund may be most in need of liquidating its derivative positions. Derivatives may also be harder to value, less tax efficient and subject to changing government regulation that could impact the Fund’s ability to use certain derivatives or their cost. Also, derivatives used for hedging or to gain or limit exposure to a particular market segment may not provide the expected benefits, particularly during adverse market conditions.
| n | | Emerging markets securities risk. The prices of securities issued by foreign companies and governments located in emerging markets countries may be affected more negatively by inflation, devaluation of their currencies, higher transaction costs, delays in settlement, adverse political developments, the introduction of capital controls, withholding taxes, nationalization of private assets, expropriation, social unrest, war or lack of timely information than those in developed countries. |
| n | | Energy industry sector risk. The Fund will concentrate its investments in the securities of issuers engaged primarily in energy-related industries. The businesses in which the Fund invests may be adversely affected by foreign, federal or state regulations governing energy production, distribution and sale as well as supply-and-demand for energy resources. Although individual security selection drives the performance of the Fund, short-term fluctuations in energy prices may cause price fluctuations in its shares. |
| n | | Foreign securities risk. The Fund’s foreign investments may be affected by changes in a foreign country’s exchange rates, political and social instability, changes in economic or taxation policies, difficulties when enforcing obligations, decreased liquidity, and increased volatility. Foreign companies may be subject to less regulation resulting in less publicly available information about the companies. |
| n | | Geographic focus risk. From time to time the Fund may invest a substantial amount of its assets in securities of issuers located in a single country or a limited number of countries. If the Fund focuses its investments in this manner, it assumes the risk that economic, political and social conditions in those countries will have a significant impact on its investment performance. The Fund’s investment performance may also be more volatile if it focuses its investments in certain countries, especially emerging markets countries. |
| n | | Infrastructure-related companies risk. The Fund will concentrate its investments in the infrastructure industry. Infrastructure-related companies are subject to a variety of factors that may adversely affect their business or operations, including costs associated with environmental, governmental and other regulations, high interest costs in connection with capital construction programs, high leverage, the effects of economic slowdown, surplus capacity, increased competition from other providers of services, uncertainties concerning the availability of fuel at reasonable prices, the effects of energy conservation policies, unfavorable tax laws or accounting policies, and other factors. Infrastructure-related companies are also affected by environmental damage due to a company’s operations or an accident, difficulty in raising capital in adequate amounts on reasonable terms in periods of high inflation and unsettled capital markets, increased susceptibility to terrorist acts or political actions, and general changes in market sentiment towards infrastructure assets. |
| n | | Management risk. The investment techniques and risk analysis used by the Fund’s portfolio managers may not produce the desired results. |
continued on page 8
This report must be accompanied or preceded by a currently effective Fund prospectus, which contains more complete information, including sales charges and expenses. Investors should read it carefully before investing.
NOT FDIC INSURED | MAY LOSE VALUE | NO BANK GUARANTEE
7 Invesco Global Infrastructure Fund
| n | | Market risk. The prices of and the income generated by the Fund’s securities may decline in response to, among other things, investor sentiment, general economic and market conditions, regional or global instability, and currency and interest rate fluctuations. |
| n | | MLP risk. An MLP is a public limited partnership or limited liability company. Although the characteristics of MLPs closely resemble a traditional limited partnership, a major difference is that MLPs may trade on a public exchange or in the over-the-counter market. The ability to trade on a public exchange or in the over-the-counter market provides a certain amount of liquidity not found in many limited partnership investments. However, MLP interests may be less liquid and subject to more abrupt or erratic price movements than conventional publicly traded securities. The risks of investing in an MLP are similar to those of investing in a partnership and include more flexible governance structures, which could result in less protection for investors than investments in a corporation. Investors in an MLP would normally not be liable for the debts of the MLP beyond the amount that the investor has contributed but investors may not be shielded to the same extent that a shareholder of a corporation would be. MLPs are generally considered interest-rate sensitive investments. During periods of interest rate volatility, these investments may not provide attractive returns. MLPs that concentrate in a particular industry or a particular geographic region are subject to risks associated with such industry or region. Additionally, if the Fund were to invest more than 25% of its total assets in MLPs that are taxed as partnerships this could cause the Fund to lose its status as regulated investment company under Subchapter M of the Internal Revenue Code. |
| n | | MLP tax risk. MLPs taxed as partnerships do not pay US federal income tax at the partnership level. Rather, each partner is allocated a share of the partnership’s income, gains, losses, deductions and expenses. A change in current tax law, or a change in the underlying business mix of a given MLP, could result in an MLP being treated as a corporation for US federal income tax purposes, which would result in such MLP being required to pay US federal income tax on its taxable income. The classification of an MLP as a corporation for US federal income tax purposes would have the effect of reducing the amount of cash available for distribution by the MLP. Thus, if any of the MLPs owned by the Fund were treated as a corporation for US federal |
| | income tax purposes, it could result in a reduction of the value of the Fund’s investment, and consequently your investment in the Fund and lower income. MLPs taxed as partnerships file a partnership tax return for US federal, state and local income tax purposes and communicate to each investor in such MLP the investor’s allocable share of the MLP’s income, gains, losses, deductions and expenses via a “Schedule K-1.” Each year, the Fund will send you an annual tax statement (Form 1099) to assist you in completing your federal, state and local tax returns. An MLP might need to amend its partnership tax return and, in turn, send amended Schedules K-1 to investors in the MLP, such as the Fund. When necessary, the Fund will send you a corrected Form 1099 to reflect Schedule K-1 information reclassified by an MLP, which could, in turn, require you to amend your federal, state or local tax returns. |
| n | | Non-diversification risk. The Fund is non-diversified and can invest a greater portion of its assets in a small number of issuers or a single issuer. A change in the value of the issuer could affect the value of the Fund more than if it was a diversified fund. |
| n | | Small- and mid-capitalization risk. Stocks of small- and mid-sized companies tend to be more vulnerable to adverse developments and may have little or no operating history or track record of success, and limited product lines, markets, management and financial resources. The securities of small- and mid-sized companies may be more volatile due to less market interest and less publicly available information about the issuer. They also may be illiquid or restricted as to resale, or may trade less frequently and in smaller volumes, all of which may cause difficulty when establishing or closing a position at a desirable price. |
About indexes used in this report
| n | | The MSCI World IndexSM is an unmanaged index considered representative of stocks of developed countries. The index is computed using the net return, which withholds applicable taxes for non-resident investors. |
| n | | The Dow Jones Brookfield Global Infrastructure Index intends to measure all sectors of the infrastructure market and includes companies domiciled globally that qualify as “pure-play” infrastructure companies – companies whose primary business is the ownership and operation of infrastructure assets, activities that generally generate long-term stable cash flows. |
| n | | The Lipper Global Infrastructure Funds Classification Average represents an average of all of the funds in the Lipper Global Infrastructure Funds classification average. |
| n | | The Fund is not managed to track the performance of any particular index, including the index(es) described here, and consequently, the performance of the Fund may deviate significantly from the performance of the index(es). |
| n | | A direct investment cannot be made in an index. Unless otherwise indicated, index results include reinvested dividends, and they do not reflect sales charges. Performance of the peer group, if applicable, reflects fund expenses; performance of a market index does not. |
Other information
| n | | The returns shown in management’s discussion of Fund performance are based on net asset values (NAVs) calculated for shareholder transactions. Generally accepted accounting principles require adjustments to be made to the net assets of the Fund at period end for financial reporting purposes, and as such, the NAVs for shareholder transactions and the returns based on those NAVs may differ from the NAVs and returns reported in the Financial Highlights. |
8 Invesco Global Infrastructure Fund
Schedule of Investments
October 31, 2014
| | | | | | | | |
| | | Shares | | | Value | |
Common Stocks & Other Equity Interests–97.42% | |
| Australia–3.33% | |
APA Group | | | 5,157 | | | $ | 35,827 | |
Spark Infrastructure Group | | | 8,308 | | | | 13,931 | |
Sydney Airport | | | 2,919 | | | | 11,357 | |
Transurban Group | | | 14,795 | | | | 106,326 | |
| | | | | | | | 167,441 | |
|
| Canada–11.68% | |
Enbridge Inc. | | | 3,868 | | | | 183,051 | |
Fortis, Inc. | | | 2,133 | | | | 69,504 | |
Inter Pipeline Ltd. | | | 1,422 | | | | 44,809 | |
Keyera Corp. | | | 677 | | | | 53,865 | |
Pembina Pipeline Corp. | | | 2,861 | | | | 118,715 | |
TransCanada Corp. | | | 2,381 | | | | 117,370 | |
| | | | | | | | 587,314 | |
|
| China–3.06% | |
Beijing Capital International Airport Co. Ltd.–Class H | | | 18,000 | | | | 13,207 | |
Beijing Enterprises Holdings Ltd. | | | 3,000 | | | | 24,592 | |
China Merchants Holdings International Co. Ltd. | | | 12,000 | | | | 37,911 | |
China Resources Gas Group Ltd. | | | 6,000 | | | | 17,137 | |
ENN Energy Holdings Ltd. | | | 7,000 | | | | 45,402 | |
Jiangsu Expressway Co. Ltd.–Class H | | | 14,000 | | | | 15,634 | |
| | | | | | | | 153,883 | |
|
| France–2.45% | |
Aeroports de Paris | | | 323 | | | | 38,192 | |
Eutelsat Communications S.A. | | | 950 | | | | 30,848 | |
Groupe Eurotunnel S.A.–REGS(a) | | | 4,300 | | | | 54,350 | |
| | | | | | | | 123,390 | |
|
| Hong Kong–1.96% | |
China Gas Holdings Ltd. | | | 14,000 | | | | 25,558 | |
Hong Kong & China Gas Co. Ltd. | | | 29,000 | | | | 67,684 | |
Towngas China Co. Ltd. | | | 5,000 | | | | 5,248 | |
| | | | | | | | 98,490 | |
|
| Italy–3.26% | |
Atlantia S.p.A. | �� | | 4,021 | | | | 94,728 | |
Snam S.p.A. | | | 12,843 | | | | 69,450 | |
| | | | | | | | 164,178 | |
|
| Japan–2.18% | |
Japan Airport Terminal Co., Ltd. | | | 400 | | | | 16,253 | |
Tokyo Gas Co., Ltd. | | | 16,000 | | | | 93,130 | |
| | | | | | | | 109,383 | |
|
| Luxembourg–1.93% | |
SES | | | 2,806 | | | | 96,871 | |
| | | | | | | | |
| | | Shares | | | Value | |
| Mexico–0.52% | |
Grupo Aeroportuario del Sureste S.A.B. de C.V.–ADR | | | 196 | | | $ | 26,397 | |
|
| New Zealand–0.75% | |
Auckland International Airport Ltd. | | | 12,231 | | | | 37,638 | |
|
| Spain–4.50% | |
Enagas S.A. | | | 1,326 | | | | 44,530 | |
Ferrovial S.A. | | | 3,815 | | | | 78,053 | |
Red Electrica Corp. S.A. | | | 1,184 | | | | 103,483 | |
| | | | | | | | 226,066 | |
|
| Switzerland–0.66% | |
Flughafen Zuerich AG | | | 52 | | | | 33,136 | |
|
| United Arab Emirates–0.82% | |
DP World Ltd. | | | 2,156 | | | | 41,309 | |
|
| United Kingdom–10.34% | |
National Grid PLC | | | 25,749 | | | | 381,782 | |
Pennon Group PLC | | | 2,748 | | | | 36,680 | |
Severn Trent PLC | | | 1,220 | | | | 39,009 | |
United Utilities Group PLC | | | 4,544 | | | | 62,212 | |
| | | | | | | | 519,683 | |
|
| United States–49.98% | |
Access Midstream Partners L.P. | | | 994 | | | | 61,916 | |
American Tower Corp. | | | 2,737 | | | | 266,858 | |
American Water Works Co., Inc. | | | 2,059 | | | | 109,889 | |
Atmos Energy Corp. | | | 625 | | | | 33,125 | |
CenterPoint Energy, Inc. | | | 2,985 | | | | 73,282 | |
Consolidated Edison, Inc. | | | 425 | | | | 26,928 | |
Crown Castle International Corp. | | | 1,784 | | | | 139,366 | |
Dominion Resources, Inc. | | | 351 | | | | 25,026 | |
Edison International | | | 819 | | | | 51,253 | |
Energy Transfer Equity, L.P. | | | 2,447 | | | | 142,807 | |
EQT Midstream Partners L.P. | | | 1,155 | | | | 102,310 | |
ITC Holdings Corp. | | | 2,779 | | | | 110,076 | |
Kinder Morgan Inc. | | | 5,239 | | | | 202,749 | |
NiSource Inc. | | | 2,562 | | | | 107,758 | |
Northeast Utilities | | | 1,968 | | | | 97,121 | |
ONEOK, Inc. | | | 1,095 | | | | 64,539 | |
PG&E Corp. | | | 1,911 | | | | 96,162 | |
Piedmont Natural Gas Co., Inc. | | | 481 | | | | 18,283 | |
SBA Communications Corp.–Class A(b) | | | 803 | | | | 90,201 | |
SemGroup Corp.–Class A | | | 263 | | | | 20,185 | |
Sempra Energy | | | 1,671 | | | | 183,810 | |
Southwest Gas Corp. | | | 290 | | | | 16,846 | |
Spectra Energy Corp. | | | 2,910 | | | | 113,868 | |
See accompanying Notes to Financial Statements which are an integral part of the financial statements.
9 Invesco Global Infrastructure Fund
| | | | | | | | |
| | | Shares | | | Value | |
| United States–(continued) | |
Targa Resources Corp. | | | 535 | | | $ | 68,817 | |
Williams Cos. Inc. (The) | | | 5,220 | | | | 289,762 | |
| | | | | | | | 2,512,937 | |
Total Common Stocks & Other Equity Interests
(Cost $4,665,656) | | | | 4,898,116 | |
| | |
Money Market Funds–1.04% | | | | | | | | |
Liquid Assets Portfolio–Institutional Class(c) | | | 26,210 | | | | 26,210 | |
Premier Portfolio–Institutional Class(c) | | | 26,210 | | | | 26,210 | |
Total Money Market Funds
(Cost $52,420) | | | | 52,420 | |
TOTAL INVESTMENTS–98.46%
(Cost $4,718,076) | | | | 4,950,536 | |
OTHER ASSETS LESS LIABILITIES–1.54% | | | | 77,238 | |
NET ASSETS–100.00% | | | $ | 5,027,774 | |
Investment Abbreviations:
| | |
| ADR | | – American Depositary Receipt |
| REGS | | – Regulation S |
Notes to Schedule of Investments:
| (a) | Security purchased or received in transaction exempt from registration under the Securities Act of 1933, as amended (the “1933 Act”). The security may be resold pursuant to an exemption from registration under the 1933 Act, typically to qualified institutional buyers. The value of this security at October 31, 2014 represented 1.08% of the Fund’s Net Assets. |
| (b) | Non-income producing security. |
| (c) | The money market fund and the Fund are affiliated by having the same investment adviser. |
See accompanying Notes to Financial Statements which are an integral part of the financial statements.
10 Invesco Global Infrastructure Fund
Statement of Assets and Liabilities
October 31, 2014
| | | | |
Assets: | |
Investments, at value (Cost $4,665,656) | | $ | 4,898,116 | |
Investments in affiliated money market funds, at value and cost | | | 52,420 | |
Total investments, at value (Cost $4,718,076) | | | 4,950,536 | |
Foreign currencies, at value (Cost $21,549) | | | 21,023 | |
Receivable for: | | | | |
Investments sold | | | 57,911 | |
Fund shares sold | | | 59,726 | |
Dividends | | | 7,414 | |
Fund expenses absorbed | | | 5,820 | |
Investment for trustee deferred compensation and retirement plans | | | 842 | |
Other assets | | | 47,418 | |
Total assets | | | 5,150,690 | |
|
Liabilities: | |
Payable for: | | | | |
Investments purchased | | | 63,647 | |
Accrued fees to affiliates | | | 1,219 | |
Accrued trustees’ and officers’ fees and benefits | | | 1,884 | |
Accrued other operating expenses | | | 55,324 | |
Trustee deferred compensation and retirement plans | | | 842 | |
Total liabilities | | | 122,916 | |
Net assets applicable to shares outstanding | | $ | 5,027,774 | |
|
Net assets consist of: | |
Shares of beneficial interest | | $ | 4,758,871 | |
Undistributed net investment income | | | 39,323 | |
Undistributed net realized gain (loss) | | | (2,609 | ) |
Net unrealized appreciation | | | 232,189 | |
| | | $ | 5,027,774 | |
| | | | |
Net Assets: | |
Class A | | $ | 2,497,250 | |
Class C | | $ | 181,170 | |
Class R | | $ | 13,130 | |
Class Y | | $ | 2,287,482 | |
Class R5 | | $ | 10,681 | |
Class R6 | | $ | 38,061 | |
|
Shares outstanding, $0.01 par value per share,
with an unlimited number of shares authorized: | |
Class A | | | 234,214 | |
Class C | | | 17,025 | |
Class R | | | 1,232 | |
Class Y | | | 214,403 | |
Class R5 | | | 1,001 | |
Class R6 | | | 3,567 | |
Class A: | | | | |
Net asset value per share | | $ | 10.66 | |
Maximum offering price per share | | | | |
(Net asset value of $10.66 ¸ 94.50%) | | $ | 11.28 | |
Class C: | | | | |
Net asset value and offering price per share | | $ | 10.64 | |
Class R: | | | | |
Net asset value and offering price per share | | $ | 10.66 | |
Class Y: | | | | |
Net asset value and offering price per share | | $ | 10.67 | |
Class R5: | | | | |
Net asset value and offering price per share | | $ | 10.67 | |
Class R6: | | | | |
Net asset value and offering price per share | | $ | 10.67 | |
See accompanying Notes to Financial Statements which are an integral part of the financial statements.
11 Invesco Global Infrastructure Fund
Statement of Operations
For the period May 2, 2014 (Commencement date) through October 31, 2014
| | | | |
Investment income: | |
Dividends (net of foreign withholding taxes of $3,111 and return of capital distributions of $3,843) | | $ | 63,223 | |
Dividends from affiliated money market funds | | | 41 | |
Total investment income | | | 63,264 | |
| |
Expenses: | | | | |
Advisory fees | | | 18,312 | |
Administrative services fees | | | 25,068 | |
Custodian fees | | | 16,663 | |
Distribution fees: | | | | |
Class A | | | 2,554 | |
Class C | | | 448 | |
Class R | | | 29 | |
Transfer agent fees — A, C, R and Y | | | 2,368 | |
Transfer agent fees — R5 | | | 5 | |
Transfer agent fees — R6 | | | 7 | |
Trustees’ and officers’ fees and benefits | | | 10,760 | |
Registration and filing fees | | | 46,941 | |
Professional services fees | | | 48,702 | |
Other | | | 13,206 | |
Total expenses | | | 185,063 | |
Less: Fees waived and expenses reimbursed | | | (157,135 | ) |
Net expenses | | | 27,928 | |
Net investment income | | | 35,336 | |
| |
Realized and unrealized gain (loss) from: | | | | |
Net realized gain (loss) from: | | | | |
Investment securities | | | (2,609 | ) |
Foreign currencies | | | (395 | ) |
| | | | (3,004 | ) |
Change in net unrealized appreciation (depreciation) of: | | | | |
Investment securities | | | 232,460 | |
Foreign currencies | | | (271 | ) |
| | | | 232,189 | |
Net realized and unrealized gain | | | 229,185 | |
Net increase in net assets resulting from operations | | $ | 264,521 | |
See accompanying Notes to Financial Statements which are an integral part of the financial statements.
12 Invesco Global Infrastructure Fund
Statement of Changes in Net Assets
For the period May 2, 2014 (Commencement date) through October 31, 2014
| | | | |
| | | 2014 | |
Operations: | | | | |
Net investment income | | $ | 35,336 | |
Net realized gain (loss) | | | (3,004 | ) |
Change in net unrealized appreciation | | | 232,189 | |
Net increase in net assets resulting from operations | | | 264,521 | |
| |
Distributions to shareholders from net investment income: | | | | |
Class A | | | (12,024 | ) |
Class C | | | (540 | ) |
Class R | | | (55 | ) |
Class Y | | | (12,343 | ) |
Class R5 | | | (59 | ) |
Class R6 | | | (59 | ) |
Total distributions from net investment income | | | (25,080 | ) |
| |
Share transactions–net: | | | | |
Class A | | | 2,397,806 | |
Class C | | | 184,137 | |
Class R | | | 12,460 | |
Class Y | | | 2,148,433 | |
Class R5 | | | 10,010 | |
Class R6 | | | 35,487 | |
Net increase in net assets resulting from share transactions | | | 4,788,333 | |
Net increase in net assets | | | 5,027,774 | |
| |
Net assets: | | | | |
Beginning of period | | | — | |
End of period (includes undistributed net investment income of $39,323) | | $ | 5,027,774 | |
Notes to Financial Statements
October 31, 2014
NOTE 1—Significant Accounting Policies
Invesco Global Infrastructure Fund (the “Fund”) is a series portfolio of AIM Investment Funds (Invesco Investment Funds) (the “Trust”). The Trust is organized as a Delaware statutory trust and is registered under the Investment Company Act of 1940, as amended (the “1940 Act”), as an open-end series management investment company consisting of twenty-four separate series portfolios, each authorized to issue an unlimited number of shares of beneficial interest. The assets, liabilities and operations of each portfolio are accounted for separately. Information presented in these financial statements pertains only to the Fund. Matters affecting each portfolio or class will be voted on exclusively by the shareholders of such portfolio or class.
The Fund’s investment objective is total return through growth of capital and current income.
The Fund currently consists of six different classes of shares: Class A, Class C, Class R, Class Y, Class R5 and Class R6. Class A shares are sold with a front-end sales charge unless certain waiver criteria are met and under certain circumstances load waived shares may be subject to contingent deferred sales charges (“CDSC”). Class C shares are sold with a CDSC. Class R, Class Y, Class R5 and Class R6 shares are sold at net asset value.
The following is a summary of the significant accounting policies followed by the Fund in the preparation of its financial statements.
| A. | Security Valuations — Securities, including restricted securities, are valued according to the following policy. |
A security listed or traded on an exchange (except convertible securities) is valued at its last sales price or official closing price as of the close of the customary trading session on the exchange where the security is principally traded, or lacking any sales or official closing price on a particular day, the security may be valued at the closing bid price on that day. Securities traded in the over-the-counter market are valued based on prices furnished by independent pricing services or market makers. When such securities are valued by an independent pricing service they may be considered fair valued. Futures contracts are valued at the final settlement price set by an exchange on which they are principally traded. Listed options are valued at the mean between the last bid and ask prices from the exchange on which they are principally traded. Options not listed on an exchange are valued by an independent source at the mean between the last bid and ask prices. For purposes of determining net asset value per share, futures and option contracts generally are valued 15 minutes after the close of the customary trading session of the New York Stock Exchange (“NYSE”).
13 Invesco Global Infrastructure Fund
Investments in open-end and closed-end registered investment companies that do not trade on an exchange are valued at the end of day net asset value per share. Investments in open-end and closed-end registered investment companies that trade on an exchange are valued at the last sales price or official closing price as of the close of the customary trading session on the exchange where the security is principally traded.
Debt obligations (including convertible securities) and unlisted equities are fair valued using an evaluated quote provided by an independent pricing service. Evaluated quotes provided by the pricing service may be determined without exclusive reliance on quoted prices, and may reflect appropriate factors such as institution-size trading in similar groups of securities, developments related to specific securities, dividend rate (for unlisted equities), yield (for debt obligations), quality, type of issue, coupon rate (for debt obligations), maturity (for debt obligations), individual trading characteristics and other market data. Debt obligations are subject to interest rate and credit risks. In addition, all debt obligations involve some risk of default with respect to interest and/or principal payments.
Foreign securities’ (including foreign exchange contracts) prices are converted into U.S. dollar amounts using the applicable exchange rates as of the close of the NYSE. If market quotations are available and reliable for foreign exchange-traded equity securities, the securities will be valued at the market quotations. Because trading hours for certain foreign securities end before the close of the NYSE, closing market quotations may become unreliable. If between the time trading ends on a particular security and the close of the customary trading session on the NYSE, events occur that the Adviser determines are significant and make the closing price unreliable, the Fund may fair value the security. If the event is likely to have affected the closing price of the security, the security will be valued at fair value in good faith using procedures approved by the Board of Trustees. Adjustments to closing prices to reflect fair value may also be based on a screening process of an independent pricing service to indicate the degree of certainty, based on historical data, that the closing price in the principal market where a foreign security trades is not the current value as of the close of the NYSE. Foreign securities’ prices meeting the approved degree of certainty that the price is not reflective of current value will be priced at the indication of fair value from the independent pricing service. Multiple factors may be considered by the independent pricing service in determining adjustments to reflect fair value and may include information relating to sector indices, American Depositary Receipts and domestic and foreign index futures. Foreign securities may have additional risks including exchange rate changes, potential for sharply devalued currencies and high inflation, political and economic upheaval, the relative lack of issuer information, relatively low market liquidity and the potential lack of strict financial and accounting controls and standards.
Securities for which market prices are not provided by any of the above methods may be valued based upon quotes furnished by independent sources. The last bid price may be used to value equity securities. The mean between the last bid and ask prices is used to value debt obligations, including corporate loans.
Securities for which market quotations are not readily available or became unreliable are valued at fair value as determined in good faith by or under the supervision of the Trust’s officers following procedures approved by the Board of Trustees. Issuer specific events, market trends, bid/ask quotes of brokers and information providers and other market data may be reviewed in the course of making a good faith determination of a security’s fair value.
The Fund may invest in securities that are subject to interest rate risk, meaning the risk that the prices will generally fall as interest rates rise and, conversely, the prices will generally rise as interest rates fall. Specific securities differ in their sensitivity to changes in interest rates depending on their individual characteristics. Changes in interest rates may result in increased market volatility, which may affect the value and/or liquidity of certain of the Fund’s investments.
Valuations change in response to many factors including the historical and prospective earnings of the issuer, the value of the issuer’s assets, general economic conditions, interest rates, investor perceptions and market liquidity. Because of the inherent uncertainties of valuation, the values reflected in the financial statements may materially differ from the value received upon actual sale of those investments.
| B. | Securities Transactions and Investment Income — Securities transactions are accounted for on a trade date basis. Realized gains or losses on sales are computed on the basis of specific identification of the securities sold. Interest income (net of withholding tax, if any) is recorded on the accrual basis from settlement date. Dividend income (net of withholding tax, if any) is recorded on the ex-dividend date. |
The Fund may periodically participate in litigation related to Fund investments. As such, the Fund may receive proceeds from litigation settlements. Any proceeds received are included in the Statement of Operations as realized gain (loss) for investments no longer held and as unrealized gain (loss) for investments still held.
Brokerage commissions and mark ups are considered transaction costs and are recorded as an increase to the cost basis of securities purchased and/or a reduction of proceeds on a sale of securities. Such transaction costs are included in the determination of net realized and unrealized gain (loss) from investment securities reported in the Statement of Operations and the Statement of Changes in Net Assets and the net realized and unrealized gains (losses) on securities per share in the Financial Highlights. Transaction costs are included in the calculation of the Fund’s net asset value and, accordingly, they reduce the Fund’s total returns. These transaction costs are not considered operating expenses and are not reflected in net investment income reported in the Statement of Operations and Statement of Changes in Net Assets, or the net investment income per share and ratios of expenses and net investment income reported in the Financial Highlights, nor are they limited by any expense limitation arrangements between the Fund and the investment adviser.
The Fund allocates income and realized and unrealized capital gains and losses to a class based on the relative net assets of each class.
| C. | Country Determination — For the purposes of making investment selection decisions and presentation in the Schedule of Investments, the investment adviser may determine the country in which an issuer is located and/or credit risk exposure based on various factors. These factors include the laws of the country under which the issuer is organized, where the issuer maintains a principal office, the country in which the issuer derives 50% or more of its total revenues and the country that has the primary market for the issuer’s securities, as well as other criteria. Among the other criteria that may be evaluated for making this determination are the country in which the issuer maintains 50% or more of its assets, the type of security, financial guarantees and enhancements, the nature of the collateral and the sponsor organization. Country of issuer and/or credit risk exposure has been determined to be the United States of America, unless otherwise noted. |
| D. | Distributions — Distributions from net investment income, if any, are declared and paid quarterly and are recorded on the ex-dividend date. Distributions from net realized capital gain, if any, are generally declared and paid annually and recorded on the ex-dividend date. The Fund may elect to treat a portion of the proceeds from redemptions as distributions for federal income tax purposes. |
| E. | Master Limited Liability Partnerships — The Fund invests in Master Limited Liability Partnerships (MLPs). MLPs are publicly traded partnerships and limited liability companies taxed as partnerships under the Internal Revenue Code of 1986, as amended (the “Internal |
14 Invesco Global Infrastructure Fund
| | Revenue Code”). The Fund principally invests in MLPs that derive their revenue primarily from businesses involved in the gathering, transporting, processing, treating, storing, refining, distributing, mining or marketing of natural gas, natural gas liquids, crude oil, refined products or coal (energy infrastructure MLPs). The Fund is a partner in each MLP; accordingly, the Fund is required to take into account the Fund’s allocable share of income, gains, losses, deductions, expenses, and tax credits recognized by each MLP. |
The Fund is non-diversified and will concentrate its investments in the energy sector. Energy infrastructure MLPs are subject to a variety of industry specific risk factors that may adversely affect their business or operations, including a decrease in production or reduced volumes of natural gas or other energy commodities available for transporting, processing, storing or distributing; changes in energy commodity prices; a sustained reduced demand for crude oil, natural gas and refined petroleum products; depletion of natural gas reserves or other commodities if not replaced; natural disasters, extreme weather and environmental hazards; rising interest rates, how facilities are constructed, maintained and operated, environmental and safety controls, and the prices they may charge for products and services. In addition, taxes, government regulation, international politics, price, and supply fluctuations, volatile interest rates and energy conservation may cause difficulties for energy infrastructure MLPs.
MLP’s may be less liquid and subject to more abrupt or erratic price movements than conventional publicly traded securities.
| F. | Return of Capital — Distributions received from the Fund’s investments in MLPs generally are comprised of income and return of capital. The Fund records investment income and return of capital based on estimates made at the time such distributions are received. The return of capital portion of the distribution is a reduction to investment income that results in an equivalent reduction in the cost basis of the associated investments and increases net realized gains (losses) and change in unrealized appreciation (depreciation). Such estimates are based on historical information available from each MLP and other industry sources. These estimates will subsequently be revised and may materially differ primarily based on information received from the MLPs after their tax reporting periods are concluded. |
| G. | Federal Income Taxes — The Fund intends to comply with the requirements of Subchapter M of the Internal Revenue Code of 1986, as amended (the “Internal Revenue Code”), necessary to qualify as a regulated investment company and to distribute substantially all of the Fund’s taxable earnings to shareholders. As such, the Fund will not be subject to federal income taxes on otherwise taxable income (including net realized capital gain) that is distributed to shareholders. Therefore, no provision for federal income taxes is recorded in the financial statements. |
The Fund recognizes the tax benefits of uncertain tax positions only when the position is more likely than not to be sustained. Management has analyzed the Fund’s uncertain tax positions and concluded that no liability for unrecognized tax benefits should be recorded related to uncertain tax positions. Management is not aware of any tax positions for which it is reasonably possible that the total amounts of unrecognized tax benefits will change materially in the next 12 months.
The Fund files tax returns in the U.S. Federal jurisdiction and certain other jurisdictions. Generally, the Fund is subject to examinations by such taxing authorities for up to three years after the filing of the return for the tax period.
| H. | Expenses — Fees provided for under the Rule 12b-1 plan of a particular class of the Fund are charged to the operations of such class. Transfer agency fees and expenses and other shareholder recordkeeping fees and expenses attributable to Class R5 and Class R6 are allocated to each share class based on relative net assets. Sub-accounting fees attributable to Class R5 are charged to the operations of the class. Transfer agency fees and expenses and other shareholder recordkeeping fees and expenses relating to all other classes are allocated among those classes based on relative net assets. All other expenses are allocated among the classes based on relative net assets. |
| I. | Accounting Estimates — The preparation of financial statements in conformity with accounting principles generally accepted in the United States of America (“GAAP”) requires management to make estimates and assumptions that affect the reported amounts of assets and liabilities at the date of the financial statements and the reported amounts of revenues and expenses during the reporting period including estimates and assumptions related to taxation. Actual results could differ from those estimates by a significant amount. In addition, the Fund monitors for material events or transactions that may occur or become known after the period-end date and before the date the financial statements are released to print. |
| J. | Indemnifications — Under the Trust’s organizational documents, each Trustee, officer, employee or other agent of the Trust is indemnified against certain liabilities that may arise out of the performance of their duties to the Fund. Additionally, in the normal course of business, the Fund enters into contracts, including the Fund’s servicing agreements, that contain a variety of indemnification clauses. The Fund’s maximum exposure under these arrangements is unknown as this would involve future claims that may be made against the Fund that have not yet occurred. The risk of material loss as a result of such indemnification claims is considered remote. |
| K. | Foreign Currency Translations — Foreign currency is valued at the close of the NYSE based on quotations posted by banks and major currency dealers. Portfolio securities and other assets and liabilities denominated in foreign currencies are translated into U.S. dollar amounts at date of valuation. Purchases and sales of portfolio securities (net of foreign taxes withheld on disposition) and income items denominated in foreign currencies are translated into U.S. dollar amounts on the respective dates of such transactions. The Fund does not separately account for the portion of the results of operations resulting from changes in foreign exchange rates on investments and the fluctuations arising from changes in market prices of securities held. The combined results of changes in foreign exchange rates and the fluctuation of market prices on investments (net of estimated foreign tax withholding) are included with the net realized and unrealized gain or loss from investments in the Statement of Operations. Reported net realized foreign currency gains or losses arise from (1) sales of foreign currencies, (2) currency gains or losses realized between the trade and settlement dates on securities transactions, and (3) the difference between the amounts of dividends, interest, and foreign withholding taxes recorded on the Fund’s books and the U.S. dollar equivalent of the amounts actually received or paid. Net unrealized foreign currency gains and losses arise from changes in the fair values of assets and liabilities, other than investments in securities at fiscal period end, resulting from changes in exchange rates. |
The Fund may invest in foreign securities, which may be subject to foreign taxes on income, gains on investments or currency repatriation, a portion of which may be recoverable. Foreign taxes, if any, are recorded based on the tax regulations and rates that exist in the foreign markets in which the Fund invests and are shown in the Statement of Operations.
| L. | Forward Foreign Currency Contracts — The Fund may engage in foreign currency transactions either on a spot (i.e. for prompt delivery and settlement) basis or through forward foreign currency contracts to manage or minimize currency or exchange rate risk. |
The Fund may also enter into forward foreign currency contracts for the purchase or sale of a security denominated in a foreign currency in order to “lock in” the U.S. dollar price of that security, or the Fund may also enter into forward foreign currency contracts that do not provide for
15 Invesco Global Infrastructure Fund
physical settlement of the two currencies, but instead are settled by a single cash payment calculated as the difference between the agreed upon exchange rate and the spot rate at settlement based upon an agreed upon notional amount (non-deliverable forwards). The Fund will set aside liquid assets in an amount equal to daily mark-to-market obligation for forward foreign currency contracts.
A forward foreign currency contract is an obligation between two parties (“Counterparties”) to purchase or sell a specific currency for an agreed-upon price at a future date. The use of forward foreign currency contracts does not eliminate fluctuations in the price of the underlying securities the Fund owns or intends to acquire but establishes a rate of exchange in advance. Fluctuations in the value of these contracts are measured by the difference in the contract date and reporting date exchange rates and are recorded as unrealized appreciation (depreciation) until the contracts are closed. When the contracts are closed, realized gains (losses) are recorded. Realized and unrealized gains (losses) on the contracts are included in the Statement of Operations. The primary risks associated with forward foreign currency contracts include failure of the Counterparty to meet the terms of the contract and the value of the foreign currency changing unfavorably. These risks may be in excess of the amounts reflected in the Statement of Assets and Liabilities.
NOTE 2—Advisory Fees and Other Fees Paid to Affiliates
The Trust has entered into a master investment advisory agreement with Invesco Advisers, Inc. (the “Adviser” or “Invesco”). Under the terms of the investment advisory agreement, the Fund pays an advisory fee to the Adviser based on the annual rate of the Fund’s average daily net assets as follows:
| | | | | | |
| Average Daily Net Assets | | Rate |
First $2.5 billion | | | 0 | .84% | | |
Next $2 billion | | | 0 | .80% | | |
Next $3.5 billion | | | 0 | .785% | | |
Over $8 billion | | | 0 | .77% | | |
For the period May 2, 2014 (commencement date) through October 31, 2014, the effective advisory fees incurred by the Fund was 0.84%.
Under the terms of a master sub-advisory agreement between the Adviser and each of Invesco Asset Management Deutschland GmbH, Invesco Asset Management Limited, Invesco Asset Management (Japan) Limited, Invesco Australia Limited, Invesco Hong Kong Limited, Invesco Senior Secured Management, Inc., Invesco Canada Ltd. and Invesco PowerShares Capital Management LLC (collectively, the “Affiliated Sub-Advisers”) the Adviser, not the Fund, may pay 40% of the fees paid to the Adviser to any such Affiliated Sub-Adviser(s) that provide(s) discretionary investment management services to the Fund based on the percentage of assets allocated to such Sub-Adviser(s).
The Adviser has contractually agreed, through at least February 29, 2016, to waive advisory fees and/or reimburse expenses of all shares to the extent necessary to limit total annual fund operating expenses after fee waiver and/or expense reimbursement (excluding certain items discussed below) of Class A, Class C, Class R, Class Y, Class R5 and Class R6 shares to 1.40%, 2.15%, 1.65%, 1.15%, 1.15% and 1.15%, respectively, of average daily net assets. In determining the Adviser’s obligation to waive advisory fees and/or reimburse expenses, the following expenses are not taken into account, and could cause the total annual fund operating expenses after fee waiver and/or expense reimbursement to exceed the numbers reflected above: (1) interest; (2) taxes; (3) dividend expense on short sales; (4) extraordinary or non-routine items, litigation expenses; and (5) expenses that the Fund has incurred but did not actually pay because of an expense offset arrangement. Unless Invesco continues the fee waiver agreement, it will terminate February 29, 2016. The fee waiver agreement cannot be terminated during its term.
Further, the Adviser has contractually agreed, through at least June 30, 2016, to waive the advisory fee payable by the Fund in an amount equal to 100% of the net advisory fees the Adviser receives from the affiliated money market funds on investments by the Fund of uninvested cash in such affiliated money market funds.
For the period May 2, 2014 (commencement date) through October 31, 2014, the Adviser waived advisory fees and reimbursed fund level expenses of $154,755 and reimbursed class level expenses of $1,116, $49, $6, $1,197, $5 and $7 of Class A, Class C, Class R, Class Y, Class R5 and Class R6 shares, respectively.
The Trust has entered into a transfer agency and service agreement with Invesco Investment Services, Inc. (“IIS”) pursuant to which the Fund has agreed to pay IIS a fee for providing transfer agency and shareholder services to the Fund and reimburse IIS for certain expenses incurred by IIS in the course of providing such services. IIS may make payments to intermediaries that provide omnibus account services, sub-accounting services and/or networking services. All fees payable by IIS to intermediaries that provide omnibus account services or sub-accounting are charged back to the Fund, subject to certain limitations approved by the Trust’s Board of Trustees. For the period May 2, 2014 (commencement date) through October 31, 2014, expenses incurred under the agreement are shown in the Statement of Operations as Transfer agent fees.
The Trust has entered into a master administrative services agreement with Invesco pursuant to which the Fund has agreed to pay Invesco for certain administrative costs incurred in providing accounting services to the Fund. For the period May 2, 2014 (commencement date) through October 31, 2014, expenses incurred under the agreement are shown in the Statement of Operations as Administrative services fees.
The Trust has entered into master distribution agreements with Invesco Distributors, Inc. (“IDI”) to serve as the distributor for the Class A, Class C, Class R, Class Y, Class R5 and Class R6 shares of the Fund. The Trust has adopted plans pursuant to Rule 12b-1 under the 1940 Act with respect to the Fund’s Class A, Class C and Class R shares (collectively, the “Plans”). The Fund, pursuant to the Plans, pays IDI compensation at the annual rate of 0.25% of the Fund’s average daily net assets of Class A shares, 1.00% of the average daily net assets of Class C shares and 0.50% of the average daily net assets of Class R shares. Of the Plan payments, up to 0.25% of the average daily net assets of each class of shares may be paid to furnish continuing personal shareholder services to customers who purchase and own shares of such classes. Any amounts not paid as a service fee under the Plans would constitute an asset-based sales charge. Rules of the Financial Industry Regulatory Authority (“FINRA”) impose a cap on the total sales charges, including asset-based sales charges, that may be paid by any class of shares of the Fund. For the period May 2, 2014 (commencement date) through October 31, 2014, expenses incurred under the Plans are shown in the Statement of Operations as Distribution fees.
Front-end sales commissions and CDSC (collectively, the “sales charges”) are not recorded as expenses of the Fund. Front-end sales commissions are deducted from proceeds from the sales of Fund shares prior to investment in Class A shares of the Fund. CDSC are deducted from redemption proceeds prior to remittance to the shareholder. During the period May 2, 2014 (commencement date) through October 31, 2014, IDI advised the Fund that IDI retained $1,235 in front-end sales commissions from the sale of Class A shares and $0 from Class A and Class C shares for CDSC imposed upon redemptions by shareholders.
Certain officers and trustees of the Trust are officers and directors of the Adviser, IIS and/or IDI.
16 Invesco Global Infrastructure Fund
NOTE 3—Additional Valuation Information
GAAP defines fair value as the price that would be received to sell an asset or paid to transfer a liability in an orderly transaction between market participants at the measurement date, under current market conditions. GAAP establishes a hierarchy that prioritizes the inputs to valuation methods, giving the highest priority to readily available unadjusted quoted prices in an active market for identical assets (Level 1) and the lowest priority to significant unobservable inputs (Level 3), generally when market prices are not readily available or are unreliable. Based on the valuation inputs, the securities or other investments are tiered into one of three levels. Changes in valuation methods may result in transfers in or out of an investment’s assigned level:
| | Level 1 — | Prices are determined using quoted prices in an active market for identical assets. |
| | Level 2 — | Prices are determined using other significant observable inputs. Observable inputs are inputs that other market participants may use in pricing a security. These may include quoted prices for similar securities, interest rates, prepayment speeds, credit risk, yield curves, loss severities, default rates, discount rates, volatilities and others. |
| | Level 3 — | Prices are determined using significant unobservable inputs. In situations where quoted prices or observable inputs are unavailable (for example, when there is little or no market activity for an investment at the end of the period), unobservable inputs may be used. Unobservable inputs reflect the Fund’s own assumptions about the factors market participants would use in determining fair value of the securities or instruments and would be based on the best available information. |
The following is a summary of the tiered valuation input levels, as of October 31, 2014. The level assigned to the securities valuations may not be an indication of the risk or liquidity associated with investing in those securities. Because of the inherent uncertainties of valuation, the values reflected in the financial statements may materially differ from the value received upon actual sale of those investments.
| | | | | | | | | | | | | | | | |
| | | Level 1 | | | Level 2 | | | Level 3 | | | Total | |
Australia | | $ | — | | | $ | 167,441 | | | $ | — | | | $ | 167,441 | |
Canada | | | 587,314 | | | | — | | | | — | | | | 587,314 | |
China | | | 129,291 | | | | 24,592 | | | | — | | | | 153,883 | |
France | | | 38,192 | | | | 85,198 | | | | — | | | | 123,390 | |
Hong Kong | | | 72,932 | | | | 25,558 | | | | — | | | | 98,490 | |
Italy | | | 94,728 | | | | 69,450 | | | | — | | | | 164,178 | |
Japan | | | — | | | | 109,383 | | | | — | | | | 109,383 | |
Luxembourg | | | 96,871 | | | | — | | | | — | | | | 96,871 | |
Mexico | | | 26,397 | | | | — | | | | — | | | | 26,397 | |
New Zealand | | | — | | | | 37,638 | | | | — | | | | 37,638 | |
Spain | | | — | | | | 226,066 | | | | — | | | | 226,066 | |
Switzerland | | | — | | | | 33,136 | | | | — | | | | 33,136 | |
United Arab Emirates | | | 41,309 | | | | — | | | | — | | | | 41,309 | |
United Kingdom | | | — | | | | 519,683 | | | | — | | | | 519,683 | |
United States | | | 2,565,357 | | | | — | | | | — | | | | 2,565,357 | |
Total Investments | | $ | 3,652,391 | | | $ | 1,298,145 | | | $ | — | | | $ | 4,950,536 | |
NOTE 4—Trustees’ and Officers’ Fees and Benefits
Trustees’ and Officers’ Fees and Benefits include amounts accrued by the Fund to pay remuneration to certain Trustees and Officers of the Fund. Trustees have the option to defer compensation payable by the Fund, and Trustees’ and Officers’ Fees and Benefits also include amounts accrued by the Fund to fund such deferred compensation amounts. Those Trustees who defer compensation have the option to select various Invesco Funds in which their deferral accounts shall be deemed to be invested. Obligations under the deferred compensation plans represents unsecured claims against the general assets of the Fund.
NOTE 5—Cash Balances
The Fund is permitted to temporarily carry a negative or overdrawn balance in its account with State Street Bank and Trust Company, the custodian bank. Such balances, if any at period end, are shown in the Statement of Assets and Liabilities under the payable caption Amount due custodian. To compensate the custodian bank for such overdrafts, the overdrawn Fund may either (1) leave funds as a compensating balance in the account so the custodian bank can be compensated by earning the additional interest; or (2) compensate by paying the custodian bank at a rate agreed upon by the custodian bank and Invesco, not to exceed the contractually agreed upon rate.
17 Invesco Global Infrastructure Fund
NOTE 6—Distributions to Shareholders and Tax Components of Net Assets
Tax Character of Distributions to Shareholders Paid During the period May 2, 2014 (commencement date) through October 31, 2014:
| | | | |
| | | 2014 | |
Ordinary income | | $ | 25,080 | |
Tax Components of Net Assets at Period-End:
| | | | |
| | | 2014 | |
Undistributed ordinary income | | $ | 45,063 | |
Net unrealized appreciation — investments | | | 224,801 | |
Net unrealized appreciation (depreciation) — other investments | | | (271 | ) |
Temporary book/tax differences | | | (690 | ) |
Shares of beneficial interest | | | 4,758,871 | |
Total net assets | | $ | 5,027,774 | |
The difference between book-basis and tax-basis unrealized appreciation (depreciation) is due to differences in the timing of recognition of gains and losses on investments for tax and book purposes. The Fund’s net unrealized appreciation difference is attributable primarily to wash sales.
The temporary book/tax differences are a result of timing differences between book and tax recognition of income and/or expenses. The Fund’s temporary book/tax differences are the result of the trustee deferral of compensation and retirement plan benefits.
Capital loss carryforward is calculated and reported as of a specific date. Results of transactions and other activity after that date may affect the amount of capital loss carryforward actually available for the Fund to utilize. The ability to utilize capital loss carryforward in the future may be limited under the Internal Revenue Code and related regulations based on the results of future transactions.
The Fund does not have a capital loss carryforward at October 31, 2014.
NOTE 7—Investment Securities
The aggregate amount of investment securities (other than short-term securities, U.S. Treasury obligations and money market funds, if any) purchased and sold by the Fund during May 2, 2014 (commencement date) through October 31, 2014 was $5,474,130 and $802,022, respectively. Cost of investments on a tax basis includes the adjustments for financial reporting purposes as of the most recently completed federal income tax reporting period-end.
| | | | |
| Unrealized Appreciation (Depreciation) of Investment Securities on a Tax Basis | |
Aggregate unrealized appreciation of investment securities | | $ | 281,672 | |
Aggregate unrealized (depreciation) of investment securities | | | (56,871 | ) |
Net unrealized appreciation of investment securities | | $ | 224,801 | |
Cost of investments for tax purposes is $4,725,735.
NOTE 8—Reclassification of Permanent Differences
Primarily as a result of differing book/tax treatment of nondeductible stock issuance costs, on October 31, 2014, undistributed net investment income was increased by $29,067, undistributed net realized gain (loss) was increased by $395 and shares of beneficial interest was decreased by $29,462. This reclassification had no effect on the net assets of the Fund.
18 Invesco Global Infrastructure Fund
NOTE 9—Share Information
| | | | | | | | |
| | | Summary of Share Activity | |
| | | May 02, 2014
(Commencement date) through
October 31, 2014(a) | |
| | | Shares | | | Amount | |
Sold: | | | | | | | | |
Class A | | | 314,147 | | | $ | 3,210,131 | |
Class C | | | 21,242 | | | | 226,573 | |
Class R | | | 1,231 | | | | 12,450 | |
Class Y | | | 214,947 | | | | 2,154,251 | |
Class R5 | | | 1,001 | | | | 10,010 | |
Class R6 | | | 3,567 | | | | 35,487 | |
| | |
Reinvested: | | | | | | | | |
Class A | | | 397 | | | | 4,258 | |
Class C | | | 47 | | | | 508 | |
Class R | | | 1 | | | | 10 | |
Class Y | | | 297 | | | | 3,184 | |
| | |
Reacquired: | | | | | | | | |
Class A | | | (80,330 | ) | | | (816,583 | ) |
Class C | | | (4,264 | ) | | | (42,944 | ) |
Class Y | | | (841 | ) | | | (9,002 | ) |
Net increase in share activity | | | 471,442 | | | $ | 4,788,333 | |
| (a) | There is an entity that is a record owner of more than 5% of the outstanding shares of the Fund and owns 11% of the outstanding shares of the Fund. IDI has an agreement with this entity to sell Fund shares. The Fund, Invesco and/or Invesco affiliates may make payments to this entity, which is considered to be related to the Fund, for providing services to the Fund, Invesco and/or Invesco affiliates including but not limited to services such as securities brokerage, distribution, third party record keeping and account servicing. The Fund has no knowledge as to whether all or any portion of the shares owned of record by this entity are also owned beneficially. |
| | In addition, 64% of the outstanding shares of the Fund are owned by the Adviser. |
NOTE 10—Financial Highlights
The following schedule presents financial highlights for a share of the Fund outstanding throughout the periods indicated.
| | | | | | | | | | | | | | | | | | | | | | | | | | | | | | | | | | | | | | | | | | | | | | | | |
| | | Net asset
value,
beginning
of period | | | Net
investment
income(a) | | | Net gains
on securities
(both
realized and
unrealized) | | | Total from
investment
operations | | | Dividends
from net
investment
income | | | Net asset
value, end
of period | | | Total
return(b) | | | Net assets,
end of period
(000’s omitted) | | | Ratio of
expenses
to average
net assets
with fee waivers
and/or expenses
absorbed | | | Ratio of
expenses
to average net
assets without
fee waivers
and/or expenses
absorbed | | | Ratio of net
investment
income
to average
net assets | | | Portfolio
turnover(c) | |
Class A | | | | | | | | | | | | | | | | | | | | | | | | | | | | | | | | | | | | | | | | | | | | | | | | |
Year ended 10/31/14(d) | | $ | 10.00 | | | $ | 0.08 | | | $ | 0.63 | | | $ | 0.71 | | | $ | (0.05 | ) | | $ | 10.66 | | | | 7.12 | % | | $ | 2,497 | | | | 1.39 | %(e) | | | 8.60 | %(e) | | | 1.51 | %(e) | | | 19 | % |
Class C | | | | | | | | | | | | | | | | | | | | | | | | | | | | | | | | | | | | | | | | | | | | | | | | |
Year ended 10/31/14(d) | | | 10.00 | | | | 0.04 | | | | 0.63 | | | | 0.67 | | | | (0.03 | ) | | | 10.64 | | | | 6.71 | | | | 181 | | | | 2.14 | (e) | | | 9.35 | (e) | | | 0.76 | (e) | | | 19 | |
Class R | | | | | | | | | | | | | | | | | | | | | | | | | | | | | | | | | | | | | | | | | | | | | | | | |
Year ended 10/31/14(d) | | | 10.00 | | | | 0.07 | | | | 0.64 | | | | 0.71 | | | | (0.05 | ) | | | 10.66 | | | | 7.05 | | | | 13 | | | | 1.64 | (e) | | | 8.85 | (e) | | | 1.26 | (e) | | | 19 | |
Class Y | | | | | | | | | | | | | | | | | | | | | | | | | | | | | | | | | | | | | | | | | | | | | | | | |
Year ended 10/31/14(d) | | | 10.00 | | | | 0.09 | | | | 0.64 | | | | 0.73 | | | | (0.06 | ) | | | 10.67 | | | | 7.29 | | | | 2,287 | | | | 1.14 | (e) | | | 8.35 | (e) | | | 1.76 | (e) | | | 19 | |
Class R5 | | | | | | | | | | | | | | | | | | | | | | | | | | | | | | | | | | | | | | | | | | | | | | | | |
Year ended 10/31/14(d) | | | 10.00 | | | | 0.09 | | | | 0.64 | | | | 0.73 | | | | (0.06 | ) | | | 10.67 | | | | 7.29 | | | | 11 | | | | 1.14 | (e) | | | 8.34 | (e) | | | 1.76 | (e) | | | 19 | |
Class R6 | | | | | | | | | | | | | | | | | | | | | | | | | | | | | | | | | | | | | | | | | | | | | | | | |
Year ended 10/31/14(d) | | | 10.00 | | | | 0.09 | | | | 0.64 | | | | 0.73 | | | | (0.06 | ) | | | 10.67 | | | | 7.29 | | | | 38 | | | | 1.14 | (e) | | | 8.34 | (e) | | | 1.76 | (e) | | | 19 | |
| (a) | Calculated using average shares outstanding. |
| (b) | Includes adjustments in accordance with accounting principles generally accepted in the United States of America and as such, the net asset value for financial reporting purposes and the returns based upon those net asset values may differ from the net asset value and returns for shareholder transactions. Does not include sales charges and is not annualized for periods less than one year, if applicable. |
| (c) | Portfolio turnover is calculated at the fund level and is not annualized for periods less than one year, if applicable. |
| (d) | Commencement date of May 2, 2014. |
| (e) | Ratios are annualized and based on average daily net assets (000’s omitted) of $2,038, $89, $12, $2,186, $10 and $13 for Class A, Class C, Class R, Class Y, Class R5 and Class R6 shares, respectively. |
19 Invesco Global Infrastructure Fund
Report of Independent Registered Public Accounting Firm
To the Board of Trustees of AIM Investment Funds (Invesco Investment Funds)
and Shareholders of Invesco Global Infrastructure Fund:
In our opinion, the accompanying statement of assets and liabilities, including the schedule of investments, and the related statements of operations and of changes in net assets and the financial highlights present fairly, in all material respects, the financial position of Invesco Global Infrastructure Fund (one of the funds constituting AIM Investment Funds (Invesco Investment Funds), hereafter referred to as the “Fund”) at October 31, 2014, and the results of its operations, the changes in its net assets and the financial highlights for the period May 2, 2014 (commencement of operations) through October 31, 2014, in conformity with accounting principles generally accepted in the United States of America. These financial statements and financial highlights (hereafter referred to as “financial statements”) are the responsibility of the Fund’s management. Our responsibility is to express an opinion on these financial statements based on our audit. We conducted our audit of these financial statements in accordance with the standards of the Public Company Accounting Oversight Board (United States). Those standards require that we plan and perform the audit to obtain reasonable assurance about whether the financial statements are free of material misstatement. An audit includes examining, on a test basis, evidence supporting the amounts and disclosures in the financial statements, assessing the accounting principles used and significant estimates made by management, and evaluating the overall financial statement presentation. We believe that our audits, which included confirmation of securities at October 31, 2014 by correspondence with the custodian and brokers, and the application of alternative auditing procedures where confirmations of security purchases have not been received, provide a reasonable basis for our opinion.
PRICEWATERHOUSECOOPERS LLP
December 23, 2014
Houston, Texas
20 Invesco Global Infrastructure Fund
Calculating your ongoing Fund expenses
Example
As a shareholder of the Fund, you incur two types of costs: (1) transaction costs, which may include sales charges (loads) on purchase payments or contingent deferred sales charges on redemptions, if any; and (2) ongoing costs, including management fees, distribution and/or service (12b-1) fees, and other Fund expenses. This example is intended to help you understand your ongoing costs (in dollars) of investing in the Fund and to compare these costs with ongoing costs of investing in other mutual funds. The example is based on an investment of $1,000 invested at the beginning of the period and held for the entire period May 2, 2014 (commencement date) through October 31, 2014.
Actual expenses
The table below provides information about actual account values and actual expenses. You may use the information in this table, together with the amount you invested, to estimate the expenses that you paid over the period. Simply divide your account value by $1,000 (for example, an $8,600 account value divided by $1,000 = 8.6), then multiply the result by the number in the table under the heading entitled “Actual Expenses Paid During Period” to estimate the expenses you paid on your account during this period.
Hypothetical example for comparison purposes
The table below also provides information about hypothetical account values and hypothetical expenses based on the Fund’s actual expense ratio and an assumed rate of return of 5% per year before expenses, which is not the Fund’s actual return.
The hypothetical account values and expenses may not be used to estimate the actual ending account balance or expenses you paid for the period. You may use this information to compare the ongoing costs of investing in the Fund and other funds. To do so, compare this 5% hypothetical example with the 5% hypothetical examples that appear in the shareholder reports of the other funds.
Please note that the expenses shown in the table are meant to highlight your ongoing costs only and do not reflect any transaction costs, such as sales charges (loads) on purchase payments or contingent deferred sales charges on redemptions, if any. Therefore, the hypothetical information is useful in comparing ongoing costs only, and will not help you determine the relative total costs of owning different funds. In addition, if these transaction costs were included, your costs would have been higher.
| | | | | | | | | | | | | | | | | | | | | | | | |
| Class | | Beginning
Account Value
(05/01/14) | | | ACTUAL | | | HYPOTHETICAL (5% annual return before expenses) | | | Annualized
Expense
Ratio | |
| | | Ending
Account Value
(10/31/14)1 | | | Expenses
Paid During
Period2 | | | Ending
Account Value
(10/31/14) | | | Expenses
Paid During
Period3 | | |
| A | | $ | 1,000.00 | | | $ | 1,071.20 | | | $ | 7.22 | | | $ | 1,018.20 | | | $ | 7.07 | | | | 1.39 | % |
| C | | | 1,000.00 | | | | 1,067.10 | | | | 11.09 | | | | 1,014.42 | | | | 10.87 | | | | 2.14 | |
| R | | | 1,000.00 | | | | 1,070.50 | | | | 8.51 | | | | 1,016.94 | | | | 8.34 | | | | 1.64 | |
| Y | | | 1,000.00 | | | | 1,072.90 | | | | 5.92 | | | | 1,019.46 | | | | 5.80 | | | | 1.14 | |
| R5 | | | 1,000.00 | | | | 1,072.90 | | | | 5.92 | | | | 1,019.46 | | | | 5.80 | | | | 1.14 | |
| R6 | | | 1,000.00 | | | | 1,072.90 | | | | 5.92 | | | | 1,019.46 | | | | 5.80 | | | | 1.14 | |
| 1 | The actual ending account value is based on the actual total return of the Fund for the period May 2, 2014 (commencement date) through October 31, 2014, after actual expenses and will differ from the hypothetical ending account value which is based on the Fund’s expense ratio and a hypothetical annual return of 5% before expenses. |
| 2 | Actual expenses are equal to the Fund’s annualized expense ratio as indicated above multiplied by the average account value over the period, multiplied by 183 (as of close of business May 2, 2014 (commencement date) through October 31, 2014)/365. Because the Fund has not been in existence for a full six month period, the actual ending account value and expense information shown may not provide a meaningful comparison to fund expense information of classes that show such data for a full six month period and, because the actual ending account value and expense information in the expense example covers a short time period, return and expense data may not be indicative of return and expense data for longer time periods. |
| 3 | Hypothetical expenses are equal to the annualized expense ratio indicated above multiplied by the average account value over the period, multiplied by 184/365 to reflect a one-half year period. The hypothetical ending account value and expenses may be used to compare ongoing costs of investing in the Fund and other funds because such data is based on a full six month period. |
21 Invesco Global Infrastructure Fund
Initial Approval of Investment Advisory and Sub-Advisory Agreements
The Board of Trustees (the Board) of AIM Investment Funds (Invesco Investment Funds) (the Company) is required under the Investment Company Act of 1940, as amended, to approve the Invesco Global Infrastructure Fund (the Fund) investment advisory agreements before the Fund can commence operations. During meetings held on March 25-26, 2014, the Board as a whole and the disinterested or “independent” Trustees voting separately approved (i) an amendment to the Company’s Master Investment Advisory Agreement with Invesco Advisers, Inc. (Invesco Advisers and the investment advisory agreement) to add the Fund, and (ii) (a) an amendment to the Master Intergroup Sub-Advisory Contract for Mutual Funds with Invesco Asset Management Deutschland GmbH, Invesco Asset Management Limited, Invesco Asset Management (Japan) Limited, Invesco Australia Limited, Invesco Hong Kong Limited, Invesco Senior Secured Management, Inc. and Invesco Canada Ltd. to add the Fund, and (b) an amendment to the Sub-Advisory Contract with Invesco PowerShares Capital Management LLC to add the Fund (the sub-advisers, the Affiliated Sub-Advisers; and the contracts, the sub-advisory contracts). In doing so, the Board followed a process similar to the process that it follows in annually reviewing and approving investment advisory agreements and sub-advisory contracts for the series portfolios of funds advised by Invesco Advisers (the Invesco Funds) and considered the information provided in the most recent annual review process as well as the information provided with respect to the Fund. The Board (i) determined that the investment advisory agreement and sub-advisory contracts are in the best interests of the Fund and its shareholders and that the compensation payable to Invesco Advisers and the Affiliated Sub-Advisers under the Fund’s agreements is fair and reasonable and (ii) approved submission of the agreements to the initial shareholder of the Fund.
The Board’s Fund Evaluation Process
The Board’s Investments Committee has established three Sub-Committees that are responsible for overseeing the management of a number of the funds advised by Invesco Advisers (the Invesco Funds). The Fund will be assigned to one of the Sub-Committees. This Sub-Committee structure permits the Trustees to focus on the performance of the Invesco Funds that have been assigned to them. The Sub-Committees meet throughout the year to review the performance, fees, expenses and other matters related to their assigned Invesco Funds. Over the course of each year, the Sub-Committees meet with portfolio managers for their assigned Invesco Funds and other members of management and review with these individuals the performance, investment
objective(s), policies, strategies, limitations and investment risks of these funds.
In evaluating the fairness and reasonableness of compensation under the Fund’s investment advisory agreement and sub-advisory contracts, the Board considered, among other things, the factors discussed below. The Board was assisted in its review by the Senior Officer, an independent officer of the Funds, and by independent legal counsel. The discussion below serves as a summary of the material factors and related conclusions that formed the basis for the Board’s approval of the Fund’s investment advisory agreement and sub-advisory contracts. The Trustees’ review and conclusions are based on the comprehensive consideration of all information presented to them and are not the result of any single determinative factor. Moreover, one Trustee may have weighed a particular piece of information or factor differently than another Trustee.
Factors and Conclusions and Summary of Evaluation of Investment Advisory and Sub-Advisory Agreements
| A. | Nature, Extent and Quality of Services Provided by Invesco Advisers and the Affiliated Sub-Advisers |
The Board reviewed the advisory services to be provided to the Fund by Invesco Advisers under the Fund’s investment advisory agreement and the credentials and experience of the officers and employees of Invesco Advisers who will provide these services. The Board’s review of the qualifications of Invesco Advisers to provide these services included the Board’s consideration of Invesco Advisers’ investment process oversight, independent credit analysis and investment risk management. The Board also considered non-advisory services that Invesco Advisers and its affiliates provide to the Invesco Funds and will provide to the Fund, such as various back office support functions, equity and fixed income trading operations, internal audit, distribution and legal and compliance. In determining whether to approve the Fund’s investment advisory agreement, the Board considered the existing relationship between Invesco Advisers and the Invesco Funds, as well as the Board’s knowledge of Invesco Advisers’ operations. The Board concluded that the nature, extent and quality of the advisory services to be provided to the Fund by Invesco Advisers are appropriate.
The Board reviewed the services that may be provided by the Affiliated Sub-Advisers under the sub-advisory contracts and the credentials and experience of the officers and employees of the Affiliated Sub-Advisers who may provide these services. The Board noted that the Affiliated Sub-Advisers have offices and personnel that are located in financial centers around the world. As a result, the Affiliated Sub-Advisers can provide research and investment
analysis on the markets and economies of various countries in which the Fund may invest, make recommendations regarding securities and assist with security trades. The Board concluded that the sub-advisory contracts will benefit the Fund and its shareholders by permitting Invesco Advisers to use the resources and talents of the Affiliated Sub-Advisers in managing the Fund. The Board concluded that the nature, extent and quality of the services that may be provided by the Affiliated Sub-Advisers are appropriate.
The Board did not consider the performance of the Fund because the Fund is new and has no performance history. The Board did review performance expectations for the Fund in different market environments.
| C. | Advisory and Sub-Advisory Fees and Fee Waivers |
The Board considered the contractual management fee rate of the Fund and the proposed fee waivers and expense limitations that will be in place for the Fund through May 31, 2015. The Board also considered the services to be provided by the Affiliated Sub-Advisers pursuant to the sub-advisory contracts and the services to be provided by Invesco Advisers pursuant to the Fund’s investment advisory agreement, as well as the allocation of fees between Invesco Advisers and the Affiliated Sub-Advisers pursuant to the sub-advisory contracts. The Board noted that the sub-advisory fees will have no direct effect on the Fund or its shareholders, as they are paid by Invesco Advisers to the Affiliated Sub-Advisers.
The Board also considered comparative advisory fee data provided by Invesco Advisers for comparable registered funds managed by third-party advisers. The Board noted that Invesco Advisers does not manage other funds or client accounts with investment strategies comparable to those of the Fund. The Board noted that the advisory fee is below the Lipper Specialty/Miscellaneous Funds classification median fee and that the advisory fee is below the fees of two key competitors identified by Invesco Advisers at all breakpoints and above the fee of one key competitor at all breakpoints. The Board noted that the competitor with the lower fees only invests in U.S. securities.
Based upon the information provided and considerations described above, the Board concluded that the compensation payable to Invesco Advisers and the Affiliated Sub-Advisers is fair and reasonable.
| D. | Economies of Scale and Breakpoints |
The Board considered the extent to which there may be economies of scale in the provision of advisory services to the Fund. The Board also considered whether the Fund would benefit from such economies of scale through contractual breakpoints in the Fund’s advisory fee schedule and through expense waivers. The
22 Invesco Global Infrastructure Fund
Board also noted that the Fund will share directly in economies of scale through lower fees charged by third party service providers based on the combined size of all of the Invesco Funds and other clients advised by Invesco Advisers.
| E. | Profitability and Financial Resources |
The Board considered information from Invesco Advisers concerning the costs of the advisory and other services that Invesco Advisers and its affiliates provide to the Invesco Funds and the profitability of Invesco Advisers and its affiliates in providing these services. The Board received information from Invesco Advisers demonstrating that Invesco Advisers and each Affiliated Sub-Adviser are financially sound and have the resources necessary to perform their obligations under the Fund’s investment advisory agreement and sub-advisory contracts.
| F. | Collateral Benefits to Invesco Advisers and its Affiliates |
The Board considered various other to be benefits received by Invesco Advisers and its affiliates resulting from Invesco Advisers’ relationship with the Fund, including the fees to be received by Invesco Advisers and its affiliates for their provision of transfer agency and distribution services to the Fund. The Board considered the performance of Invesco Advisers and its affiliates in providing these services to other Invesco Funds and the organizational structure employed by Invesco Advisers and its affiliates to provide these services. The Board also considered that these services will be provided to the Fund pursuant to written contracts that are reviewed and approved on an annual basis by the Board; that the services are required for the operation of the Fund; that Invesco Advisers and its affiliates can provide services, the nature and quality of which are at least equal to those provided by others offering the same or similar services; and that the fees for such services are fair and reasonable in light of the usual and customary charges by others for services of the same nature and quality.
The Board considered the benefits realized by Invesco Advisers and the Affiliated Sub-Advisers as a result of portfolio brokerage transactions executed through “soft dollar” arrangements. The Board noted that soft dollar arrangements shift the payment obligation for research and execution services from Invesco Advisers and the Affiliated Sub-Advisers to the Invesco Funds and that the research received may be used with other clients of Invesco Advisers and may reduce Invesco Advisers’ and the Affiliated Sub-Advisers’ expenses. The Board also considered periodic reports that it receives from the Chief Compliance Officer of the Invesco Funds demonstrating that these arrangements are consistent with regulatory requirements. The Board did not deem the soft dollar arrangements to be inappropriate.
The Board considered the fact that the Fund’s uninvested cash and cash collateral from any securities lending arrangements may be invested in money market funds advised by Invesco Advisers pursuant to procedures
approved by the Board. The Board noted that Invesco Advisers will receive advisory fees from these affiliated money market funds attributable to such investments, although Invesco Advisers has contractually agreed to waive through at least June 30, 2014, the advisory fees payable by the Fund with respect to such investments. This waiver is in an amount equal to 100% of the net advisory fee Invesco Advisers or its affiliates receive from the affiliated money market funds with respect to the Fund’s investment in the affiliated money market funds of uninvested cash, but not cash collateral from securities lending arrangements. The Board concluded that the Fund’s investment of uninvested cash and cash collateral from any securities lending arrangements in the affiliated money market funds is fair and reasonable.
The Board also considered that the Fund may use an affiliated broker to execute certain trades and was advised that such trades will be executed in compliance with rules under the Investment Company Act of 1940, as amended.
23 Invesco Global Infrastructure Fund
Tax Information
Form 1099-DIV, Form 1042-S and other year–end tax information provide shareholders with actual calendar year amounts that should be included in their tax returns. Shareholders should consult their tax advisors.
The following distribution information is being provided as required by the Internal Revenue Code or to meet a specific state’s requirement.
The Fund designates the following amounts or, if subsequently determined to be different, the maximum amount allowable for its fiscal year ended October 31, 2014:
| | | | |
Federal and State Income Tax | |
Qualified Dividend Income* | | | 87.79 | % |
Corporate Dividends Received Deduction* | | | 39.85 | % |
U.S. Treasury Obligations* | | | 0.00 | % |
| | * | The above percentages are based on ordinary income dividends paid to shareholders during the Fund’s fiscal year. |
24 Invesco Global Infrastructure Fund
Trustees and Officers
The address of each trustee and officer is AIM Investment Funds (Invesco Investment Funds) (the “Trust”), 11 Greenway Plaza, Suite 1000, Houston, Texas 77046-1173. The trustees serve for the life of the Trust, subject to their earlier death, incapacitation, resignation, retirement or removal as more specifically provided in the Trust’s organizational documents. Each officer serves for a one year term or until their successors are elected and qualified. Column two below includes length of time served with predecessor entities, if any.
| | | | | | | | |
Name, Year of Birth and Position(s) Held with the Trust | | Trustee and/
or Officer Since | | Principal Occupation(s) During Past 5 Years | | Number of Funds in Fund Complex Overseen by Trustee | | Other Directorship(s) Held by Trustee During Past 5 Years |
| Interested Persons | | | | | | | | |
| Martin L. Flanagan1 — 1960 Trustee | | 2007 | | Executive Director, Chief Executive Officer and President, Invesco Ltd. (ultimate parent of Invesco and a global investment management firm); Advisor to the Board, Invesco Advisers, Inc. (formerly known as Invesco Institutional (N.A.), Inc.); Trustee, The Invesco Funds; Vice Chair, Investment Company Institute; and Member of Executive Board, SMU Cox School of Business Formerly: Chairman and Chief Executive Officer, Invesco Advisers, Inc. (registered investment adviser); Director, Chairman, Chief Executive Officer and President, IVZ Inc. (holding company), INVESCO Group Services, Inc. (service provider) and Invesco North American Holdings, Inc. (holding company); Director, Chief Executive Officer and President, Invesco Holding Company Limited (parent of Invesco and a global investment management firm); Director, Invesco Ltd.; Chairman, Investment Company Institute and President, Co-Chief Executive Officer, Co-President, Chief Operating Officer and Chief Financial Officer, Franklin Resources, Inc. (global investment management organization). | | 144 | | None |
Philip A. Taylor2 — 1954 Trustee, President and Principal Executive Officer | | 2006 | | Head of North American Retail and Senior Managing Director, Invesco Ltd.; Director, Co-Chairman, Co-President and Co-Chief Executive Officer, Invesco Advisers, Inc. (formerly known as Invesco Institutional (N.A.), Inc.) (registered investment adviser); Director, Chairman, Chief Executive Officer and President, Invesco Management Group, Inc. (formerly known as Invesco Aim Management Group, Inc.) (financial services holding company); Director and President, INVESCO Funds Group, Inc. (registered investment adviser and registered transfer agent); Director and Chairman, Invesco Investment Services, Inc. (formerly known as Invesco Aim Investment Services, Inc.) (registered transfer agent) and IVZ Distributors, Inc. (formerly known as INVESCO Distributors, Inc.) (registered broker dealer); Director, President and Chairman, Invesco Inc. (holding company) and Invesco Canada Holdings Inc. (holding company); Chief Executive Officer, Invesco Corporate Class Inc. (corporate mutual fund company) and Invesco Canada Fund Inc. (corporate mutual fund company); Director, Chairman and Chief Executive Officer, Invesco Canada Ltd. (formerly known as Invesco Trimark Ltd./Invesco Trimark Ltèe) (registered investment adviser and registered transfer agent); Trustee, President and Principal Executive Officer, The Invesco Funds (other than AIM Treasurer’s Series Trust (Invesco Treasurer’s Series Trust) and Short-Term Investments Trust); Trustee and Executive Vice President, The Invesco Funds (AIM Treasurer’s Series Trust (Invesco Treasurer’s Series Trust) and Short-Term Investments Trust only); Director, Invesco Investment Advisers LLC (formerly known as Van Kampen Asset Management); Director, Chief Executive Officer and President, Van Kampen Exchange Corp. Formerly: Director and Chairman, Van Kampen Investor Services Inc.; Director, Chief Executive Officer and President, 1371 Preferred Inc. (holding company) and Van Kampen Investments Inc.; Director and President, AIM GP Canada Inc. (general partner for limited partnerships) and Van Kampen Advisors, Inc.; Director and Chief Executive Officer, Invesco Trimark Dealer Inc. (registered broker dealer); Director, Invesco Distributors, Inc. (formerly known as Invesco Aim Distributors, Inc.) (registered broker dealer); Manager, Invesco PowerShares Capital Management LLC; Director, Chief Executive Officer and President, Invesco Advisers, Inc.; Director, Chairman, Chief Executive Officer and President, Invesco Aim Capital Management, Inc.; President, Invesco Trimark Dealer Inc. and Invesco Trimark Ltd./Invesco Trimark Ltèe; Director and President, AIM Trimark Corporate Class Inc. and AIM Trimark Canada Fund Inc.; Senior Managing Director, Invesco Holding Company Limited; Director and Chairman, Fund Management Company (former registered broker dealer); President and Principal Executive Officer, The Invesco Funds (AIM Treasurer’s Series Trust (Invesco Treasurer’s Series Trust), and Short-Term Investments Trust only); President, AIM Trimark Global Fund Inc. and AIM Trimark Canada Fund Inc. | | 144 | | None |
Wayne W. Whalen3 — 1939 Trustee | | 2010 | | Of Counsel, and prior to 2010, partner in the law firm of Skadden, Arps, Slate, Meagher & Flom LLP, legal counsel to certain funds in the Fund Complex | | 144 | | Director of the Mutual fund Directors Forum, a nonprofit membership organization for investment directors; Chairman and Director of the Abraham Lincoln Presidential Library Foundation; and Director of the Stevenson Center for Democracy |
| 1 | Mr. Flanagan is considered an interested person (within the meaning of Section 2(a)(19) of the 1940 Act) of the Trust because he is an officer of the Adviser to the Trust, and an officer and a director of Invesco Ltd., ultimate parent of the Adviser. |
| 2 | Mr. Taylor is considered an interested person (within the meaning of Section 2(a)(19) of the 1940 Act) of the Trust because he is an officer and a director of the Adviser. |
| 3 | Mr. Whalen is retiring effective December 31, 2014. He has been deemed to be an interested person of the Trust because of his prior service as counsel to the predecessor funds of certain Invesco open-end funds and his affiliation with the law firm that served as counsel to such predecessor funds and the Invesco closed-end funds. |
T-1 Invesco Global Infrastructure Fund
Trustees and Officers—(continued)
| | | | | | | | |
Name, Year of Birth and Position(s) Held with the Trust | | Trustee and/
or Officer Since | | Principal Occupation(s) During Past 5 Years | | Number of Funds in Fund Complex Overseen by Trustee | | Other Directorship(s) Held by Trustee During Past 5 Years |
| Independent Trustees | | | | | | | | |
Bruce L. Crockett — 1944 Trustee and Chair | | 2001 | | Chairman, Crockett Technologies Associates (technology consulting company) Formerly: Director, Captaris (unified messaging provider); Director, President and Chief Executive Officer, COMSAT Corporation; Chairman, Board of Governors of INTELSAT (international communications company); ACE Limited (insurance company); and Investment Company Institute | | 144 | | ALPS (Attorneys Liability Protection Society) (insurance company) |
David C. Arch — 1945 Trustee | | 2010 | | Chairman of Blistex Inc., a consumer health care products manufacturer | | 144 | | Board member of the Illinois Manufacturers’ Association; Member of the Board of Visitors, Institute for the Humanities, University of Michigan; Member of the Audit Committee of the Edward-Elmhurst Hospital |
Frank S. Bayley — 1939 Trustee | | 1987 | | Retired. Formerly: Director, Badgley Funds Inc. (registered investment company) (2 portfolios) and General Partner and Of Counsel, law firm of Baker & McKenzie, LLP | | 144 | | Director and Chairman, C.D. Stimson Company (a real estate investment company); Trustee, The Curtis Institute of Music |
James T. Bunch — 1942 Trustee | | 2003 | | Managing Member, Grumman Hill Group LLC (family office private equity investments) Formerly: Founder, Green Manning & Bunch Ltd. (investment banking firm) (1988-2010); Executive Committee, United States Golf Association; and Director, Policy Studies, Inc. and Van Gilder Insurance Corporation | | 144 | | Chairman, Board of Governors, Western Golf Association; Chairman, Evans Scholars Foundation; and Director, Denver Film Society |
Rodney F. Dammeyer — 1940 Trustee | | 2010 | | Chairman of CAC,LLC, (private company offering capital investment and management advisory services) Formerly: Prior to 2001, Managing Partner at Equity Group Corporate Investments; Prior to 1995, Chief Executive Officer of Itel Corporation (formerly Anixter International); Prior to 1985, experience includes Senior Vice President and Chief Financial Officer of Household International, Inc., Executive Vice President and Chief Financial Officer of Northwest Industries, Inc. and Partner of Arthur Andersen & Co.; From 1987 to 2010, Director/Trustee of investment companies in the Van Kampen Funds complex | | 144 | | Director of Quidel Corporation and Stericycle, Inc. |
Albert R. Dowden — 1941 Trustee | | 2001 | | Director of a number of public and private business corporations, including the Boss Group, Ltd. (private investment and management); Nature’s Sunshine Products, Inc. and Reich & Tang Funds (5 portfolios) (registered investment company) Formerly: Director, Homeowners of America Holding Corporation/Homeowners of America Insurance Company (property casualty company); Director, Continental Energy Services, LLC (oil and gas pipeline service); Director, CompuDyne Corporation (provider of product and services to the public security market) and Director, Annuity and Life Re (Holdings), Ltd. (reinsurance company); Director, President and Chief Executive Officer, Volvo Group North America, Inc.; Senior Vice President, AB Volvo; Director of various public and private corporations; Chairman, DHJ Media, Inc.; Director, Magellan Insurance Company; and Director, The Hertz Corporation, Genmar Corporation (boat manufacturer), National Media Corporation; Advisory Board of Rotary Power International (designer, manufacturer, and seller of rotary power engines); and Chairman, Cortland Trust, Inc. (registered investment company) | | 144 | | Director of: Nature’s Sunshine Products, Inc., Reich & Tang Funds, Homeowners of America Holding Corporation/ Homeowners of America Insurance Company, the Boss Group |
Jack M. Fields — 1952 Trustee | | 2001 | | Chief Executive Officer, Twenty First Century Group, Inc. (government affairs company); Owner and Chief Executive Officer, Dos Angeles Ranch, L.P. (cattle, hunting, corporate entertainment); and Discovery Global Education Fund (non-profit) Formerly: Chief Executive Officer, Texana Timber LP (sustainable forestry company); Director of Cross Timbers Quail Research Ranch (non-profit); and member of the U.S. House of Representatives | | 144 | | Insperity, Inc. (formerly known as Administaff) |
Prema Mathai-Davis — 1950 Trustee | | 2001 | | Retired. Formerly: Chief Executive Officer, YWCA of the U.S.A. | | 144 | | None |
Larry Soll — 1942 Trustee | | 2003 | | Retired. Formerly: Chairman, Chief Executive Officer and President, Synergen Corp. (a biotechnology company) | | 144 | | None |
Hugo F. Sonnenschein — 1940 Trustee | | 2010 | | President Emeritus and Honorary Trustee of the University of Chicago and the Adam Smith Distinguished Service Professor in the Department of Economics at the University of Chicago. Prior to 2000, President of the University of Chicago | | 144 | | Trustee of the University of Rochester and a member of its investment committee; Member of the National Academy of Sciences and the American Philosophical Society; Fellow of the American Academy of Arts and Sciences |
T-2 Invesco Global Infrastructure Fund
Trustees and Officers—(continued)
| | | | | | | | |
Name, Year of Birth and Position(s) Held with the Trust | | Trustee and/
or Officer Since | | Principal Occupation(s) During Past 5 Years | | Number of Funds in Fund Complex Overseen by Trustee | | Other Directorship(s) Held by Trustee During Past 5 Years |
| Independent Trustees—(continued) |
Raymond Stickel, Jr. — 1944 Trustee | | 2005 | | Retired. Formerly: Director, Mainstay VP Series Funds, Inc. (25 portfolios) and Partner, Deloitte & Touche | | 144 | | None |
Suzanne H. Woolsey — 1941 Trustee | | 2014 | | Chief Executive Officer of Woolsey Partners LLC | | 144 | | Emeritus Chair of the Board of Trustees of the Institute for Defense Analyses; Trustee of Colorado College; Trustee of California Institute of Technology; Prior to 2014, Director of Fluor Corp.; Prior to 2010, Trustee of the German Marshall Fund of the United States; Prior to 2010 Trustee of the Rocky Mountain Institute |
| Other Officers | | | | | | | | |
Russell C. Burk — 1958 Senior Vice President and Senior Officer | | 2005 | | Senior Vice President and Senior Officer, The Invesco Funds | | N/A | | N/A |
John M. Zerr — 1962 Senior Vice President, Chief Legal Officer and Secretary | | 2006 | | Director, Senior Vice President, Secretary and General Counsel, Invesco Management Group, Inc. (formerly known as Invesco Aim Management Group, Inc.) and Van Kampen Exchange Corp.; Senior Vice President, Invesco Advisers, Inc. (formerly known as Invesco Institutional (N.A.), Inc.) (registered investment adviser); Senior Vice President and Secretary, Invesco Distributors, Inc. (formerly known as Invesco Aim Distributors, Inc.); Director, Vice President and Secretary, Invesco Investment Services, Inc. (formerly known as Invesco Aim Investment Services, Inc.) and IVZ Distributors, Inc. (formerly known as INVESCO Distributors, Inc.); Director and Vice President, INVESCO Funds Group, Inc.; Senior Vice President, Chief Legal Officer and Secretary, The Invesco Funds; Manager, Invesco PowerShares Capital Management LLC; Director, Secretary and General Counsel, Invesco Investment Advisers LLC (formerly known as Van Kampen Asset Management); Secretary and General Counsel, Invesco Capital Markets, Inc. (formerly known as Van Kampen Funds Inc.) and Chief Legal Officer, PowerShares Exchange-Traded Fund Trust, PowerShares Exchange-Traded Fund Trust II, PowerShares India Exchange-Traded Fund Trust, PowerShares Actively Managed Exchange-Traded Fund Trust; and PowerShares Actively Managed Exchange-Traded Commodity Fund Trust Formerly: Director and Vice President, Van Kampen Advisors Inc.; Director, Vice President, Secretary and General Counsel, Van Kampen Investor Services Inc.; Director, Invesco Distributors, Inc. (formerly known as Invesco Aim Distributors, Inc.); Director, Senior Vice President, General Counsel and Secretary, Invesco Aim Advisers, Inc. and Van Kampen Investments Inc.; Director, Vice President and Secretary, Fund Management Company; Director, Senior Vice President, Secretary, General Counsel and Vice President, Invesco Aim Capital Management, Inc.; Chief Operating Officer and General Counsel, Liberty Ridge Capital, Inc. (an investment adviser); Vice President and Secretary, PBHG Funds (an investment company) and PBHG Insurance Series Fund (an investment company); Chief Operating Officer, General Counsel and Secretary, Old Mutual Investment Partners (a broker-dealer); General Counsel and Secretary, Old Mutual Fund Services (an administrator) and Old Mutual Shareholder Services (a shareholder servicing center); Executive Vice President, General Counsel and Secretary, Old Mutual Capital, Inc. (an investment adviser); and Vice President and Secretary, Old Mutual Advisors Funds (an investment company) | | N/A | | N/A |
Sheri Morris — 1964 Vice President, Treasurer and Principal Financial Officer | | 1999 | | Vice President, Treasurer and Principal Financial Officer, The Invesco Funds; Vice President, Invesco Advisers, Inc. (formerly known as Invesco Institutional (N.A.), Inc.) (registered investment adviser); and Vice President, PowerShares Exchange-Traded Fund Trust, PowerShares Exchange-Traded Fund Trust II, PowerShares India Exchange-Traded Fund Trust, PowerShares Actively Managed Exchange-Traded Fund Trust, and PowerShares Actively Managed Exchange-Traded Commodity Fund Trust Formerly: Vice President, Invesco Aim Advisers, Inc., Invesco Aim Capital Management, Inc. and Invesco Aim Private Asset Management, Inc.; Assistant Vice President and Assistant Treasurer, The Invesco Funds and Assistant Vice President, Invesco Advisers, Inc., Invesco Aim Capital Management, Inc. and Invesco Aim Private Asset Management, Inc.; and Treasurer, PowerShares Exchange-Traded Fund Trust, PowerShares Exchange-Traded Fund Trust II, PowerShares India Exchange-Traded Fund Trust and PowerShares Actively Managed Exchange-Traded Fund Trust | | N/A | | N/A |
T-3 Invesco Global Infrastructure Fund
Trustees and Officers—(continued)
| | | | | | | | |
Name, Year of Birth and Position(s) Held with the Trust | | Trustee and/
or Officer Since | | Principal Occupation(s) During Past 5 Years | | Number of Funds in Fund Complex Overseen by Trustee | | Other Directorship(s) Held by Trustee During Past 5 Years |
| Other Officers—(continued) | | | | | | | | |
Karen Dunn Kelley — 1960 Vice President | | 2004 | | Senior Managing Director, Investments; Director, Co-President, Co-Chief Executive Officer, and Co-Chairman, Invesco Advisers, Inc. (formerly known as Invesco Institutional (N.A.), Inc.) (registered investment adviser); Chairman, Invesco Senior Secured Management, Inc.; Senior Vice President, Invesco Management Group, Inc. (formerly known as Invesco Aim Management Group, Inc.); Executive Vice President, Invesco Distributors, Inc. (formerly known as Invesco Aim Distributors, Inc.); Director, Invesco Mortgage Capital Inc. and Invesco Management Company Limited; Director and President, INVESCO Asset Management (Bermuda) Ltd., Vice President, The Invesco Funds (other than AIM Treasurer’s Series Trust (Invesco Treasurer’s Series Trust) and Short-Term Investments Trust); and President and Principal Executive Officer, The Invesco Funds (AIM Treasurer’s Series Trust (Invesco Treasurer’s Series Trust) and Short-Term Investments Trust only) Formerly: Director, INVESCO Global Asset Management Limited and INVESCO Management S.A.; Senior Vice President, Van Kampen Investments Inc. and Invesco Advisers, Inc. (formerly known as Invesco Institutional (N.A.), Inc.) (registered investment adviser); Vice President, Invesco Advisers, Inc. (formerly known as Invesco Institutional (N.A.), Inc.); Director of Cash Management and Senior Vice President, Invesco Advisers, Inc. and Invesco Aim Capital Management, Inc.; Director and President, Fund Management Company; Chief Cash Management Officer, Director of Cash Management, Senior Vice President, and Managing Director, Invesco Aim Capital Management, Inc.; Director of Cash Management, Senior Vice President, and Vice President, Invesco Advisers, Inc. and The Invesco Funds (AIM Treasurer’s Series Trust (Invesco Treasurer’s Series Trust), and Short-Term Investments Trust only) | | N/A | | N/A |
Crissie M. Wisdom — 1969 Anti-Money Laundering Compliance Officer | | 2013 | | Anti-Money Laundering Compliance Officer, Invesco Advisers, Inc. (formerly known as Invesco Institutional (N.A.), Inc.) (registered investment adviser), Invesco Capital Markets, Inc. (formerly known as Van Kampen Funds Inc.), Invesco Distributors, Inc., Invesco Investment Services, Inc., Invesco Management Group, Inc., Van Kampen Exchange Corp., The Invesco Funds, and PowerShares Exchange-Traded Fund Trust, PowerShares Exchange-Traded Fund Trust II, PowerShares India Exchange-Traded Fund Trust, PowerShares Actively Managed Exchange-Traded Fund Trust and PowerShares Actively Managed Exchange-Traded Commodity Fund Trust; and Fraud Prevention Manager and Controls and Risk Analysis Manager for Invesco Investment Services, Inc. | | N/A | | N/A |
Todd L. Spillane — 1958 Chief Compliance Officer | | 2006 | | Senior Vice President, Invesco Management Group, Inc. (formerly known as Invesco Aim Management Group, Inc.) and Van Kampen Exchange Corp.; Senior Vice President and Chief Compliance Officer, Invesco Advisers, Inc. (registered investment adviser) (formerly known as Invesco Institutional (N.A.), Inc.); Chief Compliance Officer, The Invesco Funds; Vice President, Invesco Distributors, Inc. (formerly known as Invesco Aim Distributors, Inc.) and Invesco Investment Services, Inc. (formerly known as Invesco Aim Investment Services, Inc.) Formerly: Chief Compliance Officer, Invesco Funds (Chicago); Senior Vice President, Van Kampen Investments Inc.; Senior Vice President and Chief Compliance Officer, Invesco Aim Advisers, Inc. and Invesco Aim Capital Management, Inc.; Chief Compliance Officer, INVESCO Private Capital Investments, Inc. (holding company), Invesco Private Capital, Inc. (registered investment adviser), Invesco Global Asset Management (N.A.), Inc., Invesco Senior Secured Management, Inc. (registered investment adviser), Van Kampen Investor Services Inc., PowerShares Exchange-Traded Fund Trust, PowerShares Exchange-Traded Fund Trust II, PowerShares India Exchange-Traded Fund Trust and PowerShares Actively Managed Exchange-Traded Fund Trust; and Vice President, Invesco Aim Capital Management, Inc. and Fund Management Company | | N/A | | N/A |
The Statement of Additional Information of the Trust includes additional information about the Fund’s Trustees and is available upon request, without charge, by calling 1.800.959.4246. Please refer to the Fund’s prospectus for information on the Fund’s sub-advisers.
| | | | | | |
Office of the Fund 11 Greenway Plaza, Suite 1000 Houston, TX 77046-1173 | | Investment Adviser Invesco Advisers, Inc. 1555 Peachtree Street, N.E. Atlanta, GA 30309 | | Distributor Invesco Distributors, Inc. 11 Greenway Plaza, Suite 1000 Houston, TX 77046-1173 | | Auditors PricewaterhouseCoopers LLP 1000 Louisiana Street, Suite 5800 Houston, TX 77002-5678 |
| | | |
| | | | | | |
Counsel to the Fund Stradley Ronon Stevens & Young, LLP 2005 Market Street, Suite 2600 Philadelphia, PA 19103-7018 | | Counsel to the Independent Trustees Goodwin Procter LLP 901 New York Avenue, N.W. Washington, D.C. 20001 | | Transfer Agent Invesco Investment Services, Inc. 11 Greenway Plaza, Suite 1000 Houston, TX 77046-1173 | | Custodian State Street Bank and Trust Company 225 Franklin Street Boston, MA 02110-2801 |
T-4 Invesco Global Infrastructure Fund

Invesco mailing information
Send general correspondence to Invesco Investment Services, Inc., P.O. Box 219078, Kansas City, MO 64121-9078.
Important notice regarding delivery of security holder documents
To reduce Fund expenses, only one copy of most shareholder documents may be mailed to shareholders with multiple accounts at the same address (Householding). Mailing of your shareholder documents may be householded indefinitely unless you instruct us otherwise. If you do not want the mailing of these documents to be combined with those for other members of your household, please contact Invesco Investment Services, Inc. at 800 959 4246 or contact your financial institution. We will begin sending you individual copies for each account within 30 days after receiving your request.
Fund holdings and proxy voting information
The Fund provides a complete list of its holdings four times in each fiscal year, at the quarter ends. For the second and fourth quarters, the lists appear in the Fund’s semiannual and annual reports to shareholders. For the first and third quarters, the Fund files the lists with the Securities and Exchange Commission (SEC) on Form N-Q. The most recent list of portfolio holdings is available at invesco.com/completeqtrholdings. Shareholders can also look up the Fund’s Forms N-Q on the SEC website at sec.gov. Copies of the Fund’s Forms N-Q may be reviewed and copied at the SEC Public Reference Room in Washington, D.C. You can obtain information on the operation of the Public Reference Room, including information about duplicating fee charges, by calling 202 551 8090 or 800 732 0330, or by electronic request at the following email address: publicinfo@sec.gov. The SEC file numbers for the Fund are shown below.
A description of the policies and procedures that the Fund uses to determine how to vote proxies relating to portfolio securities is available without charge, upon request, from our Client Services department at 800 959 4246 or at invesco.com/proxyguidelines. The information is also available on the SEC website, sec.gov.
| | |
Information regarding how the Fund voted proxies related to its portfolio securities during the most recent 12-month period ended June 30 is available at invesco.com/proxysearch. The information is also available on the SEC website, sec.gov. Invesco Advisers, Inc. is an investment adviser; it provides investment advisory services to individual and institutional clients and does not sell securities. Invesco Distributors, Inc. is the US distributor for Invesco Ltd.’s retail mutual funds, exchange-traded funds and institutional money market funds. Both are wholly owned, indirect subsidiaries of Invesco Ltd. | |  |
| | | | |
| SEC file numbers: 811-05426 and 033-19338 | | GBLI-AR-1 | | Invesco Distributors, Inc. |

Letters to Shareholders
| | | | |

Philip Taylor | | | | Dear Shareholders: This annual report includes information about your Fund, including performance data and a complete list of its investments as of the close of the reporting period. Inside, your Fund’s portfolio managers discuss how they managed your Fund and the factors that affected its performance during the reporting period. I hope you find this report of interest. During the reporting period covered by this report, the US economy showed signs of continued improvement. After contracting in the first quarter of 2014, the economy expanded strongly in the second quarter and unemployment trended lower. Much of the credit for this improvement goes to the US Federal Reserve (the Fed), which undertook an extraordinary asset purchase program following the global financial crisis. The Fed’s goal was to jumpstart the economy by encouraging banks to lend more, businesses to hire more and consumers to spend more. Signs of a stronger US economy prompted the Fed to reduce, or “taper,” its |
asset purchase program. Despite this, interest rates remained near historical low levels due largely to heavy investor demand for bonds. While signs of economic improvement were evident in the US, European economies showed signs of weakening. That, together with geopolitical uncertainty and worries about the first diagnosed cases of Ebola outside of Africa, caused increased volatility in US and European equities.
Extended periods of market strength can lull investors into complacency – just as prolonged periods of market weakness or volatility can discourage investors from initiating long-term investment plans. That’s why Invesco has always encouraged investors to work with a professional financial adviser who can stress the importance of starting to save and invest early and the importance of adhering to a disciplined investment plan – when times are good and when they’re uncertain. A financial adviser who knows your unique financial situation, investment goals and risk tolerance can be an invaluable partner as you seek to achieve your financial goals. He or she can offer a long-term perspective when markets are volatile and time-tested advice and guidance when your financial situation or investment goals change.
Timely information when and where you want it
Invesco’s efforts to help investors achieve their financial objectives include providing individual investors and financial professionals with timely information about the markets, the economy and investing – whenever and wherever they want it.
Our website, invesco.com/us, offers a wide range of market insights and investment perspectives. On the website, you’ll find detailed information about our funds, including prices, performance, holdings and portfolio manager commentaries. You can access information about your individual Invesco account whenever it’s convenient for you; just complete a simple, secure online registration. Use the “Log In” box on our home page to get started.
Invesco’s mobile app for iPad® (available free from the App StoreSM) allows you to obtain the same detailed information about your Fund and the same investment insights from our investment leaders, market strategists, economists and retirement experts on the go. You also can watch portfolio manager videos and have instant access to Invesco news and updates wherever you may be.
In addition to the resources accessible on our website and through our mobile app, you can obtain timely updates to help you stay informed about the markets, the economy and investing by connecting with Invesco on Twitter, LinkedIn or Facebook. You can access our blog at blog.invesco.us.com. Our goal is to provide you the information you want, when and where you want it.
Have questions?
For questions about your account, feel free to contact an Invesco client services representative at 800 959 4246. For Invesco-related questions or comments, please email me directly at phil@invesco.com.
All of us at Invesco look forward to serving your investment management needs for many years to come. Thank you for investing with us.
Sincerely,

Philip Taylor
Senior Managing Director, Invesco Ltd.
iPad is a trademark of Apple Inc., registered in the US and other countries. App Store is a service mark of Apple Inc. Invesco Distributors, Inc. is not affiliated with Apple Inc.
|
| 2 Invesco Global Market Neutral Fund |
| | | | |

Bruce Crockett | | | | Dear Fellow Shareholders: There are a variety of factors that can impact investment performance, many of which are uncontrollable by us as investors. These factors can include various economic trends and geopolitical developments. While the members of the Invesco Funds Board, which I chair, can’t dictate the performance of the Invesco funds, be assured that your Board works diligently throughout the year to focus on how your investments are managed. Our job is to represent you and your interests on a variety of fund management-related matters. We regularly monitor how the portfolio management teams of the Invesco funds are performing in light of ever-changing and often unpredictable economic and market conditions. We review the investment strategies and investment process employed by each fund’s management team as explained in the fund’s prospectus. Perhaps our most significant responsibility is conducting the annual review of the funds’ |
advisory and sub-advisory contracts with Invesco Advisers and its affiliates. This annual review, which is required by the Investment Company Act of 1940, focuses on the nature and quality of the services Invesco provides as the adviser to the Invesco funds and the reasonableness of the fees that it charges for those services. Each year, we spend months carefully reviewing information from Invesco that allows us to evaluate the quality of its services and the reasonableness of its fees. We also use information from a variety of independent sources, including materials provided by the independent senior officer of the Invesco funds, who reports directly to the independent trustees on the Board. Additionally, we meet with legal counsel and review performance and fee data prepared for us by Lipper Inc., an independent, third-party firm widely recognized as a leader in its field.
After a careful review, the members of the Invesco Funds Board approved the continuation of advisory and sub-advisory contracts with Invesco Advisers and its affiliates. Be assured that your Board will continue working on behalf of fund shareholders, keeping your needs and interests uppermost in our minds.
As always, please contact me at bruce@brucecrockett.com with any questions or concerns you may have. On behalf of the Board, we look forward to continuing to represent your interests and serving your needs.
Sincerely,

Bruce L. Crockett
Independent Chair
Invesco Funds Board of Trustees
|
| 3 Invesco Global Market Neutral Fund |
Management’s Discussion of Fund Performance
Performance summary
Invesco Global Market Neutral Fund incepted on December 19, 2013. From the Fund’s inception to the end of the reporting period, the Fund’s Class A Shares, at net asset value (NAV), outperformed the Citi US T-Bill 3 Month Index and the Lipper Alternative Equity Market Neutral Index, the Fund’s broad market/style-specific and peer group benchmarks, respectively. Stock selection added to total return in six of 10 sectors, led by the health care, information technology (IT) and industrials sectors. Stock selection in the energy and materials sectors detracted from Fund performance.
Additional performance information for your Fund appears later in this report.
Fund vs. Indexes
Cumulative total returns, 12/19/13 to 10/31/14, at net asset value (NAV). Performance shown does not include applicable contingent deferred sales charges (CDSC) or front-end sales charges, which would have reduced performance.
| | | | | |
| Class A Shares1 | | | | 4.90 | % |
| Class C Shares1 | | | | 4.10 | |
| Class R Shares1 | | | | 4.60 | |
| Class Y Shares1 | | | | 5.10 | |
| Class R5 Shares1 | | | | 5.10 | |
| Class R6 Shares1 | | | | 5.10 | |
| Citi US T-Bill 3 Month Index‚ (Broad Market/Style-Specific Index) | | | | 0.03 | |
| Lipper Alternative Equity Market Neutral Indexn (Peer Group Index) | | | | 0.76 | |
Source(s): ‚FactSet Research Systems Inc.; nLipper Inc.
| 1 | Amount includes the effect of the Adviser pay-in for an economic loss of $0.41 per share. Had the pay-in not been made, the total return would have been 0.80%, 0.10%, 0.60%, 1.00%, 1.00% and 1.00% for Class A, Class C, Class R, Class Y, Class R5 and Class R6 shares, respectively. |
Market conditions and your Fund
Global equity markets generally rose during the reporting period ended October 31, 2014, on signs that economic growth was accelerating as a result of the loose monetary policies of many developed countries’ central banks. While 2014 began on an optimistic note, global equity markets pulled back at various points in reaction to economic and geopolitical concerns.
These concerns included worries about potentially negative effects of the US Federal Reserve reducing the scope of its asset purchase program beginning in early 2014, an Argentine sovereign bond default and eurozone banking concerns. Global equity markets also fell as geopolitical tensions in Ukraine and the Middle East weakened the outlook for global growth.
Advanced economies such as the UK and US saw a modest but stronger
rebound than Europe, where a nascent recovery has stalled. A more supportive monetary policy in the eurozone may be positive for equity markets there, and we have seen evidence of earnings recovery coming through.
Meanwhile, the Bank of Japan remained committed to extraordinary monetary stimulus. Consumer spending in Japan has been weak for some time, and retail sales and household spending increased only gradually during the reporting period – although improved corporate earnings were an encouraging sign.
Equity market performance in emerging markets was mixed. China continued to face headwinds and struggled to balance structural reforms with its desire to maintain satisfactory growth, while many countries in Asia, including India, Indonesia and the Philippines, experienced strong positive gains.
The Fund seeks to add value by capturing the performance spread between its long and short holdings. We implement this strategy by purchasing equity securities we believe are undervalued and selling short securities we believe are overvalued. The offsetting exposures of these securities (e.g. – industry, country, region, market capitalization and style) are intended to lead to beta neutrality at the Fund level. Beta is a measure of risk representing how a security is expected to respond to general market movements.
For the reporting period, the largest contributors to Fund performance were
|
Portfolio Composition By sector, based on total investments |
| | | | | | | | | | | | | | | |
| | | Long Portfolio
Holdings | | Equity Securities - Short† | | Total Investments |
| | | |
Information Technology | | | | 10.2 | % | | | | 9.2 | % | | | | 19.4 | % |
Consumer Discretionary | | | | 9.5 | | | | | 9.4 | | | | | 18.9 | |
Industrials | | | | 9.3 | | | | | 8.0 | | | | | 17.3 | |
Energy | | | | 5.7 | | | | | 5.9 | | | | | 11.6 | |
Health Care | | | | 4.4 | | | | | 4.5 | | | | | 8.9 | |
Consumer Staples | | | | 3.0 | | | | | 3.1 | | | | | 6.1 | |
Utilities | | | | 2.3 | | | | | 2.8 | | | | | 5.1 | |
Materials | | | | 2.2 | | | | | 2.4 | | | | | 4.6 | |
Financials | | | | 2.2 | | | | | 3.3 | | | | | 5.5 | |
Telecommunication Services | | | | 1.2 | | | | | 1.3 | | | | | 2.5 | |
| Money Market Funds Plus Other Assets Less Liabilities | | | | 0.1 | | | | | – | | | | | 0.1 | |
Total | | | | 50.1 | | | | | 49.9 | | | | | 100.0 | |
| † | Represents the value of the equity securities underlying the equity short portfolio swap with Morgan Stanley. |
| | | | | |
| Top 10 Long Equity Holdings* |
| | | | | |
| |
| 1. Amgen Inc. | | | | 2.4 | % |
| 2. Northrop Grumman Corp. | | | | 2.4 | |
| 3. ProSiebenSat.1 Media AG | | | | 2.2 | |
| 4. Tokyo Gas Co., Ltd. | | | | 2.2 | |
| 5. West Japan Railway Co. | | | | 2.1 | |
| 6. Hewlett-Packard Co. | | | | 2.1 | |
7. Nippon Telegraph & Telephone Corp. | | | | 2.0 | |
| 8. Archer-Daniels-Midland Co. | | | | 1.9 | |
| 9. ITV PLC | | | | 1.9 | |
| 10. Next PLC | | | | 1.9 | |
| | | | | |
| | |
| Total Net Assets | | $13.9 million |
| | | | | |
| |
Total Number of Holdings* | | | | 116 | |
| | | | | |
The Fund’s holdings are subject to change, and there is no assurance that the Fund will continue to hold any particular security. *Excluding money market fund holdings. |
|
| 4 Invesco Global Market Neutral Fund |
stock selection in the IT, health care and industrials sector.1 Within the IT sector, the Fund benefited from short positions in the IT services and software industries that performed poorly compared to industry peers.1 The Fund’s long positions in the computer/electronics and communications equipment industries outpaced peers for the reporting period.1
In the industrials sector, the Fund benefited mostly from both long and short positions in the capital goods and commercial and professional services industries for the reporting period.1
Within the health care sector, both long positions in pharmaceuticals and biotechnology outpaced their peers and aided Fund outperformance at NAV for the reporting period.1
Stock selection in the energy sector was the largest detractor from Fund performance during the reporting period. The Fund was hampered by its long positions in the energy equipment industry. In the oil, gas and consumable fuels industry, the long holdings delivered negative performance, while short positions generated positive returns causing a drag on overall performance.
In addition, within the materials sector, long positions held in the steel industry detracted from Fund performance.
At the end of the reporting period, the largest gross sector exposures were in the IT, consumer discretionary and industrials sectors.
Please note that the Fund may utilize derivative instruments that include equity total return swaps or future contracts. During the reporting period, the Fund utilized equity total return swaps to efficiently implement its strategy. The implementation impact of using equity total return swaps is a component of transaction costs. Derivatives may amplify traditional investment risks through the creation of leverage.
During the reporting period, the Fund did not utilize futures contracts.
Thank you for your investment in Invesco Global Market Neutral Fund.
| 1 | Includes the effect of the Adviser pay-in for an economic loss of $0.41 per share. |
The views and opinions expressed in management’s discussion of Fund performance are those of Invesco Advisers, Inc. These views and opinions are subject to change at any time based on factors such as market and economic conditions. These views and opinions may not be relied upon as investment advice or recommendations, or as an offer for a particular security. The information is not a complete analysis of every aspect of any market, country, industry, security or the Fund. Statements of fact are from sources considered reliable, but Invesco Advisers, Inc. makes no representation or warranty as to their completeness or accuracy. Although historical performance is no guarantee of future results, these insights may help you understand our investment management philosophy.
See important Fund and, if applicable, index disclosures later in this report.
| | |
 | | Michael Abata Chartered Financial Analyst, Portfolio Manager, is manager of Invesco Global Market Neutral Fund. |
| He joined Invesco in 2011. Mr. Abata earned a BA in economics from Bing-hamton University. |
| | |
 | | Karl Georg Bayer Portfolio Manager, is manager of Invesco Global Market Neutral Fund. He joined Invesco in 1991. |
| Mr. Bayer earned Diplom Kaufmann and Diplom Ingenieur degrees from the University of Darmstadt. |
| | |
 | | Uwe Draeger Portfolio Manager, is manager of Invesco Global Market Neutral Fund. He joined Invesco in 2005. |
| Mr. Draeger earned a Diplom-Ökonom degree from Hochschule für Ökonomie Berlin, an MA from City of London Polytechnic and an MBA from Anglia Business School (Cambridge). |
| | |
 | | Nils Huter Chartered Financial Analyst, Portfolio Manager, is manager of Invesco Global Market Neutral Fund. |
| He joined Invesco in 2007. Mr. Huter earned a business administration degree “Diplom Kaufmann (FH)” from the University of Applied Sciences and Arts in Hildesheim. |
| | |
 | | Charles Ko Chartered Financial Analyst, Portfolio Manager, is manager of Invesco Global Market Neutral Fund. |
| He joined Invesco in 2012. Mr. Ko earned a BS from MIT and an MBA from Yale University. |
| | |
 | | Jens Langewand Portfolio Manager, is manager of Invesco Global Market Neutral Fund. He joined Invesco in 2007. |
| Mr. Langewand earned a Diplom Kaufmann degree from the University of Münster and a PhD from the University of Augsburg. |
| | |
 | | Andrew Waisburd Portfolio Manager, is manager of Invesco Global Market Neutral Fund. He joined Invesco in 2008. |
| Mr. Waisburd earned a BS in statistics from Cornell University and an MS and a PhD in finance from Indiana University. |
|
| 5 Invesco Global Market Neutral Fund |
Your Fund’s Performance
Results of a $10,000 Investment – Oldest Share Class(es) since Inception
Fund and index data from 12/19/13
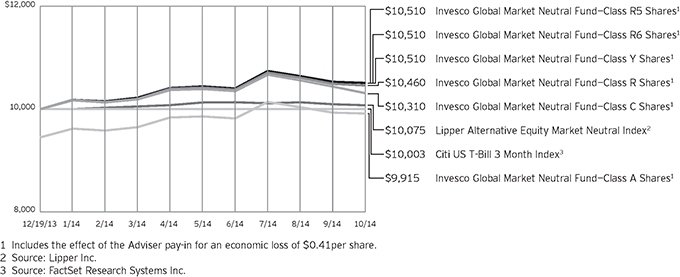
Past performance cannot guarantee comparable future results.
The data shown in the chart include reinvested distributions, applicable sales charges and Fund expenses including
management fees. Index results include reinvested dividends, but they do not reflect sales charges. Performance of the peer group, if applicable, reflects fund expenses and management fees;
performance of a market index does not. Performance shown in the chart and table(s) does not reflect deduction of taxes a shareholder would pay on Fund distributions or sale of Fund shares.
continued from page 8
About indexes used in this report
| n | | The Citi US T-Bill 3 Month Index is an unmanaged index representative of three-month Treasury bills. |
| n | | The Lipper Alternative Equity Market Neutral Index is an unmanaged index considered representative of funds that employ portfolio strategies generating consistent returns in both up and down markets by selecting positions with a total net market exposure of zero. |
| n | | The Fund is not managed to track the performance of any particular index, including the index(es) described here, and consequently, the performance of the Fund may deviate significantly from the performance of the
index(es). |
| n | | A direct investment cannot be made in an index. Unless otherwise indicated, index results include reinvested dividends, and they do not reflect sales charges. Performance of the peer group, if applicable, reflects fund expenses; performance of a market index does not. |
Other information
| n | | The returns shown in management’s discussion of Fund performance are based on net asset values (NAVs) calculated for shareholder transactions. Generally accepted accounting principles require adjustments to be made to the net assets of the Fund at period end for financial reporting purposes, and as such, the NAVs for shareholder transactions and the returns based on those NAVs may differ from the NAVs and returns reported in the Financial Highlights. |
| n | | Industry classifications used in this report are generally according to the Global Industry Classification Standard, which was developed by and is the exclusive property and a service mark of MSCI Inc. and Standard & Poor’s. |
|
| 6 Invesco Global Market Neutral Fund |
| | | | |
Cumulative Total Returns | |
As of 10/31/14, including maximum applicable sales charges | |
| |
| Class A Shares* | | | | |
| Inception (12/19/13) | | | -0.85 | % |
| |
| Class C Shares* | | | | |
| Inception (12/19/13) | | | 3.10 | % |
| |
| Class R Shares* | | | | |
| Inception (12/19/13) | | | 4.60 | % |
| |
| Class Y Shares* | | | | |
| Inception (12/19/13) | | | 5.10 | % |
| |
| Class R5 Shares* | | | | |
| Inception (12/19/13) | | | 5.10 | % |
| |
| Class R6 Shares* | | | | |
Inception (12/19/13) | | | 5.10 | % |
| * | Amount includes the effect of the Adviser pay-in for an economic loss of $0.41 per share. Had the pay-in not been made, the total return would have been -4.73%,
-0.90%, 0.60%, 1.00%, 1.00% and 1.00% for Class A, Class C, Class R, Class Y, Class R5 and Class R6 shares, respectively. |
The performance data quoted represent past performance and cannot guarantee comparable future results; current performance may be lower or higher. Please visit invesco.com/performance for the most recent month-end performance. Performance figures reflect reinvested distributions, changes in net asset value and the effect of the maximum sales charge unless otherwise stated. Investment return and principal value will fluctuate so that you may have a gain or loss when you sell shares.
The net annual Fund operating expense ratio set forth in the most recent Fund prospectus as of the date of this report for Class A, Class C, Class R, Class Y, Class R5 and Class R6 shares was 1.62%, 2.37%, 1.87%, 1.37%, 1.37% and 1.37%, respectively.1 The total annual Fund operating expense ratio set forth in the most recent Fund prospectus as of the date of this report for Class A, Class C, Class R, Class Y, Class R5 and Class R6 shares was 3.42%, 4.17%, 3.67%, 3.17%, 3.06% and 3.01%, respectively. The expense ratios presented above may vary from the expense ratios presented in other sections of this report that are based on expenses incurred during the period covered by this report.
Class A share performance reflects the maximum 5.50% sales charge, and Class C share performance reflects the
| | | | |
Cumulative Total Returns | |
| As of 9/30/14, the most recent calendar quarter end, including maximum applicable sales charges | |
| |
| Class A Shares** | | | | |
| Inception (12/19/13) | | | -0.66 | % |
| |
| Class C Shares** | | | | |
| Inception (12/19/13) | | | 3.40 | % |
| |
| Class R Shares** | | | | |
| Inception (12/19/13) | | | 4.90 | % |
| |
| Class Y Shares** | | | | |
| Inception (12/19/13) | | | 5.30 | % |
| |
| Class R5 Shares** | | | | |
| Inception (12/19/13) | | | 5.30 | % |
| |
| Class R6 Shares** | | | | |
Inception (12/19/13) | | | 5.30 | % |
| ** | Amount includes the effect of the Adviser pay-in for an economic loss of $0.41 per share. Had the pay-in not been made, the total return would have been -3.40%, 0.60%, 2.10%, 2.40%, 2.40% and 2.40% for Class A, Class C, Class R, Class Y, Class R5 and Class R6 shares, respectively. |
applicable contingent deferred sales charge (CDSC) for the period involved. The CDSC on Class C shares is 1% for the first year after purchase. Class R, Class Y, Class R5 and Class R6 class shares do not have a front-end sales charge or a CDSC; therefore, performance is at net asset value.
The performance of the Fund’s share classes will differ primarily due to different sales charge structures and class expenses.
Had the adviser not waived fees and/or reimbursed expenses, performance would have been lower.
| 1 | Total annual Fund operating expenses after any contractual fee waivers and/or expense reimbursements by the adviser in effect through at least February 29, 2016. See current prospectus for more information. |
|
| 7 Invesco Global Market Neutral Fund |
Invesco Global Market Neutral Fund’s investment objective is to seek to provide a positive return over a full market cycle from a broadly diversified portfolio of stocks while seeking to limit exposure to the general risks associated with stock market investing.
| n | | Unless otherwise stated, information presented in this report is as of October 31, 2014, and is based on total net assets. |
| n | | Unless otherwise noted, all data provided by Invesco. |
| n | | To access your Fund’s reports/prospectus, visit invesco.com/fundreports. |
About share classes
| n | | Class R shares are generally available only to employer sponsored retirement and benefit plans. Please see the prospectus for more information. |
| n | | Class Y shares are available only to certain investors. Please see the prospectus for more information. |
| n | | Class R5 shares and Class R6 shares are primarily intended for employer sponsored retirement and benefit plans that meet certain standards and for institutional investors. Please see the prospectus for more information. |
Principal risks of investing in the Fund
| n | | Derivatives risk. The value of a derivative instrument depends largely on (and is derived from) the value of an underlying security, currency, commodity, interest rate, index or other asset (each referred to as an underlying asset). In addition to risks relating to the underlying assets, the use of derivatives may include other, possibly greater, risks, including counterparty, leverage and liquidity risks. Counterparty risk is the risk that the counterparty to the derivative contract will default on its obligation to pay the Fund the amount owed or otherwise perform under the derivative contract. Derivatives create leverage risk because they do not require payment up front equal to the economic exposure created by owning the derivative. As a result, an adverse change in the value of the underlying asset could result in the Fund sustaining a loss that is substantially greater than the amount invested in the derivative, which may make the Fund’s returns more volatile and increase the risk of loss. Derivative instruments may also be less liquid than more traditional investments and the Fund may be unable to sell or close out its derivative positions at a desirable time or price. This risk may be more acute under adverse |
| | | market conditions, during which the Fund may be most in need of liquidating its derivative positions. Derivatives may also be harder to value, less tax efficient and subject to changing government regulation that could impact the Fund’s ability to use certain derivatives or their cost. Also, derivatives used for hedging or to gain or limit exposure to a particular market segment may not provide the expected benefits, particularly during adverse market conditions. These risks are greater for the Fund than mutual funds that do not use derivative instruments or that use derivative instruments to a lesser extent than the Fund to implement their investment strategy. |
| n | | Foreign securities risk. The Fund’s foreign investments may be affected by changes in a foreign country’s exchange rates, political and social instability, changes in economic or taxation policies, difficulties when enforcing obligations, decreased liquidity, and increased volatility. Foreign companies may be subject to less regulation resulting in less publicly available information about the companies. |
| n | | Large capitalization company risk. Larger, more established companies may be unable to respond quickly to new competitive challenges such as changes in consumer tastes or innovative smaller competitors. Returns on investments in large capitalization companies could trail the returns on investments in smaller companies. |
| n | | Management risk. The investment techniques and risk analysis used by the Fund’s portfolio managers may not produce the desired results. In particular, there is no guarantee that the portfolio manager’s stock selection process will produce a market neutral portfolio that reduces or eliminates the Fund’s exposure to general US stock market risk, sector or industry-specific risk or market capitalization risk. In addition, the Fund’s market neutral investment |
| | | strategy will likely cause the Fund to underperform the broader US equity market during market rallies. Such underperformance could be significant during sudden or significant market rallies. Although the Fund seeks to provide a positive return, investors may lose money by investing in the Fund. |
| n | | Market risk. The prices of and the income generated by the Fund’s securities may decline in response to, among other things, investor sentiment, general economic and market conditions, regional or global instability, and currency and interest rate fluctuations. |
| n | | Short sales risk. Short sales may cause the Fund to repurchase a security at a higher price, thereby causing a loss. A short position in a security poses more risk than holding the same security long. As there is no limit on how much the price of the security can increase, the Fund’s exposure is unlimited. In order to establish a short position in a security, the Fund must borrow the security from a broker. The Fund may not always be able to borrow a security the Fund seeks to sell short at a particular time or at an acceptable price. The Fund also may not always be able to close out the short position by replacing the borrowed securities at a particular time or at an acceptable price. The Fund will incur increased transaction costs associated with selling securities short. In addition, taking short positions in securities results in a form of leverage which may cause the Fund to be volatile. |
| n | | Small- and mid-capitalization risks. Stocks of small- and mid-sized companies tend to be more vulnerable to adverse developments and may have little or no operating history or track record of success, and limited product lines, markets, management and financial resources. The securities of small- and mid-sized companies may be more volatile due to less market interest and less publicly available information about the issuer. They also may be illiquid or restricted as to resale, or may trade less frequently and in smaller volumes, all of which may cause difficulty when establishing or closing a position at a desirable price. |
continued on page 6
|
This report must be accompanied or preceded by a currently effective Fund prospectus, which contains more complete information, including sales charges and expenses. Investors should read it carefully before investing. |
|
|
| NOT FDIC INSURED | MAY LOSE VALUE | NO BANK GUARANTEE |
|
| 8 Invesco Global Market Neutral Fund |
Schedule of Investments
October 31, 2014
| | | | | | | | |
| | | Shares | | | Value | |
Common Stocks & Other Equity Interests–102.51% | |
| Australia–1.78% | |
Caltex Australia Ltd. | | | 2,503 | | | $ | 68,646 | |
Echo Entertainment Group Ltd. | | | 17,666 | | | | 61,265 | |
Ramsay Health Care Ltd. | | | 2,555 | | | | 117,880 | |
| | | | | | | | 247,791 | |
|
| Belgium–0.38% | |
Delhaize Group S.A. | | | 776 | | | | 53,093 | |
|
| Canada–6.68% | |
Agnico-Eagle Mines Ltd. | | | 1,000 | | | | 23,569 | |
Baytex Energy Corp. | | | 600 | | | | 18,337 | |
Canadian Natural Resources Ltd. | | | 1,700 | | | | 59,332 | |
Canadian Tire Corp., Ltd.–Class A | | | 1,800 | | | | 197,379 | |
Encana Corp. | | | 12,900 | | | | 240,394 | |
Enerplus Corp. | | | 8,600 | | | | 123,173 | |
Kinross Gold Corp.(a) | | | 7,200 | | | | 15,398 | |
Stantec Inc. | | | 3,100 | | | | 196,442 | |
Suncor Energy, Inc. | | | 1,500 | | | | 53,270 | |
| | | | | | | | 927,294 | |
|
| Denmark–2.02% | |
Pandora AS | | | 1,910 | | | | 160,785 | |
Vestas Wind Systems A.S.(a) | | | 3,589 | | | | 120,125 | |
| | | | | | | | 280,910 | |
|
| France–1.81% | |
Technicolor S.A.(a) | | | 7,992 | | | | 47,237 | |
Valeo S.A. | | | 1,823 | | | | 204,891 | |
| | | | | | | | 252,128 | |
|
| Germany–3.22% | |
Continental AG | | | 320 | | | | 62,815 | |
KUKA AG | | | 1,237 | | | | 77,821 | |
ProSiebenSat.1 Media AG | | | 7,221 | | | | 291,282 | |
Rheinmetall AG | | | 348 | | | | 14,957 | |
| | | | | | | | 446,875 | |
|
| Hong Kong–1.67% | |
Power Assets Holdings Ltd. | | | 24,000 | | | | 231,641 | |
|
| Israel–0.67% | |
Bezeq The Israeli Telecommunication Corp. Ltd. | | | 27,543 | | | | 46,722 | |
Delek Group Ltd. | | | 133 | | | | 45,645 | |
| | | | | | | | 92,367 | |
|
| Japan–23.71% | |
Aoyama Trading Co., Ltd. | | | 3,600 | | | | 86,647 | |
Asahi Glass Co., Ltd. | | | 5,000 | | | | 26,374 | |
Brother Industries, Ltd. | | | 5,600 | | | | 102,546 | |
Dai Nippon Printing Co., Ltd. | | | 4,000 | | | | 39,877 | |
Daihatsu Motor Co., Ltd. | | | 8,400 | | | | 117,126 | |
| | | | | | | | |
| | | Shares | | | Value | |
| Japan–(continued) | |
Daito Trust Construction Co., Ltd. | | | 1,800 | | | $ | 227,342 | |
DeNA Co., Ltd. | | | 2,600 | | | | 33,703 | |
Denki Kagaku Kogyo Kabushiki Kaisha | | | 60,000 | | | | 196,735 | |
FamilyMart Co., Ltd. | | | 4,400 | | | | 176,426 | |
Konica Minolta Inc. | | | 6,600 | | | | 74,703 | |
Marubeni Corp. | | | 25,000 | | | | 162,582 | |
Medipal Holdings Corp. | | | 6,800 | | | | 76,661 | |
Miraca Holdings Inc. | | | 2,000 | | | | 84,810 | |
Nippon Electric Glass Co., Ltd. | | | 14,000 | | | | 66,152 | |
Nippon Paper Industries Co. Ltd. | | | 2,500 | | | | 37,146 | |
Nippon Telegraph & Telephone Corp. | | | 4,200 | | | | 262,414 | |
Nomura Real Estate Holdings, Inc. | | | 3,900 | | | | 69,568 | |
Osaka Gas Co., Ltd. | | | 34,000 | | | | 137,031 | |
Seiko Epson Corp. | | | 1,900 | | | | 89,989 | |
Sekisui Chemical Co., Ltd. | | | 3,000 | | | | 37,298 | |
Showa Shell Sekiyu K.K. | | | 29,000 | | | | 249,781 | |
Sumitomo Forestry Co., Ltd. | | | 12,900 | | | | 137,512 | |
TDK CORP | | | 2,600 | | | | 150,024 | |
Tokyo Gas Co., Ltd. | | | 50,000 | | | | 291,031 | |
Toppan Printing Co. Ltd. | | | 6,000 | | | | 41,360 | |
TOTO Ltd. | | | 3,000 | | | | 33,887 | |
West Japan Railway Co. | | | 5,900 | | | | 284,770 | |
| | | | | | | | 3,293,495 | |
|
| Luxembourg–0.84% | |
APERAM(a) | | | 4,030 | | | | 116,076 | |
|
| Macau–1.03% | |
MGM China Holdings Ltd. | | | 43,600 | | | | 142,660 | |
|
| Netherlands–1.67% | |
Heineken N.V. | | | 718 | | | | 53,615 | |
NXP Semiconductors N.V.(a) | | | 2,600 | | | | 178,516 | |
| | | | | | | | 232,131 | |
|
| New Zealand–0.23% | |
Spark New Zealand Ltd. | | | 13,027 | | | | 32,120 | |
|
| Norway–1.23% | |
DNB ASA | | | 3,810 | | | | 69,979 | |
Yara International ASA | | | 2,206 | | | | 101,520 | |
| | | | | | | | 171,499 | |
|
| Sweden–2.18% | |
Intrum Justitia AB | | | 6,162 | | | | 183,076 | |
Loomis AB–Class B | | | 4,357 | | | | 119,772 | |
| | | | | | | | 302,848 | |
|
| Switzerland–2.17% | |
Forbo Holding AG | | | 78 | | | | 80,943 | |
Georg Fischer AG | | | 381 | | | | 219,857 | |
| | | | | | | | 300,800 | |
See accompanying Notes to Financial Statements which are an integral part of the financial statements.
9 Invesco Global Market Neutral Fund
| | | | | | | | |
| | | Shares | | | Value | |
| United Kingdom–7.61% | |
AstraZeneca PLC | | | 673 | | | $ | 49,004 | |
Britvic PLC | | | 7,154 | | | | 78,025 | |
Hikma Pharmaceuticals PLC | | | 6,562 | | | | 199,206 | |
ITV PLC | | | 78,963 | | | | 256,440 | |
Next PLC | | | 2,425 | | | | 250,335 | |
PACE PLC | | | 14,352 | | | | 79,748 | |
Royal Dutch Shell PLC–Class B | | | 1,828 | | | | 67,821 | |
WH Smith PLC | | | 4,232 | | | | 76,296 | |
| | | | | | | | 1,056,875 | |
|
| United States–43.61% | |
AECOM Technology Corp.(a) | | | 2,000 | | | | 65,100 | |
Alexion Pharmaceuticals, Inc.(a) | | | 300 | | | | 57,408 | |
Amgen Inc. | | | 2,000 | | | | 324,360 | |
AOL Inc.(a) | | | 1,000 | | | | 43,530 | |
Archer-Daniels-Midland Co. | | | 5,500 | | | | 258,500 | |
Best Buy Co., Inc. | | | 2,300 | | | | 78,522 | |
Brocade Communications Systems, Inc. | | | 16,700 | | | | 179,191 | |
CA, Inc. | | | 6,400 | | | | 185,984 | |
Cardinal Health, Inc. | | | 800 | | | | 62,784 | |
Celgene Corp.(a) | | | 400 | | | | 42,836 | |
Chesapeake Energy Corp. | | | 6,000 | | | | 133,080 | |
Cisco Systems, Inc. | | | 6,400 | | | | 156,608 | |
Computer Sciences Corp. | | | 1,200 | | | | 72,480 | |
ConocoPhillips | | | 3,400 | | | | 245,310 | |
Deckers Outdoor Corp.(a) | | | 200 | | | | 17,492 | |
Devon Energy Corp. | | | 800 | | | | 48,000 | |
Everest Re Group, Ltd. | | | 1,200 | | | | 204,780 | |
GameStop Corp.–Class A | | | 5,400 | | | | 230,904 | |
Garmin Ltd. | | | 1,400 | | | | 77,672 | |
Gilead Sciences, Inc.(a) | | | 1,100 | | | | 123,200 | |
Hewlett-Packard Co. | | | 7,800 | | | | 279,864 | |
HollyFrontier Corp. | | | 600 | | | | 27,228 | |
Huntington Ingalls Industries Inc. | | | 1,700 | | | | 179,894 | |
Lexmark International, Inc.–Class A | | | 5,500 | | | | 237,380 | |
| | | | | | | | |
| | | Shares | | | Value | |
| United States–(continued) | |
Liberty Ventures–Series A(a) | | | 1,800 | | | $ | 63,180 | |
Lincoln National Corp. | | | 800 | | | | 43,808 | |
Live Nation Entertainment, Inc.(a) | | | 1,700 | | | | 44,200 | |
Manpowergroup Inc. | | | 900 | | | | 60,075 | |
Marathon Petroleum Corp. | | | 600 | | | | 54,540 | |
Marvell Technology Group Ltd. | | | 16,300 | | | | 219,072 | |
Nabors Industries Ltd. | | | 1,200 | | | | 21,420 | |
NetApp, Inc. | | | 4,500 | | | | 192,600 | |
Northrop Grumman Corp. | | | 2,300 | | | | 317,308 | |
NVIDIA Corp. | | | 3,700 | | | | 72,298 | |
Oracle Corp. | | | 1,800 | | | | 70,290 | |
Patterson-UTI Energy, Inc. | | | 4,100 | | | | 94,423 | |
Pilgrim’s Pride Corp.(a) | | | 8,400 | | | | 238,644 | |
Pitney Bowes Inc. | | | 3,700 | | | | 91,538 | |
Polycom, Inc.(a) | | | 3,100 | | | | 40,548 | |
Raytheon Co. | | | 2,100 | | | | 218,148 | |
Take-Two Interactive Software, Inc.(a) | | | 7,800 | | | | 206,310 | |
Trinity Industries, Inc. | | | 5,800 | | | | 207,118 | |
United States Steel Corp. | | | 3,300 | | | | 132,132 | |
United Therapeutics Corp.(a) | | | 800 | | | | 104,776 | |
Valero Energy Corp. | | | 1,300 | | | | 65,117 | |
VeriSign, Inc.(a) | | | 2,800 | | | | 167,328 | |
| | | | | | | | 6,056,980 | |
Total Common Stocks & Other Equity Interests
(Cost $14,014,122) | | | | 14,237,583 | |
| | |
Money Market Funds–0.24% | | | | | | | | |
Liquid Assets Portfolio–Institutional
Class(b) | | | 16,892 | | | | 16,892 | |
Premier Portfolio–Institutional Class(b) | | | 16,892 | | | | 16,892 | |
Total Money Market Funds
(Cost $33,784) | | | | 33,784 | |
TOTAL INVESTMENTS–102.75%
(Cost $14,047,906) | | | | 14,271,367 | |
OTHER ASSETS LESS LIABILITIES–(2.75)% | | | | (381,713 | ) |
NET ASSETS–100.00% | | | $ | 13,889,654 | |
Notes to Schedule of Investments:
| (a) | Non-income producing security. |
| (b) | The money market fund and the Fund are affiliated by having the same investment adviser. |
See accompanying Notes to Financial Statements which are an integral part of the financial statements.
10 Invesco Global Market Neutral Fund
| | | | | | | | | | | | | | | | | | | | | | | | |
| Open Total Return Swap Agreements | |
| Reference Entity | | Counterparty | | Expiration Date | | | Floating Rate(1) | | | | | Notional Value | | | Unrealized Appreciation
(Depreciation) | | | Net Value of
Reference
Entities | |
Equity Securities-Short | | Morgan Stanley & Co. LLC | | | 12/24/15 | | | AUD-Overnight Rate | | | AUD | | | | (105,478 | ) | | $ | (1,640 | ) | | $ | (94,466 | ) |
Equity Securities-Short | | Morgan Stanley & Co. LLC | | | 12/24/15 | | | Bank of Canada Overnight
Lending Rate | | | CAD | | | | (902,016 | ) | | | 31,118 | | | | (769,080 | ) |
Equity Securities-Short | | Morgan Stanley & Co. LLC | | | 12/24/15 | | | Tom-Next Overnight Index
Swap Rate for Swiss Franc | | | CHF | | | | (225,501 | ) | | | (5,123 | ) | | | (239,465 | ) |
Equity Securities-Short | | Morgan Stanley & Co. LLC | | | 03/17/16 | | | Copenhagen Interbank
Offered Rate | | | DKK | | | | (1,505,916 | ) | | | (9,859 | ) | | | (263,407 | ) |
Equity Securities-Short (Germany) | | Morgan Stanley & Co. LLC | | | 12/24/15 | | | Euro Overnight Index Average | | | EUR | | | | (349,833 | ) | | | (15,186 | ) | | | (453,513 | ) |
Equity Securities-Short (Supranational) | | Morgan Stanley & Co. LLC | | | 12/23/15 | | | Euro Overnight Index Average | | | EUR | | | | (583,988 | ) | | | (27,414 | ) | | | (759,005 | ) |
Equity Securities-Short | | Morgan Stanley & Co. LLC | | | 12/24/15 | | | GBP Sterling Overnight Index Average | | | GBP | | | | (633,949 | ) | | | (22,128 | ) | | | (1,036,313 | ) |
Equity Securities-Short | | Morgan Stanley & Co. LLC | | | 12/24/15 | | | Overnight Rate calculated by Hong Kong Broker Association | | | HKD | | | | (3,928,098 | ) | | | (11,023 | ) | | | (517,542 | ) |
Equity Securities-Short | | Morgan Stanley & Co. LLC | | | 12/25/15 | | | Japan Overnight Rate | | | JPY | | | | (340,864,600 | ) | | | (321,724 | ) | | | (3,349,727 | ) |
Equity Securities-Short | | Morgan Stanley & Co. LLC | | | 12/31/15 | | | Norwegian Interbank Offered Rate | | | NOK | | | | (1,940,547 | ) | | | (25,679 | ) | | | (313,456 | ) |
Equity Securities-Short | | Morgan Stanley & Co. LLC | | | 12/28/15 | | | Stockholm InterBank Offered Rate | | | SEK | | | | (1,628,473 | ) | | | (23,094 | ) | | | (243,291 | ) |
Equity Securities-Short | | Morgan Stanley & Co. LLC | | | 12/24/15 | | | Federal Funds Floating Rate | | | SGD | | | | (163,386 | ) | | | 4,507 | | | | (122,699 | ) |
Equity Securities-Short | | Morgan Stanley & Co. LLC | | | 12/24/15 | | | Federal Funds Floating Rate | | | USD | | | | (5,653,565 | ) | | | (395,366 | ) | | | (6,045,292 | ) |
Total Return Swap Agreements - Equity Risk | | | $ | (822,611 | )(2)(3) | | $ | (14,207,256 | ) |
Investment Abbreviations:
| | | | | | | | | | | | | | |
| AUD | | – Australian Dollar | | DKK | | – Danish Krone | | HKD | | – Hong Kong Dollar | | SEK | | – Swedish Krona |
| CAD | | – Canadian Dollar | | EUR | | – Euro | | JPY | | – Japanese Yen | | SGD | | – Singapore Dollar |
| CHF | | – Swiss Franc | | GBP | | – British Pound | | NOK | | – Norwegian Krona | | USD | | – United States Dollar |
| (1) | The Fund receives or pays the total return on a portfolio of short positions underlying the total return swap, and pays or receives a specific rate which is denominated in various currencies based on the currencies of the securities underlying the total return swap. |
| (2) | Amount includes $(4,364) of dividends and financing fees payable from the Fund to the Counterparty. |
| (3) | Swaps are collateralized by $73,160 cash held with Morgan Stanley & Co. LLC the Counterparty. |
The following table represents the individual short positions and related values of equity securities underlying the total return swap with Morgan Stanley & Co. LLC as of October 31, 2014.
| | | | | | | | |
| | | Shares | | | Value | |
Equity Securities—Short | |
| Australia | |
ALS Ltd. | | | (14,295 | ) | | $ | (70,823 | ) |
GrainCorp Ltd.–Class A–Class A | | | (3,067 | ) | | | (23,643 | ) |
| | | | | | | | (94,466 | ) |
|
| Canada | |
Athabasca Oil Corp. | | | (26,300 | ) | | | (85,185 | ) |
Enbridge Inc. | | | (3,500 | ) | | | (165,636 | ) |
MEG Energy Corp. | | | (3,900 | ) | | | (94,134 | ) |
Northland Power Inc. | | | (3,500 | ) | | | (52,086 | ) |
Paramount Resources Ltd.–Class A–Class A | | | (4,000 | ) | | | (167,539 | ) |
Tourmaline Oil Corp. | | | (5,700 | ) | | | (204,500 | ) |
| | | | | | | | (769,080 | ) |
|
| Denmark | |
Genmab A/S | | | (6,043 | ) | | | (263,407 | ) |
| | |
| Germany | | | | | | | | |
adidas AG | | | (1,800 | ) | | | (130,936 | ) |
Aurubis AG | | | (1,605 | ) | | | (83,647 | ) |
Deutsche Wohnen AG–BR | | | (3,306 | ) | | | (74,487 | ) |
MorphoSys AG | | | (417 | ) | | | (39,572 | ) |
| | | | | | | | |
| | | Shares | | | Value | |
| Germany-(continued) | | | | | | | | |
Volkswagen AG–Preference Shares | | | (586 | ) | | $ | (124,871 | ) |
| | | | | | | | (453,513 | ) |
| Hong Kong | |
Esprit Holdings Ltd. | | | (88,700 | ) | | | (111,060 | ) |
Hong Kong & China Gas Co. Ltd. | | | (65,100 | ) | | | (151,940 | ) |
Melco International Development Ltd. | | | (94,000 | ) | | | (254,542 | ) |
| | | | | | | | (517,542 | ) |
|
| Japan | |
Asics Corp. | | | (7,600 | ) | | | (174,994 | ) |
Chiyoda Corp. | | | (3,000 | ) | | | (30,077 | ) |
Fast Retailing Co. Ltd. | | | (500 | ) | | | (179,704 | ) |
Hamamatsu Photonics KK | | | (700 | ) | | | (31,289 | ) |
Hokkaido Electric Power Co., Inc. | | | (6,100 | ) | | | (50,241 | ) |
Hulic Co. Ltd. | | | (13,200 | ) | | | (141,743 | ) |
Isetan Mitsukoshi Holdings Ltd. | | | (21,900 | ) | | | (291,519 | ) |
Keyence Corp. | | | (600 | ) | | | (280,367 | ) |
Kikkoman Corp. | | | (3,000 | ) | | | (67,474 | ) |
Kintetsu Corp. | | | (8,000 | ) | | | (27,495 | ) |
Kyushu Electric Power Co. Inc. | | | (19,600 | ) | | | (208,548 | ) |
M3 Inc. | | | (4,200 | ) | | | (68,884 | ) |
See accompanying Notes to Financial Statements which are an integral part of the financial statements.
11 Invesco Global Market Neutral Fund
| | | | | | | | |
| | | Shares | | | Value | |
| Japan–(continued) | | | | | | | | |
Mazda Motor Corp. | | | (9,500 | ) | | $ | (215,359 | ) |
Mitsubishi Estate Co. Ltd. | | | (3,000 | ) | | | (74,673 | ) |
Mitsui Chemicals Inc. | | | (76,000 | ) | | | (217,220 | ) |
NGK Spark Plug Co., Ltd. | | | (2,000 | ) | | | (51,198 | ) |
Nintendo Co., Ltd. | | | (1,800 | ) | | | (190,882 | ) |
Ono Pharmaceutical Co. Ltd. | | | (2,800 | ) | | | (277,731 | ) |
Sharp Corp. | | | (11,000 | ) | | | (26,837 | ) |
Shimadzu Corp. | | | (5,000 | ) | | | (42,828 | ) |
SoftBank Corp. | | | (600 | ) | | | (42,413 | ) |
Sugi Holdings Co. Ltd. | | | (5,800 | ) | | | (248,660 | ) |
Sumitomo Realty & Development Co. Ltd. | | | (1,000 | ) | | | (36,457 | ) |
Temp Holdings Co. Ltd. | | | (1,800 | ) | | | (56,896 | ) |
Topcon Corp. | | | (8,100 | ) | | | (183,983 | ) |
Yamaha Motor Co. Ltd. | | | (7,200 | ) | | | (132,255 | ) |
| | | | | | | | (3,349,727 | ) |
|
| Norway | |
Schibsted ASA | | | (5,493 | ) | | | (290,623 | ) |
Telenor ASA | | | (1,016 | ) | | | (22,833 | ) |
| | | | | | | | (313,456 | ) |
|
| Singapore | |
Ezion Holdings Ltd. | | | (104,400 | ) | | | (122,699 | ) |
| | |
| Supranational | | | | | | | | |
Andritz AG | | | (824 | ) | | | (39,774 | ) |
ASML Holding N.V. | | | (1,662 | ) | | | (165,467 | ) |
Galp Energia SGPS SA | | | (8,754 | ) | | | (126,864 | ) |
Koninklijke Vopak NV | | | (2,401 | ) | | | (120,227 | ) |
OCI N.V. | | | (1,963 | ) | | | (68,359 | ) |
Remy Cointreau SA | | | (3,350 | ) | | | (238,314 | ) |
| | | | | | | | (759,005 | ) |
|
| Sweden | |
Volvo AB–Class B–Class B | | | (21,149 | ) | | | (243,291 | ) |
| | |
| Switzerland | | | | | | | | |
Swiss Prime Site AG | | | (614 | ) | | | (46,647 | ) |
Syngenta AG | | | (623 | ) | | | (192,818 | ) |
| | | | | | | | (239,465 | ) |
|
| United Kingdom | |
ASOS PLC | | | (1,900 | ) | | | (80,732 | ) |
Diageo PLC | | | (4,497 | ) | | | (132,231 | ) |
Intertek Group PLC | | | (5,487 | ) | | | (238,940 | ) |
Melrose Industries PLC | | | (18,470 | ) | | | (75,673 | ) |
Ophir Energy PLC | | | (68,644 | ) | | | (203,491 | ) |
Polyus Gold International Ltd. | | | (9,397 | ) | | | (28,112 | ) |
Telecom Plus PLC | | | (5,735 | ) | | | (129,549 | ) |
UBM PLC | | | (16,213 | ) | | | (147,585 | ) |
| | | | | | | | (1,036,313 | ) |
|
| United States | |
ACI Worldwide Inc. | | | (2,100 | ) | | | (40,404 | ) |
Alexander & Baldwin Inc. | | | (5,100 | ) | | | (204,153 | ) |
Amazon.com Inc. | | | (100 | ) | | | (30,546 | ) |
Armstrong World Industries Inc. | | | (1,300 | ) | | | (62,946 | ) |
| | | | | | | | |
| | | Shares | | | Value | |
| United States–(continued) | | | | | | | | |
Arthur J Gallagher & Co. | | | (500 | ) | | $ | (23,850 | ) |
Ascena Retail Group, Inc. | | | (3,400 | ) | | | (42,330 | ) |
Atwood Oceanics Inc. | | | (600 | ) | | | (24,390 | ) |
BioMarin Pharmaceutical Inc. | | | (3,200 | ) | | | (264,000 | ) |
Carpenter Technology Corp. | | | (3,300 | ) | | | (165,165 | ) |
Cepheid, Inc. | | | (3,400 | ) | | | (180,234 | ) |
Chart Industries, Inc. | | | (4,500 | ) | | | (209,475 | ) |
Clean Harbors, Inc. | | | (500 | ) | | | (24,815 | ) |
Cree Inc. | | | (2,400 | ) | | | (75,552 | ) |
Cypress Semiconductor Corp. | | | (16,700 | ) | | | (165,497 | ) |
Darling Ingredients Inc. | | | (9,500 | ) | | | (167,200 | ) |
DigitalGlobe Inc. | | | (1,200 | ) | | | (34,308 | ) |
Duke Energy Corp. | | | (700 | ) | | | (57,505 | ) |
Fastenal Co. | | | (5,500 | ) | | | (242,220 | ) |
Finisar Corp. | | | (4,000 | ) | | | (66,880 | ) |
Fortune Brands Home & Security Inc. | | | (6,700 | ) | | | (289,775 | ) |
Genesee & Wyoming Inc.–Class A | | | (1,900 | ) | | | (182,780 | ) |
Golar LNG Ltd. | | | (1,100 | ) | | | (61,721 | ) |
Gulfport Energy Corp. | | | (3,900 | ) | | | (195,702 | ) |
Haemonetics Corp. | | | (4,000 | ) | | | (150,880 | ) |
Howard Hughes Corp. (The) | | | (200 | ) | | | (29,476 | ) |
Liberty Global PLC–Class A | | | (1,000 | ) | | | (45,470 | ) |
Life Time Fitness, Inc. | | | (1,400 | ) | | | (78,078 | ) |
Madison Square Garden Co. (The)–Class A | | | (400 | ) | | | (30,304 | ) |
Markel Corp. | | | (400 | ) | | | (276,356 | ) |
National Instruments Corp. | | | (8,800 | ) | | | (278,784 | ) |
NCR Corp. | | | (6,900 | ) | | | (190,923 | ) |
NetSuite Inc. | | | (700 | ) | | | (76,062 | ) |
Northeast Utilities | | | (3,000 | ) | | | (148,050 | ) |
Ocwen Financial Corp. | | | (1,300 | ) | | | (30,628 | ) |
Owens Corning | | | (1,700 | ) | | | (54,502 | ) |
Panera Bread Co.–Class A | | | (200 | ) | | | (32,328 | ) |
Pentair PLC | | | (600 | ) | | | (40,230 | ) |
Perrigo Co PLC | | | (400 | ) | | | (64,580 | ) |
PVH Corp. | | | (400 | ) | | | (45,740 | ) |
Rackspace Hosting, Inc. | | | (1,300 | ) | | | (49,868 | ) |
salesforce.com. inc. | | | (400 | ) | | | (25,596 | ) |
SBA Communications Corp.–Class A | | | (1,900 | ) | | | (213,427 | ) |
SemGroup Corp. | | | (1,300 | ) | | | (99,775 | ) |
Semtech Corp. | | | (1,700 | ) | | | (43,146 | ) |
Stratasys Ltd. | | | (300 | ) | | | (36,108 | ) |
SYNNEX Corp. | | | (1,100 | ) | | | (76,098 | ) |
T-Mobile US, Inc. | | | (1,000 | ) | | | (29,190 | ) |
Tractor Supply Co. | | | (600 | ) | | | (43,932 | ) |
Trimble Navigation Ltd | | | (6,900 | ) | | | (185,334 | ) |
Triumph Group, Inc. | | | (3,500 | ) | | | (243,705 | ) |
Ulta Salon Cosmetics & Fragrance, Inc. | | | (1,000 | ) | | | (120,810 | ) |
Ultimate Software Group, Inc. (The) | | | (500 | ) | | | (75,255 | ) |
United Continental Holdings Inc. | | | (700 | ) | | | (36,967 | ) |
Verizon Communications Inc. | | | (1,000 | ) | | | (50,250 | ) |
ViaSat, Inc. | | | (5,300 | ) | | | (331,992 | ) |
| | | | | | | | (6,045,292 | ) |
Total Equity Securities — Short | | | | (14,207,256 | ) |
See accompanying Notes to Financial Statements which are an integral part of the financial statements.
12 Invesco Global Market Neutral Fund
Statement of Assets and Liabilities
October 31, 2014
| | | | |
Assets: | |
Investments, at value (Cost $14,014,122) | | $ | 14,237,583 | |
Investments in affiliated money market funds, at value and cost | | | 33,784 | |
Total investments, at value (Cost $14,047,906) | | | 14,271,367 | |
Foreign currencies, at value (Cost $24,703) | | | 21,685 | |
Receivable for: | | | | |
Deposits with brokers | | | 73,160 | |
Fund shares sold | | | 24,157 | |
Dividends | | | 35,906 | |
Fund expenses absorbed | | | 26,088 | |
Reimbursement due from advisor | | | 548,296 | |
Investment for trustee deferred compensation and retirement plans | | | 1,887 | |
Other assets | | | 20,097 | |
Total assets | | | 15,022,643 | |
|
Liabilities: | |
Payable for: | | | | |
Fund shares reacquired | | | 228,608 | |
Accrued fees to affiliates | | | 2,422 | |
Accrued trustees’ and officers’ fees and benefits | | | 1,769 | |
Accrued other operating expenses | | | 75,692 | |
Trustee deferred compensation and retirement plans | | | 1,887 | |
Unrealized depreciation on swap agreements | | | 822,611 | |
Total liabilities | | | 1,132,989 | |
Net assets applicable to shares outstanding | | $ | 13,889,654 | |
|
Net assets consist of: | |
Shares of beneficial interest | | $ | 13,407,753 | |
Undistributed net investment income | | | 1,072,517 | |
Undistributed net realized gain | | | 12,815 | |
Net unrealized appreciation (depreciation) | | | (603,431 | ) |
| | | $ | 13,889,654 | |
| | | | |
Net Assets: | |
Class A | | $ | 5,196,531 | |
Class C | | $ | 122,905 | |
Class R | | $ | 14,294 | |
Class Y | | $ | 7,311,105 | |
Class R5 | | $ | 671,473 | |
Class R6 | | $ | 573,346 | |
|
Shares outstanding, $0.01 par value per share,
with an unlimited number of shares authorized: | |
Class A | | | 495,328 | |
Class C | | | 11,805 | |
Class R | | | 1,366 | |
Class Y | | | 695,262 | |
Class R5 | | | 63,897 | |
Class R6 | | | 54,557 | |
Class A: | | | | |
Net asset value per share | | $ | 10.49 | |
Maximum offering price per share | | | | |
(Net asset value of $10.49 ¸ 94.50%) | | $ | 11.10 | |
Class C: | | | | |
Net asset value and offering price per share | | $ | 10.41 | |
Class R: | | | | |
Net asset value and offering price per share | | $ | 10.46 | |
Class Y: | | | | |
Net asset value and offering price per share | | $ | 10.52 | |
Class R5: | | | | |
Net asset value and offering price per share | | $ | 10.51 | |
Class R6: | | | | |
Net asset value and offering price per share | | $ | 10.51 | |
See accompanying Notes to Financial Statements which are an integral part of the financial statements.
13 Invesco Global Market Neutral Fund
Statement of Operations
For the period December 19, 2013 (commencement date) through October 31, 2014
| | | | |
Investment income: | |
Dividends (net of foreign withholding taxes of $14,634) | | $ | 210,803 | |
Dividends from affiliated money market funds | | | 346 | |
Total investment income | | | 211,149 | |
| |
Expenses: | | | | |
Advisory fees | | | 129,317 | |
Administrative services fees | | | 43,425 | |
Custodian fees | | | 7,075 | |
Distribution fees: | | | | |
Class A | | | 11,364 | |
Class C | | | 403 | |
Class R | | | 54 | |
Transfer agent fees — A, C, R and Y | | | 3,475 | |
Transfer agent fees — R5 | | | 34 | |
Transfer agent fees — R6 | | | 21 | |
Trustees’ and officers’ fees and benefits | | | 18,234 | |
Registration and filing fees | | | 79,159 | |
Professional services fees | | | 146,839 | |
Other | | | 22,872 | |
Total expenses | | | 462,272 | |
Less: Fees waived and expenses reimbursed | | | (310,349 | ) |
Net expenses | | | 151,923 | |
Net investment income | | | 59,226 | |
| |
Realized and unrealized gain (loss) from: | | | | |
Net realized gain from: | | | | |
Investment securities | | | 12,814 | |
Net increase from payments by affiliates — See Note 2 | | | 548,296 | |
Foreign currencies | | | 1,347 | |
Swap agreements | | | 366,773 | |
| | | | 929,230 | |
Change in net unrealized appreciation (depreciation) of: | | | | |
Investment securities | | | 223,461 | |
Foreign currencies | | | (4,281 | ) |
Swap agreements | | | (822,611 | ) |
| | | | (603,431 | ) |
Net realized and unrealized gain | | | 325,799 | |
Net increase in net assets resulting from operations | | $ | 385,025 | |
See accompanying Notes to Financial Statements which are an integral part of the financial statements.
14 Invesco Global Market Neutral Fund
Statement of Changes in Net Assets
For the period December 19, 2013 (commencement date) through October 31, 2014
| | | | |
| | | December 19, 2013
(commencement date) through October 31, 2014 | |
Operations: | | | | |
Net investment income | | $ | 59,226 | |
Net realized gain from investments | | | 929,230 | |
Change in net unrealized appreciation (depreciation) | | | (603,431 | ) |
Net increase in net assets resulting from operations | | | 385,025 | |
| |
Share transactions–net: | | | | |
Class A | | | 5,052,983 | |
Class C | | | 119,366 | |
Class R | | | 13,770 | |
Class Y | | | 7,129,394 | |
Class R5 | | | 642,586 | |
Class R6 | | | 546,530 | |
Net increase in net assets resulting from share transactions | | | 13,504,629 | |
Net increase in net assets | | | 13,889,654 | |
| |
Net assets: | | | | |
Beginning of period | | | — | |
End of year (includes undistributed net investment income of $1,072,517) | | $ | 13,889,654 | |
See accompanying Notes to Financial Statements which are an integral part of the financial statements.
15 Invesco Global Market Neutral Fund
Statement of Cash Flows
For the period December 19, 2013 (commencement date) through October 31, 2014
| | | | |
Cash provided by (used in) operating activities: | | | | |
Net increase in net assets resulting from operations | | $ | 385,025 | |
| | | | |
| |
Adjustments to reconcile net increase in net assets to net cash provided by (used in) operating activities: | | | | |
Purchases of investments | | | (18,977,271 | ) |
| | | | |
Proceeds from disposition of investments | | | 4,975,963 | |
| | | | |
Net change in unrealized depreciation swap agreements | | | 822,611 | |
Increase in deposits with broker for swaps | | | (73,160 | ) |
Increase in receivables and other assets | | | (632,274 | ) |
Increase in accrued expenses and other payables | | | 81,770 | |
Increase in net unrealized appreciation on investment securities | | | (223,461 | ) |
Increase in net realized gain from investment securities | | | (12,814 | ) |
Net cash provided by (used in) operating activities | | | (13,653,611 | ) |
| |
Cash provided by financing activities: | | | | |
Proceeds from shares of beneficial interest sold | | | 15,436,207 | |
| | | | |
Disbursements from shares of beneficial interest reacquired | | | (1,727,127 | ) |
| | | | |
Net cash provided by financing activities | | | 13,709,080 | |
Net decrease in cash and cash equivalents | | | 55,469 | |
Cash and cash equivalents at beginning of period | | | — | |
Cash and cash equivalents at end of period | | $ | 55,469 | |
Notes to Financial Statements
October 31, 2014
NOTE 1—Significant Accounting Policies
Invesco Global Market Neutral Fund (the “Fund”) is a series portfolio of AIM Investment Funds (Invesco Investment Funds) (the “Trust”). The Trust is organized as a Delaware statutory trust and is registered under the Investment Company Act of 1940, as amended (the “1940 Act”), as an open-end series management investment company consisting of twenty-four separate series portfolios, each authorized to issue an unlimited number of shares of beneficial interest. The assets, liabilities and operations of each portfolio are accounted for separately. Information presented in these financial statements pertains only to the Fund. Matters affecting each portfolio or class will be voted on exclusively by the shareholders of such portfolio or class.
The Fund’s investment objective is to seek to provide a positive return over a full market cycle from a broadly diversified portfolio of stocks while seeking to limit exposure to the general risks associated with stock market investing.
The Fund currently consists of six different classes of shares: Class A, Class C, Class R, Class Y, Class R5 and Class R6. Class A shares are sold with a front-end sales charge unless certain waiver criteria are met and under certain circumstances load waived shares may be subject to contingent deferred sales charges (“CDSC”). Class C shares are sold with a CDSC. Class R, Class Y, Class R5 and Class R6 shares are sold at net asset value.
The following is a summary of the significant accounting policies followed by the Fund in the preparation of its financial statements.
| A. | Security Valuations — Securities, including restricted securities, are valued according to the following policy. |
A security listed or traded on an exchange (except convertible securities) is valued at its last sales price or official closing price as of the close of the customary trading session on the exchange where the security is principally traded, or lacking any sales or official closing price on a particular day, the security may be valued at the closing bid price on that day. Securities traded in the over-the-counter market are valued based on prices furnished by independent pricing services or market makers. When such securities are valued by an independent pricing service they may be considered fair valued. Futures contracts are valued at the final settlement price set by an exchange on which they are principally traded. Listed options are valued at the mean between the last bid and ask prices from the exchange on which they are principally traded. Options not listed on an exchange are valued by an independent source at the mean between the last bid and ask prices. For purposes of determining net asset value per share, futures and option contracts generally are valued 15 minutes after the close of the customary trading session of the New York Stock Exchange (“NYSE”).
Investments in open-end and closed-end registered investment companies that do not trade on an exchange are valued at the end of day net asset value per share. Investments in open-end and closed-end registered investment companies that trade on an exchange are valued at the last sales price or official closing price as of the close of the customary trading session on the exchange where the security is principally traded.
Swap agreements are fair valued using an evaluated quote provided by an independent pricing service. Evaluated quotes provided by the pricing service are valued based on a model which may include end of day net present values, spreads, ratings, industry, and company performance.
Debt obligations (including convertible securities) and unlisted equities are fair valued using an evaluated quote provided by an independent pricing service. Evaluated quotes provided by the pricing service may be determined without exclusive reliance on quoted prices, and may reflect
16 Invesco Global Market Neutral Fund
appropriate factors such as institution-size trading in similar groups of securities, developments related to specific securities, dividend rate (for unlisted equities), yield (for debt obligations), quality, type of issue, coupon rate (for debt obligations), maturity (for debt obligations), individual trading characteristics and other market data. Debt obligations are subject to interest rate and credit risks. In addition, all debt obligations involve some risk of default with respect to interest and/or principal payments.
Foreign securities’ (including foreign exchange contracts) prices are converted into U.S. dollar amounts using the applicable exchange rates as of the close of the NYSE. If market quotations are available and reliable for foreign exchange-traded equity securities, the securities will be valued at the market quotations. Because trading hours for certain foreign securities end before the close of the NYSE, closing market quotations may become unreliable. If between the time trading ends on a particular security and the close of the customary trading session on the NYSE, events occur that the Adviser determines are significant and make the closing price unreliable, the Fund may fair value the security. If the event is likely to have affected the closing price of the security, the security will be valued at fair value in good faith using procedures approved by the Board of Trustees. Adjustments to closing prices to reflect fair value may also be based on a screening process of an independent pricing service to indicate the degree of certainty, based on historical data, that the closing price in the principal market where a foreign security trades is not the current value as of the close of the NYSE. Foreign securities’ prices meeting the approved degree of certainty that the price is not reflective of current value will be priced at the indication of fair value from the independent pricing service. Multiple factors may be considered by the independent pricing service in determining adjustments to reflect fair value and may include information relating to sector indices, American Depositary Receipts and domestic and foreign index futures. Foreign securities may have additional risks including exchange rate changes, potential for sharply devalued currencies and high inflation, political and economic upheaval, the relative lack of issuer information, relatively low market liquidity and the potential lack of strict financial and accounting controls and standards.
Securities for which market prices are not provided by any of the above methods may be valued based upon quotes furnished by independent sources. The last bid price may be used to value equity securities. The mean between the last bid and ask prices is used to value debt obligations, including corporate loans.
Securities for which market quotations are not readily available or became unreliable are valued at fair value as determined in good faith by or under the supervision of the Trust’s officers following procedures approved by the Board of Trustees. Issuer specific events, market trends, bid/ask quotes of brokers and information providers and other market data may be reviewed in the course of making a good faith determination of a security’s fair value.
The Fund may invest in securities that are subject to interest rate risk, meaning the risk that the prices will generally fall as interest rates rise and, conversely, the prices will generally rise as interest rates fall. Specific securities differ in their sensitivity to changes in interest rates depending on their individual characteristics. Changes in interest rates may result in increased market volatility, which may affect the value and/or liquidity of certain of the Fund’s investments.
Valuations change in response to many factors including the historical and prospective earnings of the issuer, the value of the issuer’s assets, general economic conditions, interest rates, investor perceptions and market liquidity. Because of the inherent uncertainties of valuation, the values reflected in the financial statements may materially differ from the value received upon actual sale of those investments.
| B. | Securities Transactions and Investment Income — Securities transactions are accounted for on a trade date basis. Realized gains or losses on sales are computed on the basis of specific identification of the securities sold. Interest income (net of withholding tax, if any) is recorded on the accrual basis from settlement date. Dividend income (net of withholding tax, if any) is recorded on the ex-dividend date. |
The Fund may periodically participate in litigation related to Fund investments. As such, the Fund may receive proceeds from litigation settlements. Any proceeds received are included in the Statement of Operations as realized gain (loss) for investments no longer held and as unrealized gain (loss) for investments still held.
Brokerage commissions and mark ups are considered transaction costs and are recorded as an increase to the cost basis of securities purchased and/or a reduction of proceeds on a sale of securities. Such transaction costs are included in the determination of net realized and unrealized gain (loss) from investment securities reported in the Statement of Operations and the Statement of Changes in Net Assets and the net realized and unrealized gains (losses) on securities per share in the Financial Highlights. Transaction costs are included in the calculation of the Fund’s net asset value and, accordingly, they reduce the Fund’s total returns. These transaction costs are not considered operating expenses and are not reflected in net investment income reported in the Statement of Operations and Statement of Changes in Net Assets, or the net investment income per share and ratios of expenses and net investment income reported in the Financial Highlights, nor are they limited by any expense limitation arrangements between the Fund and the investment adviser.
The Fund allocates income and realized and unrealized capital gains and losses to a class based on the relative net assets of each class.
| C. | Country Determination — For the purposes of making investment selection decisions and presentation in the Schedule of Investments, the investment adviser may determine the country in which an issuer is located and/or credit risk exposure based on various factors. These factors include the laws of the country under which the issuer is organized, where the issuer maintains a principal office, the country in which the issuer derives 50% or more of its total revenues and the country that has the primary market for the issuer’s securities, as well as other criteria. Among the other criteria that may be evaluated for making this determination are the country in which the issuer maintains 50% or more of its assets, the type of security, financial guarantees and enhancements, the nature of the collateral and the sponsor organization. Country of issuer and/or credit risk exposure has been determined to be the United States of America, unless otherwise noted. |
| D. | Distributions — Distributions from net investment income and net realized capital gain, if any, are generally declared and paid annually and recorded on the ex-dividend date. The Fund may elect to treat a portion of the proceeds from redemptions as distributions for federal income tax purposes. |
| E. | Federal Income Taxes — The Fund intends to comply with the requirements of Subchapter M of the Internal Revenue Code of 1986, as amended (the “Internal Revenue Code”), necessary to qualify as a regulated investment company and to distribute substantially all of the Fund’s taxable earnings to shareholders. As such, the Fund will not be subject to federal income taxes on otherwise taxable income (including net realized capital gain) that is distributed to shareholders. Therefore, no provision for federal income taxes is recorded in the financial statements. |
The Fund recognizes the tax benefits of uncertain tax positions only when the position is more likely than not to be sustained. Management has analyzed the Fund’s uncertain tax positions and concluded that no liability for unrecognized tax benefits should be recorded related to uncertain
17 Invesco Global Market Neutral Fund
tax positions. Management is not aware of any tax positions for which it is reasonably possible that the total amounts of unrecognized tax benefits will change materially in the next 12 months.
The Fund files tax returns in the U.S. Federal jurisdiction and certain other jurisdictions. Generally, the Fund is subject to examinations by such taxing authorities for up to three years after the filing of the return for the tax period.
| F. | Expenses — Fees provided for under the Rule 12b-1 plan of a particular class of the Fund are charged to the operations of such class. Transfer agency fees and expenses and other shareholder recordkeeping fees and expenses attributable to Class R5 and Class R6 are allocated to each share class based on relative net assets. Sub-accounting fees attributable to Class R5 are charged to the operations of the class. Transfer agency fees and expenses and other shareholder recordkeeping fees and expenses relating to all other classes are allocated among those classes based on relative net assets. All other expenses are allocated among the classes based on relative net assets. |
| G. | Accounting Estimates — The preparation of financial statements in conformity with accounting principles generally accepted in the United States of America (“GAAP”) requires management to make estimates and assumptions that affect the reported amounts of assets and liabilities at the date of the financial statements and the reported amounts of revenues and expenses during the reporting period including estimates and assumptions related to taxation. Actual results could differ from those estimates by a significant amount. In addition, the Fund monitors for material events or transactions that may occur or become known after the period-end date and before the date the financial statements are released to print. |
| H. | Indemnifications — Under the Trust’s organizational documents, each Trustee, officer, employee or other agent of the Trust is indemnified against certain liabilities that may arise out of the performance of their duties to the Fund. Additionally, in the normal course of business, the Fund enters into contracts, including the Fund’s servicing agreements, that contain a variety of indemnification clauses. The Fund’s maximum exposure under these arrangements is unknown as this would involve future claims that may be made against the Fund that have not yet occurred. The risk of material loss as a result of such indemnification claims is considered remote. |
| I. | Cash and Cash Equivalents — For the purposes of the Statement of Cash Flows the Fund defines Cash and Cash Equivalents as cash (including foreign currency), money market funds and other investments held in lieu of cash and excludes investments made with cash collateral received. |
| J. | Foreign Currency Translations — Foreign currency is valued at the close of the NYSE based on quotations posted by banks and major currency dealers. Portfolio securities and other assets and liabilities denominated in foreign currencies are translated into U.S. dollar amounts at date of valuation. Purchases and sales of portfolio securities (net of foreign taxes withheld on disposition) and income items denominated in foreign currencies are translated into U.S. dollar amounts on the respective dates of such transactions. The Fund does not separately account for the portion of the results of operations resulting from changes in foreign exchange rates on investments and the fluctuations arising from changes in market prices of securities held. The combined results of changes in foreign exchange rates and the fluctuation of market prices on investments (net of estimated foreign tax withholding) are included with the net realized and unrealized gain or loss from investments in the Statement of Operations. Reported net realized foreign currency gains or losses arise from (1) sales of foreign currencies, (2) currency gains or losses realized between the trade and settlement dates on securities transactions, and (3) the difference between the amounts of dividends, interest, and foreign withholding taxes recorded on the Fund’s books and the U.S. dollar equivalent of the amounts actually received or paid. Net unrealized foreign currency gains and losses arise from changes in the fair values of assets and liabilities, other than investments in securities at fiscal period end, resulting from changes in exchange rates. |
The Fund may invest in foreign securities, which may be subject to foreign taxes on income, gains on investments or currency repatriation, a portion of which may be recoverable. Foreign taxes, if any, are recorded based on the tax regulations and rates that exist in the foreign markets in which the Fund invests and are shown in the Statement of Operations.
| K. | Forward Foreign Currency Contracts — The Fund may engage in foreign currency transactions either on a spot (i.e. for prompt delivery and settlement) basis or through forward foreign currency contracts to manage or minimize currency or exchange rate risk. |
The Fund may also enter into forward foreign currency contracts for the purchase or sale of a security denominated in a foreign currency in order to “lock in” the U.S. dollar price of that security, or the Fund may also enter into forward foreign currency contracts that do not provide for physical settlement of the two currencies, but instead are settled by a single cash payment calculated as the difference between the agreed upon exchange rate and the spot rate at settlement based upon an agreed upon notional amount (non-deliverable forwards). The Fund will set aside liquid assets in an amount equal to daily mark-to-market obligation for forward foreign currency contracts.
A forward foreign currency contract is an obligation between two parties (“Counterparties”) to purchase or sell a specific currency for an agreed-upon price at a future date. The use of forward foreign currency contracts does not eliminate fluctuations in the price of the underlying securities the Fund owns or intends to acquire but establishes a rate of exchange in advance. Fluctuations in the value of these contracts are measured by the difference in the contract date and reporting date exchange rates and are recorded as unrealized appreciation (depreciation) until the contracts are closed. When the contracts are closed, realized gains (losses) are recorded. Realized and unrealized gains (losses) on the contracts are included in the Statement of Operations. The primary risks associated with forward foreign currency contracts include failure of the Counterparty to meet the terms of the contract and the value of the foreign currency changing unfavorably. These risks may be in excess of the amounts reflected in the Statement of Assets and Liabilities.
| L. | Swap Agreements — The Fund may enter into various swap transactions, including interest rate, total return, volatility, variance, index, currency and credit default swap contracts (“CDS”) for investment purposes or to manage interest rate, equity, currency or credit risk. Such transactions are agreements between Counterparties. These agreements may contain among other conditions, events of default and termination events, and various covenants and representations such as provisions that require the Fund to maintain a pre-determined level of net assets, and/or provide limits regarding the decline of the Fund’s NAV over specific periods of time. If the Fund were to trigger such provisions and have open derivative positions at that time, the Counterparty may be able to terminate such agreement and request immediate payment in an amount equal to the net liability positions, if any. |
Interest rate, total return, volatility, variance, index, and currency swap agreements are two-party contracts entered into primarily to exchange the returns (or differentials in rates of returns) earned or realized on particular predetermined investments or instruments. The gross returns to be exchanged or “swapped” between the parties are calculated with respect to a notional amount, i.e., the return on or increase in value of a particular dollar amount invested at a particular interest rate or return of an underlying asset, in a particular foreign currency, or in a “basket” of securities representing a particular index.
18 Invesco Global Market Neutral Fund
A total return swap is an agreement in which one party make payments based on a set rate, either fixed or variable, while the other party make payments based on the return of an underlying asset, which includes both the income generated and capital gains, if any. The unrealized appreciation (depreciation) on total return swaps includes dividends on the underlying equity securities and financing rate payable from the Counterparty. At the maturity date, a net cash flow is exchanged where the total return is equivalent to the return of the underlying reference less a financing rate, if any. As a receiver, the Fund would receive payments based on any positive total return and would owe payments in the event of a negative total return. As the payer, the Fund would owe payments on any net positive total return, and would receive payment in the event of a negative total return.
Changes in the value of swap agreements are recognized as unrealized gains (losses) in the Statement of Operations by “marking to market” on a daily basis to reflect the value of the swap agreement at the end of each trading day. Payments received or paid at the beginning of the agreement are reflected as such on the Statement of Assets and Liabilities and may be referred to as upfront payments. The Fund accrues for the fixed payment stream and amortizes upfront payments, if any, on swap agreements on a daily basis with the net amount, recorded as a component of realized gain (loss) on the Statement of Operations. A liquidation payment received or made at the termination of a swap agreement is recorded as realized gain (loss) on the Statement of Operations. The Fund segregates liquid securities having a value at least equal to the amount of the potential obligation of a Fund under any swap transaction. Entering into these agreements involves, to varying degrees, lack of liquidity and elements of credit, market, and Counterparty risk in excess of amounts recognized on the Statement of Assets and Liabilities. Such risks involve the possibility that a swap is difficult to sell or liquidate; the Counterparty does not honor its obligations under the agreement and unfavorable interest rates and market fluctuations. It is possible that developments in the swaps market, including potential government regulation, could adversely affect the Fund’s ability to terminate existing swap agreements or to realize amounts to be received under such agreements. A short position in a security poses more risk than holding the same security long. As there is no limit on how much the price of the security can increase, the Fund’s exposure is unlimited.
| M. | Leverage Risk — Leverage exists when a Fund can lose more than it originally invests because it purchases or sells an instrument or enters into a transaction without investing an amount equal to the full economic exposure of the instrument or transaction. |
| N. | Collateral — To the extent the Fund has designated or segregated a security as collateral and that security is subsequently sold, it is the Fund’s practice to replace such collateral no later than the next business day. |
NOTE 2—Advisory Fees and Other Fees Paid to Affiliates
The Trust has entered into a master investment advisory agreement with Invesco Advisers, Inc. (the “Adviser” or “Invesco”). Under the terms of the investment advisory agreement, the Fund pays an advisory fee to the Adviser based on the annual rate of the Fund’s average daily net assets as follows:
| | | | |
| Average Daily Net Assets | | Rate | |
First $10 billion | | | 1.25% | |
Over $10 billion | | | 1.15% | |
For the period December 19, 2013 (commencement date) through October 31, 2014, the effective advisory fees incurred by the Fund was 1.25%.
Under the terms of a master sub-advisory agreement between the Adviser and each of Invesco Asset Management Deutschland GmbH, Invesco Asset Management Limited, Invesco Asset Management (Japan) Limited, Invesco Australia Limited, Invesco Hong Kong Limited, Invesco Senior Secured Management, Inc., Invesco Canada Ltd. and Invesco PowerShares Capital Management LLC (collectively, the “Affiliated Sub-Advisers”) the Adviser, not the Fund, may pay 40% of the fees paid to the Adviser to any such Affiliated Sub-Adviser(s) that provide(s) discretionary investment management services to the Fund based on the percentage of assets allocated to such Sub-Adviser(s).
Effective December 19, 2013 (commencement date) the Adviser has contractually agreed, through at least February 29, 2016, to waive advisory fees and/or reimburse expenses to the extent necessary to limit total annual fund operating expenses after fee waiver and/or expense reimbursement (excluding certain items discussed below) of Class A, Class C, Class R, Class Y, Class R5 and Class R6 shares to 1.62%, 2.37%, 1.87%, 1.37%, 1.37% and 1.37% of average daily net assets, respectively. In determining the Adviser’s obligation to waive advisory fees and/or reimburse expenses, the following expenses are not taken into account, and could cause total annual fund operating expenses after fee waiver and/or expense reimbursement to exceed the numbers reflected above: (1) interest; (2) taxes; (3) dividend expense on short sales; (4) extraordinary or non-routine items, including litigation expenses; and (5) expenses that the Fund has incurred but did not actually pay because of an expense offset arrangement. Unless Invesco continues the fee waiver agreement, it will terminate on February 29, 2016. The fee waiver agreement cannot be terminated during its term.
Further, the Adviser has contractually agreed, through at least June 30, 2016, to waive the advisory fee payable by the Fund in an amount equal to 100% of the net advisory fees the Adviser receives from the affiliated money market funds on investments by the Fund of uninvested cash in such affiliated money market funds.
For the period December 19, 2013 (commencement date) through October 31, 2014, the Adviser waived advisory fees and reimbursed fund level expenses of $306,819 and reimbursed class level expenses of $1,695, $15, $4, $1,761, $34 and $21 for Class A, Class C, Class R, Class Y, Class R5 and Class R6 shares, respectively.
Subsequent to October 31, 2014, the Adviser reimbursed the Fund for an economic loss of $714,830 as a result of trading related activity. Of this amount, $548,296 represents the amount of loss reimbursed for the period December 19, 2013 (commencement date) through October 31, 2014.
The Trust has entered into a master administrative services agreement with Invesco pursuant to which the Fund has agreed to pay Invesco for certain administrative costs incurred in providing accounting services to the Fund. For the period December 19, 2013 (commencement date) through October 31, 2014, expenses incurred under the agreement are shown in the Statement of Operations as Administrative services fees.
The Trust has entered into a transfer agency and service agreement with Invesco Investment Services, Inc. (“IIS”) pursuant to which the Fund has agreed to pay IIS a fee for providing transfer agency and shareholder services to the Fund and reimburse IIS for certain expenses incurred by IIS in the course of providing such services. IIS may make payments to intermediaries that provide omnibus account services, sub-accounting services and/or networking services. All fees payable by IIS to intermediaries that provide omnibus account services or sub-accounting are charged back to the Fund, subject to certain limitations approved by the Trust’s Board of Trustees. For the period December 19, 2013 (commencement date) through October 31, 2014, expenses incurred under the agreement are shown in the Statement of Operations as Transfer agent fees.
19 Invesco Global Market Neutral Fund
The Trust has entered into master distribution agreements with Invesco Distributors, Inc. (“IDI”) to serve as the distributor for the Class A, Class C, Class R, Class Y, Class R5 and Class R6 shares of the Fund. The Trust has adopted plans pursuant to Rule 12b-1 under the 1940 Act with respect to the Fund’s Class A, Class C and Class R shares (collectively the “Plans”). The Fund, pursuant to the Plans, pays IDI compensation at the annual rate of 0.25% of the Fund’s average daily net assets of Class A shares, 1.00% of the average daily net assets of Class C shares and 0.50% of the average daily net assets of Class R shares. Of the Plan payments, up to 0.25% of the average daily net assets of each class of shares may be paid to furnish continuing personal shareholder services to customers who purchase and own shares of such classes. Any amounts not paid as a service fee under the Plans would constitute an asset-based sales charge. Rules of the Financial Industry Regulatory Authority (“FINRA”) impose a cap on the total sales charges, including asset-based sales charges, that may be paid by any class of shares of the Fund. For the period December 19, 2013 (commencement date) through October 31, 2014, expenses incurred under the Plans are shown in the Statement of Operations as Distribution fees.
Front-end sales commissions and CDSC (collectively, the “sales charges”) are not recorded as expenses of the Fund. Front-end sales commissions are deducted from proceeds from the sales of Fund shares prior to investment in Class A shares of the Fund. CDSC are deducted from redemption proceeds prior to remittance to the shareholder. During the period December 19, 2013 (commencement date) through October 31, 2014, IDI advised the Fund that IDI retained $347 in front-end sales commissions from the sale of Class A shares.
Certain officers and trustees of the Trust are officers and directors of the Adviser, IIS and/or IDI.
NOTE 3—Additional Valuation Information
GAAP defines fair value as the price that would be received to sell an asset or paid to transfer a liability in an orderly transaction between market participants at the measurement date, under current market conditions. GAAP establishes a hierarchy that prioritizes the inputs to valuation methods, giving the highest priority to readily available unadjusted quoted prices in an active market for identical assets (Level 1) and the lowest priority to significant unobservable inputs (Level 3), generally when market prices are not readily available or are unreliable. Based on the valuation inputs, the securities or other investments are tiered into one of three levels. Changes in valuation methods may result in transfers in or out of an investment’s assigned level:
| | Level 1 — | Prices are determined using quoted prices in an active market for identical assets. |
| | Level 2 — | Prices are determined using other significant observable inputs. Observable inputs are inputs that other market participants may use in pricing a security. These may include quoted prices for similar securities, interest rates, prepayment speeds, credit risk, yield curves, loss severities, default rates, discount rates, volatilities and others. |
| | Level 3 — | Prices are determined using significant unobservable inputs. In situations where quoted prices or observable inputs are unavailable (for example, when there is little or no market activity for an investment at the end of the period), unobservable inputs may be used. Unobservable inputs reflect the Fund’s own assumptions about the factors market participants would use in determining fair value of the securities or instruments and would be based on the best available information. |
The following is a summary of the tiered valuation input levels, as of October 31, 2014. The level assigned to the securities valuations may not be an indication of the risk or liquidity associated with investing in those securities. Because of the inherent uncertainties of valuation, the values reflected in the financial statements may materially differ from the value received upon actual sale of those investments.
| | | | | | | | | | | | | | | | |
| | | Level 1 | | | Level 2 | | | Level 3 | | | Total | |
Australia | | $ | — | | | $ | 247,791 | | | $ | — | | | $ | 247,791 | |
Belgium | | | — | | | | 53,093 | | | | — | | | | 53,093 | |
Canada | | | 927,294 | | | | — | | | | — | | | | 927,294 | |
Denmark | | | 280,910 | | | | — | | | | — | | | | 280,910 | |
France | | | — | | | | 252,128 | | | | — | | | | 252,128 | |
Germany | | | 62,815 | | | | 384,060 | | | | — | | | | 446,875 | |
Hong Kong | | | 231,641 | | | | — | | | | — | | | | 231,641 | |
Israel | | | — | | | | 92,367 | | | | — | | | | 92,367 | |
Japan | | | 117,126 | | | | 3,176,369 | | | | — | | | | 3,293,495 | |
Luxembourg | | | — | | | | 116,076 | | | | — | | | | 116,076 | |
Macau | | | — | | | | 142,660 | | | | — | | | | 142,660 | |
Netherlands | | | 232,131 | | | | — | | | | — | | | | 232,131 | |
New Zealand | | | — | | | | 32,120 | | | | — | | | | 32,120 | |
Norway | | | 69,979 | | | | 101,520 | | | | — | | | | 171,499 | |
Sweden | | | 302,848 | | | | — | | | | — | | | | 302,848 | |
Switzerland | | | 80,943 | | | | 219,857 | | | | — | | | | 300,800 | |
United Kingdom | | | 256,440 | | | | 800,435 | | | | — | | | | 1,056,875 | |
United States | | | 6,090,764 | | | | — | | | | — | | | | 6,090,764 | |
| | | | 8,652,891 | | | | 5,618,476 | | | | — | | | | 14,271,367 | |
Swap Agreements* | | | — | | | | (822,611 | ) | | | — | | | | (822,611 | ) |
Total Investments | | $ | 8,652,891 | | | $ | 4,795,865 | | | $ | — | | | $ | 13,448,756 | |
| * | Unrealized appreciation (depreciation). |
20 Invesco Global Market Neutral Fund
NOTE 4—Derivative Investments
Value of Derivative Investments at Period-End
The table below summarizes the value of the Fund’s derivative investments, detailed by primary risk exposure, held as of October 31, 2014:
| | | | | | | | |
| | | Value | |
| Risk Exposure/Derivative Type | | Assets | | | Liabilities | |
Equity risk: | | | | | | | | |
Swap agreements(a) | | $ | 35,625 | | | $ | (858,236 | ) |
| (a) | Values are disclosed on the Statement of Assets and Liabilities under the caption Unrealized depreciation on swap agreements. |
Effect of Derivative Investments for the period December 19, 2013 (commencement date) through October 31, 2014
The table below summarizes the gains (losses) on derivative investments, detailed by primary risk exposure, recognized in earnings during the period:
| | | | |
| | | Location of Gain (Loss) on
Statement of Operations | |
| | | Swap
Agreements | |
Realized Gain: | | | | |
Equity risk | | $ | 366,773 | |
Change in Unrealized Appreciation (Depreciation): | | | | |
Equity risk | | | (822,611 | ) |
Total | | $ | (455,838 | ) |
The table below summarizes the average notional value of swap agreements outstanding during the period.
| | | | |
| | | Swap
Agreements | |
AUD | | | (61,843 | ) |
CAD | | | (883,465 | ) |
CHF | | | (188,202 | ) |
DKK | | | (629,900 | ) |
EUR – Germany | | | (352,157 | ) |
EUR – Supranational | | | (520,392 | ) |
GBP | | | (544,902 | ) |
HKD | | | (1,730,741 | ) |
JPY | | | (260,243,170 | ) |
NOK | | | (1,071,790 | ) |
SEK | | | (1,426,959 | ) |
SGD | | | (76,766 | ) |
USD | | | (4,611,572 | ) |
Offsetting Assets and Liabilities
Accounting Standards Update (“ASU”) No. 2011-11, Disclosures about Offsetting Assets and Liabilities, which was subsequently clarified in Financial Accounting Standards Board ASU 2013-01 “Clarifying the Scope of Disclosures about Offsetting Assets and Liabilities” is intended to enhance disclosures about financial instruments and derivative instruments that are subject to offsetting arrangements on the Statement of Assets and Liabilities and to enable investors to better understand the effect of those arrangements on its financial position. In order for an arrangement to be eligible for netting, the Fund must have a basis to conclude that such netting arrangements are legally enforceable. The Fund enters into netting agreements and collateral agreements in an attempt to reduce the Fund’s Counterparty credit risk by providing for a single net settlement with a Counterparty of all financial transactions covered by the agreement in an event of default as defined under such agreement.
There were no derivative instruments subject to a netting agreement for which the Fund is not currently netting. The following tables present derivative instruments that are either subject to an enforceable netting agreement or offset by collateral arrangements as of October 31, 2014.
| | | | | | | | | | | | | | | | | | | | | | | | |
| Assets: | |
| | | Gross amounts
presented in
Statement of
Assets & Liabilities | | | Gross amounts
offset in
Statement of
Assets & Liabilities | | | Net amounts of assets
presented in the
Statement of Assets &
Liabilities | | | Collateral Received | | | | |
| Counterparty | | | | | Financial
Instruments | | | Cash | | | Net
Amount | |
Morgan Stanley & Co. LLC | | $ | 35,625 | | | $ | (35,625 | ) | | $ | — | | | $ | — | | | $ | — | | | $ | — | |
| | | | | | |
| | | | | | | | | | | | | | | | | | | | | | | | |
21 Invesco Global Market Neutral Fund
| | | | | | | | | | | | | | | | | | | | | | | | |
| Liabilities: | |
| | | Gross amounts
presented in
Statement of
Assets & Liabilities | | | Gross amounts
offset in
Statement of
Assets & Liabilities | | | Net amounts of liabilities
presented in the
Statement of Assets &
Liabilities | | | Collateral Pledged | | | | |
| Counterparty | | | | | Financial
Instruments | | | Cash | | | Net
Amount | |
Morgan Stanley & Co. LLC | | $ | 858,236 | | | $ | (35,625 | ) | | $ | 822,611 | | | $ | — | | | $ | (73,160 | ) | | $ | 749,451 | |
NOTE 5—Trustees’ and Officers’ Fees and Benefits
Trustees’ and Officers’ Fees and Benefits include amounts accrued by the Fund to pay remuneration to certain Trustees and Officers of the Fund. Trustees have the option to defer compensation payable by the Fund, and Trustees’ and Officers’ Fees and Benefits also include amounts accrued by the Fund to fund such deferred compensation amounts. Those Trustees who defer compensation have the option to select various Invesco Funds in which their deferral accounts shall be deemed to be invested. Obligations under the deferred compensation plan represents unsecured claims against the general assets of the Fund.
NOTE 6—Cash Balances
The Fund is permitted to temporarily carry a negative or overdrawn balance in its account with State Street Bank and Trust Company, the custodian bank. Such balances, if any at period end, are shown in the Statement of Assets and Liabilities under the payable caption Amount due custodian. To compensate the custodian bank for such overdrafts, the overdrawn Fund may either (1) leave funds as a compensating balance in the account so the custodian bank can be compensated by earning the additional interest; or (2) compensate by paying the custodian bank at a rate agreed upon by the custodian bank and Invesco, not to exceed the contractually agreed upon rate.
NOTE 7—Distributions to Shareholders and Tax Components of Net Assets
Tax Character of Distributions to Shareholders Paid During the Period December 19, 2013 (commencement date) through October 31, 2014:
There were no ordinary income or capital gains distributions during the period December 19, 2013 (commencement date) through October 31, 2014.
Tax Components of Net Assets at Period-End:
| | | | |
| | | 2014 | |
Undistributed ordinary income | | $ | 264,268 | |
Net unrealized appreciation — investments | | | 223,461 | |
Net unrealized appreciation (depreciation) — other investments | | | (4,281 | ) |
Temporary book/tax differences | | | (1,547 | ) |
Shares of beneficial interest | | | 13,407,753 | |
Total net assets | | $ | 13,889,654 | |
The difference between book-basis and tax-basis unrealized appreciation (depreciation) is due to differences in the timing of recognition of gains and losses on investments for tax and book purposes.
The temporary book/tax differences are a result of timing differences between book and tax recognition of income and/or expenses. The Fund’s temporary book/tax differences are the result of the trustee deferral of compensation and retirement plan benefits.
The Fund does not have a capital loss carryforward as of October 31, 2014.
NOTE 8—Investment Securities
The aggregate amount of investment securities (other than short-term securities, U.S. Treasury obligations and money market funds, if any) purchased and sold by the Fund during December 19, 2013 (commencement date) through October 31, 2014 was $18,977,271 and $4,975,963, respectively. Cost of investments on a tax basis includes the adjustments for financial reporting purposes as of the most recently completed federal income tax reporting period-end.
| | | | |
| Unrealized Appreciation (Depreciation) of Investment Securities on a Tax Basis | |
Aggregate unrealized appreciation of investment securities | | $ | 960,761 | |
Aggregate unrealized (depreciation) of investment securities | | | (737,300 | ) |
Net unrealized appreciation of investment securities | | $ | 223,461 | |
Cost of investments is the same for tax purposes and financial reporting.
NOTE 9—Reclassification of Permanent Differences
Primarily as a result of differing book/tax treatment of swap agreements, stock issuance and organizational expenses, on October 31, 2014, undistributed net investment income was increased by $1,013,291, undistributed net realized gain was decreased by $916,415 and shares of beneficial interest was decreased by $96,876. This reclassification had no effect on the net assets of the Fund.
22 Invesco Global Market Neutral Fund
NOTE 10—Share Information
| | | | | | | | |
| | | Summary of Share Activity | |
| | | December 19, 2013
(commencement date) through
October 31, 2014(a) | |
| | | Shares | | | Amount | |
Sold: | | | | | | | | |
Class A | | | 655,765 | | | $ | 6,691,675 | |
Class C | | | 18,382 | | | | 188,179 | |
Class R | | | 1,366 | | | | 13,770 | |
Class Y | | | 716,863 | | | | 7,349,692 | |
Class R5 | | | 66,552 | | | | 670,518 | |
Class R6 | | | 54,557 | | | | 546,530 | |
| | |
Reacquired: | | | | | | | | |
Class A | | | (160,437 | ) | | | (1,638,692 | ) |
Class C | | | (6,577 | ) | | | (68,813 | ) |
Class Y | | | (21,601 | ) | | | (220,298 | ) |
Class R5 | | | (2,655 | ) | | | (27,932 | ) |
Net increase in share activity | | | 1,322,215 | | | $ | 13,504,629 | |
| (a) | There is an entity that is a record owner of more than 5% of the outstanding shares of the Fund and owns 18% of the outstanding shares of the Fund. IDI has an agreement with this entity to sell Fund shares. The Fund, Invesco and/or Invesco affiliates may make payments to this entity, which is considered to be related to the Fund, for providing services to the Fund, Invesco and/or affiliates including but not limited to services such as, securities brokerage, distribution, third party record keeping and accounting services. The Fund has no knowledge as to whether all or any portion of the shares owned of record by this entity is also owned beneficially. |
| | In addition, 76% of the outstanding shares of the Fund are owned by the Adviser. |
23 Invesco Global Market Neutral Fund
NOTE 11—Financial Highlights
The following schedule presents financial highlights for a share of the Fund outstanding throughout the periods indicated.
| | | | | | | | | | | | | | | | | | | | | | | | | | | | | | | | | | | | | | | | | | | | |
| | | Net asset
value,
beginning
of period | | | Net
investment
income
(loss)(a) | | | Net gains
on securities
(both
realized and
unrealized) | | | Total from
investment
operations | | | Net asset
value, end
of period | | | Total
return(b) | | | Net assets,
end of period
(000’s omitted) | | | Ratio of
expenses
to average
net assets
with fee waivers
and/or expenses
absorbed | | | Ratio of
expenses
to average net
assets without
fee waivers
and/or expenses
absorbed | | | Ratio of net
investment
income (loss)
to average
net assets | | | Portfolio
turnover(c) | |
Class A | | | | | | | | | | | | | | | | | | | | | | | | | | | | | | | | | | | | | | | | | | | | |
Year ended 10/31/14(d) | | $ | 10.00 | | | $ | 0.04 | | | $ | 0.45 | | | $ | 0.49 | | | $ | 10.49 | | | | 4.90 | %(e) | | $ | 5,197 | | | | 1.61 | %(f) | | | 4.61 | %(f) | | | 0.43 | %(f) | | | 46 | % |
Class C | | | | | | | | | | | | | | | | | | | | | | | | | | | | | | | | | | | | | | | | | | | | |
Year ended 10/31/14(d) | | | 10.00 | | | | (0.03 | ) | | | 0.44 | | | | 0.41 | | | | 10.41 | | | | 4.10 | (e) | | | 123 | | | | 2.36 | (f) | | | 5.36 | (f) | | | (0.32 | )(f) | | | 46 | |
Class R | | | | | | | | | | | | | | | | | | | | | | | | | | | | | | | | | | | | | | | | | | | | |
Year ended 10/31/14(d) | | | 10.00 | | | | 0.02 | | | | 0.44 | | | | 0.46 | | | | 10.46 | | | | 4.60 | (e) | | | 14 | | | | 1.86 | (f) | | | 4.86 | (f) | | | 0.18 | (f) | | | 46 | |
Class Y | | | | | | | | | | | | | | | | | | | | | | | | | | | | | | | | | | | | | | | | | | | | |
Year ended 10/31/14(d) | | | 10.00 | | | | 0.06 | | | | 0.46 | | | | 0.52 | | | | 10.52 | | | | 5.20 | (e) | | | 7,311 | | | | 1.36 | (f) | | | 4.36 | (f) | | | 0.68 | (f) | | | 46 | |
Class R5 | | | | | | | | | | | | | | | | | | | | | | | | | | | | | | | | | | | | | | | | | | | | |
Year ended 10/31/14(d) | | | 10.00 | | | | 0.06 | | | | 0.45 | | | | 0.51 | | | | 10.51 | | | | 5.10 | (e) | | | 671 | | | | 1.36 | (f) | | | 4.33 | (f) | | | 0.68 | (f) | | | 46 | |
Class R6 | | | | | | | | | | | | | | | | | | | | | | | | | | | | | | | | | | | | | | | | | | | | |
Year ended 10/31/14(d) | | | 10.00 | | | | 0.06 | | | | 0.45 | | | | 0.51 | | | | 10.51 | | | | 5.10 | (e) | | | 573 | | | | 1.36 | (f) | | | 4.33 | (f) | | | 0.68 | (f) | | | 46 | |
| (a) | Calculated using average shares outstanding. |
| (b) | Includes adjustments in accordance with accounting principles generally accepted in the United States of America and as such, the net asset value for financial reporting purposes and the returns based upon those net asset values may differ from the net asset value and returns for shareholder transactions. Does not include sales charges and is not annualized for periods less than one year, if applicable. |
| (c) | Portfolio turnover is calculated at the fund level and is not annualized for periods less than one year, if applicable. |
| (d) | Commencement date December 19, 2013 for Class A, Class C, Class R, Class Y, Class R5 and Class R6 shares, respectively. |
| (e) | Amount includes the effect of the Adviser pay-in for an economic loss of $0.41 per share. Had the pay-in not been made, the total return would have been 0.80%, 0.10%, 0.60%, 1.00%, 1.00% and 1.00% for Class A, Class C, Class R, Class Y, Class R5 and Class R6 shares, respectively. |
| (f) | Ratios are annualized and based on average daily net assets (000’s omitted) of $5,234, $46, $12, $5,433, $628 and $520 for Class A, Class C, Class R, Class Y, Class R5 and Class R6 shares, respectively. |
24 Invesco Global Market Neutral Fund
Report of Independent Registered Public Accounting Firm
To the Board of Trustees of AIM Investment Funds (Invesco Investment Funds)
and Shareholders of Invesco Global Market Neutral Fund:
In our opinion, the accompanying statement of assets and liabilities, including the schedule of investments, and the related statements of operations and of changes in net assets and of cash flows and the financial highlights present fairly, in all material respects, the financial position of Invesco Global Market Neutral Fund (one of the funds constituting AIM Investment Funds (Invesco Investment Funds), hereafter referred to as the “Fund”) at October 31, 2014, and the results of its operations, the changes in its net assets and its cash flows and the financial highlights for the period December 19, 2013 (commencement of operations) through October 31, 2014, in conformity with accounting principles generally accepted in the United States of America. These financial statements and financial highlights (hereafter referred to as “financial statements”) are the responsibility of the Fund’s management. Our responsibility is to express an opinion on these financial statements based on our audit. We conducted our audit of these financial statements in accordance with the standards of the Public Company Accounting Oversight Board (United States). Those standards require that we plan and perform the audit to obtain reasonable assurance about whether the financial statements are free of material misstatement. An audit includes examining, on a test basis, evidence supporting the amounts and disclosures in the financial statements, assessing the accounting principles used and significant estimates made by management, and evaluating the overall financial statement presentation. We believe that our audit, which included confirmation of securities at October 31, 2014 by correspondence with the custodian and brokers, and the application of alternative auditing procedures where confirmations of security purchases have not been received, provides a reasonable basis for our opinion.
PRICEWATERHOUSECOOPERS LLP
December 29, 2014
Houston, Texas
25 Invesco Global Market Neutral Fund
Calculating your ongoing Fund expenses
Example
As a shareholder of the Fund, you incur two types of costs: (1) transaction costs, which may include sales charges (loads) on purchase payments or contingent deferred sales charges on redemptions, if any; and (2) ongoing costs, including management fees, distribution and/or service (12b-1) fees, and other Fund expenses. This example is intended to help you understand your ongoing costs (in dollars) of investing in the Fund and to compare these costs with ongoing costs of investing in other mutual funds. The example is based on an investment of $1,000 invested at the beginning of the period and held for the entire period May 1, 2014 through October 31, 2014.
Actual expenses
The table below provides information about actual account values and actual expenses. You may use the information in this table, together with the amount you invested, to estimate the expenses that you paid over the period. Simply divide your account value by $1,000 (for example, an $8,600 account value divided by $1,000 = 8.6), then multiply the result by the number in the table under the heading entitled “Actual Expenses Paid During Period” to estimate the expenses you paid on your account during this period.
Hypothetical example for comparison purposes
The table below also provides information about hypothetical account values and hypothetical expenses based on the Fund’s actual expense ratio and an assumed rate of return of 5% per year before expenses, which is not the Fund’s actual return.
The hypothetical account values and expenses may not be used to estimate the actual ending account balance or expenses you paid for the period. You may use this information to compare the ongoing costs of investing in the Fund and other funds. To do so, compare this 5% hypothetical example with the 5% hypothetical examples that appear in the shareholder reports of the other funds.
Please note that the expenses shown in the table are meant to highlight your ongoing costs only and do not reflect any transaction costs, such as sales charges (loads) on purchase payments or contingent deferred sales charges on redemptions, if any. Therefore, the hypothetical information is useful in comparing ongoing costs only, and will not help you determine the relative total costs of owning different funds. In addition, if these transaction costs were included, your costs would have been higher.
| | | | | | | | | | | | | | | | | | | | | | | | |
| Class | | Beginning
Account Value
(05/01/14) | | | ACTUAL | | | HYPOTHETICAL (5% annual return before
expenses) | | | Annualized
Expense
Ratio | |
| | | Ending
Account Value
(10/31/14)1 | | | Expenses Paid During
Period2,3 | | | Ending
Account Value
(10/31/14) | | | Expenses
Paid During
Period2,4 | | |
| A | | $ | 1,000.00 | | | $ | 962.80 | | | $ | 7.92 | | | $ | 1,017.14 | | | $ | 8.13 | | | | 1.60 | % |
| C | | | 1,000.00 | | | | 958.80 | | | | 11.60 | | | | 1,013.36 | | | | 11.93 | | | | 2.35 | |
| R | | | 1,000.00 | | | | 961.80 | | | | 9.15 | | | | 1,015.88 | | | | 9.40 | | | | 1.85 | |
| Y | | | 1,000.00 | | | | 963.70 | | | | 6.68 | | | | 1,018.40 | | | | 6.87 | | | | 1.35 | |
| R5 | | | 1,000.00 | | | | 963.70 | | | | 6.68 | | | | 1,018.40 | | | | 6.87 | | | | 1.35 | |
| R6 | | | 1,000.00 | | | | 963.70 | | | | 6.68 | | | | 1,018.40 | | | | 6.87 | | | | 1.35 | |
| 1 | The actual ending account value is based on the actual total return of the Fund for the period May 1, 2014 through October 31, 2014, after actual expenses and will differ from the hypothetical ending account value which is based on the Fund’s expense ratio and a hypothetical annual return of 5% before expenses. |
| 2 | Expenses are equal to the Fund’s annualized expense ratio as indicated above multiplied by the average account value over the period, multiplied by 184/365 to reflect the most recent fiscal half year. For the period December 19, 2013 (commencement date) through October 31, 2014, the Adviser reimbursed the Fund for an economic loss as a result of trading related activity. The annualized ratios restated as if this reimbursement has been in effect throughout the entire most recent fiscal half year are 1.61%, 2.36%, 1.86%, 1.36%. 1.36% and 1.36% for Class A, Class C, Class R, Class Y, Class R5 and Class R6, respectively. |
| 3 | The actual expenses restates as if the reimbursement discussed above had been in effect throughout the entire most recent fiscal half year are $7.97, $11.65, $9.20, $6.73, $6.73 and $6.73 for Class A, Class C, Class R, Class Y, Class R5 and Class R6, respectively. |
| 4 | The hypothetical expenses paid restated as if the reimbursement above had been in effect throughout the most recent fiscal half year are $8.19, $11.98, $9.45, $6.92, $6.92 and $6.92 for Class A, Class C, Class R, Class Y, Class R5 and Class R6, respectively. |
26 Invesco Global Market Neutral Fund
Approval of Investment Advisory and Sub-Advisory Contracts
The Board of Trustees (the Board) of AIM Investment Funds (Invesco Investment Funds) is required under the Investment Company Act of 1940, as amended, to approve annually the renewal of Invesco Global Market Neutral Fund’s (the Fund) investment advisory agreements. During contract renewal meetings held on June 16-17, 2014, the Board as a whole, and the disinterested or “independent” Trustees, who comprise over 75% of the Board, voting separately, approved the continuance for the Fund of the Master Investment Advisory Agreement with Invesco Advisers, Inc. (Invesco Advisers and the investment advisory agreement) and the Master Intergroup Sub-Advisory Contract for Mutual Funds with Invesco Asset Management Deutschland GmbH, Invesco Asset Management Limited, Invesco Asset Management (Japan) Limited, Invesco Australia Limited, Invesco Hong Kong Limited, Invesco Senior Secured Management, Inc., Invesco Canada Ltd. and Invesco PowerShares Capital Management LLC (collectively, the Affiliated Sub-Advisers and the sub-advisory contracts) for another year, effective July 1, 2014.
In evaluating the fairness and reasonableness of compensation under the Fund’s investment advisory agreement and sub-advisory contracts, the Board considered, among other things, the factors discussed below. The Board determined that the continuation of the Fund’s investment advisory agreement and the sub-advisory contracts are in the best interest of the Fund and its shareholders and that the compensation payable to Invesco Advisers and the Affiliated Sub-Advisers under the agreements is fair and reasonable.
The Board’s Fund Evaluation Process
The Board’s Investments Committee has established three Sub-Committees, each of which is primarily responsible for overseeing the management of a number of the funds advised by Invesco Advisers (the Invesco Funds). The Sub-Committees meet throughout the year to review the performance of their assigned Invesco Funds, including reviewing materials prepared under the direction of the independent Senior Officer, an officer of the Invesco Funds who reports directly to the independent Trustees. Over the course of each year, the Sub-Committees meet with portfolio managers for their assigned Invesco Funds and other members of management to review the performance, investment objective(s), policies, strategies, limitations and investment risks of these funds. The Sub-Committees meet regularly and at designated contract renewal meetings each year to conduct a review of the performance, fees, expenses and other matters related to their assigned Invesco Funds. Each Sub-Committee recommends to the Investments Committee, which in turn recommends to the full Board, whether and on what terms to
approve the continuance of each Invesco Fund’s investment advisory agreement and sub-advisory contracts for another year.
During the contract renewal process, the Trustees receive comparative performance and fee data regarding the Invesco Funds prepared by Invesco Advisers and Lipper Inc. (Lipper), an independent provider of investment company data. The Trustees also receive an independent written evaluation from the Senior Officer. The Senior Officer’s evaluation is prepared as part of his responsibility to manage the process by which the Invesco Funds’ proposed management fees are negotiated during the annual contract renewal process to ensure they are negotiated in a manner that is at arms’ length and reasonable. In addition to meetings with Invesco Advisers and fund counsel, the independent Trustees also discuss the continuance of the investment advisory agreement and sub-advisory contracts in separate sessions with the Senior Officer and with independent legal counsel.
The Trustees recognized that the advisory fee rates for the Invesco Funds are, in many cases, the result of years of review and negotiation. The Trustees’ deliberations and conclusions in a particular year may be based in part on their deliberations and conclusions regarding these arrangements throughout the year and in prior years. The Trustees’ review and conclusions are based on the comprehensive consideration of all information presented to them and are not the result of any single determinative factor. Moreover, one Trustee may have weighed a particular piece of information or factor differently than another Trustee.
The discussion below serves as the Senior Officer’s independent written evaluation with respect to the Fund’s investment advisory agreement as well as a discussion of the material factors and related conclusions that formed the basis for the Board’s approval of the Fund’s investment advisory agreement and sub-advisory contracts. Unless otherwise stated, this information is current as of June 17, 2014, and may not reflect consideration of factors that became known to the Board after that date.
Factors and Conclusions and Summary of Independent Written Fee Evaluation
| A. | Nature, Extent and Quality of Services Provided by Invesco Advisers and the Affiliated Sub-Advisers |
The Board reviewed the advisory services provided to the Fund by Invesco Advisers under the Fund’s investment advisory agreement, the performance of Invesco Advisers in providing these services, and the credentials and experience of the officers and employees of Invesco Advisers who provide these services, including the Fund’s portfolio manager or managers, with whom the Sub-Committees met
during the year. The Board’s review of the qualifications of Invesco Advisers to provide advisory services included the Board’s consideration of Invesco Advisers’ investment process oversight, independent credit analysis and investment risk management. The Board also considered non-advisory services that Invesco Advisers and its affiliates provide to the Invesco Funds such as various back office support functions, equity and fixed income trading operations, internal audit, distribution and legal and compliance.
In determining whether to continue the Fund’s investment advisory agreement, the Board considered the benefits of reapproving an existing relationship and the greater uncertainty that may be associated with entering into a new relationship. The Board concluded that the nature, extent and quality of the services provided to the Fund by Invesco Advisers are appropriate and satisfactory and consistent with the terms of the Fund’s investment advisory agreement.
The Board reviewed the services that may be provided by the Affiliated Sub-Advisers under the sub-advisory contracts and the credentials and experience of the officers and employees of the Affiliated Sub-Advisers who provide these services. The Board noted that the Affiliated Sub-Advisers have offices and personnel that are located in financial centers around the world. As a result, the Affiliated Sub-Advisers can provide research and investment analysis on the markets and economies of various countries in which the Fund may invest, make recommendations regarding securities and assist with security trades. The Board concluded that the sub-advisory contracts benefit the Fund and its shareholders by permitting Invesco Advisers to use the resources and talents of the Affiliated Sub-Advisers in managing the Fund. The Board concluded that the nature, extent and quality of the services that may be provided by the Affiliated Sub-Advisers are appropriate and satisfactory and consistent with the terms of the Fund’s sub-advisory contracts.
The Board noted that the Fund recently began operations and that no comparative performance data was available.
| C. | Advisory and Sub-Advisory Fees |
The Board noted that no comparative fee information was available for the Fund.
The Board noted that Invesco Advisers has contractually agreed to waive fees and/or limit expenses of the Fund through at least December 31, 2015 in an amount necessary to limit total annual operating expenses to a specified percentage of average daily net assets for each class of the Fund.
The Board also compared the Fund’s effective advisory fee rate (the advisory fee rate after advisory fee waivers and before other expense limitations/waivers) to the effective advisory fee
27 Invesco Global Market Neutral Fund
rates of other mutual funds advised by Invesco Advisers and its affiliates that are managed using an investment process substantially similar to the investment process used for the Fund. The Board noted that the Fund’s effective advisory fee rate was the same as the effective advisory fee rate of one mutual fund with a similar investment process. The Board noted that Invesco Advisers and the Affiliated Sub-Advisers do not manage other client accounts using a substantially similar investment process.
The Board also considered the services that may be provided by the Affiliated Sub-Advisers pursuant to the sub-advisory contracts, as well as the fees payable by Invesco Advisers to the Affiliated Sub-Advisers pursuant to the sub-advisory contracts. The Board noted that Invesco Advisers retains overall responsibility for, and provides services to, sub-advised Invesco Funds, including oversight of the Affiliated Sub-Advisers as well as the additional services described herein other than day-to-day portfolio management. The Board also noted that the sub-advisory fees are not paid directly by the Fund, but rather, are payable by Invesco Advisers to the Affiliated Sub-Advisers.
| D. | Economies of Scale and Breakpoints |
The Board considered the extent to which there are economies of scale in the provision of advisory services to the Fund. The Board also considered whether the Fund benefits from economies of scale through contractual breakpoints in the Fund’s advisory fee schedule and was assisted in this review by a report from the Senior Officer. The Board also noted that the Fund shares directly in economies of scale through lower fees charged by third party service providers based on the combined size of the Invesco Funds and other clients advised by Invesco Advisers.
| E. | Profitability and Financial Resources |
The Board reviewed information from Invesco Advisers concerning the costs of the advisory and other services that Invesco Advisers and its affiliates provide to the Fund and the profitability of Invesco Advisers and its affiliates in providing these services for the year ended December 31, 2013. The Board received information from Invesco Advisers about the methodology used to prepare the profitability information. The Board considered the profitability of Invesco Advisers in managing the Fund and the Invesco Funds. The Board noted that Invesco Advisers continues to operate at a net profit from services Invesco Advisers and its subsidiaries provide to the Invesco Funds. The Board noted that Invesco Advisers and its subsidiaries did not make a profit from managing the Fund because the Fund did not have a full year of operations. The Board received and accepted information from Invesco Advisers demonstrating that Invesco Advisers and each Affiliated Sub-Adviser are financially sound and have the resources necessary to perform their obligations under the investment advisory agreement and sub-advisory contracts.
| F. | Collateral Benefits to Invesco Advisers and its Affiliates |
The Board considered various other benefits received by Invesco Advisers and its affiliates from the relationship with the Fund, including the fees received for their provision of transfer agency and distribution services to the Fund. The Board considered the performance of Invesco Advisers and its affiliates in providing these services and the organizational structure employed to provide these services. The Board also considered that these services are provided to the Fund pursuant to written contracts that are reviewed and approved on an annual basis by the Board; that the services are required for the operation of the Fund; that Invesco Advisers and its affiliates can provide services, the nature and quality of which are at least equal to those provided by others offering the same or similar services; and that the fees for such services are fair and reasonable in light of the usual and customary charges by others for services of the same nature and quality.
The Board considered the benefits realized by Invesco Advisers and the Affiliated Sub-Advisers as a result of portfolio brokerage transactions executed through “soft dollar” arrangements. The Board noted that soft dollar arrangements shift the payment obligation for research services from Invesco Advisers and the Affiliated Sub-Advisers to the Invesco Funds and that the research received may be used with other clients of Invesco Advisers and may reduce Invesco Advisers’ and the Affiliated Sub-Advisers’ expenses. The Board also considered that it receives periodic reports from the Chief Compliance Officer of the Invesco Funds demonstrating that these arrangements are consistent with regulatory requirements. The Board did not deem the soft dollar arrangements to be inappropriate.
The Board considered that the Fund’s uninvested cash and cash collateral from any securities lending arrangements may be invested in money market funds advised by Invesco Advisers pursuant to procedures approved by the Board. The Board noted that Invesco Advisers receives advisory fees from these affiliated money market funds attributable to such investments, although Invesco Advisers has contractually agreed to waive through varying periods the advisory fees payable by the Invesco Funds with respect to investments in the affiliated money market funds. The waiver is in an amount equal to 100% of the net advisory fee Invesco Advisers receives from the affiliated money market funds with respect to the Fund’s investment in the affiliated money market funds of uninvested cash, but not cash collateral. The Board concluded that the amount of advisory fees received by Invesco Advisors from the Fund’s investment of uninvested cash and cash collateral from any securities lending arrangements in the affiliated money market funds are fair and reasonable.
The Board also considered the Fund may use an affiliated broker to execute certain trades for
the Fund to among other things, control information leakage, and were advised that such trades would be executed in compliance with rules under the Investment Company Act of 1940, as amended.
28 Invesco Global Market Neutral Fund
Trustees and Officers
The address of each trustee and officer is AIM Investment Funds (Invesco Investment Funds) (the “Trust”), 11 Greenway Plaza, Suite 1000, Houston, Texas 77046-1173. The trustees serve for the life of the Trust, subject to their earlier death, incapacitation, resignation, retirement or removal as more specifically provided in the Trust’s organizational documents. Each officer serves for a one year term or until their successors are elected and qualified. Column two below includes length of time served with predecessor entities, if any.
| | | | | | | | |
Name, Year of Birth and Position(s) Held with the Trust | | Trustee and/
or Officer Since | | Principal Occupation(s) During Past 5 Years | | Number of Funds in Fund Complex Overseen by Trustee | | Other Directorship(s) Held by Trustee During Past 5 Years |
| Interested Persons | | | | | | | | |
| Martin L. Flanagan1 — 1960 Trustee | | 2007 | | Executive Director, Chief Executive Officer and President, Invesco Ltd. (ultimate parent of Invesco and a global investment management firm); Advisor to the Board, Invesco Advisers, Inc. (formerly known as Invesco Institutional (N.A.), Inc.); Trustee, The Invesco Funds; Vice Chair, Investment Company Institute; and Member of Executive Board, SMU Cox School of Business Formerly: Chairman and Chief Executive Officer, Invesco Advisers, Inc. (registered investment adviser); Director, Chairman, Chief Executive Officer and President, IVZ Inc. (holding company), INVESCO Group Services, Inc. (service provider) and Invesco North American Holdings, Inc. (holding company); Director, Chief Executive Officer and President, Invesco Holding Company Limited (parent of Invesco and a global investment management firm); Director, Invesco Ltd.; Chairman, Investment Company Institute and President, Co-Chief Executive Officer, Co-President, Chief Operating Officer and Chief Financial Officer, Franklin Resources, Inc. (global investment management organization). | | 144 | | None |
Philip A. Taylor2 — 1954 Trustee, President and Principal Executive Officer | | 2006 | | Head of North American Retail and Senior Managing Director, Invesco Ltd.; Director, Co-Chairman, Co-President and Co-Chief Executive Officer, Invesco Advisers, Inc. (formerly known as Invesco Institutional (N.A.), Inc.) (registered investment adviser); Director, Chairman, Chief Executive Officer and President, Invesco Management Group, Inc. (formerly known as Invesco Aim Management Group, Inc.) (financial services holding company); Director and President, INVESCO Funds Group, Inc. (registered investment adviser and registered transfer agent); Director and Chairman, Invesco Investment Services, Inc. (formerly known as Invesco Aim Investment Services, Inc.) (registered transfer agent) and IVZ Distributors, Inc. (formerly known as INVESCO Distributors, Inc.) (registered broker dealer); Director, President and Chairman, Invesco Inc. (holding company) and Invesco Canada Holdings Inc. (holding company); Chief Executive Officer, Invesco Corporate Class Inc. (corporate mutual fund company) and Invesco Canada Fund Inc. (corporate mutual fund company); Director, Chairman and Chief Executive Officer, Invesco Canada Ltd. (formerly known as Invesco Trimark Ltd./Invesco Trimark Ltèe) (registered investment adviser and registered transfer agent); Trustee, President and Principal Executive Officer, The Invesco Funds (other than AIM Treasurer’s Series Trust (Invesco Treasurer’s Series Trust) and Short-Term Investments Trust); Trustee and Executive Vice President, The Invesco Funds (AIM Treasurer’s Series Trust (Invesco Treasurer’s Series Trust) and Short-Term Investments Trust only); Director, Invesco Investment Advisers LLC (formerly known as Van Kampen Asset Management); Director, Chief Executive Officer and President, Van Kampen Exchange Corp. Formerly: Director and Chairman, Van Kampen Investor Services Inc.; Director, Chief Executive Officer and President, 1371 Preferred Inc. (holding company) and Van Kampen Investments Inc.; Director and President, AIM GP Canada Inc. (general partner for limited partnerships) and Van Kampen Advisors, Inc.; Director and Chief Executive Officer, Invesco Trimark Dealer Inc. (registered broker dealer); Director, Invesco Distributors, Inc. (formerly known as Invesco Aim Distributors, Inc.) (registered broker dealer); Manager, Invesco PowerShares Capital Management LLC; Director, Chief Executive Officer and President, Invesco Advisers, Inc.; Director, Chairman, Chief Executive Officer and President, Invesco Aim Capital Management, Inc.; President, Invesco Trimark Dealer Inc. and Invesco Trimark Ltd./Invesco Trimark Ltèe; Director and President, AIM Trimark Corporate Class Inc. and AIM Trimark Canada Fund Inc.; Senior Managing Director, Invesco Holding Company Limited; Director and Chairman, Fund Management Company (former registered broker dealer); President and Principal Executive Officer, The Invesco Funds (AIM Treasurer’s Series Trust (Invesco Treasurer’s Series Trust), and Short-Term Investments Trust only); President, AIM Trimark Global Fund Inc. and AIM Trimark Canada Fund Inc. | | 144 | | None |
Wayne W. Whalen3 — 1939 Trustee | | 2010 | | Of Counsel, and prior to 2010, partner in the law firm of Skadden, Arps, Slate, Meagher & Flom LLP, legal counsel to certain funds in the Fund Complex | | 144 | | Director of the Mutual fund Directors Forum, a nonprofit membership organization for investment directors; Chairman and Director of the Abraham Lincoln Presidential Library Foundation; and Director of the Stevenson Center for Democracy |
| 1 | Mr. Flanagan is considered an interested person (within the meaning of Section 2(a)(19) of the 1940 Act) of the Trust because he is an officer of the Adviser to the Trust, and an officer and a director of Invesco Ltd., ultimate parent of the Adviser. |
| 2 | Mr. Taylor is considered an interested person (within the meaning of Section 2(a)(19) of the 1940 Act) of the Trust because he is an officer and a director of the Adviser. |
| 3 | Mr. Whalen is retiring effective December 31, 2014. He has been deemed to be an interested person of the Trust because of his prior service as counsel to the predecessor funds of certain Invesco open-end funds and his affiliation with the law firm that served as counsel to such predecessor funds and the Invesco closed-end funds. |
T-1 Invesco Global Market Neutral Fund
Trustees and Officers—(continued)
| | | | | | | | |
Name, Year of Birth and Position(s) Held with the Trust | | Trustee and/
or Officer Since | | Principal Occupation(s) During Past 5 Years | | Number of Funds in Fund Complex Overseen by Trustee | | Other Directorship(s) Held by Trustee During Past 5 Years |
| Independent Trustees | | | | | | | | |
Bruce L. Crockett — 1944 Trustee and Chair | | 2001 | | Chairman, Crockett Technologies Associates (technology consulting company) Formerly: Director, Captaris (unified messaging provider); Director, President and Chief Executive Officer, COMSAT Corporation; Chairman, Board of Governors of INTELSAT (international communications company); ACE Limited (insurance company); and Investment Company Institute | | 144 | | ALPS (Attorneys Liability Protection Society) (insurance company) |
David C. Arch — 1945 Trustee | | 2010 | | Chairman of Blistex Inc., a consumer health care products manufacturer | | 144 | | Board member of the Illinois Manufacturers’ Association; Member of the Board of Visitors, Institute for the Humanities, University of Michigan; Member of the Audit Committee of the Edward-Elmhurst Hospital |
Frank S. Bayley — 1939 Trustee | | 1987 | | Retired. Formerly: Director, Badgley Funds Inc. (registered investment company) (2 portfolios) and General Partner and Of Counsel, law firm of Baker & McKenzie, LLP | | 144 | | Director and Chairman, C.D. Stimson Company (a real estate investment company); Trustee, The Curtis Institute of Music |
James T. Bunch — 1942 Trustee | | 2003 | | Managing Member, Grumman Hill Group LLC (family office private equity investments) Formerly: Founder, Green Manning & Bunch Ltd. (investment banking firm) (1988-2010); Executive Committee, United States Golf Association; and Director, Policy Studies, Inc. and Van Gilder Insurance Corporation | | 144 | | Chairman, Board of Governors, Western Golf Association; Chairman, Evans Scholars Foundation; and Director, Denver Film Society |
Rodney F. Dammeyer — 1940 Trustee | | 2010 | | Chairman of CAC,LLC, (private company offering capital investment and management advisory services) Formerly: Prior to 2001, Managing Partner at Equity Group Corporate Investments; Prior to 1995, Chief Executive Officer of Itel Corporation (formerly Anixter International); Prior to 1985, experience includes Senior Vice President and Chief Financial Officer of Household International, Inc., Executive Vice President and Chief Financial Officer of Northwest Industries, Inc. and Partner of Arthur Andersen & Co.; From 1987 to 2010, Director/Trustee of investment companies in the Van Kampen Funds complex | | 144 | | Director of Quidel Corporation and Stericycle, Inc. |
Albert R. Dowden — 1941 Trustee | | 2001 | | Director of a number of public and private business corporations, including the Boss Group, Ltd. (private investment and management); Nature’s Sunshine Products, Inc. and Reich & Tang Funds (5 portfolios) (registered investment company) Formerly: Director, Homeowners of America Holding Corporation/Homeowners of America Insurance Company (property casualty company); Director, Continental Energy Services, LLC (oil and gas pipeline service); Director, CompuDyne Corporation (provider of product and services to the public security market) and Director, Annuity and Life Re (Holdings), Ltd. (reinsurance company); Director, President and Chief Executive Officer, Volvo Group North America, Inc.; Senior Vice President, AB Volvo; Director of various public and private corporations; Chairman, DHJ Media, Inc.; Director, Magellan Insurance Company; and Director, The Hertz Corporation, Genmar Corporation (boat manufacturer), National Media Corporation; Advisory Board of Rotary Power International (designer, manufacturer, and seller of rotary power engines); and Chairman, Cortland Trust, Inc. (registered investment company) | | 144 | | Director of: Nature’s Sunshine Products, Inc., Reich & Tang Funds, Homeowners of America Holding Corporation/ Homeowners of America Insurance Company, the Boss Group |
Jack M. Fields — 1952 Trustee | | 2001 | | Chief Executive Officer, Twenty First Century Group, Inc. (government affairs company); Owner and Chief Executive Officer, Dos Angeles Ranch, L.P. (cattle, hunting, corporate entertainment); and Discovery Global Education Fund (non-profit) Formerly: Chief Executive Officer, Texana Timber LP (sustainable forestry company); Director of Cross Timbers Quail Research Ranch (non-profit); and member of the U.S. House of Representatives | | 144 | | Insperity, Inc. (formerly known as Administaff) |
Prema Mathai-Davis — 1950 Trustee | | 2001 | | Retired. Formerly: Chief Executive Officer, YWCA of the U.S.A. | | 144 | | None |
Larry Soll — 1942 Trustee | | 2003 | | Retired. Formerly: Chairman, Chief Executive Officer and President, Synergen Corp. (a biotechnology company) | | 144 | | None |
Hugo F. Sonnenschein — 1940 Trustee | | 2010 | | President Emeritus and Honorary Trustee of the University of Chicago and the Adam Smith Distinguished Service Professor in the Department of Economics at the University of Chicago. Prior to 2000, President of the University of Chicago | | 144 | | Trustee of the University of Rochester and a member of its investment committee; Member of the National Academy of Sciences and the American Philosophical Society; Fellow of the American Academy of Arts and Sciences |
T-2 Invesco Global Market Neutral Fund
Trustees and Officers—(continued)
| | | | | | | | |
Name, Year of Birth and Position(s) Held with the Trust | | Trustee and/
or Officer Since | | Principal Occupation(s) During Past 5 Years | | Number of Funds in Fund Complex Overseen by Trustee | | Other Directorship(s) Held by Trustee During Past 5 Years |
| Independent Trustees—(continued) |
Raymond Stickel, Jr. — 1944 Trustee | | 2005 | | Retired. Formerly: Director, Mainstay VP Series Funds, Inc. (25 portfolios) and Partner, Deloitte & Touche | | 144 | | None |
Suzanne H. Woolsey — 1941 Trustee | | 2014 | | Chief Executive Officer of Woolsey Partners LLC | | 144 | | Emeritus Chair of the Board of Trustees of the Institute for Defense Analyses; Trustee of Colorado College; Trustee of California Institute of Technology; Prior to 2014, Director of Fluor Corp.; Prior to 2010, Trustee of the German Marshall Fund of the United States; Prior to 2010 Trustee of the Rocky Mountain Institute |
| Other Officers | | | | | | | | |
Russell C. Burk — 1958 Senior Vice President and Senior Officer | | 2005 | | Senior Vice President and Senior Officer, The Invesco Funds | | N/A | | N/A |
John M. Zerr — 1962 Senior Vice President, Chief Legal Officer and Secretary | | 2006 | | Director, Senior Vice President, Secretary and General Counsel, Invesco Management Group, Inc. (formerly known as Invesco Aim Management Group, Inc.) and Van Kampen Exchange Corp.; Senior Vice President, Invesco Advisers, Inc. (formerly known as Invesco Institutional (N.A.), Inc.) (registered investment adviser); Senior Vice President and Secretary, Invesco Distributors, Inc. (formerly known as Invesco Aim Distributors, Inc.); Director, Vice President and Secretary, Invesco Investment Services, Inc. (formerly known as Invesco Aim Investment Services, Inc.) and IVZ Distributors, Inc. (formerly known as INVESCO Distributors, Inc.); Director and Vice President, INVESCO Funds Group, Inc.; Senior Vice President, Chief Legal Officer and Secretary, The Invesco Funds; Manager, Invesco PowerShares Capital Management LLC; Director, Secretary and General Counsel, Invesco Investment Advisers LLC (formerly known as Van Kampen Asset Management); Secretary and General Counsel, Invesco Capital Markets, Inc. (formerly known as Van Kampen Funds Inc.) and Chief Legal Officer, PowerShares Exchange-Traded Fund Trust, PowerShares Exchange-Traded Fund Trust II, PowerShares India Exchange-Traded Fund Trust, PowerShares Actively Managed Exchange-Traded Fund Trust; and PowerShares Actively Managed Exchange-Traded Commodity Fund Trust Formerly: Director and Vice President, Van Kampen Advisors Inc.; Director, Vice President, Secretary and General Counsel, Van Kampen Investor Services Inc.; Director, Invesco Distributors, Inc. (formerly known as Invesco Aim Distributors, Inc.); Director, Senior Vice President, General Counsel and Secretary, Invesco Aim Advisers, Inc. and Van Kampen Investments Inc.; Director, Vice President and Secretary, Fund Management Company; Director, Senior Vice President, Secretary, General Counsel and Vice President, Invesco Aim Capital Management, Inc.; Chief Operating Officer and General Counsel, Liberty Ridge Capital, Inc. (an investment adviser); Vice President and Secretary, PBHG Funds (an investment company) and PBHG Insurance Series Fund (an investment company); Chief Operating Officer, General Counsel and Secretary, Old Mutual Investment Partners (a broker-dealer); General Counsel and Secretary, Old Mutual Fund Services (an administrator) and Old Mutual Shareholder Services (a shareholder servicing center); Executive Vice President, General Counsel and Secretary, Old Mutual Capital, Inc. (an investment adviser); and Vice President and Secretary, Old Mutual Advisors Funds (an investment company) | | N/A | | N/A |
Sheri Morris — 1964 Vice President, Treasurer and Principal Financial Officer | | 1999 | | Vice President, Treasurer and Principal Financial Officer, The Invesco Funds; Vice President, Invesco Advisers, Inc. (formerly known as Invesco Institutional (N.A.), Inc.) (registered investment adviser); and Vice President, PowerShares Exchange-Traded Fund Trust, PowerShares Exchange-Traded Fund Trust II, PowerShares India Exchange-Traded Fund Trust, PowerShares Actively Managed Exchange-Traded Fund Trust, and PowerShares Actively Managed Exchange-Traded Commodity Fund Trust Formerly: Vice President, Invesco Aim Advisers, Inc., Invesco Aim Capital Management, Inc. and Invesco Aim Private Asset Management, Inc.; Assistant Vice President and Assistant Treasurer, The Invesco Funds and Assistant Vice President, Invesco Advisers, Inc., Invesco Aim Capital Management, Inc. and Invesco Aim Private Asset Management, Inc.; and Treasurer, PowerShares Exchange-Traded Fund Trust, PowerShares Exchange-Traded Fund Trust II, PowerShares India Exchange-Traded Fund Trust and PowerShares Actively Managed Exchange-Traded Fund Trust | | N/A | | N/A |
T-3 Invesco Global Market Neutral Fund
Trustees and Officers—(continued)
| | | | | | | | |
Name, Year of Birth and Position(s) Held with the Trust | | Trustee and/
or Officer Since | | Principal Occupation(s) During Past 5 Years | | Number of Funds in Fund Complex Overseen by Trustee | | Other Directorship(s) Held by Trustee During Past 5 Years |
| Other Officers—(continued) | | | | | | | | |
Karen Dunn Kelley — 1960 Vice President | | 2004 | | Senior Managing Director, Investments; Director, Co-President, Co-Chief Executive Officer, and Co-Chairman, Invesco Advisers, Inc. (formerly known as Invesco Institutional (N.A.), Inc.) (registered investment adviser); Chairman, Invesco Senior Secured Management, Inc.; Senior Vice President, Invesco Management Group, Inc. (formerly known as Invesco Aim Management Group, Inc.); Executive Vice President, Invesco Distributors, Inc. (formerly known as Invesco Aim Distributors, Inc.); Director, Invesco Mortgage Capital Inc. and Invesco Management Company Limited; Director and President, INVESCO Asset Management (Bermuda) Ltd., Vice President, The Invesco Funds (other than AIM Treasurer’s Series Trust (Invesco Treasurer’s Series Trust) and Short-Term Investments Trust); and President and Principal Executive Officer, The Invesco Funds (AIM Treasurer’s Series Trust (Invesco Treasurer’s Series Trust) and Short-Term Investments Trust only) Formerly: Director, INVESCO Global Asset Management Limited and INVESCO Management S.A.; Senior Vice President, Van Kampen Investments Inc. and Invesco Advisers, Inc. (formerly known as Invesco Institutional (N.A.), Inc.) (registered investment adviser); Vice President, Invesco Advisers, Inc. (formerly known as Invesco Institutional (N.A.), Inc.); Director of Cash Management and Senior Vice President, Invesco Advisers, Inc. and Invesco Aim Capital Management, Inc.; Director and President, Fund Management Company; Chief Cash Management Officer, Director of Cash Management, Senior Vice President, and Managing Director, Invesco Aim Capital Management, Inc.; Director of Cash Management, Senior Vice President, and Vice President, Invesco Advisers, Inc. and The Invesco Funds (AIM Treasurer’s Series Trust (Invesco Treasurer’s Series Trust), and Short-Term Investments Trust only) | | N/A | | N/A |
Crissie M. Wisdom — 1969 Anti-Money Laundering Compliance Officer | | 2013 | | Anti-Money Laundering Compliance Officer, Invesco Advisers, Inc. (formerly known as Invesco Institutional (N.A.), Inc.) (registered investment adviser), Invesco Capital Markets, Inc. (formerly known as Van Kampen Funds Inc.), Invesco Distributors, Inc., Invesco Investment Services, Inc., Invesco Management Group, Inc., Van Kampen Exchange Corp., The Invesco Funds, and PowerShares Exchange-Traded Fund Trust, PowerShares Exchange-Traded Fund Trust II, PowerShares India Exchange-Traded Fund Trust, PowerShares Actively Managed Exchange-Traded Fund Trust and PowerShares Actively Managed Exchange-Traded Commodity Fund Trust; and Fraud Prevention Manager and Controls and Risk Analysis Manager for Invesco Investment Services, Inc. | | N/A | | N/A |
Todd L. Spillane — 1958 Chief Compliance Officer | | 2006 | | Senior Vice President, Invesco Management Group, Inc. (formerly known as Invesco Aim Management Group, Inc.) and Van Kampen Exchange Corp.; Senior Vice President and Chief Compliance Officer, Invesco Advisers, Inc. (registered investment adviser) (formerly known as Invesco Institutional (N.A.), Inc.); Chief Compliance Officer, The Invesco Funds; Vice President, Invesco Distributors, Inc. (formerly known as Invesco Aim Distributors, Inc.) and Invesco Investment Services, Inc. (formerly known as Invesco Aim Investment Services, Inc.) Formerly: Chief Compliance Officer, Invesco Funds (Chicago); Senior Vice President, Van Kampen Investments Inc.; Senior Vice President and Chief Compliance Officer, Invesco Aim Advisers, Inc. and Invesco Aim Capital Management, Inc.; Chief Compliance Officer, INVESCO Private Capital Investments, Inc. (holding company), Invesco Private Capital, Inc. (registered investment adviser), Invesco Global Asset Management (N.A.), Inc., Invesco Senior Secured Management, Inc. (registered investment adviser), Van Kampen Investor Services Inc., PowerShares Exchange-Traded Fund Trust, PowerShares Exchange-Traded Fund Trust II, PowerShares India Exchange-Traded Fund Trust and PowerShares Actively Managed Exchange-Traded Fund Trust; and Vice President, Invesco Aim Capital Management, Inc. and Fund Management Company | | N/A | | N/A |
The Statement of Additional Information of the Trust includes additional information about the Fund’s Trustees and is available upon request, without charge, by calling 1.800.959.4246. Please refer to the Fund’s prospectus for information on the Fund’s sub-advisers.
| | | | | | |
Office of the Fund 11 Greenway Plaza, Suite 1000 Houston, TX 77046-1173 | | Investment Adviser Invesco Advisers, Inc. 1555 Peachtree Street, N.E. Atlanta, GA 30309 | | Distributor Invesco Distributors, Inc. 11 Greenway Plaza, Suite 1000 Houston, TX 77046-1173 | | Auditors PricewaterhouseCoopers LLP 1000 Louisiana Street, Suite 5800 Houston, TX 77002-5678 |
| | | |
| | | | | | |
Counsel to the Fund Stradley Ronon Stevens & Young, LLP 2005 Market Street, Suite 2600 Philadelphia, PA 19103-7018 | | Counsel to the Independent Trustees Goodwin Procter LLP 901 New York Avenue, N.W. Washington, D.C. 20001 | | Transfer Agent Invesco Investment Services, Inc. 11 Greenway Plaza, Suite 1000 Houston, TX 77046-1173 | | Custodian State Street Bank and Trust Company 225 Franklin Street Boston, MA 02110-2801 |
T-4 Invesco Global Market Neutral Fund

Invesco mailing information
Send general correspondence to Invesco Investment Services, Inc., P.O. Box 219078, Kansas City, MO 64121-9078.
Important notice regarding delivery of security holder documents
To reduce Fund expenses, only one copy of most shareholder documents may be mailed to shareholders with multiple accounts at the same address (Householding). Mailing of your shareholder documents may be householded indefinitely unless you instruct us otherwise. If you do not want the mailing of these documents to be combined with those for other members of your household, please contact Invesco Investment Services, Inc. at 800 959 4246 or contact your financial institution. We will begin sending you individual copies for each account within 30 days after receiving your request.
Fund holdings and proxy voting information
The Fund provides a complete list of its holdings four times in each fiscal year, at the quarter ends. For the second and fourth quarters, the lists appear in the Fund’s semiannual and annual reports to shareholders. For the first and third quarters, the Fund files the lists with the Securities and Exchange Commission (SEC) on Form N-Q. The most recent list of portfolio holdings is available at invesco.com/completeqtrholdings. Shareholders can also look up the Fund’s Forms N-Q on the SEC website at sec.gov. Copies of the Fund’s Forms N-Q may be reviewed and copied at the SEC Public Reference Room in Washington, D.C. You can obtain information on the operation of the Public Reference Room, including information about duplicating fee charges, by calling 202 551 8090 or 800 732 0330, or by electronic request at the following email address: publicinfo@sec.gov. The SEC file numbers for the Fund are shown below.
A description of the policies and procedures that the Fund uses to determine how to vote proxies relating to portfolio securities is available without charge, upon request, from our Client Services department at 800 959 4246 or at invesco.com/proxyguidelines. The information is also available on the SEC website, sec.gov.
| | |
Information regarding how the Fund voted proxies related to its portfolio securities during the most recent 12-month period ended June 30 is available at invesco.com/proxysearch. The information is also available on the SEC website, sec.gov. Invesco Advisers, Inc. is an investment adviser; it provides investment advisory services to individual and institutional clients and does not sell securities. Invesco Distributors, Inc. is the US distributor for Invesco Ltd.’s retail mutual funds, exchange-traded funds and institutional money market funds. Both are wholly owned, indirect subsidiaries of Invesco Ltd. | |  |
SEC file numbers: 811-05426 and 033-19338 GMN-AR-1 Invesco Distributors, Inc.
Letters to Shareholders
| | |

Philip Taylor | | Dear Shareholders: This annual report includes information about your Fund, including performance data and a complete list of its investments as of the close of the reporting period. Inside, your Fund’s portfolio managers discuss how they managed your Fund and the factors that affected its performance during the reporting period. I hope you find this report of interest. During the reporting period covered by this report, the US economy showed signs of continued improvement. After contracting in the first quarter of 2014, the economy expanded strongly in the second quarter and unemployment trended lower. Much of the credit for this improvement goes to the US Federal Reserve (the Fed), which undertook an extraordinary asset purchase program following the global financial crisis. The Fed’s goal was to jumpstart the economy by encouraging banks to lend more, businesses to hire more and consumers to spend more. Signs of a stronger US economy prompted the Fed to reduce, or “taper,” its asset purchase program. Despite this, interest rates remained near historical low levels due largely |
| to heavy investor demand for bonds. While signs of economic improvement were evident in the US, European economies showed signs of weakening. That, together with geopolitical uncertainty and worries about the first diagnosed cases of Ebola outside of Africa, caused increased volatility in US and European equities. |
Extended periods of market strength can lull investors into complacency – just as prolonged periods of market weakness or volatility can discourage investors from initiating long-term investment plans. That’s why Invesco has always encouraged investors to work with a professional financial adviser who can stress the importance of starting to save and invest early and the importance of adhering to a disciplined investment plan – when times are good and when they’re uncertain. A financial adviser who knows your unique financial situation, investment goals and risk tolerance can be an invaluable partner as you seek to achieve your financial goals. He or she can offer a long-term perspective when markets are volatile and time-tested advice and guidance when your financial situation or investment goals change.
Timely information when and where you want it
Invesco’s efforts to help investors achieve their financial objectives include providing individual investors and financial professionals with timely information about the markets, the economy and investing – whenever and wherever they want it.
Our website, invesco.com/us, offers a wide range of market insights and investment perspectives. On the website, you’ll find detailed information about our funds, including prices, performance, holdings and portfolio manager commentaries. You can access information about your individual Invesco account whenever it’s convenient for you; just complete a simple, secure online registration. Use the “Log In” box on our home page to get started.
Invesco’s mobile app for iPad® (available free from the App StoreSM) allows you to obtain the same detailed information about your Fund and the same investment insights from our investment leaders, market strategists, economists and retirement experts on the go. You also can watch portfolio manager videos and have instant access to Invesco news and updates wherever you may be.
In addition to the resources accessible on our website and through our mobile app, you can obtain timely updates to help you stay informed about the markets, the economy and investing by connecting with Invesco on Twitter, LinkedIn or Facebook. You can access our blog at blog.invesco.us.com. Our goal is to provide you the information you want, when and where you want it.
Have questions?
For questions about your account, feel free to contact an Invesco client services representative at 800 959 4246. For Invesco-related questions or comments, please email me directly at phil@invesco.com.
All of us at Invesco look forward to serving your investment management needs for many years to come. Thank you for investing with us.
Sincerely,

Philip Taylor
Senior Managing Director, Invesco Ltd.
iPad is a trademark of Apple Inc., registered in the US and other countries. App Store is a service mark of Apple Inc. Invesco Distributors, Inc. is not affiliated with Apple Inc.
2 Invesco Global Markets Strategy Fund
| | |

Bruce Crockett | | Dear Fellow Shareholders: There are a variety of factors that can impact investment performance, many of which are uncontrollable by us as investors. These factors can include various economic trends and geopolitical developments. While the members of the Invesco Funds Board, which I chair, can’t dictate the performance of the Invesco funds, be assured that your Board works diligently throughout the year to focus on how your investments are managed. Our job is to represent you and your interests on a variety of fund management-related matters. We regularly monitor how the portfolio management teams of the Invesco funds are performing in light of ever-changing and often unpredictable economic and market conditions. We review the investment strategies and investment process employed by each fund’s management team as explained in the fund’s prospectus. |
| | Perhaps our most significant responsibility is conducting the annual review of the funds’ |
advisory and sub-advisory contracts with Invesco Advisers and its affiliates. This annual review, which is required by the Investment Company Act of 1940, focuses on the nature and quality of the services Invesco provides as the adviser to the Invesco funds and the reasonableness of the fees that it charges for those services. Each year, we spend months carefully reviewing information from Invesco that allows us to evaluate the quality of its services and the reasonableness of its fees. We also use information from a variety of independent sources, including materials provided by the independent senior officer of the Invesco funds, who reports directly to the independent trustees on the Board. Additionally, we meet with legal counsel and review performance and fee data prepared for us by Lipper Inc., an independent, third-party firm widely recognized as a leader in its field.
After a careful review, the members of the Invesco Funds Board approved the continuation of advisory and sub-advisory contracts with Invesco Advisers and its affiliates. Be assured that your Board will continue working on behalf of fund shareholders, keeping your needs and interests uppermost in our minds.
As always, please contact me at bruce@brucecrockett.com with any questions or concerns you may have. On behalf of the Board, we look forward to continuing to represent your interests and serving your needs.
Sincerely,

Bruce L. Crockett
Independent Chair
Invesco Funds Board of Trustees
3 Invesco Global Markets Strategy Fund
Management’s Discussion of Fund Performance
Performance summary
For the fiscal year ended October 31, 2014, Invesco Global Markets Strategy Fund, at net asset value (NAV), underperformed the Barclays 3-Month Treasury Bellwether Index, the Fund’s broad market/style-specific benchmark. The Fund’s relative performance was due to strategic equity and fixed income allocations as well as tactical allocations to fixed income markets.
Your Fund’s long-term performance appears later in this report.
Fund vs. Indexes
Total returns, 10/31/13 to 10/31/14, at net asset value (NAV). Performance shown does not include applicable contingent deferred sales charges (CDSC) or front-end sales charges, which would have reduced performance.
| | | | |
Class A Shares | | | -0.73 | % |
Class C Shares | | | -1.42 | |
Class R Shares | | | -0.83 | |
Class Y Shares | | | -0.53 | |
Class R5 Shares | | | -0.34 | |
Class R6 Shares | | | -0.53 | |
| Barclays 3-Month Treasury Bellwether Indexq (Broad Market/Style-Specific Index)* | | | 0.07 | |
S&P Diversified Trends Indicator Indexn (Former Style-Specific Index)* | | | 4.53 | |
Lipper Absolute Return Funds Index¿ (Peer Group Index) | | | 2.03 | |
Source(s): qFactSet Research Systems Inc.; nBloomberg LP; ¿Lipper Inc.
| * | During the reporting period, the Fund elected to use the Barclays 3-Month Treasury Bellwether Index as its combined broad market/style-specific index, rather than using the S&P Diversified Trend Indicator Index as its style-specific index, because the Barclays 3-Month Treasury Bellwether Index more closely represent the Fund’s investment style. |
Market conditions and your Fund
The fiscal year ended October 31, 2014, started off with equity markets pushing higher on strong investor demand due to central bank stimulus. Bond markets drifted lower as investor demand for risky assets increased. Commodity prices were mixed as energy prices generally increased while prices for metals and agricultural commodities declined.
Equities, which had become investors’ preferred asset class in 2013, began 2014 poorly – indeed, with the weakest start to a new calendar year since 2009. Through the use of derivatives, such as swaps and futures, we shifted from an overweight position to a neutral stance toward the end of January before overweighting equities again in March. The net effect of these shifts in equity weightings was minor losses for the quarter. The Fund began 2014 with slight overweight positions in government bonds in all markets except for a neutral position to Japan. In January, investors
sought perceived “safe-haven” assets as equity market volatility spiked.1 We increased our tactical allocation to this segment through the use of derivatives, such as swaps and futures, but doing so produced little additional gains. We entered 2014 with almost zero exposure to commodities. In February, a combination of deteriorating term structure (the price curve formed by the prices of futures contracts over various expiration dates), declining price trends and US dollar strength hurt commodity prices, resulting in the Fund having a meaningful net short position across the commodity complexes. As a result, the Fund’s allocation to commodities detracted from performance.
The Fund fared better in the second quarter. All three asset classes in which the Fund invests contributed to results, with bonds leading the way. Bond markets saw yields decline as geopolitical concerns out of Russia and the Middle East created greater demand for perceived “safe-haven” assets. Contraction in the
US economy and generally weak European economic data also benefited bonds. Despite beginning the quarter weak, equities posted strong results as investors overlooked weaker-than-expected fundamental data and fears of widening geopolitical concerns. Across the commodity complexes, investments in energy through the use of derivatives, such as swaps and futures, led results as issues in the Middle East drove crude oil prices higher. Through the use of derivatives, such as swaps and futures, the Fund’s tactical positioning in the quarter helped results as overweight exposure to equities and bonds were rewarded. Our positioning in commodities was beneficial overall, but from a complex level, shifts in energy and industrial metals aided results, while positioning in precious metals and agricultural commodities detracted from returns. Bonds benefited in the second quarter from weak economic data – specifically, a significant contraction in the US economy in the first quarter. Equities climbed higher after a weak start to 2014. The Fund’s tactical overweight exposure to equity and bond markets benefited Fund performance for the quarter.
In the third quarter, yields on government bonds declined as geopolitical concerns and evidence of slowing economic activity in Europe and Asia increased investor demand for perceived “safe-haven” assets. Through the use of derivatives, such as swaps and futures, the Fund’s tactical overweight positioning in bonds, in most markets, aided Fund performance. Developed-market equities delivered mixed results for the quarter as Japanese, European and US large-cap equities generally rose while US small caps and UK and Hong Kong equities declined.
Tactical results from derivative investments, such as swaps and futures, in the Fund’s equity sleeve were negative, impacted by the weakness in equity prices in the last month of the quarter. Commodities were the clear loser for the quarter, as all four commodity complexes registered price declines, largely in response to the strong US dollar and a
| | | | |
| Target Risk Allocation and Notional Asset Weights† |
By asset class | | | | |
| | Risk | | % of Total Net Assets |
Asset Class | | Allocation* | | as of 10/31/14** |
| | |
Equities | | 46.08% | | 10.56% |
Fixed Income | | 49.45 | | 90.86 |
Commodities | | 4.47 | | -22.24 |
| † | Risk contribution is measured as the standard deviation of each asset class as a percentage of total portfolio standard deviation. The risk contribution of each underlying asset determines the dollar-weighting of the asset. Standard deviation measures a fund’s range of total returns and fluctuations over a defined period of time. |
| * | Based on the expected market exposure. |
| ** | Due to the use of leverage, the percentages may not equal 100%. |
| | | | |
Total Net Assets | | $ | 167.8 million | |
The Fund uses commodity-linked derivative investments and enhanced investment techniques such as leverage.
The Fund’s holdings are subject to change, and there is no assurance that the Fund will continue to hold any particular security.
4 Invesco Global Markets Strategy Fund
strong supply outlook. Tactical exposure to commodities had no meaningful impact on Fund performance during the quarter.
The fiscal year ended with significant volatility across asset classes, the result of central bank actions and economic data releases. Bonds managed gains during October as investors sought refuge from volatility, Ebola pandemic fears and economic uncertainty. Stocks were mixed, with European and UK equities off meaningfully while equities in the US and developed Asia generally posted gains. Commodities were mixed, with prices of agricultural commodities and industrial metals rising while precious metals prices declined. Energy was the clear loser for October, with broad weakness across the complex.
Please note that our strategy is principally implemented using derivative instruments, including futures, commodity-linked notes and total return swaps. Therefore, all or most of the performance of the strategy, both positive and negative, can be attributed to these instruments. Derivatives can be a cost-effective way to gain exposure to asset classes. However, derivatives may amplify traditional investment risks through the creation of leverage and may be less liquid than traditional securities.
Thank you for your commitment to Invesco Global Markets Strategy Fund.
| 1 | So-called “safe-haven” assets do not imply risk-free investing. |
The views and opinions expressed in management’s discussion of Fund performance are those of Invesco Advisers, Inc. These views and opinions are subject to change at any time based on factors such as market and economic conditions. These views and opinions may not be relied upon as investment advice or recommendations, or as an offer for a particular security. The information is not a complete analysis of every aspect of any market, country, industry, security or the Fund. Statements of fact are from sources considered reliable, but Invesco Advisers, Inc. makes no representation or warranty as to their completeness or accuracy. Although historical performance is no guarantee of future results, these insights may help you understand our investment management philosophy.
See important Fund and, if applicable, index disclosures later in this report.
| | |

| | Scott Wolle Chartered Financial Analyst, Portfolio Manager, is lead manager of Invesco Global Markets |
| Strategy Fund. He joined Invesco in 1999. Mr. Wolle earned a BS in finance from Virginia Polytechnic Institute and State University and an MBA from Duke University Fuqua School of Business. |
| | |

| | Mark Ahnrud Chartered Financial Analyst, Portfolio Manager, is manager of Invesco Invesco Global Markets |
| Strategy Fund. He joined Invesco in 2000. Mr. Ahnrud earned a BS in finance and investments from Babson College and an MBA from Duke University Fuqua School of Business. |
| | |

| | Chris Devine Chartered Financial Analyst, Portfolio Manager, is manager of Invesco Global Markets Strategy |
| Fund. He joined Invesco in 1998. Mr. Devine earned a BA in economics from Wake Forest University and an MBA from the University of Georgia. |
| | |

| | Scott Hixon Chartered Financial Analyst, Portfolio Manager, is manager of Invesco Global Markets Strategy |
| Fund. He joined Invesco in 1994. Mr. Hixon earned a BBA in finance from Georgia Southern University and an MBA in finance from Georgia State University. |
| | |

| | Christian Ulrich Chartered Financial Analyst, Portfolio Manager, is manager of Invesco Global Markets Strategy |
| Fund. He joined Invesco in 2000. Mr. Ulrich earned the equivalent of a BBA from the KV Zurich Business School in Zurich, Switzerland. |
Assisted by the Invesco Global Asset Allocation Team
5 Invesco Global Markets Strategy Fund
Your Fund’s Long-Term Performance
Results of a $10,000 Investment – Oldest Share Class(es) since Inception
Fund data from 9/26/12; index data from 9/30/12
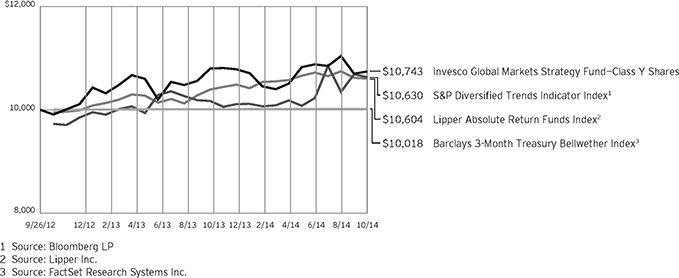
During the reporting period, the Fund elected to use the Barclays
3-Month Treasury Bellwether Index as its combined broad market/style-specific index, rather than using the S&P Diversified Trend Indicator Index as its style-specific index, because the Barclays 3-Month Treasury Bellwether Index more closely represent the Fund’s investment style. Because this is the first reporting period since we
adopted the Barclays 3-Month Treasury Bellwether Index as our style-specific index, SEC guidelines require that we compare performance to both the old and new indexes.
Past performance cannot guarantee comparable future results.
The data shown in the chart include reinvested distributions, applicable sales charges and Fund expenses including
management fees. Index results include reinvested dividends, but they do not reflect sales charges. Performance of the peer group, if applicable, reflects fund expenses and management fees; performance of a market index does not. Performance shown in the chart and table(s) does not reflect deduction of taxes a shareholder would pay on Fund distributions or sale of Fund shares.
continued from page 9
| | to risks associated with the Subsidiary’s investments. The Subsidiary is not registered under the Investment Company Act of 1940, as amended (1940 Act), and, except as otherwise noted in this prospectus is not subject to the investor protections of the 1940 Act. Changes in the laws of the United States and/or the Cayman Islands, under which the Fund and the Subsidiary, respectively, are organized, could result in the inability of the Fund and/or the Subsidiary to operate as described in this prospectus and could negatively affect the Fund and its shareholders. |
| n | | US government obligations risk. The Fund may invest in obligations issued by US government agencies and instrumentalities that may receive varying levels of support from the government, which could affect the Fund’s ability to recover should they default. |
| n | | Volatility risk. The Fund may have investments that appreciate or decrease significantly in value over short periods of time. This may cause the Fund’s net |
| | | asset value per share to experience significant increases or declines in value over short periods of time. |
About indexes used in this report
| n | | The Barclays 3-Month Treasury Bellwether Index measures the performance of Treasury bills with a maturity of less than three months. |
| n | | The Lipper Absolute Return Funds Index is an unmanaged index considered representative of absolute return funds tracked by Lipper. |
| n | | The S&P Diversified Trends Indicator Index is an investable long/short strategy that can benefit from trends (in either direction) in the global futures markets. It consists of 24 futures contracts, with a 50% weighting in financial futures and 50% weighting in commodities futures. |
| n | | The Fund is not managed to track the performance of any particular index, including the index(es) described here, and consequently, the performance of |
| | | the Fund may deviate significantly from the performance of the
index(es). |
| n | | A direct investment cannot be made in an index. Unless otherwise indicated, index results include reinvested dividends, and they do not reflect sales charges. Performance of the peer group, if applicable, reflects fund expenses; performance of a market index does not. |
Other information
| n | | The returns shown in management’s discussion of Fund performance are based on net asset values (NAVs) calculated for shareholder transactions. Generally accepted accounting principles require adjustments to be made to the net assets of the Fund at period end for financial reporting purposes, and as such, the NAVs for shareholder transactions and the returns based on those NAVs may differ from the NAVs and returns reported in the Financial Highlights. |
6 Invesco Global Markets Strategy Fund
| | | | |
Average Annual Total Returns As of 10/31/14, including maximum applicable sales charges | |
Class A Shares | | | | |
Inception | | | 0.48 | % |
1 Year | | | -6.20 | |
| |
Class C Shares | | | | |
Inception | | | 2.49 | % |
1 Year | | | -2.34 | |
| |
Class R Shares | | | | |
Inception | | | 3.01 | % |
1 Year | | | -0.83 | |
| |
Class Y Shares | | | | |
Inception (9/26/12) | | | 3.48 | % |
1 Year | | | -0.53 | |
| |
Class R5 Shares | | | | |
Inception | | | 3.53 | % |
1 Year | | | -0.34 | |
| |
Class R6 Shares | | | | |
Inception | | | 3.48 | % |
1 Year | | | -0.53 | |
On August 28, 2013, Class H1 shares converted to Class Y shares.
Class A shares incepted on August 28, 2013. Performance shown prior to that date is that of Class H1 shares and includes the 12b-1 fees applicable to Class H1 shares. Class H1 share performance reflects any applicable fee waivers or expense reimbursements.
Class C shares incepted on August 28, 2013. Performance shown prior to that date is that of Class H1 shares and includes the 12b-1 fees applicable to Class H1 shares. Class H1 share performance reflects any applicable fee waivers or expense reimbursements.
Class R shares incepted on August 28, 2013. Performance shown prior to that date is that of Class H1 shares and includes the 12b-1 fees applicable to Class H1 shares. Class H1 share performance reflects any applicable fee waivers or expense reimbursements.
Class R5 shares incepted on August 28, 2013. Performance shown prior to that date is that of Class H1 shares and includes the 12b-1 fees applicable to Class H1 shares. Class H1 share performance reflects any applicable fee waivers or expense reimbursements.
Class R6 shares incepted on August 28, 2013. Performance shown prior to that date is that of Class H1 shares and includes the 12b-1 fees applicable to
| | | | |
Average Annual Total Returns As of 9/30/14, the most recent calendar quarter end, including maximum applicable sales charges | |
Class A Shares | | | | |
Inception | | | 0.25 | % |
1 Year | | | -4.50 | |
| |
Class C Shares | | | | |
Inception | | | 2.39 | % |
1 Year | | | -0.61 | |
| |
Class R Shares | | | | |
Inception | | | 2.99 | % |
1 Year | | | 1.03 | |
| |
Class Y Shares | | | | |
Inception (9/26/12) | | | 3.42 | % |
1 Year | | | 1.33 | |
| |
Class R5 Shares | | | | |
Inception | | | 3.47 | % |
1 Year | | | 1.43 | |
| |
Class R6 Shares | | | | |
Inception | | | 3.42 | % |
1 Year | | | 1.33 | |
Class H1 shares. Class H1 share performance reflects any applicable fee waivers or expense reimbursements.
The performance data quoted represent past performance and cannot guarantee comparable future results; current performance may be lower or higher. Please visit invesco.com/performance for the most recent month-end performance. Performance figures reflect reinvested distributions, changes in net asset value and the effect of the maximum sales charge unless otherwise stated. Investment return and principal value will fluctuate so that you may have a gain or loss when you sell shares.
The net annual Fund operating expense ratio set forth in the most recent Fund prospectus as of the date of this report for Class A, Class C, Class R, Class Y, Class R5 and Class R6 shares was 1.80%, 2.55%, 2.05%, 1.55%, 1.55% and 1.55%, respectively.1,2 The total annual Fund operating expense ratio set forth in the most recent Fund prospectus as of the date of this report for Class A, Class C, Class R, Class Y, Class R5 and Class R6 shares was 2.26%, 3.01%, 2.51%, 2.01%, 1.90% and 1.86%, respectively. The expense ratios presented above may vary from the expense ratios presented in other sections of
this report that are based on expenses incurred during the period covered by this report.
Class A share performance reflects the maximum 5.50% sales charge, and Class C share performance reflects the applicable contingent deferred sales charge (CDSC) for the period involved. The CDSC on Class C shares is 1% for the first year after purchase. Class R, Class Y, Class R5 and Class R6 shares do not have a front-end sales charge or a CDSC; therefore, performance is at net asset value.
The performance of the Fund’s share classes will differ primarily due to different sales charge structures and class expenses.
Had the adviser not waived fees and/or reimbursed expenses, performance would have been lower.
| 1 | Total annual Fund operating expenses after any contractual fee waivers and/or expense reimbursements by the adviser in effect through at least June 30, 2016. See current prospectus for more information. |
| 2 | Total annual Fund operating expenses after any contractual fee waivers and/or expense reimbursements by the adviser in effect through at least February 29, 2016. See current prospectus for more information. |
7 Invesco Global Markets Strategy Fund
Invesco Global Market Strategy Fund’s investment objective is to seek a positive absolute return over a complete economic and market cycle.
| n | | Unless otherwise stated, information presented in this report is as of October 31, 2014, and is based on total net assets. |
| n | | Unless otherwise noted, all data provided by Invesco. |
| n | | To access your Fund’s reports/prospectus, visit invesco.com/fundreports. |
About share classes
| n | | Class R shares are generally available only to employer sponsored retirement and benefit plans. Please see the prospectus for more information. |
| n | | Class Y shares are available only to certain investors. Please see the prospectus for more information. |
| n | | Class R5 shares and Class R6 shares are primarily intended for employer sponsored retirement and benefit plans that meet certain standards and for institutional investors. Please see the prospectus for more information. |
Principal risks of investing in the Fund
| n | | Commodities tax risk. The tax treatment of commodity-linked derivative instruments may be adversely affected by changes in legislation, regulations or other legally binding authority. If, as a result of any such adverse action, the income of the Fund from certain commodity-linked derivatives was treated as non-qualifying income, the Fund might fail to qualify as a regulated investment company and be subject to federal income tax at the Fund level. The Internal Revenue Service has issued a number of private letter rulings to other mutual funds, including to another Invesco fund (upon which only the fund that received the private letter ruling can rely), which indicate that income from a fund’s investment in certain commodity linked notes and a wholly owned foreign subsidiary that invests in commodity-linked derivatives, such as the Subsidiary, constitutes qualifying income. However, the Internal Revenue Service suspended issuance in July 2011 of any further private letter rulings pending a review of its position. Should the Internal Revenue Service issue guidance, or Congress enact legislation, that adversely affects the tax treatment of the Fund’s use of commodity-linked notes or the Subsidiary (which guidance might be applied to the Fund retroactively), it could limit the Fund’s ability to pursue its investment strategy and the Fund |
| | | might not qualify as a regulated investment company for one or more years. In this event, the Fund’s Board of Trustees may authorize a significant change in investment strategy or Fund liquidation. The Fund also may incur transaction and other costs to comply with any new or additional guidance from the Internal Revenue Service. |
| n | | Commodity-linked notes risk. The Fund’s investments in commodity-linked notes may involve substantial risks, including risk of loss of a significant portion of their principal value. In addition to risks associated with the underlying commodities, they may be subject to additional special risks, such as risk of loss of interest and principal, lack of a secondary market and risk of greater volatility, that do not affect traditional equity and debt securities. If payment of interest on a commodity-linked note is linked to the value of a particular commodity, commodity index or other economic variable, the Fund might not receive all or a portion of the interest due on its investment if there is a loss of value of the underlying variable to which the interest is linked. To the extent that the amount of the principal to be repaid upon maturity is linked to the value of a particular commodity, commodity index or other economic variable, the Fund might not receive all or a portion of the principal at maturity of the investment. A liquid secondary market may not exist for the commodity-linked notes the Fund buys, which may make it difficult for the Fund to sell them at an acceptable price or to accurately value them. Commodity-linked notes are also subject to the credit risk of the issuer. If the issuer becomes bankrupt or otherwise fails to pay, the Fund could lose money. The value of the commodity-linked notes the Fund buys may fluctuate significantly because the values of the underlying investments to which they are linked are themselves volatile. Additionally, commodity-linked notes employ “economic” leverage that does not result in the possibility of a fund |
| | incurring obligations beyond its investment, but that nonetheless permit a fund to gain exposure that is greater than would be the case in an unlevered security. The particular terms of a commodity-linked note may create economic leverage by requiring payment by the issuer of an amount that is a multiple of the price increase or decrease of the underlying commodity, commodity index, or other economic variable. For example, a three times leveraged note will change by a magnitude of three for every percentage change (positive or negative) in the value of the underlying commodity, index or other economic variable. Such economic leverage will increase the volatility of the value of these commodity-linked notes and the Fund to the extent it invests in such notes. The Fund does not segregate assets or otherwise cover investments in securities with economic leverage. |
| n | | Commodity risk. The Fund’s significant investment exposure to the commodities markets and/or a particular sector of the commodities markets, which may subject the Fund to greater volatility than investments in traditional securities, such as stocks and bonds. The commodities markets may fluctuate widely based on a variety of factors, including changes in overall market movements, domestic and foreign political and economic events and policies, war, acts of terrorism, changes in domestic or foreign interest rates and/or investor expectations concerning interest rates, domestic and foreign inflation rates and investment and trading activities of mutual funds, hedge funds and commodities funds. Prices of various commodities may also be affected by factors such as drought, floods, weather, livestock disease, embargoes, tariffs and other regulatory developments. The prices of commodities can also fluctuate widely due to supply and demand disruptions in major producing or consuming regions. Because the Fund’s performance is linked to the performance of potentially volatile commodities, investors should be willing to assume the risks of potentially significant fluctuations in the value of the Fund’s shares. |
| n | | Correlation risk. Changes in the value of two investments or asset classes may not track or offset each other in the manner anticipated by the portfolio managers. Because the Fund’s investment strategy seeks to balance risk |
This report must be accompanied or preceded by a currently effective Fund prospectus, which contains more complete information, including sales charges and expenses. Investors should read it carefully before investing.
NOT FDIC INSURED | MAY LOSE VALUE | NO BANK GUARANTEE
8 Invesco Global Markets Strategy Fund
across three asset classes and, within each asset class, to balance risk across different countries and commodities, to the extent either the three asset classes or the selected countries and commodities are correlated in a way not anticipated by the portfolio managers the Fund’s risk allocation process may not succeed in achieving its investment objective.
| n | | Credit risk. The issuer of instruments in which the Fund invests may be unable to meet interest and/or principal payments, thereby causing its instruments to decrease in value and lowering the issuer’s credit rating. |
| n | | Currency/exchange rate risk. The dollar value of the Fund’s foreign investments will be affected by changes in the exchange rates between the dollar and the currencies in which those investments are traded. |
| n | | Derivatives risk. The value of a derivative instrument depends largely on (and is derived from) the value of an underlying security, currency, commodity, interest rate, index or other asset (each referred to as an underlying asset). In addition to risks relating to the underlying assets, the use of derivatives may include other, possibly greater, risks, including counterparty, leverage and liquidity risks. Counterparty risk is the risk that the counterparty to the derivative contract will default on its obligation to pay the Fund the amount owed or otherwise perform under the derivative contract. Derivatives create leverage risk because they do not require payment up front equal to the economic exposure created by owning the derivative. As a result, an adverse change in the value of the underlying asset could result in the Fund sustaining a loss that is substantially greater than the amount invested in the derivative, which may make the Fund’s returns more volatile and increase the risk of loss. Derivative instruments may also be less liquid than more traditional investments and the Fund may be unable to sell or close out its derivative positions at a desirable time or price. This risk may be more acute under adverse market conditions, during which the Fund may be most in need of liquidating its derivative positions. Derivatives may also be harder to value, less tax efficient and subject to changing government regulation that could impact the Fund’s ability to use certain derivatives or their cost. Also, derivatives used for hedging or to gain or limit exposure to a particular market segment may not provide the expected benefits, particularly during adverse market conditions. |
| n | | Developing/emerging markets securities risk. The prices of securities issued by foreign companies and governments located in developing/emerging market countries may be affected more negatively by inflation, devaluation of their currencies, higher transaction costs, delays in settlement, adverse political developments, the introduction of capital controls, withholding taxes, nationalization of private assets, expropriation, social unrest, war or lack of timely information than those in developed countries. |
| n | | Exchange-traded funds risk. An investment by the Fund in exchange-traded funds generally presents the same primary risks as an investment in a mutual fund. In addition, an exchange-traded fund may be subject to the following: (1) a discount of the exchange-traded fund’s shares to its net asset value; (2) failure to develop an active trading market for the exchange-traded fund’s shares; (3) the listing exchange halting trading of the exchange-traded fund’s shares; (4) failure of the exchange-traded fund’s shares to track the referenced asset; and (5) holding troubled securities in the referenced index or basket of investments. Investments in exchange-traded funds may involve duplication of management fees and certain other expenses, as the Fund indirectly bears its proportionate share of any expenses paid by the exchange-traded funds in which it invests. Further, certain of the exchange-traded funds in which the Fund may invest are leveraged. The more the Fund invests in such leveraged exchange-traded funds, the more this leverage will magnify any losses on those investments. |
| n | | Exchange-traded notes risk. Exchange-traded notes are subject to credit risk, including the credit risk of the issuer, and the value of the exchange-traded note may drop due to a downgrade in the issuer’s credit rating, despite the underlying market benchmark or strategy remaining unchanged. The value of an exchange-traded note may also be influenced by time to maturity, level of supply and demand for the exchange-traded note, volatility and lack of liquidity in the underlying market, changes in the applicable interest rates, changes in the issuer’s credit rating, and economic, legal, political, or geographic events that affect the referenced underlying market or strategy. Exchange-traded notes are also subject to the risk that the other party to the contract will not fulfill its contractual obligations, which may cause losses or additional costs to the Fund. |
| n | | Foreign government debt risk. Investments in foreign government debt |
| | | obligations involve certain risks in addition to those relating to foreign securities or debt securities generally. The issuer of the debt or the governmental authorities that control the repayment of the debt may be unable or unwilling to repay principal or interest when due in accordance with the terms of such debt, and the Fund may have limited recourse in the event of a default against the defaulting government. Without the approval of debt holders, some governmental debtors have in the past been able to reschedule or restructure their debt payments or declare moratoria on payments. |
| n | | Foreign securities risk. The Fund’s foreign investments may be affected by changes in a foreign country’s exchange rates, political and social instability, changes in economic or taxation policies, difficulties when enforcing obligations, decreased liquidity, and increased volatility. Foreign companies may be subject to less regulation resulting in less publicly available information about the companies. |
| n | | Interest rate risk. Interest rate risk refers to the risk that bond prices generally fall as interest rates rise; conversely, bond prices generally rise as interest rates fall. Specific bonds differ in their sensitivity to changes in interest rates depending on their individual characteristics, including duration. |
| n | | Liquidity risk. The Fund may hold illiquid securities that may be unable to sell at the preferred time or price and could lose its entire investment in such securities. The Fund’s significant use of derivative instruments may cause liquidity risk to be greater than other mutual funds that invest in more traditional assets such as stocks and bonds, which trade on markets with more market participants. |
| n | | Management risk. The investment techniques and risk analysis used by the Fund’s and the underlying funds’ portfolio managers may not produce the desired results. |
| n | | Market risk. The prices of and the income generated by the Fund’s securities may decline in response to, among other things, investor sentiment, general economic and market conditions, regional or global instability, and currency and interest rate fluctuations. |
| n | | Non-diversification risk. The Fund is non-diversified and can invest a greater portion of its assets in a small number of issuers or a single issuer. A change in the value of the issuer could affect the value of the Fund more than if it was a diversified fund. |
| n | | Subsidiary risk. By investing in the Subsidiary, the Fund is indirectly exposed |
continued on page 6
9 Invesco Global Markets Strategy Fund
Consolidated Schedule of Investments
October 31, 2014
| | | | | | | | | | | | | | | | |
| | | Interest
Rate | | | Maturity
Date | | | Principal Amount | | | Value | |
U.S. Treasury Securities–36.01% | |
| U.S. Treasury Bills–19.09%(a) | |
U.S. Treasury Bills(b) | | | 0.05 | % | | | 12/04/14 | | | $ | 3,440,000 | | | $ | 3,440,000 | |
U.S. Treasury Bills(b)(c) | | | 0.05 | % | | | 12/04/14 | | | | 560,000 | | | | 560,010 | |
U.S. Treasury Bills(b) | | | 0.10 | % | | | 01/08/15 | | | | 5,000,000 | | | | 4,999,953 | |
U.S. Treasury Bills(c)(d) | | | 0.10 | % | | | 01/08/15 | | | | 800,000 | | | | 799,992 | |
U.S. Treasury Bills | | | 0.05 | % | | | 01/15/15 | | | | 7,500,000 | | | | 7,499,923 | |
U.S. Treasury Bills(b)(c) | | | 0.05 | % | | | 01/15/15 | | | | 1,200,000 | | | | 1,199,988 | |
U.S. Treasury Bills(b) | | | 0.05 | % | | | 01/22/15 | | | | 7,000,000 | | | | 6,999,999 | |
U.S. Treasury Bills(b)(c) | | | 0.05 | % | | | 01/22/15 | | | | 1,120,000 | | | | 1,120,000 | |
U.S. Treasury Bills | | | 0.06 | % | | | 01/29/15 | | | | 4,640,000 | | | | 4,639,943 | |
U.S. Treasury Bills(c) | | | 0.06 | % | | | 01/29/15 | | | | 770,000 | | | | 769,991 | |
| | | | | | | | | | | | | | | | 32,029,799 | |
| | | | |
| U.S. Treasury Notes–16.92%(e) | | | | | | | | | | | | | | | | |
U.S. Treasury Notes | | | 0.07 | % | | | 01/31/16 | | | | 5,500,000 | | | | 5,500,097 | |
U.S. Treasury Notes(c) | | | 0.07 | % | | | 01/31/16 | | | | 910,000 | | | | 910,016 | |
U.S. Treasury Notes | | | 0.09 | % | | | 04/30/16 | | | | 16,380,000 | | | | 16,385,523 | |
U.S. Treasury Notes(c)(d) | | | 0.09 | % | | | 04/30/16 | | | | 2,695,000 | | | | 2,695,909 | |
U.S. Treasury Notes | | | 0.09 | % | | | 07/31/16 | | | | 2,500,000 | | | | 2,501,034 | |
U.S. Treasury Notes(c) | | | 0.09 | % | | | 07/31/16 | | | | 410,000 | | | | 410,170 | |
| | | | | | | | | | | | | | | | 28,402,749 | |
Total U.S. Treasury Securities (Cost $60,423,860) | | | | | | | | | | | | | | | 60,432,548 | |
| | | | |
| | | | | | | | | Shares | | | | |
Money Market Funds–63.50% | | | | | | | | | | | | | | | | |
Liquid Assets Portfolio–Institutional Class(f) | | | | | | | | | | | 37,377,091 | | | | 37,377,091 | |
Premier Portfolio–Institutional Class(f) | | | | | | | | | | | 37,377,092 | | | | 37,377,092 | |
STIC (Global Series) PLC–U.S. Dollar Liquidity Portfolio (Ireland)–Institutional Class(c)(f) | | | | | | | | | | | 31,826,112 | | | | 31,826,112 | |
Total Money Market Funds (Cost $106,580,295) | | | | | | | | | | | | | | | 106,580,295 | |
TOTAL INVESTMENTS–99.51% (Cost $167,004,155) | | | | | | | | | | | | | | | 167,012,843 | |
OTHER ASSETS LESS LIABILITIES–0.49% | | | | | | | | | | | | | | | 816,739 | |
NET ASSETS–100.00% | | | | | | | | | | | | | | $ | 167,829,582 | |
| | | | | | | | | | | | | | | | | | | | | | |
| Open Futures Contracts | |
| Futures Contracts | | Type of
Contract | | | | | Number of
Contracts | | | Expiration
Month | | | Notional
Value | | | Unrealized
Appreciation
(Depreciation) | |
Brent Crude(c) | | | Short | | | | | | 32 | | | | April-2015 | | | $ | (2,811,520 | ) | | $ | 304,680 | |
Cotton No.2(c) | | | Short | | | | | | 166 | | | | December-2014 | | | | (5,349,350 | ) | | | 272,941 | |
Gas Oil(c) | | | Short | | | | | | 49 | | | | December-2014 | | | | (3,632,125 | ) | | | (36,897 | ) |
Gasoline Reformulated Blendstock Oxygenate Blending(c) | | | Short | | | | | | 2 | | | | December-2014 | | | | (180,415 | ) | | | 295 | |
Heating Oil(c) | | | Short | | | | | | 39 | | | | April-2015 | | | | (4,073,870 | ) | | | 320,480 | |
Silver(c) | | | Short | | | | | | 58 | | | | December-2014 | | | | (4,670,740 | ) | | | 434,697 | |
Soybean(c) | | | Short | | | | | | 87 | | | | January-2015 | | | | (4,564,238 | ) | | | (347,203 | ) |
WTI Crude(c) | | | Short | | | | | | 4 | | | | December-2014 | | | | (322,160 | ) | | | 42,868 | |
Subtotal — Commodity Risk | | | | | | | | | | | | | | | | | | | | $ | 991,861 | |
| | | | | | |
| | | | | | | | | | | | | | | | | | | | | | |
See accompanying Notes to Consolidated Financial Statements which are an integral part of the financial statements.
10 Invesco Global Markets Strategy Fund
| | | | | | | | | | | | | | | | | | | | | | |
| Futures Contracts | | Type of
Contract | | | | | Number of
Contracts | | | Expiration
Month | | | Notional
Value | | | Unrealized
Appreciation
(Depreciation) | |
Australia 10 Year Bonds | | | Long | | | | | | 173 | | | | December-2014 | | | $ | 18,693,650 | | | $ | 497,251 | |
Canada 10 Year Bonds | | | Long | | | | | | 269 | | | | December-2014 | | | | 32,710,152 | | | | 166,138 | |
Euro Bonds | | | Long | | | | | | 164 | | | | December-2014 | | | | 31,013,273 | | | | 380,460 | |
Japanese 10 Year Bonds | | | Long | | | | | | 11 | | | | December-2014 | | | | 14,351,616 | | | | 73,658 | |
Long Gilt | | | Long | | | | | | 154 | | | | December-2014 | | | | 28,357,095 | | | | 644,586 | |
U.S. Treasury 20 Year Bonds | | | Long | | | | | | 111 | | | | December-2014 | | | | 15,661,406 | | | | 212,269 | |
Subtotal — Interest Rate Risk | | | | | | | | | | | | | | | | | | | | $ | 1,974,362 | |
Dow Jones EURO STOXX 50 Index | | | Long | | | | | | 182 | | | | December-2014 | | | | 7,072,271 | | | | (257,439 | ) |
E-Mini S&P 500 Index | | | Long | | | | | | 21 | | | | December-2014 | | | | 2,111,970 | | | | 36,442 | |
FTSE 100 Index | | | Long | | | | | | 35 | | | | December-2014 | | | | 3,642,625 | | | | (147,407 | ) |
Hang Seng Index | | | Long | | | | | | 2 | | | | November-2014 | | | | 308,739 | | | | 7,320 | |
Russell 2000 Index Mini | | | Short | | | | | | 16 | | | | December-2014 | | | | (1,873,600 | ) | | | (133,909 | ) |
Tokyo Stock Price Index | | | Long | | | | | | 53 | | | | December-2014 | | | | 6,309,411 | | | | 202,278 | |
Subtotal — Market Risk | | | | | | | | | | | | | | | | | | | | $ | (292,715 | ) |
Total Futures Contracts | | | | | | | | | | | | | | | | | | | | $ | 2,673,508 | |
| | | | | | |
| | | | | | | | | | | | | | | | | | | | | | |
| Open Over-The-Counter Total Return Swap Agreements | |
| Swap Agreements | | Type of
Contract | | | Counterparty | | Number of
Contracts | | | Termination
Date | | | Notional
Value | | | Unrealized
Appreciation
(Depreciation) | |
Receive a return equal to the Barclays Commodity Strategy 1452 Excess Return Index and pay the product of (i) 0.33% of the Notional Amount multiplied by (ii) days in the period divided by 365(c) | | | Long | | | Barclays Bank PLC | | | 4,700 | | | | October-2015 | | | $ | 2,519,201 | | | $ | 18,107 | |
Pay a floating rate equal to the Barclays Capital Soymeal Nearby Excess Return Index and pay the product of (i) 0.30% of the Notional Amount multiplied by (ii) days in the period divided by 365(c) | | | Short | | | Barclays Bank PLC | | | 1,380 | | | | October-2015 | | | | (1,288,878 | ) | | | (242,971 | ) |
Pay a floating rate equal to the Barclays Commodity Strategy 1606 Excess Return Index and pay the product of (i) 0.41% of the Notional Amount multiplied by (ii) days in the period divided by 365(c) | | | Short | | | Barclays Bank PLC | | | 3,420 | | | | October-2015 | | | | (1,141,890 | ) | | | 31,835 | |
Pay a floating rate equal to the S&P GSCI Sugar Excess Return A141 Strategy and receive the product of (i) 0.37% of the Notional Amount multiplied by (ii) days in the period divided by 365(c) | | | Short | | | Goldman Sachs
International | | | 10,470 | | | | February-2015 | | | | (2,740,356 | ) | | | 0 | |
Pay a floating rate equal to the S&P GSCI Gold Index Excess Return and pay the product of (i) 0.09% of the Notional Amount multiplied by (ii) days in the period divided by 365(c) | | | Short | | | JPMorgan Chase
Bank, N.A. | | | 19,700 | | | | April-2015 | | | | (2,061,755 | ) | | | 122,333 | |
Pay a floating rate equal to the Merrill Lynch Gold Excess Return Index and pay the product of (i) 0.14% of the Notional Amount multiplied by (ii) days in the period divided by 365(c) | | | Short | | | Merrill Lynch
International | | | 5,540 | | | | June-2015 | | | | (854,762 | ) | | | 0 | |
Pay a floating rate equal to the S&P GSCI Aluminum Dynamic Roll Excess Return Index and pay the product of (i) 0.38% of the Notional Amount multiplied by (ii) days in the period divided by 365(c) | | | Short | | | Morgan Stanley
Capital Services LLC | | | 57,050 | | | | October-2015 | | | | (6,453,958 | ) | | | (357,641 | ) |
Subtotal — Commodity Risk | | | | | | | | | | | | | | | | | | | | $ | (428,337 | ) |
Receive a return equal to Eurex Euro Bund Futures multiplied by 0.01% of the Notional Value | | | Long | | | Goldman Sachs
International | | | 10 | | | | December-2014 | | | | 1,891,053 | | | | 7,140 | |
Receive a return equal to LIFFE Long Gilt Futures multiplied by 0.01% of the Notional Value | | | Long | | | Goldman Sachs
International | | | 71 | | | | December-2014 | | | | 13,073,726 | | | | 251,782 | |
Receive a return equal to Canada 10 Year Bond Futures multiplied by 0.01% of the Notional Value | | | Long | | | Bank of America
Merrill Lynch | | | 3 | | | | December-2014 | | | | 364,797 | | | | 2,232 | |
Subtotal — Interest Rate Risk | | | | | | | | | | | | | | | | | | | | $ | 261,154 | |
Total Swap Agreements | | | | | | | | | | | | | | | | | | | | $ | (167,183 | ) |
See accompanying Notes to Consolidated Financial Statements which are an integral part of the financial statements.
11 Invesco Global Markets Strategy Fund
Index Information:
| | |
| Barclays Commodity Strategy 1452 Excess Return Index | | – a commodity index that provides exposure to futures contracts on copper. |
| Barclays Commodity Strategy 1606 Excess Return Index | | – a commodity index that provides exposure to futures contracts on sugar. |
Notes to Consolidated Schedule of Investments:
| (a) | Security traded on a discount basis. The interest rate shown represents the discount rate at the time of purchase by the Fund. |
| (b) | All or a portion of the value was pledged as collateral to cover margin requirements for open futures contracts. See Note 1K and Note 4. |
| (c) | The investment is owned by the Subsidiary. See Note 5. |
| (d) | All or a portion of the value was designated as collateral for swap agreements. See Note 1L and Note 4. |
| (e) | Interest or dividend rate is redetermined periodically. Rate shown is the rate in effect on October 31, 2014. |
| (f) | The money market fund and the Fund are affiliated by having the same investment adviser. |
See accompanying Notes to Consolidated Financial Statements which are an integral part of the financial statements.
12 Invesco Global Markets Strategy Fund
Consolidated Statement of Assets and Liabilities
October 31, 2014
| | | | |
Assets: | | | | |
Investments, at value (Cost $60,423,860) | | $ | 60,432,548 | |
Investments in affiliated money market funds, at value and cost | | | 106,580,295 | |
Total investments, at value (Cost $167,004,155) | | | 167,012,843 | |
Receivable for: | | | | |
Variation margin — futures | | | 509,772 | |
Fund shares sold | | | 466,640 | |
Dividends and interest | | | 3,393 | |
Fund expenses absorbed | | | 17,282 | |
Swaps receivables | | | 103,860 | |
Unrealized appreciation on swap agreements — OTC | | | 433,429 | |
Investment for trustee deferred compensation and retirement plans | | | 10,109 | |
Other assets | | | 34,394 | |
Total assets | | | 168,591,722 | |
| |
Liabilities: | | | | |
Payable for: | | | | |
Fund shares reacquired | | | 46,031 | |
Accrued fees to affiliates | | | 39,487 | |
Accrued trustees’ and officers’ fees and benefits | | | 1,744 | |
Accrued other operating expenses | | | 63,580 | |
Trustee deferred compensation and retirement plans | | | 10,686 | |
Unrealized depreciation on swap agreements — OTC | | | 600,612 | |
Total liabilities | | | 762,140 | |
Net assets applicable to shares outstanding | | $ | 167,829,582 | |
| |
Net assets consist of: | | | | |
Shares of beneficial interest | | $ | 160,687,956 | |
Undistributed net investment income (loss) | | | 3,315,908 | |
Undistributed net realized gain | | | 1,310,706 | |
Net unrealized appreciation | | | 2,515,012 | |
| | | $ | 167,829,582 | |
| | | | |
Net Assets: | | | | |
Class A | | $ | 6,995,637 | |
Class C | | $ | 12,136,308 | |
Class R | | $ | 24,104 | |
Class Y | | $ | 36,645,289 | |
Class R5 | | $ | 9,573 | |
Class R6 | | $ | 112,018,671 | |
|
Shares outstanding, $0.01 par value per share,
with an unlimited number of shares authorized: | |
Class A | | | 698,438 | |
Class C | | | 1,221,502 | |
Class R | | | 2,410 | |
Class Y | | | 3,645,739 | |
Class R5 | | | 952 | |
Class R6 | | | 11,144,654 | |
Class A: | | | | |
Net asset value per share | | $ | 10.02 | |
Maximum offering price per share | | | | |
(Net asset value of $10.02 ¸ 94.50%) | | $ | 10.60 | |
Class C: | | | | |
Net asset value and offering price per share | | $ | 9.94 | |
Class R: | | | | |
Net asset value and offering price per share | | $ | 10.00 | |
Class Y: | | | | |
Net asset value and offering price per share | | $ | 10.05 | |
Class R5: | | | | |
Net asset value and offering price per share | | $ | 10.06 | |
Class R6: | | | | |
Net asset value and offering price per share | | $ | 10.05 | |
See accompanying Notes to Consolidated Financial Statements which are an integral part of the financial statements.
13 Invesco Global Markets Strategy Fund
Consolidated Statement of Operations
For the year ended October 31, 2014
| | | | |
Investment income: | | | | |
Dividends from affiliated money market funds | | $ | 37,535 | |
Interest | | | 40,635 | |
Total investment income | | | 78,170 | |
| |
Expenses: | | | | |
Advisory fees | | | 2,484,654 | |
Administrative services fees | | | 50,000 | |
Custodian fees | | | 10,034 | |
Distribution fees: | | | | |
Class A | | | 16,363 | |
Class C | | | 113,127 | |
Class R | | | 78 | |
Transfer agent fees — A, C, R and Y | | | 60,536 | |
Transfer agent fees — R6 | | | 139 | |
Trustees’ and officers’ fees and benefits | | | 25,266 | |
Other | | | 237,232 | |
Total expenses | | | 2,997,429 | |
Less: Fees waived and expenses reimbursed | | | (414,113 | ) |
Net expenses | | | 2,583,316 | |
Net investment income (loss) | | | (2,505,146 | ) |
| |
Realized and unrealized gain (loss) from: | | | | |
Net realized gain (loss) from: | | | | |
Investment securities | | | 194 | |
Foreign currencies | | | (106,303 | ) |
Futures contracts | | | 3,823,731 | |
Swap agreements | | | (1,061,349 | ) |
| | | | 2,656,273 | |
Change in net unrealized appreciation (depreciation) of: | | | | |
Investment securities | | | 5,550 | |
Futures contracts | | | (622,577 | ) |
Swap agreements | | | (158,631 | ) |
| | | | (775,658 | ) |
Net realized and unrealized gain | | | 1,880,615 | |
Net increase (decrease) in net assets resulting from operations | | $ | (624,531 | ) |
See accompanying Notes to Consolidated Financial Statements which are an integral part of the financial statements.
14 Invesco Global Markets Strategy Fund
Consolidated Statement of Changes in Net Assets
For the years ended October 31, 2014 and 2013
| | | | | | | | |
| | | 2014 | | | 2013 | |
Operations: | | | | | | | | |
Net investment income (loss) | | $ | (2,505,146 | ) | | $ | (1,378,066 | ) |
Net realized gain | | | 2,656,273 | | | | 2,169,842 | |
Change in net unrealized appreciation (depreciation) | | | (775,658 | ) | | | 3,366,612 | |
Net increase (decrease) in net assets resulting from operations | | | (624,531 | ) | | | 4,158,388 | |
| | |
Distributions to shareholders from net realized gains: | | | | | | | | |
Class A | | | (94,210 | ) | | | — | |
Class C | | | (141,449 | ) | | | — | |
Class R | | | (647 | ) | | | — | |
Class Y | | | (692,741 | ) | | | — | |
Class R5 | | | (647 | ) | | | — | |
Class R6 | | | (6,922,506 | ) | | | — | |
Total distributions from net realized gains | | | (7,852,200 | ) | | | — | |
| | |
Share transactions–net: | | | | | | | | |
Class A | | | 6,388,685 | | | | 598,916 | |
Class C | | | 11,581,205 | | | | 809,842 | |
Class R | | | 14,508 | | | | 10,000 | |
Class Y | | | 30,676,861 | | | | (4,665,740 | ) |
Class R5 | | | — | | | | 10,000 | |
Class R6 | | | 9,379,796 | | | | 107,326,503 | |
Net increase in net assets resulting from share transactions | | | 58,041,055 | | | | 104,089,521 | |
Net increase in net assets | | | 49,564,324 | | | | 108,247,909 | |
| | |
Net assets: | | | | | | | | |
Beginning of year | | | 118,265,258 | | | | 10,017,349 | |
End of year (includes undistributed net investment income (loss) of $3,315,908 and $3,481, respectively) | | $ | 167,829,582 | | | $ | 118,265,258 | |
Notes to Consolidated Financial Statements
October 31, 2014
NOTE 1—Significant Accounting Policies
Invesco Global Markets Strategy Fund (the “Fund”) is a series portfolio of AIM Investment Funds (Invesco Investment Funds) (the “Trust”). The Trust is organized as a Delaware statutory trust and is registered under the Investment Company Act of 1940, as amended (the “1940 Act”), as an open-end series management investment company consisting of twenty-four separate series portfolios, each authorized to issue an unlimited number of shares of beneficial interest. The assets, liabilities and operations of each portfolio are accounted for separately. Information presented in these consolidated financial statements pertains only to the Fund. Matters affecting each portfolio or class will be voted on exclusively by the shareholders of such portfolio or class.
The Fund will seek to gain exposure to the commodity markets primarily through investments in the Invesco Cayman Commodity Fund V Ltd. (the “Subsidiary”), a wholly-owned subsidiary of the Fund organized under the laws of the Cayman Islands. The Subsidiary was organized by the Fund to invest in commodity-linked derivatives. The Fund may invest up to 25% of its total assets in the Subsidiary.
The Fund’s investment objective is to seek a positive absolute return over a complete economic and market cycle.
The Fund currently consists of six different classes of shares: Class A, Class C, Class R, Class Y, Class R5 and Class R6. On August 28, 2013, the Fund began offering Class A, Class C, Class R, Class Y, Class R5 and Class R6 shares and the Fund’s existing Class H1 shares were converted to Class Y shares. Class A shares are sold with a front-end sales charge unless certain waiver criteria are met and under certain circumstances load waiver shares may be subject to contingent deferred sales charges (“CDSC”). Class C shares are sold with a CDSC. Class R, Class Y, Class R5 and Class R6 shares are sold at net asset value.
The following is a summary of the significant accounting policies followed by the Fund in the preparation of its consolidated financial statements.
| A. | Security Valuations — Securities, including restricted securities, are valued according to the following policy. |
Debt obligations (including convertible securities) and unlisted equities are fair valued using an evaluated quote provided by an independent pricing service. Evaluated quotes provided by the pricing service may be determined without exclusive reliance on quoted prices, and may reflect appropriate factors such as institution-size trading in similar groups of securities, developments related to specific securities, dividend rate (for unlisted equities), yield (for debt obligations), quality, type of issue, coupon rate (for debt obligations), maturity (for debt obligations), individual trading characteristics and other market data. Debt obligations are subject to interest rate and credit risks. In addition, all debt obligations involve some risk of default with respect to interest and/or principal payments.
15 Invesco Global Markets Strategy Fund
A security listed or traded on an exchange (except convertible securities) is valued at its last sales price or official closing price as of the close of the customary trading session on the exchange where the security is principally traded, or lacking any sales or official closing price on a particular day, the security may be valued at the closing bid price on that day. Securities traded in the over-the-counter market are valued based on prices furnished by independent pricing services or market makers. When such securities are valued by an independent pricing service they may be considered fair valued. Futures contracts are valued at the final settlement price set by an exchange on which they are principally traded. Listed options are valued at the mean between the last bid and ask prices from the exchange on which they are principally traded. Options not listed on an exchange are valued by an independent source at the mean between the last bid and ask prices. For purposes of determining net asset value per share, futures and option contracts generally are valued 15 minutes after the close of the customary trading session of the New York Stock Exchange (“NYSE”).
Investments in open-end and closed-end registered investment companies that do not trade on an exchange are valued at the end of day net asset value per share. Investments in open-end and closed-end registered investment companies that trade on an exchange are valued at the last sales price or official closing price as of the close of the customary trading session on the exchange where the security is principally traded.
Swap agreements are fair valued using an evaluated quote provided by an independent pricing service. Evaluated quotes provided by the pricing service are valued based on a model which may include end of day net present values, spreads, ratings, industry, and company performance.
Foreign securities’ (including foreign exchange contracts) prices are converted into U.S. dollar amounts using the applicable exchange rates as of the close of the NYSE. If market quotations are available and reliable for foreign exchange-traded equity securities, the securities will be valued at the market quotations. Because trading hours for certain foreign securities end before the close of the NYSE, closing market quotations may become unreliable. If between the time trading ends on a particular security and the close of the customary trading session on the NYSE, events occur that the Adviser determines are significant and make the closing price unreliable, the Fund may fair value the security. If the event is likely to have affected the closing price of the security, the security will be valued at fair value in good faith using procedures approved by the Board of Trustees. Adjustments to closing prices to reflect fair value may also be based on a screening process of an independent pricing service to indicate the degree of certainty, based on historical data, that the closing price in the principal market where a foreign security trades is not the current value as of the close of the NYSE. Foreign securities’ prices meeting the approved degree of certainty that the price is not reflective of current value will be priced at the indication of fair value from the independent pricing service. Multiple factors may be considered by the independent pricing service in determining adjustments to reflect fair value and may include information relating to sector indices, American Depositary Receipts and domestic and foreign index futures. Foreign securities may have additional risks including exchange rate changes, potential for sharply devalued currencies and high inflation, political and economic upheaval, the relative lack of issuer information, relatively low market liquidity and the potential lack of strict financial and accounting controls and standards.
Securities for which market prices are not provided by any of the above methods may be valued based upon quotes furnished by independent sources. The last bid price may be used to value equity securities. The mean between the last bid and ask prices is used to value debt obligations, including corporate loans.
Securities for which market quotations are not readily available or became unreliable are valued at fair value as determined in good faith by or under the supervision of the Trust’s officers following procedures approved by the Board of Trustees. Issuer specific events, market trends, bid/ask quotes of brokers and information providers and other market data may be reviewed in the course of making a good faith determination of a security’s fair value.
The Fund may invest in securities that are subject to interest rate risk, meaning the risk that the prices will generally fall as interest rates rise and, conversely, the prices will generally rise as interest rates fall. Specific securities differ in their sensitivity to changes in interest rates depending on their individual characteristics. Changes in interest rates may result in increased market volatility, which may affect the value and/or liquidity of certain of the Fund’s investments.
Valuations change in response to many factors including the historical and prospective earnings of the issuer, the value of the issuer’s assets, general economic conditions, interest rates, investor perceptions and market liquidity. Because of the inherent uncertainties of valuation, the values reflected in the consolidated financial statements may materially differ from the value received upon actual sale of those investments.
| B. | Securities Transactions and Investment Income — Securities transactions are accounted for on a trade date basis. Realized gains or losses on sales are computed on the basis of specific identification of the securities sold. Interest income (net of withholding tax, if any) is recorded on the accrual basis from settlement date. Dividend income (net of withholding tax, if any) is recorded on the ex-dividend date. Bond premiums and discounts are amortized and/or accreted for financial reporting purposes. |
The Fund may periodically participate in litigation related to Fund investments. As such, the Fund may receive proceeds from litigation settlements. Any proceeds received are included in the Consolidated Statement of Operations as realized gain (loss) for investments no longer held and as unrealized gain (loss) for investments still held.
Brokerage commissions and mark ups are considered transaction costs and are recorded as an increase to the cost basis of securities purchased and/or a reduction of proceeds on a sale of securities. Such transaction costs are included in the determination of net realized and unrealized gain (loss) from investment securities reported in the Consolidated Statement of Operations and the Consolidated Statement of Changes in Net Assets and the net realized and unrealized gains (losses) on securities per share in the Consolidated Financial Highlights. Transaction costs are included in the calculation of the Fund’s net asset value and, accordingly, they reduce the Fund’s total returns. These transaction costs are not considered operating expenses and are not reflected in net investment income reported in the Consolidated Statement of Operations and Consolidated Statement of Changes in Net Assets, or the net investment income per share and ratios of expenses and net investment income reported in the Consolidated Financial Highlights, nor are they limited by any expense limitation arrangements between the Fund and the investment adviser.
The Fund allocates income and realized and unrealized capital gains and losses to a class based on the relative net assets of each class.
| C. | Country Determination — For the purposes of making investment selection decisions and presentation in the Consolidated Schedule of Investments, the investment adviser may determine the country in which an issuer is located and/or credit risk exposure based on various factors. These factors include the laws of the country under which the issuer is organized, where the issuer maintains a principal office, the country in which the issuer derives 50% or more of its total revenues and the country that has the primary market for the issuer’s securities, as well as |
16 Invesco Global Markets Strategy Fund
| | other criteria. Among the other criteria that may be evaluated for making this determination are the country in which the issuer maintains 50% or more of its assets, the type of security, financial guarantees and enhancements, the nature of the collateral and the sponsor organization. Country of issuer and/or credit risk exposure has been determined to be the United States of America, unless otherwise noted. |
| D. | Distributions — Distributions from net investment income and net realized capital gain, if any, are generally declared and paid annually and recorded on the ex-dividend date. The Fund may elect to treat a portion of the proceeds from redemptions as distributions for federal income tax purposes. |
| E. | Federal Income Taxes — The Fund intends to comply with the requirements of Subchapter M of the Internal Revenue Code of 1986, as amended (the “Internal Revenue Code”), necessary to qualify as a regulated investment company and to distribute substantially all of the Fund’s taxable earnings to shareholders. As such, the Fund will not be subject to federal income taxes on otherwise taxable income (including net realized capital gain) that is distributed to shareholders. Therefore, no provision for federal income taxes is recorded in the consolidated financial statements. |
The Fund recognizes the tax benefits of uncertain tax positions only when the position is more likely than not to be sustained. Management has analyzed the Fund’s uncertain tax positions and concluded that no liability for unrecognized tax benefits should be recorded related to uncertain tax positions. Management is not aware of any tax positions for which it is reasonably possible that the total amounts of unrecognized tax benefits will change materially in the next 12 months.
The Subsidiary is classified as a controlled foreign corporation under Subchapter N of the Internal Revenue Code. Therefore, the Fund is required to increase its taxable income by its share of the Subsidiary’s income. Net investment losses of the Subsidiary cannot be deducted by the Fund in the current period nor carried forward to offset taxable income in future periods.
The Fund files tax returns in the U.S. Federal jurisdiction and certain other jurisdictions. Generally the Fund is subject to examinations by such taxing authorities for up to three years after the filing of the return for the tax period.
| F. | Expenses — Fees provided for under the Rule 12b-1 plan of a particular class of the Fund are charged to the operations of such class. Transfer agency fees and expenses and other shareholder recordkeeping fees and expenses attributable to Class R5 and Class R6 are allocated to each share class based on relative net assets. Sub-accounting fees attributable to Class R5 are charged to the operations of the class. Transfer agency fees and expenses and other shareholder recordkeeping fees and expenses relating to all other classes are allocated among those classes based on relative net assets. All other expenses are allocated among the classes based on relative net assets. |
| G. | Accounting Estimates — The financial statements are prepared on a consolidated basis in conformity with accounting principles generally accepted in the United States of America (“GAAP”), which requires management to make estimates and assumptions that affect the reported amounts of assets and liabilities at the date of the financial statements and the reported amounts of revenues and expenses during the reporting period including estimates and assumptions related to taxation. Actual results could differ from those estimates by a significant amount. The accompanying financial statements reflect the financial position of the Fund and its Subsidiary and the results of operations on a consolidated basis. All inter-company accounts and transactions have been eliminated in consolidation. |
In addition, the Fund monitors for material events or transactions that may occur or become known after the period-end date and before the date the consolidated financial statements are released to print.
| H. | Indemnifications — Under the Trust’s organizational documents, each Trustee, officer, employee or other agent of the Trust, and under the Subsidiary’s organizational documents, the directors and officers of the Subsidiary, are indemnified against certain liabilities that may arise out of the performance of their duties to the Fund and/or the Subsidiary, respectively. Additionally, in the normal course of business, the Fund enters into contracts, including the Fund’s servicing agreements, that contain a variety of indemnification clauses. The Fund’s maximum exposure under these arrangements is unknown as this would involve future claims that may be made against the Fund that have not yet occurred. The risk of material loss as a result of such indemnification claims is considered remote. |
| I. | Foreign Currency Translations — Foreign currency is valued at the close of the NYSE based on quotations posted by banks and major currency dealers. Portfolio securities and other assets and liabilities denominated in foreign currencies are translated into U.S. dollar amounts at date of valuation. Purchases and sales of portfolio securities (net of foreign taxes withheld on disposition) and income items denominated in foreign currencies are translated into U.S. dollar amounts on the respective dates of such transactions. The Fund does not separately account for the portion of the results of operations resulting from changes in foreign exchange rates on investments and the fluctuations arising from changes in market prices of securities held. The combined results of changes in foreign exchange rates and the fluctuation of market prices on investments (net of estimated foreign tax withholding) are included with the net realized and unrealized gain or loss from investments in the Consolidated Statement of Operations. Reported net realized foreign currency gains or losses arise from (1) sales of foreign currencies, (2) currency gains or losses realized between the trade and settlement dates on securities transactions, and (3) the difference between the amounts of dividends, interest, and foreign withholding taxes recorded on the Fund’s books and the U.S. dollar equivalent of the amounts actually received or paid. Net unrealized foreign currency gains and losses arise from changes in the fair values of assets and liabilities, other than investments in securities at fiscal period end, resulting from changes in exchange rates. |
The Fund may invest in foreign securities, which may be subject to foreign taxes on income, gains on investments or currency repatriation, a portion of which may be recoverable. Foreign taxes, if any, are recorded based on the tax regulations and rates that exist in the foreign markets in which the Fund invests and are shown in the Consolidated Statement of Operations.
| J. | Forward Foreign Currency Contracts — The Fund may enter into forward foreign currency contracts to manage or minimize currency or exchange rate risk. The Fund may also enter into forward foreign currency contracts for the purchase or sale of a security denominated in a foreign currency in order to “lock in” the U.S. dollar price of that security. A forward foreign currency contract is an obligation to purchase or sell a specific currency for an agreed-upon price at a future date. The use of forward foreign currency contracts does not eliminate fluctuations in the price of the underlying securities the Fund owns or intends to acquire but establishes a rate of exchange in advance. Fluctuations in the value of these contracts are measured by the difference in the contract date and reporting date exchange rates and are recorded as unrealized appreciation (depreciation) until the contracts are closed. When the contracts are closed, realized gains (losses) are recorded. Realized and unrealized gains (losses) on the contracts are included in the Statement of Operations. The primary risks associated with forward foreign currency contracts include failure of the counterparty to meet the terms of the contract and the value of the foreign currency changing unfavorably. These risks may be in excess of the amounts reflected in the Statement of Assets and Liabilities. |
17 Invesco Global Markets Strategy Fund
| K. | Futures Contracts — The Fund may enter into futures contracts to manage exposure to interest rate, equity and market price movements and/or currency risks. A futures contract is an agreement between two parties (“Counterparties”) to purchase or sell a specified underlying security, currency or commodity (or delivery of a cash settlement price, in the case of an index future) for a fixed price at a future date. The Fund currently invests only in exchange-traded futures and they are standardized as to maturity date and underlying financial instrument. Initial margin deposits required upon entering into futures contracts are satisfied by the segregation of specific securities or cash as collateral at the futures commission merchant (broker). During the period the futures contracts are open, changes in the value of the contracts are recognized as unrealized gains or losses by recalculating the value of the contracts on a daily basis. Subsequent or variation margin payments are received or made depending upon whether unrealized gains or losses are incurred. These amounts are reflected as receivables or payables on the Consolidated Statement of Assets and Liabilities. When the contracts are closed or expire, the Fund recognizes a realized gain or loss equal to the difference between the proceeds from, or cost of, the closing transaction and the Fund’s basis in the contract. The net realized gain (loss) and the change in unrealized gain (loss) on futures contracts held during the period is included on the Consolidated Statement of Operations. The primary risks associated with futures contracts are market risk and the absence of a liquid secondary market. If the Fund were unable to liquidate a futures contract and/or enter into an offsetting closing transaction, the Fund would continue to be subject to market risk with respect to the value of the contracts and continue to be required to maintain the margin deposits on the futures contracts. Futures contracts have minimal Counterparty risk since the exchange’s clearinghouse, as Counterparty to all exchange-traded futures, guarantees the futures against default. Risks may exceed amounts recognized in the Consolidated Statement of Assets and Liabilities. |
| L. | Swap Agreements — The Fund may enter into various swap transactions, including interest rate, total return, index, currency and credit default swap contracts (“CDS”) for investment purposes or to manage interest rate, currency or credit risk. Such transactions are agreements between two parties. These agreements may contain among other conditions, events of default and termination events, and various covenants and representations such as provisions that require the Fund to maintain a pre-determined level of net assets, and/or provide limits regarding the decline of the Fund’s NAV over specific periods of time. If the Fund were to trigger such provisions and have open derivative positions at that time, the Counterparty may be able to terminate such agreement and request immediate payment in an amount equal to the net liability positions, if any. |
Interest rate, total return, index, and currency swap agreements are two-party contracts entered into primarily to exchange the returns (or differentials in rates of returns) earned or realized on particular predetermined investments or instruments. The gross returns to be exchanged or “swapped” between the parties are calculated with respect to a notional amount, i.e., the return on or increase in value of a particular dollar amount invested at a particular interest rate or return of an underlying asset, in a particular foreign currency, or in a “basket” of securities representing a particular index.
Changes in the value of swap agreements are recognized as unrealized gains (losses) in the Consolidated Statement of Operations by “marking to market” on a daily basis to reflect the value of the swap agreement at the end of each trading day. Payments received or paid at the beginning of the agreement are reflected as such on the Consolidated Statement of Assets and Liabilities and may be referred to as upfront payments. The Fund accrues for the fixed payment stream and amortizes upfront payments, if any, on swap agreements on a daily basis with the net amount, recorded as a component of realized gain (loss) on the Consolidated Statement of Operations. A liquidation payment received or made at the termination of a swap agreement is recorded as realized gain (loss) on the Consolidated Statement of Operations. The Fund segregates liquid securities having a value at least equal to the amount of the potential obligation of a Fund under any swap transaction. Entering into these agreements involves, to varying degrees, lack of liquidity and elements of credit, market, and Counterparty risk in excess of amounts recognized on the Consolidated Statement of Assets and Liabilities. Such risks involve the possibility that a swap is difficult to sell or liquidate; the Counterparty does not honor its obligations under the agreement and unfavorable interest rates and market fluctuations.
It is possible that developments in the swaps market, including potential government regulation, could adversely affect the Fund’s ability to terminate existing swap agreements or to realize amounts to be received under such agreements. A short position in a security possesses more risk than holding the same security long. As there is no limit on how much the price of the security can increase, the Fund’s exposure is unlimited.
| M. | Other Risks — The Fund will seek to gain exposure to commodity markets primarily through an investment in the Subsidiary and through investments in exchange traded funds and commodity-linked derivatives. The Subsidiary, unlike the Fund, may invest without limitation in commodities, commodity-linked derivatives and other securities, such as exchange traded notes, that may provide leverage and non-leveraged exposure to commodity markets. The Fund is indirectly exposed to the risks associated with the Subsidiary’s investments. |
The Fund is non-diversified and may invest in securities of fewer issuers than if it were diversified. Thus, the value of the Fund’s shares may vary more widely and the Fund may be subject to greater market and credit risk than if the Fund invested more broadly.
| N. | Leverage Risk — Leverage exists when a Fund can lose more than it originally invests because it purchases or sells an instrument or enters into a transaction without investing an amount equal to the full economic exposure of the instrument or transaction. |
| O. | Collateral — To the extent the Fund has designated or segregated a security as collateral and that security is subsequently sold, it is the Fund’s practice to replace such collateral no later than the next business day. |
NOTE 2—Advisory Fees and Other Fees Paid to Affiliates
The Trust has entered into a master investment advisory agreement with Invesco Advisers, Inc. (the “Adviser” or “Invesco”). Under the terms of the investment advisory agreement, the Fund pays an advisory fee to the Adviser less the amount paid by the Subsidiary to the Adviser based on the annual rate of the Fund’s average daily net assets as follows:
| | | | |
| Average Daily Net Assets | | Rate | |
First $10 billion | | | 1.50% | |
Over $10 billion | | | 1.25% | |
For the year ended October 31, 2014, the effective advisory fees incurred by the Fund was 1.50%.
The Subsidiary has entered into a separate contract with the Adviser whereby the Adviser provides investment advisory and other services to the Subsidiary. In consideration of these services, the Subsidiary pays an advisory fee to the Adviser based on the annual rate of the Subsidiary’s average daily net assets as set forth in the table above.
18 Invesco Global Markets Strategy Fund
Under the terms of a master sub-advisory agreement between the Adviser and each of Invesco Asset Management Deutschland GmbH, Invesco Asset Management Limited, Invesco Asset Management (Japan) Limited, Invesco Australia Limited, Invesco Hong Kong Limited, Invesco Senior Secured Management, Inc., Invesco Canada Ltd. and Invesco PowerShares Capital Management LLC (collectively, the “Affiliated Sub-Advisers”) the Adviser, not the Fund, may pay 40% of the fees paid to the Adviser to any such Affiliated Sub-Adviser(s) that provide(s) discretionary investment management services to the Fund based on the percentage of assets allocated to such Sub-Adviser(s).
Effective December 17, 2013, the Adviser has contractually agreed, through at least February 29, 2016, to waive advisory fees and/or reimburse expenses to the extent necessary to limit total annual fund operating expenses after fee waiver and/or expense reimbursement (excluding certain items discussed below) of Class A, Class C, Class R, Class Y, Class R5 and Class R6 shares to 1.80%, 2.55%, 2.05%, 1.55%, 1.55% and 1.55%, respectively, of average daily net assets. Prior to December 17, 2013, the Adviser had contractually agreed to waive advisory fees and/or reimburse expenses to the extent necessary to limit total annual fund operating expenses after fee waiver and/or expense reimbursement (excluding certain items discussed below) of Class A, Class C, Class R, Class Y, Class R5 and Class R6 shares to 2.25%, 3.00%, 2.50%, 2.00%, 2.00% and 2.00%, respectively, of average daily net assets. In determining the Adviser’s obligation to waive advisory fees and/or reimburse expenses, the following expenses are not taken into account, and could cause total annual fund operating expenses after fee waiver and/or expense reimbursement to exceed the numbers reflected above: (1) interest; (2) taxes; (3) dividend expense on short sales; (4) extraordinary or non-routine items, including litigation expenses; and (5) expenses that the Fund has incurred but did not actually pay because of an expense offset arrangement. Acquired Fund Fees and Expenses are not operating expenses of a Fund directly, but are fees and expenses, including management fees of the investment companies in which a Fund invests. As a result, the total annual fund operating expenses after expense reimbursement may exceed the expense limits above. Unless Invesco continues the fee waiver agreement, it will terminate on February 29, 2016. The fee waiver agreement cannot be terminated during its term.
Further, the Adviser has contractually agreed, through at least June 30, 2016, to waive the advisory fee payable by the Fund in an amount equal to 100% of the net advisory fees the Adviser receives from the affiliated money market funds on investments by the Fund of uninvested cash in such affiliated money market funds.
For the year ended October 31, 2014, the Adviser waived advisory fees of $353,869 and reimbursed class level expenses of $7,324, $12,659, $18 and $40,243 of Class A, Class C, Class R and Class Y shares, respectively.
The Trust has entered into a master administrative services agreement with Invesco pursuant to which the Fund has agreed to pay Invesco for certain administrative costs incurred in providing accounting services to the Fund. For the year ended October 31, 2014, expenses incurred under the agreement are shown in the Consolidated Statement of Operations as Administrative services fees.
The Trust has entered into a transfer agency and service agreement with Invesco Investment Services, Inc. (“IIS”) pursuant to which the Fund has agreed to pay IIS a fee for providing transfer agency and shareholder services to the Fund and reimburse IIS for certain expenses incurred by IIS in the course of providing such services. IIS may make payments to intermediaries that provide omnibus account services, sub-accounting services and/or networking services. All fees payable by IIS to intermediaries that provide omnibus account services or sub-accounting are charged back to the Fund, subject to certain limitations approved by the Trust’s Board of Trustees. For the year ended October 31, 2014, expenses incurred under the agreement are shown in the Consolidated Statement of Operations as Transfer agent fees.
The Trust has entered into master distribution agreements with Invesco Distributors, Inc. (“IDI”) to serve as the distributor for the Class A, Class C, Class R, Class Y, Class R5 and Class R6 shares of the Fund. The Trust has adopted plans pursuant to Rule 12b-1 under the 1940 Act with respect to the Fund’s Class A, Class C and Class R shares (collectively, the “Plans”). The Fund, pursuant to the Plans, pays IDI compensation at the annual rate of 0.25% of the Fund’s average daily net assets of Class A shares, 1.00% of the average daily net assets of Class C shares and 0.50% of the average daily net assets of Class R shares. Of the Plan payments, up to 0.25% of the average daily net assets of each class of shares may be paid to furnish continuing personal shareholder services to customers who purchase and own shares of such classes. Any amounts not paid as a service fee under the Plans would constitute an asset-based sales charge. Rules of the Financial Industry Regulatory Authority (“FINRA”) impose a cap on the total sales charges, including asset-based sales charges, that may be paid by any class of shares of the Fund. For the year ended October 31, 2014, expenses incurred under the Plans are shown in the Consolidated Statement of Operations as Distribution fees.
Front-end sales commissions and CDSC (collectively, the “sales charges”) are not recorded as expenses of the Fund. Front-end sales commissions are deducted from proceeds from the sales of Fund shares prior to investment in Class A shares of the Fund. CDSC are deducted from redemption proceeds prior to remittance to the shareholder. During the year ended October 31, 2014, IDI advised the Fund that IDI retained $3,334 in front-end sales commissions from the sale of Class A shares and $511 from Class C shares for CDSC imposed upon redemptions by shareholders.
Certain officers and trustees of the Trust are officers and directors of the Adviser, IIS and/or IDI.
NOTE 3—Additional Valuation Information
GAAP defines fair value as the price that would be received to sell an asset or paid to transfer a liability in an orderly transaction between market participants at the measurement date, under current market conditions. GAAP establishes a hierarchy that prioritizes the inputs to valuation methods, giving the highest priority to readily available unadjusted quoted prices in an active market for identical assets (Level 1) and the lowest priority to significant unobservable inputs (Level 3), generally when market prices are not readily available or are unreliable. Based on the valuation inputs, the securities or other investments are tiered into one of three levels. Changes in valuation methods may result in transfers in or out of an investment’s assigned level:
| | Level 1 — | Prices are determined using quoted prices in an active market for identical assets. |
| | Level 2 — | Prices are determined using other significant observable inputs. Observable inputs are inputs that other market participants may use in pricing a security. These may include quoted prices for similar securities, interest rates, prepayment speeds, credit risk, yield curves, loss severities, default rates, discount rates, volatilities and others. |
| | Level 3 — | Prices are determined using significant unobservable inputs. In situations where quoted prices or observable inputs are unavailable (for example, when there is little or no market activity for an investment at the end of the period), unobservable inputs may be used. Unobservable inputs reflect the Fund’s own assumptions about the factors market participants would use in determining fair value of the securities or instruments and would be based on the best available information. |
19 Invesco Global Markets Strategy Fund
The following is a summary of the tiered valuation input levels, as of October 31, 2014. The level assigned to the securities valuations may not be an indication of the risk or liquidity associated with investing in those securities. Because of the inherent uncertainties of valuation, the values reflected in the financial statements may materially differ from the value received upon actual sale of those investments.
| | | | | | | | | | | | | | | | |
| | | Level 1 | | | Level 2 | | | Level 3 | | | Total | |
Money Market Funds | | $ | 106,580,295 | | | $ | — | | | $ | — | | | $ | 106,580,295 | |
U.S. Treasury Securities | | | — | | | | 60,432,548 | | | | — | | | | 60,432,548 | |
| | | | 106,580,295 | | | | 60,432,548 | | | | — | | | | 167,012,843 | |
Futures Contracts* | | | 2,673,508 | | | | — | | | | — | | | | 2,673,508 | |
Swap Agreements* | | | — | | | | (167,183 | ) | | | — | | | | (167,183 | ) |
Total Investments | | $ | 109,253,803 | | | $ | 60,265,365 | | | $ | — | | | $ | 169,519,168 | |
| * | Unrealized appreciation (depreciation). |
NOTE 4—Derivative Investments
Value of Derivative Investments at Period-End
The table below summarizes the value of the Fund’s derivative investments, detailed by primary risk exposure, held as of October 31, 2014:
| | | | | | | | |
| | | Value | |
| Risk Exposure/Derivative Type | | Assets | | | Liabilities | |
Commodity risk | | | | | | | | |
Futures contracts(a) | | $ | 1,375,961 | | | $ | (384,100 | ) |
Swap agreements(b) | | | 172,275 | | | | (600,612 | ) |
Interest rate risk: | | | | | | | | |
Futures contracts(a) | | | 1,974,362 | | | | — | |
Swap agreements(b) | | | 261,154 | | | | — | |
Market risk: | | | | | | | | |
Futures contracts(a) | | | 246,040 | | | | (538,755 | ) |
Total | | $ | 4,029,792 | | | $ | (1,523,467 | ) |
| (a) | Includes cumulative appreciation (depreciation) of futures contracts. Only current day’s variation margin receivable is reported within the Consolidated Statement of Assets and Liabilities. |
| (b) | Values are disclosed on the Consolidated Statement of Assets and Liabilities under the captions Unrealized appreciation on swap agreements — OTC and Unrealized depreciation on swap agreements — OTC. |
Effect of Derivative Investments for the year ended October 31, 2014
The table below summarizes the gains (losses) on derivative investments, detailed by primary risk exposure, recognized in earnings during the period:
| | | | | | | | |
| | | Location of Gain (Loss) on
Consolidated Statement of Operations | |
| | | Futures
Contracts | | | Swap
Agreements | |
Realized Gain (Loss): | | | | | | | | |
Commodity risk | | $ | (4,278,156 | ) | | $ | (2,837,351 | ) |
Interest rate risk | | | 8,534,223 | | | | 1,776,002 | |
Market risk | | | (432,336 | ) | | | — | |
Change in Unrealized Appreciation (Depreciation): | | | | | | | | |
Commodity risk | | | 1,109,547 | | | | (413,626 | ) |
Interest rate risk | | | 710,276 | | | | 254,995 | |
Market risk | | | (2,442,400 | ) | | | — | |
Total | | $ | 3,201,154 | | | $ | (1,219,980 | ) |
The table below summarizes the average notional value of futures contracts and swap agreements outstanding during the period.
| | | | | | | | |
| | | Futures
Contracts | | | Swap
Agreements | |
Average notional value | | $ | 216,586,175 | | | $ | 41,671,206 | |
Offsetting Assets and Liabilities
Accounting Standards Update (“ASU”) No. 2011-11, Disclosures about Offsetting Assets and Liabilities, which was subsequently clarified in Financial Accounting Standards Board ASU 2013-01 “Clarifying the Scope of Disclosures about Offsetting Assets and Liabilities” is intended to enhance disclosures about financial instruments and derivative instruments that are subject to offsetting arrangements on the Consolidated Statement of Assets and Liabilities and to enable investors to better understand the effect of those arrangements on its financial position. In order for an
20 Invesco Global Markets Strategy Fund
arrangement to be eligible for netting, the Fund must have a basis to conclude that such netting arrangements are legally enforceable. The Fund enters into netting agreements and collateral agreements in an attempt to reduce the Fund’s Counterparty credit risk by providing for a single net settlement with a Counterparty of all financial transactions covered by the agreement in an event of default as defined under such agreement.
There were no derivative instruments subject to a netting agreement for which the Fund is not currently netting. The following tables present derivative instruments that are either subject to an enforceable netting agreement or offset by collateral arrangements as of October 31, 2014.
| | | | | | | | | | | | | | | | | | | | | | | | |
| Assets: | | | | | | | | | | | | | | | | | | |
| | | Gross amounts
presented in
Consolidated
Statement of
Assets & Liabilities | | | Gross amounts
offset in
Consolidated
Statement of
Assets & Liabilities | | | Net amounts of assets
presented in
Consolidated
Statement of Assets
and Liabilities | | | Collateral Received | | | | |
| Counterparty | | | | | Financial
Instruments | | | Cash | | | Net
Amount | |
| Fund | | | | | | | | | | | | | | | | | | |
Bank of America Merrill Lynch | | $ | 2,232 | | | $ | — | | | $ | 2,232 | | | $ | — | | | $ | — | | | $ | 2,232 | |
Goldman Sachs International | | | 258,922 | | | | — | | | | 258,922 | | | | — | | | | — | | | | 258,922 | |
Subtotal — Fund | | $ | 261,154 | | | $ | — | | | $ | 261,154 | | | $ | — | | | $ | — | | | $ | 261,154 | |
| | | | | | |
| Subsidiary | | | | | | | | | | | | | | | | | | |
Bank of America Securities LLC | | $ | 426 | | | $ | — | | | $ | 426 | | | $ | — | | | $ | — | | | $ | 426 | |
Barclays Bank PLC | | | 51,164 | | | | (51,164 | ) | | | — | | | | — | | | | — | | | | — | |
Goldman Sachs International | | | 70,910 | | | | — | | | | 70,910 | | | | — | | | | — | | | | 70,910 | |
JPMorgan Chase Bank, N.A. | | | 122,384 | | | | — | | | | 122,384 | | | | — | | | | — | | | | 122,384 | |
Merrill Lynch International | | | 31,251 | | | | — | | | | 31,251 | | | | — | | | | — | | | | 31,251 | |
Subtotal — Subsidiary | | $ | 276,135 | | | $ | (51,164 | ) | | $ | 224,971 | | | $ | — | | | $ | — | | | $ | 224,971 | |
Total | | $ | 537,289 | | | $ | (51,164 | ) | | $ | 486,125 | | | $ | — | | | $ | — | | | $ | 486,125 | |
| | | | | | |
| | | | | | | | | | | | | | | | | | | | | | | | |
| Liabilities: | | | | | | | | | | | | | | | | | | |
| | | Gross amounts
presented in
Consolidated
Statement of
Assets & Liabilities | | | Gross amounts
offset in
Consolidated
Statement of
Assets & Liabilities | | | Net amounts of liabilities
presented in
Consolidated
Statement of Assets
and Liabilities | | | Collateral Pledged | | | | |
| Counterparty | | | | | Financial
Instruments | | | Cash | | | Net
Amount | |
| Subsidiary | | | | | | | | | | | | | | | | | | |
Barclays Bank PLC. | | $ | 244,046 | | | $ | (51,164 | ) | | $ | 192,882 | | | $ | (192,882 | ) | | $ | — | | | $ | — | |
Morgan Stanley Capital Services LLC | | | 356,566 | | | | — | | | | 356,566 | | | | (330,098 | ) | | | — | | | | 26,468 | |
Total | | $ | 600,612 | | | $ | (51,164 | ) | | $ | 549,448 | | | $ | (522,980 | ) | | $ | — | | | $ | 26,468 | |
NOTE 5—Subsidiary Information
The Fund’s Consolidated Schedule of Investments includes the holdings, including any investments in derivatives, of both the Fund and the Subsidiary. The Fund’s Consolidated Statement of Assets and Liabilities, Consolidated Statement of Operations and Consolidated Statement of Changes in Net Assets include the account balances of both the Fund and the Subsidiary and all interfund transactions have been eliminated.
The table below summarizes the financial information of the Subsidiary recognized in the consolidated financial statements referred to above.
| | | | |
| Selected Financial Information | | Invesco Cayman
Commodity Fund V Ltd.
(the “Subsidiary”) | |
Total assets | | $ | 40,623,901 | |
Total liabilities | | | 602,654 | |
Net assets | | | 40,021,247 | |
Total investment income | | | 13,463 | |
Net investment income (loss) | | | (573,095 | ) |
Net realized gain (loss) from: | | | | |
Investment securities | | | 27 | |
Futures contracts | | | (4,278,156 | ) |
Swap agreements | | | (2,837,351 | ) |
Change in net unrealized appreciation (depreciation) of: | | | | |
Investment securities | | | 773 | |
Futures contracts | | | 1,109,546 | |
Swap agreements | | | (413,626 | ) |
Increase (decrease) in net assets resulting from operations | | $ | (6,991,882 | ) |
21 Invesco Global Markets Strategy Fund
NOTE 6—Trustees’ and Officers’ Fees and Benefits
Trustees’ and Officers’ Fees and Benefits include amounts accrued by the Fund to pay remuneration to certain Trustees and Officers of the Fund. Trustees have the option to defer compensation payable by the Fund, and Trustees’ and Officers’ Fees and Benefits also include amounts accrued by the Fund to fund such deferred compensation amounts. Those Trustees who defer compensation have the option to select various Invesco Funds in which their deferral accounts shall be deemed to be invested. Finally, certain current Trustees were eligible to participate in a retirement plan that provided for benefits to be paid upon retirement to Trustees over a period of time based on the number of years of service. The Fund may have certain former Trustees who also participate in a retirement plan and receive benefits under such plan. Trustees’ and Officers’ Fees and Benefits include amounts accrued by the Fund to fund such retirement benefits. Obligations under the deferred compensation and retirement plans represent unsecured claims against the general assets of the Fund.
NOTE 7—Cash Balances
The Fund is permitted to temporarily carry a negative or overdrawn balance in its account with State Street Bank and Trust Company, the custodian bank. Such balances, if any at period end, are shown in the Consolidated Statement of Assets and Liabilities under the payable caption Amount due custodian. To compensate the custodian bank for such overdrafts, the overdrawn Fund may either (1) leave funds as a compensating balance in the account so the custodian bank can be compensated by earning the additional interest; or (2) compensate by paying the custodian bank at a rate agreed upon by the custodian bank and Invesco, not to exceed the contractually agreed upon rate.
NOTE 8—Distributions to Shareholders and Tax Components of Net Assets
Tax Character of Distributions to Shareholders Paid During the Fiscal Years Ended October 31, 2014 and 2013:
| | | | | | | | |
| | | 2014 | | | 2013 | |
Ordinary income | | $ | 3,950,918 | | | $ | — | |
Long-term capital gain | | | 3,901,282 | | | | — | |
Total distributions | | $ | 7,852,200 | | | $ | — | |
Tax Components of Net Assets at Period-End:
| | | | |
| | | 2014 | |
Undistributed ordinary income | | $ | 3,825,798 | |
Undistributed long-term gain | | | 2,108,499 | |
Net unrealized appreciation — investments | | | 8,688 | |
Net unrealized appreciation — other investments | | | 1,207,800 | |
Temporary book/tax differences | | | (9,159 | ) |
Shares of beneficial interest | | | 160,687,956 | |
Total net assets | | $ | 167,829,582 | |
The temporary book/tax differences are a result of timing differences between book and tax recognition of income and/or expenses. The Fund’s temporary book/tax differences are the result of the trustee deferral of compensation and retirement plan benefits.
Capital loss carryforward is calculated and reported as of a specific date. Results of transactions and other activity after that date may affect the amount of capital loss carryforward actually available for the Fund to utilize. Capital losses generated in years beginning after December 22, 2010 can be carried forward for an unlimited period, whereas previous losses expire in 8 tax years. Capital losses with an expiration period may not be used to offset capital gains until all net capital losses without an expiration date have been utilized. Capital loss carryforwards with no expiration date will retain their character as either short-term or long-term capital losses instead of as short-term capital losses as under prior law. The ability to utilize capital loss carryforwards in the future may be limited under the Internal Revenue Code and related regulations based on the results of future transactions.
The Fund does not have a capital loss carryforward as of October 31, 2014.
NOTE 9—Investment Securities
The aggregate amount of long-term U.S. government obligations (other than short-term securities and money market funds, if any) purchased and sold by the Fund during the year ended October 31, 2014 was $28,398,165 and $0, respectively. Cost of investments on a tax basis includes the adjustments for financial reporting purposes as of the most recently completed federal income tax reporting period-end.
| | | | |
| Unrealized Appreciation (Depreciation) of Investment Securities on a Tax Basis | |
Aggregate unrealized appreciation of investment securities | | $ | 8,688 | |
Aggregate unrealized (depreciation) of investment securities | | | — | |
Net unrealized appreciation of investment securities | | $ | 8,688 | |
Cost of investments is the same for tax and financial reporting purposes.
22 Invesco Global Markets Strategy Fund
NOTE 10—Reclassification of Permanent Differences
Primarily as a result of differing book/tax treatment of futures contracts, swap agreement income and capital gains, net operating losses and net investment losses from the Subsidiary, on October 31, 2014, undistributed net investment income (loss) was increased by $5,817,573, undistributed net realized gain was increased by $1,124,646 and shares of beneficial interest was decreased by $6,942,219. This reclassification had no effect on the net assets of the Fund.
NOTE 11—Share Information
| | | | | | | | | | | | | | | | |
| | | Summary of Share Activity | |
| | | Years ended October 31, | |
| | | 2014(a) | | | 2013 | |
| | | Shares | | | Amount | | | Shares | | | Amount | |
Sold: | | | | | | | | | | | | | | | | |
Class A(b) | | | 1,164,747 | | | $ | 11,592,503 | | | | 57,485 | | | $ | 611,943 | |
Class C(b) | | | 1,937,959 | | | | 19,362,646 | | | | 76,472 | | | | 815,862 | |
Class R(b) | | | 1,458 | | | | 14,508 | | | | 952 | | | | 10,000 | |
Class Y | | | 6,604,938 | | | | 66,179,795 | | | | 10,745,861 | | | | 112,322,951 | |
Class R5(b) | | | — | | | | — | | | | 952 | | | | 10,000 | |
Class R6(b) | | | 1,088,964 | | | | 10,710,094 | | | | 10,259,039 | | | | 108,224,882 | |
| |
Issued as reinvestment of dividends: | | | | | |
Class A | | | 9,489 | | | | 93,564 | | | | — | | | | — | |
Class C | | | 14,309 | | | | 140,802 | | | | — | | | | — | |
Class Y | | | 69,846 | | | | 689,379 | | | | — | | | | — | |
Class R6 | | | 701,303 | | | | 6,921,859 | | | | — | | | | — | |
| |
Reacquired: | | | | | |
Class A | | | (532,075 | ) | | | (5,297,382 | ) | | | (1,208 | ) | | | (13,027 | ) |
Class C | | | (806,676 | ) | | | (7,922,243 | ) | | | (562 | ) | | | (6,020 | ) |
Class Y | | | (3,675,067 | ) | | | (36,192,313 | ) | | | (11,110,720 | ) | | | (116,988,691 | ) |
Class R6 | | | (819,568 | ) | | | (8,252,157 | ) | | | (85,084 | ) | | | (898,379 | ) |
Net increase in share activity | | | 5,759,627 | | | $ | 58,041,055 | | | | 9,943,187 | | | $ | 104,089,521 | |
| (a) | There are entities that are record owners of more than 5% of the outstanding shares of the Fund and in the aggregate own 21% of the outstanding shares of the Fund. IDI has an agreement with these entities to sell Fund shares. The Fund, Invesco and/or Invesco affiliates may make payments to these entities, which is considered to be related to the Fund, for providing services to the Fund, Invesco and/or Invesco affiliates including but not limited to services such as, securities brokerage, distribution, third party record keeping and account servicing. The Fund has no knowledge as to whether all or any portion of the shares owned of record by this entity is also owned beneficially. |
| In | addition, 68% of the outstanding shares of the Fund are owned by affiliated mutual funds. Affiliated mutual funds are mutual funds that are advised by Invesco. |
| (b) | Commencement date of August 28, 2013. |
23 Invesco Global Markets Strategy Fund
NOTE 12—Consolidated Financial Highlights
The following schedule presents financial highlights for a share of the Fund outstanding throughout the periods indicated.
| | | | | | | | | | | | | | | | | | | | | | | | | | | | | | | | | | | | | | | | | | | | | | | | |
| | | Net asset
value,
beginning
of period | | | Net
investment
income
(loss)(a) | | | Net gains
(losses)
on securities
(both
realized and
unrealized) | | | Total from
investment
operations | | | Distributions
from net
realized
gains | | | Net asset
value, end
of period | | | Total
return(b) | | | Net assets,
end of period
(000’s omitted) | | | Ratio of
expenses
to average
net assets
with fee waivers
and/or expenses
absorbed | | | Ratio of
expenses
to average net
assets without
fee waivers
and/or expenses
absorbed | | | Ratio of net
investment
income (loss)
to average
net assets | | | Portfolio
turnover(c) | |
Class A | | | | | | | | | | | | | | | | | | | | | | | | | | | | | | | | | | | | | | | | | | | | | | | | |
Year ended 10/31/14 | | $ | 10.78 | | | $ | (0.17 | ) | | $ | 0.09 | | | $ | (0.08 | ) | | $ | (0.68 | ) | | $ | 10.02 | | | | (0.64 | )% | | $ | 6,996 | | | | 1.73 | %(d) | | | 2.06 | %(d) | | | (1.68 | )%(d) | | | 0 | % |
Year ended 10/31/13(e) | | | 10.52 | | | | (0.04 | ) | | | 0.30 | | | | 0.26 | | | | — | | | | 10.78 | | | | 2.47 | | | | 607 | | | | 1.99 | (f) | | | 2.04 | (f) | | | (1.92 | )(f) | | | 0 | |
Class C | | | | | | | | | | | | | | | | | | | | | | | | | | | | | | | | | | | | | | | | | | | | | | | | |
Year ended 10/31/14 | | | 10.78 | | | | (0.24 | ) | | | 0.08 | | | | (0.16 | ) | | | (0.68 | ) | | | 9.94 | | | | (1.42 | ) | | | 12,136 | | | | 2.48 | (d) | | | 2.81 | (d) | | | (2.43 | )(d) | | | 0 | |
Year ended 10/31/13(e) | | | 10.52 | | | | (0.05 | ) | | | 0.31 | | | | 0.26 | | | | — | | | | 10.78 | | | | 2.47 | | | | 818 | | | | 2.74 | (f) | | | 2.79 | (f) | | | (2.67 | )(f) | | | 0 | |
Class R | | | | | | | | | | | | | | | | | | | | | | | | | | | | | | | | | | | | | | | | | | | | | | | | |
Year ended 10/31/14 | | | 10.78 | | | | (0.19 | ) | | | 0.09 | | | | (0.10 | ) | | | (0.68 | ) | | | 10.00 | | | | (0.83 | ) | | | 24 | | | | 1.98 | (d) | | | 2.31 | (d) | | | (1.93 | )(d) | | | 0 | |
Year ended 10/31/13(e) | | | 10.52 | | | | (0.04 | ) | | | 0.30 | | | | 0.26 | | | | — | | | | 10.78 | | | | 2.47 | | | | 10 | | | | 2.24 | (f) | | | 2.29 | (f) | | | (2.17 | )(f) | | | 0 | |
Class Y | | | | | | | | | | | | | | | | | | | | | | | | | | | | | | | | | | | | | | | | | | | | | | | | |
Year ended 10/31/14 | | | 10.79 | | | | (0.14 | ) | | | 0.08 | | | | (0.06 | ) | | | (0.68 | ) | | | 10.05 | | | | (0.44 | ) | | | 36,645 | | | | 1.48 | (d) | | | 1.81 | (d) | | | (1.43 | )(d) | | | 0 | |
Year ended 10/31/13 | | | 9.91 | | | | (0.19 | ) | | | 1.07 | | | | 0.88 | | | | — | | | | 10.79 | | | | 8.88 | | | | 6,972 | | | | 1.82 | | | | 1.87 | | | | (1.75 | ) | | | 0 | |
Year ended 10/31/12(e) | | | 10.00 | | | | (0.02 | ) | | | (0.07 | ) | | | (0.09 | ) | | | — | | | | 9.91 | | | | (0.90 | ) | | | 10,017 | | | | 2.00 | (f) | | | 6.69 | (f) | | | (1.87 | )(f) | | | 0 | |
Class R5 | | | | | | | | | | | | | | | | | | | | | | | | | | | | | | | | | | | | | | | | | | | | | | | | |
Year ended 10/31/14 | | | 10.79 | | | | (0.14 | ) | | | 0.09 | | | | (0.05 | ) | | | (0.68 | ) | | | 10.06 | | | | (0.34 | ) | | | 10 | | | | 1.48 | (d) | | | 1.69 | (d) | | | (1.43 | )(d) | | | 0 | |
Year ended 10/31/13(e) | | | 10.52 | | | | (0.03 | ) | | | 0.30 | | | | 0.27 | | | | — | | | | 10.79 | | | | 2.57 | | | | 10 | | | | 1.75 | (f) | | | 1.80 | (f) | | | (1.68 | )(f) | | | 0 | |
Class R6 | | | | | | | | | | | | | | | | | | | | | | | | | | | | | | | | | | | | | | | | | | | | | | | | |
Year ended 10/31/14 | | | 10.80 | | | | (0.14 | ) | | | 0.07 | | | | (0.07 | ) | | | (0.68 | ) | | | 10.05 | | | | (0.53 | ) | | | 112,019 | | | | 1.48 | (d) | | | 1.69 | (d) | | | (1.43 | )(d) | | | 0 | |
Year ended 10/31/13(e) | | | 10.52 | | | | (0.03 | ) | | | 0.31 | | | | 0.28 | | | | — | | | | 10.80 | | | | 2.66 | | | | 109,848 | | | | 1.71 | (f) | | | 1.76 | (f) | | | (1.64 | )(f) | | | 0 | |
| (a) | Calculated using average shares outstanding. |
| (b) | Includes adjustments in accordance with accounting principles generally accepted in the United States of America and as such, the net asset value for financial reporting purposes and the returns based upon those net asset values may differ from the net asset value and returns for shareholder transactions. Does not include sales charges and is not annualized for periods less than one year, if applicable. |
| (c) | Portfolio turnover is calculated at the fund level and is not annualized for periods less than one year, if applicable. |
| (d) | Ratios are based on average daily net assets (000’s omitted) of $6,545, $11,313, $16, $35,962, $10 and $111,798 for Class A, Class C, Class R, Class Y, Class R5 and Class R6 shares, respectively. |
| (e) | Commencement date of September 26, 2012 for Class Y shares and August 28, 2013 for Class A, Class C, Class R, Class R5 and Class R6 shares, respectively. |
24 Invesco Global Markets Strategy Fund
Report of Independent Registered Public Accounting Firm
To the Board of Trustees of AIM Investment Funds (Invesco Investment Funds)
and Shareholders of Invesco Global Markets Strategy Fund:
In our opinion, the accompanying consolidated statement of assets and liabilities, including the consolidated schedule of investments, and the related consolidated statements of operations and of changes in net assets and the financial highlights present fairly, in all material respects, the consolidated financial position of Invesco Global Markets Strategy Fund (one of the funds constituting AIM Investment Funds (Invesco Investment Funds), hereafter referred to as the “Fund”) at October 31, 2014, the results of its operations for the year then ended, the changes in its net assets for each of the two years in the period then ended and the financial highlights for each of the two years then ended and for the period September 26, 2012 (commencement of operations) through October 31, 2012, in conformity with accounting principles generally accepted in the United States of America. These consolidated financial statements and financial highlights (hereafter referred to as “financial statements”) are the responsibility of the Fund’s management. Our responsibility is to express an opinion on these financial statements based on our audits. We conducted our audits of these financial statements in accordance with the standards of the Public Company Accounting Oversight Board (United States). Those standards require that we plan and perform the audit to obtain reasonable assurance about whether the financial statements are free of material misstatement. An audit includes examining, on a test basis, evidence supporting the amounts and disclosures in the financial statements, assessing the accounting principles used and significant estimates made by management, and evaluating the overall financial statement presentation. We believe that our audits, which included confirmation of securities at October 31, 2014 by correspondence with the custodian and brokers, and the application of alternative auditing procedures where confirmations of security purchases have not been received, provide a reasonable basis for our opinion.
PRICEWATERHOUSECOOPERS LLP
December 29, 2014
Houston, Texas
25 Invesco Global Markets Strategy Fund
Calculating your ongoing Fund expenses
Example
As a shareholder of the Fund, you incur two types of costs: (1) transaction costs, which may include sales charges (loads) on purchase payments or contingent deferred sales charges on redemptions, if any; and (2) ongoing costs, including management fees, distribution and/or service (12b-1) fees, and other Fund expenses. This example is intended to help you understand your ongoing costs (in dollars) of investing in the Fund and to compare these costs with ongoing costs of investing in other mutual funds. The example is based on an investment of $1,000 invested at the beginning of the period and held for the entire period May 1, 2014 through October 31, 2014.
Actual expenses
The table below provides information about actual account values and actual expenses. You may use the information in this table, together with the amount you invested, to estimate the expenses that you paid over the period. Simply divide your account value by $1,000 (for example, an $8,600 account value divided by $1,000 = 8.6), then multiply the result by the number in the table under the heading entitled “Actual Expenses Paid During Period” to estimate the expenses you paid on your account during this period.
Hypothetical example for comparison purposes
The table below also provides information about hypothetical account values and hypothetical expenses based on the Fund’s actual expense ratio and an assumed rate of return of 5% per year before expenses, which is not the Fund’s actual return.
The hypothetical account values and expenses may not be used to estimate the actual ending account balance or expenses you paid for the period. You may use this information to compare the ongoing costs of investing in the Fund and other funds. To do so, compare this 5% hypothetical example with the 5% hypothetical examples that appear in the shareholder reports of the other funds.
Please note that the expenses shown in the table are meant to highlight your ongoing costs only and do not reflect any transaction costs, such as sales charges (loads) on purchase payments or contingent deferred sales charges on redemptions, if any. Therefore, the hypothetical information is useful in comparing ongoing costs only, and will not help you determine the relative total costs of owning different funds. In addition, if these transaction costs were included, your costs would have been higher.
| | | | | | | | | | | | | | | | | | | | | | | | |
| Class | | Beginning
Account Value
(05/01/14) | | | ACTUAL | | | HYPOTHETICAL
(5% annual return before
expenses) | | | Annualized
Expense
Ratio | |
| | | Ending
Account Value
(10/31/14)1 | | | Expenses
Paid During
Period2 | | | Ending
Account Value
(10/31/14) | | | Expenses
Paid During
Period2 | | |
| A | | $ | 1,000.00 | | | $ | 1,021.40 | | | $ | 8.66 | | | $ | 1,016.64 | | | $ | 8.64 | | | | 1.70 | % |
| C | | | 1,000.00 | | | | 1,017.40 | | | | 12.46 | | | | 1,012.85 | | | | 12.43 | | | | 2.45 | |
| R | | | 1,000.00 | | | | 1,019.40 | | | | 9.93 | | | | 1,015.38 | | | | 9.91 | | | | 1.95 | |
| Y | | | 1,000.00 | | | | 1,022.40 | | | | 7.39 | | | | 1,017.90 | | | | 7.38 | | | | 1.45 | |
| R5 | | | 1,000.00 | | | | 1,022.40 | | | | 7.39 | | | | 1,017.90 | | | | 7.38 | | | | 1.45 | |
| R6 | | | 1,000.00 | | | | 1,022.40 | | | | 7.39 | | | | 1,017.90 | | | | 7.38 | | | | 1.45 | |
| 1 | The actual ending account value is based on the actual total return of the Fund for the period May 1, 2014 through October 31, 2014, after actual expenses and will differ from the hypothetical ending account value which is based on the Fund’s expense ratio and a hypothetical annual return of 5% before expenses. |
| 2 | Expenses are equal to the Fund’s annualized expense ratio as indicated above multiplied by the average account value over the period, multiplied by 184/365 to reflect the most recent fiscal half year. |
26 Invesco Global Markets Strategy Fund
Approval of Investment Advisory and Sub-Advisory Contracts
The Board of Trustees (the Board) of AIM Investment Funds (Invesco Investment Funds) is required under the Investment Company Act of 1940, as amended, to approve annually the renewal of Invesco Global Markets Strategy Fund’s (the Fund) investment advisory agreements. During contract renewal meetings held on June 16-17, 2014, the Board as a whole, and the disinterested or “independent” Trustees, who comprise over 75% of the Board, voting separately, approved the continuance for the Fund of the Master Investment Advisory Agreement with Invesco Advisers, Inc. (Invesco Advisers and the investment advisory agreement) and the Master Intergroup Sub-Advisory Contract for Mutual Funds with Invesco Asset Management Deutschland GmbH, Invesco Asset Management Limited, Invesco Asset Management (Japan) Limited, Invesco Australia Limited, Invesco Hong Kong Limited, Invesco Senior Secured Management, Inc., Invesco Canada Ltd. and Invesco PowerShares Capital Management LLC (collectively, the Affiliated Sub-Advisers and the sub-advisory contracts) for another year, effective July 1, 2014.
In evaluating the fairness and reasonableness of compensation under the Fund’s investment advisory agreement and sub-advisory contracts, the Board considered, among other things, the factors discussed below. The Board determined that continuation of the Fund’s investment advisory agreement and the sub-advisory contracts are in the best interest of the Fund and its shareholders and that the compensation payable to Invesco Advisers and the Affiliated Sub-Advisers under the agreements is fair and reasonable.
The Board’s Fund Evaluation Process
The Board’s Investments Committee has established three Sub-Committees, each of which is primarily responsible for overseeing the management of a number of the funds advised by Invesco Advisers (the Invesco Funds). The Sub-Committees meet throughout the year to review the performance of their assigned Invesco Funds, including reviewing materials prepared under the direction of the independent Senior Officer, an officer of the Invesco Funds who reports directly to the independent Trustees. Over the course of each year, the Sub-Committees meet with portfolio managers for their assigned Invesco Funds and other members of management to review the performance, investment objective(s), policies, strategies, limitations and investment risks of these funds. The Sub-Committees meet regularly and at designated contract renewal meetings each year to conduct a review of the performance, fees, expenses and other matters related to their assigned Invesco Funds. Each Sub-Committee recommends to the Investments Committee, which in turn recommends to the
full Board, whether and on what terms to approve the continuance of each Invesco Fund’s investment advisory agreement and sub-advisory contracts for another year.
During the contract renewal process, the Trustees receive comparative performance and fee data regarding the Invesco Funds prepared by Invesco Advisers and Lipper Inc. (Lipper), an independent provider of investment company data. The Trustees also receive an independent written evaluation from the Senior Officer. The Senior Officer’s evaluation is prepared as part of his responsibility to manage the process by which the Invesco Funds’ proposed management fees are negotiated during the annual contract renewal process to ensure they are negotiated in a manner that is at arms’ length and reasonable. In addition to meetings with Invesco Advisers and fund counsel, the independent Trustees also discuss the continuance of the investment advisory agreement and sub-advisory contracts in separate sessions with the Senior Officer and with independent legal counsel.
The Trustees recognized that the advisory fee rates for the Invesco Funds are, in many cases, the result of years of review and negotiation. The Trustees’ deliberations and conclusions in a particular year may be based in part on their deliberations and conclusions regarding these same arrangements throughout the year and in prior years. The Trustees’ review and conclusions are based on the comprehensive consideration of all information presented to them and are not the result of any single determinative factor. Moreover, one Trustee may have weighed a particular piece of information or factor differently than another Trustee.
The discussion below serves as the Senior Officer’s independent written evaluation with respect to the Fund’s investment advisory agreement as well as a discussion of the material factors and related conclusions that formed the basis for the Board’s approval of the Fund’s investment advisory agreement and sub-advisory contracts. Unless otherwise stated, this information is current as of June 17, 2014, and may not reflect consideration of factors that became known to the Board after that date.
Factors and Conclusions and Summary of Independent Written Fee Evaluation
| A. | Nature, Extent and Quality of Services Provided by Invesco Advisers and the Affiliated Sub-Advisers |
The Board reviewed the advisory services provided to the Fund by Invesco Advisers under the Fund’s investment advisory agreement, the performance of Invesco Advisers in providing these services, and the credentials and experience of the officers and employees of Invesco Advisers who provide these services,
including the Fund’s portfolio manager or managers, with whom the Sub-Committees met during the year. The Board’s review of the qualifications of Invesco Advisers to provide advisory services included the Board’s consideration of Invesco Advisers’ investment process oversight, independent credit analysis and investment risk management. The Board also considered non-advisory services that Invesco Advisers and its affiliates provide to the Invesco Funds such as various back office support functions, equity and fixed income trading operations, internal audit, distribution and legal and compliance.
In determining whether to continue the Fund’s investment advisory agreement, the Board considered the benefits of reapproving an existing relationship and the greater uncertainty that may be associated with entering into a new relationship. The Board concluded that the nature, extent and quality of the services provided to the Fund by Invesco Advisers are appropriate and satisfactory and consistent with the terms of the Fund’s investment advisory agreement.
The Board reviewed the services that may be provided by the Affiliated Sub-Advisers under the sub-advisory contracts and the credentials and experience of the officers and employees of the Affiliated Sub-Advisers who provide these services. The Board noted that the Affiliated Sub-Advisers have offices and personnel that are located in financial centers around the world. As a result, the Affiliated Sub-Advisers can provide research and investment analysis on the markets and economies of various countries in which the Fund may invest, make recommendations regarding securities and assist with security trades. The Board concluded that the sub-advisory contracts benefit the Fund and its shareholders by permitting Invesco Advisers to use the resources and talents of the Affiliated Sub-Advisers in managing the Fund. The Board concluded that the nature, extent and quality of the services that may be provided by the Affiliated Sub-Advisers are appropriate and satisfactory and consistent with the terms of the Fund’s sub-advisory contracts.
The Board considered Fund performance as a relevant factor in considering whether to approve the investment advisory agreement. The Board did not view Fund performance as a relevant factor in considering whether to approve the sub-advisory contracts for the Fund, as no Affiliated Sub-Adviser currently manages assets of the Fund.
The Board noted that the Fund recently began operations and that comparative performance data for only the past calendar year was available. The Board compared the Fund’s performance during the past calendar year to the performance of funds in the Lipper
27 Invesco Global Markets Strategy Fund
performance universe and against the Lipper Absolute Return Funds Index. The Board noted that performance of Class Y shares of the Fund was in the second quintile of its performance universe for the one year period (the first quintile being the best performing funds and the fifth quintile being the worst performing funds). The Board noted that the Fund’s performance was above the performance of the Index for the one year period. The Trustees also reviewed more recent Fund performance and this review did not change their conclusions.
| C. | Advisory and Sub-Advisory Fees |
The Board compared the Fund’s contractual management fee rate to the contractual management fee rates of funds in the Fund’s Lipper expense group at a common asset level. The Board noted that the contractual management fee rate for Class Y shares of the Fund was above the median contractual management fee rate of funds in the expense group. The Board noted that the term “contractual management fee” may include both advisory and certain administrative services fees, but that Lipper does not provide information on a fund by fund basis as to what is included. The Board noted that Invesco Advisers does not charge the Invesco Funds for the administrative services included in the term as defined by Lipper. The Board also reviewed the methodology used by Lipper in providing expense group information, which includes using each fund’s contractual management fee schedule (including any applicable breakpoints) as reported in the most recent prospectus or statement of additional information for each fund in the expense group.
The Board noted that Invesco Advisers has contractually agreed to waive fees and/or limit expenses of the Fund through at least February 28, 2015 in an amount necessary to limit total annual operating expenses to a specified percentage of average daily net assets for each class of the Fund.
The Board noted that Invesco Advisers and the Affiliated Sub-Advisers do not manage other mutual funds or client accounts using an investment process that is substantially similar to the investment process used for the Fund.
The Board also considered the services that may be provided by the Affiliated Sub-Advisers pursuant to the sub-advisory contracts, as well as the fees payable by Invesco Advisers to the Affiliated Sub-Advisers pursuant to the sub-advisory contracts. The Board also noted that the sub-advisory fees are not paid directly by the Fund, but rather, are payable by Invesco Advisers to the Affiliated Sub-Advisers.
| D. | Economies of Scale and Breakpoints |
The Board considered the extent to which there are economies of scale in the provision of advisory services to the Fund. The Board also considered whether the Fund benefits from economies of scale through contractual breakpoints in the Fund’s advisory fee schedule and was assisted in this review by a report from the Senior Officer. The Board also noted that the Fund shares directly in economies of scale
through lower fees charged by third party service providers based on the combined size of the Invesco Funds and other clients advised by Invesco Advisers.
| E. | Profitability and Financial Resources |
The Board reviewed information from Invesco Advisers concerning the costs of the advisory and other services that Invesco Advisers and its affiliates provide to the Fund and the profitability of Invesco Advisers and its affiliates in providing these services for the year ended December 31, 2013. The Board received information from Invesco Advisers about the methodology used to prepare the profitability information. The Board considered the profitability of Invesco Advisers in managing the Fund and the Invesco Funds. The Board noted that Invesco Advisers continues to operate at a net profit from services Invesco Advisers and its subsidiaries provide to the Invesco Funds and the Fund. The Board did not deem the level of profits realized by Invesco Advisers and its affiliates from providing services to the Fund to be excessive given the nature, quality and extent of the services provided to the Invesco Funds. The Board received and accepted information from Invesco Advisers demonstrating that Invesco Advisers and each Affiliated Sub-Adviser are financially sound and have the resources necessary to perform their obligations under the investment advisory agreement and sub-advisory contracts.
| F. | Collateral Benefits to Invesco Advisers and its Affiliates |
The Board considered various other benefits received by Invesco Advisers and its affiliates from the relationship with the Fund, including the fees received for their provision of transfer agency and distribution services to the Fund. The Board considered comparative information regarding fees charged for these services, including information provided by Lipper and other independent sources. The Board considered the performance of Invesco Advisers and its affiliates in providing these services and the organizational structure employed to provide these services. The Board also considered that these services are provided to the Fund pursuant to written contracts that are reviewed and approved on an annual basis by the Board; that the services are required for the operation of the Fund; that Invesco Advisers and its affiliates can provide services, the nature and quality of which are at least equal to those provided by others offering the same or similar services; and that the fees for such services are fair and reasonable in light of the usual and customary charges by others for services of the same nature and quality.
The Board considered the benefits realized by Invesco Advisers and the Affiliated Sub-Advisers as a result of portfolio brokerage transactions executed through “soft dollar” arrangements. The Board noted that soft dollar arrangements shift the payment obligation for research services from Invesco Advisers and the Affiliated Sub-Advisers to the Invesco Funds and that the research received may be used with
other clients of Invesco Advisers and may reduce Invesco Advisers’ and the Affiliated Sub-Advisers’ expenses. The Board also considered that it receives periodic reports from the Chief Compliance Officer of the Invesco Funds demonstrating that these arrangements are consistent with regulatory requirements. The Board did not deem the soft dollar arrangements to be inappropriate.
The Board considered that the Fund’s uninvested cash and cash collateral from any securities lending arrangements may be invested in money market funds advised by Invesco Advisers pursuant to procedures approved by the Board. The Board noted that Invesco Advisers receives advisory fees from these affiliated money market funds attributable to such investments, although Invesco Advisers has contractually agreed to waive through varying periods the advisory fees payable by the Invesco Funds with respect to investments in the affiliated money market funds. The waiver is in an amount equal to 100% of the net advisory fee Invesco Advisers receives from the affiliated money market funds with respect to the Fund’s investment in the affiliated money market funds of uninvested cash, but not cash collateral. The Board concluded that the amount of advisory fees received by Invesco Advisors from the Fund’s investment of uninvested cash and cash collateral from any securities lending arrangements in the affiliated money market funds are fair and reasonable.
The Board also considered the Fund may use an affiliated broker to execute certain trades for the Fund to among other things, control information leakage, and were advised that such trades would be executed in compliance with rules under the Investment Company Act of 1940, as amended.
28 Invesco Global Markets Strategy Fund
Tax Information
Form 1099-DIV, Form 1042-S and other year-end tax information provide shareholders with actual calendar year amounts that should be included in their tax returns. Shareholders should consult their tax advisors.
The following distribution information is being provided as required by the Internal Revenue Code or to meet a specific state’s requirement.
The Fund designates the following amounts or, if subsequently determined to be different, the maximum amount allowable for its fiscal year ended October 31, 2014:
| | | | |
Federal and State Income Tax | |
Long-Term Capital Gain Distributions | | $ | 3,901,282 | |
Qualified Dividend Income* | | | 0.00 | % |
Corporate Dividends Received Deduction* | | | 0.00 | % |
U.S. Treasury Obligations* | | | 45.32 | % |
| | * | The above percentages are based on ordinary income dividends paid to shareholders during the Fund’s fiscal year. |
| | | | |
Non-Resident Alien Shareholders | |
Qualified Short-Term Gains | | $ | 3,950,918 | |
29 Invesco Global Markets Strategy Fund
Trustees and Officers
The address of each trustee and officer is AIM Investment Funds (Invesco Investment Funds) (the “Trust”), 11 Greenway Plaza, Suite 1000, Houston, Texas 77046-1173. The trustees serve for the life of the Trust, subject to their earlier death, incapacitation, resignation, retirement or removal as more specifically provided in the Trust’s organizational documents. Each officer serves for a one year term or until their successors are elected and qualified. Column two below includes length of time served with predecessor entities, if any.
| | | | | | | | |
Name, Year of Birth and Position(s) Held with the Trust | | Trustee and/
or Officer Since | | Principal Occupation(s) During Past 5 Years | | Number of Funds in Fund Complex Overseen by Trustee | | Other Directorship(s) Held by Trustee During Past 5 Years |
| Interested Persons | | | | | | | | |
| Martin L. Flanagan1 — 1960 Trustee | | 2007 | | Executive Director, Chief Executive Officer and President, Invesco Ltd. (ultimate parent of Invesco and a global investment management firm); Advisor to the Board, Invesco Advisers, Inc. (formerly known as Invesco Institutional (N.A.), Inc.); Trustee, The Invesco Funds; Vice Chair, Investment Company Institute; and Member of Executive Board, SMU Cox School of Business Formerly: Chairman and Chief Executive Officer, Invesco Advisers, Inc. (registered investment adviser); Director, Chairman, Chief Executive Officer and President, IVZ Inc. (holding company), INVESCO Group Services, Inc. (service provider) and Invesco North American Holdings, Inc. (holding company); Director, Chief Executive Officer and President, Invesco Holding Company Limited (parent of Invesco and a global investment management firm); Director, Invesco Ltd.; Chairman, Investment Company Institute and President, Co-Chief Executive Officer, Co-President, Chief Operating Officer and Chief Financial Officer, Franklin Resources, Inc. (global investment management organization). | | 144 | | None |
Philip A. Taylor2 — 1954 Trustee, President and Principal Executive Officer | | 2006 | | Head of North American Retail and Senior Managing Director, Invesco Ltd.; Director, Co-Chairman, Co-President and Co-Chief Executive Officer, Invesco Advisers, Inc. (formerly known as Invesco Institutional (N.A.), Inc.) (registered investment adviser); Director, Chairman, Chief Executive Officer and President, Invesco Management Group, Inc. (formerly known as Invesco Aim Management Group, Inc.) (financial services holding company); Director and President, INVESCO Funds Group, Inc. (registered investment adviser and registered transfer agent); Director and Chairman, Invesco Investment Services, Inc. (formerly known as Invesco Aim Investment Services, Inc.) (registered transfer agent) and IVZ Distributors, Inc. (formerly known as INVESCO Distributors, Inc.) (registered broker dealer); Director, President and Chairman, Invesco Inc. (holding company) and Invesco Canada Holdings Inc. (holding company); Chief Executive Officer, Invesco Corporate Class Inc. (corporate mutual fund company) and Invesco Canada Fund Inc. (corporate mutual fund company); Director, Chairman and Chief Executive Officer, Invesco Canada Ltd. (formerly known as Invesco Trimark Ltd./Invesco Trimark Ltèe) (registered investment adviser and registered transfer agent); Trustee, President and Principal Executive Officer, The Invesco Funds (other than AIM Treasurer’s Series Trust (Invesco Treasurer’s Series Trust) and Short-Term Investments Trust); Trustee and Executive Vice President, The Invesco Funds (AIM Treasurer’s Series Trust (Invesco Treasurer’s Series Trust) and Short-Term Investments Trust only); Director, Invesco Investment Advisers LLC (formerly known as Van Kampen Asset Management); Director, Chief Executive Officer and President, Van Kampen Exchange Corp. Formerly: Director and Chairman, Van Kampen Investor Services Inc.; Director, Chief Executive Officer and President, 1371 Preferred Inc. (holding company) and Van Kampen Investments Inc.; Director and President, AIM GP Canada Inc. (general partner for limited partnerships) and Van Kampen Advisors, Inc.; Director and Chief Executive Officer, Invesco Trimark Dealer Inc. (registered broker dealer); Director, Invesco Distributors, Inc. (formerly known as Invesco Aim Distributors, Inc.) (registered broker dealer); Manager, Invesco PowerShares Capital Management LLC; Director, Chief Executive Officer and President, Invesco Advisers, Inc.; Director, Chairman, Chief Executive Officer and President, Invesco Aim Capital Management, Inc.; President, Invesco Trimark Dealer Inc. and Invesco Trimark Ltd./Invesco Trimark Ltèe; Director and President, AIM Trimark Corporate Class Inc. and AIM Trimark Canada Fund Inc.; Senior Managing Director, Invesco Holding Company Limited; Director and Chairman, Fund Management Company (former registered broker dealer); President and Principal Executive Officer, The Invesco Funds (AIM Treasurer’s Series Trust (Invesco Treasurer’s Series Trust), and Short-Term Investments Trust only); President, AIM Trimark Global Fund Inc. and AIM Trimark Canada Fund Inc. | | 144 | | None |
Wayne W. Whalen3 — 1939 Trustee | | 2010 | | Of Counsel, and prior to 2010, partner in the law firm of Skadden, Arps, Slate, Meagher & Flom LLP, legal counsel to certain funds in the Fund Complex | | 144 | | Director of the Mutual fund Directors Forum, a nonprofit membership organization for investment directors; Chairman and Director of the Abraham Lincoln Presidential Library Foundation; and Director of the Stevenson Center for Democracy |
| 1 | Mr. Flanagan is considered an interested person (within the meaning of Section 2(a)(19) of the 1940 Act) of the Trust because he is an officer of the Adviser to the Trust, and an officer and a director of Invesco Ltd., ultimate parent of the Adviser. |
| 2 | Mr. Taylor is considered an interested person (within the meaning of Section 2(a)(19) of the 1940 Act) of the Trust because he is an officer and a director of the Adviser. |
| 3 | Mr. Whalen is retiring effective December 31, 2014. He has been deemed to be an interested person of the Trust because of his prior service as counsel to the predecessor funds of certain Invesco open-end funds and his affiliation with the law firm that served as counsel to such predecessor funds and the Invesco closed-end funds. |
T-1 Invesco Global Markets Strategy Fund
Trustees and Officers—(continued)
| | | | | | | | |
Name, Year of Birth and Position(s) Held with the Trust | | Trustee and/
or Officer Since | | Principal Occupation(s) During Past 5 Years | | Number of Funds in Fund Complex Overseen by Trustee | | Other Directorship(s) Held by Trustee During Past 5 Years |
| Independent Trustees | | | | | | | | |
Bruce L. Crockett — 1944 Trustee and Chair | | 2001 | | Chairman, Crockett Technologies Associates (technology consulting company) Formerly: Director, Captaris (unified messaging provider); Director, President and Chief Executive Officer, COMSAT Corporation; Chairman, Board of Governors of INTELSAT (international communications company); ACE Limited (insurance company); and Investment Company Institute | | 144 | | ALPS (Attorneys Liability Protection Society) (insurance company) |
David C. Arch — 1945 Trustee | | 2010 | | Chairman of Blistex Inc., a consumer health care products manufacturer | | 144 | | Board member of the Illinois Manufacturers’ Association; Member of the Board of Visitors, Institute for the Humanities, University of Michigan; Member of the Audit Committee of the Edward-Elmhurst Hospital |
Frank S. Bayley — 1939 Trustee | | 1987 | | Retired. Formerly: Director, Badgley Funds Inc. (registered investment company) (2 portfolios) and General Partner and Of Counsel, law firm of Baker & McKenzie, LLP | | 144 | | Director and Chairman, C.D. Stimson Company (a real estate investment company); Trustee, The Curtis Institute of Music |
James T. Bunch — 1942 Trustee | | 2003 | | Managing Member, Grumman Hill Group LLC (family office private equity investments) Formerly: Founder, Green Manning & Bunch Ltd. (investment banking firm) (1988-2010); Executive Committee, United States Golf Association; and Director, Policy Studies, Inc. and Van Gilder Insurance Corporation | | 144 | | Chairman, Board of Governors, Western Golf Association; Chairman, Evans Scholars Foundation; and Director, Denver Film Society |
Rodney F. Dammeyer — 1940 Trustee | | 2010 | | Chairman of CAC,LLC, (private company offering capital investment and management advisory services) Formerly: Prior to 2001, Managing Partner at Equity Group Corporate Investments; Prior to 1995, Chief Executive Officer of Itel Corporation (formerly Anixter International); Prior to 1985, experience includes Senior Vice President and Chief Financial Officer of Household International, Inc., Executive Vice President and Chief Financial Officer of Northwest Industries, Inc. and Partner of Arthur Andersen & Co.; From 1987 to 2010, Director/Trustee of investment companies in the Van Kampen Funds complex | | 144 | | Director of Quidel Corporation and Stericycle, Inc. |
Albert R. Dowden — 1941 Trustee | | 2001 | | Director of a number of public and private business corporations, including the Boss Group, Ltd. (private investment and management); Nature’s Sunshine Products, Inc. and Reich & Tang Funds (5 portfolios) (registered investment company) Formerly: Director, Homeowners of America Holding Corporation/Homeowners of America Insurance Company (property casualty company); Director, Continental Energy Services, LLC (oil and gas pipeline service); Director, CompuDyne Corporation (provider of product and services to the public security market) and Director, Annuity and Life Re (Holdings), Ltd. (reinsurance company); Director, President and Chief Executive Officer, Volvo Group North America, Inc.; Senior Vice President, AB Volvo; Director of various public and private corporations; Chairman, DHJ Media, Inc.; Director, Magellan Insurance Company; and Director, The Hertz Corporation, Genmar Corporation (boat manufacturer), National Media Corporation; Advisory Board of Rotary Power International (designer, manufacturer, and seller of rotary power engines); and Chairman, Cortland Trust, Inc. (registered investment company) | | 144 | | Director of: Nature’s Sunshine Products, Inc., Reich & Tang Funds, Homeowners of America Holding Corporation/ Homeowners of America Insurance Company, the Boss Group |
Jack M. Fields — 1952 Trustee | | 2001 | | Chief Executive Officer, Twenty First Century Group, Inc. (government affairs company); Owner and Chief Executive Officer, Dos Angeles Ranch, L.P. (cattle, hunting, corporate entertainment); and Discovery Global Education Fund (non-profit) Formerly: Chief Executive Officer, Texana Timber LP (sustainable forestry company); Director of Cross Timbers Quail Research Ranch (non-profit); and member of the U.S. House of Representatives | | 144 | | Insperity, Inc. (formerly known as Administaff) |
Prema Mathai-Davis — 1950 Trustee | | 2001 | | Retired. Formerly: Chief Executive Officer, YWCA of the U.S.A. | | 144 | | None |
Larry Soll — 1942 Trustee | | 2003 | | Retired. Formerly: Chairman, Chief Executive Officer and President, Synergen Corp. (a biotechnology company) | | 144 | | None |
Hugo F. Sonnenschein — 1940 Trustee | | 2010 | | President Emeritus and Honorary Trustee of the University of Chicago and the Adam Smith Distinguished Service Professor in the Department of Economics at the University of Chicago. Prior to 2000, President of the University of Chicago | | 144 | | Trustee of the University of Rochester and a member of its investment committee; Member of the National Academy of Sciences and the American Philosophical Society; Fellow of the American Academy of Arts and Sciences |
T-2 Invesco Global Markets Strategy Fund
Trustees and Officers—(continued)
| | | | | | | | |
Name, Year of Birth and Position(s) Held with the Trust | | Trustee and/
or Officer Since | | Principal Occupation(s) During Past 5 Years | | Number of Funds in Fund Complex Overseen by Trustee | | Other Directorship(s) Held by Trustee During Past 5 Years |
| Independent Trustees—(continued) |
Raymond Stickel, Jr. — 1944 Trustee | | 2005 | | Retired. Formerly: Director, Mainstay VP Series Funds, Inc. (25 portfolios) and Partner, Deloitte & Touche | | 144 | | None |
Suzanne H. Woolsey — 1941 Trustee | | 2014 | | Chief Executive Officer of Woolsey Partners LLC | | 144 | | Emeritus Chair of the Board of Trustees of the Institute for Defense Analyses; Trustee of Colorado College; Trustee of California Institute of Technology; Prior to 2014, Director of Fluor Corp.; Prior to 2010, Trustee of the German Marshall Fund of the United States; Prior to 2010 Trustee of the Rocky Mountain Institute |
| Other Officers | | | | | | | | |
Russell C. Burk — 1958 Senior Vice President and Senior Officer | | 2005 | | Senior Vice President and Senior Officer, The Invesco Funds | | N/A | | N/A |
John M. Zerr — 1962 Senior Vice President, Chief Legal Officer and Secretary | | 2006 | | Director, Senior Vice President, Secretary and General Counsel, Invesco Management Group, Inc. (formerly known as Invesco Aim Management Group, Inc.) and Van Kampen Exchange Corp.; Senior Vice President, Invesco Advisers, Inc. (formerly known as Invesco Institutional (N.A.), Inc.) (registered investment adviser); Senior Vice President and Secretary, Invesco Distributors, Inc. (formerly known as Invesco Aim Distributors, Inc.); Director, Vice President and Secretary, Invesco Investment Services, Inc. (formerly known as Invesco Aim Investment Services, Inc.) and IVZ Distributors, Inc. (formerly known as INVESCO Distributors, Inc.); Director and Vice President, INVESCO Funds Group, Inc.; Senior Vice President, Chief Legal Officer and Secretary, The Invesco Funds; Manager, Invesco PowerShares Capital Management LLC; Director, Secretary and General Counsel, Invesco Investment Advisers LLC (formerly known as Van Kampen Asset Management); Secretary and General Counsel, Invesco Capital Markets, Inc. (formerly known as Van Kampen Funds Inc.) and Chief Legal Officer, PowerShares Exchange-Traded Fund Trust, PowerShares Exchange-Traded Fund Trust II, PowerShares India Exchange-Traded Fund Trust, PowerShares Actively Managed Exchange-Traded Fund Trust; and PowerShares Actively Managed Exchange-Traded Commodity Fund Trust Formerly: Director and Vice President, Van Kampen Advisors Inc.; Director, Vice President, Secretary and General Counsel, Van Kampen Investor Services Inc.; Director, Invesco Distributors, Inc. (formerly known as Invesco Aim Distributors, Inc.); Director, Senior Vice President, General Counsel and Secretary, Invesco Aim Advisers, Inc. and Van Kampen Investments Inc.; Director, Vice President and Secretary, Fund Management Company; Director, Senior Vice President, Secretary, General Counsel and Vice President, Invesco Aim Capital Management, Inc.; Chief Operating Officer and General Counsel, Liberty Ridge Capital, Inc. (an investment adviser); Vice President and Secretary, PBHG Funds (an investment company) and PBHG Insurance Series Fund (an investment company); Chief Operating Officer, General Counsel and Secretary, Old Mutual Investment Partners (a broker-dealer); General Counsel and Secretary, Old Mutual Fund Services (an administrator) and Old Mutual Shareholder Services (a shareholder servicing center); Executive Vice President, General Counsel and Secretary, Old Mutual Capital, Inc. (an investment adviser); and Vice President and Secretary, Old Mutual Advisors Funds (an investment company) | | N/A | | N/A |
Sheri Morris — 1964 Vice President, Treasurer and Principal Financial Officer | | 1999 | | Vice President, Treasurer and Principal Financial Officer, The Invesco Funds; Vice President, Invesco Advisers, Inc. (formerly known as Invesco Institutional (N.A.), Inc.) (registered investment adviser); and Vice President, PowerShares Exchange-Traded Fund Trust, PowerShares Exchange-Traded Fund Trust II, PowerShares India Exchange-Traded Fund Trust, PowerShares Actively Managed Exchange-Traded Fund Trust, and PowerShares Actively Managed Exchange-Traded Commodity Fund Trust Formerly: Vice President, Invesco Aim Advisers, Inc., Invesco Aim Capital Management, Inc. and Invesco Aim Private Asset Management, Inc.; Assistant Vice President and Assistant Treasurer, The Invesco Funds and Assistant Vice President, Invesco Advisers, Inc., Invesco Aim Capital Management, Inc. and Invesco Aim Private Asset Management, Inc.; and Treasurer, PowerShares Exchange-Traded Fund Trust, PowerShares Exchange-Traded Fund Trust II, PowerShares India Exchange-Traded Fund Trust and PowerShares Actively Managed Exchange-Traded Fund Trust | | N/A | | N/A |
T-3 Invesco Global Markets Strategy Fund
Trustees and Officers—(continued)
| | | | | | | | |
Name, Year of Birth and Position(s) Held with the Trust | | Trustee and/
or Officer Since | | Principal Occupation(s) During Past 5 Years | | Number of Funds in Fund Complex Overseen by Trustee | | Other Directorship(s) Held by Trustee During Past 5 Years |
| Other Officers—(continued) | | | | | | | | |
Karen Dunn Kelley — 1960 Vice President | | 2004 | | Senior Managing Director, Investments; Director, Co-President, Co-Chief Executive Officer, and Co-Chairman, Invesco Advisers, Inc. (formerly known as Invesco Institutional (N.A.), Inc.) (registered investment adviser); Chairman, Invesco Senior Secured Management, Inc.; Senior Vice President, Invesco Management Group, Inc. (formerly known as Invesco Aim Management Group, Inc.); Executive Vice President, Invesco Distributors, Inc. (formerly known as Invesco Aim Distributors, Inc.); Director, Invesco Mortgage Capital Inc. and Invesco Management Company Limited; Director and President, INVESCO Asset Management (Bermuda) Ltd., Vice President, The Invesco Funds (other than AIM Treasurer’s Series Trust (Invesco Treasurer’s Series Trust) and Short-Term Investments Trust); and President and Principal Executive Officer, The Invesco Funds (AIM Treasurer’s Series Trust (Invesco Treasurer’s Series Trust) and Short-Term Investments Trust only) Formerly: Director, INVESCO Global Asset Management Limited and INVESCO Management S.A.; Senior Vice President, Van Kampen Investments Inc. and Invesco Advisers, Inc. (formerly known as Invesco Institutional (N.A.), Inc.) (registered investment adviser); Vice President, Invesco Advisers, Inc. (formerly known as Invesco Institutional (N.A.), Inc.); Director of Cash Management and Senior Vice President, Invesco Advisers, Inc. and Invesco Aim Capital Management, Inc.; Director and President, Fund Management Company; Chief Cash Management Officer, Director of Cash Management, Senior Vice President, and Managing Director, Invesco Aim Capital Management, Inc.; Director of Cash Management, Senior Vice President, and Vice President, Invesco Advisers, Inc. and The Invesco Funds (AIM Treasurer’s Series Trust (Invesco Treasurer’s Series Trust), and Short-Term Investments Trust only) | | N/A | | N/A |
Crissie M. Wisdom — 1969 Anti-Money Laundering Compliance Officer | | 2013 | | Anti-Money Laundering Compliance Officer, Invesco Advisers, Inc. (formerly known as Invesco Institutional (N.A.), Inc.) (registered investment adviser), Invesco Capital Markets, Inc. (formerly known as Van Kampen Funds Inc.), Invesco Distributors, Inc., Invesco Investment Services, Inc., Invesco Management Group, Inc., Van Kampen Exchange Corp., The Invesco Funds, and PowerShares Exchange-Traded Fund Trust, PowerShares Exchange-Traded Fund Trust II, PowerShares India Exchange-Traded Fund Trust, PowerShares Actively Managed Exchange-Traded Fund Trust and PowerShares Actively Managed Exchange-Traded Commodity Fund Trust; and Fraud Prevention Manager and Controls and Risk Analysis Manager for Invesco Investment Services, Inc. | | N/A | | N/A |
Todd L. Spillane — 1958 Chief Compliance Officer | | 2006 | | Senior Vice President, Invesco Management Group, Inc. (formerly known as Invesco Aim Management Group, Inc.) and Van Kampen Exchange Corp.; Senior Vice President and Chief Compliance Officer, Invesco Advisers, Inc. (registered investment adviser) (formerly known as Invesco Institutional (N.A.), Inc.); Chief Compliance Officer, The Invesco Funds; Vice President, Invesco Distributors, Inc. (formerly known as Invesco Aim Distributors, Inc.) and Invesco Investment Services, Inc. (formerly known as Invesco Aim Investment Services, Inc.) Formerly: Chief Compliance Officer, Invesco Funds (Chicago); Senior Vice President, Van Kampen Investments Inc.; Senior Vice President and Chief Compliance Officer, Invesco Aim Advisers, Inc. and Invesco Aim Capital Management, Inc.; Chief Compliance Officer, INVESCO Private Capital Investments, Inc. (holding company), Invesco Private Capital, Inc. (registered investment adviser), Invesco Global Asset Management (N.A.), Inc., Invesco Senior Secured Management, Inc. (registered investment adviser), Van Kampen Investor Services Inc., PowerShares Exchange-Traded Fund Trust, PowerShares Exchange-Traded Fund Trust II, PowerShares India Exchange-Traded Fund Trust and PowerShares Actively Managed Exchange-Traded Fund Trust; and Vice President, Invesco Aim Capital Management, Inc. and Fund Management Company | | N/A | | N/A |
The Statement of Additional Information of the Trust includes additional information about the Fund’s Trustees and is available upon request, without charge, by calling 1.800.959.4246. Please refer to the Fund’s prospectus for information on the Fund’s sub-advisers.
| | | | | | |
Office of the Fund 11 Greenway Plaza, Suite 1000 Houston, TX 77046-1173 | | Investment Adviser Invesco Advisers, Inc. 1555 Peachtree Street, N.E. Atlanta, GA 30309 | | Distributor Invesco Distributors, Inc. 11 Greenway Plaza, Suite 1000 Houston, TX 77046-1173 | | Auditors PricewaterhouseCoopers LLP 1000 Louisiana Street, Suite 5800 Houston, TX 77002-5678 |
| | | |
| | | | | | |
Counsel to the Fund Stradley Ronon Stevens & Young, LLP 2005 Market Street, Suite 2600 Philadelphia, PA 19103-7018 | | Counsel to the Independent Trustees Goodwin Procter LLP 901 New York Avenue, N.W. Washington, D.C. 20001 | | Transfer Agent Invesco Investment Services, Inc. 11 Greenway Plaza, Suite 1000 Houston, TX 77046-1173 | | Custodian State Street Bank and Trust Company 225 Franklin Street Boston, MA 02110-2801 |
T-4 Invesco Global Markets Strategy Fund

Invesco mailing information
Send general correspondence to Invesco Investment Services, Inc., P.O. Box 219078, Kansas City, MO 64121-9078.
Important notice regarding delivery of security holder documents
To reduce Fund expenses, only one copy of most shareholder documents may be mailed to shareholders with multiple accounts at the same address (Householding). Mailing of your shareholder documents may be householded indefinitely unless you instruct us otherwise. If you do not want the mailing of these documents to be combined with those for other members of your household, please contact Invesco Investment Services, Inc. at 800 959 4246 or contact your financial institution. We will begin sending you individual copies for each account within 30 days after receiving your request.
Fund holdings and proxy voting information
The Fund provides a complete list of its holdings four times in each fiscal year, at the quarter ends. For the second and fourth quarters, the lists appear in the Fund’s semiannual and annual reports to shareholders. For the first and third quarters, the Fund files the lists with the Securities and Exchange Commission (SEC) on Form N-Q. The most recent list of portfolio holdings is available at invesco.com/completeqtrholdings. Shareholders can also look up the Fund’s Forms
N-Q on the SEC website at sec.gov. Copies of the Fund’s Forms N-Q may be reviewed and copied at the SEC Public Reference Room in Washington, D.C. You can obtain information on the operation of the Public Reference Room, including information about duplicating fee charges, by calling 202 551 8090 or 800 732 0330, or by electronic request at the following email address: publicinfo@sec.gov. The SEC file numbers for the Fund are shown below.
A description of the policies and procedures that the Fund uses to determine how to vote proxies relating to portfolio securities is available without charge, upon request, from our Client Services department at 800 959 4246 or at invesco.com/proxyguidelines. The information is also available on the SEC website, sec.gov.
| | |
Information regarding how the Fund voted proxies related to its portfolio securities during the most recent 12-month period ended June 30 is available at invesco.com/proxysearch. The information is also available on the SEC website, sec.gov. | |  |
Invesco Advisers, Inc. is an investment adviser; it provides investment advisory services to individual and institutional clients and does not sell securities. Invesco Distributors, Inc. is the US distributor for Invesco Ltd.’s retail mutual funds, exchange-traded funds and institutional money market funds. Both are wholly owned, indirect subsidiaries of Invesco Ltd. | |
| | | | |
| SEC file numbers: 811-05426 and 033-19338 | | GMS-AR-1 | | Invesco Distributors, Inc. |

Letters to Shareholders
| | | | |

Philip Taylor | | | | Dear Shareholders: This annual report includes information about your Fund, including performance data and a complete list of its investments as of the close of the reporting period. Inside, your Fund’s portfolio managers discuss how they managed your Fund and the factors that affected its performance during the reporting period. I hope you find this report of interest. During the reporting period covered by this report, the US economy showed signs of continued improvement. After contracting in the first quarter of 2014, the economy expanded strongly in the second quarter and unemployment trended lower. Much of the credit for this improvement goes to the US Federal Reserve (the Fed), which undertook an extraordinary asset purchase program following the global financial crisis. The Fed’s goal was to jumpstart the economy by encouraging banks to lend more, businesses to hire more and consumers to spend more. Signs of a stronger US economy prompted the Fed to reduce, or “taper,” its |
asset purchase program. Despite this, interest rates remained near historical low levels due largely to heavy investor demand for bonds. While signs of economic improvement were evident in the US, European economies showed signs of weakening. That, together with geopolitical uncertainty and worries about the first diagnosed cases of Ebola outside of Africa, caused increased volatility in US and European equities.
Extended periods of market strength can lull investors into complacency – just as prolonged periods of market weakness or volatility can discourage investors from initiating long-term investment plans. That’s why Invesco has always encouraged investors to work with a professional financial adviser who can stress the importance of starting to save and invest early and the importance of adhering to a disciplined investment plan – when times are good and when they’re uncertain. A financial adviser who knows your unique financial situation, investment goals and risk tolerance can be an invaluable partner as you seek to achieve your financial goals. He or she can offer a long-term perspective when markets are volatile and time-tested advice and guidance when your financial situation or investment goals change.
Timely information when and where you want it
Invesco’s efforts to help investors achieve their financial objectives include providing individual investors and financial professionals with timely information about the markets, the economy and investing – whenever and wherever they want it.
Our website, invesco.com/us, offers a wide range of market insights and investment perspectives. On the website, you’ll find detailed information about our funds, including prices, performance, holdings and portfolio manager commentaries. You can access information about your individual Invesco account whenever it’s convenient for you; just complete a simple, secure online registration. Use the “Log In” box on our home page to get started.
Invesco’s mobile app for iPad® (available free from the App StoreSM) allows you to obtain the same detailed information about your Fund and the same investment insights from our investment leaders, market strategists, economists and retirement experts on the go. You also can watch portfolio manager videos and have instant access to Invesco news and updates wherever you may be.
In addition to the resources accessible on our website and through our mobile app, you can obtain timely updates to help you stay informed about the markets, the economy and investing by connecting with Invesco on Twitter, LinkedIn or Facebook. You can access our blog at blog.invesco.us.com. Our goal is to provide you the information you want, when and where you want it.
Have questions?
For questions about your account, feel free to contact an Invesco client services representative at 800 959 4246. For Invesco-related questions or comments, please email me directly at phil@invesco.com.
All of us at Invesco look forward to serving your investment management needs for many years to come. Thank you for investing with us.
Sincerely,

Philip Taylor
Senior Managing Director, Invesco Ltd.
iPad is a trademark of Apple Inc., registered in the US and other countries. App Store is a service mark of Apple Inc. Invesco Distributors, Inc. is not affiliated with Apple Inc.
|
| 2 Invesco Global Targeted Returns Fund |
| | | | |

Bruce Crockett | | | | Dear Fellow Shareholders: There are a variety of factors that can impact investment performance, many of which are uncontrollable by us as investors. These factors can include various economic trends and geopolitical developments. While the members of the Invesco Funds Board, which I chair, can’t dictate the performance of the Invesco funds, be assured that your Board works diligently throughout the year to focus on how your investments are managed. Our job is to represent you and your interests on a variety of fund management-related matters. We regularly monitor how the portfolio management teams of the Invesco funds are performing in light of ever-changing and often unpredictable economic and market conditions. We review the investment strategies and investment process employed by each fund’s management team as explained in the fund’s prospectus. Perhaps our most significant responsibility is conducting the annual review of the funds’ |
advisory and sub-advisory contracts with Invesco Advisers and its affiliates. This annual review, which is required by the Investment Company Act of 1940, focuses on the nature and quality of the services Invesco provides as the adviser to the Invesco funds and the reasonableness of the fees that it charges for those services. Each year, we spend months carefully reviewing information from Invesco that allows us to evaluate the quality of its services and the reasonableness of its fees. We also use information from a variety of independent sources, including materials provided by the independent senior officer of the Invesco funds, who reports directly to the independent trustees on the Board. Additionally, we meet with legal counsel and review performance and fee data prepared for us by Lipper Inc., an independent, third-party firm widely recognized as a leader in its field.
After a careful review, the members of the Invesco Funds Board approved the continuation of advisory and sub-advisory contracts with Invesco Advisers and its affiliates. Be assured that your Board will continue working on behalf of fund shareholders, keeping your needs and interests uppermost in our minds.
As always, please contact me at bruce@brucecrockett.com with any questions or concerns you may have. On behalf of the Board, we look forward to continuing to represent your interests and serving your needs.
Sincerely,

Bruce L. Crockett
Independent Chair
Invesco Funds Board of Trustees
|
| 3 Invesco Global Targeted Returns Fund |
Management’s Discussion of Fund Performance
| | | | | |
Performance summary Invesco Global Targeted Returns Fund incepted on December 19, 2013. From the Fund’s inception to the end of the reporting period, the Fund, at net asset value, outperformed the U.S. Three-Month Treasury Bills Index, its broad market/style-specific index. A broad mix of investment ideas contributed to Fund performance during the reporting period. The Fund’s interest rate ideas and currency ideas relating to the strength of the US economy performed well during the reporting period. In contrast, some of the Fund’s volatility ideas detracted from Fund performance. Additional performance information for your Fund appears later in this report. Fund vs. Indexes Cumulative total returns, 12/19/13 to 10/31/14, at net asset value (NAV). Performance shown does not include applicable contingent deferred sales charges (CDSC) or front-end sales charges, which would have reduced performance. | | |
| | | | | |
| |
| Class A Shares | | 4.40% |
| Class C Shares | | | | 3.70 | |
| Class R Shares | | | | 4.20 | |
| Class Y Shares | | | | 4.60 | |
| Class R5 Shares | | | | 4.60 | |
| Class R6 Shares | | | | 4.60 | |
| U.S. Three-Month Treasury Bills Index‚ (Broad Market Index/Style-Specific Index) | | | | 0.03 | |
| Lipper Absolute Return Funds Index‚ (Peer Group Index) | | | | 1.68 | |
Source(s): ‚Lipper Inc. | | | | | |
Market conditions and your Fund
The fund’s investment philosophy is based on the belief that positive total returns can be achieved across all market environments over a rolling 3-year period through an unconstrained approach to identifying potential sources of return and through robust risk management. Invesco’s Multi Asset team seeks to generate investment ideas, identify the optimal way to implement exposure to them and combine them successfully into a risk-managed portfolio.
The starting point for the Fund’s multi-asset investment process is the development of investment ideas. The team takes a global macro perspective, looking across asset classes, geographies, currencies and sectors for approximately 20–30 long-term investment ideas to include in its portfolio at any time. Ideas are generated through investment themes, fundamental
economic analysis and valuation/qualitative modeling and may result in investments across a wide array of asset classes, geographies, sectors and currencies. The Fund targets a gross return of 5% per annum above US 3-month Treasury Bills over a rolling 3-year period and aims to achieve this with less than half the volatility of global equities, as represented by the MSCI World Index, over the same rolling 3-year period.
During the reporting period, the underlying story of a slow return to global growth has seen equity markets testing new highs and government bonds rising in value as yields continued to move lower. This backdrop benefited the performance of some of the Fund’s investment ideas. For instance, interest rate ideas in the Fund, particularly those with targeted exposure in US and European duration1 performed well during the reporting period.
The US duration idea represents our view that subdued US economic growth and inflation could be reflected in long-term bond yields staying relatively low even as investors expect interest rates to rise over the next few years. We first implemented this idea using bond futures, but in July switched to interest rate swaptions which tend to dampen the impact of sharp interest rate rises. This idea performed well during the reporting period as, generally, US interest rates fell benefiting our long duration exposure. Similarly, the European curve steepener idea reflects the belief that short-term interest rates in Europe will remain anchored as the European Central Bank keeps interest rates low. We chose to implement this idea based on the market’s perception of where 30-year yields will be relative to 10-year yields in four years’ time, using 10-year and 30-year interest rate swap contracts, as it appeared flatter than the spot yield curve2 and steep curves in loose monetary environments tend to persist. This idea also benefited from the broad-based rally in bonds that took place over the reporting period.
Two ideas related to emerging markets and economies performed strongly during the reporting period. The first idea was pairing a long position in the Brazilian real with a short position in the Chilean peso, using currency forward contracts. This reflected our view that the economic backdrop in the two countries would lead to a divergence in monetary policy and this was observed with a series of rate hikes in Brazil and a series of rate cuts in Chile, resulting in strong performance as the real appreciated versus the peso.
Our selective Asia exposure equity idea also offered strong returns as Asian markets were among the strongest performers and the underlying funds performed well offering an alternative source of alpha3 to the Fund. The theme behind the
| | | | | |
| Portfolio Composition |
| | |
| % of Net Assets
as of 10/31/14† |
|
| |
| Options Purchased | | | | 7.2 | % |
| Swap Agreements | | | | 1.8 | |
| Forwards | | | | 1.1 | |
| Sovereign Debt | | | | 4.8 | |
| Investment Companies | | | | 70.9 | |
| Other Assets Less Liabilities | | | | 14.2 | |
| | | | | |
| Total Net Assets | | | $ | 42.3 million | |
| † | Represents the net market value of options purchased, the net unrealized appreciation/depreciation of swaps and the net unrealized appreciation/depreciation of forwards. The unrealized appreciation/depreciation of written options and futures, which each are negative (below zero), are included in “Other Assets less liabilities.” See the Schedule of Investments for a complete list of derivative instruments held by the Fund as of October 31, 2014. |
|
| 4 Invesco Global Targeted Returns Fund |
idea is our view that Asian equities appear attractively valued with many markets characterized by stabilizing fundamentals. We expressed this idea by owning Invesco Asia Pacific Growth Fund, which primarily holds securities of companies in the Asia Pacific regions, but tailored the exposure by selling Australia equity index futures because we believe Australian equities are expensive and are vulnerable because of their exposure to commodities.
Despite central bank’s support for a continued recovery, our preference for cyclical versus defensive equities detracted from Fund performance, as our UK versus Switzerland equity idea performed poorly. UK equity markets have a larger exposure to the energy sector than Swiss equity markets, which suffered as oil prices have fallen. This idea was expressed through options on the UK and Swiss equity markets.
With loose monetary policy globally keeping equity volatility levels at lows, some of the volatility ideas detracted from Fund performance. In particular, ideas focused on benefiting from sharp movements in Asian detracted from Fund performance. For this idea, we used options with the market risk hedged to reflect our view that volatility should rise over the next two to three years. This idea’s performance detracted as Asian equity volatility remained low during the reporting period.
Likewise, our Asian equities volatility versus US equities volatility idea also detracted from performance during the reporting period due to the subdued volatility in Asian equity markets. While the difference between the implied volatility of US and Asian equity markets, based on option prices, is very low versus history, we believe that Asian equity markets should be inherently more volatile and expressed this idea through swap contracts that isolated the volatility of the US, Hang Seng and the Hang Seng China Enterprise Index markets.
The Fund has seen a number of changes during the reporting period. We added a long US dollar versus euro idea to the portfolio through currency forward contracts, as economic drivers that supported a stronger euro appeared to slow. We also removed the European financials credit idea and long Brazilian real versus short Chilean peso idea. While both ideas delivered strong performance, we believe they no longer had the return potential to justify inclusion in the Fund. To provide the portfolio with a similar currency idea,
we added a long Indian rupee versus Chinese renimbi idea during the reporting period, which we implemented through currency forward contracts.
Additionally, we believe selective emerging market government bonds offer value when economic fundamentals improve making currency potentially undervalued. Accordingly, during the reporting period, we added local currency bonds in Poland, South Africa and Hungary to the Fund portfolio.
Looking forward, we believe there will be low, but positive economic growth, but with divergence among developed countries. We also expect beneficial market reform and policy adjustment impacting emerging economies. While we believe short-term interest rates will remain low for a sustained period, we believe there is potential for rate increases in the UK and US. We remain cautious on the valuation of risk assets and see interference by governments and central banks as a possible source of future market volatility.
As indicated throughout this report, our investment ideas will make significant use of derivative instruments for implementation. Therefore, the performance of the Fund can be attributed largely to these instruments. Derivatives can be a cost-effective way to gain exposure to asset classes. However, derivatives may amplify traditional investment risks through the creation of leverage and may be less liquid than traditional securities.
We thank you for your investment in Invesco Global Targeted Returns Fund.
| 1 | Duration is a measure of the sensitivity of the price (the value of principal) of a fixed-income investment to a change in interest rates. |
| 2 | Spot yield curve is a yield constructed using Treasury spot rates rather than yields. |
| 3 | Alpha is a measure of performance on a risk-adjusted basis. |
The views and opinions expressed in management’s discussion of Fund performance are those of Invesco Advisers, Inc. These views and opinions are subject to change at any time based on factors such as market and economic conditions. These views and opinions may not be relied upon as investment advice or recommendations, or as an offer for a particular security. The information is not a complete analysis of every aspect of any market, country, industry, security or the Fund. Statements of fact are from sources considered reliable, but Invesco Advisers, Inc. makes no representation or warranty as to their completeness or accuracy. Although historical performance is no guarantee of future results, these insights may help you understand our investment management philosophy.
See important Fund and, if applicable, index disclosures later in this report.
| | |
 | | David Millar Portfolio Manager, is the lead manager of Invesco Global Targeted Returns Fund. He joined |
| Invesco in 2013. Mr. Millar earned a BSc (Hons) degree in mathematical statistics from the University of Cape Town. He is a Fellow of the Institute and Faculty of Actuaries. |
| | |
 | | Richard Batty Portfolio Manager, is manager of Invesco Global Targeted Returns Fund. He joined Invesco in |
| 2013. Mr. Batty earned a PhD in financial economics from Brunel University. |
| | |
 | | Dave Jubb Portfolio Manager, is manager of Invesco Global Targeted Returns Fund. He joined Invesco in |
| 2013. Mr. Jubb earned a Bsc (Hons) in mathematics from St. Andrews University. He is a Fellow of the Institute and Faculty of Actuaries. |
|
| 5 Invesco Global Targeted Returns Fund |
Your Fund’s Performance
Results of a $10,000 Investment – Oldest Share Class(es) since Inception
Fund and index data from 12/19/13

Past performance cannot guarantee comparable future results. The data shown in the chart include reinvested distributions, applicable sales charges and Fund expenses including management
fees. Index results include reinvested dividends, but they do not reflect sales charges. Performance of the peer group, if applicable, reflects fund expenses and management fees; performance of a
market index does not. Performance shown in the chart and table(s) does not reflect deduction of taxes a shareholder would pay on Fund distributions or sale of Fund shares.
| | | | |
Cumulative Total Return1s | |
As of 10/31/14, including maximum applicable sales charges | |
| |
| Class A Shares | | | | |
| Inception (12/19/13) | | | -1.32 | % |
| |
| Class C Shares | | | | |
| Inception (12/19/13) | | | 2.70 | % |
| |
| Class R Shares | | | | |
| Inception (12/19/13) | | | 4.20 | % |
| |
| Class Y Shares | | | | |
| Inception (12/19/13) | | | 4.60 | % |
| |
| Class R5 Shares | | | | |
| Inception (12/19/13) | | | 4.60 | % |
| |
| Class R6 Shares | | | | |
| Inception (12/19/13) | | | 4.60 | % |
The performance data quoted represent past performance and cannot guarantee comparable future results; current performance may be lower or higher. Please visit invesco.com/performance for the most recent month-end performance. Performance figures reflect reinvested distributions, changes in net asset value and the effect of the maximum sales charge unless otherwise stated. Investment return and principal value will fluctuate so that you may have a gain or loss when you sell shares.
The net annual Fund operating expense ratio set forth in the most
| | | | |
Cumulative Total Returns | |
As of 9/30/14, the most recent calendar quarter end, including maximum applicable sales charges | |
| |
| Class A Shares | | | | |
| Inception (12/19/13) | | | -2.08 | % |
| |
| Class C Shares | | | | |
| Inception (12/19/13) | | | 2.00 | % |
| |
| Class R Shares | | | | |
| Inception (12/19/13) | | | 3.40 | % |
| |
| Class Y Shares | | | | |
| Inception (12/19/13) | | | 3.80 | % |
| |
| Class R5 Shares | | | | |
| Inception (12/19/13) | | | 3.80 | % |
| |
| Class R6 Shares | | | | |
| Inception (12/19/13) | | | 3.70 | % |
recent Fund prospectus as of the date of this report for Class A, Class C, Class R, Class Y, Class R5 and Class R6 shares was 1.80%, 2.55%, 2.05%, 1.55%, 1.55% and 1.55%, respectively.1,2,3 The total annual Fund operating expense ratio set forth in the most recent Fund prospectus as of the date of this report for Class A, Class C, Class R, Class Y, Class R5 and Class R6 shares was 3.09%, 3.84%, 3.34%, 2.84%, 2.74% and 2.69%, respectively. The expense ratios presented above may vary from the expense ratios presented in other sections of this report that are based on expenses
incurred during the period covered by this report.
Class A share performance reflects the maximum 5.50% sales charge, and Class C share performance reflects the applicable contingent deferred sales charge (CDSC) for the period involved. The CDSC on Class C shares is 1% for the first year after purchase. Class R, Class Y, Class R5 and Class R6 class shares do not have a front-end sales charge or a CDSC; therefore, performance is at net asset value.
The performance of the Fund’s share classes will differ primarily due to different sales charge structures and class expenses.
Had the adviser not waived fees and/ or reimbursed expenses, performance would have been lower.
| 1 | Total annual Fund operating expenses after any contractual fee waivers and/or expense reimbursements by the adviser in effect through at least June 30, 2016. See current prospectus for more information. |
| 2 | Total annual Fund operating expenses after any contractual fee waivers and/or expense reimbursements by the adviser in effect through at least February 29, 2016. See current prospectus for more information. |
| 3 | The expense ratio includes acquired fund fees and expenses of the underlying funds in which the Fund invests 0.49% for Invesco Global Targeted Returns Fund. |
|
| 6 Invesco Global Targeted Returns Fund |
Invesco Global Targeted Returns Fund’s primary investment objective is to seek a positive total return over the long term in all market environments.
| n | | Unless otherwise stated, information presented in this report is as of October 31, 2014, and is based on total net assets. |
| n | | Unless otherwise noted, all data provided by Invesco. |
| n | | To access your Fund’s reports/prospectus, visit invesco.com/fundreports. |
About share classes
| n | | Class R shares are generally available only to employer sponsored retirement and benefit plans. Please see the prospectus for more information. |
| n | | Class Y shares are available only to certain investors. Please see the prospectus for more information. |
| n | | Class R5 shares and Class R6 shares are primarily intended for employer sponsored retirement and benefit plans that meet certain standards and for institutional investors. Please see the prospectus for more information. |
Principal risks of investing in the Fund
| n | | Changing fixed income market conditions risk. The current historically low interest rate environment was created in part by the Federal Reserve Board (FRB) and certain foreign central banks keeping the federal funds and equivalent foreign rates at or near zero. There is a risk that interest rates will rise when the FRB and central banks raise these rates. This risk is heightened due to the “tapering” of the FRB’s quantitative easing program and other similar foreign central bank actions. This tapering and eventual increase in the federal funds and equivalent foreign rates may expose fixed income markets to heightened volatility and reduced liquidity for certain fixed income investments, particularly those with longer maturities. In addition, decreases in fixed income dealer market-making capacity may also potentially lead to heightened volatility and reduced liquidity in the fixed income markets. As a result, the value of the Fund’s investments and share price may decline. Changes in central bank policies could also result in higher than normal shareholder redemptions, which could potentially increase portfolio turnover and the Fund’s transaction costs. |
| n | | Commodity risk. The Fund may from time to time have significant investment exposure to the commodities |
| | markets, and/or a particular sector of the commodities markets, which may subject the Fund to greater volatility than investments in traditional securities, such as stocks and bonds. The commodities markets may fluctuate widely based on a variety of factors, including changes in overall market movements, domestic and foreign political and economic events and policies, war, acts of terrorism, changes in domestic or foreign interest rates and/ or investor expectations concerning interest rates, domestic and foreign inflation rates and investment and trading activities of mutual funds, hedge funds and commodities funds. Prices of various commodities may also be affected by factors such as drought, floods, weather, livestock disease, embargoes, tariffs and other regulatory developments. The prices of commodities can also fluctuate widely due to supply and demand disruptions in major producing or consuming regions. Because the Fund’s may be linked to the performance of potentially volatile commodities, investors should be willing to assume the risks of potentially significant fluctuations in the value of the Fund’s shares. |
| n | | Commodity-linked notes risk. The Fund’s investments in commodity-linked notes may involve substantial risks, including risk of loss of a significant portion of their principal value. In addition to risks associated with the underlying commodities, they may be subject to additional special risks, such as the lack of a secondary trading market and temporary price distortions due to speculators and/or the continuous rolling over of futures contracts underlying the notes. Commodity-linked notes are also subject to counterparty risk, which is the risk that the other party to the contract will not fulfill its contractual obligation to complete the transaction with the Fund. |
| n | | Credit risk. The issuer of instruments in which the Fund invests may be unable |
| | to meet interest and/or principal payments, thereby causing its instruments to decrease in value and lowering the issuer’s credit rating. |
| n | | Currency/exchange rate risk. The dollar value of the Fund’s foreign investments will be affected by changes in the exchange rates between the dollar and the currencies in which those investments are traded. |
| n | | Debt securities risk. The Fund may invest in debt securities that are affected by changing interest rates and changes in their effective maturities and credit quality. |
| n | | Derivatives risk. The value of a derivative instrument depends largely on (and is derived from) the value of an underlying security, currency, commodity, interest rate, index or other asset (each referred to as an underlying asset). In addition to risks relating to the underlying assets, the use of derivatives may include other, possibly greater, risks, including counterparty, leverage and liquidity risks. Counterparty risk is the risk that the counterparty to the derivative contract will default on its obligation to pay the Fund the amount owed or otherwise perform under the derivative contract. Derivatives create leverage risk because they do not require payment up front equal to the economic exposure created by owning the derivative. As a result, an adverse change in the value of the underlying asset could result in the Fund sustaining a loss that is substantially greater than the amount invested in the derivative, which may make the Fund’s returns more volatile and increase the risk of loss. Derivative instruments may also be less liquid than more traditional investments and the Fund may be unable to sell or close out its derivative positions at a desirable time or price. This risk may be more acute under adverse market conditions, during which the Fund may be most in need of liquidating its derivative positions. Derivatives may also be harder to value, less tax efficient and subject to changing government regulation that could impact the Fund’s ability to use certain derivatives or their cost. Also, derivatives used for hedging or to gain or limit exposure to a particular market segment may not provide |
continued on page 8
|
| This report must be accompanied or preceded by a currently effective Fund prospectus, which contains more complete information, including sales charges and expenses. Investors should read it carefully before investing. |
|
|
| NOT FDIC INSURED | MAY LOSE VALUE | NO BANK GUARANTEE |
|
| 7 Invesco Global Targeted Returns Fund |
continued from page 7
| | the expected benefits, particularly during adverse market conditions. These risks are greater for the Fund than mutual funds that do not use derivative instruments or that use derivative instruments to a lesser extent than the Fund to implement their investment strategy. |
| n | | Emerging markets securities risk. The prices of securities issued by foreign companies and governments located in emerging markets countries may be affected more negatively by inflation, devaluation of their currencies, higher transaction costs, delays in settlement, adverse political developments, the introduction of capital controls, withholding taxes, nationalization of private assets, expropriation, social unrest, war or lack of timely information than those in developed countries. |
| n | | Exchange-traded funds risk. An investment by the Fund in exchange-traded funds generally presents the same primary risks as an investment in a mutual fund. In addition, an exchange-traded fund may be subject to the following: (1) a discount of the exchange-traded fund’s shares to its net asset value; (2) failure to develop an active trading market for the exchange-traded fund’s shares; (3) the listing exchange halting trading of the exchange-traded fund’s shares; (4) failure of the exchange-traded fund’s shares to track the referenced asset; and (5) holding troubled securities in the referenced index or basket of investments. Exchange-traded funds may involve duplication of management fees and certain other expenses, as the Fund indirectly bears its proportionate share of any expenses paid by the exchange-traded funds in which it invests. Further, certain of the exchange-traded funds in which the Fund may invest are leveraged. The more the Fund invests in such leveraged exchange-traded funds, the more this leverage will magnify any losses on those investments. |
| n | | Exchange-traded notes risk. Exchange-traded notes are subject to credit risk, including the credit risk of the issuer, and the value of the exchange-traded note may drop due to a downgrade in the issuer’s credit rating, despite the underlying market benchmark or strategy remaining unchanged. The value of an exchange-traded note may also be influenced by time to maturity, level of supply and demand for the exchange-traded note, volatility and lack of liquidity in the underlying market, changes in the applicable interest rates, changes in the issuer’s credit rating, and economic, legal, political, |
| | or geographic events that affect the referenced underlying market or strategy. Exchange-traded notes are also subject to the risk that the other party to the contract will not fulfill its contractual obligations, which may cause losses or additional costs to the Fund. |
| n | | Foreign securities risk. The Fund’s foreign investments may be affected by changes in a foreign country’s exchange rates, political and social instability, changes in economic or taxation policies, difficulties when enforcing obligations, decreased liquidity, and increased volatility. Foreign companies may be subject to less regulation resulting in less publicly available information about the companies. |
| n | | Fund-of-funds risk. The Fund’s performance depends on the underlying funds in which it invests, and it is subject to the risks of the underlying funds. Market fluctuations may change the target weightings in the underlying funds. The underlying funds may change their investment objectives, policies or practices and may not achieve their investment objectives, all of which may cause the Fund to withdraw its investments therein at a disadvantageous time. |
| n | | Interest rate risk. Interest rate risk refers to the risk that bond prices generally fall as interest rates rise; conversely, bond prices generally rise as interest rates fall. Specific bonds differ in their sensitivity to changes in interest rates depending on their individual characteristics, including duration. |
| n | | Investing in the European Union risk. Many countries in the European Union are susceptible to high economic risks associated with high levels of debt, notably due to investments in sovereign debts of European countries such as Greece, Italy and Spain. One or more member states might exit the European Union, placing its currency and banking system in jeopardy. The European Union faces major issues involving its membership, structure, procedures and policies, including the adoption, abandonment or adjustment of the new constitutional treaty, the European Union’s enlargement to the south and east, and resolution of the European Union’s problematic fiscal and democratic accountability. Efforts of the member states to further unify their economic and monetary policies may increase the potential for the downward movement of one member state’s market to cause a similar effect on other member states’ |
| | markets. European countries that are part of the European Economic and Monetary Union may be significantly affected by the tight fiscal and monetary controls that the union seeks to impose on its members. |
| n | | Large capitalization company risk. Larger, more established companies may be unable to respond quickly to new competitive challenges such as changes in consumer tastes or innovative smaller competitors. Returns on investments in large capitalization companies could trail the returns on investments in smaller companies. |
| n | | Leverage risk. Leverage exists when the Fund purchases or sells an instrument or enters into a transaction without investing cash in an amount equal to the full economic exposure of the asset or transaction and the Fund could lose more than it invested. Leverage created from certain types of transactions or instruments may impair the Fund’s liquidity, cause it to liquidate positions at an unfavorable time, increase volatility or otherwise not achieve its intended objective. The Fund’s significant use of derivatives and leverage could, under certain market conditions, cause the Fund’s losses to be more significant than other mutual funds and, in extreme market conditions, could cause a complete loss of your investment. |
| n | | Liquidity risk. The Fund may hold illiquid securities that it is unable to sell at the preferred time or price and could lose its entire investment in such securities. The Fund’s significant use of derivative instruments may cause liquidity risk to be greater than other mutual funds that invest in more traditional assets such as stocks and bonds, which trade on markets with more market participants |
| n | | Management risk. The investment techniques and risk analysis used by the Fund’s portfolio managers may not produce the desired results. Because the Fund’s investment process relies heavily on its tactical asset allocation process, market movements that are counter to the portfolio managers’ expectations may have a significant adverse effect on the Fund’s net asset value. |
| n | | Market risk. The prices of and the income generated by the Fund’s securities may decline in response to, among other things, investor sentiment, general economic and market conditions, regional or global instability, and currency and interest rate fluctuations. |
continued on page 9
|
| 8 Invesco Global Targeted Returns Fund |
| n | | Non-diversification risk. The Fund is non-diversified and can invest a greater portion of its assets in a small number of issuers or a single issuer. A change in the value of the issuer could affect the value of the Fund more than if it was a diversified fund. Non-diversification may also permit the Fund to invest a greater percentage of its assets in one particular investment strategy than would be permitted if the Fund was diversified, thereby increasing the risk of losses in the Fund due to a single strategy. |
| n | | Short sales risk. Short sales may cause the Fund to repurchase a security at a higher price, thereby causing a loss. A short position in a security poses more risk than holding the same security long. As there is no limit on how much the price of the security can increase, the Fund’s exposure is unlimited. In order to establish a short position in a security, the Fund must borrow the security from a broker. The Fund may not always be able to borrow a security the Fund seeks to sell short at a particular time or at an acceptable price. The Fund also may not always be able to close out the short position by replacing the borrowed securities at a particular time or at an acceptable price. The Fund will incur increased transaction costs associated with selling securities short. In addition, taking short positions in securities results in a form of leverage which may cause the Fund to be volatile. |
| n | | Small- and mid-capitalization risks. Stocks of small- and mid-sized companies tend to be more vulnerable to adverse developments and may have little or no operating history or track record of success, and limited product lines, markets, management and financial resources. The securities of small- and mid-sized companies may be more volatile due to less market interest and less publicly available information about the issuer. They also may be illiquid or restricted as to resale, or may trade less frequently and in smaller volumes, all of which may cause difficulty when establishing or closing a position at a desirable price. |
| n | | Subsidiary risk. By investing in the Subsidiary, the Fund is indirectly exposed to risks associated with the Subsidiary’s investments. The Subsidiary is not registered under the Investment Company Act of 1940, as amended (1940 Act), and, except as otherwise noted in this prospectus is not subject to the investor protections of the 1940 Act. |
| | Changes in the laws of the United States and/or the Cayman Islands, under which the Fund and the Subsidiary, respectively, are organized, could result in the inability of the Fund and/or the Subsidiary to operate as described in this prospectus and could negatively affect the Fund and its shareholders. |
| n | | Tax risk. The tax treatment of commodity-linked and other derivative instruments may be adversely affected by changes in legislation, regulations or other legally binding authority. If, as a result of any such adverse action, the income of the Fund from certain commodity-linked or other derivatives was treated as non-qualifying income, the Fund might fail to qualify as a regulated investment company and be subject to federal income tax at the Fund level. The Internal Revenue Service has issued a number of private letter rulings to other mutual funds, including to another Invesco fund (upon which only the fund that received the private letter ruling can rely), which indicate that income from a fund’s investment in certain commodity linked notes and a wholly owned foreign subsidiary that invests in commodity-linked derivatives, such as the Subsidiary, constitutes qualifying income. However, the Internal Revenue Service suspended issuance of any further private letter rulings in July 2011 pending a review of its position. Should the Internal Revenue Service issue guidance, or Congress enact legislation, that adversely affects the tax treatment of the Fund’s use of commodity-linked notes or the Subsidiary (which guidance might be applied to the Fund retroactively), it could limit the Fund’s ability to pursue its investment strategy and the Fund might not qualify as a regulated investment company for one or more years. In this event, the Fund’s Board of Trustees (the Board) may authorize a significant change in investment strategy or Fund liquidation. The Fund also may incur transaction and other costs to comply with any new or additional guidance from the Internal Revenue Service. |
| n | | US government obligations risk. The Fund may invest in obligations issued by US Government agencies and instrumentalities that may receive varying levels of support from the government, which could affect the Fund’s ability to recover should they default. |
| n | | Volatility risk. The Fund may have investments that appreciate or decrease significantly in value over short periods |
| | of time. This may cause the Fund’s net asset value per share to experience significant increases or declines in value over short periods of time. |
About indexes used in this report
| n | | The U.S. Three-Month Treasury Bills Index is tracked by Lipper to provide performance for the three-month US Treasury bill. |
| n | | The Lipper Absolute Return Funds Index is an unmanaged index considered representative of absolute return funds tracked by Lipper. |
| n | | The MSCI World Index is an unmanaged index considered representative of stocks of developed countries. The index is computed using the net return, which withholds applicable taxes for non-resident investors. |
| n | | The Hang Seng China Enterprise Index is a free-float capitalization-weighted index comprised of H-Shares listed on the Hong Kong Stock Exchange and included in the Hang Seng Mainland Composite Index. |
| n | | The Hang Seng Mainland Composite Index comprises of the top 200 listed companies on the Hong Kong stock market. |
| n | | The Fund is not managed to track the performance of any particular index, including the index(es) described here, and consequently, the performance of the Fund may deviate significantly from the performance of the index(es). |
| n | | A direct investment cannot be made in an index. Unless otherwise indicated, index results include reinvested dividends, and they do not reflect sales charges. Performance of the peer group, if applicable, reflects fund expenses; performance of a market index does not. |
Other information
| n | | The returns shown in management’s discussion of Fund performance are based on net asset values (NAVs) calculated for shareholder transactions. Generally accepted accounting principles require adjustments to be made to the net assets of the Fund at period end for financial reporting purposes, and as such, the NAVs for shareholder transactions and the returns based on those NAVs may differ from the NAVs and returns reported in the Financial Highlights. |
|
| 9 Invesco Global Targeted Returns Fund |
Schedule of Investments
October 31, 2014
Schedule of Investments in Affiliated Issuers–70.89%(a)
| | | | | | | | | | | | | | | | | | | | | | | | | | | | | | | | | | | | |
| | | % of
Net
Assets
10/31/14 | | | Value
12/19/13
(Commencement
Date) | | | Purchases
at Cost | | | Proceeds
from Sales | | | Change in
Unrealized
Appreciation
(Depreciation) | | | Realized
Gain | | | Dividend
Income | | | Shares
10/31/14 | | | Value
10/31/14 | |
Domestic Equity Funds–16.45% | |
Invesco Comstock
Fund(b) | | | 10.21 | % | | $ | — | | | $ | 4,100,823 | | | $ | — | | | $ | 219,851 | | | $ | — | | | $ | 40,497 | | | | 171,116 | | | $ | 4,320,674 | |
Invesco Diversified Dividend Fund(b) | | | 6.24 | % | | | — | | | | 2,484,750 | | | | — | | | | 156,936 | | | | — | | | | 27,450 | | | | 145,387 | | | | 2,641,686 | |
Total Domestic Equity Funds | | | | | | | — | | | | 6,585,573 | | | | — | | | | 376,787 | | | | — | | | | 67,947 | | | | 316,503 | | | | 6,962,360 | |
|
Fixed-Income Funds–11.90% | |
Invesco High Yield
Fund(b) | | | 11.90 | % | | | — | | | | 5,125,880 | | | | — | | | | (87,514 | ) | | | — | | | | 192,672 | | | | 1,139,902 | | | | 5,038,366 | |
|
Foreign Equity Funds–33.17% | |
Invesco Asia Pacific Growth Fund(c) | | | 12.59 | % | | | — | | | | 4,955,400 | | | | — | | | | 374,533 | | | | — | | | | — | | | | 158,865 | | | | 5,329,933 | |
Invesco European Growth Fund(c) | | | 10.20 | % | | | — | | | | 4,441,739 | | | | — | | | | (122,531 | ) | | | — | | | | — | | | | 114,811 | | | | 4,319,208 | |
Invesco International Growth Fund(b) | | | 10.38 | % | | | — | | | | 4,312,891 | | | | — | | | | 80,431 | | | | — | | | | — | | | | 126,245 | | | | 4,393,322 | |
Total Foreign Equity Funds | | | | | | | — | | | | 13,710,030 | | | | — | | | | 332,433 | | | | — | | | | — | | | | 399,921 | | | | 14,042,463 | |
|
Money Market Funds–9.37% | |
Liquid Assets Portfolio–Institutional Class | | | 4.68 | % | | | — | | | | 27,878,177 | | | | (25,894,786 | ) | | | — | | | | — | | | | 1,198 | | | | 1,983,391 | | | | 1,983,391 | |
Premier Portfolio–Institutional Class | | | 4.69 | % | | | — | | | | 27,878,177 | | | | (25,894,785 | ) | | | — | | | | — | | | | 376 | | | | 1,983,392 | | | | 1,983,392 | |
Total Money Market Funds | | | | | | | — | | | | 55,756,354 | | | | (51,789,571 | ) | | | — | | | | — | | | | 1,574 | | | | 3,966,783 | | | | 3,966,783 | |
TOTAL INVESTMENTS IN AFFILIATED ISSUERS (Cost $29,388,266) | | | 70.89 | % | | $ | — | | | $ | 81,177,837 | | | $ | (51,789,571 | ) | | $ | 621,706 | | | $ | — | | | $ | 262,193 | | | | | | | $ | 30,009,972 | |
| | | | | | | | | |
| | | | | | | | | | | | | | | | | | | | | | | | Principal
Amount | | | | |
|
Sovereign Debt–4.84%(d) | |
Hungary Government Bond (Hungary), Series 23, Class A, Unsec. Bonds, 6.00%, 11/24/23 | | | | | | | | | | | | HUF 88,330,000 | | | | 418,096 | |
Poland Government Bond (Poland), Series 1023, Unsec. Bonds, 4.00%, 10/25/23 | | | | | | | | | | | | PLN 2,468,000 | | | | 823,049 | |
South Africa Government Bond (South Africa), Series R186, Unsec. Bonds, 10.50%, 12/21/26 | | | | | | | | | | | | ZAR 7,418,000 | | | | 808,506 | |
Total Sovereign Debt (Cost $2,100,806) | | | | | | | | | | | | | | | | | | | | 2,049,651 | |
OPTIONS PURCHASED–7.17% (Cost $3,227,300) | | | | | | | | | | | | | | | | | | | | 3,033,813 | |
TOTAL INVESTMENTS–82.90% (Cost $34,716,372) | | | | | | | | | | | | | | | | | | | | 35,093,436 | |
OTHER ASSETS LESS LIABILITIES–17.10% | | | | | | | | | | | | | | | | | | | | 7,239,348 | |
NET ASSETS–100.00% | | | | | | | | | | | | | | | | | | | $ | 42,332,784 | |
Abbreviations:
| | |
| HUF | | – Hungarian Forint |
| PLN | | – Polish Zloty |
| Unsec. | | – Unsecured |
| ZAR | | – South African Rand |
Notes to Schedule of Investments:
| (a) | Each underlying fund and the Fund are affiliated by either having the same investment adviser or an investment adviser under common control with the Fund’s investment adviser. |
| (b) | The Fund invests in Class R6 shares of the mutual funds listed. |
| (c) | The Fund invests in Class Y shares of the mutual funds listed. |
| (d) | Foreign denominated security. Principal amount is denominated in the currency indicated. |
See accompanying Notes to Financial Statements which are an integral part of the financial statements.
10 Invesco Global Targeted Returns Fund
| | | | | | | | | | | | | | | | | | | | | | | | | | | | |
| Open Over-The-Counter Index Options Purchased | |
| Description | | Type of
Contract | | | Broker/Counterparty | | | Expiration
Date | | | Number of
Contracts | | | Strike
Price | | | Notional
Value(e) | | | Value | |
Hang Seng China Enterprises Index | | | Put | | | | Morgan Stanley Capital Services LLC | | | | 12/30/15 | | | | 24 | | | HKD | 9,600 | | | HKD | 11,520,000 | | | $ | 83,194 | |
Hang Seng China Enterprises Index | | | Put | | | | Morgan Stanley Capital Services LLC | | | | 12/30/15 | | | | 85 | | | HKD | 10,000 | | | HKD | 42,500,000 | | | | 382,665 | |
Hang Seng China Enterprises Index | | | Put | | | | Morgan Stanley Capital Services LLC | | | | 12/30/15 | | | | 5 | | | HKD | 8,800 | | | HKD | 2,200,000 | | | | 9,895 | |
Hang Seng China Enterprises Index | | | Put | | | | Morgan Stanley Capital Services LLC | | | | 12/30/15 | | | | 7 | | | HKD | 9,200 | | | HKD | 3,220,000 | | | | 18,428 | |
Hang Seng China Enterprises Index | | | Put | | | | Morgan Stanley Capital Services LLC | | | | 12/30/15 | | | | 7 | | | HKD | 8,400 | | | HKD | 2,940,000 | | | | 10,368 | |
Subtotal — Over-The-Counter Index Put Options Purchased | | | | | | | | 128 | | | | | | | | | | | $ | 504,550 | |
|
| Open Exchange-Traded Index Options Purchased | |
DAX Index | | | Call | | | | Bank of America Merrill Lynch | | | | 06/19/15 | | | | 2 | | | EUR | 10,600 | | | EUR | 106,000 | | | $ | 861 | |
DAX Index | | | Call | | | | Morgan Stanley Capital Services LLC | | | | 06/19/15 | | | | 63 | | | EUR | 10,600 | | | EUR | 3,339,000 | | | | 27,118 | |
UKX Index | | | Call | | | | Bank of America Merrill Lynch | | | | 12/16/16 | | | | 3 | | | GBP | 6,200 | | | GBP | 186,000 | | | | 28,460 | |
UKX Index | | | Call | | | | Morgan Stanley Capital Services LLC | | | | 12/16/16 | | | | 44 | | | GBP | 6,200 | | | GBP | 2,728,000 | | | | 417,420 | |
Subtotal — Exchange-Traded Index Call Options Purchased | | | | | | | | 112 | | | | | | | | | | | $ | 473,859 | |
FTSE MIB Index | | | Put | | | | Bank of America Merrill Lynch | | | | 06/19/15 | | | | 74 | | | EUR | 18,500 | | | EUR | 3,422,500 | | | $ | 249,210 | |
SX5E Index | | | Put | | | | Bank of America Merrill Lynch | | | | 06/19/15 | | | | 24 | | | EUR | 2,800 | | | EUR | 672,000 | | | | 27,097 | |
SX5E Index | | | Put | | | | Goldman Sachs International | | | | 06/19/15 | | | | 10 | | | EUR | 2,650 | | | EUR | 265,000 | | | | 7,293 | |
SX5E Index | | | Put | | | | Morgan Stanley Capital Services LLC | | | | 06/19/15 | | | | 74 | | | EUR | 2,600 | | | EUR | 1,924,000 | | | | 46,550 | |
SX5E Index | | | Put | | | | UBS | | | | 06/19/15 | | | | 96 | | | EUR | 2,700 | | | EUR | 2,592,000 | | | | 81,081 | |
SX5E Index | | | Put | | | | UBS | | | | 06/19/15 | | | | 52 | | | EUR | 2,800 | | | EUR | 1,456,000 | | | | 58,710 | |
SX7E Index | | | Put | | | | Bank of America Merrill Lynch | | | | 12/18/15 | | | | 137 | | | EUR | 140 | | | EUR | 959,000 | | | | 136,911 | |
SX7E Index | | | Put | | | | Deutsche Bank Securities Inc. | | | | 12/18/15 | | | | 42 | | | EUR | 130 | | | EUR | 273,000 | | | | 29,473 | |
SX7E Index | | | Put | | | | Goldman Sachs International | | | | 12/18/15 | | | | 24 | | | EUR | 140 | | | EUR | 168,000 | | | | 23,984 | |
SX7E Index | | | Put | | | | Morgan Stanley Capital Services LLC | | | | 12/18/15 | | | | 7 | | | EUR | 130 | | | EUR | 45,500 | | | | 4,912 | |
SX7E Index | | | Put | | | | UBS | | | | 12/18/15 | | | | 70 | | | EUR | 130 | | | EUR | 455,000 | | | | 49,122 | |
SX7E Index | | | Put | | | | UBS | | | | 12/18/15 | | | | 1 | | | EUR | 140 | | | EUR | 7,000 | | | | 999 | |
UKX Index | | | Put | | | | Bank of America Merrill Lynch | | | | 12/18/15 | | | | 3 | | | GBP | 6,400 | | | GBP | 192,000 | | | | 20,278 | |
UKX Index | | | Put | | | | Goldman Sachs International | | | | 12/18/15 | | | | 1 | | | GBP | 6,400 | | | GBP | 64,000 | | | | 6,759 | |
UKX Index | | | Put | | | | Morgan Stanley Capital Services LLC | | | | 12/18/15 | | | | 9 | | | GBP | 6,300 | | | GBP | 567,000 | | | | 54,713 | |
UKX Index | | | Put | | | | UBS | | | | 12/18/15 | | | | 2 | | | GBP | 6,500 | | | GBP | 130,000 | | | | 15,006 | |
UKX Index | | | Put | | | | UBS | | | | 12/18/15 | | | | 15 | | | GBP | 6,600 | | | GBP | 990,000 | | | | 125,024 | |
Subtotal — Exchange-Traded Index Put Options Purchased | | | | | | | | 641 | | | | | | | | | | | $ | 937,122 | |
Total Index Options Purchased — Market Risk | | | | | | | | 881 | | | | | | | | | | | $ | 1,915,531 | |
Abbreviations:
| | |
| EUR | | – Euro |
| GBP | | – British Pound Sterling |
| HKD | | – Hong Kong Dollar |
| (e) | Notional Value is calculated by multiplying the Number of Contracts by the Strike Price by the multiplier. |
| | | | | | | | | | | | | | | | | | | | | | | | | | | | | | |
| Open Over-The-Counter Swaptions Purchased | |
| Description | | Type of
Contract | | | Counterparty | | Exercise
Rate | | | Pay/Receive
Exercise Rate | | | Floating Rate Index | | | Expiration
Date | | | Notional
Value | | | Value | |
5 Year Interest Rate Swap | | | Call | | | Barclays | | | 3.84 | % | | | Receive | | | | 3 Month USD LIBOR | | | | 08/22/24 | | | $ | 432,000 | | | $ | 32,239 | |
5 Year Interest Rate Swap | | | Call | | | Barclays | | | 3.90 | | | | Receive | | | | 3 Month USD LIBOR | | | | 08/01/24 | | | | 5,760,000 | | | | 444,131 | |
5 Year Interest Rate Swap | | | Call | | | Morgan Stanley Capital Services LLC | | | 3.70 | | | | Receive | | | | 3 Month USD LIBOR | | | | 09/03/24 | | | | 6,217,000 | | | | 429,693 | |
5 Year Interest Rate Swap | | | Call | | | Morgan Stanley Capital Services LLC | | | 3.75 | | | | Receive | | | | 3 Month USD LIBOR | | | | 09/04/24 | | | | 2,988,000 | | | | 212,219 | |
Total Swaptions Purchased — Interest Rate Risk | | | | | | | | | | | $ | 1,118,282 | |
Total Options Purchased (Cost $3,227,300) | | | | | | | | | | | $ | 3,033,813 | |
Abbreviations:
| | |
| LIBOR | | – London interbank offer rate |
| USD | | – U.S. Dollar |
See accompanying Notes to Financial Statements which are an integral part of the financial statements.
11 Invesco Global Targeted Returns Fund
| | | | | | | | | | | | | | | | | | | | | | | | | | | | | | | | | | | | |
| Open Over-The-Counter Index Options Written | |
| Description | | Type of
Contract | | | Counterparty | | | Expiration
Date | | | Number of
Contracts | | | Strike
Price | | | Premiums
Received | | | Notional
Value(e) | | | Value | | | Unrealized
Appreciation
(Depreciation) | |
DAX Index | | | Put | | | | Morgan Stanley Capital Services LLC | | | | 11/21/14 | | | | 5 | | | EUR | 8,900 | | | $ | 5,430 | | | EUR | 222,500 | | | $ | 1,270 | | | $ | 4,160 | |
DAX Index | | | Put | | | | Morgan Stanley Capital Services LLC | | | | 11/21/14 | | | | 6 | | | EUR | 8,700 | | | | 4,834 | | | EUR | 261,000 | | | | 855 | | | | 3,979 | |
DAX Index | | | Put | | | | Morgan Stanley Capital Services LLC | | | | 11/21/14 | | | | 6 | | | EUR | 8,800 | | | | 5,620 | | | EUR | 264,000 | | | | 1,138 | | | | 4,482 | |
DAX Index | | | Put | | | | Morgan Stanley Capital Services LLC | | | | 01/16/15 | | | | 8 | | | EUR | 8,250 | | | | 9,663 | | | EUR | 330,000 | | | | 2,660 | | | | 7,003 | |
DAX Index | | | Put | | | | Morgan Stanley Capital Services LLC | | | | 01/16/15 | | | | 7 | | | EUR | 8,300 | | | | 9,056 | | | EUR | 290,500 | | | | 2,503 | | | | 6,553 | |
DAX Index | | | Put | | | | Morgan Stanley Capital Services LLC | | | | 01/16/15 | | | | 7 | | | EUR | 8,350 | | | | 9,789 | | | EUR | 292,250 | | | | 2,691 | | | | 7,098 | |
Subtotal — Over-The-Counter Index Put Options Written | | | | 39 | | | | | | | $ | 44,392 | | | | | | | $ | 11,117 | | | $ | 33,275 | |
|
| Open Exchange-Traded Index Options Written(f) | |
CAC Index | | | Call | | | | UBS | | | | 06/19/15 | | | | 71 | | | EUR | 4,700 | | | $ | 80,598 | | | EUR | 3,337,000 | | | $ | 27,750 | | | $ | 52,848 | |
CAC Index | | | Call | | | | Bank of America Merrill Lynch | | | | 06/19/15 | | | | 2 | | | EUR | 4,700 | | | | 1,010 | | | EUR | 94,000 | | | | 782 | | | | 228 | |
SMI Index | | | Call | | | | Bank of America Merrill Lynch | | | | 12/16/16 | | | | 3 | | | CHF | 7,800 | | | | 28,905 | | | CHF | 234,000 | | | | 33,308 | | | | (4,403 | ) |
SMI Index | | | Call | | | | Morgan Stanley Capital Services LLC | | | | 12/16/16 | | | | 51 | | | CHF | 7,800 | | | | 564,134 | | | CHF | 3,978,000 | | | | 566,237 | | | | (2,103 | ) |
Subtotal — Exchange-Traded Index Call Options Written | | | | | | | | 127 | | | | | | | $ | 674,647 | | | | | | | $ | 628,077 | | | $ | 46,570 | |
DAX Index | | | Put | | | | Bank of America Merrill Lynch | | | | 11/21/14 | | | | 1 | | | EUR | 8,800 | | | $ | 696 | | | EUR | 44,000 | | | $ | 217 | | | $ | 479 | |
DAX Index | | | Put | | | | Bank of America Merrill Lynch | | | | 11/21/14 | | | | 4 | | | EUR | 9,100 | | | | 2,529 | | | EUR | 182,000 | | | | 2,075 | | | | 454 | |
DAX Index | | | Put | | | | Bank of America Merrill Lynch | | | | 12/19/14 | | | | 1 | | | EUR | 8,800 | | | | 1,058 | | | EUR | 44,000 | | | | 557 | | | | 501 | |
DAX Index | | | Put | | | | Bank of America Merrill Lynch | | | | 12/19/14 | | | | 7 | | | EUR | 9,100 | | | | 3,398 | | | EUR | 318,500 | | | | 6,833 | | | | (3,435 | ) |
DAX Index | | | Put | | | | Bank of America Merrill Lynch | | | | 12/19/14 | | | | 7 | | | EUR | 9,200 | | | | 3,983 | | | EUR | 322,000 | | | | 8,258 | | | | (4,275 | ) |
DAX Index | | | Put | | | | Bank of America Merrill Lynch | | | | 12/19/14 | | | | 7 | | | EUR | 9,300 | | | | 4,737 | | | EUR | 325,500 | | | | 9,956 | | | | (5,219 | ) |
IBEX 35 mini Futures | | | Put | | | | Bank of America Merrill Lynch | | | | 06/19/15 | | | | 358 | | | EUR | 9,500 | | | | 133,533 | | | EUR | 3,401,000 | | | | 170,472 | | | | (36,939 | ) |
SPX Index | | | Put | | | | Morgan Stanley Capital
Services LLC | | | | 11/22/14 | | | | 3 | | | USD | 18,400 | | | | 6,295 | | | USD | 552,000 | | | | 413 | | | | 5,882 | |
SPX Index | | | Put | | | | Morgan Stanley Capital Services LLC | | | | 11/22/14 | | | | 3 | | | USD | 18,600 | | | | 6,895 | | | USD | 558,000 | | | | 570 | | | | 6,325 | |
SPX Index | | | Put | | | | Morgan Stanley Capital Services LLC | | | | 11/22/14 | | | | 2 | | | USD | 18,800 | | | | 5,595 | | | USD | 376,000 | | | | 500 | | | | 5,095 | |
SPX Index | | | Put | | | | Morgan Stanley Capital Services LLC | | | | 11/22/14 | | | | 2 | | | USD | 19,000 | | | | 4,055 | | | USD | 380,000 | | | | 640 | | | | 3,415 | |
SPX Index | | | Put | | | | Morgan Stanley Capital Services LLC | | | | 12/20/14 | | | | 3 | | | USD | 18,800 | | | | 4,615 | | | USD | 564,000 | | | | 3,045 | | | | 1,570 | |
SPX Index | | | Put | | | | Morgan Stanley Capital Services LLC | | | | 12/20/14 | | | | 3 | | | USD | 19,000 | | | | 5,395 | | | USD | 570,000 | | | | 3,705 | | | | 1,690 | |
SPX Index | | | Put | | | | Morgan Stanley Capital Services LLC | | | | 12/20/14 | | | | 4 | | | USD | 19,200 | | | | 8,455 | | | USD | 768,000 | | | | 6,000 | | | | 2,455 | |
SPX Index | | | Put | | | | Morgan Stanley Capital Services LLC | | | | 01/17/15 | | | | 4 | | | USD | 17,500 | | | | 12,495 | | | USD | 700,000 | | | | 2,760 | | | | 9,735 | |
SPX Index | | | Put | | | | Morgan Stanley Capital Services LLC | | | | 01/17/15 | | | | 3 | | | USD | 17,600 | | | | 9,625 | | | USD | 528,000 | | | | 2,235 | | | | 7,390 | |
SPX Index | | | Put | | | | Morgan Stanley Capital Services LLC | | | | 01/17/15 | | | | 3 | | | USD | 17,700 | | | | 10,345 | | | USD | 531,000 | | | | 2,415 | | | | 7,930 | |
SX5E Index | | | Put | | | | Bank of America Merrill Lynch | | | | 06/19/15 | | | | 12 | | | EUR | 3,100 | | | | 31,867 | | | EUR | 372,000 | | | | 30,811 | | | | 1,056 | |
SX5E Index | | | Put | | | | Goldman Sachs International | | | | 06/19/15 | | | | 5 | | | EUR | 2,950 | | | | 19,486 | | | EUR | 147,500 | | | | 8,615 | | | | 10,871 | |
SX5E Index | | | Put | | | | Morgan Stanley Capital Services LLC | | | | 06/19/15 | | | | 37 | | | EUR | 2,950 | | | | 164,846 | | | EUR | 1,091,500 | | | | 63,751 | | | | 101,095 | |
SX5E Index | | | Put | | | | UBS | | | | 06/19/15 | | | | 48 | | | EUR | 3,000 | | | | 172,219 | | | EUR | 1,440,000 | | | | 94,795 | | | | 77,424 | |
SX5E Index | | | Put | | | | UBS | | | | 06/19/15 | | | | 26 | | | EUR | 3,100 | | | | 50,386 | | | EUR | 806,000 | | | | 66,758 | | | | (16,372 | ) |
Subtotal — Exchange-Traded Index Put Options Written | | | | | | | | 543 | | | | | | | $ | 662,508 | | | | | | | $ | 485,381 | | | $ | 177,127 | |
Total Index Options Written — Market Risk | | | | | | | | 709 | | | | | | | $ | 1,381,547 | | | | | | | $ | 1,124,575 | | | $ | 256,972 | |
Currency Abbreviations:
| | |
| EUR | | – Euro |
| CHF | | – Swiss Franc |
| USD | | – United States Dollar |
| (e) | Notional Value is calculated by multiplying the Number of Contracts by the Strike Price by the multiplier. |
| (f) | Index options written collateralized by $3,936,169 cash held with Bank of America Merrill Lynch. |
See accompanying Notes to Financial Statements which are an integral part of the financial statements.
12 Invesco Global Targeted Returns Fund
| | | | | | | | | | | | | | | | | | | | | | | | | | | | | | | | | | | | | | |
| Open Over-The-Counter Swaptions Written | |
| Description | | Type of
Contract | | | Counterparty | | Exercise
Rate | | | Pay/Receive
Exercise Rate | | | Floating
Rate Index | | | Expiration
Date | | | Premiums
Received | | | Notional
Value | | | Value | | | Unrealized
Appreciation
(Depreciation) | |
5 Year Interest Rate Swap | | | Call | | | Barclays Bank PLC | | | 2.65 | % | | | Receive | | |
| 6 Month
GBP LIBOR |
| | | 09/05/16 | | | $ | 137,053 | | | GBP | 3,900,000 | | | $ | 175,217 | | | $ | (38,164 | ) |
5 Year Interest Rate Swap | | | Call | | | Barclays Bank PLC | | | 3.06 | | | | Receive | | |
| 6 Month
GBP LIBOR |
| | | 04/04/16 | | | | 30,658 | | | GBP | 800,000 | | | | 55,606 | | | | (24,948 | ) |
5 Year Interest Rate Swap | | | Call | | | Goldman Sachs
International | | | 3.49 | | | | Receive | | |
| 3 Month
USD LIBOR |
| | | 10/17/24 | | | | 142,813 | | | USD | 2,130,000 | | | | 130,647 | | | | 12,166 | |
5 Year Interest Rate Swap | | | Call | | | Goldman Sachs International | | | 3.02 | | | | Receive | | |
| 6 Month
GBP LIBOR |
| | | 02/24/16 | | | | 310,634 | | | GBP | 8,000,000 | | | | 544,361 | | | | (233,727 | ) |
5 Year Interest Rate Swap | | | Call | | | Morgan Stanley Capital
Services LLC | | | 2.60 | | | | Receive | | |
| 6 Month
GBP LIBOR |
| | | 09/02/16 | | | | 101,432 | | | GBP | 2,891,000 | | | | 123,230 | | | | (21,798 | ) |
5 Year Interest Rate Swap | | | Call | | | Morgan Stanley Capital
Services LLC | | | 2.67 | | | | Receive | | |
| 6 Month
GBP LIBOR |
| | | 08/22/16 | | | | 37,554 | | | GBP | 1,100,000 | | | | 50,579 | | | | (13,025 | ) |
5 Year Interest Rate Swap | | | Call | | | Morgan Stanley Capital
Services LLC | | | 2.87 | | | | Receive | | |
| 6 Month
GBP LIBOR |
| | | 07/25/16 | | | | 31,417 | | | GBP | 900,000 | | | | 50,874 | | | | (19,457 | ) |
5 Year Interest Rate Swap | | | Call | | | Morgan Stanley Capital
Services LLC | | | 2.93 | | | | Receive | | |
| 6 Month
GBP LIBOR |
| | | 08/04/16 | | | | 171,903 | | | GBP | 4,850,000 | | | | 288,231 | | | | (116,328 | ) |
Total Swaptions Written — Interest Rate Risk | | | $ | 963,464 | | | | | | | $ | 1,418,745 | | | $ | (455,281 | ) |
Total — Options Written | | | | | | | | | | | | | | | | | | $ | 2,345,011 | | | | | | | $ | 2,543,320 | | | $ | (198,309 | ) |
Abbreviations:
| | |
| GBP | | – British Pound Sterling |
| LIBOR | | – London Interbank Offered Rate |
| | | | | | | | | | | | | | | | | | | | | | | | |
| Options Written Transactions | |
| | | Call Options | |
| | | Number of
Contracts* | | | Notional
Value | | | Notional
Value | | | Notional
Value | | | Notional
Value | | | Premiums
Received | |
Beginning of period | | | — | | | | — | | | | — | | | | — | | | | — | | | $ | — | |
Written | | | 369 | | | CHF | 13,639,000 | | | EUR | 8,457,000 | | | GBP | 22,441,000 | | | USD | 2,130,000 | | | | 2,913,958 | |
Closed | | | (242 | ) | | CHF | (9,427,000 | ) | | EUR | (5,026,000 | ) | | | — | | | | — | | | | (1,275,847 | ) |
Exercised | | | — | | | | — | | | | — | | | | — | | | | — | | | | — | |
Expired | | | — | | | | — | | | | — | | | | — | | | | — | | | | — | |
End of period | | | 127 | | | CHF | 4,212,000 | | | EUR | 3,431,000 | | | GBP | 22,441,000 | | | USD | 2,130,000 | | | $ | 1,638,111 | |
| | | | | | | | | | | | | | | | |
| |
| | | Put Options | |
| | | Number of
Contracts* | | | Notional
Value | | | Notional
Value | | | Premiums
Received | |
Beginning of period | | | — | | | | — | | | | — | | | $ | — | |
Written | | | 1,325 | | | EUR | 18,719,900 | | | USD | 35,710,500 | | | | 1,797,061 | |
Closed | | | (611 | ) | | EUR | (6,547,900 | ) | | USD | (14,700,000 | ) | | | (920,226 | ) |
Exercised | | | — | | | | — | | | | — | | | | — | |
Expired | | | (132 | ) | | EUR | (2,017,750 | ) | | USD | (15,483,500 | ) | | | (169,935 | ) |
End of period | | | 582 | | | EUR | 10,154,250 | | | USD | 5,527,000 | | | $ | 706,900 | |
| * | Does not include swaptions written. |
| | | | | | | | | | | | | | | | | | | | |
| Open Futures Contracts(g) | |
| Futures Contracts | | Type of
Contract | | | Number of
Contracts | | | Expiration
Month | | | Notional
Value | | | Unrealized
Appreciation
(Depreciation) | |
Long Gilt | | | Long | | | | 14 | | | | December-2014 | | | $ | 2,577,918 | | | $ | 59,082 | |
Euro OAT 10 Year | | | Short | | | | 14 | | | | December-2014 | | | | (2,541,337 | ) | | | (29,699 | ) |
Subtotal — Interest Rate Risk | | | | | | | | | | | | | | | | | | $ | 29,383 | |
CAA Index | | | Long | | | | 115 | | | | December-2014 | | | $ | 1,016,671 | | | $ | (80,990 | ) |
FTSE 100 Index | | | Long | | | | 35 | | | | December-2014 | | | | 3,642,625 | | | | (34,283 | ) |
Hang Seng China Enterprises Index | | | Long | | | | 50 | | | | November-2014 | | | | 3,463,205 | | | | 10,613 | |
See accompanying Notes to Financial Statements which are an integral part of the financial statements.
13 Invesco Global Targeted Returns Fund
| | | | | | | | | | | | | | | | | | | | |
| Futures Contracts | | Type of
Contract | | | Number of
Contracts | | | Expiration
Month | | | Notional
Value | | | Unrealized
Appreciation
(Depreciation) | |
Dow Jones EURO STOXX 50 | | | Short | | | | 43 | | | | December-2014 | | | $ | (1,670,921 | ) | | $ | 14,452 | |
E-Mini S&P 500 Index | | | Short | | | | 43 | | | | December-2014 | | | | (4,324,510 | ) | | | (54,954 | ) |
MSCI AC Asia Index | | | Short | | | | 18 | | | | December-2014 | | | | (680,017 | ) | | | 13,585 | |
Nikkei 225 | | | Short | | | | 6 | | | | December-2014 | | | | (439,809 | ) | | | (22,732 | ) |
Russell 2000 Index Mini | | | Short | | | | 24 | | | | December-2014 | | | | (2,810,400 | ) | | | (54,857 | ) |
SPI 200 Index | | | Short | | | | 14 | | | | December-2014 | | | | (1,699,544 | ) | | | (3,543 | ) |
STOXX Europe 600 Index | | | Short | | | | 176 | | | | December-2014 | | | | (3,699,653 | ) | | | 38,023 | |
Subtotal — Market Risk | | | | | | | | | | | | | | | | | | $ | (174,686 | ) |
Total — Futures Contracts | | | | | | | | | | | | | | | | | | $ | (145,303 | ) |
| (g) | Futures contracts collateralized by $1,733,058 cash held with Bank of America Securities LLC, the futures commission merchant. |
| | | | | | | | | | | | | | | | | | | | | | | | | | | | | | | | |
| Open Centrally Cleared Credit Default Swap Agreements(i) | |
| Counterparty/Clearinghouse | | Reference Entity | | | Buy/Sell
Protection | | | (Pay)/Receive
Fixed Rate | | | Implied
Credit
Spread(h) | | | Expiration
Date | | | Notional
Value | | | Upfront
Payments | | | Unrealized
Appreciation
(Depreciation) | |
Credit Suisse First Boston/ICE | | | Markit iTraxx Europe Index | | | | Sell | | | | 1.00 | % | | | 1.06 | % | | | December-2024 | | | EUR | 4,590,000 | | | $ | (25,289 | ) | | $ | (9,869 | ) |
Credit Suisse First Boston/ICE | | | Markit iTraxx Europe Index | | | | Sell | | | | 1.00 | | | | 1.06 | | | | December-2024 | | | EUR | 2,985 | | | | (48 | ) | | | 28 | |
Credit Suisse First Boston/ICE | | | Markit iTraxx Europe Index | | | | Sell | | | | 1.00 | | | | 1.06 | | | | December-2024 | | | EUR | 761,500 | | | | (6,813 | ) | | | 1,495 | |
Credit Suisse First Boston/ICE | | | Markit iTraxx Europe Index | | | | Sell | | | | 1.00 | | | | 1.06 | | | | December-2024 | | | EUR | 930,000 | | | | (9,209 | ) | | | 2,616 | |
Credit Suisse First Boston/ICE | | | Markit iTraxx Europe Index | | | | Sell | | | | 1.00 | | | | 1.06 | | | | December-2024 | | | EUR | 5,624,000 | | | | (43,953 | ) | | | (644 | ) |
Credit Suisse First Boston/ICE | | | Markit iTraxx Europe Index | | | | Buy | | | | (1.00 | ) | | | 0.65 | | | | December-2019 | | | EUR | 761,500 | | | | (15,935 | ) | | | (913 | ) |
Credit Suisse First Boston/ICE | | | Markit iTraxx Europe Index | | | | Buy | | | | (1.00 | ) | | | 0.65 | | | | December-2019 | | | EUR | 2,211,000 | | | | (46,352 | ) | | | (2,920 | ) |
Credit Suisse First Boston/ICE | | | Markit iTraxx Europe Index | | | | Buy | | | | (1.00 | ) | | | 0.65 | | | | December-2019 | | | EUR | 779,000 | | | | (16,331 | ) | | | (1,029 | ) |
Credit Suisse First Boston/ICE | | | Markit iTraxx Europe Index | | | | Buy | | | | (1.00 | ) | | | 0.65 | | | | December-2019 | | | EUR | 2,634,000 | | | | (55,220 | ) | | | (3,479 | ) |
Credit Suisse First Boston/ICE | | | Markit iTraxx Europe Index | | | | Buy | | | | (1.00 | ) | | | 0.65 | | | | December-2019 | | | EUR | 4,590,000 | | | | (99,954 | ) | | | 8,394 | |
Credit Suisse First Boston/ICE | | | Markit iTraxx Europe Index | | | | Buy | | | | (1.00 | ) | | | 0.65 | | | | December-2019 | | | EUR | 297,000 | | | | (5,786 | ) | | | (838 | ) |
Credit Suisse First Boston/ICE | | | Markit iTraxx Europe Index | | | | Buy | | | | (1.00 | ) | | | 0.65 | | | | December-2019 | | | EUR | 633,000 | | | | (12,332 | ) | | | (1,786 | ) |
Credit Suisse First Boston/ICE | | | Markit iTraxx Europe Index | | | | Buy | | | | (1.00 | ) | | | 0.65 | | | | December-2019 | | | EUR | 2,985 | | | | (51 | ) | | | (16 | ) |
Credit Suisse First Boston/CME | | | Markit iTraxx Europe Index | | | | Buy | | | | (5.00 | ) | | | 3.42 | | | | December-2019 | | | USD | 2,500,000 | | | | (173,175 | ) | | | (1,450 | ) |
Total — Credit Default Swap Agreements — Credit Risk | | | | | | | | | | | $ | (510,448 | ) | | $ | (10,411 | ) |
Abbreviations:
| | |
| CME | | – Chicago Mercantile Exchange |
| EUR | | – Euro |
| | |
| ICE | | – Intercontinental Exchange |
| USD | | – U.S. Dollar |
| (h) | Implied credit spreads represent the current level as of October 31, 2014 at which protection could be bought or sold given the terms of the existing credit default swap contract and serve as an indicator of the current status of the payment/performance risk of the credit default swap contract. An implied credit spread that has widened or increased since entry into the initial contract may indicate a deteriorating credit profile and increased risk of default for the reference entity. A declining or narowing spread may indicate an improving credit profile or decreased risk of default for the reference entity. Alternatively, credit spreads may increase or decrease reflecting the general tolerance for risk in the credit spread markets generally. |
| (i) | Centrally cleared swap agreements collateralized by $1,050,078 cash held with Credit Suisse First Boston. |
| | | | | | | | | | | | | | | | | | | | | | | | |
| Open Centrally Cleared Interest Rate Swap Agreements(i) | |
| Counterparty/Clearinghouse | | Pay/Receive
Floating Rate | | | Floating Rate Index | | | Fixed Rate | | | Termination
Date | | | Notional
Value | | | Unrealized
Appreciation
(Depreciation) | |
Credit Suisse First Boston/CME | | | Receive | | | | 6 Month EUR LIBOR | | | | 3.43 | % | | | December-2033 | | | EUR | 2,726,625 | | | $ | (312,440 | ) |
Credit Suisse First Boston/CME | | | Receive | | | | 6 Month EUR LIBOR | | | | 1.58 | | | | June-2024 | | | EUR | 258,580 | | | | (17,724 | ) |
Credit Suisse First Boston/CME | | | Receive | | | | 6 Month EUR LIBOR | | | | 1.39 | | | | July-2024 | | | EUR | 445,380 | | | | (19,209 | ) |
Credit Suisse First Boston/CME | | | Receive | | | | 6 Month EUR LIBOR | | | | 1.20 | | | | August-2024 | | | EUR | 362,000 | | | | (6,121 | ) |
Credit Suisse First Boston/CME | | | Receive | | | | 6 Month EUR LIBOR | | | | 1.15 | | | | September-2024 | | | EUR | 1,263,000 | | | | (13,394 | ) |
Credit Suisse First Boston/CME | | | Receive | | | | 6 Month EUR LIBOR | | | | 1.13 | | | | October-2024 | | | EUR | 532,304 | | | | (4,119 | ) |
Credit Suisse First Boston/CME | | | Receive | | | | 6 Month EUR LIBOR | | | | 3.10 | | | | June-2034 | | | EUR | 193,935 | | | | (14,517 | ) |
Credit Suisse First Boston/CME | | | Receive | | | | 6 Month EUR LIBOR | | | | 2.80 | | | | July-2034 | | | EUR | 334,035 | | | | (13,489 | ) |
See accompanying Notes to Financial Statements which are an integral part of the financial statements.
14 Invesco Global Targeted Returns Fund
| | | | | | | | | | | | | | | | | | | | | | | | |
| Counterparty/Clearinghouse | | Pay/Receive
Floating Rate | | | Floating Rate Index | | | Fixed Rate | | | Termination
Date | | | Notional
Value | | | Unrealized
Appreciation
(Depreciation) | |
Credit Suisse First Boston/CME | | | Receive | | | | 6 Month EUR LIBOR | | | | 2.40 | % | | | August-2034 | | | EUR | 271,000 | | | $ | 912 | |
Credit Suisse First Boston/CME | | | Receive | | | | 6 Month EUR LIBOR | | | | 2.55 | | | | September-2034 | | | EUR | 947,000 | | | | (11,933 | ) |
Credit Suisse First Boston/CME | | | Receive | | | | 6 Month EUR LIBOR | | | | 2.53 | | | | October-2034 | | | EUR | 362,174 | | | | (3,941 | ) |
Credit Suisse First Boston/CME | | | Receive | | | | 6 Month EUR LIBOR | | | | 2.84 | | | | March-2048 | | | EUR | 215,040 | | | | (51,627 | ) |
Credit Suisse First Boston/CME | | | Receive | | | | 6 Month EUR LIBOR | | | | 2.68 | | | | June-2048 | | | EUR | 155,148 | | | | (28,374 | ) |
Credit Suisse First Boston/CME | | | Receive | | | | 6 Month EUR LIBOR | | | | 2.41 | | | | July-2048 | | | EUR | 267,228 | | | | (25,210 | ) |
Credit Suisse First Boston/CME | | | Receive | | | | 6 Month EUR LIBOR | | | | 2.10 | | | | August-2048 | | | EUR | 217,000 | | | | 538 | |
Credit Suisse First Boston/CME | | | Receive | | | | 6 Month EUR LIBOR | | | | 2.31 | | | | September-2048 | | | EUR | 758,000 | | | | (44,204 | ) |
Credit Suisse First Boston/CME | | | Receive | | | | 6 Month EUR LIBOR | | | | 2.19 | | | | October-2048 | | | EUR | 289,130 | | | | (6,601 | ) |
Credit Suisse First Boston/CME | | | Receive | | | | 6 Month JPY LIBOR | | | | 0.67 | | | | July-2024 | | | JPY | 453,969,000 | | | | (37,611 | ) |
Credit Suisse First Boston/CME | | | Receive | | | | 6 Month JPY LIBOR | | | | 0.67 | | | | July-2024 | | | JPY | 42,588,000 | | | | (3,494 | ) |
Credit Suisse First Boston/CME | | | Receive | | | | 6 Month JPY LIBOR | | | | 0.64 | | | | September-2024 | | | JPY | 121,952,000 | | | | (6,157 | ) |
Credit Suisse First Boston/CME | | | Receive | | | | 6 Month JPY LIBOR | | | | 0.64 | | | | October-2024 | | | JPY | 36,551,087 | | | | (1,507 | ) |
Credit Suisse First Boston/CME | | | Receive | | | | 6 Month EUR LIBOR | | | | 1.81 | | | | March-2024 | | | EUR | 358,400 | | | | (35,752 | ) |
Credit Suisse First Boston/CME | | | Receive | | | | 6 Month EUR LIBOR | | | | 2.10 | | | | December-2023 | | | EUR | 3,635,500 | | | | (505,307 | ) |
Credit Suisse First Boston/CME | | | Receive | | | | 6 Month EUR LIBOR | | | | 3.26 | | | | March-2034 | | | EUR | 268,800 | | | | (25,204 | ) |
Credit Suisse First Boston/CME | | | Receive | | | | 6 Month EUR LIBOR | | | | 3.04 | | | | December-2047 | | | EUR | 2,181,300 | | | | (685,121 | ) |
Credit Suisse First Boston/CME | | | Pay | | | | 6 Month EUR LIBOR | | | | 2.85 | | | | March-2028 | | | EUR | 537,600 | | | | 73,013 | |
Credit Suisse First Boston/CME | | | Pay | | | | 6 Month EUR LIBOR | | | | 2.63 | | | | June-2028 | | | EUR | 387,870 | | | | 39,077 | |
Credit Suisse First Boston/CME | | | Pay | | | | 6 Month EUR LIBOR | | | | 2.32 | | | | July-2028 | | | EUR | 668,070 | | | | 38,474 | |
Credit Suisse First Boston/CME | | | Pay | | | | 6 Month EUR LIBOR | | | | 1.98 | | | | August-2028 | | | EUR | 543,000 | | | | 7,883 | |
Credit Suisse First Boston/CME | | | Pay | | | | 6 Month EUR LIBOR | | | | 2.06 | | | | September-2028 | | | EUR | 1,895,000 | | | | 42,030 | |
Credit Suisse First Boston/CME | | | Pay | | | | 6 Month EUR LIBOR | | | | 1.98 | | | | October-2028 | | | EUR | 727,391 | | | | 8,475 | |
Credit Suisse First Boston/CME | | | Pay | | | | 6 Month GBP LIBOR | | | | 3.06 | | | | April-2021 | | | GBP | 400,000 | | | | 23,909 | |
Credit Suisse First Boston/CME | | | Pay | | | | 6 Month GBP LIBOR | | | | 2.87 | | | | July-2021 | | | GBP | 450,000 | | | | 16,976 | |
Credit Suisse First Boston/CME | | | Pay | | | | 6 Month GBP LIBOR | | | | 2.93 | | | | August-2021 | | | GBP | 2,425,000 | | | | 101,580 | |
Credit Suisse First Boston/CME | | | Pay | | | | 6 Month GBP LIBOR | | | | 2.67 | | | | August-2021 | | | GBP | 550,000 | | | | 11,251 | |
Credit Suisse First Boston/CME | | | Pay | | | | 6 Month GBP LIBOR | | | | 2.65 | | | | August-2021 | | | GBP | 2,280,000 | | | | 41,720 | |
Credit Suisse First Boston/CME | | | Pay | | | | 6 Month GBP LIBOR | | | | 2.60 | | | | September-2021 | | | GBP | 1,445,500 | | | | 20,827 | |
Credit Suisse First Boston/CME | | | Pay | | | | 6 Month GBP LIBOR | | | | 2.65 | | | | September-2021 | | | GBP | 1,950,000 | | | | 35,316 | |
Credit Suisse First Boston/CME | | | Pay | | | | 6 Month GBP LIBOR | | | | 2.44 | | | | October-2021 | | | GBP | 1,570,000 | | | | 375 | |
Credit Suisse First Boston/CME | | | Pay | | | | 6 Month GBP LIBOR | | | | 2.33 | | | | October-2021 | | | GBP | 1,060,000 | | | | (8,752 | ) |
Credit Suisse First Boston/CME | | | Pay | | | | 6 Month JPY LIBOR | | | | 2.29 | | | | July-2034 | | | JPY | 518,822,000 | | | | 92,025 | |
Credit Suisse First Boston/CME | | | Pay | | | | 6 Month JPY LIBOR | | | | 2.30 | | | | July-2034 | | | JPY | 48,672,000 | | | | 8,684 | |
Credit Suisse First Boston/CME | | | Pay | | | | 6 Month JPY LIBOR | | | | 2.23 | | | | September-2034 | | | JPY | 139,374,000 | | | | 14,796 | |
Credit Suisse First Boston/CME | | | Pay | | | | 6 Month JPY LIBOR | | | | 2.25 | | | | October-2034 | | | JPY | 41,773,696 | | | | 5,023 | |
Credit Suisse First Boston/CME | | | Pay | | | | 3 Month USD LIBOR | | | | 4.46 | | | | March-2034 | | | USD | 375,000 | | | | 23,150 | |
Credit Suisse First Boston/CME | | | Pay | | | | 3 Month USD LIBOR | | | | 4.15 | | | | June-2034 | | | USD | 262,500 | | | | 10,510 | |
Credit Suisse First Boston/CME | | | Pay | | | | 3 Month USD LIBOR | | | | 3.92 | | | | July-2034 | | | USD | 450,000 | | | | 10,747 | |
Credit Suisse First Boston/CME | | | Pay | | | | 3 Month USD LIBOR | | | | 3.75 | | | | August-2034 | | | USD | 360,000 | | | | 4,483 | |
Credit Suisse First Boston/CME | | | Pay | | | | 3 Month USD LIBOR | | | | 3.72 | | | | September-2034 | | | USD | 1,245,000 | | | | 13,028 | |
Credit Suisse First Boston/CME | | | Pay | | | | 6 Month GBP LIBOR | | | | 3.02 | | | | February-2021 | | | GBP | 4,000,000 | | | | 237,110 | |
Credit Suisse First Boston/CME | | | Pay | | | | 6 Month EUR LIBOR | | | | 3.20 | | | | December-2027 | | | EUR | 5,453,250 | | | | 1,027,765 | |
Credit Suisse First Boston/CME | | | Pay | | | | 3 Month USD LIBOR | | | | 4.78 | | | | December-2033 | | | USD | 3,750,000 | | | | 315,161 | |
Total — Interest Rate Swap Agreements — Interest Rate Risk | | | $ | 343,030 | |
Abbreviations:
| | |
| CME | | – Chicago Mercantile Exchange |
| EUR | | – Euro |
| GBP | | – British Pound Sterling |
| | |
| JPY | | – Japanese Yen |
| LIBOR | | – London Interbank Offered Rate |
| USD | | – United States Dollar |
| (i) | Centrally cleared swap agreements collateralized by $1,050,078 cash held with Credit Suisse First Boston. |
See accompanying Notes to Financial Statements which are an integral part of the financial statements.
15 Invesco Global Targeted Returns Fund
| | | | | | | | | | | | | | | | | | | | |
| Open Over-The-Counter Interest Rate Swap Agreements | |
| Counterparty | | Pay/Receive
Floating Rate | | Floating
Rate Index | | Fixed Rate | | | Termination
Date | | | Notional
Value | | | Unrealized
Appreciation
(Depreciation) | |
Barclays Bank PLC | | Pay | | 3 Month BBR | | | 3.41 | % | | | September-2018 | | | AUD | 2,668,000 | | | $ | 11,591 | |
Barclays Bank PLC | | Pay | | 3 Month STIBOR | | | 2.80 | | | | December-2023 | | | SEK | 32,651,000 | | | | 546,362 | |
Citigroup Global Markets Inc. | | Pay | | 3 Month STIBOR | | | 1.72 | | | | October-2024 | | | SEK | 4,394,783 | | | | 13,312 | |
J.P. Morgan Chase Bank, N.A. | | Pay | | 3 Month STIBOR | | | 2.45 | | | | March-2024 | | | SEK | 3,173,200 | | | | 39,824 | |
Morgan Stanley Capital Services LLC | | Pay | | 3 Month STIBOR | | | 1.79 | | | | August-2024 | | | SEK | 3,312,000 | | | | 13,495 | |
Morgan Stanley Capital Services LLC | | Pay | | 3 Month BBR | | | 3.53 | | | | September-2018 | | | AUD | 11,053,260 | | | | 66,619 | |
Morgan Stanley Capital Services LLC | | Pay | | 3 Month BBR | | | 3.34 | | | | October-2018 | | | AUD | 984,261 | | | | 2,653 | |
Morgan Stanley Capital Services LLC | | Pay | | 3 Month STIBOR | | | 2.16 | | | | June-2024 | | | SEK | 2,337,930 | | | | 20,727 | |
Royal Bank of Scotland Securities Inc. | | Pay | | 3 Month STIBOR | | | 1.69 | | | | September-2024 | | | SEK | 11,616,000 | | | | 31,187 | |
Royal Bank of Scotland Securities Inc. | | Pay | | 3 Month STIBOR | | | 1.88 | | | | July-2024 | | | SEK | 4,099,680 | | | | 21,527 | |
Total — Interest Rate Swap Agreements — Interest Rate Risk | | | | | | | | | | | $ | 767,297 | |
Abbreviations:
| | |
| AUD | | – Australian Dollar |
| BBR | | – Bank Base Rate |
| SEK | | – Swedish Krona |
| STIBOR | | – Stockholm Interbank Offered Rate |
| | | | | | | | | | | | | | | | | | | | |
| Open Over-The-Counter Variance Swap Agreements | |
| Counterparty | | Reference Entity | | Pay/Receive
Variance | | Volatility
Strike Rate | | | Expiration
Date | | | Notional
Value | | | Unrealized
Appreciation
(Depreciation) | |
Deutsche Bank Securities Inc. | | S&P 500 Index | | Pay | | | 18.10 | % | | | December-2014 | | | USD | (1,800 | ) | | $ | 9,471 | |
Deutsche Bank Securities Inc. | | S&P 500 Index | | Pay | | | 18.70 | | | | December-2014 | | | USD | (17,500 | ) | | | 97,943 | |
Goldman Sachs International | | S&P 500 Index | | Pay | | | 15.00 | | | | December-2014 | | | USD | (14,700 | ) | | | 32,233 | |
Goldman Sachs International | | S&P 500 Index | | Pay | | | 17.00 | | | | December-2014 | | | USD | (1,750 | ) | | | 7,491 | |
Goldman Sachs International | | S&P 500 Index | | Pay | | | 18.85 | | | | December-2014 | | | USD | (3,500 | ) | | | 19,944 | |
Goldman Sachs International | | S&P 500 Index | | Pay | | | 19.40 | | | | December-2015 | | | USD | (4,686 | ) | | | (723 | ) |
HSBC New York | | S&P 500 Index | | Pay | | | 17.90 | | | | December-2015 | | | USD | (6,000 | ) | | | (2,909 | ) |
HSBC New York | | S&P 500 Index | | Pay | | | 18.00 | | | | December-2014 | | | USD | (3,500 | ) | | | 17,451 | |
HSBC New York | | S&P 500 Index | | Pay | | | 18.10 | | | | December-2015 | | | USD | (2,500 | ) | | | (56 | ) |
HSBC New York | | S&P 500 Index | | Pay | | | 18.30 | | | | December-2015 | | | USD | (4,200 | ) | | | (948 | ) |
J.P. Morgan Chase Bank, N.A. | | S&P 500 Index | | Pay | | | 18.90 | | | | December-2014 | | | USD | (17,500 | ) | | | 100,387 | |
Morgan Stanley Capital Services LLC | | S&P 500 Index | | Pay | | | 18.00 | | | | December-2014 | | | USD | (2,500 | ) | | | 13,147 | |
Morgan Stanley Capital Services LLC | | S&P 500 Index | | Pay | | | 18.30 | | | | December-2015 | | | USD | (6,720 | ) | | | (3,985 | ) |
Morgan Stanley Capital Services LLC | | S&P 500 Index | | Pay | | | 18.35 | | | | December-2015 | | | USD | (11,620 | ) | | | (9,247 | ) |
Morgan Stanley Capital Services LLC | | S&P 500 Index | | Pay | | | 18.40 | | | | December-2014 | | | USD | (1,600 | ) | | | 8,757 | |
Morgan Stanley Capital Services LLC | | S&P 500 Index | | Pay | | | 18.40 | | | | December-2015 | | | USD | (5,790 | ) | | | (3,816 | ) |
UBS | | S&P 500 Index | | Pay | | | 17.15 | | | | December-2014 | | | USD | (1,750 | ) | | | 7,687 | |
UBS | | S&P 500 Index | | Pay | | | 18.10 | | | | December-2015 | | | USD | (2,500 | ) | | | (56 | ) |
Deutsche Bank Securities Inc. | | Hang Seng China Enterprise Index | | Receive | | | 28.20 | | | | December-2014 | | | HKD | 13,900 | | | | (16,368 | ) |
Deutsche Bank Securities Inc. | | Hang Seng China Enterprise Index | | Receive | | | 30.90 | | | | December-2015 | | | HKD | 158,920 | | | | (81,894 | ) |
Goldman Sachs International | | Hang Seng China Enterprise Index | | Receive | | | 22.10 | | | | December-2014 | | | HKD | 56,976 | | | | (31,278 | ) |
Goldman Sachs International | | Hang Seng China Enterprise Index | | Receive | | | 25.65 | | | | December-2015 | | | HKD | 14,873 | | | | (498 | ) |
Goldman Sachs International | | Hang Seng China Enterprise Index | | Receive | | | 26.10 | | | | December-2014 | | | HKD | 13,589 | | | | (13,694 | ) |
Goldman Sachs International | | Hang Seng China Enterprise Index | | Receive | | | 27.20 | | | | December-2015 | | | HKD | 15,252 | | | | (1,189 | ) |
Goldman Sachs International | | Hang Seng China Enterprise Index | | Receive | | | 28.00 | | | | December-2015 | | | HKD | 33,372 | | | | (5,907 | ) |
Goldman Sachs International | | Hang Seng China Enterprise Index | | Receive | | | 28.60 | | | | December-2014 | | | HKD | 13,589 | | | | (16,430 | ) |
Goldman Sachs International | | Hang Seng China Enterprise Index | | Receive | | | 31.35 | | | | December-2015 | | | HKD | 15,918 | | | | (8,998 | ) |
HSBC New York | | Hang Seng China Enterprise Index | | Receive | | | 25.50 | | | | December-2015 | | | HKD | 15,500 | | | | (2,472 | ) |
HSBC New York | | Hang Seng China Enterprise Index | | Receive | | | 25.60 | | | | December-2015 | | | HKD | 38,759 | | | | (8,173 | ) |
HSBC New York | | Hang Seng China Enterprise Index | | Receive | | | 26.05 | | | | December-2015 | | | HKD | 16,276 | | | | (3,487 | ) |
See accompanying Notes to Financial Statements which are an integral part of the financial statements.
16 Invesco Global Targeted Returns Fund
| | | | | | | | | | | | | | | | | | | | | | |
| Counterparty | | Reference Entity | | Pay/Receive
Variance | | | Volatility
Strike Rate | | | Expiration
Date | | | Notional
Value | | | Unrealized
Appreciation
(Depreciation) | |
HSBC New York | | Hang Seng China Enterprise Index | | | Receive | | | | 27.00 | % | | | December-2015 | | | HKD | 52,749 | | | $ | (2,785 | ) |
HSBC New York | | Hang Seng China Enterprise Index | | | Receive | | | | 27.50 | | | | December-2014 | | | HKD | 13,566 | | | | (14,599 | ) |
HSBC New York | | Hang Seng China Enterprise Index | | | Receive | | | | 27.75 | | | | December-2015 | | | HKD | 19,066 | | | | (2,791 | ) |
J.P. Morgan Chase Bank, N.A. | | Hang Seng China Enterprise Index | | | Receive | | | | 28.00 | | | | December-2014 | | | HKD | 135,664 | | | | (152,053 | ) |
Morgan Stanley Capital Services LLC | | Hang Seng China Enterprise Index | | | Receive | | | | 22.40 | | | | December-2015 | | | HKD | 26,040 | | | | 8,578 | |
Morgan Stanley Capital Services LLC | | Hang Seng China Enterprise Index | | | Receive | | | | 25.25 | | | | December-2015 | | | HKD | 20,569 | | | | (494 | ) |
Morgan Stanley Capital Services LLC | | Hang Seng China Enterprise Index | | | Receive | | | | 25.70 | | | | December-2015 | | | HKD | 45,029 | | | | (3,871 | ) |
Morgan Stanley Capital Services LLC | | Hang Seng China Enterprise Index | | | Receive | | | | 27.40 | | | | December-2014 | | | HKD | 9,700 | | | | (10,798 | ) |
Societe Generale | | Hang Seng China Enterprise Index | | | Receive | | | | 26.45 | | | | December-2015 | | | HKD | 680 | | | | 12 | |
Deutsche Bank Securities Inc. | | Hang Seng Index | | | Receive | | | | 21.90 | | | | December-2014 | | | HKD | 135,664 | | | | (109,605 | ) |
Goldman Sachs International | | Hang Seng Index | | | Receive | | | | 17.70 | | | | December-2014 | | | HKD | 56,976 | | | | (23,382 | ) |
Goldman Sachs International | | Hang Seng Index | | | Receive | | | | 21.80 | | | | December-2015 | | | HKD | 14,873 | | | | (497 | ) |
Goldman Sachs International | | Hang Seng Index | | | Receive | | | | 22.80 | | | | December-2014 | | | HKD | 13,589 | | | | (12,567 | ) |
HSBC New York | | Hang Seng Index | | | Receive | | | | 21.05 | | | | December-2015 | | | HKD | 15,500 | | | | (1,289 | ) |
HSBC New York | | Hang Seng Index | | | Receive | | | | 21.40 | | | | December-2015 | | | HKD | 16,276 | | | | (1,747 | ) |
HSBC New York | | Hang Seng Index | | | Receive | | | | 22.00 | | | | December-2014 | | | HKD | 13,566 | | | | (10,993 | ) |
Morgan Stanley Capital Services LLC | | Hang Seng Index | | | Receive | | | | 21.35 | | | | December-2015 | | | HKD | 20,569 | | | | (331 | ) |
Morgan Stanley Capital Services LLC | | Hang Seng Index | | | Receive | | | | 21.40 | | | | December-2014 | | | HKD | 9,700 | | | | (7,694 | ) |
Morgan Stanley Capital Services LLC | | Hang Seng Index | | | Receive | | | | 21.60 | | | | December-2015 | | | HKD | 45,029 | | | | (2,140 | ) |
Morgan Stanley Capital Services LLC | | Hang Seng Index | | | Receive | | | | 21.80 | | | | December-2014 | | | HKD | 16,000 | | | | (13,268 | ) |
Morgan Stanley Capital Services LLC | | Hang Seng Index | | | Receive | | | | 25.80 | | | | December-2015 | | | HKD | 26,040 | | | | (14,500 | ) |
UBS | | Hang Seng Index | | | Receive | | | | 21.00 | | | | December-2014 | | | HKD | 13,589 | | | | (10,428 | ) |
UBS | | Hang Seng Index | | | Receive | | | | 21.00 | | | | December-2015 | | | HKD | 31,007 | | | | (3,303 | ) |
Total — Variance Swap Agreements — Market Risk | | | $ | (288,162 | ) |
Currency Abbreviations:
| | |
| HKD | | – Hong Kong Dollar |
| USD | | – United States Dollar |
| | | | | | | | | | | | | | | | | | | | |
| Open Over-The-Counter Volatility Swap Agreements | |
| Counterparty | | Reference Entity | | Pay/Receive
Volatility | | Volatility
Strike Rate | | | Expiration
Date | | | Notional
Value | | | Unrealized
Appreciation
(Depreciation) | |
Citigroup Global Markets Inc. | | USD/JPY | | Pay | | | 9.60 | % | | | October-2016 | | | USD | (6,457 | ) | | $ | (2,430 | ) |
Deutsche Bank Securities Inc. | | USD/JPY | | Pay | | | 8.75 | | | | July-2016 | | | USD | (4,500 | ) | | | (3,944 | ) |
Deutsche Bank Securities Inc. | | USD/JPY | | Pay | | | 9.00 | | | | June-2016 | | | USD | (1,578 | ) | | | (625 | ) |
Deutsche Bank Securities Inc. | | USD/JPY | | Pay | | | 9.05 | | | | June-2016 | | | USD | (2,625 | ) | | | (718 | ) |
Deutsche Bank Securities Inc. | | USD/JPY | | Pay | | | 9.45 | | | | September-2016 | | | USD | (12,450 | ) | | | (5,494 | ) |
Deutsche Bank Securities Inc. | | USD/JPY | | Pay | | | 9.60 | | | | August-2016 | | | USD | (3,600 | ) | | | (780 | ) |
Goldman Sachs International | | USD/JPY | | Pay | | | 9.05 | | | | June-2016 | | | USD | (36,000 | ) | | | (12,469 | ) |
Royal Bank of Scotland Securities Inc. | | USD/JPY | | Pay | | | 8.90 | | | | June-2016 | | | USD | (4,000 | ) | | | (1,947 | ) |
Royal Bank of Scotland Securities Inc. | | USD/JPY | | Pay | | | 9.20 | | | | September-2016 | | | USD | (2,585 | ) | | | (1,733 | ) |
Citigroup Global Markets Inc. | | AUD/JPY | | Receive | | | 10.675 | | | | October-2016 | | | AUD | 2,984 | | | | 436 | |
Deutsche Bank Securities Inc. | | AUD/JPY | | Receive | | | 10.25 | | | | July-2016 | | | AUD | 4,763 | | | | 587 | |
Deutsche Bank Securities Inc. | | AUD/JPY | | Receive | | | 10.70 | | | | June-2016 | | | AUD | 4,000 | | | | (1,836 | ) |
Deutsche Bank Securities Inc. | | AUD/JPY | | Receive | | | 10.70 | | | | June-2016 | | | AUD | 4,107 | | | | (1,885 | ) |
Deutsche Bank Securities Inc. | | AUD/JPY | | Receive | | | 10.70 | | | | September-2016 | | | AUD | 13,339 | | | | (2 | ) |
Deutsche Bank Securities Inc. | | AUD/JPY | | Receive | | | 10.90 | | | | June-2016 | | | AUD | 2,794 | | | | (1,946 | ) |
Goldman Sachs International | | AUD/JPY | | Receive | | | 11.00 | | | | June-2016 | | | AUD | 36,000 | | | | (25,581 | ) |
Royal Bank of Scotland Securities Inc. | | AUD/JPY | | Receive | | | 10.80 | | | | September-2016 | | | AUD | 2,767 | | | | (257 | ) |
See accompanying Notes to Financial Statements which are an integral part of the financial statements.
17 Invesco Global Targeted Returns Fund
| | | | | | | | | | | | | | | | | | | | |
| Counterparty | | Reference Entity | | Pay/Receive
Volatility | | Volatility
Strike Rate | | | Expiration
Date | | | Notional
Value | | | Unrealized
Appreciation
(Depreciation) | |
Royal Bank of Scotland Securities Inc. | | AUD/JPY | | Receive | | | 10.90 | % | | | August-2016 | | | AUD | 3,881 | | | $ | (941 | ) |
Total — Volatility Swap Agreements — Currency Risk | | | | | | | | | | | | | | $ | (61,565 | ) |
Currency Abbreviations:
| | |
| AUD | | – Australian Dollar |
| JPY | | – Japanese Yen |
| USD | | – United States Dollar |
| | | | | | | | | | | | | | | | | | | | | | | | | | |
| Open Forward Foreign Currency Contracts | |
Settlement
Date | | Counterparty | | Contract to | | | Notional
Value | | | Unrealized
Appreciation
(Depreciation) | |
| | | | | | Deliver | | | | | | Receive | | | |
11/21/2014 | | State Street Bank & Trust Co. | | | AUD | | | | 713,646 | | | | USD | | | | 625,517 | | | $ | 627,122 | | | $ | (1,605 | ) |
11/21/2014 | | State Street Bank & Trust Co. | | | CHF | | | | 1,416,453 | | | | USD | | | | 1,504,225 | | | | 1,472,374 | | | | 31,851 | |
11/21/2014 | | State Street Bank & Trust Co. | | | EUR | | | | 2,570,069 | | | | USD | | | | 3,295,633 | | | | 3,221,077 | | | | 74,556 | |
11/21/2014 | | State Street Bank & Trust Co. | | | GBP | | | | 230,000 | | | | USD | | | | 369,172 | | | | 367,898 | | | | 1,274 | |
11/21/2014 | | State Street Bank & Trust Co. | | | HKD | | | | 4,813,000 | | | | USD | | | | 620,471 | | | | 620,636 | | | | (165 | ) |
11/21/2014 | | State Street Bank & Trust Co. | | | JPY | | | | 22,589,000 | | | | USD | | | | 211,816 | | | | 201,157 | | | | 10,659 | |
11/21/2014 | | State Street Bank & Trust Co. | | | SEK | | | | 6,883,000 | | | | USD | | | | 960,290 | | | | 932,110 | | | | 28,180 | |
11/21/2014 | | State Street Bank & Trust Co. | | | USD | | | | 139,421 | | | | AUD | | | | 159,000 | | | | 139,722 | | | | 301 | |
11/21/2014 | | State Street Bank & Trust Co. | | | USD | | | | 186,847 | | | | CHF | | | | 177,000 | | | | 183,988 | | | | (2,859 | ) |
11/21/2014 | | State Street Bank & Trust Co. | | | USD | | | | 249,270 | | | | EUR | | | | 197,000 | | | | 246,901 | | | | (2,369 | ) |
11/21/2014 | | State Street Bank & Trust Co. | | | USD | | | | 367,009 | | | | GBP | | | | 227,741 | | | | 364,285 | | | | (2,724 | ) |
11/21/2014 | | State Street Bank & Trust Co. | | | USD | | | | 235,539 | | | | HKD | | | | 1,827,000 | | | | 235,592 | | | | 53 | |
11/21/2014 | | State Street Bank & Trust Co. | | | USD | | | | 49,556 | | | | JPY | | | | 5,357,000 | | | | 47,704 | | | | (1,852 | ) |
11/21/2014 | | State Street Bank & Trust Co. | | | USD | | | | 138,612 | | | | SEK | | | | 996,000 | | | | 134,881 | | | | (3,731 | ) |
11/25/2014 | | Deutsche Bank Securities Inc. | | | AUD | | | | 55,490 | | | | USD | | | | 51,599 | | | | 48,749 | | | | 2,850 | |
11/25/2014 | | Deutsche Bank Securities Inc. | | | CAD | | | | 959,146 | | | | USD | | | | 880,191 | | | | 850,584 | | | | 29,607 | |
11/25/2014 | | Deutsche Bank Securities Inc. | | | CHF | | | | 165,086 | | | | USD | | | | 177,282 | | | | 171,609 | | | | 5,673 | |
11/25/2014 | | Deutsche Bank Securities Inc. | | | CLP | | | | 979,921,300 | | | | USD | | | | 1,640,585 | | | | 1,691,143 | | | | (50,558 | ) |
11/25/2014 | | Deutsche Bank Securities Inc. | | | CNY | | | | 13,102,000 | | | | USD | | | | 2,116,982 | | | | 2,130,378 | | | | (13,396 | ) |
11/25/2014 | | Deutsche Bank Securities Inc. | | | EUR | | | | 391,611 | | | | USD | | | | 507,314 | | | | 490,823 | | | | 16,491 | |
11/25/2014 | | Deutsche Bank Securities Inc. | | | GBP | | | | 209,792 | | | | USD | | | | 342,619 | | | | 335,565 | | | | 7,054 | |
11/25/2014 | | Deutsche Bank Securities Inc. | | | THB | | | | 7,702,200 | | | | USD | | | | 240,168 | | | | 235,867 | | | | 4,301 | |
11/25/2014 | | Deutsche Bank Securities Inc. | | | USD | | | | 1,753,535 | | | | BRL | | | | 4,026,116 | | | | 1,612,245 | | | | (141,290 | ) |
11/25/2014 | | Deutsche Bank Securities Inc. | | | USD | | | | 2,105,648 | | | | INR | | | | 129,550,000 | | | | 2,103,084 | | | | (2,564 | ) |
11/25/2014 | | Goldman Sachs International | | | AUD | | | | 32,946 | | | | USD | | | | 28,953 | | | | 28,944 | | | | 9 | |
11/25/2014 | | Goldman Sachs International | | | BRL | | | | 4,768,767 | | | | USD | | | | 1,964,396 | | | | 1,909,637 | | | | 54,759 | |
11/25/2014 | | Goldman Sachs International | | | CAD | | | | 171,048 | | | | USD | | | | 153,028 | | | | 151,688 | | | | 1,340 | |
11/25/2014 | | Goldman Sachs International | | | CHF | | | | 70,959 | | | | USD | | | | 74,240 | | | | 73,763 | | | | 477 | |
11/25/2014 | | Goldman Sachs International | | | CNY | | | | 1,360,148 | | | | USD | | | | 220,474 | | | | 221,159 | | | | (685 | ) |
11/25/2014 | | Goldman Sachs International | | | EUR | | | | 165,692 | | | | USD | | | | 210,129 | | | | 207,669 | | | | 2,460 | |
11/25/2014 | | Goldman Sachs International | | | GBP | | | | 88,073 | | | | USD | | | | 141,777 | | | | 140,874 | | | | 903 | |
11/25/2014 | | Goldman Sachs International | | | IDR | | | | 1,081,226,556 | | | | USD | | | | 89,172 | | | | 89,115 | | | | 57 | |
11/25/2014 | | Goldman Sachs International | | | KRW | | | | 62,670,278 | | | | USD | | | | 59,948 | | | | 58,348 | | | | 1,600 | |
11/25/2014 | | Goldman Sachs International | | | PHP | | | | 3,994,280 | | | | USD | | | | 90,468 | | | | 88,897 | | | | 1,571 | |
11/25/2014 | | Goldman Sachs International | | | SGD | | | | 63,523 | | | | USD | | | | 50,242 | | | | 49,435 | | | | 807 | |
11/25/2014 | | Goldman Sachs International | | | THB | | | | 1,948,990 | | | | USD | | | | 60,129 | | | | 59,685 | | | | 444 | |
11/25/2014 | | Goldman Sachs International | | | USD | | | | 325,054 | | | | BRL | | | | 742,651 | | | | 297,392 | | | | (27,662 | ) |
11/25/2014 | | Goldman Sachs International | | | USD | | | | 2,070,331 | | | | CLP | | | | 1,248,617,200 | | | | 2,154,856 | | | | 84,525 | |
11/25/2014 | | Royal Bank of Scotland Securities Inc. | | | CLP | | | | 268,695,900 | | | | USD | | | | 453,878 | | | | 463,714 | | | | (9,836 | ) |
11/25/2014 | | State Street Bank & Trust Co. | | | AUD | | | | 373,121 | | | | USD | | | | 346,850 | | | | 327,795 | | | | 19,055 | |
11/25/2014 | | State Street Bank & Trust Co. | | | CAD | | | | 3,988,359 | | | | USD | | | | 3,663,886 | | | | 3,536,932 | | | | 126,954 | |
See accompanying Notes to Financial Statements which are an integral part of the financial statements.
18 Invesco Global Targeted Returns Fund
| | | | | | | | | | | | | | | | | | | | | | | | | | |
Settlement
Date | | Counterparty | | Contract to | | | Notional
Value | | | Unrealized
Appreciation
(Depreciation) | |
| | | | | | Deliver | | | | | | Receive | | | |
11/25/2014 | | State Street Bank & Trust Co. | | | CHF | | | | 673,063 | | | | USD | | | | 736,272 | | | $ | 699,660 | | | $ | 36,612 | |
11/25/2014 | | State Street Bank & Trust Co. | | | CNY | | | | 5,361,889 | | | | USD | | | | 867,664 | | | | 871,840 | | | | (4,176 | ) |
11/25/2014 | | State Street Bank & Trust Co. | | | EUR | | | | 4,282,614 | | | | USD | | | | 5,628,702 | | | | 5,367,582 | | | | 261,120 | |
11/25/2014 | | State Street Bank & Trust Co. | | | GBP | | | | 2,882,737 | | | | USD | | | | 4,766,691 | | | | 4,610,973 | | | | 155,718 | |
11/25/2014 | | State Street Bank & Trust Co. | | | IDR | | | | 4,133,955,960 | | | | USD | | | | 347,376 | | | | 340,722 | | | | 6,654 | |
11/25/2014 | | State Street Bank & Trust Co. | | | KRW | | | | 240,255,540 | | | | USD | | | | 235,577 | | | | 223,685 | | | | 11,892 | |
11/25/2014 | | State Street Bank & Trust Co. | | | PHP | | | | 15,837,206 | | | | USD | | | | 361,497 | | | | 352,473 | | | | 9,024 | |
11/25/2014 | | State Street Bank & Trust Co. | | | SGD | | | | 249,721 | | | | USD | | | | 199,836 | | | | 194,340 | | | | 5,496 | |
11/25/2014 | | State Street Bank & Trust Co. | | | USD | | | | 49,778 | | | | INR | | | | 3,080,500 | | | | 50,008 | | | | 230 | |
11/25/2014 | | State Street Bank & Trust Co. | | | USD | | | | 3,347,641 | | | | NOK | | | | 20,864,224 | | | | 3,090,325 | | | | (257,316 | ) |
Total Forward Foreign Currency Contracts — Currency Risk | | | | | | | | | | | | | | | | | | | | | | $ | 471,769 | |
Currency Abbreviations:
| | |
| AUD | | – Australian Dollar |
| BRL | | – Brazilian Real |
| CAD | | – Canadian Dollar |
| CHF | | – Swiss Franc |
| CLP | | – Chilean Peso |
| CNY | | – Chinese Yuan |
| EUR | | – Euro |
| GBP | | – British Pound Sterling |
| HKD | | – Hong Kong Dollar |
| IDR | | – Indonesian Rupiah |
| INR | | – Indian Rupee |
| JPY | | – Japanese Yen |
| KRW | | – South Korean Won |
| NOK | | – Norwegian Krone |
| PHP | | – Philippine Peso |
| SEK | | – Swedish Krona |
| SGD | | – Singapore Dollar |
| THB | | – Thai Baht |
| USD | | – United States Dollar |
See accompanying Notes to Financial Statements which are an integral part of the financial statements.
19 Invesco Global Targeted Returns Fund
Statement of Assets and Liabilities
October 31, 2014
| | | | |
Assets: | |
Investments, at value (Cost $5,328,106) | | $ | 5,083,464 | |
Investments in affiliated underlying funds, at value
(Cost $29,388,266) | | | 30,009,972 | |
Total investments, at value (Cost $34,716,372) | | | 35,093,436 | |
Foreign currencies, at value (Cost $2,206,715) | | | 2,106,898 | |
Receivable for: | | | | |
Deposits with brokers | | | 6,719,305 | |
Fund shares sold | | | 195,513 | |
Dividends and interest | | | 127,140 | |
Fund expenses absorbed | | | 22,201 | |
Forward foreign currency contracts outstanding | | | 471,769 | |
Swaps receivables | | | 116,145 | |
Unrealized appreciation on swap agreements — OTC | | | 1,091,421 | |
Investment for trustee deferred compensation and retirement plans | | | 1,903 | |
Other assets | | | 22,762 | |
Total assets | | | 45,968,493 | |
|
Liabilities: | |
Payable for: | | | | |
Investments purchased | | | 25,631 | |
Fund shares reacquired | | | 9,219 | |
Options written, at value (premiums received $2,345,011) | | | 2,543,320 | |
Variation margin — futures | | | 200,530 | |
Variation margin — centrally cleared swap agreements | | | 87,666 | |
Accrued fees to affiliates | | | 5,497 | |
Accrued trustees’ and officers’ fees and benefits | | | 1,919 | |
Accrued other operating expenses | | | 86,173 | |
Unrealized depreciation on swap agreements — OTC | | | 673,851 | |
Trustee deferred compensation and retirement plans | | | 1,903 | |
Total liabilities | | | 3,635,709 | |
Net assets applicable to shares outstanding | | $ | 42,332,784 | |
|
Net assets consist of: | |
Shares of beneficial interest | | $ | 41,060,842 | |
Undistributed net investment income (loss) | | | (1,560 | ) |
Undistributed net realized gain | | | 131,431 | |
Net unrealized appreciation | | | 1,142,071 | |
| | | $ | 42,332,784 | |
| | | | |
Net Assets: | |
Class A | | $ | 13,504,185 | |
Class C | | $ | 444,388 | |
Class R | | $ | 10,427 | |
Class Y | | $ | 16,351,926 | |
Class R5 | | $ | 2,724,127 | |
Class R6 | | $ | 9,297,731 | |
|
Shares outstanding, $0.01 par value per share,
with an unlimited number of shares authorized: | |
Class A | | | 1,293,659 | |
Class C | | | 42,851 | |
Class R | | | 1,001 | |
Class Y | | | 1,563,033 | |
Class R5 | | | 260,386 | |
Class R6 | | | 889,089 | |
Class A: | | | | |
Net asset value per share | | $ | 10.44 | |
Maximum offering price per share | | | | |
(Net asset value of $10.44 ¸ 94.50%) | | $ | 11.05 | |
Class C: | | | | |
Net asset value and offering price per share | | $ | 10.37 | |
Class R: | | | | |
Net asset value and offering price per share | | $ | 10.42 | |
Class Y: | | | | |
Net asset value and offering price per share | | $ | 10.46 | |
Class R5 | | | | |
Net asset value and offering price per share | | $ | 10.46 | |
Class R6: | | | | |
Net asset value and offering price per share | | $ | 10.46 | |
See accompanying Notes to Financial Statements which are an integral part of the financial statements.
20 Invesco Global Targeted Returns Fund
Statement of Operations
For the period December 19, 2013 (commencement date) through October 31, 2014
| | | | |
Investment income: | |
Dividends from affiliated underlying funds | | $ | 262,193 | |
Other Income | | | 37,750 | |
Total investment income | | | 299,943 | |
| |
Expenses: | | | | |
Advisory fees | | | 403,622 | |
Administrative services fees | | | 43,425 | |
Custodian fees | | | 17,179 | |
Distribution fees: | | | | |
Class A | | | 27,146 | |
Class C | | | 1,098 | |
Class R | | | 45 | |
Transfer agent fees — A, C, R and Y | | | 8,285 | |
Transfer agent fees — R5 | | | 35 | |
Transfer agent fees — R6 | | | 28 | |
Trustees’ and officers’ fees and benefits | | | 18,534 | |
Registration and filing fees | | | 87,548 | |
Professional services fees | | | 138,322 | |
Other | | | 64,291 | |
Total expenses | | | 809,558 | |
Less: Fees waived and expenses reimbursed | | | (500,339 | ) |
Net expenses | | | 309,219 | |
Net investment income (loss) | | | (9,276 | ) |
| |
Realized and unrealized gain from: | | | | |
Net realized gain (loss) from: | | | | |
Investment securities | | | (978,297 | ) |
Foreign currencies | | | (263,289 | ) |
Forward foreign currency contracts | | | 968,404 | |
Futures contracts | | | (538,110 | ) |
Option contracts written | | | 206,026 | |
Swap agreements | | | 655,429 | |
| | | | 50,163 | |
Change in net unrealized appreciation (depreciation) of: | | | | |
Investment securities | | | 377,064 | |
Foreign currencies | | | (113,339 | ) |
Forward foreign currency contracts | | | 471,769 | |
Futures contracts | | | (145,303 | ) |
Option contracts written | | | (198,309 | ) |
Swap agreements | | | 750,189 | |
| | | | 1,142,071 | |
Net realized and unrealized gain | | | 1,192,234 | |
Net increase in net assets resulting from operations | | $ | 1,182,958 | |
See accompanying Notes to Financial Statements which are an integral part of the financial statements.
21 Invesco Global Targeted Returns Fund
Statement of Changes in Net Assets
For the period December 19, 2013 (commencement date) through October 31, 2014
| | | | |
| | | December 19, 2013
(commencement date) through
October 31,
2014 | |
Operations: | |
Net investment income (loss) | | $ | (9,276 | ) |
Net realized gain | | | 50,163 | |
Change in net unrealized appreciation | | | 1,142,071 | |
Net increase in net assets resulting from operations | | | 1,182,958 | |
| |
Share transactions–net: | | | | |
Class A | | | 13,012,317 | |
Class C | | | 443,040 | |
Class R | | | 10,014 | |
Class Y | | | 15,803,099 | |
Class R5 | | | 2,627,776 | |
Class R6 | | | 9,253,580 | |
Net increase in net assets resulting from share transactions | | | 41,149,826 | |
Net increase in net assets | | | 42,332,784 | |
| |
Net assets: | | | | |
Beginning of period | | | — | |
End of period (includes undistributed net investment income (loss) of $(1,560)) | | $ | 42,332,784 | |
Notes to Financial Statements
October 31, 2014
NOTE 1—Significant Accounting Policies
Invesco Global Targeted Returns Fund (the “Fund”) is a series portfolio of AIM Investment Funds (Invesco Investment Funds) (the “Trust”). The Trust is organized as a Delaware statutory trust and is registered under the Investment Company Act of 1940, as amended (the “1940 Act”), as an open-end series management investment company consisting of twenty-four separate series portfolios, each authorized to issue an unlimited number of shares of beneficial interest. The assets, liabilities and operations of each portfolio are accounted for separately. Information presented in these financial statements pertains only to the Fund. Matters affecting each portfolio or class will be voted on exclusively by the shareholders of such portfolio or class.
The Fund’s investment objective is to seek a positive total return over the long term in all market environments.
The Fund currently consists of six different classes of shares: Class A, Class C, Class R, Class Y, Class R5 and Class R6. Class A shares are sold with a front-end sales charge unless certain waiver criteria are met and under certain circumstances load waived shares may be subject to contingent deferred sales charges (“CDSC”). Class C shares are sold with a CDSC. Class R, Class Y, Class R5 and Class R6 shares are sold at net asset value.
The following is a summary of the significant accounting policies followed by the Fund in the preparation of its financial statements.
| A. | Security Valuations — Securities, including restricted securities, are valued according to the following policy. |
A security listed or traded on an exchange (except convertible securities) is valued at its last sales price or official closing price as of the close of the customary trading session on the exchange where the security is principally traded, or lacking any sales or official closing price on a particular day, the security may be valued at the closing bid price on that day. Securities traded in the over-the-counter market are valued based on prices furnished by independent pricing services or market makers. When such securities are valued by an independent pricing service they may be considered fair valued. Futures contracts are valued at the final settlement price set by an exchange on which they are principally traded. Listed options are valued at the mean between the last bid and ask prices from the exchange on which they are principally traded. Options not listed on an exchange are valued by an independent source at the mean between the last bid and ask prices. For purposes of determining net asset value per share, futures and option contracts generally are valued 15 minutes after the close of the customary trading session of the New York Stock Exchange (“NYSE”).
Investments in open-end and closed-end registered investment companies that do not trade on an exchange are valued at the end of day net asset value per share. Investments in open-end and closed-end registered investment companies that trade on an exchange are valued at the last sales price or official closing price as of the close of the customary trading session on the exchange where the security is principally traded.
Swap agreements are fair valued using an evaluated quote provided by an independent pricing service. Evaluated quotes provided by the pricing service are valued based on a model which may include end of day net present values, spreads, ratings, industry, and company performance.
Debt obligations (including convertible securities) and unlisted equities are fair valued using an evaluated quote provided by an independent pricing service. Evaluated quotes provided by the pricing service may be determined without exclusive reliance on quoted prices, and may reflect appropriate factors such as institution-size trading in similar groups of securities, developments related to specific securities, dividend rate (for
22 Invesco Global Targeted Returns Fund
unlisted equities), yield (for debt obligations), quality, type of issue, coupon rate (for debt obligations), maturity (for debt obligations), individual trading characteristics and other market data. Debt obligations are subject to interest rate and credit risks. In addition, all debt obligations involve some risk of default with respect to interest and/or principal payments.
Foreign securities’ (including foreign exchange contracts) prices are converted into U.S. dollar amounts using the applicable exchange rates as of the close of the NYSE. If market quotations are available and reliable for foreign exchange-traded equity securities, the securities will be valued at the market quotations. Because trading hours for certain foreign securities end before the close of the NYSE, closing market quotations may become unreliable. If between the time trading ends on a particular security and the close of the customary trading session on the NYSE, events occur that the Adviser determines are significant and make the closing price unreliable, the Fund may fair value the security. If the event is likely to have affected the closing price of the security, the security will be valued at fair value in good faith using procedures approved by the Board of Trustees. Adjustments to closing prices to reflect fair value may also be based on a screening process of an independent pricing service to indicate the degree of certainty, based on historical data, that the closing price in the principal market where a foreign security trades is not the current value as of the close of the NYSE. Foreign securities’ prices meeting the approved degree of certainty that the price is not reflective of current value will be priced at the indication of fair value from the independent pricing service. Multiple factors may be considered by the independent pricing service in determining adjustments to reflect fair value and may include information relating to sector indices, American Depositary Receipts and domestic and foreign index futures. Foreign securities may have additional risks including exchange rate changes, potential for sharply devalued currencies and high inflation, political and economic upheaval, the relative lack of issuer information, relatively low market liquidity and the potential lack of strict financial and accounting controls and standards.
Securities for which market prices are not provided by any of the above methods may be valued based upon quotes furnished by independent sources. The last bid price may be used to value equity securities. The mean between the last bid and ask prices is used to value debt obligations, including corporate loans.
Securities for which market quotations are not readily available or became unreliable are valued at fair value as determined in good faith by or under the supervision of the Trust’s officers following procedures approved by the Board of Trustees. Issuer specific events, market trends, bid/ask quotes of brokers and information providers and other market data may be reviewed in the course of making a good faith determination of a security’s fair value.
The Fund may invest in securities that are subject to interest rate risk, meaning the risk that the prices will generally fall as interest rates rise and, conversely, the prices will generally rise as interest rates fall. Specific securities differ in their sensitivity to changes in interest rates depending on their individual characteristics. Changes in interest rates may result in increased market volatility, which may affect the value and/or liquidity of certain of the Fund’s investments.
Valuations change in response to many factors including the historical and prospective earnings of the issuer, the value of the issuer’s assets, general economic conditions, interest rates, investor perceptions and market liquidity. Because of the inherent uncertainties of valuation, the values reflected in the financial statements may materially differ from the value received upon actual sale of those investments.
| B. | Securities Transactions and Investment Income — Securities transactions are accounted for on a trade date basis. Realized gains or losses on sales are computed on the basis of specific identification of the securities sold. Distributions from ordinary income from underlying funds, if any, are recorded as dividend income on ex-dividend date. Distributions from gains from underlying funds, if any, are recorded as realized gains on the ex-dividend date. The following policies are followed by the underlying funds: Interest income (net of withholding tax, if any) is recorded on the accrual basis from settlement date. Bond premiums and discounts are amortized and/or accreted for financial reporting purposes. |
The Fund may periodically participate in litigation related to Fund investments. As such, the Fund may receive proceeds from litigation settlements. Any proceeds received are included in the Statement of Operations as realized gain (loss) for investments no longer held and as unrealized gain (loss) for investments still held.
Brokerage commissions and mark ups are considered transaction costs and are recorded as an increase to the cost basis of securities purchased and/or a reduction of proceeds on a sale of securities. Such transaction costs are included in the determination of net realized and unrealized gain (loss) from investment securities reported in the Statement of Operations and the Statement of Changes in Net Assets and the net realized and unrealized gains (losses) on securities per share in the Financial Highlights. Transaction costs are included in the calculation of the Fund’s net asset value and, accordingly, they reduce the Fund’s total returns. These transaction costs are not considered operating expenses and are not reflected in net investment income reported in the Statement of Operations and Statement of Changes in Net Assets, or the net investment income per share and ratios of expenses and net investment income reported in the Financial Highlights, nor are they limited by any expense limitation arrangements between the Fund and the investment adviser.
The Fund allocates income and realized and unrealized capital gains and losses to a class based on the relative net assets of each class.
| C. | Country Determination — For the purposes of making investment selection decisions and presentation in the Schedule of Investments, the investment adviser may determine the country in which an issuer is located and/or credit risk exposure based on various factors. These factors include the laws of the country under which the issuer is organized, where the issuer maintains a principal office, the country in which the issuer derives 50% or more of its total revenues and the country that has the primary market for the issuer’s securities, as well as other criteria. Among the other criteria that may be evaluated for making this determination are the country in which the issuer maintains 50% or more of its assets, the type of security, financial guarantees and enhancements, the nature of the collateral and the sponsor organization. Country of issuer and/or credit risk exposure has been determined to be the United States of America, unless otherwise noted. |
| D. | Distributions — Distributions from net investment income and net realized capital gain, if any, are generally declared and paid annually and recorded on the ex-dividend date. The Fund may elect to treat a portion of the proceeds from redemptions as distributions for federal income tax purposes. |
| E. | Federal Income Taxes — The Fund intends to comply with the requirements of Subchapter M of the Internal Revenue Code of 1986, as amended (the “Internal Revenue Code”), necessary to qualify as a regulated investment company and to distribute substantially all of the Fund’s taxable earnings to shareholders. As such, the Fund will not be subject to federal income taxes on otherwise taxable income (including net realized capital gain) that is distributed to shareholders. Therefore, no provision for federal income taxes is recorded in the financial statements. |
23 Invesco Global Targeted Returns Fund
The Fund recognizes the tax benefits of uncertain tax positions only when the position is more likely than not to be sustained. Management has analyzed the Fund’s uncertain tax positions and concluded that no liability for unrecognized tax benefits should be recorded related to uncertain tax positions. Management is not aware of any tax positions for which it is reasonably possible that the total amounts of unrecognized tax benefits will change materially in the next 12 months.
The Fund files tax returns in the U.S. Federal jurisdiction and certain other jurisdictions. Generally, the Fund is subject to examinations by such taxing authorities for up to three years after the filing of the return for the tax period.
| F. | Expenses — Fees provided for under the Rule 12b-1 plan of a particular class of the Fund are charged to the operations of such class. Transfer agency fees and expenses and other shareholder recordkeeping fees and expenses attributable to Class R5 and Class R6 are allocated to each share class based on relative net assets. Sub-accounting fees attributable to Class R5 are charged to the operations of the class. Transfer agency fees and expenses and other shareholder recordkeeping fees and expenses relating to all other classes are allocated among those classes based on relative net assets. All other expenses are allocated among the classes based on relative net assets. |
| G. | Accounting Estimates — The preparation of financial statements in conformity with accounting principles generally accepted in the United States of America (“GAAP”) requires management to make estimates and assumptions that affect the reported amounts of assets and liabilities at the date of the financial statements and the reported amounts of revenues and expenses during the reporting period including estimates and assumptions related to taxation. Actual results could differ from those estimates by a significant amount. In addition, the Fund monitors for material events or transactions that may occur or become known after the period-end date and before the date the financial statements are released to print. |
| H. | Indemnifications — Under the Trust’s organizational documents, each Trustee, officer, employee or other agent of the Trust is indemnified against certain liabilities that may arise out of the performance of their duties to the Fund. Additionally, in the normal course of business, the Fund enters into contracts, including the Fund’s servicing agreements, that contain a variety of indemnification clauses. The Fund’s maximum exposure under these arrangements is unknown as this would involve future claims that may be made against the Fund that have not yet occurred. The risk of material loss as a result of such indemnification claims is considered remote. |
| I. | Foreign Currency Translations — Foreign currency is valued at the close of the NYSE based on quotations posted by banks and major currency dealers. Portfolio securities and other assets and liabilities denominated in foreign currencies are translated into U.S. dollar amounts at date of valuation. Purchases and sales of portfolio securities (net of foreign taxes withheld on disposition) and income items denominated in foreign currencies are translated into U.S. dollar amounts on the respective dates of such transactions. The Fund does not separately account for the portion of the results of operations resulting from changes in foreign exchange rates on investments and the fluctuations arising from changes in market prices of securities held. The combined results of changes in foreign exchange rates and the fluctuation of market prices on investments (net of estimated foreign tax withholding) are included with the net realized and unrealized gain or loss from investments in the Statement of Operations. Reported net realized foreign currency gains or losses arise from (1) sales of foreign currencies, (2) currency gains or losses realized between the trade and settlement dates on securities transactions, and (3) the difference between the amounts of dividends, interest, and foreign withholding taxes recorded on the Fund’s books and the U.S. dollar equivalent of the amounts actually received or paid. Net unrealized foreign currency gains and losses arise from changes in the fair values of assets and liabilities, other than investments in securities at fiscal period end, resulting from changes in exchange rates. |
The Fund may invest in foreign securities, which may be subject to foreign taxes on income, gains on investments or currency repatriation, a portion of which may be recoverable. Foreign taxes, if any, are recorded based on the tax regulations and rates that exist in the foreign markets in which the Fund invests and are shown in the Statement of Operations.
| J. | Forward Foreign Currency Contracts — The Fund may engage in foreign currency transactions either on a spot (i.e. for prompt delivery and settlement) basis or through forward foreign currency contracts to manage or minimize currency or exchange rate risk. |
The Fund may also enter into forward foreign currency contracts for the purchase or sale of a security denominated in a foreign currency in order to “lock in” the U.S. dollar price of that security, or the Fund may also enter into forward foreign currency contracts that do not provide for physical settlement of the two currencies, but instead are settled by a single cash payment calculated as the difference between the agreed upon exchange rate and the spot rate at settlement based upon an agreed upon notional amount (non-deliverable forwards). The Fund will set aside liquid assets in an amount equal to daily mark-to-market obligation for forward foreign currency contracts.
A forward foreign currency contract is an obligation between two parties (“Counterparties”) to purchase or sell a specific currency for an agreed-upon price at a future date. The use of forward foreign currency contracts does not eliminate fluctuations in the price of the underlying securities the Fund owns or intends to acquire but establishes a rate of exchange in advance. Fluctuations in the value of these contracts are measured by the difference in the contract date and reporting date exchange rates and are recorded as unrealized appreciation (depreciation) until the contracts are closed. When the contracts are closed, realized gains (losses) are recorded. Realized and unrealized gains (losses) on the contracts are included in the Statement of Operations. The primary risks associated with forward foreign currency contracts include failure of the Counterparty to meet the terms of the contract and the value of the foreign currency changing unfavorably. These risks may be in excess of the amounts reflected in the Statement of Assets and Liabilities.
| K. | Futures Contracts — The Fund may enter into futures contracts to manage exposure to interest rate, equity and market price movements and/or currency risks. A futures contract is an agreement between two parties to purchase or sell a specified underlying security, currency or commodity (or delivery of a cash settlement price, in the case of an index future) for a fixed price at a future date. The Fund currently invests only in exchange-traded futures and they are standardized as to maturity date and underlying financial instrument. Initial margin deposits required upon entering into futures contracts are satisfied by the segregation of specific securities or cash as collateral at the futures commission merchant (broker). During the period the futures contracts are open, changes in the value of the contracts are recognized as unrealized gains or losses by recalculating the value of the contracts on a daily basis. Subsequent or variation margin payments are received or made depending upon whether unrealized gains or losses are incurred. These amounts are reflected as receivables or payables on the Statement of Assets and Liabilities. When the contracts are closed or expire, the Fund recognizes a realized gain or loss equal to the difference between the proceeds from, or cost of, the closing transaction and the Fund’s basis in the contract. The net realized gain (loss) and the change in unrealized gain (loss) on futures contracts held during the period is included on the Statement of Operations. The primary risks associated with futures contracts are market risk and the absence of a liquid secondary market. If the Fund were unable to liquidate a futures contract and/or enter into an offsetting closing transaction, the Fund would continue to be subject to market risk with respect to the value of the contracts and continue to be required to maintain the margin deposits on the futures contracts. Futures contracts |
24 Invesco Global Targeted Returns Fund
| | have minimal Counterparty risk since the exchange’s clearinghouse, as Counterparty to all exchange-traded futures, guarantees the futures against default. Risks may exceed amounts recognized in the Statement of Assets and Liabilities. |
| L. | Swap Agreements — The Fund may enter into various swap transactions, including interest rate, total return, volatility, variance, index, currency and credit default swap contracts (“CDS”) for investment purposes or to manage interest rate, equity, currency or credit risk. Such transactions are agreements between Counterparties. A swap agreement may be negotiated bilaterally and traded over-the-counter (OTC) between two parties (‘uncleared/OTC”) or, in some instances, must be transacted through a future commission merchant (FCM) and cleared through a clearinghouse that serves as a central Counterparty (“centrally cleared swap”). These agreements may contain among other conditions, events of default and termination events, and various covenants and representations such as provisions that require the Fund to maintain a pre-determined level of net assets, and/or provide limits regarding the decline of the Fund’s NAV over specific periods of time. If the Fund were to trigger such provisions and have open derivative positions at that time, the Counterparty may be able to terminate such agreement and request immediate payment in an amount equal to the net liability positions, if any. |
Interest rate, total return, volatility, variance, index, and currency swap agreements are two-party contracts entered into primarily to exchange the returns (or differentials in rates of returns) earned or realized on particular predetermined investments or instruments. The gross returns to be exchanged or “swapped” between the parties are calculated with respect to a notional amount, i.e., the return on or increase in value of a particular dollar amount invested at a particular interest rate or return of an underlying asset, in a particular foreign currency, or in a “basket” of securities representing a particular index.
In a centrally cleared swap, the Fund’s ultimate Counterparty is a central clearinghouse. The Fund initially will enter into centrally cleared swaps through an executing broker. When a Fund enters into a centrally cleared swap, it must deliver to the central Counterparty (via the FCM) an amount referred to as “initial margin.” Initial margin requirements are determined by the central Counterparty, but an FCM may require additional initial margin above the amount required by the central Counterparty. Initial margin deposits required upon entering into centrally cleared swaps are satisfied by cash or securities as collateral at the FCM. Securities deposited as initial margin are designated on the Schedule of Investments and cash deposited is recorded on the Statement of Assets and Liabilities. During the term of a cleared swap agreement, a “variation margin” amount may be required to be paid by the Fund or may be received by the Fund, based on the daily change in price of the underlying reference instrument subject to the swap agreement and is recorded as a receivable or payable for variation margin in the Statement of Assets and Liabilities until the centrally cleared swap is terminated at which time a realized gain or loss is recorded.
A CDS is an agreement between Counterparties to exchange the credit risk of an issuer. A buyer of a CDS is said to buy protection by paying a fixed payment over the life of the agreement and in some situations an upfront payment to the seller of the CDS. If a defined credit event occurs (such as payment default or bankruptcy), the Fund as a protection buyer would cease paying its fixed payment, the Fund would deliver eligible bonds issued by the reference entity to the seller, and the seller would pay the full notional value, or the “par value”, of the referenced obligation to the Fund. A seller of a CDS is said to sell protection and thus would receive a fixed payment over the life of the agreement and an upfront payment, if applicable. If a credit event occurs, the Fund as a protection seller would cease to receive the fixed payment stream, the Fund would pay the buyer “par value” or the full notional value of the referenced obligation, and the Fund would receive the eligible bonds issued by the reference entity. In turn, these bonds may be sold in order to realize a recovery value. Alternatively, the seller of the CDS and its Counterparty may agree to net the notional amount and the market value of the bonds and make a cash payment equal to the difference to the buyer of protection. If no credit event occurs, the Fund receives the fixed payment over the life of the agreement. As the seller, the Fund would effectively add leverage to its portfolio because, in addition to its total net assets, the Fund would be subject to investment exposure on the notional amount of the CDS. In connection with these agreements, cash and securities may be identified as collateral in accordance with the terms of the respective swap agreements to provide assets of value and recourse in the event of default under the swap agreement or bankruptcy/insolvency of a party to the swap agreement. If a Counterparty becomes bankrupt or otherwise fails to perform its obligations due to financial difficulties, the Fund may experience significant delays in obtaining any recovery in a bankruptcy or other reorganization proceeding. The Fund may obtain only limited recovery or may obtain no recovery in such circumstances. The Fund’s maximum risk of loss from Counterparty risk, either as the protection seller or as the protection buyer, is the value of the contract. The risk may be mitigated by having a master netting arrangement between the Fund and the Counterparty and by the designation of collateral by the Counterparty to cover the Fund’s exposure to the Counterparty.
Implied credit spreads represent the current level at which protection could be bought or sold given the terms of the existing CDS contract and serve as an indicator of the current status of the payment/performance risk of the CDS. An implied spread that has widened or increased since entry into the initial contract may indicate a deteriorating credit profile and increased risk of default for the reference entity. A declining or narrowing spread may indicate an improving credit profile or decreased risk of default for the reference entity. Alternatively, credit spreads may increase or decrease reflecting the general tolerance for risk in the credit markets.
A volatility swap involves an exchange between the Fund and a Counterparty of periodic payments based on the measured volatility of an underlying security, currency, commodity, interest rate, index or other reference asset over a specified time frame. Depending on the structure of the swap, either the Fund’s or the Counterparty’s payment obligation will typically be based on the realized volatility of the reference asset as measured by changes in its price or level over a specified time period while the other party’s payment obligation will be based on a specified rate representing expected volatility for the reference asset at the time the swap is executed, or the measured volatility of a different reference asset over a specified time period. The Fund will typically make or lose money on a volatility swap depending on the magnitude of the reference asset’s volatility, or size of the movements in its price, over a specified time period, rather than general increases or decreases in the price of the reference asset. Volatility swaps are often used to speculate on future volatility levels, to trade the spread between realized and expected volatility, or to decrease the volatility exposure of other investments held by the Fund. Variance swaps are similar to volatility swaps except payments are based on the difference between the implied and measured volatility mathematically squared.
An interest rate swap is an agreement between Counterparties pursuant to which the parties exchange a floating rate payment for a fixed rate payment based on a specified notional amount.
Changes in the value of centrally cleared and OTC swap agreements are recognized as unrealized gains (losses) in the Statement of Operations by “marking to market” on a daily basis to reflect the value of the swap agreement at the end of each trading day. Payments received or paid at the beginning of the agreement are reflected as such on the Statement of Assets and Liabilities and may be referred to as upfront payments. The Fund accrues for the fixed payment stream and amortizes upfront payments, if any, on swap agreements on a daily basis with the net amount, recorded as a component of realized gain (loss) on the Statement of Operations. A liquidation payment received or made at the termination of a
25 Invesco Global Targeted Returns Fund
swap agreement is recorded as realized gain (loss) on the Statement of Operations. The Fund segregates liquid securities having a value at least equal to the amount of the potential obligation of a Fund under any swap transaction. Entering into these agreements involves, to varying degrees, lack of liquidity and elements of credit, market, and Counterparty risk in excess of amounts recognized on the Statement of Assets and Liabilities. Such risks involve the possibility that a swap is difficult to sell or liquidate; the Counterparty does not honor its obligations under the agreement and unfavorable interest rates and market fluctuations. It is possible that developments in the swaps market, including potential government regulation, could adversely affect the Fund’s ability to terminate existing swap agreements or to realize amounts to be received under such agreements.
Notional amounts of each individual credit default swap agreement outstanding as of October 31, 2014 for which the Fund is the seller of protection are disclosed in the Notes to Schedule of Investments. These potential amounts would be partially offset by any recovery values of the respective referenced obligations, upfront payments received upon entering into the agreement, or net amounts received from the settlement of buy protection credit default swap agreements entered into by the Fund for the same referenced entity or entities.
A short position in a security possesses more risk than holding the same security long. As there is no limit on how much the price of the security can increase, the Fund’s exposure is unlimited.
| M. | Call Options Written and Purchased — The Fund may write call options and/or buy call options. A covered call option gives the purchaser of such option the right to buy, and the writer the obligation to sell, the underlying security at the stated exercise price during the option period. As uncovered call option exists without the ownership of the underlying security. Options written by the Fund normally will have expiration dates between three and nine months from the date written. The exercise price of a call option may be below, equal to, or above the current market value of the underlying security at the time the option is written. |
Additionally, the Fund may enter into an option on a swap agreement, also called a “swaption”. A swaption is an option that gives the buyer the right, but not the obligation, to enter into a swap on a future date in exchange for paying a market-based premium. A receiver swaption gives the owner the right to receive the total return of a specified asset, reference rate or index. Swaptions also include options that allow an existing swap to be terminated or extended by one of the counterparties.
When the Fund writes a covered call option, an amount equal to the premium received by the Fund is recorded as an asset and an equivalent liability in the Statement of Assets and Liabilities. The amount of the liability is subsequently “marked-to-market” to reflect the current market value of the option written. If a written covered call option expires on the stipulated expiration date, or if the Fund enters into a closing purchase transaction, the Fund realizes a gain (or a loss if the closing purchase transaction exceeds the premium received when the option was written) without regard to any unrealized gain or loss on the underlying security, and the liability related to such option is extinguished. If a written covered call option is exercised, the Fund realizes a gain or a loss from the sale of the underlying security and the proceeds of the sale are increased by the premium originally received. Realized and unrealized gains and losses on these contracts are included in the Statement of Operation. A risk in writing a covered call option is that the Fund gives up the opportunity for profit if the market price of the security increases and the option is exercised. The risk in writing an uncovered call option is that the Fund may incur significant losses if the value of the written security exceeds the exercise price of the option.
When the Fund buys a call option, an amount equal to the premium paid by the Fund is recorded as an investment on the Statement of Assets and Liabilities. The amount of the investment is subsequently “marked-to-market” to reflect the current value of the option purchased. Realized and unrealized gains and losses on these contracts are included in the Statement of Operations. A risk in buying an option is that the Fund pays a premium whether or not the option is exercised. In addition, there can be no assurance that a liquid secondary market will exist for any option purchased.
| N. | Put Options Purchased and Written — The Fund may purchase and write put options including options on securities indexes and/or futures contracts. By purchasing a put option, the Fund obtains the right (but not the obligation) to sell the option’s underlying instrument at a fixed strike price. In return for this right, the Fund pays an option premium. The option’s underlying instrument may be a security, securities index, or a futures contract. Put options may be used by the Fund to hedge securities it owns by locking in a minimum price at which the Fund can sell. If security prices fall, the put option could be exercised to offset all or a portion of the Fund’s resulting losses. At the same time, because the maximum the Fund has at risk is the cost of the option, purchasing put options does not eliminate the potential for the Fund to profit from an increase in the value of the underlying portfolio securities. The Fund may write put options to earn additional income in the form of option premiums if it expects the price of the underlying instrument to remain stable or rise during the option period so that the option will not be exercised. The risk in this strategy is that the price of the underlying securities may decline by an amount greater than the premium received. Put options written are reported as a liability in the Statement of Assets and Liabilities. Realized and unrealized gains and losses on these contracts are included in the Statement of Operations. A risk in buying an option is that the Fund pays a premium whether or not the option is exercised. In addition, there can be no assurance that a liquid secondary market will exist for any option purchased. |
| O. | Other Risks — The Fund is non-diversified and may invest in securities of fewer issuers than if it were diversified. Thus, the value of the Fund’s shares may vary more widely and the Fund may be subject to greater market and credit risk than if the Fund invested more broadly. |
| P. | Leverage Risk — Leverage exists when a Fund can lose more than it originally invests because it purchases or sells an instrument or enters into a transaction without investing an amount equal to the full economic exposure of the instrument or transaction. |
| Q. | Collateral — To the extent the Fund has designated or segregated a security as collateral and that security is subsequently sold, it is the Fund’s practice to replace such collateral no later than the next business day. |
NOTE 2—Advisory Fees and Other Fees Paid to Affiliates
The Trust has entered into a master investment advisory agreement with Invesco Advisers, Inc. (the “Adviser” or “Invesco”). Under the terms of the investment advisory agreement, the Fund pays an advisory fee to the Adviser based on the annual rate of the Fund’s average daily net assets as follows:
| | | | |
| Average Daily Net Assets | | Rate | |
First $10 billion | | | 1.50% | |
Over $10 billion | | | 1.25% | |
For the period December 19, 2013 (commencement date) through October 31, 2014, the effective advisory fees incurred by the Fund was 1.50%.
26 Invesco Global Targeted Returns Fund
Under the terms of a master sub-advisory agreement between the Adviser and each of Invesco Asset Management Deutschland GmbH, Invesco Asset Management Limited, Invesco Asset Management (Japan) Limited, Invesco Australia Limited, Invesco Hong Kong Limited, Invesco Senior Secured Management, Inc., Invesco Canada Ltd. and Invesco PowerShares Capital Management LLC (collectively, the “Affiliated Sub-Advisers”) the Adviser, not the Fund, may pay 40% of the fees paid to the Adviser to any such Affiliated Sub-Adviser(s) that provide(s) discretionary investment management services to the Fund based on the percentage of assets allocated to such Sub-Adviser(s).
The Subsidiary has entered into a separate contract with the Adviser whereby the Adviser provides investment advisory and other services to the Subsidiary. In consideration of these services, the Subsidiary pays an advisory fee to the Adviser based on the annual rate of the Subsidiary’s average daily net assets as set forth in the table above.
The Adviser has contractually agreed, through at least February 29, 2016, to waive advisory fees and/or reimburse expenses to the extent necessary to limit total annual fund operating expenses after fee waiver and/or expense reimbursement (excluding certain items discussed below) of Class A, Class C, Class R, Class Y, Class R5 and Class R6 shares to 1.71%, 2.46%, 1.96%, 1.46%, 1.46% and 1.46%, respectively, of average daily net assets. In determining the Adviser’s obligation to waive advisory fees and/or reimburse expenses, the following expenses are not taken into account, and could cause total annual fund operating expenses after fee waiver and/or expense reimbursement to exceed the numbers reflected above: (1) interest; (2) taxes; (3) dividend expense on short sales; (4) extraordinary or non-routine items, including litigation expenses; and (5) expenses that the Fund has incurred but did not actually pay because of an expense offset arrangement. Acquired Fund Fees and Expenses are not operating expenses of a Fund directly, but are fees and expenses, including management fees of the investment companies in which a Fund invests. As a result, the total annual fund operating expenses after expense reimbursement may exceed the expense limits above. Unless Invesco continues the fee waiver agreement, it will terminate on February 29, 2016. The fee waiver agreement cannot be terminated during its term.
Further, the Adviser has contractually agreed, through at least June 30, 2016, to waive the advisory fee payable by the Fund in an amount equal to 100% of the net advisory fees the Adviser receives from the affiliated money market funds on investments by the Fund of uninvested cash in such affiliated money market funds.
For the period December 19, 2013 (commencement date) through October 31, 2014, the Adviser waived advisory fees and reimbursed expenses of $491,991 and reimbursed class level expenses of $4,002, $40, $3, $4,240, $35 and $28 for Class A, Class C, Class R, Class Y, Class R5 and Class R6 shares, respectively.
The Trust has entered into a master administrative services agreement with Invesco pursuant to which the Fund has agreed to pay Invesco for certain administrative costs incurred in providing accounting services to the Fund. For the period December 19, 2013 (commencement date) through October 31, 2014, expenses incurred under the agreement are shown in the Statement of Operations as Administrative services fees.
The Trust has entered into a transfer agency and service agreement with Invesco Investment Services, Inc. (“IIS”) pursuant to which the Fund has agreed to pay IIS a fee for providing transfer agency and shareholder services to the Fund and reimburse IIS for certain expenses incurred by IIS in the course of providing such services. IIS may make payments to intermediaries that provide omnibus account services, sub-accounting services and/or networking services. All fees payable by IIS to intermediaries that provide omnibus account services or sub-accounting are charged back to the Fund, subject to certain limitations approved by the Trust’s Board of Trustees. For the period December 19, 2013 (commencement date) through October 31, 2014, expenses incurred under the agreement are shown in the Statement of Operations as Transfer agent fees.
The Trust has entered into master distribution agreements with Invesco Distributors, Inc. (“IDI”) to serve as the distributor for the Class A, Class C, Class R, Class Y, Class R5 and Class R6 shares of the Fund. The Trust has adopted plans pursuant to Rule 12b-1 under the 1940 Act with respect to the Fund’s Class A, Class C and Class R shares (collectively, the “Plans”). The Fund, pursuant to the Plans, pays IDI compensation at the annual rate of 0.25% of the Fund’s average daily net assets of Class A shares, 1.00% of the average daily net assets of Class C shares and 0.50% of the average daily net assets of Class R shares. Of the Plan payments, up to 0.25% of the average daily net assets of each class of shares may be paid to furnish continuing personal shareholder services to customers who purchase and own shares of such classes. Any amounts not paid as a service fee under the Plans would constitute an asset-based sales charge. Rules of the Financial Industry Regulatory Authority (“FINRA”) impose a cap on the total sales charges, including asset-based sales charges, that may be paid by any class of shares of the Fund. For the period December 19, 2013 (commencement date) through October 31, 2014, expenses incurred under the Plans are shown in the Consolidated Statement of Operations as Distribution fees.
Front-end sales commissions and CDSC (collectively, the “sales charges”) are not recorded as expenses of the Fund. Front-end sales commissions are deducted from proceeds from the sales of Fund shares prior to investment in Class A shares of the Fund. CDSC are deducted from redemption proceeds prior to remittance to the shareholder. During the period December 19, 2013 (commencement date) through October 31, 2014, IDI advised the Fund that IDI retained $246 in front-end sales commissions from the sale of Class A shares.
Certain officers and trustees of the Trust are officers and directors of the Adviser, IIS and/or IDI.
NOTE 3—Additional Valuation Information
GAAP defines fair value as the price that would be received to sell an asset or paid to transfer a liability in an orderly transaction between market participants at the measurement date, under current market conditions. GAAP establishes a hierarchy that prioritizes the inputs to valuation methods, giving the highest priority to readily available unadjusted quoted prices in an active market for identical assets (Level 1) and the lowest priority to significant unobservable inputs (Level 3), generally when market prices are not readily available or are unreliable. Based on the valuation inputs, the securities or other investments are tiered into one of three levels. Changes in valuation methods may result in transfers in or out of an investment’s assigned level:
| | Level 1 — | Prices are determined using quoted prices in an active market for identical assets. |
| | Level 2 — | Prices are determined using other significant observable inputs. Observable inputs are inputs that other market participants may use in pricing a security. These may include quoted prices for similar securities, interest rates, prepayment speeds, credit risk, yield curves, loss severities, default rates, discount rates, volatilities and others. |
| | Level 3 — | Prices are determined using significant unobservable inputs. In situations where quoted prices or observable inputs are unavailable (for example, when there is little or no market activity for an investment at the end of the period), unobservable inputs may be used. Unobservable inputs reflect the Fund’s own assumptions about the factors market participants would use in determining fair value of the securities or instruments and would be based on the best available information. |
27 Invesco Global Targeted Returns Fund
The following is a summary of the tiered valuation input levels, as of October 31, 2014. The level assigned to the securities valuations may not be an indication of the risk or liquidity associated with investing in those securities. Because of the inherent uncertainties of valuation, the values reflected in the financial statements may materially differ from the value received upon actual sale of those investments.
| | | | | | | | | | | | | | | | |
| | | Level 1 | | | Level 2 | | | Level 3 | | | Total | |
Equity Securities | | $ | 30,009,972 | | | $ | — | | | $ | — | | | $ | 30,009,972 | |
Foreign Sovereign Debt Securities | | | — | | | | 2,049,651 | | | | — | | | | 2,049,651 | |
Options Purchased | | | 1,410,981 | | | | 1,622,832 | | | | — | | | | 3,033,813 | |
| | | | 31,420,953 | | | | 3,672,483 | | | | — | | | | 35,093,436 | |
Forward Foreign Currency Contracts* | | | — | | | | 471,769 | | | | — | | | | 471,769 | |
Futures Contracts* | | | (145,303 | ) | | | — | | | | — | | | | (145,303 | ) |
Options Written* | | | (1,113,458 | ) | | | (1,429,862 | ) | | | — | | | | (2,543,320 | ) |
Swap Agreements* | | | — | | | | 750,189 | | | | — | | | | 750,189 | |
Total Investments | | $ | 30,162,192 | | | $ | 3,464,579 | | | $ | — | | | $ | 33,626,771 | |
| * | Forward Foreign Currency Contracts, Futures Contracts and Swap Agreements are valued at unrealized appreciation (depreciation). Options Written are shown at value. |
NOTE 4—Derivative Investments
Value of Derivative Investments at Period-End
The table below summarizes the value of the Fund’s derivative investments, detailed by primary risk exposure, held as of October 31, 2014:
| | | | | | | | |
| | | Value | |
| Risk Exposure/Derivative Type | | Assets | | | Liabilities | |
Credit risk: | | | | | | | | |
Swap agreements(a) | | $ | 12,533 | | | $ | (22,944 | ) |
Currency risk: | | | | | | | | |
Forward foreign currency contracts(b) | | | 994,557 | | | | (522,788 | ) |
Swap agreements(c) | | | 1,023 | | | | (62,588 | ) |
Interest rate risk: | | | | | | | | |
Futures contracts(d) | | | 59,082 | | | | (29,699 | ) |
Options purchased(e) | | | 1,118,282 | | | | — | |
Options written(f) | | | — | | | | (1,418,745 | ) |
Swap agreements(a)(c) | | | 2,992,135 | | | | (1,881,808 | ) |
Market risk: | | | | | | | | |
Futures contracts(d) | | | 101,866 | | | | (276,552 | ) |
Options purchased(e) | | | 1,915,531 | | | | — | |
Options written(f) | | | — | | | | (1,124,575 | ) |
Swap agreements(c) | | | 323,101 | | | | (611,263 | ) |
Total | | $ | 7,518,110 | | | $ | (5,950,962 | ) |
| (a) | Includes cumulative appreciation (depreciation) of centrally cleared swap agreements. Only current day’s variation margin receivable (payable) is reported within the Statement of Assets and Liabilities. |
| (b) | Values are disclosed on the Statement of Assets and Liabilities under the caption Forward foreign currency contracts outstanding. |
| (c) | Values are disclosed on the Statement of Assets and Liabilities under the captions Unrealized appreciation on swap agreements – OTC. |
| (d) | Includes cumulative appreciation (depreciation) of futures contracts. Only current day’s variation margin receivable (payable) is reported within the Statement of Assets and Liabilities. |
| (e) | Options purchased at value as reported in the Schedule of Investments. |
| (f) | Values are disclosed on the Statement of Assets and Liabilities under the caption Options written, at value. |
28 Invesco Global Targeted Returns Fund
Effect of Derivative Investments for the period December 19, 2013 (commencement date) through October 31, 2014
The table below summarizes the gains (losses) on derivative investments, detailed by primary risk exposure, recognized in earnings during the period:
| | | | | | | | | | | | | | | | |
| | | Location of Gain (Loss) on
Statement of Operations | |
| | | Futures Contracts | | | Forward Foreign Currency Contracts | | | Swap Agreements | | | Options Written(a) | |
Realized Gain (Loss): | | | | | | | | | | | | | | | | |
Credit risk | | $ | — | | | $ | — | | | $ | 47,784 | | | $ | — | |
Currency risk | | | — | | | | 968,404 | | | | — | | | | 124,650 | |
Interest rate risk | | | (77,065 | ) | | | — | | | | 607,645 | | | | — | |
Market risk | | | (461,045 | ) | | | — | | | | — | | | | 81,376 | |
Change in Unrealized Appreciation (Depreciation): | | | | | | | | | | | | | | | | |
Credit risk | | | — | | | | — | | | | (10,411 | ) | | | — | |
Currency risk | | | — | | | | 471,769 | | | | (61,565 | ) | | | — | |
Interest rate risk | | | 29,383 | | | | — | | | | 1,110,327 | | | | (455,281 | ) |
Market risk | | | (174,686 | ) | | | — | | | | (288,162 | ) | | | 256,972 | |
Total | | $ | (683,413 | ) | | $ | 1,440,173 | | | $ | 1,405,618 | | | $ | 7,717 | |
| (a) | Options purchased are included in the net realized gain (loss) from investment securities and net change in unrealized appreciation of investment securities. |
The table below summarizes the average notional value of futures contracts, forward foreign currency contracts, swap agreements, index options written, index options purchased, foreign currency options and swaptions outstanding during the period.
| | | | | | | | | | | | | | | | | | | | | | | | | | | | |
| | | Futures | | | Forward Foreign Currency Contracts | | | Swap Agreements | | | Index Options Written | | | Index Options Purchased | | | Foreign Currency Options | | | Swaptions | |
Average notional value | | $ | 19,652,307 | | | $ | 43,834,722 | | | $ | 87,103,655 | | | $ | 62,230,625 | | | $ | 25,443,620 | | | $ | 18,445,920 | | | $ | 23,794,329 | |
Average contracts | | | — | | | | — | | | | — | | | | 466 | | | | 788 | | | | — | | | | — | |
Offsetting Assets and Liabilities
Accounting Standards Update (“ASU”) No. 2011-11, Disclosures about Offsetting Assets and Liabilities, which was subsequently clarified in Financial Accounting Standards Board ASU 2013-01 “Clarifying the Scope of Disclosures about Offsetting Assets and Liabilities” is intended to enhance disclosures about financial instruments and derivative instruments that are subject to offsetting arrangements on the Statement of Assets and Liabilities and to enable investors to better understand the effect of those arrangements on its financial position. In order for an arrangement to be eligible for netting, the Fund must have a basis to conclude that such netting arrangements are legally enforceable. The Fund enters into netting agreements and collateral agreements in an attempt to reduce the Fund’s Counterparty credit risk by providing for a single net settlement with a Counterparty of all financial transactions covered by the agreement in an event of default as defined under such agreement.
There were no derivative instruments subject to a netting agreement for which the Fund is not currently netting. The following tables present derivative instruments that are either subject to an enforceable netting agreement or offset by collateral arrangements as of October 31, 2014.
| | | | | | | | | | | | | | | | | | | | | | | | |
| Assets: | |
| | | Gross amounts presented in Statement of Assets & Liabilities | | | Gross amounts offset in Statement of Assets & Liabilities | | | Net amounts of assets presented in the Statement of Assets &
Liabilities | | | Collateral Received | | | | |
| Counterparty | | | | | Financial Instruments | | | Cash | | | Net Amount | |
Barclays Bank PLC(a) | | $ | 648,450 | | | $ | — | | | $ | 648,450 | | | $ | — | | | $ | — | | | $ | 648,450 | |
Citigroup Global Markets Inc.(a) | | | 14,184 | | | | (2,430 | ) | | | 11,754 | | | | — | | | | — | | | | 11,754 | |
Credit Suisse First Boston(b) | | | 2,237,380 | | | | (1,904,697 | ) | | | 332,683 | | | | — | | | | — | | | | 332,683 | |
Deutsche Bank Securities Inc.(a) | | | 108,001 | | | | (108,001 | ) | | | — | | | | — | | | | — | | | | — | |
Deutsche Bank Securities Inc.(c) | | | 65,976 | | | | (65,976 | ) | | | — | | | | — | | | | — | | | | — | |
Goldman Sachs International(a) | | | 59,668 | | | | (59,668 | ) | | | — | | | | — | | | | — | | | | — | |
Goldman Sachs International(c) | | | 148,952 | | | | (28,347 | ) | | | 120,605 | | | | — | | | | — | | | | 120,605 | |
HSBC New York(a) | | | 17,451 | | | | (17,451 | ) | | | — | | | | — | | | | — | | | | — | |
J.P. Morgan Chase Bank, N.A. (a) | | | 145,720 | | | | (145,720 | ) | | | — | | | | — | | | | — | | | | — | |
Morgan Stanley Capital Services LLC(a) | | | 137,079 | | | | (70,144 | ) | | | 66,935 | | | | — | | | | — | | | | 66,935 | |
Royal Bank of Scotland Securities Inc.(a) | | | 56,514 | | | | (4,878 | ) | | | 51,636 | | | | — | | | | — | | | | 51,636 | |
Societe Generale(a) | | | 12 | | | | — | | | | 12 | | | | — | | | | — | | | | 12 | |
State Street Bank & Trust Co.(c) | | | 779,629 | | | | (276,797 | ) | | | 502,832 | | | | — | | | | — | | | | 502,832 | |
UBS(a) | | | 7,687 | | | | (7,687 | ) | | | — | | | | — | | | | — | | | | — | |
Total | | $ | 4,426,703 | | | $ | (2,691,796 | ) | | $ | 1,734,907 | | | $ | — | | | $ | — | | | $ | 1,734,907 | |
29 Invesco Global Targeted Returns Fund
| | | | | | | | | | | | | | | | | | | | | | | | |
| Liabilities: | |
| | | Gross amounts presented in Statement of Assets & Liabilities | | | Gross amounts offset in Statement of Assets & Liabilities | | | Net amounts of liabilities
presented in the Statement of Assets &
Liabilities | | | Collateral Pledged | | | | |
| Counterparty | | | | | Financial Instruments | | | Cash | | | Net Amount | |
Citigroup Global Markets Inc.(a) | | $ | 2,430 | | | $ | (2,430 | ) | | $ | — | | | $ | — | | | $ | — | | | $ | — | |
Credit Suisse First Boston(b) | | | 1,904,697 | | | | (1,904,697 | ) | | | — | | | | — | | | | — | | | | — | |
Deutsche Bank Securities Inc.(a) | | | 225,097 | | | | (108,001 | ) | | | 117,096 | | | | — | | | | — | | | | 117,096 | |
Deutsche Bank Securities Inc.(c) | | | 207,808 | | | | (65,976 | ) | | | 141,832 | | | | — | | | | — | | | | 141,832 | |
Goldman Sachs International(a) | | | 153,213 | | | | (59,668 | ) | | | 93,545 | | | | — | | | | — | | | | 93,545 | |
Goldman Sachs International (c) | | | 28,347 | | | | (28,347 | ) | | | — | | | | — | | | | — | | | | — | |
HSBC New York(a) | | | 52,249 | | | | (17,451 | ) | | | 34,798 | | | | — | | | | — | | | | 34,798 | |
J.P. Morgan Chase Bank, N.A.(a) | | | 152,053 | | | | (145,720 | ) | | | 6,333 | | | | — | | | | — | | | | 6,333 | |
Morgan Stanley Capital
Services LLC(a) | | | 70,144 | | | | (70,144 | ) | | | — | | | | — | | | | — | | | | — | |
Royal Bank of Scotland Securities Inc.(a) | | | 4,878 | | | | (4,878 | ) | | | — | | | | — | | | | — | | | | — | |
Royal Bank of Scotland Securities Inc.(c) | | | 9,836 | | | | — | | | | 9,836 | | | | — | | | | — | | | | 9,836 | |
State Street Bank & Trust Co.(c) | | | 276,797 | | | | (276,797 | ) | | | — | | | | — | | | | — | | | | — | |
UBS(a) | | | 13,787 | | | | (7,687 | ) | | | 6,100 | | | | — | | | | — | | | | 6,100 | |
Total | | $ | 3,101,336 | | | $ | (2,691,796 | ) | | $ | 409,540 | | | $ | — | | | $ | — | | | $ | 409,540 | |
| (a) | Swap agreements — OTC Counterparty. |
| (b) | Swap agreements — centrally cleared Counterparty. Includes cumulative appreciation (depreciation). |
| (c) | Forward foreign currency contracts Counterparty. |
NOTE 5—Trustees’ and Officers’ Fees and Benefits
Trustees’ and Officers’ Fees and Benefits include amounts accrued by the Fund to pay remuneration to certain Trustees and Officers of the Fund. Trustees have the option to defer compensation payable by the Fund, and Trustees’ and Officers’ Fees and Benefits also include amounts accrued by the Fund to fund such deferred compensation amounts. Those Trustees who defer compensation have the option to select various Invesco Funds in which their deferral accounts shall be deemed to be invested. Obligations under the deferred compensation and retirement plans represent unsecured claims against the general assets of the Fund.
NOTE 6—Cash Balances
The Fund is permitted to temporarily carry a negative or overdrawn balance in its account with State Street Bank and Trust Company, the custodian bank. Such balances, if any at period end, are shown in the Consolidated Statement of Assets and Liabilities under the payable caption Amount due custodian. To compensate the custodian bank for such overdrafts, the overdrawn Fund may either (1) leave funds as a compensating balance in the account so the custodian bank can be compensated by earning the additional interest; or (2) compensate by paying the custodian bank at a rate agreed upon by the custodian bank and Invesco, not to exceed the contractually agreed upon rate.
NOTE 7—Distributions to Shareholders and Tax Components of Net Assets
Tax Character of Distributions to Shareholders Paid During the Period December 19, 2013 (commencement date) through October 31, 2014:
There were no ordinary income or capital gains distributions during the period December 19, 2013 (commencement date) through October 31, 2014.
Tax Components of Net Assets at Period-End:
| | | | |
| | | 2014 | |
Undistributed ordinary income | | $ | 134,040 | |
Undistributed long-term gain | | | 136,138 | |
Net unrealized appreciation — investments | | | 371,044 | |
Net unrealized appreciation — other investments | | | 632,280 | |
Temporary book/tax differences | | | (1,560 | ) |
Shares of beneficial interest | | | 41,060,842 | |
Total net assets | | $ | 42,332,784 | |
30 Invesco Global Targeted Returns Fund
The difference between book-basis and tax-basis unrealized appreciation (depreciation) is due to differences in the timing of recognition of gains and losses on investments for tax and book purposes. The Fund’s net unrealized appreciation difference is attributable primarily to wash sales.
The temporary book/tax differences are a result of timing differences between book and tax recognition of income and/or expenses. The Fund’s temporary book/tax differences are the result of the trustee deferral of compensation and retirement plan benefits.
Capital loss carryforward is calculated and reported as of a specific date. Results of transactions and other activity after that date may affect the amount of capital loss carryforward actually available for the Fund to utilize. The ability to utilize capital loss carryforward in the future may be limited under the Internal Revenue Code and related regulations based on the results of future transactions.
The Fund did not have a capital loss carryforward as of October 31, 2014.
NOTE 8—Investment Securities
The aggregate amount of investment securities (other than short-term securities, U.S. Treasury obligations and money market funds, if any) purchased and sold by the Fund during December 19, 2013 (commencement date) through October 31, 2014 was $32,794,061 and $3,926,867, respectively. Cost of investments on a tax basis includes the adjustments for financial reporting purposes as of the most recently completed federal income tax reporting period-end.
| | | | |
| Unrealized Appreciation (Depreciation) of Investment Securities on a Tax Basis | |
Aggregate unrealized appreciation of investment securities | | $ | 1,062,875 | |
Aggregate unrealized (depreciation) of investment securities | | | (691,831 | ) |
Net unrealized appreciation of investment securities | | $ | 371,044 | |
Cost of investments for tax purposes is $34,722,392.
NOTE 9—Reclassification of Permanent Differences
Primarily as a result of differing book/tax treatment of stock issuance costs, organizational expenses, income from derivative investments and net operating losses, on October 31, 2014, undistributed net investment income (loss) was increased by $7,716, undistributed net realized gain was increased by $81,268 and shares of beneficial interest was decreased by $88,984. This reclassification had no effect on the net assets of the Fund.
NOTE 10—Share Information
| | | | | | | | |
| | | Summary of Share Activity | |
| | | December 19, 2013
(commencement date) through
October 31, 2014(a) | |
| | | Shares | | | Amount | |
Sold: | | | | | | | | |
Class A | | | 1,491,403 | | | $ | 15,070,925 | |
Class C | | | 42,851 | | | | 443,040 | |
Class R | | | 1,001 | | | | 10,014 | |
Class Y | | | 1,586,102 | | | | 16,042,737 | |
Class R5 | | | 261,687 | | | | 2,641,159 | |
Class R6 | | | 889,089 | | | | 9,253,580 | |
| | |
Reacquired: | | | | | | | | |
Class A | | | (197,744 | ) | | | (2,058,608 | ) |
Class Y | | | (23,069 | ) | | | (239,638 | ) |
Class R5 | | | (1,301 | ) | | | (13,383 | ) |
Net increase in share activity | | | 4,050,019 | | | $ | 41,149,826 | |
| (a) | There is an entity that is record owner of more than 5% of the outstanding shares of the Fund and in the aggregate owns 19% of the outstanding shares of the Fund. IDI has an agreement with this entity to sell Fund shares. The Fund, Invesco and/or Invesco affiliates may make payments to this entity, which is considered to be related to the Fund, for providing services to the Fund, Invesco and/or Invesco affiliates including but not limited to services such as securities brokerage, distribution, third party record keeping and account servicing. The Fund has no knowledge as to whether all or any portion of the shares owned of record by this entity are also owned beneficially. Also, 65% of the outstanding shares of the Fund are owned by the Adviser. |
31 Invesco Global Targeted Returns Fund
NOTE 11—Financial Highlights
The following schedule presents financial highlights for a share of the Fund outstanding throughout the periods indicated.
| | | | | | | | | | | | | | | | | | | | | | | | | | | | | | | | | | | | | | | | | | | | |
| | | Net asset
value,
beginning
of period | | | Net
investment
income (loss)(a) | | | Net gains
on securities (both
realized and
unrealized) | | | Total from
investment operations | | | Net asset value, end of period | | | Total
return(b) | | | Net assets, end of period (000’s omitted) | | | Ratio of
expenses
to average net assets
with fee waivers
and/or expenses absorbed(c) | | | Ratio of
expenses
to average net
assets without fee waivers
and/or expenses
absorbed | | | Ratio of net
investment
income to
average
net assets | | | Portfolio
turnover(d) | |
Class A | | | | | | | | | | | | | | | | | | | | | | | | | | | | | | | | | | | | | | | | | | | | |
Year ended 10/31/14(e) | | $ | 10.00 | | | $ | (0.02 | ) | | $ | 0.46 | | | $ | 0.44 | | | $ | 10.44 | | | | 4.40 | % | | $ | 13,504 | | | | 1.29 | %(f) | | | 3.16 | %(f) | | | (0.18 | )%(f) | | | 20 | % |
Class C | | | | | | | | | | | | | | | | | | | | | | | | | | | | | | | | | | | | | | | | | | | | |
Year ended 10/31/14(e) | | | 10.00 | | | | (0.08 | ) | | | 0.45 | | | | 0.37 | | | | 10.37 | | | | 3.70 | | | | 444 | | | | 2.04 | (f) | | | 3.91 | (f) | | | (0.93 | )(f) | | | 20 | |
Class R | | | | | | | | | | | | | | | | | | | | | | | | | | | | | | | | | | | | | | | | | | | | |
Year ended 10/31/14(e) | | | 10.00 | | | | (0.04 | ) | | | 0.46 | | | | 0.42 | | | | 10.42 | | | | 4.20 | | | | 10 | | | | 1.54 | (f) | | | 3.41 | (f) | | | (0.43 | )(f) | | | 20 | |
Class Y | | | | | | | | | | | | | | | | | | | | | | | | | | | | | | | | | | | | | | | | | | | | |
Year ended 10/31/14(e) | | | 10.00 | | | | 0.01 | | | | 0.45 | | | | 0.46 | | | | 10.46 | | | | 4.60 | | | | 16,352 | | | | 1.04 | (f) | | | 2.91 | (f) | | | 0.07 | (f) | | | 20 | |
Class R5 | | | | | | | | | | | | | | | | | | | | | | | | | | | | | | | | | | | | | | | | | | | | |
Year ended 10/31/14(e) | | | 10.00 | | | | 0.01 | | | | 0.45 | | | | 0.46 | | | | 10.46 | | | | 4.60 | | | | 2,724 | | | | 1.04 | (f) | | | 2.87 | (f) | | | 0.07 | (f) | | | 20 | |
Class R6 | | | | | | | | | | | | | | | | | | | | | | | | | | | | | | | | | | | | | | | | | | | | |
Year ended 10/31/14(e) | | | 10.00 | | | | 0.01 | | | | 0.45 | | | | 0.46 | | | | 10.46 | | | | 4.60 | | | | 9,298 | | | | 1.04 | (f) | | | 2.87 | (f) | | | 0.07 | (f) | | | 20 | |
| (a) | Calculated using average shares outstanding. |
| (b) | Includes adjustments in accordance with accounting principles generally accepted in the United States of America and as such, the net asset value for financial reporting purposes and the returns based upon those net asset values may differ from the net asset value and returns for shareholder transactions. Does not include sales charges and is not annualized for periods less than one year, if applicable. |
| (c) | In addition to the fees and expenses which the Fund bears directly; the Fund indirectly bears a pro rata share of the fees and expenses of the underlying funds in which the Fund invests. Because the underlying funds have varied expenses and fee levels and the Fund may own different proportions at different times, the amount of fees and expenses incurred indirectly by the Fund will vary. Estimated underlying fund expenses are not expenses that are incurred directly by your Fund. They are expenses that are incurred directly by the underlying funds and are deducted from the value of the funds your Fund invests in. The effect of the estimated underlying fund expenses that you bear indirectly is included in your Fund’s total return. Estimated acquired fund fees from underlying funds were 0.50% for the period ended October 31, 2014. |
| (d) | Portfolio turnover is calculated at the fund level and is not annualized for periods less than one year, if applicable. |
| (e) | Commencement date of December 19, 2013. |
| (f) | Ratios are annualized and based on average daily net assets (000’s omitted) of $12,502, $126, $10, $13,246, $2,329 and $2,769 for Class A, Class C, Class R, Class Y, Class R5 and Class R6 shares, respectively. |
NOTE 12—Subsequent Event
Effective December 10, 2014, the Fund invested in commodity-linked derivatives through the Invesco Cayman Commodity Fund VII Ltd. (the “Subsidiary”), a wholly-owned subsidiary of the Fund organized under the laws of the Cayman Islands. The Subsidiary was organized by the Fund to invest in commodity-linked derivatives. The Fund may invest up to 25% of its total assets in the Subsidiary.
32 Invesco Global Targeted Returns Fund
Report of Independent Registered Public Accounting Firm
To the Board of Trustees of AIM Investment Funds (Invesco Investment Funds)
and Shareholders of Invesco Global Targeted Returns Fund:
In our opinion, the accompanying statement of assets and liabilities, including the schedule of investments, and the related statements of operations and of changes in net assets and the financial highlights present fairly, in all material respects, the financial position of Invesco Global Targeted Returns Fund (one of the funds constituting AIM Investment Funds (Invesco Investment Funds), hereafter referred to as the “Fund”) at October 31, 2014, and the results of its operations, the changes in its net assets and the financial highlights for the period December 19, 2013 (commencement of operations) through October 31, 2014, in conformity with accounting principles generally accepted in the United States of America. These financial statements and financial highlights (hereafter referred to as “financial statements”) are the responsibility of the Fund’s management. Our responsibility is to express an opinion on these financial statements based on our audit. We conducted our audit of these financial statements in accordance with the standards of the Public Company Accounting Oversight Board (United States). Those standards require that we plan and perform the audit to obtain reasonable assurance about whether the financial statements are free of material misstatement. An audit includes examining, on a test basis, evidence supporting the amounts and disclosures in the financial statements, assessing the accounting principles used and significant estimates made by management, and evaluating the overall financial statement presentation. We believe that our audit, which included confirmation of securities at October 31, 2014 by correspondence with the custodian and brokers, provides a reasonable basis for our opinion.
PRICEWATERHOUSECOOPERS LLP
December 29, 2014
Houston, Texas
33 Invesco Global Targeted Returns Fund
Calculating your ongoing Fund expenses
Example
As a shareholder of the Fund, you incur two types of costs: (1) transaction costs, which may include sales charges (loads) on purchase payments or contingent deferred sales charges on redemptions, if any; and (2) ongoing costs, including management fees, distribution and/or service (12b-1) fees, and other Fund expenses. This example is intended to help you understand your ongoing costs (in dollars) of investing in the Fund and to compare these costs with ongoing costs of investing in other mutual funds. The example is based on an investment of $1,000 invested at the beginning of the period and held for the entire period May 1, 2014 through October 31, 2014.
Actual expenses
The table below provides information about actual account values and actual expenses. You may use the information in this table, together with the amount you invested, to estimate the expenses that you paid over the period. Simply divide your account value by $1,000 (for example, an $8,600 account value divided by $1,000 = 8.6), then multiply the result by the number in the table under the heading entitled “Actual Expenses Paid During Period” to estimate the expenses you paid on your account during this period.
Hypothetical example for comparison purposes
The table below also provides information about hypothetical account values and hypothetical expenses based on the Fund’s actual expense ratio and an assumed rate of return of 5% per year before expenses, which is not the Fund’s actual return.
The hypothetical account values and expenses may not be used to estimate the actual ending account balance or expenses you paid for the period. You may use this information to compare the ongoing costs of investing in the Fund and other funds. To do so, compare this 5% hypothetical example with the 5% hypothetical examples that appear in the shareholder reports of the other funds.
Please note that the expenses shown in the table are meant to highlight your ongoing costs only and do not reflect any transaction costs, such as sales charges (loads) on purchase payments or contingent deferred sales charges on redemptions, if any. Therefore, the hypothetical information is useful in comparing ongoing costs only, and will not help you determine the relative total costs of owning different funds. In addition, if these transaction costs were included, your costs would have been higher.
| | | | | | | | | | | | | | | | | | | | | | | | |
| Class | | Beginning Account Value (05/01/14) | | | ACTUAL | | | HYPOTHETICAL (5% annual return before
expenses) | | | Annualized Expense Ratio | |
| | | Ending Account Value (10/31/14)1 | | | Expenses Paid During Period2 | | | Ending Account Value (10/31/14) | | | Expenses Paid During Period2 | | |
| A | | $ | 1,000.00 | | | $ | 1,011.60 | | | $ | 6.59 | | | $ | 1,018.65 | | | $ | 6.61 | | | | 1.30 | % |
| C | | | 1,000.00 | | | | 1,007.80 | | | | 10.37 | | | | 1,014.87 | | | | 10.41 | | | | 2.05 | |
| R | | | 1,000.00 | | | | 1,010.70 | | | | 7.86 | | | | 1,017.39 | | | | 7.88 | | | | 1.55 | |
| Y | | | 1,000.00 | | | | 1,012.60 | | | | 5.33 | | | | 1,019.91 | | | | 5.35 | | | | 1.05 | |
| R5 | | | 1,000.00 | | | | 1,012.60 | | | | 5.33 | | | | 1,019.91 | | | | 5.35 | | | | 1.05 | |
| R6 | | | 1,000.00 | | | | 1,012.60 | | | | 5.33 | | | | 1,019.93 | | | | 5.35 | | | | 1.05 | |
| 1 | The actual ending account value is based on the actual total return of the Fund for the period May 1, 2014 through October 31, 2014, after actual expenses and will differ from the hypothetical ending account value which is based on the Fund’s expense ratio and a hypothetical annual return of 5% before expenses. |
| 2 | Expenses are equal to the Fund’s annualized expense ratio as indicated above multiplied by the average account value over the period, multiplied by 184/365 to reflect the most recent fiscal half year. |
34 Invesco Global Targeted Returns Fund
Approval of Investment Advisory and Sub-Advisory Contracts
The Board of Trustees (the Board) of AIM Investment Funds (Invesco Investment Funds) is required under the Investment Company Act of 1940, as amended, to approve annually the renewal of Invesco Global Targeted Returns Fund’s (the Fund) investment advisory agreements. During contract renewal meetings held on June 16-17, 2014, the Board as a whole, and the disinterested or “independent” Trustees, who comprise over 75% of the Board, voting separately, approved the continuance for the Fund of the Master Investment Advisory Agreement with Invesco Advisers, Inc. (Invesco Advisers and the investment advisory agreement) and the Master Intergroup Sub-Advisory Contract for Mutual Funds with Invesco Asset Management Deutschland GmbH, Invesco Asset Management Limited, Invesco Asset Management (Japan) Limited, Invesco Australia Limited, Invesco Hong Kong Limited, Invesco Senior Secured Management, Inc., Invesco Canada Ltd. and Invesco PowerShares Capital Management LLC (collectively, the Affiliated Sub-Advisers and the sub-advisory contracts) for another year, effective July 1, 2014.
In evaluating the fairness and reasonableness of compensation under the Fund’s investment advisory agreement and sub-advisory contracts, the Board considered, among other things, the factors discussed below. The Board determined that continuation of the Fund’s investment advisory agreement and the sub-advisory contracts are in the best interest of the Fund and its shareholders and that the compensation payable to Invesco Advisers and the Affiliated Sub-Advisers under the agreements is fair and reasonable.
The Board’s Fund Evaluation Process
The Board’s Investments Committee has established three Sub-Committees, each of which is primarily responsible for overseeing the management of a number of the funds advised by Invesco Advisers (the Invesco Funds). The Sub-Committees meet throughout the year to review the performance of their assigned Invesco Funds, including reviewing materials prepared under the direction of the independent Senior Officer, an officer of the Invesco Funds who reports directly to the independent Trustees. Over the course of each year, the Sub-Committees meet with portfolio managers for their assigned Invesco Funds and other members of management to review the performance, investment objective(s), policies, strategies, limitations and investment risks of these funds. The Sub-Committees meet regularly and at designated contract renewal meetings each year to conduct a review of the performance, fees, expenses and other matters related to their assigned Invesco Funds. Each Sub-Committee recommends to the Investments Committee, which in turn recommends to the full Board, whether and on what terms to
approve the continuance of each Invesco Fund’s investment advisory agreement and sub-advisory contracts for another year.
During the contract renewal process, the Trustees receive comparative performance and fee data regarding the Invesco Funds prepared by Invesco Advisers and Lipper Inc. (Lipper), an independent provider of investment company data. The Trustees also receive an independent written evaluation from the Senior Officer. The Senior Officer’s evaluation is prepared as part of his responsibility to manage the process by which the Invesco Funds’ proposed management fees are negotiated during the annual contract renewal process to ensure they are negotiated in a manner that is at arms’ length and reasonable. In addition to meetings with Invesco Advisers and fund counsel, the independent Trustees also discuss the continuance of the investment advisory agreement and sub-advisory contracts in separate sessions with the Senior Officer and with independent legal counsel.
The Trustees recognized that the advisory fee rates for the Invesco Funds are, in many cases, the result of years of review and negotiation. The Trustees’ deliberations and conclusions in a particular year may be based in part on their deliberations and conclusions regarding these arrangements throughout the year and in prior years. The Trustees’ review and conclusions are based on the comprehensive consideration of all information presented to them and are not the result of any single determinative factor. Moreover, one Trustee may have weighed a particular piece of information or factor differently than another Trustee.
The discussion below serves as the Senior Officer’s independent written evaluation with respect to the Fund’s investment advisory agreement as well as a discussion of the material factors and related conclusions that formed the basis for the Board’s approval of the Fund’s investment advisory agreement and sub-advisory contracts. Unless otherwise stated, this information is current as of June 17, 2014, and may not reflect consideration of factors that became known to the Board after that date.
Factors and Conclusions and Summary of Independent Written Fee Evaluation
| A. | Nature, Extent and Quality of Services Provided by Invesco Advisers and the Affiliated Sub-Advisers |
The Board reviewed the advisory services provided to the Fund by Invesco Advisers under the Fund’s investment advisory agreement, the performance of Invesco Advisers in providing these services, and the credentials and experience of the officers and employees of Invesco Advisers who provide these services, including the Fund’s portfolio manager or managers, with whom the Sub-Committees met
during the year. The Board’s review of the qualifications of Invesco Advisers to provide advisory services included the Board’s consideration of Invesco Advisers’ investment process oversight, independent credit analysis and investment risk management. The Board also considered non-advisory services that Invesco Advisers and its affiliates provide to the Invesco Funds such as various back office support functions, equity and fixed income trading operations, internal audit, distribution and legal and compliance.
In determining whether to continue the Fund’s investment advisory agreement, the Board considered the benefits of reapproving an existing relationship and the greater uncertainty that may be associated with entering into a new relationship. The Board concluded that the nature, extent and quality of the services provided to the Fund by Invesco Advisers are appropriate and satisfactory and consistent with the terms of the Fund’s investment advisory agreement.
The Board reviewed the services that may be provided by the Affiliated Sub-Advisers under the sub-advisory contracts and the credentials and experience of the officers and employees of the Affiliated Sub-Advisers who provide these services. The Board noted that the Affiliated Sub-Advisers have offices and personnel that are located in financial centers around the world. As a result, the Affiliated Sub-Advisers can provide research and investment analysis on the markets and economies of various countries in which the Fund may invest, make recommendations regarding securities and assist with security trades. The Board concluded that the sub-advisory contracts benefit the Fund and its shareholders by permitting Invesco Advisers to use the resources and talents of the Affiliated Sub-Advisers in managing the Fund. The Board concluded that the nature, extent and quality of the services that may be provided by the Affiliated Sub-Advisers are appropriate and satisfactory and consistent with the terms of the Fund’s sub-advisory contracts.
The Board noted that the Fund recently began operations and that no comparative performance data was available.
| C. | Advisory and Sub-Advisory Fees |
The Board noted that Invesco Advisers has contractually agreed to waive fees and/or limit expenses of the Fund through at least December 31, 2105 in an amount necessary to limit total annual operating expenses to a specified percentage of average daily net assets for each class of the Fund.
The Board also compared the Fund’s effective advisory fee rate (the advisory fee rate after advisory fee waivers and before other expense limitations/waivers) to the effective advisory fee
35 Invesco Global Targeted Returns Fund
rates of other mutual funds advised by Invesco Advisers and its affiliates that are managed using an investment process substantially similar to the investment process used for the Fund. The Board noted that the Fund’s rate was above the rates of two off-shore funds that are managed using an investment process substantially similar to the investment process used for the Fund. The Board noted that Invesco Advisers and the Affiliated Sub-Advisers do not manage other client accounts using an investment process substantially similar to the investment process used for the Fund.
The Board also considered the services that may be provided by the Affiliated Sub-Advisers pursuant to the sub-advisory contracts, as well as the fees payable by Invesco Advisers to Affiliated Sub-Advisers pursuant to the sub-advisory contracts. The Board noted that Invesco Asset Management Limited manages assets of the Fund, although Invesco Advisers retains overall responsibility for, and provides services to, sub-advised Invesco Funds, including oversight of the Affiliated Sub-Advisers as well as the additional services described herein other than day-to-day portfolio management. The Board also noted that the sub-advisory fees are not paid directly by the Fund, but rather, are payable by Invesco Advisers to the Affiliated Sub-Advisers.
| D. | Economies of Scale and Breakpoints |
The Board considered the extent to which there are economies of scale in the provision of advisory services to the Fund. The Board also considered whether the Fund benefits from economies of scale through contractual breakpoints in the Fund’s advisory fee schedule and was assisted in this review by a report from the Senior Officer. The Board also noted that the Fund shares directly in economies of scale through lower fees charged by third party service providers based on the combined size of the Invesco Funds and other clients advised by Invesco Advisers.
| E. | Profitability and Financial Resources |
The Board reviewed information from Invesco Advisers concerning the costs of the advisory and other services that Invesco Advisers and its affiliates provide to the Fund and the profitability of Invesco Advisers and its affiliates in providing these services for the year ended December 31, 2013. The Board received information from Invesco Advisers about the methodology used to prepare the profitability information. The Board considered the profitability of Invesco Advisers in managing the Fund and the Invesco Funds. The Board noted that Invesco Advisers continues to operate at a net profit from services Invesco Advisers and its subsidiaries provide to the Invesco Funds. The Board noted that Invesco Advisers and its subsidiaries did not make a profit from managing the Fund as a result of fee and expense waivers. The Board received and accepted information from Invesco Advisers demonstrating that Invesco Advisers and each Affiliated Sub-Adviser are financially sound and have the resources necessary to perform their
obligations under the investment advisory agreement and sub-advisory contracts.
| F. | Collateral Benefits to Invesco Advisers and its Affiliates |
The Board considered various other benefits received by Invesco Advisers and its affiliates from the relationship with the Fund, including the fees received for their provision of transfer agency and distribution services to the Fund. The Board considered comparative information regarding fees charged for these services, including information provided by Lipper and other independent sources. The Board considered the performance of Invesco Advisers and its affiliates in providing these services and the organizational structure employed to provide these services. The Board also considered that these services are provided to the Fund pursuant to written contracts that are reviewed and approved on an annual basis by the Board; that the services are required for the operation of the Fund; that Invesco Advisers and its affiliates can provide services, the nature and quality of which are at least equal to those provided by others offering the same or similar services; and that the fees for such services are fair and reasonable in light of the usual and customary charges by others for services of the same nature and quality.
The Board considered the benefits realized by Invesco Advisers and the Affiliated Sub-Advisers as a result of portfolio brokerage transactions executed through “soft dollar” arrangements. The Board noted that soft dollar arrangements shift the payment obligation for research services from Invesco Advisers and the Affiliated Sub-Advisers to the Invesco Funds and that the research received may be used with other clients of Invesco Advisers and may reduce Invesco Advisers’ and the Affiliated Sub-Advisers’ expenses. The Board also considered that it receives periodic reports from the Chief Compliance Officer of the Invesco Funds demonstrating that these arrangements are consistent with regulatory requirements. The Board did not deem the soft dollar arrangements to be inappropriate.
The Board considered that the Fund’s uninvested cash and cash collateral from any securities lending arrangements may be invested in money market funds advised by Invesco Advisers pursuant to procedures approved by the Board. The Board noted that Invesco Advisers receives advisory fees from these affiliated money market funds attributable to such investments, although Invesco Advisers has contractually agreed to waive through varying periods the advisory fees payable by the Invesco Funds with respect to investments in the affiliated money market funds. The waiver is in an amount equal to 100% of the net advisory fee Invesco Advisers receives from the affiliated money market funds with respect to the Fund’s investment in the affiliated money market funds of uninvested cash, but not cash collateral. The Board concluded that the amount of advisory fees received by Invesco Advisors from the Fund’s
investment of uninvested cash and cash collateral from any securities lending arrangements in the affiliated money market funds are fair and reasonable.
The Board also considered the Fund may use an affiliated broker to execute certain trades for the Fund to among other things, control information leakage, and were advised that such trades would be executed in compliance with rules under the Investment Company Act of 1940, as amended.
36 Invesco Global Targeted Returns Fund
Trustees and Officers
The address of each trustee and officer is AIM Investment Funds (Invesco Investment Funds) (the “Trust”), 11 Greenway Plaza, Suite 1000, Houston, Texas 77046-1173. The trustees serve for the life of the Trust, subject to their earlier death, incapacitation, resignation, retirement or removal as more specifically provided in the Trust’s organizational documents. Each officer serves for a one year term or until their successors are elected and qualified. Column two below includes length of time served with predecessor entities, if any.
| | | | | | | | |
Name, Year of Birth and Position(s) Held with the Trust | | Trustee and/
or Officer Since | | Principal Occupation(s) During Past 5 Years | | Number of Funds in Fund Complex Overseen by Trustee | | Other Directorship(s) Held by Trustee During Past 5 Years |
| Interested Persons | | | | | | | | |
| Martin L. Flanagan1 — 1960 Trustee | | 2007 | | Executive Director, Chief Executive Officer and President, Invesco Ltd. (ultimate parent of Invesco and a global investment management firm); Advisor to the Board, Invesco Advisers, Inc. (formerly known as Invesco Institutional (N.A.), Inc.); Trustee, The Invesco Funds; Vice Chair, Investment Company Institute; and Member of Executive Board, SMU Cox School of Business Formerly: Chairman and Chief Executive Officer, Invesco Advisers, Inc. (registered investment adviser); Director, Chairman, Chief Executive Officer and President, IVZ Inc. (holding company), INVESCO Group Services, Inc. (service provider) and Invesco North American Holdings, Inc. (holding company); Director, Chief Executive Officer and President, Invesco Holding Company Limited (parent of Invesco and a global investment management firm); Director, Invesco Ltd.; Chairman, Investment Company Institute and President, Co-Chief Executive Officer, Co-President, Chief Operating Officer and Chief Financial Officer, Franklin Resources, Inc. (global investment management organization). | | 144 | | None |
Philip A. Taylor2 — 1954 Trustee, President and Principal Executive Officer | | 2006 | | Head of North American Retail and Senior Managing Director, Invesco Ltd.; Director, Co-Chairman, Co-President and Co-Chief Executive Officer, Invesco Advisers, Inc. (formerly known as Invesco Institutional (N.A.), Inc.) (registered investment adviser); Director, Chairman, Chief Executive Officer and President, Invesco Management Group, Inc. (formerly known as Invesco Aim Management Group, Inc.) (financial services holding company); Director and President, INVESCO Funds Group, Inc. (registered investment adviser and registered transfer agent); Director and Chairman, Invesco Investment Services, Inc. (formerly known as Invesco Aim Investment Services, Inc.) (registered transfer agent) and IVZ Distributors, Inc. (formerly known as INVESCO Distributors, Inc.) (registered broker dealer); Director, President and Chairman, Invesco Inc. (holding company) and Invesco Canada Holdings Inc. (holding company); Chief Executive Officer, Invesco Corporate Class Inc. (corporate mutual fund company) and Invesco Canada Fund Inc. (corporate mutual fund company); Director, Chairman and Chief Executive Officer, Invesco Canada Ltd. (formerly known as Invesco Trimark Ltd./Invesco Trimark Ltèe) (registered investment adviser and registered transfer agent); Trustee, President and Principal Executive Officer, The Invesco Funds (other than AIM Treasurer’s Series Trust (Invesco Treasurer’s Series Trust) and Short-Term Investments Trust); Trustee and Executive Vice President, The Invesco Funds (AIM Treasurer’s Series Trust (Invesco Treasurer’s Series Trust) and Short-Term Investments Trust only); Director, Invesco Investment Advisers LLC (formerly known as Van Kampen Asset Management); Director, Chief Executive Officer and President, Van Kampen Exchange Corp. Formerly: Director and Chairman, Van Kampen Investor Services Inc.; Director, Chief Executive Officer and President, 1371 Preferred Inc. (holding company) and Van Kampen Investments Inc.; Director and President, AIM GP Canada Inc. (general partner for limited partnerships) and Van Kampen Advisors, Inc.; Director and Chief Executive Officer, Invesco Trimark Dealer Inc. (registered broker dealer); Director, Invesco Distributors, Inc. (formerly known as Invesco Aim Distributors, Inc.) (registered broker dealer); Manager, Invesco PowerShares Capital Management LLC; Director, Chief Executive Officer and President, Invesco Advisers, Inc.; Director, Chairman, Chief Executive Officer and President, Invesco Aim Capital Management, Inc.; President, Invesco Trimark Dealer Inc. and Invesco Trimark Ltd./Invesco Trimark Ltèe; Director and President, AIM Trimark Corporate Class Inc. and AIM Trimark Canada Fund Inc.; Senior Managing Director, Invesco Holding Company Limited; Director and Chairman, Fund Management Company (former registered broker dealer); President and Principal Executive Officer, The Invesco Funds (AIM Treasurer’s Series Trust (Invesco Treasurer’s Series Trust), and Short-Term Investments Trust only); President, AIM Trimark Global Fund Inc. and AIM Trimark Canada Fund Inc. | | 144 | | None |
Wayne W. Whalen3 — 1939 Trustee | | 2010 | | Of Counsel, and prior to 2010, partner in the law firm of Skadden, Arps, Slate, Meagher & Flom LLP, legal counsel to certain funds in the Fund Complex | | 144 | | Director of the Mutual fund Directors Forum, a nonprofit membership organization for investment directors; Chairman and Director of the Abraham Lincoln Presidential Library Foundation; and Director of the Stevenson Center for Democracy |
| 1 | Mr. Flanagan is considered an interested person (within the meaning of Section 2(a)(19) of the 1940 Act) of the Trust because he is an officer of the Adviser to the Trust, and an officer and a director of Invesco Ltd., ultimate parent of the Adviser. |
| 2 | Mr. Taylor is considered an interested person (within the meaning of Section 2(a)(19) of the 1940 Act) of the Trust because he is an officer and a director of the Adviser. |
| 3 | Mr. Whalen is retiring effective December 31, 2014. He has been deemed to be an interested person of the Trust because of his prior service as counsel to the predecessor funds of certain Invesco open-end funds and his affiliation with the law firm that served as counsel to such predecessor funds and the Invesco closed-end funds. |
T-1 Invesco Global Targeted Returns Fund
Trustees and Officers—(continued)
| | | | | | | | |
Name, Year of Birth and Position(s) Held with the Trust | | Trustee and/
or Officer Since | | Principal Occupation(s) During Past 5 Years | | Number of Funds in Fund Complex Overseen by Trustee | | Other Directorship(s) Held by Trustee During Past 5 Years |
| Independent Trustees | | | | | | | | |
Bruce L. Crockett — 1944 Trustee and Chair | | 2001 | | Chairman, Crockett Technologies Associates (technology consulting company) Formerly: Director, Captaris (unified messaging provider); Director, President and Chief Executive Officer, COMSAT Corporation; Chairman, Board of Governors of INTELSAT (international communications company); ACE Limited (insurance company); and Investment Company Institute | | 144 | | ALPS (Attorneys Liability Protection Society) (insurance company) |
David C. Arch — 1945 Trustee | | 2010 | | Chairman of Blistex Inc., a consumer health care products manufacturer | | 144 | | Board member of the Illinois Manufacturers’ Association; Member of the Board of Visitors, Institute for the Humanities, University of Michigan; Member of the Audit Committee of the Edward-Elmhurst Hospital |
Frank S. Bayley — 1939 Trustee | | 1987 | | Retired. Formerly: Director, Badgley Funds Inc. (registered investment company) (2 portfolios) and General Partner and Of Counsel, law firm of Baker & McKenzie, LLP | | 144 | | Director and Chairman, C.D. Stimson Company (a real estate investment company); Trustee, The Curtis Institute of Music |
James T. Bunch — 1942 Trustee | | 2003 | | Managing Member, Grumman Hill Group LLC (family office private equity investments) Formerly: Founder, Green Manning & Bunch Ltd. (investment banking firm) (1988-2010); Executive Committee, United States Golf Association; and Director, Policy Studies, Inc. and Van Gilder Insurance Corporation | | 144 | | Chairman, Board of Governors, Western Golf Association; Chairman, Evans Scholars Foundation; and Director, Denver Film Society |
Rodney F. Dammeyer — 1940 Trustee | | 2010 | | Chairman of CAC,LLC, (private company offering capital investment and management advisory services) Formerly: Prior to 2001, Managing Partner at Equity Group Corporate Investments; Prior to 1995, Chief Executive Officer of Itel Corporation (formerly Anixter International); Prior to 1985, experience includes Senior Vice President and Chief Financial Officer of Household International, Inc., Executive Vice President and Chief Financial Officer of Northwest Industries, Inc. and Partner of Arthur Andersen & Co.; From 1987 to 2010, Director/Trustee of investment companies in the Van Kampen Funds complex | | 144 | | Director of Quidel Corporation and Stericycle, Inc. |
Albert R. Dowden — 1941 Trustee | | 2001 | | Director of a number of public and private business corporations, including the Boss Group, Ltd. (private investment and management); Nature’s Sunshine Products, Inc. and Reich & Tang Funds (5 portfolios) (registered investment company) Formerly: Director, Homeowners of America Holding Corporation/Homeowners of America Insurance Company (property casualty company); Director, Continental Energy Services, LLC (oil and gas pipeline service); Director, CompuDyne Corporation (provider of product and services to the public security market) and Director, Annuity and Life Re (Holdings), Ltd. (reinsurance company); Director, President and Chief Executive Officer, Volvo Group North America, Inc.; Senior Vice President, AB Volvo; Director of various public and private corporations; Chairman, DHJ Media, Inc.; Director, Magellan Insurance Company; and Director, The Hertz Corporation, Genmar Corporation (boat manufacturer), National Media Corporation; Advisory Board of Rotary Power International (designer, manufacturer, and seller of rotary power engines); and Chairman, Cortland Trust, Inc. (registered investment company) | | 144 | | Director of: Nature’s Sunshine Products, Inc., Reich & Tang Funds, Homeowners of America Holding Corporation/ Homeowners of America Insurance Company, the Boss Group |
Jack M. Fields — 1952 Trustee | | 2001 | | Chief Executive Officer, Twenty First Century Group, Inc. (government affairs company); Owner and Chief Executive Officer, Dos Angeles Ranch, L.P. (cattle, hunting, corporate entertainment); and Discovery Global Education Fund (non-profit) Formerly: Chief Executive Officer, Texana Timber LP (sustainable forestry company); Director of Cross Timbers Quail Research Ranch (non-profit); and member of the U.S. House of Representatives | | 144 | | Insperity, Inc. (formerly known as Administaff) |
Prema Mathai-Davis — 1950 Trustee | | 2001 | | Retired. Formerly: Chief Executive Officer, YWCA of the U.S.A. | | 144 | | None |
Larry Soll — 1942 Trustee | | 2003 | | Retired. Formerly: Chairman, Chief Executive Officer and President, Synergen Corp. (a biotechnology company) | | 144 | | None |
Hugo F. Sonnenschein — 1940 Trustee | | 2010 | | President Emeritus and Honorary Trustee of the University of Chicago and the Adam Smith Distinguished Service Professor in the Department of Economics at the University of Chicago. Prior to 2000, President of the University of Chicago | | 144 | | Trustee of the University of Rochester and a member of its investment committee; Member of the National Academy of Sciences and the American Philosophical Society; Fellow of the American Academy of Arts and Sciences |
T-2 Invesco Global Targeted Returns Fund
Trustees and Officers—(continued)
| | | | | | | | |
Name, Year of Birth and Position(s) Held with the Trust | | Trustee and/
or Officer Since | | Principal Occupation(s) During Past 5 Years | | Number of Funds in Fund Complex Overseen by Trustee | | Other Directorship(s) Held by Trustee During Past 5 Years |
| Independent Trustees—(continued) |
Raymond Stickel, Jr. — 1944 Trustee | | 2005 | | Retired. Formerly: Director, Mainstay VP Series Funds, Inc. (25 portfolios) and Partner, Deloitte & Touche | | 144 | | None |
Suzanne H. Woolsey — 1941 Trustee | | 2014 | | Chief Executive Officer of Woolsey Partners LLC | | 144 | | Emeritus Chair of the Board of Trustees of the Institute for Defense Analyses; Trustee of Colorado College; Trustee of California Institute of Technology; Prior to 2014, Director of Fluor Corp.; Prior to 2010, Trustee of the German Marshall Fund of the United States; Prior to 2010 Trustee of the Rocky Mountain Institute |
| Other Officers | | | | | | | | |
Russell C. Burk — 1958 Senior Vice President and Senior Officer | | 2005 | | Senior Vice President and Senior Officer, The Invesco Funds | | N/A | | N/A |
John M. Zerr — 1962 Senior Vice President, Chief Legal Officer and Secretary | | 2006 | | Director, Senior Vice President, Secretary and General Counsel, Invesco Management Group, Inc. (formerly known as Invesco Aim Management Group, Inc.) and Van Kampen Exchange Corp.; Senior Vice President, Invesco Advisers, Inc. (formerly known as Invesco Institutional (N.A.), Inc.) (registered investment adviser); Senior Vice President and Secretary, Invesco Distributors, Inc. (formerly known as Invesco Aim Distributors, Inc.); Director, Vice President and Secretary, Invesco Investment Services, Inc. (formerly known as Invesco Aim Investment Services, Inc.) and IVZ Distributors, Inc. (formerly known as INVESCO Distributors, Inc.); Director and Vice President, INVESCO Funds Group, Inc.; Senior Vice President, Chief Legal Officer and Secretary, The Invesco Funds; Manager, Invesco PowerShares Capital Management LLC; Director, Secretary and General Counsel, Invesco Investment Advisers LLC (formerly known as Van Kampen Asset Management); Secretary and General Counsel, Invesco Capital Markets, Inc. (formerly known as Van Kampen Funds Inc.) and Chief Legal Officer, PowerShares Exchange-Traded Fund Trust, PowerShares Exchange-Traded Fund Trust II, PowerShares India Exchange-Traded Fund Trust, PowerShares Actively Managed Exchange-Traded Fund Trust; and PowerShares Actively Managed Exchange-Traded Commodity Fund Trust Formerly: Director and Vice President, Van Kampen Advisors Inc.; Director, Vice President, Secretary and General Counsel, Van Kampen Investor Services Inc.; Director, Invesco Distributors, Inc. (formerly known as Invesco Aim Distributors, Inc.); Director, Senior Vice President, General Counsel and Secretary, Invesco Aim Advisers, Inc. and Van Kampen Investments Inc.; Director, Vice President and Secretary, Fund Management Company; Director, Senior Vice President, Secretary, General Counsel and Vice President, Invesco Aim Capital Management, Inc.; Chief Operating Officer and General Counsel, Liberty Ridge Capital, Inc. (an investment adviser); Vice President and Secretary, PBHG Funds (an investment company) and PBHG Insurance Series Fund (an investment company); Chief Operating Officer, General Counsel and Secretary, Old Mutual Investment Partners (a broker-dealer); General Counsel and Secretary, Old Mutual Fund Services (an administrator) and Old Mutual Shareholder Services (a shareholder servicing center); Executive Vice President, General Counsel and Secretary, Old Mutual Capital, Inc. (an investment adviser); and Vice President and Secretary, Old Mutual Advisors Funds (an investment company) | | N/A | | N/A |
Sheri Morris — 1964 Vice President, Treasurer and Principal Financial Officer | | 1999 | | Vice President, Treasurer and Principal Financial Officer, The Invesco Funds; Vice President, Invesco Advisers, Inc. (formerly known as Invesco Institutional (N.A.), Inc.) (registered investment adviser); and Vice President, PowerShares Exchange-Traded Fund Trust, PowerShares Exchange-Traded Fund Trust II, PowerShares India Exchange-Traded Fund Trust, PowerShares Actively Managed Exchange-Traded Fund Trust, and PowerShares Actively Managed Exchange-Traded Commodity Fund Trust Formerly: Vice President, Invesco Aim Advisers, Inc., Invesco Aim Capital Management, Inc. and Invesco Aim Private Asset Management, Inc.; Assistant Vice President and Assistant Treasurer, The Invesco Funds and Assistant Vice President, Invesco Advisers, Inc., Invesco Aim Capital Management, Inc. and Invesco Aim Private Asset Management, Inc.; and Treasurer, PowerShares Exchange-Traded Fund Trust, PowerShares Exchange-Traded Fund Trust II, PowerShares India Exchange-Traded Fund Trust and PowerShares Actively Managed Exchange-Traded Fund Trust | | N/A | | N/A |
T-3 Invesco Global Targeted Returns Fund
Trustees and Officers—(continued)
| | | | | | | | |
Name, Year of Birth and Position(s) Held with the Trust | | Trustee and/
or Officer Since | | Principal Occupation(s) During Past 5 Years | | Number of Funds in Fund Complex Overseen by Trustee | | Other Directorship(s) Held by Trustee During Past 5 Years |
| Other Officers—(continued) | | | | | | | | |
Karen Dunn Kelley — 1960 Vice President | | 2004 | | Senior Managing Director, Investments; Director, Co-President, Co-Chief Executive Officer, and Co-Chairman, Invesco Advisers, Inc. (formerly known as Invesco Institutional (N.A.), Inc.) (registered investment adviser); Chairman, Invesco Senior Secured Management, Inc.; Senior Vice President, Invesco Management Group, Inc. (formerly known as Invesco Aim Management Group, Inc.); Executive Vice President, Invesco Distributors, Inc. (formerly known as Invesco Aim Distributors, Inc.); Director, Invesco Mortgage Capital Inc. and Invesco Management Company Limited; Director and President, INVESCO Asset Management (Bermuda) Ltd., Vice President, The Invesco Funds (other than AIM Treasurer’s Series Trust (Invesco Treasurer’s Series Trust) and Short-Term Investments Trust); and President and Principal Executive Officer, The Invesco Funds (AIM Treasurer’s Series Trust (Invesco Treasurer’s Series Trust) and Short-Term Investments Trust only) Formerly: Director, INVESCO Global Asset Management Limited and INVESCO Management S.A.; Senior Vice President, Van Kampen Investments Inc. and Invesco Advisers, Inc. (formerly known as Invesco Institutional (N.A.), Inc.) (registered investment adviser); Vice President, Invesco Advisers, Inc. (formerly known as Invesco Institutional (N.A.), Inc.); Director of Cash Management and Senior Vice President, Invesco Advisers, Inc. and Invesco Aim Capital Management, Inc.; Director and President, Fund Management Company; Chief Cash Management Officer, Director of Cash Management, Senior Vice President, and Managing Director, Invesco Aim Capital Management, Inc.; Director of Cash Management, Senior Vice President, and Vice President, Invesco Advisers, Inc. and The Invesco Funds (AIM Treasurer’s Series Trust (Invesco Treasurer’s Series Trust), and Short-Term Investments Trust only) | | N/A | | N/A |
Crissie M. Wisdom — 1969 Anti-Money Laundering Compliance Officer | | 2013 | | Anti-Money Laundering Compliance Officer, Invesco Advisers, Inc. (formerly known as Invesco Institutional (N.A.), Inc.) (registered investment adviser), Invesco Capital Markets, Inc. (formerly known as Van Kampen Funds Inc.), Invesco Distributors, Inc., Invesco Investment Services, Inc., Invesco Management Group, Inc., Van Kampen Exchange Corp., The Invesco Funds, and PowerShares Exchange-Traded Fund Trust, PowerShares Exchange-Traded Fund Trust II, PowerShares India Exchange-Traded Fund Trust, PowerShares Actively Managed Exchange-Traded Fund Trust and PowerShares Actively Managed Exchange-Traded Commodity Fund Trust; and Fraud Prevention Manager and Controls and Risk Analysis Manager for Invesco Investment Services, Inc. | | N/A | | N/A |
Todd L. Spillane — 1958 Chief Compliance Officer | | 2006 | | Senior Vice President, Invesco Management Group, Inc. (formerly known as Invesco Aim Management Group, Inc.) and Van Kampen Exchange Corp.; Senior Vice President and Chief Compliance Officer, Invesco Advisers, Inc. (registered investment adviser) (formerly known as Invesco Institutional (N.A.), Inc.); Chief Compliance Officer, The Invesco Funds; Vice President, Invesco Distributors, Inc. (formerly known as Invesco Aim Distributors, Inc.) and Invesco Investment Services, Inc. (formerly known as Invesco Aim Investment Services, Inc.) Formerly: Chief Compliance Officer, Invesco Funds (Chicago); Senior Vice President, Van Kampen Investments Inc.; Senior Vice President and Chief Compliance Officer, Invesco Aim Advisers, Inc. and Invesco Aim Capital Management, Inc.; Chief Compliance Officer, INVESCO Private Capital Investments, Inc. (holding company), Invesco Private Capital, Inc. (registered investment adviser), Invesco Global Asset Management (N.A.), Inc., Invesco Senior Secured Management, Inc. (registered investment adviser), Van Kampen Investor Services Inc., PowerShares Exchange-Traded Fund Trust, PowerShares Exchange-Traded Fund Trust II, PowerShares India Exchange-Traded Fund Trust and PowerShares Actively Managed Exchange-Traded Fund Trust; and Vice President, Invesco Aim Capital Management, Inc. and Fund Management Company | | N/A | | N/A |
The Statement of Additional Information of the Trust includes additional information about the Fund’s Trustees and is available upon request, without charge, by calling 1.800.959.4246. Please refer to the Fund’s prospectus for information on the Fund’s sub-advisers.
| | | | | | |
Office of the Fund 11 Greenway Plaza, Suite 1000 Houston, TX 77046-1173 | | Investment Adviser Invesco Advisers, Inc. 1555 Peachtree Street, N.E. Atlanta, GA 30309 | | Distributor Invesco Distributors, Inc. 11 Greenway Plaza, Suite 1000 Houston, TX 77046-1173 | | Auditors PricewaterhouseCoopers LLP 1000 Louisiana Street, Suite 5800 Houston, TX 77002-5678 |
| | | |
| | | | | | |
Counsel to the Fund Stradley Ronon Stevens & Young, LLP 2005 Market Street, Suite 2600 Philadelphia, PA 19103-7018 | | Counsel to the Independent Trustees Goodwin Procter LLP 901 New York Avenue, N.W. Washington, D.C. 20001 | | Transfer Agent Invesco Investment Services, Inc. 11 Greenway Plaza, Suite 1000 Houston, TX 77046-1173 | | Custodian State Street Bank and Trust Company 225 Franklin Street Boston, MA 02110-2801 |
T-4 Invesco Global Targeted Returns Fund

Invesco mailing information
Send general correspondence to Invesco Investment Services, Inc., P.O. Box 219078, Kansas City, MO 64121-9078.
Important notice regarding delivery of security holder documents
To reduce Fund expenses, only one copy of most shareholder documents may be mailed to shareholders with multiple accounts at the same address (Householding). Mailing of your shareholder documents may be householded indefinitely unless you instruct us otherwise. If you do not want the mailing of these documents to be combined with those for other members of your household, please contact Invesco Investment Services, Inc. at 800 959 4246 or contact your financial institution. We will begin sending you individual copies for each account within 30 days after receiving your request.
Fund holdings and proxy voting information
The Fund provides a complete list of its holdings four times in each fiscal year, at the quarter ends. For the second and fourth quarters, the lists appear in the Fund’s semiannual and annual reports to shareholders. For the first and third quarters, the Fund files the lists with the Securities and Exchange Commission (SEC) on Form N-Q. The most recent list of portfolio holdings is available at invesco.com/completeqtrholdings. Shareholders can also look up the Fund’s Forms
N-Q on the SEC website at sec.gov. Copies of the Fund’s Forms N-Q may be reviewed and copied at the SEC Public Reference Room in Washington, D.C. You can obtain information on the operation of the Public Reference Room, including information about duplicating fee charges, by calling 202 551 8090 or 800 732 0330, or by electronic request at the following email address: publicinfo@sec.gov. The SEC file numbers for the Fund are shown below.
A description of the policies and procedures that the Fund uses to determine how to vote proxies relating to portfolio securities is available without charge, upon request, from our Client Services department at 800 959 4246 or at invesco.com/proxyguidelines. The information is also available on the SEC website, sec.gov.
| | |
| Information regarding how the Fund voted proxies related to its portfolio securities during the most recent 12-month period ended June 30 is available at invesco.com/proxysearch. The information is also available on the SEC website, sec.gov. | | 
|
| Invesco Advisers, Inc. is an investment adviser; it provides investment advisory services to individual and institutional clients and does not sell securities. Invesco Distributors, Inc. is the US distributor for Invesco Ltd.’s retail mutual funds, exchange-traded funds and institutional money market funds. Both are wholly owned, indirect subsidiaries of Invesco Ltd. | |
SEC file numbers: 811-05426 and 033-19338 GTR-AR-1 Invesco Distributors, Inc.
Letters to Shareholders
| | |

Philip Taylor | | Dear Shareholders: This annual report includes information about your Fund, including performance data and a complete list of its investments as of the close of the reporting period. Inside, your Fund’s portfolio managers discuss how they managed your Fund and the factors that affected its performance during the reporting period. I hope you find this report of interest. During the reporting period covered by this report, the US economy showed signs of continued improvement. After contracting in the first quarter of 2014, the economy expanded strongly in the second quarter and unemployment trended lower. Much of the credit for this improvement goes to the US Federal Reserve (the Fed), which undertook an extraordinary asset purchase program following the global financial crisis. The Fed’s goal was to jumpstart the economy by encouraging banks to lend more, businesses to hire more and consumers to spend more. Signs of a stronger US economy prompted the Fed to reduce, or “taper,” its asset purchase program. Despite this, |
interest rates remained near historical low levels due largely to heavy investor demand for bonds. While signs of economic improvement were evident in the US, European economies showed signs of weakening. That, together with geopolitical uncertainty and worries about the first diagnosed cases of Ebola outside of Africa, caused increased volatility in US and European equities. Extended periods of market strength can lull investors into complacency – just as prolonged periods of market weakness or volatility can discourage investors from initiating long-term investment plans. That’s why Invesco has always encouraged investors to work with a professional financial adviser who can stress the importance of starting to save and invest early and the importance of adhering to a disciplined investment plan – when times are good and when they’re uncertain. A financial adviser who knows your unique financial situation, investment goals and risk tolerance can be an invaluable partner as you seek to achieve your financial goals. He or she can offer a long-term perspective when markets are volatile and time-tested advice and guidance when your financial situation or investment goals change. |
Timely information when and where you want it
Invesco’s efforts to help investors achieve their financial objectives include providing individual investors and financial professionals with timely information about the markets, the economy and investing – whenever and wherever they want it.
Our website, invesco.com/us, offers a wide range of market insights and investment perspectives. On the website, you’ll find detailed information about our funds, including prices, performance, holdings and portfolio manager commentaries. You can access information about your individual Invesco account whenever it’s convenient for you; just complete a simple, secure online registration. Use the “Log In” box on our home page to get started.
Invesco’s mobile app for iPad® (available free from the App StoreSM) allows you to obtain the same detailed information about your Fund and the same investment insights from our investment leaders, market strategists, economists and retirement experts on the go. You also can watch portfolio manager videos and have instant access to Invesco news and updates wherever you may be.
In addition to the resources accessible on our website and through our mobile app, you can obtain timely updates to help you stay informed about the markets, the economy and investing by connecting with Invesco on Twitter, LinkedIn or Facebook. You can access our blog at blog.invesco.us.com. Our goal is to provide you the information you want, when and where you want it.
Have questions?
For questions about your account, feel free to contact an Invesco client services representative at 800 959 4246. For Invesco-related questions or comments, please email me directly at phil@invesco.com.
All of us at Invesco look forward to serving your investment management needs for many years to come. Thank you for investing with us.
Sincerely,

Philip Taylor
Senior Managing Director, Invesco Ltd.
iPad is a trademark of Apple Inc., registered in the US and other countries. App Store is a service mark of Apple Inc. Invesco Distributors, Inc. is not affiliated with Apple Inc.
2 Invesco International Total Return Fund
| | |

Bruce Crockett | | Dear Fellow Shareholders: There are a variety of factors that can impact investment performance, many of which are uncontrollable by us as investors. These factors can include various economic trends and geopolitical developments. While the members of the Invesco Funds Board, which I chair, can’t dictate the performance of the Invesco funds, be assured that your Board works diligently throughout the year to focus on how your investments are managed. Our job is to represent you and your interests on a variety of fund management-related matters. We regularly monitor how the portfolio management teams of the Invesco funds are performing in light of ever-changing and often unpredictable economic and market conditions. We review the investment strategies and investment process employed by each fund’s management team as explained in the fund’s prospectus. |
| | Perhaps our most significant responsibility is conducting the annual review of the funds’ |
advisory and sub-advisory contracts with Invesco Advisers and its affiliates. This annual review, which is required by the Investment Company Act of 1940, focuses on the nature and quality of the services Invesco provides as the adviser to the Invesco funds and the reasonableness of the fees that it charges for those services. Each year, we spend months carefully reviewing information from Invesco that allows us to evaluate the quality of its services and the reasonableness of its fees. We also use information from a variety of independent sources, including materials provided by the independent senior officer of the Invesco funds, who reports directly to the independent trustees on the Board. Additionally, we meet with legal counsel and review performance and fee data prepared for us by Lipper Inc., an independent, third-party firm widely recognized as a leader in its field.
After a careful review, the members of the Invesco Funds Board approved the continuation of advisory and sub-advisory contracts with Invesco Advisers and its affiliates. Be assured that your Board will continue working on behalf of fund shareholders, keeping your needs and interests uppermost in our minds.
As always, please contact me at bruce@brucecrockett.com with any questions or concerns you may have. On behalf of the Board, we look forward to continuing to represent your interests and serving your needs.
Sincerely,

Bruce L. Crockett
Independent Chair
Invesco Funds Board of Trustees
|
| 3 Invesco International Total Return Fund |
Management’s Discussion of Fund Performance
Performance summary
For the fiscal year ended October 31, 2014, Invesco International Total Return Fund, at net asset value (NAV), produced negative absolute returns but outperformed the Barclays Global Aggregate ex-U.S. Index, the Fund’s broad market/style-specific benchmark.
Your Fund’s long-term performance appears later in this report.
Fund vs. Indexes
Total returns, 10/31/13 to 10/31/14, at net asset value (NAV). Performance shown does not include applicable contingent deferred sales charges (CDSC) or front-end sales charges, which would have reduced performance.
| | | | | |
Class A Shares | | | | -0.97 | % |
Class B Shares | | | | -1.63 | |
Class C Shares | | | | -1.63 | |
Class Y Shares | | | | -0.63 | |
Class R5 Shares | | | | -0.63 | |
Class R6 Shares | | | | -0.72 | |
| Barclays Global Aggregate ex-U.S. Index‚ (Broad Market/Style-Specific Index) | | | | -2.53 | |
| Lipper International Income Funds Index¢ (Peer Group Index) | | | | 1.58 | |
| |
| Source(s): ‚FactSet Research Systems Inc.; ¢Lipper Inc. | | | | | |
Market conditions and your Fund
The fiscal year began with uncertainty over future policies of the US Federal Reserve (the Fed), especially its quantitative easing program, which was the primary driver of bond market volatility in the fourth quarter of 2013. In December 2013, the yield on the 10-year US Treasury note crossed the 3% threshold for the first time in more than two years.1
During the first half of 2014, global bond market returns were generally positive, strengthened by a decline in yields due to renewed concerns over US economic growth following unexpectedly disruptive winter weather in the first quarter of 2014. Yields also were pushed lower due to demand driven by rising tensions in Eastern Europe and the Middle East, which prompted investors to seek safety. The yield on the 10-year US Treasury
note fell to 2.5% by the end of June.2 This happened despite the Fed’s tapering of its quantitative easing via bond purchases from $85 billion per month in January to $35 billion a month by the end of June.2
Meanwhile, improved economic data, global central bank stimulus and investors’ demand for yield drove rallies in credit-related markets, such as emerging market debt and high yield corporate bonds. While a favorable supply/demand dynamic and solid credit fundamentals throughout most of the year created an environment in which investors were willing to assume somewhat greater risk, credit markets experienced notable volatility near the end of the reporting period. As the reporting period drew to a close, investors once again favored credit risk assets despite slower economic activity and escalating geopolitical concerns.
In this environment, the Fund’s total return was negative, but it outperformed its broad market/style-specific benchmark, the Barclays Global Aggregate ex-U.S. Index. The Fund’s return versus the benchmark benefited from a variety of active top-down and bottom-up investment decisions. Our yield curve and duration positioning, currency pairings, country allocations, sector rotation and security selection decisions contributed to the Fund’s relative performance over the reporting period.
Country allocations proved broadly favorable for relative performance, driven mostly by our underweight exposure to Japan and the UK, but returns were tempered by overweight exposure to Germany and Poland, both of which underperformed, and underweight exposure to Italy and France, which performed better than the benchmark. A sustained overweight position in corporate bonds versus government bonds was helpful for relative returns during the reporting period. We maintained tactical allocations to off-benchmark high yield corporate bonds and emerging market debt during the reporting period, and these were advantageous as they outperformed our global investment-grade bond benchmark for the year – although volatility late in the reporting period dampened their overall beneficial effect.
Among corporate bonds, our overweight risk positions in the financials, utilities and basic industry subsectors were some of the most beneficial subsector allocations, but gains were mitigated by less favorable returns from US residential and commercial mortgage-backed securities, as well as a drag on relative return created by a slight overweight exposure to cash versus our broad
| | | | |
| Portfolio Composition | | | |
| By sector | |
| |
| Sovereign Debt | | | 58.8 | % |
| Financials | | | 19.1 | |
| Collateralized Mortgage Obligations | | | 4.0 | |
| Utilities | | | 3.2 | |
| Consumer Staples | | | 2.2 | |
| Materials | | | 2.2 | |
| Telecommunication Services | | | 1.7 | |
Other Sectors, Each Less
than 2% | | | 3.4 | |
Money Market Funds
Plus Other Assets Less Liabilities | | | 5.4 | |
| | | | | | |
| Top Five Fixed Income Issuers* | |
| | |
1. | | Bundesrepublik Deutschland | | | 14.1 | % |
2. | | Poland Government International Bond | | | 6.2 | |
3. | | Netherlands Government Bond | | | 4.8 | |
4. | | New Zealand Government Bond | | | 4.8 | |
5. | | Italy Buoni Poliennali Del Tesoro | | | 4.7 | |
| | | | | |
Total Net Assets | | | | $58.7 million | |
| |
Total Number of Holdings* | | | | 75 | |
The Fund ’s holdings are subject to change, and there is no assurance that the Fund will continue to hold any particular security.
* Excluding money market fund holdings.
|
| 4 Invesco International Total Return Fund |
market/style-specific benchmark. Our security selection versus the benchmark was a contributor to our relative outperformance. Favorable security selection decisions were an important driver of overall outperformance against our benchmark, and prevalent across the portfolio, especially among the sterling, euro and US dollar spread asset classes.
Our currency positioning within the Fund was broadly favorable and contributed meaningfully to relative performance as we took advantage of changing foreign exchange relationships during the reporting period. Our US dollar exposure and underweight holdings in currencies such as the euro, Canadian dollar, Japanese yen, Swiss franc, Singapore dollar and UK pound were especially helpful. Underweight exposure to the Swedish krona, New Zealand dollar and South Korean won, and overweight exposure to the Mexican peso and Norwegian krona offset some of those gains, but not in a material way. Part of our strategy to manage currency risk resulting from the purchase of cash bonds in foreign currencies entailed hedging that risk via currency forwards. The currency hedging activity was carried out on an as-needed basis and was effective in managing unwanted currency risk.
The Fund uses active duration and yield curve positioning for risk management and for generating alpha versus our broad market/style-specific index. Duration measures a portfolio’s price sensitivity to interest rate changes. Yield curve positioning refers to actively emphasizing points (maturities) along the yield curve with favorable risk/return expectations. The contribution to Fund performance from duration and yield curve positioning across the various global yield curves was an important contributor to relative returns over the reporting period. Strong relative performance from tactical positioning in intermediate and longer term European, Australian and Mexican interest rates overcame the relative performance deficit from overweight exposure to rising intermediate interest rates in the US and underweight exposure to falling long-term rates in Japan. Duration was managed with cash bonds and futures positions. Buying and selling interest rate futures contracts across multiple global yield curves was an important tool we used to manage interest rate risk and maintain our targeted portfolio duration.
Please note that our strategy is implemented using derivative instruments, including futures, forwards, swaps and options. Therefore, a portion of the performance of the strategy, both positive and negative, can be attributed to these instruments. Derivatives can be a cost-effective way to gain or hedge exposure to certain risks. However, derivatives may amplify traditional investment risks through the creation of leverage and may be less liquid than traditional securities.
Thank you for your commitment to Invesco International Total Return Fund.
| 2 | Source: US Federal Reserve |
The views and opinions expressed in management’s discussion of Fund performance are those of Invesco Advisers, Inc. These views and opinions are subject to change at any time based on factors such as market and economic conditions. These views and opinions may not be relied upon as investment advice or recommendations, or as an offer for a particular security. The information is not a complete analysis of every aspect of any market, country, industry, security or the Fund. Statements of fact are from sources considered reliable, but Invesco Advisers, Inc. makes no representation or warranty as to their completeness or accuracy. Although historical performance is no guarantee of future results, these insights may help you understand our investment management philosophy.
See important Fund and, if applicable, index disclosures later in this report.
| | |
 | | Avi Hooper Chartered Financial Analyst, Portfolio Manager, is lead manager of Invesco International Total |
| Return Fund. He joined Invesco in 2010. Mr. Hooper earned a BAS with a focus in accounting and finance from York University. |
| | |
 | | Mark Nash Chartered Financial Analyst, Portfolio Manager, is manager of Invesco International Total |
| Return Fund. He joined Invesco in 2001. Mr. Nash earned a BS in chemistry and an MPhi in materials engineering from The University of Nottingham. |
| | |
 | | Raymond Uy Chartered Financial Analyst, Portfolio Manager and Head of Currencies for Invesco Fixed Income, is |
| manager of Invesco International Total Return Fund. He joined Invesco in 2012. Mr. Uy earned a BBA from Hofstra University. |
| | |
 | | Robert Waldner Chartered Financial Analyst, Portfolio Manager, is manager of Invesco International Total |
| Return Fund. He joined Invesco in 2013. Mr. Waldner earned a BSE degree in civil engineering from Princeton University. |
|
| 5 Invesco International Total Return Fund |
Your Fund’s Long-Term Performance
Results of a $10,000 Investment – Oldest Share Class(es) since Inception
Fund and index data from 3/31/06
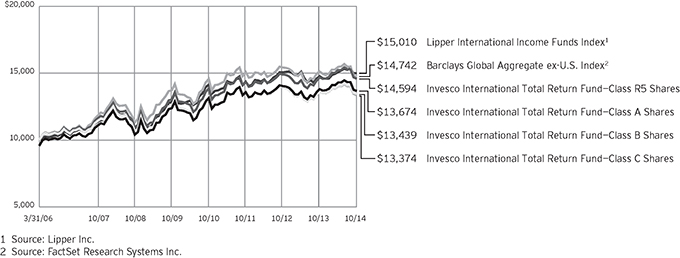
Past performance cannot guarantee comparable future results.
The data shown in the chart include reinvested distributions, applicable sales charges and Fund expenses including management fees. Results for Class B shares are calculated as if a hypothetical
shareholder had liquidated his entire investment in the Fund at the close of the reporting period and paid the contingent deferred sales charges, if applicable. Index results include reinvested dividends, but they do not reflect sales charges. Performance of the peer group,
if applicable, reflects fund expenses and management fees; performance of a market index does not. Performance shown in the chart and table(s) does not reflect deduction of taxes a shareholder would pay on Fund distributions or sale of Fund shares.
continued from page 8
produce the desired results.
| n | | Market risk. The prices of and the income generated by the Fund’s securities may decline in response to, among other things, investor sentiment, general economic and market conditions, regional or global instability, and currency and interest rate fluctuations. |
| n | | Mortgage- and asset-backed securities risk. The Fund may invest in mortgage- and asset-backed securities that are subject to prepayment or call risk, which is the risk that the borrower’s payments may be received earlier or later than expected due to changes in prepayment rates on underlying loans. Faster prepayments often happen when interest rates are falling. As a result, the Fund may reinvest these early payments at lower interest rates, thereby reducing the Fund’s income. Conversely, when interest rates rise, prepayments may happen more slowly, causing the security to lengthen in duration. Longer duration securities tend to be more volatile. Securities may be prepaid at a price less than the original purchase value. An unexpectedly high rate of defaults on the mortgages held by a mortgage pool may adversely affect the value of |
| | mortgage-backed securities and could result in losses to the Fund. The risk of such defaults is generally higher in the case of mortgage pools that include subprime mortgages. Subprime mortgages refer to loans made to borrowers with weakened credit histories or with lower capacity to make timely payments on their mortgages. |
| n | | Sovereign debt risk. Investments in foreign sovereign debt obligations involve certain risks in addition to those relating to foreign securities or debt securities generally. The issuer of the debt or the governmental authorities that control the repayment of the debt may be unable or unwilling to repay principal or interest when due in accordance with the terms of such debt, and the Fund may have limited recourse in the event of a default against the defaulting government. Without the approval of debt holders, some governmental debtors have in the past been able to reschedule or restructure their debt payments or declare moratoria on payments. |
| n | | When-issued and delayed delivery risk. When-issued and delayed delivery transactions are subject to market risk as the value or yield of a security at delivery |
| | | may be more or less than the purchase price or the yield generally available on securities when delivery occurs. In addition, the Fund is subject to counterparty risk because it relies on the buyer or seller, as the case may be, to consummate the transaction, and failure by the other party to complete the transaction may result in the Fund missing the opportunity of obtaining a price or yield considered to be advantageous. |
| n | | Zero coupon or pay-in-kind securities risk. The value, interest rates, and liquidity of non-cash paying instruments, such as zero coupon and pay-in-kind securities, are subject to greater fluctuation than other types of securities. The higher yields and interest rates on pay-in-kind securities reflect the payment deferral and increased credit risk associated with such instruments and that such investments may represent a higher credit risk than coupon loans. Pay-in-kind securities may have a potential variability in valuations because their continuing accruals require continuing judgments about the collectability of the deferred payments and the value of any associated collateral. |
continued on page 7
|
| 6 Invesco International Total Return Fund |
| | | | | |
Average Annual Total Returns As of 10/31/14, including maximum applicable
sales charges |
| |
| Class A Shares | | | | | |
| Inception (3/31/06) | | | | 3.71 | % |
| 5 Years | | | | 1.12 | |
| 1 Year | | | | -5.17 | |
| |
| Class B Shares | | | | | |
| Inception (3/31/06) | | | | 3.50 | % |
| 5 Years | | | | 0.92 | |
| 1 Year | | | | -6.44 | |
| |
| Class C Shares | | | | | |
| Inception (3/31/06) | | | | 3.44 | % |
| 5 Years | | | | 1.24 | |
| 1 Year | | | | -2.60 | |
| |
| Class Y Shares | | | | | |
| Inception | | | | 4.42 | % |
| 5 Years | | | | 2.27 | |
| 1 Year | | | | -0.63 | |
| |
| Class R5 Shares | | | | | |
| Inception (3/31/06) | | | | 4.50 | % |
| 5 Years | | | | 2.29 | |
| 1 Year | | | | -0.63 | |
| |
| Class R6 Shares | | | | | |
| Inception | | | | 4.29 | % |
| 5 Years | | | | 2.11 | |
| 1 Year | | | | -0.72 | |
Class Y shares incepted on October 3, 2008. Performance shown prior to that date is that of Class A shares and includes the 12b-1 fees applicable to Class A shares. Class A share performance reflects any applicable fee waivers or expense reimbursements.
Class R6 shares incepted on September 24, 2012. Performance shown prior to that date is that of Class A shares and includes the 12b-1 fees applicable to Class A shares. Class A share performance reflects any applicable fee waivers or expense reimbursements.
| | | | | |
| Average Annual Total Returns As of 9/30/14, the most recent calendar quarter
end, including maximum applicable sales charges |
| |
| Class A Shares | | | | | |
| Inception (3/31/06) | | | | 3.83 | % |
| 5 Years | | | | 1.36 | |
| 1 Year | | | | -2.95 | |
| |
| Class B Shares | | | | | |
| Inception (3/31/06) | | | | 3.62 | % |
| 5 Years | | | | 1.16 | |
| 1 Year | | | | -4.26 | |
| |
| Class C Shares | | | | | |
| Inception (3/31/06) | | | | 3.57 | % |
| 5 Years | | | | 1.48 | |
| 1 Year | | | | -0.33 | |
| |
| Class Y Shares | | | | | |
| Inception | | | | 4.54 | % |
| 5 Years | | | | 2.51 | |
| 1 Year | | | | 1.68 | |
| |
| Class R5 Shares | | | | | |
| Inception (3/31/06) | | | | 4.63 | % |
| 5 Years | | | | 2.53 | |
| 1 Year | | | | 1.68 | |
| |
| Class R6 Shares | | | | | |
| Inception | | | | 4.42 | % |
| 5 Years | | | | 2.35 | |
| 1 Year | | | | 1.58 | |
The performance data quoted represent past performance and cannot guarantee comparable future results; current performance may be lower or higher. Please visit invesco.com/performance for the most recent month-end performance. Performance figures reflect reinvested distributions, changes in net asset value and the effect of the maximum sales charge unless otherwise stated. Investment return and principal value will fluctuate so that you may have a gain or loss when you sell shares.
The net annual Fund operating
expense ratio set forth in the most recent Fund prospectus as of the date of this report for Class A, Class B, Class C, Class Y, Class R5 and Class R6 shares was 1.10%, 1.85%, 1.85%, 0.85%, 0.85% and 0.85%, respectively.1 The total annual Fund operating expense ratio set forth in the most recent Fund prospectus as of the date of this report for Class A, Class B, Class C, Class Y, Class R5 and Class R6 shares was 1.68%, 2.43%, 2.43%, 1.43%, 1.16% and 1.16%, respectively. The expense ratios presented above may vary from the expense ratios presented in other sections of this report that are based on expenses incurred during the period covered by this report.
Class A share performance reflects the maximum 4.25% sales charge, and Class B and Class C share performance reflects the applicable contingent deferred sales charge (CDSC) for the period involved. The CDSC on Class B shares declines from 5% beginning at the time of purchase to 0% at the beginning of the seventh year. The CDSC on Class C shares is 1% for the first year after purchase. Class Y, Class R5 and Class R6 shares do not have a front-end sales charge or a CDSC; therefore, performance is at net asset value.
The performance of the Fund’s share classes will differ primarily due to different sales charge structures and class expenses.
Had the adviser not waived fees and/ or reimbursed expenses, performance would have been lower.
| 1 | Total annual Fund operating expenses after any contractual fee waivers and/or expense reimbursements by the adviser in effect through at least February 29, 2016. See current prospectus for more information. |
continued from page 6
About indexes used in this report
| n | | The Barclays Global Aggregate ex-U.S. Index is an unmanaged index considered representative of bonds of foreign countries. |
| n | | The Lipper International Income Funds Index is an unmanaged index considered representative of international income funds tracked by Lipper. |
| n | | The Fund is not managed to track the performance of any particular index, including the index(es) described here, and consequently, the performance of the Fund may deviate significantly from |
| | | the performance of the index(es). |
| n | | A direct investment cannot be made in an index. Unless otherwise indicated, index results include reinvested dividends, and they do not reflect sales charges. Performance of the peer group, if applicable, reflects fund expenses; performance of a market index does not. |
Other information
| n | | The returns shown in management’s discussion of Fund performance are based on net asset values (NAVs) calculated for shareholder transactions. Generally accepted accounting principles |
| | | require adjustments to be made to the net assets of the Fund at period end for financial reporting purposes, and as such, the NAVs for shareholder transactions and the returns based on those NAVs may differ from the NAVs and returns reported in the Financial Highlights. |
| n | | Industry classifications used in this report are generally according to the Global Industry Classification Standard, which was developed by and is the exclusive property and a service mark of MSCI Inc. and Standard & Poor’s. |
|
| 7 Invesco International Total Return Fund |
Invesco International Total Return Fund’s investment objective is total return, comprised of current income and capital appreciation.
| n | | Unless otherwise stated, information presented in this report is as of October 31, 2014, and is based on total net assets. |
| n | | Unless otherwise noted, all data provided by Invesco. |
| n | | To access your Fund’s reports/prospectus, visit invesco.com/fundreports. |
About share classes
| n | | Class B shares may not be purchased for new or additional investments. Please see the prospectus for more information. |
| n | | Class Y shares are available to only certain investors. Please see the prospectus for more information. |
| n | | Class R5 shares and Class R6 shares are primarily intended for employer sponsored retirement and benefit plans that meet certain standards and for institutional investors. Please see the prospectus for more information. |
Principal risks of investing in the Fund
| n | | Active trading risk. The Fund engages in frequent trading of portfolio securities. Active trading results in added expenses and may result in a lower return and increased tax liability. |
| n | | Call risk. If interest rates fall, it is possible that issuers of debt securities with high interest rates will prepay or call their securities before their maturity dates. In this event, the proceeds from the called securities would likely be reinvested by the Fund in securities bearing the new, lower interest rates, resulting in a possible decline in the Fund’s income and distributions to shareholders. |
| n | | Collateralized loan obligations risk. In addition to the normal interest rate, default and other risk of fixed income securities, collateralized loan obligations carry additional risks, including the possibility that distributions from collateral securities will not be adequate to make interest or other payments, the quality of the collateral may decline in value or default, the Fund may invest in collateralized loan obligations that are subordinate to other classes, values may be volatile, and disputes with the issuer may produce unexpected investment results. |
| n | | Credit risk. The issuer of instruments in which the Fund invests may be unable to meet interest and/or principal payments, thereby causing its instruments to decrease in value and lowering the issuer’s credit rating. |
| n | | Currency/exchange rate risk. The dollar value of the Fund’s foreign investments will be affected by changes in the exchange rates between the dollar and the currencies in which those investments are traded. |
| n | | Derivatives risk. The value of a derivative instrument depends largely on (and is derived from) the value of an underlying security, currency, commodity, interest rate, index or other asset (each referred to as an underlying asset). In addition to risks relating to the underlying assets, the use of derivatives may include other, possibly greater, risks, including counterparty, leverage and liquidity risks. Counterparty risk is the risk that the counterparty to the derivative contract will default on its obligation to pay the Fund the amount owed or otherwise perform under the derivative contract. Derivatives create leverage risk because they do not require payment up front equal to the economic exposure created by owning the derivative. As a result, an adverse change in the value of the underlying asset could result in the Fund sustaining a loss that is substantially greater than the amount invested in the derivative, which may make the Fund’s returns more volatile and increase the risk of loss. Derivative instruments may also be less liquid than more traditional investments and the Fund may be unable to sell or close out its derivative positions at a desirable time or price. This risk may be more acute under adverse market conditions, during which the Fund may be most in need of liquidating its derivative positions. Derivatives may also be harder to value, less tax efficient and subject to changing government regulation that could impact the Fund’s ability to use certain derivatives or their cost. Also, derivatives used for hedging or to gain or limit exposure to a particular market segment may not provide the expected benefits, particularly during adverse market conditions. |
| n | | Developing/emerging markets securities risk. The prices of securities issued by |
| | | foreign companies and governments located in developing/emerging market countries may be affected more negatively by inflation, devaluation of their currencies, higher transaction costs, delays in settlement, adverse political developments, the introduction of capital controls, withholding taxes, nationalization of private assets, expropriation, social unrest, war or lack of timely information than those in developed countries. |
| n | | Foreign currency tax risk. If the US Treasury Department were to exercise its authority to issue regulations that exclude from the definition of “qualifying income” foreign currency gains not directly related to the Fund’s business of investing in securities, the Fund may be unable to qualify as a regulated investment company for one or more years. In this event, the Fund’s Board of Trustees may authorize a significant change in investment strategy or Fund liquidation. |
| n | | Foreign securities risk. The Fund’s foreign investments may be affected by changes in a foreign country’s exchange rates, political and social instability, changes in economic or taxation policies, difficulties when enforcing obligations, decreased liquidity, and increased volatility. Foreign companies may be subject to less regulation resulting in less publicly available information about the companies. |
| n | | High yield bond (junk bond) risk. Junk bonds involve a greater risk of default or price changes due to changes in the credit quality of the issuer. The values of junk bonds fluctuate more than those of high- quality bonds in response to company, political, regulatory or economic developments. Values of junk bonds can decline significantly over short periods of time. |
| n | | Interest rate risk. Interest rate risk refers to the risk that bond prices generally fall as interest rates rise; conversely, bond prices generally rise as interest rates fall. Specific bonds differ in their sensitivity to changes in interest rates depending on their individual characteristics, including duration. |
| n | | Liquidity risk. The Fund may hold illiquid securities that it is unable to sell at the preferred time or price and could lose its entire investment in such securities. |
| n | | Management risk. The investment techniques and risk analysis used by the Fund’s portfolio managers may not |
continued on page 6
|
This report must be accompanied or preceded by a currently effective Fund prospectus, which contains more complete information, including sales charges and expenses. Investors should read it carefully before investing. |
|
|
| NOT FDIC INSURED | MAY LOSE VALUE | NO BANK GUARANTEE |
|
| 8 Invesco International Total Return Fund |
Schedule of Investments
October 31, 2014
| | | | | | | | |
| | | Principal
Amount | | | Value | |
Non U.S. Dollar Denominated Bonds & Notes–83.63%(a) | |
| Australia–1.98% | | | | | | | | |
Australia Government Bond, Series 140, Sr. Unsec. Bonds, 4.50%, 04/21/33 | | AUD | 1,200,000 | | | $ | 1,163,626 | |
| | |
| Austria–0.96% | | | | | | | | |
OMV AG, Jr. Unsec. Sub. Medium-Term Euro Notes, 6.75%(b) | | EUR | 400,000 | | | | 563,489 | |
| | |
| Belgium–0.57% | | | | | | | | |
Anheuser-Busch InBev N.V., Sr. Unsec. Gtd. Medium-Term Euro Notes, 4.00%, 09/24/25 | | GBP | 200,000 | | | | 333,030 | |
| | |
| Brazil–1.09% | | | | | | | | |
Votorantim Cimentos S.A., Sr. Unsec. Bonds, 3.25%,04/25/21(c) | | EUR | 500,000 | | | | 641,976 | |
| | |
| Canada–4.00% | | | | | | | | |
Province of Ontario Canada, Unsec. Bonds, 3.45%, 06/02/45 | | CAD | 2,700,000 | | | | 2,350,107 | |
| | |
| Czech Republic–0.28% | | | | | | | | |
CET 21 spol sro, REGS, Sr. Sec. Gtd. Euro Notes, 9.00%, 11/01/17(c) | | EUR | 125,000 | | | | 163,295 | |
| | |
| Denmark–1.09% | | | | | | | | |
Danske Bank AS, Jr. Unsec. Sub. Medium-Term Euro Notes, 5.68%(b) | | GBP | 170,000 | | | | 280,261 | |
TDC AS, Sr. Unsec. Medium-Term Euro Notes, 3.75%, 03/02/22 | | EUR | 250,000 | | | | 360,008 | |
| | | | | 640,269 | |
| | |
| France–2.99% | | | | | | | | |
Banque Federative du Credit Mutuel S.A., Sr. Unsec. Medium-Term Euro Notes, 2.63%, 02/24/21 | | EUR | 200,000 | | | | 275,262 | |
Caisse Francaise de Financement Local, Sr. Sec. Medium-Term Euro Notes, 1.80%, 05/09/17 | | JPY | 130,000,000 | | | | 1,209,384 | |
Electricite de France S.A., Jr. Unsec. Sub. Medium-Term Euro Notes, 4.13%(b) | | EUR | 200,000 | | | | 268,320 | |
| | | | | 1,752,966 | |
|
| Germany–17.88% | |
Bundesrepublik Deutschland, Unsec. Euro Bonds, | | | | | | | | |
1.00%, 08/15/24 | | EUR | 5,000,000 | | | | 6,356,795 | |
2.50%, 08/15/46 | | EUR | 1,300,000 | | | | 1,922,223 | |
EnBW Energie Baden-Wuerttemberg AG, Jr. Unsec. Sub. Medium-Term Euro Notes, 7.38%, 04/02/72 | | EUR | 120,000 | | | | 168,417 | |
| | | | | | | | |
| | | Principal
Amount | | | Value | |
| Germany–(continued) | |
HeidelbergCement Finance Luxembourg S.A., Sr. Unsec. Gtd. Medium-Term Euro Notes, 3.25%, 10/21/21 | | EUR | 100,000 | | | $ | 132,202 | |
Kreditanstalt fur Wiederaufbau, Sr. Unsec. Gtd. Global Notes, 2.05%, 02/16/26 | | JPY | 150,000,000 | | | | 1,571,533 | |
RWE AG, Jr. Unsec. Sub. Euro Notes, 7.00%(b) | | GBP | 200,000 | | | | 345,742 | |
| | | | | 10,496,912 | |
| | |
| Italy–4.91% | | | | | | | | |
Italy Buoni Poliennali Del Tesoro, Sr. Unsec. Euro Bonds, 5.00%, 03/01/25(c) | | EUR | 1,800,000 | | | | 2,772,324 | |
Manutencoop Facility Management SpA, REGS, Sr. Sec. Gtd. Euro Notes, 8.50%, 08/01/20(c) | | EUR | 100,000 | | | | 110,273 | |
| | | | | 2,882,597 | |
| | |
| Japan–3.49% | | | | | | | | |
Japan Government Twenty Year Bond, Series 122, Sr. Unsec. Bonds, 1.80%, 09/20/30 | | JPY | 205,000,000 | | | | 2,048,783 | |
| | |
| Luxembourg–0.21% | | | | | | | | |
Magnolia BC S.A., REGS, Sr. Sec. Gtd. Medium-Term Euro Notes, 9.00%, 08/01/20(c) | | EUR | 100,000 | | | | 120,924 | |
| | |
| Mexico–2.23% | | | | | | | | |
Mexican Bonos, Series M, Sr. Unsec. Bonds, 7.75%, 05/29/31 | | MXN | 15,800,000 | | | | 1,310,452 | |
| | |
| Netherlands–6.28% | | | | | | | | |
Cooperatieve Centrale Raiffeisen-Boerenleenbank BA, Unsec. Sub. Euro Bonds, 3.88%, 07/25/23 | | EUR | 600,000 | | | | 847,976 | |
Netherlands Government Bond, Unsec. Euro Bonds, 5.50%, 01/15/28 | | EUR | 1,500,000 | | | | 2,839,234 | |
| | | | | 3,687,210 | |
|
| New Zealand–4.76% | |
New Zealand Government Bond, Series 521, Sr. Unsec. Bonds, 6.00%, 05/15/21 | | NZD | 3,200,000 | | | | 2,794,182 | |
| | |
| Norway–3.14% | | | | | | | | |
DNB Bank ASA, Unsec. Sub. Medium-Term Euro Notes, 4.75%, 03/08/22 | | EUR | 250,000 | | | | 337,874 | |
Norway Government Bond, Series 476, Unsec. Bonds, 3.00%, 03/14/24 | | NOK | 9,400,000 | | | | 1,508,219 | |
| | | | | 1,846,093 | |
See accompanying Notes to Financial Statements which are an integral part of the financial statements.
9 Invesco International Total Return Fund
| | | | | | | | |
| | | Principal
Amount | | | Value | |
| Poland–6.60% | | | | | | | | |
Poland Government Bond, Series 0718, Unsec. Bonds, 2.50%, 07/25/18 | | PLN | 800,000 | | | $ | 242,595 | |
Poland Government International Bond, Series 12, Sr. Unsec. Bonds, 1.05%, 11/08/17 | | JPY | 400,000,000 | | | | 3,634,049 | |
| | | | | 3,876,644 | |
| | |
| South Korea–3.40% | | | | | | | | |
Korea Treasury Bond, Series 2403, Sr. Unsec. Bonds, 3.50%, 03/10/24 | | KRW | 1,200,000,000 | | | | 1,205,154 | |
Republic of Korea, Sr. Unsec. Euro Notes, 2.13%, 06/10/24 | | EUR | 600,000 | | | | 792,416 | |
| | | | | 1,997,570 | |
| | |
| Spain–2.72% | | | | | | | | |
Spain Government Bond, Sr. Unsec. Euro Bonds, 5.15%, 10/31/28(c) | | EUR | 1,000,000 | | | | 1,598,492 | |
| | |
| Supranational–2.38% | | | | | | | | |
Asian Development Bank, Series 339-00-1, Sr. Unsec. Medium-Term Global Notes, 2.35%, 06/21/27 | | JPY | 130,000,000 | | | | 1,394,789 | |
| | |
| Sweden–0.23% | | | | | | | | |
Nordea Bank AB, Unsec. Sub. Medium-Term Euro Notes, 4.63%, 02/15/22 | | EUR | 100,000 | | | | 134,791 | |
| |
| United Arab Emirates–0.54% | | | | | |
IPIC GMTN Ltd., REGS, Sr. Unsec. Gtd. Medium-Term Euro Notes, 5.88%, 03/14/21(c) | | EUR | 200,000 | | | | 319,272 | |
| | |
| United Kingdom–10.31% | | | | | | | | |
Abbey National Treasury Services PLC, Sr. Sec. Gtd. Mortgage-Backed Medium-Term Euro Notes, 5.25%, 02/16/29 | | GBP | 200,000 | | | | 398,002 | |
Bakkavor Finance 2 PLC, REGS, Sr. Sec. Gtd. Euro Notes, 8.25%, 02/15/18(c) | | GBP | 105,000 | | | | 171,339 | |
Cabot Financial Luxembourg S.A., REGS, Sr. Sec. Gtd. Euro Notes, 10.38%, 10/01/19(c) | | GBP | 100,000 | | | | 175,511 | |
Direct Line Insurance Group PLC, Unsec. Sub. Gtd. Euro Notes, 9.25%, 04/27/42 | | GBP | 150,000 | | | | 302,991 | |
Lloyds Bank PLC, Unsec. Sub. Medium-Term Euro Notes, 10.75%, 12/16/21 | | GBP | 200,000 | | | | 370,565 | |
Lowell Group Financing PLC, REGS, Sr. Sec. Gtd. Euro Notes, 10.75%, 04/01/19(c) | | GBP | 100,000 | | | | 174,378 | |
Moy Park Bondco PLC, REGS, Sr. Unsec. Gtd. Euro Notes, 6.25%, 05/29/21(c) | | GBP | 100,000 | | | | 159,180 | |
| | | | | | | | |
| | | Principal
Amount | | | Value | |
| United Kingdom–(continued) | |
Nationwide Building Society, Jr. Unsec. Sub. Euro Bonds, 6.00%(b) | | GBP | 200,000 | | | $ | 332,733 | |
New Look Bondco I PLC, REGS, Sr. Sec. Gtd. Euro Notes, 8.75%, 05/14/18(c) | | GBP | 100,000 | | | | 167,379 | |
NGG Finance PLC, Unsec. Sub. Gtd. Euro Notes, 5.63%, 06/18/73 | | GBP | 250,000 | | | | 421,767 | |
Odeon & UCI Finco PLC, REGS, Sr. Sec. Gtd. Medium-Term Euro Notes,
9.00%, 08/01/18(c) | | GBP | 100,000 | | | | 144,782 | |
Scottish Widows PLC, Unsec. Sub. Euro Notes, 5.50%, 06/16/23 | | GBP | 150,000 | | | | 251,729 | |
SSE PLC, Unsec. Sub. Medium-Term Euro Notes, 5.45%(b) | | GBP | 400,000 | | | | 653,518 | |
Thomas Cook Finance PLC, REGS, Sr. Unsec. Gtd. Medium-Term Euro Notes,
7.75%, 06/15/20(c) | | EUR | 120,000 | | | | 155,001 | |
Travelex Financing PLC, REGS, Sr. Sec. Gtd. Euro Notes, 8.00%, 08/01/18(c) | | GBP | 100,000 | | | | 167,979 | |
United Kingdom Gilt, Unsec. Bonds, 3.50%, 07/22/68 | | GBP | 1,100,000 | | | | 2,007,846 | |
| | | | | 6,054,700 | |
| | |
| United States–1.59% | | | | | | | | |
Bank of America Corp., Series 8, Sr. Unsec. Bonds, 2.31%, 06/26/17 | | JPY | 100,000,000 | | | | 936,276 | |
Total Non U.S. Dollar Denominated Bonds & Notes (Cost $50,815,729) | | | | 49,108,445 | |
|
U.S. Dollar Denominated Bonds & Notes–5.84% | |
| Brazil–1.68% | | | | | | | | |
Marfrig Holding Europe B.V., Sr. Unsec. Gtd. Notes,
6.88%, 06/24/19(c) | | $ | 200,000 | | | | 201,750 | |
Minerva Luxembourg S.A., Sr. Unsec. Gtd. Notes, 7.75%, 01/31/23(c) | | | 250,000 | | | | 262,875 | |
Rio Oil Finance Trust, Series 2014-1, Sr. Sec. Notes,
6.25%, 07/06/24(c) | | | 500,000 | | | | 522,875 | |
| | | | | 987,500 | |
| | |
| Canada–0.36% | | | | | | | | |
HudBay Minerals, Inc., Sr. Unsec. Gtd. Notes, 9.50%, 10/01/20(c) | | | 200,000 | | | | 211,000 | |
| | |
| Russia–0.79% | | | | | | | | |
VimpelCom Holdings B.V., REGS, Sr. Unsec. Gtd. Euro Notes, 5.95%, 02/13/23(c) | | | 500,000 | | | | 463,165 | |
| | |
| Switzerland–0.83% | | | | | | | | |
Credit Suisse Group AG, Jr. Unsec. Sub. Notes,
6.25%(b)(c) | | | 500,000 | | | | 488,750 | |
See accompanying Notes to Financial Statements which are an integral part of the financial statements.
10 Invesco International Total Return Fund
| | | | | | | | |
| | | Principal
Amount | | | Value | |
| United Kingdom–0.43% | | | | | | | | |
HSBC Holdings PLC, Jr. Unsec. Sub. Global Bonds, 5.63%(b) | | $ | 250,000 | | | $ | 254,340 | |
| | |
| United States–1.75% | | | | | | | | |
Berry Plastics Corp., Sec. Gtd. Notes, 5.50%, 05/15/22 | | | 200,000 | | | | 202,000 | |
Citigroup Inc., Jr. Unsec. Sub. Global Notes, 5.80%(b) | | | 300,000 | | | | 301,500 | |
EarthLink Holdings Corp., Sr. Unsec. Gtd. Global Notes, 8.88%, 05/15/19 | | | 200,000 | | | | 196,250 | |
Sprint Capital Corp., Sr. Unsec. Gtd. Global Notes, 6.88%, 11/15/28 | | | 200,000 | | | | 195,500 | |
Sysco Corp., Sr. Unsec. Gtd. Notes, 4.35%, 10/02/34 | | | 125,000 | | | | 128,367 | |
| | | | | 1,023,617 | |
Total U.S. Dollar Denominated Bonds & Notes
(Cost $3,424,796) | | | | 3,428,372 | |
|
Collateralized Mortgage Obligations–4.03% | |
| United States–4.03% | | | | | | | | |
BLCP Hotel Trust, Series 2014-CLRN, Class C, Floating Rate Pass Through Ctfs., 2.10%, 08/15/29(c)(d) | | | 450,000 | | | | 451,605 | |
COMM Mortgage Trust, Series 2013-LC6, Class B, Pass Through Ctfs., 3.74%, 01/10/46 | | | 300,000 | | | | 302,151 | |
GMACM Mortgage Loan Trust, Series 2006-AR1, Class 1A1, Floating Rate Pass Through Ctfs., 2.96%, 04/19/36(d) | | | 297,848 | | | | 264,403 | |
JP Morgan Mortgage Trust, Series 2007-A4, Class 3A1, Floating Rate Pass Through Ctfs., 5.58%, 06/25/37(d) | | | 303,190 | | | | 278,286 | |
WaMu Mortgage Trust, Series 2005-AR12, Class 1A8, Floating Rate Pass Through Ctfs., 2.33%, 10/25/35(d) | | | 305,070 | | | | 297,072 | |
| | | | | | | | |
| | | Principal
Amount | | | Value | |
| United States–(continued) | |
Wells Fargo Mortgage Backed Securities Trust, Series 2005-AR14, Class A1, Floating Rate Pass Through Ctfs., 5.35%, 08/25/35(d) | | $ | 218,557 | | | $ | 221,404 | |
WFRBS Commercial Mortgage Trust, Series 2013-C16, Class A5, Pass Through Ctfs., 4.42%, 09/15/46 | | | 500,000 | | | | 549,405 | |
Total Collateralized Mortgage Obligations
(Cost $2,325,229) | | | | 2,364,326 | |
| |
Non-Agency Obligations–0.99% | | | | | |
Freddie Mac,
Series 2014-DN1, Class M2, STACR® Debt Notes, 2.35%, 02/25/24(c)(d)(e) | | | 318,000 | | | | 314,823 | |
Series 2014-HQ2, Class M2, STACR® Debt Notes, 2.35%, 09/25/24(c)(d)(e) | | | 275,000 | | | | 267,987 | |
Total Non-Agency Obligations
(Cost $594,863) | | | | 582,810 | |
| | |
| | | Shares | | | | |
Money Market Funds–0.72% | | | | | |
Liquid Assets Portfolio–Institutional Class(f) | | | 210,542 | | | | 210,542 | |
Premier Portfolio–Institutional Class(f) | | | 210,543 | | | | 210,543 | |
Total Money Market Funds
(Cost $421,085) | | | | 421,085 | |
|
Options Purchased–0.07% | |
(Cost $33,108)(g) | | | | 44,085 | |
TOTAL INVESTMENTS–95.28%
(Cost $57,614,810) | | | | | | | 55,949,123 | |
OTHER ASSETS LESS LIABILITIES–4.72% | | | | 2,770,887 | |
NET ASSETS–100.00% | | | $ | 58,720,010 | |
Investment Abbreviations:
| | |
| AUD | | – Australian Dollar |
| CAD | | – Canadian Dollar |
| Ctfs. | | – Certificates |
| EUR | | – Euro |
| GBP | | – British Pound Sterling |
| Gtd. | | – Guaranteed |
| JPY | | – Japanese Yen |
| Jr. | | – Junior |
| KRW | | – South Korean Won |
| MXN | | – Mexican Peso |
| | |
| NOK | | – Norwegian Krona |
| NZD | | – New Zealand Dollar |
| PLN | | – Poland Zloty |
| REGS | | – Regulation S |
| Sec. | | – Secured |
| Sr. | | – Senior |
| STACR® | | – Structured Agency Credit Risk |
| Sub. | | – Subordinated |
| Unsec. | | – Unsecured |
See accompanying Notes to Financial Statements which are an integral part of the financial statements.
11 Invesco International Total Return Fund
Notes to Schedule of Investments:
| (a) | Foreign denominated security. Principal amount is denominated in the currency indicated. |
| (b) | Perpetual bond with no specified maturity date. |
| (c) | Security purchased or received in a transaction exempt from registration under the Securities Act of 1933, as amended (the “1933 Act”). The security may be resold pursuant to an exemption from registration under the 1933 Act, typically to qualified institutional buyers. The aggregate value of these securities at October 31, 2014 was $9,907,663, which represented 16.87% of the Fund’s Net Assets. |
| (d) | Interest or dividend rate is redetermined periodically. Rate shown is the rate in effect on October 31, 2014. |
| (e) | Principal payments are determined by the delinquency and principal payment experience on the STACR® reference pool. Freddie Mac transfers credit risk from the mortgages in the reference pool to credit investors who invest in the STACR® debt notes. |
| (f) | The money market fund and the Fund are affiliated by having the same investment adviser. |
| (g) | The table below details options purchased: |
| | | | | | | | | | | | | | | | | | | | | | | | | | | | | | | | |
| Over-The-Counter Foreign Currency Options Purchased | |
| Description | | Type of
Contract | | | Counterparty | | | Expiration
Date | | | Strike Price | | | Notional Value | | | Value | |
EUR versus USD | | | Put | | | | Deutsche Bank | | | | 01/05/15 | | | | USD | | | | 1.23 | | | | EUR | | | | 4,000,000 | | | $ | 41,956 | |
SGD versus JPY | | | Put | | | | Morgan Stanley & Co. LLC | | | | 01/08/15 | | | | JPY | | | | 82.50 | | | | SGD | | | | 2,000,000 | | | | 2,129 | |
Total Over-The-Counter Foreign Currency Options Purchased — Currency Risk (Cost $33,108) | | | $ | 44,085 | |
Abbreviations:
| | |
| EUR | | – Euro |
| JPY | | – Japanese Yen |
| SGD | | – Singapore Dollar |
| USD | | – U.S. Dollar |
See accompanying Notes to Financial Statements which are an integral part of the financial statements.
12 Invesco International Total Return Fund
Statement of Assets and Liabilities
October 31, 2014
| | | | |
Assets: | | | | |
Investments, at value (Cost $57,193,725) | | $ | 55,528,038 | |
Investments in affiliated money market funds, at value and cost | | | 421,085 | |
Total investments, at value (Cost $57,614,810) | | | 55,949,123 | |
Foreign currencies, at value (Cost $934,098) | | | 916,236 | |
Receivable for: | | | | |
Deposits with brokers for open futures contracts | | | 155,700 | |
Investments sold | | | 1,022,338 | |
Fund shares sold | | | 326,861 | |
Dividends and interest | | | 670,540 | |
Investment for trustee deferred compensation and retirement plans | | | 34,527 | |
Other assets | | | 20,248 | |
Total assets | | | 59,095,573 | |
| |
Liabilities: | | | | |
Payable for: | | | | |
Investments purchased | | | 25,240 | |
Fund shares reacquired | | | 91,582 | |
Forward foreign currency contracts outstanding | | | 79,868 | |
Variation margin — futures | | | 49,146 | |
Accrued fees to affiliates | | | 31,547 | |
Accrued trustees’ and officers’ fees and benefits | | | 1,947 | |
Accrued other operating expenses | | | 59,748 | |
Trustee deferred compensation and retirement plans | | | 36,485 | |
Total liabilities | | | 375,563 | |
Net assets applicable to shares outstanding | | $ | 58,720,010 | |
|
Net assets consist of: | |
Shares of beneficial interest | | $ | 59,607,269 | |
Undistributed net investment income | | | 99,678 | |
Undistributed net realized gain | | | 861,803 | |
Net unrealized appreciation (depreciation) | | | (1,848,740 | ) |
| | | $ | 58,720,010 | |
| | | | |
Net Assets: | | | | |
Class A | | $ | 32,668,343 | |
Class B | | $ | 1,867,080 | |
Class C | | $ | 6,440,679 | |
Class Y | | $ | 4,989,061 | |
Class R5 | | $ | 118,340 | |
Class R6 | | $ | 12,636,507 | |
|
Shares outstanding, $0.01 par value per share,
with an unlimited number of shares authorized: | |
Class A | | | 3,072,090 | |
Class B | | | 175,829 | |
Class C | | | 606,992 | |
Class Y | | | 469,420 | |
Class R5 | | | 11,119 | |
Class R6 | | | 1,188,311 | |
Class A: | | | | |
Net asset value per share | | $ | 10.63 | |
Maximum offering price per share | | | | |
(Net asset value of $10.63 ¸ 95.75%) | | $ | 11.10 | |
Class B: | | | | |
Net asset value and offering price per share | | $ | 10.62 | |
Class C: | | | | |
Net asset value and offering price per share | | $ | 10.61 | |
Class Y: | | | | |
Net asset value and offering price per share | | $ | 10.63 | |
Class R5 | | | | |
Net asset value and offering price per share | | $ | 10.64 | |
Class R6: | | | | |
Net asset value and offering price per share | | $ | 10.63 | |
See accompanying Notes to Financial Statements which are an integral part of the financial statements.
13 Invesco International Total Return Fund
Statement of Operations
For the year ended October 31, 2014
| | | | |
Investment income: | |
Interest (net of foreign withholding taxes of $ 1,262) | | $ | 1,612,515 | |
Dividends from affiliated money market funds | | | 307 | |
Total investment income | | | 1,612,822 | |
| |
Expenses: | | | | |
Advisory fees | | | 357,552 | |
Administrative services fees | | | 50,000 | |
Custodian fees | | | 19,226 | |
Distribution fees: | | | | |
Class A | | | 82,387 | |
Class B | | | 23,389 | |
Class C | | | 60,187 | |
Transfer agent fees — A, B, C and Y | | | 128,819 | |
Transfer agent fees — R5 | | | 21 | |
Transfer agent fees — R6 | | | 594 | |
Trustees’ and officers’ fees and benefits | | | 23,869 | |
Registration and filing fees | | | 74,497 | |
Professional services fees | | | 56,052 | |
Other | | | 44,268 | |
Total expenses | | | 920,861 | |
Less: Fees waived, expenses reimbursed and expense offset arrangement(s) | | | (288,886 | ) |
Net expenses | | | 631,975 | |
Net investment income | | | 980,847 | |
| |
Realized and unrealized gain (loss) from: | | | | |
Net realized gain (loss) from: | | | | |
Investment securities | | | 1,801,943 | |
Foreign currencies | | | (130,460 | ) |
Forward foreign currency contracts | | | (214,704 | ) |
Futures contracts | | | (957,207 | ) |
| | | | 499,572 | |
Change in net unrealized appreciation (depreciation) of: | | | | |
Investment securities | | | (2,239,191 | ) |
Foreign currencies | | | (50,806 | ) |
Forward foreign currency contracts | | | (9,327 | ) |
Futures contracts | | | (60,194 | ) |
| | | | (2,359,518 | ) |
Net realized and unrealized gain (loss) | | | (1,859,946 | ) |
Net increase (decrease) in net assets resulting from operations | | $ | (879,099 | ) |
See accompanying Notes to Financial Statements which are an integral part of the financial statements.
14 Invesco International Total Return Fund
Statement of Changes in Net Assets
For the years ended October 31, 2014 and 2013
| | | | | | | | |
| | | 2014 | | | 2013 | |
Operations: | | | | | | | | |
Net investment income | | $ | 980,847 | | | $ | 850,480 | |
Net realized gain | | | 499,572 | | | | 683,864 | |
Change in net unrealized appreciation (depreciation) | | | (2,359,518 | ) | | | (2,825,798 | ) |
Net increase (decrease) in net assets resulting from operations | | | (879,099 | ) | | | (1,291,454 | ) |
| | |
Distributions to shareholders from net investment income: | | | | | | | | |
Class A | | | (342,384 | ) | | | (359,656 | ) |
Class B | | | (6,778 | ) | | | (8,962 | ) |
Class C | | | (17,273 | ) | | | (15,934 | ) |
Class Y | | | (43,342 | ) | | | (13,295 | ) |
Class R5 | | | (2,735 | ) | | | (2,815 | ) |
Class R6 | | | (136,738 | ) | | | (83,371 | ) |
Total distributions from net investment income | | | (549,250 | ) | | | (484,033 | ) |
| | |
Distributions to shareholders from net realized gains: | | | | | | | | |
Class A | | | (627,066 | ) | | | — | |
Class B | | | (54,188 | ) | | | — | |
Class C | | | (109,020 | ) | | | — | |
Class Y | | | (20,619 | ) | | | — | |
Class R5 | | | (5,529 | ) | | | — | |
Class R6 | | | (179,473 | ) | | | — | |
Total distributions from net realized gains | | | (995,895 | ) | | | — | |
| | |
Share transactions–net: | | | | | | | | |
Class A | | | 1,008,873 | | | | (6,485,845 | ) |
Class B | | | (900,676 | ) | | | (1,422,159 | ) |
Class C | | | 1,140,625 | | | | (2,203,851 | ) |
Class Y | | | 4,234,543 | | | | (103,666 | ) |
Class R5 | | | (160,180 | ) | | | 65,739 | |
Class R6 | | | 4,374,306 | | | | 3,335,917 | |
Net increase (decrease) in net assets resulting from share transactions | | | 9,697,491 | | | | (6,813,865 | ) |
Net increase (decrease) in net assets | | | 7,273,247 | | | | (8,589,352 | ) |
| | |
Net assets: | | | | | | | | |
Beginning of year | | | 51,446,763 | | | | 60,036,115 | |
End of year (includes undistributed net investment income of $99,678 and $43,087, respectively) | | $ | 58,720,010 | | | $ | 51,446,763 | |
Notes to Financial Statements
October 31, 2014
NOTE 1—Significant Accounting Policies
Invesco International Total Return Fund (the “Fund”) is a series portfolio of AIM Investment Funds (Invesco Investment Funds) (the “Trust”). The Trust is organized as a Delaware statutory trust and is registered under the Investment Company Act of 1940, as amended (the “1940 Act”), as an open-end series management investment company consisting of twenty-four separate series portfolios, each authorized to issue an unlimited number of shares of beneficial interest. The assets, liabilities and operations of each portfolio are accounted for separately. Information presented in these financial statements pertains only to the Fund. Matters affecting each portfolio or class will be voted on exclusively by the shareholders of such portfolio or class.
The Fund’s investment objective is total return, comprised of current income and capital appreciation.
The Fund currently consists of six different classes of shares: Class A, Class B, Class C, Class Y, Class R5 and Class R6. Class A shares are sold with a front-end sales charge unless certain waiver criteria are met and under certain circumstances load waived shares may be subject to contingent deferred sales charges (“CDSC”). Class C shares are sold with a CDSC. Class Y, Class R5 and Class R6 shares are sold at net asset value. Effective November 30, 2010, new or additional investments in Class B shares are no longer permitted. Existing shareholders of Class B shares may continue to reinvest dividends and capital gains distributions in Class B shares until they convert to Class A shares. Also, shareholders in Class B shares will be
15 Invesco International Total Return Fund
able to exchange those shares for Class B shares of other Invesco Funds offering such shares until they convert to Class A shares. Generally, Class B shares will automatically convert to Class A shares on or about the month-end, which is at least eight years after the date of purchase. Redemption of Class B shares prior to the conversion date will be subject to a CDSC.
The following is a summary of the significant accounting policies followed by the Fund in the preparation of its financial statements.
| A. | Security Valuations — Securities, including restricted securities, are valued according to the following policy. |
Debt obligations (including convertible securities) and unlisted equities are fair valued using an evaluated quote provided by an independent pricing service. Evaluated quotes provided by the pricing service may be determined without exclusive reliance on quoted prices, and may reflect appropriate factors such as institution-size trading in similar groups of securities, developments related to specific securities, dividend rate (for unlisted equities), yield (for debt obligations), quality, type of issue, coupon rate (for debt obligations), maturity (for debt obligations), individual trading characteristics and other market data. Debt obligations are subject to interest rate and credit risks. In addition, all debt obligations involve some risk of default with respect to interest and/or principal payments.
A security listed or traded on an exchange (except convertible securities) is valued at its last sales price or official closing price as of the close of the customary trading session on the exchange where the security is principally traded, or lacking any sales or official closing price on a particular day, the security may be valued at the closing bid price on that day. Securities traded in the over-the-counter market are valued based on prices furnished by independent pricing services or market makers. When such securities are valued by an independent pricing service they may be considered fair valued. Futures contracts are valued at the final settlement price set by an exchange on which they are principally traded. Listed options are valued at the mean between the last bid and ask prices from the exchange on which they are principally traded. Options not listed on an exchange are valued by an independent source at the mean between the last bid and ask prices. For purposes of determining net asset value per share, futures and option contracts generally are valued 15 minutes after the close of the customary trading session of the New York Stock Exchange (“NYSE”).
Investments in open-end and closed-end registered investment companies that do not trade on an exchange are valued at the end of day net asset value per share. Investments in open-end and closed-end registered investment companies that trade on an exchange are valued at the last sales price or official closing price as of the close of the customary trading session on the exchange where the security is principally traded.
Foreign securities’ (including foreign exchange contracts) prices are converted into U.S. dollar amounts using the applicable exchange rates as of the close of the NYSE. If market quotations are available and reliable for foreign exchange-traded equity securities, the securities will be valued at the market quotations. Because trading hours for certain foreign securities end before the close of the NYSE, closing market quotations may become unreliable. If between the time trading ends on a particular security and the close of the customary trading session on the NYSE, events occur that the Adviser determines are significant and make the closing price unreliable, the Fund may fair value the security. If the event is likely to have affected the closing price of the security, the security will be valued at fair value in good faith using procedures approved by the Board of Trustees. Adjustments to closing prices to reflect fair value may also be based on a screening process of an independent pricing service to indicate the degree of certainty, based on historical data, that the closing price in the principal market where a foreign security trades is not the current value as of the close of the NYSE. Foreign securities’ prices meeting the approved degree of certainty that the price is not reflective of current value will be priced at the indication of fair value from the independent pricing service. Multiple factors may be considered by the independent pricing service in determining adjustments to reflect fair value and may include information relating to sector indices, American Depositary Receipts and domestic and foreign index futures. Foreign securities may have additional risks including exchange rate changes, potential for sharply devalued currencies and high inflation, political and economic upheaval, the relative lack of issuer information, relatively low market liquidity and the potential lack of strict financial and accounting controls and standards.
Securities for which market prices are not provided by any of the above methods may be valued based upon quotes furnished by independent sources. The last bid price may be used to value equity securities. The mean between the last bid and ask prices is used to value debt obligations, including corporate loans.
Securities for which market quotations are not readily available or became unreliable are valued at fair value as determined in good faith by or under the supervision of the Trust’s officers following procedures approved by the Board of Trustees. Issuer specific events, market trends, bid/ask quotes of brokers and information providers and other market data may be reviewed in the course of making a good faith determination of a security’s fair value.
The Fund may invest in securities that are subject to interest rate risk, meaning the risk that the prices will generally fall as interest rates rise and, conversely, the prices will generally rise as interest rates fall. Specific securities differ in their sensitivity to changes in interest rates depending on their individual characteristics. Changes in interest rates may result in increased market volatility, which may affect the value and/or liquidity of certain of the Fund’s investments.
Valuations change in response to many factors including the historical and prospective earnings of the issuer, the value of the issuer’s assets, general economic conditions, interest rates, investor perceptions and market liquidity. Because of the inherent uncertainties of valuation, the values reflected in the financial statements may materially differ from the value received upon actual sale of those investments.
| B. | Securities Transactions and Investment Income — Securities transactions are accounted for on a trade date basis. Realized gains or losses on sales are computed on the basis of specific identification of the securities sold. Interest income (net of withholding tax, if any) is recorded on the accrual basis from settlement date. Dividend income (net of withholding tax, if any) is recorded on the ex-dividend date. Bond premiums and discounts are amortized and/or accreted for financial reporting purposes. |
The Fund may periodically participate in litigation related to Fund investments. As such, the Fund may receive proceeds from litigation settlements. Any proceeds received are included in the Statement of Operations as realized gain (loss) for investments no longer held and as unrealized gain (loss) for investments still held.
Brokerage commissions and mark ups are considered transaction costs and are recorded as an increase to the cost basis of securities purchased and/or a reduction of proceeds on a sale of securities. Such transaction costs are included in the determination of net realized and unrealized gain (loss) from investment securities reported in the Statement of Operations and the Statement of Changes in Net Assets and the net realized and unrealized gains (losses) on securities per share in the Financial Highlights. Transaction costs are included in the calculation of the Fund’s net asset value and, accordingly, they reduce the Fund’s total returns. These transaction costs are not considered operating expenses and are not reflected in net investment income reported in the Statement of Operations and Statement of Changes in Net Assets, or the net investment
16 Invesco International Total Return Fund
income per share and ratios of expenses and net investment income reported in the Financial Highlights, nor are they limited by any expense limitation arrangements between the Fund and the investment adviser.
The Fund allocates income and realized and unrealized capital gains and losses to a class based on the relative net assets of each class.
| C. | Country Determination — For the purposes of making investment selection decisions and presentation in the Schedule of Investments, the investment adviser may determine the country in which an issuer is located and/or credit risk exposure based on various factors. These factors include the laws of the country under which the issuer is organized, where the issuer maintains a principal office, the country in which the issuer derives 50% or more of its total revenues and the country that has the primary market for the issuer’s securities, as well as other criteria. Among the other criteria that may be evaluated for making this determination are the country in which the issuer maintains 50% or more of its assets, the type of security, financial guarantees and enhancements, the nature of the collateral and the sponsor organization. Country of issuer and/or credit risk exposure has been determined to be the United States of America, unless otherwise noted. |
| D. | Distributions — Distributions from net investment income, if any, are declared and paid quarterly and are recorded on the ex-dividend date. Distributions from net realized capital gain, if any, are generally declared and paid annually and recorded on the ex-dividend date. The Fund may elect to treat a portion of the proceeds from redemptions as distributions for federal income tax purposes. |
| E. | Federal Income Taxes — The Fund intends to comply with the requirements of Subchapter M of the Internal Revenue Code of 1986, as amended (the “Internal Revenue Code”), necessary to qualify as a regulated investment company and to distribute substantially all of the Fund’s taxable earnings to shareholders. As such, the Fund will not be subject to federal income taxes on otherwise taxable income (including net realized capital gain) that is distributed to shareholders. Therefore, no provision for federal income taxes is recorded in the financial statements. |
The Fund recognizes the tax benefits of uncertain tax positions only when the position is more likely than not to be sustained. Management has analyzed the Fund’s uncertain tax positions and concluded that no liability for unrecognized tax benefits should be recorded related to uncertain tax positions. Management is not aware of any tax positions for which it is reasonably possible that the total amounts of unrecognized tax benefits will change materially in the next 12 months.
The Fund files tax returns in the U.S. Federal jurisdiction and certain other jurisdictions. Generally, the Fund is subject to examinations by such taxing authorities for up to three years after the filing of the return for the tax period.
| F. | Expenses — Fees provided for under the Rule 12b-1 plan of a particular class of the Fund are charged to the operations of such class. Transfer agency fees and expenses and other shareholder recordkeeping fees and expenses attributable to Class R5 and Class R6 are allocated to each share class based on relative net assets. Sub-accounting fees attributable to Class R5 are charged to the operations of the class. Transfer agency fees and expenses and other shareholder recordkeeping fees and expenses relating to all other classes are allocated among those classes based on relative net assets. All other expenses are allocated among the classes based on relative net assets. |
| G. | Accounting Estimates — The preparation of financial statements in conformity with accounting principles generally accepted in the United States of America (“GAAP”) requires management to make estimates and assumptions that affect the reported amounts of assets and liabilities at the date of the financial statements and the reported amounts of revenues and expenses during the reporting period including estimates and assumptions related to taxation. Actual results could differ from those estimates by a significant amount. In addition, the Fund monitors for material events or transactions that may occur or become known after the period-end date and before the date the financial statements are released to print. |
| H. | Indemnifications — Under the Trust’s organizational documents, each Trustee, officer, employee or other agent of the Trust is indemnified against certain liabilities that may arise out of the performance of their duties to the Fund. Additionally, in the normal course of business, the Fund enters into contracts, including the Fund’s servicing agreements, that contain a variety of indemnification clauses. The Fund’s maximum exposure under these arrangements is unknown as this would involve future claims that may be made against the Fund that have not yet occurred. The risk of material loss as a result of such indemnification claims is considered remote. |
| I. | Foreign Currency Translations — Foreign currency is valued at the close of the NYSE based on quotations posted by banks and major currency dealers. Portfolio securities and other assets and liabilities denominated in foreign currencies are translated into U.S. dollar amounts at date of valuation. Purchases and sales of portfolio securities (net of foreign taxes withheld on disposition) and income items denominated in foreign currencies are translated into U.S. dollar amounts on the respective dates of such transactions. The Fund does not separately account for the portion of the results of operations resulting from changes in foreign exchange rates on investments and the fluctuations arising from changes in market prices of securities held. The combined results of changes in foreign exchange rates and the fluctuation of market prices on investments (net of estimated foreign tax withholding) are included with the net realized and unrealized gain or loss from investments in the Statement of Operations. Reported net realized foreign currency gains or losses arise from (1) sales of foreign currencies, (2) currency gains or losses realized between the trade and settlement dates on securities transactions, and (3) the difference between the amounts of dividends, interest, and foreign withholding taxes recorded on the Fund’s books and the U.S. dollar equivalent of the amounts actually received or paid. Net unrealized foreign currency gains and losses arise from changes in the fair values of assets and liabilities, other than investments in securities at fiscal period end, resulting from changes in exchange rates. |
The Fund may invest in foreign securities, which may be subject to foreign taxes on income, gains on investments or currency repatriation, a portion of which may be recoverable. Foreign taxes, if any, are recorded based on the tax regulations and rates that exist in the foreign markets in which the Fund invests and are shown in the Statement of Operations.
| J. | Forward Foreign Currency Contracts — The Fund may engage in foreign currency transactions either on a spot (i.e. for prompt delivery and settlement) basis or through forward foreign currency contracts to manage or minimize currency or exchange rate risk. |
The Fund may also enter into forward foreign currency contracts for the purchase or sale of a security denominated in a foreign currency in order to “lock in” the U.S. dollar price of that security, or the Fund may also enter into forward foreign currency contracts that do not provide for physical settlement of the two currencies, but instead are settled by a single cash payment calculated as the difference between the agreed upon exchange rate and the spot rate at settlement based upon an agreed upon notional amount (non-deliverable forwards). The Fund will set aside liquid assets in an amount equal to daily mark-to-market obligation for forward foreign currency contracts.
A forward foreign currency contract is an obligation between two parties (“Counterparties”) to purchase or sell a specific currency for an agreed-upon price at a future date. The use of forward foreign currency contracts does not eliminate fluctuations in the price of the underlying securities the Fund owns or intends to acquire but establishes a rate of exchange in advance. Fluctuations in the value of these contracts are
17 Invesco International Total Return Fund
measured by the difference in the contract date and reporting date exchange rates and are recorded as unrealized appreciation (depreciation) until the contracts are closed. When the contracts are closed, realized gains (losses) are recorded. Realized and unrealized gains (losses) on the contracts are included in the Statement of Operations. The primary risks associated with forward foreign currency contracts include failure of the Counterparty to meet the terms of the contract and the value of the foreign currency changing unfavorably. These risks may be in excess of the amounts reflected in the Statement of Assets and Liabilities.
| K. | Futures Contracts — The Fund may enter into futures contracts to manage exposure to interest rate, equity and market price movements and/or currency risks. A futures contract is an agreement between two parties to purchase or sell a specified underlying security, currency or commodity (or delivery of a cash settlement price, in the case of an index future) for a fixed price at a future date. The Fund currently invests only in exchange-traded futures and they are standardized as to maturity date and underlying financial instrument. Initial margin deposits required upon entering into futures contracts are satisfied by the segregation of specific securities or cash as collateral at the futures commission merchant (broker). During the period the futures contracts are open, changes in the value of the contracts are recognized as unrealized gains or losses by recalculating the value of the contracts on a daily basis. Subsequent or variation margin payments are received or made depending upon whether unrealized gains or losses are incurred. These amounts are reflected as receivables or payables on the Statement of Assets and Liabilities. When the contracts are closed or expire, the Fund recognizes a realized gain or loss equal to the difference between the proceeds from, or cost of, the closing transaction and the Fund’s basis in the contract. The net realized gain (loss) and the change in unrealized gain (loss) on futures contracts held during the period is included on the Statement of Operations. The primary risks associated with futures contracts are market risk and the absence of a liquid secondary market. If the Fund were unable to liquidate a futures contract and/or enter into an offsetting closing transaction, the Fund would continue to be subject to market risk with respect to the value of the contracts and continue to be required to maintain the margin deposits on the futures contracts. Futures contracts have minimal Counterparty risk since the exchange’s clearinghouse, as Counterparty to all exchange-traded futures, guarantees the futures against default. Risks may exceed amounts recognized in the Statement of Assets and Liabilities. |
| L. | Put Options Purchased — The Fund may purchase put options including options on securities indexes and/or futures contracts. By purchasing a put option, the Fund obtains the right (but not the obligation) to sell the option’s underlying instrument at a fixed strike price. In return for this right, the Fund pays an option premium. The option’s underlying instrument may be a security, securities index, or a futures contract. Put options may be used by the Fund to hedge securities it owns by locking in a minimum price at which the Fund can sell. If security prices fall, the put option could be exercised to offset all or a portion of the Fund’s resulting losses. At the same time, because the maximum the Fund has at risk is the cost of the option, purchasing put options does not eliminate the potential for the Fund to profit from an increase in the value of the securities hedged. Realized and unrealized gains and losses on these contracts are included in the Statement of Operations. A risk in buying an option is that the Fund pays a premium whether or not the option is exercised. In addition, there can be no assurance that a liquid secondary market will exist for any option purchased. |
| M. | Collateral — To the extent the Fund has designated or segregated a security as collateral and that security is subsequently sold, it is the Fund’s practice to replace such collateral no later than the next business day. |
NOTE 2—Advisory Fees and Other Fees Paid to Affiliates
The Trust has entered into a master investment advisory agreement with Invesco Advisers, Inc. (the “Adviser” or “Invesco”). Under the terms of the investment advisory agreement, the Fund pays an advisory fee to the Adviser based on the annual rate of the Fund’s average daily net assets as follows:
| | | | | | |
| Average Daily Net Assets | | Rate |
First $250 million | | | 0 | .65% | | |
Next $250 million | | | 0 | .59% | | |
Next $500 million | | | 0 | .565% | | |
Next $1.5 billion | | | 0 | .54% | | |
Next $2.5 billion | | | 0 | .515% | | |
Next $5 billion | | | 0 | .49% | | |
Over $10 billion | | | 0 | .465% | | |
For the year ended October 31, 2014, the effective advisory fee incurred by the Fund was 0.65%.
Under the terms of a master sub-advisory agreement between the Adviser and each of Invesco Asset Management Deutschland GmbH, Invesco Asset Management Limited, Invesco Asset Management (Japan) Limited, Invesco Australia Limited, Invesco Hong Kong Limited, Invesco Senior Secured Management, Inc. and Invesco Canada Ltd. (collectively, the “Affiliated Sub-Advisers”) the Adviser, not the Fund, may pay 40% of the fees paid to the Adviser to any such Affiliated Sub-Adviser(s) that provide(s) discretionary investment management services to the Fund based on the percentage of assets allocated to such Sub-Adviser(s).
The Adviser has contractually agreed, through at least February 29, 2016, to waive advisory fees and/or reimburse expenses to the extent necessary to limit total annual fund operating expenses after fee waiver and/or expense reimbursement (excluding certain items discussed below) of Class A, Class B, Class C, Class Y, Class R5 and Class R6 shares to 1.10%, 1.85%, 1.85%, 0.85%, 0.85% and 0.85% of average daily net assets, respectively. In determining the Adviser’s obligation to waive advisory fees and/or reimburse expenses, the following expenses are not taken into account, and could cause total annual fund operating expenses after fee waiver and/or expense reimbursement to exceed the numbers reflected above: (1) interest; (2) taxes; (3) dividend expense on short sales; (4) extraordinary or non-routine items, including litigation expenses; and (5) expenses that the Fund has incurred but did not actually pay because of an expense offset arrangement. Unless Invesco continues the fee waiver agreement, it will terminate on February 29, 2016. The fee waiver agreement cannot be terminated during its term.
Further, the Adviser has contractually agreed, through at least June 30, 2016, to waive the advisory fee payable by the Fund in an amount equal to 100% of the net advisory fees the Adviser receives from the affiliated money market funds on investments by the Fund of uninvested cash in such affiliated money market funds.
18 Invesco International Total Return Fund
For the year ended October 31, 2014, the Adviser waived advisory fees of $159,453 and reimbursed class level expenses of $95,547, $6,781, $17,450, $8,621, $20 and $594 of Class A, Class B, Class C, Class Y, Class R5 and Class R6 shares, respectively.
The Trust has entered into a master administrative services agreement with Invesco pursuant to which the Fund has agreed to pay Invesco for certain administrative costs incurred in providing accounting services to the Fund. For the year ended October 31, 2014, expenses incurred under the agreement are shown in the Statement of Operations as Administrative services fees.
The Trust has entered into a transfer agency and service agreement with Invesco Investment Services, Inc. (“IIS”) pursuant to which the Fund has agreed to pay IIS a fee for providing transfer agency and shareholder services to the Fund and reimburse IIS for certain expenses incurred by IIS in the course of providing such services. IIS may make payments to intermediaries that provide omnibus account services, sub-accounting services and/or networking services. All fees payable by IIS to intermediaries that provide omnibus account services or sub-accounting are charged back to the Fund, subject to certain limitations approved by the Trust’s Board of Trustees. For the year ended October 31, 2014, expenses incurred under the agreement are shown in the Statement of Operations as Transfer agent fees.
The Trust has entered into master distribution agreements with Invesco Distributors, Inc. (“IDI”) to serve as the distributor for the Class A, Class B, Class C, Class Y, Class R5 and Class R6 shares of the Fund. The Trust has adopted plans pursuant to Rule 12b-1 under the 1940 Act with respect to the Fund’s Class A, Class B and Class C shares (collectively, the “Plans”). The Fund, pursuant to the Plans, pays IDI compensation at the annual rate of 0.25% of the Fund’s average daily net assets of Class A shares and 1.00% of the average daily net assets of Class B and Class C shares. Of the Plan payments, up to 0.25% of the average daily net assets of each class of shares may be paid to furnish continuing personal shareholder services to customers who purchase and own shares of such classes. Any amounts not paid as a service fee under the Plans would constitute an asset-based sales charge. Rules of the Financial Industry Regulatory Authority (“FINRA”) impose a cap on the total sales charges, including asset-based sales charges, that may be paid by any class of shares of the Fund. For the year ended October 31, 2014, expenses incurred under the Plans are shown in the Statement of Operations as Distribution fees.
Front-end sales commissions and CDSC (collectively, the “sales charges”) are not recorded as expenses of the Fund. Front-end sales commissions are deducted from proceeds from the sales of Fund shares prior to investment in Class A shares of the Fund. CDSC are deducted from redemption proceeds prior to remittance to the shareholder. During the year ended October 31, 2014, IDI advised the Fund that IDI retained $13,523 in front-end sales commissions from the sale of Class A shares and $238, $2,650 and $120 from Class A, Class B and Class C shares, respectively, for CDSC imposed on redemptions by shareholders.
Certain officers and trustees of the Trust are officers and directors of the Adviser, IIS and/or IDI.
NOTE 3—Additional Valuation Information
GAAP defines fair value as the price that would be received to sell an asset or paid to transfer a liability in an orderly transaction between market participants at the measurement date, under current market conditions. GAAP establishes a hierarchy that prioritizes the inputs to valuation methods, giving the highest priority to readily available unadjusted quoted prices in an active market for identical assets (Level 1) and the lowest priority to significant unobservable inputs (Level 3), generally when market prices are not readily available or are unreliable. Based on the valuation inputs, the securities or other investments are tiered into one of three levels. Changes in valuation methods may result in transfers in or out of an investment’s assigned level:
| | Level 1 — | Prices are determined using quoted prices in an active market for identical assets. |
| | Level 2 — | Prices are determined using other significant observable inputs. Observable inputs are inputs that other market participants may use in pricing a security. These may include quoted prices for similar securities, interest rates, prepayment speeds, credit risk, yield curves, loss severities, default rates, discount rates, volatilities and others. |
| | Level 3 — | Prices are determined using significant unobservable inputs. In situations where quoted prices or observable inputs are unavailable (for example, when there is little or no market activity for an investment at the end of the period), unobservable inputs may be used. Unobservable inputs reflect the Fund’s own assumptions about the factors market participants would use in determining fair value of the securities or instruments and would be based on the best available information. |
The following is a summary of the tiered valuation input levels, as of October 31, 2014. The level assigned to the securities valuations may not be an indication of the risk or liquidity associated with investing in those securities. Because of the inherent uncertainties of valuation, the values reflected in the financial statements may materially differ from the value received upon actual sale of those investments.
| | | | | | | | | | | | | | | | |
| | | Level 1 | | | Level 2 | | | Level 3 | | | Total | |
Corporate Debt Securities | | $ | — | | | $ | 17,990,319 | | | $ | — | | | $ | 17,990,319 | |
Foreign Sovereign Debt Securities | | | — | | | | 34,546,498 | | | | — | | | | 34,546,498 | |
Collateralized Mortgage Obligations | | | — | | | | 2,364,326 | | | | — | | | | 2,364,326 | |
Non-Agency Obligations | | | — | | | | 582,810 | | | | — | | | | 582,810 | |
Options Purchased | | | — | | | | 44,085 | | | | — | | | | 44,085 | |
Money Market Funds | | | 421,085 | | | | — | | | | — | | | | 421,085 | |
| | | | 421,085 | | | | 55,528,038 | | | | — | | | | 55,949,123 | |
Forward Foreign Currency Contracts* | | | — | | | | (79,868 | ) | | | — | | | | (79,868 | ) |
Futures Contracts* | | | (53,023 | ) | | | — | | | | — | | | | (53,023 | ) |
Total Investments | | $ | 368,062 | | | $ | 55,448,170 | | | $ | — | | | $ | 55,816,232 | |
| * | Unrealized appreciation (depreciation). |
19 Invesco International Total Return Fund
NOTE 4—Derivative Investments
Value of Derivative Investments at Period-End
The table below summarizes the value of the Fund’s derivative investments, detailed by primary risk exposure, held as of October 31, 2014:
| | | | | | | | |
| | | Value | |
| Risk Exposure/Derivative Type | | Assets | | | Liabilities | |
Currency risk: | | | | | | | | |
Forward foreign currency contracts(a) | | $ | 1,369,724 | | | $ | (1,449,592 | ) |
Options Purchased(b) | | | 44,085 | | | | — | |
Interest rate risk: | | | | | | | | |
Futures contracts(c) | | | 63,492 | | | | (116,515 | ) |
Total | | $ | 1,477,301 | | | $ | (1,566,107 | ) |
| (a) | Values are disclosed on the Statement of Assets and Liabilities under the caption Forward foreign currency contracts outstanding. |
| (b) | Options purchased at value as reported in the Schedule of Investments. |
| (c) | Includes cumulative appreciation (depreciation) of futures contracts. Only current day’s variation margin receivable (payable) is reported within the Statement of Assets and Liabilities. |
Effect of Derivative Investments for the year ended October 31, 2014
The table below summarizes the gains (losses) on derivative investments, detailed by primary risk exposure, recognized in earnings during the period:
| | | | | | | | | | | | |
| | | Location of Gain (Loss) on
Statement of Operations | |
| | | Futures Contracts | | | Foreign Currency Contracts | | | Options(a) | |
Realized Gain (Loss): | | | | | | | | | | | | |
Currency risk | | $ | — | | | $ | (214,704 | ) | | $ | 73,605 | |
Interest rate risk | | | (957,207 | ) | | | — | | | | — | |
Change in Unrealized Appreciation (Depreciation): | | | | | | | | | | | | |
Currency risk | | | — | | | | (9,327 | ) | | | 10,977 | |
Interest rate risk | | | (60,194 | ) | | | — | | | | — | |
Total | | $ | (1,017,401 | ) | | $ | (224,031 | ) | | $ | 84,582 | |
| (a) | Options purchased are included in the net realized gain from investment securities and net change in unrealized (depreciation) of investment securities. |
The table below summarizes the average notional value of futures contracts, forward foreign currency contracts and options purchased outstanding during the period.
| | | | | | | | | | | | |
| | | Futures Contracts | | | Forward Foreign Currency Contracts | | | Options Purchased | |
Average notional value | | $ | 31,471,875 | | | $ | 26,715,911 | | | $ | 6,056,460 | |
| | | | | | | | | | | | | | | | | | | | | | | | | | |
| Open Forward Foreign Currency Contracts | |
Settlement
Date | | Counterparty | | Contract to | | | Notional
Value | | | Unrealized
Appreciation
(Depreciation) | |
| | | Deliver | | | Receive | | | |
12/05/14 | | Barclays Bank PLC | | | EUR | | | | 1,000,000 | | | | USD | | | | 1,259,750 | | | $ | 1,253,435 | | | $ | 6,315 | |
12/05/14 | | Citigroup Global Markets Inc. | | | EUR | | | | 500,000 | | | | USD | | | | 667,762 | | | | 626,717 | | | | 41,045 | |
12/05/14 | | Citigroup Global Markets Inc. | | | EUR | | | | 700,000 | | | | USD | | | | 926,660 | | | | 877,404 | | | | 49,256 | |
12/05/14 | | Citigroup Global Markets Inc. | | | SGD | | | | 1,200,000 | | | | USD | | | | 960,218 | | | | 933,843 | | | | 26,375 | |
12/05/14 | | Citigroup Global Markets Inc. | | | USD | | | | 600,145 | | | | AUD | | | | 650,000 | | | | 570,631 | | | | (29,514 | ) |
12/05/14 | | Citigroup Global Markets Inc. | | | USD | | | | 803,772 | | | | EUR | | | | 600,000 | | | | 752,061 | | | | (51,711 | ) |
12/05/14 | | Citigroup Global Markets Inc. | | | USD | | | | 1,342,215 | | | | EUR | | | | 1,000,000 | | | | 1,253,435 | | | | (88,780 | ) |
12/05/14 | | Citigroup Global Markets Inc. | | | USD | | | | 487,140 | | | | JPY | | | | 50,000,000 | | | | 445,322 | | | | (41,818 | ) |
12/05/14 | | Citigroup Global Markets Inc. | | | USD | | | | 637,530 | | | | NOK | | | | 4,000,000 | | | | 592,257 | | | | (45,273 | ) |
12/05/14 | | Goldman Sachs International | | | CAD | | | | 661,053 | | | | JPY | | | | 65,000,000 | | | | 597,591 | | | | (7,156 | ) |
12/05/14 | | Goldman Sachs International | | | CHF | | | | 600,000 | | | | USD | | | | 638,379 | | | | 623,780 | | | | 14,599 | |
12/05/14 | | Goldman Sachs International | | | CHF | | | | 1,200,000 | | | | USD | | | | 1,258,297 | | | | 1,247,561 | | | | 10,736 | |
12/05/14 | | Goldman Sachs International | | | GBP | | | | 350,000 | | | | USD | | | | 571,463 | | | | 559,787 | | | | 11,676 | |
12/05/14 | | Goldman Sachs International | | | GBP | | | | 450,000 | | | | USD | | | | 725,873 | | | | 719,726 | | | | 6,147 | |
12/05/14 | | Goldman Sachs International | | | JPY | | | | 70,000,000 | | | | USD | | | | 654,071 | | | | 623,451 | | | | 30,620 | |
12/05/14 | | Goldman Sachs International | | | JPY | | | | 130,000,000 | | | | USD | | | | 1,208,897 | | | | 1,157,837 | | | | 51,060 | |
12/05/14 | | Goldman Sachs International | | | MXN | | | | 8,000,000 | | | | USD | | | | 606,045 | | | | 592,799 | | | | 13,246 | |
12/05/14 | | Goldman Sachs International | | | MXN | | | | 8,000,000 | | | | USD | | | | 601,056 | | | | 592,799 | | | | 8,257 | |
12/05/14 | | Goldman Sachs International | | | MXN | | | | 8,000,000 | | | | EUR | | | | 465,850 | | | | 598,571 | | | | (8,887 | ) |
20 Invesco International Total Return Fund
| | | | | | | | | | | | | | | | | | | | | | | | | | |
| Open Forward Foreign Currency Contracts — (continued) | |
Settlement
Date | | Counterparty | | Contract to | | | Notional
Value | | | Unrealized
Appreciation
(Depreciation) | |
| | | Deliver | | | Receive | | | |
12/05/14 | | Goldman Sachs International | | | USD | | | | 591,904 | | | | MXN | | | | 8,000,000 | | | $ | 592,799 | | | $ | (895 | ) |
12/05/14 | | Goldman Sachs International | | | USD | | | | 633,185 | | | | AUD | | | | 700,000 | | | | 614,525 | | | | (18,660 | ) |
12/05/14 | | Goldman Sachs International | | | USD | | | | 607,051 | | | | JPY | | | | 65,000,000 | | | | 578,918 | | | | (28,133 | ) |
12/05/14 | | Goldman Sachs International | | | USD | | | | 598,064 | | | | JPY | | | | 65,000,000 | | | | 578,918 | | | | (19,146 | ) |
12/05/14 | | Goldman Sachs International | | | USD | | | | 602,053 | | | | MXN | | | | 8,000,000 | | | | 592,799 | | | | (9,254 | ) |
12/05/14 | | Goldman Sachs International | | | USD | | | | 604,984 | | | | MXN | | | | 8,000,000 | | | | 592,799 | | | | (12,185 | ) |
12/05/14 | | Goldman Sachs International | | | USD | | | | 593,753 | | | | MXN | | | | 8,000,000 | | | | 592,799 | | | | (954 | ) |
12/05/14 | | Goldman Sachs International | | | USD | | | | 777,338 | | | | NOK | | | | 5,000,000 | | | | 740,321 | | | | (37,017 | ) |
12/05/14 | | Goldman Sachs International | | | USD | | | | 1,179,848 | | | | SGD | | | | 1,500,000 | | | | 1,167,304 | | | | (12,544 | ) |
12/05/14 | | RBC Capital Markets Corp. | | | CAD | | | | 1,000,000 | | | | USD | | | | 903,314 | | | | 886,577 | | | | 16,737 | |
12/05/14 | | RBC Capital Markets Corp. | | | MXN | | | | 8,000,000 | | | | USD | | | | 602,296 | | | | 592,799 | | | | 9,497 | |
12/05/14 | | State Street Bank and Trust Co. | | | AUD | | | | 1,100,000 | | | | USD | | | | 1,023,462 | | | | 965,683 | | | | 57,779 | |
12/05/14 | | State Street Bank and Trust Co. | | | AUD | | | | 600,000 | | | | USD | | | | 552,780 | | | | 526,736 | | | | 26,044 | |
12/05/14 | | State Street Bank and Trust Co. | | | AUD | | | | 650,000 | | | | USD | | | | 588,166 | | | | 570,631 | | | | 17,535 | |
12/05/14 | | State Street Bank and Trust Co. | | | EUR | | | | 1,254,551 | | | | MXN | | | | 22,000,000 | | | | 1,643,045 | | | | 57,701 | |
12/05/14 | | State Street Bank and Trust Co. | | | EUR | | | | 500,000 | | | | USD | | | | 669,060 | | | | 626,717 | | | | 42,343 | |
12/05/14 | | State Street Bank and Trust Co. | | | EUR | | | | 1,000,000 | | | | USD | | | | 1,332,800 | | | | 1,253,435 | | | | 79,365 | |
12/05/14 | | State Street Bank and Trust Co. | | | GBP | | | | 500,000 | | | | USD | | | | 851,710 | | | | 799,695 | | | | 52,015 | |
12/05/14 | | State Street Bank and Trust Co. | | | GBP | | | | 700,000 | | | | USD | | | | 1,166,963 | | | | 1,119,573 | | | | 47,390 | |
12/05/14 | | State Street Bank and Trust Co. | | | GBP | | | | 400,000 | | | | USD | | | | 665,056 | | | | 639,756 | | | | 25,300 | |
12/05/14 | | State Street Bank and Trust Co. | | | JPY | | | | 70,000,000 | | | | USD | | | | 680,901 | | | | 623,451 | | | | 57,450 | |
12/05/14 | | State Street Bank and Trust Co. | | | JPY | | | | 60,000,000 | | | | USD | | | | 584,351 | | | | 534,386 | | | | 49,965 | |
12/05/14 | | State Street Bank and Trust Co. | | | MXN | | | | 7,000,000 | | | | USD | | | | 535,652 | | | | 518,700 | | | | 16,952 | |
12/05/14 | | State Street Bank and Trust Co. | | | JPY | | | | 130,000,000 | | | | USD | | | | 1,212,062 | | | | 1,157,837 | | | | 54,225 | |
12/05/14 | | State Street Bank and Trust Co. | | | MXN | | | | 12,000,000 | | | | USD | | | | 882,610 | | | | 889,199 | | | | (6,589 | ) |
12/05/14 | | State Street Bank and Trust Co. | | | NOK | | | | 1,600,000 | | | | USD | | | | 257,130 | | | | 236,903 | | | | 20,227 | |
12/05/14 | | State Street Bank and Trust Co. | | | NOK | | | | 11,195,258 | | | | SEK | | | | 12,294,050 | | | | 1,794,667 | | | | 7,316 | |
12/05/14 | | State Street Bank and Trust Co. | | | NOK | | | | 4,000,000 | | | | USD | | | | 647,453 | | | | 592,257 | | | | 55,196 | |
12/05/14 | | State Street Bank and Trust Co. | | | NOK | | | | 6,000,000 | | | | EUR | | | | 712,467 | | | | 905,260 | | | | 4,645 | |
12/05/14 | | State Street Bank and Trust Co. | | | NZD | | | | 3,600,000 | | | | USD | | | | 3,077,136 | | | | 2,796,627 | | | | 280,509 | |
12/05/14 | | State Street Bank and Trust Co. | | | NZD | | | | 750,000 | | | | JPY | | | | 63,375,300 | | | | 592,791 | | | | (18,182 | ) |
12/05/14 | | State Street Bank and Trust Co. | | | SEK | | | | 8,000,000 | | | | USD | | | | 1,168,368 | | | | 1,083,408 | | | | 84,960 | |
12/05/14 | | State Street Bank and Trust Co. | | | SGD | | | | 2,300,000 | | | | USD | | | | 1,820,327 | | | | 1,789,866 | | | | 30,461 | |
12/05/14 | | State Street Bank and Trust Co. | | | SGD | | | | 1,200,000 | | | | USD | | | | 940,623 | | | | 933,843 | | | | 6,780 | |
12/05/14 | | State Street Bank and Trust Co. | | | USD | | | | 555,078 | | | | AUD | | | | 600,000 | | | | 526,736 | | | | (28,342 | ) |
12/05/14 | | State Street Bank and Trust Co. | | | USD | | | | 185,474 | | | | CAD | | | | 200,000 | | | | 177,316 | | | | (8,158 | ) |
12/05/14 | | State Street Bank and Trust Co. | | | USD | | | | 848,896 | | | | CHF | | | | 800,000 | | | | 831,707 | | | | (17,189 | ) |
12/05/14 | | State Street Bank and Trust Co. | | | USD | | | | 1,077,936 | | | | EUR | | | | 800,000 | | | | 1,002,748 | | | | (75,188 | ) |
12/05/14 | | State Street Bank and Trust Co. | | | USD | | | | 1,207,143 | | | | EUR | | | | 900,000 | | | | 1,128,091 | | | | (79,052 | ) |
12/05/14 | | State Street Bank and Trust Co. | | | USD | | | | 1,207,287 | | | | EUR | | | | 900,000 | | | | 1,128,091 | | | | (79,196 | ) |
12/05/14 | | State Street Bank and Trust Co. | | | USD | | | | 854,308 | | | | EUR | | | | 650,000 | | | | 814,733 | | | | (39,575 | ) |
12/05/14 | | State Street Bank and Trust Co. | | | USD | | | | 906,849 | | | | EUR | | | | 700,000 | | | | 877,404 | | | | (29,445 | ) |
12/05/14 | | State Street Bank and Trust Co. | | | USD | | | | 647,167 | | | | EUR | | | | 500,000 | | | | 626,717 | | | | (20,450 | ) |
12/05/14 | | State Street Bank and Trust Co. | | | USD | | | | 848,710 | | | | GBP | | | | 500,000 | | | | 799,695 | | | | (49,015 | ) |
12/05/14 | | State Street Bank and Trust Co. | | | USD | | | | 337,808 | | | | GBP | | | | 200,000 | | | | 319,878 | | | | (17,930 | ) |
12/05/14 | | State Street Bank and Trust Co. | | | USD | | | | 1,971,959 | | | | JPY | | | | 200,000,000 | | | | 1,781,288 | | | | (190,671 | ) |
12/05/14 | | State Street Bank and Trust Co. | | | USD | | | | 590,110 | | | | JPY | | | | 60,000,000 | | | | 534,387 | | | | (55,723 | ) |
12/05/14 | | State Street Bank and Trust Co. | | | USD | | | | 685,824 | | | | JPY | | | | 70,000,000 | | | | 623,451 | | | | (62,373 | ) |
12/05/14 | | State Street Bank and Trust Co. | | | USD | | | | 1,172,551 | | | | JPY | | | | 120,000,000 | | | | 1,068,773 | | | | (103,778 | ) |
12/05/14 | | State Street Bank and Trust Co. | | | USD | | | | 390,313 | | | | JPY | | | | 40,000,000 | | | | 356,258 | | | | (34,055 | ) |
12/05/14 | | State Street Bank and Trust Co. | | | USD | | | | 586,958 | | | | JPY | | | | 60,000,000 | | | | 534,387 | | | | (52,571 | ) |
21 Invesco International Total Return Fund
| | | | | | | | | | | | | | | | | | | | | | | | | | |
| Open Forward Foreign Currency Contracts — (continued) | |
Settlement
Date | | Counterparty | | Contract to | | | Notional
Value | | | Unrealized
Appreciation
(Depreciation) | |
| | | Deliver | | | Receive | | | |
12/05/14 | | State Street Bank and Trust Co. | | | USD | | | | 595,451 | | | | JPY | | | | 65,000,000 | | | $ | 578,919 | | | $ | (16,532 | ) |
12/05/14 | | State Street Bank and Trust Co. | | | USD | | | | 593,613 | | | | MXN | | | | 8,000,000 | | | | 592,800 | | | | (813 | ) |
12/05/14 | | State Street Bank and Trust Co. | | | USD | | | | 600,676 | | | | NOK | | | | 3,700,000 | | | | 547,838 | | | | (52,838 | ) |
Total open forward foreign currency contracts — Currency Risk | | | | | | | | | | | | | | | | | | | | | | $ | (79,868 | ) |
Currency Abbreviations:
| | |
| AUD | | – Australian Dollar |
| CAD | | – Canadian Dollar |
| CHF | | – Swiss Franc |
| | |
| EUR | | – Euro |
| GBP | | – British Pound Sterling |
| JPY | | – Japanese Yen |
| | |
| MXN | | – Mexican Peso |
| NOK | | – Norwegian Krone |
| NZD | | – New Zealand Dollar |
| | |
| SEK | | – Swedish Krona |
| SGD | | – Singapore Dollar |
| USD | | – U.S. Dollar |
| | | | | | | | | | | | | | | | | | | | |
| Open Futures Contracts(a) | |
| Futures Contracts | | Type of
Contract | | | Number of
Contracts | | | Expiration
Month | | | Notional
Value | | | Unrealized Appreciation (Depreciation) | |
Australian 10 Year Bonds | | | Long | | | | 12 | | | | December-2014 | | | $ | 1,296,669 | | | $ | 13,164 | |
Japanese 10 Year Muni Bonds | | | Long | | | | 55 | | | | December-2014 | | | | 7,182,174 | | | | 46,809 | |
Canadian 10 Year Bonds | | | Short | | | | 26 | | | | December-2014 | | | | (3,161,576 | ) | | | (15,439 | ) |
Long Guilt | | | Short | | | | 10 | | | | December-2014 | | | | (1,841,370 | ) | | | 3,519 | |
U.S. Treasury 5 Year Notes | | | Short | | | | 117 | | | | December-2014 | | | | (13,973,274 | ) | | | (60,579 | ) |
U.S. Treasury 10 Year Notes | | | Short | | | | 42 | | | | December-2014 | | | | (5,307,094 | ) | | | (40,418 | ) |
Euro Bonds | | | Short | | | | 5 | | | | December-2014 | | | | (910,502 | ) | | | (79 | ) |
Total futures contracts — Interest Rate Risk | | | | | | | | | | | | | | | | | | $ | (53,023 | ) |
| (a) | Futures collateralized by $155,700 cash held with Merrill Lynch, the futures commission merchant. |
Offsetting Assets and Liabilities
Accounting Standards Update (“ASU”) No. 2011-11, Disclosures about Offsetting Assets and Liabilities, which was subsequently clarified in Financial Accounting Standards Board ASU 2013-01 “Clarifying the Scope of Disclosures about Offsetting Assets and Liabilities” is intended to enhance disclosures about financial instruments and derivative instruments that are subject to offsetting arrangements on the Statement of Assets and Liabilities and to enable investors to better understand the effect of those arrangements on its financial position. In order for an arrangement to be eligible for netting, the Fund must have a basis to conclude that such netting arrangements are legally enforceable. The Fund enters into netting agreements and collateral agreements in an attempt to reduce the Fund’s Counterparty credit risk by providing for a single net settlement with a Counterparty of all financial transactions covered by the agreement in an event of default as defined under such agreement.
There were no derivative instruments subject to a netting agreement for which the Fund is not currently netting. The following tables present derivative instruments that are either subject to an enforceable netting agreement or offset by collateral arrangements as of October 31, 2014.
| | | | | | | | | | | | | | | | | | | | | | | | |
| Assets: | |
| | | Gross amounts
presented in
Statement of
Assets & Liabilities(a) | | | Gross amounts
offset in
Statement of
Assets & Liabilities | | | Net amounts of assets
presented in the
Statement of Assets
& Liabilities | | | Collateral Received | | | | |
| Counterparty | | | | | Financial
Instruments | | | Cash | | | Net
Amount | |
Barclays Bank PLC | | $ | 6,315 | | | $ | — | | | $ | 6,315 | | | $ | — | | | $ | — | | | $ | 6,315 | |
Citigroup Global Markets Inc. | | | 116,676 | | | | (116,676 | ) | | | — | | | | — | | | | — | | | | — | |
Goldman Sachs International | | | 146,341 | | | | (146,341 | ) | | | — | | | | — | | | | — | | | | — | |
RBC Capital Markets Corp. | | | 26,234 | | | | — | | | | 26,234 | | | | — | | | | — | | | | 26,234 | |
State Street Bank and Trust Co. | | | 1,074,158 | | | | (1,037,665 | ) | | | 36,493 | | | | — | | | | — | | | | 36,493 | |
Total | | $ | 1,369,724 | | | $ | (1,300,682 | ) | | $ | 69,042 | | | $ | — | | | $ | — | | | $ | 69,042 | |
| | | | | | |
| | | | | | | | | | | | | | | | | | | | | | | | |
| Liabilities: | | | | | | | | | | | | | | | | | | |
| | | Gross amounts
presented in
Statement of
Assets & Liabilities(a) | | | Gross amounts
offset in
Statement of
Assets & Liabilities | | | Net amounts of liabilities
presented in the
Statement of Assets
& Liabilities | | | Collateral Pledged | | | | |
| Counterparty | | | | | Financial
Instruments | | | Cash | | | Net
Amount | |
Citigroup Global Markets Inc. | | $ | 257,096 | | | $ | (116,676 | ) | | $ | 140,420 | | | $ | — | | | $ | — | | | $ | 140,420 | |
Goldman Sachs International | | | 154,831 | | | | (146,341 | ) | | | 8,490 | | | | — | | | | — | | | | 8,490 | |
State Street Bank and Trust Co. | | | 1,037,665 | | | | (1,037,665 | ) | | | — | | | | — | | | | — | | | | — | |
Total | | $ | 1,449,592 | | | $ | (1,300,682 | ) | | $ | 148,910 | | | $ | — | | | $ | — | | | $ | 148,910 | |
| (a) | Includes cumulative appreciation (depreciation). |
22 Invesco International Total Return Fund
NOTE 5—Expense Offset Arrangement(s)
The expense offset arrangement is comprised of transfer agency credits which result from balances in demand deposit accounts used by the transfer agent for clearing shareholder transactions. For year ended October 31, 2014, the Fund received credits from this arrangement, which resulted in the reduction of the Fund’s total expenses of $420.
NOTE 6—Trustees’ and Officers’ Fees and Benefits
Trustees’ and Officers’ Fees and Benefits include amounts accrued by the Fund to pay remuneration to certain Trustees and Officers of the Fund. Trustees have the option to defer compensation payable by the Fund, and Trustees’ and Officers’ Fees and Benefits also include amounts accrued by the Fund to fund such deferred compensation amounts. Those Trustees who defer compensation have the option to select various Invesco Funds in which their deferral accounts shall be deemed to be invested. Finally, certain current Trustees were eligible to participate in a retirement plan that provided for benefits to be paid upon retirement to Trustees over a period of time based on the number of years of service. The Fund may have certain former Trustees who also participate in a retirement plan and receive benefits under such plan. Trustees’ and Officers’ Fees and Benefits include amounts accrued by the Fund to fund such retirement benefits. Obligations under the deferred compensation and retirement plans represent unsecured claims against the general assets of the Fund.
NOTE 7—Cash Balances
The Fund may borrow for leveraging in an amount up to 5% of the Fund’s total assets (excluding the amount borrowed) at the time the borrowing is made. In doing so, the Fund is permitted to temporarily carry a negative or overdrawn balance in its account with State Street Bank and Trust Company, the custodian bank. Such balances, if any at period end, are shown in the Statement of Assets and Liabilities under the payable caption Amount due custodian. To compensate the custodian bank for such overdrafts, the overdrawn Fund may either (1) leave funds as a compensating balance in the account so the custodian bank can be compensated by earning the additional interest; or (2) compensate by paying the custodian bank at a rate agreed upon by the custodian bank and Invesco, not to exceed the contractually agreed upon rate. A Fund may not purchase additional securities when any borrowings from banks exceeds 5% of the Fund’s total assets.
NOTE 8—Distributions to Shareholders and Tax Components of Net Assets
Tax Character of Distributions to Shareholders Paid During the Fiscal Years Ended October 31, 2014 and 2013:
| | | | | | | | |
| | | 2014 | | | 2013 | |
Ordinary income | | $ | 751,443 | | | $ | 484,033 | |
Long-term capital gain | | | 793,702 | | | | — | |
Total distributions | | $ | 1,545,145 | | | $ | 484,033 | |
Tax Components of Net Assets at Period-End:
| | | | |
| | | 2014 | |
Undistributed ordinary income | | $ | 767,377 | |
Net unrealized appreciation (depreciation) — investments | | | (1,668,998 | ) |
Net unrealized appreciation — other investments | | | 45,623 | |
Temporary book/tax differences | | | (31,261 | ) |
Shares of beneficial interest | | | 59,607,269 | |
Total net assets | | $ | 58,720,010 | |
The difference between book-basis and tax-basis unrealized appreciation (depreciation) is due to differences in the timing of recognition of gains and losses on investments for tax and book purposes. The Fund’s net unrealized appreciation (depreciation) difference is attributable primarily to wash sales.
The temporary book/tax differences are a result of timing differences between book and tax recognition of income and/or expenses. The Fund’s temporary book/tax differences are the result of the trustee deferral of compensation and retirement plan benefits.
Capital loss carryforward is calculated and reported as of a specific date. Results of transactions and other activity after that date may affect the amount of capital loss carryforward actually available for the Fund to utilize. Capital losses generated in years beginning after December 22, 2010 can be carried forward for an unlimited period, whereas previous losses expire in 8 tax years. Capital losses with an expiration period may not be used to offset capital gains until all net capital losses without an expiration date have been utilized. Capital loss carryforwards with no expiration date will retain their character as either short-term or long-term capital losses instead of as short-term capital losses as under prior law. The ability to utilize capital loss carryforwards in the future may be limited under the Internal Revenue Code and related regulations based on the results of future transactions.
The Fund does not have a capital loss carryforward as of October 31, 2014.
23 Invesco International Total Return Fund
NOTE 9—Investment Securities
The aggregate amount of investment securities (other than short-term securities, U.S. Treasury obligations and money market funds, if any) purchased and sold by the Fund during the year ended October 31, 2014 was $132,139,404 and $124,525,400, respectively. Cost of investments on a tax basis includes the adjustments for financial reporting purposes as of the most recently completed federal income tax reporting period-end.
| | | | |
| Unrealized Appreciation (Depreciation) of Investment Securities on a Tax Basis | |
Aggregate unrealized appreciation of investment securities | | $ | 1,071,494 | |
Aggregate unrealized (depreciation) of investment securities | | | (2,740,492 | ) |
Net unrealized appreciation (depreciation) of investment securities | | $ | (1,668,998 | ) |
Cost of investments for tax purposes is $57,618,121.
NOTE 10—Reclassification of Permanent Differences
Primarily as a result of differing book/tax treatment of foreign currency transactions, futures and options, on October 31, 2014, undistributed net investment income was decreased by $375,006 and undistributed net realized gain was increased by $375,006. This reclassification had no effect on the net assets of the Fund.
NOTE 11—Share Information
| | | | | | | | | | | | | | | | |
| | | Summary of Share Activity | |
| | | Years ended October 31, | |
| | | 2014(a) | | | 2013 | |
| | | Shares | | | Amount | | | Shares | | | Amount | |
Sold: | | | | | | | | | | | | | | | | |
Class A | | | 873,924 | | | $ | 9,646,186 | | | | 774,233 | | | $ | 8,481,019 | |
Class B | | | 12,209 | | | | 135,159 | | | | 34,717 | | | | 380,865 | |
Class C | | | 226,250 | | | | 2,495,660 | | | | 87,207 | | | | 948,139 | |
Class Y | | | 445,420 | | | | 4,940,833 | | | | 112,728 | | | | 1,204,773 | |
Class R5 | | | 6,347 | | | | 70,569 | | | | 17,004 | | | | 184,202 | |
Class R6 | | | 381,785 | | | | 4,207,536 | | | | 327,372 | | | | 3,547,309 | |
| | | | |
Issued as reinvestment of dividends: | | | | | | | | | | | | | | | | |
Class A | | | 82,518 | | | | 894,078 | | | | 29,663 | | | | 322,966 | |
Class B | | | 5,314 | | | | 57,314 | | | | 731 | | | | 7,968 | |
Class C | | | 11,145 | | | | 120,169 | | | | 1,337 | | | | 14,533 | |
Class Y | | | 4,004 | | | | 43,516 | | | | 950 | | | | 10,319 | |
Class R5 | | | 717 | | | | 7,759 | | | | 253 | | | | 2,749 | |
Class R6 | | | 29,168 | | | | 316,211 | | | | 7,686 | | | | 83,371 | |
| | | | |
Automatic conversion of Class B shares to Class A shares: | | | | | | | | | | | | | | | | |
Class A | | | 43,428 | | | | 478,998 | | | | 44,488 | | | | 483,690 | |
Class B | | | (43,477 | ) | | | (478,998 | ) | | | (44,543 | ) | | | (483,690 | ) |
| | | | |
Reacquired: | | | | | | | | | | | | | | | | |
Class A | | | (911,714 | ) | | | (10,010,389 | ) | | | (1,449,680 | ) | | | (15,773,520 | ) |
Class B | | | (56,118 | ) | | | (614,151 | ) | | | (123,137 | ) | | | (1,327,302 | ) |
Class C | | | (134,146 | ) | | | (1,475,204 | ) | | | (291,243 | ) | | | (3,166,523 | ) |
Class Y | | | (68,813 | ) | | | (749,806 | ) | | | (122,041 | ) | | | (1,318,758 | ) |
Class R5 | | | (21,419 | ) | | | (238,508 | ) | | | (11,245 | ) | | | (121,212 | ) |
Class R6 | | | (13,494 | ) | | | (149,441 | ) | | | (27,131 | ) | | | (294,763 | ) |
Net increase (decrease) in share activity | | | 873,048 | | | $ | 9,697,491 | | | | (630,651 | ) | | $ | (6,813,865 | ) |
| (a) | There are entities that are record owners of more than 5% of the outstanding shares of the Fund and in the aggregate own 28% of the outstanding shares of the Fund. IDI has an agreement with these entities to sell Fund shares. The Fund, Invesco and/or Invesco affiliates may make payments to these entities, which are considered to be related to the Fund, for providing services to the Fund, Invesco and/or Invesco affiliates including but not limited to services such as securities brokerage, distribution, third party record keeping and account servicing. The Fund has no knowledge as to whether all or any portion of the shares owned of record by these entities are also owned beneficially. |
| | In addition, 21% of the outstanding shares of the Fund are owned by an affiliated mutual fund. Affiliated mutual funds are mutual funds that are advised by Invesco. |
24 Invesco International Total Return Fund
NOTE 12—Financial Highlights
The following schedule presents financial highlights for a share of the Fund outstanding throughout the periods indicated.
| | | | | | | | | | | | | | | | | | | | | | | | | | | | | | | | | | | | | | | | | | | | | | | | | | | | | | | | | | | | |
| | | Net asset
value,
beginning
of period | | | Net
investment
income(a) | | | Net gains
(losses)
on securities
(both
realized and
unrealized) | | | Total from
investment
operations | | | Dividends
from net
investment
income | | | Distributions
from net
realized
gains | | | Return of
capital | | | Total
distributions | | | Net asset
value, end
of period(b) | | | Total
return(c) | | | Net assets,
end of period
(000’s omitted) | | | Ratio of
expenses
to average
net assets
with fee waivers
and/or expenses
absorbed | | | Ratio of
expenses
to average net
assets without
fee waivers
and/or expenses
absorbed | | | Ratio of net
investment
income
to average
net assets | | | Portfolio
turnover(d) | |
Class A | | | | | | | | | | | | | | | | | | | | | | | | | | | | | | | | | | | | | | | | | | | | | | | | | | | | | | | | | | | | |
Year ended 10/31/14 | | $ | 11.07 | | | $ | 0.20 | | | $ | (0.30 | ) | | $ | (0.10 | ) | | $ | (0.12 | ) | | $ | (0.22 | ) | | $ | — | | | $ | (0.34 | ) | | $ | 10.63 | | | | (0.97 | )% | | $ | 32,668 | | | | 1.10 | %(e) | | | 1.68 | %(e) | | | 1.83 | %(e) | | | 237 | % |
Year ended 10/31/13 | | | 11.37 | | | | 0.18 | | | | (0.37 | ) | | | (0.19 | ) | | | (0.11 | ) | | | — | | | | — | | | | (0.11 | ) | | | 11.07 | | | | (1.68 | ) | | | 33,019 | | | | 1.10 | | | | 1.68 | | | | 1.65 | | | | 233 | |
Year ended 10/31/12 | | | 11.63 | | | | 0.16 | | | | 0.20 | | | | 0.36 | | | | (0.39 | ) | | | (0.12 | ) | | | (0.11 | ) | | | (0.62 | ) | | | 11.37 | | | | 3.42 | | | | 40,771 | | | | 1.10 | | | | 1.57 | | | | 1.46 | | | | 119 | |
Year ended 10/31/11 | | | 12.22 | | | | 0.19 | | | | 0.16 | | | | 0.35 | | | | (0.58 | ) | | | (0.36 | ) | | | — | | | | (0.94 | ) | | | 11.63 | | | | 3.37 | | | | 47,162 | | | | 1.10 | | | | 1.58 | | | | 1.64 | | | | 226 | |
Year ended 10/31/10 | | | 11.68 | | | | 0.19 | | | | 0.51 | | | | 0.70 | | | | (0.16 | ) | | | — | | | | — | | | | (0.16 | ) | | | 12.22 | | | | 6.12 | | | | 32,947 | | | | 1.10 | | | | 1.55 | | | | 1.69 | | | | 203 | |
Class B | | | | | | | | | | | | | | | | | | | | | | | | | | | | | | | | | | | | | | | | | | | | | | | | | | | | | | | | | | | | |
Year ended 10/31/14 | | | 11.05 | | | | 0.12 | | | | (0.30 | ) | | | (0.18 | ) | | | (0.03 | ) | | | (0.22 | ) | | | — | | | | (0.25 | ) | | | 10.62 | | | | (1.63 | ) | | | 1,867 | | | | 1.85 | (e) | | | 2.43 | (e) | | | 1.08 | (e) | | | 237 | |
Year ended 10/31/13 | | | 11.36 | | | | 0.10 | | | | (0.38 | ) | | | (0.28 | ) | | | (0.03 | ) | | | — | | | | — | | | | (0.03 | ) | | | 11.05 | | | | (2.50 | ) | | | 2,850 | | | | 1.85 | | | | 2.43 | | | | 0.90 | | | | 233 | |
Year ended 10/31/12 | | | 11.61 | | | | 0.08 | | | | 0.20 | | | | 0.28 | | | | (0.30 | ) | | | (0.12 | ) | | | (0.11 | ) | | | (0.53 | ) | | | 11.36 | | | | 2.72 | | | | 4,430 | | | | 1.85 | | | | 2.32 | | | | 0.71 | | | | 119 | |
Year ended 10/31/11 | | | 12.19 | | | | 0.10 | | | | 0.17 | | | | 0.27 | | | | (0.49 | ) | | | (0.36 | ) | | | — | | | | (0.85 | ) | | | 11.61 | | | | 2.66 | | | | 5,934 | | | | 1.85 | | | | 2.33 | | | | 0.89 | | | | 226 | |
Year ended 10/31/10 | | | 11.65 | | | | 0.11 | | | | 0.51 | | | | 0.62 | | | | (0.08 | ) | | | — | | | | — | | | | (0.08 | ) | | | 12.19 | | | | 5.34 | | | | 6,591 | | | | 1.85 | | | | 2.30 | | | | 0.94 | | | | 203 | |
Class C | | | | | | | | | | | | | | | | | | | | | | | | | | | | | | | | | | | | | | | | | | | | | | | | | | | | | | | | | | | | |
Year ended 10/31/14 | | | 11.04 | | | | 0.12 | | | | (0.30 | ) | | | (0.18 | ) | | | (0.03 | ) | | | (0.22 | ) | | | — | | | | (0.25 | ) | | | 10.61 | | | | (1.63 | ) | | | 6,441 | | | | 1.85 | (e) | | | 2.43 | (e) | | | 1.08 | (e) | | | 237 | |
Year ended 10/31/13 | | | 11.35 | | | | 0.10 | | | | (0.38 | ) | | | (0.28 | ) | | | (0.03 | ) | | | — | | | | — | | | | (0.03 | ) | | | 11.04 | | | | (2.50 | ) | | | 5,562 | | | | 1.85 | | | | 2.43 | | | | 0.90 | | | | 233 | |
Year ended 10/31/12 | | | 11.61 | | | | 0.07 | | | | 0.20 | | | | 0.27 | | | | (0.30 | ) | | | (0.12 | ) | | | (0.11 | ) | | | (0.53 | ) | | | 11.35 | | | | 2.63 | | | | 8,016 | | | | 1.85 | | | | 2.32 | | | | 0.71 | | | | 119 | |
Year ended 10/31/11 | | | 12.19 | | | | 0.10 | | | | 0.17 | | | | 0.27 | | | | (0.49 | ) | | | (0.36 | ) | | | — | | | | (0.85 | ) | | | 11.61 | | | | 2.65 | | | | 10,782 | | | | 1.85 | | | | 2.33 | | | | 0.89 | | | | 226 | |
Year ended 10/31/10 | | | 11.66 | | | | 0.11 | | | | 0.50 | | | | 0.61 | | | | (0.08 | ) | | | — | | | | — | | | | (0.08 | ) | | | 12.19 | | | | 5.24 | | | | 9,165 | | | | 1.85 | | | | 2.30 | | | | 0.94 | | | | 203 | |
Class Y | | | | | | | | | | | | | | | | | | | | | | | | | | | | | | | | | | | | | | | | | | | | | | | | | | | | | | | | | | | | |
Year ended 10/31/14 | | | 11.06 | | | | 0.23 | | | | (0.30 | ) | | | (0.07 | ) | | | (0.14 | ) | | | (0.22 | ) | | | — | | | | (0.36 | ) | | | 10.63 | | | | (0.63 | ) | | | 4,989 | | | | 0.85 | (e) | | | 1.43 | (e) | | | 2.08 | (e) | | | 237 | |
Year ended 10/31/13 | | | 11.37 | | | | 0.21 | | | | (0.39 | ) | | | (0.18 | ) | | | (0.13 | ) | | | — | | | | — | | | | (0.13 | ) | | | 11.06 | | | | (1.52 | ) | | | 982 | | | | 0.85 | | | | 1.43 | | | | 1.90 | | | | 233 | |
Year ended 10/31/12 | | | 11.63 | | | | 0.19 | | | | 0.20 | | | | 0.39 | | | | (0.42 | ) | | | (0.12 | ) | | | (0.11 | ) | | | (0.65 | ) | | | 11.37 | | | | 3.68 | | | | 1,105 | | | | 0.85 | | | | 1.32 | | | | 1.71 | | | | 119 | |
Year ended 10/31/11 | | | 12.22 | | | | 0.22 | | | | 0.16 | | | | 0.38 | | | | (0.61 | ) | | | (0.36 | ) | | | — | | | | (0.97 | ) | | | 11.63 | | | | 3.63 | | | | 1,322 | | | | 0.85 | | | | 1.33 | | | | 1.89 | | | | 226 | |
Year ended 10/31/10 | | | 11.68 | | | | 0.22 | | | | 0.51 | | | | 0.73 | | | | (0.19 | ) | | | — | | | | — | | | | (0.19 | ) | | | 12.22 | | | | 6.39 | | | | 726 | | | | 0.85 | | | | 1.30 | | | | 1.94 | | | | 203 | |
Class R5 | | | | | | | | | | | | | | | | | | | | | | | | | | | | | | | | | | | | | | | | | | | | | | | | | | | | | | | | | | | | |
Year ended 10/31/14 | | | 11.07 | | | | 0.23 | | | | (0.30 | ) | | | (0.07 | ) | | | (0.14 | ) | | | (0.22 | ) | | | — | | | | (0.36 | ) | | | 10.64 | | | | (0.63 | ) | | | 118 | | | | 0.85 | (e) | | | 1.15 | (e) | | | 2.08 | (e) | | | 237 | |
Year ended 10/31/13 | | | 11.37 | | | | 0.21 | | | | (0.38 | ) | | | (0.17 | ) | | | (0.13 | ) | | | — | | | | — | | | | (0.13 | ) | | | 11.07 | | | | (1.43 | ) | | | 282 | | | | 0.85 | | | | 1.16 | | | | 1.90 | | | | 233 | |
Year ended 10/31/12 | | | 11.63 | | | | 0.19 | | | | 0.20 | | | | 0.39 | | | | (0.42 | ) | | | (0.12 | ) | | | (0.11 | ) | | | (0.65 | ) | | | 11.37 | | | | 3.68 | | | | 221 | | | | 0.85 | | | | 1.07 | | | | 1.71 | | | | 119 | |
Year ended 10/31/11 | | | 12.22 | | | | 0.22 | | | | 0.16 | | | | 0.38 | | | | (0.61 | ) | | | (0.36 | ) | | | — | | | | (0.97 | ) | | | 11.63 | | | | 3.63 | | | | 4,696 | | | | 0.85 | | | | 1.08 | | | | 1.89 | | | | 226 | |
Year ended 10/31/10 | | | 11.68 | | | | 0.22 | | | | 0.51 | | | | 0.73 | | | | (0.19 | ) | | | — | | | | — | | | | (0.19 | ) | | | 12.22 | | | | 6.39 | | | | 4,457 | | | | 0.85 | | | | 1.03 | | | | 1.94 | | | | 203 | |
Class R6 | | | | | | | | | | | | | | | | | | | | | | | | | | | | | | | | | | | | | | | | | | | | | | | | | | | | | | | | | | | | |
Year ended 10/31/14 | | | 11.07 | | | | 0.23 | | | | (0.31 | ) | | | (0.08 | ) | | | (0.14 | ) | | | (0.22 | ) | | | — | | | | (0.36 | ) | | | 10.63 | | | | (0.72 | ) | | | 12,637 | | | | 0.85 | (e) | | | 1.14 | (e) | | | 2.08 | (e) | | | 237 | |
Year ended 10/31/13 | | | 11.37 | | | | 0.21 | | | | (0.38 | ) | | | (0.17 | ) | | | (0.13 | ) | | | — | | | | — | | | | (0.13 | ) | | | 11.07 | | | | (1.43 | ) | | | 8,752 | | | | 0.85 | | | | 1.16 | | | | 1.90 | | | | 233 | |
Year ended 10/31/12(f) | | | 11.40 | | | | 0.02 | | | | (0.05 | ) | | | (0.03 | ) | | | — | | | | — | | | | — | | | | — | | | | 11.37 | | | | (0.26 | ) | | | 5,493 | | | | 0.85 | (g) | | | 1.10 | (g) | | | 1.71 | (g) | | | 119 | |
| (a) | Calculated using average shares outstanding. |
| (b) | Includes redemption fees added to shares of beneficial interest for Class A, Class B, Class C, Class Y and Class R5 shares which were less than $0.005 per share for fiscal years ended October 31, 2012 and prior. |
| (c) | Includes adjustments in accordance with accounting principles generally accepted in the United States of America and as such, the net asset value for financial reporting purposes and the returns based upon those net asset values may differ from the net asset value and returns for shareholder transactions. Does not include sales charges and is not annualized for periods less than one year, if applicable. |
| (d) | Portfolio turnover is calculated at the fund level and is not annualized for periods less than one year, if applicable. |
| (e) | Ratios are based on average daily net assets (000’s omitted) of $32,955, $2,339, $6,019, $2,973, $212 and $10,510 for Class A, Class B, Class C, Class Y, Class R5 and Class R6 shares, respectively. |
| (f) | Commencement date of September 24, 2012. |
25 Invesco International Total Return Fund
Report of Independent Registered Public Accounting Firm
To the Board of Trustees of AIM Investment Funds (Invesco Investment Funds)
and Shareholders of Invesco International Total Return Fund:
In our opinion, the accompanying statement of assets and liabilities, including the schedule of investments, and the related statements of operations and of changes in net assets and the financial highlights present fairly, in all material respects, the financial position of Invesco International Total Return Fund (one of the funds constituting AIM Investment Funds (Invesco Investment Funds), hereafter referred to as the “Fund”) at October 31, 2014, the results of its operations for the year then ended, the changes in its net assets for each of the two years in the period then ended and the financial highlights for each of the five years in the period then ended, in conformity with accounting principles generally accepted in the United States of America. These financial statements and financial highlights (hereafter referred to as “financial statements”) are the responsibility of the Fund’s management. Our responsibility is to express an opinion on these financial statements based on our audits. We conducted our audits of these financial statements in accordance with the standards of the Public Company Accounting Oversight Board (United States). Those standards require that we plan and perform the audit to obtain reasonable assurance about whether the financial statements are free of material misstatement. An audit includes examining, on a test basis, evidence supporting the amounts and disclosures in the financial statements, assessing the accounting principles used and significant estimates made by management, and evaluating the overall financial statement presentation. We believe that our audits, which included confirmation of securities at October 31, 2014 by correspondence with the custodian and brokers, and the application of alternative auditing procedures where confirmation of security purchases have not been received, provide a reasonable basis for our opinion.
PRICEWATERHOUSECOOPERS LLP
December 23, 2014
Houston, Texas
26 Invesco International Total Return Fund
Calculating your ongoing Fund expenses
Example
As a shareholder of the Fund, you incur two types of costs: (1) transaction costs, which may include sales charges (loads) on purchase payments or contingent deferred sales charges on redemptions, if any; and (2) ongoing costs, including management fees, distribution and/or service (12b-1) fees, and other Fund expenses. This example is intended to help you understand your ongoing costs (in dollars) of investing in the Fund and to compare these costs with ongoing costs of investing in other mutual funds. The example is based on an investment of $1,000 invested at the beginning of the period and held for the entire period May 1, 2014 through October 31, 2014.
Actual expenses
The table below provides information about actual account values and actual expenses. You may use the information in this table, together with the amount you invested, to estimate the expenses that you paid over the period. Simply divide your account value by $1,000 (for example, an $8,600 account value divided by $1,000 = 8.6), then multiply the result by the number in the table under the heading entitled “Actual Expenses Paid During Period” to estimate the expenses you paid on your account during this period.
Hypothetical example for comparison purposes
The table below also provides information about hypothetical account values and hypothetical expenses based on the Fund’s actual expense ratio and an assumed rate of return of 5% per year before expenses, which is not the Fund’s actual return.
The hypothetical account values and expenses may not be used to estimate the actual ending account balance or expenses you paid for the period. You may use this information to compare the ongoing costs of investing in the Fund and other funds. To do so, compare this 5% hypothetical example with the 5% hypothetical examples that appear in the shareholder reports of the other funds.
Please note that the expenses shown in the table are meant to highlight your ongoing costs only and do not reflect any transaction costs, such as sales charges (loads) on purchase payments or contingent deferred sales charges on redemptions, if any. Therefore, the hypothetical information is useful in comparing ongoing costs only, and will not help you determine the relative total costs of owning different funds. In addition, if these transaction costs were included, your costs would have been higher.
| | | | | | | | | | | | | | | | | | | | | | | | |
| Class | | Beginning
Account Value
(05/01/14) | | | ACTUAL | | | HYPOTHETICAL (5% annual return before expenses) | | | Annualized
Expense
Ratio | |
| | | Ending
Account Value
(10/31/14)1 | | | Expenses
Paid During
Period2 | | | Ending
Account Value
(10/31/14) | | | Expenses
Paid During
Period2 | | |
A | | $ | 1,000.00 | | | $ | 955.80 | | | $ | 5.42 | | | $ | 1,019.66 | | | $ | 5.60 | | | | 1.10 | % |
B | | | 1,000.00 | | | | 953.00 | | | | 9.11 | | | | 1,015.88 | | | | 9.40 | | | | 1.85 | |
C | | | 1,000.00 | | | | 952.90 | | | | 9.11 | | | | 1,015.88 | | | | 9.40 | | | | 1.85 | |
Y | | | 1,000.00 | | | | 957.90 | | | | 4.19 | | | | 1,020.92 | | | | 4.33 | | | | 0.85 | |
R5 | | | 1,000.00 | | | | 957.90 | | | | 4.19 | | | | 1,020.92 | | | | 4.33 | | | | 0.85 | |
| R6 | | | 1,000.00 | | | | 957.00 | | | | 4.19 | | | | 1,020.92 | | | | 4.33 | | | | 0.85 | |
| 1 | The actual ending account value is based on the actual total return of the Fund for the period May 1, 2014 through October 31, 2014, after actual expenses and will differ from the hypothetical ending account value which is based on the Fund’s expense ratio and a hypothetical annual return of 5% before expenses. |
| 2 | Expenses are equal to the Fund’s annualized expense ratio as indicated above multiplied by the average account value over the period, multiplied by 184/365 to reflect the most recent fiscal half year. |
27 Invesco International Total Return Fund
Approval of Investment Advisory and Sub-Advisory Contracts
The Board of Trustees (the Board) of AIM Investment Funds (Invesco Investment Funds) is required under the Investment Company Act of 1940, as amended, to approve annually the renewal of Invesco International Total Return Fund’s (the Fund) investment advisory agreements. During contract renewal meetings held on June 16-17, 2014, the Board as a whole, and the disinterested or “independent” Trustees, who comprise over 75% of the Board, voting separately, approved the continuance for the Fund of the Master Investment Advisory Agreement with Invesco Advisers, Inc. (Invesco Advisers and the investment advisory agreement) and the Master Intergroup Sub-Advisory Contract for Mutual Funds with Invesco Asset Management Deutschland GmbH, Invesco Asset Management Limited, Invesco Asset Management (Japan) Limited, Invesco Australia Limited, Invesco Hong Kong Limited, Invesco Senior Secured Management, Inc. and Invesco Canada Ltd. (collectively, the Affiliated Sub-Advisers and the sub-advisory contracts) for another year, effective July 1, 2014.
In evaluating the fairness and reasonableness of compensation under the Fund’s investment advisory agreement and sub-advisory contracts, the Board considered, among other things, the factors discussed below. The Board determined that continuation of the Fund’s investment advisory agreement and the sub-advisory contracts are in the best interest of the Fund and its shareholders and that the compensation payable to Invesco Advisers and the Affiliated Sub-Advisers under the agreements is fair and reasonable.
The Board’s Fund Evaluation Process
The Board’s Investments Committee has established three Sub-Committees, each of which is primarily responsible for overseeing the management of a number of the funds advised by Invesco Advisers (the Invesco Funds). The Sub-Committees meet throughout the year to review the performance of their assigned Invesco Funds, including reviewing materials prepared under the direction of the independent Senior Officer, an officer of the Invesco Funds who reports directly to the independent Trustees. Over the course of each year, the Sub-Committees meet with portfolio managers for their assigned Invesco Funds and other members of management to review the performance, investment objective(s), policies, strategies, limitations and investment risks of these funds. The Sub-Committees meet regularly and at designated contract renewal meetings each year to conduct a review of the performance, fees, expenses and other matters related to their assigned Invesco Funds. Each Sub-Committee recommends to the Investments Committee, which in turn recommends to the full Board, whether and on what terms to approve the continuance of each Invesco Fund’s
investment advisory agreement and sub-advisory contracts for another year.
During the contract renewal process, the Trustees receive comparative performance and fee data regarding the Invesco Funds prepared by Invesco Advisers and Lipper Inc. (Lipper), an independent provider of investment company data. The Trustees also receive an independent written evaluation from the Senior Officer. The Senior Officer’s evaluation is prepared as part of his responsibility to manage the process by which the Invesco Funds’ proposed management fees are negotiated during the annual contract renewal process to ensure they are negotiated in a manner that is at arms’ length and reasonable. In addition to meetings with Invesco Advisers and fund counsel, the independent Trustees also discuss the continuance of the investment advisory agreement and sub-advisory contracts in separate sessions with the Senior Officer and with independent legal counsel.
The Trustees recognized that the advisory fee rates for the Invesco Funds are, in many cases, the result of years of review and negotiation. The Trustees’ deliberations and conclusions in a particular year may be based in part on their deliberations and conclusions regarding these arrangements throughout the year and in prior years. The Trustees’ review and conclusions are based on the comprehensive consideration of all information presented to them and are not the result of any single determinative factor. Moreover, one Trustee may have weighed a particular piece of information or factor differently than another Trustee.
The discussion below serves as the Senior Officer’s independent written evaluation with respect to the Fund’s investment advisory agreement as well as a discussion of the material factors and related conclusions that formed the basis for the Board’s approval of the Fund’s investment advisory agreement and sub-advisory contracts. Unless otherwise stated, this information is current as of June 17, 2014, and may not reflect consideration of factors that became known to the Board after that date.
Factors and Conclusions and Summary of Independent Written Fee Evaluation
| A. | Nature, Extent and Quality of Services Provided by Invesco Advisers and the Affiliated Sub-Advisers |
The Board reviewed the advisory services provided to the Fund by Invesco Advisers under the Fund’s investment advisory agreement, the performance of Invesco Advisers in providing these services, and the credentials and experience of the officers and employees of Invesco Advisers who provide these services, including the Fund’s portfolio manager or managers, with whom the Sub-Committees met during the year. The Board’s review of the
qualifications of Invesco Advisers to provide advisory services included the Board’s consideration of Invesco Advisers’ investment process oversight, independent credit analysis and investment risk management. The Board also considered non-advisory services that Invesco Advisers and its affiliates provide to the Invesco Funds such as various back office support functions, equity and fixed income trading operations, internal audit, distribution and legal and compliance.
In determining whether to continue the Fund’s investment advisory agreement, the Board considered the benefits of reapproving an existing relationship and the greater uncertainty that may be associated with entering into a new relationship. The Board concluded that the nature, extent and quality of the services provided to the Fund by Invesco Advisers are appropriate and satisfactory and consistent with the terms of the Fund’s investment advisory agreement.
The Board reviewed the services that may be provided by the Affiliated Sub-Advisers under the sub-advisory contracts and the credentials and experience of the officers and employees of the Affiliated Sub-Advisers who provide these services. The Board noted that the Affiliated Sub-Advisers have offices and personnel that are located in financial centers around the world. As a result, the Affiliated Sub-Advisers can provide research and investment analysis on the markets and economies of various countries in which the Fund may invest, make recommendations regarding securities and assist with security trades. The Board concluded that the sub-advisory contracts benefit the Fund and its shareholders by permitting Invesco Advisers to use the resources and talents of the Affiliated Sub-Advisers in managing the Fund. The Board concluded that the nature, extent and quality of the services that may be provided by the Affiliated Sub-Advisers are appropriate and satisfactory and consistent with the terms of the Fund’s sub-advisory contracts.
The Board considered Fund performance as a relevant factor in considering whether to approve the investment advisory agreement as well as the sub-advisory contracts for the Fund, as Invesco Asset Management Limited currently manages assets of the Fund.
The Board compared the Fund’s performance during the past one, three and five calendar years to the performance of funds in the Lipper performance universe and against the Lipper International Income Funds Index. The Board noted that performance of Class A shares of the Fund was in the second quintile of its performance universe for the one and three year periods and the third quintile for the five year period (the first quintile being the best performing funds and the fifth quintile being the worst performing funds). The Board noted that
28 Invesco International Total Return Fund
performance of Class A shares of the Fund was above the performance of the Index for the one and three year periods and below the Index for the five year period. The Trustees also reviewed more recent Fund performance and this review did not change their conclusions.
| C. | Advisory and Sub-Advisory Fees |
The Board compared the Fund’s contractual management fee rate to the contractual management fee rates of funds in the Fund’s Lipper expense group at a common asset level. The Board noted that the contractual management fee rate for Class A shares of the Fund was below the median contractual management fee rate of funds in its expense group. The Board noted that the term “contractual management fee” may include both advisory and certain administrative services fees, but that Lipper does not provide information on a fund by fund basis as to what is included. The Board noted that Invesco Advisers does not charge the Invesco Funds for the administrative services included in the term as defined by Lipper. The Board also reviewed the methodology used by Lipper in providing expense group information, which includes using each fund’s contractual management fee schedule (including any applicable breakpoints) as reported in the most recent prospectus or statement of additional information for each fund in the expense group.
The Board noted that Invesco Advisers has contractually agreed to waive fees and/or limit expenses of the Fund through at least February 28, 2015 in an amount necessary to limit total annual operating expenses to a specified percentage of average daily net assets for each class of the Fund.
The Board noted that Invesco Advisers and the Affiliated Sub-Advisers do not manage other mutual funds or client accounts using an investment process substantially similar to the investment process used for the Fund.
The Board also considered the services that may be provided by the Affiliated Sub-Advisers pursuant to the sub-advisory contracts, as well as the fees payable by Invesco Advisers to the Affiliated Sub-Advisers pursuant to the sub-advisory contracts. The Board noted that Invesco Advisers retains overall responsibility for, and provides services to, sub-advised Invesco Funds, including oversight of the Affiliated Sub-Advisers as well as the additional services described herein other than day-to-day portfolio management. The Board also noted that the sub-advisory fees are not paid directly by the Fund, but rather, are payable by Invesco Advisers to the Affiliated Sub-Advisers.
| D. | Economies of Scale and Breakpoints |
The Board considered the extent to which there are economies of scale in the provision of advisory services to the Fund. The Board also considered whether the Fund benefits from economies of scale through contractual breakpoints in the Fund’s advisory fee schedule and was assisted in this review by a report from the Senior Officer. The Board also noted that the Fund shares directly in economies of scale
through lower fees charged by third party service providers based on the combined size of the Invesco Funds and other clients advised by Invesco Advisers
| E. | Profitability and Financial Resources |
The Board reviewed information from Invesco Advisers concerning the costs of the advisory and other services that Invesco Advisers and its affiliates provide to the Fund and the profitability of Invesco Advisers and its affiliates in providing these services for the year ended December 31, 2013. The Board received information from Invesco Advisers about the methodology used to prepare the profitability information. The Board considered the profitability of Invesco Advisers in managing the Fund and the Invesco Funds. The Board noted that Invesco Advisers continues to operate at a net profit from services Invesco Advisers and its subsidiaries provide to the Invesco Funds. The Board noted that Invesco Advisers and its subsidiaries did not make a profit from managing the Fund as a result of fee and expense waivers. The Board received and accepted information from Invesco Advisers demonstrating that Invesco Advisers and each Affiliated Sub-Adviser are financially sound and have the resources necessary to perform their obligations under the investment advisory agreement and sub-advisory contracts.
| F. | Collateral Benefits to Invesco Advisers and its Affiliates |
The Board considered various other benefits received by Invesco Advisers and its affiliates from the relationship with the Fund, including the fees received for their provision of transfer agency and distribution services to the Fund. The Board considered comparative information regarding fees charged for these services, including information provided by Lipper and other independent sources. The Board considered the performance of Invesco Advisers and its affiliates in providing these services and the organizational structure employed to provide these services. The Board also considered that these services are provided to the Fund pursuant to written contracts that are reviewed and approved on an annual basis by the Board; that the services are required for the operation of the Fund; that Invesco Advisers and its affiliates can provide services, the nature and quality of which are at least equal to those provided by others offering the same or similar services; and that the fees for such services are fair and reasonable in light of the usual and customary charges by others for services of the same nature and quality.
The Board considered the benefits realized by Invesco Advisers and the Affiliated Sub-Advisers as a result of portfolio brokerage transactions executed through “soft dollar” arrangements. Invesco Advisers noted that the Fund does not execute brokerage transactions through “soft dollar” arrangements to any significant degree.
The Board considered that the Fund’s uninvested cash and cash collateral from any securities lending arrangements may be invested in money market funds advised by
Invesco Advisers pursuant to procedures approved by the Board. The Board noted that Invesco Advisers receives advisory fees from these affiliated money market funds attributable to such investments, although Invesco Advisers has contractually agreed to waive through varying periods the advisory fees payable by the Invesco Funds with respect to investments in the affiliated money market funds. The waiver is in an amount equal to 100% of the net advisory fee Invesco Advisers receives from the affiliated money market funds with respect to the Fund’s investment in the affiliated money market funds of uninvested cash, but not cash collateral. The Board concluded that the amount of advisory fees received by Invesco Advisors from the Fund’s investment of uninvested cash and cash collateral from any securities lending arrangements in the affiliated money market funds are fair and reasonable.
29 Invesco International Total Return Fund
Tax Information
Form 1099-DIV, Form 1042-S and other year–end tax information provide shareholders with actual calendar year amounts that should be included in their tax returns. Shareholders should consult their tax advisors.
The following distribution information is being provided as required by the Internal Revenue Code or to meet a specific state’s requirement.
The Fund designates the following amounts or, if subsequently determined to be different, the maximum amount allowable for its fiscal year ended October 31, 2014:
| | | | |
Federal and State Income Tax | |
Long-Term Capital Gain Distributions | | $ | 793,702 | |
Qualified Dividend Income* | | | 0 | % |
Corporate Dividends Received Deduction* | | | 0 | % |
U.S. Treasury Obligations* | | | 0 | % |
| | * | The above percentages are based on ordinary income dividends paid to shareholders during the Fund’s fiscal year. |
| | | | |
Non-Resident Alien Shareholders | |
Qualified Short-Term Gains | | $ | 309,256 | |
30 Invesco International Total Return Fund
Trustees and Officers
The address of each trustee and officer is AIM Investment Funds (Invesco Investment Funds) (the “Trust”), 11 Greenway Plaza, Suite 1000, Houston, Texas 77046-1173. The trustees serve for the life of the Trust, subject to their earlier death, incapacitation, resignation, retirement or removal as more specifically provided in the Trust’s organizational documents. Each officer serves for a one year term or until their successors are elected and qualified. Column two below includes length of time served with predecessor entities, if any.
| | | | | | | | |
Name, Year of Birth and Position(s) Held with the Trust | | Trustee and/
or Officer Since | | Principal Occupation(s) During Past 5 Years | | Number of Funds in Fund Complex Overseen by Trustee | | Other Directorship(s) Held by Trustee During Past 5 Years |
| Interested Persons | | | | | | | | |
| Martin L. Flanagan1 — 1960 Trustee | | 2007 | | Executive Director, Chief Executive Officer and President, Invesco Ltd. (ultimate parent of Invesco and a global investment management firm); Advisor to the Board, Invesco Advisers, Inc. (formerly known as Invesco Institutional (N.A.), Inc.); Trustee, The Invesco Funds; Vice Chair, Investment Company Institute; and Member of Executive Board, SMU Cox School of Business Formerly: Chairman and Chief Executive Officer, Invesco Advisers, Inc. (registered investment adviser); Director, Chairman, Chief Executive Officer and President, IVZ Inc. (holding company), INVESCO Group Services, Inc. (service provider) and Invesco North American Holdings, Inc. (holding company); Director, Chief Executive Officer and President, Invesco Holding Company Limited (parent of Invesco and a global investment management firm); Director, Invesco Ltd.; Chairman, Investment Company Institute and President, Co-Chief Executive Officer, Co-President, Chief Operating Officer and Chief Financial Officer, Franklin Resources, Inc. (global investment management organization). | | 144 | | None |
Philip A. Taylor2 — 1954 Trustee, President and Principal Executive Officer | | 2006 | | Head of North American Retail and Senior Managing Director, Invesco Ltd.; Director, Co-Chairman, Co-President and Co-Chief Executive Officer, Invesco Advisers, Inc. (formerly known as Invesco Institutional (N.A.), Inc.) (registered investment adviser); Director, Chairman, Chief Executive Officer and President, Invesco Management Group, Inc. (formerly known as Invesco Aim Management Group, Inc.) (financial services holding company); Director and President, INVESCO Funds Group, Inc. (registered investment adviser and registered transfer agent); Director and Chairman, Invesco Investment Services, Inc. (formerly known as Invesco Aim Investment Services, Inc.) (registered transfer agent) and IVZ Distributors, Inc. (formerly known as INVESCO Distributors, Inc.) (registered broker dealer); Director, President and Chairman, Invesco Inc. (holding company) and Invesco Canada Holdings Inc. (holding company); Chief Executive Officer, Invesco Corporate Class Inc. (corporate mutual fund company) and Invesco Canada Fund Inc. (corporate mutual fund company); Director, Chairman and Chief Executive Officer, Invesco Canada Ltd. (formerly known as Invesco Trimark Ltd./Invesco Trimark Ltèe) (registered investment adviser and registered transfer agent); Trustee, President and Principal Executive Officer, The Invesco Funds (other than AIM Treasurer’s Series Trust (Invesco Treasurer’s Series Trust) and Short-Term Investments Trust); Trustee and Executive Vice President, The Invesco Funds (AIM Treasurer’s Series Trust (Invesco Treasurer’s Series Trust) and Short-Term Investments Trust only); Director, Invesco Investment Advisers LLC (formerly known as Van Kampen Asset Management); Director, Chief Executive Officer and President, Van Kampen Exchange Corp. Formerly: Director and Chairman, Van Kampen Investor Services Inc.; Director, Chief Executive Officer and President, 1371 Preferred Inc. (holding company) and Van Kampen Investments Inc.; Director and President, AIM GP Canada Inc. (general partner for limited partnerships) and Van Kampen Advisors, Inc.; Director and Chief Executive Officer, Invesco Trimark Dealer Inc. (registered broker dealer); Director, Invesco Distributors, Inc. (formerly known as Invesco Aim Distributors, Inc.) (registered broker dealer); Manager, Invesco PowerShares Capital Management LLC; Director, Chief Executive Officer and President, Invesco Advisers, Inc.; Director, Chairman, Chief Executive Officer and President, Invesco Aim Capital Management, Inc.; President, Invesco Trimark Dealer Inc. and Invesco Trimark Ltd./Invesco Trimark Ltèe; Director and President, AIM Trimark Corporate Class Inc. and AIM Trimark Canada Fund Inc.; Senior Managing Director, Invesco Holding Company Limited; Director and Chairman, Fund Management Company (former registered broker dealer); President and Principal Executive Officer, The Invesco Funds (AIM Treasurer’s Series Trust (Invesco Treasurer’s Series Trust), and Short-Term Investments Trust only); President, AIM Trimark Global Fund Inc. and AIM Trimark Canada Fund Inc. | | 144 | | None |
Wayne W. Whalen3 — 1939 Trustee | | 2010 | | Of Counsel, and prior to 2010, partner in the law firm of Skadden, Arps, Slate, Meagher & Flom LLP, legal counsel to certain funds in the Fund Complex | | 144 | | Director of the Mutual fund Directors Forum, a nonprofit membership organization for investment directors; Chairman and Director of the Abraham Lincoln Presidential Library Foundation; and Director of the Stevenson Center for Democracy |
| 1 | Mr. Flanagan is considered an interested person (within the meaning of Section 2(a)(19) of the 1940 Act) of the Trust because he is an officer of the Adviser to the Trust, and an officer and a director of Invesco Ltd., ultimate parent of the Adviser. |
| 2 | Mr. Taylor is considered an interested person (within the meaning of Section 2(a)(19) of the 1940 Act) of the Trust because he is an officer and a director of the Adviser. |
| 3 | Mr. Whalen is retiring effective December 31, 2014. He has been deemed to be an interested person of the Trust because of his prior service as counsel to the predecessor funds of certain Invesco open-end funds and his affiliation with the law firm that served as counsel to such predecessor funds and the Invesco closed-end funds. |
T-1 Invesco International Total Return Fund
Trustees and Officers—(continued)
| | | | | | | | |
Name, Year of Birth and Position(s) Held with the Trust | | Trustee and/
or Officer Since | | Principal Occupation(s) During Past 5 Years | | Number of Funds in Fund Complex Overseen by Trustee | | Other Directorship(s) Held by Trustee During Past 5 Years |
| Independent Trustees | | | | | | | | |
Bruce L. Crockett — 1944 Trustee and Chair | | 2001 | | Chairman, Crockett Technologies Associates (technology consulting company) Formerly: Director, Captaris (unified messaging provider); Director, President and Chief Executive Officer, COMSAT Corporation; Chairman, Board of Governors of INTELSAT (international communications company); ACE Limited (insurance company); and Investment Company Institute | | 144 | | ALPS (Attorneys Liability Protection Society) (insurance company) |
David C. Arch — 1945 Trustee | | 2010 | | Chairman of Blistex Inc., a consumer health care products manufacturer | | 144 | | Board member of the Illinois Manufacturers’ Association; Member of the Board of Visitors, Institute for the Humanities, University of Michigan; Member of the Audit Committee of the Edward-Elmhurst Hospital |
Frank S. Bayley — 1939 Trustee | | 1987 | | Retired. Formerly: Director, Badgley Funds Inc. (registered investment company) (2 portfolios) and General Partner and Of Counsel, law firm of Baker & McKenzie, LLP | | 144 | | Director and Chairman, C.D. Stimson Company (a real estate investment company); Trustee, The Curtis Institute of Music |
James T. Bunch — 1942 Trustee | | 2003 | | Managing Member, Grumman Hill Group LLC (family office private equity investments) Formerly: Founder, Green Manning & Bunch Ltd. (investment banking firm) (1988-2010); Executive Committee, United States Golf Association; and Director, Policy Studies, Inc. and Van Gilder Insurance Corporation | | 144 | | Chairman, Board of Governors, Western Golf Association; Chairman, Evans Scholars Foundation; and Director, Denver Film Society |
Rodney F. Dammeyer — 1940 Trustee | | 2010 | | Chairman of CAC,LLC, (private company offering capital investment and management advisory services) Formerly: Prior to 2001, Managing Partner at Equity Group Corporate Investments; Prior to 1995, Chief Executive Officer of Itel Corporation (formerly Anixter International); Prior to 1985, experience includes Senior Vice President and Chief Financial Officer of Household International, Inc., Executive Vice President and Chief Financial Officer of Northwest Industries, Inc. and Partner of Arthur Andersen & Co.; From 1987 to 2010, Director/Trustee of investment companies in the Van Kampen Funds complex | | 144 | | Director of Quidel Corporation and Stericycle, Inc. |
Albert R. Dowden — 1941 Trustee | | 2001 | | Director of a number of public and private business corporations, including the Boss Group, Ltd. (private investment and management); Nature’s Sunshine Products, Inc. and Reich & Tang Funds (5 portfolios) (registered investment company) Formerly: Director, Homeowners of America Holding Corporation/Homeowners of America Insurance Company (property casualty company); Director, Continental Energy Services, LLC (oil and gas pipeline service); Director, CompuDyne Corporation (provider of product and services to the public security market) and Director, Annuity and Life Re (Holdings), Ltd. (reinsurance company); Director, President and Chief Executive Officer, Volvo Group North America, Inc.; Senior Vice President, AB Volvo; Director of various public and private corporations; Chairman, DHJ Media, Inc.; Director, Magellan Insurance Company; and Director, The Hertz Corporation, Genmar Corporation (boat manufacturer), National Media Corporation; Advisory Board of Rotary Power International (designer, manufacturer, and seller of rotary power engines); and Chairman, Cortland Trust, Inc. (registered investment company) | | 144 | | Director of: Nature’s Sunshine Products, Inc., Reich & Tang Funds, Homeowners of America Holding Corporation/ Homeowners of America Insurance Company, the Boss Group |
Jack M. Fields — 1952 Trustee | | 2001 | | Chief Executive Officer, Twenty First Century Group, Inc. (government affairs company); Owner and Chief Executive Officer, Dos Angeles Ranch, L.P. (cattle, hunting, corporate entertainment); and Discovery Global Education Fund (non-profit) Formerly: Chief Executive Officer, Texana Timber LP (sustainable forestry company); Director of Cross Timbers Quail Research Ranch (non-profit); and member of the U.S. House of Representatives | | 144 | | Insperity, Inc. (formerly known as Administaff) |
Prema Mathai-Davis — 1950 Trustee | | 2001 | | Retired. Formerly: Chief Executive Officer, YWCA of the U.S.A. | | 144 | | None |
Larry Soll — 1942 Trustee | | 2003 | | Retired. Formerly: Chairman, Chief Executive Officer and President, Synergen Corp. (a biotechnology company) | | 144 | | None |
Hugo F. Sonnenschein — 1940 Trustee | | 2010 | | President Emeritus and Honorary Trustee of the University of Chicago and the Adam Smith Distinguished Service Professor in the Department of Economics at the University of Chicago. Prior to 2000, President of the University of Chicago | | 144 | | Trustee of the University of Rochester and a member of its investment committee; Member of the National Academy of Sciences and the American Philosophical Society; Fellow of the American Academy of Arts and Sciences |
T-2 Invesco International Total Return Fund
Trustees and Officers—(continued)
| | | | | | | | |
Name, Year of Birth and Position(s) Held with the Trust | | Trustee and/
or Officer Since | | Principal Occupation(s) During Past 5 Years | | Number of Funds in Fund Complex Overseen by Trustee | | Other Directorship(s) Held by Trustee During Past 5 Years |
| Independent Trustees—(continued) |
Raymond Stickel, Jr. — 1944 Trustee | | 2005 | | Retired. Formerly: Director, Mainstay VP Series Funds, Inc. (25 portfolios) and Partner, Deloitte & Touche | | 144 | | None |
Suzanne H. Woolsey — 1941 Trustee | | 2014 | | Chief Executive Officer of Woolsey Partners LLC | | 144 | | Emeritus Chair of the Board of Trustees of the Institute for Defense Analyses; Trustee of Colorado College; Trustee of California Institute of Technology; Prior to 2014, Director of Fluor Corp.; Prior to 2010, Trustee of the German Marshall Fund of the United States; Prior to 2010 Trustee of the Rocky Mountain Institute |
| Other Officers | | | | | | | | |
Russell C. Burk — 1958 Senior Vice President and Senior Officer | | 2005 | | Senior Vice President and Senior Officer, The Invesco Funds | | N/A | | N/A |
John M. Zerr — 1962 Senior Vice President, Chief Legal Officer and Secretary | | 2006 | | Director, Senior Vice President, Secretary and General Counsel, Invesco Management Group, Inc. (formerly known as Invesco Aim Management Group, Inc.) and Van Kampen Exchange Corp.; Senior Vice President, Invesco Advisers, Inc. (formerly known as Invesco Institutional (N.A.), Inc.) (registered investment adviser); Senior Vice President and Secretary, Invesco Distributors, Inc. (formerly known as Invesco Aim Distributors, Inc.); Director, Vice President and Secretary, Invesco Investment Services, Inc. (formerly known as Invesco Aim Investment Services, Inc.) and IVZ Distributors, Inc. (formerly known as INVESCO Distributors, Inc.); Director and Vice President, INVESCO Funds Group, Inc.; Senior Vice President, Chief Legal Officer and Secretary, The Invesco Funds; Manager, Invesco PowerShares Capital Management LLC; Director, Secretary and General Counsel, Invesco Investment Advisers LLC (formerly known as Van Kampen Asset Management); Secretary and General Counsel, Invesco Capital Markets, Inc. (formerly known as Van Kampen Funds Inc.) and Chief Legal Officer, PowerShares Exchange-Traded Fund Trust, PowerShares Exchange-Traded Fund Trust II, PowerShares India Exchange-Traded Fund Trust, PowerShares Actively Managed Exchange-Traded Fund Trust; and PowerShares Actively Managed Exchange-Traded Commodity Fund Trust Formerly: Director and Vice President, Van Kampen Advisors Inc.; Director, Vice President, Secretary and General Counsel, Van Kampen Investor Services Inc.; Director, Invesco Distributors, Inc. (formerly known as Invesco Aim Distributors, Inc.); Director, Senior Vice President, General Counsel and Secretary, Invesco Aim Advisers, Inc. and Van Kampen Investments Inc.; Director, Vice President and Secretary, Fund Management Company; Director, Senior Vice President, Secretary, General Counsel and Vice President, Invesco Aim Capital Management, Inc.; Chief Operating Officer and General Counsel, Liberty Ridge Capital, Inc. (an investment adviser); Vice President and Secretary, PBHG Funds (an investment company) and PBHG Insurance Series Fund (an investment company); Chief Operating Officer, General Counsel and Secretary, Old Mutual Investment Partners (a broker-dealer); General Counsel and Secretary, Old Mutual Fund Services (an administrator) and Old Mutual Shareholder Services (a shareholder servicing center); Executive Vice President, General Counsel and Secretary, Old Mutual Capital, Inc. (an investment adviser); and Vice President and Secretary, Old Mutual Advisors Funds (an investment company) | | N/A | | N/A |
Sheri Morris — 1964 Vice President, Treasurer and Principal Financial Officer | | 1999 | | Vice President, Treasurer and Principal Financial Officer, The Invesco Funds; Vice President, Invesco Advisers, Inc. (formerly known as Invesco Institutional (N.A.), Inc.) (registered investment adviser); and Vice President, PowerShares Exchange-Traded Fund Trust, PowerShares Exchange-Traded Fund Trust II, PowerShares India Exchange-Traded Fund Trust, PowerShares Actively Managed Exchange-Traded Fund Trust, and PowerShares Actively Managed Exchange-Traded Commodity Fund Trust Formerly: Vice President, Invesco Aim Advisers, Inc., Invesco Aim Capital Management, Inc. and Invesco Aim Private Asset Management, Inc.; Assistant Vice President and Assistant Treasurer, The Invesco Funds and Assistant Vice President, Invesco Advisers, Inc., Invesco Aim Capital Management, Inc. and Invesco Aim Private Asset Management, Inc.; and Treasurer, PowerShares Exchange-Traded Fund Trust, PowerShares Exchange-Traded Fund Trust II, PowerShares India Exchange-Traded Fund Trust and PowerShares Actively Managed Exchange-Traded Fund Trust | | N/A | | N/A |
T-3 Invesco International Total Return Fund
Trustees and Officers—(continued)
| | | | | | | | |
Name, Year of Birth and Position(s) Held with the Trust | | Trustee and/
or Officer Since | | Principal Occupation(s) During Past 5 Years | | Number of Funds in Fund Complex Overseen by Trustee | | Other Directorship(s) Held by Trustee During Past 5 Years |
| Other Officers—(continued) | | | | | | | | |
Karen Dunn Kelley — 1960 Vice President | | 2004 | | Senior Managing Director, Investments; Director, Co-President, Co-Chief Executive Officer, and Co-Chairman, Invesco Advisers, Inc. (formerly known as Invesco Institutional (N.A.), Inc.) (registered investment adviser); Chairman, Invesco Senior Secured Management, Inc.; Senior Vice President, Invesco Management Group, Inc. (formerly known as Invesco Aim Management Group, Inc.); Executive Vice President, Invesco Distributors, Inc. (formerly known as Invesco Aim Distributors, Inc.); Director, Invesco Mortgage Capital Inc. and Invesco Management Company Limited; Director and President, INVESCO Asset Management (Bermuda) Ltd., Vice President, The Invesco Funds (other than AIM Treasurer’s Series Trust (Invesco Treasurer’s Series Trust) and Short-Term Investments Trust); and President and Principal Executive Officer, The Invesco Funds (AIM Treasurer’s Series Trust (Invesco Treasurer’s Series Trust) and Short-Term Investments Trust only) Formerly: Director, INVESCO Global Asset Management Limited and INVESCO Management S.A.; Senior Vice President, Van Kampen Investments Inc. and Invesco Advisers, Inc. (formerly known as Invesco Institutional (N.A.), Inc.) (registered investment adviser); Vice President, Invesco Advisers, Inc. (formerly known as Invesco Institutional (N.A.), Inc.); Director of Cash Management and Senior Vice President, Invesco Advisers, Inc. and Invesco Aim Capital Management, Inc.; Director and President, Fund Management Company; Chief Cash Management Officer, Director of Cash Management, Senior Vice President, and Managing Director, Invesco Aim Capital Management, Inc.; Director of Cash Management, Senior Vice President, and Vice President, Invesco Advisers, Inc. and The Invesco Funds (AIM Treasurer’s Series Trust (Invesco Treasurer’s Series Trust), and Short-Term Investments Trust only) | | N/A | | N/A |
Crissie M. Wisdom — 1969 Anti-Money Laundering Compliance Officer | | 2013 | | Anti-Money Laundering Compliance Officer, Invesco Advisers, Inc. (formerly known as Invesco Institutional (N.A.), Inc.) (registered investment adviser), Invesco Capital Markets, Inc. (formerly known as Van Kampen Funds Inc.), Invesco Distributors, Inc., Invesco Investment Services, Inc., Invesco Management Group, Inc., Van Kampen Exchange Corp., The Invesco Funds, and PowerShares Exchange-Traded Fund Trust, PowerShares Exchange-Traded Fund Trust II, PowerShares India Exchange-Traded Fund Trust, PowerShares Actively Managed Exchange-Traded Fund Trust and PowerShares Actively Managed Exchange-Traded Commodity Fund Trust; and Fraud Prevention Manager and Controls and Risk Analysis Manager for Invesco Investment Services, Inc. | | N/A | | N/A |
Todd L. Spillane — 1958 Chief Compliance Officer | | 2006 | | Senior Vice President, Invesco Management Group, Inc. (formerly known as Invesco Aim Management Group, Inc.) and Van Kampen Exchange Corp.; Senior Vice President and Chief Compliance Officer, Invesco Advisers, Inc. (registered investment adviser) (formerly known as Invesco Institutional (N.A.), Inc.); Chief Compliance Officer, The Invesco Funds; Vice President, Invesco Distributors, Inc. (formerly known as Invesco Aim Distributors, Inc.) and Invesco Investment Services, Inc. (formerly known as Invesco Aim Investment Services, Inc.) Formerly: Chief Compliance Officer, Invesco Funds (Chicago); Senior Vice President, Van Kampen Investments Inc.; Senior Vice President and Chief Compliance Officer, Invesco Aim Advisers, Inc. and Invesco Aim Capital Management, Inc.; Chief Compliance Officer, INVESCO Private Capital Investments, Inc. (holding company), Invesco Private Capital, Inc. (registered investment adviser), Invesco Global Asset Management (N.A.), Inc., Invesco Senior Secured Management, Inc. (registered investment adviser), Van Kampen Investor Services Inc., PowerShares Exchange-Traded Fund Trust, PowerShares Exchange-Traded Fund Trust II, PowerShares India Exchange-Traded Fund Trust and PowerShares Actively Managed Exchange-Traded Fund Trust; and Vice President, Invesco Aim Capital Management, Inc. and Fund Management Company | | N/A | | N/A |
The Statement of Additional Information of the Trust includes additional information about the Fund’s Trustees and is available upon request, without charge, by calling 1.800.959.4246. Please refer to the Fund’s prospectus for information on the Fund’s sub-advisers.
| | | | | | |
Office of the Fund 11 Greenway Plaza, Suite 1000 Houston, TX 77046-1173 | | Investment Adviser Invesco Advisers, Inc. 1555 Peachtree Street, N.E. Atlanta, GA 30309 | | Distributor Invesco Distributors, Inc. 11 Greenway Plaza, Suite 1000 Houston, TX 77046-1173 | | Auditors PricewaterhouseCoopers LLP 1000 Louisiana Street, Suite 5800 Houston, TX 77002-5678 |
| | | |
| | | | | | |
Counsel to the Fund Stradley Ronon Stevens & Young, LLP 2005 Market Street, Suite 2600 Philadelphia, PA 19103-7018 | | Counsel to the Independent Trustees Goodwin Procter LLP 901 New York Avenue, N.W. Washington, D.C. 20001 | | Transfer Agent Invesco Investment Services, Inc. 11 Greenway Plaza, Suite 1000 Houston, TX 77046-1173 | | Custodian State Street Bank and Trust Company 225 Franklin Street Boston, MA 02110-2801 |
T-4 Invesco International Total Return Fund

Invesco mailing information
Send general correspondence to Invesco Investment Services, Inc., P.O. Box 219078, Kansas City, MO 64121-9078.
Important notice regarding delivery of security holder documents
To reduce Fund expenses, only one copy of most shareholder documents may be mailed to shareholders with multiple accounts at the same address (Householding). Mailing of your shareholder documents may be householded indefinitely unless you instruct us otherwise. If you do not want the mailing of these documents to be combined with those for other members of your household, please contact Invesco Investment Services, Inc. at 800 959 4246 or contact your financial institution. We will begin sending you individual copies for each account within 30 days after receiving your request.
Fund holdings and proxy voting information
The Fund provides a complete list of its holdings four times in each fiscal year, at the quarter ends. For the second and fourth quarters, the lists appear in the Fund’s semiannual and annual reports to shareholders. For the first and third quarters, the Fund files the lists with the Securities and Exchange Commission (SEC) on Form N-Q. The most recent list of portfolio holdings is available at invesco.com/completeqtrholdings. Shareholders can also look up the Fund’s Forms N-Q on the SEC website at sec.gov. Copies of the Fund’s Forms N-Q may be reviewed and copied at the SEC Public Reference Room in Washington, D.C. You can obtain information on the operation of the Public Reference Room, including information about duplicating fee charges, by calling 202 551 8090 or 800 732 0330, or by electronic request at the following email address: publicinfo@sec.gov. The SEC file numbers for the Fund are shown below.
A description of the policies and procedures that the Fund uses to determine how to vote proxies relating to portfolio securities is available without charge, upon request, from our Client Services department at 800 959 4246 or at invesco.com/proxyguidelines. The information is also available on the SEC website, sec.gov.
| | |
Information regarding how the Fund voted proxies related to its portfolio securities during the most recent 12-month period ended June 30 is available at invesco.com/proxysearch. The information is also available on the SEC website, sec.gov. Invesco Advisers, Inc. is an investment adviser; it provides investment advisory services to individual and institutional clients and does not sell securities. Invesco Distributors, Inc. is the US distributor for Invesco Ltd.’s retail mutual funds, exchange-traded funds and institutional money market funds. Both are wholly owned, indirect subsidiaries of Invesco Ltd. | |  |
SEC file numbers: 811-05426 and 033-19338 ITR-AR-1 Invesco Distributors, Inc.

Letters to Shareholders
| | | | |

Philip Taylor | | | | Dear Shareholders: This annual report includes information about your Fund, including performance data and a complete list of its investments as of the close of the reporting period. Inside, your Fund’s portfolio managers discuss how they managed your Fund and the factors that affected its performance during the reporting period. I hope you find this report of interest. During the reporting period covered by this report, the US economy showed signs of continued improvement. After contracting in the first quarter of 2014, the economy expanded strongly in the second quarter and unemployment trended lower. Much of the credit for this improvement goes to the US Federal Reserve (the Fed), which undertook an extraordinary asset purchase program following the global financial crisis. The Fed’s goal was to jumpstart the economy by encouraging banks to lend more, businesses to hire more and consumers to spend more. Signs of a stronger US economy prompted the Fed to reduce, or “taper,” its |
asset purchase program. Despite this, interest rates remained near historical low levels due largely to heavy investor demand for bonds. While signs of economic improvement were evident in the US, European economies showed signs of weakening. That, together with geopolitical uncertainty and worries about the first diagnosed cases of Ebola outside of Africa, caused increased volatility in US and European equities.
Extended periods of market strength can lull investors into complacency – just as prolonged periods of market weakness or volatility can discourage investors from initiating long-term investment plans. That’s why Invesco has always encouraged investors to work with a professional financial adviser who can stress the importance of starting to save and invest early and the importance of adhering to a disciplined investment plan – when times are good and when they’re uncertain. A financial adviser who knows your unique financial situation, investment goals and risk tolerance can be an invaluable partner as you seek to achieve your financial goals. He or she can offer a long-term perspective when markets are volatile and time-tested advice and guidance when your financial situation or investment goals change.
Timely information when and where you want it
Invesco’s efforts to help investors achieve their financial objectives include providing individual investors and financial professionals with timely information about the markets, the economy and investing – whenever and wherever they want it.
Our website, invesco.com/us, offers a wide range of market insights and investment perspectives. On the website, you’ll find detailed information about our funds, including prices, performance, holdings and portfolio manager commentaries. You can access information about your individual Invesco account whenever it’s convenient for you; just complete a simple, secure online registration. Use the “Log In” box on our home page to get started.
Invesco’s mobile app for iPad® (available free from the App StoreSM) allows you to obtain the same detailed information about your Fund and the same investment insights from our investment leaders, market strategists, economists and retirement experts on the go. You also can watch portfolio manager videos and have instant access to Invesco news and updates wherever you may be.
In addition to the resources accessible on our website and through our mobile app, you can obtain timely updates to help you stay informed about the markets, the economy and investing by connecting with Invesco on Twitter, LinkedIn or Facebook. You can access our blog at blog.invesco.us.com. Our goal is to provide you the information you want, when and where you want it.
Have questions?
For questions about your account, feel free to contact an Invesco client services representative at 800 959 4246. For Invesco-related questions or comments, please email me directly at phil@invesco.com.
All of us at Invesco look forward to serving your investment management needs for many years to come. Thank you for investing with us.
Sincerely,

Philip Taylor
Senior Managing Director, Invesco Ltd.
iPad is a trademark of Apple Inc., registered in the US and other countries. App Store is a service mark of Apple Inc. Invesco Distributors, Inc. is not affiliated with Apple Inc.
|
| 2 Invesco Long/Short Equity Fund |
| | | | |

Bruce Crockett | | | | Dear Fellow Shareholders: There are a variety of factors that can impact investment performance, many of which are uncontrollable by us as investors. These factors can include various economic trends and geopolitical developments. While the members of the Invesco Funds Board, which I chair, can’t dictate the performance of the Invesco funds, be assured that your Board works diligently throughout the year to focus on how your investments are managed. Our job is to represent you and your interests on a variety of fund management-related matters. We regularly monitor how the portfolio management teams of the Invesco funds are performing in light of ever-changing and often unpredictable economic and market conditions. We review the investment strategies and investment process employed by each fund’s management team as explained in the fund’s prospectus. Perhaps our most significant responsibility is conducting the annual review of the funds’ |
advisory and sub-advisory contracts with Invesco Advisers and its affiliates. This annual review, which is required by the Investment Company Act of 1940, focuses on the nature and quality of the services Invesco provides as the adviser to the Invesco funds and the reasonableness of the fees that it charges for those services. Each year, we spend months carefully reviewing information from Invesco that allows us to evaluate the quality of its services and the reasonableness of its fees. We also use information from a variety of independent sources, including materials provided by the independent senior officer of the Invesco funds, who reports directly to the independent trustees on the Board. Additionally, we meet with legal counsel and review performance and fee data prepared for us by Lipper Inc., an independent, third-party firm widely recognized as a leader in its field.
After a careful review, the members of the Invesco Funds Board approved the continuation of advisory and sub-advisory contracts with Invesco Advisers and its affiliates. Be assured that your Board will continue working on behalf of fund shareholders, keeping your needs and interests uppermost in our minds.
As always, please contact me at bruce@brucecrockett.com with any questions or concerns you may have. On behalf of the Board, we look forward to continuing to represent your interests and serving your needs.
Sincerely,

Bruce L. Crockett
Independent Chair
Invesco Funds Board of Trustees
|
| 3 Invesco Long/Short Equity Fund |
Management’s Discussion of Fund Performance
Performance summary
Invesco Long/Short Equity Fund incepted on December 19, 2013. From the Fund’s inception to the end of the reporting period, the Fund lagged the S&P 500 Index, its broad market benchmark. Stock selection added to total return in seven of 10 sectors, led by the health care, information technology (IT), consumer staples, financials, utilities and industrials sectors. Stock selection in the energy and consumer discretionary sectors detracted from Fund performance.
Additional performance information for your Fund appears later in this report.
Fund vs. Indexes
Cumulative total returns, 12/19/13 to 10/31/14, at net asset value (NAV). Performance shown does not include applicable contingent deferred sales charges (CDSC) or front-end sales charges, which would have reduced performance.
| | | | | |
| Class A Shares | | | | 10.00 | % |
| Class C Shares | | | | 9.30 | |
| Class R Shares | | | | 9.80 | |
| Class Y Shares | | | | 10.30 | |
| Class R5 Shares | | | | 10.30 | |
| Class R6 Shares | | | | 10.30 | |
| S&P 500 Index‚ (Broad Market Index) | | | | 13.43 | |
| Citi US T-Bill 3 Month Index‚ (Style-Specific Index) | | | | 0.03 | |
| Lipper Alternative Long/Short Equity Funds Indexn (Peer Group Index) | | | | 2.55 | |
Source(s): ‚FactSet Research Systems Inc.; nLipper Inc. | | | | | |
Market conditions and your Fund
The US economy remained “good but not great” during the reporting period, ended October 31, 2014. Slow but steady growth, helped by historically low interest rates, generally led US equity markets higher during the reporting period.
The reporting period began with renewed optimism after it became apparent that a two-week federal government shutdown had not derailed the economy. Evidence of economic improvement caused the US equity market to rally in late 2013 despite the announcement by the US Federal Reserve (the Fed) in
December that it would begin reducing the scope of its asset purchase program in early 2014.
The US stock market turned volatile in the first months of 2014 as investors began to worry that stocks may have risen too far, too fast. Unusually cold winter weather negatively affected consumers, and the US economy contracted in the first quarter before rebounding strongly in the second quarter. While corporate earnings were generally resilient throughout the reporting period, driven by strong profitability across many sectors, investors worried about political
developments in Ukraine and signs of economic sluggishness in China. Toward the end of the reporting period, a sharp drop in global oil prices, evidence of economic stagnation in Europe and concern about the first cases of Ebola in the US increased market volatility.
The Fund seeks to add value by capturing the performance spread between its long and short holdings and by dynamically changing its level of market exposure based on forecasted market risk.
Due to stock selection, the largest contributors to Fund performance for the reporting period were the IT, financials and consumer staples sectors. Within the IT sector, the Fund benefited from long positions in the semiconductor and computer/electronics industries that outperformed industry peers.
Within the financials sector, short positions in the Fund’s banking stocks added value as they lagged industry peers and delivered negative returns. Long positions in the real estate industry aided performance.
In the consumer staples sector, the Fund benefited mostly from long positions in the food, beverage and tobacco industries.
During the reporting period, stock selection in the energy sector detracted from performance. The Fund was hampered by its short positions in the oil, gas and consumable fuels industries, as these industries generated positive returns and the Fund held short positions in these industries.
|
Portfolio Composition By sector, based on total investments |
| | | | | | | | | | | | | | | | | | | | |
| | | Portfolio | | Equity Securities | | Total |
| | | Holdings | | Long1 | | Short2 | | Investments |
| | | | |
Information Technology | | | | 7.9 | % | | | | 5.8 | % | | | | 6.0 | % | | | | 19.7 | % |
Energy | | | | 4.2 | | | | | 7.6 | | | | | 3.9 | | | | | 15.7 | |
Consumer Discretionary | | | | 2.7 | | | | | 0.3 | | | | | 12.3 | | | | | 15.3 | |
Health Care | | | | 0.6 | | | | | 7.4 | | | | | 3.6 | | | | | 11.6 | |
Financials | | | | 3.9 | | | | | 4.9 | | | | | 2.8 | | | | | 11.6 | |
Industrials | | | | 3.8 | | | | | 3.8 | | | | | 3.0 | | | | | 10.6 | |
Materials | | | | 2.0 | | | | | 1.3 | | | | | 1.7 | | | | | 5.0 | |
Utilities | | | | 2.2 | | | | | 2.6 | | | | | – | | | | | 4.8 | |
Consumer Staples | | | | 1.7 | | | | | 1.1 | | | | | 0.9 | | | | | 3.7 | |
Telecommunication Services | | | | 0.5 | | | | | 0.1 | | | | | 0.5 | | | | | 1.1 | |
Money Market Funds Plus Other Assets Less Liabilities | | | | 0.9 | | | | | – | | | | | – | | | | | 0.9 | |
Total | | | | 30.4 | | | | | 34.9 | | | | | 34.7 | | | | | 100.0 | |
| 1 | Represents the value of the equity securities underlying the equity long portfolio swap with Morgan Stanley. |
| 2 | Represents the value of the equity securities underlying the equity short portfolio swap with Morgan Stanley. |
| | | | | |
| Top 10 Long Equity Holdings* |
| | | | | |
| |
| 1. Skyworks Solutions, Inc. | | | | 1.9 | % |
| 2. Electronic Arts Inc. | | | | 1.8 | |
| 3. NetApp, Inc. | | | | 1.8 | |
| 4. United States Steel Corp. | | | | 1.8 | |
5. Dr Pepper Snapple Group, Inc. | | | | 1.8 | |
| 6. F5 Networks, Inc. | | | | 1.7 | |
| 7. Best Buy Co., Inc. | | | | 1.7 | |
| 8. UGI Corp. | | | | 1.7 | |
| 9. PartnerRe Ltd. | | | | 1.7 | |
| 10. Lam Research Corp. | | | | 1.7 | |
| | | | | |
Total Net Assets | | | $ | 33.1 million | |
| | | | | |
| |
Total Number of Holdings* | | | | 71 | |
| | | | | |
The Fund’s holdings are subject to change, and there is no assurance that the Fund will continue to hold any particular security. *Excluding money market fund holdings. |
|
| 4 Invesco Long/Short Equity Fund |
In addition, short positions held in the retail industry within the consumer discretionary sector hurt performance during the reporting period. The automobile and components industry struggled with long positions underperforming and short positions outperforming the Fund, which detracted from overall Fund performance.
At the end of the reporting period, the largest net long sector exposures were in the IT, energy, financials, health care and industrials sectors. The largest net short sector exposure was in the consumer discretionary sector.
Please note that the Fund may utilize derivative instruments that include equity total return swaps or futures contracts. During the reporting period, the Fund utilized equity total return swaps to efficiently implement its strategy. The implementation impact of using equity total return swaps is a component of transaction costs. Derivatives may amplify traditional investment risks through the creation of leverage.
During the reporting period, the Fund did not utilize futures contracts.
Thank you for your investment in Invesco Long/Short Equity Fund.
The views and opinions expressed in management’s discussion of Fund performance are those of Invesco Advisers, Inc. These views and opinions are subject to change at any time based on factors such as market and economic conditions. These views and opinions may not be relied upon as investment advice or recommendations, or as an offer for a particular security. The information is not a complete analysis of every aspect of any market, country, industry, security or the Fund. Statements of fact are from sources considered reliable, but Invesco Advisers, Inc. makes no representation or warranty as to their completeness or accuracy. Although historical performance is no guarantee of future results, these insights may help you understand our investment management philosophy.
See important Fund and, if applicable, index disclosures later in this report.
| | |
 | | Michael Abata Chartered Financial Analyst, Portfolio Manager, is manager of Invesco Long/Short Equity Fund. He |
| joined Invesco in 2011. Mr. Abata earned a BA in economics from Binghamton University. |
| | |
 | | Charles Ko Chartered Financial Analyst, Portfolio Manager, is manager of Invesco Long/Short Equity Fund. He |
| joined Invesco in 2012. Mr. Ko earned a BS from MIT and an MBA from Yale University. |
| | |
 | | Anthony Munchak Chartered Financial Analyst, Portfolio Manager, is manager of Invesco Long/Short Equity Fund. He |
| joined Invesco in 2000. Mr. Munchak earned a BS and an MS in finance from Boston College and an MBA from Bentley College. |
| | |
 | | Glen Murphy Chartered Financial Analyst, Portfolio Manager, is manager of Invesco Long/Short Equity Fund. He |
| joined Invesco in 1995. Mr. Murphy earned a BA in business administration from the University of Massachusetts Amherst and an MS in finance from Boston College. |
| | |
 | | Francis Orlando Chartered Financial Analyst, Portfolio Manager, is manager of Invesco Long/Short Equity Fund. He |
| joined Invesco in 1987. Mr. Orlando earned a BA in business administration from Merrimack College and an MBA from Boston University. |
| | |
 | | Andrew Waisburd Portfolio Manager, is manager of Invesco Long/Short Equity Fund. He joined Invesco in 2008. |
| Mr. Waisburd earned a BS in statistics from Cornell University and an MS and a PhD in finance from Indiana University. |
|
| 5 Invesco Long/Short Equity Fund |
Your Fund’s Performance
Results of a $10,000 Investment – Oldest Share Class(es) since Inception
Fund and index data from 12/19/13
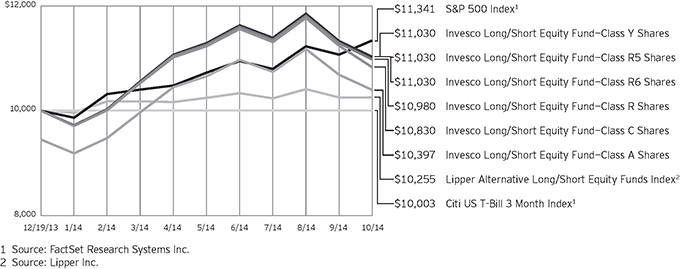
Past performance cannot guarantee comparable future results.
The data shown in the chart include reinvested distributions, applicable sales charges and Fund expenses including
management fees. Index results include reinvested dividends, but they do not reflect sales charges. Performance of the peer group, if applicable, reflects fund expenses and management fees;
performance of a market index does not. Performance shown in the chart and table(s) does not reflect deduction of taxes a shareholder would pay on Fund distributions or sale of Fund shares.
continued from page 8
| n | | The Fund is not managed to track the performance of any particular index, including the index(es) described here, and consequently, the performance of the Fund may deviate significantly from the performance of the
index(es). |
| n | | A direct investment cannot be made in an index. Unless otherwise indicated, index results include reinvested dividends, and they do not reflect sales charges. Performance of the peer group, if applicable, reflects fund expenses; performance of a market index does not. |
Other information
| n | | The returns shown in management’s discussion of Fund performance are based on net asset values (NAVs) calculated for shareholder transactions. Generally accepted accounting principles require adjustments to be made to the net assets of the Fund at period end for financial reporting purposes, and as such, the NAVs for shareholder transactions and the returns based on those NAVs may differ from the NAVs and returns reported in the Financial Highlights. |
| n | | Industry classifications used in this report are generally according to the Global Industry Classification Standard, which was developed by and is the exclusive property and a service mark of MSCI Inc. and Standard & Poor’s. |
|
| 6 Invesco Long/Short Equity Fund |
| | | | |
Cumulative Total Returns | |
As of 10/31/14, including maximum applicable sales charges | |
| |
| Class A Shares | | | | |
| Inception (12/19/13) | | | 3.97 | % |
| |
| Class C Shares | | | | |
| Inception (12/19/13) | | | 8.30 | % |
| |
| Class R Shares | | | | |
| Inception (12/19/13) | | | 9.80 | % |
| |
| Class Y Shares | | | | |
| Inception (12/19/13) | | | 10.30 | % |
| |
| Class R5 Shares | | | | |
| Inception (12/19/13) | | | 10.30 | % |
| |
| Class R6 Shares | | | | |
| Inception (12/19/13) | | | 10.30 | % |
The performance data quoted represent past performance and cannot guarantee comparable future results; current performance may be lower or higher. Please visit invesco.com/performance for the most recent month-end performance. Performance figures reflect reinvested distributions, changes in net asset value and the effect of the maximum sales charge unless otherwise stated. Investment return and principal value will fluctuate so that you may have a gain or loss when you sell shares.
The net annual Fund operating expense ratio set forth in the most recent Fund prospectus as of the date of this report for Class A, Class C, Class R, Class Y, Class R5 and Class R6 shares was 1.87%, 2.62%, 2.12%, 1.62%, 1.62% and 1.62%, respectively.1 The total annual Fund operating expense ratio set forth in the most recent Fund prospectus as of the date of this report for Class A, Class C, Class R, Class Y, Class R5 and Class R6 shares was 3.12%, 3.87%, 3.37%, 2.87%, 2.76% and 2.71%, respectively. The expense ratios presented above may vary from the expense ratios presented in other sections of this report that are based on expenses incurred during the period covered by this report.
Class A share performance reflects the maximum 5.50% sales charge, and Class C share performance reflects the applicable contingent deferred sales charge (CDSC) for the period involved. The CDSC on Class C shares is 1% for the first year after purchase. Class R, Class Y, Class R5 and Class R6 class shares do not have a front-end sales
| | | | |
Cumulative Total Returns | |
| As of 9/30/14, the most recent calendar quarter end, including maximum applicable sales charges | |
| |
| Class A Shares | | | | |
| Inception (12/19/13) | | | 6.90 | % |
| |
| Class C Shares | | | | |
| Inception (12/19/13) | | | 11.40 | % |
| |
| Class R Shares | | | | |
| Inception (12/19/13) | | | 12.90 | % |
| |
| Class Y Shares | | | | |
| Inception (12/19/13) | | | 13.30 | % |
| |
| Class R5 Shares | | | | |
| Inception (12/19/13) | | | 13.30 | % |
| |
| Class R6 Shares | | | | |
| Inception (12/19/13) | | | 13.30 | % |
charge or a CDSC; therefore, performance is at net asset value.
The performance of the Fund’s share classes will differ primarily due to different sales charge structures and class expenses.
Had the adviser not waived fees and/ or reimbursed expenses, performance would have been lower.
| 1 | Total annual Fund operating expenses after any contractual fee waivers and/or expense reimbursements by the adviser in effect through at least February 29, 2016. See current prospectus for more information. |
|
| 7 Invesco Long/Short Equity Fund |
Invesco Long/Short Equity Fund’s investment objective is to seek long-term capital appreciation.
| n | | Unless otherwise stated, information presented in this report is as of October 31, 2014, and is based on total net assets. |
| n | | Unless otherwise noted, all data provided by Invesco. |
| n | | To access your Fund’s reports/prospectus, visit invesco.com/fundreports. |
About share classes
| n | | Class R shares are generally available only to employer sponsored retirement and benefit plans. Please see the prospectus for more information. |
| n | | Class Y shares are available only to certain investors. Please see the prospectus for more information. |
| n | | Class R5 shares and Class R6 shares are primarily intended for employer sponsored retirement and benefit plans that meet certain standards and for institutional investors. Please see the prospectus for more information. |
Principal risks of investing in the Fund
| n | | Active trading risk. The Fund engages in frequent trading of portfolio securities. Active trading results in added expenses and may result in a lower return and increased tax liability. |
| n | | Derivatives risk. The value of a derivative instrument depends largely on (and is derived from) the value of an underlying security, currency, commodity, interest rate, index or other asset (each referred to as an underlying asset). In addition to risks relating to the underlying assets, the use of derivatives may include other, possibly greater, risks, including counterparty, leverage and liquidity risks. Counterparty risk is the risk that the counterparty to the derivative contract will default on its obligation to pay the Fund the amount owed or otherwise perform under the derivative contract. Derivatives create leverage risk because they do not require payment up front equal to the economic exposure created by owning the derivative. As a result, an adverse change in the value of the underlying asset could result in the Fund sustaining a loss that is substantially greater than the amount invested in the derivative, which may make the Fund’s returns more volatile and increase the risk of loss. Derivative instruments may also be less liquid than more traditional investments and the Fund may be unable to sell or close |
| | | out its derivative positions at a desirable time or price. This risk may be more acute under adverse market conditions, during which the Fund may be most in need of liquidating its derivative positions. Derivatives may also be harder to value, less tax efficient and subject to changing government regulation that could impact the Fund’s ability to use certain derivatives or their cost. Also, derivatives used for hedging or to gain or limit exposure to a particular market segment may not provide the expected benefits, particularly during adverse market conditions. These risks are greater for the Fund than mutual funds that do not use derivative instruments or that use derivative instruments to a lesser extent than the Fund to implement their investment strategy. |
| n | | Large capitalization company risk. Larger, more established companies may be unable to respond quickly to new competitive challenges such as changes in consumer tastes or innovative smaller competitors. Returns on investments in large capitalization companies could trail the returns on investments in smaller companies. |
| n | | Management risk. The investment techniques and risk analysis used by the Fund’s portfolio managers may not produce the desired results. In particular, there is no guarantee that the Fund’s mixture of long and short positions or the portfolio manager’s stock selection process will produce a portfolio with reduced exposure to stock market risk. In addition, the Fund’s long/short investment strategy may cause the Fund to underperform the broader equity markets in which the Fund invests during market rallies. Such underperformance could be significant during sudden or significant market rallies. |
| n | | Market risk. The prices of and the income generated by the Fund’s securities may decline in response to, among other things, investor sentiment, general economic and market conditions, regional or global instability, and currency and interest rate fluctuations. |
| n | | Short sales risk. Short sales may cause the Fund to repurchase a security at a higher price, thereby causing a loss. A short position in a security poses more risk than holding the same security long. As there is no limit on how much the price of the security can increase, the Fund’s exposure is unlimited. In order to establish a short position in a security, the Fund must borrow the security from a broker. The Fund may not always be able to borrow a security the Fund seeks to sell short at a particular time or at an acceptable price. The Fund also may not always be able to close out the short position by replacing the borrowed securities at a particular time or at an acceptable price. The Fund will incur increased transaction costs associated with selling securities short. In addition, taking short positions in securities results in a form of leverage which may cause the Fund to be volatile. |
| n | | Small- and mid-capitalization risks. Stocks of small- and mid-sized companies tend to be more vulnerable to adverse developments and may have little or no operating history or track record of success, and limited product lines, markets, management and financial resources. The securities of small- and mid-sized companies may be more volatile due to less market interest and less publicly available information about the issuer. They also may be illiquid or restricted as to resale, or may trade less frequently and in smaller volumes, all of which may cause difficulty when establishing or closing a position at a desirable price. |
About indexes used in this report
| n | | The S&P 500® Index is an unmanaged index considered representative of the US stock market. |
| n | | The Citi US T-Bill 3 Month Index is an unmanaged index representative of three-month Treasury bills. |
| n | | The Lipper Alternative Long/Short Equity Funds Index is comprised of domestic or foreign funds that employ portfolio strategies combining long holdings of equities with short sales of equity, equity options or equity index options. |
continued on page 6
|
This report must be accompanied or preceded by a currently effective Fund prospectus, which contains more complete information, including sales charges and expenses. Investors should read it carefully before investing. |
|
|
| NOT FDIC INSURED | MAY LOSE VALUE | NO BANK GUARANTEE |
|
| 8 Invesco Long/Short Equity Fund |
Schedule of Investments(a)
October 31, 2014
| | | | | | | | |
| | | Shares | | | Value | |
Common Stocks & Other Equity Interests–84.89% | |
| Aerospace & Defense–1.16% | |
L-3 Communications Holdings, Inc. | | | 3,150 | | | $ | 382,599 | |
|
| Agricultural Products–1.54% | |
Ingredion Inc. | | | 6,600 | | | | 509,850 | |
|
| Air Freight & Logistics–1.17% | |
C.H. Robinson Worldwide, Inc. | | | 5,600 | | | | 387,576 | |
|
| Aluminum–0.90% | |
Alcoa Inc. | | | 17,860 | | | | 299,334 | |
|
| Brewers–1.49% | |
Molson Coors Brewing Co.–Class B | | | 6,650 | | | | 494,627 | |
|
| Cable & Satellite–1.17% | |
Cablevision Systems Corp.–Class A | | | 20,750 | | | | 386,365 | |
|
| Coal & Consumable Fuels–1.32% | |
Peabody Energy Corp. | | | 41,950 | | | | 437,539 | |
|
| Communications Equipment–3.00% | |
F5 Networks, Inc.(b) | | | 4,600 | | | | 565,708 | |
Juniper Networks, Inc. | | | 20,350 | | | | 428,774 | |
| | | | | | | | 994,482 | |
|
| Computer & Electronics Retail–3.28% | |
Best Buy Co., Inc. | | | 16,450 | | | | 561,603 | |
GameStop Corp.–Class A | | | 12,250 | | | | 523,810 | |
| | | | | | | | 1,085,413 | |
|
| Construction Machinery & Heavy Trucks–1.27% | |
Joy Global Inc. | | | 8,000 | | | | 421,040 | |
|
| Data Processing & Outsourced Services–3.61% | |
Computer Sciences Corp. | | | 8,150 | | | | 492,260 | |
Western Union Co. (The) | | | 17,200 | | | | 291,712 | |
Xerox Corp. | | | 30,870 | | | | 409,954 | |
| | | | | | | | 1,193,926 | |
|
| Department Stores–0.58% | |
Kohl’s Corp. | | | 3,570 | | | | 193,565 | |
|
| Diversified Support Services–0.65% | |
Cintas Corp. | | | 2,950 | | | | 216,058 | |
|
| Electric Utilities–2.19% | |
Entergy Corp. | | | 5,570 | | | | 467,991 | |
FirstEnergy Corp. | | | 6,900 | | | | 257,646 | |
| | | | | | | | 725,637 | |
|
| Electronic Manufacturing Services–0.29% | |
Flextronics International Ltd.(b) | | | 9,050 | | | | 97,016 | |
|
| Gas Utilities–4.25% | |
AGL Resources Inc. | | | 9,100 | | | | 490,581 | |
| | | | | | | | |
| | | Shares | | | Value | |
| Gas Utilities–(continued) | |
National Fuel Gas Co. | | | 5,150 | | | $ | 356,534 | |
UGI Corp. | | | 14,900 | | | | 561,581 | |
| | | | | | | | 1,408,696 | |
|
| Gold–1.07% | |
Newmont Mining Corp. | | | 18,950 | | | | 355,502 | |
|
| Health Care Equipment–1.57% | |
C.R. Bard, Inc. | | | 2,700 | | | | 442,719 | |
St. Jude Medical, Inc. | | | 1,220 | | | | 78,287 | |
| | | | | | | | 521,006 | |
|
| Home Entertainment Software–1.84% | |
Electronic Arts Inc.(b) | | | 14,850 | | | | 608,404 | |
|
| Human Resource & Employment Services–1.30% | |
Manpowergroup Inc. | | | 6,450 | | | | 430,538 | |
|
| Industrial Machinery–1.22% | |
SPX Corp. | | | 4,250 | | | | 402,858 | |
|
| Integrated Telecommunication Services–1.54% | |
Windstream Holdings Inc. | | | 48,650 | | | | 509,852 | |
|
| Internet Retail–1.81% | |
Expedia, Inc. | | | 6,300 | | | | 535,311 | |
Lands’ End, Inc.(b) | | | 1,340 | | | | 63,610 | |
| | | | | | | | 598,921 | |
|
| Internet Software & Services–1.66% | |
AOL Inc.(b) | | | 12,650 | | | | 550,654 | |
|
| IT Consulting & Other Services–1.38% | |
Leidos Holdings, Inc. | | | 12,450 | | | | 455,297 | |
|
| Life & Health Insurance–1.90% | |
Lincoln National Corp. | | | 7,330 | | | | 401,391 | |
Unum Group | | | 6,800 | | | | 227,528 | |
| | | | | | | | 628,919 | |
|
| Marine–1.29% | |
Kirby Corp.(b) | | | 3,850 | | | | 425,733 | |
|
| Mortgage REIT’s–1.43% | |
Annaly Capital Management Inc. | | | 41,550 | | | | 474,086 | |
|
| Multi-Line Insurance–0.95% | |
Assurant, Inc. | | | 4,600 | | | | 313,812 | |
|
| Office Services & Supplies–1.45% | |
Pitney Bowes Inc. | | | 19,350 | | | | 478,719 | |
|
| Oil & Gas Drilling–1.08% | |
Nabors Industries Ltd. | | | 20,000 | | | | 357,000 | |
|
| Oil & Gas Equipment & Services–1.20% | |
Seventy Seven Energy Inc.(b) | | | 1,507 | | | | 19,696 | |
See accompanying Notes to Financial Statements which are an integral part of the financial statements.
9 Invesco Long/Short Equity Fund
| | | | | | | | |
| | | Shares | | | Value | |
| Oil & Gas Equipment & Services–(continued) | |
Superior Energy Services, Inc. | | | 15,050 | | | $ | 378,508 | |
| | | | | | | | 398,204 | |
|
| Oil & Gas Exploration & Production–5.31% | |
Chesapeake Energy Corp. | | | 5,890 | | | | 130,640 | |
Denbury Resources Inc. | | | 30,200 | | | | 374,480 | |
Encana Corp. | | | 18,370 | | | | 342,233 | |
Newfield Exploration Co.(b) | | | 12,250 | | | | 399,472 | |
Southwestern Energy Co.(b) | | | 4,570 | | | | 148,571 | |
Talisman Energy Inc. | | | 56,900 | | | | 363,022 | |
| | | | | | | | 1,758,418 | |
|
| Oil & Gas Refining & Marketing–3.16% | |
HollyFrontier Corp. | | | 11,150 | | | | 505,987 | |
Tesoro Corp. | | | 7,550 | | | | 539,145 | |
| | | | | | | | 1,045,132 | |
|
| Paper Packaging–0.63% | |
Sealed Air Corp. | | | 5,750 | | | | 208,438 | |
|
| Publishing–0.15% | |
Time Inc.(b) | | | 2,150 | | | | 48,569 | |
|
| Reinsurance–1.69% | |
PartnerRe Ltd. | | | 4,850 | | | | 561,096 | |
|
| Residential REIT’s–0.98% | |
UDR, Inc. | | | 10,700 | | | | 323,461 | |
|
| Retail REIT’s–1.47% | |
Regency Centers Corp. | | | 8,000 | | | | 485,600 | |
|
| Security & Alarm Services–1.48% | |
ADT Corp. (The) | | | 13,700 | | | | 491,008 | |
|
| Semiconductor Equipment–1.68% | |
Lam Research Corp. | | | 7,150 | | | | 556,699 | |
|
| Semiconductors–4.53% | |
Marvell Technology Group Ltd. | | | 38,100 | | | | 512,064 | |
NVIDIA Corp. | | | 19,250 | | | | 376,145 | |
Skyworks Solutions, Inc. | | | 10,500 | | | | 611,520 | |
| | | | | | | | 1,499,729 | |
| | | | | | | | |
| | | Shares | | | Value | |
| Silver–1.06% | |
Silver Wheaton Corp.(b) | | | 20,150 | | | $ | 350,006 | |
|
| Soft Drinks–1.79% | |
Dr Pepper Snapple Group, Inc. | | | 8,550 | | | | 592,087 | |
|
| Specialized Finance–1.34% | |
NASDAQ OMX Group, Inc. (The) | | | 10,250 | | | | 443,415 | |
|
| Specialized REIT’s–1.64% | |
Extra Space Storage Inc. | | | 9,350 | | | | 543,796 | |
|
| Specialty Stores–0.85% | |
Staples, Inc. | | | 22,150 | | | | 280,862 | |
|
| Steel–1.81% | |
United States Steel Corp. | | | 14,950 | | | | 598,598 | |
|
| Systems Software–0.75% | |
CA, Inc. | | | 8,600 | | | | 249,916 | |
|
| Technology Distributors–0.84% | |
Arrow Electronics, Inc.(b) | | | 4,900 | | | | 278,614 | |
|
| Technology Hardware, Storage & Peripherals–3.17% | |
Lexmark International, Inc.–Class A | | | 10,400 | | | | 448,864 | |
NetApp, Inc. | | | 14,000 | | | | 599,200 | |
| | | | | | | | 1,048,064 | |
Total Common Stocks & Other Equity Interests
(Cost $27,411,464) | | | | 28,106,736 | |
| |
Money Market Funds–2.69% | | | | | |
Liquid Assets Portfolio–Institutional Class(c) | | | 445,914 | | | | 445,914 | |
Premier Portfolio–Institutional Class(c) | | | 445,915 | | | | 445,915 | |
Total Money Market Funds
(Cost $891,829) | | | | 891,829 | |
TOTAL INVESTMENTS–87.58%
(Cost $28,303,293) | | | | 28,998,565 | |
OTHER ASSETS LESS LIABILITIES–12.42% | | | | 4,111,135 | |
NET ASSETS–100.00% | | | $ | 33,109,700 | |
Investment Abbreviations:
| | |
| REIT | | – Real Estate Investment Trust |
Notes to Schedule of Investments:
| (a) | Industry and/or sector classifications used in this report are generally according to the Global Industry Classification Standard, which was developed by and is the exclusive property and a service mark of MSCI Inc. and Standard & Poor’s. |
| (b) | Non-income producing security. |
| (c) | The money market fund and the Fund are affiliated by having the same investment adviser. |
See accompanying Notes to Financial Statements which are an integral part of the financial statements.
10 Invesco Long/Short Equity Fund
| | | | | | | | | | | | | | | | | | | | |
| Open Total Return Swap Agreements | |
| Reference Entity | | Counterparty | | Expiration
Dates | | | Floating Rate Index(1) | | Notional
Amount | | | Unrealized
Appreciation
(Depreciation)(2) | | | Net Value of
Reference
Entities | |
Equity Securities — Long | | Morgan Stanley & Co. LLC | | | 12/21/2015 | | | Federal Funds floating rate | | $ | 31,829,633 | | | $ | 1,322,392 | (3) | | $ | 33,116,849 | |
Equity Securities — Short | | Morgan Stanley & Co. LLC | | | 12/21/2015 | | | Federal Funds floating rate | | | (31,488,525 | ) | | | (1,693,830 | )(4) | | | (33,164,890 | ) |
Total Return Swap Agreements — Equity Risk | | | | | | | | | | | | $ | (371,438 | ) | | | | |
| (1) | The Fund receives or pays the total return on the long and short positions underlying the total return swap and pays or receives a specific Federal Funds floating rate. |
| (2) | Swaps collateralized by $68,575 cash held with Morgan Stanley & Co. LLC, the Counterparty. |
| (3) | Amount includes $35,176 of dividends receivable and fees from the Fund to the Counterparty. |
| (4) | Amount includes $(17,465) of dividends payable and fees from the Fund to the Counterparty. |
The following table represents the individual long and short positions and related values of equity securities underlying the total return swap with Morgan Stanley & Co. LLC as of October 31, 2014.
| | | | | | | | |
| | | Shares | | | Value | |
Equity Securities — Long | |
| Aerospace & Defense | |
General Dynamics Corp. | | | 3,600 | | | $ | 503,136 | |
Lockheed Martin Corp. | | | 3,150 | | | | 600,295 | |
Northrop Grumman Corp. | | | 3,000 | | | | 413,880 | |
| | | | | | | | 1,517,311 | |
|
| Agricultural Products | |
Archer-Daniels-Midland Co. | | | 11,300 | | | | 531,100 | |
|
| Airlines | |
Southwest Airlines Co. | | | 17,850 | | | | 615,468 | |
|
| Aluminum | |
Alcoa Inc. | | | 15,190 | | | | 254,584 | |
|
| Biotechnology | |
Alexion Pharmaceuticals, Inc. | | | 3,150 | | | | 602,784 | |
Gilead Sciences, Inc. | | | 4,550 | | | | 509,600 | |
Regeneron Pharmaceuticals, Inc. | | | 1,400 | | | | 551,208 | |
| | | | | | | | 1,663,592 | |
|
| Coal & Consumable Fuels | |
Peabody Energy Corp. | | | 5,000 | | | | 52,150 | |
|
| Commodity Chemicals | |
LyondellBasell Industries N.V.–Class A | | | 5,500 | | | | 503,965 | |
|
| Communications Equipment | |
Cisco Systems, Inc. | | | 20,350 | | | | 497,964 | |
QUALCOMM, Inc. | | | 6,300 | | | | 494,613 | |
| | | | | | | | 992,577 | |
|
| Construction Machinery & Heavy Trucks | |
Caterpillar Inc. | | | 4,550 | | | | 461,416 | |
|
| Consumer Finance | |
Capital One Financial Corp. | | | 6,000 | | | | 496,620 | |
|
| Data Processing & Outsourced Services | |
Xerox Corp. | | | 8,880 | | | | 117,926 | |
|
| Department Stores | |
Kohl’s Corp. | | | 4,680 | | | | 253,750 | |
| | | | | | | | |
| | | Shares | | | Value | |
| Diversified REIT’s | |
Vornado Realty Trust | | | 3,700 | | | $ | 405,076 | |
|
| Diversified Support Services | |
Cintas | | | 3,900 | | | | 285,636 | |
Iron Mountain Inc. | | | 11,650 | | | | 420,215 | |
| | | | | | | | 705,851 | |
|
| Electric Utilities | |
Edison International | | | 8,700 | | | | 544,446 | |
Entergy Corp. | | | 1,230 | | | | 103,345 | |
Exelon Corp. | | | 16,250 | | | | 594,587 | |
FirstEnergy Corp. | | | 6,800 | | | | 253,912 | |
| | | | | | | | 1,496,290 | |
|
| Electronic Components | |
Corning Inc. | | | 25,500 | | | | 520,965 | |
|
| Gold–1.30% | |
Barrick Gold Corp. | | | 36,300 | | | | 430,881 | |
|
| Health Care Distributors | |
Cardinal Health, Inc. | | | 7,150 | | | | 561,132 | |
|
| Health Care Equipment | |
St. Jude Medical, Inc. | | | 3,630 | | | | 232,937 | |
|
| Health Care Facilities | |
HCA Holdings, Inc. | | | 7,150 | | | | 500,857 | |
|
| Health Care Services | |
Express Scripts Holding Co. | | | 7,600 | | | | 583,832 | |
|
| Integrated Oil & Gas | |
Cenovus Energy Inc. | | | 19,600 | | | | 485,296 | |
Hess Corp. | | | 6,000 | | | | 508,860 | |
Suncor Energy, Inc. | | | 14,000 | | | | 497,560 | |
| | | | | | | | 1,491,716 | |
|
| Integrated Telecommunication Services | |
CenturyLink Inc. | | | 1,900 | | | | 78,812 | |
|
| Internet Software & Services | |
Yahoo! Inc. | | | 5,550 | | | | 255,578 | |
See accompanying Notes to Financial Statements which are an integral part of the financial statements.
11 Invesco Long/Short Equity Fund
| | | | | | | | |
| | | Shares | | | Value | |
| IT Consulting & Other Services | |
International Business Machines Corp. | | | 3,000 | | | $ | 493,200 | |
|
| Life & Health Insurance | |
Lincoln National Corp. | | | 2,270 | | | | 124,305 | |
MetLife, Inc. | | | 4,550 | | | | 246,792 | |
| | | | | | | | 371,097 | |
|
| Managed Health Care | |
Aetna Inc. | | | 6,250 | | | | 515,687 | |
Cigna Corp. | | | 5,300 | | | | 527,721 | |
WellPoint, Inc. | | | 4,600 | | | | 582,774 | |
| | | | | | | | 1,626,182 | |
|
| Multi-Line Insurance | |
American International Group, Inc. | | | 8,250 | | | | 441,952 | |
|
| Multi-Utilities | |
PG&E Corp. | | | 9,700 | | | | 488,104 | |
Public Service Enterprise Group Inc. | | | 12,250 | | | | 506,048 | |
| | | | | | | | 994,152 | |
|
| Oil & Gas Equipment & Services | |
Baker Hughes Inc. | | | 7,150 | | | | 378,664 | |
Cameron International Corp. | | | 7,000 | | | | 416,850 | |
National Oilwell Varco Inc. | | | 6,700 | | | | 486,688 | |
Seventy Seven Energy Inc. | | | 893 | | | | 11,672 | |
Superior Energy Services, Inc. | | | 4,750 | | | | 119,463 | |
| | | | | | | | 1,413,337 | |
|
| Oil & Gas Exploration & Production | |
Anadarko Petroleum Corp. | | | 4,550 | | | | 417,599 | |
Apache Corp. | | | 6,550 | | | | 505,660 | |
Canadian Natural Resources Ltd. | | | 11,700 | | | | 408,096 | |
Chesapeake Energy Corp. | | | 16,810 | | | | 372,846 | |
Crescent Point Energy Corp. | | | 2,550 | | | | 84,226 | |
Devon Energy Corp. | | | 6,700 | | | | 402,000 | |
Encana Corp. | | | 8,230 | | | | 153,325 | |
Marathon Oil Corp. | | | 14,300 | | | | 506,220 | |
Southwestern Energy Co. | | | 10,630 | | | | 345,581 | |
Talisman Energy Inc. | | | 18,800 | | | | 119,944 | |
| | | | | | | | 3,315,497 | |
|
| Oil & Gas Refining & Marketing | |
Marathon Petroleum Corp. | | | 5,400 | | | | 490,860 | |
Valero Energy Corp. | | | 9,950 | | | | 498,396 | |
| | | | | | | | 989,256 | |
|
| Packaged Foods & Meats | |
ConAgra Foods, Inc. | | | 14,250 | | | | 489,488 | |
|
| Pharmaceuticals | |
Eli Lilly and Co. | | | 7,900 | | | | 524,007 | |
Hospira, Inc. | | | 6,800 | | | | 365,160 | |
Merck & Co., Inc. | | | 8,600 | | | | 498,284 | |
Pfizer Inc. | | | 16,800 | | | | 503,160 | |
| | | | | | | | 1,890,611 | |
| | | | | | | | |
| | | Shares | | | Value | |
| Property & Casualty Insurance | |
Travelers Cos., Inc. (The) | | | 5,350 | | | $ | 539,280 | |
|
| Railroads | |
Norfolk Southern Corp. | | | 2,250 | | | | 248,940 | |
|
| Reinsurance | |
Reinsurance Group of America, Inc. | | | 3,950 | | | | 332,788 | |
|
| Residential REIT’s | |
AvalonBay Communities, Inc. | | | 3,350 | | | | 522,064 | |
|
| Retail REIT’s | |
General Growth Properties, Inc. | | | 21,100 | | | | 546,701 | |
|
| Semiconductors | |
Intel Corp. | | | 14,500 | | | | 493,145 | |
Micron Technology, Inc. | | | 600 | | | | 19,854 | |
| | | | | | | | 512,999 | |
|
| Specialized REIT’s | |
American Tower Corp. | | | 5,600 | | | | 546,000 | |
Ventas, Inc. | | | 7,250 | | | | 496,698 | |
| | | | | | | | 1,042,698 | |
|
| Systems Software | |
Microsoft Corp. | | | 10,000 | | | | 469,500 | |
Oracle Corp. | | | 12,250 | | | | 478,362 | |
| | | | | | | | 947,862 | |
|
| Technology Hardware, Storage & Peripherals | |
Apple Inc. | | | 5,400 | | | | 583,200 | |
Hewlett-Packard Co. | | | 14,700 | | | | 527,436 | |
Western Digital Corp. | | | 5,400 | | | | 531,198 | |
| | | | | | | | 1,641,834 | |
|
| Trading Companies & Distributors | |
NOW Inc. | | | 1,082 | | | | 32,525 | |
Total Equity Securities — Long | | | | | | | 33,116,849 | |
12 Invesco Long/Short Equity Fund
See accompanying Notes to Financial Statements which are an integral part of the financial statements.
| | | | | | | | |
| | | Shares | | | Value | |
Equity Securities — Short | |
| Aerospace & Defense | |
B/E Aerospace, Inc. | | | (6,500 | ) | | $ | (483,925 | ) |
Precision Castparts Corp. | | | (1,900 | ) | | | (419,330 | ) |
| | | | | | | | (903,255 | ) |
|
| Apparel, Accessories & Luxury Goods | |
Gildan Activewear Inc. | | | (6,300 | ) | | | (375,669 | ) |
Lululemon Athletica Inc. | | | (10,850 | ) | | | (451,902 | ) |
Michael Kors Holdings Ltd. | | | (6,250 | ) | | | (491,188 | ) |
| | | | | | | | (1,318,759 | ) |
|
| Application Software | |
Splunk Inc. | | | (7,350 | ) | | | (485,688 | ) |
Workday, Inc.–Class A | | | (5,200 | ) | | | (496,496 | ) |
| | | | | | | | (982,184 | ) |
|
| Automobile Manufacturers | |
General Motors Co. | | | (15,650 | ) | | | (491,410 | ) |
Tesla Motors, Inc. | | | (2,000 | ) | | | (483,400 | ) |
| | | | | | | | (974,810 | ) |
|
| Automotive Retail | |
CarMax, Inc. | | | (8,800 | ) | | | (492,008 | ) |
|
| Biotechnology | |
Biogen Idec Inc. | | | (1,380 | ) | | | (443,090 | ) |
BioMarin Pharmaceutical Inc. | | | (6,000 | ) | | | (495,000 | ) |
| | | | | | | | (938,090 | ) |
|
| Building Products | |
Fortune Brands Home & Security Inc. | | | (11,500 | ) | | | (497,375 | ) |
|
| Cable & Satellite | |
AMC Networks Inc. | | | (7,700 | ) | | | (467,005 | ) |
Charter Communications, Inc.–Class A | | | (3,000 | ) | | | (475,170 | ) |
| | | | | | | | (942,175 | ) |
|
| Casinos & Gaming | |
Wynn Resorts Ltd. | | | (2,600 | ) | | | (494,026 | ) |
|
| Commodity Chemicals | |
Methanex Corp. | | | (5,900 | ) | | | (350,106 | ) |
|
| Construction & Engineering | |
Chicago Bridge & Iron Co. N.V. | | | (9,000 | ) | | | (491,760 | ) |
|
| Data Processing & Outsourced Services | |
Alliance Data Systems Corp. | | | (100 | ) | | | (28,335 | ) |
MasterCard, Inc.–Class A | | | (6,200 | ) | | | (519,250 | ) |
| | | | | | | | (547,585 | ) |
|
| Department Stores | |
J. C. Penney Co., Inc. | | | (53,250 | ) | | | (405,232 | ) |
Sears Holdings Corp. | | | (12,400 | ) | | | (433,008 | ) |
| | | | | | | | (838,240 | ) |
|
| Distributors | |
LKQ Corp. | | | (17,500 | ) | | | (499,975 | ) |
| | | | | | | | |
| | | Shares | | | Value | |
| Diversified Chemicals | |
FMC Corp. | | | (7,500 | ) | | $ | (430,125 | ) |
|
| Drug Retail | |
Walgreen Co. | | | (6,550 | ) | | | (420,641 | ) |
|
| Food Retail | |
Whole Foods Market, Inc. | | | (12,300 | ) | | | (483,759 | ) |
|
| Footwear | |
NIKE, Inc.–Class B | | | (5,200 | ) | | | (483,444 | ) |
|
| Health Care Facilities | |
Tenet Healthcare Corp. | | | (8,600 | ) | | | (482,030 | ) |
|
| Health Care Services | |
Catamaran Corp. | | | (10,750 | ) | | | (512,453 | ) |
|
| Health Care Technology | |
Cerner Corp. | | | (7,700 | ) | | | (487,718 | ) |
|
| Home Furnishings | |
Mohawk Industries, Inc. | | | (3,350 | ) | | | (475,834 | ) |
|
| Homebuilding | |
D.R. Horton, Inc. | | | (21,050 | ) | | | (479,730 | ) |
Lennar Corp.–Class A | | | (11,150 | ) | | | (480,342 | ) |
Toll Brothers, Inc. | | | (14,600 | ) | | | (466,470 | ) |
| | | | | | | | (1,426,542 | ) |
|
| Industrial Machinery | |
Colfax Corp. | | | (6,350 | ) | | | (345,313 | ) |
|
| Insurance Brokers | |
Arthur J. Gallagher & Co. | | | (7,600 | ) | | | (362,520 | ) |
|
| Integrated Oil & Gas | |
Chevron Corp. | | | (3,850 | ) | | | (461,808 | ) |
|
| Internet Retail | |
Amazon.com, Inc. | | | (1,660 | ) | | | (507,063 | ) |
Netflix Inc. | | | (1,260 | ) | | | (494,890 | ) |
| | | | | | | | (1,001,953 | ) |
|
| Internet Software & Services | |
Google Inc.–Class A | | | (860 | ) | | | (488,368 | ) |
LinkedIn Corp.–Class A | | | (2,250 | ) | | | (515,160 | ) |
Pandora Media Inc. | | | (24,800 | ) | | | (478,144 | ) |
Rackspace Hosting, Inc. | | | (13,050 | ) | | | (500,598 | ) |
| | | | | | | | (1,982,270 | ) |
|
| Leisure Products | |
Polaris Industries Inc. | | | (2,500 | ) | | | (377,150 | ) |
|
| Movies & Entertainment | |
Twenty-First Century Fox, Inc.–Class A | | | (14,300 | ) | | | (493,064 | ) |
|
| Multi-Line Insurance | |
Loews Corp. | | | (10,200 | ) | | | (444,720 | ) |
|
| Oil & Gas Drilling | |
Diamond Offshore Drilling, Inc. | | | (10,150 | ) | | | (382,757 | ) |
See accompanying Notes to Financial Statements which are an integral part of the financial statements.
13 Invesco Long/Short Equity Fund
| | | | | | | | |
| | | Shares | | | Value | |
| Oil & Gas Drilling-(continued) | | | | | | | | |
Rowan Cos. PLC–Class A | | | (15,900 | ) | | $ | (385,893 | ) |
| | | | | | | | (768,650 | ) |
|
| Oil & Gas Exploration & Production | |
Cobalt International Energy, Inc. | | | (44,150 | ) | | | (516,997 | ) |
EQT Corp. | | | (5,400 | ) | | | (507,816 | ) |
| | | | | | | | (1,024,813 | ) |
|
| Oil & Gas Storage & Transportation | |
Cheniere Energy, Inc. | | | (6,600 | ) | | | (495,000 | ) |
Enbridge Inc. | | | (10,250 | ) | | | (485,440 | ) |
Williams Cos. Inc. (The) | | | (9,050 | ) | | | (502,365 | ) |
| | | | | | | | (1,482,805 | ) |
|
| Paper Packaging | |
Packaging Corp. of America | | | (6,950 | ) | | | (500,956 | ) |
|
| Pharmaceuticals | |
Bristol-Myers Squibb Co. | | | (8,850 | ) | | | (514,981 | ) |
Perrigo Co. PLC | | | (3,150 | ) | | | (508,567 | ) |
| | | | | | | | (1,023,548 | ) |
|
| Property & Casualty Insurance | |
FNF Group | | | (16,450 | ) | | | (490,868 | ) |
Markel Corp. | | | (700 | ) | | | (483,623 | ) |
| | | | | | | | (974,491 | ) |
|
| Real Estate Development | |
Howard Hughes Corp. | | | (2,550 | ) | | | (375,819 | ) |
|
| Restaurants | |
Panera Bread Co.–Class A | | | (2,300 | ) | | | (371,772 | ) |
|
| Semiconductors | |
Cree, Inc. | | | (15,200 | ) | | | (478,496 | ) |
|
| Specialized Finance | |
Intercontinental Exchange, Inc. | | | (2,350 | ) | | | (489,482 | ) |
|
| Specialty Stores | |
Tiffany & Co. | | | (4,750 | ) | | | (456,570 | ) |
Ulta Salon, Cosmetics & Fragrance, Inc. | | | (3,850 | ) | | | (465,119 | ) |
| | | | | | | | (921,689 | ) |
|
| Steel | |
Allegheny Technologies, Inc. | | | (11,300 | ) | | | (371,205 | ) |
|
| Systems Software | |
FireEye, Inc. | | | (14,500 | ) | | | (492,855 | ) |
NetSuite Inc. | | | (4,600 | ) | | | (499,836 | ) |
| | | | | | | | (992,691 | ) |
|
| Technology Hardware, Storage & Peripherals | |
3D Systems Corp. | | | (9,750 | ) | | | (368,550 | ) |
NCR Corp. | | | (13,700 | ) | | | (379,079 | ) |
| | | | | | | | (747,629 | ) |
| | | | | | | | |
| | | Shares | | | Value | |
| Tires & Rubber | |
Goodyear Tire & Rubber Co. (The) | | | (22,350 | ) | | $ | (541,540 | ) |
|
| Trading Companies & Distributors | |
Fastenal Co. | | | (7,500 | ) | | | (330,300 | ) |
MSC Industrial Direct Co., Inc.–Class A | | | (1,800 | ) | | | (145,746 | ) |
W.W. Grainger, Inc. | | | (850 | ) | | | (209,780 | ) |
| | | | | | | | (685,826 | ) |
|
| Wireless Telecommunication Services | |
SBA Communications Corp.–Class A | | | (4,200 | ) | | | (471,786 | ) |
Total Equity Securities — Short | | | | | | | (33,164,890 | ) |
See accompanying Notes to Financial Statements which are an integral part of the financial statements.
14 Invesco Long/Short Equity Fund
Statement of Assets and Liabilities
October 31, 2014
| | | | |
Assets: | | | | |
Investments, at value (Cost $27,411,464) | | $ | 28,106,736 | |
Investments in affiliated money market funds, at value and cost | | | 891,829 | |
Total investments, at value (Cost $28,303,293) | | | 28,998,565 | |
Receivable for: | | | | |
Deposits with brokers | | | 68,575 | |
Investments sold | | | 5,004,142 | |
Fund shares sold | | | 157,845 | |
Dividends | | | 9,164 | |
Swaps receivables | | | 201,096 | |
Investment for trustee deferred compensation and retirement plans | | | 1,890 | |
Other assets | | | 13,003 | |
Total assets | | | 34,454,280 | |
| |
Liabilities: | | | | |
Payable for: | | | | |
Fund shares reacquired | | | 601,156 | |
Swaps payable | | | 289,828 | |
Accrued fees to affiliates | | | 32,385 | |
Accrued trustees’ and officers’ fees and benefits | | | 1,792 | |
Accrued other operating expenses | | | 46,091 | |
Trustee deferred compensation and retirement plans | | | 1,890 | |
Unrealized depreciation on swap agreements | | | 371,438 | |
Total liabilities | | | 1,344,580 | |
Net assets applicable to shares outstanding | | $ | 33,109,700 | |
| |
Net assets consist of: | | | | |
Shares of beneficial interest | | $ | 32,910,280 | |
Undistributed net investment income (loss) | | | 369,889 | |
Undistributed net realized gain (loss) | | | (494,303 | ) |
Net unrealized appreciation | | | 323,834 | |
| | | $ | 33,109,700 | |
| | | | |
Net Assets: | | | | |
Class A | | $ | 16,796,467 | |
Class C | | $ | 2,617,630 | |
Class R | | $ | 27,087 | |
Class Y | | $ | 12,388,635 | |
Class R5 | | $ | 717,654 | |
Class R6 | | $ | 562,227 | |
|
Shares outstanding, $0.01 par value per share,
with an unlimited number of shares authorized: | |
Class A | | | 1,527,156 | |
Class C | | | 239,620 | |
Class R | | | 2,468 | |
Class Y | | | 1,123,769 | |
Class R5 | | | 65,103 | |
Class R6 | | | 51,004 | |
Class A: | | | | |
Net asset value per share | | $ | 11.00 | |
Maximum offering price per share | | | | |
(Net asset value of $11.00 ¸ 94.50%) | | $ | 11.64 | |
Class C: | | | | |
Net asset value and offering price per share | | $ | 10.92 | |
Class R: | | | | |
Net asset value and offering price per share | | $ | 10.98 | |
Class Y: | | | | |
Net asset value and offering price per share | | $ | 11.02 | |
Class R5: | | | | |
Net asset value and offering price per share | | $ | 11.02 | |
Class R6: | | | | |
Net asset value and offering price per share | | $ | 11.02 | |
See accompanying Notes to Financial Statements which are an integral part of the financial statements.
15 Invesco Long/Short Equity Fund
Statement of Operations
For the period December 19, 2013 (commencement date) through October 31, 2014
| | | | |
Investment income: | | | | |
Dividends (net of foreign withholding taxes of $2,743) | | $ | 328,718 | |
Dividends from affiliated money market funds | | | 922 | |
Total investment income | | | 329,640 | |
| |
Expenses: | | | | |
Advisory fees | | | 257,003 | |
Administrative services fees | | | 43,425 | |
Custodian fees | | | 6,730 | |
Distribution fees: | | | | |
Class A | | | 26,859 | |
Class C | | | 9,397 | |
Class R | | | 77 | |
Transfer agent fees — A, C, R and Y | | | 21,361 | |
Transfer agent fees — R5 | | | 55 | |
Transfer agent fees — R6 | | | 21 | |
Trustees’ and officers’ fees and benefits | | | 18,326 | |
Registration and filing fees | | | 88,101 | |
Professional services fees | | | 117,309 | |
Other | | | 20,653 | |
Total expenses | | | 609,317 | |
Less: Fees waived and expenses reimbursed | | | (243,375 | ) |
Net expenses | | | 365,942 | |
Net investment income (loss) | | | (36,302 | ) |
| |
Realized and unrealized gain (loss) from: | | | | |
Net realized gain (loss) from: | | | | |
Investment securities | | | (246,938 | ) |
Swap agreements | | | (197,283 | ) |
| | | | (444,221 | ) |
Change in net unrealized appreciation (depreciation) of: | | | | |
Investment securities | | | 695,272 | |
Swap agreements | | | (371,438 | ) |
| | | | 323,834 | |
Net realized and unrealized gain (loss) | | | (120,387 | ) |
Net increase (decrease) in net assets resulting from operations | | $ | (156,689 | ) |
See accompanying Notes to Financial Statements which are an integral part of the financial statements.
16 Invesco Long/Short Equity Fund
Statement of Changes in Net Assets
For the period December 19, 2013 (commencement date) through October 31, 2014
| | | | |
| | | December 19, 2013 (commencement date) through October 31, 2014 | |
Operations: | | | | |
Net investment income (loss) | | $ | (36,302 | ) |
Net realized gain (loss) | | | (444,221 | ) |
Change in net unrealized appreciation | | | 323,834 | |
Net increase (decrease) in net assets resulting from operations | | | (156,689 | ) |
| |
Share transactions–net: | | | | |
Class A | | | 17,061,810 | |
Class C | | | 2,778,453 | |
Class R | | | 25,838 | |
Class Y | | | 12,233,158 | |
Class R5 | | | 656,660 | |
Class R6 | | | 510,470 | |
Net increase in net assets resulting from share transactions | | | 33,266,389 | |
Net increase in net assets | | | 33,109,700 | |
| |
Net assets: | | | | |
Beginning of year | | | — | |
End of year (includes undistributed net investment income (loss) of $369,889) | | $ | 33,109,700 | |
See accompanying Notes to Financial Statements which are an integral part of the financial statements.
17 Invesco Long/Short Equity Fund
Statement of Cash Flows
For the period December 19, 2013 (commencement date) through October 31, 2014
| | | | |
Cash provided by (used in) operating activities: | | | | |
Net increase (decrease) in net assets resulting from operations | | $ | (156,689 | ) |
| |
Adjustments to reconcile the change in net assets applicable from operations to net cash provided by (used in) operating activities: | | | | |
Purchases of investments | | | (48,442,299 | ) |
Net change in unrealized depreciation on swap agreements | | | 371,438 | |
Increase in swap agreement payable, net | | | 88,732 | |
Proceeds from sales of investments | | | 15,779,755 | |
Increase in receivables and other assets | | | (92,632 | ) |
Increase in accrued expenses and other payables | | | 82,158 | |
Net realized loss from investment securities | | | 246,938 | |
Net change in unrealized appreciation on investment securities | | | (695,272 | ) |
Net cash provided by (used in) operating activities | | | (32,817,871 | ) |
| |
Cash provided by financing activities: | | | | |
Proceeds from shares of beneficial interest sold | | | 50,127,939 | |
Disbursements from shares of beneficial interest reacquired | | | (16,418,239 | ) |
Net cash provided by financing activities | | | 33,709,700 | |
Net increase in cash and cash equivalents | | | 891,829 | |
Cash and cash equivalents at beginning of period | | | — | |
Cash and cash equivalents at end of period | | $ | 891,829 | |
Notes to Financial Statements
October 31, 2014
NOTE 1—Significant Accounting Policies
Invesco Long/Short Equity Fund (the “Fund”) is a series portfolio of AIM Investment Funds (Invesco Investment Funds) (the “Trust”). The Trust is organized as a Delaware statutory trust and is registered under the Investment Company Act of 1940, as amended (the “1940 Act”), as an open-end series management investment company consisting of twenty-four separate series portfolios, each authorized to issue an unlimited number of shares of beneficial interest. The assets, liabilities and operations of each portfolio are accounted for separately. Information presented in these financial statements pertains only to the Fund. Matters affecting each portfolio or class will be voted on exclusively by the shareholders of such portfolio or class.
The Fund’s investment objective is to seek long-term capital appreciation.
The Fund currently consists of six different classes of shares: Class A, Class C, Class R, Class Y, Class R5 and Class R6. Class A shares are sold with a front-end sales charge unless certain waiver criteria are met and under certain circumstances load waived shares may be subject to contingent deferred sales charges (“CDSC”). Class C shares are sold with a CDSC. Class R, Class Y, Class R5 and Class R6 shares are sold at net asset value.
The following is a summary of the significant accounting policies followed by the Fund in the preparation of its financial statements.
| A. | Security Valuations — Securities, including restricted securities, are valued according to the following policy. |
A security listed or traded on an exchange (except convertible securities) is valued at its last sales price or official closing price as of the close of the customary trading session on the exchange where the security is principally traded, or lacking any sales or official closing price on a particular day, the security may be valued at the closing bid price on that day. Securities traded in the over-the-counter market are valued based on prices furnished by independent pricing services or market makers. When such securities are valued by an independent pricing service they may be considered fair valued. Futures contracts are valued at the final settlement price set by an exchange on which they are principally traded. Listed options are valued at the mean between the last bid and ask prices from the exchange on which they are principally traded. Options not listed on an exchange are valued by an independent source at the mean between the last bid and ask prices. For purposes of determining net asset value per share, futures and option contracts generally are valued 15 minutes after the close of the customary trading session of the New York Stock Exchange (“NYSE”).
Investments in open-end and closed-end registered investment companies that do not trade on an exchange are valued at the end of day net asset value per share. Investments in open-end and closed-end registered investment companies that trade on an exchange are valued at the last sales price or official closing price as of the close of the customary trading session on the exchange where the security is principally traded.
Swap agreements are fair valued using an evaluated quote provided by an independent pricing service. Evaluated quotes provided by the pricing service are valued based on a model which may include end of day net present values, spreads, ratings, industry, and company performance.
Debt obligations (including convertible securities) and unlisted equities are fair valued using an evaluated quote provided by an independent pricing service. Evaluated quotes provided by the pricing service may be determined without exclusive reliance on quoted prices, and may reflect appropriate factors such as institution-size trading in similar groups of securities, developments related to specific securities, dividend rate (for unlisted equities), yield (for debt obligations), quality, type of issue, coupon rate (for debt obligations), maturity (for debt obligations), individual
18 Invesco Long/Short Equity Fund
trading characteristics and other market data. Debt obligations are subject to interest rate and credit risks. In addition, all debt obligations involve some risk of default with respect to interest and/or principal payments.
Foreign securities’ (including foreign exchange contracts) prices are converted into U.S. dollar amounts using the applicable exchange rates as of the close of the NYSE. If market quotations are available and reliable for foreign exchange-traded equity securities, the securities will be valued at the market quotations. Because trading hours for certain foreign securities end before the close of the NYSE, closing market quotations may become unreliable. If between the time trading ends on a particular security and the close of the customary trading session on the NYSE, events occur that the Adviser determines are significant and make the closing price unreliable, the Fund may fair value the security. If the event is likely to have affected the closing price of the security, the security will be valued at fair value in good faith using procedures approved by the Board of Trustees. Adjustments to closing prices to reflect fair value may also be based on a screening process of an independent pricing service to indicate the degree of certainty, based on historical data, that the closing price in the principal market where a foreign security trades is not the current value as of the close of the NYSE. Foreign securities’ prices meeting the approved degree of certainty that the price is not reflective of current value will be priced at the indication of fair value from the independent pricing service. Multiple factors may be considered by the independent pricing service in determining adjustments to reflect fair value and may include information relating to sector indices, American Depositary Receipts and domestic and foreign index futures. Foreign securities may have additional risks including exchange rate changes, potential for sharply devalued currencies and high inflation, political and economic upheaval, the relative lack of issuer information, relatively low market liquidity and the potential lack of strict financial and accounting controls and standards.
Securities for which market prices are not provided by any of the above methods may be valued based upon quotes furnished by independent sources. The last bid price may be used to value equity securities. The mean between the last bid and ask prices is used to value debt obligations, including corporate loans.
Securities for which market quotations are not readily available or became unreliable are valued at fair value as determined in good faith by or under the supervision of the Trust’s officers following procedures approved by the Board of Trustees. Issuer specific events, market trends, bid/ask quotes of brokers and information providers and other market data may be reviewed in the course of making a good faith determination of a security’s fair value.
The Fund may invest in securities that are subject to interest rate risk, meaning the risk that the prices will generally fall as interest rates rise and, conversely, the prices will generally rise as interest rates fall. Specific securities differ in their sensitivity to changes in interest rates depending on their individual characteristics. Changes in interest rates may result in increased market volatility, which may affect the value and/or liquidity of certain of the Fund’s investments.
Valuations change in response to many factors including the historical and prospective earnings of the issuer, the value of the issuer’s assets, general economic conditions, interest rates, investor perceptions and market liquidity. Because of the inherent uncertainties of valuation, the values reflected in the financial statements may materially differ from the value received upon actual sale of those investments.
| B. | Securities Transactions and Investment Income — Securities transactions are accounted for on a trade date basis. Realized gains or losses on sales are computed on the basis of specific identification of the securities sold. Interest income (net of withholding tax, if any) is recorded on the accrual basis from settlement date. Dividend income (net of withholding tax, if any) is recorded on the ex-dividend date. |
The Fund may periodically participate in litigation related to Fund investments. As such, the Fund may receive proceeds from litigation settlements. Any proceeds received are included in the Statement of Operations as realized gain (loss) for investments no longer held and as unrealized gain (loss) for investments still held.
Brokerage commissions and mark ups are considered transaction costs and are recorded as an increase to the cost basis of securities purchased and/or a reduction of proceeds on a sale of securities. Such transaction costs are included in the determination of net realized and unrealized gain (loss) from investment securities reported in the Statement of Operations and the Statement of Changes in Net Assets and the net realized and unrealized gains (losses) on securities per share in the Financial Highlights. Transaction costs are included in the calculation of the Fund’s net asset value and, accordingly, they reduce the Fund’s total returns. These transaction costs are not considered operating expenses and are not reflected in net investment income reported in the Statement of Operations and Statement of Changes in Net Assets, or the net investment income per share and ratios of expenses and net investment income reported in the Financial Highlights, nor are they limited by any expense limitation arrangements between the Fund and the investment adviser.
The Fund allocates income and realized and unrealized capital gains and losses to a class based on the relative net assets of each class.
| C. | Country Determination — For the purposes of making investment selection decisions and presentation in the Schedule of Investments, the investment adviser may determine the country in which an issuer is located and/or credit risk exposure based on various factors. These factors include the laws of the country under which the issuer is organized, where the issuer maintains a principal office, the country in which the issuer derives 50% or more of its total revenues and the country that has the primary market for the issuer’s securities, as well as other criteria. Among the other criteria that may be evaluated for making this determination are the country in which the issuer maintains 50% or more of its assets, the type of security, financial guarantees and enhancements, the nature of the collateral and the sponsor organization. Country of issuer and/or credit risk exposure has been determined to be the United States of America, unless otherwise noted. |
| D. | Distributions — Distributions from net investment income and net realized capital gain, if any, are generally declared and paid annually and recorded on the ex-dividend date. The Fund may elect to treat a portion of the proceeds from redemptions as distributions for federal income tax purposes. |
| E. | Federal Income Taxes — The Fund intends to comply with the requirements of Subchapter M of the Internal Revenue Code of 1986, as amended (the “Internal Revenue Code”), necessary to qualify as a regulated investment company and to distribute substantially all of the Fund’s taxable earnings to shareholders. As such, the Fund will not be subject to federal income taxes on otherwise taxable income (including net realized capital gain) that is distributed to shareholders. Therefore, no provision for federal income taxes is recorded in the financial statements. |
The Fund recognizes the tax benefits of uncertain tax positions only when the position is more likely than not to be sustained. Management has analyzed the Fund’s uncertain tax positions and concluded that no liability for unrecognized tax benefits should be recorded related to uncertain tax positions. Management is not aware of any tax positions for which it is reasonably possible that the total amounts of unrecognized tax benefits will change materially in the next 12 months.
19 Invesco Long/Short Equity Fund
The Fund files tax returns in the U.S. Federal jurisdiction and certain other jurisdictions. Generally, the Fund is subject to examinations by such taxing authorities for up to three years after the filing of the return for the tax period.
| F. | Expenses — Fees provided for under the Rule 12b-1 plan of a particular class of the Fund are charged to the operations of such class. Transfer agency fees and expenses and other shareholder recordkeeping fees and expenses attributable to Class R5 and Class R6 are allocated to each share class based on relative net assets. Sub-accounting fees attributable to Class R5 are charged to the operations of the class. Transfer agency fees and expenses and other shareholder recordkeeping fees and expenses relating to all other classes are allocated among those classes based on relative net assets. All other expenses are allocated among the classes based on relative net assets. |
| G. | Accounting Estimates — The preparation of financial statements in conformity with accounting principles generally accepted in the United States of America (“GAAP”) requires management to make estimates and assumptions that affect the reported amounts of assets and liabilities at the date of the financial statements and the reported amounts of revenues and expenses during the reporting period including estimates and assumptions related to taxation. Actual results could differ from those estimates by a significant amount. In addition, the Fund monitors for material events or transactions that may occur or become known after the period-end date and before the date the financial statements are released to print. |
| H. | Indemnifications — Under the Trust’s organizational documents, each Trustee, officer, employee or other agent of the Trust is indemnified against certain liabilities that may arise out of the performance of their duties to the Fund. Additionally, in the normal course of business, the Fund enters into contracts, including the Fund’s servicing agreements, that contain a variety of indemnification clauses. The Fund’s maximum exposure under these arrangements is unknown as this would involve future claims that may be made against the Fund that have not yet occurred. The risk of material loss as a result of such indemnification claims is considered remote. |
| I. | Swap Agreements — The Fund may enter into various swap transactions, including interest rate, total return, volatility, variance, index, currency and credit default swap contracts (“CDS”) for investment purposes or to manage interest rate, equity, currency or credit risk. Such transactions are agreements between two parties (“Counterparties”). These agreements may contain among other conditions, events of default and termination events, and various covenants and representations such as provisions that require the Fund to maintain a pre-determined level of net assets, and/or provide limits regarding the decline of the Fund’s NAV over specific periods of time. If the Fund were to trigger such provisions and have open derivative positions at that time, the Counterparty may be able to terminate such agreement and request immediate payment in an amount equal to the net liability positions, if any. |
Interest rate, total return, volatility, variance, index, and currency swap agreements are two-party contracts entered into primarily to exchange the returns (or differentials in rates of returns) earned or realized on particular predetermined investments or instruments. The gross returns to be exchanged or “swapped” between the parties are calculated with respect to a notional amount, i.e., the return on or increase in value of a particular dollar amount invested at a particular interest rate or return of an underlying asset, in a particular foreign currency, or in a “basket” of securities representing a particular index.
A total return swap is an agreement in which one party make payments based on a set rate, either fixed or variable, while the other party make payments based on the return of an underlying asset, which includes both the income generated and capital gains, if any. The unrealized appreciation (depreciation) on total return swaps includes dividends on the underlying equity securities and financing rate payable from the Counterparty. At the maturity date, a net cash flow is exchanged where the total return is equivalent to the return of the underlying reference less a financing rate, if any. As a receiver, the Fund would receive payments based on any positive total return and would owe payments in the event of a negative total return. As the payer, the Fund would owe payments on any net positive total return, and would receive payment in the event of a negative total return.
Changes in the value of swap agreements are recognized as unrealized gains (losses) in the Statement of Operations by “marking to market” on a daily basis to reflect the value of the swap agreement at the end of each trading day. Payments received or paid at the beginning of the agreement are reflected as such on the Statement of Assets and Liabilities and may be referred to as upfront payments. The Fund accrues for the fixed payment stream and amortizes upfront payments, if any, on swap agreements on a daily basis with the net amount, recorded as a component of realized gain (loss) on the Statement of Operations. A liquidation payment received or made at the termination of a swap agreement is recorded as realized gain (loss) on the Statement of Operations. The Fund segregates liquid securities having a value at least equal to the amount of the potential obligation of a Fund under any swap transaction. Entering into these agreements involves, to varying degrees, lack of liquidity and elements of credit, market, and Counterparty risk in excess of amounts recognized on the Statement of Assets and Liabilities. Such risks involve the possibility that a swap is difficult to sell or liquidate; the Counterparty does not honor its obligations under the agreement and unfavorable interest rates and market fluctuations. It is possible that developments in the swaps market, including potential government regulation, could adversely affect the Fund’s ability to terminate existing swap agreements or to realize amounts to be received under such agreements. A short position in a security poses more risk than holding the same security long. As there is no limit on how much the price of the security can increase, the Fund’s exposure is unlimited.
| J. | Leverage Risk — Leverage exists when a Fund can lose more than it originally invests because it purchases or sells an instrument or enters into a transaction without investing an amount equal to the full economic exposure of the instrument or transaction. |
| K. | Collateral — To the extent the Fund has designated or segregated a security as collateral and that security is subsequently sold, it is the Fund’s practice to replace such collateral no later than the next business day. |
NOTE 2—Advisory Fees and Other Fees Paid to Affiliates
The Trust has entered into a master investment advisory agreement with Invesco Advisers, Inc. (the “Adviser” or “Invesco”). Under the terms of the investment advisory agreement, the Fund pays an advisory fee to the Adviser based on the annual rate of the Fund’s average daily net assets as follows:
| | | | |
| Average Daily Net Assets | | Rate | |
First $10 billion | | | 1.25% | |
Over $10 billion | | | 1.15% | |
20 Invesco Long/Short Equity Fund
For the period December 19, 2013 (commencement date) through October 31, 2014, the effective advisory fees incurred by the Fund was 1.25%.
Under the terms of a master sub-advisory agreement between the Adviser and each of Invesco Asset Management Deutschland GmbH, Invesco Asset Management Limited, Invesco Asset Management (Japan) Limited, Invesco Australia Limited, Invesco Hong Kong Limited, Invesco Senior Secured Management, Inc., Invesco Canada Ltd. and Invesco PowerShares Capital Management LLC (collectively, the “Affiliated Sub-Advisers”) the Adviser, not the Fund, may pay 40% of the fees paid to the Adviser to any such Affiliated Sub-Adviser(s) that provide(s) discretionary investment management services to the Fund based on the percentage of assets allocated to such Sub-Adviser(s).
The Adviser has contractually agreed, through at least February 29, 2016, to waive advisory fees and/or reimburse expenses to the extent necessary to limit total annual fund operating expenses after fee waiver and/or expense reimbursement (excluding certain items discussed below) of Class A, Class C, Class R, Class Y, Class R5 and Class R6 shares to 1.87%, 2.62%, 2.12%, 1.62%, 1.62% and 1.62% of average daily net assets, respectively. In determining the Adviser’s obligation to waive advisory fees and/or reimburse expenses, the following expenses are not taken into account, and could cause total annual fund operating expenses after fee waiver and/or expense reimbursement to exceed the numbers reflected above: (1) interest; (2) taxes; (3) dividend expense on short sales; (4) extraordinary or non-routine items, including litigation expenses; and (5) expenses that the Fund has incurred but did not actually pay because of an expense offset arrangement. Unless Invesco continues the fee waiver agreement, it will terminate on February 29, 2016. The fee waiver agreement cannot be terminated during its term.
Further, the Adviser has contractually agreed, through at least June 30, 2016, to waive the advisory fee payable by the Fund in an amount equal to 100% of the net advisory fees the Adviser receives from the affiliated money market funds on investments by the Fund of uninvested cash in such affiliated money market funds.
For the period December 19, 2013 (commencement date) through October 31, 2014, the Adviser waived advisory fees of $221,938 and reimbursed class level expenses of $11,767, $1,029, $17, $8,548, $55 and $21 for Class A, Class C, Class R, Class Y, Class R5 and Class R6 shares, respectively.
The Trust has entered into a master administrative services agreement with Invesco pursuant to which the Fund has agreed to pay Invesco for certain administrative costs incurred in providing accounting services to the Fund. For the period December 19, 2013 (commencement date) through October 31, 2014, expenses incurred under the agreement are shown in the Statement of Operations as Administrative services fees.
The Trust has entered into a transfer agency and service agreement with Invesco Investment Services, Inc. (“IIS”) pursuant to which the Fund has agreed to pay IIS a fee for providing transfer agency and shareholder services to the Fund and reimburse IIS for certain expenses incurred by IIS in the course of providing such services. IIS may make payments to intermediaries that provide omnibus account services, sub-accounting services and/or networking services. All fees payable by IIS to intermediaries that provide omnibus account services or sub-accounting are charged back to the Fund, subject to certain limitations approved by the Trust’s Board of Trustees. For the period December 19, 2013 (commencement date) through October 31, 2014, expenses incurred under the agreement are shown in the Statement of Operations as Transfer agent fees.
The Trust has entered into master distribution agreements with Invesco Distributors, Inc. (“IDI”) to serve as the distributor for the Class A, Class C, Class R, Class Y, Class R5 and Class R6 shares of the Fund. The Trust has adopted plans pursuant to Rule 12b-1 under the 1940 Act with respect to the Fund’s Class A, Class C and Class R shares (collectively the “Plans”). The Fund, pursuant to the Plans, pays IDI compensation at the annual rate of 0.25% of the Fund’s average daily net assets of Class A shares, 1.00% of the average daily net assets of Class C shares and 0.50% of the average daily net assets of Class R shares. Of the Plan payments, up to 0.25% of the average daily net assets of each class of shares may be paid to furnish continuing personal shareholder services to customers who purchase and own shares of such classes. Any amounts not paid as a service fee under the Plans would constitute an asset-based sales charge. Rules of the Financial Industry Regulatory Authority (“FINRA”) impose a cap on the total sales charges, including asset-based sales charges, that may be paid by any class of shares of the Fund. For the period December 19, 2013 (commencement date) through October 31, 2014, expenses incurred under the Plans are shown in the Statement of Operations as Distribution fees.
Front-end sales commissions and CDSC (collectively, the “sales charges”) are not recorded as expenses of the Fund. Front-end sales commissions are deducted from proceeds from the sales of Fund shares prior to investment in Class A shares of the Fund. CDSC are deducted from redemption proceeds prior to remittance to the shareholder. During the period December 19, 2013 (commencement date) through October 31, 2014, IDI advised the Fund that IDI retained $18,553 in front-end sales commissions from the sale of Class A shares and $2,142 from Class C shares, for CDSC imposed upon redemptions by shareholders.
Certain officers and trustees of the Trust are officers and directors of the Adviser, IIS and/or IDI.
NOTE 3—Additional Valuation Information
GAAP defines fair value as the price that would be received to sell an asset or paid to transfer a liability in an orderly transaction between market participants at the measurement date, under current market conditions. GAAP establishes a hierarchy that prioritizes the inputs to valuation methods, giving the highest priority to readily available unadjusted quoted prices in an active market for identical assets (Level 1) and the lowest priority to significant unobservable inputs (Level 3), generally when market prices are not readily available or are unreliable. Based on the valuation inputs, the securities or other investments are tiered into one of three levels. Changes in valuation methods may result in transfers in or out of an investment’s assigned level:
| | Level 1 — | Prices are determined using quoted prices in an active market for identical assets. |
| | Level 2 — | Prices are determined using other significant observable inputs. Observable inputs are inputs that other market participants may use in pricing a security. These may include quoted prices for similar securities, interest rates, prepayment speeds, credit risk, yield curves, loss severities, default rates, discount rates, volatilities and others. |
| | Level 3 — | Prices are determined using significant unobservable inputs. In situations where quoted prices or observable inputs are unavailable (for example, when there is little or no market activity for an investment at the end of the period), unobservable inputs may be used. Unobservable inputs reflect the Fund’s own assumptions about the factors market participants would use in determining fair value of the securities or instruments and would be based on the best available information. |
21 Invesco Long/Short Equity Fund
The following is a summary of the tiered valuation input levels, as of October 31, 2014. The level assigned to the securities valuations may not be an indication of the risk or liquidity associated with investing in those securities. Because of the inherent uncertainties of valuation, the values reflected in the financial statements may materially differ from the value received upon actual sale of those investments.
| | | | | | | | | | | | | | | | |
| | | Level 1 | | | Level 2 | | | Level 3 | | | Total | |
Equity Securities | | $ | 28,998,565 | | | $ | — | | | $ | — | | | $ | 28,998,565 | |
Swap Agreements* | | | — | | | | (371,438 | ) | | | — | | | | (371,438 | ) |
Total Investments | | $ | 28,998,565 | | | $ | (371,438 | ) | | $ | — | | | $ | 28,627,127 | |
| * | Unrealized appreciation (depreciation). |
NOTE 4—Derivative Investments
Value of Derivative Investments at Period-End
The table below summarizes the value of the Fund’s derivative investments, detailed by primary risk exposure, held as of October 31, 2014:
| | | | | | | | |
| | | Value | |
| Risk Exposure/Derivative Type | | Assets | | | Liabilities | |
Equity risk: | | | | | | | | |
Swap agreements(a) | | $ | 1,322,392 | | | $ | (1,693,830 | ) |
| (a) | Values are disclosed on the Statement of Assets and Liabilities under the caption Unrealized depreciation on swap agreements. |
Effect of Derivative Investments for the period December 19, 2013 (commencement date) through October 31, 2014
The table below summarizes the gains (losses) on derivative investments, detailed by primary risk exposure, recognized in earnings during the period:
| | | | |
| | | Location of Gain (Loss) on
Statement of Operations | |
| | | Swap Agreements | |
Realized Gain (Loss): | | | | |
Equity risk | | $ | (197,283 | ) |
Change in Unrealized Appreciation (Depreciation): | | | | |
Equity risk | | | (371,438 | ) |
Total | | $ | (568,721 | ) |
The table below summarizes the average notional value of swap agreements outstanding during the period.
| | | | |
| | | Swap Agreements | |
Average notional value | | $ | 45,658,108 | |
Offsetting Assets and Liabilities
Accounting Standards Update (“ASU”) No. 2011-11, Disclosures about Offsetting Assets and Liabilities, which was subsequently clarified in Financial Accounting Standards Board ASU 2013-01 “Clarifying the Scope of Disclosures about Offsetting Assets and Liabilities” is intended to enhance disclosures about financial instruments and derivative instruments that are subject to offsetting arrangements on the Statement of Assets and Liabilities and to enable investors to better understand the effect of those arrangements on its financial position. In order for an arrangement to be eligible for netting, the Fund must have a basis to conclude that such netting arrangements are legally enforceable. The Fund enters into netting agreements and collateral agreements in an attempt to reduce the Fund’s counterparty credit risk by providing for a single net settlement with a counterparty of all financial transactions covered by the agreement in an event of default as defined under such agreement.
There were no derivative instruments subject to a netting agreement for which the Fund is not currently netting. The following tables present derivative instruments that are either subject to an enforceable netting agreement or offset by collateral arrangements as of October 31, 2014.
| | | | | | | | | | | | | | | | | | | | | | | | |
| Assets: | |
| | | Gross amounts
presented in
Statement of
Assets & Liabilities | | | Gross amounts
offset in
Statement of
Assets & Liabilities | | | Net amounts of assets
presented in the
Statement of Assets and Liabilities | | | Collateral Received | | | Net
Amount | |
| Counterparty | | | | | Financial
Instruments | | | Cash | | |
Morgan Stanley & Co. LLC | | $ | 1,523,488 | | | $ | (1,523,488 | ) | | $ | — | | | $ | — | | | $ | — | | | $ | — | |
| | | | | | |
| | | | | | | | | | | | | | | | | | | | | | | | |
| Liabilities: | |
| | | Gross amounts
presented in
Statement of
Assets & Liabilities | | | Gross amounts
offset in
Statement of
Assets & Liabilities | | | Net amounts of liabilities
presented in the Statement of Assets & Liabilities | | | Collateral Received | | | Net
Amount | |
| Counterparty | | | | | Financial
Instruments | | | Cash | | |
Morgan Stanley & Co. LLC | | $ | 1,983,658 | | | $ | (1,523,488 | ) | | $ | 460,170 | | | $ | — | | | $ | (68,575 | ) | | $ | 391,595 | |
22 Invesco Long/Short Equity Fund
NOTE 5—Trustees’ and Officers’ Fees and Benefits
Trustees’ and Officers’ Fees and Benefits include amounts accrued by the Fund to pay remuneration to certain Trustees and Officers of the Fund. Trustees have the option to defer compensation payable by the Fund, and Trustees’ and Officers’ Fees and Benefits also include amounts accrued by the Fund to fund such deferred compensation amounts. Those Trustees who defer compensation have the option to select various Invesco Funds in which their deferral accounts shall be deemed to be invested. Obligations under the deferred compensation plan represents unsecured claims against the general assets of the Fund.
NOTE 6—Cash Balances
The Fund is permitted to temporarily carry a negative or overdrawn balance in its account with State Street Bank and Trust Company, the custodian bank. Such balances, if any at period end, are shown in the Statement of Assets and Liabilities under the payable caption Amount due custodian. To compensate the custodian bank for such overdrafts, the overdrawn Fund may either (1) leave funds as a compensating balance in the account so the custodian bank can be compensated by earning the additional interest; or (2) compensate by paying the custodian bank at a rate agreed upon by the custodian bank and Invesco, not to exceed the contractually agreed upon rate.
NOTE 7—Distributions to Shareholders and Tax Components of Net Assets
Tax Character of Distributions to Shareholders Paid During the period December 19, 2013 (commencement date) through October 31, 2014:
There were no ordinary income or long-term capital gain distributions during the year ended October 31, 2014.
Tax Components of Net Assets at Period-End:
| | | | |
| | | 2014 | |
Undistributed long-term gain | | $ | 6,376 | |
Net unrealized appreciation — investments | | | 194,593 | |
Temporary book/tax differences | | | (1,549 | ) |
Shares of beneficial interest | | | 32,910,280 | |
Total net assets | | $ | 33,109,700 | |
The difference between book-basis and tax-basis unrealized appreciation (depreciation) is due to differences in the timing of recognition of gains and losses on investments for tax and book purposes. The Fund’s net unrealized appreciation difference is attributable primarily to wash sales.
The temporary book/tax differences are a result of timing differences between book and tax recognition of income and/or expenses. The Fund’s temporary book/tax differences are the result of the trustee deferral of compensation and retirement plan benefits.
Capital loss carryforward is calculated and reported as of a specific date. Results of transactions and other activity after that date may affect the amount of capital loss carryforward actually available for the Fund to utilize. The ability to utilize capital loss carryforward in the future may be limited under the Internal Revenue Code and related regulations based on the results of future transactions.
The Fund does not have a capital loss carryforward as of October 31, 2014.
NOTE 8—Investment Securities
The aggregate amount of investment securities (other than short-term securities, U.S. Treasury obligations and money market funds, if any) purchased and sold by the Fund during the period December 19, 2013 (commencement date) through October 31, 2014 was $48,442,299 and $20,772,863, respectively. Cost of investments on a tax basis includes the adjustments for financial reporting purposes as the most recently completed federal income tax reporting period-end.
| | | | |
| Unrealized Appreciation (Depreciation) of Investment Securities on a Tax Basis | |
Aggregate unrealized appreciation of investment securities | | $ | 1,706,716 | |
Aggregate unrealized (depreciation) of investment securities | | | (1,512,123 | ) |
Net unrealized appreciation of investment securities | | $ | 194,593 | |
Cost of investments for tax purposes is $28,803,972.
NOTE 9—Reclassification of Permanent Differences
Primarily as a result of differing book/tax treatment of net operating losses and swap agreement income, on October 31, 2014, undistributed net investment income (loss) was increased by $406,191, undistributed net realized gain (loss) was decreased by $50,082 and shares of beneficial interest was decreased by $356,109. This reclassification had no effect on the net assets of the Fund.
23 Invesco Long/Short Equity Fund
NOTE 10—Share Information
| | | | | | | | |
| | | Summary of Share Activity | |
| | | December 19, 2013
(commencement date) through
October 31, 2014(a) | |
| | | Shares | | | Amount | |
Sold: | | | | | | | | |
Class A | | | 2,709,563 | | | $ | 30,100,662 | |
Class C | | | 358,125 | | | | 4,081,564 | |
Class R | | | 2,468 | | | | 25,838 | |
Class Y | | | 1,361,368 | | | | 14,864,488 | |
Class R5 | | | 69,434 | | | | 702,762 | |
Class R6 | | | 51,004 | | | | 510,470 | |
| | |
Reacquired: | | | | | | | | |
Class A | | | (1,182,407 | ) | | | (13,038,852 | ) |
Class C | | | (118,505 | ) | | | (1,303,111 | ) |
Class Y | | | (237,599 | ) | | | (2,631,330 | ) |
Class R5 | | | (4,331 | ) | | | (46,102 | ) |
Net increase in share activity | | | 3,009,120 | | | $ | 33,266,389 | |
| (a) | There are entities that are record owners of more than 5% of the outstanding shares of the Fund and in the aggregate own 35% of the outstanding shares of the Fund. IDI has an agreement with these entities to sell Fund shares. The Fund, Invesco and/or Invesco affiliates may make payments to these entities, which are considered to be related to the Fund, for providing services to the Fund, Invesco and/or Invesco affiliates including but not limited to services such as securities brokerage, distribution, third party record keeping and account servicing. The Fund has no knowledge as to whether all or any portion of the shares owned of record by these entities are also owned beneficially. |
| | In addition, 34% of the outstanding shares of the Fund are owned by the Adviser. |
NOTE 11—Financial Highlights
The following schedule presents financial highlights for a share of the Fund outstanding throughout the periods indicated.
| | | | | | | | | | | | | | | | | | | | | | | | | | | | | | | | | | | | | | | | | | | | |
| | | Net asset
value,
beginning
of period | | | Net
investment
income
(loss)(a) | | | Net gains
on securities
(both
realized and
unrealized) | | | Total from
investment
operations | | | Net asset
value, end
of period | | | Total
return(b) | | | Net assets,
end of period
(000’s omitted) | | | Ratio of
expenses
to average
net assets
with fee waivers
and/or expenses
absorbed | | | Ratio of
expenses
to average net
assets without
fee waivers
and/or expenses
absorbed | | | Ratio of net
investment
income (loss)
to average
net assets | | | Portfolio
turnover(c) | |
Class A | | | | | | | | | | | | | | | | | | | | | | | | | | | | | | | | | | | | | | | | | | | | |
Year ended 10/31/14(d) | | $ | 10.00 | | | $ | (0.02 | ) | | $ | 1.02 | | | $ | 1.00 | | | $ | 11.00 | | | | 10.00 | % | | $ | 16,796 | | | | 1.85 | %(e) | | | 3.04 | %(e) | | | (0.25 | )%(e) | | | 102 | % |
Class C | | | | | | | | | | | | | | | | | | | | | | | | | | | | | | | | | | | | | | | | | | | | |
Year ended 10/31/14(d) | | | 10.00 | | | | (0.10 | ) | | | 1.02 | | | | 0.92 | | | | 10.92 | | | | 9.20 | | | | 2,618 | | | | 2.60 | (e) | | | 3.79 | (e) | | | (1.00 | )(e) | | | 102 | |
Class R | | | | | | | | | | | | | | | | | | | | | | | | | | | | | | | | | | | | | | | | | | | | |
Year ended 10/31/14(d) | | | 10.00 | | | | (0.04 | ) | | | 1.02 | | | | 0.98 | | | | 10.98 | | | | 9.80 | | | | 27 | | | | 2.10 | (e) | | | 3.29 | (e) | | | (0.50 | )(e) | | | 102 | |
Class Y | | | | | | | | | | | | | | | | | | | | | | | | | | | | | | | | | | | | | | | | | | | | |
Year ended 10/31/14(d) | | | 10.00 | | | | 0.00 | | | | 1.02 | | | | 1.02 | | | | 11.02 | | | | 10.20 | | | | 12,389 | | | | 1.60 | (e) | | | 2.79 | (e) | | | 0.00 | (e) | | | 102 | |
Class R5 | | | | | | | | | | | | | | | | | | | | | | | | | | | | | | | | | | | | | | | | | | | | |
Year ended 10/31/14(d) | | | 10.00 | | | | 0.00 | | | | 1.02 | | | | 1.02 | | | | 11.02 | | | | 10.20 | | | | 718 | | | | 1.60 | (e) | | | 2.69 | (e) | | | 0.00 | (e) | | | 102 | |
Class R6 | | | | | | | | | | | | | | | | | | | | | | | | | | | | | | | | | | | | | | | | | | | | |
Year ended 10/31/14(d) | | | 10.00 | | | | 0.00 | | | | 1.02 | | | | 1.02 | | | | 11.02 | | | | 10.20 | | | | 562 | | | | 1.60 | (e) | | | 2.69 | (e) | | | 0.00 | (e) | | | 102 | |
| (a) | Calculated using average shares outstanding. |
| (b) | Includes adjustments in accordance with accounting principles generally accepted in the United States of America and as such, the net asset value for financial reporting purposes and the returns based upon those net asset values may differ from the net asset value and returns for shareholder transactions. Does not include sales charges and is not annualized for periods less than one year, if applicable. |
| (c) | Portfolio turnover is calculated at the fund level and is not annualized for periods less than one year, if applicable. |
| (d) | Commencement date of December 19, 2013. |
| (e) | Ratios are annualized and based on average daily net assets (000’s omitted) of $12,371, $1,082, $18, $8,986, $673 and $545 for Class A, Class C, Class R, Class Y, Class R5 and Class R6 shares, respectively. |
24 Invesco Long/Short Equity Fund
Report of Independent Registered Public Accounting Firm
To the Board of Trustees of AIM Investment Funds (Invesco Investment Funds)
and Shareholders of Invesco Long/Short Equity Fund:
In our opinion, the accompanying statement of assets and liabilities, including the schedule of investments, and the related statements of operations and of changes in net assets and of cash flows and the financial highlights present fairly, in all material respects, the financial position of Invesco Long/Short Equity Fund (one of the funds constituting AIM Investment Funds (Invesco Investment Funds), hereafter referred to as the “Fund”) at October 31, 2014, and the results of its operations, the changes in its net assets and its cash flows and the financial highlights for the period December 19, 2013 (commencement of operations) through October 31, 2014, in conformity with accounting principles generally accepted in the United States of America. These financial statements and financial highlights (hereafter referred to as “financial statements”) are the responsibility of the Fund’s management. Our responsibility is to express an opinion on these financial statements based on our audit. We conducted our audit of these financial statements in accordance with the standards of the Public Company Accounting Oversight Board (United States). Those standards require that we plan and perform the audit to obtain reasonable assurance about whether the financial statements are free of material misstatement. An audit includes examining, on a test basis, evidence supporting the amounts and disclosures in the financial statements, assessing the accounting principles used and significant estimates made by management, and evaluating the overall financial statement presentation. We believe that our audits, which included confirmation of securities at October 31, 2014 by correspondence with the custodian and brokers, and the application of alternative auditing procedures where confirmations of security purchases have not been received, provide a reasonable basis for our opinion.
PRICEWATERHOUSECOOPERS LLP
December 29, 2014
Houston, Texas
25 Invesco Long/Short Equity Fund
Calculating your ongoing Fund expenses
Example
As a shareholder of the Fund, you incur two types of costs: (1) transaction costs, which may include sales charges (loads) on purchase payments or contingent deferred sales charges on redemptions, if any; and (2) ongoing costs, including management fees, distribution and/or service (12b-1) fees, and other Fund expenses. This example is intended to help you understand your ongoing costs (in dollars) of investing in the Fund and to compare these costs with ongoing costs of investing in other mutual funds. The example is based on an investment of $1,000 invested at the beginning of the period and held for the entire period May 1, 2014 through October 31, 2014.
Actual expenses
The table below provides information about actual account values and actual expenses. You may use the information in this table, together with the amount you invested, to estimate the expenses that you paid over the period. Simply divide your account value by $1,000 (for example, an $8,600 account value divided by $1,000 = 8.6), then multiply the result by the number in the table under the heading entitled “Actual Expenses Paid During Period” to estimate the expenses you paid on your account during this period.
Hypothetical example for comparison purposes
The table below also provides information about hypothetical account values and hypothetical expenses based on the Fund’s actual expense ratio and an assumed rate of return of 5% per year before expenses, which is not the Fund’s actual return.
The hypothetical account values and expenses may not be used to estimate the actual ending account balance or expenses you paid for the period. You may use this information to compare the ongoing costs of investing in the Fund and other funds. To do so, compare this 5% hypothetical example with the 5% hypothetical examples that appear in the shareholder reports of the other funds.
Please note that the expenses shown in the table are meant to highlight your ongoing costs only and do not reflect any transaction costs, such as sales charges (loads) on purchase payments or contingent deferred sales charges on redemptions, if any. Therefore, the hypothetical information is useful in comparing ongoing costs only, and will not help you determine the relative total costs of owning different funds. In addition, if these transaction costs were included, your costs would have been higher.
| | | | | | | | | | | | | | | | | | | | | | | | |
| Class | | Beginning Account Value (05/01/14) | | | ACTUAL | | | HYPOTHETICAL (5% annual return before expenses) | | | Annualized Expense Ratio | |
| | | Ending Account Value (10/31/14)1 | | | Expenses Paid During Period2 | | | Ending Account Value (10/31/14) | | | Expenses Paid During Period2 | | |
| A | | $ | 1,000.00 | | | $ | 994.60 | | | $ | 9.35 | | | $ | 1,015.83 | | | $ | 9.45 | | | | 1.86 | % |
| C | | | 1,000.00 | | | | 991.80 | | | | 13.10 | | | | 1,012.05 | | | | 13.24 | | | | 2.61 | |
| R | | | 1,000.00 | | | | 993.70 | | | | 10.60 | | | | 1,014.57 | | | | 10.71 | | | | 2.11 | |
| Y | | | 1,000.00 | | | | 996.40 | | | | 8.10 | | | | 1,017.09 | | | | 8.19 | | | | 1.61 | |
| R5 | | | 1,000.00 | | | | 996.40 | | | | 8.10 | | | | 1,017.09 | | | | 8.19 | | | | 1.61 | |
| R6 | | | 1,000.00 | | | | 996.40 | | | | 8.10 | | | | 1,017.09 | | | | 8.19 | | | | 1.61 | |
| 1 | The actual ending account value is based on the actual total return of the Fund for the period May 1, 2014 through October 31, 2014, after actual expenses and will differ from the hypothetical ending account value which is based on the Fund’s expense ratio and a hypothetical annual return of 5% before expenses. |
| 2 | Expenses are equal to the Fund’s annualized expense ratio as indicated above multiplied by the average account value over the period, multiplied by 184/365 to reflect the most recent fiscal half year. |
26 Invesco Long/Short Equity Fund
Approval of Investment Advisory and Sub-Advisory Contracts
The Board of Trustees (the Board) of AIM Investment Funds (Invesco Investment Funds) is required under the Investment Company Act of 1940, as amended, to approve annually the renewal of Invesco Long/Short Equity Fund’s (the Fund) investment advisory agreements. During contract renewal meetings held on June 16-17, 2014, the Board as a whole, and the disinterested or “independent” Trustees, who comprise over 75% of the Board, voting separately, approved the continuance for the Fund of the Master Investment Advisory Agreement with Invesco Advisers, Inc. (Invesco Advisers and the investment advisory agreement) and the Master Intergroup Sub-Advisory Contract for Mutual Funds with Invesco Asset Management Deutschland GmbH, Invesco Asset Management Limited, Invesco Asset Management (Japan) Limited, Invesco Australia Limited, Invesco Hong Kong Limited, Invesco Senior Secured Management, Inc., Invesco Canada Ltd. and Invesco PowerShares Capital Management LLC (collectively, the Affiliated Sub-Advisers and the sub-advisory contracts) for another year, effective July 1, 2014.
In evaluating the fairness and reasonableness of compensation under the Fund’s investment advisory agreement and sub-advisory contracts, the Board considered, among other things, the factors discussed below. The Board determined that the continuation of the Fund’s investment advisory agreement and the sub-advisory contracts are in the best interest of the Fund and its shareholders and that the compensation payable to Invesco Advisers and the Affiliated Sub-Advisers under the agreements is fair and reasonable.
The Board’s Fund Evaluation Process
The Board’s Investments Committee has established three Sub-Committees, each of which is primarily responsible for overseeing the management of a number of the funds advised by Invesco Advisers (the Invesco Funds). The Sub-Committees meet throughout the year to review the performance of their assigned Invesco Funds, including reviewing materials prepared under the direction of the independent Senior Officer, an officer of the Invesco Funds who reports directly to the independent Trustees. Over the course of each year, the Sub-Committees meet with portfolio managers for their assigned Invesco Funds and other members of management to review the performance, investment objective(s), policies, strategies, limitations and investment risks of these funds. The Sub-Committees meet regularly and at designated contract renewal meetings each year to conduct a review of the performance, fees, expenses and other matters related to their assigned Invesco Funds. Each Sub-Committee recommends to the Investments Committee, which in turn recommends to the full Board, whether and on what terms to
approve the continuance of each Invesco Fund’s investment advisory agreement and sub-advisory contracts for another year.
During the contract renewal process, the Trustees receive comparative performance and fee data regarding the Invesco Funds prepared by Invesco Advisers and Lipper Inc. (Lipper), an independent provider of investment company data. The Trustees also receive an independent written evaluation from the Senior Officer. The Senior Officer’s evaluation is prepared as part of his responsibility to manage the process by which the Invesco Funds’ proposed management fees are negotiated during the annual contract renewal process to ensure they are negotiated in a manner that is at arms’ length and reasonable. In addition to meetings with Invesco Advisers and fund counsel, the independent Trustees also discuss the continuance of the investment advisory agreement and sub-advisory contracts in separate sessions with the Senior Officer and with independent legal counsel.
The Trustees recognized that the advisory fee rates for the Invesco Funds are, in many cases, the result of years of review and negotiation. The Trustees’ deliberations and conclusions in a particular year may be based in part on their deliberations and conclusions regarding these arrangements throughout the year and in prior years. The Trustees’ review and conclusions are based on the comprehensive consideration of all information presented to them and are not the result of any single determinative factor. Moreover, one Trustee may have weighed a particular piece of information or factor differently than another Trustee.
The discussion below serves as the Senior Officer’s independent written evaluation with respect to the Fund’s investment advisory agreement as well as a discussion of the material factors and related conclusions that formed the basis for the Board’s approval of the Fund’s investment advisory agreement and sub-advisory contracts. Unless otherwise stated, this information is current as of June 17, 2014, and may not reflect consideration of factors that became known to the Board after that date.
Factors and Conclusions and Summary of Independent Written Fee Evaluation
| A. | Nature, Extent and Quality of Services Provided by Invesco Advisers and the Affiliated Sub-Advisers |
The Board reviewed the advisory services provided to the Fund by Invesco Advisers under the Fund’s investment advisory agreement, the performance of Invesco Advisers in providing these services, and the credentials and experience of the officers and employees of Invesco Advisers who provide these services, including the Fund’s portfolio manager or managers, with whom the Sub-Committees met
during the year. The Board’s review of the qualifications of Invesco Advisers to provide advisory services included the Board’s consideration of Invesco Advisers’ investment process oversight, independent credit analysis and investment risk management. The Board also considered non-advisory services that Invesco Advisers and its affiliates provide to the Invesco Funds such as various back office support functions, equity and fixed income trading operations, internal audit, distribution and legal and compliance.
In determining whether to continue the Fund’s investment advisory agreement, the Board considered the benefits of reapproving an existing relationship and the greater uncertainty that may be associated with entering into a new relationship. The Board concluded that the nature, extent and quality of the services provided to the Fund by Invesco Advisers are appropriate and satisfactory and consistent with the terms of the Fund’s investment advisory agreement.
The Board reviewed the services that may be provided by the Affiliated Sub-Advisers under the sub-advisory contracts and the credentials and experience of the officers and employees of the Affiliated Sub-Advisers who provide these services. The Board noted that the Affiliated Sub-Advisers have offices and personnel that are located in financial centers around the world. As a result, the Affiliated Sub-Advisers can provide research and investment analysis on the markets and economies of various countries in which the Fund may invest, make recommendations regarding securities and assist with security trades. The Board concluded that the sub-advisory contracts benefit the Fund and its shareholders by permitting Invesco Advisers to use the resources and talents of the Affiliated Sub-Advisers in managing the Fund. The Board concluded that the nature, extent and quality of the services that may be provided by the Affiliated Sub-Advisers are appropriate and satisfactory and consistent with the terms of the Fund’s sub-advisory contracts.
The Board noted that the Fund recently began operations and that no comparative performance data was available.
| C. | Advisory and Sub-Advisory Fees |
The Board noted that no comparative fee information was available for the Fund.
The Board noted that Invesco Advisers has contractually agreed to waive fees and/or limit expenses of the Fund through at least December 31, 2015 in an amount necessary to limit total annual operating expenses to a specified percentage of average daily net assets for each class of the Fund.
The Board also compared the Fund’s effective advisory fee rate (the advisory fee rate after advisory fee waivers and before other expense limitations/waivers) to the effective advisory fee
27 Invesco Long/Short Equity Fund
rates of other mutual funds advised by Invesco Advisers and its affiliates that are managed using an investment process substantially similar to the investment process used for the Fund. The Board noted that the Fund’s effective advisory fee rate was the same as the effective advisory fee rate of one mutual fund with a similar investment process. The Board noted that Invesco Advisers and the Affiliated Sub-Advisers do not manage other client accounts using a substantially similar investment process.
The Board also considered the services that may be provided by the Affiliated Sub-Advisers pursuant to the sub-advisory contracts, as well as the fees payable by Invesco Advisers to the Affiliated Sub-Advisers pursuant to the sub-advisory contracts. The Board also noted that the sub-advisory fees are not paid directly by the Fund, but rather, are payable by Invesco Advisers to the Affiliated Sub-Advisers.
| D. | Economies of Scale and Breakpoints |
The Board considered the extent to which there are economies of scale in the provision of advisory services to the Fund. The Board also considered whether the Fund benefits from economies of scale through contractual breakpoints in the Fund’s advisory fee schedule and was assisted in this review by a report from the Senior Officer. The Board also noted that the Fund shares directly in economies of scale through lower fees charged by third party service providers based on the combined size of the Invesco Funds and other clients advised by Invesco Advisers.
| E. | Profitability and Financial Resources |
The Board reviewed information from Invesco Advisers concerning the costs of the advisory and other services that Invesco Advisers and its affiliates provide to the Fund and the profitability of Invesco Advisers and its affiliates in providing these services for the year ended December 31, 2013. The Board received information from Invesco Advisers about the methodology used to prepare the profitability information. The Board considered the profitability of Invesco Advisers in managing the Fund and the Invesco Funds. The Board noted that Invesco Advisers continues to operate at a net profit from services Invesco Advisers and its subsidiaries provide to the Invesco Funds. The Board noted that Invesco Advisers and its subsidiaries did not make a profit from managing the Fund as the Fund did not have a full year of operations. The Board received and accepted information from Invesco Advisers demonstrating that Invesco Advisers and each Affiliated Sub-Adviser are financially sound and have the resources necessary to perform their obligations under the investment advisory agreement and sub-advisory contracts.
| F. | Collateral Benefits to Invesco Advisers and its Affiliates |
The Board considered various other benefits received by Invesco Advisers and its affiliates from the relationship with the Fund, including the fees received for their provision of transfer agency and distribution services to the Fund.
The Board considered the performance of Invesco Advisers and its affiliates in providing these services and the organizational structure employed to provide these services. The Board also considered that these services are provided to the Fund pursuant to written contracts that are reviewed and approved on an annual basis by the Board; that the services are required for the operation of the Fund; that Invesco Advisers and its affiliates can provide services, the nature and quality of which are at least equal to those provided by others offering the same or similar services; and that the fees for such services are fair and reasonable in light of the usual and customary charges by others for services of the same nature and quality.
The Board considered the benefits realized by Invesco Advisers and the Affiliated Sub-Advisers as a result of portfolio brokerage transactions executed through “soft dollar” arrangements. The Board noted that soft dollar arrangements shift the payment obligation for research services from Invesco Advisers and the Affiliated Sub-Advisers to the Invesco Funds and that the research received may be used with other clients of Invesco Advisers and may reduce Invesco Advisers’ and the Affiliated Sub-Advisers’ expenses. The Board also considered that it receives periodic reports from the Chief Compliance Officer of the Invesco Funds demonstrating that these arrangements are consistent with regulatory requirements. The Board did not deem the soft dollar arrangements to be inappropriate.
The Board considered that the Fund’s uninvested cash and cash collateral from any securities lending arrangements may be invested in money market funds advised by Invesco Advisers pursuant to procedures approved by the Board. The Board noted that Invesco Advisers receives advisory fees from these affiliated money market funds attributable to such investments, although Invesco Advisers has contractually agreed to waive through varying periods the advisory fees payable by the Invesco Funds with respect to investments in the affiliated money market funds. The waiver is in an amount equal to 100% of the net advisory fee Invesco Advisers receives from the affiliated money market funds with respect to the Fund’s investment in the affiliated money market funds of uninvested cash, but not cash collateral. The Board concluded that the amount of advisory fees received by Invesco Advisors from the Fund’s investment of uninvested cash and cash collateral from any securities lending arrangements in the affiliated money market funds are fair and reasonable.
The Board also considered the Fund may use an affiliated broker to execute certain trades for the Fund to among other things, control information leakage, and were advised that such trades would be executed in compliance with rules under the Investment Company Act of 1940, as amended.
28 Invesco Long/Short Equity Fund
Trustees and Officers
The address of each trustee and officer is AIM Investment Funds (Invesco Investment Funds) (the “Trust”), 11 Greenway Plaza, Suite 1000, Houston, Texas 77046-1173. The trustees serve for the life of the Trust, subject to their earlier death, incapacitation, resignation, retirement or removal as more specifically provided in the Trust’s organizational documents. Each officer serves for a one year term or until their successors are elected and qualified. Column two below includes length of time served with predecessor entities, if any.
| | | | | | | | |
Name, Year of Birth and Position(s) Held with the Trust | | Trustee and/
or Officer Since | | Principal Occupation(s) During Past 5 Years | | Number of Funds in Fund Complex Overseen by Trustee | | Other Directorship(s) Held by Trustee During Past 5 Years |
| Interested Persons | | | | | | | | |
| Martin L. Flanagan1 — 1960 Trustee | | 2007 | | Executive Director, Chief Executive Officer and President, Invesco Ltd. (ultimate parent of Invesco and a global investment management firm); Advisor to the Board, Invesco Advisers, Inc. (formerly known as Invesco Institutional (N.A.), Inc.); Trustee, The Invesco Funds; Vice Chair, Investment Company Institute; and Member of Executive Board, SMU Cox School of Business Formerly: Chairman and Chief Executive Officer, Invesco Advisers, Inc. (registered investment adviser); Director, Chairman, Chief Executive Officer and President, IVZ Inc. (holding company), INVESCO Group Services, Inc. (service provider) and Invesco North American Holdings, Inc. (holding company); Director, Chief Executive Officer and President, Invesco Holding Company Limited (parent of Invesco and a global investment management firm); Director, Invesco Ltd.; Chairman, Investment Company Institute and President, Co-Chief Executive Officer, Co-President, Chief Operating Officer and Chief Financial Officer, Franklin Resources, Inc. (global investment management organization). | | 144 | | None |
Philip A. Taylor2 — 1954 Trustee, President and Principal Executive Officer | | 2006 | | Head of North American Retail and Senior Managing Director, Invesco Ltd.; Director, Co-Chairman, Co-President and Co-Chief Executive Officer, Invesco Advisers, Inc. (formerly known as Invesco Institutional (N.A.), Inc.) (registered investment adviser); Director, Chairman, Chief Executive Officer and President, Invesco Management Group, Inc. (formerly known as Invesco Aim Management Group, Inc.) (financial services holding company); Director and President, INVESCO Funds Group, Inc. (registered investment adviser and registered transfer agent); Director and Chairman, Invesco Investment Services, Inc. (formerly known as Invesco Aim Investment Services, Inc.) (registered transfer agent) and IVZ Distributors, Inc. (formerly known as INVESCO Distributors, Inc.) (registered broker dealer); Director, President and Chairman, Invesco Inc. (holding company) and Invesco Canada Holdings Inc. (holding company); Chief Executive Officer, Invesco Corporate Class Inc. (corporate mutual fund company) and Invesco Canada Fund Inc. (corporate mutual fund company); Director, Chairman and Chief Executive Officer, Invesco Canada Ltd. (formerly known as Invesco Trimark Ltd./Invesco Trimark Ltèe) (registered investment adviser and registered transfer agent); Trustee, President and Principal Executive Officer, The Invesco Funds (other than AIM Treasurer’s Series Trust (Invesco Treasurer’s Series Trust) and Short-Term Investments Trust); Trustee and Executive Vice President, The Invesco Funds (AIM Treasurer’s Series Trust (Invesco Treasurer’s Series Trust) and Short-Term Investments Trust only); Director, Invesco Investment Advisers LLC (formerly known as Van Kampen Asset Management); Director, Chief Executive Officer and President, Van Kampen Exchange Corp. Formerly: Director and Chairman, Van Kampen Investor Services Inc.; Director, Chief Executive Officer and President, 1371 Preferred Inc. (holding company) and Van Kampen Investments Inc.; Director and President, AIM GP Canada Inc. (general partner for limited partnerships) and Van Kampen Advisors, Inc.; Director and Chief Executive Officer, Invesco Trimark Dealer Inc. (registered broker dealer); Director, Invesco Distributors, Inc. (formerly known as Invesco Aim Distributors, Inc.) (registered broker dealer); Manager, Invesco PowerShares Capital Management LLC; Director, Chief Executive Officer and President, Invesco Advisers, Inc.; Director, Chairman, Chief Executive Officer and President, Invesco Aim Capital Management, Inc.; President, Invesco Trimark Dealer Inc. and Invesco Trimark Ltd./Invesco Trimark Ltèe; Director and President, AIM Trimark Corporate Class Inc. and AIM Trimark Canada Fund Inc.; Senior Managing Director, Invesco Holding Company Limited; Director and Chairman, Fund Management Company (former registered broker dealer); President and Principal Executive Officer, The Invesco Funds (AIM Treasurer’s Series Trust (Invesco Treasurer’s Series Trust), and Short-Term Investments Trust only); President, AIM Trimark Global Fund Inc. and AIM Trimark Canada Fund Inc. | | 144 | | None |
Wayne W. Whalen3 — 1939 Trustee | | 2010 | | Of Counsel, and prior to 2010, partner in the law firm of Skadden, Arps, Slate, Meagher & Flom LLP, legal counsel to certain funds in the Fund Complex | | 144 | | Director of the Mutual fund Directors Forum, a nonprofit membership organization for investment directors; Chairman and Director of the Abraham Lincoln Presidential Library Foundation; and Director of the Stevenson Center for Democracy |
| 1 | Mr. Flanagan is considered an interested person (within the meaning of Section 2(a)(19) of the 1940 Act) of the Trust because he is an officer of the Adviser to the Trust, and an officer and a director of Invesco Ltd., ultimate parent of the Adviser. |
| 2 | Mr. Taylor is considered an interested person (within the meaning of Section 2(a)(19) of the 1940 Act) of the Trust because he is an officer and a director of the Adviser. |
| 3 | Mr. Whalen is retiring effective December 31, 2014. He has been deemed to be an interested person of the Trust because of his prior service as counsel to the predecessor funds of certain Invesco open-end funds and his affiliation with the law firm that served as counsel to such predecessor funds and the Invesco closed-end funds. |
T-1 Invesco Long/Short Equity Fund
Trustees and Officers—(continued)
| | | | | | | | |
Name, Year of Birth and Position(s) Held with the Trust | | Trustee and/
or Officer Since | | Principal Occupation(s) During Past 5 Years | | Number of Funds in Fund Complex Overseen by Trustee | | Other Directorship(s) Held by Trustee During Past 5 Years |
| Independent Trustees | | | | | | | | |
Bruce L. Crockett — 1944 Trustee and Chair | | 2001 | | Chairman, Crockett Technologies Associates (technology consulting company) Formerly: Director, Captaris (unified messaging provider); Director, President and Chief Executive Officer, COMSAT Corporation; Chairman, Board of Governors of INTELSAT (international communications company); ACE Limited (insurance company); and Investment Company Institute | | 144 | | ALPS (Attorneys Liability Protection Society) (insurance company) |
David C. Arch — 1945 Trustee | | 2010 | | Chairman of Blistex Inc., a consumer health care products manufacturer | | 144 | | Board member of the Illinois Manufacturers’ Association; Member of the Board of Visitors, Institute for the Humanities, University of Michigan; Member of the Audit Committee of the Edward-Elmhurst Hospital |
Frank S. Bayley — 1939 Trustee | | 1987 | | Retired. Formerly: Director, Badgley Funds Inc. (registered investment company) (2 portfolios) and General Partner and Of Counsel, law firm of Baker & McKenzie, LLP | | 144 | | Director and Chairman, C.D. Stimson Company (a real estate investment company); Trustee, The Curtis Institute of Music |
James T. Bunch — 1942 Trustee | | 2003 | | Managing Member, Grumman Hill Group LLC (family office private equity investments) Formerly: Founder, Green Manning & Bunch Ltd. (investment banking firm) (1988-2010); Executive Committee, United States Golf Association; and Director, Policy Studies, Inc. and Van Gilder Insurance Corporation | | 144 | | Chairman, Board of Governors, Western Golf Association; Chairman, Evans Scholars Foundation; and Director, Denver Film Society |
Rodney F. Dammeyer — 1940 Trustee | | 2010 | | Chairman of CAC,LLC, (private company offering capital investment and management advisory services) Formerly: Prior to 2001, Managing Partner at Equity Group Corporate Investments; Prior to 1995, Chief Executive Officer of Itel Corporation (formerly Anixter International); Prior to 1985, experience includes Senior Vice President and Chief Financial Officer of Household International, Inc., Executive Vice President and Chief Financial Officer of Northwest Industries, Inc. and Partner of Arthur Andersen & Co.; From 1987 to 2010, Director/Trustee of investment companies in the Van Kampen Funds complex | | 144 | | Director of Quidel Corporation and Stericycle, Inc. |
Albert R. Dowden — 1941 Trustee | | 2001 | | Director of a number of public and private business corporations, including the Boss Group, Ltd. (private investment and management); Nature’s Sunshine Products, Inc. and Reich & Tang Funds (5 portfolios) (registered investment company) Formerly: Director, Homeowners of America Holding Corporation/Homeowners of America Insurance Company (property casualty company); Director, Continental Energy Services, LLC (oil and gas pipeline service); Director, CompuDyne Corporation (provider of product and services to the public security market) and Director, Annuity and Life Re (Holdings), Ltd. (reinsurance company); Director, President and Chief Executive Officer, Volvo Group North America, Inc.; Senior Vice President, AB Volvo; Director of various public and private corporations; Chairman, DHJ Media, Inc.; Director, Magellan Insurance Company; and Director, The Hertz Corporation, Genmar Corporation (boat manufacturer), National Media Corporation; Advisory Board of Rotary Power International (designer, manufacturer, and seller of rotary power engines); and Chairman, Cortland Trust, Inc. (registered investment company) | | 144 | | Director of: Nature’s Sunshine Products, Inc., Reich & Tang Funds, Homeowners of America Holding Corporation/ Homeowners of America Insurance Company, the Boss Group |
Jack M. Fields — 1952 Trustee | | 2001 | | Chief Executive Officer, Twenty First Century Group, Inc. (government affairs company); Owner and Chief Executive Officer, Dos Angeles Ranch, L.P. (cattle, hunting, corporate entertainment); and Discovery Global Education Fund (non-profit) Formerly: Chief Executive Officer, Texana Timber LP (sustainable forestry company); Director of Cross Timbers Quail Research Ranch (non-profit); and member of the U.S. House of Representatives | | 144 | | Insperity, Inc. (formerly known as Administaff) |
Prema Mathai-Davis — 1950 Trustee | | 2001 | | Retired. Formerly: Chief Executive Officer, YWCA of the U.S.A. | | 144 | | None |
Larry Soll — 1942 Trustee | | 2003 | | Retired. Formerly: Chairman, Chief Executive Officer and President, Synergen Corp. (a biotechnology company) | | 144 | | None |
Hugo F. Sonnenschein — 1940 Trustee | | 2010 | | President Emeritus and Honorary Trustee of the University of Chicago and the Adam Smith Distinguished Service Professor in the Department of Economics at the University of Chicago. Prior to 2000, President of the University of Chicago | | 144 | | Trustee of the University of Rochester and a member of its investment committee; Member of the National Academy of Sciences and the American Philosophical Society; Fellow of the American Academy of Arts and Sciences |
T-2 Invesco Long/Short Equity Fund
Trustees and Officers—(continued)
| | | | | | | | |
Name, Year of Birth and Position(s) Held with the Trust | | Trustee and/
or Officer Since | | Principal Occupation(s) During Past 5 Years | | Number of Funds in Fund Complex Overseen by Trustee | | Other Directorship(s) Held by Trustee During Past 5 Years |
| Independent Trustees—(continued) |
Raymond Stickel, Jr. — 1944 Trustee | | 2005 | | Retired. Formerly: Director, Mainstay VP Series Funds, Inc. (25 portfolios) and Partner, Deloitte & Touche | | 144 | | None |
Suzanne H. Woolsey — 1941 Trustee | | 2014 | | Chief Executive Officer of Woolsey Partners LLC | | 144 | | Emeritus Chair of the Board of Trustees of the Institute for Defense Analyses; Trustee of Colorado College; Trustee of California Institute of Technology; Prior to 2014, Director of Fluor Corp.; Prior to 2010, Trustee of the German Marshall Fund of the United States; Prior to 2010 Trustee of the Rocky Mountain Institute |
| Other Officers | | | | | | | | |
Russell C. Burk — 1958 Senior Vice President and Senior Officer | | 2005 | | Senior Vice President and Senior Officer, The Invesco Funds | | N/A | | N/A |
John M. Zerr — 1962 Senior Vice President, Chief Legal Officer and Secretary | | 2006 | | Director, Senior Vice President, Secretary and General Counsel, Invesco Management Group, Inc. (formerly known as Invesco Aim Management Group, Inc.) and Van Kampen Exchange Corp.; Senior Vice President, Invesco Advisers, Inc. (formerly known as Invesco Institutional (N.A.), Inc.) (registered investment adviser); Senior Vice President and Secretary, Invesco Distributors, Inc. (formerly known as Invesco Aim Distributors, Inc.); Director, Vice President and Secretary, Invesco Investment Services, Inc. (formerly known as Invesco Aim Investment Services, Inc.) and IVZ Distributors, Inc. (formerly known as INVESCO Distributors, Inc.); Director and Vice President, INVESCO Funds Group, Inc.; Senior Vice President, Chief Legal Officer and Secretary, The Invesco Funds; Manager, Invesco PowerShares Capital Management LLC; Director, Secretary and General Counsel, Invesco Investment Advisers LLC (formerly known as Van Kampen Asset Management); Secretary and General Counsel, Invesco Capital Markets, Inc. (formerly known as Van Kampen Funds Inc.) and Chief Legal Officer, PowerShares Exchange-Traded Fund Trust, PowerShares Exchange-Traded Fund Trust II, PowerShares India Exchange-Traded Fund Trust, PowerShares Actively Managed Exchange-Traded Fund Trust; and PowerShares Actively Managed Exchange-Traded Commodity Fund Trust Formerly: Director and Vice President, Van Kampen Advisors Inc.; Director, Vice President, Secretary and General Counsel, Van Kampen Investor Services Inc.; Director, Invesco Distributors, Inc. (formerly known as Invesco Aim Distributors, Inc.); Director, Senior Vice President, General Counsel and Secretary, Invesco Aim Advisers, Inc. and Van Kampen Investments Inc.; Director, Vice President and Secretary, Fund Management Company; Director, Senior Vice President, Secretary, General Counsel and Vice President, Invesco Aim Capital Management, Inc.; Chief Operating Officer and General Counsel, Liberty Ridge Capital, Inc. (an investment adviser); Vice President and Secretary, PBHG Funds (an investment company) and PBHG Insurance Series Fund (an investment company); Chief Operating Officer, General Counsel and Secretary, Old Mutual Investment Partners (a broker-dealer); General Counsel and Secretary, Old Mutual Fund Services (an administrator) and Old Mutual Shareholder Services (a shareholder servicing center); Executive Vice President, General Counsel and Secretary, Old Mutual Capital, Inc. (an investment adviser); and Vice President and Secretary, Old Mutual Advisors Funds (an investment company) | | N/A | | N/A |
Sheri Morris — 1964 Vice President, Treasurer and Principal Financial Officer | | 1999 | | Vice President, Treasurer and Principal Financial Officer, The Invesco Funds; Vice President, Invesco Advisers, Inc. (formerly known as Invesco Institutional (N.A.), Inc.) (registered investment adviser); and Vice President, PowerShares Exchange-Traded Fund Trust, PowerShares Exchange-Traded Fund Trust II, PowerShares India Exchange-Traded Fund Trust, PowerShares Actively Managed Exchange-Traded Fund Trust, and PowerShares Actively Managed Exchange-Traded Commodity Fund Trust Formerly: Vice President, Invesco Aim Advisers, Inc., Invesco Aim Capital Management, Inc. and Invesco Aim Private Asset Management, Inc.; Assistant Vice President and Assistant Treasurer, The Invesco Funds and Assistant Vice President, Invesco Advisers, Inc., Invesco Aim Capital Management, Inc. and Invesco Aim Private Asset Management, Inc.; and Treasurer, PowerShares Exchange-Traded Fund Trust, PowerShares Exchange-Traded Fund Trust II, PowerShares India Exchange-Traded Fund Trust and PowerShares Actively Managed Exchange-Traded Fund Trust | | N/A | | N/A |
T-3 Invesco Long/Short Equity Fund
Trustees and Officers—(continued)
| | | | | | | | |
Name, Year of Birth and Position(s) Held with the Trust | | Trustee and/
or Officer Since | | Principal Occupation(s) During Past 5 Years | | Number of Funds in Fund Complex Overseen by Trustee | | Other Directorship(s) Held by Trustee During Past 5 Years |
| Other Officers—(continued) | | | | | | | | |
Karen Dunn Kelley — 1960 Vice President | | 2004 | | Senior Managing Director, Investments; Director, Co-President, Co-Chief Executive Officer, and Co-Chairman, Invesco Advisers, Inc. (formerly known as Invesco Institutional (N.A.), Inc.) (registered investment adviser); Chairman, Invesco Senior Secured Management, Inc.; Senior Vice President, Invesco Management Group, Inc. (formerly known as Invesco Aim Management Group, Inc.); Executive Vice President, Invesco Distributors, Inc. (formerly known as Invesco Aim Distributors, Inc.); Director, Invesco Mortgage Capital Inc. and Invesco Management Company Limited; Director and President, INVESCO Asset Management (Bermuda) Ltd., Vice President, The Invesco Funds (other than AIM Treasurer’s Series Trust (Invesco Treasurer’s Series Trust) and Short-Term Investments Trust); and President and Principal Executive Officer, The Invesco Funds (AIM Treasurer’s Series Trust (Invesco Treasurer’s Series Trust) and Short-Term Investments Trust only) Formerly: Director, INVESCO Global Asset Management Limited and INVESCO Management S.A.; Senior Vice President, Van Kampen Investments Inc. and Invesco Advisers, Inc. (formerly known as Invesco Institutional (N.A.), Inc.) (registered investment adviser); Vice President, Invesco Advisers, Inc. (formerly known as Invesco Institutional (N.A.), Inc.); Director of Cash Management and Senior Vice President, Invesco Advisers, Inc. and Invesco Aim Capital Management, Inc.; Director and President, Fund Management Company; Chief Cash Management Officer, Director of Cash Management, Senior Vice President, and Managing Director, Invesco Aim Capital Management, Inc.; Director of Cash Management, Senior Vice President, and Vice President, Invesco Advisers, Inc. and The Invesco Funds (AIM Treasurer’s Series Trust (Invesco Treasurer’s Series Trust), and Short-Term Investments Trust only) | | N/A | | N/A |
Crissie M. Wisdom — 1969 Anti-Money Laundering Compliance Officer | | 2013 | | Anti-Money Laundering Compliance Officer, Invesco Advisers, Inc. (formerly known as Invesco Institutional (N.A.), Inc.) (registered investment adviser), Invesco Capital Markets, Inc. (formerly known as Van Kampen Funds Inc.), Invesco Distributors, Inc., Invesco Investment Services, Inc., Invesco Management Group, Inc., Van Kampen Exchange Corp., The Invesco Funds, and PowerShares Exchange-Traded Fund Trust, PowerShares Exchange-Traded Fund Trust II, PowerShares India Exchange-Traded Fund Trust, PowerShares Actively Managed Exchange-Traded Fund Trust and PowerShares Actively Managed Exchange-Traded Commodity Fund Trust; and Fraud Prevention Manager and Controls and Risk Analysis Manager for Invesco Investment Services, Inc. | | N/A | | N/A |
Todd L. Spillane — 1958 Chief Compliance Officer | | 2006 | | Senior Vice President, Invesco Management Group, Inc. (formerly known as Invesco Aim Management Group, Inc.) and Van Kampen Exchange Corp.; Senior Vice President and Chief Compliance Officer, Invesco Advisers, Inc. (registered investment adviser) (formerly known as Invesco Institutional (N.A.), Inc.); Chief Compliance Officer, The Invesco Funds; Vice President, Invesco Distributors, Inc. (formerly known as Invesco Aim Distributors, Inc.) and Invesco Investment Services, Inc. (formerly known as Invesco Aim Investment Services, Inc.) Formerly: Chief Compliance Officer, Invesco Funds (Chicago); Senior Vice President, Van Kampen Investments Inc.; Senior Vice President and Chief Compliance Officer, Invesco Aim Advisers, Inc. and Invesco Aim Capital Management, Inc.; Chief Compliance Officer, INVESCO Private Capital Investments, Inc. (holding company), Invesco Private Capital, Inc. (registered investment adviser), Invesco Global Asset Management (N.A.), Inc., Invesco Senior Secured Management, Inc. (registered investment adviser), Van Kampen Investor Services Inc., PowerShares Exchange-Traded Fund Trust, PowerShares Exchange-Traded Fund Trust II, PowerShares India Exchange-Traded Fund Trust and PowerShares Actively Managed Exchange-Traded Fund Trust; and Vice President, Invesco Aim Capital Management, Inc. and Fund Management Company | | N/A | | N/A |
The Statement of Additional Information of the Trust includes additional information about the Fund’s Trustees and is available upon request, without charge, by calling 1.800.959.4246. Please refer to the Fund’s prospectus for information on the Fund’s sub-advisers.
| | | | | | |
Office of the Fund 11 Greenway Plaza, Suite 1000 Houston, TX 77046-1173 | | Investment Adviser Invesco Advisers, Inc. 1555 Peachtree Street, N.E. Atlanta, GA 30309 | | Distributor Invesco Distributors, Inc. 11 Greenway Plaza, Suite 1000 Houston, TX 77046-1173 | | Auditors PricewaterhouseCoopers LLP 1000 Louisiana Street, Suite 5800 Houston, TX 77002-5678 |
| | | |
| | | | | | |
Counsel to the Fund Stradley Ronon Stevens & Young, LLP 2005 Market Street, Suite 2600 Philadelphia, PA 19103-7018 | | Counsel to the Independent Trustees Goodwin Procter LLP 901 New York Avenue, N.W. Washington, D.C. 20001 | | Transfer Agent Invesco Investment Services, Inc. 11 Greenway Plaza, Suite 1000 Houston, TX 77046-1173 | | Custodian State Street Bank and Trust Company 225 Franklin Street Boston, MA 02110-2801 |
T-4 Invesco Long/Short Equity Fund

Invesco mailing information
Send general correspondence to Invesco Investment Services, Inc., P.O. Box 219078, Kansas City, MO 64121-9078.
Important notice regarding delivery of security holder documents
To reduce Fund expenses, only one copy of most shareholder documents may be mailed to shareholders with multiple accounts at the same address (Householding). Mailing of your shareholder documents may be householded indefinitely unless you instruct us otherwise. If you do not want the mailing of these documents to be combined with those for other members of your household, please contact Invesco Investment Services, Inc. at 800 959 4246 or contact your financial institution. We will begin sending you individual copies for each account within 30 days after receiving your request.
Fund holdings and proxy voting information
The Fund provides a complete list of its holdings four times in each fiscal year, at the quarter ends. For the second and fourth quarters, the lists appear in the Fund’s semiannual and annual reports to shareholders. For the first and third quarters, the Fund files the lists with the Securities and Exchange Commission (SEC) on Form N-Q. The most recent list of portfolio holdings is available at invesco.com/completeqtrholdings. Shareholders can also look up the Fund’s Forms N-Q on the SEC website at sec.gov. Copies of the Fund’s Forms N-Q may be reviewed and copied at the SEC Public Reference Room in Washington, D.C. You can obtain information on the operation of the Public Reference Room, including information about duplicating fee charges, by calling 202 551 8090 or 800 732 0330, or by electronic request at the following email address: publicinfo@sec.gov. The SEC file numbers for the Fund are shown below.
A description of the policies and procedures that the Fund uses to determine how to vote proxies relating to portfolio securities is available without charge, upon request, from our Client Services department at 800 959 4246 or at invesco.com/proxyguidelines. The information is also available on the SEC website, sec.gov.
| | |
Information regarding how the Fund voted proxies related to its portfolio securities during the most recent 12-month period ended June 30 is available at invesco.com/proxysearch. The information is also available on the SEC website, sec.gov. Invesco Advisers, Inc. is an investment adviser; it provides investment advisory services to individual and institutional clients and does not sell securities. Invesco Distributors, Inc. is the US distributor for Invesco Ltd.’s retail mutual funds, exchange-traded funds and institutional money market funds. Both are wholly owned, indirect subsidiaries of Invesco Ltd. | |  |
SEC file numbers: 811-05426 and 033-19338 LSE-AR-1 Invesco Distributors, Inc.

Letters to Shareholders
| | |

Philip Taylor | | Dear Shareholders: This annual report includes information about your Fund, including performance data and a complete list of its investments as of the close of the reporting period. Inside, your Fund’s portfolio managers discuss how they managed your Fund and the factors that affected its performance during the reporting period. I hope you find this report of interest. During the reporting period covered by this report, the US economy showed signs of continued improvement. After contracting in the first quarter of 2014, the economy expanded strongly in the second quarter and unemployment trended lower. Much of the credit for this improvement goes to the US Federal Reserve (the Fed), which undertook an extraordinary asset purchase program following the global financial crisis. The Fed’s goal was to jumpstart the economy by encouraging banks to lend more, businesses to hire more and consumers to |
| spend more. Signs of a stronger US economy prompted the Fed to reduce, or “taper,” its asset purchase program. Despite this, interest rates remained near historical low levels due largely to heavy investor demand for bonds. While signs of economic improvement were evident in the US, European economies showed signs of weakening. That, together with geopolitical uncertainty and worries about the first diagnosed cases of Ebola outside of Africa, caused increased volatility in US and European equities. |
Extended periods of market strength can lull investors into complacency – just as prolonged periods of market weakness or volatility can discourage investors from initiating long-term investment plans. That’s why Invesco has always encouraged investors to work with a professional financial adviser who can stress the importance of starting to save and invest early and the importance of adhering to a disciplined investment plan – when times are good and when they’re uncertain. A financial adviser who knows your unique financial situation, investment goals and risk tolerance can be an invaluable partner as you seek to achieve your financial goals. He or she can offer a long-term perspective when markets are volatile and time-tested advice and guidance when your financial situation or investment goals change.
Timely information when and where you want it
Invesco’s efforts to help investors achieve their financial objectives include providing individual investors and financial professionals with timely information about the markets, the economy and investing – whenever and wherever they want it.
Our website, invesco.com/us, offers a wide range of market insights and investment perspectives. On the website, you’ll find detailed information about our funds, including prices, performance, holdings and portfolio manager commentaries. You can access information about your individual Invesco account whenever it’s convenient for you; just complete a simple, secure online registration. Use the “Log In” box on our home page to get started.
Invesco’s mobile app for iPad® (available free from the App StoreSM) allows you to obtain the same detailed information about your Fund and the same investment insights from our investment leaders, market strategists, economists and retirement experts on the go. You also can watch portfolio manager videos and have instant access to Invesco news and updates wherever you may be.
In addition to the resources accessible on our website and through our mobile app, you can obtain timely updates to help you stay informed about the markets, the economy and investing by connecting with Invesco on Twitter, LinkedIn or Facebook. You can access our blog at blog.invesco.us.com. Our goal is to provide you the information you want, when and where you want it.
Have questions?
For questions about your account, feel free to contact an Invesco client services representative at 800 959 4246. For Invesco-related questions or comments, please email me directly at phil@invesco.com.
All of us at Invesco look forward to serving your investment management needs for many years to come. Thank you for investing with us.
Sincerely,

Philip Taylor
Senior Managing Director, Invesco Ltd.
iPad is a trademark of Apple Inc., registered in the US and other countries. App Store is a service mark of Apple Inc. Invesco Distributors, Inc. is not affiliated with Apple Inc.
2 Invesco Low Volatility Emerging Markets Fund
| | |

Bruce Crockett | | Dear Fellow Shareholders: There are a variety of factors that can impact investment performance, many of which are uncontrollable by us as investors. These factors can include various economic trends and geopolitical developments. While the members of the Invesco Funds Board, which I chair, can’t dictate the performance of the Invesco funds, be assured that your Board works diligently throughout the year to focus on how your investments are managed. Our job is to represent you and your interests on a variety of fund management-related matters. We regularly monitor how the portfolio management teams of the Invesco funds are performing in light of ever-changing and often unpredictable economic and market conditions. We review the investment strategies and investment process employed by each fund’s management team as explained in the fund’s prospectus. |
| | Perhaps our most significant responsibility is conducting the annual review of the funds’ |
advisory and sub-advisory contracts with Invesco Advisers and its affiliates. This annual review, which is required by the Investment Company Act of 1940, focuses on the nature and quality of the services Invesco provides as the adviser to the Invesco funds and the reasonableness of the fees that it charges for those services. Each year, we spend months carefully reviewing information from Invesco that allows us to evaluate the quality of its services and the reasonableness of its fees. We also use information from a variety of independent sources, including materials provided by the independent senior officer of the Invesco funds, who reports directly to the independent trustees on the Board. Additionally, we meet with legal counsel and review performance and fee data prepared for us by Lipper Inc., an independent, third-party firm widely recognized as a leader in its field.
After a careful review, the members of the Invesco Funds Board approved the continuation of advisory and sub-advisory contracts with Invesco Advisers and its affiliates. Be assured that your Board will continue working on behalf of fund shareholders, keeping your needs and interests uppermost in our minds.
As always, please contact me at bruce@brucecrockett.com with any questions or concerns you may have. On behalf of the Board, we look forward to continuing to represent your interests and serving your needs.
Sincerely,

Bruce L. Crockett
Independent Chair
Invesco Funds Board of Trustees
3 Invesco Low Volatility Emerging Markets Fund
Management’s Discussion of Fund Performance
Performance summary
Invesco Low Volatility Emerging Markets Fund incepted on December 17, 2013. From the Fund’s inception to the end of the reporting period, the Fund underperformed the MSCI All Country World Index, the MSCI Emerging Markets Index and the Lipper Emerging Markets Fund Index, the Fund’s broad market, style-specific and peer group benchmarks, respectively. The consumer discretionary, consumer staples, industrials and utilities sectors contributed the most to the Fund’s performance. Also aiding Fund performance was the Fund’s underweight position in the energy sector relative to its style-specific benchmark. The financials, information technology (IT), materials and telecommunication services sectors detracted from overall Fund performance. From a geographical perspective, Fund performance was aided by its stock selection in Latin America, but hindered in the Asia/Pacific region.
Additional performance information for your Fund appears later in this report.
Fund vs. Indexes
Cumulative total returns, 12/17/13 to 10/31/14, at net asset value (NAV). Performance shown does not include applicable contingent deferred sales charges (CDSC) or front-end sales charges, which would have reduced performance.
| | | | |
Class A Shares | | | 3.20 | % |
Class C Shares | | | 2.60 | |
Class R Shares | | | 3.00 | |
Class Y Shares | | | 3.50 | |
Class R5 Shares | | | 3.50 | |
Class R6 Shares | | | 3.50 | |
MSCI All Country World Indexq (Broad Market Index) | | | 8.65 | |
MSCI Emerging Markets Indexq (Style-Specific Index) | | | 4.97 | |
Lipper Emerging Market Funds Indexn (Peer Group Index) | | | 5.44 | |
Source(s): qFactSet Research Systems Inc.; nLipper Inc.
Market conditions and your Fund
Global equity markets generally rose during the reporting period ended October 31, 2014, on signs that economic growth was accelerating as a result of the loose monetary policies of many developed countries’ central banks. While 2014 began on an optimistic note, global equity markets pulled back at various points in reaction to economic and geopolitical concerns.
These concerns included worries about potentially negative effects of the US Federal Reserve reducing the scope of its asset purchase program beginning in early 2014, an Argentine sovereign bond default and eurozone banking concerns. Global equity markets also fell as geopolitical tensions in Ukraine and the Middle East weakened the outlook for global growth.
Advanced economies such as the UK and US saw a modest but stronger rebound than Europe, where a nascent
recovery has stalled. A more supportive monetary policy in the eurozone may be positive for equity markets there, and we have seen evidence of earnings recovery coming through.
Meanwhile, the Bank of Japan remained committed to extraordinary monetary stimulus. Consumer spending in Japan has been weak for some time, and retail sales and household spending increased only gradually during the reporting period although improved corporate earnings were an encouraging sign.
Equity market performance in emerging markets was mixed. China continued to face headwinds and struggled to balance structural reforms with its desire to maintain satisfactory growth, while many countries in Asia, including India, Indonesia and the Philippines, experienced strong positive gains.
For the reporting period, both the Fund and its style-specific index posted negative returns in the energy and materials sectors. Stock selection in the consumer staples, consumer discretionary and industrials sectors was particularly strong. Stock selection in the utilities sector also aided the Fund’s performance. Stock selection in the financials, IT, materials and telecommunication services sectors dragged down overall performance.
The Fund’s stock selection process consists of four investment concepts – Earnings Expectations, Market Sentiment, Management and Quality, and Value.
Stock selection in Brazil, China and South Korea was strong, while it was weak in the Asia/Pacific region, specifically in Indonesia, Taiwan and Thailand.
The Fund’s largest contributor for the reporting period, AmorePacific Group, delivered strong performance. In addition, an overweight position in the South
| | | | |
| Portfolio Composition | | | |
| By sector | |
| | | | |
Consumer Staples | | | 16.5 | % |
Materials | | | 14.0 | |
Financials | | | 13.7 | |
Industrials | | | 13.7 | |
Consumer Discretionary | | | 11.9 | |
Utilities | | | 9.4 | |
Information Technology | | | 6.6 | |
Telecommunication Services | | | 6.1 | |
Energy | | | 1.8 | |
Health Care | | | 1.3 | |
Money Market Funds | | | | |
Plus Other Assets Less Liabilities | | | 5.0 | |
| | | | | | |
Top 10 Equity Holdings* | | | |
| | | | |
| 1. | | Huadian Power International Corp. Ltd.-Class H | | | 1.7 | % |
| 2. | | Tenaga Nasional Berhad | | | 1.6 | |
| 3. | | MRV Engenharia e Participacoes S.A. | | | 1.5 | |
| 4. | | FirstRand Ltd. | | | 1.5 | |
| 5. | | Imperial Holdings Ltd. | | | 1.5 | |
| 6. | | Hon Hai Precision Industry Co., Ltd. | | | 1.5 | |
| 7. | | Grupo Mexico S.A.B. de C.V.- Series B | | | 1.5 | |
| 8. | | TAV Havalimanlari Holding A.S. | | | 1.5 | |
| 9. | | CTBC Financial Holding Co. Ltd. | | | 1.5 | |
| 10. | | Mining and Metallurgical Co. Norilsk Nickel OJSC-ADR | | | 1.4 | |
| | | | | | |
Top Five Countries | | | |
| | | | |
| 1. | | South Korea | | | 17.4 | % |
| 2. | | Brazil | | | 13.7 | |
| 3. | | Taiwan | | | 12.2 | |
| 4. | | South Africa | | | 11.7 | |
| 5. | | Malaysia | | | 8.0 | |
| | | | | | |
Total Net Assets | | $ | 3.8 million | |
Total Number of Holdings* | | | 104 | |
The Fund’s holdings are subject to change, and there is no assurance that the Fund will continue to hold any particular security.
*Excluding money market fund holdings.
4 Invesco Low Volatility Emerging Markets Fund
Korean chemical and cosmetics company relative to the Fund’s style-specific benchmark added to its performance. High scores within our Market Sentiment and Earnings Expectations concepts generated value.
Also adding to Fund performance was an overweight position in Indonesia’s largest telecommunication company, Telekomunikasi Indonesia. Our Value concept especially generated performance for the Fund.
Stock selection in the materials sector detracted from performance versus the Fund’s style-specific benchmark. Hanwha, a South Korean company, struggled to keep pace during the reporting period. However, attractive scores in our Value concept may suggest potential upside for the stock.
In addition, an overweight position in the South African mining and minerals company African Rainbow Minerals detracted from performance relative to the Fund’s style-specific benchmark. The stock experienced a decline in our Earnings Expectations concept, but showed good scores in our Value concept.
The Fund’s stock selection model was overall a positive predictor of returns and was especially adept at navigating the intermittent shifts in investor sentiment that occurred during the reporting period. Of the Fund’s four investment concepts that make up its stock selection model, three were positive and contributed to Fund performance for the reporting period. Our Value concept worked especially well during the reporting period. Furthermore, our Earnings Expectations concept and our Management and Quality concept were additive. Our Market Sentiment concept was negative during the reporting period.
Our Value concept was one of the strongest drivers of returns over the reporting period as investors sought attractive valuation given both its upside potential and downside protection.
Our Management and Quality concept was positive for the reporting period because investors generally favored managements that protected their interests by buying back stock, reducing debt and paying out dividends.
Our Earnings Expectations concept was also positive as investors generally were willing to rely on earnings as a predictor of future returns.
Market Sentiment was the only concept to detract from our stock selection model as it was negative for the reporting period, likely due to the concept’s higher
risk profile. However, when investors had a “risk on” mentality, the concept fared well.
Thank you for your investment in Invesco Low Volatility Emerging Markets Fund.
The views and opinions expressed in management’s discussion of Fund performance are those of Invesco Advisers, Inc. These views and opinions are subject to change at any time based on factors such as market and economic conditions. These views and opinions may not be relied upon as investment advice or recommendations, or as an offer for a particular security. The information is not a complete analysis of every aspect of any market, country, industry, security or the Fund. Statements of fact are from sources considered reliable, but Invesco Advisers, Inc. makes no representation or warranty as to their completeness or accuracy. Although historical performance is no guarantee of future results, these insights may help you understand our investment management philosophy.
See important Fund and, if applicable, index disclosures later in this report.
| | |
 | | Michael Abata Chartered Financial Analyst, Portfolio Manager, is manager of Invesco Low Volatility Emerging Markets |
| Fund. He joined Invesco in 2011. Mr. Abata earned a BA in economics from Binghamton University. |
| | |
 | | Karl Georg Bayer Portfolio Manager, is manager of Invesco Low Volatility Emerging Markets Fund. He joined Invesco in 1991. |
| Mr. Bayer earned Diplom Kaufmann and Diplom Ingenieur degrees from the University of Darmstadt. |
| | |
 | | Uwe Draeger Portfolio Manager, is manager of Invesco Low Volatility Emerging Markets Fund. He joined Invesco in 2005. |
| Mr. Draeger earned a Diplom-Ökonom degree from Hoch-schule für Ökonomie Berlin, an MA from City of London Polytechnic and an MBA from Anglia Business School (Cambridge). |
| | |
 | | Nils Huter Chartered Financial Analyst, Portfolio Manager, is manager of Invesco Low Volatility Emerging Markets |
| Fund. He joined Invesco in 2007. Mr. Huter earned a business administration degree “Diplom Kaufmann (FH)” from the University of Applied Sciences and Arts in Hildesheim. |
| | |

| | Charles Ko Chartered Financial Analyst, Portfolio Manager, is manager of Invesco Low Volatility Emerging Markets |
| Fund. He joined Invesco in 2012. Mr. Ko earned a BS from MIT and an MBA from Yale University. |
| | |

| | Jens Langewand Portfolio Manager, is manager of Invesco Low Volatility Emerging Markets Fund. He joined Invesco in 2007. |
| Mr. Langewand earned a Diplom Kaufmann degree from the University of Münster and a PhD from the University of Augsburg. |
| | |

| | Andrew Waisburd Portfolio Manager, is manager of Invesco Low Volatility Emerging Markets Fund. He joined Invesco in 2008. |
| Mr. Waisburd earned a BS in statistics from Cornell University and an MS and a PhD in finance from Indiana University. |
5 Invesco Low Volatility Emerging Markets Fund
Your Fund’s Performance
Results of a $10,000 Investment – Oldest Share Class(es) since Inception
Fund and index data from 12/17/13
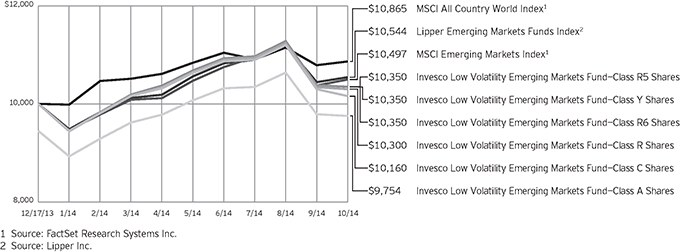
Past performance cannot guarantee comparable future results.
The data shown in the chart include reinvested distributions, applicable sales charges and Fund expenses including
management fees. Index results include reinvested dividends, but they do not reflect sales charges. Performance of the peer group, if applicable, reflects fund expenses and management fees;
performance of a market index does not. Performance shown in the chart and table(s) does not reflect deduction of taxes a shareholder would pay on Fund distributions or sale of Fund shares.
continued from page 8
resources. The securities of small- and mid-sized companies may be more volatile due to less market interest and less publicly available information about the issuer. They also may be illiquid or restricted as to resale, or may trade less frequently and in smaller volumes, all of which may cause difficulty when establishing or closing a position at a desirable price.
About indexes used in this report
| n | | The MSCI All Country World Index is a free float-adjusted market capitalization index that is designed to measure equity market performance of developed and emerging markets. The index is computed using the net return, which withholds applicable taxes for non-resident investors. |
| n | | The MSCI Emerging Markets Index is an unmanaged index considered representative of stocks of developing countries. The index is computed using the net return, which withholds applicable taxes for non-resident investors. |
| n | | The Lipper Emerging Market Funds Index is an unmanaged index considered representative of emerging market funds tracked by Lipper. |
| n | | The Fund is not managed to track the performance of any particular index, including the index(es) described here, and consequently, the performance of the Fund may deviate significantly from the performance of the
index(es). |
| n | | A direct investment cannot be made in an index. Unless otherwise indicated, index results include reinvested dividends, and they do not reflect sales charges. Performance of the peer group, if applicable, reflects fund expenses; performance of a market index does not. |
Other information
| n | | The returns shown in management’s discussion of Fund performance are based on net asset values (NAVs) calculated for shareholder transactions. Generally accepted accounting principles require adjustments to be made to the net assets of the Fund at period end for financial reporting purposes, and as such, the NAVs for shareholder transactions and the returns based on those NAVs may differ from the NAVs and returns reported in the Financial Highlights. |
| n | | Industry classifications used in this report are generally according to the Global Industry Classification Standard, which was developed by and is the exclusive property and a service mark of MSCI Inc. and Standard & Poor’s. |
6 Invesco Low Volatility Emerging Markets Fund
| | | | |
| Cumulative Total Returns | |
| As of 10/31/14, including maximum applicable sales charges | |
| |
| Class A Shares | | | | |
Inception (12/17/13) | | | -2.46 | % |
| |
Class C Shares | | | | |
Inception (12/17/13) | | | 1.60 | % |
| |
Class R Shares | | | | |
Inception (12/17/13) | | | 3.00 | % |
| |
Class Y Shares | | | | |
Inception (12/17/13) | | | 3.50 | % |
| |
Class R5 Shares | | | | |
Inception (12/17/13) | | | 3.50 | % |
| |
Class R6 Shares | | | | |
Inception (12/17/13) | | | 3.50 | % |
| | | | |
| Cumulative Total Returns | |
As of 9/30/14, the most recent calendar quarter end, including maximum applicable sales charges | |
Class A Shares | | | | |
Inception (12/17/13) | | | -2.08 | % |
| |
Class C Shares | | | | |
Inception (12/17/13) | | | 2.00 | % |
| |
Class R Shares | | | | |
Inception (12/17/13) | | | 3.40 | % |
| |
Class Y Shares | | | | |
Inception (12/17/13) | | | 3.80 | % |
| |
Class R5 Shares | | | | |
Inception (12/17/13) | | | 3.80 | % |
| |
Class R6 Shares | | | | |
Inception (12/17/13) | | | 3.80 | % |
The performance data quoted represent past performance and cannot guarantee comparable future results; current performance may be lower or higher. Please visit invesco.com/performance for the most recent month-end performance. Performance figures reflect reinvested distributions, changes in net asset value and the effect of the maximum sales charge unless otherwise stated. Investment return and principal value will fluctuate so that you may have a gain or loss when you sell shares.
The net annual Fund operating expense ratio set forth in the most recent Fund prospectus as of the date of this report for Class A, Class C, Class R, Class Y, Class R5 and Class R6 shares was 1.72%, 2.47%, 1.97%, 1.47%, 1.47% and 1.47%, respectively.1 The total annual Fund operating expense ratio set forth in the most recent Fund prospectus as of the date of this report for Class A, Class C, Class R, Class Y, Class R5 and Class R6 shares was 3.71%, 4.46%, 3.96%, 3.46%, 3.35% and 3.30%, respectively. The expense ratios presented above may vary from the expense ratios presented in other sections of this report that are based on expenses incurred during the period covered by this report.
Class A share performance reflects the maximum 5.50% sales charge, and Class C share performance reflects the applicable contingent deferred sales charge (CDSC) for the period involved. The CDSC on Class C shares is 1% for the first year after purchase. Class R, Class Y, Class R5 and Class R6 class shares do not have a front-end sales
charge or a CDSC; therefore, performance is at net asset value.
The performance of the Fund’s share classes will differ primarily due to different sales charge structures and class expenses.
Had the adviser not waived fees and/ or reimbursed expenses, performance would have been lower.
| 1 | Total annual Fund operating expenses after any contractual fee waivers and/or expense reimbursements by the adviser in effect through at least February 29, 2016. See current prospectus for more information. |
7 Invesco Low Volatility Emerging Markets Fund
Invesco Low Volatility Emerging Markets Fund’s primary investment objective is long-term growth of capital.
| n | | Unless otherwise stated, information presented in this report is as of October 31, 2014, and is based on total net assets. |
| n | | Unless otherwise noted, all data provided by Invesco. |
| n | | To access your Fund’s reports/prospectus, visit invesco.com/fundreports. |
About share classes
| n | | Class R shares are generally available only to employer sponsored retirement and benefit plans. Please see the prospectus for more information. |
| n | | Class Y shares are available only to certain investors. Please see the prospectus for more information. |
| n | | Class R5 shares and Class R6 shares are primarily intended for employer sponsored retirement and benefit plans that meet certain standards and for institutional investors. Please see the prospectus for more information. |
Principal risks of investing in the Fund
| n | | Currency/exchange rate risk. The dollar value of the Fund’s foreign investments will be affected by changes in the exchange rates between the dollar and the currencies in which those investments are traded. |
| n | | Depositary receipts risk. Depositary receipts involve many of the same risks as those associated with direct investment in foreign securities. In addition, the underlying issuers of certain depositary receipts, particularly unsponsored or unregistered depositary receipts, are under no obligation to distribute shareholder communications to the holders of such receipts or to pass through to them any voting rights with respect to the deposited securities. |
| n | | Derivatives risk. The value of a derivative instrument depends largely on (and is derived from) the value of an underlying security, currency, commodity, interest rate, index or other asset (each referred to as an underlying asset). In addition to risks relating to the underlying assets, the use of derivatives may include other, possibly greater, risks, including counterparty, leverage and liquidity risks. Counterparty risk is the risk that the counterparty to the derivative contract will default on its obligation to pay the Fund the amount owed or otherwise perform under the derivative contract. Derivatives create leverage risk because they do not require payment up front equal to the economic exposure created by owning the derivative. |
As a result, an adverse change in the value of the underlying asset could result in the Fund sustaining a loss that is substantially greater than the amount invested in the derivative, which may make the Fund’s returns more volatile and increase the risk of loss. Derivative instruments may also be less liquid than more traditional investments and the Fund may be unable to sell or close out its derivative positions at a desirable time or price. This risk may be more acute under adverse market conditions, during which the Fund may be most in need of liquidating its derivative positions. Derivatives may also be harder to value, less tax efficient and subject to changing government regulation that could impact the Fund’s ability to use certain derivatives or their cost. Also, derivatives used for hedging or to gain or limit exposure to a particular market segment may not provide the expected benefits, particularly during adverse market conditions. These risks are greater for the Fund than mutual funds that do not use derivative instruments or that use derivative instruments to a lesser extent than the Funds to implement their investment strategy.
| n | | Emerging markets securities risk. The prices of securities issued by foreign companies and governments located in emerging markets countries may be affected more negatively by inflation, devaluation of their currencies, higher transaction costs, delays in settlement, adverse political developments, the introduction of capital controls, withholding taxes, nationalization of private assets, expropriation, social unrest, war or lack of timely information than those in developed countries. |
| n | | Foreign securities risk. The Fund’s foreign investments may be affected by changes in a foreign country’s exchange rates, political and social instability, changes in economic or taxation policies, difficulties when enforcing obligations, decreased liquidity, and increased volatility. Foreign companies may be subject to less regulation resulting in less publicly available information about the companies. |
| n | | Geographic focus risk. From time to time the Fund may invest a substantial amount of its assets in securities of issuers located in a single country or a limited number of countries. If the Fund focuses its investments in this manner, it assumes the risk that economic, political and social conditions in those countries will have a significant impact on its investment performance. |
| n | | Large capitalization company risk. Larger, more established companies may be unable to respond quickly to new competitive challenges such as changes in consumer tastes or innovative smaller competitors. Returns on investments in large capitalization companies could trail the returns on investments in smaller companies. |
| n | | Management risk. The investment techniques and risk analysis used by the Fund’s portfolio managers may not produce the desired results. In particular, there is no guarantee that the portfolio manager’s stock selection process will produce lower volatility than the broader markets in which the Fund invests. In addition, the Fund’s investment strategy to seek lower volatility may cause the Fund to underperform the broader markets in which the Fund invests during market rallies. Such underperformance could be significant during sudden or significant market rallies. |
| n | | Market risk. The prices of and the income generated by the Fund’s securities may decline in response to, among other things, investor sentiment, general economic and market conditions, regional or global instability, and currency and interest rate fluctuations. |
| n | | Preferred securities risk. Preferred securities may include provisions that permit the issuer, in its discretion, to defer or omit distributions for a certain period of time. If the Fund owns a security that is deferring or omitting its distributions, the Fund may be required to report the distribution on its tax returns, even though it may not have received this income. Further, preferred securities may lose substantial value due to the omission or deferment of dividend payments. |
| n | | Small- and mid-capitalization risks. Stocks of small- and mid-sized companies tend to be more vulnerable to adverse developments and may have little or no operating history or track record of success, and limited product lines, markets, management and financial |
continued on page 6
This report must be accompanied or preceded by a currently effective Fund prospectus, which contains more complete information, including sales charges and expenses. Investors should read it carefully before investing.
| | |
| NOT FDIC INSURED | MAY LOSE VALUE | NO BANK GUARANTEE |
8 Invesco Low Volatility Emerging Markets Fund
Schedule of Investments
October 31, 2014
| | | | | | | | |
| | | Shares | | | Value | |
Common Stocks & Other Equity Interests–94.96% | |
| Brazil–13.71% | |
AES Tiete S.A.–Preference Shares | | | 4,000 | | | $ | 30,202 | |
Arteris S.A. | | | 2,400 | | | | 14,867 | |
CESP–Cia Energetica de Sao Paulo–
Class B–Preference Shares | | | 4,200 | | | | 41,407 | |
Cia Brasileira de Distribuicao–
Preference Shares | | | 1,100 | | | | 46,122 | |
Companhia de Transmissao de Energia Eletrica Paulista–Preference Shares | | | 2,100 | | | | 32,602 | |
Companhia Energetica de Minas Gerais–ADR | | | 7,192 | | | | 41,570 | |
Companhia Paranaense de Energia–Copel–Class B– Preference Shares | | | 1,200 | | | | 16,760 | |
JBS S.A. | | | 9,200 | | | | 41,025 | |
Kroton Educacional S.A. | | | 7,600 | | | | 54,163 | |
M Dias Branco S.A. | | | 600 | | | | 23,332 | |
MRV Engenharia e Participacoes S.A. | | | 17,700 | | | | 58,571 | |
Multiplus S.A. | | | 1,700 | | | | 23,840 | |
Porto Seguro S.A. | | | 3,300 | | | | 39,552 | |
Telefonica Brasil S.A.–ADR | | | 2,400 | | | | 49,056 | |
WEG S.A. | | | 910 | | | | 10,734 | |
| | | | | | | | 523,803 | |
|
| Chile–3.54% | |
Aguas Andinas S.A.–Class A | | | 16,538 | | | | 9,877 | |
Banco de Chile | | | 308,317 | | | | 37,877 | |
CAP S.A. | | | 900 | | | | 8,907 | |
Compania Cervecerias Unidas S.A.–ADR | | | 1,200 | | | | 25,572 | |
Enersis S.A. | | | 167,453 | | | | 52,985 | |
| | | | | | | | 135,218 | |
|
| China–3.92% | |
Anhui Conch Cement Co. Ltd.–Class H | | | 14,500 | | | | 47,491 | |
Guangdong Electric Power Development Co., Ltd.–Class B | | | 17,700 | | | | 11,480 | |
Huadian Power International Corp. Ltd.–
Class H | | | 84,000 | | | | 64,123 | |
Shanghai Bailian Group Co. Ltd.–Class B | | | 9,416 | | | | 12,460 | |
Shenzhen Expressway Co. Ltd.–Class H | | | 22,000 | | | | 14,071 | |
| | | | | | | | 149,625 | |
|
| Colombia–1.38% | |
Bancolombia S.A.–ADR | | | 700 | | | | 39,599 | |
Cemex Latam Holdings S.A.(a) | | | 1,459 | | | | 13,019 | |
| | | | | | | | 52,618 | |
|
| Greece–1.13% | |
Hellenic Exchanges–Athens Stock Exchange S.A. Holding | | | 1,558 | | | | 10,484 | |
OPAP S.A. | | | 2,688 | | | | 32,643 | |
| | | | | | | | 43,127 | |
|
| Hong Kong–1.10% | |
China Resources Cement Holdings Ltd. | | | 62,000 | | | | 42,132 | |
| | | | | | | | |
| | | Shares | | | Value | |
| Indonesia–3.74% | |
PT Astra Agro Lestari Tbk | | | 10,300 | | | $ | 20,198 | |
PT Indofood Sukses Makmur Tbk | | | 68,800 | | | | 38,905 | |
PT Telekomunikasi Indonesia Persero Tbk | | | 216,900 | | | | 49,785 | |
PT United Tractors Tbk | | | 22,000 | | | | 33,953 | |
| | | | | | | | 142,841 | |
|
| Malaysia–8.01% | |
AMMB Holdings Berhad | | | 25,400 | | | | 52,409 | |
Axiata Group Berhad | | | 24,100 | | | | 51,792 | |
British American Tobacco Malaysia Berhad | | | 700 | | | | 14,789 | |
DiGi.Com Berhad | | | 6,600 | | | | 12,486 | |
Hong Leong Financial Group Berhad | | | 2,100 | | | | 11,555 | |
IJM Corp. Berhad | | | 25,100 | | | | 52,860 | |
IOI Corp. Berhad | | | 33,900 | | | | 50,394 | |
Tenaga Nasional Berhad | | | 14,700 | | | | 59,703 | |
| | | | | | | | 305,988 | |
|
| Mexico–5.49% | |
Gruma, S.A.B. de C.V.–Class B(a) | | | 4,700 | | | | 51,631 | |
Grupo Aeroportuario del Pacifico S.A.B. de C.V.–ADR | | | 600 | | | | 40,890 | |
Grupo Mexico S.A.B. de C.V.–Series B | | | 16,400 | | | | 56,448 | |
Grupo Sanborns S.A.B. de C.V. | | | 7,200 | | | | 11,495 | |
Industrias Bachoco, S.A.–Series B | | | 3,400 | | | | 17,288 | |
Kimberly-Clark de Mexico, S.A.B. de C.V.–Class A | | | 13,700 | | | | 31,884 | |
| | | | | | | | 209,636 | |
|
| Philippines–0.80% | |
DMCI Holdings Inc. | | | 84,800 | | | | 30,610 | |
|
| Poland–3.68% | |
KGHM Polska Miedz S.A. | | | 1,364 | | | | 52,581 | |
Powszechna Kasa Oszczednosci Bank
Polski S.A. | | | 3,286 | | | | 36,520 | |
Powszechny Zaklad Ubezpieczen S.A. | | | 343 | | | | 51,404 | |
| | | | | | | | 140,505 | |
|
| Russia–4.37% | |
LUKOIL OAO–ADR | | | 972 | | | | 47,789 | |
Mining and Metallurgical Co. Norilsk Nickel OJSC–ADR | | | 2,956 | | | | 55,099 | |
Mobile TeleSystems OJSC–ADR | | | 3,100 | | | | 44,330 | |
NovaTek OAO–REGS–GDR(b) | | | 182 | | | | 19,547 | |
| | | | | | | | 166,765 | |
|
| South Africa–11.69% | |
African Rainbow Minerals Ltd. | | | 1,956 | | | | 24,108 | |
AVI Ltd. | | | 7,467 | | | | 48,691 | |
FirstRand Ltd. | | | 13,394 | | | | 57,336 | |
Grindrod Ltd. | | | 3,780 | | | | 7,748 | |
Imperial Holdings Ltd. | | | 3,288 | | | | 56,643 | |
Kumba Iron Ore Ltd. | | | 229 | | | | 5,721 | |
Liberty Holdings Ltd. | | | 1,476 | | | | 17,086 | |
See accompanying Notes to Financial Statements which are an integral part of the financial statements.
9 Invesco Low Volatility Emerging Markets Fund
| | | | | | | | |
| | | Shares | | | Value | |
| South Africa–(continued) | |
Mondi Ltd. | | | 1,447 | | | $ | 24,202 | |
Mr. Price Group Ltd. | | | 2,001 | | | | 41,404 | |
Netcare Ltd. | | | 16,161 | | | | 48,881 | |
Omnia Holdings Ltd. | | | 586 | | | | 11,692 | |
PPC Ltd. | | | 5,271 | | | | 14,150 | |
Sibanye Gold Ltd. | | | 14,487 | | | | 27,199 | |
SPAR Group Ltd. (The) | | | 1,840 | | | | 21,525 | |
Steinhoff International Holdings Ltd. | | | 7,815 | | | | 39,974 | |
| | | | | | | | 446,360 | |
|
| South Korea–17.36% | |
AMOREPACIFIC Group | | | 39 | | | | 43,166 | |
Coway Co., Ltd. | | | 590 | | | | 44,881 | |
E-Mart Co., Ltd. | | | 236 | | | | 43,836 | |
Hanwha Corp. | | | 2,113 | | | | 54,168 | |
Hyosung Corp. | | | 247 | | | | 14,692 | |
Hyundai Hysco Co., Ltd. | | | 635 | | | | 41,350 | |
Hyundai Marine & Fire Insurance Co., Ltd. | | | 1,361 | | | | 35,973 | |
KCC Corp. | | | 89 | | | | 49,295 | |
Kia Motors Corp. | | | 956 | | | | 46,601 | |
KT&G Corp. | | | 609 | | | | 54,130 | |
Kyongnam Bank(a) | | | 0 | | | | 4 | |
LG Hausys, Ltd. | | | 296 | | | | 44,878 | |
LS Corp. | | | 789 | | | | 44,109 | |
LS Industrial Systems Co., Ltd. | | | 370 | | | | 21,844 | |
Samsung Electronics Co., Ltd. | | | 46 | | | | 53,285 | |
SK Networks Co., Ltd.(a) | | | 2,288 | | | | 23,440 | |
Woori Finance Holdings Co. Ltd.(a) | | | 4,255 | | | | 47,374 | |
| | | | | | | | 663,026 | |
|
| Taiwan–12.19% | |
Chunghwa Telecom Co., Ltd. | | | 8,000 | | | | 24,351 | |
| | | | | | | | |
| | | Shares | | | Value | |
| Taiwan–(continued) | |
CTBC Financial Holding Co. Ltd. | | | 78,811 | | | $ | 55,217 | |
Formosa Taffeta Co., Ltd. | | | 10,000 | | | | 10,106 | |
Hon Hai Precision Industry Co., Ltd. | | | 17,920 | | | | 56,642 | |
Inotera Memories Inc.(a) | | | 14,000 | | | | 21,629 | |
Inventec Corp. | | | 43,000 | | | | 29,886 | |
Pegatron Corp. | | | 24,000 | | | | 43,816 | |
Pou Chen Corp. | | | 31,000 | | | | 34,821 | |
Radiant Opto-Electronics Corp. | | | 13,000 | | | | 45,601 | |
Taishin Financial Holding Co., Ltd. | | | 50,000 | | | | 23,850 | |
Taiwan Cement Corp. | | | 28,000 | | | | 42,774 | |
Teco Electric & Machinery Co., Ltd. | | | 34,000 | | | | 37,853 | |
Wan Hai Lines Ltd. | | | 53,000 | | | | 39,173 | |
| | | | | | | | 465,719 | |
| | |
| Turkey–2.85% | | | | | | | | |
TAV Havalimanlari Holding A.S. | | | 6,616 | | | | 55,456 | |
Turkiye Is Bankasi–Class C | | | 3,246 | | | | 8,120 | |
Ulker Biskuvi Sanayi A.S. | | | 6,134 | | | | 45,261 | |
| | | | | | | | 108,837 | |
Total Common Stocks & Other
Equity Interests
(Cost $3,632,691) | | | | 3,626,810 | |
| | |
Money Market Funds–2.96% | | | | | | | | |
Liquid Assets Portfolio–Institutional Class(c) | | | 56,540 | | | | 56,540 | |
Premier Portfolio–Institutional Class(c) | | | 56,540 | | | | 56,540 | |
Total Money Market Funds
(Cost $113,080) | | | | 113,080 | |
TOTAL INVESTMENTS–97.92%
(Cost $3,745,771) | | | | 3,739,890 | |
OTHER ASSETS LESS LIABILITIES–2.08% | | | | 79,386 | |
NET ASSETS–100.00% | | | $ | 3,819,276 | |
Investment Abbreviations:
| | |
| ADR | | – American Depositary Receipt |
| GDR | | – Global Depositary Receipt |
| REGS | | – Regulation S |
Notes to Schedule of Investments:
| (a) | Non-income producing security. |
| (b) | Security purchased or received in transaction exempt from registration under the Securities Act of 1933, as amended (the “1933 Act”). The security may be resold pursuant to an exemption from registration under the 1933 Act, typically to qualified institutional buyers. The value of this security at October 31, 2014 represented less than 1% of the Fund’s Net Assets. |
| (c) | The money market fund and the Fund are affiliated by having the same investment adviser. |
See accompanying Notes to Financial Statements which are an integral part of the financial statements.
10 Invesco Low Volatility Emerging Markets Fund
Statement of Assets and Liabilities
October 31, 2014
| | | | |
Assets: | | | | |
Investments, at value (Cost $3,632,691) | | $ | 3,626,810 | |
Investments in affiliated money market funds, at value and cost | | | 113,080 | |
Total investments, at value (Cost $3,745,771) | | | 3,739,890 | |
Foreign currencies, at value (Cost $70,238) | | | 69,266 | |
Receivable for: | | | | |
Deposits with brokers for open futures contracts | | | 6,450 | |
Variation margin — futures | | | 2,175 | |
Dividends | | | 6,402 | |
Investment for trustee deferred compensation and retirement plans | | | 1,880 | |
Fund expenses absorbed | | | 35,398 | |
Other assets | | | 10,455 | |
Total assets | | | 3,871,916 | |
| |
Liabilities: | | | | |
Payable for: | | | | |
Accrued fees to affiliates | | | 414 | |
Accrued trustees’ and officers’ fees and benefits | | | 1,911 | |
Accrued other operating expenses | | | 48,435 | |
Trustee deferred compensation and retirement plans | | | 1,880 | |
Total liabilities | | | 52,640 | |
Net assets applicable to shares outstanding | | $ | 3,819,276 | |
| |
Net assets consist of: | | | | |
Shares of beneficial interest | | $ | 3,672,473 | |
Undistributed net investment income | | | 111,161 | |
Undistributed net realized gain | | | 43,317 | |
Net unrealized appreciation (depreciation) | | | (7,675 | ) |
| | | $ | 3,819,276 | |
| | | | |
| |
Net Assets: | | | | |
Class A | | $ | 1,705,152 | |
Class C | | $ | 57,202 | |
Class R | | $ | 14,019 | |
Class Y | | $ | 1,410,587 | |
Class R5 | | $ | 477,093 | |
Class R6 | | $ | 155,223 | |
|
Shares outstanding, $0.01 par value per share,
with an unlimited number of shares authorized: | |
Class A | | | 165,164 | |
Class C | | | 5,577 | |
Class R | | | 1,361 | |
Class Y | | | 136,324 | |
Class R5 | | | 46,093 | |
Class R6 | | | 15,001 | |
Class A: | | | | |
Net asset value per share | | $ | 10.32 | |
Maximum offering price per share | | | | |
(Net asset value of $10.32 ¸ 94.50%) | | $ | 10.92 | |
Class C: | | | | |
Net asset value and offering price per share | | $ | 10.26 | |
Class R: | | | | |
Net asset value and offering price per share | | $ | 10.30 | |
Class Y: | | | | |
Net asset value and offering price per share | | $ | 10.35 | |
Class R5: | | | | |
Net asset value and offering price per share | | $ | 10.35 | |
Class R6: | | | | |
Net asset value and offering price per share | | $ | 10.35 | |
See accompanying Notes to Financial Statements which are an integral part of the financial statements.
11 Invesco Low Volatility Emerging Markets Fund
Statement of Operations
For the period December 17, 2013 (commencement date) through October 31, 2014
| | | | |
Investment income: | | | | |
Dividends (net of foreign withholding taxes of $12,697) | | $ | 105,905 | |
Dividends from affiliated money market funds | | | 67 | |
Total investment income | | | 105,972 | |
| |
Expenses: | | | | |
Advisory fees | | | 29,137 | |
Administrative services fees | | | 43,699 | |
Custodian fees | | | 19,049 | |
Distribution fees: | | | | |
Class A | | | 3,356 | |
Class C | | | 207 | |
Class R | | | 56 | |
Transfer agent fees — A, C, R and Y | | | 1,669 | |
Transfer agent fees — R5 | | | 35 | |
Transfer agent fees — R6 | | | 13 | |
Trustees’ and officers’ fees and benefits | | | 18,309 | |
Registration and filing fees | | | 87,473 | |
Professional services fees | | | 97,123 | |
Other | | | 18,319 | |
Total expenses | | | 318,445 | |
Less: Fees waived and expenses reimbursed | | | (269,243 | ) |
Net expenses | | | 49,202 | |
Net investment income | | | 56,770 | |
| |
Realized and unrealized gain (loss) from: | | | | |
Net realized gain from: | | | | |
Investment securities (net of foreign taxes on holdings of $119) | | | 35,630 | |
Foreign currencies | | | 5,726 | |
Futures contracts | | | 7,568 | |
| | | | 48,924 | |
Change in net unrealized appreciation (depreciation) of: | | | | |
Investment securities | | | (5,881 | ) |
Foreign currencies | | | (1,304 | ) |
Futures contracts | | | (490 | ) |
| | | | (7,675 | ) |
Net realized and unrealized gain | | | 41,249 | |
Net increase in net assets resulting from operations | | $ | 98,019 | |
See accompanying Notes to Financial Statements which are an integral part of the financial statements.
12 Invesco Low Volatility Emerging Markets Fund
Statement of Changes in Net Assets
For the period December 17, 2013 (commencement date) through October 31, 2014
| | | | |
| | | December 17, 2013
(commencement date) through
October 31,
2014 | |
Operations: | | | | |
Net investment income | | $ | 56,770 | |
Net realized gain | | | 48,924 | |
Change in net unrealized appreciation (depreciation) | | | (7,675 | ) |
Net increase in net assets resulting from operations | | | 98,019 | |
| |
Share transactions–net: | | | | |
Class A | | | 1,683,585 | |
Class C | | | 59,815 | |
Class R | | | 13,730 | |
Class Y | | | 1,362,792 | |
Class R5 | | | 451,325 | |
Class R6 | | | 150,010 | |
Net increase in net assets resulting from share transactions | | | 3,721,257 | |
Net increase in net assets | | | 3,819,276 | |
| |
Net assets: | | | | |
Beginning of period | | | — | |
End of period (includes undistributed net investment income of $111,161) | | $ | 3,819,276 | |
Notes to Financial Statements
October 31, 2014
NOTE 1—Significant Accounting Policies
Invesco Low Volatility Emerging Markets Fund (the “Fund”) is a series portfolio of AIM Investment Funds (Invesco Investment Funds) (the “Trust”). The Trust is organized as a Delaware statutory trust and is registered under the Investment Company Act of 1940, as amended (the “1940 Act”), as an open-end series management investment company consisting of twenty-four separate series portfolios, each authorized to issue an unlimited number of shares of beneficial interest. The assets, liabilities and operations of each portfolio are accounted for separately. Information presented in these financial statements pertains only to the Fund. Matters affecting each portfolio or class will be voted on exclusively by the shareholders of such portfolio or class.
The Fund’s primary investment objective is long-term growth of capital.
The Fund currently consists of six different classes of shares: Class A, Class C, Class R, Class Y, Class R5 and Class R6. Class A shares are sold with a front-end sales charge unless certain waiver criteria are met and under certain circumstances load waived shares may be subject to contingent deferred sales charges (“CDSC”). Class C shares are sold with a CDSC. Class R, Class Y, Class R5 and Class R6 shares are sold at net asset value.
The following is a summary of the significant accounting policies followed by the Fund in the preparation of its financial statements.
| A. | Security Valuations — Securities, including restricted securities, are valued according to the following policy. |
A security listed or traded on an exchange (except convertible securities) is valued at its last sales price or official closing price as of the close of the customary trading session on the exchange where the security is principally traded, or lacking any sales or official closing price on a particular day, the security may be valued at the closing bid price on that day. Securities traded in the over-the-counter market are valued based on prices furnished by independent pricing services or market makers. When such securities are valued by an independent pricing service they may be considered fair valued. Futures contracts are valued at the final settlement price set by an exchange on which they are principally traded. Listed options are valued at the mean between the last bid and ask prices from the exchange on which they are principally traded. Options not listed on an exchange are valued by an independent source at the mean between the last bid and ask prices. For purposes of determining net asset value per share, futures and option contracts generally are valued 15 minutes after the close of the customary trading session of the New York Stock Exchange (“NYSE”).
Investments in open-end and closed-end registered investment companies that do not trade on an exchange are valued at the end of day net asset value per share. Investments in open-end and closed-end registered investment companies that trade on an exchange are valued at the last sales price or official closing price as of the close of the customary trading session on the exchange where the security is principally traded.
Debt obligations (including convertible securities) and unlisted equities are fair valued using an evaluated quote provided by an independent pricing service. Evaluated quotes provided by the pricing service may be determined without exclusive reliance on quoted prices, and may reflect appropriate factors such as institution-size trading in similar groups of securities, developments related to specific securities, dividend rate (for unlisted equities), yield (for debt obligations), quality, type of issue, coupon rate (for debt obligations), maturity (for debt obligations), individual trading characteristics and other market data. Debt obligations are subject to interest rate and credit risks. In addition, all debt obligations involve some risk of default with respect to interest and/or principal payments.
13 Invesco Low Volatility Emerging Markets Fund
Foreign securities’ (including foreign exchange contracts) prices are converted into U.S. dollar amounts using the applicable exchange rates as of the close of the NYSE. If market quotations are available and reliable for foreign exchange-traded equity securities, the securities will be valued at the market quotations. Because trading hours for certain foreign securities end before the close of the NYSE, closing market quotations may become unreliable. If between the time trading ends on a particular security and the close of the customary trading session on the NYSE, events occur that the Adviser determines are significant and make the closing price unreliable, the Fund may fair value the security. If the event is likely to have affected the closing price of the security, the security will be valued at fair value in good faith using procedures approved by the Board of Trustees. Adjustments to closing prices to reflect fair value may also be based on a screening process of an independent pricing service to indicate the degree of certainty, based on historical data, that the closing price in the principal market where a foreign security trades is not the current value as of the close of the NYSE. Foreign securities’ prices meeting the approved degree of certainty that the price is not reflective of current value will be priced at the indication of fair value from the independent pricing service. Multiple factors may be considered by the independent pricing service in determining adjustments to reflect fair value and may include information relating to sector indices, American Depositary Receipts and domestic and foreign index futures. Foreign securities may have additional risks including exchange rate changes, potential for sharply devalued currencies and high inflation, political and economic upheaval, the relative lack of issuer information, relatively low market liquidity and the potential lack of strict financial and accounting controls and standards.
Securities for which market prices are not provided by any of the above methods may be valued based upon quotes furnished by independent sources. The last bid price may be used to value equity securities. The mean between the last bid and ask prices is used to value debt obligations, including corporate loans.
Securities for which market quotations are not readily available or became unreliable are valued at fair value as determined in good faith by or under the supervision of the Trust’s officers following procedures approved by the Board of Trustees. Issuer specific events, market trends, bid/ask quotes of brokers and information providers and other market data may be reviewed in the course of making a good faith determination of a security’s fair value.
The Fund may invest in securities that are subject to interest rate risk, meaning the risk that the prices will generally fall as interest rates rise and, conversely, the prices will generally rise as interest rates fall. Specific securities differ in their sensitivity to changes in interest rates depending on their individual characteristics. Changes in interest rates may result in increased market volatility, which may affect the value and/or liquidity of certain of the Fund’s investments.
Valuations change in response to many factors including the historical and prospective earnings of the issuer, the value of the issuer’s assets, general economic conditions, interest rates, investor perceptions and market liquidity. Because of the inherent uncertainties of valuation, the values reflected in the financial statements may materially differ from the value received upon actual sale of those investments.
| B. | Securities Transactions and Investment Income — Securities transactions are accounted for on a trade date basis. Realized gains or losses on sales are computed on the basis of specific identification of the securities sold. Interest income (net of withholding tax, if any) is recorded on the accrual basis from settlement date. Dividend income (net of withholding tax, if any) is recorded on the ex-dividend date. |
The Fund may periodically participate in litigation related to Fund investments. As such, the Fund may receive proceeds from litigation settlements. Any proceeds received are included in the Statement of Operations as realized gain (loss) for investments no longer held and as unrealized gain (loss) for investments still held.
Brokerage commissions and mark ups are considered transaction costs and are recorded as an increase to the cost basis of securities purchased and/or a reduction of proceeds on a sale of securities. Such transaction costs are included in the determination of net realized and unrealized gain (loss) from investment securities reported in the Statement of Operations and the Statement of Changes in Net Assets and the net realized and unrealized gains (losses) on securities per share in the Financial Highlights. Transaction costs are included in the calculation of the Fund’s net asset value and, accordingly, they reduce the Fund’s total returns. These transaction costs are not considered operating expenses and are not reflected in net investment income reported in the Statement of Operations and Statement of Changes in Net Assets, or the net investment income per share and ratios of expenses and net investment income reported in the Financial Highlights, nor are they limited by any expense limitation arrangements between the Fund and the investment adviser.
The Fund allocates income and realized and unrealized capital gains and losses to a class based on the relative net assets of each class.
| C. | Country Determination — For the purposes of making investment selection decisions and presentation in the Schedule of Investments, the investment adviser may determine the country in which an issuer is located and/or credit risk exposure based on various factors. These factors include the laws of the country under which the issuer is organized, where the issuer maintains a principal office, the country in which the issuer derives 50% or more of its total revenues and the country that has the primary market for the issuer’s securities, as well as other criteria. Among the other criteria that may be evaluated for making this determination are the country in which the issuer maintains 50% or more of its assets, the type of security, financial guarantees and enhancements, the nature of the collateral and the sponsor organization. Country of issuer and/or credit risk exposure has been determined to be the United States of America, unless otherwise noted. |
| D. | Distributions — Distributions from net investment income and net realized capital gain, if any, are generally declared and paid annually and recorded on the ex-dividend date. The Fund may elect to treat a portion of the proceeds from redemptions as distributions for federal income tax purposes. |
| E. | Federal Income Taxes — The Fund intends to comply with the requirements of Subchapter M of the Internal Revenue Code of 1986, as amended (the “Internal Revenue Code”), necessary to qualify as a regulated investment company and to distribute substantially all of the Fund’s taxable earnings to shareholders. As such, the Fund will not be subject to federal income taxes on otherwise taxable income (including net realized capital gain) that is distributed to shareholders. Therefore, no provision for federal income taxes is recorded in the financial statements. |
The Fund recognizes the tax benefits of uncertain tax positions only when the position is more likely than not to be sustained. Management has analyzed the Fund’s uncertain tax positions and concluded that no liability for unrecognized tax benefits should be recorded related to uncertain tax positions. Management is not aware of any tax positions for which it is reasonably possible that the total amounts of unrecognized tax benefits will change materially in the next 12 months.
The Fund files tax returns in the U.S. Federal jurisdiction and certain other jurisdictions. Generally, the Fund is subject to examinations by such taxing authorities for up to three years after the filing of the return for the tax period.
14 Invesco Low Volatility Emerging Markets Fund
| F. | Expenses — Fees provided for under the Rule 12b-1 plan of a particular class of the Fund are charged to the operations of such class. Transfer agency fees and expenses and other shareholder recordkeeping fees and expenses attributable to Class R5 and Class R6 are allocated to each share class based on relative net assets. Sub-accounting fees attributable to Class R5 are charged to the operations of the class. Transfer agency fees and expenses and other shareholder recordkeeping fees and expenses relating to all other classes are allocated among those classes based on relative net assets. All other expenses are allocated among the classes based on relative net assets. |
| G. | Accounting Estimates — The preparation of financial statements in conformity with accounting principles generally accepted in the United States of America (“GAAP”) requires management to make estimates and assumptions that affect the reported amounts of assets and liabilities at the date of the financial statements and the reported amounts of revenues and expenses during the reporting period including estimates and assumptions related to taxation. Actual results could differ from those estimates by a significant amount. In addition, the Fund monitors for material events or transactions that may occur or become known after the period-end date and before the date the financial statements are released to print. |
| H. | Indemnifications — Under the Trust’s organizational documents, each Trustee, officer, employee or other agent of the Trust is indemnified against certain liabilities that may arise out of the performance of their duties to the Fund. Additionally, in the normal course of business, the Fund enters into contracts, including the Fund’s servicing agreements that contain a variety of indemnification clauses. The Fund’s maximum exposure under these arrangements is unknown as this would involve future claims that may be made against the Fund that have not yet occurred. The risk of material loss as a result of such indemnification claims is considered remote. |
| I. | Foreign Currency Translations — Foreign currency is valued at the close of the NYSE based on quotations posted by banks and major currency dealers. Portfolio securities and other assets and liabilities denominated in foreign currencies are translated into U.S. dollar amounts at date of valuation. Purchases and sales of portfolio securities (net of foreign taxes withheld on disposition) and income items denominated in foreign currencies are translated into U.S. dollar amounts on the respective dates of such transactions. The Fund does not separately account for the portion of the results of operations resulting from changes in foreign exchange rates on investments and the fluctuations arising from changes in market prices of securities held. The combined results of changes in foreign exchange rates and the fluctuation of market prices on investments (net of estimated foreign tax withholding) are included with the net realized and unrealized gain or loss from investments in the Statement of Operations. Reported net realized foreign currency gains or losses arise from (1) sales of foreign currencies, (2) currency gains or losses realized between the trade and settlement dates on securities transactions, and (3) the difference between the amounts of dividends, interest, and foreign withholding taxes recorded on the Fund’s books and the U.S. dollar equivalent of the amounts actually received or paid. Net unrealized foreign currency gains and losses arise from changes in the fair values of assets and liabilities, other than investments in securities at fiscal period end, resulting from changes in exchange rates. |
The Fund may invest in foreign securities, which may be subject to foreign taxes on income, gains on investments or currency repatriation, a portion of which may be recoverable. Foreign taxes, if any, are recorded based on the tax regulations and rates that exist in the foreign markets in which the Fund invests and are shown in the Statement of Operations.
| J. | Forward Foreign Currency Contracts — The Fund may engage in foreign currency transactions either on a spot (i.e. for prompt delivery and settlement) basis or through forward foreign currency contracts to manage or minimize currency or exchange rate risk. |
The Fund may also enter into forward foreign currency contracts for the purchase or sale of a security denominated in a foreign currency in order to “lock in” the U.S. dollar price of that security, or the Fund may also enter into forward foreign currency contracts that do not provide for physical settlement of the two currencies, but instead are settled by a single cash payment calculated as the difference between the agreed upon exchange rate and the spot rate at settlement based upon an agreed upon notional amount (non-deliverable forwards). The Fund will set aside liquid assets in an amount equal to daily mark-to-market obligation for forward foreign currency contracts.
A forward foreign currency contract is an obligation between two parties (“Counterparties”) to purchase or sell a specific currency for an agreed-upon price at a future date. The use of forward foreign currency contracts does not eliminate fluctuations in the price of the underlying securities the Fund owns or intends to acquire but establishes a rate of exchange in advance. Fluctuations in the value of these contracts are measured by the difference in the contract date and reporting date exchange rates and are recorded as unrealized appreciation (depreciation) until the contracts are closed. When the contracts are closed, realized gains (losses) are recorded. Realized and unrealized gains (losses) on the contracts are included in the Statement of Operations. The primary risks associated with forward foreign currency contracts include failure of the Counterparty to meet the terms of the contract and the value of the foreign currency changing unfavorably. These risks may be in excess of the amounts reflected in the Statement of Assets and Liabilities.
| K. | Futures Contracts — The Fund may enter into futures contracts to manage exposure to interest rate, equity and market price movements and/or currency risks. A futures contract is an agreement between Counterparties to purchase or sell a specified underlying security, currency or commodity (or delivery of a cash settlement price, in the case of an index future) for a fixed price at a future date. The Fund currently invests only in exchange-traded futures and they are standardized as to maturity date and underlying financial instrument. Initial margin deposits required upon entering into futures contracts are satisfied by the segregation of specific securities or cash as collateral at the futures commission merchant (broker). During the period the futures contracts are open, changes in the value of the contracts are recognized as unrealized gains or losses by recalculating the value of the contracts on a daily basis. Subsequent or variation margin payments are received or made depending upon whether unrealized gains or losses are incurred. These amounts are reflected as receivables or payables on the Statement of Assets and Liabilities. When the contracts are closed or expire, the Fund recognizes a realized gain or loss equal to the difference between the proceeds from, or cost of, the closing transaction and the Fund’s basis in the contract. The net realized gain (loss) and the change in unrealized gain (loss) on futures contracts held during the period is included on the Statement of Operations. The primary risks associated with futures contracts are market risk and the absence of a liquid secondary market. If the Fund were unable to liquidate a futures contract and/or enter into an offsetting closing transaction, the Fund would continue to be subject to market risk with respect to the value of the contracts and continue to be required to maintain the margin deposits on the futures contracts. Futures contracts have minimal counterparty risk since the exchange’s clearinghouse, as counterparty to all exchange-traded futures, guarantees the futures against default. Risks may exceed amounts recognized in the Statement of Assets and Liabilities. |
15 Invesco Low Volatility Emerging Markets Fund
| L. | Collateral — To the extent the Fund has designated or segregated a security as collateral and that security is subsequently sold, it is the Fund’s practice to replace such collateral no later than the next business day. |
NOTE 2—Advisory Fees and Other Fees Paid to Affiliates
The Trust has entered into a master investment advisory agreement with Invesco Advisers, Inc. (the “Adviser” or “Invesco”). Under the terms of the investment advisory agreement, the Fund pays an advisory fee to the Adviser based on the annual rate of the Fund’s average daily net assets as follows:
| | | | |
| Average Daily Net Assets | | Rate | |
First $250 million | | | 0.935% | |
Next $250 million | | | 0.910% | |
Next $500 million | | | 0.885% | |
Next $1.5 billion | | | 0.860% | |
Next $2.5 billion | | | 0.835% | |
Next $2.5 billion | | | 0.810% | |
Next $2.5 billion | | | 0.785% | |
Over $10 billion | | | 0.760% | |
For the period December 17, 2013 (commencement date) through October 31, 2014, the effective advisory fees incurred by the Fund was 0.94%.
Under the terms of a master sub-advisory agreement between the Adviser and each of Invesco Asset Management Deutschland GmbH, Invesco Asset Management Limited, Invesco Asset Management (Japan) Limited, Invesco Australia Limited, Invesco Hong Kong Limited, Invesco Senior Secured Management, Inc., Invesco Canada Ltd. and Invesco PowerShares Capital Management LLC (collectively, the “Affiliated Sub-Advisers”) the Adviser, not the Fund, may pay 40% of the fees paid to the Adviser to any such Affiliated Sub-Adviser(s) that provide(s) discretionary investment management services to the Fund based on the percentage of assets allocated to such Sub-Adviser(s).
The Adviser has contractually agreed, through at least February 29, 2016, to waive advisory fees and/or reimburse expenses to the extent necessary to limit total annual fund operating expenses after fee waiver and/or expense reimbursement (excluding certain items discussed below) of Class A, Class C, Class R, Class Y, Class R5 and Class R6 shares to 1.72%, 2.47%, 1.97%, 1.47%, 1.47% and 1.47% of average daily net assets, respectively. In determining the Adviser’s obligation to waive advisory fees and/or reimburse expenses, the following expenses are not taken into account, and could cause total annual fund operating expenses after fee waiver and/or expense reimbursement to exceed the numbers reflected above: (1) interest; (2) taxes; (3) dividend expense on short sales; (4) extraordinary or non-routine items, including litigation expenses; and (5) expenses that the Fund has incurred but did not actually pay because of an expense offset arrangement. Unless Invesco continues the fee waiver agreement, it will terminate on February 29, 2016. The fee waiver agreement cannot be terminated during its term.
Further, the Adviser has contractually agreed, through at least June 30, 2016, to waive the advisory fee payable by the Fund in an amount equal to 100% of the net advisory fees the Adviser receives from the affiliated money market funds on investments by the Fund of uninvested cash (excluding investments of cash collateral from securities lending) in such affiliated money market funds.
For the period December 17, 2013 (commencement date) through October 31, 2014, the Adviser waived advisory fees and reimbursed fund level expenses of $267,526 and reimbursed class level expenses of $852, $13, $7, $797, $34 and $14 for Class A, Class C, Class R, Class Y, Class R5 and Class R6 shares, respectively.
The Trust has entered into a master administrative services agreement with Invesco pursuant to which the Fund has agreed to pay Invesco for certain administrative costs incurred in providing accounting services to the Fund. For the period December 17, 2013 (commencement date) through October 31, 2014, expenses incurred under the agreement are shown in the Statement of Operations as Administrative services fees.
The Trust has entered into a transfer agency and service agreement with Invesco Investment Services, Inc. (“IIS”) pursuant to which the Fund has agreed to pay IIS a fee for providing transfer agency and shareholder services to the Fund and reimburse IIS for certain expenses incurred by IIS in the course of providing such services. IIS may make payments to intermediaries that provide omnibus account services, sub-accounting services and/or networking services. All fees payable by IIS to intermediaries that provide omnibus account services or sub-accounting are charged back to the Fund, subject to certain limitations approved by the Trust’s Board of Trustees. For the period December 17, 2013 (commencement date) through October 31, 2014, expenses incurred under the agreement are shown in the Statement of Operations as Transfer agent fees.
The Trust has entered into master distribution agreements with Invesco Distributors, Inc. (“IDI”) to serve as the distributor for the Class A, Class C, Class R, Class Y, Class R5 and Class R6 shares of the Fund. The Trust has adopted plans pursuant to Rule 12b-1 under the 1940 Act with respect to the Fund’s Class A, Class C and Class R shares (collectively the “Plans”). The Fund, pursuant to the Plans, pays IDI compensation at the annual rate of 0.25% of the Fund’s average daily net assets of Class A shares, 1.00% of the average daily net assets of Class C shares and 0.50% of the average daily net assets of Class R shares. Of the Plan payments, up to 0.25% of the average daily net assets of each class of shares may be paid to furnish continuing personal shareholder services to customers who purchase and own shares of such classes. Any amounts not paid as a service fee under the Plans would constitute an asset-based sales charge. Rules of the Financial Industry Regulatory Authority (“FINRA”) impose a cap on the total sales charges, including asset-based sales charges, that may be paid by any class of shares of the Fund. For the period December 17, 2013 (commencement date) through October 31, 2014, expenses incurred under the Plans are shown in the Statement of Operations as Distribution fees.
Front-end sales commissions and CDSC (collectively, the “sales charges”) are not recorded as expenses of the Fund. Front-end sales commissions are deducted from proceeds from the sales of Fund shares prior to investment in Class A shares of the Fund. CDSC are deducted from redemption proceeds prior to remittance to the shareholder. During the period December 17, 2013 (commencement date) through October 31, 2014, IDI advised the Fund that IDI retained $1,001 in front-end sales commissions from the sale of Class A shares.
Certain officers and trustees of the Trust are officers and directors of the Adviser, IIS and/or IDI.
16 Invesco Low Volatility Emerging Markets Fund
NOTE 3—Additional Valuation Information
GAAP defines fair value as the price that would be received to sell an asset or paid to transfer a liability in an orderly transaction between market participants at the measurement date, under current market conditions. GAAP establishes a hierarchy that prioritizes the inputs to valuation methods, giving the highest priority to readily available unadjusted quoted prices in an active market for identical assets (Level 1) and the lowest priority to significant unobservable inputs (Level 3), generally when market prices are not readily available or are unreliable. Based on the valuation inputs, the securities or other investments are tiered into one of three levels. Changes in valuation methods may result in transfers in or out of an investment’s assigned level:
| | Level 1 — | Prices are determined using quoted prices in an active market for identical assets. |
| | Level 2 — | Prices are determined using other significant observable inputs. Observable inputs are inputs that other market participants may use in pricing a security. These may include quoted prices for similar securities, interest rates, prepayment speeds, credit risk, yield curves, loss severities, default rates, discount rates, volatilities and others. |
| | Level 3 — | Prices are determined using significant unobservable inputs. In situations where quoted prices or observable inputs are unavailable (for example, when there is little or no market activity for an investment at the end of the period), unobservable inputs may be used. Unobservable inputs reflect the Fund’s own assumptions about the factors market participants would use in determining fair value of the securities or instruments and would be based on the best available information. |
The following is a summary of the tiered valuation input levels, as of October 31, 2014. The level assigned to the securities valuations may not be an indication of the risk or liquidity associated with investing in those securities. Because of the inherent uncertainties of valuation, the values reflected in the financial statements may materially differ from the value received upon actual sale of those investments.
| | | | | | | | | | | | | | | | |
| | | Level 1 | | | Level 2 | | | Level 3 | | | Total | |
Brazil | | $ | 523,803 | | | $ | — | | | $ | — | | | $ | 523,803 | |
Chile | | | 25,572 | | | | 109,646 | | | | — | | | | 135,218 | |
China | | | 137,165 | | | | 12,460 | | | | — | | | | 149,625 | |
Colombia | | | 52,618 | | | | — | | | | — | | | | 52,618 | |
Greece | | | 10,484 | | | | 32,643 | | | | — | | | | 43,127 | |
Hong Kong | | | 42,132 | | | | — | | | | — | | | | 42,132 | |
Indonesia | | | — | | | | 142,841 | | | | — | | | | 142,841 | |
Malaysia | | | 136,441 | | | | 169,547 | | | | — | | | | 305,988 | |
Mexico | | | 209,636 | | | | — | | | | — | | | | 209,636 | |
Philippines | | | 30,610 | | | | — | | | | — | | | | 30,610 | |
Poland | | | 140,505 | | | | — | | | | — | | | | 140,505 | |
Russia | | | 63,877 | | | | 102,888 | | | | — | | | | 166,765 | |
South Africa | | | 419,161 | | | | 27,199 | | | | — | | | | 446,360 | |
South Korea | | | 369,971 | | | | 293,055 | | | | — | | | | 663,026 | |
Taiwan | | | 24,351 | | | | 441,368 | | | | — | | | | 465,719 | |
Turkey | | | 53,381 | | | | 55,456 | | | | — | | | | 108,837 | |
United States | | | 113,080 | | | | — | | | | — | | | | 113,080 | |
| | | | 2,352,787 | | | | 1,387,103 | | | | — | | | | 3,739,890 | |
Futures Contracts* | | | (490 | ) | | | — | | | | — | | | | (490 | ) |
Total Investments | | $ | 2,352,297 | | | $ | 1,387,103 | | | $ | — | | | $ | 3,739,400 | |
| * | Unrealized appreciation (depreciation). |
NOTE 4—Derivative Investments
Value of Derivative Investments at Period-End
The table below summarizes the value of the Fund’s derivative investments, detailed by primary risk exposure, held as of October 31, 2014:
| | | | | | | | |
| | | Value | |
| Risk Exposure/Derivative Type | | Assets | | | Liabilities | |
Market risk: | | | | | | | | |
Futures contracts(a) | | $ | — | | | $ | (490 | ) |
| (a) | Includes cumulative appreciation (depreciation) of futures contracts. Only current day’s variation margin receivable is reported within the Statement of Assets and Liabilities. |
17 Invesco Low Volatility Emerging Markets Fund
Effect of Derivative Investments for the period December 17, 2013 (commencement date) through October 31, 2014
The table below summarizes the gains (losses) on derivative investments, detailed by primary risk exposure, recognized in earnings during the period:
| | | | |
| | | Location of Gain (Loss) on
Statement of Operations | |
| | | Futures
Contracts | |
Realized Gain: | | | | |
Market risk | | $ | 7,568 | |
Change in Unrealized Appreciation (Depreciation): | | | | |
Market risk | | | (490 | ) |
Total | | $ | 7,078 | |
The table below summarizes the average notional value of futures contracts outstanding during the period.
| | | | |
| | | Futures
Contracts | |
Average notional value | | $ | 119,945 | |
| | | | | | | | | | | | | | | | | | | | |
| Open Futures Contracts(a) | |
| Futures Contracts | | Type of
Contract | | | Number of
Contracts | | | Expiration
Month | | | Notional
Value | | | Unrealized Appreciation (Depreciation) | |
MSCI Emerging Markets Mini Index | | | Long | | | | 3 | | | | December-2014 | | | $ | 152,040 | | | $ | (490 | ) |
| (a) | Futures collateralized by $6,450 cash held with Merrill Lynch, the futures commission merchant. |
NOTE 5—Trustees’ and Officers’ Fees and Benefits
Trustees’ and Officers’ Fees and Benefits include amounts accrued by the Fund to pay remuneration to certain Trustees and Officers of the Fund. Trustees have the option to defer compensation payable by the Fund, and Trustees’ and Officers’ Fees and Benefits also include amounts accrued by the Fund to fund such deferred compensation amounts. Those Trustees who defer compensation have the option to select various Invesco Funds in which their deferral accounts shall be deemed to be invested. Obligations under the deferred compensation plan represents unsecured claims against the general assets of the Fund.
NOTE 6—Cash Balances
The Fund is permitted to temporarily carry a negative or overdrawn balance in its account with State Street Bank and Trust Company, the custodian bank. Such balances, if any at period end, are shown in the Statement of Assets and Liabilities under the payable caption Amount due custodian. To compensate the custodian bank for such overdrafts, the overdrawn Fund may either (1) leave funds as a compensating balance in the account so the custodian bank can be compensated by earning the additional interest; or (2) compensate by paying the custodian bank at a rate agreed upon by the custodian bank and Invesco, not to exceed the contractually agreed upon rate.
NOTE 7—Distributions to Shareholders and Tax Components of Net Assets
Tax Character of Distributions to Shareholders Paid During the period December 17, 2013 (commencement date) through October 31, 2014:
There were no ordinary or long term gain distributions paid during the period ended December 17, 2013 (commencement date) through October 31, 2014.
Tax Components of Net Assets at Period-End:
| | | | |
| | | 2014 | |
Undistributed ordinary income | | $ | 161,387 | |
Undistributed long-term gain | | | 4,251 | |
Net unrealized appreciation (depreciation) — investments | | | (15,990 | ) |
Net unrealized appreciation (depreciation) — other investments | | | (1,304 | ) |
Temporary book/tax differences | | | (1,541 | ) |
Shares of beneficial interest | | | 3,672,473 | |
Total net assets | | $ | 3,819,276 | |
The difference between book-basis and tax-basis unrealized appreciation (depreciation) is due to differences in the timing of recognition of gains and losses on investments for tax and book purposes. The Fund’s net unrealized appreciation (depreciation) difference is attributable primarily to passive foreign investment companies and wash sales.
18 Invesco Low Volatility Emerging Markets Fund
The temporary book/tax differences are a result of timing differences between book and tax recognition of income and/or expenses. The Fund’s temporary book/tax differences are the result of the trustee deferral of compensation and retirement plan benefits.
Capital loss carryforward is calculated and reported as of a specific date. Results of transactions and other activity after that date may affect the amount of capital loss carryforward actually available for the Fund to utilize. Capital losses generated in years beginning after December 22, 2010 can be carried forward for an unlimited period, whereas previous losses expire in eight tax years. Capital losses with an expiration period may not be used to offset capital gains until all net capital losses without an expiration date have been utilized. Capital loss carryforwards with no expiration date will retain their character as either short-term or long-term capital losses instead of as short-term capital losses as under prior law. The ability to utilize capital loss carryforwards in the future may be limited under the Internal Revenue Code and related regulations based on the results of future transactions.
The Fund does not have a capital loss carryforward as of October 31, 2014.
NOTE 8—Investment Securities
The aggregate amount of investment securities (other than short-term securities, U.S. Treasury obligations and money market funds, if any) purchased and sold by the Fund during the period December 17, 2013 (commencement date) through October 31, 2014 was $4,831,634 and $1,234,688, respectively. Cost of investments on a tax basis includes the adjustments for financial reporting purposes as of the most recently completed federal income tax reporting period-end.
| | | | |
| Unrealized Appreciation (Depreciation) of Investment Securities on a Tax Basis | |
Aggregate unrealized appreciation of investment securities | | $ | 245,713 | |
Aggregate unrealized (depreciation) of investment securities | | | (261,703 | ) |
Net unrealized appreciation (depreciation) of investment securities | | $ | (15,990 | ) |
Cost of investments for tax purposes is $3,755,880.
NOTE 9—Reclassification of Permanent Differences
Primarily as a result of differing book/tax treatment of nondeductible organizational expenses and foreign currency transactions, on October 31, 2014, undistributed net investment income was increased by $54,391, undistributed net realized gain was decreased by $5,607 and shares of beneficial interest was decreased by $48,784. This reclassification had no effect on the net assets of the Fund.
NOTE 10—Share Information
| | | | | | | | |
| | | Summary of Share Activity | |
| | | December 17, 2013
(commencement date) through
October 31, 2014(a) | |
| | | Shares | | | Amount | |
Sold: | | | | | | | | |
Class A | | | 206,424 | | | $ | 2,131,506 | |
Class C | | | 5,851 | | | | 62,593 | |
Class R | | | 1,361 | | | | 13,730 | |
Class Y | | | 143,538 | | | | 1,436,470 | |
Class R5 | | | 46,638 | | | | 456,961 | |
Class R6 | | | 15,001 | | | | 150,010 | |
| | |
Reacquired: | | | | | | | | |
Class A | | | (41,260 | ) | | | (447,921 | ) |
Class C | | | (274 | ) | | | (2,778 | ) |
Class Y | | | (7,214 | ) | | | (73,678 | ) |
Class R5 | | | (545 | ) | | | (5,636 | ) |
Net increase in share activity | | | 369,520 | | | $ | 3,721,257 | |
| (a) | 90% of the outstanding shares of the Fund are owned by the Adviser. |
19 Invesco Low Volatility Emerging Markets Fund
NOTE 11—Financial Highlights
The following schedule presents financial highlights for a share of the Fund outstanding throughout the periods indicated.
| | | | | | | | | | | | | | | | | | | | | | | | | | | | | | | | | | | | | | | | | | | | |
| | | Net asset
value,
beginning
of period | | | Net
investment
income(a) | | | Net gains
on securities
(both
realized and
unrealized) | | | Total from
investment
operations | | | Net asset
value, end
of period | | | Total
return(b) | | | Net assets,
end of period
(000’s omitted) | | | Ratio of
expenses
to average
net assets
with fee waivers
and/or expenses
absorbed | | | Ratio of
expenses
to average net
assets without
fee waivers
and/or expenses
absorbed | | | Ratio of net
investment
income
to average
net assets | | | Portfolio
turnover(c) | |
Class A | | | | | | | | | | | | | | | | | | | | | | | | | | | | | | | | | | | | | | | | | | | | |
Year ended 10/31/14(d) | | $ | 10.00 | | | $ | 0.15 | | | $ | 0.17 | | | $ | 0.32 | | | $ | 10.32 | | | | 3.20 | % | | $ | 1,705 | | | | 1.71 | %(e) | | | 10.36 | %(e) | | | 1.69 | %(e) | | | 38 | % |
Class C | | | | | | | | | | | | | | | | | | | | | | | | | | | | | | | | | | | | | | | | | | | | |
Year ended 10/31/14(d) | | | 10.00 | | | | 0.09 | | | | 0.17 | | | | 0.26 | | | | 10.26 | | | | 2.60 | | | | 57 | | | | 2.46 | (e) | | | 11.11 | (e) | | | 0.94 | (e) | | | 38 | |
Class R | | | | | | | | | | | | | | | | | | | | | | | | | | | | | | | | | | | | | | | | | | | | |
Year ended 10/31/14(d) | | | 10.00 | | | | 0.13 | | | | 0.17 | | | | 0.30 | | | | 10.30 | | | | 3.00 | | | | 14 | | | | 1.96 | (e) | | | 10.61 | (e) | | | 1.44 | (e) | | | 38 | |
Class Y | | | | | | | | | | | | | | | | | | | | | | | | | | | | | | | | | | | | | | | | | | | | |
Year ended 10/31/14(d) | | | 10.00 | | | | 0.18 | | | | 0.17 | | | | 0.35 | | | | 10.35 | | | | 3.50 | | | | 1,411 | | | | 1.46 | (e) | | | 10.11 | (e) | | | 1.94 | (e) | | | 38 | |
Class R5 | | | | | | | | | | | | | | | | | | | | | | | | | | | | | | | | | | | | | | | | | | | | |
Year ended 10/31/14(d) | | | 10.00 | | | | 0.18 | | | | 0.17 | | | | 0.35 | | | | 10.35 | | | | 3.50 | | | | 477 | | | | 1.46 | (e) | | | 10.06 | (e) | | | 1.94 | (e) | | | 38 | |
Class R6 | | | | | | | | | | | | | | | | | | | | | | | | | | | | | | | | | | | | | | | | | | | | |
Year ended 10/31/14(d) | | | 10.00 | | | | 0.18 | | | | 0.17 | | | | 0.35 | | | | 10.35 | | | | 3.50 | | | | 155 | | | | 1.46 | (e) | | | 10.06 | (e) | | | 1.94 | (e) | | | 38 | |
| (a) | Calculated using average shares outstanding. |
| (b) | Includes adjustments in accordance with accounting principles generally accepted in the United States of America and as such, the net asset value for financial reporting purposes and the returns based upon those net asset values may differ from the net asset value and returns for shareholder transactions. Does not include sales charges and is not annualized for periods less than one year, if applicable. |
| (c) | Portfolio turnover is calculated at the fund level and is not annualized for periods less than one year, if applicable. |
| (d) | Commencement date of December 17, 2013. |
| (e) | Ratios are annualized and based on average daily net assets (000’s omitted) of $1,536, $24, $13, $1,437, $400 and $156 for Class A, Class C, Class R, Class Y, Class R5 and Class R6 shares, respectively. |
20 Invesco Low Volatility Emerging Markets Fund
Report of Independent Registered Public Accounting Firm
To the Board of Trustees of AIM Investment Funds (Invesco Investment Funds)
and Shareholders of Invesco Low Volatility Emerging Markets Fund:
In our opinion, the accompanying statement of assets and liabilities, including the schedule of investments, and the related statements of operations and of changes in net assets and the financial highlights present fairly, in all material respects, the financial position of Invesco Low Volatility Emerging Markets Fund (one of the funds constituting AIM Investment Funds (Invesco Investment Funds), hereafter referred to as the “Fund”) at October 31, 2014, and the results of its operations, the changes in its net assets and the financial highlights for the period December 17, 2013 (commencement of operations) through October 31, 2014, in conformity with accounting principles generally accepted in the United States of America. These financial statements and financial highlights (hereafter referred to as “financial statements”) are the responsibility of the Fund’s management. Our responsibility is to express an opinion on these financial statements based on our audit. We conducted our audit of these financial statements in accordance with the standards of the Public Company Accounting Oversight Board (United States). Those standards require that we plan and perform the audit to obtain reasonable assurance about whether the financial statements are free of material misstatement. An audit includes examining, on a test basis, evidence supporting the amounts and disclosures in the financial statements, assessing the accounting principles used and significant estimates made by management, and evaluating the overall financial statement presentation. We believe that our audit, which included confirmation of securities at October 31, 2014 by correspondence with the custodian and brokers, provides a reasonable basis for our opinion.
PRICEWATERHOUSECOOPERS LLP
December 23, 2014
Houston, Texas
21 Invesco Low Volatility Emerging Markets Fund
Calculating your ongoing Fund expenses
Example
As a shareholder of the Fund, you incur two types of costs: (1) transaction costs, which may include sales charges (loads) on purchase payments or contingent deferred sales charges on redemptions, if any; and (2) ongoing costs, including management fees, distribution and/or service (12b-1) fees, and other Fund expenses. This example is intended to help you understand your ongoing costs (in dollars) of investing in the Fund and to compare these costs with ongoing costs of investing in other mutual funds. The example is based on an investment of $1,000 invested at the beginning of the period and held for the entire period May 1, 2014 through October 31, 2014.
Actual expenses
The table below provides information about actual account values and actual expenses. You may use the information in this table, together with the amount you invested, to estimate the expenses that you paid over the period. Simply divide your account value by $1,000 (for example, an $8,600 account value divided by $1,000 = 8.6), then multiply the result by the number in the table under the heading entitled “Actual Expenses Paid During Period” to estimate the expenses you paid on your account during this period.
Hypothetical example for comparison purposes
The table below also provides information about hypothetical account values and hypothetical expenses based on the Fund’s actual expense ratio and an assumed rate of return of 5% per year before expenses, which is not the Fund’s actual return.
The hypothetical account values and expenses may not be used to estimate the actual ending account balance or expenses you paid for the period. You may use this information to compare the ongoing costs of investing in the Fund and other funds. To do so, compare this 5% hypothetical example with the 5% hypothetical examples that appear in the shareholder reports of the other funds.
Please note that the expenses shown in the table are meant to highlight your ongoing costs only and do not reflect any transaction costs, such as sales charges (loads) on purchase payments or contingent deferred sales charges on redemptions, if any. Therefore, the hypothetical information is useful in comparing ongoing costs only, and will not help you determine the relative total costs of owning different funds. In addition, if these transaction costs were included, your costs would have been higher.
| | | | | | | | | | | | | | | | | | | | | | | | |
| Class | | Beginning
Account Value
(05/01/14) | | | ACTUAL | | | HYPOTHETICAL (5% annual return before expenses) | | | Annualized
Expense
Ratio | |
| | | Ending
Account Value
(10/31/14)1 | | | Expenses
Paid During
Period2 | | | Ending
Account Value
(10/31/14) | | | Expenses
Paid During
Period2 | | |
| A | | $ | 1,000.00 | | | $ | 997.10 | | | $ | 8.61 | | | $ | 1,016.59 | | | $ | 8.69 | | | | 1.71 | % |
| C | | | 1,000.00 | | | | 994.20 | | | | 12.37 | | | | 1,012.80 | | | | 12.48 | | | | 2.46 | |
| R | | | 1,000.00 | | | | 996.10 | | | | 9.86 | | | | 1,015.32 | | | | 9.96 | | | | 1.96 | |
| Y | | | 1,000.00 | | | | 999.00 | | | | 7.36 | | | | 1,017.85 | | | | 7.43 | | | | 1.46 | |
| R5 | | | 1,000.00 | | | | 998.10 | | | | 7.35 | | | | 1,017.83 | | | | 7.43 | | | | 1.46 | |
| R6 | | | 1,000.00 | | | | 999.00 | | | | 7.36 | | | | 1,017.85 | | | | 7.43 | | | | 1.46 | |
| 1 | The actual ending account value is based on the actual total return of the Fund for the period May 1, 2014 through October 31, 2014, after actual expenses and will differ from the hypothetical ending account value which is based on the Fund’s expense ratio and a hypothetical annual return of 5% before expenses. |
| 2 | Expenses are equal to the Fund’s annualized expense ratio as indicated above multiplied by the average account value over the period, multiplied by 184/365 to reflect the most recent fiscal half year. |
22 Invesco Low Volatility Emerging Markets Fund
Approval of Investment Advisory and Sub-Advisory Contracts
The Board of Trustees (the Board) of AIM Investment Funds (Invesco Investment Funds) is required under the Investment Company Act of 1940, as amended, to approve annually the renewal of Invesco Low Volatility Emerging Markets Fund’s (the Fund) investment advisory agreements. During contract renewal meetings held on June 16-17, 2014, the Board as a whole, and the disinterested or “independent” Trustees, who comprise over 75% of the Board, voting separately, approved the continuance for the Fund of the Master Investment Advisory Agreement with Invesco Advisers, Inc. (Invesco Advisers and the investment advisory agreement) and the Master Intergroup Sub-Advisory Contract for Mutual Funds with Invesco Asset Management Deutschland GmbH, Invesco Asset Management Limited, Invesco Asset Management (Japan) Limited, Invesco Australia Limited, Invesco Hong Kong Limited, Invesco Senior Secured Management, Inc., Invesco Canada Ltd. and Invesco PowerShares Capital Management LLC (collectively, the Affiliated Sub-Advisers and the sub-advisory contracts) for another year, effective July 1, 2014.
In evaluating the fairness and reasonableness of compensation under the Fund’s investment advisory agreement and sub-advisory contracts, the Board considered, among other things, the factors discussed below. The Board determined that the continuation of the Fund’s investment advisory agreement and the sub-advisory contracts are in the best interest of the Fund and its shareholders and that the compensation payable to Invesco Advisers and the Affiliated Sub-Advisers under the agreements is fair and reasonable.
The Board’s Fund Evaluation Process
The Board’s Investments Committee has established three Sub-Committees, each of which is primarily responsible for overseeing the management of a number of the funds advised by Invesco Advisers (the Invesco Funds). The Sub-Committees meet throughout the year to review the performance of their assigned Invesco Funds, including reviewing materials prepared under the direction of the independent Senior Officer, an officer of the Invesco Funds who reports directly to the independent Trustees. Over the course of each year, the Sub-Committees meet with portfolio managers for their assigned Invesco Funds and other members of management to review the performance, investment objective(s), policies, strategies, limitations and investment risks of these funds. The Sub-Committees meet regularly and at designated contract renewal meetings each year to conduct a review of the performance, fees, expenses and other matters related to their assigned Invesco Funds. Each Sub-Committee recommends to the Investments Committee, which in turn recommends to the full Board, whether and on what terms to
approve the continuance of each Invesco Fund’s investment advisory agreement and sub-advisory contracts for another year.
During the contract renewal process, the Trustees receive comparative performance and fee data regarding the Invesco Funds prepared by Invesco Advisers and Lipper Inc. (Lipper), an independent provider of investment company data. The Trustees also receive an independent written evaluation from the Senior Officer. The Senior Officer’s evaluation is prepared as part of his responsibility to manage the process by which the Invesco Funds’ proposed management fees are negotiated during the annual contract renewal process to ensure they are negotiated in a manner that is at arms’ length and reasonable. In addition to meetings with Invesco Advisers and fund counsel, the independent Trustees also discuss the continuance of the investment advisory agreement and sub-advisory contracts in separate sessions with the Senior Officer and with independent legal counsel.
The Trustees recognized that the advisory fee rates for the Invesco Funds are, in many cases, the result of years of review and negotiation. The Trustees’ deliberations and conclusions in a particular year may be based in part on their deliberations and conclusions regarding these arrangements throughout the year and in prior years. The Trustees’ review and conclusions are based on the comprehensive consideration of all information presented to them and are not the result of any single determinative factor. Moreover, one Trustee may have weighed a particular piece of information or factor differently than another Trustee.
The discussion below serves as the Senior Officer’s independent written evaluation with respect to the Fund’s investment advisory agreement as well as a discussion of the material factors and related conclusions that formed the basis for the Board’s approval of the Fund’s investment advisory agreement and sub-advisory contracts. Unless otherwise stated, this information is current as of June 17, 2014, and may not reflect consideration of factors that became known to the Board after that date.
Factors and Conclusions and Summary of Independent Written Fee Evaluation
| A. | Nature, Extent and Quality of Services Provided by Invesco Advisers and the Affiliated Sub-Advisers |
The Board reviewed the advisory services provided to the Fund by Invesco Advisers under the Fund’s investment advisory agreement, the performance of Invesco Advisers in providing these services, and the credentials and experience of the officers and employees of Invesco Advisers who provide these services, including the Fund’s portfolio manager or managers, with whom the Sub-Committees met
during the year. The Board’s review of the qualifications of Invesco Advisers to provide advisory services included the Board’s consideration of Invesco Advisers’ investment process oversight, independent credit analysis and investment risk management. The Board also considered non-advisory services that Invesco Advisers and its affiliates provide to the Invesco Funds such as various back office support functions, equity and fixed income trading operations, internal audit, distribution and legal and compliance.
In determining whether to continue the Fund’s investment advisory agreement, the Board considered the benefits of reapproving an existing relationship and the greater uncertainty that may be associated with entering into a new relationship. The Board concluded that the nature, extent and quality of the services provided to the Fund by Invesco Advisers are appropriate and satisfactory and consistent with the terms of the Fund’s investment advisory agreement.
The Board reviewed the services that may be provided by the Affiliated Sub-Advisers under the sub-advisory contracts and the credentials and experience of the officers and employees of the Affiliated Sub-Advisers who provide these services. The Board noted that the Affiliated Sub-Advisers have offices and personnel that are located in financial centers around the world. As a result, the Affiliated Sub-Advisers can provide research and investment analysis on the markets and economies of various countries in which the Fund may invest, make recommendations regarding securities and assist with security trades. The Board concluded that the sub-advisory contracts benefit the Fund and its shareholders by permitting Invesco Advisers to use the resources and talents of the Affiliated Sub-Advisers in managing the Fund. The Board concluded that the nature, extent and quality of the services that may be provided by the Affiliated Sub-Advisers are appropriate and satisfactory and consistent with the terms of the Fund’s sub-advisory contracts.
The Board noted that the Fund recently began operations and that no comparative performance data was available.
| C. | Advisory and Sub-Advisory Fees |
The Board noted that no comparative fee information was available for the Fund.
The Board noted that Invesco Advisers has contractually agreed to waive fees and/or limit expenses of the Fund through at least December 31, 205 in an amount necessary to limit total annual operating expenses to a specified percentage of average daily net assets for each class of the Fund.
The Board also compared the Fund’s effective advisory fee rate (the advisory fee rate after advisory fee waivers and before other expense limitations/waivers) to the effective advisory fee
23 Invesco Low Volatility Emerging Markets Fund
rates of other mutual funds advised by Invesco Advisers and its affiliates that are managed using an investment process substantially similar to the investment process used for the Fund. The Board noted that the Fund’s rate was the same as the rate of one such mutual fund and above the rate of one such mutual fund.
The Board also considered the fees charged by Invesco Advisers and the Affiliated Sub-Advisers to other clients that are managed using an investment process substantially similar to the investment process used for the Fund. The Board noted that Invesco Advisers or the Affiliated Sub-Advisers may charge lower fees to large institutional clients. Invesco Advisers reviewed with the Board the significantly greater scope of services it provides to the Invesco Funds relative to certain other client accounts. These additional services include provision of administrative services, officers and office space, oversight of service providers, preparation of annual registration statement updates and financial information and regulatory compliance under the Investment Company Act of 1940, as amended. Invesco Advisers also reviewed generally the higher frequency of shareholder purchases and redemptions in the Invesco Funds relative to the flow of assets for other client accounts. Invesco Advisers advised the Board that advance notice of redemptions is often provided to Invesco Advisers by institutional clients. The Board did note that sub-advisory fee rates charged by the Affiliated Sub-Advisers to manage the Invesco Funds and to manage other client accounts tended to be more comparable, reflecting a more comparable scope of services. The Board concluded that the aggregate services provided to the Invesco Funds were sufficiently different from those provided to institutional clients to support the difference in fees.
The Board also considered the services that may be provided by the Affiliated Sub-Advisers pursuant to the sub-advisory contracts, as well as the fees payable by Invesco Advisers to the Affiliated Sub-Advisers pursuant to the sub-advisory contracts. The Board noted that Invesco Advisers retains overall responsibility for, and provides services to, sub-advised Invesco Funds, including oversight of the Affiliated Sub-Advisers as well as the additional services described herein other than day-to-day portfolio management. The Board also noted that the sub-advisory fees are not paid directly by the Fund, but rather, are payable by Invesco Advisers to the Affiliated Sub-Advisers.
| D. | Economies of Scale and Breakpoints |
The Board considered the extent to which there are economies of scale in the provision of advisory services to the Fund. The Board also considered whether the Fund benefits from economies of scale through contractual breakpoints in the Fund’s advisory fee schedule and was assisted in this review by a report from the Senior Officer. The Board also noted that the Fund shares directly in economies of scale through lower fees charged by third party service providers based on the combined size of
the Invesco Funds and other clients advised by Invesco Advisers.
| E. | Profitability and Financial Resources |
The Board reviewed information from Invesco Advisers concerning the costs of the advisory and other services that Invesco Advisers and its affiliates provide to the Fund and the profitability of Invesco Advisers and its affiliates in providing these services for the year ended December 31, 2013. The Board received information from Invesco Advisers about the methodology used to prepare the profitability information. The Board considered the profitability of Invesco Advisers in managing the Fund and the Invesco Funds. The Board noted that Invesco Advisers continues to operate at a net profit from services Invesco Advisers and its subsidiaries provide to the Invesco Funds. The Board noted that Invesco Advisers and its subsidiaries did not make a profit from managing the Fund as the Fund did not have a full year of operations. The Board received and accepted information from Invesco Advisers demonstrating that Invesco Advisers and each Affiliated Sub-Adviser are financially sound and have the resources necessary to perform their obligations under the investment advisory agreement and sub-advisory contracts.
| F. | Collateral Benefits to Invesco Advisers and its Affiliates |
The Board considered various other benefits received by Invesco Advisers and its affiliates from the relationship with the Fund, including the fees received for their provision of transfer agency and distribution services to the Fund. The Board considered the performance of Invesco Advisers and its affiliates in providing these services and the organizational structure employed to provide these services. The Board also considered that these services are provided to the Fund pursuant to written contracts that are reviewed and approved on an annual basis by the Board; that the services are required for the operation of the Fund; that Invesco Advisers and its affiliates can provide services, the nature and quality of which are at least equal to those provided by others offering the same or similar services; and that the fees for such services are fair and reasonable in light of the usual and customary charges by others for services of the same nature and quality.
The Board considered the benefits realized by Invesco Advisers and the Affiliated Sub-Advisers as a result of portfolio brokerage transactions executed through “soft dollar” arrangements. The Board noted that soft dollar arrangements shift the payment obligation for research services from Invesco Advisers and the Affiliated Sub-Advisers to the Invesco Funds and that the research received may be used with other clients of Invesco Advisers and may reduce Invesco Advisers’ and the Affiliated Sub-Advisers’ expenses. The Board also considered that it receives periodic reports from the Chief Compliance Officer of the Invesco Funds demonstrating that these arrangements are consistent with regulatory requirements. The
Board did not deem the soft dollar arrangements to be inappropriate.
The Board considered that the Fund’s uninvested cash and cash collateral from any securities lending arrangements may be invested in money market funds advised by Invesco Advisers pursuant to procedures approved by the Board. The Board noted that Invesco Advisers receives advisory fees from these affiliated money market funds attributable to such investments, although Invesco Advisers has contractually agreed to waive through varying periods the advisory fees payable by the Invesco Funds with respect to investments in the affiliated money market funds. The waiver is in an amount equal to 100% of the net advisory fee Invesco Advisers receives from the affiliated money market funds with respect to the Fund’s investment in the affiliated money market funds of uninvested cash, but not cash collateral. The Board concluded that the amount of advisory fees received by Invesco Advisors from the Fund’s investment of uninvested cash and cash collateral from any securities lending arrangements in the affiliated money market funds are fair and reasonable.
The Board also considered the Fund may use an affiliated broker to execute certain trades for the Fund to among other things, control information leakage, and were advised that such trades would be executed in compliance with rules under the Investment Company Act of 1940, as amended.
24 Invesco Low Volatility Emerging Markets Fund
Tax Information
Form 1099-DIV, Form 1042-S and other year-end tax information provide shareholders with actual calendar year amounts that should be included in their tax returns. Shareholders should consult their tax advisors.
The following distribution information is being provided as required by the Internal Revenue Code or to meet a specific state’s requirement.
The Fund designates the following amounts or, if subsequently determined to be different, the maximum amount allowable for its fiscal year ended October 31, 2014:
| | | | |
Federal and State Income Tax | |
Qualified Dividend Income* | | | 0 | % |
Corporate Dividends Received Deduction* | | | 0 | % |
U.S. Treasury Obligations* | | | 0 | % |
Foreign Taxes | | $ | 0.0313 | per share |
Foreign Income | | $ | 0.3186 | per share |
| | * | The above percentages are based on ordinary income dividends paid to shareholders during the Fund’s fiscal year. |
25 Invesco Low Volatility Emerging Markets Fund
Trustees and Officers
The address of each trustee and officer is AIM Investment Funds (Invesco Investment Funds) (the “Trust”), 11 Greenway Plaza, Suite 1000, Houston, Texas 77046-1173. The trustees serve for the life of the Trust, subject to their earlier death, incapacitation, resignation, retirement or removal as more specifically provided in the Trust’s organizational documents. Each officer serves for a one year term or until their successors are elected and qualified. Column two below includes length of time served with predecessor entities, if any.
| | | | | | | | |
Name, Year of Birth and Position(s) Held with the Trust | | Trustee and/
or Officer Since | | Principal Occupation(s) During Past 5 Years | | Number of Funds in Fund Complex Overseen by Trustee | | Other Directorship(s) Held by Trustee During Past 5 Years |
| Interested Persons | | | | | | | | |
| Martin L. Flanagan1 — 1960 Trustee | | 2007 | | Executive Director, Chief Executive Officer and President, Invesco Ltd. (ultimate parent of Invesco and a global investment management firm); Advisor to the Board, Invesco Advisers, Inc. (formerly known as Invesco Institutional (N.A.), Inc.); Trustee, The Invesco Funds; Vice Chair, Investment Company Institute; and Member of Executive Board, SMU Cox School of Business Formerly: Chairman and Chief Executive Officer, Invesco Advisers, Inc. (registered investment adviser); Director, Chairman, Chief Executive Officer and President, IVZ Inc. (holding company), INVESCO Group Services, Inc. (service provider) and Invesco North American Holdings, Inc. (holding company); Director, Chief Executive Officer and President, Invesco Holding Company Limited (parent of Invesco and a global investment management firm); Director, Invesco Ltd.; Chairman, Investment Company Institute and President, Co-Chief Executive Officer, Co-President, Chief Operating Officer and Chief Financial Officer, Franklin Resources, Inc. (global investment management organization). | | 144 | | None |
Philip A. Taylor2 — 1954 Trustee, President and Principal Executive Officer | | 2006 | | Head of North American Retail and Senior Managing Director, Invesco Ltd.; Director, Co-Chairman, Co-President and Co-Chief Executive Officer, Invesco Advisers, Inc. (formerly known as Invesco Institutional (N.A.), Inc.) (registered investment adviser); Director, Chairman, Chief Executive Officer and President, Invesco Management Group, Inc. (formerly known as Invesco Aim Management Group, Inc.) (financial services holding company); Director and President, INVESCO Funds Group, Inc. (registered investment adviser and registered transfer agent); Director and Chairman, Invesco Investment Services, Inc. (formerly known as Invesco Aim Investment Services, Inc.) (registered transfer agent) and IVZ Distributors, Inc. (formerly known as INVESCO Distributors, Inc.) (registered broker dealer); Director, President and Chairman, Invesco Inc. (holding company) and Invesco Canada Holdings Inc. (holding company); Chief Executive Officer, Invesco Corporate Class Inc. (corporate mutual fund company) and Invesco Canada Fund Inc. (corporate mutual fund company); Director, Chairman and Chief Executive Officer, Invesco Canada Ltd. (formerly known as Invesco Trimark Ltd./Invesco Trimark Ltèe) (registered investment adviser and registered transfer agent); Trustee, President and Principal Executive Officer, The Invesco Funds (other than AIM Treasurer’s Series Trust (Invesco Treasurer’s Series Trust) and Short-Term Investments Trust); Trustee and Executive Vice President, The Invesco Funds (AIM Treasurer’s Series Trust (Invesco Treasurer’s Series Trust) and Short-Term Investments Trust only); Director, Invesco Investment Advisers LLC (formerly known as Van Kampen Asset Management); Director, Chief Executive Officer and President, Van Kampen Exchange Corp. Formerly: Director and Chairman, Van Kampen Investor Services Inc.; Director, Chief Executive Officer and President, 1371 Preferred Inc. (holding company) and Van Kampen Investments Inc.; Director and President, AIM GP Canada Inc. (general partner for limited partnerships) and Van Kampen Advisors, Inc.; Director and Chief Executive Officer, Invesco Trimark Dealer Inc. (registered broker dealer); Director, Invesco Distributors, Inc. (formerly known as Invesco Aim Distributors, Inc.) (registered broker dealer); Manager, Invesco PowerShares Capital Management LLC; Director, Chief Executive Officer and President, Invesco Advisers, Inc.; Director, Chairman, Chief Executive Officer and President, Invesco Aim Capital Management, Inc.; President, Invesco Trimark Dealer Inc. and Invesco Trimark Ltd./Invesco Trimark Ltèe; Director and President, AIM Trimark Corporate Class Inc. and AIM Trimark Canada Fund Inc.; Senior Managing Director, Invesco Holding Company Limited; Director and Chairman, Fund Management Company (former registered broker dealer); President and Principal Executive Officer, The Invesco Funds (AIM Treasurer’s Series Trust (Invesco Treasurer’s Series Trust), and Short-Term Investments Trust only); President, AIM Trimark Global Fund Inc. and AIM Trimark Canada Fund Inc. | | 144 | | None |
Wayne W. Whalen3 — 1939 Trustee | | 2010 | | Of Counsel, and prior to 2010, partner in the law firm of Skadden, Arps, Slate, Meagher & Flom LLP, legal counsel to certain funds in the Fund Complex | | 144 | | Director of the Mutual fund Directors Forum, a nonprofit membership organization for investment directors; Chairman and Director of the Abraham Lincoln Presidential Library Foundation; and Director of the Stevenson Center for Democracy |
| 1 | Mr. Flanagan is considered an interested person (within the meaning of Section 2(a)(19) of the 1940 Act) of the Trust because he is an officer of the Adviser to the Trust, and an officer and a director of Invesco Ltd., ultimate parent of the Adviser. |
| 2 | Mr. Taylor is considered an interested person (within the meaning of Section 2(a)(19) of the 1940 Act) of the Trust because he is an officer and a director of the Adviser. |
| 3 | Mr. Whalen is retiring effective December 31, 2014. He has been deemed to be an interested person of the Trust because of his prior service as counsel to the predecessor funds of certain Invesco open-end funds and his affiliation with the law firm that served as counsel to such predecessor funds and the Invesco closed-end funds. |
T-1 Invesco Low Volatility Emerging Markets Fund
Trustees and Officers—(continued)
| | | | | | | | |
Name, Year of Birth and Position(s) Held with the Trust | | Trustee and/
or Officer Since | | Principal Occupation(s) During Past 5 Years | | Number of Funds in Fund Complex Overseen by Trustee | | Other Directorship(s) Held by Trustee During Past 5 Years |
| Independent Trustees | | | | | | | | |
Bruce L. Crockett — 1944 Trustee and Chair | | 2001 | | Chairman, Crockett Technologies Associates (technology consulting company) Formerly: Director, Captaris (unified messaging provider); Director, President and Chief Executive Officer, COMSAT Corporation; Chairman, Board of Governors of INTELSAT (international communications company); ACE Limited (insurance company); and Investment Company Institute | | 144 | | ALPS (Attorneys Liability Protection Society) (insurance company) |
David C. Arch — 1945 Trustee | | 2010 | | Chairman of Blistex Inc., a consumer health care products manufacturer | | 144 | | Board member of the Illinois Manufacturers’ Association; Member of the Board of Visitors, Institute for the Humanities, University of Michigan; Member of the Audit Committee of the Edward-Elmhurst Hospital |
Frank S. Bayley — 1939 Trustee | | 1987 | | Retired. Formerly: Director, Badgley Funds Inc. (registered investment company) (2 portfolios) and General Partner and Of Counsel, law firm of Baker & McKenzie, LLP | | 144 | | Director and Chairman, C.D. Stimson Company (a real estate investment company); Trustee, The Curtis Institute of Music |
James T. Bunch — 1942 Trustee | | 2003 | | Managing Member, Grumman Hill Group LLC (family office private equity investments) Formerly: Founder, Green Manning & Bunch Ltd. (investment banking firm) (1988-2010); Executive Committee, United States Golf Association; and Director, Policy Studies, Inc. and Van Gilder Insurance Corporation | | 144 | | Chairman, Board of Governors, Western Golf Association; Chairman, Evans Scholars Foundation; and Director, Denver Film Society |
Rodney F. Dammeyer — 1940 Trustee | | 2010 | | Chairman of CAC,LLC, (private company offering capital investment and management advisory services) Formerly: Prior to 2001, Managing Partner at Equity Group Corporate Investments; Prior to 1995, Chief Executive Officer of Itel Corporation (formerly Anixter International); Prior to 1985, experience includes Senior Vice President and Chief Financial Officer of Household International, Inc., Executive Vice President and Chief Financial Officer of Northwest Industries, Inc. and Partner of Arthur Andersen & Co.; From 1987 to 2010, Director/Trustee of investment companies in the Van Kampen Funds complex | | 144 | | Director of Quidel Corporation and Stericycle, Inc. |
Albert R. Dowden — 1941 Trustee | | 2001 | | Director of a number of public and private business corporations, including the Boss Group, Ltd. (private investment and management); Nature’s Sunshine Products, Inc. and Reich & Tang Funds (5 portfolios) (registered investment company) Formerly: Director, Homeowners of America Holding Corporation/Homeowners of America Insurance Company (property casualty company); Director, Continental Energy Services, LLC (oil and gas pipeline service); Director, CompuDyne Corporation (provider of product and services to the public security market) and Director, Annuity and Life Re (Holdings), Ltd. (reinsurance company); Director, President and Chief Executive Officer, Volvo Group North America, Inc.; Senior Vice President, AB Volvo; Director of various public and private corporations; Chairman, DHJ Media, Inc.; Director, Magellan Insurance Company; and Director, The Hertz Corporation, Genmar Corporation (boat manufacturer), National Media Corporation; Advisory Board of Rotary Power International (designer, manufacturer, and seller of rotary power engines); and Chairman, Cortland Trust, Inc. (registered investment company) | | 144 | | Director of: Nature’s Sunshine Products, Inc., Reich & Tang Funds, Homeowners of America Holding Corporation/ Homeowners of America Insurance Company, the Boss Group |
Jack M. Fields — 1952 Trustee | | 2001 | | Chief Executive Officer, Twenty First Century Group, Inc. (government affairs company); Owner and Chief Executive Officer, Dos Angeles Ranch, L.P. (cattle, hunting, corporate entertainment); and Discovery Global Education Fund (non-profit) Formerly: Chief Executive Officer, Texana Timber LP (sustainable forestry company); Director of Cross Timbers Quail Research Ranch (non-profit); and member of the U.S. House of Representatives | | 144 | | Insperity, Inc. (formerly known as Administaff) |
Prema Mathai-Davis — 1950 Trustee | | 2001 | | Retired. Formerly: Chief Executive Officer, YWCA of the U.S.A. | | 144 | | None |
Larry Soll — 1942 Trustee | | 2003 | | Retired. Formerly: Chairman, Chief Executive Officer and President, Synergen Corp. (a biotechnology company) | | 144 | | None |
Hugo F. Sonnenschein — 1940 Trustee | | 2010 | | President Emeritus and Honorary Trustee of the University of Chicago and the Adam Smith Distinguished Service Professor in the Department of Economics at the University of Chicago. Prior to 2000, President of the University of Chicago | | 144 | | Trustee of the University of Rochester and a member of its investment committee; Member of the National Academy of Sciences and the American Philosophical Society; Fellow of the American Academy of Arts and Sciences |
T-2 Invesco Low Volatility Emerging Markets Fund
Trustees and Officers—(continued)
| | | | | | | | |
Name, Year of Birth and Position(s) Held with the Trust | | Trustee and/
or Officer Since | | Principal Occupation(s) During Past 5 Years | | Number of Funds in Fund Complex Overseen by Trustee | | Other Directorship(s) Held by Trustee During Past 5 Years |
| Independent Trustees—(continued) |
Raymond Stickel, Jr. — 1944 Trustee | | 2005 | | Retired. Formerly: Director, Mainstay VP Series Funds, Inc. (25 portfolios) and Partner, Deloitte & Touche | | 144 | | None |
Suzanne H. Woolsey — 1941 Trustee | | 2014 | | Chief Executive Officer of Woolsey Partners LLC | | 144 | | Emeritus Chair of the Board of Trustees of the Institute for Defense Analyses; Trustee of Colorado College; Trustee of California Institute of Technology; Prior to 2014, Director of Fluor Corp.; Prior to 2010, Trustee of the German Marshall Fund of the United States; Prior to 2010 Trustee of the Rocky Mountain Institute |
| Other Officers | | | | | | | | |
Russell C. Burk — 1958 Senior Vice President and Senior Officer | | 2005 | | Senior Vice President and Senior Officer, The Invesco Funds | | N/A | | N/A |
John M. Zerr — 1962 Senior Vice President, Chief Legal Officer and Secretary | | 2006 | | Director, Senior Vice President, Secretary and General Counsel, Invesco Management Group, Inc. (formerly known as Invesco Aim Management Group, Inc.) and Van Kampen Exchange Corp.; Senior Vice President, Invesco Advisers, Inc. (formerly known as Invesco Institutional (N.A.), Inc.) (registered investment adviser); Senior Vice President and Secretary, Invesco Distributors, Inc. (formerly known as Invesco Aim Distributors, Inc.); Director, Vice President and Secretary, Invesco Investment Services, Inc. (formerly known as Invesco Aim Investment Services, Inc.) and IVZ Distributors, Inc. (formerly known as INVESCO Distributors, Inc.); Director and Vice President, INVESCO Funds Group, Inc.; Senior Vice President, Chief Legal Officer and Secretary, The Invesco Funds; Manager, Invesco PowerShares Capital Management LLC; Director, Secretary and General Counsel, Invesco Investment Advisers LLC (formerly known as Van Kampen Asset Management); Secretary and General Counsel, Invesco Capital Markets, Inc. (formerly known as Van Kampen Funds Inc.) and Chief Legal Officer, PowerShares Exchange-Traded Fund Trust, PowerShares Exchange-Traded Fund Trust II, PowerShares India Exchange-Traded Fund Trust, PowerShares Actively Managed Exchange-Traded Fund Trust; and PowerShares Actively Managed Exchange-Traded Commodity Fund Trust Formerly: Director and Vice President, Van Kampen Advisors Inc.; Director, Vice President, Secretary and General Counsel, Van Kampen Investor Services Inc.; Director, Invesco Distributors, Inc. (formerly known as Invesco Aim Distributors, Inc.); Director, Senior Vice President, General Counsel and Secretary, Invesco Aim Advisers, Inc. and Van Kampen Investments Inc.; Director, Vice President and Secretary, Fund Management Company; Director, Senior Vice President, Secretary, General Counsel and Vice President, Invesco Aim Capital Management, Inc.; Chief Operating Officer and General Counsel, Liberty Ridge Capital, Inc. (an investment adviser); Vice President and Secretary, PBHG Funds (an investment company) and PBHG Insurance Series Fund (an investment company); Chief Operating Officer, General Counsel and Secretary, Old Mutual Investment Partners (a broker-dealer); General Counsel and Secretary, Old Mutual Fund Services (an administrator) and Old Mutual Shareholder Services (a shareholder servicing center); Executive Vice President, General Counsel and Secretary, Old Mutual Capital, Inc. (an investment adviser); and Vice President and Secretary, Old Mutual Advisors Funds (an investment company) | | N/A | | N/A |
Sheri Morris — 1964 Vice President, Treasurer and Principal Financial Officer | | 1999 | | Vice President, Treasurer and Principal Financial Officer, The Invesco Funds; Vice President, Invesco Advisers, Inc. (formerly known as Invesco Institutional (N.A.), Inc.) (registered investment adviser); and Vice President, PowerShares Exchange-Traded Fund Trust, PowerShares Exchange-Traded Fund Trust II, PowerShares India Exchange-Traded Fund Trust, PowerShares Actively Managed Exchange-Traded Fund Trust, and PowerShares Actively Managed Exchange-Traded Commodity Fund Trust Formerly: Vice President, Invesco Aim Advisers, Inc., Invesco Aim Capital Management, Inc. and Invesco Aim Private Asset Management, Inc.; Assistant Vice President and Assistant Treasurer, The Invesco Funds and Assistant Vice President, Invesco Advisers, Inc., Invesco Aim Capital Management, Inc. and Invesco Aim Private Asset Management, Inc.; and Treasurer, PowerShares Exchange-Traded Fund Trust, PowerShares Exchange-Traded Fund Trust II, PowerShares India Exchange-Traded Fund Trust and PowerShares Actively Managed Exchange-Traded Fund Trust | | N/A | | N/A |
T-3 Invesco Low Volatility Emerging Markets Fund
Trustees and Officers—(continued)
| | | | | | | | |
Name, Year of Birth and Position(s) Held with the Trust | | Trustee and/
or Officer Since | | Principal Occupation(s) During Past 5 Years | | Number of Funds in Fund Complex Overseen by Trustee | | Other Directorship(s) Held by Trustee During Past 5 Years |
| Other Officers—(continued) | | | | | | | | |
Karen Dunn Kelley — 1960 Vice President | | 2004 | | Senior Managing Director, Investments; Director, Co-President, Co-Chief Executive Officer, and Co-Chairman, Invesco Advisers, Inc. (formerly known as Invesco Institutional (N.A.), Inc.) (registered investment adviser); Chairman, Invesco Senior Secured Management, Inc.; Senior Vice President, Invesco Management Group, Inc. (formerly known as Invesco Aim Management Group, Inc.); Executive Vice President, Invesco Distributors, Inc. (formerly known as Invesco Aim Distributors, Inc.); Director, Invesco Mortgage Capital Inc. and Invesco Management Company Limited; Director and President, INVESCO Asset Management (Bermuda) Ltd., Vice President, The Invesco Funds (other than AIM Treasurer’s Series Trust (Invesco Treasurer’s Series Trust) and Short-Term Investments Trust); and President and Principal Executive Officer, The Invesco Funds (AIM Treasurer’s Series Trust (Invesco Treasurer’s Series Trust) and Short-Term Investments Trust only) Formerly: Director, INVESCO Global Asset Management Limited and INVESCO Management S.A.; Senior Vice President, Van Kampen Investments Inc. and Invesco Advisers, Inc. (formerly known as Invesco Institutional (N.A.), Inc.) (registered investment adviser); Vice President, Invesco Advisers, Inc. (formerly known as Invesco Institutional (N.A.), Inc.); Director of Cash Management and Senior Vice President, Invesco Advisers, Inc. and Invesco Aim Capital Management, Inc.; Director and President, Fund Management Company; Chief Cash Management Officer, Director of Cash Management, Senior Vice President, and Managing Director, Invesco Aim Capital Management, Inc.; Director of Cash Management, Senior Vice President, and Vice President, Invesco Advisers, Inc. and The Invesco Funds (AIM Treasurer’s Series Trust (Invesco Treasurer’s Series Trust), and Short-Term Investments Trust only) | | N/A | | N/A |
Crissie M. Wisdom — 1969 Anti-Money Laundering Compliance Officer | | 2013 | | Anti-Money Laundering Compliance Officer, Invesco Advisers, Inc. (formerly known as Invesco Institutional (N.A.), Inc.) (registered investment adviser), Invesco Capital Markets, Inc. (formerly known as Van Kampen Funds Inc.), Invesco Distributors, Inc., Invesco Investment Services, Inc., Invesco Management Group, Inc., Van Kampen Exchange Corp., The Invesco Funds, and PowerShares Exchange-Traded Fund Trust, PowerShares Exchange-Traded Fund Trust II, PowerShares India Exchange-Traded Fund Trust, PowerShares Actively Managed Exchange-Traded Fund Trust and PowerShares Actively Managed Exchange-Traded Commodity Fund Trust; and Fraud Prevention Manager and Controls and Risk Analysis Manager for Invesco Investment Services, Inc. | | N/A | | N/A |
Todd L. Spillane — 1958 Chief Compliance Officer | | 2006 | | Senior Vice President, Invesco Management Group, Inc. (formerly known as Invesco Aim Management Group, Inc.) and Van Kampen Exchange Corp.; Senior Vice President and Chief Compliance Officer, Invesco Advisers, Inc. (registered investment adviser) (formerly known as Invesco Institutional (N.A.), Inc.); Chief Compliance Officer, The Invesco Funds; Vice President, Invesco Distributors, Inc. (formerly known as Invesco Aim Distributors, Inc.) and Invesco Investment Services, Inc. (formerly known as Invesco Aim Investment Services, Inc.) Formerly: Chief Compliance Officer, Invesco Funds (Chicago); Senior Vice President, Van Kampen Investments Inc.; Senior Vice President and Chief Compliance Officer, Invesco Aim Advisers, Inc. and Invesco Aim Capital Management, Inc.; Chief Compliance Officer, INVESCO Private Capital Investments, Inc. (holding company), Invesco Private Capital, Inc. (registered investment adviser), Invesco Global Asset Management (N.A.), Inc., Invesco Senior Secured Management, Inc. (registered investment adviser), Van Kampen Investor Services Inc., PowerShares Exchange-Traded Fund Trust, PowerShares Exchange-Traded Fund Trust II, PowerShares India Exchange-Traded Fund Trust and PowerShares Actively Managed Exchange-Traded Fund Trust; and Vice President, Invesco Aim Capital Management, Inc. and Fund Management Company | | N/A | | N/A |
The Statement of Additional Information of the Trust includes additional information about the Fund’s Trustees and is available upon request, without charge, by calling 1.800.959.4246. Please refer to the Fund’s prospectus for information on the Fund’s sub-advisers.
| | | | | | |
Office of the Fund 11 Greenway Plaza, Suite 1000 Houston, TX 77046-1173 | | Investment Adviser Invesco Advisers, Inc. 1555 Peachtree Street, N.E. Atlanta, GA 30309 | | Distributor Invesco Distributors, Inc. 11 Greenway Plaza, Suite 1000 Houston, TX 77046-1173 | | Auditors PricewaterhouseCoopers LLP 1000 Louisiana Street, Suite 5800 Houston, TX 77002-5678 |
| | | |
| | | | | | |
Counsel to the Fund Stradley Ronon Stevens & Young, LLP 2005 Market Street, Suite 2600 Philadelphia, PA 19103-7018 | | Counsel to the Independent Trustees Goodwin Procter LLP 901 New York Avenue, N.W. Washington, D.C. 20001 | | Transfer Agent Invesco Investment Services, Inc. 11 Greenway Plaza, Suite 1000 Houston, TX 77046-1173 | | Custodian State Street Bank and Trust Company 225 Franklin Street Boston, MA 02110-2801 |
T-4 Invesco Low Volatility Emerging Markets Fund

Invesco mailing information
Send general correspondence to Invesco Investment Services, Inc., P.O. Box 219078, Kansas City, MO 64121-9078.
Important notice regarding delivery of security holder documents
To reduce Fund expenses, only one copy of most shareholder documents may be mailed to shareholders with multiple accounts at the same address (Householding). Mailing of your shareholder documents may be householded indefinitely unless you instruct us otherwise. If you do not want the mailing of these documents to be combined with those for other members of your household, please contact Invesco Investment Services, Inc. at 800 959 4246 or contact your financial institution. We will begin sending you individual copies for each account within 30 days after receiving your request.
Fund holdings and proxy voting information
The Fund provides a complete list of its holdings four times in each fiscal year, at the quarter ends. For the second and fourth quarters, the lists appear in the Fund’s semiannual and annual reports to shareholders. For the first and third quarters, the Fund files the lists with the Securities and Exchange Commission (SEC) on Form N-Q. The most recent list of portfolio holdings is available at invesco.com/completeqtrholdings. Shareholders can also look up the Fund’s Forms N-Q on the SEC website at sec.gov. Copies of the Fund’s Forms N-Q may be reviewed and copied at the SEC Public Reference Room in Washington, D.C. You can obtain information on the operation of the Public Reference Room, including information about duplicating fee charges, by calling 202 551 8090 or 800 732 0330, or by electronic request at the following email address: publicinfo@sec.gov. The SEC file numbers for the Fund are shown below.
A description of the policies and procedures that the Fund uses to determine how to vote proxies relating to portfolio securities is available without charge, upon request, from our Client Services department at 800 959 4246 or at invesco.com/proxyguidelines. The information is also available on the SEC website, sec.gov.
| | |
Information regarding how the Fund voted proxies related to its portfolio securities during the most recent 12-month period ended June 30 is available at invesco.com/proxysearch. The information is also available on the SEC website, sec.gov. | |  |
Invesco Advisers, Inc. is an investment adviser; it provides investment advisory services to individual and institutional clients and does not sell securities. Invesco Distributors, Inc. is the US distributor for Invesco Ltd.’s retail mutual funds, exchange-traded funds and institutional money market funds. Both are wholly owned, indirect subsidiaries of Invesco Ltd. | |
| | | | |
| SEC file numbers: 811-05426 and 033-19338 | | LVEM-AR-1 | | Invesco Distributors, Inc. |

Letters to Shareholders
| | |

Philip Taylor | | Dear Shareholders: This annual report includes information about your Fund, including performance data and a complete list of its investments as of the close of the reporting period. Inside, your Fund’s portfolio managers discuss how they managed your Fund and the factors that affected its performance during the reporting period. I hope you find this report of interest. During the reporting period covered by this report, the US economy showed signs of continued improvement. After contracting in the first quarter of 2014, the economy expanded strongly in the second quarter and unemployment trended lower. Much of the credit for this improvement goes to the US Federal Reserve (the Fed), which undertook an extraordinary asset purchase program following the global financial crisis. The Fed’s goal was to jumpstart the economy by encouraging banks to lend more, businesses to hire more and consumers to spend more. Signs of a stronger |
| US economy prompted the Fed to reduce, or “taper,” its asset purchase program. Despite this, interest rates remained near historical low levels due largely to heavy investor demand for bonds. While signs of economic improvement were evident in the US, European economies showed signs of weakening. That, together with geopolitical uncertainty and worries about the first diagnosed cases of Ebola outside of Africa, caused increased volatility in US and European equities. |
Extended periods of market strength can lull investors into complacency – just as prolonged periods of market weakness or volatility can discourage investors from initiating long-term investment plans. That’s why Invesco has always encouraged investors to work with a professional financial adviser who can stress the importance of starting to save and invest early and the importance of adhering to a disciplined investment plan – when times are good and when they’re uncertain. A financial adviser who knows your unique financial situation, investment goals and risk tolerance can be an invaluable partner as you seek to achieve your financial goals. He or she can offer a long-term perspective when markets are volatile and time-tested advice and guidance when your financial situation or investment goals change.
Timely information when and where you want it
Invesco’s efforts to help investors achieve their financial objectives include providing individual investors and financial professionals with timely information about the markets, the economy and investing – whenever and wherever they want it.
Our website, invesco.com/us, offers a wide range of market insights and investment perspectives. On the website, you’ll find detailed information about our funds, including prices, performance, holdings and portfolio manager commentaries. You can access information about your individual Invesco account whenever it’s convenient for you; just complete a simple, secure online registration. Use the “Log In” box on our home page to get started.
Invesco’s mobile app for iPad® (available free from the App StoreSM) allows you to obtain the same detailed information about your Fund and the same investment insights from our investment leaders, market strategists, economists and retirement experts on the go. You also can watch portfolio manager videos and have instant access to Invesco news and updates wherever you may be.
In addition to the resources accessible on our website and through our mobile app, you can obtain timely updates to help you stay informed about the markets, the economy and investing by connecting with Invesco on Twitter, LinkedIn or Facebook. You can access our blog at blog.invesco.us.com. Our goal is to provide you the information you want, when and where you want it.
Have questions?
For questions about your account, feel free to contact an Invesco client services representative at 800 959 4246. For Invesco-related questions or comments, please email me directly at phil@invesco.com.
All of us at Invesco look forward to serving your investment management needs for many years to come. Thank you for investing with us.
Sincerely,

Philip Taylor
Senior Managing Director, Invesco Ltd.
iPad is a trademark of Apple Inc., registered in the US and other countries. App Store is a service mark of Apple Inc. Invesco Distributors, Inc. is not affiliated with Apple Inc.
2 Invesco Macro International Equity Fund
| | |

Bruce Crockett | | Dear Fellow Shareholders: There are a variety of factors that can impact investment performance, many of which are uncontrollable by us as investors. These factors can include various economic trends and geopolitical developments. While the members of the Invesco Funds Board, which I chair, can’t dictate the performance of the Invesco funds, be assured that your Board works diligently throughout the year to focus on how your investments are managed. Our job is to represent you and your interests on a variety of fund management-related matters. We regularly monitor how the portfolio management teams of the Invesco funds are performing in light of ever-changing and often unpredictable economic and market conditions. We review the investment strategies and investment process employed by each fund’s management team as explained in the fund’s prospectus. |
| | Perhaps our most significant responsibility is conducting the annual review of the funds’ |
advisory and sub-advisory contracts with Invesco Advisers and its affiliates. This annual review, which is required by the Investment Company Act of 1940, focuses on the nature and quality of the services Invesco provides as the adviser to the Invesco funds and the reasonableness of the fees that it charges for those services. Each year, we spend months carefully reviewing information from Invesco that allows us to evaluate the quality of its services and the reasonableness of its fees. We also use information from a variety of independent sources, including materials provided by the independent senior officer of the Invesco funds, who reports directly to the independent trustees on the Board. Additionally, we meet with legal counsel and review performance and fee data prepared for us by Lipper Inc., an independent, third-party firm widely recognized as a leader in its field.
After a careful review, the members of the Invesco Funds Board approved the continuation of advisory and sub-advisory contracts with Invesco Advisers and its affiliates. Be assured that your Board will continue working on behalf of fund shareholders, keeping your needs and interests uppermost in our minds.
As always, please contact me at bruce@brucecrockett.com with any questions or concerns you may have. On behalf of the Board, we look forward to continuing to represent your interests and serving your needs.
Sincerely,

Bruce L. Crockett
Independent Chair
Invesco Funds Board of Trustees
3 Invesco Macro International Equity Fund
Management’s Discussion of Fund Performance
Performance summary
From the Fund’s inception on December 17, 2013, to the end of its reporting period on October 31, 2014, Invesco Macro International Equity Fund, at net asset value, delivered positive absolute performance but underperformed its broad market/style-specific benchmark, the MSCI All Country World ex-US Index. Detracting from performance was our tactical allocation process and the underperformance of select smart beta strategies, particularly in continental Europe and emerging markets.† All other sources of return were positive.
Additional performance information for your Fund appears later in this report.
Fund vs. Indexes
Cumulative total returns, 12/17/13 to 10/31/14, at net asset value (NAV). Performance shown does not include applicable contingent deferred sales charges (CDSC) or front-end sales charges, which would have reduced performance.
| | | | |
Class A Shares | | | 1.50 | % |
Class C Shares | | | 0.90 | |
Class R Shares | | | 1.30 | |
Class Y Shares | | | 1.70 | |
Class R5 Shares | | | 1.80 | |
Class R6 Shares | | | 1.70 | |
MSCI All Country World ex-US Indexq (Broad Market/Style-Specific Index) | | | 3.15 | |
Lipper International Large-Cap Core Funds Indexn (Peer Group Index) | | | 2.92 | |
Source(s): qFactSet Research Systems Inc.; nLipper Inc.
| † | Beta is a measure of risk representing how a security is expected to respond to general market movements. Smart beta represents an alternative and selection index based methodology that seeks to outperform a benchmark or reduce portfolio risk, or both. Smart beta funds may underperform cap-weighted benchmarks and increase portfolio risk. |
Market conditions and your Fund
The reporting period ended October 31, 2014, was characterized by volatility from geopolitical issues in a framework of stretched equity valuations, which became apparent in the latter part of the reporting period.
Global equity markets generally rose during the reporting period on signs that economic growth was accelerating as a result of the loose monetary policies of many developed countries’ central banks. While 2014 began on an optimistic note, global equity markets pulled back at various points in reaction to economic and geopolitical concerns. Overweight tactical
positions during these periods of pull back, particularly in January and March 2014, detracted from Fund performance.
The concerns causing the market pull-backs included worries about potentially negative effects of the US Federal Reserve reducing the scope of its asset purchase program beginning in early 2014, an Argentine sovereign bond default and eurozone banking concerns. Global equity markets also fell as geopolitical tensions in Ukraine and the Middle East weakened the outlook for global growth. Advanced economies such as the UK and US saw a modest but stronger rebound than Europe, where a nascent recovery has stalled. However, a more supportive monetary
policy in the eurozone may be positive for equity markets there going forward. Tactical underweights in place during these rebounds hindered the Fund from fully participating, which hurt performance during the reporting period.
Meanwhile, the Bank of Japan remained committed to extraordinary monetary stimulus. Consumer spending in Japan has been weak for some time, and retail sales and household spending increased only gradually during the reporting period – although improved corporate earnings were an encouraging sign.
Equity market performance in emerging markets was mixed during the reporting period. China continued to face head-winds and struggled to balance structural reforms with its desire to maintain satisfactory growth, while many countries in Asia experienced healthy gains.
For the reporting period, the main detractors from the Fund’s performance were our positioning decisions in Hong Kong and emerging markets. On average, we maintained overweight exposure to those markets through exchange traded futures as a result of our active positioning process. However, we had underweight exposure to international equities, also using exchange-traded futures, based on volatility spikes in February and September 2014, which proved untimely as the Fund did not take full advantage of market rallies. The Fund’s physical stock positions in continental Europe and emerging markets trailed those of traditional, market-capitalization-based indexes, and that hurt the Fund’s performance. These exposures use an alternative weighting strategy that differs from traditional, market capitalization-based indexes. They use equal weighting, low volatility
| | | | |
| Portfolio Composition | |
By sector | | | | |
| Financials | | | 24.6 | % |
| Industrials | | | 13.2 | |
| Consumer Discretionary | | | 12.8 | |
| Consumer Staples | | | 9.3 | |
| Materials | | | 7.6 | |
| Health Care | | | 5.1 | |
| Information Technology | | | 5.1 | |
| Utilities | | | 5.1 | |
| Energy | | | 4.5 | |
| Telecommunication Services | | | 4.0 | |
Money Market Funds
Plus Other Assets Less Liabilities | | | 8.7 | |
| | | | |
| Total Net Assets | | $ | 7.8 million | |
| |
| Total Number of Holdings* | | | 810 | |
The Fund’s holdings are subject to change, and there is no assurance that the Fund will continue to hold any particular security.
*Excluding money market fund holdings.
4 Invesco Macro International Equity Fund
and other methodologies to determine the stocks included in the index and the weight of individual stocks within the index. Both the valuation-based adjustment favoring undervalued markets on a relative and absolute basis, particularly our bias to the Hong Kong market, as well as the regional equal weightings, contributed to performance. However, this did not compensate for the underperformance produced by the other two elements.
Please note that our strategy utilizes derivative instruments that include futures. Therefore, some of the performance of the strategy, both positive and negative, can be attributed to these instruments. Derivatives can be a cost-effective way to gain exposure to asset classes. However, derivatives may amplify traditional investment risks through the creation of leverage.
Thank you for your investment in Invesco Macro International Equity Fund.
The views and opinions expressed in management’s discussion of Fund performance are those of Invesco Advisers, Inc. These views and opinions are subject to change at any time based on factors such as market and economic conditions. These views and opinions may not be relied upon as investment advice or recommendations, or as an offer for a particular security. The information is not a complete analysis of every aspect of any market, country, industry, security or the Fund. Statements of fact are from sources considered reliable, but Invesco Advisers, Inc. makes no representation or warranty as to their completeness or accuracy. Although historical performance is no guarantee of future results, these insights may help you understand our investment management philosophy.
See important Fund and, if applicable, index disclosures later in this report.
| | |
 | | Mark Ahnrud Chartered Financial Analyst, Portfolio Manager, is manager of Invesco Macro International Equity |
| Fund. He joined Invesco in 2000. Mr. Ahnrud earned a BS in finance and investments from Babson College and an MBA from Duke University Fuqua School of Business. |
| | |
 | | Chris Devine Chartered Financial Analyst, Portfolio Manager, is manager of Invesco Macro International Equity |
| Fund. He joined Invesco in 1998. Mr. Devine earned a BA in economics from Wake Forest University and an MBA from the University of Georgia. |
| | |
 | | Scott Hixon Chartered Financial Analyst, Portfolio Manager, is manager of Invesco Macro International Equity |
| Fund. He joined Invesco in 1994. Mr. Hixon earned a BBA in finance from Georgia Southern University and an MBA in finance from Georgia State University. |
| | |
 | | Christian Ulrich Chartered Financial Analyst, Portfolio Manager, is manager of Invesco Macro International Equity |
| Fund. He joined Invesco in 2000. Mr. Ulrich earned the equivalent of a BBA from the KV Zurich Business School in Zurich, Switzerland. |
| | |
 | | Scott Wolle Chartered Financial Analyst, Portfolio Manager, is manager of Invesco Macro International Equity |
| Fund. He joined Invesco in 1999. Mr. Wolle earned a BS in finance from Virginia Polytechnic Institute and State University and an MBA from Duke University Fuqua School of Business. |
Assisted by the Invesco Global Asset Allocation Team
5 Invesco Macro International Equity Fund
Your Fund’s Performance
Results of a $10,000 Investment – Oldest Share Class(es) since Inception
Fund and index data from 12/17/13
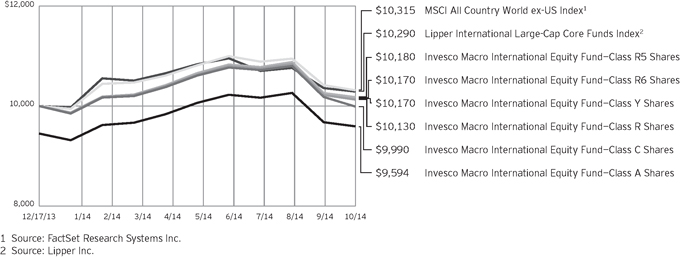
Past performance cannot guarantee comparable future results.
The data shown in the chart include reinvested distributions, applicable sales charges and Fund expenses including
management fees. Index results include reinvested dividends, but they do not reflect sales charges. Performance of the peer group, if applicable, reflects fund expenses and management fees;
performance of a market index does not. Performance shown in the chart and table(s) does not reflect deduction of taxes a shareholder would pay on Fund distributions or sale of Fund shares.
continued from page 8
| n | | Volatility risk. The Fund may have investments that appreciate or decrease significantly in value over short periods of time. This may cause the Fund’s net asset value per share to experience significant increases or declines in value over short periods of time. |
About indexes used in this report
| n | | The MSCI All Country World ex-US Index is an index considered representative of developed and emerging market stock markets, excluding the US. The index is computed using the net return, which withholds applicable taxes for non-resident investors. |
| n | | The Lipper International Large-Cap Core Funds Index is an unmanaged index considered representative of international large-cap core funds tracked by Lipper. |
| n | | The Fund is not managed to track the performance of any particular index, including the index(es) described here, and consequently, the performance of the Fund may deviate significantly from the performance of the
index(es). |
| n | | A direct investment cannot be made in an index. Unless otherwise indicated, index results include reinvested dividends, and they do not reflect sales charges. Performance of the peer group, if applicable, reflects fund expenses; performance of a market index does not. |
Other information
| n | | The returns shown in management’s discussion of Fund performance are based on net asset values (NAVs) calculated for shareholder transactions. Generally accepted accounting principles |
require adjustments to be made to the net assets of the Fund at period end for financial reporting purposes, and as such, the NAVs for shareholder transactions and the returns based on those NAVs may differ from the NAVs and returns reported in the Financial Highlights.
| n | | Industry classifications used in this report are generally according to the Global Industry Classification Standard, which was developed by and is the exclusive property and a service mark of MSCI Inc. and Standard & Poor’s. |
6 Invesco Macro International Equity Fund
| | | | |
| Cumulative Total Returns | |
As of 10/31/14, including maximum applicable sales charges | |
| Class A Shares | | | | |
| Inception (12/17/13) | | | -4.06 | % |
Class C Shares | | | | |
| Inception (12/17/13) | | | -0.10 | % |
Class R Shares | | | | |
| Inception (12/17/13) | | | 1.30 | % |
Class Y Shares | | | | |
| Inception (12/17/13) | | | 1.70 | % |
Class R5 Shares | | | | |
| Inception (12/17/13) | | | 1.80 | % |
Class R6 Shares | | | | |
| Inception (12/17/13) | | | 1.70 | % |
The performance data quoted represent past performance and cannot guarantee comparable future results; current performance may be lower or higher. Please visit invesco.com/performance for the most recent month-end performance. Performance figures reflect reinvested distributions, changes in net asset value and the effect of the maximum sales charge unless otherwise stated. Investment return and principal value will fluctuate so that you may have a gain or loss when you sell shares.
The net annual Fund operating expense ratio set forth in the most recent Fund prospectus as of the date of this report for Class A, Class C, Class R, Class Y, Class R5 and Class R6 shares was 1.43%, 2.18%, 1.68%, 1.18%, 1.18% and 1.18%, respectively.1 The total annual Fund operating expense ratio set forth in the most recent Fund prospectus as of the date of this report for Class A, Class C, Class R, Class Y, Class R5 and Class R6 shares was 5.27%, 6.02%, 5.52%, 5.02%, 4.91% and 4.86%, respectively. The expense ratios presented above may vary from the expense ratios presented in other sections of this report that are based on expenses incurred during the period covered by this report.
| | | | |
| Cumulative Total Returns | |
As of 9/30/14, the most recent calendar quarter end, including maximum applicable sales charges | |
| Class A Shares | | | | |
| Inception (12/17/13) | | | -3.21 | % |
Class C Shares | | | | |
| Inception (12/17/13) | | | 0.80 | % |
Class R Shares | | | | |
| Inception (12/17/13) | | | 2.20 | % |
Class Y Shares | | | | |
| Inception (12/17/13) | | | 2.60 | % |
Class R5 Shares | | | | |
| Inception (12/17/13) | | | 2.60 | % |
Class R6 Shares | | | | |
| Inception (12/17/13) | | | 2.60 | % |
Class A share performance reflects the maximum 5.50% sales charge, and Class C share performance reflects the applicable contingent deferred sales charge (CDSC) for the period involved. The CDSC on Class C shares is 1% for the first year after purchase. Class R, Class Y, Class R5 and Class R6 class shares do not have a front-end sales charge or a CDSC; therefore, performance is at net asset value.
The performance of the Fund’s share classes will differ primarily due to different sales charge structures and class expenses.
Had the adviser not waived fees and/or reimbursed expenses, performance would have been lower.
| 1 | Total annual Fund operating expenses after any contractual fee waivers and/or expense reimbursements by the adviser in effect through at least February 29, 2016. See current prospectus for more information. |
7 Invesco Macro International Equity Fund
Invesco Macro International Equity Fund’s investment objective is to provide total return.
| n | | Unless otherwise stated, information presented in this report is as of October 31, 2014, and is based on total net assets. |
| n | | Unless otherwise noted, all data provided by Invesco. |
| n | | To access your Fund’s reports/prospectus, visit invesco.com/fundreports. |
About share classes
| n | | Class R shares are generally available only to employer sponsored retirement and benefit plans. Please see the prospectus for more information. |
| n | | Class Y shares are available only to certain investors. Please see the prospectus for more information. |
| n | | Class R5 shares and Class R6 shares are primarily intended for employer sponsored retirement and benefit plans that meet certain standards and for institutional investors. Please see the prospectus for more information. |
Principal risks of investing in the Fund
| n | | Cash/cash equivalents risk. Holding cash or cash equivalents may negatively affect performance. |
| n | | Currency/exchange rate risk. The dollar value of the Fund’s foreign investments will be affected by changes in the exchange rates between the dollar and the currencies in which those investments are traded. |
| n | | Derivatives risk. The value of a derivative instrument depends largely on (and is derived from) the value of an underlying security, currency, commodity, interest rate, index or other asset (each referred to as an underlying asset). In addition to risks relating to the underlying assets, the use of derivatives may include other, possibly greater, risks, including counterparty, leverage and liquidity risks. Counterparty risk is the risk that the counterparty to the derivative contract will default on its obligation to pay the Fund the amount owed or otherwise perform under the derivative contract. Derivatives create leverage risk because they do not require payment up front equal to the economic exposure created by owning the derivative. As a result, an adverse change in the value of the underlying asset could result in the Fund sustaining a loss that is substantially greater than the amount invested in the derivative, which may make the Fund’s returns |
| | more volatile and increase the risk of loss. Derivative instruments may also be less liquid than more traditional investments and the underlying fund may be unable to sell or close out its derivative positions at a desirable time or price. This risk may be more acute under adverse market conditions, during which the Fund may be most in need of liquidating its derivative positions. Derivatives may also be harder to value, less tax efficient and subject to changing government regulation that could impact the Fund’s ability to use certain derivatives or their cost. Also, derivatives used for hedging or to gain or limit exposure to a particular market segment may not provide the expected benefits, particularly during adverse market conditions. These risks are greater for the Fund than mutual funds that do not use derivative instruments or that use derivative instruments to a lesser extent than the Fund to implement their investment strategy. |
| n | | Developing/emerging markets securities risk. The prices of securities issued by foreign companies and governments located in developing/emerging market countries may be affected more negatively by inflation, devaluation of their currencies, higher transaction costs, delays in settlement, adverse political developments, the introduction of capital controls, withholding taxes, nationalization of private assets, expropriation, social unrest, war or lack of timely information than those in developed countries. |
| n | | Foreign securities risk. The Fund’s foreign investments may be affected by changes in a foreign country’s exchange rates, political and social instability, changes in economic or taxation policies, difficulties when enforcing obligations, decreased liquidity, and increased volatility. Foreign companies may be subject to less regulation resulting in less publicly available information about the companies. |
| n | | Large capitalization company risk. Larger, more established companies may be unable to respond quickly to new competitive challenges such as changes in consumer tastes or innovative smaller competitors. Returns on investments in large capitalization companies could trail the returns on investments in smaller companies. |
| n | | Management risk. The investment techniques and risk analysis used by the Fund’s portfolio managers may not produce the desired results. The portfolio managers’ use of derivative instruments that provide economic leverage may increase the volatility of the Fund’s net asset value, which may increase the potential of greater losses that may cause the Fund to liquidate positions when it may not be advantageous to do so. In addition, the Fund will likely underperform the broader equity markets in which the Fund invests during market rallies when the Fund’s equity exposure is less than 100% of the Fund’s assets. Such underperformance could be significant during sudden or significant market rallies. |
| n | | Market risk. The prices of and the income generated by the Fund’s securities may decline in response to, among other things, investor sentiment, general economic and market conditions, regional or global instability, and currency and interest rate fluctuations. |
| n | | Small- and mid-capitalization risk. Stocks of small- and mid-sized companies tend to be more vulnerable to adverse developments and may have little or no operating history or track record of success, and limited product lines, markets, management and financial resources. The securities of small- and mid-sized companies may be more volatile due to less market interest and less publicly available information about the issuer. They also may be illiquid or restricted as to resale, or may trade less frequently and in smaller volumes, all of which may cause difficulty when establishing or closing a position at a desirable price. |
continued on page 6
This report must be accompanied or preceded by a currently effective Fund prospectus, which contains more complete information, including sales charges and expenses. Investors should read it carefully before investing.
NOT FDIC INSURED | MAY LOSE VALUE | NO BANK GUARANTEE
8 Invesco Macro International Equity Fund
Schedule of Investments
October 31, 2014
| | | | | | | | |
| | | Shares | | | Value | |
Common Stocks & Other Equity Interests–91.34% | |
| Australia–8.05% | |
AGL Energy Ltd. | | | 849 | | | $ | 10,170 | |
ALS Ltd. | | | 1,626 | | | | 8,097 | |
Alumina Ltd.(a) | | | 6,630 | | | | 9,579 | |
Amcor Ltd. | | | 1,027 | | | | 10,628 | |
AMP Ltd. | | | 2,076 | | | | 10,734 | |
APA Group | | | 1,505 | | | | 10,455 | |
Asciano Ltd. | | | 1,836 | | | | 10,166 | |
ASX Ltd. | | | 320 | | | | 10,165 | |
Aurizon Holdings Ltd. | | | 2,501 | | | | 10,346 | |
AusNet Services | | | 8,532 | | | | 10,353 | |
Australia and New Zealand Banking Group Ltd. | | | 364 | | | | 10,773 | |
Bank of Queensland Ltd. | | | 957 | | | | 10,662 | |
Bendigo and Adelaide Bank Ltd. | | | 950 | | | | 10,438 | |
BHP Billiton Ltd. | | | 327 | | | | 9,760 | |
BHP Billiton PLC | | | 1,008 | | | | 26,100 | |
BlueScope Steel Ltd.(a) | | | 2,072 | | | | 9,605 | |
Boral Ltd. | | | 2,214 | | | | 9,807 | |
Brambles Ltd. | | | 1,183 | | | | 9,964 | |
Caltex Australia Ltd. | | | 404 | | | | 11,080 | |
Challenger Ltd. | | | 1,581 | | | | 9,698 | |
Coca-Cola Amatil Ltd. | | | 1,282 | | | | 10,344 | |
Cochlear Ltd. | | | 176 | | | | 11,411 | |
Commonwealth Bank of Australia | | | 149 | | | | 10,598 | |
Computershare Ltd. | | | 963 | | | | 10,441 | |
Crown Resorts Ltd. | | | 790 | | | | 10,106 | |
CSL Ltd. | | | 158 | | | | 11,186 | |
Federation Centres | | | 4,532 | | | | 10,891 | |
Fortescue Metals Group Ltd. | | | 3,086 | | | | 9,573 | |
Iluka Resources Ltd. | | | 1,368 | | | | 9,062 | |
Incitec Pivot Ltd. | | | 4,086 | | | | 10,519 | |
Insurance Australia Group Ltd. | | | 1,838 | | | | 10,581 | |
Leighton Holdings Ltd. | | | 542 | | | | 10,540 | |
Lend Lease Group | | | 789 | | | | 10,911 | |
Macquarie Group Ltd. | | | 199 | | | | 10,757 | |
Metcash Ltd. | | | 4,346 | | | | 10,864 | |
National Australia Bank Ltd. | | | 342 | | | | 10,570 | |
Newcrest Mining Ltd.(a) | | | 1,157 | | | | 9,234 | |
Novion Property Group(a) | | | 5,860 | | | | 10,829 | |
Oil Search Ltd. | | | 1,248 | | | | 9,520 | |
Orica Ltd. | | | 586 | | | | 10,681 | |
Origin Energy Ltd. | | | 768 | | | | 9,676 | |
Primary Health Care Ltd. | | | 2,602 | | | | 10,693 | |
Qantas Airways Ltd.(a) | | | 7,970 | | | | 11,851 | |
QBE Insurance Group Ltd. | | | 961 | | | | 9,781 | |
Ramsay Health Care Ltd. | | | 233 | | | | 10,750 | |
Santos Ltd. | | | 813 | | | | 9,265 | |
Seek Ltd. | | | 678 | | | | 9,939 | |
Sonic Healthcare Ltd. | | | 664 | | | | 10,953 | |
| | | | | | | | |
| | | Shares | | | Value | |
| Australia–(continued) | |
Suncorp Group Ltd. | | | 809 | | | $ | 10,465 | |
Tabcorp Holdings Ltd. | | | 3,232 | | | | 11,608 | |
Tatts Group Ltd. | | | 3,672 | | | | 11,246 | |
Telstra Corp. Ltd. | | | 2,145 | | | | 10,652 | |
Toll Holdings Ltd. | | | 2,039 | | | | 10,212 | |
Treasury Wine Estates Ltd. | | | 2,448 | | | | 10,017 | |
Wesfarmers Ltd. | | | 270 | | | | 10,528 | |
Westpac Banking Corp. | | | 350 | | | | 10,762 | |
Woodside Petroleum Ltd. | | | 278 | | | | 9,849 | |
Woolworths Ltd. | | | 331 | | | | 10,514 | |
WorleyParsons Ltd. | | | 723 | | | | 8,666 | |
| | | | | 624,625 | |
|
| Austria–0.25% | |
Erste Group Bank AG | | | 270 | | | | 6,895 | |
OMV AG | | | 189 | | | | 5,949 | |
Voestalpine AG | | | 155 | | | | 6,207 | |
| | | | | 19,051 | |
|
| Belgium–0.50% | |
Ageas | | | 205 | | | | 6,845 | |
Anheuser-Busch InBev N.V. | | | 58 | | | | 6,427 | |
Delhaize Group S.A. | | | 97 | | | | 6,637 | |
KBC Groep N.V.(a) | | | 119 | | | | 6,390 | |
Solvay S.A. | | | 44 | | | | 6,002 | |
UCB S.A. | | | 77 | | | | 6,221 | |
| | | | | 38,522 | |
|
| Brazil–1.00% | |
Ambev S.A. | | | 900 | | | | 5,956 | |
BRF S.A. | | | 200 | | | | 5,205 | |
Cia Brasileira de Distribuicao–Preference Shares | | | 100 | | | | 4,193 | |
Cielo S.A. | | | 400 | | | | 6,568 | |
Grupo BTG Pactual(b) | | | 400 | | | | 5,060 | |
Hypermarcas S.A.(a) | | | 900 | | | | 6,287 | |
Itausa–Investimentos Itau S.A.–Preference Shares | | | 1,370 | | | | 5,468 | |
Lojas Americanas S.A.–Preference Shares | | | 925 | | | | 5,457 | |
M Dias Branco S.A. | | | 100 | | | | 3,889 | |
Multiplan Empreendimentos Imobiliarios S.A. | | | 300 | | | | 6,205 | |
Tractebel Energia S.A. | | | 400 | | | | 5,448 | |
Transmissora Alianca de Energia Eletrica
S.A.(c) | | | 600 | | | | 4,455 | |
Ultrapar Participacoes S.A. | | | 300 | | | | 6,544 | |
WEG S.A. | | | 550 | | | | 6,488 | |
| | | | | 77,223 | |
|
| Chile–0.52% | |
Banco de Chile | | | 63,234 | | | | 7,768 | |
Banco Santander Chile | | | 110,782 | | | | 5,885 | |
Empresa Nacional de Electricidad S.A. | | | 4,473 | | | | 6,928 | |
Empresas COPEC S.A. | | | 547 | | | | 6,631 | |
See accompanying Notes to Financial Statements which are an integral part of the financial statements.
9 Invesco Macro International Equity Fund
| | | | | | | | |
| | | Shares | | | Value | |
| Chile–(continued) | |
Enersis S.A. | | | 20,996 | | | $ | 6,644 | |
S.A.C.I. Falabella | | | 860 | | | | 6,483 | |
| | | | | 40,339 | |
| | |
| China–2.51% | | | | | | | | |
AAC Technologies Holdings Inc. | | | 1,500 | | | | 9,132 | |
Agricultural Bank of China Ltd.–Class H | | | 14,000 | | | | 6,499 | |
Bank of China Ltd.–Class H | | | 16,000 | | | | 7,648 | |
Bank of Communications Co. Ltd.–Class H | | | 9,000 | | | | 6,815 | |
Belle International Holdings Ltd. | | | 9,000 | | | | 11,454 | |
China Construction Bank Corp.–Class H | | | 10,000 | | | | 7,453 | |
China Mobile Ltd. | | | 500 | | | | 6,222 | |
CNOOC Ltd. | | | 3,000 | | | | 4,696 | |
ENN Energy Holdings Ltd. | | | 2,000 | | | | 12,972 | |
Evergrande Real Estate Group Ltd. | | | 25,000 | | | | 9,674 | |
GCL-Poly Energy Holdings Ltd.(a) | | | 27,000 | | | | 9,122 | |
Hengan International Group Co. Ltd. | | | 1,500 | | | | 15,974 | |
Industrial and Commercial Bank of China Ltd.–Class H | | | 11,000 | | | | 7,276 | |
Kunlun Energy Co. Ltd. | | | 4,000 | | | | 5,376 | |
People’s Insurance Co. (Group) of China Ltd.–Class H | | | 15,000 | | | | 6,480 | |
PetroChina Co. Ltd.–Class H | | | 4,000 | | | | 5,028 | |
Shanghai Industrial Holdings Ltd. | | | 2,000 | | | | 6,164 | |
Shimao Property Holdings Ltd. | | | 5,000 | | | | 10,754 | |
SOHO China Ltd. | | | 7,500 | | | | 5,503 | |
Sun Art Retail Group Ltd. | | | 9,000 | | | | 9,652 | |
Tencent Holdings Ltd. | | | 600 | | | | 9,563 | |
Tingyi (Cayman Islands) Holding Corp. | | | 4,000 | | | | 10,038 | |
Want Want China Holdings Ltd. | | | 8,000 | | | | 11,055 | |
| | | | | 194,550 | |
| | |
| Colombia–0.18% | | | | | | | | |
Bancolombia S.A.–Preference Shares | | | 489 | | | | 6,873 | |
Grupo de Inversiones Suramericana S.A. | | | 335 | | | | 6,965 | |
| | | | | 13,838 | |
| | |
| Czech Republic–0.15% | | | | | | | | |
Komercni Banka A.S. | | | 27 | | | | 5,783 | |
O2 Czech Republic A.S. | | | 492 | | | | 5,497 | |
| | | | | 11,280 | |
| | |
| Denmark–0.64% | | | | | | | | |
A. P. Moller–Maersk AS–Class B | | | 3 | | | | 6,990 | |
Carlsberg AS–Class B | | | 96 | | | | 8,453 | |
Coloplast AS–Class B | | | 108 | | | | 9,411 | |
Danske Bank AS | | | 325 | | | | 8,923 | |
Novo Nordisk AS–Class B | | | 188 | | | | 8,497 | |
Vestas Wind Systems AS(a) | | | 228 | | | | 7,631 | |
| | | | | 49,905 | |
| | |
| Finland–0.60% | | | | | | | | |
Fortum Oyj | | | 272 | | | | 6,309 | |
Kone Oyj–Class B | | | 161 | | | | 6,929 | |
| | | | | | | | |
| | | Shares | | | Value | |
| Finland–(continued) | |
Nokia Oyj | | | 765 | | | $ | 6,384 | |
Sampo Oyj–Class A | | | 136 | | | | 6,515 | |
Stora Enso Oyj–Class R | | | 790 | | | | 6,523 | |
UPM-Kymmene Oyj | | | 446 | | | | 7,069 | |
Wartsila OYJ Abp | | | 142 | | | | 6,577 | |
| | | | | 46,306 | |
| | |
| France–3.90% | | | | | | | | |
Accor S.A. | | | 143 | | | | 6,015 | |
Air Liquide S.A. | | | 54 | | | | 6,523 | |
Airbus Group N.V. | | | 101 | | | | 6,046 | |
Alcatel-Lucent(a) | | | 1,942 | | | | 5,973 | |
Alstom S.A.(a) | | | 182 | | | | 6,344 | |
Arkema S.A. | | | 90 | | | | 5,565 | |
AXA S.A. | | | 262 | | | | 6,053 | |
BNP Paribas S.A. | | | 97 | | | | 6,116 | |
Bouygues S.A. | | | 195 | | | | 6,752 | |
Bureau Veritas S.A. | | | 287 | | | | 7,112 | |
Cap Gemini S.A. | | | 94 | | | | 6,191 | |
Carrefour S.A. | | | 194 | | | | 5,686 | |
Casino Guichard-Perrachon S.A. | | | 58 | | | | 5,962 | |
Christian Dior S.A. | | | 38 | | | | 6,735 | |
Cie Generale des Etablissements Michelin | | | 65 | | | | 5,652 | |
Compagnie de Saint-Gobain | | | 139 | | | | 5,978 | |
Credit Agricole S.A. | | | 457 | | | | 6,786 | |
Danone | | | 94 | | | | 6,387 | |
Dassault Systemes | | | 100 | | | | 6,337 | |
Edenred | | | 247 | | | | 6,851 | |
Electricite de France S.A. | | | 211 | | | | 6,238 | |
Essilor International S.A. | | | 60 | | | | 6,633 | |
GDF Suez | | | 261 | | | | 6,336 | |
Kering | | | 33 | | | | 6,381 | |
L’Oreal S.A. | | | 40 | | | | 6,285 | |
Lafarge S.A. | | | 92 | | | | 6,399 | |
Legrand S.A. | | | 120 | | | | 6,464 | |
LVMH Moet Hennessy Louis Vuitton S.A. | | | 39 | | | | 6,631 | |
Orange S.A. | | | 452 | | | | 7,193 | |
Pernod Ricard S.A. | | | 57 | | | | 6,501 | |
Publicis Groupe S.A. | | | 92 | | | | 6,384 | |
Renault S.A. | | | 88 | | | | 6,555 | |
Safran S.A. | | | 104 | | | | 6,602 | |
Sanofi | | | 59 | | | | 5,465 | |
Schneider Electric S.E. | | | 83 | | | | 6,570 | |
SCOR S.E. | | | 213 | | | | 6,534 | |
Societe Generale S.A. | | | 125 | | | | 6,047 | |
Sodexo | | | 67 | | | | 6,454 | |
Suez Environnement Co. | | | 385 | | | | 6,489 | |
Technip S.A. | | | 79 | | | | 5,730 | |
Total S.A. | | | 104 | | | | 6,206 | |
Unibail-Rodamco S.E. | | | 26 | | | | 6,670 | |
Valeo S.A. | | | 55 | | | | 6,182 | |
Vallourec S.A. | | | 141 | | | | 5,192 | |
See accompanying Notes to Financial Statements which are an integral part of the financial statements.
10 Invesco Macro International Equity Fund
| | | | | | | | |
| | | Shares | | | Value | |
| France–(continued) | |
Veolia Environnement S.A. | | | 368 | | | $ | 6,160 | |
Vinci S.A. | | | 113 | | | | 6,466 | |
Vivendi S.A. | | | 282 | | | | 6,899 | |
Zodiac Aerospace | | | 199 | | | | 6,068 | |
| | | | | 302,798 | |
| | |
| Germany–2.81% | | | | | | | | |
adidas AG | | | 84 | | | | 6,110 | |
Allianz S.E. | | | 38 | | | | 6,033 | |
BASF S.E. | | | 68 | | | | 5,985 | |
Bayer AG | | | 46 | | | | 6,540 | |
Bayerische Motoren Werke AG | | | 58 | | | | 6,205 | |
Beiersdorf AG | | | 78 | | | | 6,310 | |
Brenntag AG | | | 132 | | | | 6,392 | |
Commerzbank AG(a) | | | 424 | | | | 6,384 | |
Continental AG | | | 31 | | | | 6,085 | |
Daimler AG | | | 82 | | | | 6,374 | |
Deutsche Bank AG | | | 189 | | | | 5,893 | |
Deutsche Boerse AG | | | 92 | | | | 6,284 | |
Deutsche Lufthansa AG | | | 396 | | | | 5,851 | |
Deutsche Post AG | | | 194 | | | | 6,091 | |
Deutsche Telekom AG | | | 431 | | | | 6,492 | |
E.ON S.E. | | | 342 | | | | 5,884 | |
Fresenius Medical Care AG & Co. KGaA | | | 96 | | | | 7,037 | |
Fresenius S.E. & Co. KGaA | | | 134 | | | | 6,893 | |
GEA Group AG | | | 152 | | | | 6,997 | |
HeidelbergCement AG | | | 95 | | | | 6,467 | |
Henkel AG & Co. KGaA–Preference Shares | | | 61 | | | | 6,022 | |
Infineon Technologies AG | | | 553 | | | | 5,364 | |
K+S AG | | | 216 | | | | 6,026 | |
LANXESS AG | | | 106 | | | | 5,510 | |
Linde AG | | | 33 | | | | 6,085 | |
Merck KGaA | | | 75 | | | | 6,773 | |
Metro AG(a) | | | 194 | | | | 6,180 | |
Muenchener Rueckversicherungs–Gesellschaft AG | | | 33 | | | | 6,486 | |
Porsche Automobil Holding S.E.–Preference Shares | | | 77 | | | | 6,309 | |
ProSiebenSat.1 Media AG | | | 147 | | | | 5,930 | |
RWE AG | | | 170 | | | | 6,020 | |
SAP S.E. | | | 94 | | | | 6,389 | |
Siemens AG | | | 54 | | | | 6,084 | |
ThyssenKrupp AG(a) | | | 244 | | | | 5,863 | |
Volkswagen AG–Preference Shares | | | 30 | | | | 6,397 | |
| | | | | 217,745 | |
| | |
| Greece–0.07% | | | | | | | | |
National Bank of Greece S.A.(a) | | | 2,128 | | | | 5,120 | |
| | |
| Hong Kong–5.66% | | | | | | | | |
AIA Group Ltd. | | | 1,800 | | | | 10,039 | |
ASM Pacific Technology Ltd. | | | 1,000 | | | | 10,999 | |
Bank of East Asia, Ltd. (The) | | | 2,400 | | | | 10,027 | |
Cheung Kong (Holdings) Ltd. | | | 1,000 | | | | 17,719 | |
| | | | | | | | |
| | | Shares | | | Value | |
| Hong Kong–(continued) | |
Cheung Kong Infrastructure Holdings Ltd. | | | 1,000 | | | $ | 7,298 | |
China Gas Holdings Ltd. | | | 6,000 | | | | 10,953 | |
CLP Holdings Ltd. | | | 1,000 | | | | 8,607 | |
Dairy Farm International Holdings Ltd. | | | 900 | | | | 8,655 | |
Esprit Holdings Ltd. | | | 6,500 | | | | 8,214 | |
First Pacific Co. Ltd. | | | 10,000 | | | | 10,793 | |
Galaxy Entertainment Group Ltd. | | | 2,000 | | | | 13,655 | |
Hang Lung Group Ltd. | | | 2,000 | | | | 10,058 | |
Hang Lung Properties Ltd. | | | 3,000 | | | | 9,362 | |
Hang Seng Bank Ltd. | | | 600 | | | | 10,166 | |
Henderson Land Development Co. Ltd. | | | 1,100 | | | | 7,440 | |
HKT Trust and HKT Ltd. | | | 8,000 | | | | 9,748 | |
Hong Kong & China Gas Co. Ltd. | | | 4,300 | | | | 10,036 | |
Hong Kong Exchanges & Clearing Ltd. | | | 400 | | | | 8,857 | |
Hongkong Land Holdings Ltd. | | | 1,000 | | | | 6,970 | |
Hutchison Whampoa Ltd. | | | 1,000 | | | | 12,675 | |
Hysan Development Co. Ltd. | | | 2,000 | | | | 9,117 | |
Jardine Strategic Holdings Ltd. | | | 500 | | | | 17,815 | |
Kerry Properties Ltd. | | | 3,000 | | | | 10,380 | |
Li & Fung Ltd. | | | 8,000 | | | | 9,798 | |
Link REIT (The) | | | 2,000 | | | | 11,747 | |
MTR Corp. Ltd. | | | 2,500 | | | | 10,243 | |
New World Development Co. Ltd. | | | 8,000 | | | | 10,048 | |
Noble Group Ltd. | | | 9,000 | | | | 8,397 | |
NWS Holdings Ltd. | | | 6,000 | | | | 11,370 | |
Power Assets Holdings Ltd. | | | 1,000 | | | | 9,652 | |
Sands China Ltd. | | | 1,600 | | | | 9,965 | |
Shangri-La Asia Ltd. | | | 6,000 | | | | 8,712 | |
Sino Land Co. Ltd. | | | 6,000 | | | | 9,919 | |
SJM Holdings Ltd. | | | 5,000 | | | | 10,561 | |
Sun Hung Kai Properties Ltd. | | | 1,000 | | | | 14,906 | |
Swire Pacific Ltd.–Class A | | | 1,000 | | | | 13,114 | |
Swire Properties Ltd. | | | 3,200 | | | | 10,254 | |
Techtronic Industries Co. Ltd. | | | 3,500 | | | | 10,944 | |
VTech Holdings Ltd. | | | 900 | | | | 11,269 | |
Wharf Holdings Ltd. (The) | | | 1,000 | | | | 7,381 | |
Wheelock and Co. Ltd. | | | 2,000 | | | | 9,736 | |
Yue Yuen Industrial (Holdings) Ltd. | | | 3,500 | | | | 11,800 | |
| | | | | 439,399 | |
| | |
| Hungary–0.07% | | | | | | | | |
MOL Hungarian Oil and Gas PLC | | | 120 | | | | 5,718 | |
| | |
| Indonesia–0.23% | | | | | | | | |
Golden Agri-Resources Ltd. | | | 26,000 | | | | 10,591 | |
PT Trada Maritime Tbk(a) | | | 53,100 | | | | 7,296 | |
| | | | | | | | 17,887 | |
| | |
| Ireland–0.46% | | | | | | | | |
CRH PLC | | | 290 | | | | 6,439 | |
Kerry Group PLC–Class A | | | 97 | | | | 6,587 | |
Shire PLC | | | 342 | | | | 22,777 | |
| | | | | | | | 35,803 | |
See accompanying Notes to Financial Statements which are an integral part of the financial statements.
11 Invesco Macro International Equity Fund
| | | | | | | | |
| | | Shares | | | Value | |
| Italy–1.08% | | | | | | | | |
Assicurazioni Generali S.p.A. | | | 309 | | | $ | 6,333 | |
Atlantia S.p.A. | | | 268 | | | | 6,314 | |
Enel S.p.A. | | | 1,250 | | | | 6,383 | |
Eni S.p.A. | | | 264 | | | | 5,624 | |
Intesa Sanpaolo S.p.A. | | | 2,147 | | | | 6,302 | |
Luxottica Group S.p.A. | | | 130 | | | | 6,619 | |
Prada S.p.A. | | | 1,600 | | | | 9,971 | |
Saipem S.p.A.(a) | | | 313 | | | | 4,910 | |
Snam S.p.A. | | | 1,150 | | | | 6,219 | |
Telecom Italia S.p.A.(a) | | | 5,678 | | | | 6,421 | |
Terna–Rete Elettrica Nazionale S.p.A. | | | 1,305 | | | | 6,579 | |
UniCredit S.p.A. | | | 828 | | | | 5,987 | |
Unione di Banche Italiane S.C.p.A. | | | 801 | | | | 6,281 | |
| | | | | | | | 83,943 | |
| | |
| Japan–18.61% | | | | | | | | |
Aeon Co., Ltd. | | | 700 | | | | 7,047 | |
Aisin Seiki Co., Ltd. | | | 200 | | | | 6,707 | |
Amada Co., Ltd. | | | 700 | | | | 6,241 | |
ANA Holdings Inc. | | | 2,000 | | | | 4,791 | |
Aozora Bank, Ltd. | | | 2,000 | | | | 7,140 | |
Asahi Glass Co., Ltd. | | | 1,000 | | | | 5,275 | |
Asahi Group Holdings, Ltd. | | | 200 | | | | 6,261 | |
Asahi Kasei Corp. | | | 1,000 | | | | 8,308 | |
ASICS Corp. | | | 400 | | | | 9,210 | |
Astellas Pharma Inc. | | | 500 | | | | 7,899 | |
Bank of Kyoto, Ltd. (The) | | | 1,000 | | | | 8,752 | |
Bank of Yokohama, Ltd. (The) | | | 1,000 | | | | 5,833 | |
Benesse Holdings, Inc. | | | 200 | | | | 6,344 | |
Bridgestone Corp. | | | 200 | | | | 6,685 | |
Brother Industries, Ltd. | | | 400 | | | | 7,325 | |
Canon Inc. | | | 200 | | | | 6,160 | |
Casio Computer Co., Ltd. | | | 500 | | | | 8,052 | |
Chiba Bank, Ltd. (The) | | | 1,000 | | | | 7,158 | |
Chubu Electric Power Co., Inc.(a) | | | 600 | | | | 7,230 | |
Chugai Pharmaceutical Co., Ltd. | | | 200 | | | | 6,081 | |
Chugoku Bank, Ltd. (The) | | | 500 | | | | 7,528 | |
Chugoku Electric Power Co., Inc. (The) | | | 500 | | | | 6,678 | |
Credit Saison Co., Ltd. | | | 400 | | | | 8,510 | |
Dai Nippon Printing Co., Ltd. | | | 1,000 | | | | 9,969 | |
Dai-ichi Life Insurance Co. Ltd. (The) | | | 500 | | | | 7,610 | |
Daihatsu Motor Co., Ltd. | | | 300 | | | | 4,183 | |
Daiichi Sankyo Co., Ltd. | | | 300 | | | | 4,539 | |
Daikin Industries, Ltd. | | | 100 | | | | 6,297 | |
Daiwa House Industry Co., Ltd. | | | 300 | | | | 5,782 | |
Daiwa Securities Group Inc. | | | 1,000 | | | | 7,972 | |
Denso Corp. | | | 100 | | | | 4,658 | |
Dentsu Inc. | | | 100 | | | | 3,748 | |
East Japan Railway Co. | | | 100 | | | | 7,909 | |
Eisai Co., Ltd. | | | 100 | | | | 3,918 | |
Electric Power Development Co., Ltd. | | | 200 | | | | 6,919 | |
FamilyMart Co., Ltd. | | | 100 | | | | 4,010 | |
| | | | | | | | |
| | | Shares | | | Value | |
| Japan–(continued) | |
Fuji Heavy Industries Ltd. | | | 200 | | | $ | 6,787 | |
Fuji Media Holdings, Inc. | | | 500 | | | | 6,820 | |
FUJIFILM Holdings Corp. | | | 200 | | | | 6,566 | |
Fujitsu Ltd. | | | 1,000 | | | | 6,121 | |
Fukuoka Financial Group, Inc. | | | 1,000 | | | | 5,192 | |
GungHo Online Entertainment, Inc. | | | 1,100 | | | | 4,508 | |
Gunma Bank, Ltd. (The) | | | 1,000 | | | | 6,333 | |
Hachijuni Bank, Ltd. (The) | | | 1,000 | | | | 6,218 | |
Hamamatsu Photonics K.K. | | | 100 | | | | 4,627 | |
Hankyu Hanshin Holdings, Inc. | | | 1,000 | | | | 6,023 | |
Hino Motors, Ltd. | | | 500 | | | | 7,348 | |
Hiroshima Bank, Ltd. (The) | | | 1,000 | | | | 5,075 | |
Hisamitsu Pharmaceutical Co., Inc. | | | 100 | | | | 3,381 | |
Hitachi, Ltd. | | | 1,000 | | | | 8,030 | |
Hokuhoku Financial Group, Inc. | | | 4,000 | | | | 7,940 | |
Hokuriku Electric Power Co. | | | 500 | | | | 6,813 | |
Honda Motor Co., Ltd. | | | 200 | | | | 6,364 | |
Hoya Corp. | | | 200 | | | | 7,313 | |
Hulic Co. Ltd. | | | 600 | | | | 6,702 | |
Idemitsu Kosan Co., Ltd. | | | 400 | | | | 7,919 | |
IHI Corp. | | | 1,000 | | | | 4,938 | |
INPEX Corp. | | | 500 | | | | 6,410 | |
Isetan Mitsukoshi Holdings Ltd. | | | 600 | | | | 8,251 | |
Isuzu Motors Ltd. | | | 500 | | | | 6,692 | |
ITOCHU Corp. | | | 500 | | | | 6,123 | |
Iyo Bank, Ltd. (The) | | | 700 | | | | 7,582 | |
J. Front Retailing Co., Ltd. | | | 600 | | | | 8,048 | |
Japan Airlines Co. Ltd. | | | 200 | | | | 5,330 | |
Japan Exchange Group Inc. | | | 200 | | | | 5,017 | |
Japan Prime Realty Investment Corp. | | | 2 | | | | 7,412 | |
Japan Real Estate Investment Corp. | | | 1 | | | | 5,414 | |
Japan Retail Fund Investment Corp. | | | 4 | | | | 8,037 | |
Japan Tobacco, Inc. | | | 200 | | | | 6,930 | |
JFE Holdings, Inc. | | | 400 | | | | 8,011 | |
Joyo Bank, Ltd. (The) | | | 1,000 | | | | 5,434 | |
JSR Corp. | | | 300 | | | | 5,468 | |
JTEKT Corp. | | | 300 | | | | 4,859 | |
JX Holdings, Inc. | | | 1,300 | | | | 5,647 | |
Kajima Corp. | | | 1,000 | | | | 4,544 | |
Kansai Electric Power Co., Inc. (The)(a) | | | 700 | | | | 6,981 | |
Kao Corp. | | | 100 | | | | 3,837 | |
Kawasaki Heavy Industries, Ltd. | | | 1,000 | | | | 3,970 | |
KDDI Corp. | | | 100 | | | | 6,443 | |
Keikyu Corp. | | | 1,000 | | | | 8,407 | |
Keio Corp. | | | 1,000 | | | | 7,700 | |
Keisei Electric Railway Co., Ltd. | | | 1,000 | | | | 11,900 | |
Kintetsu Corp. | | | 2,000 | | | | 7,017 | |
Kirin Holdings Co., Ltd. | | | 500 | | | | 6,537 | |
Kobe Steel, Ltd. | | | 3,000 | | | | 4,831 | |
Komatsu Ltd. | | | 200 | | | | 4,806 | |
Konica Minolta Inc. | | | 600 | | | | 6,791 | |
See accompanying Notes to Financial Statements which are an integral part of the financial statements.
12 Invesco Macro International Equity Fund
| | | | | | | | |
| | | Shares | | | Value | |
| Japan–(continued) | |
Kuraray Co., Ltd. | | | 600 | | | $ | 7,044 | |
Kurita Water Industries Ltd. | | | 200 | | | | 4,315 | |
Kyocera Corp. | | | 100 | | | | 4,693 | |
Kyushu Electric Power Co. Inc.(a) | | | 600 | | | | 6,566 | |
Lawson, Inc. | | | 100 | | | | 6,838 | |
LIXIL Group Corp. | | | 400 | | | | 8,830 | |
Makita Corp. | | | 100 | | | | 5,859 | |
Marubeni Corp. | | | 900 | | | | 5,853 | |
Marui Group Co., Ltd. | | | 800 | | | | 6,827 | |
Mazda Motor Corp. | | | 200 | | | | 4,806 | |
Medipal Holdings Corp. | | | 600 | | | | 6,764 | |
MEIJI Holdings Co., Ltd. | | | 100 | | | | 8,524 | |
Mitsubishi Chemical Holdings Corp. | | | 1,200 | | | | 6,015 | |
Mitsubishi Corp. | | | 400 | | | | 7,976 | |
Mitsubishi Gas Chemical Co., Inc. | | | 1,000 | | | | 6,026 | |
Mitsubishi Heavy Industries, Ltd. | | | 1,000 | | | | 6,351 | |
Mitsubishi Materials Corp. | | | 2,000 | | | | 6,358 | |
Mitsubishi Motors Corp. | | | 600 | | | | 6,317 | |
Mitsubishi Tanabe Pharma Corp. | | | 500 | | | | 7,689 | |
Mitsubishi UFJ Financial Group, Inc. | | | 1,100 | | | | 6,560 | |
Mitsui & Co., Ltd. | | | 300 | | | | 4,597 | |
Mitsui Chemicals Inc. | | | 2,000 | | | | 5,926 | |
Mitsui O.S.K. Lines, Ltd. | | | 2,000 | | | | 6,365 | |
Mizuho Financial Group, Inc. | | | 3,400 | | | | 6,196 | |
MS&AD Insurance Group Holdings, Inc. | | | 200 | | | | 4,389 | |
Nagoya Railroad Co., Ltd. | | | 1,000 | | | | 4,389 | |
Namco Bandai Holdings Inc. | | | 200 | | | | 4,948 | |
NEC Corp. | | | 2,000 | | | | 7,212 | |
NGK Spark Plug Co., Ltd. | | | 200 | | | | 5,307 | |
Nidec Corp. | | | 100 | | | | 6,572 | |
Nikon Corp. | | | 500 | | | | 6,859 | |
Nippon Building Fund Inc. | | | 1 | | | | 5,548 | |
Nippon Express Co., Ltd. | | | 1,000 | | | | 4,447 | |
Nippon Prologis REIT Inc. | | | 2 | | | | 4,616 | |
Nippon Steel & Sumitomo Metal Corp. | | | 2,000 | | | | 5,365 | |
Nippon Telegraph & Telephone Corp. | | | 100 | | | | 6,248 | |
Nippon Television Holdings, Inc. | | | 500 | | | | 7,655 | |
Nippon Yusen Kabushiki Kaisha | | | 2,000 | | | | 5,280 | |
Nissan Motor Co., Ltd. | | | 700 | | | | 6,480 | |
Nisshin Seifun Group Inc. | | | 600 | | | | 5,990 | |
Nissin Foods Holdings Co., Ltd. | | | 100 | | | | 5,345 | |
Nitori Holdings Co., Ltd. | | | 100 | | | | 6,437 | |
Nitto Denko Corp. | | | 100 | | | | 5,512 | |
NKSJ Holdings, Inc. | | | 200 | | | | 5,133 | |
Nomura Holdings, Inc. | | | 1,000 | | | | 6,271 | |
Nomura Research Institute, Ltd. | | | 200 | | | | 6,658 | |
NTT Data Corp. | | | 200 | | | | 7,865 | |
NTT DoCoMo, Inc. | | | 300 | | | | 5,031 | |
Obayashi Corp. | | | 1,000 | | | | 7,032 | |
Odakyu Electric Railway Co., Ltd. | | | 1,000 | | | | 9,505 | |
Oji Holdings Corp. | | | 1,000 | | | | 3,610 | |
| | | | | | | | |
| | | Shares | | | Value | |
| Japan–(continued) | |
Olympus Corp.(a) | | | 200 | | | $ | 7,314 | |
OMRON Corp. | | | 100 | | | | 4,852 | |
Ono Pharmaceutical Co. Ltd. | | | 100 | | | | 10,251 | |
ORIX Corp. | | | 500 | | | | 7,001 | |
Osaka Gas Co., Ltd. | | | 1,000 | | | | 4,030 | |
Otsuka Holdings Co., Ltd. | | | 200 | | | | 7,171 | |
Panasonic Corp. | | | 600 | | | | 7,239 | |
Rakuten Inc. | | | 600 | | | | 6,861 | |
Renesas Electronics Corp.(a) | | | 700 | | | | 5,540 | |
Resona Holdings, Inc. | | | 1,100 | | | | 6,399 | |
Ricoh Co., Ltd. | | | 600 | | | | 6,362 | |
Rinnai Corp. | | | 100 | | | | 8,955 | |
Rohm Co. Ltd. | | | 100 | | | | 6,227 | |
Santen Pharmaceutical Co., Ltd. | | | 100 | | | | 6,003 | |
SECOM Co., Ltd. | | | 100 | | | | 6,200 | |
Sega Sammy Holdings Inc. | | | 300 | | | | 4,800 | |
Seiko Epson Corp. | | | 100 | | | | 4,736 | |
Sekisui Chemical Co., Ltd. | | | 1,000 | | | | 12,433 | |
Sekisui House, Ltd. | | | 600 | | | | 7,509 | |
Seven & I Holdings Co., Ltd. | | | 100 | | | | 3,949 | |
Sharp Corp.(a) | | | 2,000 | | | | 5,118 | |
Shikoku Electric Power Co. Inc.(a) | | | 500 | | | | 6,914 | |
Shimadzu Corp. | | | 1,000 | | | | 8,874 | |
Shimamura Co., Ltd. | | | 100 | | | | 8,834 | |
Shimizu Corp. | | | 1,000 | | | | 7,484 | |
Shin-Etsu Chemical Co., Ltd. | | | 100 | | | | 6,506 | |
Shinsei Bank, Ltd. | | | 4,000 | | | | 9,001 | |
Shionogi & Co., Ltd. | | | 200 | | | | 5,200 | |
Shiseido Co., Ltd. | | | 300 | | | | 5,019 | |
Shizuoka Bank, Ltd. (The) | | | 1,000 | | | | 10,460 | |
SoftBank Corp. | | | 100 | | | | 7,411 | |
Sony Corp. | | | 300 | | | | 6,046 | |
Sony Financial Holdings Inc. | | | 500 | | | | 8,071 | |
Stanley Electric Co., Ltd. | | | 200 | | | | 4,114 | |
Sumitomo Chemical Co., Ltd. | | | 1,000 | | | | 3,491 | |
Sumitomo Corp. | | | 500 | | | | 5,412 | |
Sumitomo Electric Industries, Ltd. | | | 500 | | | | 6,875 | |
Sumitomo Heavy Industries, Ltd. | | | 1,000 | | | | 5,651 | |
Sumitomo Mitsui Financial Group, Inc. | | | 100 | | | | 4,066 | |
Sumitomo Mitsui Trust Holdings, Inc. | | | 1,000 | | | | 4,124 | |
Suntory Beverage & Food Ltd. | | | 200 | | | | 7,209 | |
Suruga Bank Ltd. | | | 400 | | | | 8,450 | |
Suzuken Co., Ltd. | | | 200 | | | | 5,461 | |
Suzuki Motor Corp. | | | 200 | | | | 6,800 | |
Sysmex Corp. | | | 100 | | | | 4,399 | |
T&D Holdings, Inc. | | | 500 | | | | 6,538 | |
Taiheiyo Cement Corp. | | | 1,000 | | | | 3,675 | |
Taisei Corp. | | | 1,000 | | | | 5,651 | |
Taisho Pharmaceutical Holdings Co. Ltd. | | | 100 | | | | 7,113 | |
Takashimaya Co., Ltd. | | | 1,000 | | | | 8,356 | |
Takeda Pharmaceutical Co. Ltd. | | | 100 | | | | 4,363 | |
See accompanying Notes to Financial Statements which are an integral part of the financial statements.
13 Invesco Macro International Equity Fund
| | | | | | | | |
| | | Shares | | | Value | |
| Japan–(continued) | |
TDK Corp. | | | 100 | | | $ | 5,770 | |
Teijin Ltd. | | | 2,000 | | | | 4,880 | |
Terumo Corp. | | | 200 | | | | 5,084 | |
THK Co., Ltd. | | | 200 | | | | 5,101 | |
Tobu Railway Co., Ltd. | | | 1,000 | | | | 5,112 | |
Toho Co., Ltd. | | | 400 | | | | 9,268 | |
Toho Gas Co., Ltd. | | | 1,000 | | | | 5,505 | |
Tohoku Electric Power Co., Inc. | | | 600 | | | | 7,590 | |
Tokio Marine Holdings, Inc. | | | 200 | | | | 6,482 | |
Tokyo Electric Power Co. Inc.(a) | | | 1,700 | | | | 6,174 | |
Tokyo Electron Ltd. | | | 100 | | | | 6,206 | |
Tokyo Gas Co., Ltd. | | | 1,000 | | | | 5,821 | |
Tokyo Tatemono Co., Ltd. | | | 1,000 | | | | 8,810 | |
Tokyu Corp. | | | 1,000 | | | | 6,674 | |
Tokyu Fudosan Holdings, Corp. | | | 900 | | | | 6,403 | |
TonenGeneral Sekiyu K.K. | | | 1,000 | | | | 8,816 | |
Toppan Printing Co. Ltd. | | | 1,000 | | | | 6,893 | |
Toray Industries, Inc. | | | 1,000 | | | | 6,773 | |
Toshiba Corp. | | | 1,000 | | | | 4,467 | |
Toyo Seikan Group Holdings Ltd. | | | 500 | | | | 6,142 | |
Toyo Suisan Kaisha, Ltd. | | | 200 | | | | 6,912 | |
Toyota Industries Corp. | | | 100 | | | | 4,801 | |
Toyota Motor Corp. | | | 100 | | | | 6,016 | |
Toyota Tsusho Corp. | | | 200 | | | | 5,084 | |
Trend Micro Inc. | | | 200 | | | | 6,773 | |
Unicharm Corp. | | | 400 | | | | 9,370 | |
United Urban Investment Corp. | | | 5 | | | | 7,905 | |
West Japan Railway Co. | | | 100 | | | | 4,827 | |
Yahoo Japan Corp. | | | 1,500 | | | | 5,311 | |
Yakult Honsha Co., Ltd. | | | 100 | | | | 5,565 | |
Yamada Denki Co., Ltd. | | | 1,900 | | | | 6,106 | |
Yamaguchi Financial Group, Inc. | | | 1,000 | | | | 9,629 | |
Yamaha Motor Co. Ltd. | | | 400 | | | | 7,700 | |
Yamato Holdings Co., Ltd. | | | 400 | | | | 8,624 | |
Yaskawa Electric Corp. | | | 500 | | | | 6,549 | |
Yokogawa Electric Corp. | | | 500 | | | | 7,078 | |
| | | | | | | | 1,443,914 | |
| | |
| Luxembourg–0.15% | | | | | | | | |
ArcelorMittal S.A. | | | 460 | | | | 6,030 | |
Tenaris S.A. | | | 299 | | | | 5,916 | |
| | | | | | | | 11,946 | |
| | |
| Macau–0.15% | | | | | | | | |
Wynn Macau, Ltd. | | | 3,200 | | | | 11,769 | |
| | |
| Malaysia–3.55% | | | | | | | | |
Alliance Financial Group Berhad | | | 4,500 | | | | 6,579 | |
AMMB Holdings Berhad | | | 5,900 | | | | 12,174 | |
Axiata Group Berhad | | | 8,700 | | | | 18,697 | |
British American Tobacco Malaysia Berhad | | | 388 | | | | 8,198 | |
Bumi Armada Berhad | | | 13,000 | | | | 6,205 | |
CIMB Group Holdings Berhad | | | 4,500 | | | | 8,899 | |
| | | | | | | | |
| | | Shares | | | Value | |
| Malaysia–(continued) | |
DiGi.Com Berhad | | | 5,400 | | | $ | 10,216 | |
Gamuda Berhad | | | 4,700 | | | | 7,315 | |
Genting Berhad | | | 2,800 | | | | 8,329 | |
Genting Malaysia Berhad | | | 4,700 | | | | 6,168 | |
Hap Seng Consolidated Berhad | | | 7,200 | | | | 9,614 | |
Hong Leong Bank Berhad | | | 2,800 | | | | 12,444 | |
IHH Healthcare Berhad | | | 5,600 | | | | 8,427 | |
IJM Corp. Berhad | | | 4,300 | | | | 9,056 | |
IOI Corp. Berhad | | | 5,100 | | | | 7,581 | |
Kuala Lumpur Kepong Berhad | | | 1,100 | | | | 7,691 | |
Malayan Banking Berhad | | | 4,400 | | | | 12,975 | |
Maxis Berhad | | | 6,400 | | | | 13,151 | |
MISC Berhad | | | 3,100 | | | | 6,511 | |
Petronas Chemicals Group Berhad | | | 5,300 | | | | 9,931 | |
Petronas Dagangan Berhad | | | 900 | | | | 5,597 | |
Petronas Gas Berhad | | | 1,000 | | | | 6,860 | |
Public Bank Berhad | | | 2,000 | | | | 11,286 | |
RHB Capital Berhad | | | 2,900 | | | | 7,758 | |
SapuraKencana Petroleum Berhad | | | 4,600 | | | | 4,802 | |
Sime Darby Berhad | | | 5,900 | | | | 17,389 | |
Telekom Malaysia Berhad | | | 4,300 | | | | 9,463 | |
Tenaga Nasional Berhad | | | 2,000 | | | | 8,123 | |
UMW Holdings Berhad | | | 2,100 | | | | 7,477 | |
YTL Corp. Berhad | | | 12,400 | | | | 6,257 | |
| | | | | | | | 275,173 | |
| | |
| Mexico–0.73% | | | | | | | | |
America Movil S.A.B. de C.V.–Series L | | | 4,900 | | | | 5,993 | |
Arca Continental S.A.B. de C.V. | | | 1,000 | | | | 6,438 | |
Cemex S.A.B. de C.V.–Series CPO(a)(d) | | | 5,000 | | | | 6,164 | |
Coca-Cola Femsa, S.A.B. de C.V.–Series L | | | 600 | | | | 6,354 | |
Fibra Uno Administracion S.A. de C.V. | | | 1,700 | | | | 5,901 | |
Fomento Economico Mexicano, S.A.B. de C.V. Series BD(e) | | | 800 | | | | 7,707 | |
Grupo Financiero Banorte S.A.B. de C.V.–Class O | | | 900 | | | | 5,768 | |
Grupo Televisa S.A.B.–Series CPO(f) | | | 900 | | | | 6,520 | |
Wal-Mart de Mexico S.A.B. de C.V.–Series V | | | 2,500 | | | | 5,798 | |
| | | | | | | | 56,643 | |
| | |
| Netherlands–0.98% | | | | | | | | |
Aegon N.V. | | | 776 | | | | 6,324 | |
Akzo Nobel N.V. | | | 92 | | | | 6,124 | |
ASML Holding N.V. | | | 66 | | | | 6,585 | |
Gemalto N.V. | | | 73 | | | | 5,581 | |
Heineken Holding N.V. | | | 98 | | | | 6,348 | |
Heineken N.V. | | | 89 | | | | 6,646 | |
Koninklijke Ahold N.V. | | | 399 | | | | 6,676 | |
Koninklijke DSM N.V. | | | 104 | | | | 6,520 | |
Koninklijke KPN N.V. | | | 2,088 | | | | 6,857 | |
Koninklijke Philips N.V. | | | 220 | | | | 6,153 | |
Randstad Holding N.V. | | | 135 | | | | 5,963 | |
Wolters Kluwer N.V. | | | 234 | | | | 6,250 | |
| | | | | | | | 76,027 | |
See accompanying Notes to Financial Statements which are an integral part of the financial statements.
14 Invesco Macro International Equity Fund
| | | | | | | | |
| | | Shares | | | Value | |
| New Zealand–0.40% | | | | | | | | |
Auckland International Airport Ltd. | | | 3,425 | | | $ | 10,540 | |
Fletcher Building Ltd. | | | 1,449 | | | | 9,744 | |
Spark New Zealand Ltd. | | | 4,304 | | | | 10,612 | |
| | | | | | | | 30,896 | |
| | |
| Norway–0.54% | | | | | | | | |
DNB ASA | | | 483 | | | | 8,871 | |
Orkla ASA | | | 990 | | | | 7,565 | |
Statoil ASA | | | 322 | | | | 7,359 | |
Telenor ASA | | | 414 | | | | 9,304 | |
Yara International ASA | | | 187 | | | | 8,606 | |
| | | | | | | | 41,705 | |
| | |
| Philippines–0.33% | | | | | | | | |
Ayala Corp. | | | 380 | | | | 5,842 | |
Bank of the Philippine Islands | | | 2,960 | | | | 6,266 | |
BDO Unibank, Inc. | | | 2,850 | | | | 6,223 | |
Philippine Long Distance Telephone Co. | | | 105 | | | | 7,328 | |
| | | | | | | | 25,659 | |
| | |
| Poland–0.08% | | | | | | | | |
Powszechna Kasa Oszczednosci Bank Polski S.A. | | | 536 | | | | 5,957 | |
| | |
| Portugal–0.08% | | | | | | | | |
Energias de Portugal, S.A. | | | 1,516 | | | | 6,535 | |
| | |
| Russia–0.21% | | | | | | | | |
LUKOIL OAO–ADR | | | 106 | | | | 5,212 | |
Rosneft Oil Co.–REGS–GDR(g) | | | 941 | | | | 5,241 | |
Surgutneftegas OAO–ADR | | | 879 | | | | 5,792 | |
| | | | | | | | 16,245 | |
| | |
| Singapore–2.79% | | | | | | | | |
Ascendas REIT | | | 6,000 | | | | 10,460 | |
CapitaLand Ltd. | | | 4,000 | | | | 9,923 | |
CapitaMall Trust | | | 7,000 | | | | 10,769 | |
City Developments Ltd. | | | 1,000 | | | | 7,369 | |
ComfortDelGro Corp. Ltd. | | | 5,000 | | | | 10,274 | |
DBS Group Holdings Ltd. | | | 1,000 | | | | 14,450 | |
Genting Singapore PLC | | | 12,000 | | | | 10,274 | |
Global Logistic Properties Ltd. | | | 5,000 | | | | 10,725 | |
Keppel Corp. Ltd. | | | 1,000 | | | | 7,378 | |
Oversea-Chinese Banking Corp. Ltd. | | | 1,000 | | | | 7,698 | |
SembCorp Industries Ltd. | | | 3,000 | | | | 11,392 | |
SembCorp Marine Ltd. | | | 3,000 | | | | 8,499 | |
Singapore Airlines Ltd. | | | 1,000 | | | | 7,705 | |
Singapore Exchange Ltd. | | | 2,000 | | | | 10,917 | |
Singapore Press Holdings Ltd. | | | 3,000 | | | | 10,019 | |
Singapore Technologies Engineering Ltd. | | | 4,000 | | | | 11,694 | |
Singapore Telecommunications Ltd. | | | 3,000 | | | | 8,826 | |
Suntec REIT | | | 7,000 | | | | 9,725 | |
United Overseas Bank Ltd. | | | 1,000 | | | | 17,945 | |
UOL Group Ltd. | | | 2,000 | | | | 10,061 | |
| | | | | | | | |
| | | Shares | | | Value | |
| Singapore–(continued) | | | | | | | | |
Wilmar International Ltd. | | | 4,000 | | | $ | 9,963 | |
| | | | | | | | 216,066 | |
| | |
| South Africa–2.42% | | | | | | | | |
Aspen Pharmacare Holdings Ltd. | | | 192 | | | | 6,851 | |
Barclays Africa Group Ltd. | | | 463 | | | | 7,313 | |
Bidvest Group Ltd. | | | 283 | | | | 7,786 | |
Coronation Fund Managers Ltd. | | | 685 | | | | 5,933 | |
Discovery Ltd. | | | 674 | | | | 6,133 | |
Exxaro Resources Ltd. | | | 505 | | | | 5,267 | |
FirstRand Ltd. | | | 1,578 | | | | 6,755 | |
Growthpoint Properties Ltd. | | | 3,416 | | | | 8,287 | |
Investec Ltd. | | | 694 | | | | 6,338 | |
Liberty Holdings Ltd. | | | 632 | | | | 7,316 | |
Mediclinic International Ltd. | | | 698 | | | | 6,235 | |
MMI Holdings Ltd. | | | 2,356 | | | | 6,024 | |
Mr. Price Group Ltd. | | | 321 | | | | 6,642 | |
MTN Group Ltd. | | | 288 | | | | 6,373 | |
Nedbank Group Ltd. | | | 313 | | | | 6,820 | |
Netcare Ltd. | | | 2,081 | | | | 6,294 | |
Rand Merchant Insurance Holdings Ltd. | | | 2,202 | | | | 7,853 | |
Redefine Properties Ltd. | | | 7,637 | | | | 6,929 | |
Remgro Ltd. | | | 316 | | | | 7,250 | |
Sanlam Ltd. | | | 966 | | | | 6,102 | |
Sasol Ltd. | | | 141 | | | | 7,047 | |
Shoprite Holdings Ltd. | | | 507 | | | | 7,347 | |
SPAR Group Ltd. (The) | | | 557 | | | | 6,516 | |
Standard Bank Group Ltd. | | | 551 | | | | 6,939 | |
Steinhoff International Holdings Ltd. | | | 1,266 | | | | 6,476 | |
Tiger Brands Ltd. | | | 210 | | | | 6,316 | |
Tsogo Sun Holdings Ltd. | | | 2,691 | | | | 6,760 | |
Vodacom Group Ltd. | | | 483 | | | | 5,862 | |
| | | | | | | | 187,764 | |
| | |
| South Korea–1.98% | | | | | | | | |
BS Financial Group Inc. | | | 362 | | | | 5,626 | |
Daewoo Securities Co., Ltd.(a) | | | 662 | | | | 6,950 | |
Dongbu Insurance Co., Ltd. | | | 110 | | | | 6,165 | |
GS Holdings | | | 195 | | | | 7,562 | |
Hankook Tire Co. Ltd. | | | 314 | | | | 6,366 | |
Hyundai Engineering & Construction Co. Ltd. | | | 103 | | | | 4,685 | |
Hyundai Marine & Fire Insurance Co., Ltd. | | | 249 | | | | 6,581 | |
Kia Motors Corp. | | | 105 | | | | 5,118 | |
Korea Investment Holdings Co., Ltd. | | | 135 | | | | 6,833 | |
KT Corp. | | | 182 | | | | 5,585 | |
KT&G Corp. | | | 73 | | | | 6,489 | |
Kumho Petrochemical Co., Ltd. | | | 82 | | | | 5,921 | |
LG Chem Ltd. | | | 23 | | | | 4,279 | |
LG Corp. | | | 102 | | | | 6,070 | |
LG Electronics Inc. | | | 93 | | | | 5,682 | |
POSCO | | | 22 | | | | 6,323 | |
S-Oil Corp. | | | 195 | | | | 7,397 | |
See accompanying Notes to Financial Statements which are an integral part of the financial statements.
15 Invesco Macro International Equity Fund
| | | | | | | | |
| | | Shares | | | Value | |
| South Korea–(continued) | |
Samsung Card Co., Ltd. | | | 133 | | | $ | 5,724 | |
Samsung Electro-Mechanics Co., Ltd. | | | 119 | | | | 5,404 | |
Samsung Electronics Co., Ltd. | | | 6 | | | | 6,950 | |
Samsung Fire & Marine Insurance Co., Ltd. | | | 24 | | | | 6,467 | |
Samsung Life Insurance Co., Ltd. | | | 66 | | | | 7,202 | |
Samsung Securities Co., Ltd. | | | 134 | | | | 6,001 | |
Samsung Techwin Co., Ltd. | | | 203 | | | | 6,202 | |
Woori Investment & Securities Co., Ltd. | | | 555 | | | | 6,086 | |
| | | | | | | | 153,668 | |
| | |
| Spain–1.39% | | | | | | | | |
Abertis Infraestructuras S.A. | | | 327 | | | | 6,812 | |
Amadeus IT Holding S.A.–Class A | | | 174 | | | | 6,401 | |
Banco Bilbao Vizcaya Argentaria, S.A. | | | 546 | | | | 6,105 | |
Banco de Sabadell S.A. | | | 2,025 | | | | 5,854 | |
Banco Popular Espanol S.A. | | | 1,039 | | | | 5,961 | |
Banco Santander S.A. | | | 650 | | | | 5,735 | |
Bankia S.A.(a) | | | 3,467 | | | | 6,210 | |
CaixaBank S.A. | | | 1,090 | | | | 5,957 | |
Enagas S.A. | | | 206 | | | | 6,918 | |
Ferrovial S.A. | | | 329 | | | | 6,731 | |
Gas Natural SDG, S.A. | | | 219 | | | | 6,327 | |
Grifols S.A. | | | 157 | | | | 6,396 | |
Iberdrola S.A. | | | 939 | | | | 6,643 | |
Industria de Diseno Textil, S.A. | | | 239 | | | | 6,730 | |
Red Electrica Corp. S.A. | | | 78 | | | | 6,817 | |
Repsol S.A. | | | 274 | | | | 6,128 | |
Telefonica S.A. | | | 414 | | | | 6,223 | |
| | | | | | | | 107,948 | |
| | |
| Sweden–1.96% | | | | | | | | |
Assa Abloy AB–Class B | | | 176 | | | | 9,359 | |
Atlas Copco AB–Class A | | | 308 | | | | 8,899 | |
Hennes & Mauritz AB–Class B | | | 208 | | | | 8,281 | |
Hexagon AB–Class B | | | 278 | | | | 9,355 | |
Investor AB–Class B | | | 261 | | | | 9,338 | |
Nordea Bank AB | | | 685 | | | | 8,784 | |
Sandvik AB | | | 783 | | | | 8,609 | |
Skandinaviska Enskilda Banken AB–Class A | | | 704 | | | | 9,033 | |
Skanska AB–Class B | | | 449 | | | | 9,169 | |
SKF AB–Class B | | | 414 | | | | 8,309 | |
Svenska Cellulosa AB–Class B | | | 357 | | | | 8,002 | |
Svenska Handelsbanken AB–Class A | | | 200 | | | | 9,536 | |
Swedbank AB–Class A | | | 369 | | | | 9,759 | |
Swedish Match AB | | | 280 | | | | 9,104 | |
Telefonaktiebolaget LM Ericsson–Class B | | | 694 | | | | 8,206 | |
TeliaSonera AB | | | 1,344 | | | | 9,316 | |
Volvo AB-Class B–Class B | | | 795 | | | | 9,178 | |
| | | | | | | | 152,237 | |
| | |
| Switzerland–2.93% | | | | | | | | |
ABB Ltd. | | | 397 | | | | 8,705 | |
Actelion Ltd. | | | 77 | | | | 9,141 | |
| | | | | | | | |
| | | Shares | | | Value | |
| Switzerland–(continued) | |
Adecco S.A | | | 127 | | | $ | 8,605 | |
Cie Financiere Richemont S.A. | | | 105 | | | | 8,847 | |
Credit Suisse Group AG | | | 328 | | | | 8,736 | |
Geberit AG | | | 28 | | | | 9,553 | |
Givaudan S.A. | | | 6 | | | | 10,011 | |
Glencore PLC | | | 5,030 | | | | 25,792 | |
Holcim Ltd. | | | 122 | | | | 8,650 | |
Julius Baer Group Ltd. | | | 203 | | | | 8,894 | |
Kuehne + Nagel International AG | | | 70 | | | | 9,120 | |
Nestle S.A. | | | 126 | | | | 9,219 | |
Novartis AG | | | 97 | | | | 8,996 | |
Roche Holding AG | | | 30 | | | | 8,860 | |
Schindler Holding AG–Participation Ctfs. | | | 65 | | | | 9,094 | |
SGS S.A. | | | 4 | | | | 8,789 | |
Sika AG | | | 2 | | | | 7,147 | |
STMicroelectronics N.V. | | | 847 | | | | 5,668 | |
Swatch Group AG (The) | | | 18 | | | | 8,533 | |
Swiss Re AG | | | 111 | | | | 8,976 | |
Swisscom AG | | | 16 | | | | 9,430 | |
Syngenta AG | | | 27 | | | | 8,367 | |
UBS AG | | | 513 | | | | 8,916 | |
Zurich Insurance Group AG | | | 31 | | | | 9,382 | |
| | | | | | | | 227,431 | |
| | |
| Taiwan–5.09% | | | | | | | | |
Asia Cement Corp. | | | 7,140 | | | | 9,202 | |
Cathay Financial Holding Co., Ltd. | | | 4,250 | | | | 7,019 | |
Chailease Holding Co. Ltd. | | | 2,000 | | | | 4,933 | |
Chang Hwa Commercial Bank | | | 16,360 | | | | 10,299 | |
Cheng Shin Rubber Industry Co., Ltd. | | | 3,000 | | | | 7,002 | |
Cheng Uei Precision Industry Co., Ltd. | | | 4,000 | | | | 6,674 | |
Chicony Electronics Co., Ltd. | | | 2,010 | | | | 5,780 | |
China Development Financial Holding Corp. | | | 28,000 | | | | 8,991 | |
China Life Insurance Co., Ltd. | | | 8,800 | | | | 7,672 | |
China Steel Chemical Corp. | | | 1,000 | | | | 5,445 | |
China Steel Corp. | | | 13,240 | | | | 11,403 | |
Chunghwa Telecom Co., Ltd. | | | 6,000 | | | | 18,264 | |
CTBC Financial Holding Co. Ltd. | | | 12,517 | | | | 8,770 | |
E.Sun Financial Holding Co. Ltd. | | | 13,159 | | | | 8,325 | |
Far Eastern Department Stores Ltd. | | | 9,000 | | | | 8,123 | |
Far Eastern New Century Corp. | | | 8,160 | | | | 8,571 | |
Far EasTone Telecommunications Co., Ltd. | | | 4,000 | | | | 8,840 | |
First Financial Holding Co., Ltd. | | | 19,610 | | | | 12,056 | |
Formosa Chemicals & Fibre Corp. | | | 3,000 | | | | 7,057 | |
Formosa Petrochemical Corp. | | | 3,000 | | | | 7,069 | |
Formosa Plastics Corp. | | | 4,000 | | | | 9,279 | |
Foxconn Technology Co. Ltd. | | | 3,150 | | | | 8,398 | |
Fubon Financial Holding Co. Ltd. | | | 4,000 | | | | 6,769 | |
Highwealth Construction Corp. | | | 3,500 | | | | 6,058 | |
Hon Hai Precision Industry Co., Ltd. | | | 2,360 | | | | 7,460 | |
Hua Nan Financial Holdings Co., Ltd. | | | 17,000 | | | | 10,060 | |
King’s Town Bank Co. Ltd. | | | 8,000 | | | | 8,741 | |
See accompanying Notes to Financial Statements which are an integral part of the financial statements.
16 Invesco Macro International Equity Fund
| | | | | | | | |
| | | Shares | | | Value | |
| Taiwan–(continued) | |
Mega Financial Holding Co., Ltd. | | | 11,000 | | | $ | 9,114 | |
Nan Kang Rubber Tire Co., Ltd. | | | 7,000 | | | | 7,672 | |
Nan Ya Plastics Corp. | | | 3,000 | | | | 6,230 | |
President Chain Store Corp. | | | 1,000 | | | | 7,500 | |
Ruentex Development Co., Ltd. | | | 4,000 | | | | 5,963 | |
Ruentex Industries Ltd. | | | 2,000 | | | | 4,262 | |
Shin Kong Financial Holding Co., Ltd. | | | 31,952 | | | | 9,699 | |
SinoPac Financial Holdings Co., Ltd. | | | 19,616 | | | | 8,511 | |
Taishin Financial Holding Co., Ltd. | | | 20,086 | | | | 9,581 | |
Taiwan Cement Corp. | | | 4,000 | | | | 6,111 | |
Taiwan Cooperative Financial Holding Co. Ltd. | | | 27,500 | | | | 14,691 | |
Taiwan Fertilizer Co., Ltd. | | | 6,000 | | | | 10,632 | |
Taiwan Mobile Co., Ltd. | | | 2,000 | | | | 6,482 | |
Taiwan Semiconductor Manufacturing Co. Ltd. | | | 2,000 | | | | 8,622 | |
Tatung Co., Ltd.(a) | | | 20,000 | | | | 5,672 | |
Uni-President Enterprises Corp. | | | 4,240 | | | | 7,304 | |
United Microelectronics Corp. | | | 14,000 | | | | 6,190 | |
Walsin Lihwa Corp.(a) | | | 17,000 | | | | 5,647 | |
Win Semiconductors Corp. | | | 6,000 | | | | 5,418 | |
WPG Holdings Ltd. | | | 6,000 | | | | 7,302 | |
Yuanta Financial Holding Co., Ltd. | | | 13,350 | | | | 6,718 | |
Yulon Motor Co., Ltd. | | | 5,000 | | | | 7,373 | |
| | | | | | | | 394,954 | |
| | |
| Thailand–0.59% | | | | | | | | |
Bangkok Bank PCL | | | 900 | | | | 5,495 | |
BTS Group Holdings PCL | | | 21,700 | | | | 6,854 | |
PTT Exploration and Production PCL | | | 1,200 | | | | 5,420 | |
PTT Global Chemical PCL | | | 3,500 | | | | 6,668 | |
Siam Cement PCL (The) | | | 400 | | | | 5,520 | |
Thai Beverage PCL | | | 18,000 | | | | 10,693 | |
Thai Oil PCL | | | 3,700 | | | | 5,078 | |
| | | | | | | | 45,728 | |
| | |
| United Kingdom–17.56% | | | | | | | | |
Anglo American PLC | | | 1,247 | | | | 26,309 | |
ARM Holdings PLC | | | 1,943 | | | | 27,513 | |
Associated British Foods PLC | | | 689 | | | | 30,407 | |
AstraZeneca PLC | | | 406 | | | | 29,563 | |
Aviva PLC | | | 3,442 | | | | 28,722 | |
BAE Systems PLC | | | 3,907 | | | | 28,709 | |
Barclays PLC | | | 7,871 | | | | 30,173 | |
BG Group PLC | | | 1,580 | | | | 26,333 | |
BP PLC | | | 3,894 | | | | 28,056 | |
British American Tobacco PLC | | | 505 | | | | 28,684 | |
British Sky Broadcasting Group PLC | | | 2,073 | | | | 29,383 | |
BT Group PLC | | | 4,682 | | | | 27,557 | |
Burberry Group PLC | | | 1,222 | | | | 29,971 | |
Centrica PLC | | | 5,760 | | | | 27,905 | |
CNH Industrial N.V.(a) | | | 853 | | | | 6,954 | |
Compass Group PLC | | | 1,847 | | | | 29,763 | |
Diageo PLC | | | 1,009 | | | | 29,699 | |
| | | | | | | | |
| | | Shares | | | Value | |
| United Kingdom–(continued) | |
Experian PLC | | | 1,779 | | | $ | 26,738 | |
Fiat Chrysler Automobiles N.V.(a) | | | 672 | | | | 7,499 | |
GlaxoSmithKline PLC | | | 1,272 | | | | 28,845 | |
HSBC Holdings PLC | | | 2,778 | | | | 28,421 | |
Imperial Tobacco Group PLC | | | 671 | | | | 29,136 | |
Kingfisher PLC | | | 5,831 | | | | 28,260 | |
Land Securities Group PLC | | | 1,708 | | | | 30,282 | |
Legal & General Group PLC | | | 7,722 | | | | 28,569 | |
Lloyds Banking Group PLC(a) | | | 23,994 | | | | 29,651 | |
Marks & Spencer Group PLC | | | 4,186 | | | | 27,277 | |
National Grid PLC | | | 2,079 | | | | 30,825 | |
Next PLC | | | 266 | | | | 27,459 | |
Old Mutual PLC | | | 9,516 | | | | 29,507 | |
Pearson PLC | | | 1,489 | | | | 27,896 | |
Prudential PLC | | | 1,305 | | | | 30,159 | |
Reckitt Benckiser Group PLC | | | 344 | | | | 28,918 | |
Reed Elsevier N.V. | | | 304 | | | | 7,005 | |
Reed Elsevier PLC | | | 1,824 | | | | 30,004 | |
Rio Tinto Ltd. | | | 185 | | | | 9,871 | |
Rio Tinto PLC | | | 580 | | | | 27,702 | |
Rolls-Royce Holdings PLC | | | 1,819 | | | | 24,577 | |
Rolls-Royce Holdings PLC–Class C Preference Shares(a) | | | 163,710 | | | | 262 | |
Royal Bank of Scotland Group PLC(a) | | | 5,036 | | | | 31,260 | |
Royal Dutch Shell PLC -Class A | | | 766 | | | | 27,431 | |
SABMiller PLC | | | 516 | | | | 29,146 | |
Smith & Nephew PLC | | | 1,729 | | | | 29,283 | |
SSE PLC | | | 1,210 | | | | 30,953 | |
Standard Chartered PLC | | | 1,486 | | | | 22,369 | |
Standard Life PLC | | | 4,372 | | | | 27,537 | |
Tesco PLC | | | 8,027 | | | | 22,293 | |
Tullow Oil PLC | | | 2,764 | | | | 21,515 | |
Unilever PLC | | | 707 | | | | 28,435 | |
Vodafone Group PLC | | | 9,007 | | | | 29,931 | |
Wolseley PLC | | | 562 | | | | 29,866 | |
WPP PLC | | | 1,419 | | | | 27,698 | |
| | | | | | | | 1,362,281 | |
| | |
| United States–0.14% | | | | | | | | |
Samsonite International S.A. | | | 3,300 | | | | 11,019 | |
Total Common Stocks & Other Equity Interests
(Cost $7,090,019) | | | | 7,085,617 | |
| | |
Money Market Funds–4.95% | | | | | | | | |
Liquid Assets Portfolio–Institutional
Class(h) | | | 192,092 | | | | 192,092 | |
Premier Portfolio–Institutional Class(h) | | | 192,093 | | | | 192,093 | |
Total Money Market Funds
(Cost $384,185) | | | | 384,185 | |
TOTAL INVESTMENTS–96.29% (Cost $7,474,204) | | | | 7,469,802 | |
OTHER ASSETS LESS LIABILITIES–3.71% | | | | 287,986 | |
NET ASSETS–100.00% | | | $ | 7,757,788 | |
See accompanying Notes to Financial Statements which are an integral part of the financial statements.
17 Invesco Macro International Equity Fund
Investment Abbreviations:
| | |
| ADR | | – American Depositary Receipt |
| CPO | | – Certificates of Ordinary Participation |
| Ctfs. | | – Certificates |
| GDR | | – Global Depositary Receipt |
| REGS | | – Regulation S |
| REIT | | – Real Estate Investment Trust |
Notes to Schedule of Investments:
| (a) | Non-income producing security. |
| (b) | Each unit represents one common share, two series A preferred shares, one Class A voting common share and two Class B non-voting common shares. |
| (c) | Each unit represents one common share and two preferred shares. |
| (d) | Each CPO represents two Series A shares and one Series B share. |
| (e) | Each unit represents one Series B share, two Series D-B shares and two Series D-L shares. |
| (f) | Each CPO represents twenty-five A shares, twenty-two B shares, thirty-five L shares and thirty-five D shares. |
| (g) | Security purchased or received in a transaction exempt from registration under the Securities Act of 1933, as amended (the “1933 Act”). The security may be resold pursuant to an exemption from registration under the 1933 Act, typically to qualified institutional buyers. The value of this security at October 31, 2014 represented less than 1% of the Fund’s Net Assets. |
| (h) | The money market fund and the Fund are affiliated by having the same investment adviser. |
See accompanying Notes to Financial Statements which are an integral part of the financial statements.
18 Invesco Macro International Equity Fund
Statement of Assets and Liabilities
October 31, 2014
| | | | |
Assets: | |
Investments, at value (Cost $7,090,019) | | $ | 7,085,617 | |
Investments in affiliated money market funds, at value and cost | | | 384,185 | |
Total investments, at value (Cost $7,474,204) | | | 7,469,802 | |
Foreign currencies, at value (Cost $52,501) | | | 52,175 | |
Receivable for: | | | | |
Deposits with brokers for open futures contracts | | | 195,000 | |
Investments sold | | | 122 | |
Variation margin — futures | | | 31,411 | |
Fund shares sold | | | 350 | |
Dividends | | | 16,656 | |
Fund expenses absorbed | | | 54,517 | |
Investment for trustee deferred compensation and retirement plans | | | 1,884 | |
Other assets | | | 11,148 | |
Total assets | | | 7,833,065 | |
|
Liabilities: | |
Payable for: | | | | |
Accrued fees to affiliates | | | 910 | |
Accrued trustees’ and officers’ fees and benefits | | | 2,023 | |
Accrued other operating expenses | | | 70,460 | |
Trustee deferred compensation and retirement plans | | | 1,884 | |
Total liabilities | | | 75,277 | |
Net assets applicable to shares outstanding | | $ | 7,757,788 | |
|
Net assets consist of: | |
Shares of beneficial interest | | $ | 7,599,196 | |
Undistributed net investment income | | | 147,701 | |
Undistributed net realized gain | | | 79,469 | |
Net unrealized appreciation (depreciation) | | | (68,578 | ) |
| | | $ | 7,757,788 | |
| | | | |
Net Assets: | |
Class A | | $ | 3,247,444 | |
Class C | | $ | 20,766 | |
Class R | | $ | 10,141 | |
Class Y | | $ | 3,202,431 | |
Class R5 | | $ | 920,879 | |
Class R6 | | $ | 356,127 | |
|
Shares outstanding, $0.01 par value per share,
with an unlimited number of shares authorized: | |
Class A | | | 319,866 | |
Class C | | | 2,059 | |
Class R | | | 1,001 | |
Class Y | | | 314,742 | |
Class R5 | | | 90,501 | |
Class R6 | | | 35,001 | |
Class A: | | | | |
Net asset value per share | | $ | 10.15 | |
Maximum offering price per share | | | | |
(Net asset value of $10.15 ¸ 94.50%) | | $ | 10.74 | |
Class C: | | | | |
Net asset value and offering price per share | | $ | 10.09 | |
Class R: | | | | |
Net asset value and offering price per share | | $ | 10.13 | |
Class Y: | | | | |
Net asset value and offering price per share | | $ | 10.17 | |
Class R5: | | | | |
Net asset value and offering price per share | | $ | 10.18 | |
Class R6: | | | | |
Net asset value and offering price per share | | $ | 10.17 | |
See accompanying Notes to Financial Statements which are an integral part of the financial statements.
19 Invesco Macro International Equity Fund
Statement of Operations
For the period December 17, 2013 (commencement date) through October 31, 2014
| | | | |
Investment income: | |
Dividends (net of foreign withholding taxes of $15,613) | | $ | 183,876 | |
Dividends from affiliated money market funds | | | 278 | |
Total investment income | | | 184,154 | |
| |
Expenses: | | | | |
Advisory fees | | | 63,531 | |
Administrative services fees | | | 43,699 | |
Custodian fees | | | 113,140 | |
Distribution fees: | | | | |
Class A | | | 7,205 | |
Class C | | | 116 | |
Class R | | | 45 | |
Transfer agent fees — A, C, R and Y | | | 2,006 | |
Transfer agent fees — R5 | | | 33 | |
Transfer agent fees — R6 | | | 15 | |
Trustees’ and officers’ fees and benefits | | | 18,459 | |
Registration and filing fees | | | 87,476 | |
Licensing Fees | | | 80,000 | |
Professional services fees | | | 72,309 | |
Other | | | 59,421 | |
Total expenses | | | 547,455 | |
Less: Fees waived and expenses reimbursed | | | (460,532 | ) |
Net expenses | | | 86,923 | |
Net investment income | | | 97,231 | |
| |
Realized and unrealized gain (loss) from: | | | | |
Net realized gain from: | | | | |
Investment securities (net of foreign taxes of $267) | | | 90,889 | |
Foreign currencies | | | 1,027 | |
Futures contracts | | | 766 | |
| | | | 92,682 | |
Change in net unrealized appreciation (depreciation) of: | | | | |
Investment securities (net of foreign taxes on holdings of $115) | | | (4,402 | ) |
Foreign currencies | | | (892 | ) |
Futures contracts | | | (63,284 | ) |
| | | | (68,578 | ) |
Net realized and unrealized gain | | | 24,104 | |
Net increase in net assets resulting from operations | | $ | 121,335 | |
See accompanying Notes to Financial Statements which are an integral part of the financial statements.
20 Invesco Macro International Equity Fund
Statement of Changes in Net Assets
For the period December 17, 2013 (commencement date) through October 31, 2014
| | | | |
| | | December 17, 2013 (commencement date)
through October 31,
2014 | |
Operations: | | | | |
Net investment income | | $ | 97,231 | |
Net realized gain | | | 92,682 | |
Change in net unrealized appreciation (depreciation) | | | (68,578 | ) |
Net increase in net assets resulting from operations | | | 121,335 | |
| |
Share transactions–net: | | | | |
Class A | | | 3,198,397 | |
Class C | | | 20,866 | |
Class R | | | 10,010 | |
Class Y | | | 3,146,281 | |
Class R5 | | | 910,889 | |
Class R6 | | | 350,010 | |
Net increase in net assets resulting from share transactions | | | 7,636,453 | |
Net increase in net assets | | | 7,757,788 | |
| |
Net assets: | | | | |
Beginning of period | | | — | |
End of period (includes undistributed net investment income of $147,701) | | $ | 7,757,788 | |
Notes to Financial Statements
October 31, 2014
NOTE 1—Significant Accounting Policies
Invesco Macro International Equity Fund (the “Fund”) is a series portfolio of AIM Investment Funds (Invesco Investment Funds) (the “Trust”). The Trust is organized as a Delaware statutory trust and is registered under the Investment Company Act of 1940, as amended (the “1940 Act”), as an open-end series management investment company consisting of twenty-four separate series portfolios, each authorized to issue an unlimited number of shares of beneficial interest. The assets, liabilities and operations of each portfolio are accounted for separately. Information presented in these financial statements pertains only to the Fund. Matters affecting each portfolio or class will be voted on exclusively by the shareholders of such portfolio or class.
The Fund’s investment objective is to provide total return.
The Fund currently consists of six different classes of shares: Class A, Class C, Class R, Class Y, Class R5 and Class R6. Class A shares are sold with a front-end sales charge unless certain waiver criteria are met and under certain circumstances load waived shares may be subject to contingent deferred sales charges (“CDSC”). Class C shares are sold with a CDSC. Class R, Class Y, Class R5 and Class R6 shares are sold at net asset value.
The following is a summary of the significant accounting policies followed by the Fund in the preparation of its financial statements.
| A. | Security Valuations — Securities, including restricted securities, are valued according to the following policy. |
A security listed or traded on an exchange (except convertible securities) is valued at its last sales price or official closing price as of the close of the customary trading session on the exchange where the security is principally traded, or lacking any sales or official closing price on a particular day, the security may be valued at the closing bid price on that day. Securities traded in the over-the-counter market are valued based on prices furnished by independent pricing services or market makers. When such securities are valued by an independent pricing service they may be considered fair valued. Futures contracts are valued at the final settlement price set by an exchange on which they are principally traded. Listed options are valued at the mean between the last bid and ask prices from the exchange on which they are principally traded. Options not listed on an exchange are valued by an independent source at the mean between the last bid and ask prices. For purposes of determining net asset value per share, futures and option contracts generally are valued 15 minutes after the close of the customary trading session of the New York Stock Exchange (“NYSE”).
Investments in open-end and closed-end registered investment companies that do not trade on an exchange are valued at the end of day net asset value per share. Investments in open-end and closed-end registered investment companies that trade on an exchange are valued at the last sales price or official closing price as of the close of the customary trading session on the exchange where the security is principally traded.
Debt obligations (including convertible securities) and unlisted equities are fair valued using an evaluated quote provided by an independent pricing service. Evaluated quotes provided by the pricing service may be determined without exclusive reliance on quoted prices, and may reflect appropriate factors such as institution-size trading in similar groups of securities, developments related to specific securities, dividend rate (for unlisted equities), yield (for debt obligations), quality, type of issue, coupon rate (for debt obligations), maturity (for debt obligations), individual trading characteristics and other market data. Debt obligations are subject to interest rate and credit risks. In addition, all debt obligations involve some risk of default with respect to interest and/or principal payments.
21 Invesco Macro International Equity Fund
Foreign securities’ (including foreign exchange contracts) prices are converted into U.S. dollar amounts using the applicable exchange rates as of the close of the NYSE. If market quotations are available and reliable for foreign exchange-traded equity securities, the securities will be valued at the market quotations. Because trading hours for certain foreign securities end before the close of the NYSE, closing market quotations may become unreliable. If between the time trading ends on a particular security and the close of the customary trading session on the NYSE, events occur that the Adviser determines are significant and make the closing price unreliable, the Fund may fair value the security. If the event is likely to have affected the closing price of the security, the security will be valued at fair value in good faith using procedures approved by the Board of Trustees. Adjustments to closing prices to reflect fair value may also be based on a screening process of an independent pricing service to indicate the degree of certainty, based on historical data, that the closing price in the principal market where a foreign security trades is not the current value as of the close of the NYSE. Foreign securities’ prices meeting the approved degree of certainty that the price is not reflective of current value will be priced at the indication of fair value from the independent pricing service. Multiple factors may be considered by the independent pricing service in determining adjustments to reflect fair value and may include information relating to sector indices, American Depositary Receipts and domestic and foreign index futures. Foreign securities may have additional risks including exchange rate changes, potential for sharply devalued currencies and high inflation, political and economic upheaval, the relative lack of issuer information, relatively low market liquidity and the potential lack of strict financial and accounting controls and standards.
Securities for which market prices are not provided by any of the above methods may be valued based upon quotes furnished by independent sources. The last bid price may be used to value equity securities. The mean between the last bid and ask prices is used to value debt obligations, including corporate loans.
Securities for which market quotations are not readily available or became unreliable are valued at fair value as determined in good faith by or under the supervision of the Trust’s officers following procedures approved by the Board of Trustees. Issuer specific events, market trends, bid/ask quotes of brokers and information providers and other market data may be reviewed in the course of making a good faith determination of a security’s fair value.
The Fund may invest in securities that are subject to interest rate risk, meaning the risk that the prices will generally fall as interest rates rise and, conversely, the prices will generally rise as interest rates fall. Specific securities differ in their sensitivity to changes in interest rates depending on their individual characteristics. Changes in interest rates may result in increased market volatility, which may affect the value and/or liquidity of certain of the Fund’s investments.
Valuations change in response to many factors including the historical and prospective earnings of the issuer, the value of the issuer’s assets, general economic conditions, interest rates, investor perceptions and market liquidity. Because of the inherent uncertainties of valuation, the values reflected in the financial statements may materially differ from the value received upon actual sale of those investments.
| B. | Securities Transactions and Investment Income — Securities transactions are accounted for on a trade date basis. Realized gains or losses on sales are computed on the basis of specific identification of the securities sold. Interest income (net of withholding tax, if any) is recorded on the accrual basis from settlement date. Dividend income (net of withholding tax, if any) is recorded on the ex-dividend date. |
The Fund may periodically participate in litigation related to Fund investments. As such, the Fund may receive proceeds from litigation settlements. Any proceeds received are included in the Statement of Operations as realized gain (loss) for investments no longer held and as unrealized gain (loss) for investments still held.
Brokerage commissions and mark ups are considered transaction costs and are recorded as an increase to the cost basis of securities purchased and/or a reduction of proceeds on a sale of securities. Such transaction costs are included in the determination of net realized and unrealized gain (loss) from investment securities reported in the Statement of Operations and the Statement of Changes in Net Assets and the net realized and unrealized gains (losses) on securities per share in the Financial Highlights. Transaction costs are included in the calculation of the Fund’s net asset value and, accordingly, they reduce the Fund’s total returns. These transaction costs are not considered operating expenses and are not reflected in net investment income reported in the Statement of Operations and Statement of Changes in Net Assets, or the net investment income per share and ratios of expenses and net investment income reported in the Financial Highlights, nor are they limited by any expense limitation arrangements between the Fund and the investment adviser.
The Fund allocates income and realized and unrealized capital gains and losses to a class based on the relative net assets of each class.
| C. | Country Determination — For the purposes of making investment selection decisions and presentation in the Schedule of Investments, the investment adviser may determine the country in which an issuer is located and/or credit risk exposure based on various factors. These factors include the laws of the country under which the issuer is organized, where the issuer maintains a principal office, the country in which the issuer derives 50% or more of its total revenues and the country that has the primary market for the issuer’s securities, as well as other criteria. Among the other criteria that may be evaluated for making this determination are the country in which the issuer maintains 50% or more of its assets, the type of security, financial guarantees and enhancements, the nature of the collateral and the sponsor organization. Country of issuer and/or credit risk exposure has been determined to be the United States of America, unless otherwise noted. |
| D. | Distributions — Distributions from net investment income and net realized capital gain, if any, are generally declared and paid annually and recorded on the ex-dividend date. The Fund may elect to treat a portion of the proceeds from redemptions as distributions for federal income tax purposes. |
| E. | Federal Income Taxes — The Fund intends to comply with the requirements of Subchapter M of the Internal Revenue Code of 1986, as amended (the “Internal Revenue Code”), necessary to qualify as a regulated investment company and to distribute substantially all of the Fund’s taxable earnings to shareholders. As such, the Fund will not be subject to federal income taxes on otherwise taxable income (including net realized capital gain) that is distributed to shareholders. Therefore, no provision for federal income taxes is recorded in the financial statements. |
The Fund recognizes the tax benefits of uncertain tax positions only when the position is more likely than not to be sustained. Management has analyzed the Fund’s uncertain tax positions and concluded that no liability for unrecognized tax benefits should be recorded related to uncertain tax positions. Management is not aware of any tax positions for which it is reasonably possible that the total amounts of unrecognized tax benefits will change materially in the next 12 months.
The Fund files tax returns in the U.S. Federal jurisdiction and certain other jurisdictions. Generally, the Fund is subject to examinations by such taxing authorities for up to three years after the filing of the return for the tax period.
22 Invesco Macro International Equity Fund
| F. | Expenses — Fees provided for under the Rule 12b-1 plan of a particular class of the Fund are charged to the operations of such class. Transfer agency fees and expenses and other shareholder recordkeeping fees and expenses attributable to Class R5 and Class R6 are allocated to each share class based on relative net assets. Sub-accounting fees attributable to Class R5 are charged to the operations of the class. Transfer agency fees and expenses and other shareholder recordkeeping fees and expenses relating to all other classes are allocated among those classes based on relative net assets. All other expenses are allocated among the classes based on relative net assets. |
| G. | Accounting Estimates — The preparation of financial statements in conformity with accounting principles generally accepted in the United States of America (“GAAP”) requires management to make estimates and assumptions that affect the reported amounts of assets and liabilities at the date of the financial statements and the reported amounts of revenues and expenses during the reporting period including estimates and assumptions related to taxation. Actual results could differ from those estimates by a significant amount. In addition, the Fund monitors for material events or transactions that may occur or become known after the period-end date and before the date the financial statements are released to print. |
| H. | Indemnifications — Under the Trust’s organizational documents, each Trustee, officer, employee or other agent of the Trust is indemnified against certain liabilities that may arise out of the performance of their duties to the Fund. Additionally, in the normal course of business, the Fund enters into contracts, including the Fund’s servicing agreements, that contain a variety of indemnification clauses. The Fund’s maximum exposure under these arrangements is unknown as this would involve future claims that may be made against the Fund that have not yet occurred. The risk of material loss as a result of such indemnification claims is considered remote. |
| I. | Foreign Currency Translations — Foreign currency is valued at the close of the NYSE based on quotations posted by banks and major currency dealers. Portfolio securities and other assets and liabilities denominated in foreign currencies are translated into U.S. dollar amounts at date of valuation. Purchases and sales of portfolio securities (net of foreign taxes withheld on disposition) and income items denominated in foreign currencies are translated into U.S. dollar amounts on the respective dates of such transactions. The Fund does not separately account for the portion of the results of operations resulting from changes in foreign exchange rates on investments and the fluctuations arising from changes in market prices of securities held. The combined results of changes in foreign exchange rates and the fluctuation of market prices on investments (net of estimated foreign tax withholding) are included with the net realized and unrealized gain or loss from investments in the Statement of Operations. Reported net realized foreign currency gains or losses arise from (1) sales of foreign currencies, (2) currency gains or losses realized between the trade and settlement dates on securities transactions, and (3) the difference between the amounts of dividends, interest, and foreign withholding taxes recorded on the Fund’s books and the U.S. dollar equivalent of the amounts actually received or paid. Net unrealized foreign currency gains and losses arise from changes in the fair values of assets and liabilities, other than investments in securities at fiscal period end, resulting from changes in exchange rates. |
The Fund may invest in foreign securities, which may be subject to foreign taxes on income, gains on investments or currency repatriation, a portion of which may be recoverable. Foreign taxes, if any, are recorded based on the tax regulations and rates that exist in the foreign markets in which the Fund invests and are shown in the Statement of Operations.
| J. | Forward Foreign Currency Contracts — The Fund may engage in foreign currency transactions either on a spot (i.e. for prompt delivery and settlement) basis or through forward foreign currency contracts to manage or minimize currency or exchange rate risk. |
The Fund may also enter into forward foreign currency contracts for the purchase or sale of a security denominated in a foreign currency in order to “lock in” the U.S. dollar price of that security, or the Fund may also enter into forward foreign currency contracts that do not provide for physical settlement of the two currencies, but instead are settled by a single cash payment calculated as the difference between the agreed upon exchange rate and the spot rate at settlement based upon an agreed upon notional amount (non-deliverable forwards). The Fund will set aside liquid assets in an amount equal to daily mark-to-market obligation for forward foreign currency contracts.
A forward foreign currency contract is an obligation between two parties (“Counterparties”) to purchase or sell a specific currency for an agreed-upon price at a future date. The use of forward foreign currency contracts does not eliminate fluctuations in the price of the underlying securities the Fund owns or intends to acquire but establishes a rate of exchange in advance. Fluctuations in the value of these contracts are measured by the difference in the contract date and reporting date exchange rates and are recorded as unrealized appreciation (depreciation) until the contracts are closed. When the contracts are closed, realized gains (losses) are recorded. Realized and unrealized gains (losses) on the contracts are included in the Statement of Operations. The primary risks associated with forward foreign currency contracts include failure of the Counterparty to meet the terms of the contract and the value of the foreign currency changing unfavorably. These risks may be in excess of the amounts reflected in the Statement of Assets and Liabilities.
| K. | Futures Contracts — The Fund may enter into futures contracts to manage exposure to interest rate, equity and market price movements and/or currency risks. A futures contract is an agreement between Counterparties to purchase or sell a specified underlying security, currency or commodity (or delivery of a cash settlement price, in the case of an index future) for a fixed price at a future date. The Fund currently invests only in exchange-traded futures and they are standardized as to maturity date and underlying financial instrument. Initial margin deposits required upon entering into futures contracts are satisfied by the segregation of specific securities or cash as collateral at the futures commission merchant (broker). During the period the futures contracts are open, changes in the value of the contracts are recognized as unrealized gains or losses by recalculating the value of the contracts on a daily basis. Subsequent or variation margin payments are received or made depending upon whether unrealized gains or losses are incurred. These amounts are reflected as receivables or payables on the Statement of Assets and Liabilities. When the contracts are closed or expire, the Fund recognizes a realized gain or loss equal to the difference between the proceeds from, or cost of, the closing transaction and the Fund’s basis in the contract. The net realized gain (loss) and the change in unrealized gain (loss) on futures contracts held during the period is included on the Statement of Operations. The primary risks associated with futures contracts are market risk and the absence of a liquid secondary market. If the Fund were unable to liquidate a futures contract and/or enter into an offsetting closing transaction, the Fund would continue to be subject to market risk with respect to the value of the contracts and continue to be required to maintain the margin deposits on the futures contracts. Futures contracts have minimal counterparty risk since the exchange’s clearinghouse, as counterparty to all exchange-traded futures, guarantees the futures against default. Risks may exceed amounts recognized in the Statement of Assets and Liabilities. |
| L. | Collateral — To the extent the Fund has designated or segregated a security as collateral and that security is subsequently sold, it is the Fund’s practice to replace such collateral no later than the next business day. |
23 Invesco Macro International Equity Fund
NOTE 2—Advisory Fees and Other Fees Paid to Affiliates
The Trust has entered into a master investment advisory agreement with Invesco Advisers, Inc. (the “Adviser” or “Invesco”). Under the terms of the investment advisory agreement, the Fund pays an advisory fee to the Adviser based on the annual rate of the Fund’s average daily net assets as follows:
| | | | | | |
| Average Daily Net Assets | | Rate |
First $250 million | | | 0 | .935% | | |
Next $250 million | | | 0 | .910% | | |
Next $500 million | | | 0 | .885% | | |
Next $1.5 billion | | | 0 | .860% | | |
Next $2.5 billion | | | 0 | .835% | | |
Next $2.5 billion | | | 0 | .810% | | |
Next $2.5 billion | | | 0 | .785% | | |
Over $10 billion | | | 0 | .760% | | |
For the period December 17, 2013 (commencement date) through October 31, 2014, the effective advisory fees incurred by the Fund was 0.94%.
Under the terms of a master sub-advisory agreement between the Adviser and each of Invesco Asset Management Deutschland GmbH, Invesco Asset Management Limited, Invesco Asset Management (Japan) Limited, Invesco Australia Limited, Invesco Hong Kong Limited, Invesco Senior Secured Management, Inc., Invesco Canada Ltd. and Invesco PowerShares Capital Management LLC (collectively, the “Affiliated Sub-Advisers”) the Adviser, not the Fund, may pay 40% of the fees paid to the Adviser to any such Affiliated Sub-Adviser(s) that provide(s) discretionary investment management services to the Fund based on the percentage of assets allocated to such Sub-Adviser(s).
The Adviser has contractually agreed, through at least February 29, 2016, to waive advisory fees and/or reimburse expenses to the extent necessary to limit total annual fund operating expenses after fee waiver and/or expense reimbursement (excluding certain items discussed below) of Class A, Class C, Class R, Class Y, Class R5 and Class R6 shares to 1.43%, 2.18%, 1.68%, 1.18%, 1.18% and 1.18% of average daily net assets, respectively. In determining the Adviser’s obligation to waive advisory fees and/or reimburse expenses, the following expenses are not taken into account, and could cause total annual fund operating expenses after fee waiver and/or expense reimbursement to exceed the numbers reflected above: (1) interest; (2) taxes; (3) dividend expense on short sales; (4) extraordinary or non-routine items, including litigation expenses; and (5) expenses that the Fund has incurred but did not actually pay because of an expense offset arrangement. Unless Invesco continues the fee waiver agreement, it will terminate on February 29, 2016. The fee waiver agreement cannot be terminated during its term.
Further, the Adviser has contractually agreed, through at least June 30, 2016, to waive the advisory fee payable by the Fund in an amount equal to 100% of the net advisory fees the Adviser receives from the affiliated money market funds on investments by the Fund of uninvested cash in such affiliated money market funds.
For the period December 17, 2013 (commencement date) through October 31, 2014, the Adviser waived advisory fees and reimbursed fund level expenses of $458,478 and reimbursed class level expenses of $999, $4, $3, $1,000, $33 and $15 for Class A, Class C, Class R, Class Y, Class R5 and Class R6 shares, respectively.
The Trust has entered into a master administrative services agreement with Invesco pursuant to which the Fund has agreed to pay Invesco for certain administrative costs incurred in providing accounting services to the Fund. For the period December 17, 2013 (commencement date) through October 31, 2014, expenses incurred under the agreement are shown in the Statement of Operations as Administrative services fees.
The Trust has entered into a transfer agency and service agreement with Invesco Investment Services, Inc. (“IIS”) pursuant to which the Fund has agreed to pay IIS a fee for providing transfer agency and shareholder services to the Fund and reimburse IIS for certain expenses incurred by IIS in the course of providing such services. IIS may make payments to intermediaries that provide omnibus account services, sub-accounting services and/or networking services. All fees payable by IIS to intermediaries that provide omnibus account services or sub-accounting are charged back to the Fund, subject to certain limitations approved by the Trust’s Board of Trustees. For the period December 17, 2013 (commencement date) through October 31, 2014, expenses incurred under the agreement are shown in the Statement of Operations as Transfer agent fees.
The Trust has entered into master distribution agreements with Invesco Distributors, Inc. (“IDI”) to serve as the distributor for the Class A, Class C, Class R, Class Y, Class R5 and Class R6 shares of the Fund. The Trust has adopted plans pursuant to Rule 12b-1 under the 1940 Act with respect to the Fund’s Class A, Class C and Class R shares (collectively the “Plans”). The Fund, pursuant to the Plans, pays IDI compensation at the annual rate of 0.25% of the Fund’s average daily net assets of Class A shares, 1.00% of the average daily net assets of Class C shares and 0.50% of the average daily net assets of Class R shares. Of the Plan payments, up to 0.25% of the average daily net assets of each class of shares may be paid to furnish continuing personal shareholder services to customers who purchase and own shares of such classes. Any amounts not paid as a service fee under the Plans would constitute an asset-based sales charge. Rules of the Financial Industry Regulatory Authority (“FINRA”) impose a cap on the total sales charges, including asset-based sales charges, that may be paid by any class of shares of the Fund. For the period December 17, 2013 (commencement date) through October 31, 2014, expenses incurred under the Plans are shown in the Statement of Operations as Distribution fees.
Front-end sales commissions and CDSC (collectively, the “sales charges”) are not recorded as expenses of the Fund. Front-end sales commissions are deducted from proceeds from the sales of Fund shares prior to investment in Class A shares of the Fund. CDSC are deducted from redemption proceeds prior to remittance to the shareholder. During the period December 17, 2013 (commencement date) through October 31, 2014, IDI advised the Fund that IDI retained $327 in front-end sales commissions from the sale of Class A shares.
Certain officers and trustees of the Trust are officers and directors of the Adviser, IIS and/or IDI.
24 Invesco Macro International Equity Fund
NOTE 3—Additional Valuation Information
GAAP defines fair value as the price that would be received to sell an asset or paid to transfer a liability in an orderly transaction between market participants at the measurement date, under current market conditions. GAAP establishes a hierarchy that prioritizes the inputs to valuation methods, giving the highest priority to readily available unadjusted quoted prices in an active market for identical assets (Level 1) and the lowest priority to significant unobservable inputs (Level 3), generally when market prices are not readily available or are unreliable. Based on the valuation inputs, the securities or other investments are tiered into one of three levels. Changes in valuation methods may result in transfers in or out of an investment’s assigned level:
| | Level 1 — | Prices are determined using quoted prices in an active market for identical assets. |
| | Level 2 — | Prices are determined using other significant observable inputs. Observable inputs are inputs that other market participants may use in pricing a security. These may include quoted prices for similar securities, interest rates, prepayment speeds, credit risk, yield curves, loss severities, default rates, discount rates, volatilities and others. |
| | Level 3 — | Prices are determined using significant unobservable inputs. In situations where quoted prices or observable inputs are unavailable (for example, when there is little or no market activity for an investment at the end of the period), unobservable inputs may be used. Unobservable inputs reflect the Fund’s own assumptions about the factors market participants would use in determining fair value of the securities or instruments and would be based on the best available information. |
The following is a summary of the tiered valuation input levels, as of October 31, 2014. The level assigned to the securities valuations may not be an indication of the risk or liquidity associated with investing in those securities. Because of the inherent uncertainties of valuation, the values reflected in the financial statements may materially differ from the value received upon actual sale of those investments.
| | | | | | | | | | | | | | | | |
| | | Level 1 | | | Level 2 | | | Level 3 | | | Total | |
Australia | | $ | 10,017 | | | $ | 614,608 | | | $ | — | | | $ | 624,625 | |
Austria | | | 6,207 | | | | 12,844 | | | | — | | | | 19,051 | |
Belgium | | | 6,845 | | | | 31,677 | | | | — | | | | 38,522 | |
Brazil | | | 77,223 | | | | — | | | | — | | | | 77,223 | |
Chile | | | — | | | | 40,339 | | | | — | | | | 40,339 | |
China | | | 99,462 | | | | 95,088 | | | | — | | | | 194,550 | |
Colombia | | | 13,838 | | | | — | | | | — | | | | 13,838 | |
Czech Republic | | | 11,280 | | | | — | | | | — | | | | 11,280 | |
Denmark | | | 23,075 | | | | 26,830 | | | | — | | | | 49,905 | |
Finland | | | 12,961 | | | | 33,345 | | | | — | | | | 46,306 | |
France | | | 25,246 | | | | 277,552 | | | | — | | | | 302,798 | |
Germany | | | 179,515 | | | | 38,230 | | | | — | | | | 217,745 | |
Greece | | | 5,120 | | | | — | | | | — | | | | 5,120 | |
Hong Kong | | | 298,456 | | | | 140,943 | | | | — | | | | 439,399 | |
Hungary | | | — | | | | 5,718 | | | | — | | | | 5,718 | |
Indonesia | | | — | | | | 10,591 | | | | 7,296 | | | | 17,887 | |
Ireland | | | 29,364 | | | | 6,439 | | | | — | | | | 35,803 | |
Italy | | | 24,977 | | | | 58,966 | | | | — | | | | 83,943 | |
Japan | | | 31,454 | | | | 1,412,460 | | | | — | | | | 1,443,914 | |
Luxembourg | | | — | | | | 11,946 | | | | — | | | | 11,946 | |
Macau | | | — | | | | 11,769 | | | | — | | | | 11,769 | |
Malaysia | | | 92,974 | | | | 182,199 | | | | — | | | | 275,173 | |
Mexico | | | 56,643 | | | | — | | | | — | | | | 56,643 | |
Netherlands | | | 18,574 | | | | 57,453 | | | | — | | | | 76,027 | |
New Zealand | | | — | | | | 30,896 | | | | — | | | | 30,896 | |
Norway | | | 25,741 | | | | 15,964 | | | | — | | | | 41,705 | |
Philippines | | | 18,331 | | | | 7,328 | | | | — | | | | 25,659 | |
Poland | | | 5,957 | | | | — | | | | — | | | | 5,957 | |
Portugal | | | — | | | | 6,535 | | | | — | | | | 6,535 | |
Russia | | | 5,241 | | | | 11,004 | | | | — | | | | 16,245 | |
Singapore | | | 72,965 | | | | 143,101 | | | | — | | | | 216,066 | |
South Africa | | | 166,849 | | | | 20,915 | | | | — | | | | 187,764 | |
South Korea | | | 61,809 | | | | 91,859 | | | | — | | | | 153,668 | |
Spain | | | 6,223 | | | | 101,725 | | | | — | | | | 107,948 | |
Sweden | | | 46,772 | | | | 105,465 | | | | — | | | | 152,237 | |
25 Invesco Macro International Equity Fund
| | | | | | | | | | | | | | | | |
| | | Level 1 | | | Level 2 | | | Level 3 | | | Total | |
Switzerland | | $ | 9,219 | | | $ | 218,212 | | | $ | — | | | $ | 227,431 | |
Taiwan | | | 37,847 | | | | 357,107 | | | | — | | | | 394,954 | |
Thailand | | | 17,451 | | | | 28,277 | | | | — | | | | 45,728 | |
United Kingdom | | | 234,887 | | | | 1,127,394 | | | | — | | | | 1,362,281 | |
United States | | | 384,185 | | | | 11,019 | | | | — | | | | 395,204 | |
| | | | 2,116,708 | | | | 5,345,798 | | | | 7,296 | | | | 7,469,802 | |
Futures Contracts* | | | (63,284 | ) | | | — | | | | — | | | | (63,284 | ) |
Total Investments | | $ | 2,053,424 | | | $ | 5,345,798 | | | $ | 7,296 | | | $ | 7,406,518 | |
| * | Unrealized appreciation (depreciation). |
NOTE 4—Derivative Investments
Value of Derivative Investments at Period-End
The table below summarizes the value of the Fund’s derivative investments, detailed by primary risk exposure, held as of October 31, 2014:
| | | | | | | | |
| | | Value | |
| Risk Exposure/Derivative Type | | Assets | | | Liabilities | |
Market risk: | | | | | | | | |
Futures contracts(a) | | $ | 7,874 | | | $ | (71,158 | ) |
| (a) | Includes cumulative appreciation (depreciation) of futures contracts. Only current day’s variation margin receivable is reported within the Statement of Assets and Liabilities. |
Effect of Derivative Investments for the period December 17, 2013 (commencement date) through October 31, 2014
The table below summarizes the gains (losses) on derivative investments, detailed by primary risk exposure, recognized in earnings during the period:
| | | | |
| | | Location of Gain (Loss) on
Statement of Operations | |
| | | Futures Contracts | |
Realized Gain: | | | | |
Market risk | | $ | 766 | |
Change in Unrealized Appreciation (Depreciation): | | | | |
Market risk | | | (63,284 | ) |
Total | | $ | (62,518 | ) |
The table below summarizes the average notional value of futures contracts outstanding during the period.
| | | | |
| | | Futures Contracts | |
Average notional value | | $ | 2,045,631 | |
| | | | | | | | | | | | | | | | | | | | |
| Open Futures Contracts(a) | |
| Futures Contracts | | Type of
Contract | | | Number of
Contracts | | | Expiration Month | | | Notional
Value | | | Unrealized Appreciation (Depreciation) | |
Dow Jones EURO STOXX 50 Index | | | Long | | | | 22 | | | | December-2014 | | | $ | 854,890 | | | $ | (29,593 | ) |
FTSE 100 Index | | | Long | | | | 1 | | | | December-2014 | | | | 104,075 | | | | (4,212 | ) |
Tokyo Stock Price Index | | | Long | | | | 4 | | | | December-2014 | | | | 476,182 | | | | 7,874 | |
Hang Seng Index | | | Short | | | | 5 | | | | November-2014 | | | | (771,847 | ) | | | (22,204 | ) |
Mini MSCI Emerging Markets Index | | | Short | | | | 16 | | | | December-2014 | | | | (810,880 | ) | | | (15,149 | ) |
Total Futures Contracts — Market Risk | | | | | | | | | | | | | | | | | | $ | (63,284 | ) |
| (a) | Futures collateralized by $195,000 cash held with Goldman Sachs & Co., the futures commission merchant. |
NOTE 5—Trustees’ and Officers’ Fees and Benefits
Trustees’ and Officers’ Fees and Benefits include amounts accrued by the Fund to pay remuneration to certain Trustees and Officers of the Fund. Trustees have the option to defer compensation payable by the Fund, and Trustees’ and Officers’ Fees and Benefits also include amounts accrued by the Fund to fund such deferred compensation amounts. Those Trustees who defer compensation have the option to select various Invesco Funds in which their deferral accounts shall be deemed to be invested. Obligations under the deferred compensation plan represents unsecured claims against the general assets of the Fund.
26 Invesco Macro International Equity Fund
NOTE 6—Cash Balances
The Fund is permitted to temporarily carry a negative or overdrawn balance in its account with State Street Bank and Trust Company, the custodian bank. Such balances, if any at period end, are shown in the Statement of Assets and Liabilities under the payable caption Amount due custodian. To compensate the custodian bank for such overdrafts, the overdrawn Fund may either (1) leave funds as a compensating balance in the account so the custodian bank can be compensated by earning the additional interest; or (2) compensate by paying the custodian bank at a rate agreed upon by the custodian bank and Invesco, not to exceed the contractually agreed upon rate.
NOTE 7—Distributions to Shareholders and Tax Components of Net Assets
There were no ordinary income and long-term gain distributions paid during the period December 17, 2013 (commencement date) through October 31, 2014.
Tax Components of Net Assets at Period-End:
| | | | |
| | | 2014 | |
Undistributed ordinary income | | $ | 198,040 | |
Undistributed long-term gain | | | 5,845 | |
Net unrealized appreciation (depreciation) — investments | | | (28,527 | ) |
Net unrealized appreciation (depreciation) — other investments | | | (15,221 | ) |
Temporary book/tax differences | | | (1,545 | ) |
Shares of beneficial interest | | | 7,599,196 | |
Total net assets | | $ | 7,757,788 | |
The difference between book-basis and tax-basis unrealized appreciation (depreciation) is due to differences in the timing of recognition of gains and losses on investments for tax and book purposes. The Fund’s net unrealized appreciation (depreciation) difference is attributable primarily to wash sales and the recognition for tax purposes of unrealized gains on passive foreign investment companies.
The temporary book/tax differences are a result of timing differences between book and tax recognition of income and/or expenses. The Fund’s temporary book/tax differences are the result of the trustee deferral of compensation and retirement plan benefits.
Capital loss carryforward is calculated and reported as of a specific date. Results of transactions and other activity after that date may affect the amount of capital loss carryforward actually available for the Fund to utilize. The ability to utilize capital loss carryforward in the future may be limited under the Internal Revenue Code and related regulations based on the results of future transactions.
The Fund does not have a capital loss carryforward as of October 31, 2014.
NOTE 8—Investment Securities
The aggregate amount of investment securities (other than short-term securities, U.S. Treasury obligations and money market funds, if any) purchased and sold by the Fund during the period December 17, 2013 (commencement date) through October 31, 2014 was $10,004,882 and $3,006,027, respectively. Cost of investments on a tax basis includes the adjustments for financial reporting purposes as of the most recently completed federal income tax reporting period-end.
| | | | |
| Unrealized Appreciation (Depreciation) of Investment Securities on a Tax Basis | |
Aggregate unrealized appreciation of investment securities | | $ | 397,748 | |
Aggregate unrealized (depreciation) of investment securities | | | (426,275 | ) |
Net unrealized appreciation (depreciation) of investment securities | | $ | (28,527 | ) |
Cost of investments for tax purposes is $7,498,329.
NOTE 9—Reclassification of Permanent Differences
Primarily as a result of differing book/tax treatment of foreign currency transactions, passive foreign investment companies and nondeductible stock issuance costs on October 31, 2014, undistributed net investment income was increased by $50,470, undistributed net realized gain was decreased by $13,213 and shares of beneficial interest was decreased by $37,257. This reclassification had no effect on the net assets of the Fund.
27 Invesco Macro International Equity Fund
NOTE 10—Share Information
| | | | | | | | |
| | | Summary of Share Activity | |
| | | December 17, 2013
(commencement date) through
October 31, 2014(a) | |
| | | Shares | | | Amount | |
Sold: | | | | | | | | |
Class A | | | 332,714 | | | $ | 3,329,683 | |
Class C | | | 2,059 | | | | 20,866 | |
Class R | | | 1,001 | | | | 10,010 | |
Class Y | | | 322,560 | | | | 3,225,939 | |
Class R5 | | | 91,465 | | | | 921,027 | |
Class R6 | | | 35,001 | | | | 350,010 | |
| | |
Reacquired: | | | | | | | | |
Class A | | | (12,848 | ) | | | (131,286 | ) |
Class Y | | | (7,818 | ) | | | (79,658 | ) |
Class R5 | | | (964 | ) | | | (10,138 | ) |
Net increase in share activity | | | 763,170 | | | $ | 7,636,453 | |
| (a) | 99% of the outstanding shares of the Fund are owned by the Adviser. |
NOTE 11—Financial Highlights
The following schedule presents financial highlights for a share of the Fund outstanding throughout the periods indicated.
| | | | | | | | | | | | | | | | | | | | | | | | | | | | | | | | | | | | | | | | | | | | |
| | | Net asset
value,
beginning
of period | | | Net
investment
income(a) | | | Net gains
on securities
(both
realized and
unrealized) | | | Total from
investment
operations | | | Net asset
value, end
of period | | | Total
return(b) | | | Net assets,
end of period
(000’s omitted) | | | Ratio of
expenses
to average
net assets
with fee waivers
and/or expenses
absorbed | | | Ratio of
expenses
to average net
assets without
fee waivers
and/or expenses
absorbed | | | Ratio of net
investment
income
to average
net assets | | | Portfolio
turnover(c) | |
Class A | |
Year ended 10/31/14(d) | | $ | 10.00 | | | $ | 0.12 | | | $ | 0.03 | | | $ | 0.15 | | | $ | 10.15 | | | | 1.50 | % | | $ | 3,247 | | | | 1.42 | %(e) | | | 8.20 | %(e) | | | 1.29 | %(e) | | | 45 | % |
Class C | |
Year ended 10/31/14(d) | | | 10.00 | | | | 0.05 | | | | 0.04 | | | | 0.09 | | | | 10.09 | | | | 0.90 | | | | 21 | | | | 2.17 | (e) | | | 8.95 | (e) | | | 0.54 | (e) | | | 45 | |
Class R | |
Year ended 10/31/14(d) | | | 10.00 | | | | 0.09 | | | | 0.04 | | | | 0.13 | | | | 10.13 | | | | 1.30 | | | | 10 | | | | 1.67 | (e) | | | 8.45 | (e) | | | 1.04 | (e) | | | 45 | |
Class Y | |
Year ended 10/31/14(d) | | | 10.00 | | | | 0.14 | | | | 0.03 | | | | 0.17 | | | | 10.17 | | | | 1.70 | | | | 3,202 | | | | 1.17 | (e) | | | 7.95 | (e) | | | 1.54 | (e) | | | 45 | |
Class R5 | |
Year ended 10/31/14(d) | | | 10.00 | | | | 0.14 | | | | 0.04 | | | | 0.18 | | | | 10.18 | | | | 1.80 | | | | 921 | | | | 1.17 | (e) | | | 7.92 | (e) | | | 1.54 | (e) | | | 45 | |
Class R6 | |
Year ended 10/31/14(d) | | | 10.00 | | | | 0.14 | | | | 0.03 | | | | 0.17 | | | | 10.17 | | | | 1.70 | | | | 356 | | | | 1.17 | (e) | | | 7.92 | (e) | | | 1.54 | (e) | | | 45 | |
| (a) | Calculated using average shares outstanding. |
| (b) | Includes adjustments in accordance with accounting principles generally accepted in the United States of America and as such, the net asset value for financial reporting purposes and the returns based upon those net asset values may differ from the net asset value and returns for shareholder transactions. Does not include sales charges and is not annualized for periods less than one year, if applicable. |
| (c) | Portfolio turnover is calculated at the fund level and is not annualized for periods less than one year, if applicable. |
| (d) | Commencement date of December 17, 2013. |
| (e) | Ratios are annualized and based on average daily net assets (000’s omitted) of $3,297, $13, $10, $3,298, $792 and $364 for Class A, Class C, Class R, Class Y, Class R5 and Class R6 shares, respectively. |
28 Invesco Macro International Equity Fund
Report of Independent Registered Public Accounting Firm
To the Board of Trustees of AIM Investment Funds (Invesco Investment Funds)
and Shareholders of Invesco Macro International Equity Fund:
In our opinion, the accompanying statement of assets and liabilities, including the schedule of investments, and the related statements of operations and of changes in net assets and the financial highlights present fairly, in all material respects, the financial position of Invesco Macro International Equity Fund (one of the funds constituting AIM Investment Funds (Invesco Investment Funds), hereafter referred to as the “Fund”) at October 31, 2014, and the results of its operations, the changes in its net assets and the financial highlights for the period December 17, 2013 (commencement of operations) through October 31, 2014, in conformity with accounting principles generally accepted in the United States of America. These financial statements and financial highlights (hereafter referred to as “financial statements”) are the responsibility of the Fund’s management. Our responsibility is to express an opinion on these financial statements based on our audit. We conducted our audit of these financial statements in accordance with the standards of the Public Company Accounting Oversight Board (United States). Those standards require that we plan and perform the audit to obtain reasonable assurance about whether the financial statements are free of material misstatement. An audit includes examining, on a test basis, evidence supporting the amounts and disclosures in the financial statements, assessing the accounting principles used and significant estimates made by management, and evaluating the overall financial statement presentation. We believe that our audit, which included confirmation of securities at October 31, 2014 by correspondence with the custodian and brokers, provides a reasonable basis for our opinion.
PRICEWATERHOUSECOOPERS LLP
December 23, 2014
Houston, Texas
29 Invesco Macro International Equity Fund
Calculating your ongoing Fund expenses
Example
As a shareholder of the Fund, you incur two types of costs: (1) transaction costs, which may include sales charges (loads) on purchase payments or contingent deferred sales charges on redemptions, if any; and (2) ongoing costs, including management fees, distribution and/or service (12b-1) fees, and other Fund expenses. This example is intended to help you understand your ongoing costs (in dollars) of investing in the Fund and to compare these costs with ongoing costs of investing in other mutual funds. The example is based on an investment of $1,000 invested at the beginning of the period and held for the entire period May 1, 2014 through October 31, 2014.
Actual expenses
The table below provides information about actual account values and actual expenses. You may use the information in this table, together with the amount you invested, to estimate the expenses that you paid over the period. Simply divide your account value by $1,000 (for example, an $8,600 account value divided by $1,000 = 8.6), then multiply the result by the number in the table under the heading entitled “Actual Expenses Paid During Period” to estimate the expenses you paid on your account during this period.
Hypothetical example for comparison purposes
The table below also provides information about hypothetical account values and hypothetical expenses based on the Fund’s actual expense ratio and an assumed rate of return of 5% per year before expenses, which is not the Fund’s actual return.
The hypothetical account values and expenses may not be used to estimate the actual ending account balance or expenses you paid for the period. You may use this information to compare the ongoing costs of investing in the Fund and other funds. To do so, compare this 5% hypothetical example with the 5% hypothetical examples that appear in the shareholder reports of the other funds.
Please note that the expenses shown in the table are meant to highlight your ongoing costs only and do not reflect any transaction costs, such as sales charges (loads) on purchase payments or contingent deferred sales charges on redemptions, if any. Therefore, the hypothetical information is useful in comparing ongoing costs only, and will not help you determine the relative total costs of owning different funds. In addition, if these transaction costs were included, your costs would have been higher.
| | | | | | | | | | | | | | | | | | | | | | | | |
| | | | | | ACTUAL | | | HYPOTHETICAL (5% annual return before expenses) | | | | |
| Class | | Beginning
Account Value
(05/01/14) | | | Ending
Account Value
(10/31/14)1 | | | Expenses
Paid During
Period2 | | | Ending
Account Value
(10/31/14) | | | Expenses
Paid During
Period2 | | | Annualized
Expense
Ratio | |
| A | | $ | 1,000.00 | | | $ | 975.00 | | | $ | 7.07 | | | $ | 1,018.05 | | | $ | 7.22 | | | | 1.42 | % |
| C | | | 1,000.00 | | | | 972.10 | | | | 10.79 | | | | 1,014.27 | | | | 11.02 | | | | 2.17 | |
| R | | | 1,000.00 | | | | 974.00 | | | | 8.31 | | | | 1,016.79 | | | | 8.49 | | | | 1.67 | |
| Y | | | 1,000.00 | | | | 976.90 | | | | 5.83 | | | | 1,019.31 | | | | 5.96 | | | | 1.17 | |
| R5 | | | 1,000.00 | | | | 977.00 | | | | 5.83 | | | | 1,019.31 | | | | 5.96 | | | | 1.17 | |
| R6 | | | 1,000.00 | | | | 976.90 | | | | 5.83 | | | | 1,019.31 | | | | 5.96 | | | | 1.17 | |
| 1 | The actual ending account value is based on the actual total return of the Fund for the period May 1, 2014 through October 31, 2014, after actual expenses and will differ from the hypothetical ending account value which is based on the Fund’s expense ratio and a hypothetical annual return of 5% before expenses. |
| 2 | Expenses are equal to the Fund’s annualized expense ratio as indicated above multiplied by the average account value over the period, multiplied by 184/365 to reflect the most recent fiscal half year. |
30 Invesco Macro International Equity Fund
Approval of Investment Advisory and Sub-Advisory Contracts
The Board of Trustees (the Board) of AIM Investment Funds (Invesco Investment Funds) is required under the Investment Company Act of 1940, as amended, to approve annually the renewal of Invesco Macro International Equity Fund’s (the Fund) investment advisory agreements. During contract renewal meetings held on June 16-17, 2014, the Board as a whole, and the disinterested or “independent” Trustees, who comprise over 75% of the Board, voting separately, approved the continuance for the Fund of the Master Investment Advisory Agreement with Invesco Advisers, Inc. (Invesco Advisers and the investment advisory agreement) and the Master Intergroup Sub-Advisory Contract for Mutual Funds with Invesco Asset Management Deutschland GmbH, Invesco Asset Management Limited, Invesco Asset Management (Japan) Limited, Invesco Australia Limited, Invesco Hong Kong Limited, Invesco Senior Secured Management, Inc., Invesco Canada Ltd. and Invesco PowerShares Capital Management LLC (collectively, the Affiliated Sub-Advisers and the sub-advisory contracts) for another year, effective July 1, 2014.
In evaluating the fairness and reasonableness of compensation under the Fund’s investment advisory agreement and sub-advisory contracts, the Board considered, among other things, the factors discussed below. The Board determined that continuation of the Fund’s investment advisory agreement and the sub-advisory contracts are in the best interest of the Fund and its shareholders and that the compensation payable to Invesco Advisers and the Affiliated Sub-Advisers under the agreements is fair and reasonable.
The Board’s Fund Evaluation Process
The Board’s Investments Committee has established three Sub-Committees, each of which is primarily responsible for overseeing the management of a number of the funds advised by Invesco Advisers (the Invesco Funds). The Sub-Committees meet throughout the year to review the performance of their assigned Invesco Funds, including reviewing materials prepared under the direction of the independent Senior Officer, an officer of the Invesco Funds who reports directly to the independent Trustees. Over the course of each year, the Sub-Committees meet with portfolio managers for their assigned Invesco Funds and other members of management to review the performance, investment objective(s), policies, strategies, limitations and investment risks of these funds. The Sub-Committees meet regularly and at designated contract renewal meetings each year to conduct a review of the performance, fees, expenses, and other matters related to their assigned Invesco Funds. Each Sub-Committee recommends to the Investments Committee, which in turn recommends to the full Board, whether and on what terms to
approve the continuance of each Invesco Fund’s investment advisory agreement and sub-advisory contracts for another year.
During the contract renewal process, the Trustees receive comparative performance and fee data regarding the Invesco Funds prepared by Invesco Advisers and Lipper Inc. (Lipper), an independent provider of investment company data. The Trustees also receive an independent written evaluation from the Senior Officer. The Senior Officer’s evaluation is prepared as part of his responsibility to manage the process by which the Invesco Funds’ proposed management fees are negotiated during the annual contract renewal process to ensure they are negotiated in a manner that is at arms’ length and reasonable. In addition to meetings with Invesco Advisers and fund counsel, the independent Trustees also discuss the continuance of the investment advisory agreement and sub-advisory contracts in separate sessions with the Senior Officer and with independent legal counsel.
The Trustees recognized that the advisory fee rates for the Invesco Funds are, in many cases, the result of years of review and negotiation. The Trustees’ deliberations and conclusions in a particular year may be based in part on their deliberations and conclusions regarding these same arrangements throughout the year and in prior years. The Trustees’ review and conclusions are based on the comprehensive consideration of all information presented to them and are not the result of any single determinative factor. Moreover, one Trustee may have weighed a particular piece of information or factor differently than another Trustee.
The discussion below serves as the Senior Officer’s independent written evaluation with respect to the Fund’s investment advisory agreement as well as a discussion of the material factors and related conclusions that formed the basis for the Board’s approval of the Fund’s investment advisory agreement and sub-advisory contracts. Unless otherwise stated, this information is current as of June 17, 2014, and may not reflect consideration of factors that became known to the Board after that date.
Factors and Conclusions and Summary of Independent Written Fee Evaluation
| A. | Nature, Extent and Quality of Services Provided by Invesco Advisers and the Affiliated Sub-Advisers |
The Board reviewed the advisory services provided to the Fund by Invesco Advisers under the Fund’s investment advisory agreement, the performance of Invesco Advisers in providing these services, and the credentials and experience of the officers and employees of Invesco Advisers who provide these services, including the Fund’s portfolio manager or
managers, with whom the Sub-Committees met during the year. The Board’s review of the qualifications of Invesco Advisers to provide advisory services included the Board’s consideration of Invesco Advisers’ investment process oversight, independent credit analysis and investment risk management. The Board also considered non-advisory services that Invesco Advisers and its affiliates provide to the Invesco Funds such as various back office support functions, equity and fixed income trading operations, internal audit, distribution and legal and compliance.
In determining whether to continue the Fund’s investment advisory agreement, the Board considered the benefits of reapproving an existing relationship and the greater uncertainty that may be associated with entering into a new relationship. The Board concluded that the nature, extent and quality of the services provided to the Fund by Invesco Advisers are appropriate and satisfactory and consistent with the terms of the Fund’s investment advisory agreement.
The Board reviewed the services that may be provided by the Affiliated Sub-Advisers under the sub-advisory contracts and the credentials and experience of the officers and employees of the Affiliated Sub-Advisers who provide these services. The Board noted that the Affiliated Sub-Advisers have offices and personnel that are located in financial centers around the world. As a result, the Affiliated Sub-Advisers can provide research and investment analysis on the markets and economies of various countries in which the Fund may invest, make recommendations regarding securities and assist with security trades. The Board concluded that the sub-advisory contracts benefit the Fund and its shareholders by permitting Invesco Advisers to use the resources and talents of the Affiliated Sub-Advisers in managing the Fund. The Board concluded that the nature, extent and quality of the services that may be provided by the Affiliated Sub-Advisers are appropriate and satisfactory and consistent with the terms of the Fund’s sub-advisory contracts.
The Board did not consider Fund performance as a relevant factor in considering whether to approve the investment advisory agreement or the sub-advisory contracts for the Fund, as the fund recently began operations and comparative performance information was not available.
| C. | Advisory and Sub-Advisory Fees |
The Board noted that Invesco Advisers has contractually agreed to waive fees and/or limit expenses of the Fund through at least December 31, 2015 in an amount necessary to limit total annual operating expenses to a specified percentage of average daily net assets for each class of the Fund.
31 Invesco Macro International Equity Fund
The Board noted that Invesco Advisers and the Affiliated Sub-Advisers do not manage other mutual funds or client accounts using an investment process substantially similar to the investment process used for the Fund.
The Board also considered the services that may be provided by the Affiliated Sub-Advisers pursuant to the sub-advisory contracts, as well as the fees payable by Invesco Advisers to the Affiliated Sub-Advisers pursuant to the sub-advisory contracts. The Board also noted that the sub-advisory fees are not paid directly by the Fund, but rather, are payable to the Affiliated Sub-Advisers.
| D. | Economies of Scale and Breakpoints |
The Board considered the extent to which there are economies of scale in the provision of advisory services to the Fund. The Board also considered whether the Fund benefits from economies of scale through contractual breakpoints in the Fund’s advisory fee schedule and was assisted in this review by a report from the Senior Officer. The Board also noted that the Fund shares directly in economies of scale through lower fees charged by third party service providers based on the combined size of the Invesco Funds and other clients advised by Invesco Advisers.
| E. | Profitability and Financial Resources |
The Board reviewed information from Invesco Advisers concerning the costs of the advisory and other services that Invesco Advisers and its affiliates provide to the Fund and the profitability of Invesco Advisers and its affiliates in providing these services for the year ended December 31, 2013. The Board received information from Invesco Advisers about the methodology used to prepare the profitability information. The Board considered the profitability of Invesco Advisers in managing the Fund and the Invesco Funds. The Board noted that Invesco Advisers continues to operate at a net profit from services Invesco Advisers and its subsidiaries provide to the Invesco Funds. The Board noted that Invesco Advisers and its subsidiaries did not make a profit from managing the Fund as a result of fee and expense waivers. The Board received and accepted information from Invesco Advisers demonstrating that Invesco Advisers and each Affiliated Sub-Adviser are financially sound and have the resources necessary to perform their obligations under the investment advisory agreement and sub-advisory contracts.
| F. | Collateral Benefits to Invesco Advisers and its Affiliates |
The Board considered various other benefits received by Invesco Advisers and its affiliates from the relationship with the Fund, including the fees received for their provision of transfer agency and distribution services to the Fund. The Board considered the performance of Invesco Advisers and its affiliates in providing these services and the organizational structure employed to provide these services. The Board also considered that these services are provided to the Fund pursuant to written contracts that are reviewed and approved on an annual basis
by the Board; that the services are required for the operation of the Fund; that Invesco Advisers and its affiliates can provide services, the nature and quality of which are at least equal to those provided by others offering the same or similar services; and that the fees for such services are fair and reasonable in light of the usual and customary charges by others for services of the same nature and quality.
The Board considered the benefits realized by Invesco Advisers and the Affiliated Sub-Advisers as a result of portfolio brokerage transactions executed through “soft dollar” arrangements. The Board noted that soft dollar arrangements shift the payment obligation for research services from Invesco Advisers and the Affiliated Sub-Advisers to the Invesco Funds and that the research received may be used with other clients of Invesco Advisers and may reduce Invesco Advisers’ and the Affiliated Sub-Advisers’ expenses. The Board also considered that it receives periodic reports from the Chief Compliance Officer of the Invesco Funds demonstrating that these arrangements are consistent with regulatory requirements. The Board did not deem the soft dollar arrangements to be inappropriate.
The Board considered that the Fund’s uninvested cash and cash collateral from any securities lending arrangements may be invested in money market funds advised by Invesco Advisers pursuant to procedures approved by the Board. The Board noted that Invesco Advisers receives advisory fees from these affiliated money market funds attributable to such investments, although Invesco Advisers has contractually agreed to waive through varying periods the advisory fees payable by the Invesco Funds with respect to investments in the affiliated money market funds. The waiver is in an amount equal to 100% of the net advisory fee Invesco Advisers receives from the affiliated money market funds with respect to the Fund’s investment in the affiliated money market funds of uninvested cash, but not cash collateral. The Board concluded that the amount of advisory fees received by Invesco Advisors from the Fund’s investment of uninvested cash and cash collateral from any securities lending arrangements in the affiliated money market funds are fair and reasonable.
The Board also considered the Fund may use an affiliated broker to execute certain trades for the Fund to among other things, control information leakage, and were advised that such trades would be executed in compliance with rules under the Investment Company Act of 1940, as amended.
32 Invesco Macro International Equity Fund
Tax Information
Form 1099-DIV, Form 1042-S and other year–end tax information provide shareholders with actual calendar year amounts that should be included in their tax returns. Shareholders should consult their tax advisors.
The following distribution information is being provided as required by the Internal Revenue Code or to meet a specific state’s requirement.
The Fund designates the following amounts or, if subsequently determined to be different, the maximum amount allowable for its fiscal year ended October 31, 2014:
| | | | |
Federal and State Income Tax | |
Qualified Dividend Income* | | | 0 | % |
Corporate Dividends Received Deduction* | | | 0 | % |
U.S. Treasury Obligations* | | | 0 | % |
| | * | The above percentages are based on ordinary income dividends paid to shareholders during the Fund’s fiscal year. |
33 Invesco Macro International Equity Fund
Trustees and Officers
The address of each trustee and officer is AIM Investment Funds (Invesco Investment Funds) (the “Trust”), 11 Greenway Plaza, Suite 1000, Houston, Texas 77046-1173. The trustees serve for the life of the Trust, subject to their earlier death, incapacitation, resignation, retirement or removal as more specifically provided in the Trust’s organizational documents. Each officer serves for a one year term or until their successors are elected and qualified. Column two below includes length of time served with predecessor entities, if any.
| | | | | | | | |
Name, Year of Birth and Position(s) Held with the Trust | | Trustee and/
or Officer Since | | Principal Occupation(s) During Past 5 Years | | Number of Funds in Fund Complex Overseen by Trustee | | Other Directorship(s) Held by Trustee During Past 5 Years |
| Interested Persons | | | | | | | | |
| Martin L. Flanagan1 — 1960 Trustee | | 2007 | | Executive Director, Chief Executive Officer and President, Invesco Ltd. (ultimate parent of Invesco and a global investment management firm); Advisor to the Board, Invesco Advisers, Inc. (formerly known as Invesco Institutional (N.A.), Inc.); Trustee, The Invesco Funds; Vice Chair, Investment Company Institute; and Member of Executive Board, SMU Cox School of Business Formerly: Chairman and Chief Executive Officer, Invesco Advisers, Inc. (registered investment adviser); Director, Chairman, Chief Executive Officer and President, IVZ Inc. (holding company), INVESCO Group Services, Inc. (service provider) and Invesco North American Holdings, Inc. (holding company); Director, Chief Executive Officer and President, Invesco Holding Company Limited (parent of Invesco and a global investment management firm); Director, Invesco Ltd.; Chairman, Investment Company Institute and President, Co-Chief Executive Officer, Co-President, Chief Operating Officer and Chief Financial Officer, Franklin Resources, Inc. (global investment management organization). | | 144 | | None |
Philip A. Taylor2 — 1954 Trustee, President and Principal Executive Officer | | 2006 | | Head of North American Retail and Senior Managing Director, Invesco Ltd.; Director, Co-Chairman, Co-President and Co-Chief Executive Officer, Invesco Advisers, Inc. (formerly known as Invesco Institutional (N.A.), Inc.) (registered investment adviser); Director, Chairman, Chief Executive Officer and President, Invesco Management Group, Inc. (formerly known as Invesco Aim Management Group, Inc.) (financial services holding company); Director and President, INVESCO Funds Group, Inc. (registered investment adviser and registered transfer agent); Director and Chairman, Invesco Investment Services, Inc. (formerly known as Invesco Aim Investment Services, Inc.) (registered transfer agent) and IVZ Distributors, Inc. (formerly known as INVESCO Distributors, Inc.) (registered broker dealer); Director, President and Chairman, Invesco Inc. (holding company) and Invesco Canada Holdings Inc. (holding company); Chief Executive Officer, Invesco Corporate Class Inc. (corporate mutual fund company) and Invesco Canada Fund Inc. (corporate mutual fund company); Director, Chairman and Chief Executive Officer, Invesco Canada Ltd. (formerly known as Invesco Trimark Ltd./Invesco Trimark Ltèe) (registered investment adviser and registered transfer agent); Trustee, President and Principal Executive Officer, The Invesco Funds (other than AIM Treasurer’s Series Trust (Invesco Treasurer’s Series Trust) and Short-Term Investments Trust); Trustee and Executive Vice President, The Invesco Funds (AIM Treasurer’s Series Trust (Invesco Treasurer’s Series Trust) and Short-Term Investments Trust only); Director, Invesco Investment Advisers LLC (formerly known as Van Kampen Asset Management); Director, Chief Executive Officer and President, Van Kampen Exchange Corp. Formerly: Director and Chairman, Van Kampen Investor Services Inc.; Director, Chief Executive Officer and President, 1371 Preferred Inc. (holding company) and Van Kampen Investments Inc.; Director and President, AIM GP Canada Inc. (general partner for limited partnerships) and Van Kampen Advisors, Inc.; Director and Chief Executive Officer, Invesco Trimark Dealer Inc. (registered broker dealer); Director, Invesco Distributors, Inc. (formerly known as Invesco Aim Distributors, Inc.) (registered broker dealer); Manager, Invesco PowerShares Capital Management LLC; Director, Chief Executive Officer and President, Invesco Advisers, Inc.; Director, Chairman, Chief Executive Officer and President, Invesco Aim Capital Management, Inc.; President, Invesco Trimark Dealer Inc. and Invesco Trimark Ltd./Invesco Trimark Ltèe; Director and President, AIM Trimark Corporate Class Inc. and AIM Trimark Canada Fund Inc.; Senior Managing Director, Invesco Holding Company Limited; Director and Chairman, Fund Management Company (former registered broker dealer); President and Principal Executive Officer, The Invesco Funds (AIM Treasurer’s Series Trust (Invesco Treasurer’s Series Trust), and Short-Term Investments Trust only); President, AIM Trimark Global Fund Inc. and AIM Trimark Canada Fund Inc. | | 144 | | None |
Wayne W. Whalen3 — 1939 Trustee | | 2010 | | Of Counsel, and prior to 2010, partner in the law firm of Skadden, Arps, Slate, Meagher & Flom LLP, legal counsel to certain funds in the Fund Complex | | 144 | | Director of the Mutual fund Directors Forum, a nonprofit membership organization for investment directors; Chairman and Director of the Abraham Lincoln Presidential Library Foundation; and Director of the Stevenson Center for Democracy |
| 1 | Mr. Flanagan is considered an interested person (within the meaning of Section 2(a)(19) of the 1940 Act) of the Trust because he is an officer of the Adviser to the Trust, and an officer and a director of Invesco Ltd., ultimate parent of the Adviser. |
| 2 | Mr. Taylor is considered an interested person (within the meaning of Section 2(a)(19) of the 1940 Act) of the Trust because he is an officer and a director of the Adviser. |
| 3 | Mr. Whalen is retiring effective December 31, 2014. He has been deemed to be an interested person of the Trust because of his prior service as counsel to the predecessor funds of certain Invesco open-end funds and his affiliation with the law firm that served as counsel to such predecessor funds and the Invesco closed-end funds. |
T-1 Invesco Macro International Equity Fund
Trustees and Officers—(continued)
| | | | | | | | |
Name, Year of Birth and Position(s) Held with the Trust | | Trustee and/
or Officer Since | | Principal Occupation(s) During Past 5 Years | | Number of Funds in Fund Complex Overseen by Trustee | | Other Directorship(s) Held by Trustee During Past 5 Years |
| Independent Trustees | | | | | | | | |
Bruce L. Crockett — 1944 Trustee and Chair | | 2001 | | Chairman, Crockett Technologies Associates (technology consulting company) Formerly: Director, Captaris (unified messaging provider); Director, President and Chief Executive Officer, COMSAT Corporation; Chairman, Board of Governors of INTELSAT (international communications company); ACE Limited (insurance company); and Investment Company Institute | | 144 | | ALPS (Attorneys Liability Protection Society) (insurance company) |
David C. Arch — 1945 Trustee | | 2010 | | Chairman of Blistex Inc., a consumer health care products manufacturer | | 144 | | Board member of the Illinois Manufacturers’ Association; Member of the Board of Visitors, Institute for the Humanities, University of Michigan; Member of the Audit Committee of the Edward-Elmhurst Hospital |
Frank S. Bayley — 1939 Trustee | | 1987 | | Retired. Formerly: Director, Badgley Funds Inc. (registered investment company) (2 portfolios) and General Partner and Of Counsel, law firm of Baker & McKenzie, LLP | | 144 | | Director and Chairman, C.D. Stimson Company (a real estate investment company); Trustee, The Curtis Institute of Music |
James T. Bunch — 1942 Trustee | | 2003 | | Managing Member, Grumman Hill Group LLC (family office private equity investments) Formerly: Founder, Green Manning & Bunch Ltd. (investment banking firm) (1988-2010); Executive Committee, United States Golf Association; and Director, Policy Studies, Inc. and Van Gilder Insurance Corporation | | 144 | | Chairman, Board of Governors, Western Golf Association; Chairman, Evans Scholars Foundation; and Director, Denver Film Society |
Rodney F. Dammeyer — 1940 Trustee | | 2010 | | Chairman of CAC,LLC, (private company offering capital investment and management advisory services) Formerly: Prior to 2001, Managing Partner at Equity Group Corporate Investments; Prior to 1995, Chief Executive Officer of Itel Corporation (formerly Anixter International); Prior to 1985, experience includes Senior Vice President and Chief Financial Officer of Household International, Inc., Executive Vice President and Chief Financial Officer of Northwest Industries, Inc. and Partner of Arthur Andersen & Co.; From 1987 to 2010, Director/Trustee of investment companies in the Van Kampen Funds complex | | 144 | | Director of Quidel Corporation and Stericycle, Inc. |
Albert R. Dowden — 1941 Trustee | | 2001 | | Director of a number of public and private business corporations, including the Boss Group, Ltd. (private investment and management); Nature’s Sunshine Products, Inc. and Reich & Tang Funds (5 portfolios) (registered investment company) Formerly: Director, Homeowners of America Holding Corporation/Homeowners of America Insurance Company (property casualty company); Director, Continental Energy Services, LLC (oil and gas pipeline service); Director, CompuDyne Corporation (provider of product and services to the public security market) and Director, Annuity and Life Re (Holdings), Ltd. (reinsurance company); Director, President and Chief Executive Officer, Volvo Group North America, Inc.; Senior Vice President, AB Volvo; Director of various public and private corporations; Chairman, DHJ Media, Inc.; Director, Magellan Insurance Company; and Director, The Hertz Corporation, Genmar Corporation (boat manufacturer), National Media Corporation; Advisory Board of Rotary Power International (designer, manufacturer, and seller of rotary power engines); and Chairman, Cortland Trust, Inc. (registered investment company) | | 144 | | Director of: Nature’s Sunshine Products, Inc., Reich & Tang Funds, Homeowners of America Holding Corporation/ Homeowners of America Insurance Company, the Boss Group |
Jack M. Fields — 1952 Trustee | | 2001 | | Chief Executive Officer, Twenty First Century Group, Inc. (government affairs company); Owner and Chief Executive Officer, Dos Angeles Ranch, L.P. (cattle, hunting, corporate entertainment); and Discovery Global Education Fund (non-profit) Formerly: Chief Executive Officer, Texana Timber LP (sustainable forestry company); Director of Cross Timbers Quail Research Ranch (non-profit); and member of the U.S. House of Representatives | | 144 | | Insperity, Inc. (formerly known as Administaff) |
Prema Mathai-Davis — 1950 Trustee | | 2001 | | Retired. Formerly: Chief Executive Officer, YWCA of the U.S.A. | | 144 | | None |
Larry Soll — 1942 Trustee | | 2003 | | Retired. Formerly: Chairman, Chief Executive Officer and President, Synergen Corp. (a biotechnology company) | | 144 | | None |
Hugo F. Sonnenschein — 1940 Trustee | | 2010 | | President Emeritus and Honorary Trustee of the University of Chicago and the Adam Smith Distinguished Service Professor in the Department of Economics at the University of Chicago. Prior to 2000, President of the University of Chicago | | 144 | | Trustee of the University of Rochester and a member of its investment committee; Member of the National Academy of Sciences and the American Philosophical Society; Fellow of the American Academy of Arts and Sciences |
T-2 Invesco Macro International Equity Fund
Trustees and Officers—(continued)
| | | | | | | | |
Name, Year of Birth and Position(s) Held with the Trust | | Trustee and/
or Officer Since | | Principal Occupation(s) During Past 5 Years | | Number of Funds in Fund Complex Overseen by Trustee | | Other Directorship(s) Held by Trustee During Past 5 Years |
| Independent Trustees—(continued) |
Raymond Stickel, Jr. — 1944 Trustee | | 2005 | | Retired. Formerly: Director, Mainstay VP Series Funds, Inc. (25 portfolios) and Partner, Deloitte & Touche | | 144 | | None |
Suzanne H. Woolsey — 1941 Trustee | | 2014 | | Chief Executive Officer of Woolsey Partners LLC | | 144 | | Emeritus Chair of the Board of Trustees of the Institute for Defense Analyses; Trustee of Colorado College; Trustee of California Institute of Technology; Prior to 2014, Director of Fluor Corp.; Prior to 2010, Trustee of the German Marshall Fund of the United States; Prior to 2010 Trustee of the Rocky Mountain Institute |
| Other Officers | | | | | | | | |
Russell C. Burk — 1958 Senior Vice President and Senior Officer | | 2005 | | Senior Vice President and Senior Officer, The Invesco Funds | | N/A | | N/A |
John M. Zerr — 1962 Senior Vice President, Chief Legal Officer and Secretary | | 2006 | | Director, Senior Vice President, Secretary and General Counsel, Invesco Management Group, Inc. (formerly known as Invesco Aim Management Group, Inc.) and Van Kampen Exchange Corp.; Senior Vice President, Invesco Advisers, Inc. (formerly known as Invesco Institutional (N.A.), Inc.) (registered investment adviser); Senior Vice President and Secretary, Invesco Distributors, Inc. (formerly known as Invesco Aim Distributors, Inc.); Director, Vice President and Secretary, Invesco Investment Services, Inc. (formerly known as Invesco Aim Investment Services, Inc.) and IVZ Distributors, Inc. (formerly known as INVESCO Distributors, Inc.); Director and Vice President, INVESCO Funds Group, Inc.; Senior Vice President, Chief Legal Officer and Secretary, The Invesco Funds; Manager, Invesco PowerShares Capital Management LLC; Director, Secretary and General Counsel, Invesco Investment Advisers LLC (formerly known as Van Kampen Asset Management); Secretary and General Counsel, Invesco Capital Markets, Inc. (formerly known as Van Kampen Funds Inc.) and Chief Legal Officer, PowerShares Exchange-Traded Fund Trust, PowerShares Exchange-Traded Fund Trust II, PowerShares India Exchange-Traded Fund Trust, PowerShares Actively Managed Exchange-Traded Fund Trust; and PowerShares Actively Managed Exchange-Traded Commodity Fund Trust Formerly: Director and Vice President, Van Kampen Advisors Inc.; Director, Vice President, Secretary and General Counsel, Van Kampen Investor Services Inc.; Director, Invesco Distributors, Inc. (formerly known as Invesco Aim Distributors, Inc.); Director, Senior Vice President, General Counsel and Secretary, Invesco Aim Advisers, Inc. and Van Kampen Investments Inc.; Director, Vice President and Secretary, Fund Management Company; Director, Senior Vice President, Secretary, General Counsel and Vice President, Invesco Aim Capital Management, Inc.; Chief Operating Officer and General Counsel, Liberty Ridge Capital, Inc. (an investment adviser); Vice President and Secretary, PBHG Funds (an investment company) and PBHG Insurance Series Fund (an investment company); Chief Operating Officer, General Counsel and Secretary, Old Mutual Investment Partners (a broker-dealer); General Counsel and Secretary, Old Mutual Fund Services (an administrator) and Old Mutual Shareholder Services (a shareholder servicing center); Executive Vice President, General Counsel and Secretary, Old Mutual Capital, Inc. (an investment adviser); and Vice President and Secretary, Old Mutual Advisors Funds (an investment company) | | N/A | | N/A |
Sheri Morris — 1964 Vice President, Treasurer and Principal Financial Officer | | 1999 | | Vice President, Treasurer and Principal Financial Officer, The Invesco Funds; Vice President, Invesco Advisers, Inc. (formerly known as Invesco Institutional (N.A.), Inc.) (registered investment adviser); and Vice President, PowerShares Exchange-Traded Fund Trust, PowerShares Exchange-Traded Fund Trust II, PowerShares India Exchange-Traded Fund Trust, PowerShares Actively Managed Exchange-Traded Fund Trust, and PowerShares Actively Managed Exchange-Traded Commodity Fund Trust Formerly: Vice President, Invesco Aim Advisers, Inc., Invesco Aim Capital Management, Inc. and Invesco Aim Private Asset Management, Inc.; Assistant Vice President and Assistant Treasurer, The Invesco Funds and Assistant Vice President, Invesco Advisers, Inc., Invesco Aim Capital Management, Inc. and Invesco Aim Private Asset Management, Inc.; and Treasurer, PowerShares Exchange-Traded Fund Trust, PowerShares Exchange-Traded Fund Trust II, PowerShares India Exchange-Traded Fund Trust and PowerShares Actively Managed Exchange-Traded Fund Trust | | N/A | | N/A |
T-3 Invesco Macro International Equity Fund
Trustees and Officers—(continued)
| | | | | | | | |
Name, Year of Birth and Position(s) Held with the Trust | | Trustee and/
or Officer Since | | Principal Occupation(s) During Past 5 Years | | Number of Funds in Fund Complex Overseen by Trustee | | Other Directorship(s) Held by Trustee During Past 5 Years |
| Other Officers—(continued) | | | | | | | | |
Karen Dunn Kelley — 1960 Vice President | | 2004 | | Senior Managing Director, Investments; Director, Co-President, Co-Chief Executive Officer, and Co-Chairman, Invesco Advisers, Inc. (formerly known as Invesco Institutional (N.A.), Inc.) (registered investment adviser); Chairman, Invesco Senior Secured Management, Inc.; Senior Vice President, Invesco Management Group, Inc. (formerly known as Invesco Aim Management Group, Inc.); Executive Vice President, Invesco Distributors, Inc. (formerly known as Invesco Aim Distributors, Inc.); Director, Invesco Mortgage Capital Inc. and Invesco Management Company Limited; Director and President, INVESCO Asset Management (Bermuda) Ltd., Vice President, The Invesco Funds (other than AIM Treasurer’s Series Trust (Invesco Treasurer’s Series Trust) and Short-Term Investments Trust); and President and Principal Executive Officer, The Invesco Funds (AIM Treasurer’s Series Trust (Invesco Treasurer’s Series Trust) and Short-Term Investments Trust only) Formerly: Director, INVESCO Global Asset Management Limited and INVESCO Management S.A.; Senior Vice President, Van Kampen Investments Inc. and Invesco Advisers, Inc. (formerly known as Invesco Institutional (N.A.), Inc.) (registered investment adviser); Vice President, Invesco Advisers, Inc. (formerly known as Invesco Institutional (N.A.), Inc.); Director of Cash Management and Senior Vice President, Invesco Advisers, Inc. and Invesco Aim Capital Management, Inc.; Director and President, Fund Management Company; Chief Cash Management Officer, Director of Cash Management, Senior Vice President, and Managing Director, Invesco Aim Capital Management, Inc.; Director of Cash Management, Senior Vice President, and Vice President, Invesco Advisers, Inc. and The Invesco Funds (AIM Treasurer’s Series Trust (Invesco Treasurer’s Series Trust), and Short-Term Investments Trust only) | | N/A | | N/A |
Crissie M. Wisdom — 1969 Anti-Money Laundering Compliance Officer | | 2013 | | Anti-Money Laundering Compliance Officer, Invesco Advisers, Inc. (formerly known as Invesco Institutional (N.A.), Inc.) (registered investment adviser), Invesco Capital Markets, Inc. (formerly known as Van Kampen Funds Inc.), Invesco Distributors, Inc., Invesco Investment Services, Inc., Invesco Management Group, Inc., Van Kampen Exchange Corp., The Invesco Funds, and PowerShares Exchange-Traded Fund Trust, PowerShares Exchange-Traded Fund Trust II, PowerShares India Exchange-Traded Fund Trust, PowerShares Actively Managed Exchange-Traded Fund Trust and PowerShares Actively Managed Exchange-Traded Commodity Fund Trust; and Fraud Prevention Manager and Controls and Risk Analysis Manager for Invesco Investment Services, Inc. | | N/A | | N/A |
Todd L. Spillane — 1958 Chief Compliance Officer | | 2006 | | Senior Vice President, Invesco Management Group, Inc. (formerly known as Invesco Aim Management Group, Inc.) and Van Kampen Exchange Corp.; Senior Vice President and Chief Compliance Officer, Invesco Advisers, Inc. (registered investment adviser) (formerly known as Invesco Institutional (N.A.), Inc.); Chief Compliance Officer, The Invesco Funds; Vice President, Invesco Distributors, Inc. (formerly known as Invesco Aim Distributors, Inc.) and Invesco Investment Services, Inc. (formerly known as Invesco Aim Investment Services, Inc.) Formerly: Chief Compliance Officer, Invesco Funds (Chicago); Senior Vice President, Van Kampen Investments Inc.; Senior Vice President and Chief Compliance Officer, Invesco Aim Advisers, Inc. and Invesco Aim Capital Management, Inc.; Chief Compliance Officer, INVESCO Private Capital Investments, Inc. (holding company), Invesco Private Capital, Inc. (registered investment adviser), Invesco Global Asset Management (N.A.), Inc., Invesco Senior Secured Management, Inc. (registered investment adviser), Van Kampen Investor Services Inc., PowerShares Exchange-Traded Fund Trust, PowerShares Exchange-Traded Fund Trust II, PowerShares India Exchange-Traded Fund Trust and PowerShares Actively Managed Exchange-Traded Fund Trust; and Vice President, Invesco Aim Capital Management, Inc. and Fund Management Company | | N/A | | N/A |
The Statement of Additional Information of the Trust includes additional information about the Fund’s Trustees and is available upon request, without charge, by calling 1.800.959.4246. Please refer to the Fund’s prospectus for information on the Fund’s sub-advisers.
| | | | | | |
Office of the Fund 11 Greenway Plaza, Suite 1000 Houston, TX 77046-1173 | | Investment Adviser Invesco Advisers, Inc. 1555 Peachtree Street, N.E. Atlanta, GA 30309 | | Distributor Invesco Distributors, Inc. 11 Greenway Plaza, Suite 1000 Houston, TX 77046-1173 | | Auditors PricewaterhouseCoopers LLP 1000 Louisiana Street, Suite 5800 Houston, TX 77002-5678 |
| | | |
| | | | | | |
Counsel to the Fund Stradley Ronon Stevens & Young, LLP 2005 Market Street, Suite 2600 Philadelphia, PA 19103-7018 | | Counsel to the Independent Trustees Goodwin Procter LLP 901 New York Avenue, N.W. Washington, D.C. 20001 | | Transfer Agent Invesco Investment Services, Inc. 11 Greenway Plaza, Suite 1000 Houston, TX 77046-1173 | | Custodian State Street Bank and Trust Company 225 Franklin Street Boston, MA 02110-2801 |
T-4 Invesco Macro International Equity Fund

Invesco mailing information
Send general correspondence to Invesco Investment Services, Inc., P.O. Box 219078, Kansas City, MO 64121-9078.
Important notice regarding delivery of security holder documents
To reduce Fund expenses, only one copy of most shareholder documents may be mailed to shareholders with multiple accounts at the same address (Householding). Mailing of your shareholder documents may be householded indefinitely unless you instruct us otherwise. If you do not want the mailing of these documents to be combined with those for other members of your household, please contact Invesco Investment Services, Inc. at 800 959 4246 or contact your financial institution. We will begin sending you individual copies for each account within 30 days after receiving your request.
Fund holdings and proxy voting information
The Fund provides a complete list of its holdings four times in each fiscal year, at the quarter ends. For the second and fourth quarters, the lists appear in the Fund’s semiannual and annual reports to shareholders. For the first and third quarters, the Fund files the lists with the Securities and Exchange Commission (SEC) on Form N-Q. The most recent list of portfolio holdings is available at invesco.com/completeqtrholdings. Shareholders can also look up the Fund’s Forms
N-Q on the SEC website at sec.gov. Copies of the Fund’s Forms N-Q may be reviewed and copied at the SEC Public Reference Room in Washington, D.C. You can obtain information on the operation of the Public Reference Room, including information about duplicating fee charges, by calling 202 551 8090 or 800 732 0330, or by electronic request at the following email address: publicinfo@sec.gov. The SEC file numbers for the Fund are shown below.
A description of the policies and procedures that the Fund uses to determine how to vote proxies relating to portfolio securities is available without charge, upon request, from our Client Services department at 800 959 4246 or at invesco.com/proxyguidelines. The information is also available on the SEC website, sec.gov.
| | |
Information regarding how the Fund voted proxies related to its portfolio securities during the most recent 12-month period ended June 30 is available at invesco.com/proxysearch. The information is also available on the SEC website, sec.gov. Invesco Advisers, Inc. is an investment adviser; it provides investment advisory services to individual and institutional clients and does not sell securities. Invesco Distributors, Inc. is the US distributor for Invesco Ltd.’s retail mutual funds, exchange-traded funds and institutional money market funds. Both are wholly owned, indirect subsidiaries of Invesco Ltd. | |  |
| | | | |
| SEC file numbers: 811-05426 and 033-19338 | | MIE-AR-1 | | Invesco Distributors, Inc. |
Letters to Shareholders
| | |

Philip Taylor | | Dear Shareholders: This annual report includes information about your Fund, including performance data and a complete list of its investments as of the close of the reporting period. Inside, your Fund’s portfolio managers discuss how they managed your Fund and the factors that affected its performance during the reporting period. I hope you find this report of interest. During the reporting period covered by this report, the US economy showed signs of continued improvement. After contracting in the first quarter of 2014, the economy expanded strongly in the second quarter and unemployment trended lower. Much of the credit for this improvement goes to the US Federal Reserve (the Fed), which undertook an extraordinary asset purchase program following the global financial crisis. The Fed’s goal was to jumpstart the economy by encouraging banks to lend more, businesses to hire more and consumers to spend more. Signs of a stronger US economy prompted the Fed to reduce, or “taper,” its asset purchase program. Despite this, |
| interest rates remained near historical low levels due largely to heavy investor demand for bonds. While signs of economic improvement were evident in the US, European economies showed signs of weakening. That, together with geopolitical uncertainty and worries about the first diagnosed cases of Ebola outside of Africa, caused increased volatility in US and European equities. |
Extended periods of market strength can lull investors into complacency – just as prolonged periods of market weakness or volatility can discourage investors from initiating long-term investment plans. That’s why Invesco has always encouraged investors to work with a professional financial adviser who can stress the importance of starting to save and invest early and the importance of adhering to a disciplined investment plan – when times are good and when they’re uncertain. A financial adviser who knows your unique financial situation, investment goals and risk tolerance can be an invaluable partner as you seek to achieve your financial goals. He or she can offer a long-term perspective when markets are volatile and time-tested advice and guidance when your financial situation or investment goals change.
Timely information when and where you want it
Invesco’s efforts to help investors achieve their financial objectives include providing individual investors and financial professionals with timely information about the markets, the economy and investing – whenever and wherever they want it.
Our website, invesco.com/us, offers a wide range of market insights and investment perspectives. On the website, you’ll find detailed information about our funds, including prices, performance, holdings and portfolio manager commentaries. You can access information about your individual Invesco account whenever it’s convenient for you; just complete a simple, secure online registration. Use the “Log In” box on our home page to get started.
Invesco’s mobile app for iPad® (available free from the App StoreSM) allows you to obtain the same detailed information about your Fund and the same investment insights from our investment leaders, market strategists, economists and retirement experts on the go. You also can watch portfolio manager videos and have instant access to Invesco news and updates wherever you may be.
In addition to the resources accessible on our website and through our mobile app, you can obtain timely updates to help you stay informed about the markets, the economy and investing by connecting with Invesco on Twitter, LinkedIn or Facebook. You can access our blog at blog.invesco.us.com. Our goal is to provide you the information you want, when and where you want it.
Have questions?
For questions about your account, feel free to contact an Invesco client services representative at 800 959 4246. For Invesco-related questions or comments, please email me directly at phil@invesco.com.
All of us at Invesco look forward to serving your investment management needs for many years to come. Thank you for investing with us.
Sincerely,

Philip Taylor
Senior Managing Director, Invesco Ltd.
iPad is a trademark of Apple Inc., registered in the US and other countries. App Store is a service mark of Apple Inc. Invesco Distributors, Inc. is not affiliated with Apple Inc.
2 Invesco Macro Long/Short Fund
| | |

Bruce Crockett | | Dear Fellow Shareholders: There are a variety of factors that can impact investment performance, many of which are uncontrollable by us as investors. These factors can include various economic trends and geopolitical developments. While the members of the Invesco Funds Board, which I chair, can’t dictate the performance of the Invesco funds, be assured that your Board works diligently throughout the year to focus on how your investments are managed. Our job is to represent you and your interests on a variety of fund management-related matters. We regularly monitor how the portfolio management teams of the Invesco funds are performing in light of ever-changing and often unpredictable economic and market conditions. We review the investment strategies and investment process employed by each fund’s management team as explained in the fund’s prospectus. |
| | Perhaps our most significant responsibility is conducting the annual review of the funds’ |
advisory and sub-advisory contracts with Invesco Advisers and its affiliates. This annual review, which is required by the Investment Company Act of 1940, focuses on the nature and quality of the services Invesco provides as the adviser to the Invesco funds and the reasonableness of the fees that it charges for those services. Each year, we spend months carefully reviewing information from Invesco that allows us to evaluate the quality of its services and the reasonableness of its fees. We also use information from a variety of independent sources, including materials provided by the independent senior officer of the Invesco funds, who reports directly to the independent trustees on the Board. Additionally, we meet with legal counsel and review performance and fee data prepared for us by Lipper Inc., an independent, third-party firm widely recognized as a leader in its field.
After a careful review, the members of the Invesco Funds Board approved the continuation of advisory and sub-advisory contracts with Invesco Advisers and its affiliates. Be assured that your Board will continue working on behalf of fund shareholders, keeping your needs and interests uppermost in our minds.
As always, please contact me at bruce@brucecrockett.com with any questions or concerns you may have. On behalf of the Board, we look forward to continuing to represent your interests and serving your needs.
Sincerely,

Bruce L. Crockett
Independent Chair
Invesco Funds Board of Trustees
3 Invesco Macro Long/Short Fund
Management’s Discussion of Fund Performance
Performance summary
From the Fund’s inception on December 17, 2013, to the close of the reporting period on October 31, 2014, Class A shares of Invesco Macro Long/Short Fund, at net asset value, underperformed the Barclays 3-Month Treasury Bellwether Index, the Fund’s style-specific index. The main detractors from performance were the tactical overlay as well as the smart beta indexes; the valuation adjustment element contributed to performance.† For the reporting period overall, the Fund performed in line with expectations versus its index, given the specific market environment.
Additional information about your Fund’s performance appears later in this report.
Fund vs. Indexes
Cumulative total returns, 12/17/13 to 10/31/14, at net asset value (NAV). Performance shown does not include applicable contingent deferred sales charges (CDSC) or front-end sales charges, which would have reduced performance.
| | | | |
Class A Shares | | | -0.20 | % |
Class C Shares | | | -0.80 | |
Class R Shares | | | -0.40 | |
Class Y Shares | | | 0.00 | |
Class R5 Shares | | | 0.10 | |
Class R6 Shares | | | 0.00 | |
MSCI All Country World Indexq (Broad Market Index) | | | 8.65 | |
Barclays 3-Month Treasury Bellwether Indexq (Style-Specific Index) | | | 0.06 | |
Lipper Alternative Long/Short Equity Indexn (Peer Group Index) | | | 3.21 | |
Source(s): qFactSet Research Systems Inc.; nLipper Inc. † Beta is a measure of risk representing how a security is expected to respond to general market movements. Smart beta represents an alternative and selection index based methodology that seeks to outperform a benchmark or reduce portfolio risk, or both. Smart beta funds may underperform cap-weighted benchmarks and increase portfolio risk. | |
Market conditions and your Fund
The reporting period ended October 31, 2014, saw considerable geopolitical volatility and stretched equity valuations – both of which contributed to market volatility, particularly in the latter part of the reporting period.
Global equity markets generally rose during the reporting period on signs that economic growth was accelerating as a result of the loose monetary policies of many developed countries’ central banks. While 2014 began on an optimistic note, global equity markets pulled back at various points in reaction to economic and
geopolitical concerns. These concerns included worries about potentially negative effects of the US Federal Reserve (the Fed) reducing the scope of its asset purchase program beginning in early 2014, an Argentine sovereign bond default and eurozone banking concerns. Global equity markets also fell as geopolitical tensions in Ukraine and the Middle East weakened the outlook for global growth.
As the reporting period progressed, advanced economies such as the UK and US saw a modest but stronger rebound than in continental Europe, where a nascent recovery stalled. However, we
believe a more supportive monetary policy in the eurozone may be positive for equity markets there going forward. Meanwhile, the Bank of Japan remained committed to extraordinary monetary stimulus. Consumer spending in Japan has been weak for some time, and retail sales and household spending increased only gradually during the reporting period – although improved corporate earnings were an encouraging sign.
Equity market performance in emerging markets was mixed during the reporting period. China continued to face headwinds and struggled to balance structural reforms with its desire to maintain satisfactory growth, while many countries in Asia experienced healthy gains.
Equity markets experienced significant corrections in January and September 2014. Reasons for these corrections included hawkish remarks by the Fed, geopolitical tensions emanating from the Middle East as well as Ukraine and Russia, and weaker macroeconomic reports from emerging markets. The main detractors from Fund performance during the reporting period were our long cash equity holdings as well as aggregate tactical shifts. The tactical overlay, designed to adjust the portfolio to short-term market dynamics, is implemented through the use of futures and swaps. The Fund’s exposure to the US, Hong Kong and emerging markets hurt performance the most. Our tactical signals in February and October 2014 experienced increased short positions triggered mainly by conditional factors related to volatility spikes. These short positions hurt Fund performance, given market rallies in those months.
| | | | |
| Portfolio Composition | | | |
| By sector | |
| | | | |
Financials | | | 24.3 | % |
Industrials | | | 11.3 | |
Consumer Discretionary | | | 10.3 | |
Consumer Staples | | | 7.4 | |
Materials | | | 5.6 | |
Health Care | | | 5.5 | |
Utilities | | | 5.5 | |
Information Technology | | | 5.4 | |
Energy | | | 3.9 | |
Telecommunication Services | | | 2.7 | |
Money Market Funds | | | | |
| Plus Other Assets Less Liabilities | | | 18.1 | |
| | | | |
Total Net Assets | | | $13.8 million | |
| |
Total Number of Holdings* | | | 1,192 | |
The Fund’s holdings are subject to change, and there is no assurance that the Fund will continue to hold any particular security.
*Excluding money market fund holdings.
4 Invesco Macro Long/Short Fund
Please note that our strategy utilizes derivative instruments that include futures and total return swaps. Therefore, some of the performance of the strategy, both positive and negative, can be attributed to these instruments. Derivatives can be a cost-effective way to gain exposure to asset classes. However, derivatives may amplify traditional investment risks through the creation of leverage.
Thank you for your investment in Invesco Macro Long/Short Fund.
The views and opinions expressed in management’s discussion of Fund performance are those of Invesco Advisers, Inc. These views and opinions are subject to change at any time based on factors such as market and economic conditions. These views and opinions may not be relied upon as investment advice or recommendations, or as an offer for a particular security. The information is not a complete analysis of every aspect of any market, country, industry, security or the Fund. Statements of fact are from sources considered reliable, but Invesco Advisers, Inc. makes no representation or warranty as to their completeness or accuracy. Although historical performance is no guarantee of future results, these insights may help you understand our investment management philosophy.
See important Fund and, if applicable, index disclosures later in this report.
| | |
 | | Mark Ahnrud Chartered Financial Analyst, Portfolio Manager, is manager of Invesco Macro Long/Short Fund. He |
| joined Invesco in 2000. Mr. Ahnrud earned a BS in finance and investments from Babson College and an MBA from Duke University Fuqua School of Business. |
| | |
 | | Chris Devine Chartered Financial Analyst, Portfolio Manager, is manager of Invesco Macro Long/Short Fund. He |
| joined Invesco in 1998. Mr. Devine earned a BA in economics from Wake Forest University and an MBA from the University of Georgia. |
| | |
 | | Scott Hixon Chartered Financial Analyst, Portfolio Manager, is manager of Invesco Macro Long/Short Fund. He |
| joined Invesco in 1994. Mr. Hixon earned a BBA in finance from Georgia Southern University and an MBA in finance from Georgia State University. |
| | |
 | | Christian Ulrich Chartered Financial Analyst, Portfolio Manager, is manager of Invesco Macro Long/Short Fund. He |
| joined Invesco in 2000. Mr. Ulrich earned the equivalent of a BBA from the KV Zurich Business School in Zurich, Switzerland. |
| | |
 | | Scott Wolle Chartered Financial Analyst, Portfolio Manager, is manager of Invesco Macro Long/Short Fund. He |
| joined Invesco in 1999. Mr. Wolle earned a BS in finance from Virginia Polytechnic Institute and State University and an MBA from Duke University Fuqua School of Business. |
Assisted by the Invesco Global Asset Allocation Team
5 Invesco Macro Long/Short Fund
Your Fund’s Performance
Results of a $10,000 Investment – Oldest Share Class(es) since Inception
Fund and index data from 12/17/13
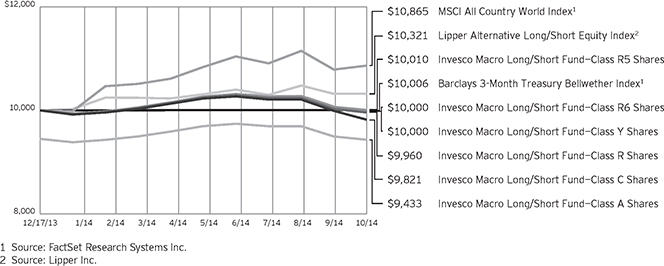
Past performance cannot guarantee comparable future results.
The data shown in the chart include reinvested distributions, applicable sales charges and Fund expenses including
management fees. Index results include reinvested dividends, but they do not reflect sales charges. Performance of the peer group, if applicable, reflects fund expenses and management fees;
performance of a market index does not. Performance shown in the chart and table(s) does not reflect deduction of taxes a shareholder would pay on Fund distributions or sale of Fund shares.
continued from page 8
Stocks of small- and mid-sized companies tend to be more vulnerable to adverse developments and may have little or no operating history or track record of success, and limited product lines, markets, management and financial resources. The securities of small- and mid-sized companies may be more volatile due to less market interest and less publicly available information about the issuer. They also may be illiquid or restricted as to resale, or may trade less frequently and in smaller volumes, all of which may cause difficulty when establishing or closing a position at a desirable price.
| n | | Volatility risk. The Fund may have investments that appreciate or decrease significantly in value over short periods of time. This may cause the Fund’s net asset value per share to experience significant increases or declines in value over short periods of time. |
About indexes used in this report
| n | | The MSCI All Country World Index is a free float-adjusted market capitalization index that is designed to measure equity market performance of developed and emerging markets. The index is computed using the net return, which withholds applicable taxes for nonresident investors. |
| n | | The Barclays 3-Month Treasury Bellwether Index measures the performance of Treasury bills with a maturity of less than three months. |
| n | | The Lipper Alternative Long/Short Equity Index is an unmanaged index considered representative of alternative equity long/short funds tracked by Lipper. |
| n | | The Fund is not managed to track the performance of any particular index, including the index(es) described here, and consequently, the performance of the Fund may deviate significantly from the performance of the
index(es). |
| n | | A direct investment cannot be made in an index. Unless otherwise indicated, index results include reinvested dividends, and they do not reflect sales charges. Performance of the peer group, if applicable, reflects fund expenses; performance of a market index does not. |
Other information
| n | | The returns shown in management’s discussion of Fund performance are based on net asset values (NAVs) calculated for shareholder transactions. Generally accepted accounting principles require adjustments to be made to the net assets of the Fund at period end for financial reporting purposes, and as such, the NAVs for shareholder transactions and the returns based on those NAVs may differ from the NAVs and returns reported in the Financial Highlights. |
| n | | Industry classifications used in this report are generally according to the Global Industry Classification Standard, which was developed by and is the exclusive property and a service mark of MSCI Inc. and Standard & Poor’s. |
6 Invesco Macro Long/Short Fund
| | | | |
Cumulative Total Returns | |
As of 10/31/14, including maximum applicable sales charges | |
Class A Shares | | | | |
Inception (12/17/13) | | | -5.67 | % |
| |
Class C Shares | | | | |
Inception (12/17/13) | | | -1.79 | % |
| |
Class R Shares | | | | |
Inception (12/17/13) | | | -0.40 | % |
| |
Class Y Shares | | | | |
Inception (12/17/13) | | | 0.00 | % |
| |
Class R5 Shares | | | | |
Inception (12/17/13) | | | 0.10 | % |
| |
Class R6 Shares | | | | |
Inception (12/17/13) | | | 0.00 | % |
The performance data quoted represent past performance and cannot guarantee comparable future results; current performance may be lower or higher. Please visit invesco.com/performance for the most recent month-end performance. Performance figures reflect reinvested distributions, changes in net asset value and the effect of the maximum sales charge unless otherwise stated. Investment return and principal value will fluctuate so that you may have a gain or loss when you sell shares.
The net annual Fund operating expense ratio set forth in the most recent Fund prospectus as of the date of this report for Class A, Class C, Class R, Class Y, Class R5 and Class R6 shares was 1.87%, 2.62%, 2.12%, 1.62%, 1.62% and 1.62%, respectively.1 The total annual Fund operating expense ratio set forth in the most recent Fund prospectus as of the date of this report for Class A, Class C, Class R, Class Y, Class R5 and Class R6 shares was 3.87%, 4.62%, 4.12%, 3.62%, 3.51% and 3.46%, respectively. The expense ratios presented above may vary from the expense ratios presented in other sections of this report that are based on expenses incurred during the period covered by this report.
| | | | |
Cumulative Total Returns | |
As of 9/30/14, the most recent calendar quarter end, including maximum applicable sales charges | |
Class A Shares | | | | |
Inception (12/17/13) | | | -5.01 | % |
| |
Class C Shares | | | | |
Inception (12/17/13) | | | -1.10 | % |
| |
Class R Shares | | | | |
Inception (12/17/13) | | | 0.30 | % |
| |
Class Y Shares | | | | |
Inception (12/17/13) | | | 0.70 | % |
| |
Class R5 Shares | | | | |
Inception (12/17/13) | | | 0.70 | % |
| |
Class R6 Shares | | | | |
Inception (12/17/13) | | | 0.70 | % |
Class A share performance reflects the maximum 5.50% sales charge, and Class C share performance reflects the applicable contingent deferred sales charge (CDSC) for the period involved. The CDSC on Class C shares is 1% for the first year after purchase. Class R, Class Y, Class R5 and Class R6 class shares do not have a front-end sales charge or a CDSC; therefore, performance is at net asset value.
The performance of the Fund’s share classes will differ primarily due to different sales charge structures and class expenses.
Had the adviser not waived fees and/ or reimbursed expenses, performance would have been lower.
| 1 | Total annual Fund operating expenses after any contractual fee waivers and/or expense reimbursements by the adviser in effect through at least February 29, 2016. See current prospectus for more information. |
7 Invesco Macro Long/Short Fund
Invesco Macro Long/Short Fund’s investment objective is to seek a positive absolute return over a complete economic and market cycle.
| n | | Unless otherwise stated, information presented in this report is as of October 31, 2014, and is based on total net assets. |
| n | | Unless otherwise noted, all data provided by Invesco. |
| n | | To access your Fund’s reports/prospectus, visit invesco.com/fundreports. |
About share classes
| n | | Class R shares are generally available only to employer sponsored retirement and benefit plans. Please see the prospectus for more information. |
| n | | Class Y shares are available only to certain investors. Please see the prospectus for more information. |
| n | | Class R5 shares and Class R6 shares are primarily intended for employer sponsored retirement and benefit plans that meet certain standards and for institutional investors. Please see the prospectus for more information. |
Principal risks of investing in the Fund
| n | | Cash/cash equivalents risk. Holding cash or cash equivalents may negatively affect performance. |
| n | | Currency/exchange rate risk. The dollar value of the Fund’s foreign investments will be affected by changes in the exchange rates between the dollar and the currencies in which those investments are traded. |
| n | | Derivatives risk. The value of a derivative instrument depends largely on (and is derived from) the value of an underlying security, currency, commodity, interest rate, index or other asset (each referred to as an underlying asset). In addition to risks relating to the underlying assets, the use of derivatives may include other, possibly greater, risks, including counterparty, leverage and liquidity risks. Counterparty risk is the risk that the counterparty to the derivative contract will default on its obligation to pay the Fund the amount owed or otherwise perform under the derivative contract. Derivatives create leverage risk because they do not require payment up front equal to the economic exposure created by owning the derivative. As a result, an adverse change in the value of the underlying asset could result in the Fund sustaining a loss that is substantially greater than the amount invested in the derivative, which may make the Fund’s returns |
more volatile and increase the risk of loss. Derivative instruments may also be less liquid than more traditional investments and the Fund may be unable to sell or close out its derivative positions at a desirable time or price. This risk may be more acute under adverse market conditions, during which the Fund may be most in need of liquidating its derivative positions. Derivatives may also be harder to value, less tax efficient and subject to changing government regulation that could impact the Fund’s ability to use certain derivatives or their cost. Also, derivatives used for hedging or to gain or limit exposure to a particular market segment may not provide the expected benefits, particularly during adverse market conditions. These risks are greater for the Fund than mutual funds that do not use derivative instruments or that use derivative instruments to a lesser extent than the Fund to implement their investment strategy.
| n | | Developing/emerging markets securities risk. The prices of securities issued by foreign companies and governments located in developing/emerging market countries may be affected more negatively by inflation, devaluation of their currencies, higher transaction costs, delays in settlement, adverse political developments, the introduction of capital controls, withholding taxes, nationalization of private assets, expropriation, social unrest, war or lack of timely information than those in developed countries. |
| n | | Foreign securities risk. The Fund’s foreign investments may be affected by changes in a foreign country’s exchange rates, political and social instability, changes in economic or taxation policies, difficulties when enforcing obligations, decreased liquidity, and increased volatility. Foreign companies may be subject to less regulation resulting in less publicly available information about the companies. |
| n | | Large capitalization company risk. Larger, more established companies may be unable to respond quickly to |
new competitive challenges such as changes in consumer tastes or innovative smaller competitors. Returns on investments in large capitalization companies could trail the returns on investments in smaller companies.
| n | | Management risk. The investment techniques and risk analysis used by the Fund’s portfolio managers may not produce the desired results. The portfolio managers’ use of derivative instruments that provide economic leverage may increase the volatility of the Fund’s net asset value, which may increase the potential of greater losses that may cause the Fund to liquidate positions when it may not be advantageous to do so. In addition, the Fund will likely underperform the broader equity markets in which the Fund invests during market rallies when the Fund’s equity exposure is less than 100% of the Fund’s assets. Such underperformance could be significant during sudden or significant market rallies. |
| n | | Market risk. The prices of and the income generated by the Fund’s securities may decline in response to, among other things, investor sentiment, general economic and market conditions, regional or global instability, and currency and interest rate fluctuations. |
| n | | Short sales risk. Short sales may cause the Fund to repurchase a security at a higher price, thereby causing a loss. A short position in a security poses more risk than holding the same security long. As there is no limit on how much the price of the security can increase, the Fund’s exposure is unlimited. In order to establish a short position in a security, the Fund must borrow the security from a broker. The Fund may not always be able to borrow a security the Fund seeks to sell short at a particular time or at an acceptable price. The Fund also may not always be able to close out the short position by replacing the borrowed securities at a particular time or at an acceptable price. The Fund will incur increased transaction costs associated with selling securities short. In addition, taking short positions in securities results in a form of leverage which may cause the Fund to be volatile. |
| n | | Small- and mid-capitalization risk. |
continued on page 6
This report must be accompanied or preceded by a currently effective Fund prospectus, which contains more complete information, including sales charges and expenses. Investors should read it carefully before investing.
NOT FDIC INSURED | MAY LOSE VALUE | NO BANK GUARANTEE
8 Invesco Macro Long/Short Fund
Schedule of Investments
October 31, 2014
| | | | | | | | |
| | | Shares | | | Value | |
Common Stocks & Other Equity Interests–81.86% | |
| Australia–4.85% | |
AGL Energy Ltd. | | | 948 | | | $ | 11,356 | |
ALS Ltd. | | | 1,815 | | | | 9,038 | |
Alumina Ltd.(a) | | | 7,403 | | | | 10,696 | |
Amcor Ltd. | | | 1,169 | | | | 12,097 | |
AMP Ltd. | | | 2,318 | | | | 11,985 | |
APA Group | | | 1,739 | | | | 12,081 | |
Asciano Ltd. | | | 2,123 | | | | 11,755 | |
ASX Ltd. | | | 358 | | | | 11,372 | |
Aurizon Holdings Ltd. | | | 2,792 | | | | 11,549 | |
AusNet Services | | | 9,526 | | | | 11,559 | |
Australia and New Zealand Banking Group Ltd. | | | 406 | | | | 12,016 | |
Bank of Queensland Ltd. | | | 1,069 | | | | 11,910 | |
Bendigo and Adelaide Bank Ltd. | | | 1,061 | | | | 11,658 | |
BHP Billiton Ltd. | | | 365 | | | | 10,894 | |
BlueScope Steel Ltd.(a) | | | 2,313 | | | | 10,723 | |
Boral Ltd. | | | 2,472 | | | | 10,950 | |
Brambles Ltd. | | | 1,281 | | | | 10,789 | |
Caltex Australia Ltd. | | | 451 | | | | 12,369 | |
Challenger Ltd. | | | 1,765 | | | | 10,827 | |
Coca-Cola Amatil Ltd. | | | 1,431 | | | | 11,547 | |
Cochlear Ltd. | | | 191 | | | | 12,383 | |
Commonwealth Bank of Australia | | | 167 | | | | 11,878 | |
Computershare Ltd. | | | 1,075 | | | | 11,655 | |
Crown Resorts Ltd. | | | 882 | | | | 11,282 | |
CSL Ltd. | | | 172 | | | | 12,177 | |
Federation Centres | | | 5,061 | | | | 12,162 | |
Fortescue Metals Group Ltd. | | | 3,446 | | | | 10,690 | |
Iluka Resources Ltd. | | | 1,528 | | | | 10,122 | |
Incitec Pivot Ltd. | | | 4,562 | | | | 11,745 | |
Insurance Australia Group Ltd. | | | 2,117 | | | | 12,188 | |
Leighton Holdings Ltd. | | | 587 | | | | 11,416 | |
Lend Lease Group | | | 902 | | | | 12,473 | |
Macquarie Group Ltd. | | | 222 | | | | 12,000 | |
Metcash Ltd. | | | 4,852 | | | | 12,129 | |
National Australia Bank Ltd. | | | 382 | | | | 11,806 | |
Newcrest Mining Ltd.(a) | | | 1,292 | | | | 10,311 | |
Novion Property Group(a) | | | 6,543 | | | | 12,091 | |
Oil Search Ltd. | | | 1,393 | | | | 10,626 | |
Orica Ltd. | | | 654 | | | | 11,921 | |
Origin Energy Ltd. | | | 857 | | | | 10,798 | |
Primary Health Care Ltd. | | | 2,905 | | | | 11,938 | |
Qantas Airways Ltd.(a) | | | 8,636 | | | | 12,842 | |
QBE Insurance Group Ltd. | | | 1,042 | | | | 10,606 | |
Ramsay Health Care Ltd. | | | 253 | | | | 11,673 | |
Santos Ltd. | | | 907 | | | | 10,337 | |
Seek Ltd. | | | 757 | | | | 11,097 | |
Sonic Healthcare Ltd. | | | 741 | | | | 12,223 | |
Suncorp Group Ltd. | | | 876 | | | | 11,331 | |
| | | | | | | | |
| | | Shares | | | Value | |
| Australia–(continued) | |
Tabcorp Holdings Ltd. | | | 3,609 | | | $ | 12,962 | |
Tatts Group Ltd. | | | 4,100 | | | | 12,557 | |
Telstra Corp. Ltd. | | | 2,395 | | | | 11,893 | |
Toll Holdings Ltd. | | | 2,296 | | | | 11,499 | |
Treasury Wine Estates Ltd. | | | 2,733 | | | | 11,183 | |
Wesfarmers Ltd. | | | 302 | | | | 11,776 | |
Westpac Banking Corp. | | | 391 | | | | 12,022 | |
Woodside Petroleum Ltd. | | | 310 | | | | 10,982 | |
Woolworths Ltd. | | | 369 | | | | 11,721 | |
WorleyParsons Ltd. | | | 807 | | | | 9,673 | |
| | | | | 667,339 | |
|
| Austria–0.15% | |
Erste Group Bank AG | | | 301 | | | | 7,686 | |
OMV AG | | | 211 | | | | 6,642 | |
Voestalpine AG | | | 159 | | | | 6,367 | |
| | | | | 20,695 | |
|
| Belgium–0.32% | |
Ageas | | | 228 | | | | 7,613 | |
Anheuser-Busch InBev N.V. | | | 70 | | | | 7,757 | |
Delhaize Group S.A. | | | 108 | | | | 7,389 | |
KBC Groep N.V.(a) | | | 139 | | | | 7,464 | |
Solvay S.A. | | | 48 | | | | 6,548 | |
UCB S.A. | | | 85 | | | | 6,867 | |
| | | | | 43,638 | |
|
| Brazil–0.68% | |
Ambev S.A. | | | 1,100 | | | | 7,280 | |
BRF S.A. | | | 315 | | | | 8,198 | |
Cia Brasileira de Distribuicao–Preference Shares | | | 163 | | | | 6,834 | |
Cielo S.A. | | | 408 | | | | 6,700 | |
Grupo BTG Pactual(b) | | | 400 | | | | 5,061 | |
Hypermarcas S.A.(a) | | | 975 | | | | 6,811 | |
Itausa-Investimentos Itau S.A.–Preference Shares | | | 1,515 | | | | 6,047 | |
Lojas Americanas S.A.–Preference Shares | | | 1,032 | | | | 6,089 | |
M Dias Branco S.A. | | | 163 | | | | 6,338 | |
Multiplan Empreendimentos Imobiliarios S.A. | | | 338 | | | | 6,990 | |
Tractebel Energia S.A. | | | 455 | | | | 6,197 | |
Transmissora Alianca de Energia Eletrica S.A.(c) | | | 705 | | | | 5,235 | |
Ultrapar Participacoes S.A. | | | 350 | | | | 7,634 | |
WEG S.A. | | | 680 | | | | 8,021 | |
| | | | | 93,435 | |
|
| Chile–0.33% | |
Banco de Chile | | | 70,602 | | | | 8,674 | |
Banco Santander Chile | | | 123,690 | | | | 6,570 | |
Empresa Nacional de Electricidad S.A. | | | 4,994 | | | | 7,735 | |
Empresas COPEC S.A. | | | 610 | | | | 7,395 | |
See accompanying Notes to Financial Statements which are an integral part of the financial statements.
9 Invesco Macro Long/Short Fund
| | | | | | | | |
| | | Shares | | | Value | |
| Chile–(continued) | |
Enersis S.A. | | | 23,575 | | | $ | 7,460 | |
S.A.C.I. Falabella | | | 960 | | | | 7,237 | |
| | | | | 45,071 | |
|
| China–1.55% | |
AAC Technologies Holdings Inc. | | | 1,784 | | | | 10,861 | |
Agricultural Bank of China Ltd.–Class H | | | 15,000 | | | | 6,963 | |
Bank of China Ltd.–Class H | | | 18,000 | | | | 8,604 | |
Bank of Communications Co. Ltd.–Class H | | | 10,000 | | | | 7,572 | |
Belle International Holdings Ltd. | | | 10,000 | | | | 12,727 | |
China Construction Bank Corp.–Class H | | | 11,000 | | | | 8,199 | |
China Mobile Ltd. | | | 375 | | | | 4,666 | |
CNOOC Ltd. | | | 3,000 | | | | 4,696 | |
ENN Energy Holdings Ltd. | | | 1,167 | | | | 7,569 | |
Evergrande Real Estate Group Ltd. | | | 28,704 | | | | 11,107 | |
GCL-Poly Energy Holdings Ltd.(a) | | | 29,555 | | | | 9,985 | |
Hengan International Group Co. Ltd. | | | 1,817 | | | | 19,350 | |
Industrial and Commercial Bank of China Ltd.–Class H | | | 12,000 | | | | 7,938 | |
Kunlun Energy Co. Ltd. | | | 4,000 | | | | 5,376 | |
People’s Insurance Co. (Group) of China Ltd.–Class H | | | 15,737 | | | | 6,798 | |
PetroChina Co. Ltd.–Class H | | | 6,000 | | | | 7,541 | |
Shanghai Industrial Holdings Ltd. | | | 2,217 | | | | 6,833 | |
Shimao Property Holdings Ltd. | | | 5,609 | | | | 12,064 | |
SOHO China Ltd. | | | 8,500 | | | | 6,237 | |
Sun Art Retail Group Ltd. | | | 10,000 | | | | 10,725 | |
Tencent Holdings Ltd. | | | 748 | | | | 11,922 | |
Tingyi (Cayman Islands) Holding Corp. | | | 5,034 | | | | 12,632 | |
Want Want China Holdings Ltd. | | | 9,068 | | | | 12,531 | |
| | | | | 212,896 | |
|
| Colombia–0.11% | |
Bancolombia S.A.–Preference Shares | | | 522 | | | | 7,337 | |
Grupo de Inversiones Suramericana S.A. | | | 376 | | | | 7,817 | |
| | | | | 15,154 | |
|
| Czech Republic–0.09% | |
Komercni Banka A.S. | | | 30 | | | | 6,426 | |
O2 Czech Republic A.S. | | | 549 | | | | 6,133 | |
| | | | | 12,559 | |
|
| Denmark–0.41% | |
A. P. Moller-Maersk A/S–Class B | | | 4 | | | | 9,320 | |
Carlsberg A/S–Class B | | | 103 | | | | 9,069 | |
Coloplast A/S–Class B | | | 115 | | | | 10,021 | |
Danske Bank A/S | | | 368 | | | | 10,104 | |
Novo Nordisk A/S–Class B | | | 210 | | | | 9,491 | |
Vestas Wind Systems A/S(a) | | | 255 | | | | 8,535 | |
| | | | | 56,540 | |
|
| Finland–0.37% | |
Fortum Oyj | | | 289 | | | | 6,704 | |
Kone Oyj–Class B | | | 178 | | | | 7,661 | |
| | | | | | | | |
| | | Shares | | | Value | |
| Finland–(continued) | |
Nokia Oyj | | | 854 | | | $ | 7,127 | |
Sampo Oyj–Class A | | | 147 | | | | 7,042 | |
Stora Enso Oyj–Class R | | | 882 | | | | 7,283 | |
UPM-Kymmene Oyj | | | 498 | | | | 7,893 | |
Wartsila OYJ Abp | | | 153 | | | | 7,086 | |
| | | | | 50,796 | |
|
| France–2.44% | |
Accor S.A. | | | 159 | | | | 6,688 | |
Air Liquide S.A. | | | 58 | | | | 7,006 | |
Airbus Group N.V. | | | 114 | | | | 6,824 | |
Alcatel-Lucent(a) | | | 2,180 | | | | 6,705 | |
Alstom S.A.(a) | | | 204 | | | | 7,111 | |
Arkema S.A. | | | 101 | | | | 6,245 | |
AXA S.A. | | | 293 | | | | 6,770 | |
BNP Paribas S.A. | | | 112 | | | | 7,062 | |
Bouygues S.A. | | | 217 | | | | 7,513 | |
Bureau Veritas S.A. | | | 321 | | | | 7,954 | |
Cap Gemini S.A. | | | 107 | | | | 7,048 | |
Carrefour S.A. | | | 218 | | | | 6,390 | |
Casino Guichard-Perrachon S.A. | | | 62 | | | | 6,373 | |
Christian Dior S.A. | | | 40 | | | | 7,089 | |
Cie Generale des Etablissements Michelin | | | 73 | | | | 6,348 | |
Compagnie de Saint-Gobain | | | 155 | | | | 6,666 | |
Credit Agricole S.A. | | | 513 | | | | 7,618 | |
Danone | | | 104 | | | | 7,066 | |
Dassault Systemes | | | 118 | | | | 7,478 | |
Edenred | | | 263 | | | | 7,295 | |
Electricite de France S.A. | | | 237 | | | | 7,006 | |
Essilor International S.A. | | | 69 | | | | 7,628 | |
GDF Suez | | | 294 | | | | 7,137 | |
Kering | | | 37 | | | | 7,155 | |
L’Oreal S.A. | | | 43 | | | | 6,756 | |
Lafarge S.A. | | | 103 | | | | 7,164 | |
Legrand S.A. | | | 127 | | | | 6,841 | |
LVMH Moet Hennessy Louis Vuitton S.A. | | | 40 | | | | 6,801 | |
Orange S.A. | | | 508 | | | | 8,084 | |
Pernod Ricard S.A. | | | 64 | | | | 7,299 | |
Publicis Groupe S.A. | | | 102 | | | | 7,078 | |
Renault S.A. | | | 98 | | | | 7,300 | |
Safran S.A. | | | 116 | | | | 7,364 | |
Sanofi | | | 70 | | | | 6,484 | |
Schneider Electric S.E. | | | 93 | | | | 7,362 | |
SCOR S.E. | | | 227 | | | | 6,964 | |
Societe Generale S.A. | | | 140 | | | | 6,773 | |
Sodexo | | | 75 | | | | 7,224 | |
Suez Environnement Co. | | | 430 | | | | 7,247 | |
Technip S.A. | | | 89 | | | | 6,455 | |
Total S.A. | | | 116 | | | | 6,922 | |
Unibail-Rodamco S.E. | | | 28 | | | | 7,183 | |
Valeo S.A. | | | 57 | | | | 6,406 | |
Vallourec S.A. | | | 157 | | | | 5,781 | |
See accompanying Notes to Financial Statements which are an integral part of the financial statements.
10 Invesco Macro Long/Short Fund
| | | | | | | | |
| | | Shares | | | Value | |
| France–(continued) | |
Veolia Environnement S.A. | | | 397 | | | $ | 6,646 | |
Vinci S.A. | | | 126 | | | | 7,210 | |
Vivendi S.A. | | | 300 | | | | 7,339 | |
Zodiac Aerospace | | | 226 | | | | 6,892 | |
| �� | | | | 335,750 | |
|
| Germany–1.76% | |
adidas AG | | | 94 | | | | 6,838 | |
Allianz S.E. | | | 42 | | | | 6,668 | |
BASF S.E. | | | 75 | | | | 6,601 | |
Bayer AG | | | 53 | | | | 7,535 | |
Bayerische Motoren Werke AG | | | 60 | | | | 6,419 | |
Beiersdorf AG | | | 81 | | | | 6,553 | |
Brenntag AG | | | 147 | | | | 7,118 | |
Commerzbank AG(a) | | | 476 | | | | 7,167 | |
Continental AG | | | 33 | | | | 6,478 | |
Daimler AG | | | 91 | | | | 7,073 | |
Deutsche Bank AG | | | 212 | | | | 6,609 | |
Deutsche Boerse AG | | | 103 | | | | 7,035 | |
Deutsche Lufthansa AG | | | 443 | | | | 6,545 | |
Deutsche Post AG | | | 221 | | | | 6,939 | |
Deutsche Telekom AG | | | 452 | | | | 6,808 | |
E.ON S.E. | | | 400 | | | | 6,882 | |
Fresenius Medical Care AG & Co. KGaA | | | 107 | | | | 7,844 | |
Fresenius S.E. & Co. KGaA | | | 159 | | | | 8,179 | |
GEA Group AG | | | 173 | | | | 7,964 | |
HeidelbergCement AG | | | 106 | | | | 7,215 | |
Henkel AG & Co. KGaA–Preference Shares | | | 69 | | | | 6,812 | |
Infineon Technologies AG | | | 653 | | | | 6,334 | |
K+S AG | | | 234 | | | | 6,529 | |
LANXESS AG | | | 113 | | | | 5,874 | |
Linde AG | | | 37 | | | | 6,822 | |
Merck KGaA | | | 86 | | | | 7,767 | |
Metro AG(a) | | | 217 | | | | 6,912 | |
Muenchener Rueckversicherungs–Gesellschaft AG | | | 37 | | | | 7,272 | |
Porsche Automobil Holding S.E.–Preference Shares | | | 85 | | | | 6,964 | |
ProSiebenSat.1 Media AG | | | 165 | | | | 6,656 | |
RWE AG | | | 181 | | | | 6,410 | |
SAP S.E. | | | 100 | | | | 6,797 | |
Siemens AG | | | 60 | | | | 6,760 | |
ThyssenKrupp AG(a) | | | 279 | | | | 6,704 | |
Volkswagen AG–Preference Shares | | | 33 | | | | 7,037 | |
| | | | | 242,120 | |
|
| Greece–0.04% | |
National Bank of Greece S.A.(a) | | | 2,376 | | | | 5,717 | |
|
| Hong Kong–3.72% | |
AIA Group Ltd. | | | 2,000 | | | | 11,154 | |
ASM Pacific Technology Ltd. | | | 1,100 | | | | 12,099 | |
Bank of East Asia, Ltd. (The) | | | 2,800 | | | | 11,698 | |
Cheung Kong (Holdings) Ltd. | | | 1,000 | | | | 17,719 | |
| | | | | | | | |
| | | Shares | | | Value | |
| Hong Kong–(continued) | |
Cheung Kong Infrastructure Holdings Ltd. | | | 2,000 | | | $ | 14,597 | |
China Gas Holdings Ltd. | | | 6,000 | | | | 10,953 | |
CLP Holdings Ltd. | | | 1,500 | | | | 12,911 | |
Dairy Farm International Holdings Ltd. | | | 900 | | | | 8,655 | |
Esprit Holdings Ltd. | | | 7,300 | | | | 9,225 | |
First Pacific Co. Ltd. | | | 10,000 | | | | 10,793 | |
Galaxy Entertainment Group Ltd. | | | 2,000 | | | | 13,655 | |
Hang Lung Group Ltd. | | | 2,000 | | | | 10,058 | |
Hang Lung Properties Ltd. | | | 4,000 | | | | 12,482 | |
Hang Seng Bank Ltd. | | | 700 | | | | 11,861 | |
Henderson Land Development Co. Ltd. | | | 2,100 | | | | 14,203 | |
HKT Trust and HKT Ltd. | | | 9,000 | | | | 10,967 | |
Hong Kong & China Gas Co. Ltd. | | | 5,400 | | | | 12,603 | |
Hong Kong Exchanges & Clearing Ltd. | | | 500 | | | | 11,071 | |
Hongkong Land Holdings Ltd. | | | 2,000 | | | | 13,940 | |
Hutchison Whampoa Ltd. | | | 1,000 | | | | 12,675 | |
Hysan Development Co. Ltd. | | | 2,000 | | | | 9,117 | |
Jardine Strategic Holdings Ltd. | | | 500 | | | | 17,815 | |
Kerry Properties Ltd. | | | 3,500 | | | | 12,111 | |
Li & Fung Ltd. | | | 10,000 | | | | 12,248 | |
Link REIT (The) | | | 2,000 | | | | 11,747 | |
MTR Corp. Ltd. | | | 3,000 | | | | 12,291 | |
New World Development Co. Ltd. | | | 9,000 | | | | 11,303 | |
Noble Group Ltd. | | | 10,000 | | | | 9,330 | |
NWS Holdings Ltd. | | | 6,000 | | | | 11,370 | |
Power Assets Holdings Ltd. | | | 1,500 | | | | 14,478 | |
Sands China Ltd. | | | 2,000 | | | | 12,456 | |
Shangri-La Asia Ltd. | | | 8,000 | | | | 11,616 | |
Sino Land Co. Ltd. | | | 6,000 | | | | 9,919 | |
SJM Holdings Ltd. | | | 5,000 | | | | 10,561 | |
Sun Hung Kai Properties Ltd. | | | 1,000 | | | | 14,906 | |
Swire Pacific Ltd.–Class A | | | 1,000 | | | | 13,114 | |
Swire Properties Ltd. | | | 3,600 | | | | 11,536 | |
Techtronic Industries Co. Ltd. | | | 4,000 | | | | 12,508 | |
VTech Holdings Ltd. | | | 1,000 | | | | 12,521 | |
Wharf Holdings Ltd. (The) | | | 2,000 | | | | 14,762 | |
Wheelock and Co. Ltd. | | | 2,000 | | | | 9,736 | |
Yue Yuen Industrial (Holdings) Ltd. | | | 4,000 | | | | 13,485 | |
| | | | | 512,249 | |
|
| Hungary–0.05% | |
MOL Hungarian Oil and Gas PLC | | | 134 | | | | 6,385 | |
|
| Indonesia–0.14% | |
Golden Agri-Resources Ltd. | | | 29,000 | | | | 11,812 | |
PT Trada Maritime Tbk(a) | | | 59,000 | | | | 8,107 | |
| | | | | 19,919 | |
|
| Ireland–0.29% | |
CRH PLC | | | 324 | | | | 7,194 | |
Kerry Group PLC–Class A | | | 104 | | | | 7,062 | |
Shire PLC | | | 382 | | | | 25,441 | |
| | | | | 39,697 | |
See accompanying Notes to Financial Statements which are an integral part of the financial statements.
11 Invesco Macro Long/Short Fund
| | | | | | | | |
| | | Shares | | | Value | |
| Italy–0.67% | |
Assicurazioni Generali S.p.A. | | | 327 | | | $ | 6,702 | |
Atlantia S.p.A. | | | 294 | | | | 6,926 | |
Enel S.p.A. | | | 1,396 | | | | 7,129 | |
Eni S.p.A. | | | 297 | | | | 6,327 | |
Intesa Sanpaolo S.p.A. | | | 2,454 | | | | 7,204 | |
Luxottica Group S.p.A. | | | 135 | | | | 6,873 | |
Prada S.p.A. | | | 1,700 | | | | 10,594 | |
Saipem S.p.A.(a) | | | 349 | | | | 5,475 | |
Snam S.p.A. | | | 1,308 | | | | 7,073 | |
Telecom Italia S.p.A.(a) | | | 6,173 | | | | 6,981 | |
Terna-Rete Elettrica Nazionale S.p.A. | | | 1,484 | | | | 7,481 | |
UniCredit S.p.A. | | | 880 | | | | 6,363 | |
Unione di Banche Italiane S.C.p.A. | | | 841 | | | | 6,595 | |
| | | | | 91,723 | |
|
| Japan–11.79% | |
Aeon Co., Ltd. | | | 700 | | | | 7,047 | |
Aisin Seiki Co., Ltd. | | | 200 | | | | 6,707 | |
Amada Co., Ltd. | | | 800 | | | | 7,133 | |
ANA Holdings Inc. | | | 3,000 | | | | 7,187 | |
Aozora Bank, Ltd. | | | 2,000 | | | | 7,140 | |
Asahi Glass Co., Ltd. | | | 1,000 | | | | 5,275 | |
Asahi Group Holdings, Ltd. | | | 200 | | | | 6,261 | |
Asahi Kasei Corp. | | | 1,000 | | | | 8,308 | |
ASICS Corp. | | | 300 | | | | 6,908 | |
Astellas Pharma Inc. | | | 400 | | | | 6,319 | |
Bank of Kyoto, Ltd. (The) | | | 1,000 | | | | 8,752 | |
Bank of Yokohama, Ltd. (The) | | | 1,000 | | | | 5,833 | |
Benesse Holdings, Inc. | | | 200 | | | | 6,344 | |
Bridgestone Corp. | | | 200 | | | | 6,685 | |
Brother Industries, Ltd. | | | 300 | | | | 5,493 | |
Canon Inc. | | | 200 | | | | 6,160 | |
Casio Computer Co., Ltd. | | | 500 | | | | 8,052 | |
Chiba Bank, Ltd. (The) | | | 1,000 | | | | 7,158 | |
Chubu Electric Power Co., Inc.(a) | | | 600 | | | | 7,230 | |
Chugai Pharmaceutical Co., Ltd. | | | 200 | | | | 6,081 | |
Chugoku Bank, Ltd. (The) | | | 400 | | | | 6,023 | |
Chugoku Electric Power Co., Inc. (The) | | | 600 | | | | 8,013 | |
Credit Saison Co., Ltd. | | | 300 | | | | 6,383 | |
Dai Nippon Printing Co., Ltd. | | | 1,000 | | | | 9,969 | |
Dai-ichi Life Insurance Co. Ltd. (The) | | | 400 | | | | 6,088 | |
Daihatsu Motor Co., Ltd. | | | 400 | | | | 5,577 | |
Daiichi Sankyo Co., Ltd. | | | 500 | | | | 7,564 | |
Daikin Industries, Ltd. | | | 100 | | | | 6,297 | |
Daito Trust Construction Co., Ltd. | | | 100 | | | | 12,630 | |
Daiwa House Industry Co., Ltd. | | | 500 | | | | 9,637 | |
Daiwa Securities Group Inc. | | | 1,000 | | | | 7,972 | |
Denso Corp. | | | 100 | | | | 4,658 | |
Dentsu Inc. | | | 200 | | | | 7,496 | |
East Japan Railway Co. | | | 100 | | | | 7,909 | |
Eisai Co., Ltd. | | | 200 | | | | 7,836 | |
Electric Power Development Co., Ltd. | | | 200 | | | | 6,919 | |
| | | | | | | | |
| | | Shares | | | Value | |
| Japan–(continued) | |
FamilyMart Co., Ltd. | | | 200 | | | $ | 8,019 | |
Fuji Heavy Industries Ltd. | | | 200 | | | | 6,787 | |
Fuji Media Holdings, Inc. | | | 400 | | | | 5,456 | |
FUJIFILM Holdings Corp. | | | 200 | | | | 6,566 | |
Fujitsu Ltd. | | | 1,000 | | | | 6,121 | |
Fukuoka Financial Group, Inc. | | | 1,000 | | | | 5,192 | |
GungHo Online Entertainment, Inc. | | | 1,300 | | | | 5,328 | |
Gunma Bank, Ltd. (The) | | | 1,000 | | | | 6,333 | |
Hachijuni Bank, Ltd. (The) | | | 1,000 | | | | 6,218 | |
Hamamatsu Photonics K. K. | | | 100 | | | | 4,627 | |
Hankyu Hanshin Holdings, Inc. | | | 1,000 | | | | 6,023 | |
Hino Motors, Ltd. | | | 400 | | | | 5,879 | |
Hiroshima Bank, Ltd. (The) | | | 1,000 | | | | 5,075 | |
Hisamitsu Pharmaceutical Co., Inc. | | | 200 | | | | 6,762 | |
Hitachi, Ltd. | | | 1,000 | | | | 8,030 | |
Hokuhoku Financial Group, Inc. | | | 3,000 | | | | 5,955 | |
Hokuriku Electric Power Co. | | | 600 | | | | 8,175 | |
Honda Motor Co., Ltd. | | | 200 | | | | 6,364 | |
Hoya Corp. | | | 200 | | | | 7,313 | |
Hulic Co. Ltd. | | | 700 | | | | 7,819 | |
Idemitsu Kosan Co., Ltd. | | | 300 | | | | 5,940 | |
IHI Corp. | | | 1,000 | | | | 4,938 | |
INPEX Corp. | | | 600 | | | | 7,691 | |
Isetan Mitsukoshi Holdings Ltd. | | | 600 | | | | 8,251 | |
Isuzu Motors Ltd. | | | 600 | | | | 8,031 | |
ITOCHU Corp. | | | 600 | | | | 7,347 | |
Iyo Bank, Ltd. (The) | | | 700 | | | | 7,582 | |
J. Front Retailing Co., Ltd. | | | 600 | | | | 8,048 | |
Japan Airlines Co. Ltd. | | | 200 | | | | 5,330 | |
Japan Exchange Group Inc. | | | 300 | | | | 7,525 | |
Japan Prime Realty Investment Corp. | | | 2 | | | | 7,412 | |
Japan Real Estate Investment Corp. | | | 1 | | | | 5,414 | |
Japan Retail Fund Investment Corp. | | | 3 | | | | 6,028 | |
Japan Tobacco, Inc. | | | 200 | | | | 6,930 | |
JFE Holdings, Inc. | | | 300 | | | | 6,008 | |
Joyo Bank, Ltd. (The) | | | 1,000 | | | | 5,434 | |
JSR Corp. | | | 500 | | | | 9,114 | |
JTEKT Corp. | | | 500 | | | | 8,099 | |
JX Holdings, Inc. | | | 1,400 | | | | 6,082 | |
Kajima Corp. | | | 1,000 | | | | 4,544 | |
Kansai Electric Power Co., Inc. (The)(a) | | | 800 | | | | 7,978 | |
Kao Corp. | | | 200 | | | | 7,673 | |
Kawasaki Heavy Industries, Ltd. | | | 2,000 | | | | 7,941 | |
KDDI Corp. | | | 100 | | | | 6,443 | |
Keikyu Corp. | | | 1,000 | | | | 8,407 | |
Keio Corp. | | | 1,000 | | | | 7,700 | |
Keisei Electric Railway Co., Ltd. | | | 1,000 | | | | 11,900 | |
Kintetsu Corp. | | | 2,000 | | | | 7,017 | |
Kirin Holdings Co., Ltd. | | | 600 | | | | 7,844 | |
Kobe Steel, Ltd. | | | 5,000 | | | | 8,052 | |
Komatsu Ltd. | | | 300 | | | | 7,210 | |
Konica Minolta Inc. | | | 600 | | | | 6,791 | |
See accompanying Notes to Financial Statements which are an integral part of the financial statements.
12 Invesco Macro Long/Short Fund
| | | | | | | | |
| | | Shares | | | Value | |
| Japan–(continued) | |
Kuraray Co., Ltd. | | | 600 | | | $ | 7,044 | |
Kurita Water Industries Ltd. | | | 300 | | | | 6,472 | |
Kyocera Corp. | | | 100 | | | | 4,693 | |
Kyowa Hakko Kirin Co., Ltd. | | | 1,000 | | | | 11,712 | |
Kyushu Electric Power Co. Inc.(a) | | | 700 | | | | 7,661 | |
Lawson, Inc. | | | 100 | | | | 6,838 | |
LIXIL Group Corp. | | | 300 | | | | 6,623 | |
Makita Corp. | | | 100 | | | | 5,859 | |
Marubeni Corp. | | | 1,000 | | | | 6,503 | |
Marui Group Co., Ltd. | | | 900 | | | | 7,681 | |
Mazda Motor Corp. | | | 300 | | | | 7,209 | |
Medipal Holdings Corp. | | | 600 | | | | 6,764 | |
MEIJI Holdings Co., Ltd. | | | 100 | | | | 8,524 | |
Mitsubishi Chemical Holdings Corp. | | | 1,500 | | | | 7,519 | |
Mitsubishi Corp. | | | 300 | | | | 5,982 | |
Mitsubishi Gas Chemical Co., Inc. | | | 1,000 | | | | 6,026 | |
Mitsubishi Heavy Industries, Ltd. | | | 1,000 | | | | 6,351 | |
Mitsubishi Materials Corp. | | | 2,000 | | | | 6,358 | |
Mitsubishi Motors Corp. | | | 600 | | | | 6,317 | |
Mitsubishi Tanabe Pharma Corp. | | | 400 | | | | 6,152 | |
Mitsubishi UFJ Financial Group, Inc. | | | 1,200 | | | | 7,156 | |
Mitsui & Co., Ltd. | | | 400 | | | | 6,129 | |
Mitsui Chemicals Inc. | | | 2,000 | | | | 5,926 | �� |
Mitsui O.S.K. Lines, Ltd. | | | 2,000 | | | | 6,365 | |
Mizuho Financial Group, Inc. | | | 3,400 | | | | 6,196 | |
MS&AD Insurance Group Holdings, Inc. | | | 300 | | | | 6,584 | |
Murata Manufacturing Co., Ltd. | | | 100 | | | | 11,374 | |
Nagoya Railroad Co., Ltd. | | | 2,000 | | | | 8,777 | |
Namco Bandai Holdings Inc. | | | 200 | | | | 4,948 | |
NEC Corp. | | | 2,000 | | | | 7,212 | |
NGK Spark Plug Co., Ltd. | | | 200 | | | | 5,307 | |
Nidec Corp. | | | 100 | | | | 6,572 | |
Nikon Corp. | | | 400 | | | | 5,487 | |
Nintendo Co., Ltd. | | | 100 | | | | 10,879 | |
Nippon Building Fund Inc. | | | 1 | | | | 5,548 | |
Nippon Express Co., Ltd. | | | 1,000 | | | | 4,447 | |
Nippon Prologis REIT Inc. | | | 3 | | | | 6,925 | |
Nippon Steel & Sumitomo Metal Corp. | | | 2,000 | | | | 5,365 | |
Nippon Telegraph & Telephone Corp. | | | 100 | | | | 6,248 | |
Nippon Television Holdings, Inc. | | | 400 | | | | 6,124 | |
Nippon Yusen Kabushiki Kaisha | | | 2,000 | | | | 5,280 | |
Nissan Motor Co., Ltd. | | | 700 | | | | 6,480 | |
Nisshin Seifun Group Inc. | | | 600 | | | | 5,990 | |
Nissin Foods Holdings Co., Ltd. | | | 100 | | | | 5,345 | |
Nitori Holdings Co., Ltd. | | | 100 | | | | 6,437 | |
Nitto Denko Corp. | | | 100 | | | | 5,512 | |
NKSJ Holdings, Inc. | | | 300 | | | | 7,699 | |
Nomura Holdings, Inc. | | | 1,100 | | | | 6,898 | |
Nomura Research Institute, Ltd. | | | 200 | | | | 6,658 | |
NTT Data Corp. | | | 200 | | | | 7,865 | |
NTT DoCoMo, Inc. | | | 500 | | | | 8,385 | |
| | | | | | | | |
| | | Shares | | | Value | |
| Japan–(continued) | |
Obayashi Corp. | | | 1,000 | | | $ | 7,032 | |
Odakyu Electric Railway Co., Ltd. | | | 1,000 | | | | 9,505 | |
Oji Holdings Corp. | | | 2,000 | | | | 7,220 | |
Olympus Corp.(a) | | | 200 | | | | 7,314 | |
OMRON Corp. | | | 100 | | | | 4,852 | |
Ono Pharmaceutical Co. Ltd. | | | 100 | | | | 10,251 | |
ORIX Corp. | | | 400 | | | | 5,601 | |
Osaka Gas Co., Ltd. | | | 2,000 | | | | 8,061 | |
Otsuka Holdings Co., Ltd. | | | 200 | | | | 7,171 | |
Panasonic Corp. | | | 600 | | | | 7,239 | |
Rakuten Inc. | | | 600 | | | | 6,861 | |
Renesas Electronics Corp.(a) | | | 800 | | | | 6,331 | |
Resona Holdings, Inc. | | | 1,200 | | | | 6,981 | |
Ricoh Co., Ltd. | | | 700 | | | | 7,422 | |
Rinnai Corp. | | | 100 | | | | 8,955 | |
Rohm Co. Ltd. | | | 100 | | | | 6,227 | |
Santen Pharmaceutical Co., Ltd. | | | 100 | | | | 6,003 | |
SECOM Co., Ltd. | | | 100 | | | | 6,200 | |
Sega Sammy Holdings Inc. | | | 500 | | | | 8,000 | |
Seiko Epson Corp. | | | 100 | | | | 4,736 | |
Sekisui Chemical Co., Ltd. | | | 1,000 | | | | 12,433 | |
Sekisui House, Ltd. | | | 600 | | | | 7,509 | |
Seven & I Holdings Co., Ltd. | | | 200 | | | | 7,898 | |
Sharp Corp.(a) | | | 2,000 | | | | 5,118 | |
Shikoku Electric Power Co. Inc.(a) | | | 600 | | | | 8,297 | |
Shimadzu Corp. | | | 1,000 | | | | 8,874 | |
Shimamura Co., Ltd. | | | 100 | | | | 8,834 | |
Shimano Inc. | | | 100 | | | | 13,443 | |
Shimizu Corp. | | | 1,000 | | | | 7,484 | |
Shin-Etsu Chemical Co., Ltd. | | | 100 | | | | 6,506 | |
Shinsei Bank, Ltd. | | | 3,000 | | | | 6,751 | |
Shionogi & Co., Ltd. | | | 300 | | | | 7,800 | |
Shiseido Co., Ltd. | | | 500 | | | | 8,364 | |
Shizuoka Bank, Ltd. (The) | | | 1,000 | | | | 10,460 | |
SoftBank Corp. | | | 100 | | | | 7,411 | |
Sony Corp. | | | 500 | | | | 10,076 | |
Sony Financial Holdings Inc. | | | 500 | | | | 8,071 | |
Stanley Electric Co., Ltd. | | | 300 | | | | 6,170 | |
Sumitomo Chemical Co., Ltd. | | | 2,000 | | | | 6,982 | |
Sumitomo Corp. | | | 600 | | | | 6,495 | |
Sumitomo Electric Industries, Ltd. | | | 400 | | | | 5,500 | |
Sumitomo Heavy Industries, Ltd. | | | 1,000 | | | | 5,651 | |
Sumitomo Mitsui Financial Group, Inc. | | | 200 | | | | 8,131 | |
Sumitomo Mitsui Trust Holdings, Inc. | | | 1,000 | | | | 4,124 | |
Suntory Beverage & Food Ltd. | | | 200 | | | | 7,209 | |
Suruga Bank Ltd. | | | 300 | | | | 6,338 | |
Suzuken Co., Ltd. | | | 200 | | | | 5,461 | |
Suzuki Motor Corp. | | | 200 | | | | 6,800 | |
Sysmex Corp. | | | 200 | | | | 8,798 | |
T&D Holdings, Inc. | | | 600 | | | | 7,845 | |
Taiheiyo Cement Corp. | | | 2,000 | | | | 7,351 | |
See accompanying Notes to Financial Statements which are an integral part of the financial statements.
13 Invesco Macro Long/Short Fund
| | | | | | | | |
| | | Shares | | | Value | |
| Japan–(continued) | |
Taisei Corp. | | | 1,000 | | | $ | 5,651 | |
Taisho Pharmaceutical Holdings Co. Ltd. | | | 100 | | | | 7,113 | |
Takashimaya Co., Ltd. | | | 1,000 | | | | 8,356 | |
Takeda Pharmaceutical Co. Ltd. | | | 100 | | | | 4,363 | |
TDK Corp. | | | 100 | | | | 5,770 | |
Teijin Ltd. | | | 3,000 | | | | 7,320 | |
Terumo Corp. | | | 300 | | | | 7,625 | |
THK Co., Ltd. | | | 300 | | | | 7,652 | |
Tobu Railway Co., Ltd. | | | 1,000 | | | | 5,112 | |
Toho Co., Ltd. | | | 300 | | | | 6,951 | |
Toho Gas Co., Ltd. | | | 1,000 | | | | 5,505 | |
Tohoku Electric Power Co., Inc. | | | 700 | | | | 8,854 | |
Tokio Marine Holdings, Inc. | | | 200 | | | | 6,482 | |
Tokyo Electric Power Co. Inc.(a) | | | 1,800 | | | | 6,537 | |
Tokyo Electron Ltd. | | | 100 | | | | 6,206 | |
Tokyo Gas Co., Ltd. | | | 1,000 | | | | 5,821 | |
Tokyo Tatemono Co., Ltd. | | | 1,000 | | | | 8,810 | |
Tokyu Corp. | | | 1,000 | | | | 6,674 | |
Tokyu Fudosan Holdings, Corp. | | | 1,000 | | | | 7,115 | |
TonenGeneral Sekiyu K.K. | | | 1,000 | | | | 8,816 | |
Toppan Printing Co. Ltd. | | | 1,000 | | | | 6,893 | |
Toray Industries, Inc. | | | 1,000 | | | | 6,773 | |
Toshiba Corp. | | | 1,000 | | | | 4,467 | |
TOTO Ltd. | | | 1,000 | | | | 11,296 | |
Toyo Seikan Group Holdings Ltd. | | | 600 | | | | 7,370 | |
Toyo Suisan Kaisha, Ltd. | | | 200 | | | | 6,912 | |
Toyota Industries Corp. | | | 100 | | | | 4,801 | |
Toyota Motor Corp. | | | 100 | | | | 6,016 | |
Toyota Tsusho Corp. | | | 300 | | | | 7,627 | |
Trend Micro Inc. | | | 200 | | | | 6,773 | |
Unicharm Corp. | | | 300 | | | | 7,027 | |
United Urban Investment Corp. | | | 5 | | | | 7,905 | |
West Japan Railway Co. | | | 100 | | | | 4,827 | |
Yahoo Japan Corp. | | | 1,700 | | | | 6,019 | |
Yakult Honsha Co., Ltd. | | | 100 | | | | 5,565 | |
Yamada Denki Co., Ltd. | | | 2,200 | | | | 7,070 | |
Yamaguchi Financial Group, Inc. | | | 1,000 | | | | 9,629 | |
Yamaha Motor Co. Ltd. | | | 300 | | | | 5,775 | |
Yamato Holdings Co., Ltd. | | | 300 | | | | 6,468 | |
Yaskawa Electric Corp. | | | 600 | | | | 7,859 | |
Yokogawa Electric Corp. | | | 600 | | | | 8,493 | |
| | | | | 1,622,640 | |
|
| Luxembourg–0.10% | |
ArcelorMittal S.A. | | | 516 | | | | 6,764 | |
Tenaris S.A. | | | 333 | | | | 6,588 | |
| | | | | 13,352 | |
|
| Macau–0.09% | |
Wynn Macau, Ltd. | | | 3,487 | | | | 12,825 | |
|
| Malaysia–2.24% | |
Alliance Financial Group Berhad | | | 5,100 | | | | 7,456 | |
AMMB Holdings Berhad | | | 6,623 | | | | 13,665 | |
| | | | | | | | |
| | | Shares | | | Value | |
| Malaysia–(continued) | |
Axiata Group Berhad | | | 9,768 | | | $ | 20,992 | |
British American Tobacco Malaysia Berhad | | | 412 | | | | 8,705 | |
Bumi Armada Berhad | | | 14,515 | | | | 6,928 | |
CIMB Group Holdings Berhad | | | 5,031 | | | | 9,949 | |
DiGi.Com Berhad | | | 6,000 | | | | 11,351 | |
Gamuda Berhad | | | 5,500 | | | | 8,561 | |
Genting Berhad | | | 3,131 | | | | 9,314 | |
Genting Malaysia Berhad | | | 5,500 | | | | 7,218 | |
Hap Seng Consolidated Berhad | | | 8,000 | | | | 10,682 | |
Hong Leong Bank Berhad | | | 3,100 | | | | 13,778 | |
IHH Healthcare Berhad | | | 6,221 | | | | 9,361 | |
IJM Corp. Berhad | | | 4,779 | | | | 10,065 | |
IOI Corp. Berhad | | | 5,700 | | | | 8,473 | |
Kuala Lumpur Kepong Berhad | | | 1,300 | | | | 9,090 | |
Malayan Banking Berhad | | | 4,919 | | | | 14,505 | |
Maxis Berhad | | | 7,181 | | | | 14,755 | |
MISC Berhad | | | 3,224 | | | | 6,771 | |
Petronas Chemicals Group Berhad | | | 6,000 | | | | 11,243 | |
Petronas Dagangan Berhad | | | 1,100 | | | | 6,841 | |
Petronas Gas Berhad | | | 1,200 | | | | 8,232 | |
Public Bank Berhad | | | 2,285 | | | | 12,894 | |
RHB Capital Berhad | | | 3,300 | | | | 8,828 | |
SapuraKencana Petroleum Berhad | | | 5,216 | | | | 5,445 | |
Sime Darby Berhad | | | 6,605 | | | | 19,467 | |
Telekom Malaysia Berhad | | | 4,791 | | | | 10,544 | |
Tenaga Nasional Berhad | | | 2,122 | | | | 8,618 | |
UMW Holdings Berhad | | | 2,307 | | | | 8,215 | |
YTL Corp. Berhad | | | 13,832 | | | | 6,980 | |
| | | | | 308,926 | |
|
| Mexico–0.44% | |
America Movil S.A.B. de C.V.–Series L | | | 5,440 | | | | 6,653 | |
Arca Continental S.A.B. de C.V. | | | 1,032 | | | | 6,644 | |
Cemex S.A.B. de C.V.–Series CPO(a)(d) | | | 5,134 | | | | 6,329 | |
Coca-Cola Femsa, S.A.B. de C.V.–Series L | | | 600 | | | | 6,354 | |
Fibra Uno Administracion S.A. de C.V. | | | 1,900 | | | | 6,595 | |
Fomento Economico Mexicano, S.A.B. de C.V. Series BD(e) | | | 800 | | | | 7,707 | |
Grupo Financiero Banorte S.A.B. de C.V.–Class O | | | 1,000 | | | | 6,409 | |
Grupo Televisa S.A.B.–Series CPO(f) | | | 1,000 | | | | 7,245 | |
Wal-Mart de Mexico S.A.B. de C.V.–Series V | | | 2,824 | | | | 6,549 | |
| | | | | 60,485 | |
|
| Netherlands–0.67% | |
Aegon N.V. | | | 871 | | | | 7,099 | |
Akzo Nobel N.V. | | | 103 | | | | 6,856 | |
ASML Holding N.V. | | | 74 | | | | 7,384 | |
Gemalto N.V. | | | 82 | | | | 6,269 | |
Heineken Holding N.V. | | | 114 | | | | 7,384 | |
Heineken N.V. | | | 107 | | | | 7,990 | |
Koninklijke Ahold N.V. | | | 417 | | | | 6,977 | |
Koninklijke DSM N.V. | | | 109 | | | | 6,834 | |
Koninklijke KPN N.V. | | | 2,331 | | | | 7,654 | |
See accompanying Notes to Financial Statements which are an integral part of the financial statements.
14 Invesco Macro Long/Short Fund
| | | | | | | | |
| | | Shares | | | Value | |
| Netherlands–(continued) | |
Koninklijke Philips N.V. | | | 248 | | | $ | 6,937 | |
Randstad Holding N.V. | | | 140 | | | | 6,183 | |
Reed Elsevier N.V. | | | 325 | | | | 7,488 | |
Wolters Kluwer N.V. | | | 259 | | | | 6,918 | |
| | | | | 91,973 | |
|
| New Zealand–0.25% | |
Auckland International Airport Ltd. | | | 3,825 | | | | 11,771 | |
Fletcher Building Ltd. | | | 1,617 | | | | 10,874 | |
Spark New Zealand Ltd. | | | 4,663 | | | | 11,497 | |
| | | | | 34,142 | |
|
| Norway–0.34% | |
DNB ASA | | | 560 | | | | 10,286 | |
Orkla ASA | | | 1,105 | | | | 8,444 | |
Statoil ASA | | | 359 | | | | 8,204 | |
Telenor ASA | | | 466 | | | | 10,473 | |
Yara International ASA | | | 210 | | | | 9,664 | |
| | | | | 47,071 | |
|
| Philippines–0.21% | |
Ayala Corp. | | | 430 | | | | 6,611 | |
Bank of the Philippine Islands | | | 3,300 | | | | 6,985 | |
BDO Unibank, Inc. | | | 3,190 | | | | 6,966 | |
Philippine Long Distance Telephone Co. | | | 115 | | | | 8,026 | |
| | | | | 28,588 | |
|
| Poland–0.05% | |
Powszechna Kasa Oszczednosci Bank Polski S.A. | | | 598 | | | | 6,646 | |
|
| Portugal–0.05% | |
Energias de Portugal, S.A. | | | 1,585 | | | | 6,833 | |
|
| Russia–0.13% | |
LUKOIL OAO–ADR | | | 119 | | | | 5,851 | |
Rosneft Oil Co.–REGS–GDR(g) | | | 1,057 | | | | 5,888 | |
Surgutneftegas OAO–ADR | | | 987 | | | | 6,503 | |
| | | | | 18,242 | |
|
| Singapore–1.76% | |
Ascendas REIT | | | 7,000 | | | | 12,203 | |
CapitaLand Ltd. | | | 4,000 | | | | 9,923 | |
CapitaMall Trust | | | 8,000 | | | | 12,308 | |
City Developments Ltd. | | | 2,000 | | | | 14,739 | |
ComfortDelGro Corp. Ltd. | | | 6,000 | | | | 12,329 | |
DBS Group Holdings Ltd. | | | 1,000 | | | | 14,449 | |
Genting Singapore PLC | | | 13,000 | | | | 11,130 | |
Global Logistic Properties Ltd. | | | 5,000 | | | | 10,725 | |
Keppel Corp. Ltd. | | | 1,000 | | | | 7,378 | |
Oversea-Chinese Banking Corp. Ltd. | | �� | 1,000 | | | | 7,698 | |
SembCorp Industries Ltd. | | | 3,000 | | | | 11,392 | |
SembCorp Marine Ltd. | | | 4,000 | | | | 11,332 | |
Singapore Airlines Ltd. | | | 1,000 | | | | 7,705 | |
Singapore Exchange Ltd. | | | 2,000 | | | | 10,917 | |
Singapore Press Holdings Ltd. | | | 4,000 | | | | 13,359 | |
| | | | | | | | |
| | | Shares | | | Value | |
| Singapore–(continued) | |
Singapore Technologies Engineering Ltd. | | | 4,000 | | | $ | 11,694 | |
Singapore Telecommunications Ltd. | | | 4,000 | | | | 11,768 | |
Suntec REIT | | | 8,000 | | | | 11,115 | |
United Overseas Bank Ltd. | | | 1,000 | | | | 17,945 | |
UOL Group Ltd. | | | 2,000 | | | | 10,061 | |
Wilmar International Ltd. | | | 5,000 | | | | 12,453 | |
| | | | | 242,623 | |
|
| South Africa–1.52% | |
Aspen Pharmacare Holdings Ltd. | | | 215 | | | | 7,672 | |
Barclays Africa Group Ltd. | | | 517 | | | | 8,166 | |
Bidvest Group Ltd. | | | 316 | | | | 8,694 | |
Coronation Fund Managers Ltd. | | | 719 | | | | 6,227 | |
Discovery Ltd. | | | 752 | | | | 6,843 | |
Exxaro Resources Ltd. | | | 564 | | | | 5,882 | |
FirstRand Ltd. | | | 1,762 | | | | 7,543 | |
Growthpoint Properties Ltd. | | | 3,814 | | | | 9,253 | |
Investec Ltd. | | | 755 | | | | 6,895 | |
Liberty Holdings Ltd. | | | 706 | | | | 8,173 | |
Mediclinic International Ltd. | | | 779 | | | | 6,959 | |
MMI Holdings Ltd. | | | 2,631 | | | | 6,726 | |
Mr. Price Group Ltd. | | | 359 | | | | 7,428 | |
MTN Group Ltd. | | | 323 | | | | 7,148 | |
Nedbank Group Ltd. | | | 351 | | | | 7,648 | |
Netcare Ltd. | | | 2,323 | | | | 7,026 | |
Rand Merchant Insurance Holdings Ltd. | | | 2,332 | | | | 8,316 | |
Redefine Properties Ltd. | | | 8,527 | | | | 7,736 | |
Remgro Ltd. | | | 335 | | | | 7,686 | |
Sanlam Ltd. | | | 1,079 | | | | 6,816 | |
Sasol Ltd. | | | 160 | | | | 7,996 | |
Shoprite Holdings Ltd. | | | 566 | | | | 8,202 | |
SPAR Group Ltd. (The) | | | 621 | | | | 7,265 | |
Standard Bank Group Ltd. | | | 616 | | | | 7,758 | |
Steinhoff International Holdings Ltd. | | | 1,413 | | | | 7,228 | |
Tiger Brands Ltd. | | | 236 | | | | 7,098 | |
Tsogo Sun Holdings Ltd. | | | 3,005 | | | | 7,549 | |
Vodacom Group Ltd. | | | 543 | | | | 6,591 | |
| | | | | 208,524 | |
|
| South Korea–1.24% | |
BS Financial Group Inc. | | | 404 | | | | 6,279 | |
Daewoo Securities Co., Ltd.(a) | | | 739 | | | | 7,759 | |
Dongbu Insurance Co., Ltd. | | | 120 | | | | 6,725 | |
GS Holdings | | | 218 | | | | 8,454 | |
Hankook Tire Co. Ltd. | | | 351 | | | | 7,116 | |
Hyundai Engineering & Construction Co. Ltd. | | | 115 | | | | 5,230 | |
Hyundai Marine & Fire Insurance Co., Ltd. | | | 285 | | | | 7,533 | |
Kia Motors Corp. | | | 115 | | | | 5,606 | |
Korea Investment Holdings Co., Ltd. | | | 151 | | | | 7,643 | |
KT Corp. | | | 203 | | | | 6,230 | |
KT&G Corp. | | | 81 | | | | 7,200 | |
Kumho Petrochemical Co., Ltd. | | | 92 | | | | 6,643 | |
See accompanying Notes to Financial Statements which are an integral part of the financial statements.
15 Invesco Macro Long/Short Fund
| | | | | | | | |
| | | Shares | | | Value | |
| South Korea–(continued) | |
LG Chem Ltd. | | | 27 | | | $ | 5,023 | |
LG Corp. | | | 114 | | | | 6,784 | |
LG Electronics Inc. | | | 104 | | | | 6,354 | |
POSCO | | | 25 | | | | 7,185 | |
S-Oil Corp. | | | 217 | | | | 8,231 | |
Samsung Card Co., Ltd. | | | 149 | | | | 6,413 | |
Samsung Electro-Mechanics Co., Ltd. | | | 133 | | | | 6,040 | |
Samsung Electronics Co., Ltd. | | | 6 | | | | 6,950 | |
Samsung Fire & Marine Insurance Co., Ltd. | | | 26 | | | | 7,006 | |
Samsung Life Insurance Co., Ltd. | | | 72 | | | | 7,856 | |
Samsung Securities Co., Ltd. | | | 150 | | | | 6,717 | |
Samsung Techwin Co., Ltd. | | | 226 | | | | 6,905 | |
Woori Investment & Securities Co., Ltd. | | | 619 | | | | 6,788 | |
| | | | | 170,670 | |
|
| Spain–0.87% | |
Abertis Infraestructuras S.A. | | | 346 | | | | 7,208 | |
Amadeus IT Holding S.A.–Class A | | | 202 | | | | 7,431 | |
Banco Bilbao Vizcaya Argentaria, S.A. | | | 595 | | | | 6,653 | |
Banco de Sabadell S.A. | | | 2,274 | | | | 6,574 | |
Banco Popular Espanol S.A. | | | 1,088 | | | | 6,242 | |
Banco Santander S.A.(a) | | | 729 | | | | 6,432 | |
Bankia S.A.(a) | | | 3,893 | | | | 6,973 | |
CaixaBank S.A. | | | 1,224 | | | | 6,689 | |
Enagas S.A. | | | 230 | | | | 7,724 | |
Ferrovial S.A. | | | 365 | | | | 7,468 | |
Gas Natural SDG, S.A. | | | 262 | | | | 7,570 | |
Grifols S.A. | | | 176 | | | | 7,170 | |
Iberdrola S.A. | | | 1,041 | | | | 7,364 | |
Industria de Diseno Textil, S.A. | | | 259 | | | | 7,293 | |
Red Electrica Corp. S.A. | | | 87 | | | | 7,604 | |
Repsol S.A. | | | 288 | | | | 6,441 | |
Telefonica S.A. | | | 464 | | | | 6,974 | |
| | | | | 119,810 | |
|
| Sweden–1.23% | |
Assa Abloy AB–Class B | | | 196 | | | | 10,423 | |
Atlas Copco AB–Class A | | | 355 | | | | 10,256 | |
Hennes & Mauritz AB–Class B | | | 243 | | | | 9,674 | |
Hexagon AB–Class B | | | 325 | | | | 10,937 | |
Investor AB–Class B | | | 290 | | | | 10,375 | |
Nordea Bank AB | | | 740 | | | | 9,490 | |
Sandvik AB | | | 875 | | | | 9,621 | |
Skandinaviska Enskilda Banken AB–Class A | | | 780 | | | | 10,008 | |
Skanska AB–Class B | | | 501 | | | | 10,231 | |
SKF AB–Class B | | | 462 | | | | 9,273 | |
Svenska Cellulosa AB–Class B | | | 414 | | | | 9,280 | |
Svenska Handelsbanken AB–Class A | | | 214 | | | | 10,204 | |
Swedbank AB–Class A | | | 396 | | | | 10,473 | |
Swedish Match AB | | | 312 | | | | 10,144 | |
Telefonaktiebolaget LM Ericsson–Class B | | | 774 | | | | 9,151 | |
TeliaSonera AB | | | 1,431 | | | | 9,919 | |
| | | | | | | | |
| | | Shares | | | Value | |
| Sweden–(continued) | |
Volvo AB–Class B | | | 887 | | | $ | 10,240 | |
| | | | | 169,699 | |
|
| Switzerland–1.89% | |
ABB Ltd. | | | 449 | | | | 9,846 | �� |
Actelion Ltd. | | | 82 | | | | 9,735 | |
Adecco S.A | | | 141 | | | | 9,553 | |
Cie Financiere Richemont S.A. | | | 117 | | | | 9,857 | |
Credit Suisse Group AG | | | 349 | | | | 9,296 | |
Geberit AG | | | 29 | | | | 9,894 | |
Givaudan S.A. | | | 6 | | | | 10,011 | |
Glencore PLC | | | 5,617 | | | | 28,802 | |
Holcim Ltd. | | | 136 | | | | 9,643 | |
Julius Baer Group Ltd. | | | 227 | | | | 9,945 | |
Kuehne + Nagel International AG | | | 77 | | | | 10,032 | |
Nestle S.A. | | | 134 | | | | 9,804 | |
Novartis AG | | | 109 | | | | 10,109 | |
Roche Holding AG | | | 35 | | | | 10,337 | |
Schindler Holding AG–Participation Ctfs. | | | 69 | | | | 9,654 | |
SGS S.A. | | | 5 | | | | 10,986 | |
Sika AG | | | 3 | | | | 10,720 | |
STMicroelectronics N.V. | | | 946 | | | | 6,331 | |
Swatch Group AG (The) | | | 20 | | | | 9,481 | |
Swiss Re AG | | | 120 | | | | 9,704 | |
Swisscom AG | | | 18 | | | | 10,609 | |
Syngenta AG | | | 31 | | | | 9,607 | |
TE Connectivity Ltd. | | | 109 | | | | 6,663 | |
UBS AG | | | 546 | | | | 9,489 | |
Zurich Insurance Group AG | | | 35 | | | | 10,592 | |
| | | | | 260,700 | |
|
| Taiwan–3.26% | |
Asia Cement Corp. | | | 7,450 | | | | 9,602 | |
Cathay Financial Holding Co., Ltd. | | | 4,758 | | | | 7,858 | |
Chailease Holding Co. Ltd. | | | 3,000 | | | | 7,399 | |
Chang Hwa Commercial Bank | | | 18,472 | | | | 11,629 | |
Cheng Shin Rubber Industry Co., Ltd. | | | 4,000 | | | | 9,337 | |
Cheng Uei Precision Industry Co., Ltd. | | | 4,434 | | | | 7,399 | |
Chicony Electronics Co., Ltd. | | | 2,697 | | | | 7,756 | |
China Development Financial Holding Corp. | | | 31,224 | | | | 10,027 | |
China Life Insurance Co., Ltd. | | | 9,498 | | | | 8,280 | |
China Steel Chemical Corp. | | | 1,400 | | | | 7,623 | |
China Steel Corp. | | | 14,409 | | | | 12,410 | |
Chunghwa Telecom Co., Ltd. | | | 6,551 | | | | 19,941 | |
CTBC Financial Holding Co. Ltd. | | | 13,420 | | | | 9,402 | |
E.Sun Financial Holding Co. Ltd. | | | 15,159 | | | | 9,591 | |
Far Eastern Department Stores Ltd. | | | 10,000 | | | | 9,025 | |
Far Eastern New Century Corp. | | | 8,521 | | | | 8,950 | |
Far EasTone Telecommunications Co., Ltd. | | | 4,267 | | | | 9,430 | |
First Financial Holding Co., Ltd. | | | 20,843 | | | | 12,814 | |
Formosa Chemicals & Fibre Corp. | | | 4,267 | | | | 10,037 | |
Formosa Petrochemical Corp. | | | 4,000 | | | | 9,425 | |
See accompanying Notes to Financial Statements which are an integral part of the financial statements.
16 Invesco Macro Long/Short Fund
| | | | | | | | |
| | | Shares | | | Value | |
| Taiwan–(continued) | |
Formosa Plastics Corp. | | | 3,734 | | | $ | 8,662 | |
Foxconn Technology Co. Ltd. | | | 3,920 | | | | 10,451 | |
Fubon Financial Holding Co. Ltd. | | | 5,301 | | | | 8,970 | |
Highwealth Construction Corp. | | | 3,726 | | | | 6,449 | |
Hon Hai Precision Industry Co., Ltd. | | | 2,790 | | | | 8,819 | |
Hua Nan Financial Holdings Co., Ltd. | | | 19,000 | | | | 11,244 | |
King’s Town Bank Co. Ltd. | | | 9,000 | | | | 9,833 | |
Mega Financial Holding Co., Ltd. | | | 12,000 | | | | 9,942 | |
Nan Kang Rubber Tire Co., Ltd. | | | 7,702 | | | | 8,441 | |
Nan Ya Plastics Corp. | | | 3,384 | | | | 7,027 | |
President Chain Store Corp. | | | 1,000 | | | | 7,500 | |
Ruentex Development Co., Ltd. | | | 4,000 | | | | 5,963 | |
Ruentex Industries Ltd. | | | 3,000 | | | | 6,393 | |
Shin Kong Financial Holding Co., Ltd. | | | 35,984 | | | | 10,923 | |
SinoPac Financial Holdings Co., Ltd. | | | 22,432 | | | | 9,733 | |
Taishin Financial Holding Co., Ltd. | | | 23,970 | | | | 11,434 | |
Taiwan Cement Corp. | | | 4,668 | | | | 7,131 | |
Taiwan Cooperative Financial Holding Co. Ltd. | | | 30,187 | | | | 16,127 | |
Taiwan Fertilizer Co., Ltd. | | | 6,718 | | | | 11,904 | |
Taiwan Mobile Co., Ltd. | | | 2,217 | | | | 7,185 | |
Taiwan Semiconductor Manufacturing Co. Ltd. | | | 1,750 | | | | 7,544 | |
Tatung Co., Ltd.(a) | | | 22,000 | | | | 6,240 | |
Uni-President Enterprises Corp. | | | 4,948 | | | | 8,523 | |
United Microelectronics Corp. | | | 15,000 | | | | 6,632 | |
Walsin Lihwa Corp.(a) | | | 19,622 | | | | 6,518 | |
Win Semiconductors Corp. | | | 7,000 | | | | 6,322 | |
WPG Holdings Ltd. | | | 7,068 | | | | 8,601 | |
Yuanta Financial Holding Co., Ltd. | | | 15,375 | | | | 7,738 | |
Yulon Motor Co., Ltd. | | | 5,484 | | | | 8,087 | |
| | | | | 448,271 | |
|
| Thailand–0.37% | |
Bangkok Bank PCL | | | 1,000 | | | | 6,106 | |
BTS Group Holdings PCL | | | 24,200 | | | | 7,644 | |
PTT Exploration and Production PCL | | | 1,300 | | | | 5,872 | |
PTT Global Chemical PCL | | | 3,900 | | | | 7,430 | |
Siam Cement PCL (The) | | | 500 | | | | 6,900 | |
Thai Beverage PCL | | | 20,000 | | | | 11,881 | |
Thai Oil PCL | | | 4,100 | | | | 5,626 | |
| | | | | 51,459 | |
|
| United Kingdom–10.94% | |
Anglo American PLC | | | 1,360 | | | | 28,693 | |
ARM Holdings PLC | | | 2,088 | | | | 29,566 | |
Associated British Foods PLC | | | 748 | | | | 33,011 | |
AstraZeneca PLC | | | 431 | | | | 31,383 | |
Aviva PLC | | | 3,793 | | | | 31,651 | |
BAE Systems PLC | | | 4,241 | | | | 31,164 | |
Barclays PLC | | | 8,545 | | | | 32,756 | |
BG Group PLC | | | 1,715 | | | | 28,583 | |
BHP Billiton PLC | | | 1,126 | | | | 29,155 | |
BP PLC | | | 4,228 | | | | 30,462 | |
| | | | | | | | |
| | | Shares | | | Value | |
| United Kingdom–(continued) | |
British American Tobacco PLC | | | 551 | | | $ | 31,297 | |
British Sky Broadcasting Group PLC | | | 2,251 | | | | 31,906 | |
BT Group PLC | | | 4,959 | | | | 29,188 | |
Burberry Group PLC | | | 1,335 | | | | 32,743 | |
Centrica PLC | | | 6,252 | | | | 30,288 | |
CNH Industrial N.V.(a) | | | 927 | | | | 7,557 | |
Compass Group PLC | | | 1,985 | | | | 31,987 | |
Delphi Automotive PLC | | | 97 | | | | 6,691 | |
Diageo PLC | | | 1,096 | | | | 32,260 | |
Experian PLC | | | 1,914 | | | | 28,767 | |
Fiat Chrysler Automobiles N.V.(a) | | | 755 | | | | 8,425 | |
GlaxoSmithKline PLC | | | 1,380 | | | | 31,295 | |
HSBC Holdings PLC | | | 3,015 | | | | 30,846 | |
Imperial Tobacco Group PLC | | | 711 | | | | 30,873 | |
Kingfisher PLC | | | 6,330 | | | | 30,678 | |
Land Securities Group PLC | | | 1,835 | | | | 32,534 | |
Legal & General Group PLC | | | 8,491 | | | | 31,415 | |
Lloyds Banking Group PLC(a) | | | 26,044 | | | | 32,184 | |
Marks & Spencer Group PLC | | | 4,596 | | | | 29,948 | |
National Grid PLC | | | 2,280 | | | | 33,806 | |
Next PLC | | | 288 | | | | 29,731 | |
Old Mutual PLC | | | 10,329 | | | | 32,028 | |
Pearson PLC | | | 1,616 | | | | 30,275 | |
Prudential PLC | | | 1,430 | | | | 33,048 | |
Reckitt Benckiser Group PLC | | | 374 | | | | 31,440 | |
Reed Elsevier PLC | | | 1,959 | | | | 32,224 | |
Rio Tinto Ltd. | | | 198 | | | | 10,565 | |
Rio Tinto PLC | | | 625 | | | | 29,851 | |
Rolls-Royce Holdings PLC | | | 1,975 | | | | 26,685 | |
Rolls-Royce Holdings PLC–Class C Preference Shares(a) | | | 177,750 | | | | 284 | |
Royal Bank of Scotland Group PLC(a) | | | 5,466 | | | | 33,929 | |
Royal Dutch Shell PLC–Class A | | | 832 | | | | 29,795 | |
SABMiller PLC | | | 567 | | | | 32,026 | |
Smith & Nephew PLC | | | 1,877 | | | | 31,789 | |
SSE PLC | | | 1,314 | | | | 33,613 | |
Standard Chartered PLC | | | 1,613 | | | | 24,281 | |
Standard Life PLC | | | 4,746 | | | | 29,892 | |
Tesco PLC | | | 8,714 | | | | 24,201 | |
Tullow Oil PLC | | | 3,000 | | | | 23,352 | |
Unilever PLC | | | 768 | | | | 30,888 | |
Vodafone Group PLC | | | 9,677 | | | | 32,157 | |
Wolseley PLC | | | 596 | | | | 31,673 | |
WPP PLC | | | 1,550 | | | | 30,256 | |
| | | | | 1,505,095 | |
|
| United States–24.45% | |
3M Co. | | | 43 | | | | 6,612 | |
Abbott Laboratories | | | 147 | | | | 6,408 | |
AbbVie Inc. | | | 116 | | | | 7,361 | |
ABM Industries Inc. | | | 519 | | | | 14,345 | |
Acadia Realty Trust | | | 603 | | | | 18,814 | |
See accompanying Notes to Financial Statements which are an integral part of the financial statements.
17 Invesco Macro Long/Short Fund
| | | | | | | | |
| | | Shares | | | Value | |
| United States–(continued) | |
Accenture PLC–Class A | | | 81 | | | $ | 6,571 | |
ACE Ltd. | | | 60 | | | | 6,558 | |
Actavis PLC(a) | | | 27 | | | | 6,554 | |
Actuant Corp.–Class A | | | 385 | | | | 12,201 | |
Adobe Systems Inc.(a) | | | 97 | | | | 6,802 | |
Aetna Inc. | | | 80 | | | | 6,601 | |
Aflac, Inc. | | | 111 | | | | 6,630 | |
Agilent Technologies, Inc. | | | 109 | | | | 6,026 | |
Agree Realty Corp. | | | 488 | | | | 14,938 | |
Air Products and Chemicals, Inc. | | | 52 | | | | 7,002 | |
Albany International Corp.–Class A | | | 330 | | | | 12,467 | |
Alexion Pharmaceuticals, Inc.(a) | | | 40 | | | | 7,654 | |
Allergan, Inc. | | | 41 | | | | 7,792 | |
ALLETE, Inc. | | | 377 | | | | 19,694 | |
Allstate Corp. (The) | | | 110 | | | | 7,133 | |
Altria Group, Inc. | | | 142 | | | | 6,864 | |
Amazon.com, Inc.(a) | | | 21 | | | | 6,415 | |
American Airlines Group Inc. | | | 177 | | | | 7,319 | |
American Assets Trust Inc. | | | 412 | | | | 15,796 | |
American Electric Power Co., Inc. | | | 113 | | | | 6,592 | |
American Express Co. | | | 66 | | | | 5,937 | |
American International Group, Inc. | | | 111 | | | | 5,946 | |
American Tower Corp. | | | 69 | | | | 6,728 | |
Ameriprise Financial, Inc. | | | 53 | | | | 6,687 | |
Amgen Inc. | | | 45 | | | | 7,298 | |
Anadarko Petroleum Corp. | | | 60 | | | | 5,507 | |
Analog Devices, Inc. | | | 118 | | | | 5,855 | |
Aon PLC | | | 68 | | | | 5,848 | |
Apache Corp. | | | 67 | | | | 5,172 | |
Apple Inc. | | | 67 | | | | 7,236 | |
Applied Industrial Technologies, Inc. | | | 238 | | | | 11,617 | |
Applied Materials, Inc. | | | 273 | | | | 6,031 | |
Archer-Daniels-Midland Co. | | | 125 | | | | 5,875 | |
AT&T Inc. | | | 186 | | | | 6,480 | |
Automatic Data Processing, Inc. | | | 77 | | | | 6,297 | |
AutoZone, Inc.(a) | | | 12 | | | | 6,642 | |
Avista Corp. | | | 509 | | | | 18,044 | |
B&G Foods Inc. | | | 408 | | | | 12,020 | |
Baker Hughes Inc. | | | 90 | | | | 4,766 | |
Bank of America Corp. | | | 382 | | | | 6,555 | |
Bank of New York Mellon Corp. (The) | | | 163 | | | | 6,311 | |
Baxter International Inc. | | | 84 | | | | 5,892 | |
BB&T Corp. | | | 163 | | | | 6,174 | |
Becton, Dickinson and Co. | | | 56 | | | | 7,207 | |
Benchmark Electronics, Inc.(a) | | | 493 | | | | 11,694 | |
Berkshire Hathaway Inc.–Class B(a) | | | 46 | | | | 6,447 | |
Biglari Holdings, Inc.(a) | | | 29 | | | | 10,126 | |
Biogen Idec Inc.(a) | | | 21 | | | | 6,743 | |
BlackRock, Inc. | | | 21 | | | | 7,163 | |
Boeing Co. (The) | | | 52 | | | | 6,495 | |
Boston Properties, Inc. | | | 57 | | | | 7,225 | |
Bristol-Myers Squibb Co. | | | 126 | | | | 7,332 | |
| | | | | | | | |
| | | Shares | | | Value | |
| United States–(continued) | |
Broadcom Corp.–Class A | | | 158 | | | $ | 6,617 | |
Brookline Bancorp, Inc. | | | 1,678 | | | | 16,092 | |
CACI International Inc.–Class A(a) | | | 261 | | | | 21,478 | |
Calgon Carbon Corp.(a) | | | 573 | | | | 12,050 | |
Capital One Financial Corp. | | | 74 | | | | 6,125 | |
Capstead Mortgage Corp. | | | 1,432 | | | | 18,201 | |
Cardinal Health, Inc. | | | 85 | | | | 6,671 | |
Carnival Corp. | | | 170 | | | | 6,825 | |
Casey’s General Stores, Inc. | | | 168 | | | | 13,754 | |
Caterpillar Inc. | | | 61 | | | | 6,186 | |
CBS Corp.–Class B | | | 113 | | | | 6,127 | |
Cedar Realty Trust Inc. | | | 1,851 | | | | 12,735 | |
Celgene Corp.(a) | | | 71 | | | | 7,603 | |
CenturyLink Inc. | | | 166 | | | | 6,886 | |
Charles Schwab Corp. (The) | | | 224 | | | | 6,422 | |
Chesapeake Energy Corp. | | | 262 | | | | 5,811 | |
Chesapeake Lodging Trust | | | 493 | | | | 16,289 | |
Chevron Corp. | | | 48 | | | | 5,758 | |
Chubb Corp. (The) | | | 66 | | | | 6,558 | |
Cigna Corp. | | | 72 | | | | 7,169 | |
Cisco Systems, Inc. | | | 272 | | | | 6,656 | |
Citigroup Inc. | | | 121 | | | | 6,477 | |
City Holding Co. | | | 289 | | | | 13,002 | |
CME Group Inc.–Class A | | | 78 | | | | 6,537 | |
Coca-Cola Co. (The) | | | 149 | | | | 6,240 | |
Cognizant Technology Solutions Corp.–Class A(a) | | | 144 | | | | 7,034 | |
Colgate-Palmolive Co. | | | 95 | | | | 6,354 | |
Columbia Banking System, Inc. | | | 472 | | | | 13,112 | |
Comcast Corp.–Class A | | | 116 | | | | 6,421 | |
Community Bank System, Inc. | | | 374 | | | | 14,268 | |
ConocoPhillips | | | 79 | | | | 5,700 | |
Consolidated Edison, Inc. | | | 115 | | | | 7,286 | |
Corning Inc. | | | 317 | | | | 6,476 | |
Costco Wholesale Corp. | | | 55 | | | | 7,335 | |
Cousins Properties, Inc. | | | 1,103 | | | | 14,350 | |
Covidien PLC | | | 74 | | | | 6,841 | |
Cracker Barrel Old Country Store, Inc. | | | 128 | | | | 14,765 | |
Crown Castle International Corp. | | | 82 | | | | 6,406 | |
CSX Corp. | | | 197 | | | | 7,019 | |
Cubic Corp. | | | 262 | | | | 12,639 | |
Cummins Inc. | | | 47 | | | | 6,870 | |
CVB Financial Corp. | | | 779 | | | | 12,293 | |
CVS Health Corp. | | | 83 | | | | 7,122 | |
Danaher Corp. | | | 84 | | | | 6,754 | |
Deere & Co. | | | 77 | | | | 6,587 | |
Delta Air Lines, Inc. | | | 168 | | | | 6,759 | |
Devon Energy Corp. | | | 85 | | | | 5,100 | |
DiamondRock Hospitality Co. | | | 985 | | | | 14,135 | |
Dime Community Bancshares, Inc. | | | 960 | | | | 15,120 | |
DIRECTV(a) | | | 79 | | | | 6,856 | |
Discover Financial Services | | | 98 | | | | 6,250 | |
See accompanying Notes to Financial Statements which are an integral part of the financial statements.
18 Invesco Macro Long/Short Fund
| | | | | | | | |
| | | Shares | | | Value | |
| United States–(continued) | |
Dollar General Corp.(a) | | | 97 | | | $ | 6,079 | |
Dominion Resources, Inc. | | | 92 | | | | 6,560 | |
Dow Chemical Co. (The) | | | 117 | | | | 5,780 | |
Duke Energy Corp. | | | 92 | | | | 7,558 | |
E. I. du Pont de Nemours and Co. | | | 96 | | | | 6,638 | |
EastGroup Properties, Inc. | | | 246 | | | | 16,940 | |
Eaton Corp. PLC | | | 98 | | | | 6,702 | |
eBay Inc.(a) | | | 124 | | | | 6,510 | |
Ecolab Inc. | | | 58 | | | | 6,451 | |
Edison International | | | 107 | | | | 6,696 | |
Education Realty Trust, Inc. | | | 1,373 | | | | 15,460 | |
El Paso Electric Co. | | | 382 | | | | 14,455 | |
Eli Lilly and Co. | | | 99 | | | | 6,567 | |
EMC Corp. | | | 219 | | | | 6,292 | |
EMCOR Group, Inc. | | | 295 | | | | 13,018 | |
Emerson Electric Co. | | | 97 | | | | 6,214 | |
Entergy Corp. | | | 83 | | | | 6,974 | |
EOG Resources, Inc. | | | 57 | | | | 5,418 | |
EPR Properties | | | 247 | | | | 13,857 | |
Equity Residential | | | 99 | | | | 6,886 | |
ESCO Technologies Inc. | | | 392 | | | | 14,904 | |
Exelon Corp. | | | 188 | | | | 6,879 | |
Exponent, Inc. | | | 158 | | | | 12,612 | |
Express Scripts Holding Co.(a) | | | 89 | | | | 6,837 | |
Exxon Mobil Corp. | | | 67 | | | | 6,480 | |
F.N.B. Corp. | | | 1,069 | | | | 13,673 | |
Facebook Inc.–Class A(a) | | | 83 | | | | 6,224 | |
FedEx Corp. | | | 41 | | | | 6,863 | |
First Financial Bancorp. | | | 806 | | | | 14,137 | |
First Financial Bankshares, Inc. | | | 408 | | | | 12,966 | |
First Midwest Bancorp, Inc. | | | 707 | | | | 11,871 | |
FirstEnergy Corp. | | | 194 | | | | 7,244 | |
Ford Motor Co. | | | 373 | | | | 5,256 | |
Forward Air Corp. | | | 294 | | | | 14,074 | |
Franklin Resources, Inc. | | | 106 | | | | 5,895 | |
Franklin Street Properties Corp. | | | 1,183 | | | | 14,184 | |
Freeport-McMoRan Inc. | | | 178 | | | | 5,073 | |
General Dynamics Corp. | | | 53 | | | | 7,407 | |
General Electric Co. | | | 250 | | | | 6,453 | |
General Mills, Inc. | | | 117 | | | | 6,079 | |
General Motors Co. | | | 182 | | | | 5,715 | |
Geo Group Inc. (The) | | | 349 | | | | 13,939 | |
Getty Realty Corp. | | | 742 | | | | 13,809 | |
Gilead Sciences, Inc.(a) | | | 61 | | | | 6,832 | |
Glacier Bancorp, Inc. | | | 446 | | | | 12,796 | |
Goldman Sachs Group, Inc. (The) | | | 38 | | | | 7,220 | |
Google Inc.–Class A(a) | | | 11 | | | | 6,247 | |
Government Properties Income Trust | | | 678 | | | | 15,472 | |
Greatbatch, Inc.(a) | | | 251 | | | | 12,598 | |
Haemonetics Corp.(a) | | | 321 | | | | 12,108 | |
Halliburton Co. | | | 95 | | | | 5,238 | |
HCP, Inc. | | | 151 | | | | 6,639 | |
| | | | | | | | |
| | | Shares | | | Value | |
| United States–(continued) | |
Health Care REIT, Inc. | | | 96 | | | $ | 6,827 | |
Healthcare Realty Trust, Inc. | | | 587 | | | | 15,538 | |
Healthcare Services Group, Inc. | | | 463 | | | | 13,788 | |
Hershey Co. (The) | | | 67 | | | | 6,426 | |
Hess Corp. | | | 63 | | | | 5,343 | |
Hewlett-Packard Co. | | | 181 | | | | 6,494 | |
Hillenbrand, Inc. | | | 406 | | | | 13,516 | |
Home Depot, Inc. (The) | | | 68 | | | | 6,631 | |
Honeywell International Inc. | | | 67 | | | | 6,440 | |
Horace Mann Educators Corp. | | | 463 | | | | 14,080 | |
Humana Inc. | | | 48 | | | | 6,665 | |
Iconix Brand Group, Inc.(a) | | | 288 | | | | 11,523 | |
Illinois Tool Works Inc. | | | 74 | | | | 6,738 | |
Illumina, Inc.(a) | | | 38 | | | | 7,318 | |
Independent Bank Corp. | | | 377 | | | | 15,382 | |
Infinity Property & Casualty Corp. | | | 177 | | | | 12,923 | |
Ingersoll-Rand PLC | | | 109 | | | | 6,826 | |
Inland Real Estate Corp. | | | 1,481 | | | | 15,713 | |
Integra LifeSciences Holdings Corp.(a) | | | 239 | | | | 12,215 | |
Intel Corp. | | | 186 | | | | 6,326 | |
Intercontinental Exchange, Inc. | | | 34 | | | | 7,082 | |
International Business Machines Corp. | | | 33 | | | | 5,425 | |
International Paper Co. | | | 139 | | | | 7,036 | |
Intuit Inc. | | | 77 | | | | 6,777 | |
Intuitive Surgical, Inc.(a) | | | 14 | | | | 6,941 | |
J & J Snack Foods Corp. | | | 137 | | | | 14,115 | |
Johnson & Johnson | | | 63 | | | | 6,790 | |
Johnson Controls, Inc. | | | 139 | | | | 6,568 | |
JPMorgan Chase & Co. | | | 108 | | | | 6,532 | |
Kaiser Aluminum Corp. | | | 191 | | | | 13,284 | |
Kaman Corp. | | | 343 | | | | 14,770 | |
Kellogg Co. | | | 103 | | | | 6,588 | |
Kimberly-Clark Corp. | | | 59 | | | | 6,742 | |
Kinder Morgan Inc. | | | 168 | | | | 6,502 | |
Kite Realty Group Trust | | | 479 | | | | 12,401 | |
Knight Transportation, Inc. | | | 493 | | | | 14,425 | |
Kraft Foods Group, Inc. | | | 106 | | | | 5,973 | |
Kroger Co. (The) | | | 132 | | | | 7,354 | |
Laclede Group, Inc. (The) | | | 393 | | | | 19,953 | |
Landauer, Inc. | | | 307 | | | | 10,988 | |
Las Vegas Sands Corp. | | | 104 | | | | 6,475 | |
Lexington Realty Trust | | | 1,345 | | | | 14,741 | |
Littelfuse, Inc. | | | 126 | | | | 12,290 | |
Lockheed Martin Corp. | | | 36 | | | | 6,861 | |
Lorillard, Inc. | | | 102 | | | | 6,273 | |
Lowe’s Cos., Inc. | | | 120 | | | | 6,864 | |
LTC Properties, Inc. | | | 343 | | | | 14,385 | |
LyondellBasell Industries N.V.–Class A | | | 56 | | | | 5,131 | |
Macy’s, Inc. | | | 110 | | | | 6,360 | |
Magellan Health, Inc.(a) | | | 243 | | | | 14,706 | |
ManTech International Corp.–Class A | | | 421 | | | | 11,855 | |
See accompanying Notes to Financial Statements which are an integral part of the financial statements.
19 Invesco Macro Long/Short Fund
| | | | | | | | |
| | | Shares | | | Value | |
| United States–(continued) | |
Marathon Oil Corp. | | | 156 | | | $ | 5,522 | |
Marathon Petroleum Corp. | | | 70 | | | | 6,363 | |
Marriott Vacations Worldwide Corp. | | | 224 | | | | 15,555 | |
Marsh & McLennan Cos., Inc. | | | 117 | | | | 6,361 | |
MasterCard, Inc.–Class A | | | 82 | | | | 6,867 | |
Matthews International Corp.–Class A | | | 324 | | | | 14,930 | |
MB Financial, Inc. | | | 443 | | | | 13,977 | |
McDonald’s Corp. | | | 69 | | | | 6,467 | |
McGraw Hill Financial, Inc. | | | 76 | | | | 6,876 | |
McKesson Corp. | | | 35 | | | | 7,119 | |
Mead Johnson Nutrition Co. | | | 66 | | | | 6,554 | |
Medical Properties Trust Inc. | | | 906 | | | | 12,222 | |
Medtronic, Inc. | | | 96 | | | | 6,543 | |
Merck & Co., Inc. | | | 104 | | | | 6,026 | |
MetLife, Inc. | | | 119 | | | | 6,455 | |
Micron Technology, Inc.(a) | | | 210 | | | | 6,949 | |
Microsoft Corp. | | | 136 | | | | 6,385 | |
MKS Instruments, Inc. | | | 380 | | | | 13,832 | |
Mondelez International Inc.–Class A | | | 177 | | | | 6,241 | |
Monsanto Co. | | | 53 | | | | 6,097 | |
Morgan Stanley | | | 189 | | | | 6,606 | |
Mosaic Co. (The) | | | 127 | | | | 5,627 | |
Motorola Solutions, Inc. | | | 105 | | | | 6,772 | |
MTS Systems Corp. | | | 172 | | | | 11,354 | |
Mueller Industries, Inc. | | | 435 | | | | 14,120 | |
National Oilwell Varco Inc. | | | 84 | | | | 6,102 | |
National Penn Bancshares, Inc. | | | 1,279 | | | | 13,161 | |
National Presto Industries, Inc. | | | 185 | | | | 11,666 | |
Navigators Group, Inc. (The)(a) | | | 227 | | | | 15,456 | |
NBT Bancorp Inc. | | | 547 | | | | 14,047 | |
Netflix Inc.(a) | | | 15 | | | | 5,892 | |
New Jersey Resources Corp. | | | 254 | | | | 14,854 | |
NextEra Energy, Inc. | | | 68 | | | | 6,815 | |
NIKE, Inc.–Class B | | | 84 | | | | 7,809 | |
Noble Energy, Inc. | | | 85 | | | | 4,899 | |
Norfolk Southern Corp. | | | 57 | | | | 6,306 | |
Northern Trust Corp. | | | 93 | | | | 6,166 | |
Northrop Grumman Corp. | | | 52 | | | | 7,174 | |
Northwest Bancshares, Inc. | | | 1,132 | | | | 14,524 | |
Northwest Natural Gas Co. | | | 434 | | | | 20,368 | |
NorthWestern Corp. | | | 360 | | | | 19,022 | |
Nucor Corp. | | | 112 | | | | 6,055 | |
Occidental Petroleum Corp. | | | 62 | | | | 5,514 | |
Old National Bancorp | | | 982 | | | | 14,288 | |
Omnicom Group Inc. | | | 88 | | | | 6,324 | |
Oracle Corp. | | | 152 | | | | 5,936 | |
Oritani Financial Corp. | | | 1,074 | | | | 15,863 | |
PACCAR Inc. | | | 108 | | | | 7,055 | |
Parkway Properties, Inc. | | | 636 | | | | 12,752 | |
PepsiCo, Inc. | | | 69 | | | | 6,636 | |
Pfizer Inc. | | | 224 | | | | 6,709 | |
| | | | | | | | |
| | | Shares | | | Value | |
| United States–(continued) | |
PG&E Corp. | | | 141 | | | $ | 7,095 | |
Philip Morris International Inc. | | | 76 | | | | 6,765 | |
Phillips 66 | | | 78 | | | | 6,123 | |
Piedmont Natural Gas Co., Inc. | | | 525 | | | | 19,955 | |
Pinnacle Financial Partners, Inc. | | | 322 | | | | 12,622 | |
Pioneer Natural Resources Co. | | | 32 | | | | 6,050 | |
PNC Financial Services Group, Inc. (The) | | | 69 | | | | 5,961 | |
Pool Corp. | | | 237 | | | | 14,149 | |
Post Properties, Inc. | | | 292 | | | | 16,334 | |
PPG Industries, Inc. | | | 32 | | | | 6,518 | |
PPL Corp. | | | 194 | | | | 6,788 | |
Praxair, Inc. | | | 51 | | | | 6,425 | |
Precision Castparts Corp. | | | 25 | | | | 5,518 | |
Priceline Group Inc. (The)(a) | | | 5 | | | | 6,031 | |
ProAssurance Corp. | | | 379 | | | | 17,730 | |
Procter & Gamble Co. (The) | | | 81 | | | | 7,069 | |
Prologis, Inc. | | | 168 | | | | 6,997 | |
Provident Financial Services, Inc. | | | 689 | | | | 12,560 | |
Prudential Financial, Inc. | | | 73 | | | | 6,463 | |
PS Business Parks, Inc. | | | 217 | | | | 18,276 | |
Public Service Enterprise Group Inc. | | | 155 | | | | 6,403 | |
Public Storage | | | 38 | | | | 7,005 | |
QUALCOMM, Inc. | | | 83 | | | | 6,516 | |
Raytheon Co. | | | 65 | | | | 6,752 | |
Regeneron Pharmaceuticals, Inc.(a) | | | 18 | | | | 7,087 | |
Retail Opportunity Investments Corp. | | | 985 | | | | 16,095 | |
Reynolds American Inc. | | | 106 | | | | 6,668 | |
RLI Corp. | | | 319 | | | | 15,819 | |
Sabra Health Care REIT, Inc. | | | 422 | | | | 12,057 | |
Safety Insurance Group, Inc. | | | 276 | | | | 17,217 | |
salesforce.com, inc.(a) | | | 108 | | | | 6,911 | |
Samsonite International S.A. | | | 3,388 | | | | 11,313 | |
SanDisk Corp. | | | 59 | | | | 5,554 | |
Saul Centers, Inc. | | | 275 | | | | 15,111 | |
Schlumberger Ltd. | | | 58 | | | | 5,722 | |
SEACOR Holdings Inc.(a) | | | 169 | | | | 13,934 | |
Selective Insurance Group, Inc. | | | 565 | | | | 14,588 | |
Sempra Energy | | | 59 | | | | 6,490 | |
Seventy Seven Energy Inc.(a) | | | 18 | | | | 235 | |
Simon Property Group, Inc. | | | 41 | | | | 7,348 | |
South Jersey Industries, Inc. | | | 295 | | | | 17,299 | |
Southern Co. (The) | | | 138 | | | | 6,398 | |
Southwest Airlines Co. | | | 187 | | | | 6,448 | |
Southwest Gas Corp. | | | 345 | | | | 20,041 | |
Sovran Self Storage, Inc. | | | 177 | | | | 15,061 | |
Spectra Energy Corp. | | | 148 | | | | 5,791 | |
St. Jude Medical, Inc. | | | 104 | | | | 6,674 | |
Starbucks Corp. | | | 83 | | | | 6,271 | |
State Street Corp. | | | 92 | | | | 6,942 | |
Stepan Co. | | | 300 | | | | 13,284 | |
Sterling Bancorp | | | 1,081 | | | | 15,199 | |
See accompanying Notes to Financial Statements which are an integral part of the financial statements.
20 Invesco Macro Long/Short Fund
| | | | | | | | |
| | | Shares | | | Value | |
| United States–(continued) | |
Stryker Corp. | | | 72 | | | $ | 6,302 | |
SunTrust Banks, Inc. | | | 158 | | | | 6,184 | |
Sysco Corp. | | | 177 | | | | 6,822 | |
T. Rowe Price Group Inc. | | | 81 | | | | 6,649 | |
Tanger Factory Outlet Centers, Inc. | | | 522 | | | | 18,672 | |
Target Corp. | | | 101 | | | | 6,244 | |
Teledyne Technologies Inc.(a) | | | 153 | | | | 15,855 | |
TeleTech Holdings, Inc.(a) | | | 409 | | | | 10,556 | |
Texas Instruments Inc. | | | 140 | | | | 6,952 | |
Texas Roadhouse, Inc. | | | 487 | | | | 14,060 | |
Thermo Fisher Scientific, Inc. | | | 52 | | | | 6,114 | |
Time Inc.(a) | | | 11 | | | | 248 | |
Time Warner Cable Inc. | | | 44 | | | | 6,477 | |
Time Warner Inc. | | | 88 | | | | 6,993 | |
TJX Cos., Inc. (The) | | | 109 | | | | 6,902 | |
Tompkins Financial Corp. | | | 252 | | | | 12,650 | |
Toro Co. (The) | | | 234 | | | | 14,445 | |
Transocean Ltd. | | | 190 | | | | 5,668 | |
Travelers Cos., Inc. (The) | | | 65 | | | | 6,552 | |
TreeHouse Foods, Inc.(a) | | | 150 | | | | 12,775 | |
TrustCo Bank Corp NY | | | 1,809 | | | | 13,206 | |
Twenty-First Century Fox, Inc.–Class A | | | 194 | | | | 6,689 | |
Tyco International Ltd. | | | 145 | | | | 6,225 | |
U.S. Bancorp | | | 151 | | | | 6,433 | |
UIL Holdings Corp. | | | 406 | | | | 16,703 | |
Union Pacific Corp. | | | 61 | | | | 7,103 | |
United Bankshares, Inc. | | | 419 | | | | 14,363 | |
United Parcel Service, Inc.–Class B | | | 65 | | | | 6,819 | |
United Stationers Inc. | | | 308 | | | | 12,865 | |
United Technologies Corp. | | | 60 | | | | 6,420 | |
UnitedHealth Group Inc. | | | 74 | | | | 7,031 | |
Universal Health Realty Income Trust | | | 314 | | | | 15,213 | |
Urstadt Biddle Properties Inc.–Class A | | | 758 | | | | 16,396 | |
Valero Energy Corp. | | | 134 | | | | 6,712 | |
Ventas, Inc. | | | 100 | | | | 6,851 | |
Veritiv Corp.(a) | | | 2 | | | | 90 | |
| | | | | | | | |
| | | Shares | | | Value | |
| United States–(continued) | |
Verizon Communications Inc. | | | 136 | | | $ | 6,834 | |
Vertex Pharmaceuticals Inc.(a) | | | 66 | | | | 7,434 | |
VF Corp. | | | 97 | | | | 6,565 | |
Viacom Inc.–Class B | | | 78 | | | | 5,669 | |
Visa Inc.–Class A | | | 32 | | | | 7,726 | |
Vornado Realty Trust | | | 58 | | | | 6,350 | |
Wal-Mart Stores, Inc. | | | 83 | | | | 6,330 | |
Walgreen Co. | | | 103 | | | | 6,615 | |
Walt Disney Co. (The) | | | 72 | | | | 6,579 | |
Waste Management, Inc. | | | 139 | | | | 6,796 | |
Watts Water Technologies, Inc.–Class A | | | 207 | | | | 12,550 | |
WellPoint, Inc. | | | 52 | | | | 6,588 | |
Wells Fargo & Co. | | | 116 | | | | 6,158 | |
Western Digital Corp. | | | 66 | | | | 6,492 | |
Weyerhaeuser Co. | | | 198 | | | | 6,704 | |
Whole Foods Market, Inc. | | | 164 | | | | 6,450 | |
Williams Cos. Inc. (The) | | | 115 | | | | 6,384 | |
Wintrust Financial Corp. | | | 322 | | | | 14,915 | |
Xcel Energy, Inc. | | | 205 | | | | 6,861 | |
Yahoo! Inc.(a) | | | 158 | | | | 7,276 | |
Yum! Brands, Inc. | | | 89 | | | | 6,393 | |
Zimmer Holdings, Inc. | | | 62 | | | | 6,897 | |
Zoetis Inc. | | | 174 | | | | 6,467 | |
| | | | | | | | 3,364,445 | |
Total Common Stocks & Other Equity Interests (Cost $10,989,928) | | | | 11,264,702 | |
|
Money Market Funds–13.62% | |
Liquid Assets Portfolio–Institutional Class(h) | | | 936,792 | | | | 936,792 | |
Premier Portfolio–Institutional Class(h) | | | 936,792 | | | | 936,792 | |
Total Money Market Funds
(Cost $1,873,584) | | | | 1,873,584 | |
TOTAL INVESTMENTS–95.48%
(Cost $12,863,512) | | | | 13,138,286 | |
OTHER ASSETS LESS LIABILITIES–4.52% | | | | 622,011 | |
NET ASSETS–100.00% | | | $ | 13,760,297 | |
Investment Abbreviations:
| | |
| ADR | | – American Depositary Receipt |
| CPO | | – Certificates of Ordinary Participation |
| Ctfs. | | – Certificates |
| GDR | | – Global Depositary Receipt |
| REGS | | – Regulation S |
| REIT | | – Real Estate Investment Trust |
Notes to Schedule of Investments:
| (a) | Non-income producing security. |
| (b) | Each unit represents one common share, two series A preferred shares, one Class A voting common share and two Class B non-voting common shares. |
| (c) | Each unit represents one common share and two preferred shares. |
| (d) | Each CPO represents two Series A shares and one Series B share. |
| (e) | Each unit represents one Series B share, two Series D-B shares and two Series D-L shares. |
| (f) | Each CPO represents twenty-five A shares, twenty-two B shares, thirty-five L shares and thirty-five D shares. |
| (g) | Security purchased or received in transaction exempt from registration under the Securities Act of 1933, as amended (the “1933 Act”). The security may be resold pursuant to an exemption from registration under the 1933 Act, typically to qualified institutional buyers. The value of this security at October 31, 2014 represented less than 1% of the Fund’s Net Assets. |
| (h) | The money market fund and the Fund are affiliated by having the same investment adviser. |
See accompanying Notes to Financial Statements which are an integral part of the financial statements.
21 Invesco Macro Long/Short Fund
Statement of Assets and Liabilities
October 31, 2014
| | | | |
Assets: | | | | |
Investments, at value (Cost $10,989,928) | | $ | 11,264,702 | |
Investments in affiliated money market funds, at value and cost | | | 1,873,584 | |
Total investments, at value (Cost $12,863,512) | | | 13,138,286 | |
Foreign currencies, at value (Cost $57,589) | | | 57,264 | |
Receivable for: | | | | |
Deposits with brokers for open futures contracts | | | 590,000 | |
Investments sold | | | 137 | |
Dividends | | | 21,876 | |
Fund expenses absorbed | | | 83,292 | |
Forward foreign currency contracts outstanding | | | 25,116 | |
Investment for trustee deferred compensation and retirement plans | | | 1,890 | |
Other assets | | | 11,019 | |
Total assets | | | 13,928,880 | |
| |
Liabilities: | | | | |
Payable for: | | | | |
Fund shares reacquired | | | 200 | |
Variation margin — futures | | | 54,095 | |
Accrued fees to affiliates | | | 1,657 | |
Accrued trustees’ and officers’ fees and benefits | | | 1,727 | |
Accrued other operating expenses | | | 108,133 | |
Trustee deferred compensation and retirement plans | | | 1,890 | |
Unrealized depreciation on swap agreements — OTC | | | 881 | |
Total liabilities | | | 168,583 | |
Net assets applicable to shares outstanding | | $ | 13,760,297 | |
| |
Net assets consist of: | | | | |
Shares of beneficial interest | | $ | 13,720,673 | |
Undistributed net investment income | | | 137,339 | |
Undistributed net realized gain (loss) | | | (210,072 | ) |
Net unrealized appreciation | | | 112,357 | |
| | | $ | 13,760,297 | |
| | | | |
Net Assets: | | | | |
Class A | | $ | 5,920,692 | |
Class C | | $ | 66,339 | |
Class R | | $ | 9,971 | |
Class Y | | $ | 5,842,686 | |
Class R5 | | $ | 1,231,401 | |
Class R6 | | $ | 689,208 | |
|
Shares outstanding, $0.01 par value per share,
with an unlimited number of shares authorized: | |
Class A | | | 593,092 | |
Class C | | | 6,688 | |
Class R | | | 1,001 | |
Class Y | | | 584,001 | |
Class R5 | | | 123,059 | |
Class R6 | | | 68,888 | |
Class A: | | | | |
Net asset value per share | | $ | 9.98 | |
Maximum offering price per share | | | | |
(Net asset value of $9.98 ¸ 94.50%) | | $ | 10.56 | |
Class C: | | | | |
Net asset value and offering price per share | | $ | 9.92 | |
Class R: | | | | |
Net asset value and offering price per share | | $ | 9.96 | |
Class Y: | | | | |
Net asset value and offering price per share | | $ | 10.00 | |
Class R5: | | | | |
Net asset value and offering price per share | | $ | 10.01 | |
Class R6: | | | | |
Net asset value and offering price per share | | $ | 10.00 | |
See accompanying Notes to Financial Statements which are an integral part of the financial statements.
22 Invesco Macro Long/Short Fund
Statement of Operations
For the period December 17, 2013 (commencement date) through October 31, 2014
| | | | |
Investment income: | | | | |
Dividends (net of foreign withholding taxes of $17,341) | | $ | 274,463 | |
Dividends from affiliated money market funds | | | 891 | |
Total investment income | | | 275,354 | |
| |
Expenses: | | | | |
Advisory fees | | | 149,774 | |
Administrative services fees | | | 43,699 | |
Custodian fees | | | 139,991 | |
Distribution fees: | | | | |
Class A | | | 13,026 | |
Class C | | | 338 | |
Class R | | | 44 | |
Transfer agent fees — A, C, R and Y | | | 2,929 | |
Transfer agent fees — R5 | | | 23 | |
Transfer agent fees — R6 | | | 14 | |
Trustees’ and officers’ fees and benefits | | | 18,215 | |
Registration and filing fees | | | 87,479 | |
Licensing Fees | | | 80,000 | |
Professional services fees | | | 80,440 | |
Other | | | 64,381 | |
Total expenses | | | 680,353 | |
Less: Fees waived and expenses reimbursed | | | (475,746 | ) |
Net expenses | | | 204,607 | |
Net investment income | | | 70,747 | |
| |
Realized and unrealized gain (loss) from: | | | | |
Net realized gain (loss) from: | | | | |
Investment securities (Net of foreign taxes of $300) | | | 170,027 | |
Foreign currencies | | | 4,655 | |
Forward foreign currency contracts | | | 272,524 | |
Futures contracts | | | (635,013 | ) |
| | | | (187,807 | ) |
Change in net unrealized appreciation (depreciation) of: | | | | |
Investment securities (net of foreign taxes on holdings of $129) | | | 274,774 | |
Foreign currencies | | | (928 | ) |
Forward foreign currency contracts | | | 25,116 | |
Futures contracts | | | (185,724 | ) |
Swap agreements | | | (881 | ) |
| | | | 112,357 | |
Net realized and unrealized gain (loss) | | | (75,450 | ) |
Net increase (decrease) in net assets resulting from operations | | $ | (4,703 | ) |
See accompanying Notes to Financial Statements which are an integral part of the financial statements.
23 Invesco Macro Long/Short Fund
Statement of Changes in Net Assets
For the period December 17, 2013 (commencement date) through October 31, 2014
| | | | |
| | | December 17, 2013
(commencement date) through
October 31,
2014 | |
Operations: | |
Net investment income | | $ | 70,747 | |
Net realized gain (loss) | | | (187,807 | ) |
Change in net unrealized appreciation | | | 112,357 | |
Net increase (decrease) in net assets resulting from operations | | | (4,703 | ) |
| |
Share transactions–net: | | | | |
Class A | | | 5,931,843 | |
Class C | | | 67,324 | |
Class R | | | 10,010 | |
Class Y | | | 5,837,544 | |
Class R5 | | | 1,229,957 | |
Class R6 | | | 688,322 | |
Net increase in net assets resulting from share transactions | | | 13,765,000 | |
Net increase in net assets | | | 13,760,297 | |
| |
Net assets: | | | | |
Beginning of period | | | — | |
End of period (includes undistributed net investment income of $137,339) | | $ | 13,760,297 | |
Notes to Financial Statements
October 31, 2014
NOTE 1—Significant Accounting Policies
Invesco Macro Long/Short Fund (the “Fund”) is a series portfolio of AIM Investment Funds (Invesco Investment Funds) (the “Trust”). The Trust is organized as a Delaware statutory trust and is registered under the Investment Company Act of 1940, as amended (the “1940 Act”), as an open-end series management investment company consisting of twenty-four separate series portfolios, each authorized to issue an unlimited number of shares of beneficial interest. The assets, liabilities and operations of each portfolio are accounted for separately. Information presented in these financial statements pertains only to the Fund. Matters affecting each portfolio or class will be voted on exclusively by the shareholders of such portfolio or class.
The Fund’s investment objective is to seek a positive absolute return over a complete economic and market cycle.
The Fund currently consists of six different classes of shares: Class A, Class C, Class R, Class Y, Class R5 and Class R6. Class A shares are sold with a front-end sales charge unless certain waiver criteria are met and under certain circumstances load waived shares may be subject to contingent deferred sales charges (“CDSC”). Class C shares are sold with a CDSC. Class R, Class Y, Class R5 and Class R6 shares are sold at net asset value.
The following is a summary of the significant accounting policies followed by the Fund in the preparation of its financial statements.
| A. | Security Valuations — Securities, including restricted securities, are valued according to the following policy. |
A security listed or traded on an exchange (except convertible securities) is valued at its last sales price or official closing price as of the close of the customary trading session on the exchange where the security is principally traded, or lacking any sales or official closing price on a particular day, the security may be valued at the closing bid price on that day. Securities traded in the over-the-counter market are valued based on prices furnished by independent pricing services or market makers. When such securities are valued by an independent pricing service they may be considered fair valued. Futures contracts are valued at the final settlement price set by an exchange on which they are principally traded. Listed options are valued at the mean between the last bid and ask prices from the exchange on which they are principally traded. Options not listed on an exchange are valued by an independent source at the mean between the last bid and ask prices. For purposes of determining net asset value per share, futures and option contracts generally are valued 15 minutes after the close of the customary trading session of the New York Stock Exchange (“NYSE”).
Investments in open-end and closed-end registered investment companies that do not trade on an exchange are valued at the end of day net asset value per share. Investments in open-end and closed-end registered investment companies that trade on an exchange are valued at the last sales price or official closing price as of the close of the customary trading session on the exchange where the security is principally traded.
Debt obligations (including convertible securities) and unlisted equities are fair valued using an evaluated quote provided by an independent pricing service. Evaluated quotes provided by the pricing service may be determined without exclusive reliance on quoted prices, and may reflect appropriate factors such as institution-size trading in similar groups of securities, developments related to specific securities, dividend rate (for unlisted equities), yield (for debt obligations), quality, type of issue, coupon rate (for debt obligations), maturity (for debt obligations), individual trading characteristics and other market data. Debt obligations are subject to interest rate and credit risks. In addition, all debt obligations involve some risk of default with respect to interest and/or principal payments.
24 Invesco Macro Long/Short Fund
Foreign securities’ (including foreign exchange contracts) prices are converted into U.S. dollar amounts using the applicable exchange rates as of the close of the NYSE. If market quotations are available and reliable for foreign exchange-traded equity securities, the securities will be valued at the market quotations. Because trading hours for certain foreign securities end before the close of the NYSE, closing market quotations may become unreliable. If between the time trading ends on a particular security and the close of the customary trading session on the NYSE, events occur that the Adviser determines are significant and make the closing price unreliable, the Fund may fair value the security. If the event is likely to have affected the closing price of the security, the security will be valued at fair value in good faith using procedures approved by the Board of Trustees. Adjustments to closing prices to reflect fair value may also be based on a screening process of an independent pricing service to indicate the degree of certainty, based on historical data, that the closing price in the principal market where a foreign security trades is not the current value as of the close of the NYSE. Foreign securities’ prices meeting the approved degree of certainty that the price is not reflective of current value will be priced at the indication of fair value from the independent pricing service. Multiple factors may be considered by the independent pricing service in determining adjustments to reflect fair value and may include information relating to sector indices, American Depositary Receipts and domestic and foreign index futures. Foreign securities may have additional risks including exchange rate changes, potential for sharply devalued currencies and high inflation, political and economic upheaval, the relative lack of issuer information, relatively low market liquidity and the potential lack of strict financial and accounting controls and standards.
Securities for which market prices are not provided by any of the above methods may be valued based upon quotes furnished by independent sources. The last bid price may be used to value equity securities. The mean between the last bid and ask prices is used to value debt obligations, including corporate loans.
Securities for which market quotations are not readily available or became unreliable are valued at fair value as determined in good faith by or under the supervision of the Trust’s officers following procedures approved by the Board of Trustees. Issuer specific events, market trends, bid/ask quotes of brokers and information providers and other market data may be reviewed in the course of making a good faith determination of a security’s fair value.
The Fund may invest in securities that are subject to interest rate risk, meaning the risk that the prices will generally fall as interest rates rise and, conversely, the prices will generally rise as interest rates fall. Specific securities differ in their sensitivity to changes in interest rates depending on their individual characteristics. Changes in interest rates may result in increased market volatility, which may affect the value and/or liquidity of certain of the Fund’s investments.
Valuations change in response to many factors including the historical and prospective earnings of the issuer, the value of the issuer’s assets, general economic conditions, interest rates, investor perceptions and market liquidity. Because of the inherent uncertainties of valuation, the values reflected in the financial statements may materially differ from the value received upon actual sale of those investments.
| B. | Securities Transactions and Investment Income — Securities transactions are accounted for on a trade date basis. Realized gains or losses on sales are computed on the basis of specific identification of the securities sold. Interest income (net of withholding tax, if any) is recorded on the accrual basis from settlement date. Dividend income (net of withholding tax, if any) is recorded on the ex-dividend date. |
The Fund may periodically participate in litigation related to Fund investments. As such, the Fund may receive proceeds from litigation settlements. Any proceeds received are included in the Statement of Operations as realized gain (loss) for investments no longer held and as unrealized gain (loss) for investments still held.
Brokerage commissions and mark ups are considered transaction costs and are recorded as an increase to the cost basis of securities purchased and/or a reduction of proceeds on a sale of securities. Such transaction costs are included in the determination of net realized and unrealized gain (loss) from investment securities reported in the Statement of Operations and the Statement of Changes in Net Assets and the net realized and unrealized gains (losses) on securities per share in the Financial Highlights. Transaction costs are included in the calculation of the Fund’s net asset value and, accordingly, they reduce the Fund’s total returns. These transaction costs are not considered operating expenses and are not reflected in net investment income reported in the Statement of Operations and Statement of Changes in Net Assets, or the net investment income per share and ratios of expenses and net investment income reported in the Financial Highlights, nor are they limited by any expense limitation arrangements between the Fund and the investment adviser.
The Fund allocates income and realized and unrealized capital gains and losses to a class based on the relative net assets of each class.
| C. | Country Determination — For the purposes of making investment selection decisions and presentation in the Schedule of Investments, the investment adviser may determine the country in which an issuer is located and/or credit risk exposure based on various factors. These factors include the laws of the country under which the issuer is organized, where the issuer maintains a principal office, the country in which the issuer derives 50% or more of its total revenues and the country that has the primary market for the issuer’s securities, as well as other criteria. Among the other criteria that may be evaluated for making this determination are the country in which the issuer maintains 50% or more of its assets, the type of security, financial guarantees and enhancements, the nature of the collateral and the sponsor organization. Country of issuer and/or credit risk exposure has been determined to be the United States of America, unless otherwise noted. |
| D. | Distributions — Distributions from net investment income and net realized capital gain, if any, are generally declared and paid annually and recorded on the ex-dividend date. The Fund may elect to treat a portion of the proceeds from redemptions as distributions for federal income tax purposes. |
| E. | Federal Income Taxes — The Fund intends to comply with the requirements of Subchapter M of the Internal Revenue Code of 1986, as amended (the “Internal Revenue Code”), necessary to qualify as a regulated investment company and to distribute substantially all of the Fund’s taxable earnings to shareholders. As such, the Fund will not be subject to federal income taxes on otherwise taxable income (including net realized capital gain) that is distributed to shareholders. Therefore, no provision for federal income taxes is recorded in the financial statements. |
The Fund recognizes the tax benefits of uncertain tax positions only when the position is more likely than not to be sustained. Management has analyzed the Fund’s uncertain tax positions and concluded that no liability for unrecognized tax benefits should be recorded related to uncertain tax positions. Management is not aware of any tax positions for which it is reasonably possible that the total amounts of unrecognized tax benefits will change materially in the next 12 months.
The Fund files tax returns in the U.S. Federal jurisdiction and certain other jurisdictions. Generally, the Fund is subject to examinations by such taxing authorities for up to three years after the filing of the return for the tax period.
| F. | Expenses — Fees provided for under the Rule 12b-1 plan of a particular class of the Fund are charged to the operations of such class. Transfer agency fees and expenses and other shareholder recordkeeping fees and expenses attributable to Class R5 and Class R6 are allocated to each share class based on relative net assets. Sub-accounting fees attributable to Class R5 are charged to the operations of the class. Transfer agency |
25 Invesco Macro Long/Short Fund
| | fees and expenses and other shareholder recordkeeping fees and expenses relating to all other classes are allocated among those classes based on relative net assets. All other expenses are allocated among the classes based on relative net assets. |
| G. | Accounting Estimates — The preparation of financial statements in conformity with accounting principles generally accepted in the United States of America (“GAAP”) requires management to make estimates and assumptions that affect the reported amounts of assets and liabilities at the date of the financial statements and the reported amounts of revenues and expenses during the reporting period including estimates and assumptions related to taxation. Actual results could differ from those estimates by a significant amount. In addition, the Fund monitors for material events or transactions that may occur or become known after the period-end date and before the date the financial statements are released to print. |
| H. | Indemnifications — Under the Trust’s organizational documents, each Trustee, officer, employee or other agent of the Trust is indemnified against certain liabilities that may arise out of the performance of their duties to the Fund. Additionally, in the normal course of business, the Fund enters into contracts, including the Fund’s servicing agreements, that contain a variety of indemnification clauses. The Fund’s maximum exposure under these arrangements is unknown as this would involve future claims that may be made against the Fund that have not yet occurred. The risk of material loss as a result of such indemnification claims is considered remote. |
| I. | Foreign Currency Translations — Foreign currency is valued at the close of the NYSE based on quotations posted by banks and major currency dealers. Portfolio securities and other assets and liabilities denominated in foreign currencies are translated into U.S. dollar amounts at date of valuation. Purchases and sales of portfolio securities (net of foreign taxes withheld on disposition) and income items denominated in foreign currencies are translated into U.S. dollar amounts on the respective dates of such transactions. The Fund does not separately account for the portion of the results of operations resulting from changes in foreign exchange rates on investments and the fluctuations arising from changes in market prices of securities held. The combined results of changes in foreign exchange rates and the fluctuation of market prices on investments (net of estimated foreign tax withholding) are included with the net realized and unrealized gain or loss from investments in the Statement of Operations. Reported net realized foreign currency gains or losses arise from (1) sales of foreign currencies, (2) currency gains or losses realized between the trade and settlement dates on securities transactions, and (3) the difference between the amounts of dividends, interest, and foreign withholding taxes recorded on the Fund’s books and the U.S. dollar equivalent of the amounts actually received or paid. Net unrealized foreign currency gains and losses arise from changes in the fair values of assets and liabilities, other than investments in securities at fiscal period end, resulting from changes in exchange rates. |
The Fund may invest in foreign securities, which may be subject to foreign taxes on income, gains on investments or currency repatriation, a portion of which may be recoverable. Foreign taxes, if any, are recorded based on the tax regulations and rates that exist in the foreign markets in which the Fund invests and are shown in the Statement of Operations.
| J. | Forward Foreign Currency Contracts — The Fund may engage in foreign currency transactions either on a spot (i.e. for prompt delivery and settlement) basis or through forward foreign currency contracts to manage or minimize currency or exchange rate risk. |
The Fund may also enter into forward foreign currency contracts for the purchase or sale of a security denominated in a foreign currency in order to “lock in” the U.S. dollar price of that security, or the Fund may also enter into forward foreign currency contracts that do not provide for physical settlement of the two currencies, but instead are settled by a single cash payment calculated as the difference between the agreed upon exchange rate and the spot rate at settlement based upon an agreed upon notional amount (non-deliverable forwards). The Fund will set aside liquid assets in an amount equal to daily mark-to-market obligation for forward foreign currency contracts.
A forward foreign currency contract is an obligation between two parties (“Counterparties”) to purchase or sell a specific currency for an agreed-upon price at a future date. The use of forward foreign currency contracts does not eliminate fluctuations in the price of the underlying securities the Fund owns or intends to acquire but establishes a rate of exchange in advance. Fluctuations in the value of these contracts are measured by the difference in the contract date and reporting date exchange rates and are recorded as unrealized appreciation (depreciation) until the contracts are closed. When the contracts are closed, realized gains (losses) are recorded. Realized and unrealized gains (losses) on the contracts are included in the Statement of Operations. The primary risks associated with forward foreign currency contracts include failure of the Counterparty to meet the terms of the contract and the value of the foreign currency changing unfavorably. These risks may be in excess of the amounts reflected in the Statement of Assets and Liabilities.
| K. | Futures Contracts — The Fund may enter into futures contracts to manage exposure to interest rate, equity and market price movements and/or currency risks. A futures contract is an agreement between Counterparties to purchase or sell a specified underlying security, currency or commodity (or delivery of a cash settlement price, in the case of an index future) for a fixed price at a future date. The Fund currently invests only in exchange-traded futures and they are standardized as to maturity date and underlying financial instrument. Initial margin deposits required upon entering into futures contracts are satisfied by the segregation of specific securities or cash as collateral at the futures commission merchant (broker). During the period the futures contracts are open, changes in the value of the contracts are recognized as unrealized gains or losses by recalculating the value of the contracts on a daily basis. Subsequent or variation margin payments are received or made depending upon whether unrealized gains or losses are incurred. These amounts are reflected as receivables or payables on the Statement of Assets and Liabilities. When the contracts are closed or expire, the Fund recognizes a realized gain or loss equal to the difference between the proceeds from, or cost of, the closing transaction and the Fund’s basis in the contract. The net realized gain (loss) and the change in unrealized gain (loss) on futures contracts held during the period is included on the Statement of Operations. The primary risks associated with futures contracts are market risk and the absence of a liquid secondary market. If the Fund were unable to liquidate a futures contract and/or enter into an offsetting closing transaction, the Fund would continue to be subject to market risk with respect to the value of the contracts and continue to be required to maintain the margin deposits on the futures contracts. Futures contracts have minimal counterparty risk since the exchange’s clearinghouse, as counterparty to all exchange-traded futures, guarantees the futures against default. Risks may exceed amounts recognized in the Statement of Assets and Liabilities. |
| L. | Swap Agreements — The Fund may enter into various swap transactions, including interest rate, total return, index, currency and credit default swap contracts (“CDS”) for investment purposes or to manage interest rate, currency or credit risk. Such transactions are agreements between two parties (“Counterparties”). These agreements may contain among other conditions, events of default and termination events, and various covenants and representations such as provisions that require the Fund to maintain a pre-determined level of net assets, and/or provide limits regarding the decline of the Fund’s NAV over specific periods of time. If the Fund were to trigger such provisions and have open derivative |
26 Invesco Macro Long/Short Fund
| | positions at that time, the Counterparty may be able to terminate such agreement and request immediate payment in an amount equal to the net liability positions, if any. |
Interest rate, total return, index, and currency swap agreements are two-party contracts entered into primarily to exchange the returns (or differentials in rates of returns) earned or realized on particular predetermined investments or instruments. The gross returns to be exchanged or “swapped” between the parties are calculated with respect to a notional amount, i.e., the return on or increase in value of a particular dollar amount invested at a particular interest rate or return of an underlying asset, in a particular foreign currency, or in a “basket” of securities representing a particular index.
Changes in the value of swap agreements are recognized as unrealized gains (losses) in the Statement of Operations by “marking to market” on a daily basis to reflect the value of the swap agreement at the end of each trading day. Payments received or paid at the beginning of the agreement are reflected as such on the Statement of Assets and Liabilities and may be referred to as upfront payments. The Fund accrues for the fixed payment stream and amortizes upfront payments, if any, on swap agreements on a daily basis with the net amount, recorded as a component of realized gain (loss) on the Statement of Operations. A liquidation payment received or made at the termination of a swap agreement is recorded as realized gain (loss) on the Statement of Operations. The Fund segregates liquid securities having a value at least equal to the amount of the potential obligation of a Fund under any swap transaction. Entering into these agreements involves, to varying degrees, lack of liquidity and elements of credit, market, and Counterparty risk in excess of amounts recognized on the Statement of Assets and Liabilities. Such risks involve the possibility that a swap is difficult to sell or liquidate; the Counterparty does not honor its obligations under the agreement and unfavorable interest rates and market fluctuations. It is possible that developments in the swaps market, including potential government regulation, could adversely affect the Fund’s ability to terminate existing swap agreements or to realize amounts to be received under such agreements. A short position in a security possesses more risk than holding the same security long. As there is no limit on how much the price of the security can increase, the Fund’s exposure is unlimited.
| M. | Leverage Risk — Leverage exists when a Fund can lose more than it originally invests because it purchases or sells an instrument or enters into a transaction without investing an amount equal to the full economic exposure of the instrument or transaction. |
| N. | Collateral — To the extent the Fund has designated or segregated a security as collateral and that security is subsequently sold, it is the Fund’s practice to replace such collateral no later than the next business day. |
NOTE 2—Advisory Fees and Other Fees Paid to Affiliates
The Trust has entered into a master investment advisory agreement with Invesco Advisers, Inc. (the “Adviser” or “Invesco”). Under the terms of the investment advisory agreement, the Fund pays an advisory fee to the Adviser based on the annual rate of the Fund’s average daily net assets as follows:
| | | | |
| Average Daily Net Assets | | Rate | |
First $10 billion | | | 1.25% | |
Over $10 billion | | | 1.15% | |
For the period December 17, 2013 (commencement date) through October 31, 2014, the effective advisory fees incurred by the Fund was 1.25%.
Under the terms of a master sub-advisory agreement between the Adviser and each of Invesco Asset Management Deutschland GmbH, Invesco Asset Management Limited, Invesco Asset Management (Japan) Limited, Invesco Australia Limited, Invesco Hong Kong Limited, Invesco Senior Secured Management, Inc. and Invesco Canada Ltd. and Invesco PowerShares Capital Management LLC (collectively, the “Affiliated Sub-Advisers”) the Adviser, not the Fund, may pay 40% of the fees paid to the Adviser to any such Affiliated Sub-Adviser(s) that provide(s) discretionary investment management services to the Fund based on the percentage of assets allocated to such Sub-Adviser(s).
The Adviser has contractually agreed, through at least February 29, 2016, to waive advisory fees and/or reimburse expenses to the extent necessary to limit total annual fund operating expenses after fee waiver and/or expense reimbursement (excluding certain items discussed below) of Class A, Class C, Class R, Class Y, Class R5 and Class R6 shares to 1.87%, 2.62%, 2.12%, 1.62%, 1.62% and 1.62% of average daily net assets, respectively. In determining the Adviser’s obligation to waive advisory fees and/or reimburse expenses, the following expenses are not taken into account, and could cause total annual fund operating expenses after fee waiver and/or expense reimbursement to exceed the numbers reflected above: (1) interest; (2) taxes; (3) dividend expense on short sales; (4) extraordinary or non-routine items, including litigation expenses; and (5) expenses that the Fund has incurred but did not actually pay because of an expense offset arrangement. Unless Invesco continues the fee waiver agreement, it will terminate on February 29, 2016. The fee waiver agreement cannot be terminated during its term.
Further, the Adviser has contractually agreed, through at least June 30, 2016, to waive the advisory fee payable by the Fund in an amount equal to 100% of the net advisory fees the Adviser receives from the affiliated money market funds on investments by the Fund of uninvested cash in such affiliated money market funds.
For the period December 17, 2013 (commencement date) through October 31, 2014, the Adviser waived advisory fees and reimbursed fund level expenses of $472,779 and reimbursed class level expenses of $1,461, $10, $2, $1,457, $23 and $14 for Class A, Class C, Class R, Class Y, Class R5 and Class R6 shares, respectively.
The Trust has entered into a master administrative services agreement with Invesco pursuant to which the Fund has agreed to pay Invesco for certain administrative costs incurred in providing accounting services to the Fund. For the period December 17, 2013 (commencement date) through October 31, 2014, expenses incurred under the agreement are shown in the Statement of Operations as Administrative services fees.
The Trust has entered into a transfer agency and service agreement with Invesco Investment Services, Inc. (“IIS”) pursuant to which the Fund has agreed to pay IIS a fee for providing transfer agency and shareholder services to the Fund and reimburse IIS for certain expenses incurred by IIS in the course of providing such services. IIS may make payments to intermediaries that provide omnibus account services, sub-accounting services and/or networking services. All fees payable by IIS to intermediaries that provide omnibus account services or sub-accounting are charged back to the Fund, subject to certain limitations approved by the Trust’s Board of Trustees. For the period December 17, 2013 (commencement date) through October 31, 2014, expenses incurred under the agreement are shown in the Statement of Operations as Transfer agent fees.
The Trust has entered into master distribution agreements with Invesco Distributors, Inc. (“IDI”) to serve as the distributor for the Class A, Class C, Class R, Class Y, Class R5 and Class R6 shares of the Fund. The Trust has adopted plans pursuant to Rule 12b-1 under the 1940 Act with respect to the Fund’s Class A, Class C and Class R shares (collectively the “Plans”). The Fund, pursuant to the Plans, pays IDI compensation at the annual rate of
27 Invesco Macro Long/Short Fund
0.25% of the Fund’s average daily net assets of Class A shares, 1.00% of the average daily net assets of Class C shares and 0.50% of the average daily net assets of Class R shares. Of the Plan payments, up to 0.25% of the average daily net assets of each class of shares may be paid to furnish continuing personal shareholder services to customers who purchase and own shares of such classes. Any amounts not paid as a service fee under the Plans would constitute an asset-based sales charge. Rules of the Financial Industry Regulatory Authority (“FINRA”) impose a cap on the total sales charges, including asset-based sales charges, that may be paid by any class of shares of the Fund. For the period December 17, 2013 (commencement date) through October 31, 2014, expenses incurred under the Plans are shown in the Statement of Operations as Distribution fees.
Front-end sales commissions and CDSC (collectively, the “sales charges”) are not recorded as expenses of the Fund. Front-end sales commissions are deducted from proceeds from the sales of Fund shares prior to investment in Class A shares of the Fund. CDSC are deducted from redemption proceeds prior to remittance to the shareholder. During the period December 17, 2013 (commencement date) through October 31, 2014, IDI advised the Fund that IDI retained $180 in front-end sales commissions from the sale of Class A shares and $0 from Class A and Class C shares, respectively, for CDSC imposed upon redemptions by shareholders.
Certain officers and trustees of the Trust are officers and directors of the Adviser, IIS and/or IDI.
NOTE 3—Additional Valuation Information
GAAP defines fair value as the price that would be received to sell an asset or paid to transfer a liability in an orderly transaction between market participants at the measurement date, under current market conditions. GAAP establishes a hierarchy that prioritizes the inputs to valuation methods, giving the highest priority to readily available unadjusted quoted prices in an active market for identical assets (Level 1) and the lowest priority to significant unobservable inputs (Level 3), generally when market prices are not readily available or are unreliable. Based on the valuation inputs, the securities or other investments are tiered into one of three levels. Changes in valuation methods may result in transfers in or out of an investment’s assigned level:
| | Level 1 — | Prices are determined using quoted prices in an active market for identical assets. |
| | Level 2 — | Prices are determined using other significant observable inputs. Observable inputs are inputs that other market participants may use in pricing a security. These may include quoted prices for similar securities, interest rates, prepayment speeds, credit risk, yield curves, loss severities, default rates, discount rates, volatilities and others. |
| | Level 3 — | Prices are determined using significant unobservable inputs. In situations where quoted prices or observable inputs are unavailable (for example, when there is little or no market activity for an investment at the end of the period), unobservable inputs may be used. Unobservable inputs reflect the Fund’s own assumptions about the factors market participants would use in determining fair value of the securities or instruments and would be based on the best available information. |
The following is a summary of the tiered valuation input levels, as of October 31, 2014. The level assigned to the securities valuations may not be an indication of the risk or liquidity associated with investing in those securities. Because of the inherent uncertainties of valuation, the values reflected in the financial statements may materially differ from the value received upon actual sale of those investments.
| | | | | | | | | | | | | | | | |
| | | Level 1 | | | Level 2 | | | Level 3 | | | Total | |
Australia | | $ | 11,184 | | | $ | 656,155 | | | $ | — | | | $ | 667,339 | |
Austria | | | 6,367 | | | | 14,328 | | | | — | | | | 20,695 | |
Belgium | | | 7,613 | | | | 36,025 | | | | — | | | | 43,638 | |
Brazil | | | 93,435 | | | | — | | | | — | | | | 93,435 | |
Chile | | | — | | | | 45,071 | | | | — | | | | 45,071 | |
China | | | 101,899 | | | | 110,997 | | | | — | | | | 212,896 | |
Colombia | | | 15,154 | | | | — | | | | — | | | | 15,154 | |
Czech Republic | | | 12,559 | | | | — | | | | — | | | | 12,559 | |
Denmark | | | 26,924 | | | | 29,616 | | | | — | | �� | | 56,540 | |
Finland | | | 14,213 | | | | 36,583 | | | | — | | | | 50,796 | |
France | | | 28,659 | | | | 307,091 | | | | — | | | | 335,750 | |
Germany | | | 199,962 | | | | 42,158 | | | | — | | | | 242,120 | |
Greece | | | 5,717 | | | | — | | | | — | | | | 5,717 | |
Hong Kong | | | 345,089 | | | | 167,160 | | | | — | | | | 512,249 | |
Hungary | | | — | | | | 6,385 | | | | — | | | | 6,385 | |
Indonesia | | | — | | | | 11,812 | | | | 8,107 | | | | 19,919 | |
Ireland | | | 32,503 | | | | 7,194 | | | | — | | | | 39,697 | |
Italy | | | 27,107 | | | | 64,616 | | | | — | | | | 91,723 | |
Japan | | | 30,546 | | | | 1,592,094 | | | | — | | | | 1,622,640 | |
Luxembourg | | | — | | | | 13,352 | | | | — | | | | 13,352 | |
Macau | | | — | | | | 12,825 | | | | — | | | | 12,825 | |
Malaysia | | | 103,827 | | | | 205,099 | | | | — | | | | 308,926 | |
Mexico | | | 60,485 | | | | — | | | | — | | | | 60,485 | |
Netherlands | | | 21,643 | | | | 70,330 | | | | — | | | | 91,973 | |
New Zealand | | | — | | | | 34,142 | | | | — | | | | 34,142 | |
Norway | | | 29,203 | | | | 17,868 | | | | — | | | | 47,071 | |
28 Invesco Macro Long/Short Fund
| | | | | | | | | | | | | | | | |
| | | Level 1 | | | Level 2 | | | Level 3 | | | Total | |
Philippines | | $ | 20,562 | | | $ | 8,026 | | | $ | — | | | $ | 28,588 | |
Poland | | | 6,646 | | | | — | | | | — | | | | 6,646 | |
Portugal | | | — | | | | 6,833 | | | | — | | | | 6,833 | |
Russia | | | 5,888 | | | | 12,354 | | | | — | | | | 18,242 | |
Singapore | | | 85,531 | | | | 157,092 | | | | — | | | | 242,623 | |
South Africa | | | 185,033 | | | | 23,491 | | | | — | | | | 208,524 | |
South Korea | | | 68,941 | | | | 101,729 | | | | — | | | | 170,670 | |
Spain | | | 6,974 | | | | 112,836 | | | | — | | | | 119,810 | |
Sweden | | | 51,478 | | | | 118,221 | | | | — | | | | 169,699 | |
Switzerland | | | 16,467 | | | | 244,233 | | | | — | | | | 260,700 | |
Taiwan | | | 42,949 | | | | 405,322 | | | | — | | | | 448,271 | |
Thailand | | | 20,170 | | | | 31,289 | | | | — | | | | 51,459 | |
United Kingdom | | | 261,970 | | | | 1,243,125 | | | | — | | | | 1,505,095 | |
United States | | | 5,226,716 | | | | 11,313 | | | | — | | | | 5,238,029 | |
| | | | 7,173,414 | | | | 5,956,765 | | | | 8,107 | | | | 13,138,286 | |
Forward Foreign Currency Contracts* | | | — | | | | 25,116 | | | | — | | | | 25,116 | |
Futures Contracts* | | | (185,724 | ) | | | — | | | | — | | | | (185,724 | ) |
Swap Agreements* | | | — | | | | (881 | ) | | | — | | | | (881 | ) |
Total Investments | | $ | 6,987,690 | | | $ | 5,981,000 | | | $ | 8,107 | | | $ | 12,976,797 | |
| * | Unrealized appreciation (depreciation). |
NOTE 4—Derivative Investments
Value of Derivative Investments at Period-End
The table below summarizes the value of the Fund’s derivative investments, detailed by primary risk exposure, held as of October 31, 2014:
| | | | | | | | |
| | | Value | |
| Risk Exposure/Derivative Type | | Assets | | | Liabilities | |
Currency risk: | | | | | | | | |
Forward foreign currency contracts(a) | | $ | 41,541 | | | $ | (16,425 | ) |
Market risk: | | | | | | | | |
Futures contracts(b) | | | 120,820 | | | | (306,544 | ) |
Swap agreements(c) | | | — | | | | (881 | ) |
Total | | $ | 162,361 | | | $ | (323,850 | ) |
| (a) | Values are disclosed on the Statement of Assets and Liabilities under the caption Forward foreign currency contracts outstanding. |
| (b) | Includes cumulative appreciation (depreciation) of futures contracts. Only current day’s variation margin receivable is reported within the Statement of Assets and Liabilities. |
| (c) | Values are disclosed on the Statement of Assets and Liabilities under the caption Unrealized depreciation on swap agreements — OTC. |
Effect of Derivative Investments for the period December 17, 2013 (commencement date) through October 31, 2014
The table below summarizes the gains (losses) on derivative investments, detailed by primary risk exposure, recognized in earnings during the period:
| | | | | | | | | | | | |
| | | Location of Gain (Loss) on
Statement of Operations | |
| | | Futures
Contracts | | | Forward
Foreign Currency
Contracts | | | Swap
Agreements | |
Realized Gain (Loss): | | | | | | | | | | | | |
Currency risk | | $ | — | | | $ | 272,524 | | | $ | — | |
Market risk | | | (635,013 | ) | | | — | | | | — | |
Change in Unrealized Appreciation (Depreciation): | | | | | | | | | | | | |
Currency risk | | | — | | | | 25,116 | | | | — | |
Market risk | | | (185,724 | ) | | | — | | | | (881 | ) |
Total | | $ | (820,737 | ) | | $ | 297,640 | | | $ | (881 | ) |
29 Invesco Macro Long/Short Fund
The table below summarizes the average notional value of futures contracts outstanding for the period December 17, 2013 (commencement date) through October 31, 2014, the three month average notional value of forward foreign currency contracts, and the two month average notional value of swap agreements outstanding during the period.
| | | | | | | | | | | | |
| | | Futures
Contracts | | | Forward
Foreign Currency
Contracts | | | Swap
Agreements | |
Average notional value | | $ | 7,211,013 | | | $ | 4,813,314 | | | $ | 184,290 | |
| | | | | | | | | | | | | | | | | | | | | | | | | | |
| Open Forward Foreign Currency Contracts | |
Settlement
Date | | Counterparty | | Contract to | | | Notional
Value | | | Unrealized
Appreciation
(Depreciation) | |
| | | Deliver | | | Receive | | | |
1/14/2015 | | Canadian Imperial Bank of Commerce | | | AUD | | | | 720,000 | | | | USD | | | | 619,792 | | | $ | 630,207 | | | $ | (10,415 | ) |
1/14/2015 | | Canadian Imperial Bank of Commerce | | | CHF | | | | 210,000 | | | | USD | | | | 217,461 | | | | 218,428 | | | | (967 | ) |
1/14/2015 | | Canadian Imperial Bank of Commerce | | | EUR | | | | 900,000 | | | | USD | | | | 1,126,836 | | | | 1,128,413 | | | | (1,577 | ) |
1/14/2015 | | Canadian Imperial Bank of Commerce | | | GBP | | | | 990,000 | | | | USD | | | | 1,579,614 | | | | 1,582,874 | | | | (3,260 | ) |
1/14/2015 | | Canadian Imperial Bank of Commerce | | | JPY | | | | 169,800,00 | | | | USD | | | | 1,549,921 | | | | 1,513,266 | | | | 36,655 | |
1/14/2015 | | Canadian Imperial Bank of Commerce | | | NOK | | | | 330,000 | | | | USD | | | | 50,424 | | | | 48,793 | | | | 1,631 | |
1/14/2015 | | Canadian Imperial Bank of Commerce | | | NZD | | | | 40,000 | | | | USD | | | | 30,741 | | | | 30,947 | | | | (206 | ) |
1/14/2015 | | Canadian Imperial Bank of Commerce | | | SEK | | | | 1,220,000 | | | | USD | | | | 167,757 | | | | 165,236 | | | | 2,521 | |
1/14/2015 | | Canadian Imperial Bank of Commerce | | | SGD | | | | 330,000 | | | | USD | | | | 257,531 | | | | 256,797 | | | | 734 | |
Total Forward Foreign Currency Contracts — Currency Risk | | | | | | | | | | | | | | | | | | | | | | $ | 25,116 | |
Currency Abbreviations:
| | |
| AUD | | – Australian Dollar |
| CHF | | – Swiss Franc |
| EUR | | – Euro |
| GBP | | – British Pound Sterling |
| | |
| JPY | | – Japanese Yen |
| NOK | | – Norwegian Krone |
| NZD | | – New Zealand Dollar |
| SEK | | – Swedish Krona |
| | |
| SGD | | – Singapore Dollar |
| USD | | – United States Dollar |
| | | | | | | | | | | | | | | | | | | | |
| Open Futures Contracts(a) | |
| Futures Contracts | | Type of
Contract | | | Number of
Contracts | | | Expiration
Month | | | Notional Value | | | Unrealized
Appreciation
(Depreciation) | |
Dow Jones EURO STOXX 50 Index | | | Long | | | | 41 | | | | December-2014 | | | $ | 1,593,204 | | | $ | (55,313 | ) |
Dow Jones EURO STOXX 50 Index | | | Short | | | | 18 | | | | December-2014 | | | | (699,455 | ) | | | 23,507 | |
E-Mini S&P 500 Index | | | Short | | | | 13 | | | | December-2014 | | | | (1,307,410 | ) | | | (24,324 | ) |
FTSE 100 Index | | | Short | | | | 8 | | | | December-2014 | | | | (832,600 | ) | | | 39,712 | |
Hang Seng Index | | | Short | | | | 8 | | | | November-2014 | | | | (1,234,955 | ) | | | (35,526 | ) |
Mini MSCI Emerging Markets Asia Index | | | Short | | | | 39 | | | | December-2014 | | | | (1,976,520 | ) | | | 31,770 | |
MSCI Singapore Index | | | Short | | | | 2 | | | | November-2014 | | | | (115,037 | ) | | | (2,216 | ) |
Russell 2000 Mini Index | | | Short | | | | 28 | | | | December-2014 | | | | (3,278,800 | ) | | | (157,760 | ) |
SPI 200 Index | | | Short | | | | 5 | | | | December-2014 | | | | (606,980 | ) | | | (7,594 | ) |
Tokyo Stock Price Index | | | Long | | | | 12 | | | | December-2014 | | | | 1,428,546 | | | | 25,831 | |
Tokyo Stock Price Index | | | Short | | | | 7 | | | | December-2014 | | | | (833,319 | ) | | | (23,811 | ) |
Total Futures Contracts — Market Risk | | | | | | | | | | | $ | (185,724 | ) |
| (a) | Futures collateralized by $590,000 cash held with Goldman Sachs International, the futures commission merchant. |
| | | | | | | | | | | | | | | | | | | | | | | | |
| Open Over-The-Counter Total Return Swap Agreements — Market Risk | |
| Swap Agreements | | Type of
Contract | | | Counterparty | | | Number of
Contracts | | | Termination
Date | | | Notional
Value | | | Unrealized
Appreciation
(Depreciation) | |
Pay a return equal to Swiss Market Index Futures multiplied by the Notional Value | | | Short | | | | Goldman Sachs International | | | | 2 | | | | December-2014 | | | $ | (183,455 | ) | | $ | (881 | ) |
30 Invesco Macro Long/Short Fund
Offsetting Assets and Liabilities
Accounting Standards Update (“ASU”) No. 2011-11, Disclosures about Offsetting Assets and Liabilities, which was subsequently clarified in Financial Accounting Standards Board ASU 2013-01 “Clarifying the Scope of Disclosures about Offsetting Assets and Liabilities” is intended to enhance disclosures about financial instruments and derivative instruments that are subject to offsetting arrangements on the Statement of Assets and Liabilities and to enable investors to better understand the effect of those arrangements on its financial position. In order for an arrangement to be eligible for netting, the Fund must have a basis to conclude that such netting arrangements are legally enforceable. The Fund enters into netting agreements and collateral agreements in an attempt to reduce the Fund’s Counterparty credit risk by providing for a single net settlement with a Counterparty of all financial transactions covered by the agreement in an event of default as defined under such agreement.
There were no derivative instruments subject to a netting agreement for which the Fund is not currently netting. The following tables present derivative instruments that are either subject to an enforceable netting agreement or offset by collateral arrangements as of October 31, 2014.
| | | | | | | | | | | | | | | | | | | | | | | | |
| Assets: | |
| | | Gross amounts
presented in
Statement of
Assets & Liabilities | | | Gross amounts
offset in
Statement of
Assets & Liabilities | | | Net amounts of assets
presented in the
Statement of Assets
and Liabilities | | | Collateral Received | | | | |
| Counterparty | | | | | Financial
Instruments | | | Cash | | | Net
Amount | |
Canadian Imperial Bank of Commerce | | $ | 41,541 | | | $ | (16,425 | ) | | $ | 25,116 | | | $ | — | | | $ | — | | | $ | 25,116 | |
| | | | | | |
| | | | | | | | | | | | | | | | | | | | | | | | |
| Liabilities: | |
| | | Gross amounts
presented in
Statement of
Assets & Liabilities | | | Gross amounts
offset in
Statement of
Assets & Liabilities | | | Net amounts of liabilities
presented in the
Statement of Assets
and Liabilities | | | Collateral Pledged | | | | |
| Counterparty | | | | | Financial
Instruments | | | Cash | | | Net
Amount | |
Canadian Imperial Bank of Commerce | | $ | 16,425 | | | $ | (16,425 | ) | | $ | — | | | $ | — | | | $ | — | | | $ | — | |
Goldman Sachs International | | | 881 | | | | — | | | | 881 | | | | — | | | | — | | | | 881 | |
Total | | $ | 17,306 | | | $ | (16,425 | ) | | $ | 881 | | | $ | — | | | $ | — | | | $ | 881 | |
NOTE 5—Trustees’ and Officers’ Fees and Benefits
Trustees’ and Officers’ Fees and Benefits include amounts accrued by the Fund to pay remuneration to certain Trustees and Officers of the Fund. Trustees have the option to defer compensation payable by the Fund, and Trustees’ and Officers’ Fees and Benefits also include amounts accrued by the Fund to fund such deferred compensation amounts. Those Trustees who defer compensation have the option to select various Invesco Funds in which their deferral accounts shall be deemed to be invested. Obligations under the deferred compensation plan represents unsecured claims against the general assets of the Fund.
NOTE 6—Cash Balances
The Fund is permitted to temporarily carry a negative or overdrawn balance in its account with State Street Bank and Trust Company, the custodian bank. Such balances, if any at period end, are shown in the Statement of Assets and Liabilities under the payable caption Amount due custodian. To compensate the custodian bank for such overdrafts, the overdrawn Fund may either (1) leave funds as a compensating balance in the account so the custodian bank can be compensated by earning the additional interest; or (2) compensate by paying the custodian bank at a rate agreed upon by the custodian bank and Invesco, not to exceed the contractually agreed upon rate.
NOTE 7—Distributions to Shareholders and Tax Components of Net Assets
Tax Character of Distributions to Shareholders Paid During the period December 17, 2013 (commencement date) through October 31, 2014:
There were no ordinary income or capital gains distributions during the period December 17, 2013 (commencement date) through October 31, 2014.
Tax Components of Net Assets at Period-End:
| | | | |
| | | 2014 | |
Undistributed ordinary income | | $ | 149,341 | |
Net unrealized appreciation — investments | | | 247,673 | |
Net unrealized appreciation (depreciation) — other investments | | | (44,391 | ) |
Temporary book/tax differences | | | (156,702 | ) |
Capital loss carryforward | | | (156,297 | ) |
Shares of beneficial interest | | | 13,720,673 | |
Total net assets | | $ | 13,760,297 | |
The difference between book-basis and tax-basis unrealized appreciation (depreciation) is due to differences in the timing of recognition of gains and losses on investments for tax and book purposes. The Fund’s net unrealized appreciation difference is attributable primarily to wash sales and passive foreign investment companies.
The temporary book/tax differences are a result of timing differences between book and tax recognition of income and/or expenses. The Fund’s temporary book/tax differences are the result of the trustee deferral of compensation and retirement plan benefits.
31 Invesco Macro Long/Short Fund
Capital loss carryforward is calculated and reported as of a specific date. Results of transactions and other activity after that date may affect the amount of capital loss carryforward actually available for the Fund to utilize. The ability to utilize capital loss carryforward in the future may be limited under the Internal Revenue Code and related regulations based on the results of future transactions.
The Fund has a capital loss carryforward as of October 31, 2014:
| | | | | | | | | | | | |
| Capital Loss Carryforward* | |
| Expiration | | Short-Term | | | Long-Term | | | Total | |
Not subject to expiration | | $ | 31,553 | | | $ | 124,744 | | | $ | 156,297 | |
| * | Capital loss carryforward as of the date listed above is reduced for limitations, if any, to the extent required by the Internal Revenue Code and may be further limited depending upon a variety of factors, including the realization of net unrealized gains or losses as of the date of any reorganization. |
NOTE 8—Investment Securities
The aggregate amount of investment securities (other than short-term securities, U.S. Treasury obligations and money market funds, if any) purchased and sold by the Fund during the period December 17, 2013 (commencement date) through October 31, 2014 was $15,500,459 and $4,680,793, respectively. Cost of investments on a tax basis includes the adjustments for financial reporting purposes as of the most recently completed federal income tax reporting period-end.
| | | | |
| Unrealized Appreciation (Depreciation) of Investment Securities on a Tax Basis | |
Aggregate unrealized appreciation of investment securities | | $ | 742,218 | |
Aggregate unrealized (depreciation) of investment securities | | | (494,545 | ) |
Net unrealized appreciation of investment securities | | $ | 247,673 | |
Cost of investments for tax purposes is $12,890,613.
NOTE 9—Reclassification of Permanent Differences
Primarily as a result of differing book/tax treatment of stock issuance costs, organizational expenses and passive foreign investment companies, on October 31, 2014, undistributed net investment income was increased by $66,592, undistributed net realized gain (loss) was decreased by $22,265 and shares of beneficial interest was decreased by $44,327. This reclassification had no effect on the net assets of the Fund.
NOTE 10—Share Information
| | | | | | | | |
| | | Summary of Share Activity | |
| | | December 17, 2013
(commencement date) through
October 31, 2014(a) | |
| | | Shares | | | Amount | |
Sold: | | | | | | | | |
Class A | | | 597,931 | | | $ | 5,981,144 | |
Class C | | | 6,688 | | | | 67,324 | |
Class R | | | 1,001 | | | | 10,010 | |
Class Y | | | 592,645 | | | | 5,926,023 | |
Class R5 | | | 123,628 | | | | 1,235,815 | |
Class R6 | | | 68,888 | | | | 688,322 | |
| | |
Reacquired: | | | | | | | | |
Class A | | | (4,839 | ) | | | (49,301 | ) |
Class Y | | | (8,644 | ) | | | (88,479 | ) |
Class R5 | | | (569 | ) | | | (5,858 | ) |
Net increase in share activity | | | 1,376,729 | | | $ | 13,765,000 | |
| (a) | 99% of the outstanding shares of the Fund are owned by the Adviser or an affiliate of the Adviser. |
32 Invesco Macro Long/Short Fund
NOTE 11—Financial Highlights
The following schedule presents financial highlights for a share of the Fund outstanding throughout the periods indicated.
| | | | | | | | | | | | | | | | | | | | | | | | | | | | | | | | | | | | | | | | | | | | |
| | | Net asset
value,
beginning
of period | | | Net
investment
income
(loss)(a) | | | Net gains
on securities
(both
realized and
unrealized) | | | Total from
investment
operations | | | Net asset
value, end
of period | | | Total
return(b) | | | Net assets,
end of period
(000’s omitted) | | | Ratio of
expenses
to average
net assets
with fee waivers
and/or expenses
absorbed | | | Ratio of
expenses
to average net
assets without
fee waivers
and/or expenses
absorbed | | | Ratio of net
investment
income (loss)
to average
net assets | | | Portfolio
turnover(c) | |
Class A | | | | | | | | | | | | | | | | | | | | | | | | | | | | | | | | | | | | | | | | | | | | |
Year ended 10/31/14(d) | | $ | 10.00 | | | $ | 0.04 | | | $ | (0.06 | ) | | $ | (0.02 | ) | | $ | 9.98 | | | | (0.20 | )% | | $ | 5,921 | | | | 1.85 | %(e) | | | 5.82 | %(e) | | | 0.45 | %(e) | | | 44 | % |
Class C | | | | | | | | | | | | | | | | | | | | | | | | | | | | | | | | | | | | | | | | | | | | |
Year ended 10/31/14(d) | | | 10.00 | | | | (0.03 | ) | | | (0.05 | ) | | | (0.08 | ) | | | 9.92 | | | | (0.80 | ) | | | 66 | �� | | | 2.60 | (e) | | | 6.57 | (e) | | | (0.30 | )(e) | | | 44 | |
Class R | | | | | | | | | | | | | | | | | | | | | | | | | | | | | | | | | | | | | | | | | | | | |
Year ended 10/31/14(d) | | | 10.00 | | | | 0.02 | | | | (0.06 | ) | | | (0.04 | ) | | | 9.96 | | | | (0.40 | ) | | | 10 | | | | 2.10 | (e) | | | 6.07 | (e) | | | 0.20 | (e) | | | 44 | |
Class Y | | | | | | | | | | | | | | | | | | | | | | | | | | | | | | | | | | | | | | | | | | | | |
Year ended 10/31/14(d) | | | 10.00 | | | | 0.06 | | | | (0.06 | ) | | | 0.00 | | | | 10.00 | | | | 0.00 | | | | 5,843 | | | | 1.60 | (e) | | | 5.57 | (e) | | | 0.70 | (e) | | | 44 | |
Class R5 | | | | | | | | | | | | | | | | | | | | | | | | | | | | | | | | | | | | | | | | | | | | |
Year ended 10/31/14(d) | | | 10.00 | | | | 0.06 | | | | (0.05 | ) | | | 0.01 | | | | 10.01 | | | | 0.10 | | | | 1,231 | | | | 1.60 | (e) | | | 5.54 | (e) | | | 0.70 | (e) | | | 44 | |
Class R6 | | | | | | | | | | | | | | | | | | | | | | | | | | | | | | | | | | | | | | | | | | | | |
Year ended 10/31/14(d) | | | 10.00 | | | | 0.06 | | | | (0.06 | ) | | | 0.00 | | | | 10.00 | | | | 0.00 | | | | 689 | | | | 1.60 | (e) | | | 5.54 | (e) | | | 0.70 | (e) | | | 44 | |
| (a) | Calculated using average shares outstanding. |
| (b) | Includes adjustments in accordance with accounting principles generally accepted in the United States of America and as such, the net asset value for financial reporting purposes and the returns based upon those net asset values may differ from the net asset value and returns for shareholder transactions. Does not include sales charges and is not annualized for periods less than one year, if applicable. |
| (c) | Portfolio turnover is calculated at the fund level and is not annualized for periods less than one year, if applicable. |
| (d) | Commencement date of December 17, 2013. |
| (e) | Ratios are annualized and based on average daily net assets (000’s omitted) of $5,962, $39, $10, $5,947, $1,092 and $660 for Class A, Class C, Class R, Class Y, Class R5 and Class R6 shares, respectively. |
33 Invesco Macro Long/Short Fund
Report of Independent Registered Public Accounting Firm
To the Board of Trustees of AIM Investment Funds (Invesco Investment Funds)
and Shareholders of Invesco Macro Long/Short Fund:
In our opinion, the accompanying statement of assets and liabilities, including the schedule of investments, and the related statements of operations and of changes in net assets and the financial highlights present fairly, in all material respects, the financial position of Invesco Macro Long/Short Fund (one of the funds constituting AIM Investment Funds (Invesco Investment Funds), hereafter referred to as the “Fund”) at October 31, 2014, and the results of its operations, the changes in its net assets and the financial highlights for the period December 17, 2013 (commencement of operations) through October 31, 2014, in conformity with accounting principles generally accepted in the United States of America. These financial statements and financial highlights (hereafter referred to as “financial statements”) are the responsibility of the Fund’s management. Our responsibility is to express an opinion on these financial statements based on our audit. We conducted our audit of these financial statements in accordance with the standards of the Public Company Accounting Oversight Board (United States). Those standards require that we plan and perform the audit to obtain reasonable assurance about whether the financial statements are free of material misstatement. An audit includes examining, on a test basis, evidence supporting the amounts and disclosures in the financial statements, assessing the accounting principles used and significant estimates made by management, and evaluating the overall financial statement presentation. We believe that our audits, which included confirmation of securities at October 31, 2014 by correspondence with the custodian and brokers, and the application of alternative auditing procedures where confirmations of security purchases have not been received, provide a reasonable basis for our opinion.
PRICEWATERHOUSECOOPERS LLP
December 23, 2014
Houston, Texas
34 Invesco Macro Long/Short Fund
Calculating your ongoing Fund expenses
Example
As a shareholder of the Fund, you incur two types of costs: (1) transaction costs, which may include sales charges (loads) on purchase payments or contingent deferred sales charges on redemptions, if any; and (2) ongoing costs, including management fees, distribution and/or service (12b-1) fees, and other Fund expenses. This example is intended to help you understand your ongoing costs (in dollars) of investing in the Fund and to compare these costs with ongoing costs of investing in other mutual funds. The example is based on an investment of $1,000 invested at the beginning of the period and held for the entire period May 1, 2014 through October 31, 2014.
Actual expenses
The table below provides information about actual account values and actual expenses. You may use the information in this table, together with the amount you invested, to estimate the expenses that you paid over the period. Simply divide your account value by $1,000 (for example, an $8,600 account value divided by $1,000 = 8.6), then multiply the result by the number in the table under the heading entitled “Actual Expenses Paid During Period” to estimate the expenses you paid on your account during this period.
Hypothetical example for comparison purposes
The table below also provides information about hypothetical account values and hypothetical expenses based on the Fund’s actual expense ratio and an assumed rate of return of 5% per year before expenses, which is not the Fund’s actual return.
The hypothetical account values and expenses may not be used to estimate the actual ending account balance or expenses you paid for the period. You may use this information to compare the ongoing costs of investing in the Fund and other funds. To do so, compare this 5% hypothetical example with the 5% hypothetical examples that appear in the shareholder reports of the other funds.
Please note that the expenses shown in the table are meant to highlight your ongoing costs only and do not reflect any transaction costs, such as sales charges (loads) on purchase payments or contingent deferred sales charges on redemptions, if any. Therefore, the hypothetical information is useful in comparing ongoing costs only, and will not help you determine the relative total costs of owning different funds. In addition, if these transaction costs were included, your costs would have been higher.
| | | | | | | | | | | | | | | | | | | | | | | | |
| Class | | Beginning Account Value (05/01/14) | | | ACTUAL | | | HYPOTHETICAL
(5% annual return before
expenses) | | | Annualized
Expense
Ratio | |
| | | Ending Account Value (10/31/14)1 | | | Expenses Paid During Period2 | | | Ending Account Value (10/31/14) | | | Expenses Paid During Period2 | | |
| A | | $ | 1,000.00 | | | $ | 983.20 | | | $ | 9.25 | | | $ | 1,015.88 | | | $ | 9.40 | | | | 1.85 | % |
| C | | | 1,000.00 | | | | 979.30 | | | | 12.97 | | | | 1,012.10 | | | | 13.19 | | | | 2.60 | |
| R | | | 1,000.00 | | | | 982.20 | | | | 10.49 | | | | 1,014.62 | | | | 10.66 | | | | 2.10 | |
| Y | | | 1,000.00 | | | | 984.20 | | | | 8.00 | | | | 1,017.14 | | | | 8.13 | | | | 1.60 | |
| R5 | | | 1,000.00 | | | | 985.20 | | | | 8.01 | | | | 1,017.14 | | | | 8.13 | | | | 1.60 | |
| R6 | | | 1,000.00 | | | | 984.20 | | | | 8.00 | | | | 1,017.14 | | | | 8.13 | | | | 1.60 | |
| 1 | The actual ending account value is based on the actual total return of the Fund for the period May 1, 2014 through October 31, 2014, after actual expenses and will differ from the hypothetical ending account value which is based on the Fund’s expense ratio and a hypothetical annual return of 5% before expenses. |
| 2 | Expenses are equal to the Fund’s annualized expense ratio as indicated above multiplied by the average account value over the period, multiplied by 184/365 to reflect the most recent fiscal half year. |
35 Invesco Macro Long/Short Fund
Approval of Investment Advisory and Sub-Advisory Contracts
The Board of Trustees (the Board) of AIM Investment Funds (Invesco Investment Funds) is required under the Investment Company Act of 1940, as amended, to approve annually the renewal of Invesco Macro Long/Short Fund’s (the Fund) investment advisory agreements. During contract renewal meetings held on June 16-17, 2014, the Board as a whole, and the disinterested or “independent” Trustees, who comprise over 75% of the Board, voting separately, approved the continuance for the Fund of the Master Investment Advisory Agreement with Invesco Advisers, Inc. (Invesco Advisers and the investment advisory agreement) and the Master Intergroup Sub-Advisory Contract for Mutual Funds with Invesco Asset Management Deutschland GmbH, Invesco Asset Management Limited, Invesco Asset Management (Japan) Limited, Invesco Australia Limited, Invesco Hong Kong Limited, Invesco Senior Secured Management, Inc., Invesco Canada Ltd. and Invesco PowerShares Capital Management LLC (collectively, the Affiliated Sub-Advisers and the sub-advisory contracts) for another year, effective July 1, 2014.
In evaluating the fairness and reasonableness of compensation under the Fund’s investment advisory agreement and sub-advisory contracts, the Board considered, among other things, the factors discussed below. The Board determined that continuation of the Fund’s investment advisory agreement and the sub-advisory contracts are in the best interest of the Fund and its shareholders and that the compensation payable to Invesco Advisers and the Affiliated Sub-Advisers under the agreements is fair and reasonable.
The Board’s Fund Evaluation Process
The Board’s Investments Committee has established three Sub-Committees, each of which is primarily responsible for overseeing the management of a number of the funds advised by Invesco Advisers (the Invesco Funds). The Sub-Committees meet throughout the year to review the performance of their assigned Invesco Funds, including reviewing materials prepared under the direction of the independent Senior Officer, an officer of the Invesco Funds who reports directly to the independent Trustees. Over the course of each year, the Sub-Committees meet with portfolio managers for their assigned Invesco Funds and other members of management to review the performance, investment objective(s), policies, strategies, limitations and investment risks of these funds. The Sub-Committees meet regularly and at designated contract renewal meetings each year to conduct a review of the performance, fees, expenses and other matters related to their assigned Invesco Funds. Each Sub-Committee recommends to the Investments Committee, which in turn recommends to the full Board, whether and on what terms to
approve the continuance of each Invesco Fund’s investment advisory agreement and sub-advisory contracts for another year.
During the contract renewal process, the Trustees receive comparative performance and fee data regarding the Invesco Funds prepared by Invesco Advisers and Lipper Inc. (Lipper), an independent provider of investment company data. The Trustees also receive an independent written evaluation from the Senior Officer. The Senior Officer’s evaluation is prepared as part of his responsibility to manage the process by which the Invesco Funds’ proposed management fees are negotiated during the annual contract renewal process to ensure they are negotiated in a manner that is at arms’ length and reasonable. In addition to meetings with Invesco Advisers and fund counsel, the independent Trustees also discuss the continuance of the investment advisory agreement and sub-advisory contracts in separate sessions with the Senior Officer and with independent legal counsel.
The Trustees recognized that the advisory fee rates for the Invesco Funds are, in many cases, the result of years of review and negotiation. The Trustees’ deliberations and conclusions in a particular year may be based in part on their deliberations and conclusions regarding these same arrangements throughout the year and in prior years. The Trustees’ review and conclusions are based on the comprehensive consideration of all information presented to them and are not the result of any single determinative factor. Moreover, one Trustee may have weighed a particular piece of information or factor differently than another Trustee.
The discussion below serves as the Senior Officer’s independent written evaluation with respect to the Fund’s investment advisory agreement as well as a discussion of the material factors and related conclusions that formed the basis for the Board’s approval of the Fund’s investment advisory agreement and sub-advisory contracts. Unless otherwise stated, this information is current as of June 17, 2014, and may not reflect consideration of factors that became known to the Board after that date.
Factors and Conclusions and Summary of Independent Written Fee Evaluation
| A. | Nature, Extent and Quality of Services Provided by Invesco Advisers and the Affiliated Sub-Advisers |
The Board reviewed the advisory services provided to the Fund by Invesco Advisers under the Fund’s investment advisory agreement, the performance of Invesco Advisers in providing these services, and the credentials and experience of the officers and employees of Invesco Advisers who provide these services, including the Fund’s portfolio manager or
managers, with whom the Sub-Committees met during the year. The Board’s review of the qualifications of Invesco Advisers to provide advisory services included the Board’s consideration of Invesco Advisers’ investment process oversight, independent credit analysis and investment risk management. The Board also considered non-advisory services that Invesco Advisers and its affiliates provide to the Invesco Funds such as various back office support functions, equity and fixed income trading operations, internal audit, distribution and legal and compliance.
In determining whether to continue the Fund’s investment advisory agreement, the Board considered the benefits of reapproving an existing relationship and the greater uncertainty that may be associated with entering into a new relationship. The Board concluded that the nature, extent and quality of the services provided to the Fund by Invesco Advisers are appropriate and satisfactory and consistent with the terms of the Fund’s investment advisory agreement.
The Board reviewed the services that may be provided by the Affiliated Sub-Advisers under the sub-advisory contracts and the credentials and experience of the officers and employees of the Affiliated Sub-Advisers who provide these services. The Board noted that the Affiliated Sub-Advisers have offices and personnel that are located in financial centers around the world. As a result, the Affiliated Sub-Advisers can provide research and investment analysis on the markets and economies of various countries in which the Fund may invest, make recommendations regarding securities and assist with security trades. The Board concluded that the sub-advisory contracts benefit the Fund and its shareholders by permitting Invesco Advisers to use the resources and talents of the Affiliated Sub-Advisers in managing the Fund. The Board concluded that the nature, extent and quality of the services that may be provided by the Affiliated Sub-Advisers are appropriate and satisfactory and consistent with the terms of the Fund’s sub-advisory contracts.
The Board did not consider Fund performance as a relevant factor in considering whether to approve the investment advisory agreement or the sub-advisory contracts for the Fund, as the Fund recently began operations and not comparative data was available.
| C. | Advisory and Sub-Advisory Fees |
The Board noted that Invesco Advisers has contractually agreed to waive fees and/or limit expenses of the Fund through at least December 31, 2015 in an amount necessary to limit total annual operating expenses to a specified percentage of average daily net assets for each class of the Fund.
The Board compared the Fund’s effective advisory fee rate (the advisory fee rate after
36 Invesco Macro Long/Short Fund
advisory fee waivers and before other expense limitations/waivers) to the effective advisory fee rates of other mutual funds advised by Invesco Advisers and its affiliates with investment strategies comparable to those of the Fund. The Board noted that the Fund’s rate was the same as the rate of one such mutual fund that is managed using an investment process substantially similar to the investment process used for the Fund. The Board noted that Invesco Advisers and the Affiliated Sub-Advisers do not manage other client accounts using an investment process substantially similar to the investment process used for the Fund.
The Board also considered the services that may be provided by the Affiliated Sub-Advisers pursuant to the sub-advisory contracts, as well as the fees payable by Invesco Advisers to the Affiliated Sub-Advisers pursuant to the sub-advisory contracts. The Board also noted that the sub-advisory fees are not paid directly by the Fund, but rather, are payable by Invesco Advisers to the Affiliated Sub-Advisers.
| D. | Economies of Scale and Breakpoints |
The Board considered the extent to which there are economies of scale in the provision of advisory services to the Fund. The Board also considered whether the Fund benefits from economies of scale through contractual breakpoints in the Fund’s advisory fee schedule and was assisted in this review by a report from the Senior Officer. The Board also noted that the Fund shares directly in economies of scale through lower fees charged by third party service providers based on the combined size of the Invesco Funds and other clients advised by Invesco Advisers.
| E. | Profitability and Financial Resources |
The Board reviewed information from Invesco Advisers concerning the costs of the advisory and other services that Invesco Advisers and its affiliates provide to the Fund and the profitability of Invesco Advisers and its affiliates in providing these services for the year ended December 31, 2013. The Board received information from Invesco Advisers about the methodology used to prepare the profitability information. The Board considered the profitability of Invesco Advisers in managing the Fund and the Invesco Funds. The Board noted that Invesco Advisers continues to operate at a net profit from services Invesco Advisers and its subsidiaries provide to the Invesco Funds. The Board noted that Invesco Advisers and its subsidiaries did not make a profit from managing the Fund as a result of fee and expense waivers. The Board received and accepted information from Invesco Advisers demonstrating that Invesco Advisers and each Affiliated Sub-Adviser are financially sound and have the resources necessary to perform their obligations under the investment advisory agreement and sub-advisory contracts.
| F. | Collateral Benefits to Invesco Advisers and its Affiliates |
The Board considered various other benefits received by Invesco Advisers and its affiliates from the relationship with the Fund, including
the fees received for their provision of transfer agency and distribution services to the Fund. The Board considered the performance of Invesco Advisers and its affiliates in providing these services and the organizational structure employed to provide these services. The Board also considered that these services are provided to the Fund pursuant to written contracts that are reviewed and approved on an annual basis by the Board; that the services are required for the operation of the Fund; that Invesco Advisers and its affiliates can provide services, the nature and quality of which are at least equal to those provided by others offering the same or similar services; and that the fees for such services are fair and reasonable in light of the usual and customary charges by others for services of the same nature and quality.
The Board considered the benefits realized by Invesco Advisers and the Affiliated Sub-Advisers as a result of portfolio brokerage transactions executed through “soft dollar” arrangements. The Board noted that soft dollar arrangements shift the payment obligation for research services from Invesco Advisers and the Affiliated Sub-Advisers to the Invesco Funds and that the research received may be used with other clients of Invesco Advisers and may reduce Invesco Advisers’ and the Affiliated Sub-Advisers’ expenses. The Board also considered that it receives periodic reports from the Chief Compliance Officer of the Invesco Funds demonstrating that these arrangements are consistent with regulatory requirements. The Board did not deem the soft dollar arrangements to be inappropriate.
The Board considered that the Fund’s uninvested cash and cash collateral from any securities lending arrangements may be invested in money market funds advised by Invesco Advisers pursuant to procedures approved by the Board. The Board noted that Invesco Advisers receives advisory fees from these affiliated money market funds attributable to such investments, although Invesco Advisers has contractually agreed to waive through varying periods the advisory fees payable by the Invesco Funds with respect to investments in the affiliated money market funds. The waiver is in an amount equal to 100% of the net advisory fee Invesco Advisers receives from the affiliated money market funds with respect to the Fund’s investment in the affiliated money market funds of uninvested cash, but not cash collateral. The Board concluded that the amount of advisory fees received by Invesco Advisors from the Fund’s investment of uninvested cash and cash collateral from any securities lending arrangements in the affiliated money market funds are fair and reasonable.
The Board also considered the Fund may use an affiliated broker to execute certain trades for the Fund to among other things, control information leakage, and were advised that such trades would be executed in compliance with rules under the Investment Company Act of 1940, as amended.
37 Invesco Macro Long/Short Fund
Trustees and Officers
The address of each trustee and officer is AIM Investment Funds (Invesco Investment Funds) (the “Trust”), 11 Greenway Plaza, Suite 1000, Houston, Texas 77046-1173. The trustees serve for the life of the Trust, subject to their earlier death, incapacitation, resignation, retirement or removal as more specifically provided in the Trust’s organizational documents. Each officer serves for a one year term or until their successors are elected and qualified. Column two below includes length of time served with predecessor entities, if any.
| | | | | | | | |
Name, Year of Birth and Position(s) Held with the Trust | | Trustee and/
or Officer Since | | Principal Occupation(s) During Past 5 Years | | Number of Funds in Fund Complex Overseen by Trustee | | Other Directorship(s) Held by Trustee During Past 5 Years |
| Interested Persons | | | | | | | | |
| Martin L. Flanagan1 — 1960 Trustee | | 2007 | | Executive Director, Chief Executive Officer and President, Invesco Ltd. (ultimate parent of Invesco and a global investment management firm); Advisor to the Board, Invesco Advisers, Inc. (formerly known as Invesco Institutional (N.A.), Inc.); Trustee, The Invesco Funds; Vice Chair, Investment Company Institute; and Member of Executive Board, SMU Cox School of Business Formerly: Chairman and Chief Executive Officer, Invesco Advisers, Inc. (registered investment adviser); Director, Chairman, Chief Executive Officer and President, IVZ Inc. (holding company), INVESCO Group Services, Inc. (service provider) and Invesco North American Holdings, Inc. (holding company); Director, Chief Executive Officer and President, Invesco Holding Company Limited (parent of Invesco and a global investment management firm); Director, Invesco Ltd.; Chairman, Investment Company Institute and President, Co-Chief Executive Officer, Co-President, Chief Operating Officer and Chief Financial Officer, Franklin Resources, Inc. (global investment management organization). | | 144 | | None |
Philip A. Taylor2 — 1954 Trustee, President and Principal Executive Officer | | 2006 | | Head of North American Retail and Senior Managing Director, Invesco Ltd.; Director, Co-Chairman, Co-President and Co-Chief Executive Officer, Invesco Advisers, Inc. (formerly known as Invesco Institutional (N.A.), Inc.) (registered investment adviser); Director, Chairman, Chief Executive Officer and President, Invesco Management Group, Inc. (formerly known as Invesco Aim Management Group, Inc.) (financial services holding company); Director and President, INVESCO Funds Group, Inc. (registered investment adviser and registered transfer agent); Director and Chairman, Invesco Investment Services, Inc. (formerly known as Invesco Aim Investment Services, Inc.) (registered transfer agent) and IVZ Distributors, Inc. (formerly known as INVESCO Distributors, Inc.) (registered broker dealer); Director, President and Chairman, Invesco Inc. (holding company) and Invesco Canada Holdings Inc. (holding company); Chief Executive Officer, Invesco Corporate Class Inc. (corporate mutual fund company) and Invesco Canada Fund Inc. (corporate mutual fund company); Director, Chairman and Chief Executive Officer, Invesco Canada Ltd. (formerly known as Invesco Trimark Ltd./Invesco Trimark Ltèe) (registered investment adviser and registered transfer agent); Trustee, President and Principal Executive Officer, The Invesco Funds (other than AIM Treasurer’s Series Trust (Invesco Treasurer’s Series Trust) and Short-Term Investments Trust); Trustee and Executive Vice President, The Invesco Funds (AIM Treasurer’s Series Trust (Invesco Treasurer’s Series Trust) and Short-Term Investments Trust only); Director, Invesco Investment Advisers LLC (formerly known as Van Kampen Asset Management); Director, Chief Executive Officer and President, Van Kampen Exchange Corp. Formerly: Director and Chairman, Van Kampen Investor Services Inc.; Director, Chief Executive Officer and President, 1371 Preferred Inc. (holding company) and Van Kampen Investments Inc.; Director and President, AIM GP Canada Inc. (general partner for limited partnerships) and Van Kampen Advisors, Inc.; Director and Chief Executive Officer, Invesco Trimark Dealer Inc. (registered broker dealer); Director, Invesco Distributors, Inc. (formerly known as Invesco Aim Distributors, Inc.) (registered broker dealer); Manager, Invesco PowerShares Capital Management LLC; Director, Chief Executive Officer and President, Invesco Advisers, Inc.; Director, Chairman, Chief Executive Officer and President, Invesco Aim Capital Management, Inc.; President, Invesco Trimark Dealer Inc. and Invesco Trimark Ltd./Invesco Trimark Ltèe; Director and President, AIM Trimark Corporate Class Inc. and AIM Trimark Canada Fund Inc.; Senior Managing Director, Invesco Holding Company Limited; Director and Chairman, Fund Management Company (former registered broker dealer); President and Principal Executive Officer, The Invesco Funds (AIM Treasurer’s Series Trust (Invesco Treasurer’s Series Trust), and Short-Term Investments Trust only); President, AIM Trimark Global Fund Inc. and AIM Trimark Canada Fund Inc. | | 144 | | None |
Wayne W. Whalen3 — 1939 Trustee | | 2010 | | Of Counsel, and prior to 2010, partner in the law firm of Skadden, Arps, Slate, Meagher & Flom LLP, legal counsel to certain funds in the Fund Complex | | 144 | | Director of the Mutual fund Directors Forum, a nonprofit membership organization for investment directors; Chairman and Director of the Abraham Lincoln Presidential Library Foundation; and Director of the Stevenson Center for Democracy |
| 1 | Mr. Flanagan is considered an interested person (within the meaning of Section 2(a)(19) of the 1940 Act) of the Trust because he is an officer of the Adviser to the Trust, and an officer and a director of Invesco Ltd., ultimate parent of the Adviser. |
| 2 | Mr. Taylor is considered an interested person (within the meaning of Section 2(a)(19) of the 1940 Act) of the Trust because he is an officer and a director of the Adviser. |
| 3 | Mr. Whalen is retiring effective December 31, 2014. He has been deemed to be an interested person of the Trust because of his prior service as counsel to the predecessor funds of certain Invesco open-end funds and his affiliation with the law firm that served as counsel to such predecessor funds and the Invesco closed-end funds. |
T-1 Invesco Macro Long/Short Fund
Trustees and Officers—(continued)
| | | | | | | | |
Name, Year of Birth and Position(s) Held with the Trust | | Trustee and/
or Officer Since | | Principal Occupation(s) During Past 5 Years | | Number of Funds in Fund Complex Overseen by Trustee | | Other Directorship(s) Held by Trustee During Past 5 Years |
| Independent Trustees | | | | | | | | |
Bruce L. Crockett — 1944 Trustee and Chair | | 2001 | | Chairman, Crockett Technologies Associates (technology consulting company) Formerly: Director, Captaris (unified messaging provider); Director, President and Chief Executive Officer, COMSAT Corporation; Chairman, Board of Governors of INTELSAT (international communications company); ACE Limited (insurance company); and Investment Company Institute | | 144 | | ALPS (Attorneys Liability Protection Society) (insurance company) |
David C. Arch — 1945 Trustee | | 2010 | | Chairman of Blistex Inc., a consumer health care products manufacturer | | 144 | | Board member of the Illinois Manufacturers’ Association; Member of the Board of Visitors, Institute for the Humanities, University of Michigan; Member of the Audit Committee of the Edward-Elmhurst Hospital |
Frank S. Bayley — 1939 Trustee | | 1987 | | Retired. Formerly: Director, Badgley Funds Inc. (registered investment company) (2 portfolios) and General Partner and Of Counsel, law firm of Baker & McKenzie, LLP | | 144 | | Director and Chairman, C.D. Stimson Company (a real estate investment company); Trustee, The Curtis Institute of Music |
James T. Bunch — 1942 Trustee | | 2003 | | Managing Member, Grumman Hill Group LLC (family office private equity investments) Formerly: Founder, Green Manning & Bunch Ltd. (investment banking firm) (1988-2010); Executive Committee, United States Golf Association; and Director, Policy Studies, Inc. and Van Gilder Insurance Corporation | | 144 | | Chairman, Board of Governors, Western Golf Association; Chairman, Evans Scholars Foundation; and Director, Denver Film Society |
Rodney F. Dammeyer — 1940 Trustee | | 2010 | | Chairman of CAC,LLC, (private company offering capital investment and management advisory services) Formerly: Prior to 2001, Managing Partner at Equity Group Corporate Investments; Prior to 1995, Chief Executive Officer of Itel Corporation (formerly Anixter International); Prior to 1985, experience includes Senior Vice President and Chief Financial Officer of Household International, Inc., Executive Vice President and Chief Financial Officer of Northwest Industries, Inc. and Partner of Arthur Andersen & Co.; From 1987 to 2010, Director/Trustee of investment companies in the Van Kampen Funds complex | | 144 | | Director of Quidel Corporation and Stericycle, Inc. |
Albert R. Dowden — 1941 Trustee | | 2001 | | Director of a number of public and private business corporations, including the Boss Group, Ltd. (private investment and management); Nature’s Sunshine Products, Inc. and Reich & Tang Funds (5 portfolios) (registered investment company) Formerly: Director, Homeowners of America Holding Corporation/Homeowners of America Insurance Company (property casualty company); Director, Continental Energy Services, LLC (oil and gas pipeline service); Director, CompuDyne Corporation (provider of product and services to the public security market) and Director, Annuity and Life Re (Holdings), Ltd. (reinsurance company); Director, President and Chief Executive Officer, Volvo Group North America, Inc.; Senior Vice President, AB Volvo; Director of various public and private corporations; Chairman, DHJ Media, Inc.; Director, Magellan Insurance Company; and Director, The Hertz Corporation, Genmar Corporation (boat manufacturer), National Media Corporation; Advisory Board of Rotary Power International (designer, manufacturer, and seller of rotary power engines); and Chairman, Cortland Trust, Inc. (registered investment company) | | 144 | | Director of: Nature’s Sunshine Products, Inc., Reich & Tang Funds, Homeowners of America Holding Corporation/ Homeowners of America Insurance Company, the Boss Group |
Jack M. Fields — 1952 Trustee | | 2001 | | Chief Executive Officer, Twenty First Century Group, Inc. (government affairs company); Owner and Chief Executive Officer, Dos Angeles Ranch, L.P. (cattle, hunting, corporate entertainment); and Discovery Global Education Fund (non-profit) Formerly: Chief Executive Officer, Texana Timber LP (sustainable forestry company); Director of Cross Timbers Quail Research Ranch (non-profit); and member of the U.S. House of Representatives | | 144 | | Insperity, Inc. (formerly known as Administaff) |
Prema Mathai-Davis — 1950 Trustee | | 2001 | | Retired. Formerly: Chief Executive Officer, YWCA of the U.S.A. | | 144 | | None |
Larry Soll — 1942 Trustee | | 2003 | | Retired. Formerly: Chairman, Chief Executive Officer and President, Synergen Corp. (a biotechnology company) | | 144 | | None |
Hugo F. Sonnenschein — 1940 Trustee | | 2010 | | President Emeritus and Honorary Trustee of the University of Chicago and the Adam Smith Distinguished Service Professor in the Department of Economics at the University of Chicago. Prior to 2000, President of the University of Chicago | | 144 | | Trustee of the University of Rochester and a member of its investment committee; Member of the National Academy of Sciences and the American Philosophical Society; Fellow of the American Academy of Arts and Sciences |
T-2 Invesco Macro Long/Short Fund
Trustees and Officers—(continued)
| | | | | | | | |
Name, Year of Birth and Position(s) Held with the Trust | | Trustee and/
or Officer Since | | Principal Occupation(s) During Past 5 Years | | Number of Funds in Fund Complex Overseen by Trustee | | Other Directorship(s) Held by Trustee During Past 5 Years |
| Independent Trustees—(continued) |
Raymond Stickel, Jr. — 1944 Trustee | | 2005 | | Retired. Formerly: Director, Mainstay VP Series Funds, Inc. (25 portfolios) and Partner, Deloitte & Touche | | 144 | | None |
Suzanne H. Woolsey — 1941 Trustee | | 2014 | | Chief Executive Officer of Woolsey Partners LLC | | 144 | | Emeritus Chair of the Board of Trustees of the Institute for Defense Analyses; Trustee of Colorado College; Trustee of California Institute of Technology; Prior to 2014, Director of Fluor Corp.; Prior to 2010, Trustee of the German Marshall Fund of the United States; Prior to 2010 Trustee of the Rocky Mountain Institute |
| Other Officers | | | | | | | | |
Russell C. Burk — 1958 Senior Vice President and Senior Officer | | 2005 | | Senior Vice President and Senior Officer, The Invesco Funds | | N/A | | N/A |
John M. Zerr — 1962 Senior Vice President, Chief Legal Officer and Secretary | | 2006 | | Director, Senior Vice President, Secretary and General Counsel, Invesco Management Group, Inc. (formerly known as Invesco Aim Management Group, Inc.) and Van Kampen Exchange Corp.; Senior Vice President, Invesco Advisers, Inc. (formerly known as Invesco Institutional (N.A.), Inc.) (registered investment adviser); Senior Vice President and Secretary, Invesco Distributors, Inc. (formerly known as Invesco Aim Distributors, Inc.); Director, Vice President and Secretary, Invesco Investment Services, Inc. (formerly known as Invesco Aim Investment Services, Inc.) and IVZ Distributors, Inc. (formerly known as INVESCO Distributors, Inc.); Director and Vice President, INVESCO Funds Group, Inc.; Senior Vice President, Chief Legal Officer and Secretary, The Invesco Funds; Manager, Invesco PowerShares Capital Management LLC; Director, Secretary and General Counsel, Invesco Investment Advisers LLC (formerly known as Van Kampen Asset Management); Secretary and General Counsel, Invesco Capital Markets, Inc. (formerly known as Van Kampen Funds Inc.) and Chief Legal Officer, PowerShares Exchange-Traded Fund Trust, PowerShares Exchange-Traded Fund Trust II, PowerShares India Exchange-Traded Fund Trust, PowerShares Actively Managed Exchange-Traded Fund Trust; and PowerShares Actively Managed Exchange-Traded Commodity Fund Trust Formerly: Director and Vice President, Van Kampen Advisors Inc.; Director, Vice President, Secretary and General Counsel, Van Kampen Investor Services Inc.; Director, Invesco Distributors, Inc. (formerly known as Invesco Aim Distributors, Inc.); Director, Senior Vice President, General Counsel and Secretary, Invesco Aim Advisers, Inc. and Van Kampen Investments Inc.; Director, Vice President and Secretary, Fund Management Company; Director, Senior Vice President, Secretary, General Counsel and Vice President, Invesco Aim Capital Management, Inc.; Chief Operating Officer and General Counsel, Liberty Ridge Capital, Inc. (an investment adviser); Vice President and Secretary, PBHG Funds (an investment company) and PBHG Insurance Series Fund (an investment company); Chief Operating Officer, General Counsel and Secretary, Old Mutual Investment Partners (a broker-dealer); General Counsel and Secretary, Old Mutual Fund Services (an administrator) and Old Mutual Shareholder Services (a shareholder servicing center); Executive Vice President, General Counsel and Secretary, Old Mutual Capital, Inc. (an investment adviser); and Vice President and Secretary, Old Mutual Advisors Funds (an investment company) | | N/A | | N/A |
Sheri Morris — 1964 Vice President, Treasurer and Principal Financial Officer | | 1999 | | Vice President, Treasurer and Principal Financial Officer, The Invesco Funds; Vice President, Invesco Advisers, Inc. (formerly known as Invesco Institutional (N.A.), Inc.) (registered investment adviser); and Vice President, PowerShares Exchange-Traded Fund Trust, PowerShares Exchange-Traded Fund Trust II, PowerShares India Exchange-Traded Fund Trust, PowerShares Actively Managed Exchange-Traded Fund Trust, and PowerShares Actively Managed Exchange-Traded Commodity Fund Trust Formerly: Vice President, Invesco Aim Advisers, Inc., Invesco Aim Capital Management, Inc. and Invesco Aim Private Asset Management, Inc.; Assistant Vice President and Assistant Treasurer, The Invesco Funds and Assistant Vice President, Invesco Advisers, Inc., Invesco Aim Capital Management, Inc. and Invesco Aim Private Asset Management, Inc.; and Treasurer, PowerShares Exchange-Traded Fund Trust, PowerShares Exchange-Traded Fund Trust II, PowerShares India Exchange-Traded Fund Trust and PowerShares Actively Managed Exchange-Traded Fund Trust | | N/A | | N/A |
T-3 Invesco Macro Long/Short Fund
Trustees and Officers—(continued)
| | | | | | | | |
Name, Year of Birth and Position(s) Held with the Trust | | Trustee and/
or Officer Since | | Principal Occupation(s) During Past 5 Years | | Number of Funds in Fund Complex Overseen by Trustee | | Other Directorship(s) Held by Trustee During Past 5 Years |
| Other Officers—(continued) | | | | | | | | |
Karen Dunn Kelley — 1960 Vice President | | 2004 | | Senior Managing Director, Investments; Director, Co-President, Co-Chief Executive Officer, and Co-Chairman, Invesco Advisers, Inc. (formerly known as Invesco Institutional (N.A.), Inc.) (registered investment adviser); Chairman, Invesco Senior Secured Management, Inc.; Senior Vice President, Invesco Management Group, Inc. (formerly known as Invesco Aim Management Group, Inc.); Executive Vice President, Invesco Distributors, Inc. (formerly known as Invesco Aim Distributors, Inc.); Director, Invesco Mortgage Capital Inc. and Invesco Management Company Limited; Director and President, INVESCO Asset Management (Bermuda) Ltd., Vice President, The Invesco Funds (other than AIM Treasurer’s Series Trust (Invesco Treasurer’s Series Trust) and Short-Term Investments Trust); and President and Principal Executive Officer, The Invesco Funds (AIM Treasurer’s Series Trust (Invesco Treasurer’s Series Trust) and Short-Term Investments Trust only) Formerly: Director, INVESCO Global Asset Management Limited and INVESCO Management S.A.; Senior Vice President, Van Kampen Investments Inc. and Invesco Advisers, Inc. (formerly known as Invesco Institutional (N.A.), Inc.) (registered investment adviser); Vice President, Invesco Advisers, Inc. (formerly known as Invesco Institutional (N.A.), Inc.); Director of Cash Management and Senior Vice President, Invesco Advisers, Inc. and Invesco Aim Capital Management, Inc.; Director and President, Fund Management Company; Chief Cash Management Officer, Director of Cash Management, Senior Vice President, and Managing Director, Invesco Aim Capital Management, Inc.; Director of Cash Management, Senior Vice President, and Vice President, Invesco Advisers, Inc. and The Invesco Funds (AIM Treasurer’s Series Trust (Invesco Treasurer’s Series Trust), and Short-Term Investments Trust only) | | N/A | | N/A |
Crissie M. Wisdom — 1969 Anti-Money Laundering Compliance Officer | | 2013 | | Anti-Money Laundering Compliance Officer, Invesco Advisers, Inc. (formerly known as Invesco Institutional (N.A.), Inc.) (registered investment adviser), Invesco Capital Markets, Inc. (formerly known as Van Kampen Funds Inc.), Invesco Distributors, Inc., Invesco Investment Services, Inc., Invesco Management Group, Inc., Van Kampen Exchange Corp., The Invesco Funds, and PowerShares Exchange-Traded Fund Trust, PowerShares Exchange-Traded Fund Trust II, PowerShares India Exchange-Traded Fund Trust, PowerShares Actively Managed Exchange-Traded Fund Trust and PowerShares Actively Managed Exchange-Traded Commodity Fund Trust; and Fraud Prevention Manager and Controls and Risk Analysis Manager for Invesco Investment Services, Inc. | | N/A | | N/A |
Todd L. Spillane — 1958 Chief Compliance Officer | | 2006 | | Senior Vice President, Invesco Management Group, Inc. (formerly known as Invesco Aim Management Group, Inc.) and Van Kampen Exchange Corp.; Senior Vice President and Chief Compliance Officer, Invesco Advisers, Inc. (registered investment adviser) (formerly known as Invesco Institutional (N.A.), Inc.); Chief Compliance Officer, The Invesco Funds; Vice President, Invesco Distributors, Inc. (formerly known as Invesco Aim Distributors, Inc.) and Invesco Investment Services, Inc. (formerly known as Invesco Aim Investment Services, Inc.) Formerly: Chief Compliance Officer, Invesco Funds (Chicago); Senior Vice President, Van Kampen Investments Inc.; Senior Vice President and Chief Compliance Officer, Invesco Aim Advisers, Inc. and Invesco Aim Capital Management, Inc.; Chief Compliance Officer, INVESCO Private Capital Investments, Inc. (holding company), Invesco Private Capital, Inc. (registered investment adviser), Invesco Global Asset Management (N.A.), Inc., Invesco Senior Secured Management, Inc. (registered investment adviser), Van Kampen Investor Services Inc., PowerShares Exchange-Traded Fund Trust, PowerShares Exchange-Traded Fund Trust II, PowerShares India Exchange-Traded Fund Trust and PowerShares Actively Managed Exchange-Traded Fund Trust; and Vice President, Invesco Aim Capital Management, Inc. and Fund Management Company | | N/A | | N/A |
The Statement of Additional Information of the Trust includes additional information about the Fund’s Trustees and is available upon request, without charge, by calling 1.800.959.4246. Please refer to the Fund’s prospectus for information on the Fund’s sub-advisers.
| | | | | | |
Office of the Fund 11 Greenway Plaza, Suite 1000 Houston, TX 77046-1173 | | Investment Adviser Invesco Advisers, Inc. 1555 Peachtree Street, N.E. Atlanta, GA 30309 | | Distributor Invesco Distributors, Inc. 11 Greenway Plaza, Suite 1000 Houston, TX 77046-1173 | | Auditors PricewaterhouseCoopers LLP 1000 Louisiana Street, Suite 5800 Houston, TX 77002-5678 |
| | | |
| | | | | | |
Counsel to the Fund Stradley Ronon Stevens & Young, LLP 2005 Market Street, Suite 2600 Philadelphia, PA 19103-7018 | | Counsel to the Independent Trustees Goodwin Procter LLP 901 New York Avenue, N.W. Washington, D.C. 20001 | | Transfer Agent Invesco Investment Services, Inc. 11 Greenway Plaza, Suite 1000 Houston, TX 77046-1173 | | Custodian State Street Bank and Trust Company 225 Franklin Street Boston, MA 02110-2801 |
T-4 Invesco Macro Long/Short Fund

Invesco mailing information
Send general correspondence to Invesco Investment Services, Inc., P.O. Box 219078, Kansas City, MO 64121-9078.
Important notice regarding delivery of security holder documents
To reduce Fund expenses, only one copy of most shareholder documents may be mailed to shareholders with multiple accounts at the same address (Householding). Mailing of your shareholder documents may be householded indefinitely unless you instruct us otherwise. If you do not want the mailing of these documents to be combined with those for other members of your household, please contact Invesco Investment Services, Inc. at 800 959 4246 or contact your financial institution. We will begin sending you individual copies for each account within 30 days after receiving your request.
Fund holdings and proxy voting information
The Fund provides a complete list of its holdings four times in each fiscal year, at the quarter ends. For the second and fourth quarters, the lists appear in the Fund’s semiannual and annual reports to shareholders. For the first and third quarters, the Fund files the lists with the Securities and Exchange Commission (SEC) on Form N-Q. The most recent list of portfolio holdings is available at invesco.com/completeqtrholdings. Shareholders can also look up the Fund’s Forms N-Q on the SEC website at sec.gov. Copies of the Fund’s Forms N-Q may be reviewed and copied at the SEC Public Reference Room in Washington, D.C. You can obtain information on the operation of the Public Reference Room, including information about duplicating fee charges, by calling 202 551 8090 or 800 732 0330, or by electronic request at the following email address: publicinfo@sec.gov. The SEC file numbers for the Fund are shown below.
A description of the policies and procedures that the Fund uses to determine how to vote proxies relating to portfolio securities is available without charge, upon request, from our Client Services department at 800 959 4246 or at invesco.com/proxyguidelines. The information is also available on the SEC website, sec.gov.
| | |
Information regarding how the Fund voted proxies related to its portfolio securities during the most recent 12-month period ended June 30 is available at invesco.com/proxysearch. The information is also available on the SEC website, sec.gov. Invesco Advisers, Inc. is an investment adviser; it provides investment advisory services to individual and institutional clients and does not sell securities. Invesco Distributors, Inc. is the US distributor for Invesco Ltd.’s retail mutual funds, exchange-traded funds and institutional money market funds. Both are wholly owned, indirect subsidiaries of Invesco Ltd. | |  |
| | | | |
| SEC file numbers: 811-05426 and 033-19338 | | MLS-AR-1 | | Invesco Distributors, Inc. |
Letters to Shareholders
| | |

Philip Taylor | | Dear Shareholders: This annual report includes information about your Fund, including performance data and a complete list of its investments as of the close of the reporting period. Inside, your Fund’s portfolio managers discuss how they managed your Fund and the factors that affected its performance during the reporting period. I hope you find this report of interest. During the reporting period covered by this report, the US economy showed signs of continued improvement. After contracting in the first quarter of 2014, the economy expanded strongly in the second quarter and unemployment trended lower. Much of the credit for this improvement goes to the US Federal Reserve (the Fed), which undertook an extraordinary asset purchase program following the global financial crisis. The Fed’s goal was to jumpstart the economy by encouraging banks to lend more, businesses to hire more and consumers to spend more. Signs of a stronger US economy prompted the Fed to reduce, or “taper,” its asset purchase program. Despite this, interest rates remained near historical low levels due |
| largely to heavy investor demand for bonds. While signs of economic improvement were evident in the US, European economies showed signs of weakening. That, together with geopolitical uncertainty and worries about the first diagnosed cases of Ebola outside of Africa, caused increased volatility in US and European equities. |
Extended periods of market strength can lull investors into complacency – just as prolonged periods of market weakness or volatility can discourage investors from initiating long-term investment plans. That’s why Invesco has always encouraged investors to work with a professional financial adviser who can stress the importance of starting to save and invest early and the importance of adhering to a disciplined investment plan – when times are good and when they’re uncertain. A financial adviser who knows your unique financial situation, investment goals and risk tolerance can be an invaluable partner as you seek to achieve your financial goals. He or she can offer a long-term perspective when markets are volatile and time-tested advice and guidance when your financial situation or investment goals change.
Timely information when and where you want it
Invesco’s efforts to help investors achieve their financial objectives include providing individual investors and financial professionals with timely information about the markets, the economy and investing – whenever and wherever they want it.
Our website, invesco.com/us, offers a wide range of market insights and investment perspectives. On the website, you’ll find detailed information about our funds, including prices, performance, holdings and portfolio manager commentaries. You can access information about your individual Invesco account whenever it’s convenient for you; just complete a simple, secure online registration. Use the “Log In” box on our home page to get started.
Invesco’s mobile app for iPad® (available free from the App StoreSM) allows you to obtain the same detailed information about your Fund and the same investment insights from our investment leaders, market strategists, economists and retirement experts on the go. You also can watch portfolio manager videos and have instant access to Invesco news and updates wherever you may be.
In addition to the resources accessible on our website and through our mobile app, you can obtain timely updates to help you stay informed about the markets, the economy and investing by connecting with Invesco on Twitter, LinkedIn or Facebook. You can access our blog at blog.invesco.us.com. Our goal is to provide you the information you want, when and where you want it.
Have questions?
For questions about your account, feel free to contact an Invesco client services representative at 800 959 4246. For Invesco-related questions or comments, please email me directly at phil@invesco.com.
All of us at Invesco look forward to serving your investment management needs for many years to come. Thank you for investing with us.
Sincerely,

Philip Taylor
Senior Managing Director, Invesco Ltd.
iPad is a trademark of Apple Inc., registered in the US and other countries. App Store is a service mark of Apple Inc. Invesco Distributors, Inc. is not affiliated with Apple Inc.
2 Invesco MLP Fund
| | |

Bruce Crockett | | Dear Fellow Shareholders: There are a variety of factors that can impact investment performance, many of which are uncontrollable by us as investors. These factors can include various economic trends and geopolitical developments. While the members of the Invesco Funds Board, which I chair, can’t dictate the performance of the Invesco funds, be assured that your Board works diligently throughout the year to focus on how your investments are managed. Our job is to represent you and your interests on a variety of fund management-related matters. We regularly monitor how the portfolio management teams of the Invesco funds are performing in light of ever-changing and often unpredictable economic and market conditions. We review the investment strategies and investment process employed by each fund’s management team as explained in the fund’s prospectus. |
| | Perhaps our most significant responsibility is conducting the annual review of the funds’ |
advisory and sub-advisory contracts with Invesco Advisers and its affiliates. This annual review, which is required by the Investment Company Act of 1940, focuses on the nature and quality of the services Invesco provides as the adviser to the Invesco funds and the reasonableness of the fees that it charges for those services. Each year, we spend months carefully reviewing information from Invesco that allows us to evaluate the quality of its services and the reasonableness of its fees. We also use information from a variety of independent sources, including materials provided by the independent senior officer of the Invesco funds, who reports directly to the independent trustees on the Board. Additionally, we meet with legal counsel and review performance and fee data prepared for us by Lipper Inc., an independent, third-party firm widely recognized as a leader in its field.
After a careful review, the members of the Invesco Funds Board approved the continuation of advisory and sub-advisory contracts with Invesco Advisers and its affiliates. Be assured that your Board will continue working on behalf of fund shareholders, keeping your needs and interests uppermost in our minds.
As always, please contact me at bruce@brucecrockett.com with any questions or concerns you may have. On behalf of the Board, we look forward to continuing to represent your interests and serving your needs.
Sincerely,

Bruce L. Crockett
Independent Chair
Invesco Funds Board of Trustees
3 Invesco MLP Fund
Management’s Discussion of Fund Performance
Performance summary
From the Fund’s inception on August 29, 2014, to the close of the reporting period on October 31, 2014, master limited partnerships (MLPs) were volatile and generally produced negative returns, due to sharp declines in crude oil prices. From its inception to the close of the reporting period, Invesco MLP Fund produced negative returns and underperformed its style specific benchmark, the Alerian MLP Index. Fund underperformance was primarily due to security selection in and overweight exposure to the oilfield services sector; a lack of exposure to propane MLPs; and security selection in the natural gas pipelines and storage sector.
Additional performance information for your Fund appears later in this report.
Fund vs. Indexes
Cumulative total returns, 8/29/14 to 10/31/14, at net asset value (NAV). Performance shown does not include applicable contingent deferred sales charges (CDSC) or front-end sales charges, which would have reduced performance.
| | | | |
Class A Shares | | | -6.50 | % |
Class C Shares | | | -6.60 | |
Class R Shares | | | -6.50 | |
Class Y Shares | | | -6.40 | |
Class R5 Shares | | | -6.40 | |
Class R6 Shares | | | -6.40 | |
S&P 500 Indexq (Broad Market Index)* | | | 1.01 | |
Alerian MLP Indexq (Style-Specific Index)* | | | -6.09 | |
Lipper Energy MLP Funds Indexn (Peer Group Index)* | | | -5.50 | |
Source(s): qFactSet Research Systems Inc.; nLipper Inc.
*The returns for the Fund’s indexes are from 8/31/14, the month-end closest to the Fund’s inception.
Market conditions and your Fund
Overall, US equity markets experienced significant volatility from the Fund’s inception on August 29, 2014, through the end of its reporting period end on October 31, 2014. The US economy continued to grow, with improvements in employment and domestic demand. The US Federal Reserve ended its extraordinary asset-purchase program, called quantitative easing, with a final purchase in October 2014. However, concerns over global economic growth and geopolitical uncertainty in the Middle East and Russia added layers of uncertainty for equity markets, which fell late in the
reporting period. Risk appetite diminished and volatility spiked toward the end of the reporting period. However, equity markets recovered in the last few weeks of October.
Yields on 10-year US Treasuries and commodities were volatile and ended the reporting period lower, while the US dollar rose to a four-year high versus other major currencies. Of particular note, crude oil prices fell significantly, largely the result of a downward revision in 2014 demand forecasts by the Energy Information Agency as well as increased supply from Libya and Iraq. As a result, investors sold MLP equities somewhat indiscriminately, regardless of their actual exposure
to crude oil prices. As a result, MLP equities generally underperformed the broad market, as measured by the S&P 500 Index, during the reporting period and the Fund underperformed its style-specific index.
Security selection in and overweight exposure to the oilfield services sector; a lack of exposure to propane MLPs; and security selection in the natural gas pipelines and storage sector were the primary detractors from Fund performance during the report period. Conversely, underweight exposure to upstream MLPs and lack of exposure to marine and coal MLPs contributed to Fund performance. Ancillary cash in the Fund also was beneficial given the declines in equity markets.
Despite overall negative security selection from the pipelines and midstream diversified MLP sector, the top contributor to Fund performance during the reporting period was Energy Transfer Partners. Energy Transfer Partners operates as a pipeline and midstream diversified MLP with exposure to natural gas, natural gas liquids (NGL), crude oil and refined products. Its operations include intrastate and interstate transportation and storage, gathering and processing, NGL transportation and storage, as well as retail sale of gasoline and middle distillates and the operation of convenience stores in 25 states, primarily on the East Coast and in the Midwest.
MarkWest Energy Partners, an MLP focused on gathering and processing natural gas, NGL and crude oil, was among the top detractors from Fund performance for the reporting period. MarkWest is the largest processor and fractionator in both the southern Appalachian Basin and the Marcellus Shale in the Northeast. It also offers midstream services in the Haynesville Shale in the South and Eagle
| | | | |
| Portfolio Composition | |
By MLP sector | | | | |
| |
Pipelines & Midstream Diversified | | | 35.8 | % |
Gathering & Processing MLP | | | 19.4 | |
Refined Products Pipelines & Terminals | | | 17.6 | |
General Partner (C-Corp) | | | 16.1 | |
General Partner (MLP) | | | 3.7 | |
Upstream MLP | | | 3.0 | |
Oilfield Services | | | 1.8 | |
Natural Gas Pipelines & Storage | | | 0.5 | |
Money Market Funds Plus Other Assets Less Liabilities | | | 2.1 | |
| | | | | | |
| Top 10 Equity Holdings* | |
| | |
1. | | Enterprise Products Partners L.P. | | | 15.2 | % |
2. | | Plains All American Pipeline, L.P. | | | 10.7 | |
3. | | Magellan Midstream Partners, L.P. | | | 8.2 | |
4. | | Energy Transfer Partners, L.P. | | | 8.0 | |
5. | | Kinder Morgan Inc. | | | 6.4 | |
6. | | MarkWest Energy Partners, L.P. | | | 5.4 | |
7. | | Williams Cos. Inc. (The) | | | 4.5 | |
8. | | Sunoco Logistics Partners L.P. | | | 4.2 | |
9. | | EQT Midstream Partners L.P. | | | 4.1 | |
10. | | Energy Transfer Equity, L.P. | | | 3.7 | |
| | | | |
Total Net Assets | | $ | 5.3 million | |
| | | | |
| |
Total Number of Holdings* | | | 28 | |
The Fund’s holdings are subject to change, and there is no assurance that the Fund will continue to hold any particular security.
*Excluding money market fund holdings.
4 Invesco MLP Fund
Ford Shale in South Texas, as well as the Utica Basin in the Northeast.
During the reporting period, the Fund, on average, maintained overweight exposure to refined products pipelines and terminals, gathering and processing MLPs, pipelines and midstream diversified MLPs and oilfield services relative to its style-specific index. The Fund, on average, maintained underweight exposure to upstream MLPs as well as natural gas pipelines and storage. The Fund lacked exposure to several sectors in which its style-specific benchmark had minor exposure: marine, non-traditional, propane and coal. In general, the Fund had a bias toward higher quality assets, generally lower leveraged balance sheets and above-average growth prospects.
We thank you for your investment in Invesco MLP Fund.
The views and opinions expressed in management’s discussion of Fund performance are those of Invesco Advisers, Inc. These views and opinions are subject to change at any time based on factors such as market and economic conditions. These views and opinions may not be relied upon as investment advice or recommendations, or as an offer for a particular security. The information is not a complete analysis of every aspect of any market, country, industry, security or the Fund. Statements of fact are from sources considered reliable, but Invesco Advisers, Inc. makes no representation or warranty as to their completeness or accuracy. Although historical performance is no guarantee of future results, these insights may help you understand our investment management philosophy.
See important Fund and, if applicable, index disclosures later in this report.
| | |

| | Joe Rodriguez Jr. Portfolio Manager, is lead manager of Invesco MLP Fund. He joined Invesco in 1990. Mr. Rodriguez |
| earned a BBA in economics and finance and an MBA in finance from Baylor University. |
| | |

| | Mark Blackburn Chartered Financial Analyst, Portfolio Manager, is manager of Invesco MLP Fund. He joined Invesco in |
| 1998. Mr. Blackburn earned a BS in accounting from Louisiana State University and an MBA from Southern Methodist University. |
| | |

| | Paul Curbo Chartered Financial Analyst, Portfolio Manager, is manager of Invesco MLP Fund. He joined Invesco in |
| 1998. Mr. Curbo earned a BBA in finance from The University of Texas at Austin. |
| | |

| | Darin Turner Portfolio Manager, is manager of Invesco MLP Fund. He joined Invesco in 2005. Mr. Turner earned a |
| BBA in finance from Baylor University, an MS in real estate from The University of Texas at Arlington and an MBA specializing in investments from Southern Methodist University. |
5 Invesco MLP Fund
Your Fund’s Performance
| | | | |
Cumulative Total Returns As of 10/31/14, including maximum applicable sales charges | |
| |
Class A Shares | | | | |
Inception (8/29/14) | | | -11.63 | % |
| |
Class C Shares | | | | |
Inception (8/29/14) | | | -7.53 | % |
| |
Class R Shares | | | | |
Inception (8/29/14) | | | -6.50 | % |
| |
Class Y Shares | | | | |
Inception (8/29/14) | | | -6.40 | % |
| |
Class R5 Shares | | | | |
Inception (8/29/14) | | | -6.40 | % |
| |
Class R6 Shares | | | | |
Inception (8/29/14) | | | -6.40 | % |
The performance data quoted represent past performance and cannot guarantee comparable future results; current performance may be lower or higher. Please visit invesco.com/performance for the most recent month-end performance. Performance figures reflect reinvested distributions, changes in net asset value and the effect of the maximum sales charge unless otherwise stated. Performance figures do not reflect deduction of taxes a shareholder would pay on Fund distributions or sale of Fund shares. Investment return and
| | | | |
Cumulative Total Returns As of 9/30/14, the most recent calendar quarter end, including maximum applicable sales charges | |
| |
Class A Shares | | | | |
Inception (8/29/14) | | | -6.99 | % |
| |
Class C Shares | | | | |
Inception (8/29/14) | | | -2.68 | % |
| |
Class R Shares | | | | |
Inception (8/29/14) | | | -1.60 | % |
| |
Class Y Shares | | | | |
Inception (8/29/14) | | | -1.50 | % |
| |
Class R5 Shares | | | | |
Inception (8/29/14) | | | -1.60 | % |
| |
Class R6 Shares | | | | |
Inception (8/29/14) | | | -1.60 | % |
principal value will fluctuate so that you may have a gain or loss when you sell shares.
The net annual Fund operating expense ratio set forth in the most recent Fund prospectus as of the date of this report for Class A, Class C, Class R, Class Y, Class R5 and Class R6 shares was 4.79%, 5.54%, 5.04%, 4.54%, 4.54% and 4.54%, respectively.1 The total annual Fund operating expense ratio set forth in the most recent Fund prospectus as of the date of this report for Class A, Class C,
Class R, Class Y, Class R5 and Class R6 shares was 11.96%, 12.71%, 12.21%, 11.71%, 11.60% and 11.55%, respectively. The expense ratios presented above may vary from the expense ratios presented in other sections of this report that are based on expenses incurred during the period covered by this report.
Class A share performance reflects the maximum 5.50% sales charge, and Class C share performance reflects the applicable contingent deferred sales charge (CDSC) for the period involved. The CDSC on Class C shares is 1% for the first year after purchase. Class R, Class Y, Class R5 and Class R6 class shares do not have a front-end sales charge or a CDSC; therefore, performance is at net asset value.
The performance of the Fund’s share classes will differ primarily due to different sales charge structures and class expenses.
Had the adviser not waived fees and/or reimbursed expenses, performance would have been lower.
| 1 | Total annual Fund operating expenses after any contractual fee waivers and/or expense reimbursements by the adviser in effect through at least February 29, 2016. See current prospectus for more information. |
Invesco MLP Fund’s investment objective is capital appreciation and secondarily income.
| n | | Unless otherwise stated, information presented in this report is as of October 31, 2014, and is based on total net assets. |
| n | | Unless otherwise noted, all data provided by Invesco. |
| n | | To access your Fund’s reports/prospectus, visit invesco.com/fundreports. |
About share classes
| n | | Class R shares are generally available only to employer sponsored retirement and benefit plans. Please see the prospectus for more information. |
| n | | Class Y shares are available only to certain investors. Please see the prospectus for more information. |
| n | | Class R5 shares and Class R6 shares are primarily intended for employer sponsored retirement and benefit plans that meet certain standards and for institutional investors. Please see the prospectus for more information. |
Principal risks of investing in the Fund
| n | | Deferred tax risk. The Fund is classified for federal tax purposes as a taxable regular corporation or so-called Sub-chapter “C” corporation. As a “C” corporation, the Fund is subject to US |
| | federal income tax on its taxable income at the graduated rates applicable to corporations (currently at a maximum rate of 35%) as well as state and local income taxes. The Fund will not benefit from the current favorable federal income tax rates on long term capital gains and Fund income, losses and expenses will not be passed through to the Fund’s shareholders. An investment strategy whereby a fund is taxed as a regular corporation, or “C” corporation, rather than as a regulated investment company for US federal income tax purposes, is a relatively recent strategy for open-end registered investment companies such as the Fund. This strategy involves complicated accounting, tax, net asset value (NAV) and share valuation aspects that would cause the Fund to differ significantly from most other open- end registered investment companies. |
| n | | Energy infrastructure MLP risk. The Fund will concentrate its investments in the energy sector. Energy infrastructure MLPs are subject to a variety of industry specific risk factors that may adversely affect their business or operations, including a decrease in production or reduced volumes of natural gas or other energy commodities available for transporting, processing, storing or distributing; changes in energy commodity prices; a sustained reduced demand for crude oil, natural gas and refined petroleum products; depletion of the natural gas reserves or other commodities if not replaced; natural disasters, extreme weather and environmental hazards; rising interest rates which could result in a higher cost of capital and drive investors into other investment opportunities; and threats of attack by terrorists on energy assets. Energy infrastructure MLPs are also subject to significant federal, state |
continued on page 7
6 Invesco MLP Fund
and local government regulation in various aspects of their operations, including how facilities are constructed, maintained and operated, environmental and safety controls, and the prices they may charge for products and services. In addition, taxes, government regulation, international politics, price and supply fluctuations, volatile interest rates and energy conservation may cause difficulties for energy infrastructure MLPs.
| n | | Management risk. The investment techniques and risk analysis used by the Fund’s portfolio managers may not produce the desired results. |
| n | | Market risk. The prices of and the income generated by the Fund’s securities may decline in response to, among other things, investor sentiment, general economic and market conditions, regional or global instability, and currency and interest rate fluctuations. |
| n | | MLP risk. An MLP is a public limited partnership or limited liability company. Although the characteristics of MLPs closely resemble a traditional limited partnership, a major difference is that MLPs may trade on a public exchange or in the over-the-counter market. The ability to trade on a public exchange or in the over-the-counter market provides a certain amount of liquidity not found in many limited partnership investments. However, MLP interests may be less liquid and subject to more abrupt or erratic price movements than conventional publicly traded securities. The risks of investing in an MLP are similar to those of investing in a partnership and include more flexible governance structures, which could result in less protection for investors than investments in a corporation. Investors in an MLP would normally not be liable for the debts of the MLP beyond the amount that the investor has contributed but investors may not be shielded to the same extent that a shareholder of a corporation would be. MLPs are generally considered interest-rate sensitive investments. During periods of interest rate volatility, these investments may not provide attractive returns. |
| n | | MLP tax risk. MLPs taxed as partnerships do not pay US federal income tax at the partnership level. Rather, each partner is allocated a share of the partnership’s income, gains, losses, deductions |
and expenses. A change in current tax law, or a change in the underlying business mix of a given MLP, could result in an MLP being treated as a corporation for US federal income tax purposes, which would result in such MLP being required to pay US federal income tax on its taxable income. The classification of an MLP as a corporation for US federal income tax purposes would have the effect of reducing the amount of cash available for distribution by the MLP. Thus, if any of the MLPs owned by the Fund were treated as a corporation for US federal income tax purposes, it could result in a reduction of the value of the Fund’s investment, and consequently your investment in the Fund and lower income. MLPs taxed as partnerships file a partnership tax return for US federal, state and local income tax purposes and communicate to each investor in such MLP the investor’s allocable share of the MLP’s income, gains, losses, deductions and expenses via a “Schedule K-1.” Each year, the Fund will send you an annual tax statement (Form 1099) to assist you in completing your federal, state and local tax returns. An MLP might need to amend its partnership tax return and, in turn, send amended Schedules K-1 to investors in the MLP, such as the Fund. When necessary, the Fund will send you a corrected Form 1099 to reflect Schedule K-1 information reclassified by an MLP, which could, in turn, require you to amend your federal, state or local tax returns.
| n | | Non-diversification risk. The Fund is non-diversified and can invest a greater portion of its assets in a small number of issuers or a single issuer. A change in the value of the issuer could affect the value of the Fund more than if it was a diversified fund. |
| n | | Small- and mid-capitalization risk. Stocks of small- and mid-sized companies tend to be more vulnerable to adverse developments and may have little or no operating history or track record of success, and limited product lines, markets, management and financial resources. The securities of small- and mid-sized companies may be more volatile due to less market interest and less publicly available information about the issuer. They |
also may be illiquid or restricted as to resale, or may trade less frequently and in smaller volumes, all of which may cause difficulty when establishing or closing a position at a desirable price.
About indexes used in this report
| n | | The S&P 500® Index is an unmanaged index considered representative of the US stock market. |
| n | | The Alerian MLP Index is a market-cap weighted, float-adjusted index created to provide a comprehensive benchmark for investors to track the performance of the energy MLP sector. The index components are selected by Alerian, LLC. |
| n | | The Lipper Energy MLP Funds Index is an unmanaged index considered representative of energy MLP funds tracked by Lipper. |
| n | | The Fund is not managed to track the performance of any particular index, including the index(es) described here, and consequently, the performance of the Fund may deviate significantly from the performance of the index(es). |
| n | | A direct investment cannot be made in an index. Unless otherwise indicated, index results include reinvested dividends, and they do not reflect sales charges. Performance of the peer group, if applicable, reflects fund expenses; performance of a market index does not. |
Other information
| n | | The returns shown in management’s discussion of Fund performance are based on net asset values (NAVs) calculated for shareholder transactions. Generally accepted accounting principles require adjustments to be made to the net assets of the Fund at period end for financial reporting purposes, and as such, the NAVs for shareholder transactions and the returns based on those NAVs may differ from the NAVs and returns reported in the Financial Highlights. |
| n | | Sectors used in this report are according to the Alerian MLP Index. |
This report must be accompanied or preceded by a currently effective Fund prospectus, which contains more complete information, including sales charges and expenses. Investors should read it carefully before investing.
NOT FDIC INSURED | MAY LOSE VALUE | NO BANK GUARANTEE
7 Invesco MLP Fund
Schedule of Investments
October 31, 2014
| | | | | | | | |
| | | Units | | | Value | |
Master Limited Partnerships–81.77% | |
| Gathering & Processing MLP–19.43% | |
Access Midstream Partners L.P. | | | 3,025 | | | $ | 188,427 | |
EnLink Midstream Partners L.P. | | | 2,168 | | | | 65,040 | |
EQT Midstream Partners L.P. | | | 2,479 | | | | 219,590 | |
MarkWest Energy Partners, L.P. | | | 4,125 | | | | 288,956 | |
Regency Energy Partners L.P. | | | 1,780 | | | | 53,400 | |
Targa Resources Partners L.P. | | | 1,671 | | | | 102,065 | |
Western Gas Partners L.P. | | | 1,644 | | | | 114,916 | |
| | | | | 1,032,394 | |
|
| General Partner (MLP)–3.67% | |
Energy Transfer Equity, L.P. | | | 3,339 | | | | 194,864 | |
|
| Natural Gas Pipelines & Storage–0.49% | |
TC Pipelines, L.P. | | | 419 | | | | 26,125 | |
|
| Oilfield Services–1.81% | |
Emerge Energy Services L.P. | | | 301 | | | | 26,614 | |
Hi-Crush Partners L.P. | | | 1,614 | | | | 69,612 | |
| | | | | 96,226 | |
|
| Pipelines & Midstream Diversified–35.75% | |
Enbridge Energy Partners, L.P. | | | 2,793 | | | | 100,744 | |
Energy Transfer Partners, L.P. | | | 6,595 | | | | 424,916 | |
Enterprise Products Partners L.P. | | | 21,855 | | | | 806,449 | |
Plains All American Pipeline, L.P. | | | 10,061 | | | | 566,937 | |
| | | | | 1,899,046 | |
|
| Refined Products Pipelines & Terminals–17.63% | |
Magellan Midstream Partners, L.P. | | | 5,338 | | | | 437,022 | |
MPLX L.P. | | | 863 | | | | 57,545 | |
NGL Energy Partners L.P. | | | 2,186 | | | | 75,111 | |
| | | | | | | | |
| | | Units | | | Value | |
| Refined Products Pipelines & Terminals–(continued) | |
Oiltanking Partners L.P. | | | 716 | | | $ | 32,635 | |
Sunoco Logistics Partners L.P. | | | 4,624 | | | | 220,704 | |
Tesoro Logistics L.P. | | | 2,015 | | | | 113,444 | |
| | | | | 936,461 | |
|
| Upstream MLP–2.99% | |
Linn Energy LLC | | | 1,262 | | | | 31,474 | |
Legacy Reserves L.P. | | | 2,043 | | | | 44,211 | |
Memorial Production Partners L.P. | | | 3,983 | | | | 83,364 | |
| | | | | | | | 159,049 | |
Total Master Limited Partnerships
(Cost $4,601,180) | | | | 4,344,165 | |
| | |
| | | Shares | | | | |
Common Stocks–16.10% | |
| General Partner (C-Corp.)–16.10% | |
Kinder Morgan Inc. | | | 8,818 | | | | 341,256 | |
ONEOK, Inc. | | | 1,837 | | | | 108,273 | |
Targa Resources Corp. | | | 1,292 | | | | 166,190 | |
Williams Cos. Inc. (The) | | | 4,315 | | | | 239,526 | |
Total Common Stocks
(Cost $893,116) | | | | 855,245 | |
|
Money Market Funds–2.60% | |
Liquid Assets Portfolio–Institutional
Class(a) | | | 69,104 | | | | 69,104 | |
Premier Portfolio–Institutional Class(a) | | | 69,105 | | | | 69,105 | |
Total Money Market Funds
(Cost $138,209) | | | | 138,209 | |
TOTAL INVESTMENTS–100.47%
(Cost $5,632,505) | | | | 5,337,619 | |
OTHER ASSETS LESS LIABILITIES–(0.47)% | | | | (25,094 | ) |
NET ASSETS–100.00% | | | $ | 5,312,525 | |
Notes to Schedule of Investments:
| (a) | The money market fund and the Fund are affiliated by having the same investment adviser. |
See accompanying Notes to Financial Statements which are an integral part of the financial statements.
8 Invesco MLP Fund
Statement of Assets and Liabilities
October 31, 2014
| | | | |
Assets: | |
Investments, at value (Cost $5,494,296) | | $ | 5,199,410 | |
Investments in affiliated money market funds, at value and cost | | | 138,209 | |
Total investments, at value (Cost $5,632,505) | | | 5,337,619 | |
Receivable for: | | | | |
Investments sold | | | 39,231 | |
Fund shares sold | | | 14,134 | |
Dividends | | | 38,241 | |
Fund expenses absorbed | | | 367,453 | |
Deferred tax asset, net | | | 0 | |
Other assets | | | 80,441 | |
Total assets | | | 5,877,119 | |
|
Liabilities: | |
Payable for: | | | | |
Investments purchased | | | 107,242 | |
Fund shares reacquired | | | 2,189 | |
Accrued fees to affiliates | | | 2,331 | |
Accrued trustees’ and officers’ fees and benefits | | | 1,603 | |
Accrued other operating expenses | | | 451,229 | |
Total liabilities | | | 564,594 | |
Net assets applicable to shares outstanding | | $ | 5,312,525 | |
|
Net assets consist of: | |
Shares of beneficial interest | | $ | 5,645,609 | |
Undistributed net investment income (loss), net of taxes | | | (9,540 | ) |
Undistributed net realized gain (loss), net of taxes | | | (28,658 | ) |
Net unrealized appreciation (depreciation), net of taxes | | | (294,886 | ) |
| | | $ | 5,312,525 | |
| | | | |
Net Assets: | |
Class A | | $ | 1,931,392 | |
Class C | | $ | 1,713,329 | |
Class R | | $ | 21,402 | |
Class Y | | $ | 1,627,670 | |
Class R5 | | $ | 9,366 | |
Class R6 | | $ | 9,366 | |
|
Shares outstanding, $0.01 par value per share,
with an unlimited number of shares authorized: | |
Class A | | | 206,504 | |
Class C | | | 183,520 | |
Class R | | | 2,289 | |
Class Y | | | 173,957 | |
Class R5 | | | 1,001 | |
Class R6 | | | 1,001 | |
Class A: | | | | |
Net asset value per share | | $ | 9.35 | |
Maximum offering price per share | | | | |
(Net asset value of $9.35 ¸ 94.50%) | | $ | 9.89 | |
Class C: | | | | |
Net asset value and offering price per share | | $ | 9.34 | |
Class R: | | | | |
Net asset value and offering price per share | | $ | 9.35 | |
Class Y: | | | | |
Net asset value and offering price per share | | $ | 9.36 | |
Class R5: | | | | |
Net asset value and offering price per share | | $ | 9.36 | |
Class R6: | | | | |
Net asset value and offering price per share | | $ | 9.36 | |
See accompanying Notes to Financial Statements which are an integral part of the financial statements.
9 Invesco MLP Fund
Statement of Operations
For the period August 29, 2014 (commencement date) through October 31, 2014
| | | | |
Investment income: | |
Dividends (net of return of capital distributions of $33,334) | | $ | 7,059 | |
Dividends from affiliated money market funds | | | 31 | |
Total investment income | | | 7,090 | |
| |
Expenses: | | | | |
Advisory fees | | | 7,470 | |
Administrative services fees | | | 8,767 | |
Custodian fees | | | 867 | |
Distribution fees: | | | | |
Class A | | | 751 | |
Class C | | | 1,635 | |
Class R | | | 9 | |
Transfer agent fees — A, C, R and Y | | | 934 | |
Transfer agent fees — R5 | | | 2 | |
Transfer agent fees — R6 | | | 1 | |
Trustees’ and officers’ fees and benefits | | | 1,603 | |
Professional services fees | | | 500,834 | |
Other | | | 19,639 | |
Total expenses, before waivers and taxes | | | 542,512 | |
Less: Fees waived and expenses reimbursed | | | (530,823 | ) |
Net expenses, before taxes | | | 11,689 | |
Net investment income (loss), before taxes | | | (4,599 | ) |
Net tax expense (benefit) | | | 0 | |
Net investment income (loss), net of taxes | | | (4,599 | ) |
| |
Realized and unrealized gain (loss) from: | | | | |
Net realized gain (loss) from: | | | | |
Investment securities | | | (28,658 | ) |
Net tax expense (benefit) | | | 0 | |
Net realized gain (loss), net of taxes | | | (28,658 | ) |
Change in net unrealized appreciation (depreciation) of: | | | | |
Investment securities | | | (294,886 | ) |
Net tax expense (benefit) | | | 0 | |
Net change in unrealized appreciation (depreciation), net of taxes | | | (294,886 | ) |
Net realized and unrealized gain (loss), net of taxes | | | (323,544 | ) |
Net increase (decrease) in net assets resulting from operations | | $ | (328,143 | ) |
See accompanying Notes to Financial Statements which are an integral part of the financial statements.
10 Invesco MLP Fund
Statement of Changes in Net Assets
For the period August 29, 2014 (commencement date) through October 31, 2014
| | | | |
| | | August 29, 2014 (commencement date)
through October 31, 2014 | |
Operations: | |
Net investment income (loss), net of taxes | | $ | (4,599 | ) |
Net realized gain (loss), net of taxes | | | (28,658 | ) |
Change in net unrealized appreciation (depreciation), net of taxes | | | (294,886 | ) |
Net increase (decrease) in net assets resulting from operations | | | (328,143 | ) |
| |
Share transactions–net: | | | | |
Class A | | | 2,054,278 | |
Class C | | | 1,815,276 | |
Class R | | | 22,010 | |
Class Y | | | 1,729,084 | |
Class R5 | | | 10,010 | |
Class R6 | | | 10,010 | |
Net increase in net assets resulting from share transactions | | | 5,640,668 | |
Net increase in net assets | | | 5,312,525 | |
| |
Net assets: | | | | |
Beginning of year | | | — | |
End of year (includes undistributed net investment income (loss), net of taxes, of $(9,540)) | | $ | 5,312,525 | |
Notes to Financial Statements
October 31, 2014
NOTE 1—Significant Accounting Policies
Invesco MLP Fund (the “Fund”) is a series portfolio of AIM Investment Funds (Invesco Investment Funds) (the “Trust”). The Trust is organized as a Delaware statutory trust and is registered under the Investment Company Act of 1940, as amended (the “1940 Act”), as an open-end series management investment company consisting of twenty-four separate series portfolios, each authorized to issue an unlimited number of shares of beneficial interest. The assets, liabilities and operations of each portfolio are accounted for separately. Information presented in these financial statements pertains only to the Fund. Matters affecting each portfolio or class will be voted on exclusively by the shareholders of such portfolio or class. The Fund commenced operations on August 29, 2014.
The Fund’s investment objective is capital appreciation and secondarily income.
The Fund currently consists of six different classes of shares: Class A, Class C, Class R, Class Y, Class R5 and Class R6. Class A shares are sold with a front-end sales charge unless certain waiver criteria are met and under certain circumstances load waived shares may be subject to contingent deferred sales charges (“CDSC”). Class C shares are sold with a CDSC. Class R, Class Y, Class R5 and Class R6 shares are sold at net asset value.
The following is a summary of the significant accounting policies followed by the Fund in the preparation of its financial statements.
| A. | Security Valuations — Securities, including restricted securities, are valued according to the following policy. |
A security listed or traded on an exchange (except convertible securities) is valued at its last sales price or official closing price as of the close of the customary trading session on the exchange where the security is principally traded, or lacking any sales or official closing price on a particular day, the security may be valued at the closing bid price on that day. Securities traded in the over-the-counter market are valued based on prices furnished by independent pricing services or market makers. When such securities are valued by an independent pricing service they may be considered fair valued. Futures contracts are valued at the final settlement price set by an exchange on which they are principally traded. Listed options are valued at the mean between the last bid and ask prices from the exchange on which they are principally traded. Options not listed on an exchange are valued by an independent source at the mean between the last bid and ask prices. For purposes of determining net asset value per share, futures and option contracts generally are valued 15 minutes after the close of the customary trading session of the New York Stock Exchange (“NYSE”).
Investments in open-end and closed-end registered investment companies that do not trade on an exchange are valued at the end of day net asset value per share. Investments in open-end and closed-end registered investment companies that trade on an exchange are valued at the last sales price or official closing price as of the close of the customary trading session on the exchange where the security is principally traded.
Debt obligations (including convertible securities) and unlisted equities are fair valued using an evaluated quote provided by an independent pricing service. Evaluated quotes provided by the pricing service may be determined without exclusive reliance on quoted prices, and may reflect appropriate factors such as institution-size trading in similar groups of securities, developments related to specific securities, dividend rate (for unlisted equities), yield (for debt obligations), quality, type of issue, coupon rate (for debt obligations), maturity (for debt obligations), individual trading characteristics and other market data. Debt obligations are subject to interest rate and credit risks. In addition, all debt obligations involve some risk of default with respect to interest and/or principal payments.
11 Invesco MLP Fund
Foreign securities’ (including foreign exchange contracts) prices are converted into U.S. dollar amounts using the applicable exchange rates as of the close of the NYSE. If market quotations are available and reliable for foreign exchange-traded equity securities, the securities will be valued at the market quotations. Because trading hours for certain foreign securities end before the close of the NYSE, closing market quotations may become unreliable. If between the time trading ends on a particular security and the close of the customary trading session on the NYSE, events occur that the Adviser determines are significant and make the closing price unreliable, the Fund may fair value the security. If the event is likely to have affected the closing price of the security, the security will be valued at fair value in good faith using procedures approved by the Board of Trustees. Adjustments to closing prices to reflect fair value may also be based on a screening process of an independent pricing service to indicate the degree of certainty, based on historical data, that the closing price in the principal market where a foreign security trades is not the current value as of the close of the NYSE. Foreign securities’ prices meeting the approved degree of certainty that the price is not reflective of current value will be priced at the indication of fair value from the independent pricing service. Multiple factors may be considered by the independent pricing service in determining adjustments to reflect fair value and may include information relating to sector indices, American Depositary Receipts and domestic and foreign index futures. Foreign securities may have additional risks including exchange rate changes, potential for sharply devalued currencies and high inflation, political and economic upheaval, the relative lack of issuer information, relatively low market liquidity and the potential lack of strict financial and accounting controls and standards.
Securities for which market prices are not provided by any of the above methods may be valued based upon quotes furnished by independent sources. The last bid price may be used to value equity securities. The mean between the last bid and ask prices is used to value debt obligations, including corporate loans.
Securities for which market quotations are not readily available or became unreliable are valued at fair value as determined in good faith by or under the supervision of the Trust’s officers following procedures approved by the Board of Trustees. Issuer specific events, market trends, bid/ask quotes of brokers and information providers and other market data may be reviewed in the course of making a good faith determination of a security’s fair value.
The Fund may invest in securities that are subject to interest rate risk, meaning the risk that the prices will generally fall as interest rates rise and, conversely, the prices will generally rise as interest rates fall. Specific securities differ in their sensitivity to changes in interest rates depending on their individual characteristics. Changes in interest rates may result in increased market volatility, which may affect the value and/or liquidity of certain of the Fund’s investments.
Valuations change in response to many factors including the historical and prospective earnings of the issuer, the value of the issuer’s assets, general economic conditions, interest rates, investor perceptions and market liquidity. Because of the inherent uncertainties of valuation, the values reflected in the financial statements may materially differ from the value received upon actual sale of those investments.
| B. | Securities Transactions and Investment Income — Securities transactions are accounted for on a trade date basis. Realized gains or losses on sales are computed on the basis of specific identification of the securities sold. Interest income (net of withholding tax, if any) is recorded on the accrual basis from settlement date. Dividend income (net of withholding tax, if any) is recorded on the ex-dividend date. |
The Fund may periodically participate in litigation related to Fund investments. As such, the Fund may receive proceeds from litigation settlements. Any proceeds received are included in the Statement of Operations as realized gain (loss) for investments no longer held and as unrealized gain (loss) for investments still held.
Brokerage commissions and mark ups are considered transaction costs and are recorded as an increase to the cost basis of securities purchased and/or a reduction of proceeds on a sale of securities. Such transaction costs are included in the determination of net realized and unrealized gain (loss) from investment securities reported in the Statement of Operations and the Statement of Changes in Net Assets and the net realized and unrealized gains (losses) on securities per share in the Financial Highlights. Transaction costs are included in the calculation of the Fund’s net asset value and, accordingly, they reduce the Fund’s total returns. These transaction costs are not considered operating expenses and are not reflected in net investment income reported in the Statement of Operations and Statement of Changes in Net Assets, or the net investment income per share and ratios of expenses and net investment income reported in the Financial Highlights, nor are they limited by any expense limitation arrangements between the Fund and the investment adviser.
The Fund allocates income and realized and unrealized capital gains and losses to a class based on the relative net assets of each class.
| C. | Country Determination — For the purposes of making investment selection decisions and presentation in the Schedule of Investments, the investment adviser may determine the country in which an issuer is located and/or credit risk exposure based on various factors. These factors include the laws of the country under which the issuer is organized, where the issuer maintains a principal office, the country in which the issuer derives 50% or more of its total revenues and the country that has the primary market for the issuer’s securities, as well as other criteria. Among the other criteria that may be evaluated for making this determination are the country in which the issuer maintains 50% or more of its assets, the type of security, financial guarantees and enhancements, the nature of the collateral and the sponsor organization. Country of issuer and/or credit risk exposure has been determined to be the United States of America, unless otherwise noted. |
| D. | Distributions — Distributions from net investment income, if any, are declared and paid quarterly and are recorded on the ex-dividend date. Distributions from net realized capital gain, if any, are generally declared and paid annually and recorded on the ex-dividend date. |
| E. | Master Limited Partnerships — The Fund primarily invests in Master Limited Partnerships (MLPs). MLPs are publicly traded partnerships and limited liability companies taxed as partnerships under the Internal Revenue Code of 1986, as amended (the “Internal Revenue Code”). The Fund principally invests in MLPs that derive their revenue primarily from businesses involved in the gathering, transporting, processing, treating, storing, refining, distributing, mining or marketing of natural gas, natural gas liquids, crude oil, refined products or coal (energy infrastructure MLPs). The Fund is a partner in each MLP; accordingly, the Fund is required to take into account the Fund’s allocable share of income, gains, losses, deductions, expenses, and tax credits recognized by each MLP. |
The Fund is non-diversified and concentrates its investments in the energy sector. Energy infrastructure MLPs are subject to a variety of industry specific risk factors that may adversely affect their business or operations, including a decrease in production or reduced volumes of natural gas or other energy commodities available for transporting, processing, storing or distributing; changes in energy commodity prices; a sustained reduced demand for crude oil, natural gas and refined petroleum products; depletion of natural gas reserves or other commodities if not replaced; natural disasters, extreme weather and environmental hazards; rising interest rates, how facilities are constructed, maintained and operated, environmental and safety controls, and the prices they may charge for products and services. In addition, taxes, government regulation, international politics, price, and supply fluctuations, volatile interest rates and energy conservation may cause difficulties for energy infrastructure MLPs.
12 Invesco MLP Fund
MLP’s may be less liquid and subject to more abrupt or erratic price movements than conventional publicly traded securities.
| F. | Return of Capital — Distributions received from the Fund’s investments in MLPs generally are comprised of income and return of capital. The Fund records investment income and return of capital based on estimates made at the time such distributions are received. The return of capital portion of the distribution is a reduction to investment income that results in an equivalent reduction in the cost basis of the associated investments and increases net realized gains (losses) and change in unrealized appreciation (depreciation). Such estimates are based on historical information available from each MLP and other industry sources. These estimates will subsequently be revised and may materially differ primarily based on information received from the MLPs after their tax reporting periods are concluded. |
| G. | Federal Income Taxes — The Fund does not intend to qualify as a regulated investment company pursuant to Subchapter M of the Internal Revenue Code. The Fund is treated as a regular corporation, or “C” corporation, for U.S. federal income tax purposes and generally is subject to U.S. federal income tax on its taxable income at the graduated rates applicable to corporations. In addition, as a regular corporation, the Fund may be subject to state and local taxes in jurisdictions in which the MLPs operate. The estimate state tax rate is based on a periodic analysis of the Fund’s holdings. The Fund may also be subject to a federal alternative minimum tax on its alternative minimum taxable income to the extent that the alternative minimum tax exceeds the Fund’s regular federal income tax liability. |
Taxes include current and deferred taxes. Current taxes reflect the estimated tax liability of the Fund as of a measurement date based on taxable income. Deferred taxes reflect estimates of (i) taxes on net unrealized gains (losses), which are attributable to the difference between fair market value and tax basis, (ii) the net tax effects of temporary differences between the carrying amounts of assets and liabilities for financial reporting purposes and the amounts used for tax purposes, and (iii) the net tax benefit of accumulated net operating losses, capital loss carryforwards and other tax attributes.
The Fund’s deferred tax asset (DTA) and/or liability balances are estimated using estimates of effective tax rates expected to apply to taxable income in the years such balances are realized. A DTA will be recognized for temporary book/tax differences, net of unrealized losses, and carryforwards (net operating losses, capital loss carryforward, or tax credits). To the extent the Fund has a DTA, the Fund assesses whether a valuation allowance is required to offset the value of a portion, or all, of the DTA. Prior year ordinary income or capital gains (carrybacks), unrealized net gains, future reversals of existing taxable timing differences, forecast of future profitability (based on historical evidence), potential tax planning strategies, unsettled circumstances, and other evidence will be used in determining the valuation allowance. The valuation allowance is reviewed periodically and the Fund may modify its estimates or assumptions regarding the net deferred tax asset or liability balances and any applicable valuation allowance.
The Fund recognizes interest and penalties associated with underpayment of federal and state income taxes, if any, in tax expense.
The Fund recognizes the tax benefits of uncertain tax positions only when the position is more likely than not to be sustained. Management has analyzed the Fund’s uncertain tax positions and concluded that no liability for unrecognized tax benefits should be recorded related to uncertain tax positions. Management is not aware of any tax positions for which it is reasonably possible that the total amounts of unrecognized tax benefits will change materially in the next 12 months.
The Fund files tax returns in the U.S. Federal jurisdiction and certain other jurisdictions. Generally, the Fund is subject to examinations by such taxing authorities for up to three years after the filing of the return for the tax period.
| H. | Expenses — Fees provided for under the Rule 12b-1 plan of a particular class of the Fund are charged to the operations of such class. Transfer agency fees and expenses and other shareholder recordkeeping fees and expenses attributable to Class R5 and Class R6 are allocated to each share class based on relative net assets. Sub-accounting fees attributable to Class R5 are charged to the operations of the class. Transfer agency fees and expenses and other shareholder recordkeeping fees and expenses relating to all other classes are allocated among those classes based on relative net assets. All other expenses are allocated among the classes based on relative net assets. |
| I. | Accounting Estimates — The preparation of financial statements in conformity with accounting principles generally accepted in the United States of America (“GAAP”) requires management to make estimates and assumptions that affect the reported amounts of assets and liabilities at the date of the financial statements and the reported amounts of revenues and expenses during the reporting period including estimates and assumptions related to taxation. Actual results could differ from those estimates by a significant amount. In addition, the Fund monitors for material events or transactions that may occur or become known after the period-end date and before the date the financial statements are released to print. |
| J. | Indemnifications — Under the Trust’s organizational documents, each Trustee, officer, employee or other agent of the Trust is indemnified against certain liabilities that may arise out of the performance of their duties to the Fund. Additionally, in the normal course of business, the Fund enters into contracts, including the Fund’s servicing agreements, that contain a variety of indemnification clauses. The Fund’s maximum exposure under these arrangements is unknown as this would involve future claims that may be made against the Fund that have not yet occurred. The risk of material loss as a result of such indemnification claims is considered remote. |
NOTE 2—Advisory Fees and Other Fees Paid to Affiliates
The Trust has entered into a master investment advisory agreement with Invesco Advisers, Inc. (the “Adviser” or “Invesco”). Under the terms of the investment advisory agreement, the Fund pays an advisory fee to the Adviser based on the annual rate of the Fund’s average daily net assets as follows:
| | | | |
| Average Daily Net Assets | | Rate | |
First $1.0 billion | | | 1.00% | |
Next $1.5 billion | | | 0.95% | |
Next $2.0 billion | | | 0.93% | |
Next $3.5 billion | | | 0.91% | |
Over $8 billion | | | 0.90% | |
For the period August 29, 2014 (commencement date) through October 31, 2014, the effective advisory fees incurred by the Fund was 1.00%.
Under the terms of a master sub-advisory agreement between the Adviser and each of Invesco Asset Management Deutschland GmbH, Invesco Asset Management Limited, Invesco Asset Management (Japan) Limited, Invesco Australia Limited, Invesco Hong Kong Limited, Invesco Senior Secured Management, Inc., Invesco Canada Ltd. and Invesco PowerShares Capital Management LLC (collectively, the “Affiliated Sub-Advisers”) the Adviser, not
13 Invesco MLP Fund
the Fund, may pay 40% of the fees paid to the Adviser to any such Affiliated Sub-Adviser(s) that provide(s) discretionary investment management services to the Fund based on the percentage of assets allocated to such Sub-Adviser(s).
The Adviser has contractually agreed, through at least February 29, 2016, to waive advisory fees and/or reimburse expenses of all shares to the extent necessary to limit total annual fund operating expenses after fee waiver and/or expense reimbursement (excluding certain items discussed below) of Class A, Class C, Class R, Class Y, Class R5 and Class R6 shares to 1.50%, 2.25%, 1.75%, 1.25%, 1.25% and 1.25%, respectively, of average daily net assets. In determining the Adviser’s obligation to waive advisory fees and/or reimburse expenses, the following expenses are not taken into account, and could cause the total annual fund operating expenses after fee waiver and/or expense reimbursement to exceed the numbers reflected above: (1) interest; (2) taxes; (3) dividend expense on short sales; (4) extraordinary or non-routine items, including litigation expenses; and (5) expenses that the Fund has incurred but did not actually pay because of an expense offset arrangement. Unless Invesco continues the fee waiver agreement, it will terminate on February 29, 2016. The fee waiver agreement cannot be terminated during its term.
Further, the Adviser has contractually agreed, through at least June 30, 2016, to waive the advisory fee payable by the Fund in an amount equal to 100% of the net advisory fees the Adviser receives from the affiliated money market funds on investments by the Fund of uninvested cash (excluding investments of cash collateral from securities lending) in such affiliated money market funds.
For the period August 29, 2014 (commencement date) through October 31, 2014, the Adviser waived advisory fees and reimbursed fund level expenses of $529,887 and reimbursed class level expenses of $377, $205, $2, $349, $2 and $1 of Class A, Class C, Class R, Class Y, Class R5 and Class R6 shares, respectively.
The Trust has entered into a master administrative services agreement with Invesco pursuant to which the Fund has agreed to pay Invesco for certain administrative costs incurred in providing accounting services to the Fund. For the period August 29, 2014 (commencement date) through October 31, 2014, expenses incurred under the agreement are shown in the Statement of Operations as Administrative services fees.
The Trust has entered into a transfer agency and service agreement with Invesco Investment Services, Inc. (“IIS”) pursuant to which the Fund has agreed to pay IIS a fee for providing transfer agency and shareholder services to the Fund and reimburse IIS for certain expenses incurred by IIS in the course of providing such services. IIS may make payments to intermediaries that provide omnibus account services, sub-accounting services and/or networking services. All fees payable by IIS to intermediaries that provide omnibus account services or sub-accounting are charged back to the Fund, subject to certain limitations approved by the Trust’s Board of Trustees. For the period August 29, 2014 (commencement date) through October 31, 2014, expenses incurred under the agreement are shown in the Statement of Operations as Transfer agent fees.
The Trust has entered into master distribution agreements with Invesco Distributors, Inc. (“IDI”) to serve as the distributor for the Class A, Class C, Class R, Class Y, Class R5 and Class R6 shares of the Fund. The Trust has adopted plans pursuant to Rule 12b-1 under the 1940 Act with respect to the Fund’s Class A, Class C and Class R shares (collectively the “Plans”). The Fund, pursuant to the Plans, pays IDI compensation at the annual rate of 0.25% of the Fund’s average daily net assets of Class A shares, 1.00% of the average daily net assets of Class C shares and 0.50% of the average daily net assets of Class R shares. Of the Plan payments, up to 0.25% of the average daily net assets of each class of shares may be paid to furnish continuing personal shareholder services to customers who purchase and own shares of such classes. Any amounts not paid as a service fee under the Plans would constitute an asset-based sales charge. Rules of the Financial Industry Regulatory Authority (“FINRA”) impose a cap on the total sales charges, including asset-based sales charges, that may be paid by any class of shares of the Fund. For the period August 29, 2014 (commencement date) through October 31, 2014, expenses incurred under the Plans are shown in the Statement of Operations as Distribution fees.
Front-end sales commissions and CDSC (collectively, the “sales charges”) are not recorded as expenses of the Fund. Front-end sales commissions are deducted from proceeds from the sales of Fund shares prior to investment in Class A shares of the Fund. CDSC are deducted from redemption proceeds prior to remittance to the shareholder. For the period August 29, 2014 (commencement date) through October 31, 2014, IDI advised the Fund that IDI retained $149 in front-end sales commissions from the sale of Class A shares.
Certain officers and trustees of the Trust are officers and directors of the Adviser, IIS and/or IDI.
NOTE 3—Additional Valuation Information
GAAP defines fair value as the price that would be received to sell an asset or paid to transfer a liability in an orderly transaction between market participants at the measurement date, under current market conditions. GAAP establishes a hierarchy that prioritizes the inputs to valuation methods, giving the highest priority to readily available unadjusted quoted prices in an active market for identical assets (Level 1) and the lowest priority to significant unobservable inputs (Level 3), generally when market prices are not readily available or are unreliable. Based on the valuation inputs, the securities or other investments are tiered into one of three levels. Changes in valuation methods may result in transfers in or out of an investment’s assigned level:
| | Level 1 — | Prices are determined using quoted prices in an active market for identical assets. |
| | Level 2 — | Prices are determined using other significant observable inputs. Observable inputs are inputs that other market participants may use in pricing a security. These may include quoted prices for similar securities, interest rates, prepayment speeds, credit risk, yield curves, loss severities, default rates, discount rates, volatilities and others. |
| | Level 3 — | Prices are determined using significant unobservable inputs. In situations where quoted prices or observable inputs are unavailable (for example, when there is little or no market activity for an investment at the end of the period), unobservable inputs may be used. Unobservable inputs reflect the Fund’s own assumptions about the factors market participants would use in determining fair value of the securities or instruments and would be based on the best available information. |
As of October 31, 2014, all of the securities in this Fund were valued based on Level 1 inputs (see the Schedule of Investments for security categories). The level assigned to the securities valuations may not be an indication of the risk or liquidity associated with investing in those securities. Because of the inherent uncertainties of valuation, the values reflected in the financial statements may materially differ from the value received upon actual sale of those investments.
NOTE 4—Trustees’ and Officers’ Fees and Benefits
Trustees’ and Officers’ Fees and Benefits include amounts accrued by the Fund to pay remuneration to certain Trustees and Officers of the Fund.
14 Invesco MLP Fund
NOTE 5—Cash Balances
The Fund is permitted to temporarily carry a negative or overdrawn balance in its account with State Street Bank and Trust Company, the custodian bank. Such balances, if any at period end, are shown in the Statement of Assets and Liabilities under the payable caption Amount due custodian. To compensate the custodian bank for such overdrafts, the overdrawn Fund may either (1) leave funds as a compensating balance in the account so the custodian bank can be compensated by earning the additional interest; or (2) compensate by paying the custodian bank at a rate agreed upon by the custodian bank and Invesco, not to exceed the contractually agreed upon rate.
NOTE 6–Taxes and Distributions to Shareholders
Total taxes have been computed by applying the federal statutory tax rate of 34% plus a blended state and other tax rate of 2.73%. The Fund applied this rate to net investment income (loss) and realized and unrealized gains (losses) on investments before taxes in computing its total tax expense (benefit).
The provision for taxes differs from the amount derived from applying the statutory tax rate to net investment income (loss) and realized and unrealized gains (losses) before taxes at period-end as follows:
| | | | | | | | |
Provision at statutory rates | | $ | (111,569 | ) | | | 34.00 | % |
State and other taxes, net of federal tax benefit | | | (5,994 | ) | | | 1.83 | |
Permanent differences, current period | | | (1,679 | ) | | | 0.51 | |
Valuation allowance | | | 119,242 | | | | (36.34 | ) |
Total | | $ | 0 | | | | 0.00 | % |
Components of the Fund’s Net Deferred Tax Asset at Period-End:
| | | | |
Deferred Tax Assets: | | | | |
Net operating loss carryforward | | $ | 3,415 | |
Capital loss carryforward | | | 771 | |
Unrealized gains/losses on investment securities | | | 115,056 | |
Total Deferred Tax Assets | | | 119,242 | |
Valuation allowance | | | (119,242 | ) |
Deferred Tax Asset, net | | $ | 0 | |
The Fund has a capital loss carryforward as of October 31, 2014, of $2,155. Capital losses may be carried forward for 5 years and accordingly, would begin to expire as of October 31, 2019.
The Fund has a federal net operating loss carryforward as of October 31, 2014, of $9,540, which expires in 2034. As of October 31, 2014, the Fund has state net operating losses of approximately $9,540. If not utilized, these net operating losses will expire in various years through October 31, 2034.
At October 31, 2014, based on the net unrealized losses on the Fund’s investment securities the Fund has recorded a valuation allowance to offset the DTA as the Fund has determined at October 31, 2014 based on historical evidence it is unlikely the DTA will be realized.
There were no distributions during the period August 29, 2014 (commencement date) through October 31, 2014.
NOTE 7—Investment Securities
The aggregate amount of investment securities (other than short-term securities, U.S. Treasury obligations and money market funds, if any) purchased and sold by the Fund during the period August 29, 2014 (commencement date) through October 31, 2014 was $5,778,524 and $222,235, respectively. Cost of investment on a tax basis includes the adjustments for financial reporting purposes as of the most recently completed federal income tax reporting period-end.
| | | | |
| Unrealized Appreciation (Depreciation) of Investment Securities on a Tax Basis | |
Aggregate unrealized appreciation of investment securities | | $ | 45,840 | |
Aggregate unrealized (depreciation) of investment securities | | | (367,228 | ) |
Net unrealized appreciation (depreciation) of investment securities | | $ | (321,388 | ) |
Cost of investments for tax purposes is $5,659,007.
NOTE 8—Reclassification of Permanent Differences
Primarily as a result of differing book/tax treatment of dividends received deduction, on October 31, 2014, undistributed net investment income (loss) was decreased by $4,941 and shares of beneficial interest was increased by $4,941. This reclassification had no effect on the net assets of the Fund.
15 Invesco MLP Fund
NOTE 9—Share Information
| | | | | | | | |
| | | Summary of Share Activity | |
| | | August 29, 2014
(commencement date) through
October 31, 2014(a) | |
| | | Shares | | | Amount | |
Sold: | | | | | | | | |
Class A | | | 211,398 | | | $ | 2,100,737 | |
Class C | | | 191,620 | | | | 1,891,027 | |
Class R | | | 2,289 | | | | 22,010 | |
Class Y | | | 174,543 | | | | 1,734,597 | |
Class R5 | | | 1,001 | | | | 10,010 | |
Class R6 | | | 1,001 | | | | 10,010 | |
| | |
Reacquired: | | | | | | | | |
Class A | | | (4,894 | ) | | | (46,459 | ) |
Class C | | | (8,100 | ) | | | (75,751 | ) |
Class Y | | | (586 | ) | | | (5,513 | ) |
Net increase in share activity | | | 568,272 | | | $ | 5,640,668 | |
| (a) | 53% of the outstanding shares of the Fund are owned by the Adviser. |
16 Invesco MLP Fund
NOTE 10—Financial Highlights
The following schedule presents financial highlights for a share of the Fund outstanding throughout the periods indicated.
| | | | |
| | | Class A | |
| | | Year ended
October 31,
2014(a) | |
Net asset value, beginning of period | | $ | 10.00 | |
Net investment income (loss)(b) | | | (0.01 | ) |
Net gains (losses) on securities (both realized and unrealized) | | | (0.64 | ) |
Total from investment operations | | | (0.65 | ) |
Net asset value, end of period | | $ | 9.35 | |
Total return(c) | | | (6.50 | )% |
Net assets, end of period (000’s omitted) | | $ | 1,931 | |
Portfolio turnover rate(d) | | | 5 | % |
|
Ratios/supplemental data based on average net assets: | |
Ratio of expenses: | | | | |
With fee waivers and/or expense reimbursements, before taxes | | | 1.49 | %(e) |
Tax expense (benefit)(f) | | | 0 | %(e) |
With fee waivers and/or expense reimbursements, after taxes(f) | | | 1.49 | %(e) |
Without fee waivers and/or expense reimbursements, after taxes(f) | | | 72.56 | %(e) |
Ratio of net investment income (loss), before taxes | | | (0.54 | )%(e) |
Ratio of net investment income (loss), after taxes(g) | | | (0.54 | )%(e) |
| (a) | Commencement date of August 29, 2014. |
| (b) | Calculated using average shares outstanding. |
| (c) | Includes adjustments in accordance with accounting principles generally accepted in the United States of America and as such, the net asset value for financial reporting purposes and the returns based upon those net asset values may differ from the net asset value and returns for shareholder transactions. Does not include sales charges and is not annualized for periods less than one year, if applicable. |
| (d) | Portfolio turnover is calculated at the fund level and is not annualized for periods less than one year, if applicable. |
| (e) | Ratios are annualized and based on average daily net assets (000’s omitted) of $1,711. |
| (f) | Ratio includes tax expense derived from net investment income (loss) and realized and unrealized gains (losses). |
| (g) | Ratio includes tax expense derived from net investment income (loss) only. |
| | | | |
| | | Class C | |
| | | Year ended
October 31,
2014(a) | |
Net asset value, beginning of period | | $ | 10.00 | |
Net investment income (loss)(b) | | | (0.02 | ) |
Net gains (losses) on securities (both realized and unrealized) | | | (0.64 | ) |
Total from investment operations | | | (0.66 | ) |
Net asset value, end of period | | $ | 9.34 | |
Total return(c) | | | (6.60 | )% |
Net assets, end of period (000’s omitted) | | $ | 1,713 | |
Portfolio turnover rate(d) | | | 5 | % |
|
Ratios/supplemental data based on average net assets: | |
Ratio of expenses: | | | | |
With fee waivers and/or expense reimbursements, before taxes | | | 2.24 | %(e) |
Tax expense (benefit)(f) | | | 0 | %(e) |
With fee waivers and/or expense reimbursements, after taxes(f) | | | 2.24 | %(e) |
Without fee waivers and/or expense reimbursements, after taxes(f) | | | 73.31 | %(e) |
Ratio of net investment income (loss), before taxes | | | (1.29 | )%(e) |
Ratio of net investment income (loss), after taxes(g) | | | (1.29 | )%(e) |
| (a) | Commencement date of August 29, 2014. |
| (b) | Calculated using average shares outstanding. |
| (c) | Includes adjustments in accordance with accounting principles generally accepted in the United States of America and as such, the net asset value for financial reporting purposes and the returns based upon those net asset values may differ from the net asset value and returns for shareholder transactions. Does not include sales charges and is not annualized for periods less than one year, if applicable. |
| (d) | Portfolio turnover is calculated at the fund level and is not annualized for periods less than one year, if applicable. |
| (e) | Ratios are annualized and based on average daily net assets (000’s omitted) of $933. |
| (f) | Ratio includes tax expense derived from net investment income (loss) and realized and unrealized gains (losses). |
| (g) | Ratio includes tax expense derived from net investment income (loss) only. |
17 Invesco MLP Fund
NOTE 10—Financial Highlights—(continued)
| | | | |
| | | Class R | |
| | | Year ended
October 31,
2014(a) | |
Net asset value, beginning of period | | $ | 10.00 | |
Net investment income (loss)(b) | | | (0.01 | ) |
Net gains (losses) on securities (both realized and unrealized) | | | (0.64 | ) |
Total from investment operations | | | (0.65 | ) |
Net asset value, end of period | | $ | 9.35 | |
Total return(c) | | | (6.50 | )% |
Net assets, end of period (000’s omitted) | | $ | 21 | |
Portfolio turnover rate(d) | | | 5 | % |
|
Ratios/supplemental data based on average net assets: | |
Ratio of expenses: | | | | |
With fee waivers and/or expense reimbursements, before taxes | | | 1.74 | %(e) |
Tax expense (benefit)(f) | | | 0 | %(e) |
With fee waivers and/or expense reimbursements, after taxes(f) | | | 1.74 | %(e) |
Without fee waivers and/or expense reimbursements, after taxes(f) | | | 72.80 | %(e) |
Ratio of net investment income (loss), before taxes | | | (0.79 | )%(e) |
Ratio of net investment income (loss), after taxes(g) | | | (0.79 | )%(e) |
| (a) | Commencement date of August 29, 2014. |
| (b) | Calculated using average shares outstanding. |
| (c) | Includes adjustments in accordance with accounting principles generally accepted in the United States of America and as such, the net asset value for financial reporting purposes and the returns based upon those net asset values may differ from the net asset value and returns for shareholder transactions. Does not include sales charges and is not annualized for periods less than one year, if applicable. |
| (d) | Portfolio turnover is calculated at the fund level and is not annualized for periods less than one year, if applicable. |
| (e) | Ratios are annualized and based on average daily net assets (000’s omitted) of $10. |
| (f) | Ratio includes tax expense derived from net investment income (loss) and realized and unrealized gains (losses). |
| (g) | Ratio includes tax expense derived from net investment income (loss) only. |
| | | | |
| | | Class Y | |
| | | Year ended
October 31,
2014(a) | |
Net asset value, beginning of period | | $ | 10.00 | |
Net investment income (loss)(b) | | | (0.01 | ) |
Net gains (losses) on securities (both realized and unrealized) | | | (0.63 | ) |
Total from investment operations | | | (0.64 | ) |
Net asset value, end of period | | $ | 9.36 | |
Total return(c) | | | (6.40 | )% |
Net assets, end of period (000’s omitted) | | $ | 1,628 | |
Portfolio turnover rate(d) | | | 5 | % |
|
Ratios/supplemental data based on average net assets: | |
Ratio of expenses: | | | | |
With fee waivers and/or expense reimbursements, before taxes | | | 1.24 | %(e) |
Tax expense (benefit)(f) | | | 0 | %(e) |
With fee waivers and/or expense reimbursements, after taxes(f) | | | 1.24 | %(e) |
Without fee waivers and/or expense reimbursements, after taxes(f) | | | 72.31 | %(e) |
Ratio of net investment income (loss), before taxes | | | (0.29 | )%(e) |
Ratio of net investment income (loss), after taxes(g) | | | (0.29 | )%(e) |
| (a) | Commencement date of August 29, 2014. |
| (b) | Calculated using average shares outstanding. |
| (c) | Includes adjustments in accordance with accounting principles generally accepted in the United States of America and as such, the net asset value for financial reporting purposes and the returns based upon those net asset values may differ from the net asset value and returns for shareholder transactions. Does not include sales charges and is not annualized for periods less than one year, if applicable. |
| (d) | Portfolio turnover is calculated at the fund level and is not annualized for periods less than one year, if applicable. |
| (e) | Ratios are annualized and based on average daily net assets (000’s omitted) of $1,587. |
| (f) | Ratio includes tax expense derived from net investment income (loss) and realized and unrealized gains (losses). |
| (g) | Ratio includes tax expense derived from net investment income (loss) only. |
18 �� Invesco MLP Fund
NOTE 10—Financial Highlights—(continued)
| | | | |
| | | Class R5 | |
| | | Year ended
October 31,
2014(a) | |
Net asset value, beginning of period | | $ | 10.00 | |
Net investment income (loss)(b) | | | (0.01 | ) |
Net gains (losses) on securities (both realized and unrealized) | | | (0.63 | ) |
Total from investment operations | | | (0.64 | ) |
Net asset value, end of period | | $ | 9.36 | |
Total return(c) | | | (6.40 | )% |
Net assets, end of period (000’s omitted) | | $ | 9 | |
Portfolio turnover rate(d) | | | 5 | % |
|
Ratios/supplemental data based on average net assets: | |
Ratio of expenses: | | | | |
With fee waivers and/or expense reimbursements, before taxes | | | 1.24 | %(e) |
Tax expense (benefit)(f) | | | 0 | %(e) |
With fee waivers and/or expense reimbursements, after taxes(f) | | | 1.24 | %(e) |
Without fee waivers and/or expense reimbursements, after taxes(f) | | | 72.28 | %(e) |
Ratio of net investment income (loss), before taxes | | | (0.29 | )%(e) |
Ratio of net investment income (loss), after taxes(g) | | | (0.29 | )%(e) |
| (a) | Commencement date of August 29, 2014. |
| (b) | Calculated using average shares outstanding. |
| (c) | Includes adjustments in accordance with accounting principles generally accepted in the United States of America and as such, the net asset value for financial reporting purposes and the returns based upon those net asset values may differ from the net asset value and returns for shareholder transactions. Does not include sales charges and is not annualized for periods less than one year, if applicable. |
| (d) | Portfolio turnover is calculated at the fund level and is not annualized for periods less than one year, if applicable. |
| (e) | Ratios are annualized and based on average daily net assets (000’s omitted) of $10. |
| (f) | Ratio includes tax expense derived from net investment income (loss) and realized and unrealized gains (losses). |
| (g) | Ratio includes tax expense derived from net investment income (loss) only. |
| | | | |
| | | Class R6 | |
| | | Year ended October 31,
2014(a) | |
Net asset value, beginning of period | | $ | 10.00 | |
Net investment income (loss)(b) | | | (0.01 | ) |
Net gains (losses) on securities (both realized and unrealized) | | | (0.63 | ) |
Total from investment operations | | | (0.64 | ) |
Net asset value, end of period | | $ | 9.36 | |
Total return(c) | | | (6.40 | )% |
Net assets, end of period (000’s omitted) | | $ | 9 | |
Portfolio turnover rate(d) | | | 5 | % |
|
Ratios/supplemental data based on average net assets: | |
Ratio of expenses: | | | | |
With fee waivers and/or expense reimbursements, before taxes | | | 1.24 | %(e) |
Tax expense (benefit)(f) | | | 0 | %(e) |
With fee waivers and/or expense reimbursements, after taxes(f) | | | 1.24 | %(e) |
Without fee waivers and/or expense reimbursements, after taxes(f) | | | 72.23 | %(e) |
Ratio of net investment income (loss), before taxes | | | (0.29 | )%(e) |
Ratio of net investment income (loss), after taxes(g) | | | (0.29 | )%(e) |
| (a) | Commencement date of August 29, 2014. |
| (b) | Calculated using average shares outstanding. |
| (c) | Includes adjustments in accordance with accounting principles generally accepted in the United States of America and as such, the net asset value for financial reporting purposes and the returns based upon those net asset values may differ from the net asset value and returns for shareholder transactions. Does not include sales charges and is not annualized for periods less than one year, if applicable. |
| (d) | Portfolio turnover is calculated at the fund level and is not annualized for periods less than one year, if applicable. |
| (e) | Ratios are annualized and based on average daily net assets (000’s omitted) of $10. |
| (f) | Ratio includes tax expense derived from net investment income (loss) and realized and unrealized gains (losses). |
| (g) | Ratio includes tax expense derived from net investment income (loss) only. |
19 Invesco MLP Fund
NOTE 11—Subsequent Event
On December 1, 2014, the Fund declared a distribution from net investment income of $0.07, $0.06, $0.07, $0.08, $0.08 and $0.08 per share of Class A, Class C, Class R, Class Y, Class R5 and Class R6, respectively payable on December 12, 2014 to shareholders of record on December 11, 2014.
20 Invesco MLP Fund
Report of Independent Registered Public Accounting Firm
To the Board of Trustees of AIM Investment Funds (Invesco Investment Funds)
and Shareholders of Invesco MLP Fund:
In our opinion, the accompanying statement of assets and liabilities, including the schedule of investments, and the related statements of operations and of changes in net assets and the financial highlights present fairly, in all material respects, the financial position of Invesco MLP Fund (one of the funds constituting AIM Investment Funds (Invesco Investment Funds), hereafter referred to as the “Fund”) at October 31, 2014, and the results of its operations, the changes in its net assets and the financial highlights for the period August 29, 2014 (commencement of operations) through October 31, 2014, in conformity with accounting principles generally accepted in the United States of America. These financial statements and financial highlights (hereafter referred to as “financial statements”) are the responsibility of the Fund’s management. Our responsibility is to express an opinion on these financial statements based on our audit. We conducted our audit of these financial statements in accordance with the standards of the Public Company Accounting Oversight Board (United States). Those standards require that we plan and perform the audit to obtain reasonable assurance about whether the financial statements are free of material misstatement. An audit includes examining, on a test basis, evidence supporting the amounts and disclosures in the financial statements, assessing the accounting principles used and significant estimates made by management, and evaluating the overall financial statement presentation. We believe that our audit, which included confirmation of securities at October 31, 2014 by correspondence with the custodian and brokers, and the application of alternative auditing procedures where confirmations of security purchases have not been received, provides a reasonable basis for our opinion.
PRICEWATERHOUSECOOPERS LLP
December 29, 2014
Houston, Texas
21 Invesco MLP Fund
Calculating your ongoing Fund expenses
Example
As a shareholder of the Fund, you incur two types of costs: (1) transaction costs, which may include sales charges (loads) on purchase payments or contingent deferred sales charges on redemptions, if any; and (2) ongoing costs, including management fees, distribution and/or service (12b-1) fees, and other Fund expenses. This example is intended to help you understand your ongoing costs (in dollars) of investing in the Fund and to compare these costs with ongoing costs of investing in other mutual funds. The example is based on an investment of $1,000 invested at the beginning of the period and held for the entire period August 29, 2014 (commencement date) through October 31, 2014.
Actual expenses
The table below provides information about actual account values and actual expenses. You may use the information in this table, together with the amount you invested, to estimate the expenses that you paid over the period. Simply divide your account value by $1,000 (for example, an $8,600 account value divided by $1,000 = 8.6), then multiply the result by the number in the table under the heading entitled “Actual Expenses Paid During Period” to estimate the expenses you paid on your account during this period (as of close of business August 29, 2014 (commencement date) through October 31, 2014).
Hypothetical example for comparison purposes
The table below also provides information about hypothetical account values and hypothetical expenses based on the Fund’s actual expense ratio and an assumed rate of return of 5% per year before expenses, which is not the Fund’s actual return.
The hypothetical account values and expenses may not be used to estimate the actual ending account balance or expenses you paid for the period. You may use this information to compare the ongoing costs of investing in the Fund and other funds. To do so, compare this 5% hypothetical example with the 5% hypothetical examples that appear in the shareholder reports of the other funds.
Please note that the expenses shown in the table are meant to highlight your ongoing costs only and do not reflect any transaction costs, such as sales charges (loads) on purchase payments or contingent deferred sales charges on redemptions, if any. Therefore, the hypothetical information is useful in comparing ongoing costs only, and will not help you determine the relative total costs of owning different funds. In addition, if these transaction costs were included, your costs would have been higher.
| | | | | | | | | | | | | | | | | | | | | | | | |
| Class | | Beginning
Account Value
(05/01/14) | | | ACTUAL | | | HYPOTHETICAL
(5% annual return before
expenses) | | | Annualized Expense Ratio | |
| | | Ending
Account Value
(10/31/14)1 | | | Expenses
Paid During
Period2 | | | Ending
Account Value
(10/31/14) | | | Expenses
Paid During
Period3 | | |
| A | | $ | 1,000.00 | | | $ | 935.00 | | | $ | 2.53 | | | $ | 1,017.69 | | | $ | 7.58 | | | | 1.49 | % |
| C | | | 1,000.00 | | | | 934.00 | | | | 3.80 | | | | 1,013.91 | | | | 11.37 | | | | 2.24 | |
| R | | | 1,000.00 | | | | 935.00 | | | | 2.95 | | | | 1,016.43 | | | | 8.84 | | | | 1.74 | |
| Y | | | 1,000.00 | | | | 936.00 | | | | 2.10 | | | | 1,018.95 | | | | 6.31 | | | | 1.24 | |
| R5 | | | 1,000.00 | | | | 936.00 | | | | 2.10 | | | | 1,018.95 | | | | 6.31 | | | | 1.24 | |
| R6 | | | 1,000.00 | | | | 936.00 | | | | 2.10 | | | | 1,018.95 | | | | 6.31 | | | | 1.24 | |
| 1 | The actual ending account value is based on the actual total return of the Fund for the period August 29, 2014 (commencement date) through October 31, 2014, after actual expenses and will differ from the hypothetical ending account value which is based on the Fund’s expense ratio and a hypothetical annual return of 5% before expenses. |
| 2 | Actual expenses are equal to the Fund’s annualized expense ratio as indicated above multiplied by the average account value over the period, multiplied by 64 (as of close of business August 29, 2014 (commencement date) through October 31, 2014)/365. Because the Fund has not been in existence for a full six month period, the actual ending account value and expense information shown may not provide a meaningful comparison to fund expense information of classes that show such data for a full six month period and, because the actual ending account value and expense information in the expense example covers a short time period, return and expense data may not be indicative of return and expense data for longer time periods. |
| 3 | Hypothetical expenses are equal to the annualized expense ratio indicated above multiplied by the average account value over the period, multiplied by 184/365 to reflect a one-half year period. The hypothetical ending account value and expenses may be used to compare ongoing costs of investing in the Fund and other funds because such data is based on a full six month period. |
22 Invesco MLP Fund
Initial Approval of Investment Advisory and Sub-Advisory Agreements
The Board of Trustees (the Board) of AIM Investment Funds (Invesco Investment Funds) (the Company) is required under the Investment Company Act of 1940, as amended, to approve the Invesco MLP Fund (the Fund) investment advisory agreements before the Fund can commence operations. During meetings held on March 25-26, 2014, the Board as a whole and the disinterested or “independent” Trustees voting separately approved (i) an amendment to the Company’s Master Investment Advisory Agreement with Invesco Advisers, Inc. (Invesco Advisers and the investment advisory agreement) to add the Fund, and (ii) (a) an amendment to the Master Intergroup Sub-Advisory Contract for Mutual Funds with Invesco Asset Management Deutschland GmbH, Invesco Asset Management Limited, Invesco Asset Management (Japan) Limited, Invesco Australia Limited, Invesco Hong Kong Limited, Invesco Senior Secured Management, Inc. and Invesco Canada Ltd. to add the Fund, and (b) an amendment to the Sub-Advisory Contract with Invesco PowerShares Capital Management LLC to add the Fund (the sub-advisers, the Affiliated Sub-Advisers; and the contracts, the sub-advisory contracts). In doing so, the Board followed a process similar to the process that it follows in annually reviewing and approving investment advisory agreements and sub-advisory contracts for the series portfolios of funds advised by Invesco Advisers (the Invesco Funds) and considered the information provided in the most recent annual review process as well as the information provided with respect to the Fund. The Board (i) determined that the investment advisory agreement and sub-advisory contracts are in the best interest of the Fund and its shareholders and that the compensation payable to Invesco Advisers and the Affiliated Sub-Advisers under the Fund’s agreements is fair and reasonable and (ii) approved submission of the agreements to the initial shareholder of the Fund.
The Board’s Fund Evaluation Process
The Board’s Investments Committee has established three Sub-Committees that are responsible for overseeing the management of a number of the funds advised by Invesco Advisers (the Invesco Funds). The Fund will be assigned to one of the Sub-Committees. This Sub-Committee structure permits the Trustees to focus on the performance of the Invesco Funds that have been assigned to them. The Sub-Committees meet throughout the year to review the performance, fees, expenses and other matters related to their assigned Invesco Funds. Over the course of each year, the Sub-Committees meet with portfolio managers for their assigned Invesco Funds and other members of management and review with these individuals the performance, investment
objective(s), policies, strategies, limitations and investment risks of these funds.
In evaluating the fairness and reasonableness of compensation under the Fund’s investment advisory agreement and sub-advisory contracts, the Board considered, among other things, the factors discussed below. The Board was assisted in its review by the Senior Officer, an independent officer of the Funds, and by independent legal counsel. The discussion below serves as a summary of the material factors and related conclusions that formed the basis for the Board’s approval of the Fund’s investment advisory agreement and sub-advisory contracts. The Trustees’ review and conclusions are based on the comprehensive consideration of all information presented to them and are not the result of any single determinative factor. Moreover, one Trustee may have weighed a particular piece of information or factor differently than another Trustee.
Factors and Conclusions and Summary of Evaluation of Investment Advisory and Sub-Advisory Agreements
| A. | Nature, Extent and Quality of Services Provided by Invesco Advisers and the Affiliated Sub-Advisers |
The Board reviewed the advisory services to be provided to the Fund by Invesco Advisers under the Fund’s investment advisory agreement and the credentials and experience of the officers and employees of Invesco Advisers who will provide these services. The Board’s review of the qualifications of Invesco Advisers to provide these services included the Board’s consideration of Invesco Advisers’ investment process oversight, independent credit analysis and investment risk management. The Board also considered non-advisory services that Invesco Advisers and its affiliates provide to the Invesco Funds and will provide to the Fund, such as various back office support functions, equity and fixed income trading operations, internal audit, distribution and legal and compliance. The Board noted that Invesco Advisers will be using a service provider to assist with tax services, as the Fund will be taxed as a corporation and not a registered investment company. In determining whether to approve the Fund’s investment advisory agreement, the Board considered the existing relationship between Invesco Advisers and the Invesco Funds, as well as the Board’s knowledge of Invesco Advisers’ operations. The Board concluded that the nature, extent and quality of the advisory services to be provided to the Fund by Invesco Advisers are appropriate.
The Board reviewed the services that may be provided by the Affiliated Sub-Advisers under the sub-advisory contracts and the credentials and experience of the officers and employees of the Affiliated Sub-Advisers who may provide these services. The Board noted that the
Affiliated Sub-Advisers have offices and personnel that are located in financial centers around the world. As a result, the Affiliated Sub-Advisers can provide research and investment analysis on the markets and economies of various countries in which the Fund may invest, make recommendations regarding securities and assist with security trades. The Board concluded that the sub-advisory contracts will benefit the Fund and its shareholders by permitting Invesco Advisers to use the resources and talents of the Affiliated Sub-Advisers in managing the Fund. The Board concluded that the nature, extent and quality of the services that may be provided by the Affiliated Sub-Advisers are appropriate.
The Board did not consider the performance of the Fund because the Fund is new and has no performance history. The Board did review performance expectations for the Fund in different market environments.
| C. | Advisory and Sub-Advisory Fees and Fee Waivers |
The Board considered the contractual management fee rate of the Fund and the proposed fee waivers and expense limitations that will be in place for the Fund through April 30, 2015. The Board also considered the services to be provided by the Affiliated Sub-Advisers pursuant to the sub-advisory contracts and the services to be provided by Invesco Advisers pursuant to the Fund’s investment advisory agreement, as well as the allocation of fees between Invesco Advisers and the Affiliated Sub-Advisers pursuant to the sub-advisory contracts. The Board noted that the sub-advisory fees will have no direct effect on the Fund or its shareholders, as they are paid by Invesco Advisers to the Affiliated Sub-Advisers.
The Board also considered comparative advisory fee data provided by Invesco Advisers for comparable registered funds managed by third-party advisers. The Board noted that Invesco Advisers does not manage other funds or client accounts with investment strategies comparable to those of the Fund. The Board noted that the advisory fee is at or below the Lipper MLP Energy classification median fee and that the advisory fee is at or below the fees of three key competitors identified by Invesco Advisers at all breakpoints and above the fees of two key competitors at all breakpoints. The Board noted that the competitors with the lower fees invest in more liquid securities or invest using a more passive approach than the Fund.
Based upon the information provided and considerations described above, the Board concluded that the compensation payable to Invesco Advisers and the Affiliated Sub-Advisers is fair and reasonable.
| D. | Economies of Scale and Breakpoints |
The Board considered the extent to which there may be economies of scale in the provision of
23 Invesco MLP Fund
advisory services to the Fund. The Board also considered whether the Fund would benefit from such economies of scale through contractual breakpoints in the Fund’s advisory fee schedule and through expense waivers. The Board also noted that the Fund will share directly in economies of scale through lower fees charged by third party service providers based on the combined size of all of the Invesco Funds and other clients advised by Invesco Advisers.
| E. | Profitability and Financial Resources |
The Board considered information from Invesco Advisers concerning the costs of the advisory and other services that Invesco Advisers and its affiliates provide to the Invesco Funds and the profitability of Invesco Advisers and its affiliates in providing these services. The Board received information from Invesco Advisers demonstrating that Invesco Advisers and each Affiliated Sub-Adviser are financially sound and have the resources necessary to perform their obligations under the Fund’s investment advisory agreement and sub-advisory contracts.
| F. | Collateral Benefits to Invesco Advisers and its Affiliates |
The Board considered various other benefits to be received by Invesco Advisers and its affiliates resulting from Invesco Advisers’ relationship with the Fund, including the fees to be received by Invesco Advisers and its affiliates for their provision of transfer agency and distribution services to the Fund. The Board considered the performance of Invesco Advisers and its affiliates in providing these services to other Invesco Funds and the organizational structure employed by Invesco Advisers and its affiliates to provide these services. The Board also considered that these services will be provided to the Fund pursuant to written contracts that are reviewed and approved on an annual basis by the Board; that the services are required for the operation of the Fund; that Invesco Advisers and its affiliates can provide services, the nature and quality of which are at least equal to those provided by others offering the same or similar services; and that the fees for such services are fair and reasonable in light of the usual and customary charges by others for services of the same nature and quality.
The Board considered the benefits realized by Invesco Advisers and the Affiliated Sub-Advisers as a result of portfolio brokerage transactions executed through “soft dollar” arrangements. The Board noted that soft dollar arrangements shift the payment obligation for research and execution services from Invesco Advisers and the Affiliated Sub-Advisers to the Invesco Funds and that the research received may be used with other clients of Invesco Advisers and may reduce Invesco Advisers’ and the Affiliated Sub-Advisers’ expenses. The Board also considered that it receives periodic reports from the Chief Compliance Officer of the Invesco Funds demonstrating that these arrangements are consistent with regulatory requirements. The Board did not deem the soft dollar arrangements to be inappropriate.
The Board considered the fact that the Fund’s uninvested cash and cash collateral from any securities lending arrangements may be invested in money market funds advised by Invesco Advisers pursuant to procedures approved by the Board. The Board noted that Invesco Advisers will receive advisory fees from these affiliated money market funds attributable to such investments, although Invesco Advisers has contractually agreed to waive through at least June 30, 2014, the advisory fees payable by the Fund with respect to such investments. This waiver is in an amount equal to 100% of the net advisory fee Invesco Advisers or its affiliates receive from the affiliated money market funds with respect to the Fund’s investment in the affiliated money market funds of uninvested cash, but not cash collateral from securities lending arrangements. The Board concluded that the Fund’s investment of uninvested cash and cash collateral from any securities lending arrangements in the affiliated money market funds is fair and reasonable.
The Board also considered that the Fund may use an affiliated broker to execute certain trades and was advised that such trades will be executed in compliance with rules under the Investment Company Act of 1940, as amended.
24 Invesco MLP Fund
Trustees and Officers
The address of each trustee and officer is AIM Investment Funds (Invesco Investment Funds) (the “Trust”), 11 Greenway Plaza, Suite 1000, Houston, Texas 77046-1173. The trustees serve for the life of the Trust, subject to their earlier death, incapacitation, resignation, retirement or removal as more specifically provided in the Trust’s organizational documents. Each officer serves for a one year term or until their successors are elected and qualified. Column two below includes length of time served with predecessor entities, if any.
| | | | | | | | |
Name, Year of Birth and Position(s) Held with the Trust | | Trustee and/
or Officer Since | | Principal Occupation(s) During Past 5 Years | | Number of Funds in Fund Complex Overseen by Trustee | | Other Directorship(s) Held by Trustee During Past 5 Years |
| Interested Persons | | | | | | | | |
| Martin L. Flanagan1 — 1960 Trustee | | 2007 | | Executive Director, Chief Executive Officer and President, Invesco Ltd. (ultimate parent of Invesco and a global investment management firm); Advisor to the Board, Invesco Advisers, Inc. (formerly known as Invesco Institutional (N.A.), Inc.); Trustee, The Invesco Funds; Vice Chair, Investment Company Institute; and Member of Executive Board, SMU Cox School of Business Formerly: Chairman and Chief Executive Officer, Invesco Advisers, Inc. (registered investment adviser); Director, Chairman, Chief Executive Officer and President, IVZ Inc. (holding company), INVESCO Group Services, Inc. (service provider) and Invesco North American Holdings, Inc. (holding company); Director, Chief Executive Officer and President, Invesco Holding Company Limited (parent of Invesco and a global investment management firm); Director, Invesco Ltd.; Chairman, Investment Company Institute and President, Co-Chief Executive Officer, Co-President, Chief Operating Officer and Chief Financial Officer, Franklin Resources, Inc. (global investment management organization). | | 144 | | None |
Philip A. Taylor2 — 1954 Trustee, President and Principal Executive Officer | | 2006 | | Head of North American Retail and Senior Managing Director, Invesco Ltd.; Director, Co-Chairman, Co-President and Co-Chief Executive Officer, Invesco Advisers, Inc. (formerly known as Invesco Institutional (N.A.), Inc.) (registered investment adviser); Director, Chairman, Chief Executive Officer and President, Invesco Management Group, Inc. (formerly known as Invesco Aim Management Group, Inc.) (financial services holding company); Director and President, INVESCO Funds Group, Inc. (registered investment adviser and registered transfer agent); Director and Chairman, Invesco Investment Services, Inc. (formerly known as Invesco Aim Investment Services, Inc.) (registered transfer agent) and IVZ Distributors, Inc. (formerly known as INVESCO Distributors, Inc.) (registered broker dealer); Director, President and Chairman, Invesco Inc. (holding company) and Invesco Canada Holdings Inc. (holding company); Chief Executive Officer, Invesco Corporate Class Inc. (corporate mutual fund company) and Invesco Canada Fund Inc. (corporate mutual fund company); Director, Chairman and Chief Executive Officer, Invesco Canada Ltd. (formerly known as Invesco Trimark Ltd./Invesco Trimark Ltèe) (registered investment adviser and registered transfer agent); Trustee, President and Principal Executive Officer, The Invesco Funds (other than AIM Treasurer’s Series Trust (Invesco Treasurer’s Series Trust) and Short-Term Investments Trust); Trustee and Executive Vice President, The Invesco Funds (AIM Treasurer’s Series Trust (Invesco Treasurer’s Series Trust) and Short-Term Investments Trust only); Director, Invesco Investment Advisers LLC (formerly known as Van Kampen Asset Management); Director, Chief Executive Officer and President, Van Kampen Exchange Corp. Formerly: Director and Chairman, Van Kampen Investor Services Inc.; Director, Chief Executive Officer and President, 1371 Preferred Inc. (holding company) and Van Kampen Investments Inc.; Director and President, AIM GP Canada Inc. (general partner for limited partnerships) and Van Kampen Advisors, Inc.; Director and Chief Executive Officer, Invesco Trimark Dealer Inc. (registered broker dealer); Director, Invesco Distributors, Inc. (formerly known as Invesco Aim Distributors, Inc.) (registered broker dealer); Manager, Invesco PowerShares Capital Management LLC; Director, Chief Executive Officer and President, Invesco Advisers, Inc.; Director, Chairman, Chief Executive Officer and President, Invesco Aim Capital Management, Inc.; President, Invesco Trimark Dealer Inc. and Invesco Trimark Ltd./Invesco Trimark Ltèe; Director and President, AIM Trimark Corporate Class Inc. and AIM Trimark Canada Fund Inc.; Senior Managing Director, Invesco Holding Company Limited; Director and Chairman, Fund Management Company (former registered broker dealer); President and Principal Executive Officer, The Invesco Funds (AIM Treasurer’s Series Trust (Invesco Treasurer’s Series Trust), and Short-Term Investments Trust only); President, AIM Trimark Global Fund Inc. and AIM Trimark Canada Fund Inc. | | 144 | | None |
Wayne W. Whalen3 — 1939 Trustee | | 2010 | | Of Counsel, and prior to 2010, partner in the law firm of Skadden, Arps, Slate, Meagher & Flom LLP, legal counsel to certain funds in the Fund Complex | | 144 | | Director of the Mutual fund Directors Forum, a nonprofit membership organization for investment directors; Chairman and Director of the Abraham Lincoln Presidential Library Foundation; and Director of the Stevenson Center for Democracy |
| 1 | Mr. Flanagan is considered an interested person (within the meaning of Section 2(a)(19) of the 1940 Act) of the Trust because he is an officer of the Adviser to the Trust, and an officer and a director of Invesco Ltd., ultimate parent of the Adviser. |
| 2 | Mr. Taylor is considered an interested person (within the meaning of Section 2(a)(19) of the 1940 Act) of the Trust because he is an officer and a director of the Adviser. |
| 3 | Mr. Whalen is retiring effective December 31, 2014. He has been deemed to be an interested person of the Trust because of his prior service as counsel to the predecessor funds of certain Invesco open-end funds and his affiliation with the law firm that served as counsel to such predecessor funds and the Invesco closed-end funds. |
T-1 Invesco MLP Fund
Trustees and Officers—(continued)
| | | | | | | | |
Name, Year of Birth and Position(s) Held with the Trust | | Trustee and/
or Officer Since | | Principal Occupation(s) During Past 5 Years | | Number of Funds in Fund Complex Overseen by Trustee | | Other Directorship(s) Held by Trustee During Past 5 Years |
| Independent Trustees | | | | | | | | |
Bruce L. Crockett — 1944 Trustee and Chair | | 2001 | | Chairman, Crockett Technologies Associates (technology consulting company) Formerly: Director, Captaris (unified messaging provider); Director, President and Chief Executive Officer, COMSAT Corporation; Chairman, Board of Governors of INTELSAT (international communications company); ACE Limited (insurance company); and Investment Company Institute | | 144 | | ALPS (Attorneys Liability Protection Society) (insurance company) |
David C. Arch — 1945 Trustee | | 2010 | | Chairman of Blistex Inc., a consumer health care products manufacturer | | 144 | | Board member of the Illinois Manufacturers’ Association; Member of the Board of Visitors, Institute for the Humanities, University of Michigan; Member of the Audit Committee of the Edward-Elmhurst Hospital |
Frank S. Bayley — 1939 Trustee | | 1987 | | Retired. Formerly: Director, Badgley Funds Inc. (registered investment company) (2 portfolios) and General Partner and Of Counsel, law firm of Baker & McKenzie, LLP | | 144 | | Director and Chairman, C.D. Stimson Company (a real estate investment company); Trustee, The Curtis Institute of Music |
James T. Bunch — 1942 Trustee | | 2003 | | Managing Member, Grumman Hill Group LLC (family office private equity investments) Formerly: Founder, Green Manning & Bunch Ltd. (investment banking firm) (1988-2010); Executive Committee, United States Golf Association; and Director, Policy Studies, Inc. and Van Gilder Insurance Corporation | | 144 | | Chairman, Board of Governors, Western Golf Association; Chairman, Evans Scholars Foundation; and Director, Denver Film Society |
Rodney F. Dammeyer — 1940 Trustee | | 2010 | | Chairman of CAC,LLC, (private company offering capital investment and management advisory services) Formerly: Prior to 2001, Managing Partner at Equity Group Corporate Investments; Prior to 1995, Chief Executive Officer of Itel Corporation (formerly Anixter International); Prior to 1985, experience includes Senior Vice President and Chief Financial Officer of Household International, Inc., Executive Vice President and Chief Financial Officer of Northwest Industries, Inc. and Partner of Arthur Andersen & Co.; From 1987 to 2010, Director/Trustee of investment companies in the Van Kampen Funds complex | | 144 | | Director of Quidel Corporation and Stericycle, Inc. |
Albert R. Dowden — 1941 Trustee | | 2001 | | Director of a number of public and private business corporations, including the Boss Group, Ltd. (private investment and management); Nature’s Sunshine Products, Inc. and Reich & Tang Funds (5 portfolios) (registered investment company) Formerly: Director, Homeowners of America Holding Corporation/Homeowners of America Insurance Company (property casualty company); Director, Continental Energy Services, LLC (oil and gas pipeline service); Director, CompuDyne Corporation (provider of product and services to the public security market) and Director, Annuity and Life Re (Holdings), Ltd. (reinsurance company); Director, President and Chief Executive Officer, Volvo Group North America, Inc.; Senior Vice President, AB Volvo; Director of various public and private corporations; Chairman, DHJ Media, Inc.; Director, Magellan Insurance Company; and Director, The Hertz Corporation, Genmar Corporation (boat manufacturer), National Media Corporation; Advisory Board of Rotary Power International (designer, manufacturer, and seller of rotary power engines); and Chairman, Cortland Trust, Inc. (registered investment company) | | 144 | | Director of: Nature’s Sunshine Products, Inc., Reich & Tang Funds, Homeowners of America Holding Corporation/ Homeowners of America Insurance Company, the Boss Group |
Jack M. Fields — 1952 Trustee | | 2001 | | Chief Executive Officer, Twenty First Century Group, Inc. (government affairs company); Owner and Chief Executive Officer, Dos Angeles Ranch, L.P. (cattle, hunting, corporate entertainment); and Discovery Global Education Fund (non-profit) Formerly: Chief Executive Officer, Texana Timber LP (sustainable forestry company); Director of Cross Timbers Quail Research Ranch (non-profit); and member of the U.S. House of Representatives | | 144 | | Insperity, Inc. (formerly known as Administaff) |
Prema Mathai-Davis — 1950 Trustee | | 2001 | | Retired. Formerly: Chief Executive Officer, YWCA of the U.S.A. | | 144 | | None |
Larry Soll — 1942 Trustee | | 2003 | | Retired. Formerly: Chairman, Chief Executive Officer and President, Synergen Corp. (a biotechnology company) | | 144 | | None |
Hugo F. Sonnenschein — 1940 Trustee | | 2010 | | President Emeritus and Honorary Trustee of the University of Chicago and the Adam Smith Distinguished Service Professor in the Department of Economics at the University of Chicago. Prior to 2000, President of the University of Chicago | | 144 | | Trustee of the University of Rochester and a member of its investment committee; Member of the National Academy of Sciences and the American Philosophical Society; Fellow of the American Academy of Arts and Sciences |
T-2 Invesco MLP Fund
Trustees and Officers—(continued)
| | | | | | | | |
Name, Year of Birth and Position(s) Held with the Trust | | Trustee and/
or Officer Since | | Principal Occupation(s) During Past 5 Years | | Number of Funds in Fund Complex Overseen by Trustee | | Other Directorship(s) Held by Trustee During Past 5 Years |
| Independent Trustees—(continued) |
Raymond Stickel, Jr. — 1944 Trustee | | 2005 | | Retired. Formerly: Director, Mainstay VP Series Funds, Inc. (25 portfolios) and Partner, Deloitte & Touche | | 144 | | None |
Suzanne H. Woolsey — 1941 Trustee | | 2014 | | Chief Executive Officer of Woolsey Partners LLC | | 144 | | Emeritus Chair of the Board of Trustees of the Institute for Defense Analyses; Trustee of Colorado College; Trustee of California Institute of Technology; Prior to 2014, Director of Fluor Corp.; Prior to 2010, Trustee of the German Marshall Fund of the United States; Prior to 2010 Trustee of the Rocky Mountain Institute |
| Other Officers | | | | | | | | |
Russell C. Burk — 1958 Senior Vice President and Senior Officer | | 2005 | | Senior Vice President and Senior Officer, The Invesco Funds | | N/A | | N/A |
John M. Zerr — 1962 Senior Vice President, Chief Legal Officer and Secretary | | 2006 | | Director, Senior Vice President, Secretary and General Counsel, Invesco Management Group, Inc. (formerly known as Invesco Aim Management Group, Inc.) and Van Kampen Exchange Corp.; Senior Vice President, Invesco Advisers, Inc. (formerly known as Invesco Institutional (N.A.), Inc.) (registered investment adviser); Senior Vice President and Secretary, Invesco Distributors, Inc. (formerly known as Invesco Aim Distributors, Inc.); Director, Vice President and Secretary, Invesco Investment Services, Inc. (formerly known as Invesco Aim Investment Services, Inc.) and IVZ Distributors, Inc. (formerly known as INVESCO Distributors, Inc.); Director and Vice President, INVESCO Funds Group, Inc.; Senior Vice President, Chief Legal Officer and Secretary, The Invesco Funds; Manager, Invesco PowerShares Capital Management LLC; Director, Secretary and General Counsel, Invesco Investment Advisers LLC (formerly known as Van Kampen Asset Management); Secretary and General Counsel, Invesco Capital Markets, Inc. (formerly known as Van Kampen Funds Inc.) and Chief Legal Officer, PowerShares Exchange-Traded Fund Trust, PowerShares Exchange-Traded Fund Trust II, PowerShares India Exchange-Traded Fund Trust, PowerShares Actively Managed Exchange-Traded Fund Trust; and PowerShares Actively Managed Exchange-Traded Commodity Fund Trust Formerly: Director and Vice President, Van Kampen Advisors Inc.; Director, Vice President, Secretary and General Counsel, Van Kampen Investor Services Inc.; Director, Invesco Distributors, Inc. (formerly known as Invesco Aim Distributors, Inc.); Director, Senior Vice President, General Counsel and Secretary, Invesco Aim Advisers, Inc. and Van Kampen Investments Inc.; Director, Vice President and Secretary, Fund Management Company; Director, Senior Vice President, Secretary, General Counsel and Vice President, Invesco Aim Capital Management, Inc.; Chief Operating Officer and General Counsel, Liberty Ridge Capital, Inc. (an investment adviser); Vice President and Secretary, PBHG Funds (an investment company) and PBHG Insurance Series Fund (an investment company); Chief Operating Officer, General Counsel and Secretary, Old Mutual Investment Partners (a broker-dealer); General Counsel and Secretary, Old Mutual Fund Services (an administrator) and Old Mutual Shareholder Services (a shareholder servicing center); Executive Vice President, General Counsel and Secretary, Old Mutual Capital, Inc. (an investment adviser); and Vice President and Secretary, Old Mutual Advisors Funds (an investment company) | | N/A | | N/A |
Sheri Morris — 1964 Vice President, Treasurer and Principal Financial Officer | | 1999 | | Vice President, Treasurer and Principal Financial Officer, The Invesco Funds; Vice President, Invesco Advisers, Inc. (formerly known as Invesco Institutional (N.A.), Inc.) (registered investment adviser); and Vice President, PowerShares Exchange-Traded Fund Trust, PowerShares Exchange-Traded Fund Trust II, PowerShares India Exchange-Traded Fund Trust, PowerShares Actively Managed Exchange-Traded Fund Trust, and PowerShares Actively Managed Exchange-Traded Commodity Fund Trust Formerly: Vice President, Invesco Aim Advisers, Inc., Invesco Aim Capital Management, Inc. and Invesco Aim Private Asset Management, Inc.; Assistant Vice President and Assistant Treasurer, The Invesco Funds and Assistant Vice President, Invesco Advisers, Inc., Invesco Aim Capital Management, Inc. and Invesco Aim Private Asset Management, Inc.; and Treasurer, PowerShares Exchange-Traded Fund Trust, PowerShares Exchange-Traded Fund Trust II, PowerShares India Exchange-Traded Fund Trust and PowerShares Actively Managed Exchange-Traded Fund Trust | | N/A | | N/A |
T-3 Invesco MLP Fund
Trustees and Officers—(continued)
| | | | | | | | |
Name, Year of Birth and Position(s) Held with the Trust | | Trustee and/
or Officer Since | | Principal Occupation(s) During Past 5 Years | | Number of Funds in Fund Complex Overseen by Trustee | | Other Directorship(s) Held by Trustee During Past 5 Years |
| Other Officers—(continued) | | | | | | | | |
Karen Dunn Kelley — 1960 Vice President | | 2004 | | Senior Managing Director, Investments; Director, Co-President, Co-Chief Executive Officer, and Co-Chairman, Invesco Advisers, Inc. (formerly known as Invesco Institutional (N.A.), Inc.) (registered investment adviser); Chairman, Invesco Senior Secured Management, Inc.; Senior Vice President, Invesco Management Group, Inc. (formerly known as Invesco Aim Management Group, Inc.); Executive Vice President, Invesco Distributors, Inc. (formerly known as Invesco Aim Distributors, Inc.); Director, Invesco Mortgage Capital Inc. and Invesco Management Company Limited; Director and President, INVESCO Asset Management (Bermuda) Ltd., Vice President, The Invesco Funds (other than AIM Treasurer’s Series Trust (Invesco Treasurer’s Series Trust) and Short-Term Investments Trust); and President and Principal Executive Officer, The Invesco Funds (AIM Treasurer’s Series Trust (Invesco Treasurer’s Series Trust) and Short-Term Investments Trust only) Formerly: Director, INVESCO Global Asset Management Limited and INVESCO Management S.A.; Senior Vice President, Van Kampen Investments Inc. and Invesco Advisers, Inc. (formerly known as Invesco Institutional (N.A.), Inc.) (registered investment adviser); Vice President, Invesco Advisers, Inc. (formerly known as Invesco Institutional (N.A.), Inc.); Director of Cash Management and Senior Vice President, Invesco Advisers, Inc. and Invesco Aim Capital Management, Inc.; Director and President, Fund Management Company; Chief Cash Management Officer, Director of Cash Management, Senior Vice President, and Managing Director, Invesco Aim Capital Management, Inc.; Director of Cash Management, Senior Vice President, and Vice President, Invesco Advisers, Inc. and The Invesco Funds (AIM Treasurer’s Series Trust (Invesco Treasurer’s Series Trust), and Short-Term Investments Trust only) | | N/A | | N/A |
Crissie M. Wisdom — 1969 Anti-Money Laundering Compliance Officer | | 2013 | | Anti-Money Laundering Compliance Officer, Invesco Advisers, Inc. (formerly known as Invesco Institutional (N.A.), Inc.) (registered investment adviser), Invesco Capital Markets, Inc. (formerly known as Van Kampen Funds Inc.), Invesco Distributors, Inc., Invesco Investment Services, Inc., Invesco Management Group, Inc., Van Kampen Exchange Corp., The Invesco Funds, and PowerShares Exchange-Traded Fund Trust, PowerShares Exchange-Traded Fund Trust II, PowerShares India Exchange-Traded Fund Trust, PowerShares Actively Managed Exchange-Traded Fund Trust and PowerShares Actively Managed Exchange-Traded Commodity Fund Trust; and Fraud Prevention Manager and Controls and Risk Analysis Manager for Invesco Investment Services, Inc. | | N/A | | N/A |
Todd L. Spillane — 1958 Chief Compliance Officer | | 2006 | | Senior Vice President, Invesco Management Group, Inc. (formerly known as Invesco Aim Management Group, Inc.) and Van Kampen Exchange Corp.; Senior Vice President and Chief Compliance Officer, Invesco Advisers, Inc. (registered investment adviser) (formerly known as Invesco Institutional (N.A.), Inc.); Chief Compliance Officer, The Invesco Funds; Vice President, Invesco Distributors, Inc. (formerly known as Invesco Aim Distributors, Inc.) and Invesco Investment Services, Inc. (formerly known as Invesco Aim Investment Services, Inc.) Formerly: Chief Compliance Officer, Invesco Funds (Chicago); Senior Vice President, Van Kampen Investments Inc.; Senior Vice President and Chief Compliance Officer, Invesco Aim Advisers, Inc. and Invesco Aim Capital Management, Inc.; Chief Compliance Officer, INVESCO Private Capital Investments, Inc. (holding company), Invesco Private Capital, Inc. (registered investment adviser), Invesco Global Asset Management (N.A.), Inc., Invesco Senior Secured Management, Inc. (registered investment adviser), Van Kampen Investor Services Inc., PowerShares Exchange-Traded Fund Trust, PowerShares Exchange-Traded Fund Trust II, PowerShares India Exchange-Traded Fund Trust and PowerShares Actively Managed Exchange-Traded Fund Trust; and Vice President, Invesco Aim Capital Management, Inc. and Fund Management Company | | N/A | | N/A |
The Statement of Additional Information of the Trust includes additional information about the Fund’s Trustees and is available upon request, without charge, by calling 1.800.959.4246. Please refer to the Fund’s prospectus for information on the Fund’s sub-advisers.
| | | | | | |
Office of the Fund 11 Greenway Plaza, Suite 1000 Houston, TX 77046-1173 | | Investment Adviser Invesco Advisers, Inc. 1555 Peachtree Street, N.E. Atlanta, GA 30309 | | Distributor Invesco Distributors, Inc. 11 Greenway Plaza, Suite 1000 Houston, TX 77046-1173 | | Auditors PricewaterhouseCoopers LLP 1000 Louisiana Street, Suite 5800 Houston, TX 77002-5678 |
| | | |
| | | | | | |
Counsel to the Fund Stradley Ronon Stevens & Young, LLP 2005 Market Street, Suite 2600 Philadelphia, PA 19103-7018 | | Counsel to the Independent Trustees Goodwin Procter LLP 901 New York Avenue, N.W. Washington, D.C. 20001 | | Transfer Agent Invesco Investment Services, Inc. 11 Greenway Plaza, Suite 1000 Houston, TX 77046-1173 | | Custodian State Street Bank and Trust Company 225 Franklin Street Boston, MA 02110-2801 |
T-4 Invesco MLP Fund

Invesco mailing information
Send general correspondence to Invesco Investment Services, Inc., P.O. Box 219078, Kansas City, MO 64121-9078.
Important notice regarding delivery of security holder documents
To reduce Fund expenses, only one copy of most shareholder documents may be mailed to shareholders with multiple accounts at the same address (Householding). Mailing of your shareholder documents may be householded indefinitely unless you instruct us otherwise. If you do not want the mailing of these documents to be combined with those for other members of your household, please contact Invesco Investment Services, Inc. at 800 959 4246 or contact your financial institution. We will begin sending you individual copies for each account within 30 days after receiving your request.
Fund holdings and proxy voting information
The Fund provides a complete list of its holdings four times in each fiscal year, at the quarter ends. For the second and fourth quarters, the lists appear in the Fund’s semiannual and annual reports to shareholders. For the first and third quarters, the Fund files the lists with the Securities and Exchange Commission (SEC) on Form N-Q. The most recent list of portfolio holdings is available at invesco.com/completeqtrholdings. Shareholders can also look up the Fund’s Forms N-Q on the SEC website at sec.gov. Copies of the Fund’s Forms N-Q may be reviewed and copied at the SEC Public Reference Room in Washington, D.C. You can obtain information on the operation of the Public Reference Room, including information about duplicating fee charges, by calling 202 551 8090 or 800 732 0330, or by electronic request at the following email address: publicinfo@sec.gov. The SEC file numbers for the Fund are shown below.
A description of the policies and procedures that the Fund uses to determine how to vote proxies relating to portfolio securities is available without charge, upon request, from our Client Services department at 800 959 4246 or at invesco.com/proxyguidelines. The information is also available on the SEC website, sec.gov.
| | |
Information regarding how the Fund voted proxies related to its portfolio securities during the most recent 12-month period ended June 30 is available at invesco.com/proxysearch. The information is also available on the SEC website, sec.gov. | |  |
Invesco Advisers, Inc. is an investment adviser; it provides investment advisory services to individual and institutional clients and does not sell securities. Invesco Distributors, Inc. is the US distributor for Invesco Ltd.’s retail mutual funds, exchange-traded funds and institutional money market funds. Both are wholly owned, indirect subsidiaries of Invesco Ltd. | |
| | | | |
| SEC file numbers: 811-05426 and 033-19338 | | MLP-AR-1 | | Invesco Distributors, Inc. |
Letters to Shareholders
| | | | |

Philip Taylor | | | | Dear Shareholders: This annual report includes information about your Fund, including performance data and a complete list of its investments as of the close of the reporting period. Inside, your Fund’s portfolio managers discuss how they managed your Fund and the factors that affected its performance during the reporting period. I hope you find this report of interest. During the reporting period covered by this report, the US economy showed signs of continued improvement. After contracting in the first quarter of 2014, the economy expanded strongly in the second quarter and unemployment trended lower. Much of the credit for this improvement goes to the US Federal Reserve (the Fed), which undertook an extraordinary asset purchase program following the global financial crisis. The Fed’s goal was to jumpstart the economy by encouraging banks to lend more, businesses to hire more and consumers to spend |
more. Signs of a stronger US economy prompted the Fed to reduce, or “taper,” its asset purchase program. Despite this, interest rates remained near historical low levels due largely to heavy investor demand for bonds. While signs of economic improvement were evident in the US, European economies showed signs of weakening. That, together with geopolitical uncertainty and worries about the first diagnosed cases of Ebola outside of Africa, caused increased volatility in US and European equities.
Extended periods of market strength can lull investors into complacency – just as prolonged periods of market weakness or volatility can discourage investors from initiating long-term investment plans. That’s why Invesco has always encouraged investors to work with a professional financial adviser who can stress the importance of starting to save and invest early and the importance of adhering to a disciplined investment plan – when times are good and when they’re uncertain. A financial adviser who knows your unique financial situation, investment goals and risk tolerance can be an invaluable partner as you seek to achieve your financial goals. He or she can offer a long-term perspective when markets are volatile and time-tested advice and guidance when your financial situation or investment goals change.
Timely information when and where you want it
Invesco’s efforts to help investors achieve their financial objectives include providing individual investors and financial professionals with timely information about the markets, the economy and investing – whenever and wherever they want it.
Our website, invesco.com/us, offers a wide range of market insights and investment perspectives. On the website, you’ll find detailed information about our funds, including prices, performance, holdings and portfolio manager commentaries. You can access information about your individual Invesco account whenever it’s convenient for you; just complete a simple, secure online registration. Use the “Log In” box on our home page to get started.
Invesco’s mobile app for iPad® (available free from the App StoreSM) allows you to obtain the same detailed information about your Fund and the same investment insights from our investment leaders, market strategists, economists and retirement experts on the go. You also can watch portfolio manager videos and have instant access to Invesco news and updates wherever you may be.
In addition to the resources accessible on our website and through our mobile app, you can obtain timely updates to help you stay informed about the markets, the economy and investing by connecting with Invesco on Twitter, LinkedIn or Facebook. You can access our blog at blog.invesco.us.com. Our goal is to provide you the information you want, when and where you want it.
Have questions?
For questions about your account, feel free to contact an Invesco client services representative at 800 959 4246. For Invesco-related questions or comments, please email me directly at phil@invesco.com.
All of us at Invesco look forward to serving your investment management needs for many years to come. Thank you for investing with us.
Sincerely,

Philip Taylor
Senior Managing Director, Invesco Ltd.
iPad is a trademark of Apple Inc., registered in the US and other countries. App Store is a service mark of Apple Inc. Invesco Distributors, Inc. is not affiliated with Apple Inc.
|
| 2 Invesco Pacific Growth Fund |
| | | | | | | | | |

Bruce Crockett | | | | Dear Fellow Shareholders: There are a variety of factors that can impact investment performance, many of which are uncontrollable by us as investors. These factors can include various economic trends and geopolitical developments. While the members of the Invesco Funds Board, which I chair, can’t dictate the performance of the Invesco funds, be assured that your Board works diligently throughout the year to focus on how your investments are managed. Our job is to represent you and your interests on a variety of fund management-related matters. We regularly monitor how the portfolio management teams of the Invesco funds are performing in light of ever-changing and often unpredictable economic and market conditions. We review the investment strategies and investment process employed by each fund’s management team as explained in the fund’s prospectus. | | |
Perhaps our most significant responsibility is conducting the annual review of the funds’ advisory and sub-advisory contracts with Invesco Advisers and its affiliates. This annual review, which is required by the Investment Company Act of 1940, focuses on the nature and quality of the services Invesco provides as the adviser to the Invesco funds and the reasonableness of the fees that it charges for those services. Each year, we spend months carefully reviewing information from Invesco that allows us to evaluate the quality of its services and the reasonableness of its fees. We also use information from a variety of independent sources, including materials provided by the independent senior officer of the Invesco funds, who reports directly to the independent trustees on the Board. Additionally, we meet with legal counsel and review performance and fee data prepared for us by Lipper Inc., an independent, third-party firm widely recognized as a leader in its field.
After a careful review, the members of the Invesco Funds Board approved the continuation of advisory and sub-advisory contracts with Invesco Advisers and its affiliates. Be assured that your Board will continue working on behalf of fund shareholders, keeping your needs and interests uppermost in our minds.
As always, please contact me at bruce@brucecrockett.com with any questions or concerns you may have. On behalf of the Board, we look forward to continuing to represent your interests and serving your needs.
Sincerely,

Bruce L. Crockett
Independent Chair
Invesco Funds Board of Trustees
|
| 3 Invesco Pacific Growth Fund |
Management’s Discussion of Fund Performance
Performance summary
For the fiscal year ended October 31, 2014, Invesco Pacific Growth Fund produced positive returns, at net asset value (NAV), and outperformed its style-specific index, the MSCI All Country Asia Pacific Index. The Fund’s performance relative to its style-specific index was primarily the result of positive stock selection in the consumer discretionary sector and in South Korea. Conversely, Fund holdings in the financials sector and in Taiwan were the leading detractors from relative results.
Your Fund’s long-term performance appears later in this report.
Fund vs. Indexes
Total returns, 10/31/13 to 10/31/14, at net asset value (NAV). Performance shown does not include applicable contingent deferred sales charges (CDSC) or front-end sales charges, which would have reduced performance.
| | | | | |
| Class A Shares | | | | 4.10 | % |
| Class B Shares | | | | 3.28 | |
| Class C Shares | | | | 3.28 | |
| Class R Shares | | | | 3.82 | |
| Class Y Shares | | | | 4.34 | |
| Class R5 Shares | | | | 4.48 | |
| MSCI EAFE Index‚ (Broad Market Index) | | | | -0.60 | |
| MSCI All Country Asia Pacific Index‚ (Style-Specific Index) | | | | 2.12 | |
| Lipper Pacific Region Funds Indexn (Peer Group Index) | | | | 2.91 | |
Source(s): ‚FactSet Research Systems Inc.; nLipper Inc.
Market conditions and your Fund
Global equity markets generally rose during the fiscal year ended October 31, 2014, on signs that economic growth was accelerating as a result of the loose monetary policies of many developed countries’ central banks. While 2014 began on an optimistic note, global equity markets pulled back at various points in reaction to economic and geopolitical concerns.
These concerns included worries about potentially negative effects of the US Federal Reserve reducing the scope of its asset purchase program beginning in early 2014, an Argentine sovereign bond default and eurozone banking concerns. Global equity markets also fell as geopolitical tensions in Ukraine and the Middle
East weakened the outlook for global growth.
Meanwhile, the Bank of Japan remained committed to extraordinary monetary stimulus. Consumer spending in Japan has been weak for some time particularly after a consumption tax hike in April, and retail sales and household spending increased only gradually during the reporting period – although improved corporate earnings were an encouraging sign.
Equity market performance in emerging markets was mixed. China continued to face growth headwinds in the process of pursuing structural reforms on various fronts, while many countries in Asia, including India, Indonesia and the Philippines, experienced strong positive gains on the back of positive political development and robust economic conditions.
For the reporting period, the Fund, at NAV, produced positive returns and outperformed its style-specific index. At the sector level, stock selection in the consumer discretionary sector led performance versus the MSCI All Country Asia Pacific Index. Stock selection in the industrials, consumer staples and health care sectors also contributed to relative Fund outperformance versus the style-specific index.
In the consumer discretionary sector, Hanssem, a kitchen parts manufacturer based in South Korea, led Fund performance during the reporting period. The company, which supplies kitchen and building materials to new housing developments, received a boost during the fiscal year when the South Korean government rolled out a stimulus package and loosened mortgage borrowing restrictions. Another South Korean company in the consumer staples sector, Amorepacific, also contributed to relative Fund performance. The skincare, makeup and fragrance manufacturer’s stock rose during the reporting period due to strong overseas sales.
Fund holdings in the industrials sector also contributed to relative performance. The leading contributor to Fund performance in the sector was Kepco Plant Service & Engineering, a South Korean company that provides maintenance services for power plants and industrial plants. Japanese company Nidec, the world’s leading manufacturer of small precision motors, automotive motors and other industrial motors, contributed to relative performance as well.
In contrast, Fund holdings in the financials sector were the leading detractors from relative performance during
| | | | | |
| Portfolio Composition | | |
| By sector | |
| |
| Financials | | | | 27.4 | % |
| Consumer Discretionary | | | | 16.8 | |
| Industrials | | | | 15.9 | |
| Information Technology | | | | 11.1 | |
| Consumer Staples | | | | 6.6 | |
| Materials | | | | 4.0 | |
| Health Care | | | | 3.9 | |
| Telecommunication Services | | | | 2.3 | |
| Utilities | | | | 2.2 | |
| Energy | | | | 2.0 | |
Money Market Funds Plus Other Assets Less Liabilities | | | | 7.8 | |
| | | | | | | |
| Top 10 Equity Holdings* |
| |
| | |
| 1. | | Commonwealth Bank of Australia | | | | 1.9 | % |
| 2. | | Toyota Motor Corp. | | | | 1.8 | |
| 3. | | Mitsubishi UFJ Financial Group, Inc. | | | | 1.7 | |
| 4. | | Westpac Banking Corp. | | | | 1.7 | |
| 5. | | Sumitomo Mitsui Financial Group, Inc. | | | | 1.6 | |
| 6. | | Australia and New Zealand Banking Group Ltd. | | | | 1.5 | |
| 7. | | Axis Bank Ltd. | | | | 1.5 | |
| 8. | | Larsen & Toubro Ltd. | | | | 1.4 | |
| 9. | | Tencent Holdings Ltd. | | | | 1.4 | |
| 10. | | Astellas Pharma Inc. | | | | 1.4 | |
| | | | | |
Total Net Assets | | | | $81.9 million | |
| |
Total Number of Holdings* | | | | 150 | |
The Fund’s holdings are subject to change, and there is no assurance that the Fund will continue to hold any particular security.
*Excluding money market fund holdings.
|
| 4 Invesco Pacific Growth Fund |
the fiscal year. Fund holdings in the information technology (IT) sector also hurt Fund performance versus the index.
In the financials sector, Sumitomo Mitsui Financial Group was one of the leading detractors from Fund performance. The Japanese financial conglomerate provides commercial banking and a variety of financial services. Mitsubishi Estate Company, Japan’s largest real estate developer, also detracted from relative Fund performance as investors’ hope for Bank of Japan’s (BOJ) additional easing measures diminished at the end of October on the back of the BOJ’s Governor Haruhiko Kuroda’s bullish assessment about Japan’s inflation. So-called reflation beneficiaries, including Mitsubishi Estate Company and other financial and real estate stocks, fell out of favor in the market.
In the IT sector, relative Fund performance was largely impacted by Samsung Electronics, the world’s largest smartphone maker. Recent results for Samsung were negatively affected by greater competition in the Chinese low-end smartphone market and relatively weak sales of the new high-end Galaxy S5 phone. However, we maintained our position as the company is trading at a compelling valuation.
From a geographic perspective, strong stock selection in South Korea was the leading contributor to relative Fund performance. Strong stock selection in Japan helped as well. Conversely, stock selection in Taiwan was the largest detractor from relative performance. Underweight exposure to holdings in Australia and Hong Kong also hurt relative performance.
Given the market environment during the fiscal year, we increased the Fund’s exposure to the financials, consumer discretionary, consumer staples and energy sectors to take advantage of attractive valuations. We also decreased exposure to the industrials, materials and IT sectors.
At the close of the reporting period, we believed the key theme for Asia will be “reforms trinity”. New leaderships in India, China, and Indonesia are all committed to reforms on various fronts. Political and economic reforms will likely be key market drivers in the region.
Thank you for your investment in Invesco Pacific Growth Fund.
The views and opinions expressed in management’s discussion of Fund performance are those of Invesco Advisers, Inc. These views and opinions are subject to change at any time based on factors such as market and economic conditions. These views and opinions may not be relied upon as investment advice or recommendations, or as an offer for a particular security. The information is not a complete analysis of every aspect of any market, country, industry, security or the Fund. Statements of fact are from sources considered reliable, but Invesco Advisers, Inc. makes no representation or warranty as to their completeness or accuracy. Although historical performance is no guarantee of future results, these insights may help you understand our investment management philosophy.
See important Fund and, if applicable, index disclosures later in this report.
| | |
 | | Paul Chan Chartered Financial Analyst, Portfolio Manager, is manager of Invesco Pacific Growth Fund. He |
| joined Invesco in 2001. Mr. Chan earned a BS in economics from the University of Manitoba. |
| | |
 | | Daiji Ozawa Chartered Financial Analyst, Portfolio Manager, is manager of Invesco Pacific Growth Fund. He |
| joined Invesco in 2010. Mr. Ozawa earned a BA in political science from Waseda University. |
|
| 5 Invesco Pacific Growth Fund |
Your Fund’s Long-Term Performance
Results of a $10,000 Investment – Oldest Share Class(es)
Fund and index data from 10/31/04
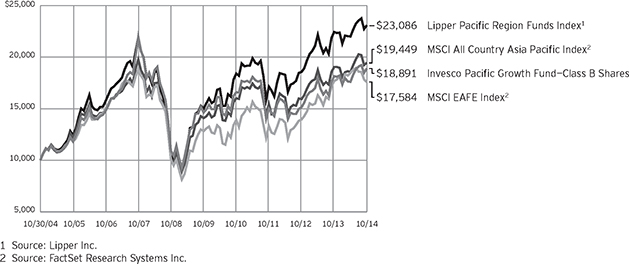
Past performance cannot guarantee comparable future results.
The data shown in the chart include reinvested distributions, applicable sales charges and Fund expenses including management fees. Results for Class B shares are calculated as if a hypothetical
shareholder had liquidated his entire investment in the Fund at the close of the reporting period and paid the contingent deferred sales charges, if applicable. Index results include reinvested dividends, but they do not reflect sales charges. Performance of the peer group,
if applicable, reflects fund expenses and management fees; performance of a market index does not. Performance shown in the chart and table(s) does not reflect deduction of taxes a shareholder would pay on Fund distributions or sale of Fund shares.
continued from page 8
Other information
| n | | The returns shown in management’s discussion of Fund performance are based on net asset values (NAVs) calculated for shareholder transactions. Generally accepted accounting principles require adjustments to be made to the net assets of the Fund at period end for financial reporting purposes, and as such, the NAVs for shareholder transactions and the returns based on those NAVs may differ from the NAVs and returns reported in the Financial Highlights. |
| n | | Industry classifications used in this report are generally according to the Global Industry Classification Standard, which was developed by and is the exclusive property and a service mark of MSCI Inc. and Standard & Poor’s. |
|
6 Invesco Pacific Growth Fund |
| | | | |
Average Annual Total Returns | |
| As of 10/31/14, including maximum applicable sales charges | |
| |
| Class A Shares | | | | |
| Inception (7/28/97) | | | 1.70 | % |
| 10 Years | | | 6.61 | |
| 5 Years | | | 4.53 | |
| 1 Year | | | -1.62 | |
| |
| Class B Shares | | | | |
| Inception (11/30/90) | | | 4.80 | % |
| 10 Years | | | 6.57 | |
| 5 Years | | | 4.60 | |
| 1 Year | | | -1.72 | |
| |
| Class C Shares | | | | |
| Inception (7/28/97) | | | 1.30 | % |
| 10 Years | | | 6.44 | |
| 5 Years | | | 4.95 | |
| 1 Year | | | 2.28 | |
| |
| Class R Shares | | | | |
| Inception (3/31/08) | | | 1.25 | % |
| 5 Years | | | 5.44 | |
| 1 Year | | | 3.82 | |
| |
| Class Y Shares | | | | |
| Inception (7/28/97) | | | 2.28 | % |
| 10 Years | | | 7.49 | |
| 5 Years | | | 6.00 | |
| 1 Year | | | 4.34 | |
| |
| Class R5 Shares | | | | |
| 10 Years | | | 7.36 | % |
| 5 Years | | | 6.01 | |
| 1 Year | | | 4.48 | |
Effective June 1, 2010, Class A, Class B, Class C, Class R, Class W and Class I shares of the predecessor fund, Morgan Stanley Pacific Growth Fund Inc., advised by Morgan Stanley Investment Advisors Inc. were reorganized into Class A, Class B, Class C, Class R, Class A and Class Y shares, respectively, of Invesco Pacific Growth Fund. Returns shown above for Class A, Class B, Class C, Class R and Class Y shares are blended returns of the predecessor fund and Invesco Pacific Growth Fund. Share class returns will differ from the predecessor fund because of different expenses.
Class R5 shares incepted on May 23, 2011. Performance shown prior to that date is that of the Fund’s and the predecessor fund’s Class A shares and includes the 12b-1 fees applicable to Class A shares. Class A share performance reflects any applicable fee waivers or expense reimbursements.
| | | | |
Average Annual Total Returns | |
| As of 9/30/14, the most recent calendar quarter end, including maximum applicable sales charges | |
| |
| Class A Shares | | | | |
| Inception (7/28/97) | | | 1.58 | % |
| 10 Years | | | 6.55 | |
| 5 Years | | | 3.31 | |
| 1 Year | | | -0.64 | |
| |
| Class B Shares | | | | |
| Inception (11/30/90) | | | 4.72 | % |
| 10 Years | | | 6.51 | |
| 5 Years | | | 3.35 | |
| 1 Year | | | -0.66 | |
| |
| Class C Shares | | | | |
| Inception (7/28/97) | | | 1.19 | % |
| 10 Years | | | 6.38 | |
| 5 Years | | | 3.74 | |
| 1 Year | | | 3.37 | |
| |
| Class R Shares | | | | |
| Inception (3/31/08) | | | 0.94 | % |
| 5 Years | | | 4.21 | |
| 1 Year | | | 4.82 | |
| |
| Class Y Shares | | | | |
| Inception (7/28/97) | | | 2.16 | % |
| 10 Years | | | 7.43 | |
| 5 Years | | | 4.77 | |
| 1 Year | | | 5.38 | |
| |
| Class R5 Shares | | | | |
| 10 Years | | | 7.30 | % |
| 5 Years | | | 4.77 | |
| 1 Year | | | 5.56 | |
The performance data quoted represent past performance and cannot guarantee comparable future results; current performance may be lower or higher. Please visit invesco.com/performance for the most recent month-end performance. Performance figures reflect reinvested distributions, changes in net asset value and the effect of the maximum sales charge unless otherwise stated. Investment return and principal value will fluctuate so that you may have a gain or loss when you sell shares.
The total annual Fund operating expense ratio set forth in the most recent Fund prospectus as of the date of this report for Class A, Class B, Class C, Class R, Class Y and Class R5 shares was 1.82%, 2.57%, 2.57%, 2.07%, 1.57% and 1.44%, respectively. The expense ratios presented above may vary from the expense ratios presented in other sections of this report that are
based on expenses incurred during the period covered by this report.
Class A share performance reflects the maximum 5.50% sales charge, and Class B and Class C share performance reflects the applicable contingent deferred sales charge (CDSC) for the period involved. The CDSC on Class B shares declines from 5% beginning at the time of purchase to 0% at the beginning of the seventh year. The CDSC on Class C shares is 1% for the first year after purchase. Class R, Class Y and Class R5 shares do not have a front-end sales charge or a CDSC; therefore, performance is at net asset value.
The performance of the Fund’s share classes will differ primarily due to different sales charge structures and class expenses.
|
| 7 Invesco Pacific Growth Fund |
Invesco Pacific Growth Fund’s investment objective is long-term growth of capital.
| n | | Unless otherwise stated, information presented in this report is as of October 31, 2014, and is based on total net assets. |
| n | | Unless otherwise noted, all data provided by Invesco. |
| n | | To access your Fund’s reports/prospectus, visit invesco.com/fundreports. |
About share classes
| n | | Class B shares may not be purchased for new or additional investments. Please see the prospectus for more information. |
| n | | Class R shares are generally available only to employer sponsored retirement and benefit plans. Please see the prospectus for more information. |
| n | | Class Y shares are available to only certain investors. Please see the prospectus for more information. |
| n | | Class R5 shares are primarily intended for employer sponsored retirement and benefit plans that meet certain standards and for institutional investors. Please see the prospectus for more information. |
Principal risks of investing in the Fund
| n | | Depositary receipts risk. Depositary receipts involve many of the same risks as those associated with direct investment in foreign securities. In addition, the underlying issuers of certain depositary receipts, particularly unsponsored or unregistered depositary receipts, are under no obligation to distribute shareholder communications to the holders of such receipts or to pass through to them any voting rights with respect to the deposited securities. |
| n | | Developing/emerging markets securities risk. The prices of securities issued by foreign companies and governments located in developing/emerging market countries may be affected more negatively by inflation, devaluation of their currencies, higher transaction costs, delays in settlement, adverse political developments, the introduction of capital controls, withholding taxes, nationalization of private assets, expropriation, social unrest, war or lack of timely information than those in developed countries. |
| n | | Foreign securities risk. The Fund’s foreign investments may be affected by changes in a foreign country’s exchange rates, political and social instability, changes in economic or taxation |
| | policies, difficulties when enforcing obligations, decreased liquidity, and increased volatility. Foreign companies may be subject to less regulation resulting in less publicly available information about the companies. |
| n | | Geographic focus risk. From time to time the Fund may invest a substantial amount of its assets in securities of issuers located in a single country or a limited number of countries. If the Fund focuses its investments in this manner, it assumes the risk that economic, political and social conditions in those countries will have a significant impact on its investment performance. The Fund’s investment performance may also be more volatile if it focuses its investments in certain countries, especially emerging markets countries. |
| n | | Growth investing risk. Growth stocks tend to be more expensive relative to their earnings or assets compared with other types of stock. As a result they tend to be more sensitive to changes in their earnings and can be more volatile. |
| n | | Management risk. The investment techniques and risk analysis used by the Fund’s portfolio managers may not produce the desired results. |
| n | | Market risk. The prices of and the income generated by the Fund’s securities may decline in response to, among other things, investor sentiment, general economic and market conditions, regional or global instability, and currency and interest rate fluctuations. |
| n | | Preferred securities risk. Preferred securities may include provisions that permit the issuer, in its discretion, to defer or omit distributions for a certain period of time. If the Fund owns a security that is deferring or omitting its distributions, the Fund may be required to report the distribution on its tax returns, even though it may not have received this income. Further, preferred securities may lose substantial value due to the omission or deferment of dividend payments. |
| n | | Small- and mid-capitalization risks. Stocks of small- and mid-sized companies |
| | | tend to be more vulnerable to adverse developments and may have little or no operating history or track record of success, and limited product lines, markets, management and financial resources. The securities of small- and mid-sized companies may be more volatile due to less market interest and less publicly available information about the issuer. They also may be illiquid or restricted as to resale, or may trade less frequently and in smaller volumes, all of which may cause difficulty when establishing or closing a position at a desirable price. |
About indexes used in this report
| n | | The MSCI EAFE® Index is an unmanaged index considered representative of stocks of Europe, Australasia and the Far East. The index is computed using the net return, which withholds applicable taxes for non-resident investors. |
| n | | The MSCI All Country Asia Pacific Index is an unmanaged index considered representative of Pacific region stock markets. The index is computed using the net return, which withholds applicable taxes for non-resident investors. |
| n | | The Lipper Pacific Region Funds Index is an unmanaged index considered representative of Pacific region funds tracked by Lipper. |
| n | | The Fund is not managed to track the performance of any particular index, including the index(es) described here, and consequently, the performance of the Fund may deviate significantly from the performance of the
index(es). |
| n | | A direct investment cannot be made in an index. Unless otherwise indicated, index results include reinvested dividends, and they do not reflect sales charges. Performance of the peer group, if applicable, reflects fund expenses; performance of a market index does not. |
continued on page 6
|
This report must be accompanied or preceded by a currently effective Fund prospectus, which contains more complete information, including sales charges and expenses. Investors should read it carefully before investing. |
|
|
| NOT FDIC INSURED | MAY LOSE VALUE | NO BANK GUARANTEE |
|
8 Invesco Pacific Growth Fund |
Schedule of Investments
October 31, 2014
| | | | | | | | |
| | | Shares | | | Value | |
Common Stocks & Other Equity Interests–92.20% | |
| Australia–14.43% | |
Alumina Ltd.(a) | | | 163,977 | | | $ | 236,907 | |
AMP Ltd. | | | 34,561 | | | | 178,698 | |
Aurizon Holdings Ltd. | | | 79,854 | | | | 330,323 | |
Australia and New Zealand Banking Group Ltd. | | | 40,780 | | | | 1,206,896 | |
Bank of Queensland Ltd. | | | 14,060 | | | | 156,648 | |
BHP Billiton Ltd. | | | 33,405 | | | | 997,059 | |
Brambles Ltd. | | | 15,124 | | | | 127,383 | |
Caltex Australia Ltd. | | | 8,892 | | | | 243,868 | |
Commonwealth Bank of Australia | | | 22,374 | | | | 1,591,342 | |
CSL Ltd. | | | 2,354 | | | | 166,660 | |
CSR Ltd. | | | 79,081 | | | | 241,033 | |
Echo Entertainment Group Ltd. | | | 36,244 | | | | 125,692 | |
Hills Holdings Ltd. | | | 18,030 | | | | 21,275 | |
Insurance Australia Group Ltd. | | | 58,399 | | | | 336,206 | |
Macquarie Group Ltd. | | | 8,035 | | | | 434,318 | |
National Australia Bank Ltd. | | | 21,017 | | | | 649,530 | |
Ramsay Health Care Ltd. | | | 6,931 | | | | 319,776 | |
RCR Tomlinson Ltd. | | | 17,651 | | | | 42,331 | |
Slater & Gordon Ltd. | | | 22,163 | | | | 119,640 | |
Sonic Healthcare Ltd. | | | 20,748 | | | | 342,242 | |
Tassal Group Ltd. | | | 25,820 | | | | 84,377 | |
Tatts Group Ltd. | | | 59,602 | | | | 182,544 | |
Telstra Corp. Ltd. | | | 106,464 | | | | 528,685 | |
Wesfarmers Ltd. | | | 7,940 | | | | 309,603 | |
Western Areas Ltd. | | | 61,673 | | | | 236,888 | |
Westpac Banking Corp. | | | 44,530 | | | | 1,369,186 | |
Woodside Petroleum Ltd. | | | 15,128 | | | | 535,942 | |
Woolworths Ltd. | | | 22,115 | | | | 702,436 | |
| | | | | 11,817,488 | |
|
| China–8.09% | |
Bank of China Ltd.–Class H | | | 1,684,000 | | | | 804,968 | |
Beijing Capital International Airport Co. Ltd.–Class H | | | 464,000 | | | | 340,442 | |
China Petroleum & Chemical Corp.–Class H | | | 308,000 | | | | 267,793 | |
China Resources Land Ltd. | | | 192,000 | | | | 457,944 | |
China Shenhua Energy Co. Ltd.–Class H | | | 106,000 | | | | 298,655 | |
CNOOC Ltd. | | | 160,000 | | | | 250,471 | |
FIH Mobile Ltd.(a) | | | 691,000 | | | | 367,994 | |
Great Wall Motor Co. Ltd.–Class H | | | 89,500 | | | | 392,387 | |
Guangdong Investment Ltd. | | | 396,000 | | | | 525,179 | |
Industrial & Commercial Bank of China Ltd.–Class H | | | 1,201,000 | | | | 794,462 | |
Semiconductor Manufacturing International Corp.(a) | | | 5,066,000 | | | | 526,717 | |
Tencent Holdings Ltd. | | | 73,900 | | | | 1,177,811 | |
Zhuzhou CSR Times Electric Co., Ltd.–Class H | | | 97,000 | | | | 417,138 | |
| | | | | 6,621,961 | |
| | | | | | | | |
| | | Shares | | | Value | |
| Hong Kong–5.53% | |
Cathay Pacific Airways Ltd. | | | 156,000 | | | $ | 294,637 | |
Cheung Kong Infrastructure Holdings Ltd. | | | 54,000 | | | | 394,115 | |
Chow Tai Fook Jewellery Group Ltd. | | | 422,800 | | | | 596,283 | |
New World Development Co. Ltd. | | | 492,000 | | | | 617,926 | |
Sands China Ltd. | | | 126,401 | | | | 787,240 | |
Sun Hung Kai Properties Ltd. | | | 45,000 | | | | 670,784 | |
Techtronic Industries Co. Ltd. | | | 183,500 | | | | 573,800 | |
Yue Yuen Industrial (Holdings) Ltd. | | | 177,000 | | | | 596,736 | |
| | | | | | | | 4,531,521 | |
|
| India–5.46% | |
Axis Bank Ltd. | | | 167,450 | | | | 1,200,949 | |
Bharat Forge Ltd. | | | 41,090 | | | | 544,418 | |
HCL Technologies Ltd. | | | 33,984 | | | | 890,734 | |
IndusInd Bank Ltd. | | | 55,471 | | | | 650,936 | |
Larsen & Toubro Ltd. | | | 43,755 | | | | 1,180,383 | |
| | | | | | | | 4,467,420 | |
|
| Indonesia–1.68% | |
PT Matahari Department Store Tbk | | | 546,900 | | | | 670,102 | |
PT Telekomunikasi Indonesia Persero Tbk | | | 3,067,700 | | | | 704,124 | |
| | | | | | | | 1,374,226 | |
|
| Japan–37.59% | |
Amada Co., Ltd. | | | 44,100 | | | | 393,183 | |
AOKI Holdings Inc. | | | 24,800 | | | | 282,906 | |
Astellas Pharma Inc. | | | 74,200 | | | | 1,172,213 | |
Canon Inc. | | | 17,900 | | | | 551,352 | |
Casio Computer Co., Ltd. | | | 9,400 | | | | 151,383 | |
Chiba Bank, Ltd. (The) | | | 45,000 | | | | 322,092 | |
Daicel Corp. | | | 67,000 | | | | 790,767 | |
Daifuku Co., Ltd. | | | 28,600 | | | | 339,988 | |
Daikin Industries, Ltd. | | | 10,800 | | | | 680,074 | |
Daito Trust Construction Co., Ltd. | | | 4,800 | | | | 606,245 | |
Daiwa House Industry Co., Ltd. | | | 20,900 | | | | 402,829 | |
East Japan Railway Co. | | | 10,200 | | | | 806,768 | |
FamilyMart Co., Ltd. | | | 7,300 | | | | 292,707 | |
Gulliver International Co., Ltd. | | | 58,900 | | | | 508,184 | |
Hitachi Capital Corp. | | | 26,200 | | | | 653,006 | |
Hitachi High-Technologies Corp. | | | 16,000 | | | | 496,412 | |
Hitachi, Ltd. | | | 137,000 | | | | 1,100,171 | |
Honda Motor Co., Ltd. | | | 28,300 | | | | 900,537 | |
JGC Corp. | | | 12,000 | | | | 315,674 | |
Komatsu Ltd. | | | 18,400 | | | | 442,187 | |
Kyocera Corp. | | | 6,400 | | | | 300,335 | |
Maeda Road Construction Co., Ltd. | | | 24,000 | | | | 371,881 | |
Marubeni Corp. | | | 71,500 | | | | 464,984 | |
Minebea Co., Ltd. | | | 11,000 | | | | 152,613 | |
Mitsubishi Corp. | | | 29,600 | | | | 590,218 | |
Mitsubishi Estate Co. Ltd. | | | 35,000 | | | | 898,910 | |
See accompanying Notes to Financial Statements which are an integral part of the financial statements.
9 Invesco Pacific Growth Fund
| | | | | | | | |
| | | Shares | | | Value | |
| Japan–(continued) | | | | | | | | |
Mitsubishi Heavy Industries, Ltd. | | | 112,000 | | | $ | 711,310 | |
Mitsubishi UFJ Financial Group, Inc. | | | 232,900 | | | | 1,388,872 | |
NH Foods Ltd. | | | 17,000 | | | | 394,316 | |
Nidec Corp. | | | 12,800 | | | | 841,222 | |
Nifco Inc. | | | 15,400 | | | | 494,283 | |
Nissan Motor Co., Ltd. | | | 40,600 | | | | 375,835 | |
Obayashi Corp. | | | 44,000 | | | | 309,401 | |
Ono Pharmaceutical Co. Ltd. | | | 6,100 | | | | 625,306 | |
ORIX Corp. | | | 71,400 | | | | 999,775 | |
Relo Holdings, Inc. | | | 5,700 | | | | 412,431 | |
Resorttrust, Inc. | | | 25,300 | | | | 614,091 | |
Ricoh Co., Ltd. | | | 21,800 | | | | 231,145 | |
Sanwa Holdings Corp. | | | 73,200 | | | | 524,350 | |
SATO Holdings Corp. | | | 12,800 | | | | 340,930 | |
Sekisui Chemical Co., Ltd. | | | 64,000 | | | | 795,701 | |
Seven & I Holdings Co., Ltd. | | | 28,400 | | | | 1,121,551 | |
Shimamura Co., Ltd. | | | 4,500 | | | | 397,545 | |
Sumitomo Metal Mining Co., Ltd. | | | 21,000 | | | | 295,474 | |
Sumitomo Mitsui Financial Group, Inc. | | | 31,700 | | | | 1,288,787 | |
Suzuki Motor Corp. | | | 13,000 | | | | 441,980 | |
Tokyu Fudosan Holdings, Corp. | | | 21,500 | | | | 152,965 | |
Toshiba Corp. | | | 135,000 | | | | 603,098 | |
Toyo Ink SC Holdings Co., Ltd. | | | 64,000 | | | | 298,904 | |
Toyoda Gosei Co., Ltd. | | | 7,200 | | | | 136,205 | |
Toyota Motor Corp. | | | 23,800 | | | | 1,431,908 | |
Tsubakimoto Chain Co. | | | 65,000 | | | | 516,607 | |
Yamaha Motor Co. Ltd. | | | 21,000 | | | | 404,239 | |
Yaskawa Electric Corp. | | | 36,800 | | | | 482,016 | |
Yellow Hat Ltd. | | | 7,200 | | | | 155,988 | |
| | | | | | | | 30,773,854 | |
|
| Malaysia–0.83% | |
Public Bank Berhad | | | 120,930 | | | | 682,402 | |
|
| Singapore–1.70% | |
Singapore Post Ltd. | | | 530,000 | | | | 817,121 | |
United Overseas Bank Ltd. | | | 32,000 | | | | 574,242 | |
| | | | | | | | 1,391,363 | |
|
| South Korea–9.83% | |
AMOREPACIFIC Corp. | | | 148 | | | | 318,482 | |
AMOREPACIFIC Group | | | 410 | | | | 453,800 | |
Coway Co., Ltd. | | | 6,077 | | | | 462,280 | |
Dongsuh Companies Inc. | | | 6,162 | | | | 121,404 | |
Grand Korea Leisure Co., Ltd. | | | 13,019 | | | | 464,308 | |
Green Cross Corp. | | | 4,675 | | | | 599,280 | |
Hanssem Co., Ltd. | | | 6,540 | | | | 780,159 | |
KEPCO Plant Service & Engineering Co., Ltd. | | | 8,657 | | | | 710,334 | |
| | | | | | | | |
| | | Shares | | | Value | |
| South Korea–(continued) | | | | | | | | |
Korea Electric Power Corp. | | | 8,078 | | | $ | 352,298 | |
Nongshim Co., Ltd. | | | 2,719 | | | | 679,228 | |
ORION Corp. | | | 626 | | | | 483,196 | |
Ottogi Corp. | | | 902 | | | | 478,503 | |
Samchully Co., Ltd. | | | 3,989 | | | | 563,555 | |
Samsung Electronics Co., Ltd. | | | 316 | | | | 366,042 | |
Samsung Fire & Marine Insurance Co., Ltd. | | | 1,966 | | | | 529,755 | |
SK Telecom Co., Ltd. | | | 2,724 | | | | 683,156 | |
| | | | | | | | 8,045,780 | |
|
| Taiwan–4.58% | |
China Development Financial Holding Corp. | | | 822,000 | | | | 263,960 | |
China Life Insurance Co., Ltd. | | | 371,954 | | | | 324,264 | |
Grand Ocean Retail Group Ltd. | | | 87,000 | | | | 181,176 | |
Hiwin Technologies Corp. | | | 19,930 | | | | 157,634 | |
Hon Hai Precision Industry Co., Ltd. | | | 156,800 | | | | 495,618 | |
Largan Precision Co. Ltd. | | | 4,001 | | | | 281,445 | |
Nan Ya Plastics Corp. | | | 99,000 | | | | 205,587 | |
San Shing Fastech Corp. | | | 86,940 | | | | 225,857 | |
Synnex Technology International Corp. | | | 149,000 | | | | 209,629 | |
Taiwan Semiconductor Manufacturing Co. Ltd. | | | 147,143 | | | | 634,350 | |
Tong Hsing Electronic Industries, Ltd. | | | 46,000 | | | | 175,577 | |
Toung Loong Textile Manufacturing Co., Ltd. | | | 54,000 | | | | 151,227 | |
Unimicron Technology Corp. | | | 220,000 | | | | 169,302 | |
Yungtay Engineering Co., Ltd. | | | 124,000 | | | | 275,258 | |
| | | | | | | | 3,750,884 | |
|
| Thailand–2.01% | |
Central Pattana PCL–NVDR | | | 346,000 | | | | 511,944 | |
Kasikornbank PCL–NVDR | | | 156,400 | | | | 1,133,603 | |
| | | | | | | | 1,645,547 | |
|
| United Kingdom–0.47% | |
Henderson Group PLC–CDI | | | 49,238 | | | | 171,486 | |
Rio Tinto Ltd. | | | 4,038 | | | | 215,465 | |
| | | | | | | | 386,951 | |
Total Common Stocks & Other Equity Interests
(Cost $66,500,747) | | | | 75,489,397 | |
|
Money Market Funds–1.35% | |
Liquid Assets Portfolio–Institutional Class(b) | | | 551,055 | | | | 551,055 | |
Premier Portfolio–Institutional Class(b) | | | 551,055 | | | | 551,055 | |
Total Money Market Funds
(Cost $1,102,110) | | | | 1,102,110 | |
TOTAL INVESTMENTS–93.55%
(Cost $67,602,857) | | | | 76,591,507 | |
OTHER ASSETS LESS LIABILITIES–6.45% | | | | 5,284,912 | |
NET ASSETS–100.00% | | | $ | 81,876,419 | |
Investment Abbreviations:
| | |
| CDI | | – Chess Depositary Instruments |
| NVDR | | – Non-Voting Depositary Receipt |
Notes to Schedule of Investments:
| (a) | Non-income producing security. |
| (b) | The money market fund and the Fund are affiliated by having the same investment adviser. |
See accompanying Notes to Financial Statements which are an integral part of the financial statements.
10 Invesco Pacific Growth Fund
Statement of Assets and Liabilities
October 31, 2014
| | | | |
Assets: | |
Investments, at value (Cost $66,500,747) | | $ | 75,489,397 | |
Investments in affiliated money market funds, at value and cost | | | 1,102,110 | |
Total investments, at value (Cost $67,602,857) | | | 76,591,507 | |
Foreign currencies, at value (Cost $43,574) | | | 72,748 | |
Receivable for: | | | | |
Investments sold | | | 6,286,557 | |
Fund shares sold | | | 76,143 | |
Dividends | | | 384,647 | |
Investment for trustee deferred compensation and retirement plans | | | 38,120 | |
Other assets | | | 24,192 | |
Total assets | | | 83,473,914 | |
|
Liabilities: | |
Payable for: | | | | |
Investments purchased | | | 1,004,288 | |
Fund shares reacquired | | | 125,963 | |
Accrued fees to affiliates | | | 130,406 | |
Accrued trustees’ and officers’ fees and benefits | | | 1,976 | |
Accrued other operating expenses | | | 237,930 | |
Trustee deferred compensation and retirement plans | | | 96,932 | |
Total liabilities | | | 1,597,495 | |
Net assets applicable to shares outstanding | | $ | 81,876,419 | |
|
Net assets consist of: | |
Shares of beneficial interest | | $ | 90,913,755 | |
Undistributed net investment income | | | (381,825 | ) |
Undistributed net realized gain (loss) | | | (17,529,740 | ) |
Net unrealized appreciation | | | 8,874,229 | |
| | | $ | 81,876,419 | |
| | | | |
Net Assets: | |
Class A | | $ | 73,457,296 | |
Class B | | $ | 480,174 | |
Class C | | $ | 4,637,516 | |
Class R | | $ | 343,960 | |
Class Y | | $ | 2,944,442 | |
Class R5 | | $ | 13,031 | |
|
Shares outstanding, $0.01 par value per share,
with an unlimited number of shares authorized: | |
Class A | | | 2,997,230 | |
Class B | | | 20,832 | |
Class C | | | 200,814 | |
Class R | | | 14,136 | |
Class Y | | | 118,255 | |
Class R5 | | | 523 | |
Class A: | | | | |
Net asset value per share | | $ | 24.51 | |
Maximum offering price per share | | | | |
(Net asset value of $24.51 ¸ 94.50%) | | $ | 25.94 | |
Class B: | | | | |
Net asset value and offering price per share | | $ | 23.05 | |
Class C: | | | | |
Net asset value and offering price per share | | $ | 23.09 | |
Class R: | | | | |
Net asset value and offering price per share | | $ | 24.33 | |
Class Y: | | | | |
Net asset value and offering price per share | | $ | 24.90 | |
Class R5 | | | | |
Net asset value and offering price per share | | $ | 24.92 | |
See accompanying Notes to Financial Statements which are an integral part of the financial statements.
11 Invesco Pacific Growth Fund
Statement of Operations
For the year ended October 31, 2014
| | | | |
Investment income: | |
Dividends (net of foreign withholding taxes of $163,243) | | $ | 1,984,459 | |
Dividends from affiliated money market funds (includes securities lending income of $5,872) | | | 6,170 | |
Total investment income | | | 1,990,629 | |
| |
Expenses: | | | | |
Advisory fees | | | 732,674 | |
Administrative services fees | | | 50,000 | |
Custodian fees | | | 79,927 | |
Distribution fees: | | | | |
Class A | | | 182,752 | |
Class B | | | 6,263 | |
Class C | | | 46,699 | |
Class R | | | 1,571 | |
Transfer agent fees | | | 195,820 | |
Transfer agent fees — R5 | | | 10 | |
Trustees’ and officers’ fees and benefits | | | 29,176 | |
Other | | | 197,914 | |
Total expenses | | | 1,522,806 | |
Less: Fees waived and expense offset arrangement(s) | | | (1,241 | ) |
Net expenses | | | 1,521,565 | |
Net investment income | | | 469,064 | |
| |
Realized and unrealized gain (loss) from: | | | | |
Net realized gain (loss) from: | | | | |
Investment securities (net of foreign taxes of $13,649) | | | 6,663,061 | |
Foreign currencies | | | (139,965 | ) |
| | | | 6,523,096 | |
Change in net unrealized appreciation (depreciation) of: | | | | |
Investment securities (net of foreign taxes on holdings of $110,722) | | | (3,719,664 | ) |
Foreign currencies | | | (111,210 | ) |
| | | | (3,830,874 | ) |
Net realized and unrealized gain | | | 2,692,222 | |
Net increase in net assets resulting from operations | | $ | 3,161,286 | |
See accompanying Notes to Financial Statements which are an integral part of the financial statements.
12 Invesco Pacific Growth Fund
Statement of Changes in Net Assets
For the years ended October 31, 2014 and 2013
| | | | | | | | |
| | | 2014 | | | 2013 | |
Operations: | | | | | | | | |
Net investment income | | $ | 469,064 | | | $ | 455,894 | |
Net realized gain | | | 6,523,096 | | | | 2,903,818 | |
Change in net unrealized appreciation (depreciation) | | | (3,830,874 | ) | | | 12,530,395 | |
Net increase in net assets resulting from operations | | | 3,161,286 | | | | 15,890,107 | |
| | |
Distributions to shareholders from net investment income: | | | | | | | | |
Class A | | | (1,136,339 | ) | | | (358,018 | ) |
Class B | | | (6,423 | ) | | | — | |
Class C | | | (37,052 | ) | | | — | |
Class R | | | (3,682 | ) | | | (684 | ) |
Class Y | | | (57,092 | ) | | | (33,551 | ) |
Class R5 | | | (228 | ) | | | (99 | ) |
Total distributions from net investment income | | | (1,240,816 | ) | | | (392,352 | ) |
| | |
Share transactions–net: | | | | | | | | |
Class A | | | (7,943,838 | ) | | | (8,249,873 | ) |
Class B | | | (411,438 | ) | | | (1,194,593 | ) |
Class C | | | (506,174 | ) | | | (408,914 | ) |
Class R | | | 44,765 | | | | 15,501 | |
Class Y | | | (435,625 | ) | | | (2,727,648 | ) |
Net increase (decrease) in net assets resulting from share transactions | | | (9,252,310 | ) | | | (12,565,527 | ) |
Net increase (decrease) in net assets | | | (7,331,840 | ) | | | 2,932,228 | |
| | |
Net assets: | | | | | | | | |
Beginning of year | | | 89,208,259 | | | | 86,276,031 | |
End of year (includes undistributed net investment income of $(381,825) and $87,885, respectively) | | $ | 81,876,419 | | | $ | 89,208,259 | |
Notes to Financial Statements
October 31, 2014
NOTE 1—Significant Accounting Policies
Invesco Pacific Growth Fund (the “Fund”) is a series portfolio of AIM Investment Funds (Invesco Investment Funds) (the “Trust”). The Trust is organized as a Delaware statutory trust and is registered under the Investment Company Act of 1940, as amended (the “1940 Act”), as an open-end series management investment company consisting of twenty-four separate series portfolios, each authorized to issue an unlimited number of shares of beneficial interest. The assets, liabilities and operations of each portfolio are accounted for separately. Information presented in these financial statements pertains only to the Fund. Matters affecting each portfolio or class will be voted on exclusively by the shareholders of such portfolio or class.
The Fund’s investment objective is long-term growth of capital.
The Fund currently consists of six different classes of shares: Class A, Class B, Class C, Class R, Class Y and Class R5. Class A shares are sold with a front-end sales charge unless certain waiver criteria are met and under certain circumstances load waived shares may be subject to contingent deferred sales charges (“CDSC”). Class C shares are sold with a CDSC. Class R, Class Y and Class R5 shares are sold at net asset value. Effective November 30, 2010, new or additional investments in Class B shares are no longer permitted. Existing shareholders of Class B shares may continue to reinvest dividends and capital gains distributions in Class B shares until they convert to Class A shares. Also, shareholders in Class B shares will be able to exchange those shares for Class B shares of other Invesco Funds offering such shares until they convert to Class A shares. Generally, Class B shares will automatically convert to Class A shares on or about the month-end, which is at least eight years after the date of purchase. Redemption of Class B shares prior to the conversion date will be subject to a CDSC.
The following is a summary of the significant accounting policies followed by the Fund in the preparation of its financial statements.
A. Security Valuations — Securities, including restricted securities, are valued according to the following policy.
A security listed or traded on an exchange (except convertible securities) is valued at its last sales price or official closing price as of the close of the customary trading session on the exchange where the security is principally traded, or lacking any sales or official closing price on a particular day, the security may be valued at the closing bid price on that day. Securities traded in the over-the-counter market are valued based on prices furnished by independent pricing services or market makers. When such securities are valued by an independent pricing service they may be considered fair valued. Futures contracts are valued at the final settlement price set by an exchange on which they are principally traded. Listed options are valued at the mean between the last bid and ask prices from the exchange on which they are principally traded. Options not
13 Invesco Pacific Growth Fund
listed on an exchange are valued by an independent source at the mean between the last bid and ask prices. For purposes of determining net asset value per share, futures and option contracts generally are valued 15 minutes after the close of the customary trading session of the New York Stock Exchange (“NYSE”).
Investments in open-end and closed-end registered investment companies that do not trade on an exchange are valued at the end of day net asset value per share. Investments in open-end and closed-end registered investment companies that trade on an exchange are valued at the last sales price or official closing price as of the close of the customary trading session on the exchange where the security is principally traded.
Debt obligations (including convertible securities) and unlisted equities are fair valued using an evaluated quote provided by an independent pricing service. Evaluated quotes provided by the pricing service may be determined without exclusive reliance on quoted prices, and may reflect appropriate factors such as institution-size trading in similar groups of securities, developments related to specific securities, dividend rate (for unlisted equities), yield (for debt obligations), quality, type of issue, coupon rate (for debt obligations), maturity (for debt obligations), individual trading characteristics and other market data. Debt obligations are subject to interest rate and credit risks. In addition, all debt obligations involve some risk of default with respect to interest and/or principal payments.
Foreign securities’ (including foreign exchange contracts) prices are converted into U.S. dollar amounts using the applicable exchange rates as of the close of the NYSE. If market quotations are available and reliable for foreign exchange-traded equity securities, the securities will be valued at the market quotations. Because trading hours for certain foreign securities end before the close of the NYSE, closing market quotations may become unreliable. If between the time trading ends on a particular security and the close of the customary trading session on the NYSE, events occur that the Adviser determines are significant and make the closing price unreliable, the Fund may fair value the security. If the event is likely to have affected the closing price of the security, the security will be valued at fair value in good faith using procedures approved by the Board of Trustees. Adjustments to closing prices to reflect fair value may also be based on a screening process of an independent pricing service to indicate the degree of certainty, based on historical data, that the closing price in the principal market where a foreign security trades is not the current value as of the close of the NYSE. Foreign securities’ prices meeting the approved degree of certainty that the price is not reflective of current value will be priced at the indication of fair value from the independent pricing service.
Multiple factors may be considered by the independent pricing service in determining adjustments to reflect fair value and may include information relating to sector indices, American Depositary Receipts and domestic and foreign index futures. Foreign securities may have additional risks including exchange rate changes, potential for sharply devalued currencies and high inflation, political and economic upheaval, the relative lack of issuer information, relatively low market liquidity and the potential lack of strict financial and accounting controls and standards.
Securities for which market prices are not provided by any of the above methods may be valued based upon quotes furnished by independent sources. The last bid price may be used to value equity securities. The mean between the last bid and ask prices is used to value debt obligations, including corporate loans.
Securities for which market quotations are not readily available or became unreliable are valued at fair value as determined in good faith by or under the supervision of the Trust’s officers following procedures approved by the Board of Trustees. Issuer specific events, market trends, bid/ask quotes of brokers and information providers and other market data may be reviewed in the course of making a good faith determination of a security’s fair value.
The Fund may invest in securities that are subject to interest rate risk, meaning the risk that the prices will generally fall as interest rates rise and, conversely, the prices will generally rise as interest rates fall. Specific securities differ in their sensitivity to changes in interest rates depending on their individual characteristics. Changes in interest rates may result in increased market volatility, which may affect the value and/or liquidity of certain of the Fund’s investments.
Valuations change in response to many factors including the historical and prospective earnings of the issuer, the value of the issuer’s assets, general economic conditions, interest rates, investor perceptions and market liquidity. Because of the inherent uncertainties of valuation, the values reflected in the financial statements may materially differ from the value received upon actual sale of those investments.
| B. | Securities Transactions and Investment Income — Securities transactions are accounted for on a trade date basis. Realized gains or losses on sales are computed on the basis of specific identification of the securities sold. Interest income (net of withholding tax, if any) is recorded on the accrual basis from settlement date. Dividend income (net of withholding tax, if any) is recorded on the ex-dividend date. |
The Fund may periodically participate in litigation related to Fund investments. As such, the Fund may receive proceeds from litigation settlements. Any proceeds received are included in the Statement of Operations as realized gain (loss) for investments no longer held and as unrealized gain (loss) for investments still held.
Brokerage commissions and mark ups are considered transaction costs and are recorded as an increase to the cost basis of securities purchased and/or a reduction of proceeds on a sale of securities. Such transaction costs are included in the determination of net realized and unrealized gain (loss) from investment securities reported in the Statement of Operations and the Statement of Changes in Net Assets and the net realized and unrealized gains (losses) on securities per share in the Financial Highlights. Transaction costs are included in the calculation of the Fund’s net asset value and, accordingly, they reduce the Fund’s total returns. These transaction costs are not considered operating expenses and are not reflected in net investment income reported in the Statement of Operations and Statement of Changes in Net Assets, or the net investment income per share and ratios of expenses and net investment income reported in the Financial Highlights, nor are they limited by any expense limitation arrangements between the Fund and the investment adviser.
The Fund allocates income and realized and unrealized capital gains and losses to a class based on the relative net assets of each class.
| C. | Country Determination — For the purposes of making investment selection decisions and presentation in the Schedule of Investments, the investment adviser may determine the country in which an issuer is located and/or credit risk exposure based on various factors. These factors include the laws of the country under which the issuer is organized, where the issuer maintains a principal office, the country in which the issuer derives 50% or more of its total revenues and the country that has the primary market for the issuer’s securities, as well as other criteria. Among the other criteria that may be evaluated for making this determination are the country in which the issuer maintains 50% or more of its assets, the type of security, financial guarantees and enhancements, the nature of the collateral and the sponsor organization. Country of issuer and/or credit risk exposure has been determined to be the United States of America, unless otherwise noted. |
14 Invesco Pacific Growth Fund
| D. | Distributions — Distributions from net investment income and net realized capital gain, if any, are generally declared and paid annually and recorded on the ex-dividend date. The Fund may elect to treat a portion of the proceeds from redemptions as distributions for federal income tax purposes. |
| E. | Federal Income Taxes — The Fund intends to comply with the requirements of Subchapter M of the Internal Revenue Code of 1986, as amended (the “Internal Revenue Code”), necessary to qualify as a regulated investment company and to distribute substantially all of the Fund’s taxable earnings to shareholders. As such, the Fund will not be subject to federal income taxes on otherwise taxable income (including net realized capital gain) that is distributed to shareholders. Therefore, no provision for federal income taxes is recorded in the financial statements. |
The Fund recognizes the tax benefits of uncertain tax positions only when the position is more likely than not to be sustained. Management has analyzed the Fund’s uncertain tax positions and concluded that no liability for unrecognized tax benefits should be recorded related to uncertain tax positions. Management is not aware of any tax positions for which it is reasonably possible that the total amounts of unrecognized tax benefits will change materially in the next 12 months.
The Fund files tax returns in the U.S. Federal jurisdiction and certain other jurisdictions. Generally, the Fund is subject to examinations by such taxing authorities for up to three years after the filing of the return for the tax period.
| F. | Expenses — Fees provided for under the Rule 12b-1 plan of a particular class of the Fund are charged to the operations of such class. Transfer agency fees and expenses and other shareholder recordkeeping fees and expenses attributable to Class R5 are charged to such class. Transfer agency fees and expenses and other shareholder recordkeeping fees and expenses relating to all other classes are allocated among those classes based on relative net assets. All other expenses are allocated among the classes based on relative net assets. |
| G. | Accounting Estimates — The preparation of financial statements in conformity with accounting principles generally accepted in the United States of America (“GAAP”) requires management to make estimates and assumptions that affect the reported amounts of assets and liabilities at the date of the financial statements and the reported amounts of revenues and expenses during the reporting period including estimates and assumptions related to taxation. Actual results could differ from those estimates by a significant amount. In addition, the Fund monitors for material events or transactions that may occur or become known after the period-end date and before the date the financial statements are released to print. |
| H. | Indemnifications — Under the Trust’s organizational documents, each Trustee, officer, employee or other agent of the Trust is indemnified against certain liabilities that may arise out of the performance of their duties to the Fund. Additionally, in the normal course of business, the Fund enters into contracts, including the Fund’s servicing agreements, that contain a variety of indemnification clauses. The Fund’s maximum exposure under these arrangements is unknown as this would involve future claims that may be made against the Fund that have not yet occurred. The risk of material loss as a result of such indemnification claims is considered remote. |
| I. | Securities Lending — The Fund may lend portfolio securities having a market value up to one-third of the Fund’s total assets. Such loans are secured by collateral equal to no less than the market value of the loaned securities determined daily by the securities lending provider. Such collateral will be cash or debt securities issued or guaranteed by the U.S. Government or any of its sponsored agencies. Cash collateral received in connection with these loans is invested in short-term money market instruments or affiliated money market funds and is shown as such on the Schedule of Investments. It is the Fund’s policy to obtain additional collateral from or return excess collateral to the borrower by the end of the next business day, following the valuation date of the securities loaned. Therefore, the value of the collateral held may be temporarily less than the value of the securities on loan. Lending securities entails a risk of loss to the Fund if, and to the extent that, the market value of the securities loaned were to increase and the borrower did not increase the collateral accordingly, and the borrower failed to return the securities. Upon the failure of the borrower to return the securities, collateral may be liquidated and the securities may be purchased on the open market to replace the loaned securities. The Fund could experience delays and costs in gaining access to the collateral. The Fund bears the risk of any deficiency in the amount of the collateral available for return to the borrower due to any loss on the collateral invested. Dividends received on cash collateral investments for securities lending transactions, which are net of compensation to counterparties, is included in Dividends from affiliated money market funds on the Statement of Operations. The aggregate value of securities out on loan is shown as a footnote on the Statement of Assets and Liabilities, if any. |
| J. | Foreign Currency Translations — Foreign currency is valued at the close of the NYSE based on quotations posted by banks and major currency dealers. Portfolio securities and other assets and liabilities denominated in foreign currencies are translated into U.S. dollar amounts at date of valuation. Purchases and sales of portfolio securities (net of foreign taxes withheld on disposition) and income items denominated in foreign currencies are translated into U.S. dollar amounts on the respective dates of such transactions. The Fund does not separately account for the portion of the results of operations resulting from changes in foreign exchange rates on investments and the fluctuations arising from changes in market prices of securities held. The combined results of changes in foreign exchange rates and the fluctuation of market prices on investments (net of estimated foreign tax withholding) are included with the net realized and unrealized gain or loss from investments in the Statement of Operations. Reported net realized foreign currency gains or losses arise from (1) sales of foreign currencies, (2) currency gains or losses realized between the trade and settlement dates on securities transactions, and (3) the difference between the amounts of dividends, interest, and foreign withholding taxes recorded on the Fund’s books and the U.S. dollar equivalent of the amounts actually received or paid. Net unrealized foreign currency gains and losses arise from changes in the fair values of assets and liabilities, other than investments in securities at fiscal period end, resulting from changes in exchange rates. |
The Fund may invest in foreign securities, which may be subject to foreign taxes on income, gains on investments or currency repatriation, a portion of which may be recoverable. Foreign taxes, if any, are recorded based on the tax regulations and rates that exist in the foreign markets in which the Fund invests and are shown in the Statement of Operations.
| K. | Forward Foreign Currency Contracts — The Fund may engage in foreign currency transactions either on a spot (i.e. for prompt delivery and settlement) basis or through forward foreign currency contracts to manage or minimize currency or exchange rate risk. |
The Fund may also enter into forward foreign currency contracts for the purchase or sale of a security denominated in a foreign currency in order to “lock in” the U.S. dollar price of that security, or the Fund may also enter into forward foreign currency contracts that do not provide for physical settlement of the two currencies, but instead are settled by a single cash payment calculated as the difference between the agreed upon exchange rate and the spot rate at settlement based upon an agreed upon notional amount (non-deliverable forwards). The Fund will set aside liquid assets in an amount equal to daily mark-to-market obligation for forward foreign currency contracts.
15 Invesco Pacific Growth Fund
A forward foreign currency contract is an obligation between two parties (“Counterparties”) to purchase or sell a specific currency for an agreed-upon price at a future date. The use of forward foreign currency contracts does not eliminate fluctuations in the price of the underlying securities the Fund owns or intends to acquire but establishes a rate of exchange in advance. Fluctuations in the value of these contracts are measured by the difference in the contract date and reporting date exchange rates and are recorded as unrealized appreciation (depreciation) until the contracts are closed. When the contracts are closed, realized gains (losses) are recorded. Realized and unrealized gains (losses) on the contracts are included in the Statement of Operations. The primary risks associated with forward foreign currency contracts include failure of the Counterparty to meet the terms of the contract and the value of the foreign currency changing unfavorably. These risks may be in excess of the amounts reflected in the Statement of Assets and Liabilities.
NOTE 2—Advisory Fees and Other Fees Paid to Affiliates
The Trust has entered into a master investment advisory agreement with Invesco Advisers, Inc. (the “Adviser” or “Invesco”). Under the terms of the investment advisory agreement, the Fund pays an advisory fee to the Adviser based on the annual rate of the Fund’s average daily net assets as follows:
| | | | |
| Average Daily Net Assets | | Rate | |
First $1 billion | | | 0.87% | |
Next $1 billion | | | 0.82% | |
Over $2 billion | | | 0.77% | |
For the year ended October 31, 2014, the effective advisory fees incurred by the Fund was 0.87%.
Under the terms of a master sub-advisory agreement between the Adviser and each of Invesco Asset Management Deutschland GmbH, Invesco Asset Management Limited, Invesco Asset Management (Japan) Limited, Invesco Australia Limited, Invesco Hong Kong Limited, Invesco Senior Secured Management, Inc. and Invesco Canada Ltd. (collectively, the “Affiliated Sub-Advisers”) the Adviser, not the Fund, may pay 40% of the fees paid to the Adviser to any such Affiliated Sub-Adviser(s) that provide(s) discretionary investment management services to the Fund based on the percentage of assets allocated to such Sub-Adviser(s).
The Adviser has contractually agreed, through at least June 30, 2015, to waive advisory fees and/or reimburse expenses of all shares to the extent necessary to limit total annual fund operating expenses after fee waiver and/or expense reimbursement (excluding certain items discussed below) of Class A, Class B, Class C, Class R, Class Y and Class R5 shares to 2.25%, 3.00%, 3.00%, 2.50%, 2.00% and 2.00%, respectively, of average daily net assets. In determining the Adviser’s obligation to waive advisory fees and/or reimburse expenses, the following expenses are not taken into account, and could cause the total annual fund operating expenses after fee waiver and/or expense reimbursement to exceed the numbers reflected above: (1) interest; (2) taxes; (3) dividend expense on short sales; (4) extraordinary or non-routine items, including litigation expenses; and (5) expenses that the Fund has incurred but did not actually pay because of an expense offset arrangement. Unless Invesco continues the fee waiver agreement, it will terminate on June 30, 2015. The fee waiver agreement cannot be terminated during its term. The Adviser did not waive fees and/or reimburse expenses during the period under this expense limitation.
Further, the Adviser has contractually agreed, through at least June 30, 2016, to waive the advisory fee payable by the Fund in an amount equal to 100% of the net advisory fees the Adviser receives from the affiliated money market funds on investments by the Fund of uninvested cash (excluding investments of cash collateral from securities lending) in such affiliated money market funds.
For the year ended October 31, 2014, the Adviser waived advisory fees of $1,087.
The Trust has entered into a master administrative services agreement with Invesco pursuant to which the Fund has agreed to pay Invesco for certain administrative costs incurred in providing accounting services to the Fund. For the year ended October 31, 2014, expenses incurred under the agreement are shown in the Statement of Operations as Administrative services fees.
The Trust has entered into a transfer agency and service agreement with Invesco Investment Services, Inc. (“IIS”) pursuant to which the Fund has agreed to pay IIS a fee for providing transfer agency and shareholder services to the Fund and reimburse IIS for certain expenses incurred by IIS in the course of providing such services. IIS may make payments to intermediaries that provide omnibus account services, sub-accounting services and/or networking services. All fees payable by IIS to intermediaries that provide omnibus account services or sub-accounting are charged back to the Fund, subject to certain limitations approved by the Trust’s Board of Trustees. For the year ended October 31, 2014, expenses incurred under the agreement are shown in the Statement of Operations as Transfer agent fees.
Shares of the Fund are distributed by Invesco Distributors, Inc. (“IDI”), an affiliate of the Adviser. The Fund has adopted a Plan of Distribution (the “Plan”) pursuant to Rule 12b-1 under the 1940 Act. The Plan provides that the Fund will reimburse IDI for distribution related expenses that IDI incurs up to a maximum of the following annual rates: (1) Class A — up to 0.25% of the average daily net assets of Class A shares; (2) Class B — up to 1.00% of the average daily net assets of Class B shares; (3) Class C — up to 1.00% of the average daily net assets of Class C shares; and (4) Class R — up to 0.50% of the average daily net assets of Class R shares.
In the case of Class B shares, provided that the Plan continues in effect, any cumulative expenses incurred by IDI, but not yet reimbursed to IDI, may be recovered through the payment of future distribution fees from the Fund pursuant to the Plan and contingent deferred sales charges paid by investors upon redemption of Class B shares.
For the year ended October 31, 2014, expenses incurred under these agreements are shown in the Statement of Operations as Distribution fees.
Front-end sales commissions and CDSC (collectively, the “sales charges”) are not recorded as expenses of the Fund. Front-end sales commissions are deducted from proceeds from the sales of Fund shares prior to investment in Class A shares of the Fund. CDSC are deducted from redemption proceeds prior to remittance to the shareholder. During the year ended October 31, 2014, IDI advised the Fund that IDI retained $2,655 in front-end sales commissions from the sale of Class A shares and $59, $202 and $70 from Class A, Class B and Class C shares, respectively, for CDSC imposed on redemptions by shareholders.
Certain officers and trustees of the Trust are officers and directors of the Adviser, IIS and/or IDI.
16 Invesco Pacific Growth Fund
NOTE 3—Additional Valuation Information
GAAP defines fair value as the price that would be received to sell an asset or paid to transfer a liability in an orderly transaction between market participants at the measurement date, under current market conditions. GAAP establishes a hierarchy that prioritizes the inputs to valuation methods, giving the highest priority to readily available unadjusted quoted prices in an active market for identical assets (Level 1) and the lowest priority to significant unobservable inputs (Level 3), generally when market prices are not readily available or are unreliable. Based on the valuation inputs, the securities or other investments are tiered into one of three levels. Changes in valuation methods may result in transfers in or out of an investment’s assigned level:
| | Level 1 — | Prices are determined using quoted prices in an active market for identical assets. |
| | Level 2 — | Prices are determined using other significant observable inputs. Observable inputs are inputs that other market participants may use in pricing a security. These may include quoted prices for similar securities, interest rates, prepayment speeds, credit risk, yield curves, loss severities, default rates, discount rates, volatilities and others. |
| | Level 3 — | Prices are determined using significant unobservable inputs. In situations where quoted prices or observable inputs are unavailable (for example, when there is little or no market activity for an investment at the end of the period), unobservable inputs may be used. Unobservable inputs reflect the Fund’s own assumptions about the factors market participants would use in determining fair value of the securities or instruments and would be based on the best available information. |
The following is a summary of the tiered valuation input levels, as of October 31, 2014. The level assigned to the securities valuations may not be an indication of the risk or liquidity associated with investing in those securities. Because of the inherent uncertainties of valuation, the values reflected in the financial statements may materially differ from the value received upon actual sale of those investments.
During the year ended October 31, 2014, there were transfers from Level 1 to Level 2 of $13,413,584 and from Level 2 to Level 1 of $679,228, due to foreign fair value adjustments.
| | | | | | | | | | | | | | | | |
| | | Level 1 | | | Level 2 | | | Level 3 | | | Total | |
Australia | | $ | — | | | $ | 11,817,488 | | | $ | — | | | $ | 11,817,488 | |
China | | | 3,371,751 | | | | 3,250,210 | | | | — | | | | 6,621,961 | |
Hong Kong | | | 3,043,865 | | | | 1,487,656 | | | | — | | | | 4,531,521 | |
India | | | 3,266,471 | | | | 1,200,949 | | | | — | | | | 4,467,420 | |
Indonesia | | | — | | | | 1,374,226 | | | | — | | | | 1,374,226 | |
Japan | | | 508,184 | | | | 30,265,670 | | | | — | | | | 30,773,854 | |
Malaysia | | | — | | | | 682,402 | | | | — | | | | 682,402 | |
Singapore | | | — | | | | 1,391,363 | | | | — | | | | 1,391,363 | |
South Korea | | | 5,066,537 | | | | 2,979,243 | | | | — | | | | 8,045,780 | |
Taiwan | | | — | | | | 3,750,884 | | | | — | | | | 3,750,884 | |
Thailand | | | 511,944 | | | | 1,133,603 | | | | — | | | | 1,645,547 | |
United Kingdom | | | — | | | | 386,951 | | | | — | | | | 386,951 | |
United States | | | 1,102,110 | | | | — | | | | — | | | | 1,102,110 | |
Total Investments | | $ | 16,870,862 | | | $ | 59,720,645 | | | $ | — | | | $ | 76,591,507 | |
NOTE 4—Expense Offset Arrangement(s)
The expense offset arrangement is comprised of transfer agency credits which result from balances in demand deposit accounts used by the transfer agent for clearing shareholder transactions. For the year ended October 31, 2014, the Fund received credits from this arrangement, which resulted in the reduction of the Fund’s total expenses of $154.
NOTE 5—Trustees’ and Officers’ Fees and Benefits
Trustees’ and Officers’ Fees and Benefits include amounts accrued by the Fund to pay remuneration to certain Trustees and Officers of the Fund. Trustees have the option to defer compensation payable by the Fund, and Trustees’ and Officers’ Fees and Benefits also include amounts accrued by the Fund to fund such deferred compensation amounts. Those Trustees who defer compensation have the option to select various Invesco Funds in which their deferral accounts shall be deemed to be invested. Finally, certain current Trustees were eligible to participate in a retirement plan that provided for benefits to be paid upon retirement to Trustees over a period of time based on the number of years of service. The Fund may have certain former Trustees who also participate in a retirement plan and receive benefits under such plan. Trustees’ and Officers’ Fees and Benefits include amounts accrued by the Fund to fund such retirement benefits. Obligations under the deferred compensation and retirement plans represent unsecured claims against the general assets of the Fund.
17 Invesco Pacific Growth Fund
NOTE 6—Cash Balances
The Fund is permitted to temporarily carry a negative or overdrawn balance in its account with State Street Bank and Trust Company, the custodian bank. Such balances, if any at period end, are shown in the Statement of Assets and Liabilities under the payable caption Amount due custodian. To compensate the custodian bank for such overdrafts, the overdrawn Fund may either (1) leave funds as a compensating balance in the account so the custodian bank can be compensated by earning the additional interest; or (2) compensate by paying the custodian bank at a rate agreed upon by the custodian bank and Invesco, not to exceed the contractually agreed upon rate.
NOTE 7—Distributions to Shareholders and Tax Components of Net Assets
Tax Character of Distributions to Shareholders Paid During the Years Ended October 31, 2014 and 2013:
| | | | | | | | |
| | | 2014 | | | 2013 | |
Ordinary income | | $ | 1,240,816 | | | $ | 392,352 | |
Tax Components of Net Assets at Period-End:
| | | | |
| | | 2014 | |
Undistributed ordinary income | | $ | 88,885 | |
Net unrealized appreciation — investments | | | 8,337,248 | |
Net unrealized appreciation (depreciation) — other investments | | | (114,421 | ) |
Temporary book/tax differences | | | (91,082 | ) |
Capital loss carryforward | | | (17,257,966 | ) |
Shares of beneficial interest | | | 90,913,755 | |
Total net assets | | $ | 81,876,419 | |
The difference between book-basis and tax-basis unrealized appreciation (depreciation) is due to differences in the timing of recognition of gains and losses on investments for tax and book purposes. The Fund’s net unrealized appreciation difference is attributable primarily to wash sales and the recognition for tax purposes of unrealized gains on passive foreign investment companies.
The temporary book/tax differences are a result of timing differences between book and tax recognition of income and/or expenses. The Fund’s temporary book/tax differences are the result of the trustee deferral of compensation and retirement plan benefits.
Capital loss carryforward is calculated and reported as of a specific date. Results of transactions and other activity after that date may affect the amount of capital loss carryforward actually available for the Fund to utilize. Capital losses generated in years beginning after December 22, 2010 can be carried forward for an unlimited period, whereas previous losses expire in 8 tax years. Capital losses with an expiration period may not be used to offset capital gains until all net capital losses without an expiration date have been utilized. Capital loss carryforwards with no expiration date will retain their character as either short-term or long-term capital losses instead of as short-term capital losses as under prior law. The ability to utilize capital loss carryforward in the future may be limited under the Internal Revenue Code and related regulations based on the results of future transactions.
The Fund utilized $5,671,829 of capital loss carryforward in the current period to offset net realized capital gain for federal income tax purposes. The Fund has a capital loss carryforward as of October 31, 2014, which expires as follows:
| | | | | | | | | | | | |
| Capital Loss Carryforward* | |
| Expiration | | Short-Term | | | Long-Term | | | Total | |
October 31, 2015 | | $ | 45,180 | | | $ | — | | | $ | 45,180 | |
October 31, 2016 | | | 1,247,693 | | | | — | | | | 1,247,693 | |
October 31, 2017 | | | 15,965,093 | | | | — | | | | 15,965,093 | |
Total capital loss carryforward | | $ | 17,257,966 | | | $ | — | | | $ | 17,257,966 | |
| | | | | | | | | | | | |
| * | Capital loss carryforward as of the date listed above is reduced for limitations, if any, to the extent required by the Internal Revenue Code and may be further limited depending upon a variety of factors, including the realization of net unrealized gains or losses as of the date of any reorganization. |
NOTE 8—Investment Securities
The aggregate amount of investment securities (other than short-term securities, U.S. Treasury obligations and money market funds, if any) purchased and sold by the Fund during the year ended October 31, 2014 was $51,772,895 and $66,351,833, respectively. Cost of investments on a tax basis includes the adjustments for financial reporting purposes as of the most recently completed federal income tax reporting period-end.
| | | | |
| Unrealized Appreciation (Depreciation) of Investment Securities on a Tax Basis | |
Aggregate unrealized appreciation of investment securities | | $ | 10,649,553 | |
Aggregate unrealized (depreciation) of investment securities | | | (2,312,305 | ) |
Net unrealized appreciation of investment securities | | $ | 8,337,248 | |
Cost of investments for tax purposes is $68,254,259.
18 Invesco Pacific Growth Fund
NOTE 9—Reclassification of Permanent Differences
Primarily as a result of differing book/tax treatment of foreign currency transactions and passive foreign investment companies, on October 31, 2014, undistributed net investment income was increased by $302,042 and undistributed net realized gain (loss) was decreased by $302,042. This reclassification had no effect on the net assets of the Fund.
NOTE 10—Share Information
| | | | | | | | | | | | | | | | |
| | | Summary of Share Activity | |
| | | Years ended October 31, | |
| | | 2014(a) | | | 2013 | |
| | | Shares | | | Amount | | | Shares | | | Amount | |
Sold: | | | | | | | | | | | | | | | | |
Class A | | | 133,449 | | | $ | 3,122,847 | | | | 183,134 | | | $ | 4,073,454 | |
Class B | | | 922 | | | | 20,231 | | | | 1,847 | | | | 39,858 | |
Class C | | | 14,602 | | | | 327,536 | | | | 17,833 | | | | 377,709 | |
Class R | | | 12,584 | | | | 306,742 | | | | 3,286 | | | | 72,948 | |
Class Y | | | 107,353 | | | | 2,570,104 | | | | 165,224 | | | | 3,675,896 | |
| | | | |
Issued as reinvestment of dividends: | | | | | | | | | | | | | | | | |
Class A | | | 43,353 | | | | 991,482 | | | | 14,534 | | | | 313,754 | |
Class B | | | 261 | | | | 5,649 | | | | — | | | | — | |
Class C | | | 1,529 | | | | 33,187 | | | | — | | | | — | |
Class R | | | 153 | | | | 3,472 | | | | 29 | | | | 640 | |
Class Y | | | 2,362 | | | | 54,770 | | | | 1,516 | | | | 32,520 | |
| | | | |
Automatic conversion of Class B shares to Class A shares: | | | | | | | | | | | | | | | | |
Class A | | | 12,179 | | | | 283,842 | | | | 35,357 | | | | 773,892 | |
Class B | | | (12,895 | ) | | | (283,842 | ) | | | (37,464 | ) | | | (773,892 | ) |
| | | | |
Reacquired: | | | | | | | | | | | | | | | | |
Class A | | | (524,772 | ) | | | (12,342,009 | ) | | | (606,595 | ) | | | (13,410,973 | ) |
Class B | | | (7,007 | ) | | | (153,476 | ) | | | (22,453 | ) | | | (460,559 | ) |
Class C | | | (39,409 | ) | | | (866,897 | ) | | | (37,694 | ) | | | (786,623 | ) |
Class R | | | (11,043 | ) | | | (265,449 | ) | | | (2,730 | ) | | | (58,087 | ) |
Class Y | | | (126,963 | ) | | | (3,060,499 | ) | | | (288,507 | ) | | | (6,436,064 | ) |
Net increase (decrease) in share activity | | | (393,342 | ) | | $ | (9,252,310 | ) | | | (572,683 | ) | | $ | (12,565,527 | ) |
| (a) | There are entities that are record owners of more than 5% of the outstanding shares of the Fund and in the aggregate own 68% of the outstanding shares of the Fund. IDI has an agreement with these entities to sell Fund shares. The Fund, Invesco and/or Invesco affiliates may make payments to these entities, which are considered to be related to the Fund, for providing services to the Fund, Invesco and/or Invesco affiliates including but not limited to services such as securities brokerage, distribution, third party record keeping and account servicing. The Fund has no knowledge as to whether all or any portion of the shares owned of record by these entities are also owned beneficially. |
19 Invesco Pacific Growth Fund
NOTE 11—Financial Highlights
The following schedule presents financial highlights for a share of the Fund outstanding throughout the periods indicated.
| | | | | | | | | | | | | | | | | | | | | | | | | | | | | | | | | | | | | | | | | | | | | | | | | | | | |
| | | Net asset
value,
beginning
of period | | | Net
investment
income
(loss)(a) | | | Net gains
(losses)
on securities
(both
realized and
unrealized) | | | Total from
investment
operations | | | Dividends
from net
investment
income | | | Net asset
value, end
of period(b) | | | Total
return(c) | | | Net assets,
end of period
(000’s omitted) | | | Ratio of
expenses
to average
net assets
with fee waivers
and/or expenses
absorbed | | | Ratio of
expenses
to average net
assets without
fee waivers
and/or expenses
absorbed | | | Ratio of net
investment
income (loss)
to average
net assets | | | Rebate from
Morgan
Stanley
Affiliate | | | Portfolio
turnover(d) | |
Class A | | | | | | | | | | | | | | | | | | | | | | | | | | | | | | | | | | | | | | | | | | | | | | | | | | | | |
Year ended 10/31/14 | | $ | 23.90 | | | $ | 0.14 | | | $ | 0.82 | | | $ | 0.96 | | | $ | (0.35 | ) | | $ | 24.51 | | | | 4.10 | %(h) | | $ | 73,457 | | | | 1.77 | %(e)(h) | | | 1.77 | %(e)(h) | | | 0.60 | %(e)(h) | | | N/A | | | | 63 | % |
Year ended 10/31/13 | | | 20.05 | | | | 0.12 | | | | 3.83 | | | | 3.95 | | | | (0.10 | ) | | | 23.90 | | | | 19.76 | | | | 79,672 | | | | 1.81 | | | | 1.81 | | | | 0.56 | | | | N/A | | | | 87 | |
Year ended 10/31/12 | | | 20.05 | | | | 0.15 | | | | 0.20 | | | | 0.35 | | | | (0.35 | ) | | | 20.05 | | | | 1.81 | | | | 74,319 | | | | 1.79 | | | | 1.79 | | | | 0.76 | | | | N/A | | | | 101 | |
Year ended 10/31/11 | | | 22.21 | | | | 0.23 | | | | (2.20 | ) | | | (1.97 | ) | | | (0.19 | ) | | | 20.05 | | | | (8.95 | ) | | | 83,779 | | | | 1.68 | | | | 1.68 | | | | 1.03 | | | | N/A | | | | 109 | |
Year ended 10/31/10 | | | 19.48 | | | | 0.06 | | | | 2.72 | | | | 2.78 | | | | (0.05 | ) | | | 22.21 | | | | 14.29 | | | | 105,428 | | | | 1.78 | (f) | | | 1.78 | (f) | | | 0.31 | (f) | | | 0.00 | %(g) | | | 76 | |
Class B | | | | | | | | | | | | | | | | | | | | | | | | | | | | | | | | | | | | | | | | | | | | | | | | | | | | |
Year ended 10/31/14 | | | 22.49 | | | | (0.04 | ) | | | 0.77 | | | | 0.73 | | | | (0.17 | ) | | | 23.05 | | | | 3.28 | | | | 480 | | | | 2.53 | (e) | | | 2.53 | (e) | | | (0.16 | )(e) | | | N/A | | | | 63 | |
Year ended 10/31/13 | | | 18.92 | | | | (0.04 | ) | | | 3.61 | | | | 3.57 | | | | — | | | | 22.49 | | | | 18.87 | | | | 889 | | | | 2.56 | | | | 2.56 | | | | (0.19 | ) | | | N/A | | | | 87 | |
Year ended 10/31/12 | | | 18.91 | | | | (0.00 | ) | | | 0.20 | | | | 0.20 | | | | (0.19 | ) | | | 18.92 | | | | 1.09 | | | | 1,847 | | | | 2.55 | | | | 2.55 | | | | (0.00 | ) | | | N/A | | | | 101 | |
Year ended 10/31/11 | | | 20.97 | | | | 0.06 | | | | (2.08 | ) | | | (2.02 | ) | | | (0.04 | ) | | | 18.91 | | | | (9.68 | ) | | | 4,376 | | | | 2.43 | | | | 2.43 | | | | 0.28 | | | | N/A | | | | 109 | |
Year ended 10/31/10 | | | 18.49 | | | | (0.09 | ) | | | 2.57 | | | | 2.48 | | | | — | | | | 20.97 | | | | 13.41 | | | | 8,279 | | | | 2.53 | (f) | | | 2.53 | (f) | | | (0.44 | )(f) | | | 0.00 | (g) | | | 76 | |
Class C | | | | | | | | | | | | | | | | | | | | | | | | | | | | | | | | | | | | | | | | | | | | | | | | | | | | |
Year ended 10/31/14 | | | 22.53 | | | | (0.03 | ) | | | 0.76 | | | | 0.73 | | | | (0.17 | ) | | | 23.09 | | | | 3.28 | (h) | | | 4,638 | | | | 2.52 | (e)(h) | | | 2.52 | (e)(h) | | | (0.15 | )(e)(h) | | | N/A | | | | 63 | |
Year ended 10/31/13 | | | 18.95 | | | | (0.04 | ) | | | 3.62 | | | | 3.58 | | | | — | | | | 22.53 | | | | 18.89 | | | | 5,049 | | | | 2.56 | | | | 2.56 | | | | (0.19 | ) | | | N/A | | | | 87 | |
Year ended 10/31/12 | | | 18.94 | | | | 0.02 | | | | 0.19 | | | | 0.21 | | | | (0.20 | ) | | | 18.95 | | | | 1.15 | (h) | | | 4,624 | | | | 2.46 | (h) | | | 2.46 | (h) | | | 0.09 | (h) | | | N/A | | | | 101 | |
Year ended 10/31/11 | | | 20.99 | | | | 0.07 | | | | (2.08 | ) | | | (2.01 | ) | | | (0.04 | ) | | | 18.94 | | | | (9.62 | )(h) | | | 5,572 | | | | 2.39 | (h) | | | 2.39 | (h) | | | 0.32 | (h) | | | N/A | | | | 109 | |
Year ended 10/31/10 | | | 18.51 | | | | (0.09 | ) | | | 2.57 | | | | 2.48 | | | | — | | | | 20.99 | | | | 13.40 | | | | 5,951 | | | | 2.53 | (f) | | | 2.53 | (f) | | | (0.44 | )(f) | | | 0.00 | (g) | | | 76 | |
Class R | | | | | | | | | | | | | | | | | | | | | | | | | | | | | | | | | | | | | | | | | | | | | | | | | | | | |
Year ended 10/31/14 | | | 23.74 | | | | 0.08 | | | | 0.80 | | | | 0.88 | | | | (0.29 | ) | | | 24.33 | | | | 3.78 | | | | 344 | | | | 2.03 | (e) | | | 2.03 | (e) | | | 0.34 | (e) | | | N/A | | | | 63 | |
Year ended 10/31/13 | | | 19.93 | | | | 0.07 | | | | 3.80 | | | | 3.87 | | | | (0.06 | ) | | | 23.74 | | | | 19.44 | | | | 295 | | | | 2.06 | | | | 2.06 | | | | 0.31 | | | | N/A | | | | 87 | |
Year ended 10/31/12 | | | 19.95 | | | | 0.10 | | | | 0.20 | | | | 0.30 | | | | (0.32 | ) | | | 19.93 | | | | 1.59 | | | | 236 | | | | 2.05 | | | | 2.05 | | | | 0.50 | | | | N/A | | | | 101 | |
Year ended 10/31/11 | | | 22.11 | | | | 0.17 | | | | (2.19 | ) | | | (2.02 | ) | | | (0.14 | ) | | | 19.95 | | | | (9.21 | ) | | | 129 | | | | 1.93 | | | | 1.93 | | | | 0.78 | | | | N/A | | | | 109 | |
Year ended 10/31/10 | | | 19.41 | | | | 0.01 | | | | 2.70 | | | | 2.71 | | | | (0.01 | ) | | | 22.11 | | | | 13.97 | | | | 37 | | | | 2.03 | (f) | | | 2.03 | (f) | | | 0.06 | (f) | | | 0.00 | (g) | | | 76 | |
Class Y(i) | | | | | | | | | | | | | | | | | | | | | | | | | | | | | | | | | | | | | | | | | | | | | | | | | | | | |
Year ended 10/31/14 | | | 24.28 | | | | 0.20 | | | | 0.82 | | | | 1.02 | | | | (0.40 | ) | | | 24.90 | | | | 4.34 | | | | 2,944 | | | | 1.53 | (e) | | | 1.53 | (e) | | | 0.84 | (e) | | | N/A | | | | 63 | |
Year ended 10/31/13 | | | 20.37 | | | | 0.18 | | | | 3.88 | | | | 4.06 | | | | (0.15 | ) | | | 24.28 | | | | 20.03 | | | | 3,291 | | | | 1.56 | | | | 1.56 | | | | 0.81 | | | | N/A | | | | 87 | |
Year ended 10/31/12 | | | 20.37 | | | | 0.20 | | | | 0.21 | | | | 0.41 | | | | (0.41 | ) | | | 20.37 | | | | 2.10 | | | | 5,240 | | | | 1.55 | | | | 1.55 | | | | 1.00 | | | | N/A | | | | 101 | |
Year ended 10/31/11 | | | 22.57 | | | | 0.29 | | | | (2.24 | ) | | | (1.95 | ) | | | (0.25 | ) | | | 20.37 | | | | (8.77 | ) | | | 7,998 | | | | 1.43 | | | | 1.43 | | | | 1.28 | | | | N/A | | | | 109 | |
Year ended 10/31/10 | | | 19.77 | | | | 0.12 | | | | 2.77 | | | | 2.89 | | | | (0.09 | ) | | | 22.57 | | | | 14.67 | | | | 9,553 | | | | 1.53 | (f) | | | 1.53 | (f) | | | 0.56 | (f) | | | 0.00 | (g) | | | 76 | |
Class R5 | | | | | | | | | | | | | | | | | | | | | | | | | | | | | | | | | | | | | | | | | | | | | | | | | | | | |
Year ended 10/31/14 | | | 24.30 | | | | 0.24 | | | | 0.82 | | | | 1.06 | | | | (0.44 | ) | | | 24.92 | | | | 4.48 | | | | 13 | | | | 1.37 | (e) | | | 1.37 | (e) | | | 1.00 | (e) | | | N/A | | | | 63 | |
Year ended 10/31/13 | | | 20.39 | | | | 0.21 | | | | 3.89 | | | | 4.10 | | | | (0.19 | ) | | | 24.30 | | | | 20.23 | | | | 13 | | | | 1.43 | | | | 1.43 | | | | 0.94 | | | | N/A | | | | 87 | |
Year ended 10/31/12 | | | 20.39 | | | | 0.24 | | | | 0.20 | | | | 0.44 | | | | (0.44 | ) | | | 20.39 | | | | 2.24 | | | | 11 | | | | 1.37 | | | | 1.37 | | | | 1.18 | | | | N/A | | | | 101 | |
Year ended 10/31/11(j) | | | 23.52 | | | | 0.35 | | | | (3.48 | ) | | | (3.13 | ) | | | — | | | | 20.39 | | | | (13.31 | ) | | | 11 | | | | 1.22 | (k) | | | 1.22 | (k) | | | 1.49 | (k) | | | N/A | | | | 109 | |
| (a) | Calculated using average shares outstanding. |
| (b) | Includes redemption fees added to shares of beneficial interest which were less than $0.005 per share for the years ended October 31, 2012 and October 31, 2011. |
| (c) | Includes adjustments in accordance with accounting principles generally accepted in the United States of America and as such, the net asset value for financial reporting purposes and the returns based upon those net asset values may differ from the net asset value and returns for shareholder transactions. Does not include sales charges and is not annualized for periods less than one year, if applicable. |
| (d) | Portfolio turnover is calculated at the fund level and is not annualized for periods less than one year, if applicable. For the period ended October 31, 2011, the portfolio turnover calculation excludes the value of securities purchased of $5,980,249 and sold of $4,944,271 in effect to realign the Fund’s portfolio holdings after the reorganization of Invesco Japan Fund into the Fund. |
| (e) | Ratios are based on average daily net assets (000’s omitted) of $75,052, $626, $4,694, $314, $3,516 and $13 for Class A, Class B, Class C, Class R, Class Y, and Class R5 shares, respectively. |
| (f) | The ratios reflect the rebate of certain Fund expenses in connection with investments in a Morgan Stanley affiliate during the period. The effect of the rebate on the ratios is disclosed in the above table as “Rebate from Morgan Stanley affiliate”. |
| (g) | Amount is less than 0.005%. |
| (h) | The total return, ratio of expenses to average net assets and ratio of net investment income to average net assets reflect actual 12b-1 fees of 0.24% for Class A shares for the year ended October 31, 2014 and 0.99%, 0.90% and 0.95% for Class C shares for the years ended October 31, 2014, 2012 and 2011, respectively. |
| (i) | On June 1, 2010, Morgan Stanley Pacific Growth Funds Inc.’s former Class I shares were reorganized into Class Y shares. |
| (j) | Commencement date of May 23, 2011 for Class R5 shares. |
20 Invesco Pacific Growth Fund
Report of Independent Registered Public Accounting Firm
To the Board of Trustees of AIM Investment Funds (Invesco Investment Funds)
and Shareholders of Invesco Pacific Growth Fund:
In our opinion, the accompanying statement of assets and liabilities, including the schedule of investments, and the related statements of operations and of changes in net assets and the financial highlights present fairly, in all material respects, the financial position of Invesco Pacific Growth Fund (one of the funds constituting AIM Investment Funds (Invesco Investment Funds), hereafter referred to as the “Fund”) at October 31, 2014, the results of its operations for the year then ended, the changes in its net assets for each of the two years in the period then ended and the financial highlights for each of the five years in the period then ended, in conformity with accounting principles generally accepted in the United States of America. These financial statements and financial highlights (hereafter referred to as “financial statements”) are the responsibility of the Fund’s management. Our responsibility is to express an opinion on these financial statements based on our audits. We conducted our audits of these financial statements in accordance with the standards of the Public Company Accounting Oversight Board (United States). Those standards require that we plan and perform the audit to obtain reasonable assurance about whether the financial statements are free of material misstatement. An audit includes examining, on a test basis, evidence supporting the amounts and disclosures in the financial statements, assessing the accounting principles used and significant estimates made by management, and evaluating the overall financial statement presentation. We believe that our audits, which included confirmation of securities at October 31, 2014 by correspondence with the custodian and brokers, and the application of alternative auditing procedures where confirmations of security purchases have not been received, provide a reasonable basis for our opinion.
PRICEWATERHOUSECOOPERS LLP
December 23, 2014
Houston, Texas
21 Invesco Pacific Growth Fund
Calculating your ongoing Fund expenses
Example
As a shareholder of the Fund, you incur two types of costs: (1) transaction costs, which may include sales charges (loads) on purchase payments or contingent deferred sales charges on redemptions, if any; and (2) ongoing costs, including management fees, distribution and/or service (12b-1) fees, and other Fund expenses. This example is intended to help you understand your ongoing costs (in dollars) of investing in the Fund and to compare these costs with ongoing costs of investing in other mutual funds. The example is based on an investment of $1,000 invested at the beginning of the period and held for the entire period May 1, 2014 through October 31, 2014.
Actual expenses
The table below provides information about actual account values and actual expenses. You may use the information in this table, together with the amount you invested, to estimate the expenses that you paid over the period. Simply divide your account value by $1,000 (for example, an $8,600 account value divided by $1,000 = 8.6), then multiply the result by the number in the table under the heading entitled “Actual Expenses Paid During Period” to estimate the expenses you paid on your account during this period.
Hypothetical example for comparison purposes
The table below also provides information about hypothetical account values and hypothetical expenses based on the Fund’s actual expense ratio and an assumed rate of return of 5% per year before expenses, which is not the Fund’s actual return.
The hypothetical account values and expenses may not be used to estimate the actual ending account balance or expenses you paid for the period. You may use this information to compare the ongoing costs of investing in the Fund and other funds. To do so, compare this 5% hypothetical example with the 5% hypothetical examples that appear in the shareholder reports of the other funds.
Please note that the expenses shown in the table are meant to highlight your ongoing costs only and do not reflect any transaction costs, such as sales charges (loads) on purchase payments or contingent deferred sales charges on redemptions, if any. Therefore, the hypothetical information is useful in comparing ongoing costs only, and will not help you determine the relative total costs of owning different funds. In addition, if these transaction costs were included, your costs would have been higher.
| | | | | | | | | | | | | | | | | | | | | | | | |
| Class | | Beginning
Account Value
(05/01/14) | | | ACTUAL | | | HYPOTHETICAL (5% annual return before expenses) | | | Annualized
Expense
Ratio | |
| | | Ending
Account Value
(10/31/14)1 | | | Expenses
Paid During
Period2 | | | Ending
Account Value
(10/31/14) | | | Expenses
Paid During
Period2 | | |
| A | | $ | 1,000.00 | | | $ | 1,073.10 | | | $ | 9.30 | | | $ | 1,016.23 | | | $ | 9.05 | | | | 1.78 | % |
| B | | | 1,000.00 | | | | 1,068.60 | | | | 13.24 | | | | 1,012.40 | | | | 12.88 | | | | 2.54 | |
| C | | | 1,000.00 | | | | 1,068.40 | | | | 13.29 | | | | 1,012.35 | | | | 12.93 | | | | 2.55 | |
| R | | | 1,000.00 | | | | 1,071.30 | | | | 10.65 | | | | 1,014.92 | | | | 10.36 | | | | 2.04 | |
| Y | | | 1,000.00 | | | | 1,074.20 | | | | 8.05 | | | | 1,017.44 | | | | 7.83 | | | | 1.54 | |
| R5 | | | 1,000.00 | | | | 1,075.00 | | | | 7.22 | | | | 1,018.25 | | | | 7.02 | | | | 1.38 | |
| 1 | The actual ending account value is based on the actual total return of the Fund for the period May 1, 2014 through October 31, 2014, after actual expenses and will differ from the hypothetical ending account value which is based on the Fund’s expense ratio and a hypothetical annual return of 5% before expenses. |
| 2 | Expenses are equal to the Fund’s annualized expense ratio as indicated above multiplied by the average account value over the period, multiplied by 184/365 to reflect the most recent fiscal half year. |
22 Invesco Pacific Growth Fund
Approval of Investment Advisory and Sub-Advisory Contracts
The Board of Trustees (the Board) of AIM Investment Funds (Invesco Investment Funds) is required under the Investment Company Act of 1940, as amended, to approve annually the renewal of Invesco Pacific Growth Fund’s (the Fund) investment advisory agreements. During contract renewal meetings held on June 16-17, 2014, the Board as a whole, and the disinterested or “independent” Trustees, who comprise over 75% of the Board, voting separately, approved the continuance for the Fund of the Master Investment Advisory Agreement with Invesco Advisers, Inc. (Invesco Advisers and the investment advisory agreement) and the Master Intergroup Sub-Advisory Contract for Mutual Funds with Invesco Asset Management Deutschland GmbH, Invesco Asset Management Limited, Invesco Asset Management (Japan) Limited, Invesco Australia Limited, Invesco Hong Kong Limited, Invesco Senior Secured Management, Inc. and Invesco Canada Ltd. (collectively, the Affiliated Sub-Advisers and the sub-advisory contracts) for another year, effective July 1, 2014.
In evaluating the fairness and reasonableness of compensation under the Fund’s investment advisory agreement and sub-advisory contracts, the Board considered, among other things, the factors discussed below. The Board determined that the continuation of the Fund’s investment advisory agreement and the sub-advisory contracts are in the best interest of the Fund and its shareholders and that the compensation payable to Invesco Advisers and the Affiliated Sub-Advisers under the agreements is fair and reasonable.
The Board’s Fund Evaluation Process
The Board’s Investments Committee has established three Sub-Committees, each of which is primarily responsible for overseeing the management of a number of the funds advised by Invesco Advisers (the Invesco Funds). The Sub-Committees meet throughout the year to review the performance of their assigned Invesco Funds, including reviewing materials prepared under the direction of the independent Senior Officer, an officer of the Invesco Funds who reports directly to the independent Trustees. Over the course of each year, the Sub-Committees meet with portfolio managers for their assigned Invesco Funds and other members of management to review the performance, investment objective(s), policies, strategies, limitations and investment risks of these funds. The Sub-Committees meet regularly and at designated contract renewal meetings each year to conduct a review of the performance, fees, expenses and other matters related to their assigned Invesco Funds. Each Sub-Committee recommends to the Investments Committee, which in turn recommends to the full Board, whether and on what terms to approve the continuance of each Invesco Fund’s
investment advisory agreement and sub-advisory contracts for another year.
During the contract renewal process, the Trustees receive comparative performance and fee data regarding the Invesco Funds prepared by Invesco Advisers and Lipper Inc. (Lipper), an independent provider of investment company data. The Trustees also receive an independent written evaluation from the Senior Officer. The Senior Officer’s evaluation is prepared as part of his responsibility to manage the process by which the Invesco Funds’ proposed management fees are negotiated during the annual contract renewal process to ensure they are negotiated in a manner that is at arms’ length and reasonable. In addition to meetings with Invesco Advisers and fund counsel, the independent Trustees also discuss the continuance of the investment advisory agreement and sub-advisory contracts in separate sessions with the Senior Officer and with independent legal counsel.
The Trustees recognized that the advisory fee rates for the Invesco Funds are, in many cases, the result of years of review and negotiation. The Trustees’ deliberations and conclusions in a particular year may be based in part on their deliberations and conclusions regarding these arrangements throughout the year and in prior years. The Trustees’ review and conclusions are based on the comprehensive consideration of all information presented to them and are not the result of any single determinative factor. Moreover, one Trustee may have weighed a particular piece of information or factor differently than another Trustee.
The discussion below serves as the Senior Officer’s independent written evaluation with respect to the Fund’s investment advisory agreement as well as a discussion of the material factors and related conclusions that formed the basis for the Board’s approval of the Fund’s investment advisory agreement and sub-advisory contracts. Unless otherwise stated, this information is current as of June 17, 2014, and may not reflect consideration of factors that became known to the Board after that date.
Factors and Conclusions and Summary of Independent Written Fee Evaluation
| A. | Nature, Extent and Quality of Services Provided by Invesco Advisers and the Affiliated Sub-Advisers |
The Board reviewed the advisory services provided to the Fund by Invesco Advisers under the Fund’s investment advisory agreement, the performance of Invesco Advisers in providing these services, and the credentials and experience of the officers and employees of Invesco Advisers who provide these services, including the Fund’s portfolio manager or managers, with whom the Sub-Committees met during the year. The Board’s review of the
qualifications of Invesco Advisers to provide advisory services included the Board’s consideration of Invesco Advisers’ investment process oversight, independent credit analysis and investment risk management. The Board also considered non-advisory services that Invesco Advisers and its affiliates provide to the Invesco Funds such as various back office support functions, equity and fixed income trading operations, internal audit, distribution and legal and compliance.
In determining whether to continue the Fund’s investment advisory agreement, the Board considered the benefits of reapproving an existing relationship and the greater uncertainty that may be associated with entering into a new relationship. The Board concluded that the nature, extent and quality of the services provided to the Fund by Invesco Advisers are appropriate and satisfactory and consistent with the terms of the Fund’s investment advisory agreement.
The Board reviewed the services provided by the Affiliated Sub-Advisers under the sub-advisory contracts and the credentials and experience of the officers and employees of the Affiliated Sub-Advisers who provide these services. The Board noted that the Affiliated Sub-Advisers have offices and personnel that are located in financial centers around the world. As a result, the Affiliated Sub-Advisers can provide research and investment analysis on the markets and economies of various countries in which the Fund may invest, make recommendations regarding securities and assist with security trades. The Board concluded that the sub-advisory contracts benefit the Fund and its shareholders by permitting Invesco Advisers to use the resources and talents of the Affiliated Sub-Advisers in managing the Fund. The Board concluded that the nature, extent and quality of the services provided by the Affiliated Sub-Advisers are appropriate and satisfactory and consistent with the terms of the Fund’s sub-advisory contracts.
The Board considered Fund performance as a relevant factor in considering whether to approve the investment advisory agreement as well as the sub-advisory contracts for the Fund, as Invesco Asset Management (Japan) Limited and Invesco Hong Kong Limited currently manage assets of the Fund.
The Board compared the Fund’s performance during the past one, three and five calendar years to the performance of funds in the Lipper performance universe and against the Lipper Pacific Region Funds Index. The Board noted that performance of Class A shares of the Fund was in the third quintile of the performance universe for the one year period and the fifth quintile for the three and five year periods (the first quintile being the best performing funds
23 Invesco Pacific Growth Fund
and the fifth quintile being the worst performing funds). The Board noted that performance of Class A shares of the Fund was below the performance of the Index for the one, three and five year periods. Invesco Advisers noted that the portfolio management team is managing to a new index which has slightly lower exposure to Japan. The Trustees also reviewed more recent Fund performance and this review did not change their conclusions.
| C. | Advisory and Sub-Advisory Fees |
The Board compared the Fund’s contractual management fee rate to the contractual management fee rates of funds in the Fund’s Lipper expense group at a common asset level. The Board noted that the contractual management fee rate for Class A shares of the Fund was below the median contractual management fee rate of funds in the expense group. The Board noted that the term “contractual management fee” may include both advisory and certain administrative services fees, but that Lipper does not provide information on a fund by fund basis as to what is included. The Board noted that Invesco does not charge the Invesco Funds for the administrative services included in the term as defined by Lipper. The Board also reviewed the methodology used by Lipper in providing expense group information, which includes using each fund’s contractual management fee schedule (including any applicable breakpoints) as reported in the most recent prospectus or statement of additional information for each fund in the expense group.
The Board noted that Invesco Advisers has contractually agreed to waive fees and/or limit expenses of the Fund through at least June 30, 2015 in an amount necessary to limit total annual operating expenses to a specified percentage of average daily net assets for each class of the Fund.
The Board noted that Invesco Advisers and the Affiliated Sub-Advisers do not manage other funds or client accounts using an investment process substantially similar to the investment process used for the Fund.
The Board also considered the services provided by the Affiliated Sub-Advisers pursuant to the sub-advisory contracts, as well as the fees payable by Invesco Advisers to the Affiliated Sub-Advisers pursuant to the sub-advisory contracts. The Board noted that Invesco Advisers retains overall responsibility for, and provides services to, sub-advised Invesco Funds, including oversight of the Affiliated Sub-Advisers as well as the additional services described herein other than day-to-day portfolio management. The Board also noted that the sub-advisory fees are not paid directly by the Fund, but rather, are payable by Invesco Advisers to the Affiliated Sub-Advisers.
| D. | Economies of Scale and Breakpoints |
The Board considered the extent to which there are economies of scale in the provision of advisory services to the Fund. The Board also considered whether the Fund benefits from economies of scale through contractual
breakpoints in the Fund’s advisory fee schedule and was assisted in this review by a report from the Senior Officer. The Board also noted that the Fund shares directly in economies of scale through lower fees charged by third party service providers based on the combined size of the Invesco Funds and other clients advised by Invesco Advisers.
| E. | Profitability and Financial Resources |
The Board reviewed information from Invesco Advisers concerning the costs of the advisory and other services that Invesco Advisers and its affiliates provide to the Fund and the profitability of Invesco Advisers and its affiliates in providing these services for the year ended December 31, 2013. The Board received information from Invesco Advisers about the methodology used to prepare the profitability information. The Board considered the profitability of Invesco Advisers in managing the Fund and the Invesco Funds. The Board noted that Invesco Advisers continues to operate at a net profit from services Invesco Advisers and its subsidiaries provide to the Invesco Funds and the Fund. The Board did not deem the level of profits realized by Invesco Advisers and its affiliates from providing services to the Fund to be excessive given the nature, quality and extent of the services provided to the Invesco Funds. The Board received and accepted information from Invesco Advisers demonstrating that Invesco Advisers and each Affiliated Sub-Adviser are financially sound and have the resources necessary to perform their obligations under the investment advisory agreement and sub-advisory contracts.
| F. | Collateral Benefits to Invesco Advisers and its Affiliates |
The Board considered various other benefits received by Invesco Advisers and its affiliates from the relationship with the Fund, including the fees received for their provision of transfer agency and distribution services to the Fund. The Board considered comparative information regarding fees charged for these services, including information provided by Lipper and other independent sources. The Board considered the performance of Invesco Advisers and its affiliates in providing these services and the organizational structure employed to provide these services. The Board also considered that these services are provided to the Fund pursuant to written contracts that are reviewed and approved on an annual basis by the Board; that the services are required for the operation of the Fund; that Invesco Advisers and its affiliates can provide services, the nature and quality of which are at least equal to those provided by others offering the same or similar services; and that the fees for such services are fair and reasonable in light of the usual and customary charges by others for services of the same nature and quality.
The Board considered the benefits realized by Invesco Advisers and the Affiliated Sub-Advisers as a result of portfolio brokerage transactions executed through “soft dollar” arrangements. The Board noted that soft dollar arrangements
shift the payment obligation for research services from Invesco Advisers and the Affiliated Sub-Advisers to the Invesco Funds and that the research received may be used with other clients of Invesco Advisers and may reduce Invesco Advisers’ and the Affiliated Sub-Advisers’ expenses. The Board also considered that it receives periodic reports from the Chief Compliance Officer of the Invesco Funds demonstrating that these arrangements are consistent with regulatory requirements. The Board did not deem the soft dollar arrangements to be inappropriate.
The Board considered that the Fund’s uninvested cash and cash collateral from any securities lending arrangements may be invested in money market funds advised by Invesco Advisers pursuant to procedures approved by the Board. The Board noted that Invesco Advisers receives advisory fees from these affiliated money market funds attributable to such investments, although Invesco Advisers has contractually agreed to waive through varying periods the advisory fees payable by the Invesco Funds with respect to investments in the affiliated money market funds. The waiver is in an amount equal to 100% of the net advisory fee Invesco Advisers receives from the affiliated money market funds with respect to the Fund’s investment in the affiliated money market funds of uninvested cash, but not cash collateral. The Board concluded that the amount of advisory fees received by Invesco Advisors from the Fund’s investment of uninvested cash and cash collateral from any securities lending arrangements in the affiliated money market funds are fair and reasonable.
The Board also considered the Fund may use an affiliated broker to execute certain trades for the Fund to among other things, control information leakage, and were advised that such trades would be executed in compliance with rules under the Investment Company Act of 1940, as amended.
24 Invesco Pacific Growth Fund
Tax Information
Form 1099-DIV, Form 1042-S and other year–end tax information provide shareholders with actual calendar year amounts that should be included in their tax returns. Shareholders should consult their tax advisors.
The following distribution information is being provided as required by the Internal Revenue Code or to meet a specific state’s requirement.
The Fund designates the following amounts or, if subsequently determined to be different, the maximum amount allowable for its fiscal year ended October 31, 2014:
| | | | |
Federal and State Income Tax | |
Qualified Dividend Income* | | | 100 | % |
Corporate Dividends Received Deduction* | | | 0 | % |
U.S. Treasury Obligations* | | | 0 | % |
| | * | The above percentages are based on ordinary income dividends paid to shareholders during the Fund’s fiscal year. |
25 Invesco Pacific Growth Fund
Trustees and Officers
The address of each trustee and officer is AIM Investment Funds (Invesco Investment Funds) (the “Trust”), 11 Greenway Plaza, Suite 1000, Houston, Texas 77046-1173. The trustees serve for the life of the Trust, subject to their earlier death, incapacitation, resignation, retirement or removal as more specifically provided in the Trust’s organizational documents. Each officer serves for a one year term or until their successors are elected and qualified. Column two below includes length of time served with predecessor entities, if any.
| | | | | | | | |
Name, Year of Birth and Position(s) Held with the Trust | | Trustee and/
or Officer Since | | Principal Occupation(s) During Past 5 Years | | Number of Funds in Fund Complex Overseen by Trustee | | Other Directorship(s) Held by Trustee During Past 5 Years |
| Interested Persons | | | | | | | | |
| Martin L. Flanagan1 — 1960 Trustee | | 2007 | | Executive Director, Chief Executive Officer and President, Invesco Ltd. (ultimate parent of Invesco and a global investment management firm); Advisor to the Board, Invesco Advisers, Inc. (formerly known as Invesco Institutional (N.A.), Inc.); Trustee, The Invesco Funds; Vice Chair, Investment Company Institute; and Member of Executive Board, SMU Cox School of Business Formerly: Chairman and Chief Executive Officer, Invesco Advisers, Inc. (registered investment adviser); Director, Chairman, Chief Executive Officer and President, IVZ Inc. (holding company), INVESCO Group Services, Inc. (service provider) and Invesco North American Holdings, Inc. (holding company); Director, Chief Executive Officer and President, Invesco Holding Company Limited (parent of Invesco and a global investment management firm); Director, Invesco Ltd.; Chairman, Investment Company Institute and President, Co-Chief Executive Officer, Co-President, Chief Operating Officer and Chief Financial Officer, Franklin Resources, Inc. (global investment management organization). | | 144 | | None |
Philip A. Taylor2 — 1954 Trustee, President and Principal Executive Officer | | 2006 | | Head of North American Retail and Senior Managing Director, Invesco Ltd.; Director, Co-Chairman, Co-President and Co-Chief Executive Officer, Invesco Advisers, Inc. (formerly known as Invesco Institutional (N.A.), Inc.) (registered investment adviser); Director, Chairman, Chief Executive Officer and President, Invesco Management Group, Inc. (formerly known as Invesco Aim Management Group, Inc.) (financial services holding company); Director and President, INVESCO Funds Group, Inc. (registered investment adviser and registered transfer agent); Director and Chairman, Invesco Investment Services, Inc. (formerly known as Invesco Aim Investment Services, Inc.) (registered transfer agent) and IVZ Distributors, Inc. (formerly known as INVESCO Distributors, Inc.) (registered broker dealer); Director, President and Chairman, Invesco Inc. (holding company) and Invesco Canada Holdings Inc. (holding company); Chief Executive Officer, Invesco Corporate Class Inc. (corporate mutual fund company) and Invesco Canada Fund Inc. (corporate mutual fund company); Director, Chairman and Chief Executive Officer, Invesco Canada Ltd. (formerly known as Invesco Trimark Ltd./Invesco Trimark Ltèe) (registered investment adviser and registered transfer agent); Trustee, President and Principal Executive Officer, The Invesco Funds (other than AIM Treasurer’s Series Trust (Invesco Treasurer’s Series Trust) and Short-Term Investments Trust); Trustee and Executive Vice President, The Invesco Funds (AIM Treasurer’s Series Trust (Invesco Treasurer’s Series Trust) and Short-Term Investments Trust only); Director, Invesco Investment Advisers LLC (formerly known as Van Kampen Asset Management); Director, Chief Executive Officer and President, Van Kampen Exchange Corp. Formerly: Director and Chairman, Van Kampen Investor Services Inc.; Director, Chief Executive Officer and President, 1371 Preferred Inc. (holding company) and Van Kampen Investments Inc.; Director and President, AIM GP Canada Inc. (general partner for limited partnerships) and Van Kampen Advisors, Inc.; Director and Chief Executive Officer, Invesco Trimark Dealer Inc. (registered broker dealer); Director, Invesco Distributors, Inc. (formerly known as Invesco Aim Distributors, Inc.) (registered broker dealer); Manager, Invesco PowerShares Capital Management LLC; Director, Chief Executive Officer and President, Invesco Advisers, Inc.; Director, Chairman, Chief Executive Officer and President, Invesco Aim Capital Management, Inc.; President, Invesco Trimark Dealer Inc. and Invesco Trimark Ltd./Invesco Trimark Ltèe; Director and President, AIM Trimark Corporate Class Inc. and AIM Trimark Canada Fund Inc.; Senior Managing Director, Invesco Holding Company Limited; Director and Chairman, Fund Management Company (former registered broker dealer); President and Principal Executive Officer, The Invesco Funds (AIM Treasurer’s Series Trust (Invesco Treasurer’s Series Trust), and Short-Term Investments Trust only); President, AIM Trimark Global Fund Inc. and AIM Trimark Canada Fund Inc. | | 144 | | None |
Wayne W. Whalen3 — 1939 Trustee | | 2010 | | Of Counsel, and prior to 2010, partner in the law firm of Skadden, Arps, Slate, Meagher & Flom LLP, legal counsel to certain funds in the Fund Complex | | 144 | | Director of the Mutual fund Directors Forum, a nonprofit membership organization for investment directors; Chairman and Director of the Abraham Lincoln Presidential Library Foundation; and Director of the Stevenson Center for Democracy |
| 1 | Mr. Flanagan is considered an interested person (within the meaning of Section 2(a)(19) of the 1940 Act) of the Trust because he is an officer of the Adviser to the Trust, and an officer and a director of Invesco Ltd., ultimate parent of the Adviser. |
| 2 | Mr. Taylor is considered an interested person (within the meaning of Section 2(a)(19) of the 1940 Act) of the Trust because he is an officer and a director of the Adviser. |
| 3 | Mr. Whalen is retiring effective December 31, 2014. He has been deemed to be an interested person of the Trust because of his prior service as counsel to the predecessor funds of certain Invesco open-end funds and his affiliation with the law firm that served as counsel to such predecessor funds and the Invesco closed-end funds. |
T-1 Invesco Pacific Growth Fund
Trustees and Officers—(continued)
| | | | | | | | |
Name, Year of Birth and Position(s) Held with the Trust | | Trustee and/
or Officer Since | | Principal Occupation(s) During Past 5 Years | | Number of Funds in Fund Complex Overseen by Trustee | | Other Directorship(s) Held by Trustee During Past 5 Years |
| Independent Trustees | | | | | | | | |
Bruce L. Crockett — 1944 Trustee and Chair | | 2001 | | Chairman, Crockett Technologies Associates (technology consulting company) Formerly: Director, Captaris (unified messaging provider); Director, President and Chief Executive Officer, COMSAT Corporation; Chairman, Board of Governors of INTELSAT (international communications company); ACE Limited (insurance company); and Investment Company Institute | | 144 | | ALPS (Attorneys Liability Protection Society) (insurance company) |
David C. Arch — 1945 Trustee | | 2010 | | Chairman of Blistex Inc., a consumer health care products manufacturer | | 144 | | Board member of the Illinois Manufacturers’ Association; Member of the Board of Visitors, Institute for the Humanities, University of Michigan; Member of the Audit Committee of the Edward-Elmhurst Hospital |
Frank S. Bayley — 1939 Trustee | | 1987 | | Retired. Formerly: Director, Badgley Funds Inc. (registered investment company) (2 portfolios) and General Partner and Of Counsel, law firm of Baker & McKenzie, LLP | | 144 | | Director and Chairman, C.D. Stimson Company (a real estate investment company); Trustee, The Curtis Institute of Music |
James T. Bunch — 1942 Trustee | | 2003 | | Managing Member, Grumman Hill Group LLC (family office private equity investments) Formerly: Founder, Green Manning & Bunch Ltd. (investment banking firm) (1988-2010); Executive Committee, United States Golf Association; and Director, Policy Studies, Inc. and Van Gilder Insurance Corporation | | 144 | | Chairman, Board of Governors, Western Golf Association; Chairman, Evans Scholars Foundation; and Director, Denver Film Society |
Rodney F. Dammeyer — 1940 Trustee | | 2010 | | Chairman of CAC,LLC, (private company offering capital investment and management advisory services) Formerly: Prior to 2001, Managing Partner at Equity Group Corporate Investments; Prior to 1995, Chief Executive Officer of Itel Corporation (formerly Anixter International); Prior to 1985, experience includes Senior Vice President and Chief Financial Officer of Household International, Inc., Executive Vice President and Chief Financial Officer of Northwest Industries, Inc. and Partner of Arthur Andersen & Co.; From 1987 to 2010, Director/Trustee of investment companies in the Van Kampen Funds complex | | 144 | | Director of Quidel Corporation and Stericycle, Inc. |
Albert R. Dowden — 1941 Trustee | | 2001 | | Director of a number of public and private business corporations, including the Boss Group, Ltd. (private investment and management); Nature’s Sunshine Products, Inc. and Reich & Tang Funds (5 portfolios) (registered investment company) Formerly: Director, Homeowners of America Holding Corporation/Homeowners of America Insurance Company (property casualty company); Director, Continental Energy Services, LLC (oil and gas pipeline service); Director, CompuDyne Corporation (provider of product and services to the public security market) and Director, Annuity and Life Re (Holdings), Ltd. (reinsurance company); Director, President and Chief Executive Officer, Volvo Group North America, Inc.; Senior Vice President, AB Volvo; Director of various public and private corporations; Chairman, DHJ Media, Inc.; Director, Magellan Insurance Company; and Director, The Hertz Corporation, Genmar Corporation (boat manufacturer), National Media Corporation; Advisory Board of Rotary Power International (designer, manufacturer, and seller of rotary power engines); and Chairman, Cortland Trust, Inc. (registered investment company) | | 144 | | Director of: Nature’s Sunshine Products, Inc., Reich & Tang Funds, Homeowners of America Holding Corporation/ Homeowners of America Insurance Company, the Boss Group |
Jack M. Fields — 1952 Trustee | | 2001 | | Chief Executive Officer, Twenty First Century Group, Inc. (government affairs company); Owner and Chief Executive Officer, Dos Angeles Ranch, L.P. (cattle, hunting, corporate entertainment); and Discovery Global Education Fund (non-profit) Formerly: Chief Executive Officer, Texana Timber LP (sustainable forestry company); Director of Cross Timbers Quail Research Ranch (non-profit); and member of the U.S. House of Representatives | | 144 | | Insperity, Inc. (formerly known as Administaff) |
Prema Mathai-Davis — 1950 Trustee | | 2001 | | Retired. Formerly: Chief Executive Officer, YWCA of the U.S.A. | | 144 | | None |
Larry Soll — 1942 Trustee | | 2003 | | Retired. Formerly: Chairman, Chief Executive Officer and President, Synergen Corp. (a biotechnology company) | | 144 | | None |
Hugo F. Sonnenschein — 1940 Trustee | | 2010 | | President Emeritus and Honorary Trustee of the University of Chicago and the Adam Smith Distinguished Service Professor in the Department of Economics at the University of Chicago. Prior to 2000, President of the University of Chicago | | 144 | | Trustee of the University of Rochester and a member of its investment committee; Member of the National Academy of Sciences and the American Philosophical Society; Fellow of the American Academy of Arts and Sciences |
T-2 Invesco Pacific Growth Fund
Trustees and Officers—(continued)
| | | | | | | | |
Name, Year of Birth and Position(s) Held with the Trust | | Trustee and/
or Officer Since | | Principal Occupation(s) During Past 5 Years | | Number of Funds in Fund Complex Overseen by Trustee | | Other Directorship(s) Held by Trustee During Past 5 Years |
| Independent Trustees—(continued) |
Raymond Stickel, Jr. — 1944 Trustee | | 2005 | | Retired. Formerly: Director, Mainstay VP Series Funds, Inc. (25 portfolios) and Partner, Deloitte & Touche | | 144 | | None |
Suzanne H. Woolsey — 1941 Trustee | | 2014 | | Chief Executive Officer of Woolsey Partners LLC | | 144 | | Emeritus Chair of the Board of Trustees of the Institute for Defense Analyses; Trustee of Colorado College; Trustee of California Institute of Technology; Prior to 2014, Director of Fluor Corp.; Prior to 2010, Trustee of the German Marshall Fund of the United States; Prior to 2010 Trustee of the Rocky Mountain Institute |
| Other Officers | | | | | | | | |
Russell C. Burk — 1958 Senior Vice President and Senior Officer | | 2005 | | Senior Vice President and Senior Officer, The Invesco Funds | | N/A | | N/A |
John M. Zerr — 1962 Senior Vice President, Chief Legal Officer and Secretary | | 2006 | | Director, Senior Vice President, Secretary and General Counsel, Invesco Management Group, Inc. (formerly known as Invesco Aim Management Group, Inc.) and Van Kampen Exchange Corp.; Senior Vice President, Invesco Advisers, Inc. (formerly known as Invesco Institutional (N.A.), Inc.) (registered investment adviser); Senior Vice President and Secretary, Invesco Distributors, Inc. (formerly known as Invesco Aim Distributors, Inc.); Director, Vice President and Secretary, Invesco Investment Services, Inc. (formerly known as Invesco Aim Investment Services, Inc.) and IVZ Distributors, Inc. (formerly known as INVESCO Distributors, Inc.); Director and Vice President, INVESCO Funds Group, Inc.; Senior Vice President, Chief Legal Officer and Secretary, The Invesco Funds; Manager, Invesco PowerShares Capital Management LLC; Director, Secretary and General Counsel, Invesco Investment Advisers LLC (formerly known as Van Kampen Asset Management); Secretary and General Counsel, Invesco Capital Markets, Inc. (formerly known as Van Kampen Funds Inc.) and Chief Legal Officer, PowerShares Exchange-Traded Fund Trust, PowerShares Exchange-Traded Fund Trust II, PowerShares India Exchange-Traded Fund Trust, PowerShares Actively Managed Exchange-Traded Fund Trust; and PowerShares Actively Managed Exchange-Traded Commodity Fund Trust Formerly: Director and Vice President, Van Kampen Advisors Inc.; Director, Vice President, Secretary and General Counsel, Van Kampen Investor Services Inc.; Director, Invesco Distributors, Inc. (formerly known as Invesco Aim Distributors, Inc.); Director, Senior Vice President, General Counsel and Secretary, Invesco Aim Advisers, Inc. and Van Kampen Investments Inc.; Director, Vice President and Secretary, Fund Management Company; Director, Senior Vice President, Secretary, General Counsel and Vice President, Invesco Aim Capital Management, Inc.; Chief Operating Officer and General Counsel, Liberty Ridge Capital, Inc. (an investment adviser); Vice President and Secretary, PBHG Funds (an investment company) and PBHG Insurance Series Fund (an investment company); Chief Operating Officer, General Counsel and Secretary, Old Mutual Investment Partners (a broker-dealer); General Counsel and Secretary, Old Mutual Fund Services (an administrator) and Old Mutual Shareholder Services (a shareholder servicing center); Executive Vice President, General Counsel and Secretary, Old Mutual Capital, Inc. (an investment adviser); and Vice President and Secretary, Old Mutual Advisors Funds (an investment company) | | N/A | | N/A |
Sheri Morris — 1964 Vice President, Treasurer and Principal Financial Officer | | 1999 | | Vice President, Treasurer and Principal Financial Officer, The Invesco Funds; Vice President, Invesco Advisers, Inc. (formerly known as Invesco Institutional (N.A.), Inc.) (registered investment adviser); and Vice President, PowerShares Exchange-Traded Fund Trust, PowerShares Exchange-Traded Fund Trust II, PowerShares India Exchange-Traded Fund Trust, PowerShares Actively Managed Exchange-Traded Fund Trust, and PowerShares Actively Managed Exchange-Traded Commodity Fund Trust Formerly: Vice President, Invesco Aim Advisers, Inc., Invesco Aim Capital Management, Inc. and Invesco Aim Private Asset Management, Inc.; Assistant Vice President and Assistant Treasurer, The Invesco Funds and Assistant Vice President, Invesco Advisers, Inc., Invesco Aim Capital Management, Inc. and Invesco Aim Private Asset Management, Inc.; and Treasurer, PowerShares Exchange-Traded Fund Trust, PowerShares Exchange-Traded Fund Trust II, PowerShares India Exchange-Traded Fund Trust and PowerShares Actively Managed Exchange-Traded Fund Trust | | N/A | | N/A |
T-3 Invesco Pacific Growth Fund
Trustees and Officers—(continued)
| | | | | | | | |
Name, Year of Birth and Position(s) Held with the Trust | | Trustee and/
or Officer Since | | Principal Occupation(s) During Past 5 Years | | Number of Funds in Fund Complex Overseen by Trustee | | Other Directorship(s) Held by Trustee During Past 5 Years |
| Other Officers—(continued) | | | | | | | | |
Karen Dunn Kelley — 1960 Vice President | | 2004 | | Senior Managing Director, Investments; Director, Co-President, Co-Chief Executive Officer, and Co-Chairman, Invesco Advisers, Inc. (formerly known as Invesco Institutional (N.A.), Inc.) (registered investment adviser); Chairman, Invesco Senior Secured Management, Inc.; Senior Vice President, Invesco Management Group, Inc. (formerly known as Invesco Aim Management Group, Inc.); Executive Vice President, Invesco Distributors, Inc. (formerly known as Invesco Aim Distributors, Inc.); Director, Invesco Mortgage Capital Inc. and Invesco Management Company Limited; Director and President, INVESCO Asset Management (Bermuda) Ltd., Vice President, The Invesco Funds (other than AIM Treasurer’s Series Trust (Invesco Treasurer’s Series Trust) and Short-Term Investments Trust); and President and Principal Executive Officer, The Invesco Funds (AIM Treasurer’s Series Trust (Invesco Treasurer’s Series Trust) and Short-Term Investments Trust only) Formerly: Director, INVESCO Global Asset Management Limited and INVESCO Management S.A.; Senior Vice President, Van Kampen Investments Inc. and Invesco Advisers, Inc. (formerly known as Invesco Institutional (N.A.), Inc.) (registered investment adviser); Vice President, Invesco Advisers, Inc. (formerly known as Invesco Institutional (N.A.), Inc.); Director of Cash Management and Senior Vice President, Invesco Advisers, Inc. and Invesco Aim Capital Management, Inc.; Director and President, Fund Management Company; Chief Cash Management Officer, Director of Cash Management, Senior Vice President, and Managing Director, Invesco Aim Capital Management, Inc.; Director of Cash Management, Senior Vice President, and Vice President, Invesco Advisers, Inc. and The Invesco Funds (AIM Treasurer’s Series Trust (Invesco Treasurer’s Series Trust), and Short-Term Investments Trust only) | | N/A | | N/A |
Crissie M. Wisdom — 1969 Anti-Money Laundering Compliance Officer | | 2013 | | Anti-Money Laundering Compliance Officer, Invesco Advisers, Inc. (formerly known as Invesco Institutional (N.A.), Inc.) (registered investment adviser), Invesco Capital Markets, Inc. (formerly known as Van Kampen Funds Inc.), Invesco Distributors, Inc., Invesco Investment Services, Inc., Invesco Management Group, Inc., Van Kampen Exchange Corp., The Invesco Funds, and PowerShares Exchange-Traded Fund Trust, PowerShares Exchange-Traded Fund Trust II, PowerShares India Exchange-Traded Fund Trust, PowerShares Actively Managed Exchange-Traded Fund Trust and PowerShares Actively Managed Exchange-Traded Commodity Fund Trust; and Fraud Prevention Manager and Controls and Risk Analysis Manager for Invesco Investment Services, Inc. | | N/A | | N/A |
Todd L. Spillane — 1958 Chief Compliance Officer | | 2006 | | Senior Vice President, Invesco Management Group, Inc. (formerly known as Invesco Aim Management Group, Inc.) and Van Kampen Exchange Corp.; Senior Vice President and Chief Compliance Officer, Invesco Advisers, Inc. (registered investment adviser) (formerly known as Invesco Institutional (N.A.), Inc.); Chief Compliance Officer, The Invesco Funds; Vice President, Invesco Distributors, Inc. (formerly known as Invesco Aim Distributors, Inc.) and Invesco Investment Services, Inc. (formerly known as Invesco Aim Investment Services, Inc.) Formerly: Chief Compliance Officer, Invesco Funds (Chicago); Senior Vice President, Van Kampen Investments Inc.; Senior Vice President and Chief Compliance Officer, Invesco Aim Advisers, Inc. and Invesco Aim Capital Management, Inc.; Chief Compliance Officer, INVESCO Private Capital Investments, Inc. (holding company), Invesco Private Capital, Inc. (registered investment adviser), Invesco Global Asset Management (N.A.), Inc., Invesco Senior Secured Management, Inc. (registered investment adviser), Van Kampen Investor Services Inc., PowerShares Exchange-Traded Fund Trust, PowerShares Exchange-Traded Fund Trust II, PowerShares India Exchange-Traded Fund Trust and PowerShares Actively Managed Exchange-Traded Fund Trust; and Vice President, Invesco Aim Capital Management, Inc. and Fund Management Company | | N/A | | N/A |
The Statement of Additional Information of the Trust includes additional information about the Fund’s Trustees and is available upon request, without charge, by calling 1.800.959.4246. Please refer to the Fund’s prospectus for information on the Fund’s sub-advisers.
| | | | | | |
Office of the Fund 11 Greenway Plaza, Suite 1000 Houston, TX 77046-1173 | | Investment Adviser Invesco Advisers, Inc. 1555 Peachtree Street, N.E. Atlanta, GA 30309 | | Distributor Invesco Distributors, Inc. 11 Greenway Plaza, Suite 1000 Houston, TX 77046-1173 | | Auditors PricewaterhouseCoopers LLP 1000 Louisiana Street, Suite 5800 Houston, TX 77002-5678 |
| | | |
| | | | | | |
Counsel to the Fund Stradley Ronon Stevens & Young, LLP 2005 Market Street, Suite 2600 Philadelphia, PA 19103-7018 | | Counsel to the Independent Trustees Goodwin Procter LLP 901 New York Avenue, N.W. Washington, D.C. 20001 | | Transfer Agent Invesco Investment Services, Inc. 11 Greenway Plaza, Suite 1000 Houston, TX 77046-1173 | | Custodian State Street Bank and Trust Company 225 Franklin Street Boston, MA 02110-2801 |
T-4 Invesco Pacific Growth Fund

Invesco mailing information
Send general correspondence to Invesco Investment Services, Inc., P.O. Box 219078, Kansas City, MO 64121-9078.
Important notice regarding delivery of security holder documents
To reduce Fund expenses, only one copy of most shareholder documents may be mailed to shareholders with multiple accounts at the same address (Householding). Mailing of your shareholder documents may be householded indefinitely unless you instruct us otherwise. If you do not want the mailing of these documents to be combined with those for other members of your household, please contact Invesco Investment Services, Inc. at 800 959 4246 or contact your financial institution. We will begin sending you individual copies for each account within 30 days after receiving your request.
Fund holdings and proxy voting information
The Fund provides a complete list of its holdings four times in each fiscal year, at the quarter ends. For the second and fourth quarters, the lists appear in the Fund’s semiannual and annual reports to shareholders. For the first and third quarters, the Fund files the lists with the Securities and Exchange Commission (SEC) on Form N-Q. The most recent list of portfolio holdings is available at invesco.com/completeqtrholdings. Shareholders can also look up the Fund’s Forms N-Q on the SEC website at sec.gov. Copies of the Fund’s Forms N-Q may be reviewed and copied at the SEC Public Reference Room in Washington, D.C. You can obtain information on the operation of the Public Reference Room, including information about duplicating fee charges, by calling 202 551 8090 or 800 732 0330, or by electronic request at the following email address: publicinfo@sec.gov. The SEC file numbers for the Fund are shown below.
A description of the policies and procedures that the Fund uses to determine how to vote proxies relating to portfolio securities is available without charge, upon request, from our Client Services department at 800 959 4246 or at invesco.com/proxyguidelines. The information is also available on the SEC website, sec.gov.
| | |
Information regarding how the Fund voted proxies related to its portfolio securities during the most recent 12-month period ended June 30 is available at invesco.com/proxysearch. The information is also available on the SEC website, sec.gov. Invesco Advisers, Inc. is an investment adviser; it provides investment advisory services to individual and institutional clients and does not sell securities. Invesco Distributors, Inc. is the US distributor for Invesco Ltd.’s retail mutual funds, exchange-traded funds and institutional money market funds. Both are wholly owned, indirect subsidiaries of Invesco Ltd. | |  |
| | | | |
| SEC file numbers: 811-05426 and 033-19338 | | MS-PGRO-AR-1 | | Invesco Distributors, Inc. |
Letters to Shareholders
| | | | |

Philip Taylor | | | | Dear Shareholders: This annual report includes information about your Fund, including performance data and a complete list of its investments as of the close of the reporting period. Inside, your Fund’s portfolio managers discuss how they managed your Fund and the factors that affected its performance during the reporting period. I hope you find this report of interest. During the reporting period covered by this report, the US economy showed signs of continued improvement. After contracting in the first quarter of 2014, the economy expanded strongly in the second quarter and unemployment trended lower. Much of the credit for this improvement goes to the US Federal Reserve (the Fed), which undertook an extraordinary asset purchase program following the global financial crisis. The Fed’s goal was to jumpstart the economy by encouraging banks to lend more, businesses to hire more and consumers to spend more. Signs of a stronger US economy prompted the Fed to reduce, or “taper,” its |
asset purchase program. Despite this, interest rates remained near historical low levels due largely to heavy investor demand for bonds. While signs of economic improvement were evident in the US, European economies showed signs of weakening. That, together with geopolitical uncertainty and worries about the first diagnosed cases of Ebola outside of Africa, caused increased volatility in US and European equities.
Extended periods of market strength can lull investors into complacency – just as prolonged periods of market weakness or volatility can discourage investors from initiating long-term investment plans. That’s why Invesco has always encouraged investors to work with a professional financial adviser who can stress the importance of starting to save and invest early and the importance of adhering to a disciplined investment plan – when times are good and when they’re uncertain. A financial adviser who knows your unique financial situation, investment goals and risk tolerance can be an invaluable partner as you seek to achieve your financial goals. He or she can offer a long-term perspective when markets are volatile and time-tested advice and guidance when your financial situation or investment goals change.
Timely information when and where you want it
Invesco’s efforts to help investors achieve their financial objectives include providing individual investors and financial professionals with timely information about the markets, the economy and investing – whenever and wherever they want it.
Our website, invesco.com/us, offers a wide range of market insights and investment perspectives. On the website, you’ll find detailed information about our funds, including prices, performance, holdings and portfolio manager commentaries. You can access information about your individual Invesco account whenever it’s convenient for you; just complete a simple, secure online registration. Use the “Log In” box on our home page to get started.
Invesco’s mobile app for iPad® (available free from the App StoreSM) allows you to obtain the same detailed information about your Fund and the same investment insights from our investment leaders, market strategists, economists and retirement experts on the go. You also can watch portfolio manager videos and have instant access to Invesco news and updates wherever you may be.
In addition to the resources accessible on our website and through our mobile app, you can obtain timely updates to help you stay informed about the markets, the economy and investing by connecting with Invesco on Twitter, LinkedIn or Facebook. You can access our blog at blog.invesco.us.com. Our goal is to provide you the information you want, when and where you want it.
Have questions?
For questions about your account, feel free to contact an Invesco client services representative at 800 959 4246. For Invesco-related questions or comments, please email me directly at phil@invesco.com.
All of us at Invesco look forward to serving your investment management needs for many years to come. Thank you for investing with us.
Sincerely,

Philip Taylor
Senior Managing Director, Invesco Ltd.
iPad is a trademark of Apple Inc., registered in the US and other countries. App Store is a service mark of Apple Inc. Invesco Distributors, Inc. is not affiliated with Apple Inc.
|
| 2 Invesco Premium Income Fund |
| | | | |

Bruce Crockett | | | | Dear Fellow Shareholders: There are a variety of factors that can impact investment performance, many of which are uncontrollable by us as investors. These factors can include various economic trends and geopolitical developments. While the members of the Invesco Funds Board, which I chair, can’t dictate the performance of the Invesco funds, be assured that your Board works diligently throughout the year to focus on how your investments are managed. Our job is to represent you and your interests on a variety of fund management-related matters. We regularly monitor how the portfolio management teams of the Invesco funds are performing in light of ever-changing and often unpredictable economic and market conditions. We review the investment strategies and investment process employed by each fund’s management team as explained in the fund’s prospectus. Perhaps our most significant responsibility is conducting the annual review of the funds’ |
advisory and sub-advisory contracts with Invesco Advisers and its affiliates. This annual review, which is required by the Investment Company Act of 1940, focuses on the nature and quality of the services Invesco provides as the adviser to the Invesco funds and the reasonableness of the fees that it charges for those services. Each year, we spend months carefully reviewing information from Invesco that allows us to evaluate the quality of its services and the reasonableness of its fees. We also use information from a variety of independent sources, including materials provided by the independent senior officer of the Invesco funds, who reports directly to the independent trustees on the Board. Additionally, we meet with legal counsel and review performance and fee data prepared for us by Lipper Inc., an independent, third-party firm widely recognized as a leader in its field.
After a careful review, the members of the Invesco Funds Board approved the continuation of advisory and sub-advisory contracts with Invesco Advisers and its affiliates. Be assured that your Board will continue working on behalf of fund shareholders, keeping your needs and interests uppermost in our minds.
As always, please contact me at bruce@brucecrockett.com with any questions or concerns you may have. On behalf of the Board, we look forward to continuing to represent your interests and serving your needs.
Sincerely,

Bruce L. Crockett
Independent Chair
Invesco Funds Board of Trustees
|
| 3 Invesco Premium Income Fund |
Management’s Discussion of Fund Performance
Performance summary
For the fiscal year ended October 31, 2014, Invesco Premium Income Fund underperformed its style-specific benchmark, the Custom Premium Income Index. Strong performance in all four of the strategic asset classes in which the Fund invests – high yield bonds, emerging market debt, preferred equities and Treasury STRIPS – contributed to results over the reporting period. The top-performing asset class, Treasury STRIPS, benefited as investors sought safety from geopolitical uncertainty. Tactical allocations also helped Fund performance.
Your Fund’s long-term performance appears later in this report.
Fund vs. Indexes
Total returns, 10/31/13 to 10/31/14, at net asset value (NAV). Performance shown does not include applicable contingent deferred sales charges (CDSC) or front-end sales charges, which would have reduced performance.
| | | | | |
| Class A Shares | | | | 8.66 | % |
| Class C Shares | | | | 7.85 | |
| Class R Shares | | | | 8.39 | |
| Class Y Shares | | | | 8.82 | |
| Class R5 Shares | | | | 8.82 | |
| Class R6 Shares | | | | 8.93 | |
| Barclays U.S. Aggregate Index‚ (Broad Market Index) | | | | 4.14 | |
| Custom Premium Income Indexn (Style-Specific Index) | | | | 10.84 | |
Lipper Mixed-Asset Target Allocation Conservative Funds Index¿ (Peer Group Index) | | | | 5.74 | |
Source(s): ‚FactSet Research Systems Inc.; nInvesco, FactSet Research Systems Inc.; ¿Lipper Inc.
Market conditions and your Fund
Among the Fund’s fixed-income investments, US Treasury obligations issued by the US government under the Separate Trading of Registered Interest and Principal Securities (STRIPS) program, contributed the most to Fund performance for the reporting period. Emerging market debt, preferred stocks and high yield securities also added to performance despite several spikes of market volatility. Tactical positioning was a contributor to overall Fund performance and was consistent with an intentionally small allocation versus the strategic allocation.
At the start of the fiscal year, the Fund’s emerging market debt and high yield securities provided gains, while preferred stocks and Treasuries produced losses. Yields on 30-year Treasuries
closed calendar year 2013 higher as the US Federal Reserve (the Fed) signaled its intention to reduce, or “taper,” its asset purchases going forward. Investors were relieved by the Fed’s decision to delay tapering, and high yield bonds fared quite well in the face of rising interest rates at the end of 2013. The high yield market viewed tapering as only a reduction in stimulus, not outright monetary tightening. Emerging market bonds rose on indications that macroeconomic stability in China was improving. Preferred stocks suffered in December due to increases in interest rates and aggressive year-end tax-loss selling.
Yields on 30-year Treasuries fell in early 2014, providing gains as demand for perceived “safe-haven” assets increased due to pressure on equities resulting from geopolitical concerns
spawned by Russian actions in Ukraine and Crimea.1 Preferred stock securities were the primary contributor to Fund performance over the first six months of 2014 as government bond yields decreased and global economic concerns remained in check. High yield securities benefited from favorable credit conditions, low default rates and a reduction in new issuance. Emerging market debt also provided gains for the Fund despite head-winds from political developments in Russia, Turkey and Venezuela. The Fund’s tactical government bond exposure, achieved through the use of exchange-traded futures, was beneficial for Fund performance given our overweight exposure throughout the first half of 2014. Tactical equity exposure detracted from Fund returns in January and March as overweight positions, also achieved through the use of futures, were untimely due to market declines. However, our overweight position in the second quarter of 2014 was rewarded by favorable economic developments and monetary policy.
Fund performance was mixed in the third quarter of 2014, as US preferred stock securities posted positive returns while the emerging market and high yield bond sectors were weak. High yield bond securities were hurt by large new issuance, geopolitical risks and market concerns that the Fed would raise interest rates sooner rather than later. Emerging market bond securities declined broadly as investors grappled with expectations for a less accommodative Fed and as the strengthening US dollar weighed on commodity exporting nations. Venezuela’s credit rating downgrade was another factor that caused weakness for emerging market debt. Treasuries were the Fund’s primary contributor in the quarter. Factors driving Treasuries, implemented through individual Treasury STRIP securities, included ongoing geopolitical
| | | | | |
| Portfolio Composition | | |
| By security type | |
| |
U.S. Dollar Denominated Bonds and Notes | | | | 54.0 | % |
| Preferred Stocks | | | | 28.0 | |
| U.S. Treasury Securities | | | | 7.3 | |
Non-U.S. Dollar Denominated
Bonds and Notes | | | | 2.0 | |
Money Market Funds Plus Other Assets Less Liabilities | | | | 8.7 | |
| | | | | |
| Top Five Fixed Income Issuers* |
| | | | | |
| |
| 1. U.S. Treasury Securities | | | | 7.3 | % |
| 2. Transnet SOC Ltd. | | | | 0.8 | |
| 3. Petroleos Mexicanos | | | | 0.7 | |
| 4. Rio Oil Finance Trust | | | | 0.7 | |
5. Dominican Republic International Bond | | | | 0.6 | |
| | | | | |
Total Net Assets | | | $ | 114.9 million | |
| | | | | |
| |
Total Number of Holdings* | | | | 546 | |
| | | | | |
The Fund’s holdings are subject to change, and there is no assurance that the Fund will continue to hold any particular security. *Excluding money market fund holdings. |
|
| 4 Invesco Premium Income Fund |
concerns resulting from the conflict between Russia and Ukraine as well as rising conflict in the Middle East. Further bolstering the appeal of bonds was weaker-than-expected economic data in Europe, China and Japan. Preferred stocks also contributed to absolute Fund performance as they fell less than emerging market securities and high yield bond securities in September. Our tactical allocations, implemented with exchange-traded futures, also helped Fund performance in the quarter. Tactical global government bond exposure was favorable given the Fund’s overweight bias throughout the third quarter. However, tactical global equity exposure detracted from Fund performance due to an average overweight position.
The fiscal year ended with positive performance in all four asset classes in which the Fund invests. Volatility from central bank actions and fear of the Ebola outbreak caused investors to seek refuge in perceived “safe haven” assets such as STRIPS. High yield bonds, preferred stocks and emerging market debt, all implemented through individual securities, also posted gains at the end of the reporting period.
Please note that our strategy utilizes derivative instruments that include futures and total return swaps. Therefore, some of the performance of the strategy, both positive and negative, can be attributed to these instruments. Derivatives can be a cost-effective way to gain exposure to asset classes. However, derivatives may amplify traditional investment risks through the creation of leverage and may be less liquid than traditional securities.
Thank you for your continued commitment to Invesco Premium Income Fund.
| 1 | So-called “safe-haven” assets do not imply risk-free investing. |
The views and opinions expressed in management’s discussion of Fund performance are those of Invesco Advisers, Inc. These views and opinions are subject to change at any time based on factors such as market and economic conditions. These views and opinions may not be relied upon as investment advice or recommendations, or as an offer for a particular security. The information is not a complete analysis of every aspect of any market, country, industry, security or the Fund. Statements of fact are from sources considered reliable, but Invesco Advisers, Inc. makes no representation or warranty as to their completeness or accuracy. Although historical performance is no guarantee of future results, these insights may help you understand our investment management philosophy.
See important Fund and, if applicable, index disclosures later in this report.
| | |
 | | Mark Ahnrud Chartered Financial Analyst, Portfolio Manager, is manager of Invesco Premium Income Fund. He |
| joined Invesco in 2000. Mr. Ahnrud earned a BS in finance and investments from Babson College and an MBA from Duke University Fuqua School of Business. |
| |
 | | Jack Deino Chartered Financial Analyst, Portfolio Manager, is manager of Invesco Premium Income Fund. He |
| joined Invesco in 2006. Mr. Deino earned a BA in Latin American studies from The University of Texas at Austin. |
| |
 | | Chris Devine Chartered Financial Analyst, Portfolio Manager, is manager of Invesco Premium Income Fund. He |
| joined Invesco in 1998. Mr. Devine earned a BA in economics from Wake Forest University and an MBA from the University of Georgia. |
| |
 | | Scott Hixon Chartered Financial Analyst, Portfolio Manager, is manager of Invesco Premium Income Fund. He |
| joined Invesco in 1994. Mr. Hixon earned a BBA in finance from Georgia Southern University and an MBA in finance from Georgia State University. |
| |
 | | Peter Hubbard Portfolio Manager, is manager of Invesco Premium Income Fund. He joined Invesco in 2005. |
| Mr. Hubbard earned a BA in business and economics from Wheaton College. |
| |
 | | Darren Hughes Chartered Financial Analyst, Portfolio Manager, is manager of Invesco Premium Income Fund. He |
| joined Invesco in 1992. Mr. Hughes earned a BBA in finance and economics from Baylor University. |
| | |
 | | Jeff Kernagis Chartered Financial Analyst, Portfolio Manager, is manager of Invesco Premium Income Fund. He |
| joined Invesco in 2007. Mr. Kernagis earned a BBA from the University of Notre Dame and an MBA from DePaul University. |
| |
 | | Richard Ose Portfolio Manager, is manager of Invesco Premium Income Fund. He joined Invesco and/or its |
| affiliates in 2011. Mr. Ose earned a BS with concentrations in finance and economics from Carroll University and an MBA with a concentration in finance from DePaul University. |
| |
 | | Joseph Portera Portfolio Manager, is manager of Invesco Premium Income Fund. He joined Invesco in 2012. |
| Mr. Portera earned BA and MA degrees in Soviet studies and an MA in international political economy and development from Fordham University. |
| |
 | | Scott Roberts Chartered Financial Analyst, Portfolio Manager, is manager of Invesco Premium Income Fund. He |
| joined Invesco in 2000. Mr. Roberts earned a BBA in finance from the University of Houston. |
| |
 | | Christian Ulrich Chartered Financial Analyst, Portfolio Manager, is manager of Invesco Premium Income Fund. He |
| joined Invesco in 2000. Mr. Ulrich earned the equivalent of a BBA from the KV Zurich Business School in Zurich, Switzerland. |
| |
 | | Scott Wolle Chartered Financial Analyst, Portfolio Manager, is manager of Invesco Premium Income Fund. He |
| joined Invesco in 1999. Mr. Wolle earned a BS in finance from Virginia Polytechnic Institute and State University and an MBA from Duke University Fuqua School of Business. |
|
| 5 Invesco Premium Income Fund |
Your Fund’s Long-Term Performance
Results of a $10,000 Investment – Oldest Share Class(es) since Inception
Fund data from 12/14/11; index data from 11/30/11
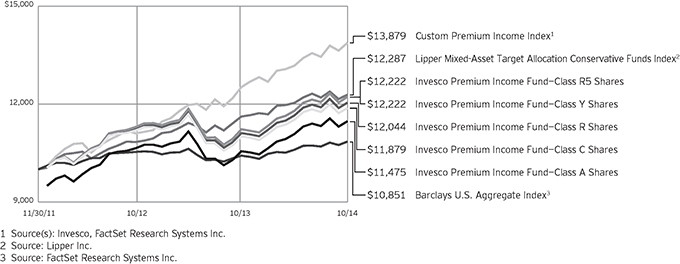
Past performance cannot guarantee comparable future results.
The data shown in the chart include reinvested distributions, applicable sales charges and Fund expenses including
management fees. Index results include reinvested dividends, but they do not reflect sales charges. Performance of the peer group, if applicable, reflects fund expenses and management fees;
performance of a market index does not. Performance shown in the chart and table(s) does not reflect deduction of taxes a shareholder would pay on Fund distributions or sale of Fund shares.
continued from page 9
| n | | The Custom Premium Income Index, created by Invesco to serve as a benchmark for Invesco Premium Income Fund, comprises the following indexes: S&P 500 (50%) and Barclays U.S. Universal (50%). |
| n | | The Lipper Mixed-Asset Target Allocation Conservative Funds Index is an unmanaged index considered representative of mixed-asset target allocation conservative funds tracked by Lipper. |
| n | | The S&P 500® Index is an unmanaged index considered representative of the US stock market. |
| n | | The Barclays U.S. Universal Index is an unmanaged index comprising US dollar-denominated, taxable bonds that are rated investment grade or below investment grade. |
| n | | The Fund is not managed to track the performance of any particular index, including the index(es) described here, and consequently, the performance of the Fund may deviate significantly from the performance of the
index(es). |
| n | | A direct investment cannot be made in an index. Unless otherwise indicated, index results include reinvested dividends, and they do not reflect sales charges. Performance of the peer group, if applicable, reflects fund expenses; performance of a market index does not. |
Other information
| n | | The returns shown in management’s discussion of Fund performance are based on net asset values (NAVs) calculated for shareholder transactions. Generally accepted accounting principles require adjustments to be made to the net assets of the Fund at period end for financial reporting purposes, and as such, the NAVs for shareholder transactions and the returns based on those NAVs may differ from the NAVs and returns reported in the Financial Highlights. |
|
| 6 Invesco Premium Income Fund |
| | | | |
Average Annual Total Returns | |
As of 10/31/14, including maximum applicable sales charges | |
| |
| Class A Shares | | | | |
| Inception (12/14/11) | | | 4.89 | % |
| 1 Year | | | 2.72 | |
| |
| Class C Shares | | | | |
| Inception (12/14/11) | | | 6.16 | % |
| 1 Year | | | 6.85 | |
| |
| Class R Shares | | | | |
| Inception (12/14/11) | | | 6.66 | % |
| 1 Year | | | 8.39 | |
| |
| Class Y Shares | | | | |
| Inception (12/14/11) | | | 7.21 | % |
| 1 Year | | | 8.82 | |
| |
| Class R5 Shares | | | | |
| Inception (12/14/11) | | | 7.21 | % |
| 1 Year | | | 8.82 | |
| |
| Class R6 Shares | | | | |
| Inception | | | 7.15 | % |
| 1 Year | | | 8.93 | |
Class R6 shares incepted on September 24, 2012. Performance shown prior to that date is that of Class A shares and includes the 12b-1 fees applicable to Class A shares. Class A share performance reflects any applicable fee waivers or expense reimbursements.
The performance data quoted represent past performance and cannot guarantee comparable future results; current performance may be lower or higher. Please visit invesco.com/performance for the most recent month-end performance. Performance figures reflect reinvested distributions, changes in net asset value and the effect of the maximum sales charge unless otherwise stated. Investment return and principal value will fluctuate so that you may have a gain or loss when you sell shares.
The net annual Fund operating expense ratio set forth in the most recent Fund prospectus as of the date of this report for Class A, Class C, Class R, Class Y, Class R5 and Class R6 shares was 0.89%, 1.64%, 1.14%, 0.64%, 0.64% and 0.64%, respectively.1,2 The total annual Fund operating expense ratio set forth in the most recent Fund prospectus as of the date of this report for Class A, Class C, Class R, Class Y, Class R5 and Class R6 shares was 1.23%, 1.98%, 1.48%, 0.98%, 0.91% and 0.86%, respectively.
| | | | |
Average Annual Total Returns | |
| As of 9/30/14, the most recent calendar quarter end, including maximum applicable sales charges | |
| |
| Class A Shares | | | | |
| Inception (12/14/11) | | | 4.52 | % |
| 1 Year | | | 3.92 | |
| |
| Class C Shares | | | | |
| Inception (12/14/11) | | | 5.85 | % |
| 1 Year | | | 8.13 | |
| |
| Class R Shares | | | | |
| Inception (12/14/11) | | | 6.35 | % |
| 1 Year | | | 9.68 | |
| |
| Class Y Shares | | | | |
| Inception (12/14/11) | | | 6.90 | % |
| 1 Year | | | 10.22 | |
| |
| Class R5 Shares | | | | |
| Inception (12/14/11) | | | 6.90 | % |
| 1 Year | | | 10.22 | |
| |
| Class R6 Shares | | | | |
| Inception | | | 6.84 | % |
| 1 Year | | | 10.22 | |
The expense ratios presented above may vary from the expense ratios presented in other sections of this report that are based on expenses incurred during the period covered by this report.
Class A share performance reflects the maximum 5.50% sales charge, and Class C share performance reflects the applicable contingent deferred sales charge (CDSC) for the period involved. The CDSC on Class C shares is 1% for the first year after purchase. Class R, Class Y, Class R5 and Class R6 shares do not have a front-end sales charge or a CDSC; therefore, performance is at net asset value.
The performance of the Fund’s share classes will differ primarily due to different sales charge structures and class expenses.
Had the adviser not waived fees and/ or reimbursed expenses on Class A, Class C, Class R and Class Y shares, performance would have been lower.
| 1 | Total annual Fund operating expenses after any contractual fee waivers and/or expense reimbursements by the adviser in effect through at least June 30, 2016. See current prospectus for more information. |
| 2 | Total annual Fund operating expenses after any contractual fee waivers and/or expense reimbursements by the adviser in effect through at least February 29, 2016. See current prospectus for more information. |
|
| 7 Invesco Premium Income Fund |
Invesco Premium Income Fund’s investment objective is to provide current income.
| n | | Unless otherwise stated, information presented in this report is as of October 31, 2014, and is based on total net assets. |
| n | | Unless otherwise noted, all data provided by Invesco. |
| n | | To access your Fund’s reports/prospectus, visit invesco.com/fundreports. |
About share classes
| n | | Class R shares are generally available only to employer sponsored retirement and benefit plans. Please see the prospectus for more information. |
| n | | Class Y shares are available only to certain investors. Please see the prospectus for more information. |
| n | | Class R5 shares and Class R6 shares are primarily intended for employer sponsored retirement and benefit plans that meet certain standards and for institutional investors. Please see the prospectus for more information. |
Principal risks of investing in the Fund
| n | | Call risk. If interest rates fall, it is possible that issuers of debt securities with high interest rates will prepay or call their securities before their maturity dates. In this event, the proceeds from the called securities would likely be reinvested by the Fund in securities bearing the new, lower interest rates, resulting in a possible decline in the Fund’s income and distributions to shareholders. |
| n | | Credit linked notes risk. Risks of credit linked notes include those risks associated with the underlying reference obligation including but not limited to market risk, interest rate risk, credit risk, default risk and foreign currency risk. In the case of a credit linked note created with credit default swaps, the structure will be “funded” such that the par amount of the security will represent the maximum loss that could be incurred on the investment and no leverage is introduced. An investor in a credit linked note bears counterparty risk or the risk that the issuer of the credit linked note will default or become bankrupt and not make timely payment of principal and interest of the structured security. |
| n | | Credit risk. The issuer of instruments in which the Fund invests may be unable to meet interest and/or principal payments, thereby causing its instruments to decrease in value and lowering the issuer’s credit rating. |
| n | | Currency/exchange rate risk. The dollar value of the Fund’s foreign investments will be affected by changes in the exchange rates between the dollar and the currencies in which those investments are traded. |
| n | | Derivatives risk. The value of a derivative instrument depends largely on (and is derived from) the value of an underlying security, currency, commodity, interest rate, index or other asset (each referred to as an underlying asset). In addition to risks relating to the underlying assets, the use of derivatives may include other, possibly greater, risks, including counterparty, leverage and liquidity risks. Counterparty risk is the risk that the counterparty to the derivative contract will default on its obligation to pay the Fund the amount owed or otherwise perform under the derivative contract. Derivatives create leverage risk because they do not require payment up front equal to the economic exposure created by owning the derivative. As a result, an adverse change in the value of the underlying asset could result in the Fund sustaining a loss that is substantially greater than the amount invested in the derivative, which may make the Fund’s returns more volatile and increase the risk of loss. Derivative instruments may also be less liquid than more traditional investments and the Fund may be unable to sell or close out its derivative positions at a desirable time or price. This risk may be more acute under adverse market conditions, during which the Fund may be most in need of liquidating its derivative positions. Derivatives may also be harder to value, less tax efficient and subject to changing government regulation that could impact the Fund’s ability to use certain derivatives or their cost. Also, derivatives used for hedging or to gain or limit exposure to a particular market segment may not provide the expected benefits, particularly during adverse market conditions. |
| n | | Developing/emerging markets securities risk. The prices of securities issued by foreign companies and governments located in developing/emerging market countries may be affected more negatively by inflation, devaluation of their currencies, higher transaction costs, delays in settlement, adverse political developments, the introduction of capital controls, withholding taxes, nationalization of private assets, expropriation, social unrest, war or lack of timely information than those in developed countries. |
| n | | Exchange-traded funds risk. An investment by the Fund in exchange-traded funds generally presents the same primary risks as an investment in a mutual fund. In addition, an exchange-traded fund may be subject to the following: (1) a discount of the exchange-traded fund’s shares to its net asset value; (2) failure to develop an active trading market for the exchange-traded fund’s shares; (3) the listing exchange halting trading of the exchange-traded fund’s shares; (4) failure of the exchange-traded fund’s shares to track the referenced asset; and (5) holding troubled securities in the referenced index or basket of investments. Investments in exchange-traded funds may involve duplication of management fees and certain other expenses, as the Fund indirectly bears its proportionate share of any expenses paid by the exchange-traded funds in which it invests. Further, certain of the exchange-traded funds in which the Fund may invest are leveraged. The more the Fund invests in such leveraged exchange-traded funds, the more this leverage will magnify any losses on those investments. |
| n | | Financial institutions risk. Investments in financial institutions may be subject to certain risks, including, but not limited to, the risk of regulatory actions, changes in interest rates and concentration of loan portfolios in an industry or sector. Financial institutions are highly regulated and may suffer set-backs should regulatory rules and interpretations under which they operate change. Likewise, there is a high level of competition among financial institutions which could adversely affect the viability of an institution. |
continued on page 9
|
This report must be accompanied or preceded by a currently effective Fund prospectus, which contains more complete information, including sales charges and expenses. Investors should read it carefully before investing. |
|
|
| NOT FDIC INSURED | MAY LOSE VALUE | NO BANK GUARANTEE |
|
| 8 Invesco Premium Income Fund |
| n | | Floating rate risk. The Fund may invest in senior secured floating rate loans and debt securities that require collateral. There is a risk that the value of the collateral may not be sufficient to cover the amount owed, collateral securing a loan may be found invalid, and collateral may be used to pay other outstanding obligations of the borrower under applicable law or may be difficult to sell. There is also the risk that the collateral may be difficult to liquidate, or that a majority of the collateral may be illiquid. |
| n | | Foreign currency tax risk. If the US Treasury Department were to exercise its authority to issue regulations that exclude from the definition of “qualifying income” foreign currency gains not directly related to the Fund’s business of investing in securities, the Fund may be unable to qualify as a regulated investment company for one or more years. In this event, the Fund’s Board of Trustees may authorize a significant change in investment strategy or Fund liquidation. |
| n | | Foreign securities risk. The Fund’s foreign investments may be affected by changes in a foreign country’s exchange rates, political and social instability, changes in economic or taxation policies, difficulties when enforcing obligations, decreased liquidity, and increased volatility. Foreign companies may be subject to less regulation resulting in less publicly available information about the companies. |
| n | | High yield bond (junk bond) risk. Junk bonds involve a greater risk of default or price changes due to changes in the credit quality of the issuer. The values of junk bonds fluctuate more than those of high- quality bonds in response to company, political, regulatory or economic developments. Values of junk bonds can decline significantly over short periods of time. |
| n | | Interest rate risk. Interest rate risk refers to the risk that bond prices generally fall as interest rates rise; conversely, bond prices generally rise as interest rates fall. Specific bonds differ in their sensitivity to changes in interest rates depending on their individual characteristics, including duration. |
| n | | Liquidity risk. The Fund may hold illiquid securities that it is unable to sell at the preferred time or price and could lose its entire investment in such securities. |
| n | | Management risk. The investment techniques and risk analysis used by the Fund’s and the underlying funds’ portfolio managers may not produce the desired results. |
| n | | Market risk. The prices of and the income generated by the Fund’s securities may decline in response to, among other things, investor sentiment, general economic and market conditions, regional or global instability, and currency and interest rate fluctuations. |
| n | | Mortgage- and asset-backed securities risk. The Fund may invest in mortgage- and asset-backed securities that are subject to prepayment or call risk, which is the risk that the borrower’s payments may be received earlier or later than expected due to changes in prepayment rates on underlying loans. Faster prepayments often happen when interest rates are falling. As a result, the Fund may reinvest these early payments at lower interest rates, thereby reducing the Fund’s income. Conversely, when interest rates rise, prepayments may happen more slowly, causing the security to lengthen in duration. Longer duration securities tend to be more volatile. Securities may be prepaid at a price less than the original purchase value. An unexpectedly high rate of defaults on the mortgages held by a mortgage pool may adversely affect the value of mortgage-backed securities and could result in losses to the Fund. The risk of such defaults is generally higher in the case of mortgage pools that include subprime mortgages. Subprime mortgages refer to loans made to borrowers with weakened credit histories or with lower capacity to make timely payments on their mortgages. |
| n | | Non-correlation risk. The return of the Fund’s preferred equity segment may not match the return of the Index for a number of reasons. For example, the Fund incurs operating expenses not applicable to the Index, and incurs costs in buying and selling securities, especially when rebalancing securities holdings to reflect changes in the Index. In addition, the performance of the preferred equity segment and the Index may vary due to asset valuation differences and differences between the preferred equity segment and the Index resulting from legal restrictions, cost or liquidity constraints. |
| n | | Preferred securities risk. Preferred securities may include provisions that permit the issuer, in its discretion, to defer or omit distributions for a certain period of time. If the Fund owns a security that is deferring or omitting its distributions, the Fund may be required to report the distribution on its tax returns, even though it may not have received this income. Further, preferred |
| | securities may lose substantial value due to the omission or deferment of dividend payments. |
| n | | Reinvestment risk. Reinvestment risk is the risk that a bond’s cash flows (coupon income and principal repayment) will be reinvested at an interest rate below that on the original bond. |
| n | | REIT risk/real estate risk. Investments in real estate related instruments may be affected by economic, legal, cultural, environmental or technological factors that affect property values, rents or occupancies of real estate related to the Fund’s holdings. Real estate companies, including REITs or similar structures, tend to be small- and mid-cap companies, and their shares may be more volatile and less liquid. The value of investments in real estate related companies may be affected by the quality of management, the ability to repay loans, the utilization of leverage and financial covenants related thereto, whether the company carries adequate insurance and environmental factors. If a real estate related company defaults, the Fund may own real estate directly, which involves the following additional risks: environmental liabilities; difficulty in valuing and selling the real estate; and economic or regulatory changes. |
| n | | Sovereign debt risk. Investments in foreign sovereign debt obligations involve certain risks in addition to those relating to foreign securities or debt securities generally. The issuer of the debt or the governmental authorities that control the repayment of the debt may be unable or unwilling to repay principal or interest when due in accordance with the terms of such debt, and the Fund may have limited recourse in the event of a default against the defaulting government. Without the approval of debt holders, some governmental debtors have in the past been able to reschedule or restructure their debt payments or declare moratoria on payments. |
| n | | US government obligations risk. The Fund may invest in obligations issued by US government agencies and instrumentalities that may receive varying levels of support from the government, which could affect the Fund’s ability to recover should they default. |
About indexes used in this report
| n | | The Barclays U.S. Aggregate Index is an unmanaged index considered representative of the US investment-grade, fixed-rate bond market. |
continued on page 6
|
| 9 Invesco Premium Income Fund |
Schedule of Investments(a)
October 31, 2014
| | | | | | | | |
| | | Principal
Amount | | | Value | |
U.S. Dollar Denominated Bonds and Notes–54.00% | |
| Aerospace & Defense–0.76% | |
B/E Aerospace Inc., Sr. Unsec. Notes, 5.25%, 04/01/22 | | $ | 23,000 | | | $ | 25,731 | |
Bombardier Inc. (Canada), Sr. Unsec. Notes, 7.75%, 03/15/20(b) | | | 171,000 | | | | 190,451 | |
DigitalGlobe Inc., Sr. Unsec. Gtd. Bonds, 5.25%, 02/01/21(b) | | | 85,000 | | | | 83,088 | |
GenCorp Inc., Sec. Gtd. Global Notes, 7.13%, 03/15/21 | | | 165,000 | | | | 176,344 | |
TransDigm Inc., Sr. Unsec. Gtd. Sub. Global Notes,
5.50%, 10/15/20 | | | 117,000 | | | | 117,146 | |
6.00%, 07/15/22 | | | 135,000 | | | | 138,037 | |
6.50%, 07/15/24 | | | 117,000 | | | | 120,071 | |
7.50%, 07/15/21 | | | 26,000 | | | | 28,178 | |
| | | | | | | | 879,046 | |
|
| Agricultural & Farm Machinery–0.09% | |
Titan International Inc., Sr. Sec. Gtd. Global Notes, 6.88%, 10/01/20 | | | 114,000 | | | | 103,740 | |
|
| Agricultural Products–0.08% | |
Darling Ingredients, Inc., Sr. Unsec. Gtd. Global Notes, 5.38%, 01/15/22 | | | 86,000 | | | | 86,860 | |
|
| Airlines–0.24% | |
American Airlines Pass Through Trust,
Series 2011-1, Class B, Sec. Pass Through Ctfs., 7.00%, 01/31/18(b) | | | 33,418 | | | | 35,506 | |
Series 2014-1, Class B, Sec. Pass Through Ctfs., 4.38%, 10/01/22 | | | 105,000 | | | | 106,181 | |
United Continental Holdings Inc., Sr. Unsec. Gtd. Notes, 6.00%, 12/01/20 | | | 125,000 | | | | 129,375 | |
US Airways Pass Through Trust, Series 2012-1, Class B, Sec. Pass Through Ctfs., 8.00%, 10/01/19 | | | 7,164 | | | | 8,077 | |
| | | | | | | | 279,139 | |
|
| Alternative Carriers–0.50% | |
Level 3 Escrow II Inc., Sr. Unsec. Gtd. Notes, 5.38%, 08/15/22(b) | | | 160,000 | | | | 163,200 | |
Level 3 Financing Inc., Sr. Unsec. Gtd. Notes, 6.13%, 01/15/21(b) | | | 390,000 | | | | 412,425 | |
| | | | | | | | 575,625 | |
|
| Apparel Retail–0.72% | |
Hot Topic, Inc., Sr. Sec. Gtd. Notes, 9.25%, 06/15/21(b) | | | 253,000 | | | | 275,770 | |
L Brands, Inc.,
Sr. Unsec. Gtd. Global Notes, 5.63%, 02/15/22 | | | 109,000 | | | | 117,584 | |
Sr. Unsec. Gtd. Notes, 6.63%, 04/01/21 | | | 52,000 | | | | 59,085 | |
| | | | | | | | |
| | | Principal
Amount | | | Value | |
| Apparel Retail–(continued) | |
Men’s Wearhouse Inc. (The), Sr. Unsec. Gtd. Notes, 7.00%, 07/01/22(b) | | $ | 318,000 | | | $ | 329,925 | |
Neiman Marcus Group Ltd. LLC, Sr. Unsec. Gtd. Notes, 8.00%, 10/15/21(b) | | | 44,000 | | | | 47,025 | |
| | | | | | | | 829,389 | |
|
| Apparel, Accessories & Luxury Goods–0.17% | |
Levi Strauss & Co., Sr. Unsec. Global Notes, 6.88%, 05/01/22 | | | 122,000 | | | | 133,895 | |
William Carter Co. (The), Sr. Unsec. Gtd. Global Notes, 5.25%, 08/15/21 | | | 59,000 | | | | 61,655 | |
| | | | | | | | 195,550 | |
|
| Application Software–0.10% | |
Nuance Communications Inc., Sr. Unsec. Gtd. Notes, 5.38%, 08/15/20(b) | | | 110,000 | | | | 111,100 | |
|
| Asset Management & Custody Banks–0.05% | |
Signode Industrial Group Lux S.A./Signode Industrial Group U.S. Inc., Sr. Unsec. Notes, 6.38%, 05/01/22(b) | | | 64,000 | | | | 62,600 | |
|
| Auto Parts & Equipment–0.36% | |
CTP Transportation Products LLC/CTP Finance Inc., Sr. Sec. Notes, 8.25%, 12/15/19(b) | | | 84,000 | | | | 91,350 | |
Dana Holding Corp., Sr. Unsec. Notes, 5.38%, 09/15/21 | | | 142,000 | | | | 148,745 | |
Stackpole International Intermediate Co. S.A./Stackpole International Powder Metal (Canada), Sr. Sec. Gtd. Notes, 7.75%, 10/15/21(b) | | | 170,000 | | | | 173,400 | |
| | | | | | | | 413,495 | |
|
| Automotive Retail–0.12% | |
CST Brands, Inc., Sr. Unsec. Gtd. Global Notes, 5.00%, 05/01/23 | | | 112,000 | | | | 111,720 | |
Group 1 Automotive, Inc., Sr. Unsec. Gtd. Notes, 5.00%, 06/01/22(b) | | | 30,000 | | | | 29,925 | |
| | | | | | | | 141,645 | |
|
| Broadcasting–0.48% | |
Clear Channel Worldwide Holdings Inc., Series B, Sr. Unsec. Gtd. Global Notes, 6.50%, 11/15/22 | | | 98,000 | | | | 102,900 | |
iHeartCommunications Inc.,
Sr. Sec. Gtd. Notes,
9.00%, 09/15/22(b) | | | 70,000 | | | | 70,350 | |
Sr. Unsec. Global Notes, 10.00%, 01/15/18 | | | 134,000 | | | | 112,225 | |
LIN Television Corp., Sr. Unsec. Gtd. Global Notes, 6.38%, 01/15/21 | | | 75,000 | | | | 77,437 | |
See accompanying Notes to Financial Statements which are an integral part of the financial statements.
10 Invesco Premium Income Fund
| | | | | | | | |
| | | Principal
Amount | | | Value | |
| Broadcasting–(continued) | |
Sinclair Television Group Inc., Sr. Unsec. Gtd. Notes, 5.63%, 08/01/24(b) | | $ | 180,000 | | | $ | 179,100 | |
Starz LLC/Starz Finance Corp., Sr. Unsec. Gtd. Global Notes, 5.00%, 09/15/19 | | | 8,000 | | | | 8,320 | |
| | | | | | | | 550,332 | |
|
| Building Products–0.87% | |
Builders FirstSource Inc., Sr. Sec. Notes, 7.63%, 06/01/21(b) | | | 255,000 | | | | 267,750 | |
Building Materials Holding Corp., Sr. Sec. Notes, 9.00%, 09/15/18(b) | | | 120,000 | | | | 130,500 | |
Gibraltar Industries Inc., Sr. Unsec. Gtd. Sub. Global Notes, 6.25%, 02/01/21 | | | 190,000 | | | | 195,700 | |
Norbord Inc. (Canada), Sr. Sec. Notes, 5.38%, 12/01/20(b) | | | 103,000 | | | | 102,001 | |
Nortek Inc., Sr. Unsec. Gtd. Global Notes, 8.50%, 04/15/21 | | | 196,000 | | | | 211,680 | |
USG Corp., Sr. Unsec. Gtd. Notes,
5.88%, 11/01/21(b) | | | 24,000 | | | | 24,840 | |
7.88%, 03/30/20(b) | | | 57,000 | | | | 61,702 | |
| | | | | | | | 994,173 | |
|
| Cable & Satellite–1.78% | |
Altice S.A. (Luxembourg), Sr. Sec. Gtd. Notes, 7.75%, 05/15/22(b) | | | 200,000 | | | | 209,770 | |
CCO Holdings LLC/CCO Holdings Capital Corp., Sr. Unsec. Gtd.
Global Notes,
5.25%, 03/15/21 | | | 231,000 | | | | 235,042 | |
5.25%, 09/30/22 | | | 50,000 | | | | 50,750 | |
CCOH Safari LLC, Sr. Unsec. Gtd. Bonds, 5.50%, 12/01/22 | | | 50,000 | | | | 50,625 | |
DISH DBS Corp., Sr. Unsec. Gtd. Global Notes, 5.13%, 05/01/20 | | | 424,000 | | | | 443,080 | |
Hughes Satellite Systems Corp., Sr. Unsec. Gtd. Global Notes, 7.63%, 06/15/21 | | | 42,000 | | | | 46,883 | |
Intelsat Luxembourg S.A. (Luxembourg), Sr. Unsec. Gtd. Global Bonds,
7.75%, 06/01/21 | | | 225,000 | | | | 236,250 | |
8.13%, 06/01/23 | | | 139,000 | | | | 148,382 | |
Numericable Group S.A. (France), Sr. Sec. Bonds, 6.00%, 05/15/22(b) | | | 200,000 | | | | 206,000 | |
VTR Finance B.V. (Chile), REGS, Sr. Sec. Euro Notes, 6.88%, 01/15/24(b) | | | 400,000 | | | | 421,000 | |
| | | | | | | | 2,047,782 | |
|
| Casinos & Gaming–0.24% | |
Caesars Entertainment Resort Properties LLC, Sr. Sec. Gtd. Notes, 8.00%, 10/01/20(b) | | | 20,000 | | | | 19,450 | |
Caesars Growth Properties Holdings LLC/Caesars Growth Properties Finance Inc., Sec. Gtd. Notes, 9.38%, 05/01/22(b) | | | 23,000 | | | | 21,448 | |
| | | | | | | | |
| | | Principal
Amount | | | Value | |
| Casinos & Gaming–(continued) | |
MGM Resorts International,
Sr. Unsec. Gtd. Global Notes, 6.63%, 12/15/21 | | $ | 123,000 | | | $ | 135,607 | |
Sr. Unsec. Gtd. Notes, 7.75%, 03/15/22 | | | 87,000 | | | | 101,029 | |
| | | | | | | | 277,534 | |
|
| Coal & Consumable Fuels–0.44% | |
CONSOL Energy Inc., Sr. Unsec. Gtd. Notes, 5.88%, 04/15/22(b) | | | 225,000 | | | | 228,487 | |
Indo Energy Finance II B.V. (Indonesia), Sr. Sec. Gtd. Notes,
6.38%, 01/24/23(b) | | | 300,000 | | | | 246,660 | |
Peabody Energy Corp., Sr. Unsec. Gtd. Notes, 6.50%, 09/15/20 | | | 31,000 | | | | 29,683 | |
| | | | | | | | 504,830 | |
|
| Commodity Chemicals–0.54% | |
Braskem Finance Ltd. (Brazil), Sr. Unsec. Gtd. Global Bonds, 6.45%, 02/03/24 | | | 200,000 | | | | 212,742 | |
Mexichem S.A.B. de C.V. (Mexico), Sr. Unsec. Gtd. Notes, 5.88%, 09/17/44(b) | | | 400,000 | | | | 402,500 | |
| | | | | | | | 615,242 | |
|
| Communications Equipment–0.35% | |
Avaya Inc.,
Sec. Gtd. Notes, 10.50%, 03/01/21(b) | | | 81,000 | | | | 71,280 | |
Sr. Sec. Gtd. Notes,
7.00%, 04/01/19(b) | | | 200,000 | | | | 197,500 | |
9.00%, 04/01/19(b) | | | 126,000 | | | | 128,835 | |
| | | | | | | | 397,615 | |
|
| Construction & Engineering–0.23% | |
AECOM Technology Corp., Sr. Unsec. Gtd. Notes,
5.75%, 10/15/22(b) | | | 70,000 | | | | 73,754 | |
5.88%, 10/15/24(b) | | | 40,000 | | | | 42,367 | |
Dycom Investments Inc., Sr. Unsec. Gtd. Sub. Global Notes, 7.13%, 01/15/21 | | | 140,000 | | | | 147,700 | |
| | | | | | | | 263,821 | |
|
| Construction Machinery & Heavy Trucks–0.92% | |
Allied Specialty Vehicles, Inc., Sr. Sec. Notes, 8.50%, 11/01/19(b) | | | 125,000 | | | | 131,563 | |
Commercial Vehicle Group Inc., Sec. Gtd. Global Notes, 7.88%, 04/15/19 | | | 245,000 | | | | 254,800 | |
Meritor Inc., Sr. Unsec. Gtd. Notes,
6.25%, 02/15/24 | | | 73,000 | | | | 74,825 | |
6.75%, 06/15/21 | | | 135,000 | | | | 143,100 | |
Navistar International Corp.,
Sr. Unsec. Gtd. Notes, 8.25%, 11/01/21 | | | 187,000 | | | | 193,545 | |
Sr. Unsec. Sub. Conv. Notes, 4.75%, 04/15/19(b) | | | 55,000 | | | | 55,034 | |
See accompanying Notes to Financial Statements which are an integral part of the financial statements.
11 Invesco Premium Income Fund
| | | | | | | | |
| | | Principal
Amount | | | Value | |
| Construction Machinery & Heavy Trucks–(continued) | |
Oshkosh Corp., Sr. Unsec. Gtd. Global Notes, 5.38%, 03/01/22 | | $ | 199,000 | | | $ | 203,975 | |
| | | | | | | | 1,056,842 | |
|
| Construction Materials–0.95% | |
Building Materials Corp. of America, Sr. Unsec. Notes, 5.38%, 11/15/24(b) | | | 45,000 | | | | 45,169 | |
Cemex S.A.B. de C.V. (Mexico), Sr. Sec. Gtd. Notes,
5.70%, 01/11/25(b) | | | 435,000 | | | | 428,475 | |
5.88%, 03/25/19(b) | | | 200,000 | | | | 207,750 | |
CPG Merger Sub LLC, Sr. Unsec. Gtd. Notes, 8.00%, 10/01/21(b) | | | 31,000 | | | | 31,930 | |
Unifrax I LLC/Unifrax Holding Co., Sr. Unsec. Gtd. Notes, 7.50%, 02/15/19(b) | | | 115,000 | | | | 117,300 | |
7.50%, 02/15/19(b) | | | 102,000 | | | | 104,040 | |
US Concrete, Inc., Sr. Sec. Gtd. Global Notes, 8.50%, 12/01/18 | | | 145,000 | | | | 155,875 | |
| | | | | | | | 1,090,539 | |
|
| Consumer Finance–0.03% | |
Ally Financial Inc., Sr. Unsec. Global Notes, 5.13%, 09/30/24 | | | 36,000 | | | | 37,485 | |
|
| Data Processing & Outsourced Services–0.54% | |
CoreLogic, Inc., Sr. Unsec. Gtd. Global Notes, 7.25%, 06/01/21 | | | 180,000 | | | | 189,900 | |
First Data Corp.,
Sr. Unsec. Gtd. Global Notes, 12.63%, 01/15/21 | | | 83,000 | | | | 100,534 | |
Sr. Unsec. Gtd. Sub. Global Notes, 11.75%, 08/15/21 | | | 282,000 | | | | 331,350 | |
| | | | | | | | 621,784 | |
|
| Department Stores–0.43% | |
1011778 BC ULC/ New Red Finance, Inc. (Canada), Sec. Notes, 6.00%, 04/01/22(b) | | | 291,000 | | | | 297,547 | |
SACI Falabella (Chile), Sr. Unsec. Notes, 4.38%, 01/27/25(b) | | | 200,000 | | | | 201,401 | |
| | | | | 498,948 | |
|
| Distillers & Vintners–0.10% | |
CEDC Finance Corp. International Inc. (Poland), Sr. Sec. Gtd. Global Notes, 10.00%, 04/30/18(c) | | | 62,000 | | | | 58,590 | |
Constellation Brands Inc., Sr. Unsec. Gtd. Notes, 4.75%, 11/15/24 | | | 55,000 | | | | 56,306 | |
| | | | | 114,896 | |
|
| Diversified Banks–3.22% | |
Banco Davivienda S.A. (Colombia), REGS, Unsec. Sub. Euro Notes, 5.88%, 07/09/22(b) | | | 310,000 | | | | 316,200 | |
Banco Inbursa S.A. Institucion de Banca Multiple (Mexico), Sr. Unsec. Notes, 4.13%, 06/06/24(b) | | | 500,000 | | | | 483,235 | |
| | | | | | | | |
| | | Principal
Amount | | | Value | |
| Diversified Banks–(continued) | |
Banco Santander Mexico S.A. Institucion de Banca Multiple Grupo Financiero Santander (Mexico), Unsec. Sub. Notes,
5.95%, 01/30/24(b) | | $ | 300,000 | | | $ | 321,375 | |
Bancolombia S.A. (Colombia), Unsec. Sub. Global Notes, 5.13%, 09/11/22 | | | 300,000 | | | | 307,248 | |
BBVA Bancomer S.A. (Mexico), Unsec. Sub. Notes, 6.75%, 09/30/22(b) | | | 150,000 | | | | 170,198 | |
Citigroup Inc., Jr. Unsec. Sub. Global Notes, 5.80%(d) | | | 40,000 | | | | 40,200 | |
Emirates NBD Tier 1 Ltd. (United Arab Emirates), Jr. Unsec. Gtd. Sub. Euro Bonds, 5.75%(d) | | | 300,000 | | | | 294,810 | |
Finansbank A.S. (Turkey), REGS, Sr. Unsec. Euro Notes, 6.25%, 04/30/19(b) | | | 200,000 | | | | 209,840 | |
ICICI Bank Ltd. (India), Jr. Unsec. Sub. Bonds, 6.38%, 04/30/22(b) | | | 300,000 | | | | 310,500 | |
Royal Bank of Scotland Group PLC (The) (United Kingdom), Unsec. Sub. Notes, 6.13%, 12/15/22 | | | 118,000 | | | | 127,776 | |
Russian Agricultural Bank OJSC Via RSHB Capital S.A. (Russia), REGS, Sr. Unsec. Euro Notes, 5.10%, 07/25/18(b) | | | 400,000 | | | | 387,020 | |
Sberbank of Russia Via SB Capital S.A. (Russia), REGS, Sr. Unsec. Euro Notes, 6.13%, 02/07/22(b) | | | 300,000 | | | | 301,125 | |
State Bank of India (India), Sr. Unsec. Notes, 4.88%, 04/17/24(b) | | | 200,000 | | | | 207,899 | |
Turkiye Is Bankasi (Turkey), Unsec. Sub. Notes, 7.85%, 12/10/23(b) | | | 200,000 | | | | 222,000 | |
| | | | | | | | 3,699,426 | |
|
| Diversified Chemicals–0.47% | |
OCP S.A. (Morocco),
Sr. Unsec. Bonds,
6.88%, 04/25/44(b) | | | 300,000 | | | | 328,095 | |
Sr. Unsec. Notes, 5.63%, 04/25/24(b) | | | 200,000 | | | | 210,456 | |
| | | | | | | | 538,551 | |
|
| Diversified Metals & Mining–0.81% | |
Cia Minera Ares SAC (Peru), Sr. Unsec. Gtd. Notes, 7.75%, 01/23/21(b) | | | 500,000 | | | | 537,500 | |
FMG Resources (August 2006) Pty. Ltd. (Australia), Sr. Unsec. Gtd. Notes, 6.88%, 04/01/22(b) | | | 200,000 | | | | 207,000 | |
HudBay Minerals, Inc. (Canada), Sr. Unsec. Gtd. Global Notes, 9.50%, 10/01/20 | | | 102,000 | | | | 108,120 | |
Imperial Metals Corp. (Canada), Sr. Unsec. Gtd. Notes, 7.00%, 03/15/19(b) | | | 78,000 | | | | 74,295 | |
| | | | | | | | 926,915 | |
See accompanying Notes to Financial Statements which are an integral part of the financial statements.
12 Invesco Premium Income Fund
| | | | | | | | |
| | | Principal
Amount | | | Value | |
| Diversified Support Services–0.21% | |
Laureate Education, Inc.,
Sr. Unsec. Gtd. Notes, 9.75%, 09/01/19(b) | | $ | 70,000 | | | $ | 72,538 | |
REGS, Sr. Unsec. Gtd. Euro Notes, 9.75%, 09/01/19(b) | | | 160,000 | | | | 165,600 | |
| | | | | | | | 238,138 | |
|
| Electric Utilities–0.10% | |
Majapahit Holding B.V. (Indonesia), Sr. Unsec. Gtd. Notes, 7.75%, 01/20/20(b) | | | 100,000 | | | | 116,988 | |
|
| Electrical Components & Equipment–0.05% | |
Sensata Technologies B.V. (Netherlands), Sr. Unsec. Gtd. Notes, 4.88%, 10/15/23(b) | | | 55,000 | | | | 54,450 | |
|
| Electronic Components–0.05% | |
Belden Inc., Sr. Unsec. Gtd. Sub. Notes, 5.50%, 09/01/22(b) | | | 52,000 | | | | 53,365 | |
|
| Environmental & Facilities Services–0.03% | |
ADS Waste Holdings, Inc., Sr. Unsec. Gtd. Global Notes, 8.25%, 10/01/20 | | | 38,000 | | | | 39,995 | |
|
| Gas Utilities–0.14% | |
AmeriGas Finance LLC/Corp., Sr. Unsec. Gtd. Global Notes, 7.00%, 05/20/22 | | | 19,000 | | | | 20,615 | |
Ferrellgas L.P./Ferrellgas Finance Corp., Sr. Unsec. Global Notes, 6.75%, 01/15/22 | | | 30,000 | | | | 30,525 | |
Suburban Propane Partners, L.P./Suburban Energy Finance Corp., Sr. Unsec. Global Notes, 5.50%, 06/01/24 | | | 59,000 | | | | 59,000 | |
7.38%, 08/01/21 | | | 44,000 | | | | 47,520 | |
| | | | | | | | 157,660 | |
| | |
| Gold–0.14% | | | | | | | | |
New Gold Inc. (Canada), Sr. Unsec. Notes, 6.25%, 11/15/22(b) | | | 159,000 | | | | 156,218 | |
|
| Health Care Equipment–0.09% | |
Universal Hospital Services Inc., Sec. Gtd. Global Notes, 7.63%, 08/15/20 | | | 105,000 | | | | 98,438 | |
|
| Health Care Facilities–1.20% | |
Community Health Systems Inc., Sr. Sec. Gtd. Notes, 5.13%, 08/01/21(b) | | | 55,000 | | | | 57,681 | |
Sr. Unsec. Gtd. Notes, 6.88%, 02/01/22
(Acquired 01/15/14-06/24/14 ;
Cost $241,183)(b) | | | 233,470 | | | | 253,023 | |
HCA Holdings, Inc., Sr. Unsec. Notes, 6.25%, 02/15/21 | | | 97,000 | | | | 105,002 | |
| | | | | | | | |
| | | Principal
Amount | | | Value | |
| Health Care Facilities–(continued) | |
HCA, Inc.,
Sr. Sec. Gtd. Global Notes, 5.88%, 03/15/22 | | $ | 199,000 | | | $ | 217,905 | |
6.50%, 02/15/20 | | | 45,000 | | | | 50,513 | |
Sr. Unsec. Gtd. Global Notes, 7.50%, 02/15/22 | | | 141,000 | | | | 164,089 | |
LifePoint Hospitals, Inc., Sr. Unsec. Gtd. Global Notes, 5.50%, 12/01/21 | | | 23,000 | | | | 24,150 | |
Tenet Healthcare Corp.,
Sr. Sec. Gtd. Global Notes, 6.00%, 10/01/20 | | | 71,000 | | | | 76,858 | |
Sr. Unsec. Global Notes, 6.75%, 02/01/20 | | | 225,000 | | | | 239,062 | |
8.13%, 04/01/22 | | | 168,000 | | | | 193,200 | |
| | | | | | | | 1,381,483 | |
|
| Health Care Services–0.19% | |
MPH Acquisition Holdings LLC, Sr. Unsec. Gtd. Notes, 6.63%, 04/01/22(b) | | | 210,000 | | | | 221,025 | |
|
| Home Improvement Retail–0.23% | |
Hillman Group Inc. (The), Sr. Unsec. Notes, 6.38%, 07/15/22(b) | | | 270,000 | | | | 263,925 | |
|
| Homebuilding–0.66% | |
Ashton Woods USA LLC/Ashton Woods Finance Co., Sr. Unsec. Notes, 6.88%, 02/15/21(b) | | | 313,000 | | | | 307,131 | |
Beazer Homes USA Inc., Sr. Unsec. Gtd. Global Notes, 7.50%, 09/15/21 | | | 89,000 | | | | 90,335 | |
K. Hovnanian Enterprises Inc.,
Sr. Sec. Gtd. Notes,
7.25%, 10/15/20(b) | | | 61,000 | | | | 64,965 | |
Sr. Unsec. Gtd. Notes, 7.00%, 01/15/19(b) | | | 79,000 | | | | 78,407 | |
7.50%, 05/15/16 | | | 50,000 | | | | 52,687 | |
8.00%, 11/01/19(b) | | | 55,000 | | | | 55,756 | |
KB Home, Sr. Unsec. Gtd. Notes, 7.00%, 12/15/21 | | | 43,000 | | | | 46,118 | |
7.50%, 09/15/22 | | | 23,000 | | | | 25,013 | |
Ryland Group Inc. (The), Sr. Unsec. Gtd. Notes, 5.38%, 10/01/22 | | | 33,000 | | | | 32,505 | |
| | | | | | | | 752,917 | |
|
| Hotels, Resorts & Cruise Lines–0.05% | |
Choice Hotels International, Inc., Sr. Unsec. Gtd. Notes, 5.75%, 07/01/22 | | | 58,000 | | | | 62,640 | |
|
| Household Products–0.23% | |
Reynolds Group Issuer Inc./LLC,
Sr. Sec. Gtd. Global Notes, 5.75%, 10/15/20 | | | 146,000 | | | | 152,388 | |
Sr. Unsec. Gtd. Global Notes, 8.25%, 02/15/21 | | | 100,000 | | | | 107,875 | |
| | | | | | | | 260,263 | |
See accompanying Notes to Financial Statements which are an integral part of the financial statements.
13 Invesco Premium Income Fund
| | | | | | | | |
| | | Principal
Amount | | | Value | |
| Hypermarkets & Super Centers–0.44% | |
Cencosud S.A. (Chile), REGS, Sr. Unsec. Gtd. Euro Notes, 4.88%, 01/20/23(b) | | $ | 500,000 | | | $ | 501,136 | |
|
| Independent Power Producers & Energy Traders–0.40% | |
AES Corp., Sr. Unsec. Global Notes, 7.38%, 07/01/21 | | | 102,000 | | | | 116,790 | |
8.00%, 10/15/17 | | | 2,000 | | | | 2,290 | |
Calpine Corp., Sr. Unsec. Global Notes, 5.38%, 01/15/23 | | | 181,000 | | | | 183,262 | |
NRG Energy Inc., Sr. Unsec. Gtd. Global Notes, 6.25%, 07/15/22 | | | 144,000 | | | | 151,560 | |
| | | | | | | | 453,902 | |
|
| Industrial Conglomerates–0.50% | |
Grupo KUO S.A.B De C.V. (Mexico), Sr. Unsec. Gtd. Notes, 6.25%, 12/04/22(b) | | | 400,000 | | | | 411,500 | |
Hutchison Whampoa International (10) Ltd. (Hong Kong), Unsec. Gtd. Sub. Notes, 6.00%(b)(d) | | | 159,000 | | | | 165,161 | |
| | | | | | | | 576,661 | |
|
| Industrial Gases–0.26% | |
Yingde Gases Investment Ltd. (China), Sr. Unsec. Gtd. Notes, 7.25%, 02/28/20(b) | | | 300,000 | | | | 299,250 | |
|
| Industrial Machinery–0.17% | |
EnPro Industries, Inc., Sr. Unsec. Gtd. Notes, 5.88%, 09/15/22(b) | | | 17,000 | | | | 17,510 | |
Waterjet Holdings, Inc., Sr. Sec. Gtd. Notes, 7.63%, 02/01/20(b) | | | 168,000 | | | | 176,190 | |
| | | | | | | | 193,700 | |
|
| Integrated Oil & Gas–2.44% | |
California Resources Corp., Sr. Unsec. Gtd. Notes, 5.50%, 09/15/21(b) | | | 128,000 | | | | 131,520 | |
Ecopetrol S.A. (Colombia),
Sr. Unsec. Global Bonds, 4.13%, 01/16/25 | | | 367,000 | | | | 357,825 | |
Sr. Unsec. Global Notes, 5.88%, 05/28/45 | | | 100,000 | | | | 102,763 | |
Hiland Partners L.P./Hiland Partners Finance Corp., Sr. Unsec. Gtd. Notes, 5.50%, 05/15/22(b) | | | 49,000 | | | | 48,510 | |
KazMunayGas National Co. JSC (Kazakhstan),
Unsec. Bonds, 6.00%, 11/07/44(b) | | | 400,000 | | | | 394,524 | |
REGS, Sr. Unsec. Euro Notes, 4.40%, 04/30/23(b) | | | 200,000 | | | | 196,900 | |
Petrobras Global Finance B.V. (Brazil), Sr. Unsec. Gtd. Global Notes, 6.25%, 03/17/24 | | | 372,000 | | | | 395,847 | |
| | | | | | | | |
| | | Principal
Amount | | | Value | |
| Integrated Oil & Gas–(continued) | |
Petroleos de Venezuela S.A. (Venezuela),
Sr. Unsec. Gtd. Notes, 8.50%, 11/02/17(b) | | $ | 106,000 | | | $ | 81,620 | |
REGS, Sr. Unsec. Gtd. Euro Notes, 8.50%, 11/02/17(b) | | | 100,000 | | | | 75,990 | |
9.00%, 11/17/21(b) | | | 265,000 | | | | 169,269 | |
Unsec. Euro Bonds,
6.00%, 05/16/24(b) | | | 520,000 | | | | 270,088 | |
State Oil Co. of the Azerbaijan Republic (Azerbaijan),
Sr. Unsec. Euro Notes, 5.45%, 02/09/17 | | | 265,000 | | | | 278,250 | |
Sr. Unsec. Medium-Term Euro Notes, 4.75%, 03/13/23 | | | 300,000 | | | | 299,430 | |
| | | | | | | | 2,802,536 | |
|
| Integrated Telecommunication Services–1.05% | |
Digicel Group Ltd. (Jamaica), REGS, Sr. Unsec. Euro Notes, 7.13%, 04/01/22(b) | | | 500,000 | | | | 503,750 | |
Globo Comunicacao e Participacoes S.A. (Brazil), Sr. Sec. Euro Notes, 6.25%(b)(c)(d) | | | 359,000 | | | | 372,014 | |
T-Mobile USA, Inc., Sr. Unsec. Gtd. Notes, 6.38%, 03/01/25 | | | 119,000 | | | | 123,165 | |
Virgin Media Secured Finance PLC (United Kingdom), Sr. Sec. Gtd. Global Notes, 5.25%, 01/15/21 | | | 200,000 | | | | 209,000 | |
| | | | | | | | 1,207,929 | |
|
| Internet Software & Services–0.43% | |
CyrusOne L.P./CyrusOne Finance Corp., Sr. Unsec. Gtd. Global Notes, 6.38%, 11/15/22 | | | 281,000 | | | | 297,860 | |
EarthLink Holdings Corp.,
Sr. Sec. Gtd. Global Notes, 7.38%, 06/01/20 | | | 155,000 | | | | 159,069 | |
Sr. Unsec. Gtd. Global Notes, 8.88%, 05/15/19 | | | 38,000 | | | | 37,287 | |
| | | | | | | | 494,216 | |
|
| Leisure Facilities–0.08% | |
Cedar Fair L.P./Canada’s Wonderland Co./Magnum Management Corp., Sr. Unsec. Gtd. Global Notes, 5.25%, 03/15/21 | | | 86,000 | | | | 87,075 | |
|
| Marine–0.43% | |
Navios Maritime Acquisition Corp./Navios Acquisition Finance U.S. Inc., Sr. Sec. Gtd. Mortgage Notes, 8.13%, 11/15/21(b) | | | 180,000 | | | | 184,500 | |
Pelabuhan Indonesia III PT (Indonesia), Sr. Unsec. Notes, 4.88%, 10/01/24(b) | | | 300,000 | | | | 305,379 | |
| | | | | | | | 489,879 | |
See accompanying Notes to Financial Statements which are an integral part of the financial statements.
14 Invesco Premium Income Fund
| | | | | | | | |
| | | Principal
Amount | | | Value | |
| Metal & Glass Containers–0.37% | |
Ball Corp., Sr. Unsec. Gtd. Notes, 5.00%, 03/15/22 | | $ | 75,000 | | | $ | 78,375 | |
Berry Plastics Corp., Sec. Gtd. Notes, 5.50%, 05/15/22 | | | 345,000 | | | | 348,450 | |
| | | | | | | | 426,825 | |
|
| Movies & Entertainment–0.13% | |
AMC Entertainment Inc., Sr. Unsec. Gtd. Sub. Global Notes, 5.88%, 02/15/22 | | | 45,000 | | | | 46,238 | |
DreamWorks Animation SKG, Inc., Sr. Unsec. Gtd. Notes, 6.88%, 08/15/20(b) | | | 101,000 | | | | 106,050 | |
| | | | | | | | 152,288 | |
|
| Multi-Sector Holdings–0.26% | |
SUAM Finance B.V. (Colombia), Sr. Unsec. Gtd. Notes, 4.88%, 04/17/24(b) | | | 300,000 | | | | 303,746 | |
|
| Oil & Gas Drilling–0.32% | |
Parker Drilling Co., Sr. Unsec. Gtd. Global Notes,
6.75%, 07/15/22 | | | 7,000 | | | | 6,580 | |
7.50%, 08/01/20 | | | 162,000 | | | | 158,760 | |
Pioneer Energy Services Corp., Sr. Unsec. Gtd. Notes, 6.13%, 03/15/22(b) | | | 105,000 | | | | 99,619 | |
Precision Drilling Corp. (Canada),
Sr. Unsec. Gtd. Global Notes, 6.50%, 12/15/21 | | | 30,000 | | | | 31,125 | |
Sr. Unsec. Gtd. Notes, 5.25%, 11/15/24(b) | | | 79,000 | | | | 73,912 | |
| | | | | | | | 369,996 | |
|
| Oil & Gas Equipment & Services–0.35% | |
Bristow Group, Inc., Sr. Unsec. Gtd. Notes, 6.25%, 10/15/22 | | | 97,000 | | | | 101,486 | |
Exterran Partners L.P./EXLP Finance Corp.,
Sr. Unsec. Gtd. Global Notes, 6.00%, 04/01/21 | | | 176,000 | | | | 171,600 | |
Sr. Unsec. Gtd. Notes, 6.00%, 10/01/22(b) | | | 59,000 | | | | 57,230 | |
Gulfmark Offshore Inc., Sr. Unsec. Global Notes, 6.38%, 03/15/22 | | | 82,000 | | | | 74,415 | |
| | | | | | | | 404,731 | |
|
| Oil & Gas Exploration & Production–3.13% | |
American Eagle Energy Corp., Sr. Sec. Gtd. Notes, 11.00%, 09/01/19(b) | | | 59,000 | | | | 52,510 | |
Antero Resources Corp., Sr. Unsec. Gtd. Notes, 5.13%, 12/01/22(b) | | | 110,000 | | | | 110,275 | |
Antero Resources Finance Corp., Sr. Unsec. Gtd. Global Notes, 5.38%, 11/01/21 | | | 129,000 | | | | 131,580 | |
Approach Resources Inc., Sr. Unsec. Gtd. Global Notes, 7.00%, 06/15/21 | | | 143,000 | | | | 133,347 | |
| | | | | | | | |
| | | Principal
Amount | | | Value | |
| Oil & Gas Exploration & Production–(continued) | |
Carrizo Oil & Gas Inc., Sr. Unsec. Notes, 7.50%, 09/15/20(b) | | $ | 49,000 | | | $ | 50,103 | |
Concho Resources Inc., Sr. Unsec. Gtd. Global Notes, 5.50%, 10/01/22 | | | 37,000 | | | | 39,266 | |
Denbury Resources Inc., Sr. Unsec. Gtd. Sub. Notes, 5.50%, 05/01/22 | | | 96,000 | | | | 95,280 | |
EXCO Resources, Inc., Sr. Unsec. Gtd. Notes, 8.50%, 04/15/22 | | | 145,000 | | | | 127,237 | |
Halcon Resources Corp., Sr. Unsec. Gtd. Global Notes,
8.88%, 05/15/21 | | | 68,000 | | | | 56,270 | |
9.75%, 07/15/20 | | | 146,000 | | | | 125,195 | |
Kosmos Energy Ltd. (Ghana), Sr. Sec. Gtd. Notes, 7.88%, 08/01/21(b) | | | 300,000 | | | | 285,000 | |
Pacific Rubiales Energy Corp. (Colombia), Sr. Unsec. Gtd. Notes, 5.63%, 01/19/25(b) | | | 500,000 | | | | 489,125 | |
Pertamina Persero PT (Indonesia), REGS, Sr. Unsec. Medium-Term Euro Notes, 4.30%, 05/20/23(b) | | | 500,000 | | | | 488,750 | |
Petroleos Mexicanos (Mexico), Sr. Unsec. Gtd. Global Bonds, 5.50%, 06/27/44 | | | 159,000 | | | | 165,230 | |
Sr. Unsec. Gtd. Global Notes, 3.50%, 01/30/23 | | | 318,000 | | | | 308,874 | |
6.38%, 01/23/45 | | | 117,000 | | | | 134,657 | |
6.50%, 06/02/41 | | | 159,000 | | | | 185,929 | |
QEP Resources Inc.,
Sr. Unsec. Global Notes, 5.25%, 05/01/23 | | | 73,000 | | | | 71,905 | |
Sr. Unsec. Notes, 5.38%, 10/01/22 | | | 19,000 | | | | 18,953 | |
RSP Permian, Inc., Sr. Unsec. Gtd. Notes, 6.63%, 10/01/22(b) | | | 166,000 | | | | 166,000 | |
Sanchez Energy Corp., Sr. Unsec. Gtd. Notes, 6.13%, 01/15/23(b) | | | 159,000 | | | | 151,845 | |
SandRidge Energy Inc., Sr. Unsec. Gtd. Global Notes, 7.50%, 03/15/21 | | | 107,000 | | | | 97,370 | |
SM Energy Co., Sr. Unsec. Global Notes, 6.50%, 11/15/21 | | | 4,000 | | | | 4,170 | |
Ultra Petroleum Corp., Sr. Unsec. Notes, 6.13%, 10/01/24(b) | | | 118,000 | | | | 111,510 | |
| | | | | | | | 3,600,381 | |
|
| Oil & Gas Storage & Transportation–2.33% | |
Access Midstream Partners L.P./ACMP Finance Corp., Sr. Unsec. Gtd. Global Notes, 4.88%, 05/15/23 | | | 467,000 | | | | 490,350 | |
Energy Transfer Equity L.P., Sr. Sec. Gtd. Notes, 7.50%, 10/15/20 | | | 410,000 | | | | 473,550 | |
GNL Quintero S.A. (Chile), Sr. Unsec. Notes, 4.63%, 07/31/29(b) | | | 200,000 | | | | 206,984 | |
MarkWest Energy Partners L.P./MarkWest Energy Finance Corp., Sr. Unsec. Gtd. Notes, 5.50%, 02/15/23 | | | 555,000 | | | | 595,237 | |
NGL Energy Partners L.P./NGL Energy Finance Corp., Sr. Unsec. Gtd. Notes, 6.88%, 10/15/21(b) | | | 154,000 | | | | 165,550 | |
See accompanying Notes to Financial Statements which are an integral part of the financial statements.
15 Invesco Premium Income Fund
| | | | | | | | |
| | | Principal
Amount | | | Value | |
| Oil & Gas Storage & Transportation–(continued) | |
Regency Energy Partners L.P./Regency Energy Finance Corp., Sr. Unsec. Gtd. Global Notes, 5.88%, 03/01/22 | | $ | 16,000 | | | $ | 17,120 | |
Sabine Pass Liquefaction LLC, Sr. Sec. Global Notes, 5.63%, 04/15/23 | | | 100,000 | | | | 104,250 | |
Teekay Corp. (Bermuda), Sr. Unsec. Global Notes, 8.50%, 01/15/20 | | | 60,000 | | | | 66,900 | |
Teekay Offshore Partners L.P./Teekay Offshore Finance Corp. (Bermuda), Sr. Unsec. Global Notes, 6.00%, 07/30/19 | | | 44,000 | | | | 41,254 | |
Tesoro Logistics L.P./Tesoro Logistics Finance Corp.,
Sr. Unsec. Gtd. Global Notes, 5.88%, 10/01/20 | | | 123,000 | | | | 126,690 | |
Sr. Unsec. Notes, 6.25%, 10/15/22(b) | | | 14,000 | | | | 14,543 | |
Transportadora de Gas Internacional S.A. E.S.P. (Colombia), REGS, Sr. Unsec. Euro Notes, 5.70%, 03/20/22(b) | | | 350,000 | | | | 375,725 | |
| | | | | | | | 2,678,153 | |
|
| Other Diversified Financial Services–2.15% | |
Corp Financiera de Desarrollo S.A. (Peru), Unsec. Sub. Notes, 5.25%, 07/15/29(b) | | | 300,000 | | | | 310,200 | |
Infinity Acquisition LLC/Infinity Acquisition Finance Corp., Sr. Sec. Notes, 7.25%, 08/01/22(b) | | | 56,000 | | | | 52,640 | |
Odebrecht Oil & Gas Finance Ltd. (Brazil), Sr. Unsec. Gtd. Notes, 7.00%(b)(d) | | | 425,000 | | | | 414,375 | |
Power Sector Assets & Liabilities Management Corp. (Philippines), Sr. Unsec. Gtd. Bonds, 7.39%, 12/02/24(b) | | | 300,000 | | | | 393,000 | |
Rio Oil Finance Trust (Brazil), Series 2014-1, Sr. Sec. Notes, 6.25%, 07/06/24(b) | | | 750,000 | | | | 784,312 | |
Trust F/1401 (Mexico), Sr. Unsec. Notes, 5.25%, 12/15/24(b) | | | 302,000 | | | | 320,875 | |
Unifin Financiera S.A.P.I. de C.V. SOFOM, E.N.R. (Mexico), Sr. Unsec. Gtd. Bonds, 6.25%, 07/22/19(b) | | | 200,000 | | | | 196,250 | |
| | | | | | | | 2,471,652 | |
|
| Packaged Foods & Meats–2.10% | |
Chiquita Brands International Inc., Sr. Unsec. Conv. Notes, 4.25%, 08/15/16 | | | 230,000 | | | | 231,150 | |
Chiquita Brands International Inc./Chiquita Brands LLC, Sr. Sec. Gtd. Global Notes, 7.88%, 02/01/21 | | | 22,000 | | | | 24,228 | |
Diamond Foods Inc., Sr. Unsec. Gtd. Notes, 7.00%, 03/15/19(b) | | | 290,000 | | | | 297,250 | |
FAGE Dairy Industry S.A./FAGE USA Dairy Industry, Inc. (Greece),
Sr. Unsec. Gtd. Notes, 9.88%, 02/01/20(b) | | | 100,000 | | | | 105,875 | |
| | | | | | | | |
| | | Principal
Amount | | | Value | |
| Packaged Foods & Meats–(continued) | |
JBS Investments GmbH (Brazil), Sr. Unsec. Gtd. Notes, 7.25%, 04/03/24(b) | | $ | 200,000 | | | $ | 214,500 | |
JBS S.A. (Brazil),
Sr. Unsec. Notes,
10.50%, 08/04/16(b) | | | 100,000 | | | | 113,200 | |
REGS, Sr. Unsec. Euro Notes, 10.50%, 08/04/16(b) | | | 100,000 | | | | 114,000 | |
MHP S.A. (Ukraine), Sr. Unsec. Gtd. Notes, 8.25%, 04/02/20(b) | | | 400,000 | | | | 348,000 | |
Minerva Luxembourg S.A. (Brazil), Sr. Unsec. Gtd. Notes, 7.75%, 01/31/23(b) | | | 350,000 | | | | 368,025 | |
REGS, Sr. Unsec. Gtd. Euro Notes, 7.75%, 01/31/23(b) | | | 200,000 | | | | 209,500 | |
Post Holdings Inc.,
Sr. Unsec. Gtd. Global Notes, 7.38%, 02/15/22 | | | 111,000 | | | | 114,330 | |
Sr. Unsec. Gtd. Notes, 6.00%, 12/15/22(b) | | | 71,000 | | | | 68,692 | |
Smithfield Foods Inc., Sr. Unsec. Notes,
5.88%, 08/01/21(b) | | | 29,000 | | | | 30,957 | |
6.63%, 08/15/22 | | | 74,000 | | | | 80,845 | |
WhiteWave Foods Co. (The), Sr. Unsec. Gtd. Notes, 5.38%, 10/01/22 | | | 92,000 | | | | 97,060 | |
| | | | | | | | 2,417,612 | |
|
| Paper Packaging–0.06% | |
Graphic Packaging International Inc., Sr. Unsec. Gtd. Notes, 4.75%, 04/15/21 | | | 6,000 | | | | 6,083 | |
4.88%, 11/15/22 | | | 67,000 | | | | 67,670 | |
| | | | | | | | 73,753 | |
|
| Paper Products–0.15% | |
PH Glatfelter Co., Sr. Unsec. Gtd. Global Notes, 5.38%, 10/15/20 | | | 165,000 | | | | 170,363 | |
|
| Personal Products–0.32% | |
Albea Beauty Holdings S.A. (France), Sr. Sec. Gtd. Notes,
8.38%, 11/01/19(b) | | | 200,000 | | | | 215,000 | |
NBTY Inc., Sr. Unsec. Gtd. Global Notes, 9.00%, 10/01/18 | | | 142,000 | | | | 148,035 | |
| | | | | | | | 363,035 | |
|
| Pharmaceuticals–0.41% | |
Salix Pharmaceuticals Ltd., Sr. Unsec. Gtd. Notes, 6.00%, 01/15/21(b) | | | 50,000 | | | | 54,375 | |
Valeant Pharmaceuticals International, Inc., Sr. Unsec. Gtd. Notes,
5.63%, 12/01/21(b) | | | 140,000 | | | | 139,475 | |
6.38%, 10/15/20(b) | | | 115,000 | | | | 118,594 | |
6.75%, 08/15/21(b) | | | 62,000 | | | | 64,557 | |
7.25%, 07/15/22(b) | | | 58,000 | | | | 61,480 | |
7.50%, 07/15/21(b) | | | 32,000 | | | | 34,400 | |
| | | | | | | | 472,881 | |
See accompanying Notes to Financial Statements which are an integral part of the financial statements.
16 Invesco Premium Income Fund
| | | | | | | | |
| | | Principal
Amount | | | Value | |
| Railroads–0.84% | |
Transnet SOC Ltd. (South Africa),
Sr. Unsec. Notes, 4.00%, 07/26/22(b) | | $ | 300,000 | | | $ | 288,375 | |
REGS, Sr. Unsec. Euro Notes, 4.00%, 07/26/22(b) | | | 700,000 | | | | 677,390 | |
| | | | | | | | 965,765 | |
|
| Real Estate Development–0.39% | |
AV Homes, Inc., Sr. Unsec. Notes, 8.50%, 07/01/19(b) | | | 60,000 | | | | 59,550 | |
Country Garden Holdings Co. Ltd. (China), REGS, Sr. Unsec. Gtd. Euro Notes, 7.50%, 01/10/23(b) | | | 400,000 | | | | 393,000 | |
| | | | | | | | 452,550 | |
|
| Regional Banks–0.43% | |
Banco Internacional del Peru SAA (Peru), Unsec. Sub. Notes, 6.63%, 03/19/29(b) | | | 300,000 | | | | 325,264 | |
Synovus Financial Corp., Sr. Unsec. Global Notes, 7.88%, 02/15/19 | | | 147,000 | | | | 165,375 | |
| | | | | | | | 490,639 | |
|
| Renewable Electricity–0.26% | |
Greenko Dutch B.V. (India), Sr. Sec. Gtd. Notes, 8.00%, 08/01/19(b) | | | 300,000 | | | | 294,750 | |
|
| Research & Consulting Services–0.04% | |
IHS Inc., Sr. Unsec. Gtd. Notes, 5.00%, 11/01/22(b) | | | 40,000 | | | | 40,800 | |
|
| Security & Alarm Services–0.07% | |
ADT Corp. (The), Sr. Unsec. Global Notes, 6.25%, 10/15/21 | | | 75,000 | | | | 79,031 | |
|
| Semiconductor Equipment–0.39% | |
Amkor Technology Inc., Sr. Unsec. Global Notes, 6.38%, 10/01/22 | | | 349,000 | | | | 351,618 | |
Entegris Inc., Sr. Unsec. Gtd. Notes, 6.00%, 04/01/22(b) | | | 96,000 | | | | 98,880 | |
| | | | | | | | 450,498 | |
|
| Semiconductors–0.42% | |
Freescale Semiconductor Inc., Sr. Sec. Gtd. Notes, 6.00%, 01/15/22(b) | | | 136,000 | | | | 140,760 | |
Micron Technology, Inc., Sr. Unsec. Notes, 5.88%, 02/15/22(b) | | | 122,000 | | | | 129,320 | |
NXP B.V./NXP Funding LLC (Netherlands), Sr. Unsec. Gtd. Notes, 5.75%, 02/15/21(b) | | | 200,000 | | | | 211,000 | |
| | | | | | | | 481,080 | |
|
| Sovereign Debt–7.71% | |
Bahrain Government International Bond (Bahrain), Unsec. Bonds, 6.00%, 09/19/44(b) | | | 200,000 | | | | 206,500 | |
Chile Government International Bond (Chile), Sr. Unsec. Global Notes, 3.25%, 09/14/21 | | | 212,000 | | | | 220,480 | |
3.63%, 10/30/42 | | | 300,000 | | | | 272,550 | |
| | | | | | | | |
| | | Principal
Amount | | | Value | |
| Sovereign Debt–(continued) | |
Dominican Republic International Bond (Dominican Repubic),
Sr. Unsec. Bonds, 7.45%, 04/30/44(b) | | $ | 100,000 | | | $ | 112,250 | |
Sr. Unsec. Notes, 9.04%, 01/23/18(b) | | | 191,795 | | | | 210,015 | |
REGS, Sr. Unsec. Euro Bonds, 5.88%, 04/18/24(b) | | | 400,000 | | | | 424,000 | |
El Salvador Government International Bond (El Salvador), Unsec. Notes, 6.38%, 01/18/27(b) | | | 172,000 | | | | 177,160 | |
Guatemala Government Bond (Guatemala), Sr. Unsec. Bonds, 8.13%, 10/06/19(b)(e) | | | 359,000 | | | | 472,982 | |
Honduras Government International Bond (Honduras), REGS, Sr. Unsec. Euro Notes, 7.50%, 03/15/24(b) | | | 200,000 | | | | 217,500 | |
Hungary Government International Bond (Hungary), Sr. Unsec. Global Notes,
5.38%, 02/21/23 | | | 80,000 | | | | 86,400 | |
5.38%, 03/25/24 | | | 200,000 | | | | 214,520 | |
7.63%, 03/29/41 | | | 186,000 | | | | 241,335 | |
Indonesia Government International Bond (Indonesia),
Sr. Unsec. Notes, 4.63%, 04/15/43(b) | | | 265,000 | | | | 249,100 | |
REGS, Sr. Unsec. Euro Notes, 3.75%, 04/25/22(b) | | | 265,000 | | | | 265,000 | |
Kazakhstan Government International Bond (Kazakhstan), Sr. Unsec. Notes, 4.88%, 10/14/44(b) | | | 313,000 | | | | 302,827 | |
Lebanon Government International Bond (Lebanon), REGS, Sr. Unsec. Euro Bonds, 6.00%, 01/27/23(b) | | | 500,000 | | | | 508,225 | |
Magyar Export-Import Bank Zrt. (Hungary), Sr. Unsec. Gtd. Bonds, 4.00%, 01/30/20(b) | | | 200,000 | | | | 199,250 | |
MDC-GMTN B.V. (United Arab Emirates), Sr. Unsec. Gtd. Bonds, 3.25%, 04/28/22(b) | | | 200,000 | | | | 204,250 | |
Mexico Government International Bond (Mexico), Sr. Unsec. Global Notes, 3.63%, 03/15/22 | | | 138,000 | | | | 141,996 | |
Pakistan Government International Bond (Pakistan), Unsec. Bonds, 7.25%, 04/15/19(b) | | | 400,000 | | | | 415,000 | |
Panama Government International Bond (Panama), Sr. Unsec. Global Bonds, 4.00%, 09/22/24 | | | 200,000 | | | | 205,500 | |
Perusahaan Penerbit SBSN Indonesia III (Indonesia), Unsec. Notes, 4.35%, 09/10/24(b) | | | 350,000 | | | | 352,625 | |
Peruvian Government International Bond (Peru), Sr. Unsec. Global Bonds, 8.75%, 11/21/33 | | | 212,000 | | | | 327,010 | |
See accompanying Notes to Financial Statements which are an integral part of the financial statements.
17 Invesco Premium Income Fund
| | | | | | | | |
| | | Principal
Amount | | | Value | |
| Sovereign Debt–(continued) | |
Poland Government International Bond (Poland),
Sr. Unsec. Global Notes, 3.00%, 03/17/23 | | $ | 106,000 | | | $ | 105,285 | |
Sr. Unsec. Global Notes, 5.00%, 03/23/22 | | | 146,000 | | | | 164,433 | |
Qatar Government International Bond (Qatar), REGS, Sr. Unsec. Notes, 5.75%, 01/20/42(b) | | | 260,000 | | | | 309,400 | |
Republic of Angola Via Northern Lights III B.V. (Angola), REGS, Sr. Unsec. Euro Notes, 7.00%, 08/16/19(b) | | | 318,000 | | | | 341,055 | |
Republic of Serbia (Serbia), Sr. Unsec. Bonds, 4.88%, 02/25/20(b) | | | 250,000 | | | | 254,375 | |
Romanian Government International Bond (Romania), Sr. Unsec. Notes,
4.88%, 01/22/24(b) | | | 106,000 | | | | 114,745 | |
6.75%, 02/07/22(b) | | | 84,000 | | | | 100,947 | |
Russian Foreign Bond (Russia), REGS, Sr. Unsec. Euro Bonds, 7.50%, 03/31/30(b)(c) | | | 580,985 | | | | 660,574 | |
Sri Lanka Government International Bond (Sri Lanka), REGS, Unsec. Euro Notes, 7.40%, 01/22/15(b) | | | 318,000 | | | | 322,770 | |
Ukraine Government International Bond (Ukraine), REGS, Sr. Unsec. Euro Notes, 6.75%, 11/14/17(b) | | | 305,000 | | | | 268,019 | |
Venezuela Government International Bond (Venezuela), REGS, Sr. Unsec. Euro Bonds,
6.00%, 12/09/20(b) | | | 116,500 | | | | 69,900 | |
11.95%, 08/05/31(b) | | | 169,600 | | | | 124,232 | |
| | | | | | | | 8,862,210 | |
|
| Specialized Finance–0.97% | |
Aircastle Ltd.,
Sr. Unsec. Global Notes, 7.63%, 04/15/20 | | | 189,000 | | | | 215,224 | |
Sr. Unsec. Notes, 5.13%, 03/15/21 | | | 85,000 | | | | 86,381 | |
CIT Group Inc., Sr. Unsec. Global Notes, 5.00%, 08/15/22 | | | 204,000 | | | | 215,730 | |
Fly Leasing Ltd. (Ireland), Sr. Unsec. Gtd. Global Notes, 6.75%, 12/15/20 | | | 200,000 | | | | 207,740 | |
International Lease Finance Corp., Sr. Unsec. Global Notes, 5.88%, 08/15/22 | | | 138,000 | | | | 150,765 | |
Sr. Unsec. Notes, 8.25%, 12/15/20 | | | 201,000 | | | | 243,713 | |
| | | | | | | | 1,119,553 | |
|
| Specialized REIT’s–0.27% | |
Crown Castle International Corp., Sr. Unsec. Global Notes, 5.25%, 01/15/23 | | | 150,000 | | | | 154,313 | |
Sr. Unsec. Notes, 4.88%, 04/15/22 | | | 156,000 | | | | 157,365 | |
| | | | | | | | 311,678 | |
| | | | | | | | |
| | | Principal
Amount | | | Value | |
| Specialty Stores–0.37% | |
Michaels Stores Inc., Sr. Unsec. Gtd. Sub. Notes, 5.88%, 12/15/20(b) | | $ | 342,000 | | | $ | 347,557 | |
Outerwall, Inc., Sr. Unsec. Gtd. Global Notes, 6.00%, 03/15/19 | | | 14,000 | | | | 13,878 | |
Sally Holdings LLC/Sally Capital Inc., Sr. Unsec. Gtd. Global Bonds, 5.50%, 11/01/23 | | | 56,000 | | | | 59,360 | |
| | | | | | | | 420,795 | |
|
| Steel–1.63% | |
AK Steel Corp., Sr. Unsec. Gtd. Notes, 7.63%, 10/01/21 | | | 102,000 | | | | 102,510 | |
ArcelorMittal (Luxembourg), Sr. Unsec. Global Notes,
6.00%, 03/01/21 | | | 200,000 | | | | 214,000 | |
6.75%, 02/25/22 | | | 97,000 | | | | 108,155 | |
Evraz Inc. N.A. (Canada), Sr. Sec. Gtd. Notes, 7.50%, 11/15/19(b) | | | 470,000 | | | | 475,875 | |
Magnetation LLC/ Mag Finance Corp., Sr. Sec. Gtd. Notes, 11.00%, 05/15/18(b) | | | 230,000 | | | | 207,000 | |
Steel Dynamics, Inc.,
Sr. Unsec. Gtd. Global Notes, 6.38%, 08/15/22 | | | 144,000 | | | | 157,320 | |
Sr. Unsec. Gtd. Notes, 5.13%, 10/01/21(b) | | | 13,000 | | | | 13,650 | |
5.50%, 10/01/24(b) | | | 51,000 | | | | 54,188 | |
SunCoke Energy Partners L.P./SunCoke Energy Partners Finance Corp., Sr. Unsec. Gtd. Notes, 7.38%, 02/01/20(b) | | | 35,000 | | | | 36,794 | |
7.38%, 02/01/20(b) | | | 242,000 | | | | 253,192 | |
United States Steel Corp., Sr. Unsec. Global Notes, 7.50%, 03/15/22 | | | 32,000 | | | | 35,040 | |
Vale Overseas Ltd. (Brazil), Sr. Unsec. Gtd. Global Notes, 4.38%, 01/11/22 | | | 212,000 | | | | 215,581 | |
| | | | | | | | 1,873,305 | |
|
| Tires & Rubber–0.26% | |
Gajah Tunggal Tbk PT (Indonesia), REGS, Sr. Sec. Gtd. Euro Notes, 7.75%, 02/06/18(b) | | | 300,000 | | | | 303,000 | |
|
| Trading Companies & Distributors–0.25% | |
AerCap Ireland Capital Ltd./AerCap Global Aviation Trust (Netherlands), Sr. Unsec. Notes, 5.00%, 10/01/21(b) | | | 150,000 | | | | 156,750 | |
United Rentals North America Inc., Sr. Unsec. Gtd. Notes, 6.13%, 06/15/23 | | | 125,000 | | | | 135,000 | |
| | | | | | | | 291,750 | |
|
| Wireless Telecommunication Services–2.46% | |
America Movil S.A.B. de C.V. (Mexico), Sr. Unsec. Global Notes, 4.38%, 07/16/42 | | | 200,000 | | | | 191,994 | |
See accompanying Notes to Financial Statements which are an integral part of the financial statements.
18 Invesco Premium Income Fund
| | | | | | | | |
| | | Principal
Amount | | | Value | |
| Wireless Telecommunication Services–(continued) | |
Digicel Ltd. (Jamaica), Sr. Unsec. Notes, 6.00%, 04/15/21(b) | | $ | 200,000 | | | $ | 203,500 | |
SBA Communications Corp., Sr. Unsec. Notes, 4.88%, 07/15/22(b) | | | 170,000 | | | | 168,088 | |
Sprint Capital Corp., Sr. Unsec. Gtd. Global Notes, 6.88%, 11/15/28 | | | 475,000 | | | | 464,312 | |
Sprint Communications Inc., Sr. Unsec. Global Notes, 6.00%, 11/15/22 | | | 121,000 | | | | 121,000 | |
Sprint Corp., Sr. Unsec. Gtd. Notes, 7.25%, 09/15/21(b) | | | 79,000 | | | | 83,740 | |
7.88%, 09/15/23(b) | | | 268,000 | | | | 289,440 | |
T-Mobile USA, Inc.,
Sr. Unsec. Gtd. Global Notes, 6.63%, 04/01/23 | | | 280,000 | | | | 296,800 | |
Sr. Unsec. Gtd. Notes, 6.84%, 04/28/23 | | | 183,000 | | | | 194,895 | |
VimpelCom Holdings B.V. (Russia), REGS, Sr. Unsec. Gtd. Euro Notes, 5.95%, 02/13/23(b) | | | 450,000 | | | | 416,848 | |
Wind Acquisition Finance S.A. (Italy), Sr. Unsec. Gtd. Notes, 7.38%, 04/23/21(b) | | | 400,000 | | | | 393,000 | |
| | | | | | | | 2,823,617 | |
Total U.S. Dollar Denominated Bonds and Notes
(Cost $61,367,721) | | | | 62,045,130 | |
| | |
| | | Shares | | | | |
Preferred Stocks–27.96% | |
| Asset Management & Custody Banks–0.68% | |
Affiliated Managers Group Inc., 6.38% Sr. Unsec. Pfd. | | | 3,100 | | | | 80,786 | |
Apollo Investment Corp., 6.88% Sr. Unsec. Pfd. | | | 2,700 | | | | 67,581 | |
Ares Capital Corp., 7.00% Sr. Unsec. Pfd. | | | 6,800 | | | | 172,924 | |
Bank of New York Mellon Corp. (The), 5.20% Pfd. | | | 5,300 | | | | 126,352 | |
Northern Trust Corp., Series C, 5.85% Pfd. | | | 3,000 | | | | 74,280 | |
State Street Corp., Series C, 5.25% Pfd. | | | 4,500 | | | | 109,845 | |
State Street Corp., Series D, 5.90% Pfd. | | | 5,800 | | | | 151,380 | |
| | | | | 783,148 | |
|
| Cable & Satellite–0.06% | |
Comcast Corp., 5.00% Sr. Unsec. Gtd. Pfd. | | | 2,600 | | | | 66,118 | |
|
| Consumer Finance–1.19% | |
Ally Financial Inc., Series A, 8.50% Pfd. | | | 11,400 | | | | 301,872 | |
Capital One Financial Corp., Series B, 6.00% Pfd. | | | 8,200 | | | | 197,948 | |
Capital One Financial Corp., Series C, 6.25% Pfd. | | | 4,300 | | | | 104,662 | |
Discover Financial Services, Series B, 6.50% Pfd. | | | 5,200 | | | | 133,484 | |
| | | | | | | | |
| | |
Shares | | | Value | |
| Consumer Finance–(continued) | |
GMAC Capital Trust I, Series 2, 8.13% Jr. Sub. Gtd. Pfd. | | | 20,100 | | | $ | 537,273 | |
Navient Corp., 6.00% Sr. Unsec. Pfd. | | | 4,200 | | | | 90,426 | |
| | | | | 1,365,665 | |
|
| Diversified Banks–10.19% | |
BAC Capital Trust VIII, 6.00% Jr. Unsec. Sub. Gtd. Pfd. | | | 5,500 | | | | 140,745 | |
Bank of America Corp., Series 3, 6.38% Pfd. | | | 18,400 | | | | 464,232 | |
Bank of America Corp., Series D, 6.20% Pfd. | | | 15,900 | | | | 399,567 | |
Bank of America Corp., Series I, 6.63% Pfd. | | | 18,651 | | | | 481,569 | |
Bank of America Corp., Series W, 6.25% Pfd. | | | 15,000 | | | | 379,350 | |
Barclays Bank PLC (United Kingdom), Series 4, 7.75% Pfd. | | | 21,900 | | | | 562,173 | |
Barclays Bank PLC (United Kingdom), Series 5, 8.13% Pfd. | | | 28,000 | | | | 722,680 | |
Citigroup Inc., Series J, 7.13% Pfd. | | | 10,100 | | | | 273,306 | |
Citigroup Inc., Series K, 6.88% Pfd. | | | 14,900 | | | | 398,724 | |
Citigroup Inc., Series L, 6.88% Pfd. | | | 7,500 | | | | 191,325 | |
Countrywide Capital V, 7.00% Jr. Sub. Gtd. Pfd. | | | 9,600 | | | | 245,568 | |
HSBC Holdings PLC (United Kingdom), Series 2, 8.00% Jr. Unsec. Sub. Pfd. | | | 72,000 | | | | 1,929,600 | |
JPMorgan Chase & Co., Series O, 5.50% Pfd. | | | 8,900 | | | | 205,501 | |
JPMorgan Chase & Co., Series P, 5.45% Pfd. | | | 12,300 | | | | 282,285 | |
JPMorgan Chase & Co., Series T, 6.70% Pfd. | | | 7,700 | | | | 198,121 | |
JPMorgan Chase & Co., Series W, 6.30% Pfd. | | | 9,200 | | | | 229,632 | |
JPMorgan Chase Capital XXIX, 6.70% Jr. Sub. Gtd. Pfd. | | | 7,200 | | | | 185,184 | |
Lloyds Banking Group PLC (United Kingdom), 7.75% Sr. Unsec. Pfd. | | | 8,100 | | | | 212,544 | |
RBS Capital Funding Trust VII (Netherlands), Series G, 6.08% Jr. Unsec. Sub. Gtd. Pfd. | | | 17,502 | | | | 423,373 | |
Royal Bank of Scotland Group PLC (The) (United Kingdom), Series L, 5.75% Jr. Sub. Pfd. | | | 18,201 | | | | 427,178 | |
Royal Bank of Scotland Group PLC (The) (United Kingdom), Series R, 6.13% Jr. Sub. Pfd. | | | 11,000 | | | | 264,440 | |
Royal Bank of Scotland Group PLC (The) (United Kingdom), Series S, 6.60% Jr. Sub. Pfd. | | | 15,900 | | | | 394,638 | |
Royal Bank of Scotland Group PLC (The) (United Kingdom), Series T, 7.25% Jr. Sub. Pfd. | | | 11,300 | | | | 286,455 | |
US Bancorp, Series F, 6.50% Pfd. | | | 22,400 | | | | 656,544 | |
Wells Fargo & Co., 5.20% Pfd. | | | 14,000 | | | | 325,220 | |
See accompanying Notes to Financial Statements which are an integral part of the financial statements.
19 Invesco Premium Income Fund
| | | | | | | | |
| | | Shares | | | Value | |
| Diversified Banks–(continued) | |
Wells Fargo & Co., 5.85% Pfd. | | | 8,400 | | | $ | 218,064 | |
Wells Fargo & Co., 6.63% Pfd. | | | 8,400 | | | | 235,788 | |
Wells Fargo & Co., Series J, 8.00% Pfd. | | | 6,500 | | | | 190,905 | |
Wells Fargo & Co., Series O, 5.13% Pfd. | | | 15,900 | | | | 366,654 | |
Wells Fargo & Co., Series P, 5.25% Pfd. | | | 5,400 | | | | 128,088 | |
Wells Fargo & Co., Series T, 6.00% Pfd. | | | 11,400 | | | | 284,772 | |
| | | | | 11,704,225 | |
|
| Diversified Capital Markets–1.34% | |
Deutsche Bank Contingent Capital Trust III (Germany), 7.60% Jr. Unsec. Sub. Gtd. Pfd. | | | 21,900 | | | | 600,279 | |
Deutsche Bank Contingent Capital Trust V (Germany), 8.05% Jr. Unsec. Sub. Gtd. Pfd. | | | 27,100 | | | | 763,407 | |
KKR Financial Holdings LLC, Series A, 7.38% Pfd. | | | 3,400 | | | | 88,400 | |
KKR Financial Holdings LLC., 8.38% Sr. Unsec. Pfd. | | | 3,200 | | | | 90,400 | |
| | | | | 1,542,486 | |
|
| Diversified REIT’s–0.40% | |
PS Business Parks, Inc., Series S, 6.45% Pfd. | | | 8,600 | | | | 223,342 | |
Vornado Realty Trust, Series J, 6.88% Pfd. | | | 8,800 | | | | 237,600 | |
| | | | | 460,942 | |
|
| Electric Utilities–1.12% | |
Alabama Power Co., 5.63% Pfd. | | | 3,500 | | | | 87,391 | |
BGE Capital Trust II, 6.20% Jr. Unsec. Sub. Gtd. Pfd. | | | 2,300 | | | | 58,765 | |
Duke Energy Corp., 5.13% Jr. Unsec. Sub. Pfd. | | | 4,500 | | | | 109,215 | |
Entergy Louisiana LLC, 5.25% Sr. Sec. First Mortgage Pfd. | | | 2,300 | | | | 57,500 | |
Entergy Mississippi Inc., 6.00% Sr. Sec. First Mortgage Pfd. | | | 4,300 | | | | 110,080 | |
Entergy Texas Inc., 5.63% Sr. Sec. Pfd. | | | 3,400 | | | | 87,074 | |
Interstate Power & Light Co., Series D, 5.10% Pfd. | | | 1,800 | | | | 45,180 | |
NextEra Energy Capital Holdings Inc., 5.00% Jr. Unsec. Sub. Gtd. Pfd. | | | 4,500 | | | | 100,305 | |
NextEra Energy Capital Holdings Inc., Series G, 5.70% Jr. Unsec. Sub. Gtd. Pfd. | | | 3,600 | | | | 90,684 | |
NextEra Energy Capital Holdings Inc., Series H, 5.63% Jr. Unsec. Sub. Gtd. Pfd. | | | 7,200 | | | | 179,784 | |
Pacific Gas & Electric Co., Series A, 6.00% Pfd. | | | 1,000 | | | | 28,100 | |
PPL Capital Funding, Inc., Series B, 5.90% Jr. Unsec. Sub. Gtd. Pfd. | | | 4,100 | | | | 99,835 | |
SCE Trust I, 5.63% Jr. Unsec. Sub. Pfd. | | | 7,900 | | | | 193,234 | |
SCE Trust III, 5.75% Jr. Unsec. Sub. Pfd. | | | 1,300 | | | | 35,152 | |
| | | | | 1,282,299 | |
| | | | | | | | |
| | | Shares | | | Value | |
| Health Care REIT’s–0.17% | |
Health Care REIT, Inc., Series J, 6.50% Pfd. | | | 2,600 | | | $ | 67,626 | |
Senior Housing Properties Trust, 5.63% Sr. Unsec. Pfd. | | | 3,200 | | | | 75,296 | |
Ventas Realty L.P. / Ventas Capital Corp., 5.45% Sr. Unsec. Gtd. Pfd. | | | 2,300 | | | | 56,649 | |
| | | | | 199,571 | |
|
| Hotel and Resort REIT’s–0.06% | |
Hospitality Properties Trust, Series D,
7.13% Pfd. | | | 2,600 | | | | 68,562 | |
|
| Industrial Conglomerates–0.37% | |
General Electric Capital Corp.,
4.70% Sr. Unsec. Pfd. | | | 5,400 | | | | 129,114 | |
4.88% Sr. Unsec. Pfd. | | | 7,500 | | | | 185,400 | |
4.88% Sr. Unsec. Pfd. | | | 4,500 | | | | 111,825 | |
| | | | | 426,339 | |
|
| Industrial Machinery–0.15% | |
Stanley Black & Decker Inc., 5.75% Jr. Unsec. Sub. Pfd. | | | 6,800 | | | | 171,836 | |
|
| Integrated Telecommunication Services–0.67% | |
Qwest Corp.,
6.13% Sr. Unsec. Pfd. | | | 5,000 | | | | 117,700 | |
7.00% Sr. Unsec. Pfd. | | | 3,600 | | | | 92,340 | |
7.00% Sr. Unsec. Pfd. | | | 4,500 | | | | 115,785 | |
7.38% Sr. Unsec. Pfd. | | | 7,000 | | | | 184,660 | |
7.50% Sr. Unsec. Pfd. | | | 5,400 | | | | 144,180 | |
Verizon Communications Inc., 5.90% Sr. Unsec. Pfd. | | | 4,500 | | | | 116,550 | |
| | | | | 771,215 | |
|
| Investment Banking & Brokerage–2.73% | |
BGC Partners Inc., 8.13% Sr. Unsec. Pfd. | | | 1,000 | | | | 27,340 | |
Charles Schwab Corp. (The), Series B, 6.00% Pfd. | | | 4,400 | | | | 112,420 | |
Goldman Sachs Group Inc. (The), Series K, 6.38% Pfd. | | | 11,500 | | | | 292,100 | |
Goldman Sachs Group, Inc. (The), 6.50% Sr. Unsec. Pfd. | | | 5,400 | | | | 145,260 | |
Goldman Sachs Group, Inc. (The), Series I, 5.95% Pfd. | | | 14,000 | | | | 336,700 | |
Goldman Sachs Group, Inc. (The), Series J, 5.50% Pfd. | | | 14,900 | | | | 356,557 | |
Morgan Stanley, 6.88% Pfd. | | | 16,000 | | | | 424,320 | |
Morgan Stanley, Series E, 7.13% Pfd. | | | 16,000 | | | | 436,160 | |
Morgan Stanley, Series G, 6.63% Pfd. | | | 3,400 | | | | 86,632 | |
Morgan Stanley, Series I, 6.38% Pfd. | | | 23,400 | | | | 589,914 | |
Morgan Stanley Capital Trust VI, 6.60% Jr. Unsec. Sub. Gtd. Pfd. | | | 6,800 | | | | 173,808 | |
Raymond James Financial Inc., 6.90% Sr. Unsec. Pfd. | | | 3,200 | | | | 86,400 | |
Stifel Financial Corp., 6.70% Sr. Unsec. Pfd. | | | 2,900 | | | | 73,544 | |
| | | | | 3,141,155 | |
See accompanying Notes to Financial Statements which are an integral part of the financial statements.
20 Invesco Premium Income Fund
| | | | | | | | |
| | | Shares | | | Value | |
| Life & Health Insurance–1.33% | |
Aegon N.V. (Netherlands), 6.38% Jr. Unsec. Sub. Pfd. | | | 7,500 | | | $ | 191,475 | |
Aegon N.V. (Netherlands), 8.00% Unsec. Sub. Pfd. | | | 9,600 | | | | 273,312 | |
Aflac Inc., 5.50% Jr. Unsec. Sub. Pfd. | | | 4,500 | | | | 111,600 | |
MetLife Inc., Series B, 6.50% Pfd. | | | 12,600 | | | | 326,970 | |
Principal Financial Group Inc., Series B, 6.52% Pfd. | | | 2,300 | | | | 58,880 | |
Protective Life Corp., 6.25% Sr. Unsec.
Sub. Pfd. | | | 4,900 | | | | 127,155 | |
Prudential Financial Inc., 5.70% Jr. Unsec. Sub. Pfd. | | | 5,900 | | | | 147,500 | |
Prudential Financial Inc., 5.75% Jr. Unsec. Sub. Pfd. | | | 5,400 | | | | 135,540 | |
Prudential PLC (United Kingdom), 6.75% Jr. Unsec. Sub. Pfd. | | | 5,000 | | | | 129,250 | |
Torchmark Corp., 5.88% Jr. Unsec. Sub. Pfd. | | | 1,100 | | | | 27,588 | |
| | | | | 1,529,270 | |
|
| Multi-Line Insurance–0.34% | |
American Financial Group Inc., 6.38% Sr. Unsec. Pfd. | | | 4,400 | | | | 115,456 | |
Aviva PLC (United Kingdom), 8.25% Sr. Unsec. Sub. Pfd. | | | 3,600 | | | | 100,872 | |
Hartford Financial Services Group Inc. (The), 7.88% Jr. Sub. Pfd. | | | 4,600 | | | | 139,288 | |
Kemper Corp., 7.38% Unsec. Sub. Pfd. | | | 1,200 | | | | 31,320 | |
| | | | | 386,936 | |
|
| Multi-Utilities–0.21% | |
DTE Energy Co., 6.50% Jr. Unsec. Sub. Pfd. | | | 4,300 | | | | 115,455 | |
Integrys Energy Group, Inc., 6.00% Jr. Unsec. Sub. Pfd. | | | 3,600 | | | | 94,032 | |
SCANA Corp., 7.70% Jr. Unsec. Sub. Pfd. | | | 1,400 | | | | 35,560 | |
| | | | | 245,047 | |
|
| Office REIT’s–0.39% | |
Alexandria Real Estate Equities Inc., Series E, 6.45% Pfd. | | | 1,200 | | | | 30,600 | |
Boston Properties, Inc., 5.25% Pfd. | | | 1,800 | | | | 43,470 | |
Digital Realty Trust, Inc., Series F, 6.63% Pfd. | | | 2,000 | | | | 50,460 | |
Digital Realty Trust, Inc., Series G, 5.88% Pfd. | | | 2,300 | | | | 52,670 | |
Digital Realty Trust, Inc., Series H, 7.38% Pfd. | | | 3,100 | | | | 82,801 | |
Equity Commonwealth, 5.75% Sr. Unsec. Pfd. | | | 4,100 | | | | 92,414 | |
Kilroy Realty Corp., Series G, 6.88% Pfd. | | | 900 | | | | 23,319 | |
Kilroy Realty Corp., Series H, 6.38% Pfd. | | | 900 | | | | 22,716 | |
SL Green Realty Corp., Series I, 6.50% Pfd. | | | 2,100 | | | | 53,550 | |
| | | | | 452,000 | |
| | | | | | | | |
| | | Shares | | | Value | |
| Office Services & Supplies–0.11% | |
Pitney Bowes Inc., 5.25% Sr. Unsec. Pfd. | | | 800 | | | $ | 21,104 | |
Pitney Bowes Inc., 6.70% Sr. Unsec. Pfd. | | | 4,100 | | | | 109,019 | |
| | | | | 130,123 | |
|
| Oil & Gas Refining & Marketing–0.08% | |
NuStar Logistics L.P., 7.63% Jr. Unsec. Sub. Gtd. Pfd. | | | 3,600 | | | | 95,904 | |
|
| Other Diversified Financial Services–1.37% | |
Citigroup Capital XIII, 7.88% Jr. Sub. Pfd. | | | 13,966 | | | | 371,775 | |
ING Groep NV (Netherlands),
6.38% Jr. Unsec. Sub. Pfd. | | | 32,700 | | | | 827,637 | |
7.38% Jr. Unsec. Sub. Pfd. | | | 14,500 | | | | 369,750 | |
| | | | | 1,569,162 | |
|
| Property & Casualty Insurance–0.98% | |
Allstate Corp. (The), 5.10% Unsec. Sub. Pfd. | | | 4,300 | | | | 105,694 | |
Allstate Corp. (The), 5.63% Pfd. | | | 2,800 | | | | 70,000 | |
Allstate Corp. (The), Series C, 6.75% Pfd. | | | 3,200 | | | | 86,368 | |
Allstate Corp. (The), Series E, 6.63% Pfd. | | | 6,200 | | | | 163,308 | |
Allstate Corp. (The), Series F, 6.25% Pfd. | | | 2,200 | | | | 57,728 | |
Arch Capital Group Ltd., Series C, 6.75% Pfd. | | | 2,900 | | | | 77,546 | |
Argo Group U.S. Inc., 6.50% Sr. Unsec.
Gtd. Pfd. | | | 1,300 | | | | 32,071 | |
Aspen Insurance Holdings Ltd.,
5.95% Pfd. | | | 2,300 | | | | 59,501 | |
7.25% Pfd. | | | 2,900 | | | | 76,763 | |
Assured Guaranty Municipal Holdings Inc., 6.25% Sr. Unsec. Gtd. Pfd. | | | 3,900 | | | | 98,280 | |
Axis Capital Holdings Ltd., Series C, 6.88% Pfd. | | | 5,400 | | | | 143,910 | |
Hanover Insurance Group, Inc. (The), 6.35% Jr. Unsec. Sub. Pfd. | | | 1,600 | | | | 39,296 | |
Selective Insurance Group, Inc., 5.88% Sr. Unsec. Pfd. | | | 1,600 | | | | 39,568 | |
W. R. Berkley Corp., 5.63% Jr. Unsec.
Sub. Pfd. | | | 3,200 | | | | 77,152 | |
| | | | | 1,127,185 | |
|
| Regional Banks–1.81% | |
BB&T Corp., 5.85% Pfd. | | | 6,800 | | | | 171,156 | |
BB&T Corp., Series E, 5.63% Pfd. | | | 15,900 | | | | 387,006 | |
City National Corp., Series C, 5.50% Pfd. | | | 2,500 | | | | 56,325 | |
Cullen/Frost Bankers, Inc., 5.38% Pfd. | | | 1,400 | | | | 33,334 | |
Fifth Third Bancorp, Series I, 6.63% Pfd. | | | 4,100 | | | | 111,233 | |
First Horizon National Corp., Series A, 6.20% Pfd. | | | 900 | | | | 21,735 | |
First Niagara Financial Group Inc., Series B, 8.63% Pfd. | | | 3,200 | | | | 89,280 | |
First Republic Bank, 5.50% Pfd. | | | 1,800 | | | | 41,022 | |
First Republic Bank, 7.00% Pfd. | | | 1,800 | | | | 48,564 | |
See accompanying Notes to Financial Statements which are an integral part of the financial statements.
21 Invesco Premium Income Fund
| | | | | | | | |
| | | Shares | | | Value | |
| Regional Banks–(continued) | |
First Republic Bank, Series A, 6.70% Pfd. | | | 2,100 | | | $ | 54,999 | |
First Republic Bank, Series B, 6.20% Pfd. | | | 2,200 | | | | 55,594 | |
FirstMerit Corp., Series A, 5.88% Pfd. | | | 900 | | | | 21,546 | |
FNB Corp., 7.25% Pfd. | | | 1,000 | | | | 27,240 | |
PNC Financial Services Group, Inc. (The), Series P, 6.13% Pfd. | | | 15,800 | | | | 430,392 | |
Regions Financial Corp., Series A, 6.38% Pfd. | | | 4,500 | | | | 113,040 | |
Regions Financial Corp., Series B, 6.38% Pfd. | | | 3,400 | | | | 87,040 | |
SunTrust Banks Inc., Series E, 5.88% Pfd. | | | 4,100 | | | | 98,154 | |
TCF Financial Corp., 7.50% Pfd. | | | 1,200 | | | | 32,112 | |
TCF Financial Corp., Series B, 6.45% Pfd. | | | 1,200 | | | | 29,964 | |
Texas Capital Bancshares, Inc., Series A, 6.50% Pfd. | | | 2,400 | | | | 59,688 | |
Webster Financial Corp., Series E, 6.40% Pfd. | | | 1,100 | | | | 27,214 | |
Zions Bancorp., Series F, 7.90% Pfd. | | | 2,872 | | | | 79,841 | |
| | | | | 2,076,479 | |
|
| Reinsurance–0.58% | |
Endurance Specialty Holdings Ltd., Series A, 7.75% Pfd. | | | 1,800 | | | | 47,862 | |
Endurance Specialty Holdings Ltd., Series B, 7.50% Pfd. | | | 2,100 | | | | 56,007 | |
Maiden Holdings Ltd., Series A, 8.25% Pfd. | | | 4,600 | | | | 117,806 | |
Montpelier Re Holdings Ltd. (Bermuda), Series A, 8.88% Pfd. | | | 1,400 | | | | 38,640 | |
PartnerRe Ltd., Series E, 7.25% Pfd. | | | 8,000 | | | | 219,040 | |
Reinsurance Group of America, Inc., 6.20% Sr. Unsec. Sub. Pfd. | | | 3,600 | | | | 100,548 | |
RenaissanceRe Holdings Ltd., Series E, 5.38% Pfd. | | | 3,600 | | | | 82,764 | |
| | | | | | | | 662,667 | |
|
| Retail REIT’s–0.57% | |
DDR Corp., Class J, 6.50% Pfd. | | | 3,200 | | | | 82,176 | |
Glimcher Realty Trust, 6.88% Pfd. | | | 2,000 | | | | 50,300 | |
Kimco Realty Corp., Series I, 6.00% Pfd. | | | 9,100 | | | | 231,777 | |
National Retail Properties Inc., Series D, 6.63% Pfd. | | | 5,200 | | | | 135,044 | |
Realty Income Corp., Series F, 6.63% Pfd. | | | 3,600 | | | | 97,092 | |
Regency Centers Corp., Series 6, 6.63% Pfd. | | | 2,300 | | | | 59,225 | |
| | | | | | | | 655,614 | |
|
| Specialized REIT’s–0.79% | |
EPR Properties, Series F, 6.63% Pfd. | | | 1,100 | | | | 27,500 | |
Public Storage, Series Q, 6.50% Pfd. | | | 19,600 | | | | 514,500 | |
| | | | | | | | |
| | | Shares | | | Value | |
| Specialized REIT’s–(continued) | |
Public Storage, Series Y, 6.38% Pfd. | | | 14,100 | | | $ | 364,485 | |
| | | | | | | | 906,485 | |
|
| Thrifts & Mortgage Finance–0.03% | |
Astoria Financial Corp., Series C, 6.50% Pfd. | | | 1,200 | | | | 29,676 | |
|
| Wireless Telecommunication Services–0.24% | |
Telephone & Data Systems Inc., 7.00%
Sr. Unsec. Pfd. | | | 7,800 | | | | 198,900 | |
United States Cellular Corp., 6.95%
Sr. Unsec. Pfd. | | | 3,100 | | | | 79,267 | |
| | | | | | | | 278,167 | |
Total Preferred Stocks
(Cost $30,617,348) | | | | 32,128,276 | |
| | |
| | | Principal
Amount | | | | |
U.S. Treasury Securities–7.29% | |
| U.S. Treasury Bills–0.13% | |
0.07%, 11/13/14(f) | | $ | 100,000 | | | | 99,981 | |
0.09%, 08/20/15(f) | | | 45,000 | | | | 44,992 | |
0.05%, 08/20/15(f) | | | 5,000 | | | | 4,999 | |
| | | | | | | | 149,972 | |
|
| U.S. Treasury STRIPS–7.16% | |
3.98%, 02/15/43(f)(g) | | | 15,550,000 | | | | 6,313,543 | |
4.11%, 02/15/43(f)(g) | | | 4,700,000 | | | | 1,908,273 | |
| | | | | | | | 8,221,816 | |
Total U.S. Treasury Securities
(Cost $6,729,734) | | | | 8,371,788 | |
|
Non-U.S. Dollar Denominated Bonds &
Notes–2.01%(h) | |
| Auto Parts & Equipment–0.14% | |
Autodis S.A. (France), Sr. Sec. Gtd. Notes, 6.50%, 02/01/19(b) | | EUR | 126,000 | | | | 155,525 | |
|
| Broadcasting–0.14% | |
CET 21 spol sro (Czech Republic), REGS, Sr. Sec. Gtd.
Euro Notes,
9.00%, 11/01/17(b) | | EUR | 120,000 | | | | 156,763 | |
|
| Electric Utilities–0.05% | |
Empresas Publicas de Medellin ESP (Colombia),
Sr. Unsec. Notes,
7.63%, 09/10/24(b) | | COP | 122,000,000 | | | | 59,518 | |
|
| Hotels, Resorts & Cruise Lines–0.19% | |
Thomas Cook Group PLC (United Kingdom), Sr. Unsec. Gtd. Medium-Term Euro Notes, 7.75%, 06/22/17 | | GBP | 57,000 | | | | 94,524 | |
TUI AG (Germany), Sr. Unsec. Notes, 4.50%, 10/01/19(b) | | EUR | 100,000 | | | | 128,533 | |
| | | | | | | | 223,057 | |
See accompanying Notes to Financial Statements which are an integral part of the financial statements.
22 Invesco Premium Income Fund
| | | | | | | | |
| | | Principal
Amount | | | Value | |
| Internet Software & Services–0.12% | |
Adria Bidco B.V. (Serbia), REGS, Sr. Sec. Gtd. Euro Notes, 7.88%, 11/15/20(b) | | EUR | 100,000 | | | $ | 132,202 | |
|
| Multi-Sector Holdings–0.19% | |
Odeon & UCI Finco PLC (United Kingdom), REGS, Sr. Sec. Gtd. Medium-Term Euro Notes, 9.00%, 08/01/18(b) | | GBP | 150,000 | | | | 217,173 | |
|
| Other Diversified Financial Services–0.41% | |
Cabot Financial Luxembourg S.A. (United Kingdom), REGS, Sr. Sec. Gtd. Euro Notes,
10.38%, 10/01/19(b) | | GBP | 100,000 | | | | 175,511 | |
Financiere Gaillon 8 SAS (France), Sr. Sec. Notes, 7.00%, 09/30/19(b) | | EUR | 100,000 | | | | 120,862 | |
Lowell Group Financing PLC (United Kingdom), REGS, Sr. Sec. Gtd. Euro Notes,
10.75%, 04/01/19(b) | | GBP | 100,000 | | | | 174,378 | |
| | | | | | | | 470,751 | |
|
| Publishing–0.13% | |
Johnston Press Bond PLC (United Kingdom), Sr. Sec. Notes, 8.63%, 06/01/19(b) | | GBP | 100,000 | | | | 149,581 | |
| | | | | | | | |
| | | Principal
Amount | | | Value | |
| Sovereign Debt–0.50% | |
Mexican Bonos (Mexico), Series M,
Sr. Unsec. Bonds, 7.75%, 05/29/31 | | MXN | 5,030,000 | | | $ | 417,188 | |
Unsec. Bonds, 8.00%, 06/11/20 | | MXN | 1,850,000 | | | | 156,318 | |
| | | | | | | | 573,506 | |
|
| Specialized Finance–0.14% | |
HSS Financing PLC (United Kingdom), REGS, Sr. Sec. Gtd. Euro Notes, 6.75%, 08/01/19(b) | | GBP | 100,000 | | | | 165,779 | |
Total Non-U.S. Dollar Denominated
Bonds & Notes
(Cost $2,495,109) | | | | 2,303,855 | |
| | |
| | | Shares | | | | |
Money Market Funds–8.03% | |
Liquid Assets Portfolio–Institutional Class(i) | | | 4,615,750 | | | | 4,615,750 | |
Premier Portfolio–Institutional Class(i) | | | 4,615,751 | | | | 4,615,751 | |
Total Money Market Funds
(Cost $9,231,501) | | | | 9,231,501 | |
TOTAL INVESTMENTS–99.29%
(Cost $110,441,413) | | | | 114,080,550 | |
OTHER ASSETS LESS LIABILITIES–0.71% | | | | 810,874 | |
NET ASSETS–100.00% | | | $ | 114,891,424 | |
Investment Abbreviations:
| | |
| Conv. | | – Convertible |
| COP | | – Colombian Peso |
| Ctfs. | | – Certificates |
| EUR | | – Euro |
| GBP | | – British Pound |
| Gtd. | | – Guaranteed |
| Jr. | | – Junior |
| MXN | | – Mexican Peso |
| Pfd. | | – Preferred |
| REGS | | – Regulation S |
| REIT | | – Real Estate Investment Trust |
| Sec. | | – Secured |
| Sr. | | – Senior |
| STRIPS | | – Separately Traded Registered Interest and Principal Security |
| Sub. | | – Subordinated |
| Unsec. | | – Unsecured |
Notes to Schedule of Investments:
| (a) | Industry and/or sector classifications used in this report are generally according to the Global Industry Classification Standard, which was developed by and is the exclusive property and a service mark of MSCI Inc. and Standard & Poor’s. |
| (b) | Security purchased or received in a transaction exempt from registration under the Securities Act of 1933, as amended (the “1933 Act”). The security may be resold pursuant to an exemption from registration under the 1933 Act, typically to qualified institutional buyers. The aggregate value of these securities at October 31, 2014 was $40,162,135, which represented 34.96% of the Fund’s Net Assets. |
| (c) | Step coupon bond. The interest rate represents the coupon rate at which the bond will accrue at a specified future date. |
| (d) | Perpetual bond with no specified maturity date. |
| (e) | Security has an irrevocable call by the issuer or mandatory put by the holder. Maturity date reflects such call or put. |
| (f) | Security traded on a discount basis. The interest rate shown represents the discount rate at the time of purchase by the Fund. |
| (g) | All or a portion of the value was pledged as collateral to cover margin requirements for open futures contracts. See Note 1K and Note 4. |
| (h) | Foreign denominated security. Principal amount is denominated in the currency indicated. |
| (i) | The money market fund and the Fund are affiliated by having the same investment adviser. |
See accompanying Notes to Financial Statements which are an integral part of the financial statements.
23 Invesco Premium Income Fund
Statement of Assets and Liabilities
October 31, 2014
| | | | |
Assets: | |
Investments, at value (Cost $101,209,912) | | $ | 104,849,049 | |
Investments in affiliated money market funds, at value and cost | | | 9,231,501 | |
Total investments, at value (Cost $110,441,413) | | | 114,080,550 | |
Foreign currencies, at value (Cost $34,280) | | | 33,896 | |
Receivable for: | | | | |
Deposits with brokers for open futures contracts | | | 200,000 | |
Investments sold | | | 107,952 | |
Variation margin — futures | | | 102,836 | |
Variation margin — centrally cleared swap agreements | | | 12,133 | |
Fund shares sold | | | 1,210,510 | |
Dividends and interest | | | 971,035 | |
Fund expenses absorbed | | | 8,856 | |
Forward foreign currency contracts outstanding | | | 55,317 | |
Investment for trustee deferred compensation and retirement plans | | | 21,224 | |
Other assets | | | 12,666 | |
Total assets | | | 116,816,975 | |
|
Liabilities: | |
Payable for: | | | | |
Investments purchased | | | 1,770,829 | |
Fund shares reacquired | | | 29,383 | |
Accrued fees to affiliates | | | 36,411 | |
Accrued trustees’ and officers’ fees and benefits | | | 2,047 | |
Accrued other operating expenses | | | 63,375 | |
Trustee deferred compensation and retirement plans | | | 23,506 | |
Total liabilities | | | 1,925,551 | |
Net assets applicable to shares outstanding | | $ | 114,891,424 | |
|
Net assets consist of: | |
Shares of beneficial interest | | $ | 117,698,093 | |
Undistributed net investment income | | | (112,914 | ) |
Undistributed net realized gain (loss) | | | (6,365,814 | ) |
Net unrealized appreciation | | | 3,672,059 | |
| | | $ | 114,891,424 | |
| | | | |
Net Assets: | |
Class A | | $ | 42,103,580 | |
Class C | | $ | 14,853,767 | |
Class R | | $ | 141,376 | |
Class Y | | $ | 6,725,007 | |
Class R5 | | $ | 10,385 | |
Class R6 | | $ | 51,057,309 | |
|
Shares outstanding, $0.01 par value per share,
with an unlimited number of shares authorized: | |
Class A | | | 4,061,167 | |
Class C | | | 1,434,159 | |
Class R | | | 13,642 | |
Class Y | | | 648,344 | |
Class R5 | | | 1,001 | |
Class R6 | | | 4,921,211 | |
Class A: | | | | |
Net asset value per share | | $ | 10.37 | |
Maximum offering price per share | | | | |
(Net asset value of $10.37 ¸ 94.50%) | | $ | 10.97 | |
Class C: | | | | |
Net asset value and offering price per share | | $ | 10.36 | |
Class R: | | | | |
Net asset value and offering price per share | | $ | 10.36 | |
Class Y: | | | | |
Net asset value and offering price per share | | $ | 10.37 | |
Class R5: | | | | |
Net asset value and offering price per share | | $ | 10.37 | |
Class R6: | | | | |
Net asset value and offering price per share | | $ | 10.37 | |
See accompanying Notes to Financial Statements which are an integral part of the financial statements.
24 Invesco Premium Income Fund
Statement of Operations
For the year ended October 31, 2014
| | | | |
Investment income: | |
Interest (net of foreign withholding taxes of $ 855) | | $ | 5,121,903 | |
Dividends (net of foreign withholding taxes of $1,217) | | | 2,923,962 | |
Dividends from affiliated money market funds | | | 3,712 | |
Total investment income | | | 8,049,577 | |
| |
Expenses: | | | | |
Advisory fees | | | 939,507 | |
Administrative services fees | | | 50,000 | |
Custodian fees | | | 33,701 | |
Distribution fees: | | | | |
Class A | | | 89,331 | |
Class C | | | 147,768 | |
Class R | | | 478 | |
Transfer agent fees — A, C, R and Y | | | 74,889 | |
Transfer agent fees — R6 | | | 598 | |
Trustees’ and officers’ fees and benefits | | | 27,568 | |
Registration and filing fees | | | 88,606 | |
Other | | | 165,684 | |
Total expenses | | | 1,618,130 | |
Less: Fees waived, expenses reimbursed and expense offset arrangement(s) | | | (468,477 | ) |
Net expenses | | | 1,149,653 | |
Net investment income | | | 6,899,924 | |
| |
Realized and unrealized gain (loss) from: | | | | |
Net realized gain (loss) from: | | | | |
Investment securities (includes net gains from securities sold to affiliates of $313,956 and net gains (losses) from a redemption-in-kind of ($418,000)) | | | 967,257 | |
Foreign currencies | | | (7,865 | ) |
Forward foreign currency contracts | | | (163,357 | ) |
Futures contracts | | | 130,430 | |
Swap agreements | | | 315,858 | |
| | | | 1,242,323 | |
Change in net unrealized appreciation (depreciation) of: | | | | |
Investment securities | | | 4,308,120 | |
Foreign currencies | | | (4,012 | ) |
Forward foreign currency contracts | | | 157,967 | |
Futures contracts | | | (299,627 | ) |
Swap agreements | | | (294,720 | ) |
| | | | 3,867,728 | |
Net realized and unrealized gain | | | 5,110,051 | |
Net increase in net assets resulting from operations | | $ | 12,009,975 | |
See accompanying Notes to Financial Statements which are an integral part of the financial statements.
25 Invesco Premium Income Fund
Statement of Changes in Net Assets
For the years ended October 31, 2014 and 2013
| | | | | | | | |
| | | 2014 | | | 2013 | |
Operations: | | | | | |
Net investment income | | $ | 6,899,924 | | | $ | 11,380,181 | |
Net realized gain (loss) | | | 1,242,323 | | | | (6,279,100 | ) |
Change in net unrealized appreciation (depreciation) | | | 3,867,728 | | | | (8,855,920 | ) |
Net increase (decrease) in net assets resulting from operations | | | 12,009,975 | | | | (3,754,839 | ) |
| | |
Distributions to shareholders from net investment income: | | | | | | | | |
Class A | | | (1,808,084 | ) | | | (2,764,656 | ) |
Class C | | | (638,928 | ) | | | (800,895 | ) |
Class R | | | (4,535 | ) | | | (4,422 | ) |
Class Y | | | (339,729 | ) | | | (551,082 | ) |
Class R5 | | | (543 | ) | | | (41,260 | ) |
Class R6 | | | (4,760,854 | ) | | | (8,290,751 | ) |
Total distributions from net investment income | | | (7,552,673 | ) | | | (12,453,066 | ) |
| | |
Distributions to shareholders from net realized gains: | | | | | | | | |
Class A | | | — | | | | (576,861 | ) |
Class C | | | — | | | | (186,656 | ) |
Class R | | | — | | | | (1,094 | ) |
Class Y | | | — | | | | (95,533 | ) |
Class R5 | | | — | | | | (14,633 | ) |
Class R6 | | | — | | | | (1,969,438 | ) |
Total distributions from net realized gains | | | — | | | | (2,844,215 | ) |
| | |
Share transactions–net: | | | | | | | | |
Class A | | | 560,935 | | | | 21,555,276 | |
Class C | | | (2,185,049 | ) | | | 7,848,956 | |
Class R | | | 87,569 | | | | 9,246 | |
Class Y | | | (920,949 | ) | | | 3,983,563 | |
Class R5 | | | — | | | | (677,776 | ) |
Class R6 | | | (122,825,649 | ) | | | 43,116,958 | |
Net increase (decrease) in net assets resulting from share transactions | | | (125,283,143 | ) | | | 75,836,223 | |
Net increase (decrease) in net assets | | | (120,825,841 | ) | | | 56,784,103 | |
| | |
Net assets: | | | | | | | | |
Beginning of year | | | 235,717,265 | | | | 178,933,162 | |
End of year (includes undistributed net investment income of $(112,914) and $(320,583), respectively) | | $ | 114,891,424 | | | $ | 235,717,265 | |
Notes to Financial Statements
October 31, 2014
NOTE 1—Significant Accounting Policies
Invesco Premium Income Fund (the “Fund”) is a series portfolio of AIM Investment Funds (Invesco Investment Funds) (the “Trust”). The Trust is organized as a Delaware statutory trust and is registered under the Investment Company Act of 1940, as amended (the “1940 Act”), as an open-end series management investment company consisting of twenty-four separate series portfolios, each authorized to issue an unlimited number of shares of beneficial interest. The assets, liabilities and operations of each portfolio are accounted for separately. Information presented in these financial statements pertains only to the Fund. Matters affecting each portfolio or class will be voted on exclusively by the shareholders of such portfolio or class.
The Fund’s investment objective is to provide current income.
The Fund currently consists of six different classes of shares: Class A, Class C, Class R, Class Y, Class R5 and Class R6. Class A shares are sold with a front-end sales charge unless certain waiver criteria are met and under certain circumstances load waived shares may be subject to contingent deferred sales charges (“CDSC”). Class C shares are sold with a CDSC. Class R, Class Y, Class R5 and Class R6 shares are sold at net asset value.
26 Invesco Premium Income Fund
The following is a summary of the significant accounting policies followed by the Fund in the preparation of its financial statements.
| A. | Security Valuations — Securities, including restricted securities, are valued according to the following policy. |
Debt obligations (including convertible securities) and unlisted equities are fair valued using an evaluated quote provided by an independent pricing service. Evaluated quotes provided by the pricing service may be determined without exclusive reliance on quoted prices, and may reflect appropriate factors such as institution-size trading in similar groups of securities, developments related to specific securities, dividend rate (for unlisted equities), yield (for debt obligations), quality, type of issue, coupon rate (for debt obligations), maturity (for debt obligations), individual trading characteristics and other market data. Debt obligations are subject to interest rate and credit risks. In addition, all debt obligations involve some risk of default with respect to interest and/or principal payments.
A security listed or traded on an exchange (except convertible securities) is valued at its last sales price or official closing price as of the close of the customary trading session on the exchange where the security is principally traded, or lacking any sales or official closing price on a particular day, the security may be valued at the closing bid price on that day. Securities traded in the over-the-counter market are valued based on prices furnished by independent pricing services or market makers. When such securities are valued by an independent pricing service they may be considered fair valued. Futures contracts are valued at the final settlement price set by an exchange on which they are principally traded. Listed options are valued at the mean between the last bid and ask prices from the exchange on which they are principally traded. Options not listed on an exchange are valued by an independent source at the mean between the last bid and ask prices. For purposes of determining net asset value per share, futures and option contracts generally are valued 15 minutes after the close of the customary trading session of the New York Stock Exchange (“NYSE”).
Investments in open-end and closed-end registered investment companies that do not trade on an exchange are valued at the end of day net asset value per share. Investments in open-end and closed-end registered investment companies that trade on an exchange are valued at the last sales price or official closing price as of the close of the customary trading session on the exchange where the security is principally traded.
Swap agreements are fair valued using an evaluated quote provided by an independent pricing service. Evaluated quotes provided by the pricing service are valued based on a model which may include end of day net present values, spreads, ratings, industry, and company performance.
Foreign securities’ (including foreign exchange contracts) prices are converted into U.S. dollar amounts using the applicable exchange rates as of the close of the NYSE. If market quotations are available and reliable for foreign exchange-traded equity securities, the securities will be valued at the market quotations. Because trading hours for certain foreign securities end before the close of the NYSE, closing market quotations may become unreliable. If between the time trading ends on a particular security and the close of the customary trading session on the NYSE, events occur that the Adviser determines are significant and make the closing price unreliable, the Fund may fair value the security. If the event is likely to have affected the closing price of the security, the security will be valued at fair value in good faith using procedures approved by the Board of Trustees. Adjustments to closing prices to reflect fair value may also be based on a screening process of an independent pricing service to indicate the degree of certainty, based on historical data, that the closing price in the principal market where a foreign security trades is not the current value as of the close of the NYSE. Foreign securities’ prices meeting the approved degree of certainty that the price is not reflective of current value will be priced at the indication of fair value from the independent pricing service. Multiple factors may be considered by the independent pricing service in determining adjustments to reflect fair value and may include information relating to sector indices, American Depositary Receipts and domestic and foreign index futures. Foreign securities may have additional risks including exchange rate changes, potential for sharply devalued currencies and high inflation, political and economic upheaval, the relative lack of issuer information, relatively low market liquidity and the potential lack of strict financial and accounting controls and standards.
Securities for which market prices are not provided by any of the above methods may be valued based upon quotes furnished by independent sources. The last bid price may be used to value equity securities. The mean between the last bid and ask prices is used to value debt obligations, including corporate loans.
Securities for which market quotations are not readily available or became unreliable are valued at fair value as determined in good faith by or under the supervision of the Trust’s officers following procedures approved by the Board of Trustees. Issuer specific events, market trends, bid/ask quotes of brokers and information providers and other market data may be reviewed in the course of making a good faith determination of a security’s fair value.
The Fund may invest in securities that are subject to interest rate risk, meaning the risk that the prices will generally fall as interest rates rise and, conversely, the prices will generally rise as interest rates fall. Specific securities differ in their sensitivity to changes in interest rates depending on their individual characteristics. Changes in interest rates may result in increased market volatility, which may affect the value and/or liquidity of certain of the Fund’s investments.
Valuations change in response to many factors including the historical and prospective earnings of the issuer, the value of the issuer’s assets, general economic conditions, interest rates, investor perceptions and market liquidity. Because of the inherent uncertainties of valuation, the values reflected in the financial statements may materially differ from the value received upon actual sale of those investments.
| B. | Securities Transactions and Investment Income — Securities transactions are accounted for on a trade date basis. Realized gains or losses on sales are computed on the basis of specific identification of the securities sold. Interest income (net of withholding tax, if any) is recorded on the accrual basis from settlement date. Paydown gains and losses on mortgage and asset-backed securities are recorded as adjustments to interest income. Dividend income (net of withholding tax, if any) is recorded on the ex-dividend date. Bond premiums and discounts are amortized and/or accreted for financial reporting purposes. |
The Fund may periodically participate in litigation related to Fund investments. As such, the Fund may receive proceeds from litigation settlements. Any proceeds received are included in the Statement of Operations as realized gain (loss) for investments no longer held and as unrealized gain (loss) for investments still held.
Brokerage commissions and mark ups are considered transaction costs and are recorded as an increase to the cost basis of securities purchased and/or a reduction of proceeds on a sale of securities. Such transaction costs are included in the determination of net realized and unrealized gain (loss) from investment securities reported in the Statement of Operations and the Statement of Changes in Net Assets and the net realized and unrealized gains (losses) on securities per share in the Financial Highlights. Transaction costs are included in the calculation of the Fund’s net asset value and, accordingly, they reduce the Fund’s total returns. These transaction costs are not considered operating expenses and
27 Invesco Premium Income Fund
are not reflected in net investment income reported in the Statement of Operations and Statement of Changes in Net Assets, or the net investment income per share and ratios of expenses and net investment income reported in the Financial Highlights, nor are they limited by any expense limitation arrangements between the Fund and the investment adviser.
The Fund allocates income and realized and unrealized capital gains and losses to a class based on the relative net assets of each class.
| C. | Country Determination — For the purposes of making investment selection decisions and presentation in the Schedule of Investments, the investment adviser may determine the country in which an issuer is located and/or credit risk exposure based on various factors. These factors include the laws of the country under which the issuer is organized, where the issuer maintains a principal office, the country in which the issuer derives 50% or more of its total revenues and the country that has the primary market for the issuer’s securities, as well as other criteria. Among the other criteria that may be evaluated for making this determination are the country in which the issuer maintains 50% or more of its assets, the type of security, financial guarantees and enhancements, the nature of the collateral and the sponsor organization. Country of issuer and/or credit risk exposure has been determined to be the United States of America, unless otherwise noted. |
| D. | Distributions — Distributions from net investment income, if any, are declared and paid monthly. Distributions from net realized capital gain, if any, are generally declared and paid annually and recorded on the ex-dividend date. The Fund may elect to treat a portion of the proceeds from redemptions as distributions for federal income tax purposes. |
| E. | Federal Income Taxes — The Fund intends to comply with the requirements of Subchapter M of the Internal Revenue Code of 1986, as amended (the “Internal Revenue Code”), necessary to qualify as a regulated investment company and to distribute substantially all of the Fund’s taxable earnings to shareholders. As such, the Fund will not be subject to federal income taxes on otherwise taxable income (including net realized capital gain) that is distributed to shareholders. Therefore, no provision for federal income taxes is recorded in the financial statements. |
The Fund recognizes the tax benefits of uncertain tax positions only when the position is more likely than not to be sustained. Management has analyzed the Fund’s uncertain tax positions and concluded that no liability for unrecognized tax benefits should be recorded related to uncertain tax positions. Management is not aware of any tax positions for which it is reasonably possible that the total amounts of unrecognized tax benefits will change materially in the next 12 months.
The Fund files tax returns in the U.S. Federal jurisdiction and certain other jurisdictions. Generally, the Fund is subject to examinations by such taxing authorities for up to three years after the filing of the return for the tax period.
| F. | Expenses — Fees provided for under the Rule 12b-1 plan of a particular class of the Fund are charged to the operations of such class. Transfer agency fees and expenses and other shareholder recordkeeping fees and expenses attributable to Class R5 and Class R6 are allocated to each share class based on relative net assets. Sub-accounting fees attributable to Class R5 are charged to the operations of the class. Transfer agency fees and expenses and other shareholder recordkeeping fees and expenses relating to all other classes are allocated among those classes based on relative net assets. All other expenses are allocated among the classes based on relative net assets. |
| G. | Accounting Estimates — The preparation of financial statements in conformity with accounting principles generally accepted in the United States of America (“GAAP”) requires management to make estimates and assumptions that affect the reported amounts of assets and liabilities at the date of the financial statements and the reported amounts of revenues and expenses during the reporting period including estimates and assumptions related to taxation. Actual results could differ from those estimates by a significant amount. In addition, the Fund monitors for material events or transactions that may occur or become known after the period-end date and before the date the financial statements are released to print. |
| H. | Indemnifications — Under the Trust’s organizational documents, each Trustee, officer, employee or other agent of the Trust is indemnified against certain liabilities that may arise out of the performance of their duties to the Fund. Additionally, in the normal course of business, the Fund enters into contracts, including the Fund’s servicing agreements, that contain a variety of indemnification clauses. The Fund’s maximum exposure under these arrangements is unknown as this would involve future claims that may be made against the Fund that have not yet occurred. The risk of material loss as a result of such indemnification claims is considered remote. |
| I. | Foreign Currency Translations — Foreign currency is valued at the close of the NYSE based on quotations posted by banks and major currency dealers. Portfolio securities and other assets and liabilities denominated in foreign currencies are translated into U.S. dollar amounts at date of valuation. Purchases and sales of portfolio securities (net of foreign taxes withheld on disposition) and income items denominated in foreign currencies are translated into U.S. dollar amounts on the respective dates of such transactions. The Fund does not separately account for the portion of the results of operations resulting from changes in foreign exchange rates on investments and the fluctuations arising from changes in market prices of securities held. The combined results of changes in foreign exchange rates and the fluctuation of market prices on investments (net of estimated foreign tax withholding) are included with the net realized and unrealized gain or loss from investments in the Statement of Operations. Reported net realized foreign currency gains or losses arise from (1) sales of foreign currencies, (2) currency gains or losses realized between the trade and settlement dates on securities transactions, and (3) the difference between the amounts of dividends, interest, and foreign withholding taxes recorded on the Fund’s books and the U.S. dollar equivalent of the amounts actually received or paid. Net unrealized foreign currency gains and losses arise from changes in the fair values of assets and liabilities, other than investments in securities at fiscal period end, resulting from changes in exchange rates. |
The Fund may invest in foreign securities, which may be subject to foreign taxes on income, gains on investments or currency repatriation, a portion of which may be recoverable. Foreign taxes, if any, are recorded based on the tax regulations and rates that exist in the foreign markets in which the Fund invests and are shown in the Statement of Operations.
| J. | Forward Foreign Currency Contracts — The Fund may engage in foreign currency transactions either on a spot (i.e. for prompt delivery and settlement) basis or through forward foreign currency contracts to manage or minimize currency or exchange rate risk. |
The Fund may also enter into forward foreign currency contracts for the purchase or sale of a security denominated in a foreign currency in order to “lock in” the U.S. dollar price of that security, or the Fund may also enter into forward foreign currency contracts that do not provide for physical settlement of the two currencies, but instead are settled by a single cash payment calculated as the difference between the agreed upon exchange rate and the spot rate at settlement based upon an agreed upon notional amount (non-deliverable forwards). The Fund will set aside liquid assets in an amount equal to daily mark-to-market obligation for forward foreign currency contracts.
A forward foreign currency contract is an obligation between two parties (“Counterparties”) to purchase or sell a specific currency for an agreed-upon price at a future date. The use of forward foreign currency contracts does not eliminate fluctuations in the price of the underlying
28 Invesco Premium Income Fund
securities the Fund owns or intends to acquire but establishes a rate of exchange in advance. Fluctuations in the value of these contracts are measured by the difference in the contract date and reporting date exchange rates and are recorded as unrealized appreciation (depreciation) until the contracts are closed. When the contracts are closed, realized gains (losses) are recorded. Realized and unrealized gains (losses) on the contracts are included in the Statement of Operations. The primary risks associated with forward foreign currency contracts include failure of the Counterparty to meet the terms of the contract and the value of the foreign currency changing unfavorably. These risks may be in excess of the amounts reflected in the Statement of Assets and Liabilities.
| K. | Futures Contracts — The Fund may enter into futures contracts to manage exposure to interest rate, equity and market price movements and/or currency risks. A futures contract is an agreement between two parties to purchase or sell a specified underlying security, currency or commodity (or delivery of a cash settlement price, in the case of an index future) for a fixed price at a future date. The Fund currently invests only in exchange-traded futures and they are standardized as to maturity date and underlying financial instrument. Initial margin deposits required upon entering into futures contracts are satisfied by the segregation of specific securities or cash as collateral at the futures commission merchant (broker). During the period the futures contracts are open, changes in the value of the contracts are recognized as unrealized gains or losses by recalculating the value of the contracts on a daily basis. Subsequent or variation margin payments are received or made depending upon whether unrealized gains or losses are incurred. These amounts are reflected as receivables or payables on the Statement of Assets and Liabilities. When the contracts are closed or expire, the Fund recognizes a realized gain or loss equal to the difference between the proceeds from, or cost of, the closing transaction and the Fund’s basis in the contract. The net realized gain (loss) and the change in unrealized gain (loss) on futures contracts held during the period is included on the Statement of Operations. The primary risks associated with futures contracts are market risk and the absence of a liquid secondary market. If the Fund were unable to liquidate a futures contract and/or enter into an offsetting closing transaction, the Fund would continue to be subject to market risk with respect to the value of the contracts and continue to be required to maintain the margin deposits on the futures contracts. Futures contracts have minimal Counterparty risk since the exchange’s clearinghouse, as Counterparty to all exchange-traded futures, guarantees the futures against default. Risks may exceed amounts recognized in the Statement of Assets and Liabilities. |
| L. | Swap Agreements — The Fund may enter into various swap transactions, including interest rate, total return, index, currency and credit default swap contracts (“CDS”) for investment purposes or to manage interest rate, currency or credit risk. Such transactions are agreements between two parties (“Counterparties”). A swap agreement may be negotiated bilaterally and traded over-the-counter (OTC) between two parties (‘uncleared/OTC”) or, in some instances, must be transacted through a future commission merchant (FCM) and cleared through a clearinghouse that serves as a central Counterparty (“centrally cleared swap”). These agreements may contain among other conditions, events of default and termination events, and various covenants and representations such as provisions that require the Fund to maintain a pre-determined level of net assets, and/or provide limits regarding the decline of the Fund’s NAV over specific periods of time. If the Fund were to trigger such provisions and have open derivative positions at that time, the Counterparty may be able to terminate such agreement and request immediate payment in an amount equal to the net liability positions, if any. |
Interest rate, total return, index, and currency swap agreements are two-party contracts entered into primarily to exchange the returns (or differentials in rates of returns) earned or realized on particular predetermined investments or instruments. The gross returns to be exchanged or “swapped” between the parties are calculated with respect to a notional amount, i.e., the return on or increase in value of a particular dollar amount invested at a particular interest rate or return of an underlying asset, in a particular foreign currency, or in a “basket” of securities representing a particular index.
In a centrally cleared swap, the Fund’s ultimate Counterparty is a central clearinghouse. The Fund initially will enter into centrally cleared swaps through an executing broker. When a Fund enters into a centrally cleared swap, it must deliver to the central Counterparty (via the FCM) an amount referred to as “initial margin.” Initial margin requirements are determined by the central Counterparty, but an FCM may require additional initial margin above the amount required by the central Counterparty. Initial margin deposits required upon entering into centrally cleared swaps are satisfied by cash or securities as collateral at the FCM. Securities deposited as initial margin are designated on the Schedule of Investments and cash deposited is recorded on the Statement of Assets and Liabilities. During the term of a cleared swap agreement, a “variation margin” amount may be required to be paid by the Fund or may be received by the Fund, based on the daily change in price of the underlying reference instrument subject to the swap agreement and is recorded as a receivable or payable for variation margin in the Statement of Assets and Liabilities until the centrally cleared swap is terminated at which time a realized gain or loss is recorded.
A CDS is an agreement between Counterparties to exchange the credit risk of an issuer. A buyer of a CDS is said to buy protection by paying a fixed payment over the life of the agreement and in some situations an upfront payment to the seller of the CDS. If a defined credit event occurs (such as payment default or bankruptcy), the Fund as a protection buyer would cease paying its fixed payment, the Fund would deliver eligible bonds issued by the reference entity to the seller, and the seller would pay the full notional value, or the “par value”, of the referenced obligation to the Fund. A seller of a CDS is said to sell protection and thus would receive a fixed payment over the life of the agreement and an upfront payment, if applicable. If a credit event occurs, the Fund as a protection seller would cease to receive the fixed payment stream, the Fund would pay the buyer “par value” or the full notional value of the referenced obligation, and the Fund would receive the eligible bonds issued by the reference entity. In turn, these bonds may be sold in order to realize a recovery value. Alternatively, the seller of the CDS and its Counterparty may agree to net the notional amount and the market value of the bonds and make a cash payment equal to the difference to the buyer of protection. If no credit event occurs, the Fund receives the fixed payment over the life of the agreement. As the seller, the Fund would effectively add leverage to its portfolio because, in addition to its total net assets, the Fund would be subject to investment exposure on the notional amount of the CDS. In connection with these agreements, cash and securities may be identified as collateral in accordance with the terms of the respective swap agreements to provide assets of value and recourse in the event of default under the swap agreement or bankruptcy/insolvency of a party to the swap agreement. If a Counterparty becomes bankrupt or otherwise fails to perform its obligations due to financial difficulties, the Fund may experience significant delays in obtaining any recovery in a bankruptcy or other reorganization proceeding. The Fund may obtain only limited recovery or may obtain no recovery in such circumstances. The Fund’s maximum risk of loss from Counterparty risk, either as the protection seller or as the protection buyer, is the value of the contract. The risk may be mitigated by having a master netting arrangement between the Fund and the Counterparty and by the designation of collateral by the Counterparty to cover the Fund’s exposure to the Counterparty.
29 Invesco Premium Income Fund
Implied credit spreads represent the current level at which protection could be bought or sold given the terms of the existing CDS contract and serve as an indicator of the current status of the payment/performance risk of the CDS. An implied spread that has widened or increased since entry into the initial contract may indicate a deteriorating credit profile and increased risk of default for the reference entity. A declining or narrowing spread may indicate an improving credit profile or decreased risk of default for the reference entity. Alternatively, credit spreads may increase or decrease reflecting the general tolerance for risk in the credit markets.
An interest rate swap is an agreement between Counterparties pursuant to which the parties exchange a floating rate payment for a fixed rate payment based on a specified notional amount.
Changes in the value of centrally cleared and OTC swap agreements are recognized as unrealized gains (losses) in the Statement of Operations by “marking to market” on a daily basis to reflect the value of the swap agreement at the end of each trading day. Payments received or paid at the beginning of the agreement are reflected as such on the Statement of Assets and Liabilities and may be referred to as upfront payments. The Fund accrues for the fixed payment stream and amortizes upfront payments, if any, on swap agreements on a daily basis with the net amount, recorded as a component of realized gain (loss) on the Statement of Operations. A liquidation payment received or made at the termination of a swap agreement is recorded as realized gain (loss) on the Statement of Operations. The Fund segregates liquid securities having a value at least equal to the amount of the potential obligation of a Fund under any swap transaction. Entering into these agreements involves, to varying degrees, lack of liquidity and elements of credit, market, and Counterparty risk in excess of amounts recognized on the Statement of Assets and Liabilities. Such risks involve the possibility that a swap is difficult to sell or liquidate; the Counterparty does not honor its obligations under the agreement and unfavorable interest rates and market fluctuations. It is possible that developments in the swaps market, including potential government regulation, could adversely affect the Fund’s ability to terminate existing swap agreements or to realize amounts to be received under such agreements.
Notional amounts of each individual credit default swap agreement outstanding as of October 31, 2014 for which the Fund is the seller of protection are disclosed in the Notes to Schedule of Investments. These potential amounts would be partially offset by any recovery values of the respective referenced obligations, upfront payments received upon entering into the agreement, or net amounts received from the settlement of buy protection credit default swap agreements entered into by the Fund for the same referenced entity or entities.
| M. | Other Risks — The Fund may invest in lower-quality debt securities, i.e., “junk bonds”. Investments in lower-rated securities or unrated securities of comparable quality tend to be more sensitive to economic conditions than higher rated securities. Junk bonds involve a greater risk of default by the issuer because such securities are generally unsecured and are often subordinated to other creditors’ claim. |
| N. | Leverage Risk — Leverage exists when a Fund can lose more than it originally invests because it purchases or sells an instrument or enters into a transaction without investing an amount equal to the full economic exposure of the instrument or transaction. |
| O. | Collateral — To the extent the Fund has designated or segregated a security as collateral and that security is subsequently sold, it is the Fund’s practice to replace such collateral no later than the next business day. |
NOTE 2—Advisory Fees and Other Fees Paid to Affiliates
The Trust has entered into a master investment advisory agreement with Invesco Advisers, Inc. (the “Adviser” or “Invesco”). Under the terms of the investment advisory agreement, the Fund pays an advisory fee to the Adviser based on the annual rate of the Fund’s average daily net assets as follows:
| | | | |
| Average Daily Net Assets | | Rate | |
First $500 million | | | 0.65% | |
Next $500 million | | | 0.60% | |
Next $500 million | | | 0.55% | |
Over $1.5 billion | | | 0.54% | |
For the year ended October 31, 2014, the effective advisory fees incurred by the Fund was 0.65%.
Under the terms of a master sub-advisory agreement between the Adviser and each of Invesco Asset Management Deutschland GmbH, Invesco Asset Management Limited, Invesco Asset Management (Japan) Limited, Invesco Australia Limited, Invesco Hong Kong Limited, Invesco Senior Secured Management, Inc., Invesco Canada Ltd. and Invesco PowerShares Capital Management LLC (collectively, the “Affiliated Sub-Advisers”) the Adviser, not the Fund, may pay 40% of the fees paid to the Adviser to any such Affiliated Sub-Adviser(s) that provide(s) discretionary investment management services to the Fund based on the percentage of assets allocated to such Sub-Adviser(s).
The Adviser has contractually agreed, through at least February 28, 2015, to waive advisory fees and/or reimburse expenses of all shares to the extent necessary to limit total annual fund operating expenses after fee waiver and/or expense reimbursement (excluding certain items discussed below) of Class A, Class C, Class R, Class Y, Class R5 and Class R6 shares to 0.89%, 1.64%, 1.14%, 0.64%, 0.64% and 0.64% respectively, of average daily net assets. In determining the Adviser’s obligation to waive advisory fees and/or reimburse expenses, the following expenses are not taken into account, and could cause the total annual fund operating expenses after fee waiver and/or expense reimbursement to exceed the numbers reflected above: (1) interest; (2) taxes; (3) dividend expense on short sales; (4) extraordinary or non-routine items, including litigation expenses; and (5) expenses that the Fund has incurred but did not actually pay because of an expense offset arrangement. Unless Invesco continues the fee waiver agreement, it will terminate on February 28, 2015. The fee waiver agreement cannot be terminated during its term.
Further, the Adviser has contractually agreed, through at least June 30, 2016, to waive the advisory fee payable by the Fund in an amount equal to 100% of the net advisory fees the Adviser receives from the affiliated money market funds on investments by the Fund of uninvested cash in such affiliated money market funds.
For the year ended October 31, 2014, the Adviser waived advisory fees of $392,990 and reimbursed class level expenses of $46,808, $19,357, $125, $8,475, $0 and $597 of Class A, Class C, Class R, Class Y, Class R5 and Class R6 shares, respectively.
The Trust has entered into a master administrative services agreement with Invesco pursuant to which the Fund has agreed to pay Invesco for certain administrative costs incurred in providing accounting services to the Fund. For the year ended October 31, 2014, expenses incurred under the agreement are shown in the Statement of Operations as Administrative services fees.
30 Invesco Premium Income Fund
The Trust has entered into a transfer agency and service agreement with Invesco Investment Services, Inc. (“IIS”) pursuant to which the Fund has agreed to pay IIS a fee for providing transfer agency and shareholder services to the Fund and reimburse IIS for certain expenses incurred by IIS in the course of providing such services. IIS may make payments to intermediaries that provide omnibus account services, sub-accounting services and/or networking services. All fees payable by IIS to intermediaries that provide omnibus account services or sub-accounting are charged back to the Fund, subject to certain limitations approved by the Trust’s Board of Trustees. For the year ended October 31, 2014, expenses incurred under the agreement are shown in the Statement of Operations as Transfer agent fees.
The Trust has entered into master distribution agreements with Invesco Distributors, Inc. (“IDI”) to serve as the distributor for the Class A, Class C, Class R, Class Y, Class R5 and Class R6 shares of the Fund. The Trust has adopted plans pursuant to Rule 12b-1 under the 1940 Act with respect to the Fund’s Class A, Class C and Class R shares (collectively the “Plans”). The Fund, pursuant to the Plans, pays IDI compensation at the annual rate of 0.25% of the Fund’s average daily net assets of Class A shares, 1.00% of the average daily net assets of Class C shares and 0.50% of the average daily net assets of Class R shares. Of the Plan payments, up to 0.25% of the average daily net assets of each class of shares may be paid to furnish continuing personal shareholder services to customers who purchase and own shares of such classes. Any amounts not paid as a service fee under the Plans would constitute an asset-based sales charge. Rules of the Financial Industry Regulatory Authority (“FINRA”) impose a cap on the total sales charges, including asset-based sales charges, that may be paid by any class of shares of the Fund. For the year ended October 31, 2014, expenses incurred under the Plans are shown in the Statement of Operations as Distribution fees.
Front-end sales commissions and CDSC (collectively, the “sales charges”) are not recorded as expenses of the Fund. Front-end sales commissions are deducted from proceeds from the sales of Fund shares prior to investment in Class A shares of the Fund. CDSC are deducted from redemption proceeds prior to remittance to the shareholder. During the year ended October 31, 2014, IDI advised the Fund that IDI retained $11,568 in front-end sales commissions from the sale of Class A shares and $1,066 and $6,664 from Class A and Class C shares, respectively, for CDSC imposed upon redemptions by shareholders.
Certain officers and trustees of the Trust are officers and directors of the Adviser, IIS and/or IDI.
NOTE 3—Additional Valuation Information
GAAP defines fair value as the price that would be received to sell an asset or paid to transfer a liability in an orderly transaction between market participants at the measurement date, under current market conditions. GAAP establishes a hierarchy that prioritizes the inputs to valuation methods, giving the highest priority to readily available unadjusted quoted prices in an active market for identical assets (Level 1) and the lowest priority to significant unobservable inputs (Level 3), generally when market prices are not readily available or are unreliable. Based on the valuation inputs, the securities or other investments are tiered into one of three levels. Changes in valuation methods may result in transfers in or out of an investment’s assigned level:
| | Level 1 — | Prices are determined using quoted prices in an active market for identical assets. |
| | Level 2 — | Prices are determined using other significant observable inputs. Observable inputs are inputs that other market participants may use in pricing a security. These may include quoted prices for similar securities, interest rates, prepayment speeds, credit risk, yield curves, loss severities, default rates, discount rates, volatilities and others. |
| | Level 3 — | Prices are determined using significant unobservable inputs. In situations where quoted prices or observable inputs are unavailable (for example, when there is little or no market activity for an investment at the end of the period), unobservable inputs may be used. Unobservable inputs reflect the Fund’s own assumptions about the factors market participants would use in determining fair value of the securities or instruments and would be based on the best available information. |
The following is a summary of the tiered valuation input levels, as of October 31, 2014. The level assigned to the securities valuations may not be an indication of the risk or liquidity associated with investing in those securities. Because of the inherent uncertainties of valuation, the values reflected in the financial statements may materially differ from the value received upon actual sale of those investments.
| | | | | | | | | | | | | | | | |
| | | Level 1 | | | Level 2 | | | Level 3 | | | Total | |
Equity Securities | | $ | 41,272,386 | | | $ | 87,391 | | | $ | — | | | $ | 41,359,777 | |
U.S. Treasury Securities | | | — | | | | 8,371,788 | | | | — | | | | 8,371,788 | |
Corporate Debt Securities | | | — | | | | 53,182,920 | | | | — | | | | 53,182,920 | |
Foreign Debt Securities | | | — | | | | 1,730,349 | | | | — | | | | 1,730,349 | |
Foreign Sovereign Debt Securities | | | — | | | | 9,435,716 | | | | — | | | | 9,435,716 | |
| | | | 41,272,386 | | | | 72,808,164 | | | | — | | | | 114,080,550 | |
Forward Foreign Currency Contracts* | | | — | | | | 55,317 | | | | — | | | | 55,317 | |
Futures Contracts* | | | 19,762 | | | | — | | | | — | | | | 19,762 | |
Swap Agreements* | | | — | | | | (40,844 | ) | | | — | | | | (40,844 | ) |
Total Investments | | $ | 41,292,148 | | | $ | 72,822,637 | | | $ | — | | | $ | 114,114,785 | |
| * | Unrealized appreciation (depreciation). |
31 Invesco Premium Income Fund
NOTE 4—Derivative Investments
Value of Derivative Investments at Period-End
The table below summarizes the value of the Fund’s derivative investments, detailed by primary risk exposure, held as of October 31, 2014:
| | | | | | | | |
| | | Value | |
| Risk Exposure/Derivative Type | | Assets | | | Liabilities | |
Credit risk: | | | | | | | | |
Swap agreements(a) | | $ | — | | | $ | (40,844 | ) |
Currency risk: | | | | | | | | |
Forward foreign currency contracts(b) | | | 55,317 | | | | — | |
Interest rate risk: | | | | | | | | |
Futures contracts(c) | | | 255,535 | | | | — | |
Market risk: | | | | | | | | |
Futures contracts(c) | | | 102,209 | | | | (337,982 | ) |
Total | | $ | 413,061 | | | $ | (378,826 | ) |
| (a) | Includes cumulative appreciation (depreciation) of centrally cleared swap agreements. Only current day’s variation margin receivable is reported within the Statement of Assets and Liabilities. |
| (b) | Values are disclosed on the Statement of Assets and Liabilities under the Forward foreign currency contracts outstanding. |
| (c) | Includes cumulative appreciation (depreciation) of futures contracts. Only current day’s variation margin receivable is reported within the Statement of Assets and Liabilities. |
Effect of Derivative Investments for the year ended October 31, 2014
The table below summarizes the gains (losses) on derivative investments, detailed by primary risk exposure, recognized in earnings during the period:
| | | | | | | | | | | | |
| | | Location of Gain (Loss) on
Statement of Operations | |
| | | Futures Contracts | | | Forward
Foreign Currency
Contracts | | | Swap Agreements | |
Realized Gain (Loss): | | | | | | | | | | | | |
Credit risk | | $ | — | | | $ | — | | | $ | 315,858 | |
Currency risk | | | — | | | | (163,357 | ) | | | — | |
Interest rate risk | | | 609,721 | | | | — | | | | — | |
Market risk | | | (479,291 | ) | | | — | | | | — | |
Change in Unrealized Appreciation (Depreciation): | | | | | | | | | | | | |
Credit risk | | | — | | | | — | | | | (294,720 | ) |
Currency risk | | | — | | | | 157,967 | | | | — | |
Interest rate risk | | | 129,140 | | | | — | | | | — | |
Market risk | | | (428,767 | ) | | | — | | | | — | |
Total | | $ | (169,197 | ) | | $ | (5,390 | ) | | $ | 21,138 | |
The table below summarizes the average notional value of futures contracts, forward foreign currency contracts and swap agreements outstanding during the period.
| | | | | | | | | | | | |
| | | Futures
Contracts | | | Forward
Foreign Currency
Contracts | | | Swap
Agreements | |
Average notional value | | $ | 23,957,285 | | | $ | 4,783,330 | | | $ | 5,541,667 | |
| | | | | | | | | | | | | | | | | | | | | | | | | | |
| Open Forward Foreign Currency Contracts | |
Settlement
Date | | Counterparty | | Contract to | | | Notional
Value | | | Unrealized
Appreciation | |
| | | Deliver | | | Receive | | | |
12/15/2014 | | Citigroup Global Markets Inc. | | | EUR | | | | 400,000 | | | | USD | | | | 527,200 | | | $ | 501,409 | | | $ | 25,791 | |
12/15/2014 | | Citigroup Global Markets Inc. | | | EUR | | | | 95,000 | | | | USD | | | | 121,088 | | | | 119,085 | | | | 2,003 | |
12/15/2014 | | RBC Capital Markets Corp. | | | GBP | | | | 485,000 | | | | USD | | | | 801,598 | | | | 775,641 | | | | 25,957 | |
12/15/2014 | | RBC Capital Markets Corp. | | | GBP | | | | 149,625 | | | | USD | | | | 240,856 | | | | 239,290 | | | | 1,566 | |
Total open forward foreign currency contracts — Currency Risk | | | | | | | | | | | | | | | | | | | $ | 55,317 | |
Currency Abbreviations:
| | |
| EUR | | – Euro |
| GBP | | – British Pound Sterling |
| USD | | – U.S. Dollar |
32 Invesco Premium Income Fund
| | | | | | | | | | | | | | | | | | | | |
| Open Futures Contracts(a) | |
| Futures Contracts | | Type of
Contract | | | Number of Contracts | | | Expiration Month | | | Notional Value | | | Unrealized Appreciation (Depreciation) | |
Australian 10 Year Bonds | | | Long | | | | 19 | | | | December-2014 | | | $ | 2,053,060 | | | $ | 32,921 | |
Canada 10 Year Bonds | | | Long | | | | 50 | | | | December-2014 | | | | 6,079,954 | | | | 33,881 | |
Euro Bond | | | Long | | | | 32 | | | | December-2014 | | | | 6,051,370 | | | | 31,974 | |
Japanese 10 Year Mini Bonds | | | Long | | | | 15 | | | | December-2014 | | | | 1,958,775 | | | | 9,749 | |
Long Gilt | | | Long | | | | 43 | | | | December-2014 | | | | 7,917,890 | | | | 115,457 | |
U.S. Treasury Long Bonds | | | Long | | | | 19 | | | | December-2014 | | | | 2,680,781 | | | | 31,553 | |
Subtotal — Interest Rate Risk | | | | | | | | | | | | | | | | | | $ | 255,535 | |
Dow Jones Eurostoxx 50 | | | Long | | | | 71 | | | | December-2014 | | | | 2,758,963 | | | $ | (48,582 | ) |
Hang Seng Index | | | Short | | | | 17 | | | | November-2014 | | | | (2,624,280 | ) | | | (75,493 | ) |
Russell 2000 Mini Index | | | Short | | | | 24 | | | | December-2014 | | | | (2,810,400 | ) | | | (213,907 | ) |
Tokyo Stock Price Index | | | Long | | | | 23 | | | | December-2014 | | | | 2,738,046 | | | | 102,209 | |
Subtotal — Market Risk | | | | | | | | | | | | | | | | | | $ | (235,773 | ) |
Total Futures Contracts | | | | | | | | | | | | | | | | | | $ | 19,762 | |
| (a) | Futures collateralized by $200,000 cash held with Goldman Sachs & Co., the futures commission merchant. |
| | | | | | | | | | | | | | | | | | | | | | | | | | | | | | |
| Total Open Centrally Cleared Credit Default Swap Agreements — Credit Risk | |
| Counterparty/Clearinghouse | | Reference Entity | | Buy/Sell
Protection | | | (Pay)/Receive
Fixed Rate | | | Expiration
Date | | | Implied
Credit
Spread(a) | | | Notional
Value | | | Upfront
Payments | | | Unrealized
Appreciation
(Depreciation) | |
Credit Suisse Securities (USA) LLC/CME | | Markit CDX North America, High Yield Index | | | Sell | | | | 5.00 | % | | | 06/20/2019 | | | | 3.18 | % | | $ | 2,970,000 | | | $ | (191,218 | ) | | $ | (40,844 | ) |
Abbreviations:
| | |
| CME | | – Chicago Mercantile Exchange |
| (a) | Implied credit spreads represent the current level as of October 31, 2014 at which protection could be bought or sold given the terms of the existing credit default swap contract and serve as an indicator of the current status of the payment/performance risk of the credit default swap contract. An implied credit spread that has widened or increased since entry into the initial contract may indicate a deteriorating credit profile and increased risk of default for the reference entity. A declining or narrowing spread may indicate an improving credit profile or decreased risk of default for the reference entity. Alternatively, credit spreads may increase or decrease reflecting the general tolerance for risk in the credit markets generally. |
Offsetting Assets and Liabilities
Accounting Standards Update (“ASU”) No. 2011-11, Disclosures about Offsetting Assets and Liabilities, which was subsequently clarified in Financial Accounting Standards Board ASU 2013-01 “Clarifying the Scope of Disclosures about Offsetting Assets and Liabilities” is intended to enhance disclosures about financial instruments and derivative instruments that are subject to offsetting arrangements on the Statement of Assets and Liabilities and to enable investors to better understand the effect of those arrangements on its financial position. In order for an arrangement to be eligible for netting, the Fund must have a basis to conclude that such netting arrangements are legally enforceable. The Fund enters into netting agreements and collateral agreements in an attempt to reduce the Fund’s Counterparty credit risk by providing for a single net settlement with a Counterparty of all financial transactions covered by the agreement in an event of default as defined under such agreement.
There were no derivative instruments subject to a netting agreement for which the Fund is not currently netting. The following tables present derivative instruments that are either subject to an enforceable netting agreement or offset by collateral arrangements as of October 31, 2014.
| | | | | | | | | | | | | | | | | | | | | | | | |
| Assets: | |
| | | Gross amounts
presented in
Statement of
Assets & Liabilities | | | Gross amounts
offset in
Statement of
Assets & Liabilities | | | Net amounts of assets
presented in the
Statement of Assets &
Liabilities | | | Collateral Received | | | | |
| Counterparty | | | | | Financial
Instruments | | | Cash | | | Net
Amount | |
Citigroup Global Markets Inc.(a) | | $ | 27,794 | | | $ | — | | | $ | 27,794 | | | $ | — | | | $ | — | | | $ | 27,794 | |
RBC Capital Markets Corp.(a) | | | 27,523 | | | | — | | | | 27,523 | | | | — | | | | — | | | | 27,523 | |
Total | | $ | 55,317 | | | $ | — | | | $ | 55,317 | | | $ | — | | | $ | — | | | $ | 55,317 | |
| | | | | | |
| | | | | | | | | | | | | | | | | | | | | | | | |
| Liabilities: | |
| | | Gross amounts
presented in
Statement of
Assets & Liabilities | | | Gross amounts
offset in
Statement of
Assets & Liabilities | | | Net amounts of liabilities
presented in the
Statement of Assets &
Liabilities | | | Collateral Pledged | | | | |
| Counterparty | | | | | Financial
Instruments | | | Cash | | | Net
Amount | |
Credit Suisse Securities (USA)
LLC/CME(b) | | $ | 232,062 | | | $ | — | | | $ | 232,062 | | | $ | 149,971 | | | $ | — | | | $ | 82,091 | |
| (a) | Forward foreign currency contracts counterparty. |
| (b) | Includes upfront payments and cumulative appreciation (depreciation) of centrally cleared swap agreements. |
33 Invesco Premium Income Fund
NOTE 5—Expense Offset Arrangement(s)
The expense offset arrangement is comprised of transfer agency credits which result from balances in demand deposit accounts used by the transfer agent for clearing shareholder transactions. For the year ended October 31, 2014, the Fund received credits from this arrangement, which resulted in the reduction of the Fund’s total expenses of $125.
NOTE 6—Security Transactions with Affiliated Funds
The Fund is permitted to purchase or sell securities from or to certain other Invesco Funds under specified conditions outlined in procedures adopted by the Board of Trustees of the Trust. The procedures have been designed to ensure that any purchase or sale of securities by the Fund from or to another fund or portfolio that is or could be considered an affiliate by virtue of having a common investment adviser (or affiliated investment advisers), common Trustees and/or common officers complies with Rule 17a-7 of the 1940 Act. Further, as defined under the procedures, each transaction is effected at the current market price. Pursuant to these procedures, for the year ended October 31, 2014, the Fund engaged in securities sales of $8,419,135, which resulted in net realized gains of $313,956.
NOTE 7—Trustees’ and Officers’ Fees and Benefits
Trustees’ and Officers’ Fees and Benefits include amounts accrued by the Fund to pay remuneration to certain Trustees and Officers of the Fund. Trustees have the option to defer compensation payable by the Fund, and Trustees’ and Officers’ Fees and Benefits also include amounts accrued by the Fund to fund such deferred compensation amounts. Those Trustees who defer compensation have the option to select various Invesco Funds in which their deferral accounts shall be deemed to be invested. Finally, certain current Trustees were eligible to participate in a retirement plan that provided for benefits to be paid upon retirement to Trustees over a period of time based on the number of years of service. The Fund may have certain former Trustees who also participate in a retirement plan and receive benefits under such plan. Trustees’ and Officers’ Fees and Benefits include amounts accrued by the Fund to fund such retirement benefits. Obligations under the deferred compensation and retirement plans represent unsecured claims against the general assets of the Fund.
NOTE 8—Cash Balances
The Fund is permitted to temporarily carry a negative or overdrawn balance in its account with State Street Bank and Trust Company, the custodian bank. Such balances, if any at period end, are shown in the Statement of Assets and Liabilities under the payable caption Amount due custodian. To compensate the custodian bank for such overdrafts, the overdrawn Fund may either (1) leave funds as a compensating balance in the account so the custodian bank can be compensated by earning the additional interest; or (2) compensate by paying the custodian bank at a rate agreed upon by the custodian bank and Invesco, not to exceed the contractually agreed upon rate.
NOTE 9—Distributions to Shareholders and Tax Components of Net Assets
Tax Character of Distributions to Shareholders Paid During the Years Ended October 31, 2014 and 2013:
| | | | | | | | |
| | | 2014 | | | 2013 | |
Ordinary income | | $ | 7,552,673 | | | $ | 14,555,377 | |
Long-term capital gain | | | — | | | | 741,904 | |
Total distributions | | $ | 7,552,673 | | | $ | 15,297,281 | |
Tax Components of Net Assets at Period-End:
| | | | |
| | | 2014 | |
Undistributed ordinary income | | $ | 64,753 | |
Net unrealized appreciation — investments | | | 3,269,316 | |
Net unrealized appreciation — other investments | | | 61,109 | |
Temporary book/tax differences | | | (20,848 | ) |
Capital loss carryforward | | | (6,180,999 | ) |
Shares of beneficial interest | | | 117,698,093 | |
Total net assets | | $ | 114,891,424 | |
The difference between book-basis and tax-basis unrealized appreciation (depreciation) is due to differences in the timing of recognition of gains and losses on investments for tax and book purposes. The Fund’s net unrealized appreciation difference is attributable primarily to wash sales and bond premiums.
The temporary book/tax differences are a result of timing differences between book and tax recognition of income and/or expenses. The Fund’s temporary book/tax differences are the result of the trustee deferral of compensation and retirement plan benefits.
Capital loss carryforward is calculated and reported as of a specific date. Results of transactions and other activity after that date may affect the amount of capital loss carryforward actually available for the Fund to utilize. Capital losses generated in years beginning after December 22, 2010 can be carried forward for an unlimited period, whereas previous losses expire in 8 tax years. Capital losses with an expiration period may not be used to offset capital gains until all net capital losses without an expiration date have been utilized. Capital loss carryforwards with no expiration date will retain their character as either short-term or long-term capital losses instead of as short-term capital losses as under prior law. The ability to utilize capital loss carryforward in the future may be limited under the Internal Revenue Code and related regulations based on the results of future transactions.
34 Invesco Premium Income Fund
The Fund utilized $1,773,885 of capital loss carryforward in the current period to offset net realized capital gain for federal income tax purposes. The Fund has a capital loss carryforward as of October 31, 2014, which expires as follows:
| | | | | | | | | | | | |
| Capital Loss Carryforward* | |
| Expiration | | Short-Term | | | Long-Term | | | Total | |
Not subject to expiration | | $ | 3,990,533 | | | $ | 2,190,466 | | | $ | 6,180,999 | |
| * | Capital loss carryforward as of the date listed above is reduced for limitations, if any, to the extent required by the Internal Revenue Code and may be further limited depending upon a variety of factors, including the realization of net unrealized gains or losses as of the date of any reorganization. |
On March 3, 2014, 13,334,409 of Class R6 shares valued at $135,228,909, were redeemed by a significant shareholder and settled through a redemption-in-kind transaction, of which $28,214,731 consisted of cash, which resulted in a realized gain (loss) of $(418,000) to the Fund for book purposes. From a federal income tax perspective, the realized losses are not recognized.
NOTE 10—Investment Securities
The aggregate amount of investment securities (other than short-term securities, U.S. Treasury obligations and money market funds, if any) purchased and sold by the Fund during the year ended October 31, 2014 was $122,149,689 and $227,116,170, respectively. During the same period, purchases and sales of U.S. Treasury obligations were $2,686,847 and $27,637,554, respectively. Cost of investments on a tax basis includes the adjustments for financial reporting purposes as of the most recently completed federal income tax reporting period-end.
| | | | |
| Unrealized Appreciation (Depreciation) of Investment Securities on a Tax Basis | |
Aggregate unrealized appreciation of investment securities | | $ | 4,251,466 | |
Aggregate unrealized (depreciation) of investment securities | | | (982,150 | ) |
Net unrealized appreciation of investment securities | | $ | 3,269,316 | |
Cost of investments for tax purposes is $110,811,234.
NOTE 11—Reclassification of Permanent Differences
Primarily as a result of differing book/tax treatment of swap income, bond premium amortization and redemption in kind, on October 31, 2014, undistributed net investment income was increased by $860,418, undistributed net realized gain (loss) was decreased by $197,626 and shares of beneficial interest was decreased by $662,792. This reclassification had no effect on the net assets of the Fund.
35 Invesco Premium Income Fund
NOTE 12—Share Information
| | | | | | | | | | | | | | | | |
| | | Summary of Share Activity | |
| | | Years ended October 31, | |
| | | 2014(a) | | | 2013 | |
| | | Shares | | | Amount | | | Shares | | | Amount | |
Sold: | | | | | | | | | | | | | | | | |
Class A | | | 1,674,041 | | | $ | 17,271,491 | | | | 7,327,011 | | | $ | 78,212,871 | |
Class C | | | 395,527 | | | | 4,043,695 | | | | 1,782,493 | | | | 18,908,415 | |
Class R | | | 8,385 | | | | 85,861 | | | | 6,300 | | | | 67,663 | |
Class Y | | | 999,906 | | | | 10,319,807 | | | | 1,365,574 | | | | 14,575,716 | |
Class R5 | | | — | | | | — | | | | 27,981 | | | | 303,296 | |
Class R6 | | | 1,318,479 | | | | 13,484,561 | | | | 3,874,010 | | | | 39,434,442 | |
| | | | |
Issued as reinvestment of dividends: | | | | | | | | | | | | | | | | |
Class A | | | 121,004 | | | | 1,228,961 | | | | 207,079 | | | | 2,159,053 | |
Class C | | | 44,317 | | | | 449,554 | | | | 60,353 | | | | 625,920 | |
Class R | | | 395 | | | | 4,044 | | | | 465 | | | | 4,834 | |
Class Y | | | 27,683 | | | | 281,703 | | | | 48,748 | | | | 506,194 | |
Class R5 | | | — | | | | — | | | | 4,950 | | | | 52,527 | |
Class R6 | | | 473,502 | | | | 4,760,854 | | | | 987,714 | | | | 10,260,189 | |
| | | | |
Reacquired: | | | | | | | | | | | | | | | | |
Class A | | | (1,769,874 | ) | | | (17,939,517 | ) | | | (5,748,979 | ) | | | (58,816,648 | ) |
Class C | | | (660,296 | ) | | | (6,678,298 | ) | | | (1,155,372 | ) | | | (11,685,379 | ) |
Class R | | | (223 | ) | | | (2,336 | ) | | | (6,283 | ) | | | (63,251 | ) |
Class Y | | | (1,116,824 | ) | | | (11,522,459 | ) | | | (1,090,069 | ) | | | (11,098,347 | ) |
Class R5 | | | — | | | | — | | | | (102,625 | ) | | | (1,033,599 | ) |
Class R6 | | | (13,919,440 | ) | | | (141,071,064 | ) | | | (620,075 | ) | | | (6,577,673 | ) |
Net increase (decrease) in share activity | | | (12,403,418 | ) | | $ | (125,283,143 | ) | | | 6,969,275 | | | $ | 75,836,223 | |
| (a) | There are entities that are record owners of more than 5% of the outstanding shares of the Fund and in the aggregate own 36% of the outstanding shares of the Fund. IDI has an agreement with these entities to sell Fund shares. The Fund, Invesco and/or Invesco affiliates may make payments to these entities, which are considered to be related to the Fund, for providing services to the Fund, Invesco and/or Invesco affiliates including but not limited to services such as securities brokerage, distribution, third party record keeping and account servicing. The Fund has no knowledge as to whether all or any portion of the shares owned of record by these entities are also owned beneficially. |
| | In addition, 44% of the outstanding shares of the Fund are owned by affiliated mutual funds. Affiliated mutual funds are other mutual funds that are also advised by Invesco. |
36 Invesco Premium Income Fund
NOTE 13—Financial Highlights
The following schedule presents financial highlights for a share of the Fund outstanding throughout the periods indicated.
| | | | | | | | | | | | | | | | | | | | | | | | | | | | | | | | | | | | | | | | | | | | | | | | | | | | | | | | |
| | | Net asset
value,
beginning
of period | | | Net
investment
income(a) | | | Net gains
(losses)
on securities
(both
realized and
unrealized) | | | Total from
investment
operations | | | Dividends
from net
investment
income | | | Distributions
from net
realized
gains | | | Total
distributions | | | Net asset
value, end
of period | | | Total
return(b) | | | Net assets,
end of period
(000’s omitted) | | | Ratio of
expenses
to average
net assets
with fee waivers
and/or expenses
absorbed | | | Ratio of
expenses
to average net
assets without
fee waivers
and/or expenses
absorbed | | | Ratio of net
investment
income
to average
net assets | | | Portfolio
turnover(c) | |
Class A | |
Year ended 10/31/14 | | $ | 10.04 | | | $ | 0.48 | | | $ | 0.37 | | | $ | 0.85 | | | $ | (0.52 | ) | | $ | — | | | $ | (0.52 | ) | | $ | 10.37 | | | | 8.66 | % | | $ | 42,104 | | | | 0.88 | %(d) | | | 1.28 | %(d) | | | 4.69 | %(d) | | | 89 | % |
Year ended 10/31/13 | | | 10.83 | | | | 0.50 | | | | (0.58 | ) | | | (0.08 | ) | | | (0.55 | ) | | | (0.16 | ) | | | (0.71 | ) | | | 10.04 | | | | (0.83 | ) | | | 40,515 | | | | 0.88 | | | | 1.22 | | | | 4.83 | | | | 86 | |
Year ended 10/31/12(e) | | | 10.03 | | | | 0.43 | | | | 0.81 | | | | 1.24 | | | | (0.44 | ) | | | — | | | | (0.44 | ) | | | 10.83 | | | | 12.64 | | | | 24,388 | | | | 0.88 | (f) | | | 1.18 | (f) | | | 4.54 | (f) | | | 79 | |
Class C | | | | | | | | | | | | | | | | | | | | | | | | | | | | | | | | | | | | | | | | | | | | | | | | | | | | | | | | |
Year ended 10/31/14 | | | 10.03 | | | | 0.40 | | | | 0.37 | | | | 0.77 | | | | (0.44 | ) | | | — | | | | (0.44 | ) | | | 10.36 | | | | 7.85 | | | | 14,854 | | | | 1.63 | (d) | | | 2.03 | (d) | | | 3.94 | (d) | | | 89 | |
Year ended 10/31/13 | | | 10.82 | | | | 0.42 | | | | (0.58 | ) | | | (0.16 | ) | | | (0.47 | ) | | | (0.16 | ) | | | (0.63 | ) | | | 10.03 | | | | (1.58 | ) | | | 16,592 | | | | 1.63 | | | | 1.97 | | | | 4.08 | | | | 86 | |
Year ended 10/31/12(e) | | | 10.03 | | | | 0.36 | | | | 0.81 | | | | 1.17 | | | | (0.38 | ) | | | — | | | | (0.38 | ) | | | 10.82 | | | | 11.91 | | | | 10,469 | | | | 1.63 | (f) | | | 1.93 | (f) | | | 3.79 | (f) | | | 79 | |
Class R | | | | | | | | | | | | | | | | | | | | | | | | | | | | | | | | | | | | | | | | | | | | | | | | | | | | | | | | |
Year ended 10/31/14 | | | 10.03 | | | | 0.46 | | | | 0.36 | | | | 0.82 | | | | (0.49 | ) | | | — | | | | (0.49 | ) | | | 10.36 | | | | 8.39 | | | | 141 | | | | 1.13 | (d) | | | 1.53 | (d) | | | 4.44 | (d) | | | 89 | |
Year ended 10/31/13 | | | 10.83 | | | | 0.47 | | | | (0.59 | ) | | | (0.12 | ) | | | (0.52 | ) | | | (0.16 | ) | | | (0.68 | ) | | | 10.03 | | | | (1.17 | ) | | | 51 | | | | 1.13 | | | | 1.47 | | | | 4.58 | | | | 86 | |
Year ended 10/31/12(e) | | | 10.03 | | | | 0.40 | | | | 0.82 | | | | 1.22 | | | | (0.42 | ) | | | — | | | | (0.42 | ) | | | 10.83 | | | | 12.43 | | | | 50 | | | | 1.13 | (f) | | | 1.43 | (f) | | | 4.29 | (f) | | | 79 | |
Class Y | | | | | | | | | | | | | | | | | | | | | | | | | | | | | | | | | | | | | | | | | | | | | | | | | | | | | | | | |
Year ended 10/31/14 | | | 10.05 | | | | 0.51 | | | | 0.35 | | | | 0.86 | | | | (0.54 | ) | | | — | | | | (0.54 | ) | | | 10.37 | | | | 8.82 | | | | 6,725 | | | | 0.63 | (d) | | | 1.03 | (d) | | | 4.94 | (d) | | | 89 | |
Year ended 10/31/13 | | | 10.84 | | | | 0.53 | | | | (0.58 | ) | | | (0.05 | ) | | | (0.58 | ) | | | (0.16 | ) | | | (0.74 | ) | | | 10.05 | | | | (0.57 | ) | | | 7,409 | | | | 0.63 | | | | 0.97 | | | | 5.08 | | | | 86 | |
Year ended 10/31/12(e) | | | 10.03 | | | | 0.45 | | | | 0.82 | | | | 1.27 | | | | (0.46 | ) | | | — | | | | (0.46 | ) | | | 10.84 | | | | 12.96 | | | | 4,482 | | | | 0.63 | (f) | | | 0.93 | (f) | | | 4.79 | (f) | | | 79 | |
Class R5 | | | | | | | | | | | | | | | | | | | | | | | | | | | | | | | | | | | | | | | | | | | | | | | | | | | | | | | | |
Year ended 10/31/14 | | | 10.05 | | | | 0.50 | | | | 0.36 | | | | 0.86 | | | | (0.54 | ) | | | — | | | | (0.54 | ) | | | 10.37 | | | | 8.82 | | | | 10 | | | | 0.63 | (d) | | | 0.90 | (d) | | | 4.94 | (d) | | | 89 | |
Year ended 10/31/13 | | | 10.84 | | | | 0.54 | | | | (0.59 | ) | | | (0.05 | ) | | | (0.58 | ) | | | (0.16 | ) | | | (0.74 | ) | | | 10.05 | | | | (0.57 | ) | | | 10 | | | | 0.63 | | | | 0.90 | | | | 5.08 | | | | 86 | |
Year ended 10/31/12(e) | | | 10.03 | | | | 0.44 | | | | 0.83 | | | | 1.27 | | | | (0.46 | ) | | | — | | | | (0.46 | ) | | | 10.84 | | | | 12.96 | | | | 766 | | | | 0.63 | (f) | | | 0.85 | (f) | | | 4.79 | (f) | | | 79 | |
Class R6 | | | | | | | | | | | | | | | | | | | | | | | | | | | | | | | | | | | | | | | | | | | | | | | | | | | | | | | | |
Year ended 10/31/14 | | | 10.04 | | | | 0.50 | | | | 0.37 | | | | 0.87 | | | | (0.54 | ) | | | — | | | | (0.54 | ) | | | 10.37 | | | | 8.93 | | | | 51,057 | | | | 0.63 | (d) | | | 0.90 | (d) | | | 4.94 | (d) | | | 89 | |
Year ended 10/31/13 | | | 10.84 | | | | 0.53 | | | | (0.59 | ) | | | (0.06 | ) | | | (0.58 | ) | | | (0.16 | ) | | | (0.74 | ) | | | 10.04 | | | | (0.67 | ) | | | 171,140 | | | | 0.63 | | | | 0.85 | | | | 5.08 | | | | 86 | |
Year ended 10/31/12(e) | | | 10.75 | | | | 0.05 | | | | 0.09 | | | | 0.14 | | | | (0.05 | ) | | | — | | | | (0.05 | ) | | | 10.84 | | | | 1.31 | | | | 138,779 | | | | 0.63 | (f) | | | 0.82 | (f) | | | 4.79 | (f) | | | 79 | |
| (a) | Calculated using average shares outstanding. |
| (b) | Includes adjustments in accordance with accounting principles generally accepted in the United States of America and as such, the net asset value for financial reporting purposes and the returns based upon those net asset values may differ from the net asset value and returns for shareholder transactions. Does not include sales charges and is not annualized for periods less than one year, if applicable. |
| (c) | Portfolio turnover is calculated at the fund level and is not annualized for periods less than one year, if applicable. |
| (d) | Ratios are based on average daily net assets (000’s omitted) of $35,732, $14,777, $96, $6,469, $10 and $87,455 for Class A, Class C, Class R, Class Y, Class R5 and Class R6 shares, respectively. |
| (e) | Commencement date of December 14, 2011 for Class A, Class C, Class R, Class Y and Class R5 shares and September 24, 2012 for Class R6 shares. |
37 Invesco Premium Income Fund
Report of Independent Registered Public Accounting Firm
To the Board of Trustees of AIM Investment Funds (Invesco Investment Funds)
and Shareholders of Invesco Premium Income Fund:
In our opinion, the accompanying statement of assets and liabilities, including the schedule of investments, and the related statements of operations and of changes in net assets and the financial highlights present fairly, in all material respects, the financial position of Invesco Premium Income Fund (one of the funds constituting AIM Investment Funds (Invesco Investment Funds), hereafter referred to as the “Fund”) at October 31, 2014, the results of its operations for the year then ended, the changes in its net assets for each of the two years in the period then ended and the financial highlights for each of the two years in the period then ended and for the period December 14, 2011 (commencement of operations) through October 31, 2012, in conformity with accounting principles generally accepted in the United States of America. These financial statements and financial highlights (hereafter referred to as “financial statements”) are the responsibility of the Fund’s management. Our responsibility is to express an opinion on these financial statements based on our audits. We conducted our audits of these financial statements in accordance with the standards of the Public Company Accounting Oversight Board (United States). Those standards require that we plan and perform the audit to obtain reasonable assurance about whether the financial statements are free of material misstatement. An audit includes examining, on a test basis, evidence supporting the amounts and disclosures in the financial statements, assessing the accounting principles used and significant estimates made by management, and evaluating the overall financial statement presentation. We believe that our audits, which included confirmation of securities at October 31, 2014 by correspondence with the custodian and brokers, and the application of alternative auditing procedures where confirmations of security purchases have not been received, provide a reasonable basis for our opinion.
PRICEWATERHOUSECOOPERS LLP
December 29, 2014
Houston, Texas
38 Invesco Premium Income Fund
Calculating your ongoing Fund expenses
Example
As a shareholder of the Fund, you incur two types of costs: (1) transaction costs, which may include sales charges (loads) on purchase payments or contingent deferred sales charges on redemptions, if any; and (2) ongoing costs, including management fees, distribution and/or service (12b-1) fees, and other Fund expenses. This example is intended to help you understand your ongoing costs (in dollars) of investing in the Fund and to compare these costs with ongoing costs of investing in other mutual funds. The example is based on an investment of $1,000 invested at the beginning of the period and held for the entire period May 1, 2014 through October 31, 2014.
Actual expenses
The table below provides information about actual account values and actual expenses. You may use the information in this table, together with the amount you invested, to estimate the expenses that you paid over the period. Simply divide your account value by $1,000 (for example, an $8,600 account value divided by $1,000 = 8.6), then multiply the result by the number in the table under the heading entitled “Actual Expenses Paid During Period” to estimate the expenses you paid on your account during this period.
Hypothetical example for comparison purposes
The table below also provides information about hypothetical account values and hypothetical expenses based on the Fund’s actual expense ratio and an assumed rate of return of 5% per year before expenses, which is not the Fund’s actual return.
The hypothetical account values and expenses may not be used to estimate the actual ending account balance or expenses you paid for the period. You may use this information to compare the ongoing costs of investing in the Fund and other funds. To do so, compare this 5% hypothetical example with the 5% hypothetical examples that appear in the shareholder reports of the other funds.
Please note that the expenses shown in the table are meant to highlight your ongoing costs only and do not reflect any transaction costs, such as sales charges (loads) on purchase payments or contingent deferred sales charges on redemptions, if any. Therefore, the hypothetical information is useful in comparing ongoing costs only, and will not help you determine the relative total costs of owning different funds. In addition, if these transaction costs were included, your costs would have been higher.
| | | | | | | | | | | | | | | | | | | | | | | | |
| Class | | Beginning
Account Value
(05/01/14) | | | ACTUAL | | | HYPOTHETICAL
(5% annual return before
expenses) | | | Annualized
Expense
Ratio | |
| | | Ending
Account Value
(10/31/14)1 | | | Expenses
Paid During
Period2 | | | Ending
Account Value
(10/31/14) | | | Expenses
Paid During
Period2 | | |
| A | | $ | 1,000.00 | | | $ | 1,034.70 | | | $ | 4.51 | | | $ | 1,020.77 | | | $ | 4.48 | | | | 0.88 | % |
| C | | | 1,000.00 | | | | 1,030.90 | | | | 8.34 | | | | 1,016.99 | | | | 8.29 | | | | 1.63 | |
| R | | | 1,000.00 | | | | 1,033.40 | | | | 5.79 | | | | 1,019.51 | | | | 5.75 | | | | 1.13 | |
| Y | | | 1,000.00 | | | | 1,036.00 | | | | 3.23 | | | | 1,022.03 | | | | 3.21 | | | | 0.63 | |
| R5 | | | 1,000.00 | | | | 1,036.00 | | | | 3.23 | | | | 1,022.03 | | | | 3.21 | | | | 0.63 | |
| R6 | | | 1,000.00 | | | | 1,036.00 | | | | 3.23 | | | | 1,022.03 | | | | 3.21 | | | | 0.63 | |
| 1 | The actual ending account value is based on the actual total return of the Fund for the period May 1, 2014 through October 31, 2014, after actual expenses and will differ from the hypothetical ending account value which is based on the Fund’s expense ratio and a hypothetical annual return of 5% before expenses. |
| 2 | Expenses are equal to the Fund’s annualized expense ratio as indicated above multiplied by the average account value over the period, multiplied by 184/365 to reflect the most recent fiscal half year. |
39 Invesco Premium Income Fund
Approval of Investment Advisory and Sub-Advisory Contracts
The Board of Trustees (the Board) of AIM Investment Funds (Invesco Investment Funds) is required under the Investment Company Act of 1940, as amended, to approve annually the renewal of Invesco Premium Income Fund’s (the Fund) investment advisory agreements. During contract renewal meetings held on June 16-17, 2014, the Board as a whole, and the disinterested or “independent” Trustees, who comprise over 75% of the Board, voting separately, approved the continuance for the Fund of the Master Investment Advisory Agreement with Invesco Advisers, Inc. (Invesco Advisers and the investment advisory agreement) and the Master Intergroup Sub-Advisory Contract for Mutual Funds with Invesco Asset Management Deutschland GmbH, Invesco Asset Management Limited, Invesco Asset Management (Japan) Limited, Invesco Australia Limited, Invesco Hong Kong Limited, Invesco Senior Secured Management, Inc., Invesco Canada Ltd. and Invesco PowerShares Capital Management LLC (collectively, the Affiliated Sub-Advisers and the sub-advisory contracts) for another year, effective July 1, 2014.
In evaluating the fairness and reasonableness of compensation under the Fund’s investment advisory agreement and sub-advisory contracts, the Board considered, among other things, the factors discussed below. The Board determined that continuation of the Fund’s investment advisory agreement and the sub-advisory contracts are in the best interest of the Fund and its shareholders and that the compensation payable to Invesco Advisers and the Affiliated Sub-Advisers under the agreements is fair and reasonable.
The Board’s Fund Evaluation Process
The Board’s Investments Committee has established three Sub-Committees, each of which is primarily responsible for overseeing the management of a number of the funds advised by Invesco Advisers (the Invesco Funds). The Sub-Committees meet throughout the year to review the performance of their assigned Invesco Funds, including reviewing materials prepared under the direction of the independent Senior Officer, an officer of the Invesco Funds who reports directly to the independent Trustees. Over the course of each year, the Sub-Committees meet with portfolio managers for their assigned Invesco Funds and other members of management to review the performance, investment objective(s), policies, strategies, limitations and investment risks of these funds. The Sub-Committees meet regularly and at designated contract renewal meetings each year to conduct a review of the performance, fees, expenses and other matters related to their assigned Invesco Funds. Each Sub-Committee recommends to the Investments Committee, which in turn recommends to the full Board, whether and on what terms to
approve the continuance of each Invesco Fund’s investment advisory agreement and sub-advisory contracts for another year.
During the contract renewal process, the Trustees receive comparative performance and fee data regarding the Invesco Funds prepared by Invesco Advisers and Lipper Inc. (Lipper), an independent provider of investment company data. The Trustees also receive an independent written evaluation from the Senior Officer. The Senior Officer’s evaluation is prepared as part of his responsibility to manage the process by which the Invesco Funds’ proposed management fees are negotiated during the annual contract renewal process to ensure they are negotiated in a manner that is at arms’ length and reasonable. In addition to meetings with Invesco Advisers and fund counsel, the independent Trustees also discuss the continuance of the investment advisory agreement and sub-advisory contracts in separate sessions with the Senior Officer and with independent legal counsel.
The Trustees recognized that the advisory fee rates for the Invesco Funds are, in many cases, the result of years of review and negotiation. The Trustees’ deliberations and conclusions in a particular year may be based in part on their deliberations and conclusions regarding these same arrangements throughout the year and in prior years. The Trustees’ review and conclusions are based on the comprehensive consideration of all information presented to them and are not the result of any single determinative factor. Moreover, one Trustee may have weighed a particular piece of information or factor differently than another Trustee.
The discussion below serves as the Senior Officer’s independent written evaluation with respect to the Fund’s investment advisory agreement as well as a discussion of the material factors and related conclusions that formed the basis for the Board’s approval of the Fund’s investment advisory agreement and sub-advisory contracts. Unless otherwise stated, this information is current as of June 17, 2014, and may not reflect consideration of factors that became known to the Board after that date.
Factors and Conclusions and Summary of Independent Written Fee Evaluation
| A. | Nature, Extent and Quality of Services Provided by Invesco Advisers and the Affiliated Sub-Advisers |
The Board reviewed the advisory services provided to the Fund by Invesco Advisers under the Fund’s investment advisory agreement, the performance of Invesco Advisers in providing these services, and the credentials and experience of the officers and employees of Invesco Advisers who provide these services, including the Fund’s portfolio manager or
managers, with whom the Sub-Committees met during the year. The Board’s review of the qualifications of Invesco Advisers to provide advisory services included the Board’s consideration of Invesco Advisers’ investment process oversight, independent credit analysis and investment risk management. The Board also considered non-advisory services that Invesco Advisers and its affiliates provide to the Invesco Funds such as various back office support functions, equity and fixed income trading operations, internal audit, distribution and legal and compliance.
In determining whether to continue the Fund’s investment advisory agreement, the Board considered the benefits of reapproving an existing relationship and the greater uncertainty that may be associated with entering into a new relationship. The Board concluded that the nature, extent and quality of the services provided to the Fund by Invesco Advisers are appropriate and satisfactory and consistent with the terms of the Fund’s investment advisory agreement.
The Board reviewed the services that may be provided by the Affiliated Sub-Advisers under the sub-advisory contracts and the credentials and experience of the officers and employees of the Affiliated Sub-Advisers who provide these services. The Board noted that the Affiliated Sub-Advisers have offices and personnel that are located in financial centers around the world. As a result, the Affiliated Sub-Advisers can provide research and investment analysis on the markets and economies of various countries in which the Fund may invest, make recommendations regarding securities and assist with security trades. The Board concluded that the sub-advisory contracts benefit the Fund and its shareholders by permitting Invesco Advisers to use the resources and talents of the Affiliated Sub-Advisers in managing the Fund. The Board concluded that the nature, extent and quality of the services that may be provided by the Affiliated Sub-Advisers are appropriate and satisfactory and consistent with the terms of the Fund’s sub-advisory contracts.
The Board considered Fund performance as a relevant factor in considering whether to approve the investment advisory agreement as well as the sub-advisory contracts for the Fund, as Invesco PowerShares Capital Management LLC currently manages certain assets of the Fund.
The Board noted that the Fund recently began operations and that comparative performance data for only the past two calendar years was available. The Board compared the Fund’s performance during the past two calendar years to the performance of funds in the Lipper performance universe and against the Lipper Mixed-Asset Target Allocation Conservative Funds Index. The Board noted that performance of Class A shares of the Fund was
40 Invesco Premium Income Fund
in the fifth quintile of its performance universe for the one year period and the fourth quintile for the two year period (the first quintile being the best performing funds and the fifth quintile being the worst performing funds). The Board noted that the Fund’s performance was below the performance of the Index for the one and two year periods. The Trustees also reviewed more recent Fund performance and this review did not change their conclusions.
| C. | Advisory and Sub-Advisory Fees |
The Board compared the Fund’s contractual management fee rate to the contractual management fee rates of funds in the Fund’s Lipper expense group at a common asset level. The Board noted that the contractual management fee rate for Class A shares of the Fund was at the median contractual management fee rate of funds in the expense group. The Board noted that the term “contractual management fee” may include both advisory and certain administrative services fees, but that Lipper does not provide information on a fund by fund basis as to what is included. The Board noted that Invesco Advisers does not charge the Invesco Funds for the administrative services included in the term as defined by Lipper. The Board also reviewed the methodology used by Lipper in providing expense group information, which includes using each fund’s contractual management fee schedule (including any applicable breakpoints) as reported in the most recent prospectus or statement of additional information for each fund in the expense group.
The Board noted that Invesco Advisers has contractually agreed to waive fees and/or limit expenses of the Fund through at least February 28, 2015 in an amount necessary to limit total annual operating expenses to a specified percentage of average daily net assets for each class of the Fund.
The Board noted that Invesco Advisers and its affiliates manage two other mutual funds using an investment process substantially similar to the investment process used for the Fund. The Board noted that both of the other mutual funds are fund of funds and Invesco Advisers does not charge advisory fees at the fund level. Invesco Advisors and the Affiliated Sub-Advisers do not manage other client accounts using an investment process substantially similar to the investment process used for the Fund.
The Board also considered the services that may be provided by the Affiliated Sub-Advisers pursuant to the sub-advisory contracts, as well as the fees payable by Invesco Advisers to the Affiliated Sub-Advisers pursuant to the sub-advisory contracts. The Board noted that Invesco Advisers retains overall responsibility for, and provides services to, sub-advised Invesco Funds, including oversight of the Affiliated Sub-Advisers as well as the additional services described herein other than day-to-day portfolio management. The Board also noted that the sub-advisory fees are not paid directly by the Fund, but rather, are payable by Invesco Advisers to the Affiliated Sub-Advisers.
| D. | Economies of Scale and Breakpoints |
The Board considered the extent to which there are economies of scale in the provision of advisory services to the Fund. The Board also considered whether the Fund benefits from economies of scale through contractual breakpoints in the Fund’s advisory fee schedule and was assisted in this review by a report from the Senior Officer. The Board also noted that the Fund shares directly in economies of scale through lower fees charged by third party service providers based on the combined size of the Invesco Funds and other clients advised by Invesco Advisers.
| E. | Profitability and Financial Resources |
The Board reviewed information from Invesco Advisers concerning the costs of the advisory and other services that Invesco Advisers and its affiliates provide to the Fund and the profitability of Invesco Advisers and its affiliates in providing these services for the year ended December 31, 2013. The Board received information from Invesco Advisers about the methodology used to prepare the profitability information. The Board considered the profitability of Invesco Advisers in managing the Fund and the Invesco Funds. The Board noted that Invesco Advisers continues to operate at a net profit from services Invesco Advisers and its subsidiaries provide to the Invesco Funds and the Fund. The Board did not deem the level of profits realized by Invesco Advisers and its affiliates from providing services to the Fund to be excessive given the nature, quality and extent of the services provided to the Invesco Funds. The Board received and accepted information from Invesco Advisers demonstrating that Invesco Advisers and each Affiliated Sub-Adviser are financially sound and have the resources necessary to perform their obligations under the investment advisory agreement and sub-advisory contracts.
| F. | Collateral Benefits to Invesco Advisers and its Affiliates |
The Board considered various other benefits received by Invesco Advisers and its affiliates from the relationship with the Fund, including the fees received for their provision of transfer agency and distribution services to the Fund. The Board considered comparative information regarding fees charged for these services, including information provided by Lipper and other independent sources. The Board considered the performance of Invesco Advisers and its affiliates in providing these services and the organizational structure employed to provide these services. The Board also considered that these services are provided to the Fund pursuant to written contracts that are reviewed and approved on an annual basis by the Board; that the services are required for the operation of the Fund; that Invesco Advisers and its affiliates can provide services, the nature and quality of which are at least equal to those provided by others offering the same or similar services; and that the fees for such services are fair and reasonable in light of the
usual and customary charges by others for services of the same nature and quality.
The Board considered the benefits realized by Invesco Advisers and the Affiliated Sub-Advisers as a result of portfolio brokerage transactions executed through “soft dollar” arrangements. Invesco Advisers noted that the Fund does not execute brokerage transaction through “soft dollar” arrangements to any significant degree.
The Board considered that the Fund’s uninvested cash and cash collateral from any securities lending arrangements may be invested in money market funds advised by Invesco Advisers pursuant to procedures approved by the Board. The Board noted that Invesco Advisers receives advisory fees from these affiliated money market funds attributable to such investments, although Invesco Advisers has contractually agreed to waive through varying periods the advisory fees payable by the Invesco Funds with respect to investments in the affiliated money market funds. The waiver is in an amount equal to 100% of the net advisory fee Invesco Advisers receives from the affiliated money market funds with respect to the Fund’s investment in the affiliated money market funds of uninvested cash, but not cash collateral. The Board concluded that the amount of advisory fees received by Invesco Advisors from the Fund’s investment of uninvested cash and cash collateral from any securities lending arrangements in the affiliated money market funds are fair and reasonable.
41 Invesco Premium Income Fund
Tax Information
Form 1099-DIV, Form 1042-S and other year–end tax information provide shareholders with actual calendar year amounts that should be included in their tax returns. Shareholders should consult their tax advisors.
The following distribution information is being provided as required by the Internal Revenue Code or to meet a specific state’s requirement.
The Fund designates the following amounts or, if subsequently determined to be different, the maximum amount allowable for its fiscal year ended October 31, 2014:
| | | | |
Federal and State Income Tax | |
Qualified Dividend Income* | | | 0 | % |
Corporate Dividends Received Deduction* | | | 0 | % |
U.S. Treasury Obligations* | | | 2.92 | % |
| | * | The above percentages are based on ordinary income dividends paid to shareholders during the Fund’s fiscal year. |
42 Invesco Premium Income Fund
Trustees and Officers
The address of each trustee and officer is AIM Investment Funds (Invesco Investment Funds) (the “Trust”), 11 Greenway Plaza, Suite 1000, Houston, Texas 77046-1173. The trustees serve for the life of the Trust, subject to their earlier death, incapacitation, resignation, retirement or removal as more specifically provided in the Trust’s organizational documents. Each officer serves for a one year term or until their successors are elected and qualified. Column two below includes length of time served with predecessor entities, if any.
| | | | | | | | |
Name, Year of Birth and Position(s) Held with the Trust | | Trustee and/
or Officer Since | | Principal Occupation(s) During Past 5 Years | | Number of Funds in Fund Complex Overseen by Trustee | | Other Directorship(s) Held by Trustee During Past 5 Years |
| Interested Persons | | | | | | | | |
| Martin L. Flanagan1 — 1960 Trustee | | 2007 | | Executive Director, Chief Executive Officer and President, Invesco Ltd. (ultimate parent of Invesco and a global investment management firm); Advisor to the Board, Invesco Advisers, Inc. (formerly known as Invesco Institutional (N.A.), Inc.); Trustee, The Invesco Funds; Vice Chair, Investment Company Institute; and Member of Executive Board, SMU Cox School of Business Formerly: Chairman and Chief Executive Officer, Invesco Advisers, Inc. (registered investment adviser); Director, Chairman, Chief Executive Officer and President, IVZ Inc. (holding company), INVESCO Group Services, Inc. (service provider) and Invesco North American Holdings, Inc. (holding company); Director, Chief Executive Officer and President, Invesco Holding Company Limited (parent of Invesco and a global investment management firm); Director, Invesco Ltd.; Chairman, Investment Company Institute and President, Co-Chief Executive Officer, Co-President, Chief Operating Officer and Chief Financial Officer, Franklin Resources, Inc. (global investment management organization). | | 144 | | None |
Philip A. Taylor2 — 1954 Trustee, President and Principal Executive Officer | | 2006 | | Head of North American Retail and Senior Managing Director, Invesco Ltd.; Director, Co-Chairman, Co-President and Co-Chief Executive Officer, Invesco Advisers, Inc. (formerly known as Invesco Institutional (N.A.), Inc.) (registered investment adviser); Director, Chairman, Chief Executive Officer and President, Invesco Management Group, Inc. (formerly known as Invesco Aim Management Group, Inc.) (financial services holding company); Director and President, INVESCO Funds Group, Inc. (registered investment adviser and registered transfer agent); Director and Chairman, Invesco Investment Services, Inc. (formerly known as Invesco Aim Investment Services, Inc.) (registered transfer agent) and IVZ Distributors, Inc. (formerly known as INVESCO Distributors, Inc.) (registered broker dealer); Director, President and Chairman, Invesco Inc. (holding company) and Invesco Canada Holdings Inc. (holding company); Chief Executive Officer, Invesco Corporate Class Inc. (corporate mutual fund company) and Invesco Canada Fund Inc. (corporate mutual fund company); Director, Chairman and Chief Executive Officer, Invesco Canada Ltd. (formerly known as Invesco Trimark Ltd./Invesco Trimark Ltèe) (registered investment adviser and registered transfer agent); Trustee, President and Principal Executive Officer, The Invesco Funds (other than AIM Treasurer’s Series Trust (Invesco Treasurer’s Series Trust) and Short-Term Investments Trust); Trustee and Executive Vice President, The Invesco Funds (AIM Treasurer’s Series Trust (Invesco Treasurer’s Series Trust) and Short-Term Investments Trust only); Director, Invesco Investment Advisers LLC (formerly known as Van Kampen Asset Management); Director, Chief Executive Officer and President, Van Kampen Exchange Corp. Formerly: Director and Chairman, Van Kampen Investor Services Inc.; Director, Chief Executive Officer and President, 1371 Preferred Inc. (holding company) and Van Kampen Investments Inc.; Director and President, AIM GP Canada Inc. (general partner for limited partnerships) and Van Kampen Advisors, Inc.; Director and Chief Executive Officer, Invesco Trimark Dealer Inc. (registered broker dealer); Director, Invesco Distributors, Inc. (formerly known as Invesco Aim Distributors, Inc.) (registered broker dealer); Manager, Invesco PowerShares Capital Management LLC; Director, Chief Executive Officer and President, Invesco Advisers, Inc.; Director, Chairman, Chief Executive Officer and President, Invesco Aim Capital Management, Inc.; President, Invesco Trimark Dealer Inc. and Invesco Trimark Ltd./Invesco Trimark Ltèe; Director and President, AIM Trimark Corporate Class Inc. and AIM Trimark Canada Fund Inc.; Senior Managing Director, Invesco Holding Company Limited; Director and Chairman, Fund Management Company (former registered broker dealer); President and Principal Executive Officer, The Invesco Funds (AIM Treasurer’s Series Trust (Invesco Treasurer’s Series Trust), and Short-Term Investments Trust only); President, AIM Trimark Global Fund Inc. and AIM Trimark Canada Fund Inc. | | 144 | | None |
Wayne W. Whalen3 — 1939 Trustee | | 2010 | | Of Counsel, and prior to 2010, partner in the law firm of Skadden, Arps, Slate, Meagher & Flom LLP, legal counsel to certain funds in the Fund Complex | | 144 | | Director of the Mutual fund Directors Forum, a nonprofit membership organization for investment directors; Chairman and Director of the Abraham Lincoln Presidential Library Foundation; and Director of the Stevenson Center for Democracy |
| 1 | Mr. Flanagan is considered an interested person (within the meaning of Section 2(a)(19) of the 1940 Act) of the Trust because he is an officer of the Adviser to the Trust, and an officer and a director of Invesco Ltd., ultimate parent of the Adviser. |
| 2 | Mr. Taylor is considered an interested person (within the meaning of Section 2(a)(19) of the 1940 Act) of the Trust because he is an officer and a director of the Adviser. |
| 3 | Mr. Whalen is retiring effective December 31, 2014. He has been deemed to be an interested person of the Trust because of his prior service as counsel to the predecessor funds of certain Invesco open-end funds and his affiliation with the law firm that served as counsel to such predecessor funds and the Invesco closed-end funds. |
T-1 Invesco Premium Income Fund
Trustees and Officers—(continued)
| | | | | | | | |
Name, Year of Birth and Position(s) Held with the Trust | | Trustee and/
or Officer Since | | Principal Occupation(s) During Past 5 Years | | Number of Funds in Fund Complex Overseen by Trustee | | Other Directorship(s) Held by Trustee During Past 5 Years |
| Independent Trustees | | | | | | | | |
Bruce L. Crockett — 1944 Trustee and Chair | | 2001 | | Chairman, Crockett Technologies Associates (technology consulting company) Formerly: Director, Captaris (unified messaging provider); Director, President and Chief Executive Officer, COMSAT Corporation; Chairman, Board of Governors of INTELSAT (international communications company); ACE Limited (insurance company); and Investment Company Institute | | 144 | | ALPS (Attorneys Liability Protection Society) (insurance company) |
David C. Arch — 1945 Trustee | | 2010 | | Chairman of Blistex Inc., a consumer health care products manufacturer | | 144 | | Board member of the Illinois Manufacturers’ Association; Member of the Board of Visitors, Institute for the Humanities, University of Michigan; Member of the Audit Committee of the Edward-Elmhurst Hospital |
Frank S. Bayley — 1939 Trustee | | 1987 | | Retired. Formerly: Director, Badgley Funds Inc. (registered investment company) (2 portfolios) and General Partner and Of Counsel, law firm of Baker & McKenzie, LLP | | 144 | | Director and Chairman, C.D. Stimson Company (a real estate investment company); Trustee, The Curtis Institute of Music |
James T. Bunch — 1942 Trustee | | 2003 | | Managing Member, Grumman Hill Group LLC (family office private equity investments) Formerly: Founder, Green Manning & Bunch Ltd. (investment banking firm) (1988-2010); Executive Committee, United States Golf Association; and Director, Policy Studies, Inc. and Van Gilder Insurance Corporation | | 144 | | Chairman, Board of Governors, Western Golf Association; Chairman, Evans Scholars Foundation; and Director, Denver Film Society |
Rodney F. Dammeyer — 1940 Trustee | | 2010 | | Chairman of CAC,LLC, (private company offering capital investment and management advisory services) Formerly: Prior to 2001, Managing Partner at Equity Group Corporate Investments; Prior to 1995, Chief Executive Officer of Itel Corporation (formerly Anixter International); Prior to 1985, experience includes Senior Vice President and Chief Financial Officer of Household International, Inc., Executive Vice President and Chief Financial Officer of Northwest Industries, Inc. and Partner of Arthur Andersen & Co.; From 1987 to 2010, Director/Trustee of investment companies in the Van Kampen Funds complex | | 144 | | Director of Quidel Corporation and Stericycle, Inc. |
Albert R. Dowden — 1941 Trustee | | 2001 | | Director of a number of public and private business corporations, including the Boss Group, Ltd. (private investment and management); Nature’s Sunshine Products, Inc. and Reich & Tang Funds (5 portfolios) (registered investment company) Formerly: Director, Homeowners of America Holding Corporation/Homeowners of America Insurance Company (property casualty company); Director, Continental Energy Services, LLC (oil and gas pipeline service); Director, CompuDyne Corporation (provider of product and services to the public security market) and Director, Annuity and Life Re (Holdings), Ltd. (reinsurance company); Director, President and Chief Executive Officer, Volvo Group North America, Inc.; Senior Vice President, AB Volvo; Director of various public and private corporations; Chairman, DHJ Media, Inc.; Director, Magellan Insurance Company; and Director, The Hertz Corporation, Genmar Corporation (boat manufacturer), National Media Corporation; Advisory Board of Rotary Power International (designer, manufacturer, and seller of rotary power engines); and Chairman, Cortland Trust, Inc. (registered investment company) | | 144 | | Director of: Nature’s Sunshine Products, Inc., Reich & Tang Funds, Homeowners of America Holding Corporation/ Homeowners of America Insurance Company, the Boss Group |
Jack M. Fields — 1952 Trustee | | 2001 | | Chief Executive Officer, Twenty First Century Group, Inc. (government affairs company); Owner and Chief Executive Officer, Dos Angeles Ranch, L.P. (cattle, hunting, corporate entertainment); and Discovery Global Education Fund (non-profit) Formerly: Chief Executive Officer, Texana Timber LP (sustainable forestry company); Director of Cross Timbers Quail Research Ranch (non-profit); and member of the U.S. House of Representatives | | 144 | | Insperity, Inc. (formerly known as Administaff) |
Prema Mathai-Davis — 1950 Trustee | | 2001 | | Retired. Formerly: Chief Executive Officer, YWCA of the U.S.A. | | 144 | | None |
Larry Soll — 1942 Trustee | | 2003 | | Retired. Formerly: Chairman, Chief Executive Officer and President, Synergen Corp. (a biotechnology company) | | 144 | | None |
Hugo F. Sonnenschein — 1940 Trustee | | 2010 | | President Emeritus and Honorary Trustee of the University of Chicago and the Adam Smith Distinguished Service Professor in the Department of Economics at the University of Chicago. Prior to 2000, President of the University of Chicago | | 144 | | Trustee of the University of Rochester and a member of its investment committee; Member of the National Academy of Sciences and the American Philosophical Society; Fellow of the American Academy of Arts and Sciences |
T-2 Invesco Premium Income Fund
Trustees and Officers—(continued)
| | | | | | | | |
Name, Year of Birth and Position(s) Held with the Trust | | Trustee and/
or Officer Since | | Principal Occupation(s) During Past 5 Years | | Number of Funds in Fund Complex Overseen by Trustee | | Other Directorship(s) Held by Trustee During Past 5 Years |
| Independent Trustees—(continued) |
Raymond Stickel, Jr. — 1944 Trustee | | 2005 | | Retired. Formerly: Director, Mainstay VP Series Funds, Inc. (25 portfolios) and Partner, Deloitte & Touche | | 144 | | None |
Suzanne H. Woolsey — 1941 Trustee | | 2014 | | Chief Executive Officer of Woolsey Partners LLC | | 144 | | Emeritus Chair of the Board of Trustees of the Institute for Defense Analyses; Trustee of Colorado College; Trustee of California Institute of Technology; Prior to 2014, Director of Fluor Corp.; Prior to 2010, Trustee of the German Marshall Fund of the United States; Prior to 2010 Trustee of the Rocky Mountain Institute |
| Other Officers | | | | | | | | |
Russell C. Burk — 1958 Senior Vice President and Senior Officer | | 2005 | | Senior Vice President and Senior Officer, The Invesco Funds | | N/A | | N/A |
John M. Zerr — 1962 Senior Vice President, Chief Legal Officer and Secretary | | 2006 | | Director, Senior Vice President, Secretary and General Counsel, Invesco Management Group, Inc. (formerly known as Invesco Aim Management Group, Inc.) and Van Kampen Exchange Corp.; Senior Vice President, Invesco Advisers, Inc. (formerly known as Invesco Institutional (N.A.), Inc.) (registered investment adviser); Senior Vice President and Secretary, Invesco Distributors, Inc. (formerly known as Invesco Aim Distributors, Inc.); Director, Vice President and Secretary, Invesco Investment Services, Inc. (formerly known as Invesco Aim Investment Services, Inc.) and IVZ Distributors, Inc. (formerly known as INVESCO Distributors, Inc.); Director and Vice President, INVESCO Funds Group, Inc.; Senior Vice President, Chief Legal Officer and Secretary, The Invesco Funds; Manager, Invesco PowerShares Capital Management LLC; Director, Secretary and General Counsel, Invesco Investment Advisers LLC (formerly known as Van Kampen Asset Management); Secretary and General Counsel, Invesco Capital Markets, Inc. (formerly known as Van Kampen Funds Inc.) and Chief Legal Officer, PowerShares Exchange-Traded Fund Trust, PowerShares Exchange-Traded Fund Trust II, PowerShares India Exchange-Traded Fund Trust, PowerShares Actively Managed Exchange-Traded Fund Trust; and PowerShares Actively Managed Exchange-Traded Commodity Fund Trust Formerly: Director and Vice President, Van Kampen Advisors Inc.; Director, Vice President, Secretary and General Counsel, Van Kampen Investor Services Inc.; Director, Invesco Distributors, Inc. (formerly known as Invesco Aim Distributors, Inc.); Director, Senior Vice President, General Counsel and Secretary, Invesco Aim Advisers, Inc. and Van Kampen Investments Inc.; Director, Vice President and Secretary, Fund Management Company; Director, Senior Vice President, Secretary, General Counsel and Vice President, Invesco Aim Capital Management, Inc.; Chief Operating Officer and General Counsel, Liberty Ridge Capital, Inc. (an investment adviser); Vice President and Secretary, PBHG Funds (an investment company) and PBHG Insurance Series Fund (an investment company); Chief Operating Officer, General Counsel and Secretary, Old Mutual Investment Partners (a broker-dealer); General Counsel and Secretary, Old Mutual Fund Services (an administrator) and Old Mutual Shareholder Services (a shareholder servicing center); Executive Vice President, General Counsel and Secretary, Old Mutual Capital, Inc. (an investment adviser); and Vice President and Secretary, Old Mutual Advisors Funds (an investment company) | | N/A | | N/A |
Sheri Morris — 1964 Vice President, Treasurer and Principal Financial Officer | | 1999 | | Vice President, Treasurer and Principal Financial Officer, The Invesco Funds; Vice President, Invesco Advisers, Inc. (formerly known as Invesco Institutional (N.A.), Inc.) (registered investment adviser); and Vice President, PowerShares Exchange-Traded Fund Trust, PowerShares Exchange-Traded Fund Trust II, PowerShares India Exchange-Traded Fund Trust, PowerShares Actively Managed Exchange-Traded Fund Trust, and PowerShares Actively Managed Exchange-Traded Commodity Fund Trust Formerly: Vice President, Invesco Aim Advisers, Inc., Invesco Aim Capital Management, Inc. and Invesco Aim Private Asset Management, Inc.; Assistant Vice President and Assistant Treasurer, The Invesco Funds and Assistant Vice President, Invesco Advisers, Inc., Invesco Aim Capital Management, Inc. and Invesco Aim Private Asset Management, Inc.; and Treasurer, PowerShares Exchange-Traded Fund Trust, PowerShares Exchange-Traded Fund Trust II, PowerShares India Exchange-Traded Fund Trust and PowerShares Actively Managed Exchange-Traded Fund Trust | | N/A | | N/A |
T-3 Invesco Premium Income Fund
Trustees and Officers—(continued)
| | | | | | | | |
Name, Year of Birth and Position(s) Held with the Trust | | Trustee and/
or Officer Since | | Principal Occupation(s) During Past 5 Years | | Number of Funds in Fund Complex Overseen by Trustee | | Other Directorship(s) Held by Trustee During Past 5 Years |
| Other Officers—(continued) | | | | | | | | |
Karen Dunn Kelley — 1960 Vice President | | 2004 | | Senior Managing Director, Investments; Director, Co-President, Co-Chief Executive Officer, and Co-Chairman, Invesco Advisers, Inc. (formerly known as Invesco Institutional (N.A.), Inc.) (registered investment adviser); Chairman, Invesco Senior Secured Management, Inc.; Senior Vice President, Invesco Management Group, Inc. (formerly known as Invesco Aim Management Group, Inc.); Executive Vice President, Invesco Distributors, Inc. (formerly known as Invesco Aim Distributors, Inc.); Director, Invesco Mortgage Capital Inc. and Invesco Management Company Limited; Director and President, INVESCO Asset Management (Bermuda) Ltd., Vice President, The Invesco Funds (other than AIM Treasurer’s Series Trust (Invesco Treasurer’s Series Trust) and Short-Term Investments Trust); and President and Principal Executive Officer, The Invesco Funds (AIM Treasurer’s Series Trust (Invesco Treasurer’s Series Trust) and Short-Term Investments Trust only) Formerly: Director, INVESCO Global Asset Management Limited and INVESCO Management S.A.; Senior Vice President, Van Kampen Investments Inc. and Invesco Advisers, Inc. (formerly known as Invesco Institutional (N.A.), Inc.) (registered investment adviser); Vice President, Invesco Advisers, Inc. (formerly known as Invesco Institutional (N.A.), Inc.); Director of Cash Management and Senior Vice President, Invesco Advisers, Inc. and Invesco Aim Capital Management, Inc.; Director and President, Fund Management Company; Chief Cash Management Officer, Director of Cash Management, Senior Vice President, and Managing Director, Invesco Aim Capital Management, Inc.; Director of Cash Management, Senior Vice President, and Vice President, Invesco Advisers, Inc. and The Invesco Funds (AIM Treasurer’s Series Trust (Invesco Treasurer’s Series Trust), and Short-Term Investments Trust only) | | N/A | | N/A |
Crissie M. Wisdom — 1969 Anti-Money Laundering Compliance Officer | | 2013 | | Anti-Money Laundering Compliance Officer, Invesco Advisers, Inc. (formerly known as Invesco Institutional (N.A.), Inc.) (registered investment adviser), Invesco Capital Markets, Inc. (formerly known as Van Kampen Funds Inc.), Invesco Distributors, Inc., Invesco Investment Services, Inc., Invesco Management Group, Inc., Van Kampen Exchange Corp., The Invesco Funds, and PowerShares Exchange-Traded Fund Trust, PowerShares Exchange-Traded Fund Trust II, PowerShares India Exchange-Traded Fund Trust, PowerShares Actively Managed Exchange-Traded Fund Trust and PowerShares Actively Managed Exchange-Traded Commodity Fund Trust; and Fraud Prevention Manager and Controls and Risk Analysis Manager for Invesco Investment Services, Inc. | | N/A | | N/A |
Todd L. Spillane — 1958 Chief Compliance Officer | | 2006 | | Senior Vice President, Invesco Management Group, Inc. (formerly known as Invesco Aim Management Group, Inc.) and Van Kampen Exchange Corp.; Senior Vice President and Chief Compliance Officer, Invesco Advisers, Inc. (registered investment adviser) (formerly known as Invesco Institutional (N.A.), Inc.); Chief Compliance Officer, The Invesco Funds; Vice President, Invesco Distributors, Inc. (formerly known as Invesco Aim Distributors, Inc.) and Invesco Investment Services, Inc. (formerly known as Invesco Aim Investment Services, Inc.) Formerly: Chief Compliance Officer, Invesco Funds (Chicago); Senior Vice President, Van Kampen Investments Inc.; Senior Vice President and Chief Compliance Officer, Invesco Aim Advisers, Inc. and Invesco Aim Capital Management, Inc.; Chief Compliance Officer, INVESCO Private Capital Investments, Inc. (holding company), Invesco Private Capital, Inc. (registered investment adviser), Invesco Global Asset Management (N.A.), Inc., Invesco Senior Secured Management, Inc. (registered investment adviser), Van Kampen Investor Services Inc., PowerShares Exchange-Traded Fund Trust, PowerShares Exchange-Traded Fund Trust II, PowerShares India Exchange-Traded Fund Trust and PowerShares Actively Managed Exchange-Traded Fund Trust; and Vice President, Invesco Aim Capital Management, Inc. and Fund Management Company | | N/A | | N/A |
The Statement of Additional Information of the Trust includes additional information about the Fund’s Trustees and is available upon request, without charge, by calling 1.800.959.4246. Please refer to the Fund’s prospectus for information on the Fund’s sub-advisers.
| | | | | | |
Office of the Fund 11 Greenway Plaza, Suite 1000 Houston, TX 77046-1173 | | Investment Adviser Invesco Advisers, Inc. 1555 Peachtree Street, N.E. Atlanta, GA 30309 | | Distributor Invesco Distributors, Inc. 11 Greenway Plaza, Suite 1000 Houston, TX 77046-1173 | | Auditors PricewaterhouseCoopers LLP 1000 Louisiana Street, Suite 5800 Houston, TX 77002-5678 |
| | | |
| | | | | | |
Counsel to the Fund Stradley Ronon Stevens & Young, LLP 2005 Market Street, Suite 2600 Philadelphia, PA 19103-7018 | | Counsel to the Independent Trustees Goodwin Procter LLP 901 New York Avenue, N.W. Washington, D.C. 20001 | | Transfer Agent Invesco Investment Services, Inc. 11 Greenway Plaza, Suite 1000 Houston, TX 77046-1173 | | Custodian State Street Bank and Trust Company 225 Franklin Street Boston, MA 02110-2801 |
T-4 Invesco Premium Income Fund

Invesco mailing information
Send general correspondence to Invesco Investment Services, Inc., P.O. Box 219078, Kansas City, MO 64121-9078.
Important notice regarding delivery of security holder documents
To reduce Fund expenses, only one copy of most shareholder documents may be mailed to shareholders with multiple accounts at the same address (Householding). Mailing of your shareholder documents may be householded indefinitely unless you instruct us otherwise. If you do not want the mailing of these documents to be combined with those for other members of your household, please contact Invesco Investment Services, Inc. at 800 959 4246 or contact your financial institution. We will begin sending you individual copies for each account within 30 days after receiving your request.
Fund holdings and proxy voting information
The Fund provides a complete list of its holdings four times in each fiscal year, at the quarter ends. For the second and fourth quarters, the lists appear in the Fund’s semiannual and annual reports to shareholders. For the first and third quarters, the Fund files the lists with the Securities and Exchange Commission (SEC) on Form N-Q. The most recent list of portfolio holdings is available at invesco.com/completeqtrholdings. Shareholders can also look up the Fund’s Forms N-Q on the SEC website at sec.gov. Copies of the Fund’s Forms N-Q may be reviewed and copied at the SEC Public Reference Room in Washington, D.C. You can obtain information on the operation of the Public Reference Room, including information about duplicating fee charges, by calling 202 551 8090 or 800 732 0330, or by electronic request at the following email address: publicinfo@sec.gov. The SEC file numbers for the Fund are shown below.
A description of the policies and procedures that the Fund uses to determine how to vote proxies relating to portfolio securities is available without charge, upon request, from our Client Services department at 800 959 4246 or at invesco.com/proxyguidelines. The information is also available on the SEC website, sec.gov.
| | |
Information regarding how the Fund voted proxies related to its portfolio securities during the most recent 12-month period ended June 30 is available at invesco.com/proxysearch. The information is also available on the SEC website, sec.gov. Invesco Advisers, Inc. is an investment adviser; it provides investment advisory services to individual and institutional clients and does not sell securities. Invesco Distributors, Inc. is the US distributor for Invesco Ltd.’s retail mutual funds, exchange-traded funds and institutional money market funds. Both are wholly owned, indirect subsidiaries of Invesco Ltd. | |  |
| | | | |
| SEC file numbers: 811-05426 and 033-19338 | | PIN-AR-1 | | Invesco Distributors, Inc. |
Letters to Shareholders
| | | | | | | | | |

Philip Taylor | | | | Dear Shareholders: This annual report includes information about your Fund, including performance data and a complete list of its investments as of the close of the reporting period. Inside, your Fund’s portfolio managers discuss how they managed your Fund and the factors that affected its performance during the reporting period. I hope you find this report of interest. During the reporting period covered by this report, the US economy showed signs of continued improvement. After contracting in the first quarter of 2014, the economy expanded strongly in the second quarter and unemployment trended lower. Much of the credit for this improvement goes to the US Federal Reserve (the Fed), which undertook an extraordinary asset purchase program following the global financial crisis. The Fed’s goal was to jumpstart the economy by encouraging banks to lend more, businesses to hire more and consumers to | | |
spend more. Signs of a stronger US economy prompted the Fed to reduce, or “taper,” its asset purchase program. Despite this, interest rates remained near historical low levels due largely to heavy investor demand for bonds. While signs of economic improvement were evident in the US, European economies showed signs of weakening. That, together with geopolitical uncertainty and worries about the first diagnosed cases of Ebola outside of Africa, caused increased volatility in US and European equities.
Extended periods of market strength can lull investors into complacency – just as prolonged periods of market weakness or volatility can discourage investors from initiating long-term investment plans. That’s why Invesco has always encouraged investors to work with a professional financial adviser who can stress the importance of starting to save and invest early and the importance of adhering to a disciplined investment plan – when times are good and when they’re uncertain. A financial adviser who knows your unique financial situation, investment goals and risk tolerance can be an invaluable partner as you seek to achieve your financial goals. He or she can offer a long-term perspective when markets are volatile and time-tested advice and guidance when your financial situation or investment goals change.
Timely information when and where you want it
Invesco’s efforts to help investors achieve their financial objectives include providing individual investors and financial professionals with timely information about the markets, the economy and investing – whenever and wherever they want it.
Our website, invesco.com/us, offers a wide range of market insights and investment perspectives. On the website, you’ll find detailed information about our funds, including prices, performance, holdings and portfolio manager commentaries. You can access information about your individual Invesco account whenever it’s convenient for you; just complete a simple, secure online registration. Use the “Log In” box on our home page to get started.
Invesco’s mobile app for iPad® (available free from the App StoreSM) allows you to obtain the same detailed information about your Fund and the same investment insights from our investment leaders, market strategists, economists and retirement experts on the go. You also can watch portfolio manager videos and have instant access to Invesco news and updates wherever you may be.
In addition to the resources accessible on our website and through our mobile app, you can obtain timely updates to help you stay informed about the markets, the economy and investing by connecting with Invesco on Twitter, LinkedIn or Facebook. You can access our blog at blog.invesco.us.com. Our goal is to provide you the information you want, when and where you want it.
Have questions?
For questions about your account, feel free to contact an Invesco client services representative at 800 959 4246. For Invesco-related questions or comments, please email me directly at phil@invesco.com.
All of us at Invesco look forward to serving your investment management needs for many years to come. Thank you for investing with us.
Sincerely,

Philip Taylor
Senior Managing Director, Invesco Ltd.
iPad is a trademark of Apple Inc., registered in the US and other countries. App Store is a service mark of Apple Inc. Invesco Distributors, Inc. is not affiliated with Apple Inc.
|
| 2 Invesco Select Companies Fund |
| | | | |

Bruce Crockett | | | | Dear Fellow Shareholders: There are a variety of factors that can impact investment performance, many of which are uncontrollable by us as investors. These factors can include various economic trends and geopolitical developments. While the members of the Invesco Funds Board, which I chair, can’t dictate the performance of the Invesco funds, be assured that your Board works diligently throughout the year to focus on how your investments are managed. Our job is to represent you and your interests on a variety of fund management-related matters. We regularly monitor how the portfolio management teams of the Invesco funds are performing in light of ever-changing and often unpredictable economic and market conditions. We review the investment strategies and investment process employed by each fund’s management team as explained in the fund’s prospectus. Perhaps our most significant responsibility is conducting the annual review of the funds’ |
advisory and sub-advisory contracts with Invesco Advisers and its affiliates. This annual review, which is required by the Investment Company Act of 1940, focuses on the nature and quality of the services Invesco provides as the adviser to the Invesco funds and the reasonableness of the fees that it charges for those services. Each year, we spend months carefully reviewing information from Invesco that allows us to evaluate the quality of its services and the reasonableness of its fees. We also use information from a variety of independent sources, including materials provided by the independent senior officer of the Invesco funds, who reports directly to the independent trustees on the Board. Additionally, we meet with legal counsel and review performance and fee data prepared for us by Lipper Inc., an independent, third-party firm widely recognized as a leader in its field.
After a careful review, the members of the Invesco Funds Board approved the continuation of advisory and sub-advisory contracts with Invesco Advisers and its affiliates. Be assured that your Board will continue working on behalf of fund shareholders, keeping your needs and interests uppermost in our minds.
As always, please contact me at bruce@brucecrockett.com with any questions or concerns you may have. On behalf of the Board, we look forward to continuing to represent your interests and serving your needs.
Sincerely,

Bruce L. Crockett
Independent Chair
Invesco Funds Board of Trustees
|
| 3 Invesco Select Companies Fund |
Management’s Discussion of Fund Performance
Performance summary
For the fiscal year ended October 31, 2014, Invesco Select Companies Fund, at net asset value (NAV), outperformed its style-specific and peer group indexes but underperformed its broad market index.
Drivers of Fund performance were largely stock specific. We attribute the Fund’s outperformance versus its style-specific index mainly to select investments in the information technology (IT) sector. Select holdings in the energy and consumer discretionary sectors were among the largest detractors.
Your Fund’s long-term performance appears later in this report.
Fund vs. Indexes
Total returns, 10/31/13 to 10/31/14, at net asset value (NAV). Performance shown does not include applicable contingent deferred sales charges (CDSC) or front-end sales charges, which would have reduced performance.
| | | | | |
| Class A Shares | | | | 11.66 | % |
| Class B Shares | | | | 10.77 | |
| Class C Shares | | | | 10.83 | |
| Class R Shares | | | | 11.37 | |
| Class Y Shares | | | | 11.92 | |
| Class R5 Shares | | | | 12.01 | |
| S&P 500 Index‚ (Broad Market Index) | | | | 17.27 | |
| Russell 2000 Index‚ (Style Market Index) | | | | 8.06 | |
| Lipper Small-Cap Core Funds Indexn (Peer Group Index) | | | | 7.51 | |
Source(s): ‚FactSet Research Systems Inc.; nLipper Inc.
Market conditions and your Fund
The US economy remained “good but not great” during the fiscal year ended October 31, 2014. Slow but steady growth, helped by historically low interest rates, generally led US equity markets higher during the reporting period.
The fiscal year began with renewed optimism after it became apparent that a two-week federal government shutdown had not derailed the economy. Evidence of economic improvement caused the US equity market to rally in late 2013 despite the announcement by the US Federal Reserve (the Fed) in December that it would begin reducing the scope of its asset purchase program in early 2014.
The US stock market turned volatile in the first months of 2014 as investors began to worry that stocks may have risen too far, too fast. Unusually cold
winter weather negatively affected consumers, and the US economy contracted in the first quarter before rebounding strongly in the second quarter. While corporate earnings were generally resilient throughout the fiscal year, driven by strong profitability across many sectors, investors worried about political developments in Ukraine and signs of economic sluggishness in China. Toward the end of the reporting period, a sharp drop in global oil prices, evidence of economic stagnation in Europe and concern about the first cases of Ebola in the US increased market volatility.
Before we discuss the Fund’s results during the fiscal year, it is helpful to briefly explain how we manage the Fund for shareholders. We view ourselves as business people buying businesses, and we consider the purchase of a stock as an
ownership interest in a business. We strive to develop a proprietary view of a business through in-depth, fundamental research that includes careful financial statement analysis and meetings with company management. We then seek to purchase businesses whose stock prices are below what we have calculated to be the true value of the company based on its future free cash flows.
Our investment approach focuses on individual businesses rather than market sectors. Therefore, your Fund shares little in common with sector weightings of various market indexes. However, if we were to broadly categorize businesses with which we had the most success during the fiscal year, our investments in select IT stocks were the largest contributors to performance. Select holdings in the energy and consumer discretionary sectors were among the largest detractors. Additionally, our cash position hurt the Fund’s performance relative to the Russell 2000 Index in a rising market environment.
IT company International Rectifier was the largest contributor to Fund performance during the fiscal year. International Rectifier has a 40-year history of leadership in making chips that reduce power consumption. The company specializes in semiconductors used in computers, as well as in energy-efficient appliances and automobiles. These semiconductors help reduce power consumption and improve both performance and efficiency. Toward the end of the fiscal year, the company’s share price rose after receiving a take-out offer from a competitor at a 51% premium to the previous day’s closing price. We sold our position in International Rectifier after the announcement.
Booz Allen Hamilton was another top contributor to Fund performance. Booz Allen Hamilton provides high-end IT
| | | | | |
| Portfolio Composition |
By sector | | | | | |
| Information Technology | | | | 23.5 | % |
| Health Care | | | | 12.7 | |
| Consumer Discretionary | | | | 10.9 | |
| Industrials | | | | 10.5 | |
| Financials | | | | 7.3 | |
| Energy | | | | 6.9 | |
| Materials | | | | 1.4 | |
Money Market Funds Plus Other Assets Less Liabilities | | | | 26.8 | |
| | | | | | | |
| Top 10 Equity Holdings* |
| | | | | | | |
1. | | Alere, Inc. | | | | 5.7 | % |
2. | | Booz Allen Hamilton Holding Corp. | | | | 5.6 | |
3. | | Rovi Corp. | | | | 4.8 | |
4. | | Charles River Laboratories International, Inc. | | | | 4.7 | |
5. | | John Wiley & Sons, Inc.–Class A | | | | 4.5 | |
6. | | Global Payments Inc. | | | | 4.4 | |
7. | | Alliance Data Systems Corp. | | | | 4.4 | |
8. | | Microsemi Corp. | | | | 4.2 | |
9. | | Ultra Petroleum Corp. | | | | 4.0 | |
10. | | Encore Capital Group, Inc. | | | | 3.7 | |
| | | | | |
Total Net Assets | | | | $1.4 billion | |
| |
Total Number of Holdings* | | | | 23 | |
The Fund’s holdings are subject to change, and there is no assurance that the Fund will continue to hold any particular security.
*Excluding money market fund holdings.
|
| 4 Invesco Select Companies Fund |
consulting services to the military and has a long-standing reputation as “the Mercedes” of the government IT consulting industry. We are attracted to the company’s unique culture, in which every partner is paid the same regardless of his or her individual performance. This has resulted in a company run by individuals who row in the same direction; this creates an environment in which the sum is greater than each of its parts. Booz Allen Hamilton has a long history of double-digit organic growth as a result of its culture. We were able to purchase the company’s shares a couple of years ago at depressed levels due to investor concern about the impact of potential reductions in government spending on the military due to budget constraints. Shares of the company rose during the fiscal year after reporting strong results led by a rebound in its defense segment and investor appreciation of the company’s leadership in cyber security consulting.
Among the largest detractors from Fund performance were ION Geophysical and American Public Education. ION Geophysical is a leader in small niches in offshore seismic activity for the oil and gas industry. The company is building its own library of seismic data in areas that are typically very difficult to explore (e.g., the Arctic), yet represent some of the largest areas of potential oil and gas on the planet. Shares of ION Geophysical have been depressed as large oil exploration companies have reduced their capital expenditures. We believe this is a cyclical issue, which eventually will turn around. We continue to believe in the long-term growth prospects of the business. At the same time, the company is trading at inexpensive valuations and has a strong balance sheet to weather short-term headwinds.
American Public Education is exclusively an online post-secondary education institution. The school focuses both on the military and the public. Approximately 40% of American Public’s students are on active duty or in the military reserve, although the company’s growth is tilted toward civilian enrollees, a target group that is showing positive momentum. The company’s share price declined over the reporting period as military students delayed enrollment due to uncertainty about continued funding from the government. We believe this is a temporary issue; funding still exists, but it just isn’t as transparent as it was in past. As time goes by, students should get more familiar with the various funding opportunities that the government provides. Given American Public’s lower cost,
strong reputation and online user friendliness, the school is well positioned to increase its market share, we believe.
While the rising market environment made it difficult for us to find new investment opportunities, we did make some new investments and added to some of our existing holdings during periods of volatility. We also sold several holdings based on valuations and other factors. The Fund’s large cash position is a result of holdings being acquired ,which generates cash because we have to sell them, over the past few years and a lack of opportunities as markets continued to rise. We believe the cash should act as shock absorber in the next market correction, while providing us with the ability to invest in attractive opportunities as they present themselves.
During the fiscal year, we focused on finding quality businesses trading at attractive values relative to what we believe are their long-term prospects. In contrast, the market is often driven by short-term events or outlooks in both good times and bad. Market volatility allows us to take advantage of investment opportunities we believe will benefit your Fund in the long term.
While we can never predict future Fund performance, we pledge to you that we will adhere to our discipline of being business people who buy businesses; we will continually strive to upgrade the quality of your Fund’s portfolio.
As always, we thank you for your investment in Invesco Select Companies Fund and for sharing our long-term investment perspective.
The views and opinions expressed in management’s discussion of Fund performance are those of Invesco Advisers, Inc. These views and opinions are subject to change at any time based on factors such as market and economic conditions. These views and opinions may not be relied upon as investment advice or recommendations, or as an offer for a particular security. The information is not a complete analysis of every aspect of any market, country, industry, security or the Fund. Statements of fact are from sources considered reliable, but Invesco Advisers, Inc. makes no representation or warranty as to their completeness or accuracy. Although historical performance is no guarantee of future results, these insights may help you understand our investment management philosophy.
See important Fund and, if applicable, index disclosures later in this report.
| | |
 | | Robert Mikalachki Chartered Financial Analyst, Portfolio Manager, is lead manager of Invesco Select Companies |
| Fund. He joined Invesco in 1999. Mr. Mikalachki earned a business degree from Wilfrid Laurier University. |
| | |
 | | Virginia Au Chartered Financial Analyst, Portfolio Manager, is manager of Invesco Select Companies Fund. She |
| joined Invesco in 2006. Ms. Au earned a Bachelor of Commerce degree in finance from The University of British Columbia. |
| | |
 | | Jason Whiting Chartered Financial Analyst, Portfolio Manager, is manager of Invesco Select Companies Fund. He |
| joined Invesco in 2003. Mr. Whiting earned a BBA from Wilfrid Laurier University. |
|
| 5 Invesco Select Companies Fund |
Your Fund’s Long-Term Performance
Results of a $10,000 Investment – Oldest Share Class(es)
Fund and index data from 10/31/04

Past performance cannot guarantee comparable future results.
The data shown in the chart include reinvested distributions, applicable sales charges and Fund expenses including management fees. Results for Class B shares are calculated as if a hypothetical
shareholder had liquidated his entire investment in the Fund at the close of the reporting period and paid the contingent deferred sales charges, if applicable. Index results include reinvested dividends, but they do not reflect sales charges. Performance of the peer group,
if applicable, reflects fund expenses and management fees; performance of a market index does not. Performance shown in the chart and table(s) does not reflect deduction of taxes a shareholder would pay on Fund distributions or sale of Fund shares.
|
| 6 Invesco Select Companies Fund |
| | | | |
Average Annual Total Returns | |
| As of 10/31/14, including maximum applicable sales charges | |
| |
| Class A Shares | | | | |
| Inception (11/4/03) | | | 11.22 | % |
| 10 Years | | | 10.46 | |
| 5 Years | | | 17.59 | |
| 1 Year | | | 5.53 | |
| |
| Class B Shares | | | | |
| Inception (11/4/03) | | | 11.20 | % |
| 10 Years | | | 10.42 | |
| 5 Years | | | 17.81 | |
| 1 Year | | | 5.77 | |
| |
| Class C Shares | | | | |
| Inception (11/4/03) | | | 10.98 | % |
| 10 Years | | | 10.26 | |
| 5 Years | | | 18.02 | |
| 1 Year | | | 9.83 | |
| |
| Class R Shares | | | | |
| Inception (4/30/04) | | | 11.53 | % |
| 10 Years | | | 10.82 | |
| 5 Years | | | 18.63 | |
| 1 Year | | | 11.37 | |
| |
| Class Y Shares | | | | |
| 10 Years | | | 11.25 | % |
| 5 Years | | | 19.23 | |
| 1 Year | | | 11.92 | |
| |
| Class R5 Shares | | | | |
| Inception (4/30/04) | | | 12.26 | % |
| 10 Years | | | 11.56 | |
| 5 Years | | | 19.35 | |
| 1 Year | | | 12.01 | |
Class Y shares incepted on October 3, 2008. Performance shown prior to that date is that of Class A shares and includes the 12b-1 fees applicable to Class A shares. Class A share performance reflects any applicable fee waivers or expense reimbursements.
The performance data quoted represent past performance and cannot guarantee comparable future results; current performance may be lower or higher. Please visit invesco.com/performance for the most recent month-end performance. Performance figures reflect reinvested distributions, changes in net asset value and the effect of the maximum sales charge unless otherwise stated.
The net annual Fund operating expense ratio set forth in the most recent Fund prospectus as of the date of this report for Class A, Class B, Class C, Class R, Class Y and Class R5 shares was 1.20%, 1.95%, 1.95%, 1.45%, 0.95% and 0.87%, respectively.1 The
| | | | |
Average Annual Total Returns | |
| As of 9/30/14, the most recent calendar quarter end, including maximum applicable sales charges. | |
| |
| Class A Shares | | | | |
| Inception (11/4/03) | | | 10.87 | % |
| 10 Years | | | 10.55 | |
| 5 Years | | | 16.11 | |
| 1 Year | | | 2.63 | |
| |
| Class B Shares | | | | |
| Inception (11/4/03) | | | 10.86 | % |
| 10 Years | | | 10.53 | |
| 5 Years | | | 16.36 | |
| 1 Year | | | 2.79 | |
| |
| Class C Shares | | | | |
| Inception (11/4/03) | | | 10.63 | % |
| 10 Years | | | 10.35 | |
| 5 Years | | | 16.57 | |
| 1 Year | | | 6.80 | |
| |
| Class R Shares | | | | |
| Inception (4/30/04) | | | 11.17 | % |
| 10 Years | | | 10.92 | |
| 5 Years | | | 17.15 | |
| 1 Year | | | 8.37 | |
| |
| Class Y Shares | | | | |
| 10 Years | | | 11.35 | % |
| 5 Years | | | 17.75 | |
| 1 Year | | | 8.89 | |
| |
| Class R5 Shares | | | | |
| Inception (4/30/04) | | | 11.91 | % |
| 10 Years | | | 11.66 | |
| 5 Years | | | 17.89 | |
| 1 Year | | | 8.97 | |
total annual Fund operating expense ratio set forth in the most recent Fund prospectus as of the date of this report for Class A, Class B, Class C, Class R, Class Y and Class R5 shares was 1.24%, 1.99%, 1.99%, 1.49%, 0.99% and 0.91%, respectively. The expense ratios presented above may vary from the expense ratios presented in other sections of this report that are based on expenses incurred during the period covered by this report.
Class A share performance reflects the maximum 5.50% sales charge, and Class B and Class C share performance reflects the applicable contingent deferred sales charge (CDSC) for the period involved. The CDSC on Class B shares declines from 5% beginning at the time of purchase to 0% at the beginning of the seventh year. The CDSC on Class C shares is 1% for the first year after purchase. Class R, Class Y and Class R5 shares do not have a front-end sales charge or a CDSC;
therefore, performance is at net asset value.
The performance of the Fund’s share classes will differ primarily due to different sales charge structures and class expenses.
| 1 | Total annual Fund operating expenses after any contractual fee waivers and/or expense reimbursements by the adviser in effect through at least June 30, 2016. See current prospectus for more information. |
|
| 7 Invesco Select Companies Fund |
Invesco Select Companies Fund’s investment objective is long-term growth of capital.
| n | | Unless otherwise stated, information presented in this report is as of October 31, 2014, and is based on total net assets. |
| n | | Unless otherwise noted, all data provided by Invesco. |
| n | | To access your Fund’s reports/prospectus, visit invesco.com/fundreports. |
About share classes
| n | | Class B shares may not be purchased for new or additional investments. Please see the prospectus for more information. |
| n | | Class R shares are generally available only to employer sponsored retirement and benefit plans. Please see the prospectus for more information. |
| n | | Class Y shares are available only to certain investors. Please see the prospectus for more information. |
| n | | Class R5 shares are primarily intended for employer sponsored retirement and benefit plans that meet certain standards and for institutional investors. Please see the prospectus for more information. |
Principal risks of investing in the Fund
| n | | Cash/cash equivalents risk. Holding cash or cash equivalents may negatively affect performance. |
| n | | Debt securities risk. The Fund may invest in debt securities that are affected by changing interest rates and changes in their effective maturities and credit quality. |
| n | | Foreign securities risk. The Fund’s foreign investments may be affected by changes in a foreign country’s exchange rates, political and social instability, changes in economic or taxation policies, difficulties when enforcing obligations, decreased liquidity, and increased volatility. Foreign companies may be subject to less regulation resulting in less publicly available information about the companies. |
| n | | Management risk. The investment techniques and risk analysis used by the Fund’s portfolio managers may not produce the desired results. |
| n | | Market risk. The prices of and the income generated by the Fund’s securities may decline in response to, among other things, investor sentiment, general economic and market conditions, regional or global instability, and currency and interest rate fluctuations. |
| n | | Small- and mid-capitalization risks. Stocks of small- and mid-sized companies tend to be more vulnerable to adverse developments and may have little or no operating history or track record of success, and limited product lines, markets, management and financial resources. The securities of small- and mid-sized companies may be more volatile due to less market interest and less publicly available information about the issuer. They also may be illiquid or restricted as to resale, or may trade less frequently and in smaller volumes, all of which may cause difficulty when establishing or closing a position at a desirable price. |
| n | | US government obligations risk. The Fund may invest in obligations issued by US government agencies and instrumentalities that may receive varying levels of support from the government, which could affect the Fund’s ability to recover should they default. |
| n | | Value investing style risk. The Fund emphasizes a value style of investing, which focuses on undervalued companies with characteristics for improved valuations. This style of investing is subject to the risk that the valuations never improve or that the returns on value equity securities are less than returns on other styles of investing or the overall stock market. Value stocks also may decline in price, even though in theory they are already underpriced. |
About indexes used in this report
| n | | The S&P 500® Index is an unmanaged index considered representative of the US stock market. |
| n | | The Russell 2000 Index is an unmanaged index considered representative of small-cap stocks. The Russell 2000 Index is a trademark/service mark of the Frank Russell Co. Russell® is a trademark of the Frank Russell Co. |
| n | | The Lipper Small-Cap Core Funds Index is an unmanaged index considered representative of small-cap core funds tracked by Lipper. |
| n | | The Fund is not managed to track the performance of any particular index, including the index(es) described here, and consequently, the performance of the Fund may deviate significantly from the performance of the index(es). |
| n | | A direct investment cannot be made in an index. Unless otherwise indicated, index results include reinvested dividends, and they do not reflect sales charges. Performance of the peer group, if applicable, reflects fund expenses; performance of a market index does not. |
Other information
| n | | The returns shown in management’s discussion of Fund performance are based on net asset values (NAVs) calculated for shareholder transactions. Generally accepted accounting principles require adjustments to be made to the net assets of the Fund at period end for financial reporting purposes, and as such, the NAVs for shareholder transactions and the returns based on those NAVs may differ from the NAVs and returns reported in the Financial Highlights. |
| n | | Industry classifications used in this report are generally according to the Global Industry Classification Standard, which was developed by and is the exclusive property and a service mark of MSCI Inc. and Standard & Poor’s. |
|
This report must be accompanied or preceded by a currently effective Fund prospectus, which contains more complete information, including sales charges and expenses. Investors should read it carefully before investing. |
|
|
| NOT FDIC INSURED | MAY LOSE VALUE | NO BANK GUARANTEE |
|
| 8 Invesco Select Companies Fund |
Schedule of Investments(a)
October 31, 2014
| | | | | | | | |
| | | Shares | | | Value | |
Common Stocks–73.25% | |
| Aerospace & Defense–3.60% | |
Cubic Corp. | | | 1,033,123 | | | $ | 49,837,854 | |
| | |
| Aluminum–0.00% | | | | | | | | |
Cymat Technologies Ltd. (Canada)(b) | | | 249,750 | | | | 44,325 | |
|
| Apparel, Accessories & Luxury Goods–0.11% | |
Hampshire Group, Ltd.(b)(c) | | | 592,824 | | | | 1,487,988 | |
|
| Automotive Retail–3.13% | |
America’s Car-Mart, Inc.(b)(c) | | | 942,136 | | | | 43,319,413 | |
|
| Commodity Chemicals–1.39% | |
Chemtrade Logistics Income Fund (Canada) | | | 1,045,784 | | | | 19,293,504 | |
|
| Consumer Finance–3.66% | |
Encore Capital Group, Inc.(b) | | | 1,115,018 | | | | 50,744,469 | |
|
| Data Processing & Outsourced Services–8.79% | |
Alliance Data Systems Corp.(b) | | | 214,039 | | | | 60,647,951 | |
Global Payments Inc. | | | 758,587 | | | | 61,066,253 | |
| | | | | 121,714,204 | |
|
| Diversified Support Services–2.08% | |
Performant Financial Corp.(b)(c) | | | 3,330,719 | | | | 28,744,105 | |
|
| Education Services–3.18% | |
American Public Education Inc.(b)(c) | | | 1,423,005 | | | | 44,098,925 | |
|
| Electrical Components & Equipment–3.15% | |
Regal-Beloit Corp. | | | 614,559 | | | | 43,615,252 | |
| | |
| Health Care Supplies–8.03% | | | | | | | | |
Alere, Inc.(b) | | | 1,978,539 | | | | 79,082,204 | |
Cooper Cos., Inc. (The) | | | 196,102 | | | | 32,141,118 | |
| | | | | 111,223,322 | |
|
| IT Consulting & Other Services–5.62% | |
Booz Allen Hamilton Holding Corp. | | | 2,956,676 | | | | 77,908,413 | |
|
| Life Sciences Tools & Services–4.69% | |
Charles River Laboratories International, Inc.(b) | | | 1,028,775 | | | | 64,977,429 | |
| | | | | | | | |
| | | Shares | | | Value | |
| Oil & Gas Equipment & Services–2.85% | |
ION Geophysical Corp.(b)(c) | | | 14,077,289 | | | $ | 39,416,409 | |
|
| Oil & Gas Exploration & Production–4.04% | |
Ultra Petroleum Corp.(b) | | | 2,453,956 | | | | 55,950,197 | |
|
| Other Diversified Financial Services–0.00% | |
Brompton Corp. (Canada) (Acquired 11/19/03-07/21/05; Cost $0)(b) | | | 69,374 | | | | 0 | |
| | |
| Publishing–4.51% | | | | | | | | |
John Wiley & Sons, Inc.–Class A | | | 1,070,433 | | | | 62,502,583 | |
|
| Real Estate Services–3.64% | |
FirstService Corp. (Canada) | | | 954,356 | | | | 50,440,539 | |
|
| Semiconductors–4.24% | |
Microsemi Corp.(b) | | | 2,250,091 | | | | 58,659,872 | |
|
| Systems Software–4.82% | |
Rovi Corp.(b) | | | 3,194,588 | | | | 66,702,997 | |
| | |
| Trucking–1.72% | | | | | | | | |
Con-way Inc. | | | 550,873 | | | | 23,891,362 | |
Total Common Stocks
(Cost $732,914,859) | | | | | | | 1,014,573,162 | |
|
Money Market Funds–24.74% | |
Liquid Assets Portfolio–Institutional Class(d) | | | 171,302,925 | | | | 171,302,925 | |
Premier Portfolio–Institutional Class(d) | | | 171,302,924 | | | | 171,302,924 | |
Total Money Market Funds
(Cost $342,605,849) | | | | | | | 342,605,849 | |
TOTAL INVESTMENTS–97.99%
(Cost $1,075,520,708) | | | | | | | 1,357,179,011 | |
OTHER ASSETS LESS LIABILITIES–2.01% | | | | | | | 27,871,131 | |
NET ASSETS–100.00% | | | | | | $ | 1,385,050,142 | |
Notes to Schedule of Investments:
| (a) | Industry and/or sector classifications used in this report are generally according to the Global Industry Classification Standard, which was developed by and is the exclusive property and a service mark of MSCI Inc. and Standard & Poor’s. |
| (b) | Non-income producing security. |
| (c) | Affiliated company during the period. The Investment Company Act of 1940 defines affiliates as those companies in which a fund holds 5% or more of the outstanding voting securities. The Fund has not owned enough of the outstanding voting securities of the issuer to have control (as defined in the Investment Company Act of 1940) of that issuer. The aggregate value of these securities as of October 31, 2014 was $157,066,840, which represented 11.34% of the Fund’s Net Assets. See Note 4. |
| (d) | The money market fund and the Fund are affiliated by having the same investment adviser. |
See accompanying Notes to Financial Statements which are an integral part of the financial statements.
9 Invesco Select Companies Fund
Statement of Assets and Liabilities
October 31, 2014
| | | | |
Assets: | | | | |
Investments, at value (Cost $532,215,466) | | $ | 857,506,322 | |
Investments in affiliates, at value (Cost $543,305,242) | | | 499,672,689 | |
Total investments, at value (Cost $1,075,520,708) | | | 1,357,179,011 | |
Foreign currencies, at value (Cost $25,772,279) | | | 25,020,060 | |
Receivable for: | | | | |
Investments sold | | | 5,928,540 | |
Fund shares sold | | | 255,888 | |
Dividends | | | 90,160 | |
Investment for trustee deferred compensation and retirement plans | | | 141,573 | |
Other assets | | | 46,256 | |
Total assets | | | 1,388,661,488 | |
| |
Liabilities: | | | | |
Payable for: | | | | |
Fund shares reacquired | | | 2,362,585 | |
Accrued fees to affiliates | | | 987,600 | |
Accrued trustees’ and officers’ fees and benefits | | | 3,205 | |
Accrued other operating expenses | | | 94,321 | |
Trustee deferred compensation and retirement plans | | | 163,635 | |
Total liabilities | | | 3,611,346 | |
Net assets applicable to shares outstanding | | $ | 1,385,050,142 | |
| |
Net assets consist of: | | | | |
Shares of beneficial interest | | $ | 976,751,239 | |
Undistributed net investment income (loss) | | | (4,763,959 | ) |
Undistributed net realized gain | | | 132,157,477 | |
Net unrealized appreciation | | | 280,905,385 | |
| | | $ | 1,385,050,142 | |
| | | | |
Net Assets: | | | | |
Class A | | $ | 754,309,714 | |
Class B | | $ | 9,039,358 | |
Class C | | $ | 180,852,621 | |
Class R | | $ | 70,176,991 | |
Class Y | | $ | 304,628,969 | |
Class R5 | | $ | 66,042,489 | |
|
Shares outstanding, $0.01 par value per share,
with an unlimited number of shares authorized: | |
Class A | | | 29,614,709 | |
Class B | | | 383,760 | |
Class C | | | 7,687,617 | |
Class R | | | 2,820,949 | |
Class Y | | | 11,849,923 | |
Class R5 | | | 2,503,324 | |
Class A: | | | | |
Net asset value per share | | $ | 25.47 | |
Maximum offering price per share | | | | |
(Net asset value of $25.47 ¸ 94.50%) | | $ | 26.95 | |
Class B: | | | | |
Net asset value and offering price per share | | $ | 23.55 | |
Class C: | | | | |
Net asset value and offering price per share | | $ | 23.53 | |
Class R: | | | | |
Net asset value and offering price per share | | $ | 24.88 | |
Class Y: | | | | |
Net asset value and offering price per share | | $ | 25.71 | |
Class R5: | | | | |
Net asset value and offering price per share | | $ | 26.38 | |
See accompanying Notes to Financial Statements which are an integral part of the financial statements.
10 Invesco Select Companies Fund
Statement of Operations
For the year ended October 31, 2014
| | | | |
Investment income: | |
Dividends (net of foreign withholding taxes of $247,365) | | $ | 13,040,929 | |
Dividends from affiliates | | | 150,879 | |
Interest | | | 144,642 | |
Total investment income | | | 13,336,450 | |
| |
Expenses: | | | | |
Advisory fees | | | 10,829,780 | |
Administrative services fees | | | 371,249 | |
Custodian fees | | | 51,343 | |
Distribution fees: | | | | |
Class A | | | 2,098,906 | |
Class B | | | 103,437 | |
Class C | | | 1,821,683 | |
Class R | | | 365,627 | |
Transfer agent fees — A, B, C, R and Y | | | 2,433,128 | |
Transfer agent fees — R5 | | | 72,393 | |
Trustees’ and officers’ fees and benefits | | | 59,520 | |
Other | | | 385,918 | |
Total expenses | | | 18,592,984 | |
Less: Fees waived and expense offset arrangement(s) | | | (539,814 | ) |
Net expenses | | | 18,053,170 | |
Net investment income (loss) | | | (4,716,720 | ) |
| |
Realized and unrealized gain (loss) from: | | | | |
Net realized gain (loss) from: | | | | |
Investment securities (includes net gains from securities sold to affiliates of $2,962,614) | | | 136,897,254 | |
Foreign currencies | | | (170,131 | ) |
| | | | 136,727,123 | |
Change in net unrealized appreciation (depreciation) of: | | | | |
Investment securities | | | 35,974,815 | |
Foreign currencies | | | (678,430 | ) |
| | | | 35,296,385 | |
Net realized and unrealized gain | | | 172,023,508 | |
Net increase in net assets resulting from operations | | $ | 167,306,788 | |
See accompanying Notes to Financial Statements which are an integral part of the financial statements.
11 Invesco Select Companies Fund
Statement of Changes in Net Assets
For the years ended October 31, 2014 and 2013
| | | | | | | | |
| | | 2014 | | | 2013 | |
Operations: | | | | | | | | |
Net investment income (loss) | | $ | (4,716,720 | ) | | $ | (8,374,112 | ) |
Net realized gain | | | 136,727,123 | | | | 86,673,466 | |
Change in net unrealized appreciation | | | 35,296,385 | | | | 232,019,311 | |
Net increase in net assets resulting from operations | | | 167,306,788 | | | | 310,318,665 | |
| | |
Distributions to shareholders from net investment income: | | | | | | | | |
Class A | | | — | | | | (9,045,657 | ) |
Class B | | | — | | | | (78,673 | ) |
Class C | | | — | | | | (979,377 | ) |
Class R | | | — | | | | (727,433 | ) |
Class Y | | | — | | | | (3,504,875 | ) |
Class R5 | | | — | | | | (1,070,529 | ) |
Total distributions from net investment income | | | — | | | | (15,406,544 | ) |
| | |
Distributions to shareholders from net realized gains: | | | | | | | | |
Class A | | | (41,356,017 | ) | | | (40,976,377 | ) |
Class B | | | (565,193 | ) | | | (781,665 | ) |
Class C | | | (9,079,104 | ) | | | (9,730,664 | ) |
Class R | | | (3,610,155 | ) | | | (4,037,779 | ) |
Class Y | | | (17,699,816 | ) | | | (13,402,054 | ) |
Class R5 | | | (3,696,664 | ) | | | (3,886,968 | ) |
Total distributions from net realized gains | | | (76,006,949 | ) | | | (72,815,507 | ) |
| | |
Share transactions–net: | | | | | | | | |
Class A | | | (180,545,095 | ) | | | 31,129,289 | |
Class B | | | (2,998,780 | ) | | | (3,572,393 | ) |
Class C | | | (10,931,159 | ) | | | (4,017,375 | ) |
Class R | | | (10,410,262 | ) | | | (6,243,826 | ) |
Class Y | | | (88,773,706 | ) | | | 92,529,139 | |
Class R5 | | | (19,977,867 | ) | | | (1,271,507 | ) |
Net increase (decrease) in net assets resulting from share transactions | | | (313,636,869 | ) | | | 108,553,327 | |
Net increase (decrease) in net assets | | | (222,337,030 | ) | | | 330,649,941 | |
| | |
Net assets: | | | | | | | | |
Beginning of year | | | 1,607,387,172 | | | | 1,276,737,231 | |
End of year (includes undistributed net investment income (loss) of $(4,763,959) and $(8,266,341), respectively) | | $ | 1,385,050,142 | | | $ | 1,607,387,172 | |
Notes to Financial Statements
October 31, 2014
NOTE 1—Significant Accounting Policies
Invesco Select Companies Fund (the “Fund”) is a series portfolio of AIM Investment Funds (Invesco Investment Funds) (the “Trust”). The Trust is organized as a Delaware statutory trust and is registered under the Investment Company Act of 1940, as amended (the “1940 Act”), as an open-end series management investment company consisting of twenty-four separate series portfolios, each authorized to issue an unlimited number of shares of beneficial interest. The assets, liabilities and operations of each portfolio are accounted for separately. Information presented in these financial statements pertains only to the Fund. Matters affecting each portfolio or class will be voted on exclusively by the shareholders of such portfolio or class.
The Fund’s investment objective is long-term growth of capital.
The Fund currently consists of six different classes of shares: Class A, Class B, Class C, Class R, Class Y and Class R5. Class A shares are sold with a front-end sales charge unless certain waiver criteria are met and under certain circumstances load waived shares may be subject to contingent deferred sales charges (“CDSC”). Class C shares are sold with a CDSC. Class R, Class Y and Class R5 shares are sold at net asset value. Effective November 30, 2010, new or additional investments in Class B shares are no longer permitted. Existing shareholders of Class B shares may continue to reinvest dividends and capital gains distributions in Class B shares until they convert to Class A shares. Also, shareholders in Class B shares will be
12 Invesco Select Companies Fund
able to exchange those shares for Class B shares of other Invesco Funds offering such shares until they convert to Class A shares. Generally, Class B shares will automatically convert to Class A shares on or about the month-end, which is at least eight years after the date of purchase. Redemption of Class B shares prior to the conversion date will be subject to a CDSC.
As of the end of business on March 15, 2012, the Fund has limited public sales of its shares to certain investors.
The following is a summary of the significant accounting policies followed by the Fund in the preparation of its financial statements.
| A. | Security Valuations — Securities, including restricted securities, are valued according to the following policy. |
A security listed or traded on an exchange (except convertible securities) is valued at its last sales price or official closing price as of the close of the customary trading session on the exchange where the security is principally traded, or lacking any sales or official closing price on a particular day, the security may be valued at the closing bid price on that day. Securities traded in the over-the-counter market are valued based on prices furnished by independent pricing services or market makers. When such securities are valued by an independent pricing service they may be considered fair valued. Futures contracts are valued at the final settlement price set by an exchange on which they are principally traded. Listed options are valued at the mean between the last bid and ask prices from the exchange on which they are principally traded. Options not listed on an exchange are valued by an independent source at the mean between the last bid and ask prices. For purposes of determining net asset value per share, futures and option contracts generally are valued 15 minutes after the close of the customary trading session of the New York Stock Exchange (“NYSE”).
Investments in open-end and closed-end registered investment companies that do not trade on an exchange are valued at the end of day net asset value per share. Investments in open-end and closed-end registered investment companies that trade on an exchange are valued at the last sales price or official closing price as of the close of the customary trading session on the exchange where the security is principally traded.
Debt obligations (including convertible securities) and unlisted equities are fair valued using an evaluated quote provided by an independent pricing service. Evaluated quotes provided by the pricing service may be determined without exclusive reliance on quoted prices, and may reflect appropriate factors such as institution-size trading in similar groups of securities, developments related to specific securities, dividend rate (for unlisted equities), yield (for debt obligations), quality, type of issue, coupon rate (for debt obligations), maturity (for debt obligations), individual trading characteristics and other market data. Debt obligations are subject to interest rate and credit risks. In addition, all debt obligations involve some risk of default with respect to interest and/or principal payments.
Foreign securities’ (including foreign exchange contracts) prices are converted into U.S. dollar amounts using the applicable exchange rates as of the close of the NYSE. If market quotations are available and reliable for foreign exchange-traded equity securities, the securities will be valued at the market quotations. Because trading hours for certain foreign securities end before the close of the NYSE, closing market quotations may become unreliable. If between the time trading ends on a particular security and the close of the customary trading session on the NYSE, events occur that the Adviser determines are significant and make the closing price unreliable, the Fund may fair value the security. If the event is likely to have affected the closing price of the security, the security will be valued at fair value in good faith using procedures approved by the Board of Trustees. Adjustments to closing prices to reflect fair value may also be based on a screening process of an independent pricing service to indicate the degree of certainty, based on historical data, that the closing price in the principal market where a foreign security trades is not the current value as of the close of the NYSE. Foreign securities’ prices meeting the approved degree of certainty that the price is not reflective of current value will be priced at the indication of fair value from the independent pricing service. Multiple factors may be considered by the independent pricing service in determining adjustments to reflect fair value and may include information relating to sector indices, American Depositary Receipts and domestic and foreign index futures. Foreign securities may have additional risks including exchange rate changes, potential for sharply devalued currencies and high inflation, political and economic upheaval, the relative lack of issuer information, relatively low market liquidity and the potential lack of strict financial and accounting controls and standards.
Securities for which market prices are not provided by any of the above methods may be valued based upon quotes furnished by independent sources. The last bid price may be used to value equity securities. The mean between the last bid and ask prices is used to value debt obligations, including corporate loans.
Securities for which market quotations are not readily available or became unreliable are valued at fair value as determined in good faith by or under the supervision of the Trust’s officers following procedures approved by the Board of Trustees. Issuer specific events, market trends, bid/ask quotes of brokers and information providers and other market data may be reviewed in the course of making a good faith determination of a security’s fair value.
The Fund may invest in securities that are subject to interest rate risk, meaning the risk that the prices will generally fall as interest rates rise and, conversely, the prices will generally rise as interest rates fall. Specific securities differ in their sensitivity to changes in interest rates depending on their individual characteristics. Changes in interest rates may result in increased market volatility, which may affect the value and/or liquidity of certain of the Fund’s investments.
Valuations change in response to many factors including the historical and prospective earnings of the issuer, the value of the issuer’s assets, general economic conditions, interest rates, investor perceptions and market liquidity. Because of the inherent uncertainties of valuation, the values reflected in the financial statements may materially differ from the value received upon actual sale of those investments.
| B. | Securities Transactions and Investment Income — Securities transactions are accounted for on a trade date basis. Realized gains or losses on sales are computed on the basis of specific identification of the securities sold. Interest income (net of withholding tax, if any) is recorded on the accrual basis from settlement date. Dividend income (net of withholding tax, if any) is recorded on the ex-dividend date. Bond premiums and discounts are amortized and/or accreted for financial reporting purposes. |
The Fund may periodically participate in litigation related to Fund investments. As such, the Fund may receive proceeds from litigation settlements. Any proceeds received are included in the Statement of Operations as realized gain (loss) for investments no longer held and as unrealized gain (loss) for investments still held.
Brokerage commissions and mark ups are considered transaction costs and are recorded as an increase to the cost basis of securities purchased and/or a reduction of proceeds on a sale of securities. Such transaction costs are included in the determination of net realized and unrealized gain (loss) from investment securities reported in the Statement of Operations and the Statement of Changes in Net Assets and the net realized and unrealized gains (losses) on securities per share in the Financial Highlights. Transaction costs are included in the calculation of the Fund’s net asset value and, accordingly, they reduce the Fund’s total returns. These transaction costs are not considered operating expenses and
13 Invesco Select Companies Fund
are not reflected in net investment income reported in the Statement of Operations and Statement of Changes in Net Assets, or the net investment income per share and ratios of expenses and net investment income reported in the Financial Highlights, nor are they limited by any expense limitation arrangements between the Fund and the investment adviser.
The Fund allocates income and realized and unrealized capital gains and losses to a class based on the relative net assets of each class.
| C. | Country Determination — For the purposes of making investment selection decisions and presentation in the Schedule of Investments, the investment adviser may determine the country in which an issuer is located and/or credit risk exposure based on various factors. These factors include the laws of the country under which the issuer is organized, where the issuer maintains a principal office, the country in which the issuer derives 50% or more of its total revenues and the country that has the primary market for the issuer’s securities, as well as other criteria. Among the other criteria that may be evaluated for making this determination are the country in which the issuer maintains 50% or more of its assets, the type of security, financial guarantees and enhancements, the nature of the collateral and the sponsor organization. Country of issuer and/or credit risk exposure has been determined to be the United States of America, unless otherwise noted. |
| D. | Distributions — Distributions from net investment income and net realized capital gain, if any, are generally declared and paid annually and recorded on the ex-dividend date. The Fund may elect to treat a portion of the proceeds from redemptions as distributions for federal income tax purposes. |
| E. | Federal Income Taxes — The Fund intends to comply with the requirements of Subchapter M of the Internal Revenue Code of 1986, as amended (the “Internal Revenue Code”), necessary to qualify as a regulated investment company and to distribute substantially all of the Fund’s taxable earnings to shareholders. As such, the Fund will not be subject to federal income taxes on otherwise taxable income (including net realized capital gain) that is distributed to shareholders. Therefore, no provision for federal income taxes is recorded in the financial statements. |
The Fund recognizes the tax benefits of uncertain tax positions only when the position is more likely than not to be sustained. Management has analyzed the Fund’s uncertain tax positions and concluded that no liability for unrecognized tax benefits should be recorded related to uncertain tax positions. Management is not aware of any tax positions for which it is reasonably possible that the total amounts of unrecognized tax benefits will change materially in the next 12 months.
The Fund files tax returns in the U.S. Federal jurisdiction and certain other jurisdictions. Generally, the Fund is subject to examinations by such taxing authorities for up to three years after the filing of the return for the tax period.
| F. | Expenses — Fees provided for under the Rule 12b-1 plan of a particular class of the Fund are charged to the operations of such class. Transfer agency fees and expenses and other shareholder recordkeeping fees and expenses attributable to Class R5 are charged to such class. Transfer agency fees and expenses and other shareholder recordkeeping fees and expenses relating to all other classes are allocated among those classes based on relative net assets. All other expenses are allocated among the classes based on relative net assets. |
| G. | Accounting Estimates — The preparation of financial statements in conformity with accounting principles generally accepted in the United States of America (“GAAP”) requires management to make estimates and assumptions that affect the reported amounts of assets and liabilities at the date of the financial statements and the reported amounts of revenues and expenses during the reporting period including estimates and assumptions related to taxation. Actual results could differ from those estimates by a significant amount. In addition, the Fund monitors for material events or transactions that may occur or become known after the period-end date and before the date the financial statements are released to print. |
| H. | Indemnifications — Under the Trust’s organizational documents, each Trustee, officer, employee or other agent of the Trust is indemnified against certain liabilities that may arise out of the performance of their duties to the Fund. Additionally, in the normal course of business, the Fund enters into contracts, including the Fund’s servicing agreements, that contain a variety of indemnification clauses. The Fund’s maximum exposure under these arrangements is unknown as this would involve future claims that may be made against the Fund that have not yet occurred. The risk of material loss as a result of such indemnification claims is considered remote. |
| I. | Foreign Currency Translations — Foreign currency is valued at the close of the NYSE based on quotations posted by banks and major currency dealers. Portfolio securities and other assets and liabilities denominated in foreign currencies are translated into U.S. dollar amounts at date of valuation. Purchases and sales of portfolio securities (net of foreign taxes withheld on disposition) and income items denominated in foreign currencies are translated into U.S. dollar amounts on the respective dates of such transactions. The Fund does not separately account for the portion of the results of operations resulting from changes in foreign exchange rates on investments and the fluctuations arising from changes in market prices of securities held. The combined results of changes in foreign exchange rates and the fluctuation of market prices on investments (net of estimated foreign tax withholding) are included with the net realized and unrealized gain or loss from investments in the Statement of Operations. Reported net realized foreign currency gains or losses arise from (1) sales of foreign currencies, (2) currency gains or losses realized between the trade and settlement dates on securities transactions, and (3) the difference between the amounts of dividends, interest, and foreign withholding taxes recorded on the Fund’s books and the U.S. dollar equivalent of the amounts actually received or paid. Net unrealized foreign currency gains and losses arise from changes in the fair values of assets and liabilities, other than investments in securities at fiscal period end, resulting from changes in exchange rates. |
The Fund may invest in foreign securities, which may be subject to foreign taxes on income, gains on investments or currency repatriation, a portion of which may be recoverable. Foreign taxes, if any, are recorded based on the tax regulations and rates that exist in the foreign markets in which the Fund invests and are shown in the Statement of Operations.
| J. | Forward Foreign Currency Contracts — The Fund may engage in foreign currency transactions either on a spot (i.e. for prompt delivery and settlement) basis or through forward foreign currency contracts to manage or minimize currency or exchange rate risk. |
The Fund may also enter into forward foreign currency contracts for the purchase or sale of a security denominated in a foreign currency in order to “lock in” the U.S. dollar price of that security, or the Fund may also enter into forward foreign currency contracts that do not provide for physical settlement of the two currencies, but instead are settled by a single cash payment calculated as the difference between the agreed upon exchange rate and the spot rate at settlement based upon an agreed upon notional amount (non-deliverable forwards). The Fund will set aside liquid assets in an amount equal to daily mark-to-market obligation for forward foreign currency contracts.
A forward foreign currency contract is an obligation between two parties (“Counterparties”) to purchase or sell a specific currency for an agreed-upon price at a future date. The use of forward foreign currency contracts does not eliminate fluctuations in the price of the underlying securities the Fund owns or intends to acquire but establishes a rate of exchange in advance. Fluctuations in the value of these contracts are
14 Invesco Select Companies Fund
measured by the difference in the contract date and reporting date exchange rates and are recorded as unrealized appreciation (depreciation) until the contracts are closed. When the contracts are closed, realized gains (losses) are recorded. Realized and unrealized gains (losses) on the contracts are included in the Statement of Operations. The primary risks associated with forward foreign currency contracts include failure of the Counterparty to meet the terms of the contract and the value of the foreign currency changing unfavorably. These risks may be in excess of the amounts reflected in the Statement of Assets and Liabilities.
NOTE 2—Advisory Fees and Other Fees Paid to Affiliates
The Trust has entered into a master investment advisory agreement with Invesco Advisers, Inc. (the “Adviser” or “Invesco”). Under the terms of the investment advisory agreement, the Fund pays an advisory fee to the Adviser based on the annual rate of the Fund’s average daily net assets as follows:
| | | | | | |
| Average Daily Net Assets | | Rate |
First $250 million | | | 0 | .745% | | |
Next $250 million | | | 0 | .73% | | |
Next $500 million | | | 0 | .715% | | |
Next $1.5 billion | | | 0 | .70% | | |
Next $2.5 billion | | | 0 | .685% | | |
Next $2.5 billion | | | 0 | .67% | | |
Next $2.5 billion | | | 0 | .655% | | |
Over $10 billion | | | 0 | .64% | | |
For the year ended October 31, 2014, the effective advisory fees incurred by the Fund was 0.72%.
Under the terms of a master sub-advisory agreement between the Adviser and each of Invesco Asset Management Deutschland GmbH, Invesco Asset Management Limited, Invesco Asset Management (Japan) Limited, Invesco Australia Limited, Invesco Hong Kong Limited, Invesco Senior Secured Management, Inc. and Invesco Canada Ltd. (collectively, the “Affiliated Sub-Advisers”) the Adviser, not the Fund, may pay 40% of the fees paid to the Adviser to any such Affiliated Sub-Adviser(s) that provide(s) discretionary investment management services to the Fund based on the percentage of assets allocated to such Sub-Adviser(s).
The Adviser has contractually agreed, through at least June 30, 2015, to waive advisory fees and/or reimburse expenses to the extent necessary to limit total annual fund operating expenses after fee waivers and/or expense reimbursements (excluding certain items discussed below) of Class A, Class B, Class C, Class R, Class Y and Class R5 shares to 2.00%, 2.75%, 2.75%, 2.25%, 1.75% and 1.75% of average daily net assets, respectively. In determining the Adviser’s obligation to waive advisory fees and/or reimburse expenses, the following expenses are not taken into account, and could cause the total annual fund operating expenses after fee waivers and/or expense reimbursements to exceed the numbers reflected above: (1) interest; (2) taxes; (3) dividend expense on short sales; (4) extraordinary or non-routine items, including litigation expenses; and (5) expenses that the Fund has incurred but did not actually pay because of an expense offset arrangement. Unless Invesco continues the fee waiver agreement, it will terminate on June 30, 2015. The fee waiver agreement cannot be terminated during its term. The Adviser did not waive fees and/or reimburse expenses during the period under this expense limitation.
Further, the Adviser has contractually agreed, through at least June 30, 2016, to waive the advisory fee payable by the Fund in an amount equal to 100% of the net advisory fees the Adviser receives from the affiliated money market funds on investments by the Fund of uninvested cash in such affiliated money market funds.
For the year ended October 31, 2014, the Adviser waived advisory fees of $538,033.
The Trust has entered into a master administrative services agreement with Invesco pursuant to which the Fund has agreed to pay Invesco for certain administrative costs incurred in providing accounting services to the Fund. For the year ended October 31, 2014, expenses incurred under the agreement are shown in the Statement of Operations as Administrative services fees.
The Trust has entered into a transfer agency and service agreement with Invesco Investment Services, Inc. (“IIS”) pursuant to which the Fund has agreed to pay IIS a fee for providing transfer agency and shareholder services to the Fund and reimburse IIS for certain expenses incurred by IIS in the course of providing such services. IIS may make payments to intermediaries that provide omnibus account services, sub-accounting services and/or networking services. All fees payable by IIS to intermediaries that provide omnibus account services or sub-accounting are charged back to the Fund, subject to certain limitations approved by the Trust’s Board of Trustees. For the year ended October 31, 2014, expenses incurred under the agreement are shown in the Statement of Operations as Transfer agent fees.
The Trust has entered into master distribution agreements with Invesco Distributors, Inc. (“IDI”) to serve as the distributor for the Class A, Class B, Class C, Class R, Class Y and Class R5 shares of the Fund. The Trust has adopted plans pursuant to Rule 12b-1 under the 1940 Act with respect to the Fund’s Class A, Class B, Class C and Class R shares (collectively, the “Plans”). The Fund, pursuant to the Plans, pays IDI compensation at the annual rate of 0.25% of the Fund’s average daily net assets of Class A shares, 1.00% of the average daily net assets of Class B and Class C shares and 0.50% of the average daily net assets of Class R shares. Of the Plan payments, up to 0.25% of the average daily net assets of each class of shares may be paid to furnish continuing personal shareholder services to customers who purchase and own shares of such classes. Any amounts not paid as a service fee under the Plans would constitute an asset-based sales charge. Rules of the Financial Industry Regulatory Authority (“FINRA”) impose a cap on the total sales charges, including asset-based sales charges, that may be paid by any class of shares of the Fund. For the year ended October 31, 2014, expenses incurred under the Plans are shown in the Statement of Operations as Distribution fees.
Front-end sales commissions and CDSC (collectively, the “sales charges”) are not recorded as expenses of the Fund. Front-end sales commissions are deducted from proceeds from the sales of Fund shares prior to investment in Class A shares of the Fund. CDSC are deducted from redemption proceeds prior to remittance to the shareholder. During the year ended October 31, 2014, IDI advised the Fund that IDI retained $17,794 in front-end sales commissions from the sale of Class A shares and $2,661, $4,256 and $4,282 from Class A, Class B and Class C shares, respectively, for CDSC imposed on redemptions by shareholders.
Certain officers and trustees of the Trust are officers and directors of the Adviser, IIS and/or IDI.
15 Invesco Select Companies Fund
NOTE 3—Additional Valuation Information
GAAP defines fair value as the price that would be received to sell an asset or paid to transfer a liability in an orderly transaction between market participants at the measurement date, under current market conditions. GAAP establishes a hierarchy that prioritizes the inputs to valuation methods, giving the highest priority to readily available unadjusted quoted prices in an active market for identical assets (Level 1) and the lowest priority to significant unobservable inputs (Level 3), generally when market prices are not readily available or are unreliable. Based on the valuation inputs, the securities or other investments are tiered into one of three levels. Changes in valuation methods may result in transfers in or out of an investment’s assigned level:
| | Level 1 — | Prices are determined using quoted prices in an active market for identical assets. |
| | Level 2 — | Prices are determined using other significant observable inputs. Observable inputs are inputs that other market participants may use in pricing a security. These may include quoted prices for similar securities, interest rates, prepayment speeds, credit risk, yield curves, loss severities, default rates, discount rates, volatilities and others. |
| | Level 3 — | Prices are determined using significant unobservable inputs. In situations where quoted prices or observable inputs are unavailable (for example, when there is little or no market activity for an investment at the end of the period), unobservable inputs may be used. Unobservable inputs reflect the Fund’s own assumptions about the factors market participants would use in determining fair value of the securities or instruments and would be based on the best available information. |
The following is a summary of the tiered valuation input levels, as of October 31, 2014. The level assigned to the securities valuations may not be an indication of the risk or liquidity associated with investing in those securities. Because of the inherent uncertainties of valuation, the values reflected in the financial statements may materially differ from the value received upon actual sale of those investments.
| | | | | | | | | | | | | | | | |
| | | Level 1 | | | Level 2 | | | Level 3 | | | Total | |
Equity Securities | | $ | 1,357,179,011 | | | $ | — | | | $ | 0 | | | $ | 1,357,179,011 | |
NOTE 4—Investments in Other Affiliates
The 1940 Act defines affiliates as those issuances in which a fund holds 5% or more of the outstanding voting securities. The Fund has not owned enough of the outstanding voting securities of the issuer to have control (as defined in the 1940 Act) of that issuer. The following is a summary of the investments in other affiliates for the year ended October 31, 2014.
| | | | | | | | | | | | | | | | | | | | | | | | | | | | |
| | | Value
10/31/13 | | | Purchases
at Cost | | | Proceeds
from Sales | | | Change in
Unrealized
Appreciation
(Depreciation) | | | Realized
Gain (Loss) | | | Value
10/31/14 | | | Interest/
Dividend
Income | |
America’s Car-Mart, Inc. | | $ | 42,557,639 | | | $ | 469,482 | | | $ | — | | | $ | 292,292 | | | $ | — | | | $ | 43,319,413 | | | $ | — | |
American Public Education Inc. | | | 56,962,890 | | | | — | | | | — | | | | (12,863,965 | ) | | | — | | | | 44,098,925 | | | | — | |
Hampshire Group, Ltd. | | | 2,489,861 | | | | — | | | | — | | | | (1,001,873 | ) | | | — | | | | 1,487,988 | | | | — | |
International Rectifier Corp. | | | 117,031,728 | | | | — | | | | (159,429,156 | ) | | | (17,701,680 | ) | | | 60,099,108 | | | | — | | | | — | |
ION Geophysical Corp. | | | 51,472,907 | | | | 11,989,092 | | | | — | | | | (24,045,590 | ) | | | — | | | | 39,416,409 | | | | — | |
MEGA Brands Inc. | | | 29,402,694 | | | | — | | | | (31,622,266 | ) | | | 42,960,084 | | | | (40,740,512 | ) | | | — | | | | — | |
NCI, Inc.–Class A | | | 3,861,283 | | | | — | | | | (4,767,031 | ) | | | 8,367,086 | | | | (7,461,338 | ) | | | — | | | | — | |
Performant Financial Corp. | | | — | | | | 29,863,681 | | | | — | | | | (1,119,576 | ) | | | — | | | | 28,744,105 | | | | — | |
Total | | $ | 303,779,002 | | | $ | 42,322,255 | | | $ | (195,818,453 | ) | | $ | (5,113,222 | ) | | $ | 11,897,258 | | | $ | 157,066,840 | | | $ | — | |
NOTE 5—Security Transactions with Affiliated Funds
The Fund is permitted to purchase or sell securities from or to certain other Invesco Funds under specified conditions outlined in procedures adopted by the Board of Trustees of the Trust. The procedures have been designed to ensure that any purchase or sale of securities by the Fund from or to another fund or portfolio that is or could be considered an affiliate by virtue of having a common investment adviser (or affiliated investment advisers), common Trustees and/or common officers complies with Rule 17a-7 of the 1940 Act. Further, as defined under the procedures, each transaction is effected at the current market price. Pursuant to these procedures, for the year ended October 31, 2014, the Fund engaged in securities sales of $6,992,843, which resulted in net realized gains of $2,962,614.
NOTE 6—Expense Offset Arrangement(s)
The expense offset arrangement is comprised of transfer agency credits which result from balances in demand deposit accounts used by the transfer agent for clearing shareholder transactions. For the year ended October 31, 2014, the Fund received credits from this arrangement, which resulted in the reduction of the Fund’s total expenses of $1,781.
16 Invesco Select Companies Fund
NOTE 7—Trustees’ and Officers’ Fees and Benefits
Trustees’ and Officers’ Fees and Benefits include amounts accrued by the Fund to pay remuneration to certain Trustees and Officers of the Fund. Trustees have the option to defer compensation payable by the Fund, and Trustees’ and Officers’ Fees and Benefits also include amounts accrued by the Fund to fund such deferred compensation amounts. Those Trustees who defer compensation have the option to select various Invesco Funds in which their deferral accounts shall be deemed to be invested. Finally, certain current Trustees were eligible to participate in a retirement plan that provided for benefits to be paid upon retirement to Trustees over a period of time based on the number of years of service. The Fund may have certain former Trustees who also participate in a retirement plan and receive benefits under such plan. Trustees’ and Officers’ Fees and Benefits include amounts accrued by the Fund to fund such retirement benefits. Obligations under the deferred compensation and retirement plans represent unsecured claims against the general assets of the Fund.
NOTE 8—Cash Balances
The Fund is permitted to temporarily carry a negative or overdrawn balance in its account with State Street Bank and Trust Company, the custodian bank. Such balances, if any at period end, are shown in the Statement of Assets and Liabilities under the payable caption Amount due custodian. To compensate the custodian bank for such overdrafts, the overdrawn Fund may either (1) leave funds as a compensating balance in the account so the custodian bank can be compensated by earning the additional interest; or (2) compensate by paying the custodian bank at a rate agreed upon by the custodian bank and Invesco, not to exceed the contractually agreed upon rate.
NOTE 9—Distributions to Shareholders and Tax Components of Net Assets
Tax Character of Distributions to Shareholders Paid During the Years Ended October 31, 2014 and 2013:
| | | | | | | | |
| | | 2014 | | | 2013 | |
Ordinary income | | $ | — | | | $ | 18,973,430 | |
Long-term capital gain | | | 76,006,949 | | | | 69,248,621 | |
Total distributions | | $ | 76,006,949 | | | $ | 88,222,051 | |
Tax Components of Net Assets at Period-End:
| | | | |
| | | 2014 | |
Undistributed long-term gain | | $ | 132,498,273 | |
Net unrealized appreciation — investments | | | 281,317,507 | |
Net unrealized appreciation (depreciation) — other investments | | | (752,918 | ) |
Temporary book/tax differences | | | (151,510 | ) |
Late-Year ordinary loss deferral | | | (4,612,449 | ) |
Shares of beneficial interest | | | 976,751,239 | |
Total net assets | | $ | 1,385,050,142 | |
The difference between book-basis and tax-basis unrealized appreciation (depreciation) is due to differences in the timing of recognition of gains and losses on investments for tax and book purposes. The Fund’s net unrealized appreciation difference is attributable primarily to wash sales.
The temporary book/tax differences are a result of timing differences between book and tax recognition of income and/or expenses. The Fund’s temporary book/tax differences are the result of the trustee deferral of compensation and retirement plan benefits.
Capital loss carryforward is calculated and reported as of a specific date. Results of transactions and other activity after that date may affect the amount of capital loss carryforward actually available for the Fund to utilize. Capital losses generated in years beginning after December 22, 2010 can be carried forward for an unlimited period, whereas previous losses expire in 8 tax years. Capital losses with an expiration period may not be used to offset capital gains until all net capital losses without an expiration date have been utilized. Capital loss carryforwards with no expiration date will retain their character as either short-term or long-term capital losses instead of as short-term capital losses as under prior law. The ability to utilize capital loss carryforward in the future may be limited under the Internal Revenue Code and related regulations based on the results of future transactions.
The Fund does not have a capital loss carryforward as of October 31, 2014.
NOTE 10—Investment Securities
The aggregate amount of investment securities (other than short-term securities, U.S. Treasury obligations and money market funds, if any) purchased and sold by the Fund during the year ended October 31, 2014 was $112,420,892 and $426,346,103, respectively. Cost of investments on a tax basis includes the adjustments for financial reporting purposes as of the most recently completed federal income tax reporting period-end.
| | | | |
| Unrealized Appreciation (Depreciation) of Investment Securities on a Tax Basis | |
Aggregate unrealized appreciation of investment securities | | $ | 332,332,371 | |
Aggregate unrealized (depreciation) of investment securities | | | (51,014,864 | ) |
Net unrealized appreciation of investment securities | | $ | 281,317,507 | |
Cost of investments for tax purposes is $1,075,861,504.
17 Invesco Select Companies Fund
NOTE 11—Reclassification of Permanent Differences
Primarily as a result of differing book/tax treatment of net operating loss and foreign currency transactions, on October 31, 2014, undistributed net investment income (loss) was increased by $8,219,102, undistributed net realized gain was decreased by $308,778 and shares of beneficial interest was decreased by $7,910,324. This reclassification had no effect on the net assets of the Fund.
NOTE 12—Share Information
| | | | | | | | | | | | | | | | |
| | | Summary of Share Activity | |
| | | Years ended October 31, | |
| | | 2014(a) | | | 2013 | |
| | | Shares | | | Amount | | | Shares | | | Amount | |
Sold: | | | | | | | | | | | | | | | | |
Class A | | | 3,644,392 | | | $ | 86,862,251 | | | | 10,210,363 | | | $ | 222,017,511 | |
Class B | | | 13,561 | | | | 301,065 | | | | 17,409 | | | | 362,878 | |
Class C | | | 333,846 | | | | 7,383,566 | | | | 776,216 | | | | 15,810,509 | |
Class R | | | 669,277 | | | | 15,849,454 | | | | 865,084 | | | | 18,343,330 | |
Class Y | | | 4,809,060 | | | | 116,897,383 | | | | 8,644,200 | | | | 191,736,546 | |
Class R5 | | | 613,241 | | | | 15,312,739 | | | | 1,147,552 | | | | 25,328,784 | |
| | | | |
Issued as reinvestment of dividends: | | | | | | | | | | | | | | | | |
Class A | | | 1,721,956 | | | | 38,847,334 | | | | 2,349,373 | | | | 45,671,799 | |
Class B | | | 24,878 | | | | 522,441 | | | | 43,851 | | | | 802,476 | |
Class C | | | 411,569 | | | | 8,634,710 | | | | 556,529 | | | | 10,173,353 | |
Class R | | | 163,418 | | | | 3,608,270 | | | | 249,028 | | | | 4,756,430 | |
Class Y | | | 623,137 | | | | 14,157,670 | | | | 699,462 | | | | 13,653,515 | |
Class R5 | | | 133,694 | | | | 3,115,068 | | | | 175,267 | | | | 3,501,830 | |
| | | | |
Automatic conversion of Class B shares to Class A shares: | | | | | | | | | | | | | | | | |
Class A | | | 78,001 | | | | 1,886,904 | | | | 102,696 | | | | 2,231,292 | |
Class B | | | (84,013 | ) | | | (1,886,904 | ) | | | (109,446 | ) | | | (2,231,292 | ) |
| | | | |
Reacquired: | | | | | | | | | | | | | | | | |
Class A | | | (12,693,542 | ) | | | (308,141,584 | ) | | | (11,092,468 | ) | | | (238,791,313 | ) |
Class B | | | (86,383 | ) | | | (1,935,382 | ) | | | (122,024 | ) | | | (2,506,455 | ) |
Class C | | | (1,203,216 | ) | | | (26,949,435 | ) | | | (1,483,200 | ) | | | (30,001,237 | ) |
Class R | | | (1,265,120 | ) | | | (29,867,986 | ) | | | (1,379,680 | ) | | | (29,343,586 | ) |
Class Y | | | (9,038,247 | ) | | | (219,828,759 | ) | | | (5,257,907 | ) | | | (112,860,922 | ) |
Class R5 | | | (1,544,955 | ) | | | (38,405,674 | ) | | | (1,383,570 | ) | | | (30,102,121 | ) |
Net increase (decrease) in share activity | | | (12,675,446 | ) | | $ | (313,636,869 | ) | | | 5,008,735 | | | $ | 108,553,327 | |
| (a) | There are entities that are record owners of more than 5% of the outstanding shares of the Fund and in the aggregate own 35% of the outstanding shares of the Fund. IDI has an agreement with these entities to sell Fund shares. The Fund, Invesco and/or Invesco affiliates may make payments to these entities, which are considered to be related to the Fund, for providing services to the Fund, Invesco and/or Invesco affiliates including but not limited to services such as securities brokerage, distribution, third party record keeping and account servicing. The Fund has no knowledge as to whether all or any portion of the shares owned of record by these entities are also owned beneficially. |
18 Invesco Select Companies Fund
NOTE 13—Financial Highlights
The following schedule presents financial highlights for a share of the Fund outstanding throughout the periods indicated.
| | | | | | | | | | | | | | | | | | | | | | | | | | | | | | | | | | | | | | | | | | | | | | | | | | | | | | | | |
| | | Net asset
value,
beginning
of period | | | Net
investment
income
(loss)(a) | | | Net gains
on securities
(both
realized and
unrealized) | | | Total from
investment
operations | | | Dividends
from net
investment
income | | | Distributions
from net
realized
gains | | | Total
distributions | | | Net asset
value, end
of period | | | Total
return(b) | | | Net assets,
end of period
(000’s omitted) | | | Ratio of
expenses
to average
net assets
with fee waivers
and/or expenses
absorbed | | | Ratio of
expenses
to average net
assets without
fee waivers
and/or expenses
absorbed | | | Ratio of net
investment
income (loss)
to average
net assets | | | Portfolio
turnover(c) | |
Class A | | | | | | | | | | | | | | | | | | | | | | | | | | | | | | | | | | | | | | | | | | | | | | | | | | | | | | | | |
Year ended 10/31/14 | | $ | 23.95 | | | $ | (0.06 | ) | | $ | 2.71 | | | $ | 2.65 | | | $ | — | | | $ | (1.13 | ) | | $ | (1.13 | ) | | $ | 25.47 | | | | 11.66 | % | | $ | 754,310 | | | | 1.16 | %(d) | | | 1.20 | %(d) | | | (0.28 | )%(d) | | | 10 | % |
Year ended 10/31/13 | | | 20.57 | | | | (0.12 | ) | | | 4.95 | | | | 4.83 | | | | (0.23 | ) | | | (1.22 | ) | | | (1.45 | ) | | | 23.95 | | | | 25.11 | | | | 883,072 | | | | 1.16 | | | | 1.20 | | | | (0.55 | ) | | | 19 | |
Year ended 10/31/12 | | | 18.97 | | | | (0.07 | ) | | | 1.67 | (e) | | | 1.60 | | | | — | | | | — | | | | — | | | | 20.57 | | | | 8.43 | | | | 725,950 | | | | 1.18 | | | | 1.23 | | | | (0.34 | ) | | | 37 | |
Year ended 10/31/11 | | | 15.50 | | | | (0.12 | ) | | | 3.59 | | | | 3.47 | | | | — | | | | — | | | | — | | | | 18.97 | | | | 22.39 | | | | 485,609 | | | | 1.24 | | | | 1.27 | | | | (0.64 | ) | | | 38 | |
Year ended 10/31/10 | | | 12.09 | | | | (0.02 | ) | | | 3.44 | | | | 3.42 | | | | (0.01 | ) | | | — | | | | (0.01 | ) | | | 15.50 | | | | 28.28 | | | | 275,777 | | | | 1.31 | | | | 1.33 | | | | (0.18 | ) | | | 50 | |
Class B | | | | | | | | | | | | | | | | | | | | | | | | | | | | | | | | | | | | | | | | | | | | | | | | | | | | | | | | |
Year ended 10/31/14 | | | 22.40 | | | | (0.23 | ) | | | 2.51 | | | | 2.28 | | | | — | | | | (1.13 | ) | | | (1.13 | ) | | | 23.55 | | | | 10.77 | | | | 9,039 | | | | 1.91 | (d) | | | 1.95 | (d) | | | (1.03 | )(d) | | | 10 | |
Year ended 10/31/13 | | | 19.32 | | | | (0.26 | ) | | | 4.65 | | | | 4.39 | | | | (0.09 | ) | | | (1.22 | ) | | | (1.31 | ) | | | 22.40 | | | | 24.22 | | | | 11,551 | | | | 1.91 | | | | 1.95 | | | | (1.30 | ) | | | 19 | |
Year ended 10/31/12 | | | 17.95 | | | | (0.21 | ) | | | 1.58 | (e) | | | 1.37 | | | | — | | | | — | | | | — | | | | 19.32 | | | | 7.63 | | | | 13,251 | | | | 1.93 | | | | 1.98 | | | | (1.09 | ) | | | 37 | |
Year ended 10/31/11 | | | 14.78 | | | | (0.24 | ) | | | 3.41 | | | | 3.17 | | | | — | | | | — | | | | — | | | | 17.95 | | | | 21.45 | | | | 15,478 | | | | 1.99 | | | | 2.02 | | | | (1.39 | ) | | | 38 | |
Year ended 10/31/10 | | | 11.61 | | | | (0.13 | ) | | | 3.30 | | | | 3.17 | | | | — | | | | — | | | | — | | | | 14.78 | | | | 27.30 | | | | 13,952 | | | | 2.06 | | | | 2.08 | | | | (0.93 | ) | | | 50 | |
Class C | | | | | | | | | | | | | | | | | | | | | | | | | | | | | | | | | | | | | | | | | | | | | | | | | | | | | | | | |
Year ended 10/31/14 | | | 22.37 | | | | (0.23 | ) | | | 2.52 | | | | 2.29 | | | | — | | | | (1.13 | ) | | | (1.13 | ) | | | 23.53 | | | | 10.83 | | | | 180,853 | | | | 1.91 | (d) | | | 1.95 | (d) | | | (1.03 | )(d) | | | 10 | |
Year ended 10/31/13 | | | 19.30 | | | | (0.26 | ) | | | 4.64 | | | | 4.38 | | | | (0.09 | ) | | | (1.22 | ) | | | (1.31 | ) | | | 22.37 | | | | 24.19 | | | | 182,221 | | | | 1.91 | | | | 1.95 | | | | (1.30 | ) | | | 19 | |
Year ended 10/31/12 | | | 17.93 | | | | (0.21 | ) | | | 1.58 | (e) | | | 1.37 | | | | — | | | | — | | | | — | | | | 19.30 | | | | 7.64 | | | | 160,090 | | | | 1.93 | | | | 1.98 | | | | (1.09 | ) | | | 37 | |
Year ended 10/31/11 | | | 14.76 | | | | (0.24 | ) | | | 3.41 | | | | 3.17 | | | | — | | | | — | | | | — | | | | 17.93 | | | | 21.48 | | | | 123,286 | | | | 1.99 | | | | 2.02 | | | | (1.39 | ) | | | 38 | |
Year ended 10/31/10 | | | 11.60 | | | | (0.13 | ) | | | 3.29 | | | | 3.16 | | | | — | | | | — | | | | — | | | | 14.76 | | | | 27.24 | | | | 86,591 | | | | 2.06 | | | | 2.08 | | | | (0.93 | ) | | | 50 | |
Class R | | | | | | | | | | | | | | | | | | | | | | | | | | | | | | | | | | | | | | | | | | | | | | | | | | | | | | | | |
Year ended 10/31/14 | | | 23.48 | | | | (0.12 | ) | | | 2.65 | | | | 2.53 | | | | — | | | | (1.13 | ) | | | (1.13 | ) | | | 24.88 | | | | 11.37 | | | | 70,177 | | | | 1.41 | (d) | | | 1.45 | (d) | | | (0.53 | )(d) | | | 10 | |
Year ended 10/31/13 | | | 20.19 | | | | (0.17 | ) | | | 4.86 | | | | 4.69 | | | | (0.18 | ) | | | (1.22 | ) | | | (1.40 | ) | | | 23.48 | | | | 24.83 | | | | 76,385 | | | | 1.41 | | | | 1.45 | | | | (0.80 | ) | | | 19 | |
Year ended 10/31/12 | | | 18.66 | | | | (0.12 | ) | | | 1.65 | (e) | | | 1.53 | | | | — | | | | — | | | | — | | | | 20.19 | | | | 8.20 | | | | 71,040 | | | | 1.43 | | | | 1.48 | | | | (0.59 | ) | | | 37 | |
Year ended 10/31/11 | | | 15.29 | | | | (0.16 | ) | | | 3.53 | | | | 3.37 | | | | — | | | | — | | | | — | | | | 18.66 | | | | 22.04 | | | | 62,112 | | | | 1.49 | | | | 1.52 | | | | (0.89 | ) | | | 38 | |
Year ended 10/31/10 | | | 11.95 | | | | (0.06 | ) | | | 3.40 | | | | 3.34 | | | | (0.00 | ) | | | — | | | | (0.00 | ) | | | 15.29 | | | | 27.97 | | | | 32,270 | | | | 1.56 | | | | 1.58 | | | | (0.43 | ) | | | 50 | |
Class Y | | | | | | | | | | | | | | | | | | | | | | | | | | | | | | | | | | | | | | | | | | | | | | | | | | | | | | | | |
Year ended 10/31/14 | | | 24.11 | | | | (0.01 | ) | | | 2.74 | | | | 2.73 | | | | — | | | | (1.13 | ) | | | (1.13 | ) | | | 25.71 | | | | 11.92 | | | | 304,629 | | | | 0.91 | (d) | | | 0.95 | (d) | | | (0.03 | )(d) | | | 10 | |
Year ended 10/31/13 | | | 20.69 | | | | (0.06 | ) | | | 4.98 | | | | 4.92 | | | | (0.28 | ) | | | (1.22 | ) | | | (1.50 | ) | | | 24.11 | | | | 25.47 | | | | 372,632 | | | | 0.91 | | | | 0.95 | | | | (0.30 | ) | | | 19 | |
Year ended 10/31/12 | | | 19.03 | | | | (0.02 | ) | | | 1.68 | (e) | | | 1.66 | | | | — | | | | — | | | | — | | | | 20.69 | | | | 8.72 | | | | 235,268 | | | | 0.93 | | | | 0.98 | | | | (0.09 | ) | | | 37 | |
Year ended 10/31/11 | | | 15.51 | | | | (0.07 | ) | | | 3.59 | | | | 3.52 | | | | — | | | | — | | | | — | | | | 19.03 | | | | 22.70 | | | | 41,476 | | | | 0.99 | | | | 1.02 | | | | (0.39 | ) | | | 38 | |
Year ended 10/31/10 | | | 12.07 | | | | 0.01 | | | | 3.44 | | | | 3.45 | | | | (0.01 | ) | | | — | | | | (0.01 | ) | | | 15.51 | | | | 28.62 | | | | 12,735 | | | | 1.06 | | | | 1.08 | | | | 0.07 | | | | 50 | |
Class R5 | | | | | | | | | | | | | | | | | | | | | | | | | | | | | | | | | | | | | | | | | | | | | | | | | | | | | | | | |
Year ended 10/31/14 | | | 24.69 | | | | 0.01 | | | | 2.81 | | | | 2.82 | | | | — | | | | (1.13 | ) | | | (1.13 | ) | | | 26.38 | | | | 12.01 | | | | 66,042 | | | | 0.84 | (d) | | | 0.88 | (d) | | | 0.04 | (d) | | | 10 | |
Year ended 10/31/13 | | | 21.16 | | | | (0.05 | ) | | | 5.10 | | | | 5.05 | | | | (0.30 | ) | | | (1.22 | ) | | | (1.52 | ) | | | 24.69 | | | | 25.53 | | | | 81,527 | | | | 0.83 | | | | 0.87 | | | | (0.22 | ) | | | 19 | |
Year ended 10/31/12 | | | 19.45 | | | | (0.00 | ) | | | 1.71 | (e) | | | 1.71 | | | | — | | | | — | | | | — | | | | 21.16 | | | | 8.79 | | | | 71,138 | | | | 0.84 | | | | 0.89 | | | | (0.00 | ) | | | 37 | |
Year ended 10/31/11 | | | 15.82 | | | | (0.04 | ) | | | 3.67 | | | | 3.63 | | | | — | | | | — | | | | — | | | | 19.45 | | | | 22.95 | | | | 70,652 | | | | 0.83 | | | | 0.86 | | | | (0.23 | ) | | | 38 | |
Year ended 10/31/10 | | | 12.30 | | | | 0.04 | | | | 3.50 | | | | 3.54 | | | | (0.02 | ) | | | — | | | | (0.02 | ) | | | 15.82 | | | | 28.79 | | | | 29,499 | | | | 0.86 | | | | 0.88 | | | | 0.27 | | | | 50 | |
| (a) | Calculated using average shares outstanding. |
| (b) | Includes adjustments in accordance with accounting principles generally accepted in the United States of America and as such, the net asset value for financial reporting purposes and the returns based upon those net asset values may differ from the net asset value and returns for shareholder transactions. Does not include sales charges and is not annualized for periods less than one year, if applicable. |
| (c) | Portfolio turnover is calculated at the fund level and is not annualized for periods less than one year, if applicable. |
| (d) | Ratios are based on average daily net assets (000’s omitted) of $839,563, $10,344, $182,168, $73,125, $331,910 and $72,501 for Class A, Class B, Class C, Class R, Class Y and Class R5 shares, respectively. |
| (e) | Net gains (losses) on securities (both realized and unrealized) include capital gains realized on distributions from Booz Allen Hamilton Holding Corp. on June 7, 2012 and Generac Holdings, Inc. on July 2, 2012. Net gains (losses) on securities (both realized and unrealized) excluding the capital gains are $1.55, $1.46, $1.46, $1.53, $1.56 and $1.59 for Class A, Class B, Class C, Class R, Class Y and Class R5, respectively. |
19 Invesco Select Companies Fund
Report of Independent Registered Public Accounting Firm
To the Board of Trustees of AIM Investment Funds (Invesco Investment Funds)
and Shareholders of Invesco Select Companies Fund:
In our opinion, the accompanying statement of assets and liabilities, including the schedule of investments, and the related statements of operations and of changes in net assets and the financial highlights present fairly, in all material respects, the financial position of Invesco Select Companies Fund (one of the funds constituting AIM Investment Funds (Invesco Investment Funds), hereafter referred to as the “Fund”) at October 31, 2014, the results of its operations for the year then ended, the changes in its net assets for each of the two years in the period then ended and the financial highlights for each of the five years in the period then ended, in conformity with accounting principles generally accepted in the United States of America. These financial statements and financial highlights (hereafter referred to as “financial statements”) are the responsibility of the Fund’s management. Our responsibility is to express an opinion on these financial statements based on our audits. We conducted our audits of these financial statements in accordance with the standards of the Public Company Accounting Oversight Board (United States). Those standards require that we plan and perform the audit to obtain reasonable assurance about whether the financial statements are free of material misstatement. An audit includes examining, on a test basis, evidence supporting the amounts and disclosures in the financial statements, assessing the accounting principles used and significant estimates made by management, and evaluating the overall financial statement presentation. We believe that our audits, which included confirmation of securities at October 31, 2014 by correspondence with the custodian, provide a reasonable basis for our opinion.
PRICEWATERHOUSECOOPERS LLP
December 23, 2014
Houston, Texas
20 Invesco Select Companies Fund
Calculating your ongoing Fund expenses
Example
As a shareholder of the Fund, you incur two types of costs: (1) transaction costs, which may include sales charges (loads) on purchase payments or contingent deferred sales charges on redemptions, if any; and (2) ongoing costs, including management fees, distribution and/or service (12b-1) fees, and other Fund expenses. This example is intended to help you understand your ongoing costs (in dollars) of investing in the Fund and to compare these costs with ongoing costs of investing in other mutual funds. The example is based on an investment of $1,000 invested at the beginning of the period and held for the entire period May 1, 2014 through October 31, 2014.
Actual expenses
The table below provides information about actual account values and actual expenses. You may use the information in this table, together with the amount you invested, to estimate the expenses that you paid over the period. Simply divide your account value by $1,000 (for example, an $8,600 account value divided by $1,000 = 8.6), then multiply the result by the number in the table under the heading entitled “Actual Expenses Paid During Period” to estimate the expenses you paid on your account during this period.
Hypothetical example for comparison purposes
The table below also provides information about hypothetical account values and hypothetical expenses based on the Fund’s actual expense ratio and an assumed rate of return of 5% per year before expenses, which is not the Fund’s actual return.
The hypothetical account values and expenses may not be used to estimate the actual ending account balance or expenses you paid for the period. You may use this information to compare the ongoing costs of investing in the Fund and other funds. To do so, compare this 5% hypothetical example with the 5% hypothetical examples that appear in the shareholder reports of the other funds.
Please note that the expenses shown in the table are meant to highlight your ongoing costs only and do not reflect any transaction costs, such as sales charges (loads) on purchase payments or contingent deferred sales charges on redemptions, if any. Therefore, the hypothetical information is useful in comparing ongoing costs only, and will not help you determine the relative total costs of owning different funds. In addition, if these transaction costs were included, your costs would have been higher.
| | | | | | | | | | | | | | | | | | | | | | | | |
| Class | | Beginning
Account Value
(05/01/14) | | | ACTUAL | | | HYPOTHETICAL (5% annual return before expenses) | | | Annualized
Expense
Ratio | |
| | | Ending
Account Value
(10/31/14)1 | | | Expenses
Paid During
Period2 | | | Ending
Account Value
(10/31/14) | | | Expenses
Paid During
Period2 | | |
| A | | $ | 1,000.00 | | | $ | 1,059.90 | | | $ | 6.18 | | | $ | 1,019.21 | | | $ | 6.06 | | | | 1.19 | % |
| B | | | 1,000.00 | | | | 1,055.60 | | | | 10.05 | | | | 1,015.43 | | | | 9.86 | | | | 1.94 | |
| C | | | 1,000.00 | | | | 1,056.10 | | | | 10.05 | | | | 1,015.43 | | | | 9.86 | | | | 1.94 | |
| R | | | 1,000.00 | | | | 1,058.70 | | | | 7.47 | | | | 1,017.95 | | | | 7.32 | | | | 1.44 | |
| Y | | | 1,000.00 | | | | 1,061.10 | | | | 4.88 | | | | 1,020.47 | | | | 4.79 | | | | 0.94 | |
| R5 | | | 1,000.00 | | | | 1,061.60 | | | | 4.42 | | | | 1,020.92 | | | | 4.33 | | | | 0.85 | |
| 1 | The actual ending account value is based on the actual total return of the Fund for the period May 1, 2014 through October 31, 2014, after actual expenses and will differ from the hypothetical ending account value which is based on the Fund’s expense ratio and a hypothetical annual return of 5% before expenses. |
| 2 | Expenses are equal to the Fund’s annualized expense ratio as indicated above multiplied by the average account value over the period, multiplied by 184/365 to reflect the most recent fiscal half year. |
21 Invesco Select Companies Fund
Approval of Investment Advisory and Sub-Advisory Contracts
The Board of Trustees (the Board) of AIM Investment Funds (Invesco Investment Funds) is required under the Investment Company Act of 1940, as amended, to approve annually the renewal of Invesco Select Companies Fund’s (the Fund) investment advisory agreements. During contract renewal meetings held on June 16-17, 2014, the Board as a whole, and the disinterested or “independent” Trustees, who comprise over 75% of the Board, voting separately, approved the continuance for the Fund of the Master Investment Advisory Agreement with Invesco Advisers, Inc. (Invesco Advisers and the investment advisory agreement) and the Master Intergroup Sub-Advisory Contract for Mutual Funds with Invesco Asset Management Deutschland GmbH, Invesco Asset Management Limited, Invesco Asset Management (Japan) Limited, Invesco Australia Limited, Invesco Hong Kong Limited, Invesco Senior Secured Management, Inc. and Invesco Canada Ltd. (collectively, the Affiliated Sub-Advisers and the sub-advisory contracts) for another year, effective July 1, 2014.
In evaluating the fairness and reasonableness of compensation under the Fund’s investment advisory agreement and sub-advisory contracts, the Board considered, among other things, the factors discussed below. The Board determined that continuation of the Fund’s investment advisory agreement and the sub-advisory contracts are in the best interest of the Fund and its shareholders and that the compensation payable to Invesco Advisers and the Affiliated Sub-Advisers under the agreements is fair and reasonable.
The Board’s Fund Evaluation Process
The Board’s Investments Committee has established three Sub-Committees, each of which is primarily responsible for overseeing the management of a number of the funds advised by Invesco Advisers (the Invesco Funds). The Sub-Committees meet throughout the year to review the performance of their assigned Invesco Funds, including reviewing materials prepared under the direction of the independent Senior Officer, an officer of the Invesco Funds who reports directly to the independent Trustees. Over the course of each year, the Sub-Committees meet with portfolio managers for their assigned Invesco Funds and other members of management to review the performance, investment objective(s), policies, strategies, limitations and investment risks of these funds. The Sub-Committees meet regularly and at designated contract renewal meetings each year to conduct a review of the performance, fees, expenses and other matters related to their assigned Invesco Funds. Each Sub-Committee recommends to the Investments Committee, which in turn recommends to the full Board, whether and on what terms to approve the continuance of each Invesco Fund’s
investment advisory agreement and sub-advisory contracts for another year.
During the contract renewal process, the Trustees receive comparative performance and fee data regarding the Invesco Funds prepared by Invesco Advisers and Lipper Inc. (Lipper), an independent provider of investment company data. The Trustees also receive an independent written evaluation from the Senior Officer. The Senior Officer’s evaluation is prepared as part of his responsibility to manage the process by which the Invesco Funds’ proposed management fees are negotiated during the annual contract renewal process to ensure they are negotiated in a manner that is at arms’ length and reasonable. In addition to meetings with Invesco Advisers and fund counsel, the independent Trustees also discuss the continuance of the investment advisory agreement and sub-advisory contracts in separate sessions with the Senior Officer and with independent legal counsel.
The Trustees recognized that the advisory fee rates for the Invesco Funds are, in many cases, the result of years of review and negotiation. The Trustees’ deliberations and conclusions in a particular year may be based in part on their deliberations and conclusions regarding these same arrangements throughout the year and in prior years. The Trustees’ review and conclusions are based on the comprehensive consideration of all information presented to them and are not the result of any single determinative factor. Moreover, one Trustee may have weighed a particular piece of information or factor differently than another Trustee.
The discussion below serves as the Senior Officer’s independent written evaluation with respect to the Fund’s investment advisory agreement as well as a discussion of the material factors and related conclusions that formed the basis for the Board’s approval of the Fund’s investment advisory agreement and sub-advisory contracts. Unless otherwise stated, this information is current as of June 17, 2014, and may not reflect consideration of factors that became known to the Board after that date.
Factors and Conclusions and Summary of Independent Written Fee Evaluation
| A. | Nature, Extent and Quality of Services Provided by Invesco Advisers and the Affiliated Sub-Advisers |
The Board reviewed the advisory services provided to the Fund by Invesco Advisers under the Fund’s investment advisory agreement, the performance of Invesco Advisers in providing these services, and the credentials and experience of the officers and employees of Invesco Advisers who provide these services, including the Fund’s portfolio manager or managers, with whom the Sub-Committees met
during the year. The Board’s review of the qualifications of Invesco Advisers to provide advisory services included the Board’s consideration of Invesco Advisers’ investment process oversight, independent credit analysis and investment risk management. The Board also considered non-advisory services that Invesco Advisers and its affiliates provide to the Invesco Funds such as various back office support functions, equity and fixed income trading operations, internal audit, distribution and legal and compliance.
In determining whether to continue the Fund’s investment advisory agreement, the Board considered the benefits of reapproving an existing relationship and the greater uncertainty that may be associated with entering into a new relationship. The Board concluded that the nature, extent and quality of the services provided to the Fund by Invesco Advisers are appropriate and satisfactory and consistent with the terms of the Fund’s investment advisory agreement.
The Board reviewed the services that may be provided by the Affiliated Sub-Advisers under the sub-advisory contracts and the credentials and experience of the officers and employees of the Affiliated Sub-Advisers who provide these services. The Board noted that the Affiliated Sub-Advisers have offices and personnel that are located in financial centers around the world. As a result, the Affiliated Sub-Advisers can provide research and investment analysis on the markets and economies of various countries in which the Fund may invest, make recommendations regarding securities and assist with security trades. The Board concluded that the sub-advisory contracts benefit the Fund and its shareholders by permitting Invesco Advisers to use the resources and talents of the Affiliated Sub-Advisers in managing the Fund. The Board concluded that the nature, extent and quality of the services that may be provided by the Affiliated Sub-Advisers are appropriate and satisfactory and consistent with the terms of the Fund’s sub-advisory contracts.
The Board considered Fund performance as a relevant factor in considering whether to approve the investment advisory agreement as well as the sub-advisory contracts for the Fund, as Invesco Canada Ltd. currently manages assets of the Fund.
The Board compared the Fund’s performance during the past one, three and five calendar years to the performance of funds in the Lipper performance universe and against the Lipper Small-Cap Core Funds Index. The Board noted that performance of Class A shares of the Fund was in the fifth quintile of its performance universe for the one year period, the third quintile for the three year period and the first quintile for the five year period (the first quintile being the best performing funds
22 Invesco Select Companies Fund
and the fifth quintile being the worst performing funds). The Board noted that performance of Class A shares of the Fund was below the performance of the Index for the one year period and above the performance of the Index for the three and five year periods. The Trustees also reviewed more recent Fund performance and this review did not change their conclusions.
| C. | Advisory and Sub-Advisory Fees |
The Board compared the Fund’s contractual management fee rate to the contractual management fee rates of funds in the Fund’s Lipper expense group at a common asset level. The Board noted that the contractual management fee rate for Class A shares of the Fund was below the median contractual management fee rate of funds in the expense group. The Board noted that the term “contractual management fee” may include both advisory and certain administrative services fees, but that Lipper does not provide information on a fund by fund basis as to what is included. The Board noted that Invesco Advisers does not charge the Invesco Funds for the administrative services included in the term as defined by Lipper. The Board also reviewed the methodology used by Lipper in providing expense group information, which includes using each fund’s contractual management fee schedule (including any applicable breakpoints) as reported in the most recent prospectus or statement of additional information for each fund in the expense group.
The Board noted that Invesco Advisers has contractually agreed to waive fees and/or limit expenses of the Fund through at least June 30, 2015 in an amount necessary to limit total annual operating expenses to a specified percentage of average daily net assets for each class of the Fund.
The Board also compared the Fund’s effective advisory fee rate (the advisory fee rate after advisory fee waivers and before other expense limitations/waivers) to the effective advisory fee rates of other mutual funds advised by Invesco Advisers and its affiliates that are managed using an investment process substantially similar to the investment process used for the Fund. The Board noted that the Fund’s rate was below the effective advisory fee rate of one off-shore fund and above the sub-adviser effective rate of one off-shore fund sub-advised by Invesco Advisers using a similar investment process. The Board noted that Invesco Advisers and the Affiliated Sub-Advisers do not manage other client accounts that are managed using an investment process substantially similar to the investment process used for the Fund.
The Board also considered the services that may be provided by the Affiliated Sub-Advisers pursuant to the sub-advisory contracts, as well as the fees payable by Invesco Advisers to the Affiliated Sub-Advisers pursuant to the sub-advisory contracts. The Board noted that Invesco Advisers retains overall responsibility for, and provides services to, sub-advised Invesco Funds, including oversight of the
Affiliated Sub-Advisers as well as the additional services described herein other than day-to-day portfolio management. The Board also noted that the sub-advisory fees are not paid directly by the Fund, but rather, are payable by Invesco Advisers to the Affiliated Sub-Advisers.
| D. | Economies of Scale and Breakpoints |
The Board considered the extent to which there are economies of scale in the provision of advisory services to the Fund. The Board also considered whether the Fund benefits from economies of scale through contractual breakpoints in the Fund’s advisory fee schedule and was assisted in this review by a report from the Senior Officer. The Board also noted that the Fund shares directly in economies of scale through lower fees charged by third party service providers based on the combined size of the Invesco Funds and other clients advised by Invesco Advisers.
| E. | Profitability and Financial Resources |
The Board reviewed information from Invesco Advisers concerning the costs of the advisory and other services that Invesco Advisers and its affiliates provide to the Fund and the profitability of Invesco Advisers and its affiliates in providing these services for the year ended December 31, 2013. The Board received information from Invesco Advisers about the methodology used to prepare the profitability information. The Board considered the profitability of Invesco Advisers in managing the Fund and the Invesco Funds. The Board noted that Invesco Advisers continues to operate at a net profit from services Invesco Advisers and its subsidiaries provide to the Invesco Funds and the Fund. The Board did not deem the level of profits realized by Invesco Advisers and its affiliates from providing services to the Fund to be excessive given the nature, quality and extent of the services provided to the Invesco Funds. The Board received and accepted information from Invesco Advisers demonstrating that Invesco Advisers and each Affiliated Sub-Adviser are financially sound and have the resources necessary to perform their obligations under the investment advisory agreement and sub-advisory contracts.
| F. | Collateral Benefits to Invesco Advisers and its Affiliates |
The Board considered various other benefits received by Invesco Advisers and its affiliates from the relationship with the Fund, including the fees received for their provision of transfer agency and distribution services to the Fund. The Board considered comparative information regarding fees charged for these services, including information provided by Lipper and other independent sources. The Board considered the performance of Invesco Advisers and its affiliates in providing these services and the organizational structure employed to provide these services. The Board also considered that these services are provided to the Fund pursuant to written contracts that are reviewed and approved on an annual basis by the Board; that the services are required for the operation of the Fund; that Invesco Advisers
and its affiliates can provide services, the nature and quality of which are at least equal to those provided by others offering the same or similar services; and that the fees for such services are fair and reasonable in light of the usual and customary charges by others for services of the same nature and quality.
The Board considered the benefits realized by Invesco Advisers and the Affiliated Sub-Advisers as a result of portfolio brokerage transactions executed through “soft dollar” arrangements. The Board noted that soft dollar arrangements shift the payment obligation for research services from Invesco Advisers and the Affiliated Sub-Advisers to the Invesco Funds and that the research received may be used with other clients of Invesco Advisers and may reduce Invesco Advisers’ and the Affiliated Sub-Advisers’ expenses. The Board also considered that it receives periodic reports from the Chief Compliance Officer of the Invesco Funds demonstrating that these arrangements are consistent with regulatory requirements. The Board did not deem the soft dollar arrangements to be inappropriate.
The Board considered that the Fund’s uninvested cash and cash collateral from any securities lending arrangements may be invested in money market funds advised by Invesco Advisers pursuant to procedures approved by the Board. The Board noted that Invesco Advisers receives advisory fees from these affiliated money market funds attributable to such investments, although Invesco Advisers has contractually agreed to waive through varying periods the advisory fees payable by the Invesco Funds with respect to investments in the affiliated money market funds. The waiver is in an amount equal to 100% of the net advisory fee Invesco Advisers receives from the affiliated money market funds with respect to the Fund’s investment in the affiliated money market funds of uninvested cash, but not cash collateral. The Board concluded that the amount of advisory fees received by Invesco Advisors from the Fund’s investment of uninvested cash and cash collateral from any securities lending arrangements in the affiliated money market funds are fair and reasonable.
The Board also considered the Fund may use an affiliated broker to execute certain trades for the Fund to among other things, control information leakage, and were advised that such trades would be executed in compliance with rules under the Investment Company Act of 1940, as amended.
23 Invesco Select Companies Fund
Tax Information
Form 1099-DIV, Form 1042-S and other year–end tax information provide shareholders with actual calendar year amounts that should be included in their tax returns. Shareholders should consult their tax advisors.
The following distribution information is being provided as required by the Internal Revenue Code or to meet a specific state’s requirement.
The Fund designates the following amounts or, if subsequently determined to be different, the maximum amount allowable for its fiscal year ended October 31, 2014:
| | | | |
Federal and State Income Tax | |
Long-Term Capital Gain Distributions | | $ | 76,006,949 | |
Qualified Dividend Income* | | | 0 | % |
Corporate Dividends Received Deduction* | | | 0 | % |
U.S. Treasury Obligations* | | | 0 | % |
| | * | The above percentages are based on ordinary income dividends paid to shareholders during the Fund’s fiscal year. |
24 Invesco Select Companies Fund
Trustees and Officers
The address of each trustee and officer is AIM Investment Funds (Invesco Investment Funds) (the “Trust”), 11 Greenway Plaza, Suite 1000, Houston, Texas 77046-1173. The trustees serve for the life of the Trust, subject to their earlier death, incapacitation, resignation, retirement or removal as more specifically provided in the Trust’s organizational documents. Each officer serves for a one year term or until their successors are elected and qualified. Column two below includes length of time served with predecessor entities, if any.
| | | | | | | | |
Name, Year of Birth and Position(s) Held with the Trust | | Trustee and/
or Officer Since | | Principal Occupation(s) During Past 5 Years | | Number of Funds in Fund Complex Overseen by Trustee | | Other Directorship(s) Held by Trustee During Past 5 Years |
| Interested Persons | | | | | | | | |
| Martin L. Flanagan1 — 1960 Trustee | | 2007 | | Executive Director, Chief Executive Officer and President, Invesco Ltd. (ultimate parent of Invesco and a global investment management firm); Advisor to the Board, Invesco Advisers, Inc. (formerly known as Invesco Institutional (N.A.), Inc.); Trustee, The Invesco Funds; Vice Chair, Investment Company Institute; and Member of Executive Board, SMU Cox School of Business Formerly: Chairman and Chief Executive Officer, Invesco Advisers, Inc. (registered investment adviser); Director, Chairman, Chief Executive Officer and President, IVZ Inc. (holding company), INVESCO Group Services, Inc. (service provider) and Invesco North American Holdings, Inc. (holding company); Director, Chief Executive Officer and President, Invesco Holding Company Limited (parent of Invesco and a global investment management firm); Director, Invesco Ltd.; Chairman, Investment Company Institute and President, Co-Chief Executive Officer, Co-President, Chief Operating Officer and Chief Financial Officer, Franklin Resources, Inc. (global investment management organization). | | 144 | | None |
Philip A. Taylor2 — 1954 Trustee, President and Principal Executive Officer | | 2006 | | Head of North American Retail and Senior Managing Director, Invesco Ltd.; Director, Co-Chairman, Co-President and Co-Chief Executive Officer, Invesco Advisers, Inc. (formerly known as Invesco Institutional (N.A.), Inc.) (registered investment adviser); Director, Chairman, Chief Executive Officer and President, Invesco Management Group, Inc. (formerly known as Invesco Aim Management Group, Inc.) (financial services holding company); Director and President, INVESCO Funds Group, Inc. (registered investment adviser and registered transfer agent); Director and Chairman, Invesco Investment Services, Inc. (formerly known as Invesco Aim Investment Services, Inc.) (registered transfer agent) and IVZ Distributors, Inc. (formerly known as INVESCO Distributors, Inc.) (registered broker dealer); Director, President and Chairman, Invesco Inc. (holding company) and Invesco Canada Holdings Inc. (holding company); Chief Executive Officer, Invesco Corporate Class Inc. (corporate mutual fund company) and Invesco Canada Fund Inc. (corporate mutual fund company); Director, Chairman and Chief Executive Officer, Invesco Canada Ltd. (formerly known as Invesco Trimark Ltd./Invesco Trimark Ltèe) (registered investment adviser and registered transfer agent); Trustee, President and Principal Executive Officer, The Invesco Funds (other than AIM Treasurer’s Series Trust (Invesco Treasurer’s Series Trust) and Short-Term Investments Trust); Trustee and Executive Vice President, The Invesco Funds (AIM Treasurer’s Series Trust (Invesco Treasurer’s Series Trust) and Short-Term Investments Trust only); Director, Invesco Investment Advisers LLC (formerly known as Van Kampen Asset Management); Director, Chief Executive Officer and President, Van Kampen Exchange Corp. Formerly: Director and Chairman, Van Kampen Investor Services Inc.; Director, Chief Executive Officer and President, 1371 Preferred Inc. (holding company) and Van Kampen Investments Inc.; Director and President, AIM GP Canada Inc. (general partner for limited partnerships) and Van Kampen Advisors, Inc.; Director and Chief Executive Officer, Invesco Trimark Dealer Inc. (registered broker dealer); Director, Invesco Distributors, Inc. (formerly known as Invesco Aim Distributors, Inc.) (registered broker dealer); Manager, Invesco PowerShares Capital Management LLC; Director, Chief Executive Officer and President, Invesco Advisers, Inc.; Director, Chairman, Chief Executive Officer and President, Invesco Aim Capital Management, Inc.; President, Invesco Trimark Dealer Inc. and Invesco Trimark Ltd./Invesco Trimark Ltèe; Director and President, AIM Trimark Corporate Class Inc. and AIM Trimark Canada Fund Inc.; Senior Managing Director, Invesco Holding Company Limited; Director and Chairman, Fund Management Company (former registered broker dealer); President and Principal Executive Officer, The Invesco Funds (AIM Treasurer’s Series Trust (Invesco Treasurer’s Series Trust), and Short-Term Investments Trust only); President, AIM Trimark Global Fund Inc. and AIM Trimark Canada Fund Inc. | | 144 | | None |
Wayne W. Whalen3 — 1939 Trustee | | 2010 | | Of Counsel, and prior to 2010, partner in the law firm of Skadden, Arps, Slate, Meagher & Flom LLP, legal counsel to certain funds in the Fund Complex | | 144 | | Director of the Mutual fund Directors Forum, a nonprofit membership organization for investment directors; Chairman and Director of the Abraham Lincoln Presidential Library Foundation; and Director of the Stevenson Center for Democracy |
| 1 | Mr. Flanagan is considered an interested person (within the meaning of Section 2(a)(19) of the 1940 Act) of the Trust because he is an officer of the Adviser to the Trust, and an officer and a director of Invesco Ltd., ultimate parent of the Adviser. |
| 2 | Mr. Taylor is considered an interested person (within the meaning of Section 2(a)(19) of the 1940 Act) of the Trust because he is an officer and a director of the Adviser. |
| 3 | Mr. Whalen is retiring effective December 31, 2014. He has been deemed to be an interested person of the Trust because of his prior service as counsel to the predecessor funds of certain Invesco open-end funds and his affiliation with the law firm that served as counsel to such predecessor funds and the Invesco closed-end funds. |
T-1 Invesco Select Companies Fund
Trustees and Officers—(continued)
| | | | | | | | |
Name, Year of Birth and Position(s) Held with the Trust | | Trustee and/
or Officer Since | | Principal Occupation(s) During Past 5 Years | | Number of Funds in Fund Complex Overseen by Trustee | | Other Directorship(s) Held by Trustee During Past 5 Years |
| Independent Trustees | | | | | | | | |
Bruce L. Crockett — 1944 Trustee and Chair | | 2001 | | Chairman, Crockett Technologies Associates (technology consulting company) Formerly: Director, Captaris (unified messaging provider); Director, President and Chief Executive Officer, COMSAT Corporation; Chairman, Board of Governors of INTELSAT (international communications company); ACE Limited (insurance company); and Investment Company Institute | | 144 | | ALPS (Attorneys Liability Protection Society) (insurance company) |
David C. Arch — 1945 Trustee | | 2010 | | Chairman of Blistex Inc., a consumer health care products manufacturer | | 144 | | Board member of the Illinois Manufacturers’ Association; Member of the Board of Visitors, Institute for the Humanities, University of Michigan; Member of the Audit Committee of the Edward-Elmhurst Hospital |
Frank S. Bayley — 1939 Trustee | | 1987 | | Retired. Formerly: Director, Badgley Funds Inc. (registered investment company) (2 portfolios) and General Partner and Of Counsel, law firm of Baker & McKenzie, LLP | | 144 | | Director and Chairman, C.D. Stimson Company (a real estate investment company); Trustee, The Curtis Institute of Music |
James T. Bunch — 1942 Trustee | | 2003 | | Managing Member, Grumman Hill Group LLC (family office private equity investments) Formerly: Founder, Green Manning & Bunch Ltd. (investment banking firm) (1988-2010); Executive Committee, United States Golf Association; and Director, Policy Studies, Inc. and Van Gilder Insurance Corporation | | 144 | | Chairman, Board of Governors, Western Golf Association; Chairman, Evans Scholars Foundation; and Director, Denver Film Society |
Rodney F. Dammeyer — 1940 Trustee | | 2010 | | Chairman of CAC,LLC, (private company offering capital investment and management advisory services) Formerly: Prior to 2001, Managing Partner at Equity Group Corporate Investments; Prior to 1995, Chief Executive Officer of Itel Corporation (formerly Anixter International); Prior to 1985, experience includes Senior Vice President and Chief Financial Officer of Household International, Inc., Executive Vice President and Chief Financial Officer of Northwest Industries, Inc. and Partner of Arthur Andersen & Co.; From 1987 to 2010, Director/Trustee of investment companies in the Van Kampen Funds complex | | 144 | | Director of Quidel Corporation and Stericycle, Inc. |
Albert R. Dowden — 1941 Trustee | | 2001 | | Director of a number of public and private business corporations, including the Boss Group, Ltd. (private investment and management); Nature’s Sunshine Products, Inc. and Reich & Tang Funds (5 portfolios) (registered investment company) Formerly: Director, Homeowners of America Holding Corporation/Homeowners of America Insurance Company (property casualty company); Director, Continental Energy Services, LLC (oil and gas pipeline service); Director, CompuDyne Corporation (provider of product and services to the public security market) and Director, Annuity and Life Re (Holdings), Ltd. (reinsurance company); Director, President and Chief Executive Officer, Volvo Group North America, Inc.; Senior Vice President, AB Volvo; Director of various public and private corporations; Chairman, DHJ Media, Inc.; Director, Magellan Insurance Company; and Director, The Hertz Corporation, Genmar Corporation (boat manufacturer), National Media Corporation; Advisory Board of Rotary Power International (designer, manufacturer, and seller of rotary power engines); and Chairman, Cortland Trust, Inc. (registered investment company) | | 144 | | Director of: Nature’s Sunshine Products, Inc., Reich & Tang Funds, Homeowners of America Holding Corporation/ Homeowners of America Insurance Company, the Boss Group |
Jack M. Fields — 1952 Trustee | | 2001 | | Chief Executive Officer, Twenty First Century Group, Inc. (government affairs company); Owner and Chief Executive Officer, Dos Angeles Ranch, L.P. (cattle, hunting, corporate entertainment); and Discovery Global Education Fund (non-profit) Formerly: Chief Executive Officer, Texana Timber LP (sustainable forestry company); Director of Cross Timbers Quail Research Ranch (non-profit); and member of the U.S. House of Representatives | | 144 | | Insperity, Inc. (formerly known as Administaff) |
Prema Mathai-Davis — 1950 Trustee | | 2001 | | Retired. Formerly: Chief Executive Officer, YWCA of the U.S.A. | | 144 | | None |
Larry Soll — 1942 Trustee | | 2003 | | Retired. Formerly: Chairman, Chief Executive Officer and President, Synergen Corp. (a biotechnology company) | | 144 | | None |
Hugo F. Sonnenschein — 1940 Trustee | | 2010 | | President Emeritus and Honorary Trustee of the University of Chicago and the Adam Smith Distinguished Service Professor in the Department of Economics at the University of Chicago. Prior to 2000, President of the University of Chicago | | 144 | | Trustee of the University of Rochester and a member of its investment committee; Member of the National Academy of Sciences and the American Philosophical Society; Fellow of the American Academy of Arts and Sciences |
T-2 Invesco Select Companies Fund
Trustees and Officers—(continued)
| | | | | | | | |
Name, Year of Birth and Position(s) Held with the Trust | | Trustee and/
or Officer Since | | Principal Occupation(s) During Past 5 Years | | Number of Funds in Fund Complex Overseen by Trustee | | Other Directorship(s) Held by Trustee During Past 5 Years |
| Independent Trustees—(continued) |
Raymond Stickel, Jr. — 1944 Trustee | | 2005 | | Retired. Formerly: Director, Mainstay VP Series Funds, Inc. (25 portfolios) and Partner, Deloitte & Touche | | 144 | | None |
Suzanne H. Woolsey — 1941 Trustee | | 2014 | | Chief Executive Officer of Woolsey Partners LLC | | 144 | | Emeritus Chair of the Board of Trustees of the Institute for Defense Analyses; Trustee of Colorado College; Trustee of California Institute of Technology; Prior to 2014, Director of Fluor Corp.; Prior to 2010, Trustee of the German Marshall Fund of the United States; Prior to 2010 Trustee of the Rocky Mountain Institute |
| Other Officers | | | | | | | | |
Russell C. Burk — 1958 Senior Vice President and Senior Officer | | 2005 | | Senior Vice President and Senior Officer, The Invesco Funds | | N/A | | N/A |
John M. Zerr — 1962 Senior Vice President, Chief Legal Officer and Secretary | | 2006 | | Director, Senior Vice President, Secretary and General Counsel, Invesco Management Group, Inc. (formerly known as Invesco Aim Management Group, Inc.) and Van Kampen Exchange Corp.; Senior Vice President, Invesco Advisers, Inc. (formerly known as Invesco Institutional (N.A.), Inc.) (registered investment adviser); Senior Vice President and Secretary, Invesco Distributors, Inc. (formerly known as Invesco Aim Distributors, Inc.); Director, Vice President and Secretary, Invesco Investment Services, Inc. (formerly known as Invesco Aim Investment Services, Inc.) and IVZ Distributors, Inc. (formerly known as INVESCO Distributors, Inc.); Director and Vice President, INVESCO Funds Group, Inc.; Senior Vice President, Chief Legal Officer and Secretary, The Invesco Funds; Manager, Invesco PowerShares Capital Management LLC; Director, Secretary and General Counsel, Invesco Investment Advisers LLC (formerly known as Van Kampen Asset Management); Secretary and General Counsel, Invesco Capital Markets, Inc. (formerly known as Van Kampen Funds Inc.) and Chief Legal Officer, PowerShares Exchange-Traded Fund Trust, PowerShares Exchange-Traded Fund Trust II, PowerShares India Exchange-Traded Fund Trust, PowerShares Actively Managed Exchange-Traded Fund Trust; and PowerShares Actively Managed Exchange-Traded Commodity Fund Trust Formerly: Director and Vice President, Van Kampen Advisors Inc.; Director, Vice President, Secretary and General Counsel, Van Kampen Investor Services Inc.; Director, Invesco Distributors, Inc. (formerly known as Invesco Aim Distributors, Inc.); Director, Senior Vice President, General Counsel and Secretary, Invesco Aim Advisers, Inc. and Van Kampen Investments Inc.; Director, Vice President and Secretary, Fund Management Company; Director, Senior Vice President, Secretary, General Counsel and Vice President, Invesco Aim Capital Management, Inc.; Chief Operating Officer and General Counsel, Liberty Ridge Capital, Inc. (an investment adviser); Vice President and Secretary, PBHG Funds (an investment company) and PBHG Insurance Series Fund (an investment company); Chief Operating Officer, General Counsel and Secretary, Old Mutual Investment Partners (a broker-dealer); General Counsel and Secretary, Old Mutual Fund Services (an administrator) and Old Mutual Shareholder Services (a shareholder servicing center); Executive Vice President, General Counsel and Secretary, Old Mutual Capital, Inc. (an investment adviser); and Vice President and Secretary, Old Mutual Advisors Funds (an investment company) | | N/A | | N/A |
Sheri Morris — 1964 Vice President, Treasurer and Principal Financial Officer | | 1999 | | Vice President, Treasurer and Principal Financial Officer, The Invesco Funds; Vice President, Invesco Advisers, Inc. (formerly known as Invesco Institutional (N.A.), Inc.) (registered investment adviser); and Vice President, PowerShares Exchange-Traded Fund Trust, PowerShares Exchange-Traded Fund Trust II, PowerShares India Exchange-Traded Fund Trust, PowerShares Actively Managed Exchange-Traded Fund Trust, and PowerShares Actively Managed Exchange-Traded Commodity Fund Trust Formerly: Vice President, Invesco Aim Advisers, Inc., Invesco Aim Capital Management, Inc. and Invesco Aim Private Asset Management, Inc.; Assistant Vice President and Assistant Treasurer, The Invesco Funds and Assistant Vice President, Invesco Advisers, Inc., Invesco Aim Capital Management, Inc. and Invesco Aim Private Asset Management, Inc.; and Treasurer, PowerShares Exchange-Traded Fund Trust, PowerShares Exchange-Traded Fund Trust II, PowerShares India Exchange-Traded Fund Trust and PowerShares Actively Managed Exchange-Traded Fund Trust | | N/A | | N/A |
T-3 Invesco Select Companies Fund
Trustees and Officers—(continued)
| | | | | | | | |
Name, Year of Birth and Position(s) Held with the Trust | | Trustee and/
or Officer Since | | Principal Occupation(s) During Past 5 Years | | Number of Funds in Fund Complex Overseen by Trustee | | Other Directorship(s) Held by Trustee During Past 5 Years |
| Other Officers—(continued) | | | | | | | | |
Karen Dunn Kelley — 1960 Vice President | | 2004 | | Senior Managing Director, Investments; Director, Co-President, Co-Chief Executive Officer, and Co-Chairman, Invesco Advisers, Inc. (formerly known as Invesco Institutional (N.A.), Inc.) (registered investment adviser); Chairman, Invesco Senior Secured Management, Inc.; Senior Vice President, Invesco Management Group, Inc. (formerly known as Invesco Aim Management Group, Inc.); Executive Vice President, Invesco Distributors, Inc. (formerly known as Invesco Aim Distributors, Inc.); Director, Invesco Mortgage Capital Inc. and Invesco Management Company Limited; Director and President, INVESCO Asset Management (Bermuda) Ltd., Vice President, The Invesco Funds (other than AIM Treasurer’s Series Trust (Invesco Treasurer’s Series Trust) and Short-Term Investments Trust); and President and Principal Executive Officer, The Invesco Funds (AIM Treasurer’s Series Trust (Invesco Treasurer’s Series Trust) and Short-Term Investments Trust only) Formerly: Director, INVESCO Global Asset Management Limited and INVESCO Management S.A.; Senior Vice President, Van Kampen Investments Inc. and Invesco Advisers, Inc. (formerly known as Invesco Institutional (N.A.), Inc.) (registered investment adviser); Vice President, Invesco Advisers, Inc. (formerly known as Invesco Institutional (N.A.), Inc.); Director of Cash Management and Senior Vice President, Invesco Advisers, Inc. and Invesco Aim Capital Management, Inc.; Director and President, Fund Management Company; Chief Cash Management Officer, Director of Cash Management, Senior Vice President, and Managing Director, Invesco Aim Capital Management, Inc.; Director of Cash Management, Senior Vice President, and Vice President, Invesco Advisers, Inc. and The Invesco Funds (AIM Treasurer’s Series Trust (Invesco Treasurer’s Series Trust), and Short-Term Investments Trust only) | | N/A | | N/A |
Crissie M. Wisdom — 1969 Anti-Money Laundering Compliance Officer | | 2013 | | Anti-Money Laundering Compliance Officer, Invesco Advisers, Inc. (formerly known as Invesco Institutional (N.A.), Inc.) (registered investment adviser), Invesco Capital Markets, Inc. (formerly known as Van Kampen Funds Inc.), Invesco Distributors, Inc., Invesco Investment Services, Inc., Invesco Management Group, Inc., Van Kampen Exchange Corp., The Invesco Funds, and PowerShares Exchange-Traded Fund Trust, PowerShares Exchange-Traded Fund Trust II, PowerShares India Exchange-Traded Fund Trust, PowerShares Actively Managed Exchange-Traded Fund Trust and PowerShares Actively Managed Exchange-Traded Commodity Fund Trust; and Fraud Prevention Manager and Controls and Risk Analysis Manager for Invesco Investment Services, Inc. | | N/A | | N/A |
Todd L. Spillane — 1958 Chief Compliance Officer | | 2006 | | Senior Vice President, Invesco Management Group, Inc. (formerly known as Invesco Aim Management Group, Inc.) and Van Kampen Exchange Corp.; Senior Vice President and Chief Compliance Officer, Invesco Advisers, Inc. (registered investment adviser) (formerly known as Invesco Institutional (N.A.), Inc.); Chief Compliance Officer, The Invesco Funds; Vice President, Invesco Distributors, Inc. (formerly known as Invesco Aim Distributors, Inc.) and Invesco Investment Services, Inc. (formerly known as Invesco Aim Investment Services, Inc.) Formerly: Chief Compliance Officer, Invesco Funds (Chicago); Senior Vice President, Van Kampen Investments Inc.; Senior Vice President and Chief Compliance Officer, Invesco Aim Advisers, Inc. and Invesco Aim Capital Management, Inc.; Chief Compliance Officer, INVESCO Private Capital Investments, Inc. (holding company), Invesco Private Capital, Inc. (registered investment adviser), Invesco Global Asset Management (N.A.), Inc., Invesco Senior Secured Management, Inc. (registered investment adviser), Van Kampen Investor Services Inc., PowerShares Exchange-Traded Fund Trust, PowerShares Exchange-Traded Fund Trust II, PowerShares India Exchange-Traded Fund Trust and PowerShares Actively Managed Exchange-Traded Fund Trust; and Vice President, Invesco Aim Capital Management, Inc. and Fund Management Company | | N/A | | N/A |
The Statement of Additional Information of the Trust includes additional information about the Fund’s Trustees and is available upon request, without charge, by calling 1.800.959.4246. Please refer to the Fund’s prospectus for information on the Fund’s sub-advisers.
| | | | | | |
Office of the Fund 11 Greenway Plaza, Suite 1000 Houston, TX 77046-1173 | | Investment Adviser Invesco Advisers, Inc. 1555 Peachtree Street, N.E. Atlanta, GA 30309 | | Distributor Invesco Distributors, Inc. 11 Greenway Plaza, Suite 1000 Houston, TX 77046-1173 | | Auditors PricewaterhouseCoopers LLP 1000 Louisiana Street, Suite 5800 Houston, TX 77002-5678 |
| | | |
| | | | | | |
Counsel to the Fund Stradley Ronon Stevens & Young, LLP 2005 Market Street, Suite 2600 Philadelphia, PA 19103-7018 | | Counsel to the Independent Trustees Goodwin Procter LLP 901 New York Avenue, N.W. Washington, D.C. 20001 | | Transfer Agent Invesco Investment Services, Inc. 11 Greenway Plaza, Suite 1000 Houston, TX 77046-1173 | | Custodian State Street Bank and Trust Company 225 Franklin Street Boston, MA 02110-2801 |
T-4 Invesco Select Companies Fund

Invesco mailing information
Send general correspondence to Invesco Investment Services, Inc., P.O. Box 219078, Kansas City, MO 64121-9078.
Important notice regarding delivery of security holder documents
To reduce Fund expenses, only one copy of most shareholder documents may be mailed to shareholders with multiple accounts at the same address (Householding). Mailing of your shareholder documents may be householded indefinitely unless you instruct us otherwise. If you do not want the mailing of these documents to be combined with those for other members of your household, please contact Invesco Investment Services, Inc. at 800 959 4246 or contact your financial institution. We will begin sending you individual copies for each account within 30 days after receiving your request.
Fund holdings and proxy voting information
The Fund provides a complete list of its holdings four times in each fiscal year, at the quarter ends. For the second and fourth quarters, the lists appear in the Fund’s semiannual and annual reports to shareholders. For the first and third quarters, the Fund files the lists with the Securities and Exchange Commission (SEC) on Form N-Q. The most recent list of portfolio holdings is available at invesco.com/completeqtrholdings. Shareholders can also look up the Fund’s Forms N-Q on the SEC website at sec.gov. Copies of the Fund’s Forms N-Q may be reviewed and copied at the SEC Public Reference Room in Washington, D.C. You can obtain information on the operation of the Public Reference Room, including information about duplicating fee charges, by calling 202 551 8090 or 800 732 0330, or by electronic request at the following email address: publicinfo@sec.gov. The SEC file numbers for the Fund are shown below.
A description of the policies and procedures that the Fund uses to determine how to vote proxies relating to portfolio securities is available without charge, upon request, from our Client Services department at 800 959 4246 or at invesco.com/proxyguidelines. The information is also available on the SEC website, sec.gov.
| | |
Information regarding how the Fund voted proxies related to its portfolio securities during the most recent 12-month period ended June 30 is available at invesco.com/proxysearch. The information is also available on the SEC website, sec.gov. Invesco Advisers, Inc. is an investment adviser; it provides investment advisory services to individual and institutional clients and does not sell securities. Invesco Distributors, Inc. is the US distributor for Invesco Ltd.’s retail mutual funds, exchange-traded funds and institutional money market funds. Both are wholly owned, indirect subsidiaries of Invesco Ltd. | |  |
| | | | |
| SEC file numbers: 811-05426 and 033-19338 | | SCO-AR-1 | | Invesco Distributors, Inc. |
Letters to Shareholders
| | |

Philip Taylor | | Dear Shareholders: This annual report includes information about your Fund, including performance data and a complete list of its investments as of the close of the reporting period. Inside, your Fund’s portfolio managers discuss how they managed your Fund and the factors that affected its performance during the reporting period. I hope you find this report of interest. During the reporting period covered by this report, the US economy showed signs of continued improvement. After contracting in the first quarter of 2014, the economy expanded strongly in the second quarter and unemployment trended lower. Much of the credit for this improvement goes to the US Federal Reserve (the Fed), which undertook an extraordinary asset purchase program following the global financial crisis. The Fed’s goal was to jumpstart the economy by encouraging banks to lend more, businesses to hire more and consumers to spend more. Signs of a stronger US economy prompted the Fed to reduce, or “taper,” its asset purchase program. Despite this, interest rates remained near historical low levels due |
largely to heavy investor demand for bonds. While signs of economic improvement were evident in the US, European economies showed signs of weakening. That, together with geopolitical uncertainty and worries about the first diagnosed cases of Ebola outside of Africa, caused increased volatility in US and European equities.
Extended periods of market strength can lull investors into complacency – just as prolonged periods of market weakness or volatility can discourage investors from initiating long-term investment plans. That’s why Invesco has always encouraged investors to work with a professional financial adviser who can stress the importance of starting to save and invest early and the importance of adhering to a disciplined investment plan – when times are good and when they’re uncertain. A financial adviser who knows your unique financial situation, investment goals and risk tolerance can be an invaluable partner as you seek to achieve your financial goals. He or she can offer a long-term perspective when markets are volatile and time-tested advice and guidance when your financial situation or investment goals change.
Timely information when and where you want it
Invesco’s efforts to help investors achieve their financial objectives include providing individual investors and financial professionals with timely information about the markets, the economy and investing – whenever and wherever they want it.
Our website, invesco.com/us, offers a wide range of market insights and investment perspectives. On the website, you’ll find detailed information about our funds, including prices, performance, holdings and portfolio manager commentaries. You can access information about your individual Invesco account whenever it’s convenient for you; just complete a simple, secure online registration. Use the “Log In” box on our home page to get started.
Invesco’s mobile app for iPad® (available free from the App StoreSM) allows you to obtain the same detailed information about your Fund and the same investment insights from our investment leaders, market strategists, economists and retirement experts on the go. You also can watch portfolio manager videos and have instant access to Invesco news and updates wherever you may be.
In addition to the resources accessible on our website and through our mobile app, you can obtain timely updates to help you stay informed about the markets, the economy and investing by connecting with Invesco on Twitter, LinkedIn or Facebook. You can access our blog at blog.invesco.us.com. Our goal is to provide you the information you want, when and where you want it.
Have questions?
For questions about your account, feel free to contact an Invesco client services representative at 800 959 4246. For Invesco-related questions or comments, please email me directly at phil@invesco.com.
All of us at Invesco look forward to serving your investment management needs for many years to come. Thank you for investing with us.
Sincerely,

Philip Taylor
Senior Managing Director, Invesco Ltd.
iPad is a trademark of Apple Inc., registered in the US and other countries. App Store is a service mark of Apple Inc. Invesco Distributors, Inc. is not affiliated with Apple Inc.
2 Invesco Strategic Income Fund
| | |

Bruce Crockett | | Dear Fellow Shareholders: There are a variety of factors that can impact investment performance, many of which are uncontrollable by us as investors. These factors can include various economic trends and geopolitical developments. While the members of the Invesco Funds Board, which I chair, can’t dictate the performance of the Invesco funds, be assured that your Board works diligently throughout the year to focus on how your investments are managed. Our job is to represent you and your interests on a variety of fund management-related matters. We regularly monitor how the portfolio management teams of the Invesco funds are performing in light of ever-changing and often unpredictable economic and market conditions. We review the investment strategies and investment process employed by each fund’s management team as explained in the fund’s prospectus. |
| | Perhaps our most significant responsibility is conducting the annual review of the funds’ |
advisory and sub-advisory contracts with Invesco Advisers and its affiliates. This annual review, which is required by the Investment Company Act of 1940, focuses on the nature and quality of the services Invesco provides as the adviser to the Invesco funds and the reasonableness of the fees that it charges for those services. Each year, we spend months carefully reviewing information from Invesco that allows us to evaluate the quality of its services and the reasonableness of its fees. We also use information from a variety of independent sources, including materials provided by the independent senior officer of the Invesco funds, who reports directly to the independent trustees on the Board. Additionally, we meet with legal counsel and review performance and fee data prepared for us by Lipper Inc., an independent, third-party firm widely recognized as a leader in its field.
After a careful review, the members of the Invesco Funds Board approved the continuation of advisory and sub-advisory contracts with Invesco Advisers and its affiliates. Be assured that your Board will continue working on behalf of fund shareholders, keeping your needs and interests uppermost in our minds.
As always, please contact me at bruce@brucecrockett.com with any questions or concerns you may have. On behalf of the Board, we look forward to continuing to represent your interests and serving your needs.
Sincerely,

Bruce L. Crockett
Independent Chair
Invesco Funds Board of Trustees
3 Invesco Strategic Income Fund
Management’s Discussion of Fund Performance
Performance summary
Invesco Strategic Income Fund incepted on May 2, 2014. For the reporting period ended October 31, 2014, the Fund, at net asset value (NAV), delivered positive absolute returns and performed in line with the Barclays U.S. Aggregate Index, the Fund’s broad market/style-specific benchmark.
Additional information about your Fund’s performance appears later in this report.
Fund vs. Indexes
Cumulative total returns, 5/2/14 to 10/31/14, at net asset value (NAV). Performance shown does not include applicable contingent deferred sales charges (CDSC) or front-end sales charges, which would have reduced performance.
| | | | |
Class A Shares | | | 2.19 | % |
Class C Shares | | | 1.86 | |
Class R Shares | | | 2.08 | |
Class Y Shares | | | 2.29 | |
Class R5 Shares | | | 2.29 | |
Class R6 Shares | | | 2.29 | |
Barclays U.S. Aggregate Indexq (Broad Market/Style-Specific Index) | | | 2.07 | |
Lipper Multi-Sector Income Funds Indexn (Peer Group Index) | | | 1.38 | |
Source(s): qFactSet Research Systems Inc.; nLipper Inc.
Market conditions and your Fund
During the reporting period ended October 31, 2014, economic data, global central bank stimulus and investors’ demand for yield drove rallies in credit-related markets, such as emerging market debt and high yield corporate bonds. While a favorable supply/demand dynamic and solid credit fundamentals throughout most of the reporting period created an environment in which investors were willing to assume somewhat greater risk, credit markets experienced notable volatility near the end of the reporting period. As the reporting period drew to a close, investors once again favored credit risk assets despite slower economic activity and escalating geopolitical concerns.
In this environment, the Fund, at NAV since its inception on May 2, 2014, delivered positive absolute returns and performed in line with its broad market/style-specific benchmark, the Barclays U.S. Aggregate Index. The Fund’s returns versus the benchmark were impacted by a variety of active top-down and bottom-up investment decisions. Our sector rotation, security selection and yield curve and duration positioning decisions affected the Fund’s absolute and relative performance over the reporting period. Please note that the Fund has been in existence for less than one year; cumulative performance may not be indicative of the Fund’s long-term performance potential.
Among the sector allocation decisions, our positions in municipal bonds, residential mortgage-backed securities (MBS)
and emerging market debt were some of the most beneficial allocations, but their gains were offset by less favorable returns from bank loans, non-US dollar-denominated holdings and a drag on relative return created by our cash position versus our broad market/style-specific benchmark. Our security selection versus the Fund’s broad market/style-specific benchmark was a contributor to our relative performance.
Please note that our strategy is implemented using derivative instruments, including futures, forwards, swaps and options. Therefore, a portion of the performance of the strategy, both positive and negative, can be attributed to these instruments. Derivatives can be a cost-effective way to gain or hedge exposure to certain risks. However, derivatives may amplify traditional investment risks through the creation of leverage and may be less liquid than traditional securities.
Thank you for your investment in the Invesco Strategic Income Fund.
The views and opinions expressed in management’s discussion of Fund performance are those of Invesco Advisers, Inc. These views and opinions are subject to change at any time based on factors such as market and economic conditions. These views and opinions may not be relied upon as investment advice or recommendations, or as an offer for a particular security. The information is not a complete analysis of every aspect of any market, country, industry, security or the Fund. Statements of fact are from sources considered reliable, but Invesco Advisers, Inc. makes no representation or warranty as to their completeness or accuracy. Although historical performance is no guarantee of future results, these insights may help you understand our investment management philosophy.
See important Fund and, if applicable, index disclosures later in this report.
| | | | |
| Portfolio Composition | | | |
| By security type | |
| | | | |
Asset-Backed Securities | | | 41.2 | % |
Common Stocks | | | 21.3 | |
U.S. Dollar-Denominated | | | | |
Bonds & Notes | | | 14.5 | |
Non-U.S. Dollar-Denominated | | | | |
Bonds & Notes | | | 8.0 | |
Municipal Obligations | | | 6.6 | |
U.S. Treasury Securities | | | 6.1 | |
Money Market Funds | | | | |
Plus Other Assets Less Liabilities | | | 2.3 | |
| | | | | | |
Top Five Debt Issuers* | | | |
| | | |
| 1. | | U.S. Treasury | | | 6.1 | % |
| 2. | | Wells Fargo Mortgage Backed Securities Trust | | | 4.5 | |
| 3. | | Freddie Mac | | | 2.6 | |
| 4. | | Portugal Obrigacoes do Tesouro OT | | | 2.5 | |
| 5. | | JP Morgan Mortgage Trust | | | 2.5 | |
| | | | |
| Total Net Assets | | | $27.9 million | |
| |
| Total Number of Holdings* | | | 97 | |
The Fund’s holdings are subject to change, and there is no assurance that the Fund will continue to hold any particular security.
*Excluding money market fund holdings.
4 Invesco Strategic Income Fund
| | |

| | Ivan Bakrac Portfolio Manager and Head of Multi-Sector Portfolio Management for Invesco Fixed Income, is manager |
of Invesco Strategic Income Fund. He joined Invesco in 2014. Mr. Bakrac earned a BBA in finance and investments from Baruch College and an MS in financial engineering from Polytechnic Institute of New York University.
| | |

| | Thomas Ewald Portfolio Manager, is manager of Invesco Strategic Income Fund. He joined Invesco in 2000. |
Mr. Ewald earned a BA from Harvard College and an MBA from the University of Virginia Darden School of Business.
| | |

| | Michael Hyman Portfolio Manager, is manager of Invesco Strategic Income Fund. He joined Invesco in 2013. |
Mr. Hyman earned a BSE in finance from Pennsylvania State University and an MBA from the Stern School of Business at New York University.
| | |

| | Joseph Portera Portfolio Manager, is manager of Invesco Strategic Income Fund. He joined Invesco in 2012. |
Mr. Portera earned BA and MA degrees in Soviet studies and an MA in international political economy and development from Fordham University.
| | |

| | Robert Waldner Chartered Financial Analyst, Portfolio Manager, is manager of Invesco Strategic Income Fund. He |
joined Invesco in 2013. Mr. Waldner earned a BSE degree in civil engineering from Princeton University.
5 Invesco Strategic Income Fund
Your Fund’s Performance
| | | | |
| Cumulative Total Returns | |
As of 10/31/14, including maximum applicable sales charges | |
| |
| Class A Shares | | | | |
Inception (5/2/14) | | | -2.12 | % |
| |
| Class C Shares | | | | |
Inception (5/2/14) | | | 0.86 | % |
| |
| Class R Shares | | | | |
Inception (5/2/14) | | | 2.08 | % |
| |
| Class Y Shares | | | | |
Inception (5/2/14) | | | 2.29 | % |
| |
| Class R5 Shares | | | | |
Inception (5/2/14) | | | 2.29 | % |
| |
| Class R6 Shares | | | | |
Inception (5/2/14) | | | 2.29 | % |
The performance data quoted represent past performance and cannot guarantee comparable future results; current performance may be lower or higher. Please visit invesco.com/performance for the most recent month-end performance. Performance figures reflect reinvested distributions, changes in net asset value and the effect of the maximum sales charge unless otherwise stated. Performance figures do not reflect deduction of taxes a shareholder would pay on Fund distributions or sale of Fund shares. Investment return and principal value will fluctuate so that you may have a gain or loss when you sell shares.
The net annual Fund operating expense ratio set forth in the most recent Fund prospectus as of the date of this report for Class A, Class C, Class R, Class Y, Class R5 and Class R6 shares was 0.85%, 1.60%, 1.10%, 0.60%, 0.60% and 0.60%, respectively.1,2 The total annual Fund operating expense ratio set forth in the most recent Fund prospectus as of the date of this report for Class A, Class C, Class R, Class Y, Class R5 and Class R6 shares was 1.77%, 2.52%, 2.02%, 1.52%, 1.53% and 1.48%, respectively. The expense ratios presented above may vary from the expense ratios presented in other sections of this report that are based on expenses incurred during the period covered by this report.
| | | | |
| Cumulative Total Returns | |
| As of 9/30/14, the most recent calendar quarter end, including maximum applicable sales charges | |
| |
| Class A Shares | | | | |
Inception (5/2/14) | | | -2.53 | % |
| |
| Class C Shares | | | | |
Inception (5/2/14) | | | 0.50 | % |
| |
| Class R Shares | | | | |
Inception (5/2/14) | | | 1.67 | % |
| |
| Class Y Shares | | | | |
Inception (5/2/14) | | | 1.94 | % |
| |
| Class R5 Shares | | | | |
Inception (5/2/14) | | | 1.94 | % |
| |
| Class R6 Shares | | | | |
Inception (5/2/14) | | | 1.94 | % |
Class A share performance reflects the maximum 4.25% sales charge, and Class C share performance reflects the applicable contingent deferred sales charge (CDSC) for the period involved. The CDSC on Class C shares is 1% for the first year after purchase. Class R, Class Y, Class R5 and Class R6 shares do not have a front-end sales charge or a CDSC; therefore, performance is at net asset value.
The performance of the Fund’s share classes will differ primarily due to different sales charge structures and class expenses.
Had the adviser not waived fees and/or reimbursed expenses, performance would have been lower.
| 1 | Total annual Fund operating expenses after any contractual fee waivers and/or expense reimbursements by the adviser in effect through at least February 29, 2016. See current prospectus for more information. |
| 2 | Total annual Fund operating expenses after any contractual fee waivers and/or expense reimbursements by the adviser in effect through at least June 30, 2016. See current prospectus for more information. |
6 Invesco Strategic Income Fund
Invesco Strategic Income Fund’s investment objective is to provide current income and, secondarily, long-term growth of capital.
| n | | Unless otherwise stated, information presented in this report is as of October 31, 2014, and is based on total net assets. |
| n | | Unless otherwise noted, all data provided by Invesco. |
| n | | To access your Fund’s reports/prospectus, visit invesco.com/fundreports. |
About share classes
| n | | Class R shares are generally available only to employer sponsored retirement and benefit plans. Please see the prospectus for more information. |
| n | | Class Y shares are available only to certain investors. Please see the prospectus for more information. |
| n | | Class R5 shares and Class R6 shares are primarily intended for employer sponsored retirement and benefit plans that meet certain standards and for institutional investors. Please see the prospectus for more information. |
Principal risks of investing in the Fund
| n | | Active trading risk. The Fund engages in frequent trading of portfolio securities. Active trading results in added expenses and may result in a lower return and increased tax liability. |
| n | | Changing fixed income market conditions risk. The current historically low interest rate environment was created in part by the Federal Reserve Board (FRB) and certain foreign central banks keeping the federal funds and equivalent foreign rates at or near zero. There is a risk that interest rates will rise when the FRB and central banks raise these rates. This risk is heightened due to the “tapering” of the FRB’s quantitative easing program and other similar foreign central bank actions. This tapering and eventual increase in the federal funds and equivalent foreign rates may expose fixed income markets to heightened volatility and reduced liquidity for certain fixed income investments, particularly those with longer maturities. In addition, decreases in fixed income dealer market-making capacity may also potentially lead to heightened volatility and reduced liquidity in the fixed income markets. As a result, the value of the Fund’s investments and share price may decline. Changes in central bank policies could also result in higher than normal shareholder redemptions, which could |
| | | potentially increase portfolio turnover and the Fund’s transaction costs. |
| n | | Collateralized loan obligations risk. In addition to the normal interest rate, default and other risk of fixed income securities, collateralized loan obligations carry additional risks, including the possibility that distributions from collateral securities will not be adequate to make interest or other payments, the quality of the collateral may decline in value or default, the Fund may invest in collateralized loan obligations that are subordinate to other classes, values may be volatile, and disputes with the issuer may produce unexpected investment results. |
| n | | Convertible securities risk. The Fund may own convertible securities, the value of which may be affected by market interest rates, the risk that the issuer will default, the value of the underlying stock or the right of the issuer to buy back the convertible securities. |
| n | | Credit risk. The issuer of instruments in which the Fund invests may be unable to meet interest and/or principal payments, thereby causing its instruments to decrease in value and lowering the issuer’s credit rating. |
| n | | Currency/exchange rate risk. The dollar value of the Fund’s foreign investments will be affected by changes in the exchange rates between the dollar and the currencies in which those investments are traded. |
| n | | Derivatives risk. The value of a derivative instrument depends largely on (and is derived from) the value of an underlying security, currency, commodity, interest rate, index or other asset (each referred to as an underlying asset). In addition to risks relating to the underlying assets, the use of derivatives may include other, possibly greater, risks, including counterparty, leverage and liquidity risks. Counterparty risk is the risk that the counterparty to the derivative contract will default on its obligation to pay the Fund the amount owed or otherwise perform under the derivative contract. |
| | Derivatives create leverage risk because they do not require payment up front equal to the economic exposure created by owning the derivative. As a result, an adverse change in the value of the underlying asset could result in the Fund sustaining a loss that is substantially greater than the amount invested in the derivative, which may make the Fund’s returns more volatile and increase the risk of loss. Derivative instruments may also be less liquid than more traditional investments and the Fund may be unable to sell or close out its derivative positions at a desirable time or price. This risk may be more acute under adverse market conditions, during which the Fund may be most in need of liquidating its derivative positions. Derivatives may also be harder to value, less tax efficient and subject to changing government regulation that could impact the Fund’s ability to use certain derivatives or their cost. Also, derivatives used for hedging or to gain or limit exposure to a particular market segment may not provide the expected benefits, particularly during adverse market conditions. |
| n | | Emerging markets securities risk. The prices of securities issued by foreign companies and governments located in emerging markets countries may be affected more negatively by inflation, devaluation of their currencies, higher transaction costs, delays in settlement, adverse political developments, the introduction of capital controls, withholding taxes, nationalization of private assets, expropriation, social unrest, war or lack of timely information than those in developed countries. |
| n | | Floating rate risk. The Fund may invest in senior secured floating rate loans and debt securities that require collateral. There is a risk that the value of the collateral may not be sufficient to cover the amount owed, collateral securing a loan may be found invalid, and collateral may be used to pay other outstanding obligations of the borrower under applicable law or may be difficult to sell. There is also the risk that the collateral may be difficult to liquidate, or that a majority of the collateral may be illiquid. |
continued on page 8
This report must be accompanied or preceded by a currently effective Fund prospectus, which contains more complete information, including sales charges and expenses. Investors should read it carefully before investing.
NOT FDIC INSURED | MAY LOSE VALUE | NO BANK GUARANTEE
7 Invesco Strategic Income Fund
continued from page 7
| n | | Foreign government debt risk. Investments in foreign government debt obligations involve certain risks in addition to those relating to foreign securities or debt securities generally. The issuer of the debt or the governmental authorities that control the repayment of the debt may be unable or unwilling to repay principal or interest when due in accordance with the terms of such debt, and the Fund may have limited recourse in the event of a default against the defaulting government. Without the approval of debt holders, some governmental debtors have in the past been able to reschedule or restructure their debt payments or declare moratoria on payments. |
| n | | Foreign securities risk. The Fund’s foreign investments may be affected by changes in a foreign country’s exchange rates, political and social instability, changes in economic or taxation policies, difficulties when enforcing obligations, decreased liquidity, and increased volatility. Foreign companies may be subject to less regulation resulting in less publicly available information about the companies. |
| n | | High yield bond (junk bond) risk. High yield bonds (commonly referred to as junk bonds) involve a greater risk of default or price changes due to changes in the credit quality of the issuer. The values of junk bonds fluctuate more than those of high- quality bonds in response to company, political, regulatory or economic developments. Values of junk bonds can decline significantly over short periods of time. |
| n | | Income risk. The income you receive from the Fund is based primarily on prevailing interest rates, which can vary widely over the short- and long-term. If interest rates drop, your income from the Fund may drop as well. |
| n | | Inflation-indexed security risk. The risk that the value of an inflation indexed security tends to decrease when real interest rates increase and increase when real interest rates decrease. Interest payments on US inflation-protected securities will vary along with changes in the Consumer Price Index. |
| n | | Interest rate risk. Interest rate risk refers to the risk that bond prices generally fall as interest rates rise; conversely, bond prices generally rise as interest rates fall. Specific bonds differ in their sensitivity to changes in interest rates depending on their individual characteristics, including duration. |
| n | | Liquidity risk. The Fund may hold illiquid securities that it is unable to sell at the preferred time or price and could lose its entire investment in such securities. The Fund’s significant use of derivative instruments may cause liquidity risk to be greater than other mutual funds that invest in more traditional assets such as stocks and bonds, which trade on markets with more market participants. |
| n | | Management risk. The investment techniques and risk analysis used by the Fund’s portfolio managers may not produce the desired results. Because the Fund’s investment process relies heavily on its asset allocation process, market movements that are counter to the portfolio managers’ expectations may have a significant adverse effect on the Fund’s net asset value. |
| n | | Market risk. The prices of and the income generated by the Fund’s securities may decline in response to, among other things, investor sentiment, general economic and market conditions, regional or global instability, and currency and interest rate fluctuations. |
| n | | Mortgage- and asset-backed securities risk. The Fund may invest in mortgage- and asset-backed securities that are subject to prepayment or call risk, which is the risk that the borrower’s payments may be received earlier or later than expected due to changes in prepayment rates on underlying loans. Faster prepayments often happen when interest rates are falling. As a result, the Fund may reinvest these early payments at lower interest rates, thereby reducing the Fund’s income. Conversely, when interest rates rise, prepayments may happen more slowly, causing the security to lengthen in duration. Longer duration securities tend to be more volatile. Securities may be prepaid at a price less than the original purchase value. An unexpectedly high rate of defaults on the mortgages held by a mortgage pool may adversely affect the value of mortgage-backed securities and could result in losses to the Fund. The risk of such defaults is generally higher in the case of mortgage pools that include subprime mortgages. Subprime mortgages refer to loans made to borrowers with weakened credit histories or with lower capacity to make timely payments on their mortgages. |
| n | | Municipal securities risk. The Fund may invest in municipal securities. Constitutional amendments, legislative enactments, |
| | | executive orders, administrative regulations, voter initiatives, and the issuer’s regional economic conditions may affect the municipal security’s value, interest payments, repayment of principal and the Fund’s ability to sell it. Failure of a municipal security issuer to comply with applicable tax requirements may make income paid thereon taxable, resulting in a decline in the security’s value. In addition, there could be changes in applicable tax laws or tax treatments that reduce or eliminate the current federal income tax exemption on municipal securities or otherwise adversely affect the current federal or state tax status of municipal securities. |
| n | | Non-diversification risk. The Fund is non-diversified, meaning it can invest a greater portion of its assets in the obligations or securities of a small number of issuers or any single issuer than a diversified fund can. To the extent that a large percentage of the Fund’s net assets may be invested in a limited number of issuers, a change in the value of the issuers’ securities could affect the value of the Fund more than would occur in a diversified fund. |
| n | | Prepayment risk. An issuer’s ability to prepay principal on a loan or debt security prior to maturity can limit the Fund’s potential gains. Prepayments may require the Fund to replace the loan or debt security with a lower yielding security, adversely affecting the Fund’s yield. |
| n | | Reinvestment risk. Reinvestment risk is the risk that a bond’s cash flows (coupon income and principal repayment) will be reinvested at an interest rate below that on the original bond. |
| n | | Short sales risk. Short sales may cause the Fund to repurchase a security at a higher price, thereby causing a loss. A short position in a security poses more risk than holding the same security long. As there is no limit on how much the price of the security can increase, the Fund’s exposure is unlimited. In order to establish a short position in a security, the Fund must borrow the security from a broker. The Fund may not always be able to borrow a security the Fund seeks to sell short at a particular time or at an acceptable price. The Fund also may not always be able to close out the short position by replacing the borrowed securities at a particular time or at an acceptable price. The Fund will incur increased transaction |
continued on page 9
8 Invesco Strategic Income Fund
| | costs associated with selling securities short. In addition, taking short positions in securities results in a form of leverage which may cause the Fund to be volatile. |
| n | | TBA transactions risk. TBA transactions involve the risk that the securities received may be less favorable than what was anticipated by the Fund when entering into the TBA transaction. TBA transactions also involve the risk that a counterparty will fail to deliver the securities, exposing the Fund to further losses. Whether or not the Fund takes delivery of the securities at the termination date of a TBA transaction, the Fund will nonetheless be exposed to changes in the value of the underlying investments during the term of the agreement. When the Fund enters into a short sale of a TBA mortgage it does not own, the Fund may have to purchase deliverable mortgages to settle the short sale at a higher price than anticipated, thereby causing a loss. A short position in a TBA mortgage poses more risk than holding the same TBA mortgage long. As there is no limit on how much the price of mortgage securities can increase, the Fund’s exposure is unlimited. The Fund may not always be able to purchase mortgage securities to close out the short position at a particular time or at an acceptable price. A Fund will earmark or segregate liquid assets in an amount at least equal to its exposure for the duration of the contract. The Fund will incur increased transaction costs associated with selling TBA mortgages short. In addition, taking short positions in TBA mortgages results in a form of leverage which could increase the volatility of the Fund’s share price. |
| n | | US government obligations risk. The Fund may invest in obligations issued by US government agencies and instrumentalities that may receive varying levels of support from the government, which could affect the Fund’s ability to recover should they default. |
| n | | When-issued and delayed delivery risk. When-issued and delayed delivery transactions are subject to market risk as the value or yield of a security at delivery may be more or less than the purchase price or the yield generally available on securities when delivery occurs. In addition, the Fund is subject to counterparty risk because it relies on the buyer or seller, as the case may be, to consummate |
| | | the transaction, and failure by the other party to complete the transaction may result in the Fund missing the opportunity of obtaining a price or yield considered to be advantageous. |
| n | | Yield risk. The Fund’s yield will vary as the short-term securities in its portfolio mature or are sold and the proceeds are reinvested in other securities. Additionally, inflation may outpace and diminish investment returns over time. |
| n | | Zero coupon or pay-in-kind securities risk. The value, interest rates, and liquidity of non-cash paying instruments, such as zero coupon and pay-in-kind securities, are subject to greater fluctuation than other types of securities. The higher yields and interest rates on pay-in-kind securities reflect the payment deferral and increased credit risk associated with such instruments and that such investments may represent a higher credit risk than coupon loans. Pay-in-kind securities may have a potential variability in valuations because their continuing accruals require continuing judgments about the collectability of the deferred payments and the value of any associated collateral. |
About indexes used in this report
| n | | The Barclays U.S. Aggregate Index is an unmanaged index considered representative of the US investment-grade, fixed-rate bond market. |
| n | | The Lipper Multi-Sector Income Funds Index is an unmanaged index considered representative of multi-sector income funds tracked by Lipper. |
| n | | The Fund is not managed to track the performance of any particular index, including the index(es) described here, and consequently, the performance of the Fund may deviate significantly from the performance of the
index(es). |
| n | | A direct investment cannot be made in an index. Unless otherwise indicated, index results include reinvested dividends, and they do not reflect sales charges. Performance of the peer group, if applicable, reflects fund expenses; performance of a market index does not. |
Other information
| n | | The returns shown in management’s discussion of Fund performance are based on net asset values (NAVs) calculated for shareholder transactions. Generally accepted accounting principles require adjustments to be made to |
| | the net assets of the Fund at period end for financial reporting purposes, and as such, the NAVs for shareholder transactions and the returns based on those NAVs may differ from the NAVs and returns reported in the Financial Highlights. |
| n | | Industry classifications used in this report are generally according to the Global Industry Classification Standard, which was developed by and is the exclusive property and a service mark of MSCI Inc. and Standard & Poor’s. |
9 Invesco Strategic Income Fund
Schedule of Investments(a)
October 31, 2014
| | | | | | | | |
| | | Principal
Amount | | | Value | |
Asset-Backed Securities–41.18% | |
Babson Euro CLO 2014-2 B.V. (Netherlands), Series 2014-2A, Class D, Floating Rate Pass Through Ctfs.,
0.00%, 11/25/27(b)(c)(d) | | EUR | 250,000 | | | $ | 304,221 | |
Babson Mid-Market CLO Inc. 2007-II (Cayman Islands), Series 2007-2A, Class E, Floating Rate Pass Through Ctfs., 3.88%, 04/15/21(c) | | $ | 500,000 | | | | 487,900 | |
BAMLL Commercial Mortgage Securities Trust, Series 2014-ICTS, Class C, Floating Rate Pass Through Ctfs., 1.55%, 06/15/28(b)(c) | | | 200,000 | | | | 199,709 | |
Banc of America Commercial Mortgage Trust, Series 2006-2, Class AJ, Variable Rate Pass Through Ctfs., 5.95%, 05/10/45(c) | | | 540,000 | | | | 568,003 | |
Banc of America Funding Trust, Series 2006-3, Class 5A5, Pass Through Ctfs., 5.50%, 03/25/36 | | | 218,223 | | | | 209,111 | |
Bear Stearns Commercial Mortgage Securities Trust,
Series 2005-PWR9, Class AJ, Variable Rate Pass Through Ctfs., 4.99%, 09/11/42(c) | | | 500,000 | | | | 511,765 | |
Series 2007-T28, Class AJ, Variable Rate Pass Through Ctfs., 5.96%, 09/11/42(c) | | | 105,000 | | | | 114,013 | |
Chase Mortgage Finance Trust, Series 2005-A1, Class 3A1, Floating Rate Pass Through Ctfs., 2.52%, 12/25/35(c) | | | 194,038 | | | | 177,560 | |
Citigroup Mortgage Loan Trust, Series 2006-AR2, Class 1A2, Floating Rate Pass Through Ctfs., 2.63%, 03/25/36(c) | | | 203,507 | | | | 192,108 | |
Dryden XI-Leveraged Loan CDO, Series 2006-11A, Class A3, Floating Rate Pass Through Ctfs., 0.61%, 04/12/20(b)(c)(e) | | | 500,000 | | | | 488,850 | |
Eaton Vance CDO VIII Ltd. (Cayman Islands), Series 2006-8A, Class D, Floating Rate Pass Through Ctfs., 3.65%, 08/15/22(b)(c) | | | 400,000 | | | | 385,240 | |
Foothill CLO Ltd. (Cayman Islands), Series 2007-1A, Class C, Floating Rate Pass Through Ctfs., 0.94%, 02/22/21(b)(c) | | | 250,000 | | | | 245,300 | |
Freddie Mac,
Series 2014-DN1, Class M2, Floating Rate STACR® Debt Notes, 2.35%, 02/25/24(c)(f) | | | 375,000 | | | | 371,253 | |
Series 2014-HQ2, Class M2, Floating Rate STACR® Debt Notes, 2.35%, 09/25/24(c)(f) | | | 375,000 | | | | 365,437 | |
Gallatin CLO III Ltd., Series 2007-1A, Class A2L, Floating Rate Pass Through Ctfs., 0.57%, 05/15/21(b)(c) | | | 200,000 | | | | 195,640 | |
| | | | | | | | |
| | | Principal
Amount | | | Value | |
GMACM Mortgage Loan Trust, Series 2006-AR1, Class 1A1, Floating Rate Pass Through Ctfs., 2.96%, 04/19/36(c) | | $ | 248,207 | | | $ | 220,336 | |
GSAA Home Equity Trust, Series 2007-7, Class A4, Floating Rate Pass Through Ctfs., 0.42%, 07/25/37(c) | | | 257,067 | | | | 218,304 | |
Hamlet II Ltd. (Cayman Islands), Series 2006-2A, Class A2B, Floating Rate Pass Through Ctfs., 0.56%, 05/11/21(b)(c) | | | 500,000 | | | | 477,450 | |
JP Morgan Chase Commercial Mortgage Securities Trust, Series 2014-FL5, Class B, Floating Rate Pass Through Ctfs., 1.50%, 07/15/31(b)(c) | | | 250,000 | | | | 250,734 | |
JP Morgan Mortgage Trust,
Series 2005-A1, Class IB2, Floating Rate Pass Through Ctfs., 2.68%, 02/25/35(c) | | | 195,553 | | | | 178,612 | |
Series 2005-A3, Class 7CA1, Floating Rate Pass Through Ctfs., 2.52%, 06/25/35(c) | | | 177,980 | | | | 169,133 | |
Series 2006-A2, Class 1A1, Floating Rate Pass Through Ctfs., 2.78%, 04/25/36(c) | | | 127,427 | | | | 114,713 | |
Series 2007-A4, Class 3A1, Floating Rate Pass Through Ctfs., 5.58%, 06/25/37(c) | | | 252,658 | | | | 231,905 | |
LSTAR Commercial Mortgage Trust, Series 2014-2, Class A2, Pass Through Ctfs., 2.77%, 01/20/41(b) | | | 425,000 | | | | 430,159 | |
Merrill Lynch Mortgage Investors Trust, Series 2005-A9, Class 2A1C, Floating Rate Pass Through Ctfs., 2.50%, 12/25/35(c) | | | 200,000 | | | | 194,093 | |
Morgan Stanley Bank of America Merrill Lynch Trust, Series 2014-C18, Class B, Pass Through Ctfs., 4.45%, 10/15/47 | | | 250,000 | | | | 264,762 | |
Octagon Investment Partners XVI Ltd. (Cayman Islands), Series 2013-1A, Class B1, Floating Rate Pass Through Ctfs., 1.83%, 07/17/25(b)(c) | | | 250,000 | | | | 237,225 | |
Octagon Investment Partners XXI Ltd. (Cayman Islands), Series 2014-1A, Class C, Floating Rate Pass Through Ctfs., 3.88%, 11/14/26(b)(c) | | | 500,000 | | | | 478,780 | |
Seneca Park CLO Ltd. (Cayman Islands), Series 2014-1A, Class E, Floating Rate Pass Through Ctfs.,
4.92%, 07/17/26(b)(c) | | | 250,000 | | | | 223,450 | |
Structured Asset Securities Corp., Series 2002-21A, Class B1II, Floating Rate Pass Through Ctfs., 2.40%, 11/25/32(c) | | | 165,913 | | | | 150,894 | |
Symphony CLO XIV Ltd.,
Series 2014-14A, Class E, Floating Rate Pass Through Ctfs., 4.83%, 07/14/26(b)(c) | | | 250,000 | | | | 221,125 | |
See accompanying Notes to Financial Statements which are an integral part of the financial statements.
10 Invesco Strategic Income Fund
| | | | | | | | |
| | | Principal
Amount | | | Value | |
T2 Income Fund CLO Ltd. (Cayman Islands), Series 2007-1A, Class B, Floating Rate Pass Through Ctfs., 0.83%, 07/15/19(b)(c)(e) | | $ | 600,000 | | | $ | 591,720 | |
WaMu Mortgage Trust, Series 2005-AR12, Class 1A8, Floating Rate Pass Through Ctfs., 2.33%, 10/25/35(c) | | | 274,563 | | | | 267,365 | |
Wells Fargo Alternative Loan Trust, Series 2007-PA5, Class 1A1, Pass Through Ctfs., 6.25%, 11/25/37 | | | 248,124 | | | | 235,988 | |
Wells Fargo Mortgage Backed Securities Trust,
Series 2005-AR12, Class 2A11, Floating Rate Pass Through Ctfs., 2.62%, 06/25/35(c) | | | 223,692 | | | | 222,338 | |
Series 2005-AR14, Class A1, Floating Rate Pass Through Ctfs., 5.35%, 08/25/35(c) | | | 187,334 | | | | 189,775 | |
Series 2005-AR2, Class 2A2, Floating Rate Pass Through Ctfs., 2.61%, 03/25/35(c) | | | 180,649 | | | | 184,032 | |
Series 2005-AR7, Class 1A1, Floating Rate Pass Through Ctfs., 5.06%, 05/25/35(c) | | | 214,649 | | | | 218,287 | |
Series 2006-AR8, Class 2A3, Floating Rate Pass Through Ctfs., 2.60%, 04/25/36(c) | | | 252,737 | | | | 247,484 | |
Series 2007-7, Class A1, Pass Through Ctfs., 6.00%, 06/25/37 | | | 194,052 | | | | 196,933 | |
WFRBS Commercial Mortgage Trust, Series 2014-C24, Class B, Pass Through Ctfs., 4.20%, 11/15/47 | | | 250,000 | | | | 257,483 | |
Total Asset-Backed Securities
(Cost $11,472,282) | | | | 11,489,190 | |
| | |
| | | Shares | | | | |
Common Stocks–21.32% | |
| Fixed Income Funds–21.32% | |
Invesco Floating Rate Fund, Class R6 (Cost $5,992,477)(g) | | | 756,851 | | | | 5,948,846 | |
| | |
| | | Principal
Amount | | | | |
U.S. Dollar Denominated Bonds & Notes–14.50% | |
| Aerospace & Defense–0.15% | |
Bombardier Inc. (Canada), Sr. Unsec. Notes,
6.00%, 10/15/22(b) | | $ | 40,000 | | | | 41,150 | |
|
| Agricultural & Farm Machinery–0.13% | |
Titan International Inc., Sr. Sec. Gtd. Global Notes, 6.88%, 10/01/20 | | | 40,000 | | | | 36,400 | |
|
| Agricultural Products–0.14% | |
Darling Ingredients, Inc., Sr. Unsec. Gtd. Global Notes, 5.38%, 01/15/22 | | | 40,000 | | | | 40,400 | |
|
| Auto Parts & Equipment–0.15% | |
Stackpole International Intermediate Co. S.A./Stackpole International Powder Metal (Canada), Sr. Sec. Gtd. Notes, 7.75%, 10/15/21(b) | | | 40,000 | | | | 40,800 | |
| | | | | | | | |
| | | Principal
Amount | | | Value | |
| Broadcasting–0.15% | |
Clear Channel Worldwide Holdings Inc., Series B, Sr. Unsec. Gtd. Global Notes, 6.50%, 11/15/22 | | $ | 40,000 | | | $ | 42,000 | |
|
| Building Products–0.06% | |
Builders FirstSource Inc., Sr. Sec. Notes, 7.63%, 06/01/21(b) | | | 15,000 | | | | 15,750 | |
|
| Cable & Satellite–0.79% | |
CCO Holdings LLC/CCO Holdings Capital Corp., Sr. Unsec. Gtd. Notes, 6.50%, 04/30/21 | | | 40,000 | | | | 42,400 | |
DISH DBS Corp., Sr. Unsec. Gtd. Global Notes, 5.13%, 05/01/20 | | | 165,000 | | | | 172,425 | |
ViaSat Inc., Sr. Unsec. Gtd. Global Notes, 6.88%, 06/15/20 | | | 5,000 | | | | 5,312 | |
| | | | | | | | 220,137 | |
|
| Casinos & Gaming–0.65% | |
MGM Resorts International, Sr. Unsec. Gtd. Global Notes, 6.75%, 10/01/20 | | | 165,000 | | | | 181,913 | |
|
| Communications Equipment–0.21% | |
Avaya Inc., Sr. Sec. Gtd. Notes, 7.00%, 04/01/19(b) | | | 60,000 | | | | 59,250 | |
|
| Construction Machinery & Heavy Trucks–0.30% | |
Meritor Inc., Sr. Unsec. Gtd. Notes, 6.25%, 02/15/24 | | | 40,000 | | | | 41,000 | |
Navistar International Corp., Sr. Unsec. Gtd. Notes, 8.25%, 11/01/21 | | | 40,000 | | | | 41,400 | |
| | | | | | | | 82,400 | |
|
| Data Processing & Outsourced Services–0.45% | |
First Data Corp., Sr. Unsec. Gtd. Sub. Global Notes, 11.75%, 08/15/21 | | | 107,000 | | | | 125,725 | |
|
| Diversified Banks–3.29% | |
ABN AMRO Bank N.V. (Netherlands), REGS, Unsec. Sub. Medium-Term Euro Notes, 6.25%, 09/13/22(b) | | | 200,000 | | | | 219,750 | |
Bank of America Corp., Unsec. Sub. Medium-Term Notes, 4.25%, 10/22/26 | | | 75,000 | | | | 74,719 | |
BPCE S.A. (France), Unsec. Sub. Notes, 5.15%, 07/21/24(b) | | | 200,000 | | | | 206,911 | |
Erste Group Bank AG (Austria), Unsec. Sub. Medium-Term Euro Notes, 6.38%, 03/28/23 | | | 200,000 | | | | 214,532 | |
Wells Fargo & Co., Unsec. Sub. Medium-Term Notes, 4.10%, 06/03/26 | | | 200,000 | | | | 203,501 | |
| | | | | | | | 919,413 | |
|
| Diversified Metals & Mining–0.15% | |
FMG Resources (August 2006) Pty. Ltd. (Australia), Sr. Unsec. Gtd. Notes, 6.88%, 04/01/22(b) | | | 40,000 | | | | 41,400 | |
See accompanying Notes to Financial Statements which are an integral part of the financial statements.
11 Invesco Strategic Income Fund
| | | | | | | | |
| | | Principal
Amount | | | Value | |
| Health Care Services–0.23% | |
MPH Acquisition Holdings LLC, Sr. Unsec. Gtd. Notes, 6.63%, 04/01/22(b) | | $ | 60,000 | | | $ | 63,150 | |
|
| Independent Power Producers & Energy Traders–0.34% | |
AES Corp., Sr. Unsec. Global Notes, 7.38%, 07/01/21 | | | 40,000 | | | | 45,800 | |
Calpine Corp., Sr. Unsec. Global Notes, 5.38%, 01/15/23 | | | 48,000 | | | | 48,600 | |
| | | | | | | | 94,400 | |
|
| Internet Software & Services–0.28% | |
CyrusOne L.P./CyrusOne Finance Corp., Sr. Unsec. Gtd. Global Notes, 6.38%, 11/15/22 | | | 75,000 | | | | 79,500 | |
|
| Oil & Gas Drilling–0.14% | |
Pioneer Energy Services Corp., Sr. Unsec. Gtd. Notes, 6.13%, 03/15/22(b) | | | 40,000 | | | | 37,950 | |
|
| Oil & Gas Equipment & Services–0.58% | |
Exterran Partners L.P./EXLP Finance Corp., Sr. Unsec. Gtd. Global Notes, 6.00%, 04/01/21 | | | 165,000 | | | | 160,875 | |
|
| Oil & Gas Exploration & Production–0.95% | |
Continental Resources Inc., Sr. Unsec. Gtd. Global Notes, 5.00%, 09/15/22 | | | 250,000 | | | | 265,625 | |
|
| Oil & Gas Storage & Transportation–0.76% | |
Fermaca Enterprises S de RL de C.V. (Mexico), Sr. Sec. Gtd. Notes, 6.38%, 03/30/38(b) | | | 200,000 | | | | 211,750 | |
|
| Regional Banks–0.70% | |
Fifth Third Bancorp, Series J, Jr. Unsec. Sub. Bonds, 4.90%(h) | | | 200,000 | | | | 196,500 | |
|
| Semiconductor Equipment–0.14% | |
Amkor Technology Inc., Sr. Unsec. Global Notes, 6.38%, 10/01/22 | | | 40,000 | | | | 40,300 | |
|
| Semiconductors–1.09% | |
Freescale Semiconductor Inc., Sr. Sec. Gtd. Notes, 6.00%, 01/15/22(b) | | | 125,000 | | | | 129,375 | |
Micron Technology, Inc., Sr. Unsec. Notes, 5.88%, 02/15/22(b) | | | 40,000 | | | | 42,400 | |
NXP B.V./NXP Funding LLC (Netherlands), Sr. Unsec. Gtd. Notes, 5.75%, 02/15/21(b) | | | 125,000 | | | | 131,875 | |
| | | | | | | | 303,650 | |
|
| Steel–0.64% | |
Evraz Group S.A. (Russia), REGS, Sr. Unsec. Euro Notes, 6.50%, 04/22/20(b) | | | 200,000 | | | | 179,794 | |
|
| Wireless Telecommunication Services–2.03% | |
Bharti Airtel International Netherlands B.V. (India), Sr. Unsec. Gtd. Bonds, 5.35%, 05/20/24(b) | | | 200,000 | | | | 215,116 | |
Intelsat Luxembourg S.A. (Luxembourg), Sr. Unsec. Gtd. Global Bonds, 7.75%, 06/01/21 | | | 165,000 | | | | 173,250 | |
| | | | | | | | |
| | | Principal
Amount | | | Value | |
| Wireless Telecommunication Services–(continued) | |
Sprint Corp., Sr. Unsec. Gtd. Notes, 7.88%, 09/15/23(b) | | $ | 165,000 | | | $ | 178,200 | |
| | | | | | | | 566,566 | |
Total U.S. Dollar Denominated Bonds & Notes (Cost $4,035,695) | | | | 4,046,798 | |
|
Non-U.S. Dollar Denominated Bonds & Notes–7.97%(d) | |
| Diversified Banks–2.20% | |
HSBC Capital Funding L.P. (United Kingdom), Jr. Unsec. Gtd. Sub. Euro Notes, 5.13%(h) | | EUR | 100,000 | | | | 130,626 | |
Standard Chartered Bank (United Kingdom), Sr. Unsec. Medium-Term Euro Notes, 7.83%, 04/13/18(b) | | INR | 30,000,000 | | | | 483,322 | |
| | | | | | | | 613,948 | |
|
| Life & Health Insurance–0.58% | |
Delta Lloyd Levensverzekering N.V. (Netherlands), Unsec. Sub. Euro Notes, 9.00%, 08/29/42 | | EUR | 100,000 | | | | 163,780 | |
|
| Sovereign Debt–5.19% | |
Brazil Notas do Tesouro Nacional (Brazil), Series F, Unsec. Notes, 10.00%, 01/01/23 | | BRL | 750,000 | | | | 270,502 | |
Mexican Bonos (Mexico), Series M, Unsec. Bonds, 8.00%, 12/07/23 | | MXN | 5,500,000 | | | | 469,495 | |
Portugal Obrigacoes do Tesouro OT (Portugal), Sr. Unsec. Euro Notes, 4.75%, 06/14/19(b) | | EUR | 500,000 | | | | 707,338 | |
| | | | | | | | 1,447,335 | |
Total Non-U.S. Dollar Denominated Bonds & Notes
(Cost $2,369,828) | | | | 2,225,063 | |
|
Municipal Obligations–6.58% | |
Golden State Tobacco Securitization Corp.; Series 2007 A-1, Sr. Tobacco Settlement Asset-Backed RB, 5.13%, 06/01/47 | | $ | 100,000 | | | | 74,752 | |
Houston (City of), Texas (United Airlines, Inc. Terminal E); Series 2014, Ref. Airport System Special Facilities RB, 5.00%, 07/01/29(i) | | | 250,000 | | | | 264,925 | |
Iowa (State of) Finance Authority (Iowa Fertilizer Co.); Series 2013, Midwestern Disaster Area RB, 5.25%, 12/01/25 | | | 250,000 | | | | 270,038 | |
M-S-R Energy Authority; Series 2009 B, Gas RB, 6.50%, 11/01/39 | | | 250,000 | | | | 340,387 | |
New York Liberty Development Corp. (3 World Trade Center); Series 2014, Class 2, Ref. RB, 5.38%, 11/15/40(b) | | | 200,000 | | | | 205,446 | |
New York Liberty Development Corp. (Goldman Sachs Headquarters); Series 2005, RB, 5.25%, 10/01/35 | | | 250,000 | | | | 296,163 | |
See accompanying Notes to Financial Statements which are an integral part of the financial statements.
12 Invesco Strategic Income Fund
| | | | | | | | |
| | | Principal
Amount | | | Value | |
Texas Municipal Gas Acquisition & Supply Corp. I; Series 2008 D, Sr. Lien Gas Supply RB, 6.25%, 12/15/26 | | $ | 250,000 | | | $ | 308,492 | |
Tobacco Settlement Financing Corp.; Series 2007 1A, Asset-Backed RB, 5.00%, 06/01/41 | | | 100,000 | | | | 75,045 | |
Total Municipal Obligations
(Cost $1,781,824) | | | | 1,835,248 | |
|
U.S. Treasury Securities–6.08% | |
| U.S. Treasury Bills–0.50% | |
0.02%, 11/13/14(j)(k) | | | 50,000 | | | | 50,000 | |
0.04%, 11/13/14(j)(k) | | | 80,000 | | | | 80,000 | |
0.08%, 08/20/15(j) | | | 10,000 | | | | 9,995 | |
| | | | | | | | 139,995 | |
|
| U.S. Treasury Notes–5.58% | |
1.63%, 06/30/19 | | | 1,550,000 | | | | 1,555,260 | |
Total U.S. Treasury Securities
(Cost $1,684,617) | | | | 1,695,255 | |
| | | | | | | | |
| | |
Shares | | | Value | |
Money Market Funds–8.10% | |
Liquid Assets Portfolio, Institutional Class(l) | | | 1,130,645 | | | $ | 1,130,645 | |
Premier Portfolio, Institutional Class(l) | | | 1,130,645 | | | | 1,130,645 | |
Total Money Market Funds
(Cost $2,261,290) | | | | 2,261,290 | |
| | |
Options Purchased–0.14% | | | | | | | | |
(Cost $33,990)(m) | | | | 39,000 | |
TOTAL INVESTMENTS–105.87%
(Cost $29,632,003) | | | | 29,540,690 | |
OTHER ASSETS LESS LIABILITIES–(5.87)% | | | | (1,638,607 | ) |
NET ASSETS–100.00% | | | $ | 27,902,083 | |
Investment Abbreviations:
| | |
| BRL | | – Brazilian Real |
| CDO | | – Collateralized Debt Obligation |
| CLO | | – Collateralized Loan Obligation |
| Ctfs. | | – Certificates |
| | |
| EUR | | – Euro |
| Gtd. | | – Guaranteed |
| INR | | – Indian Rupee |
| Jr. | | – Junior |
| | |
| MXN | | – Mexican Peso |
| RB | | – Revenue Bonds |
| REGS | | – Regulation S |
| Sec. | | – Secured |
| | |
| Sr. | | – Senior |
| STACR® | | – Structured Agency Credit Risk |
| Sub. | | – Subordinated |
| Unsec. | | – Unsecured |
Notes to Schedule of Investments:
| (a) | Industry and/or sector classifications used in this report are generally according to the Global Industry Classification Standard, which was developed by and is the exclusive property and a service mark of MSCI Inc. and Standard & Poor’s. |
| (b) | Security purchased or received in a transaction exempt from registration under the Securities Act of 1933, as amended (the “1933 Act”). The security may be resold pursuant to an exemption from registration under the 1933 Act, typically to qualified institutional buyers. The aggregate value of these securities at October 31, 2014 was $7,940,330, which represented 28.46% of the Fund’s Net Assets. |
| (c) | Interest or dividend rate is redetermined periodically. Rate shown is the rate in effect on October 31, 2014. |
| (d) | Foreign denominated security. Principal amount is denominated in the currency indicated. |
| (e) | All or a portion of the security is pledged as collateral for open reverse repurchase agreements. See Note 1N. The following table presents the Fund’s collateral pledged as of October 31, 2014. |
| | | | | | | | | | | | |
| Counterparty | | Reverse Repurchase
Agreements | | | Value of Non-cash Collateral Pledged* | | | Net Amount | |
Royal Bank of Canada | | $ | 983,955 | | | $ | (983,955 | ) | | $ | — | |
* Amount excludes excess collateral pledged.
| (f) | Principal payments are determined by the delinquency and principal payment experience on the STACR® reference pool. Freddie Mac transfers credit risk from the mortgages in the reference pool to credit investors who invest in the STACR® debt notes. |
| (g) | Invesco Floating Rate Fund and the Fund are affiliated by either having the same investment adviser or an investment adviser under common control with the Fund’s investment adviser. The value of this security as of October 31, 2014 represented 21.32% of the Fund’s Net Assets. See Note 5. |
| (h) | Perpetual bond with no specified maturity date. |
| (i) | Security subject to the alternative minimum tax. |
| (j) | Security traded on a discount basis. The interest rate shown represents the discount rate at the time of purchase by the Fund. |
| (k) | All or a portion of the value was pledged and/or designated as collateral to cover margin requirements for open futures contracts and swap agreements. See Notes 1K, 1M and 4. |
| (l) | The money market fund and the Fund are affiliated by having the same investment adviser. |
| (m) | The table below details options purchased: |
| | | | | | | | | | | | | | | | | | | | | | | | | | | | | | | | |
| Open Over-The-Counter Foreign Currency Options Purchased — Currency Risk | |
| Description | | Type of
Contract | | | Counterparty | | | Expiration
Date | | | Strike
Price | | | Notional Value | | | Value | |
EUR versus USD | | | Put | | | | Deutsche Bank AG | | | | 12/26/14 | | | | USD | | | | 1.25 | | | | EUR | | | | 3,000,000 | | | $ | 39,000 | |
Currency Abbreviations:
| | |
| EUR | | – Euro |
| USD | | – U.S. Dollar |
See accompanying Notes to Financial Statements which are an integral part of the financial statements.
13 Invesco Strategic Income Fund
Statement of Assets and Liabilities
October 31, 2014
| | | | |
Assets: | | | | |
Investments, at value (Cost $21,378,236) | | $ | 21,330,554 | |
Investments in affiliates, at value (Cost $8,253,767) | | | 8,210,136 | |
Total investments, at value (Cost $29,632,003) | | | 29,540,690 | |
Cash | | | 18,822 | |
Receivable for: | | | | |
Variation margin — futures contracts | | | 4,320 | |
Variation margin — centrally cleared swap agreements | | | 876 | |
Fund shares sold | | | 44,211 | |
Dividends and interest | | | 185,476 | |
Forward foreign currency contracts outstanding | | | 75,198 | |
Unrealized appreciation on swap agreements — OTC | | | 3,011 | |
Investment for trustee deferred compensation and retirement plans | | | 846 | |
Other assets | | | 56,150 | |
Total assets | | | 29,929,600 | |
| |
Liabilities: | | | | |
Payable for: | | | | |
Investments purchased | | | 782,885 | |
Fund shares reacquired | | | 100,000 | |
Amount due custodian — foreign currency (Cost $95,311) | | | 99,110 | |
Reverse repurchase agreements | | | 979,000 | |
Swaps payable | | | 73 | |
Accrued fees to affiliates | | | 9,864 | |
Accrued trustees’ and officers’ fees and benefits | | | 1,963 | |
Accrued other operating expenses | | | 53,776 | |
Trustee deferred compensation and retirement plans | | | 846 | |
Total liabilities | | | 2,027,517 | |
Net assets applicable to shares outstanding | | $ | 27,902,083 | |
| |
Net assets consist of: | | | | |
Shares of beneficial interest | | $ | 27,750,229 | |
Undistributed net investment income | | | (9,474 | ) |
Undistributed net realized gain | | | 143,173 | |
Net unrealized appreciation | | | 18,155 | |
| | | $ | 27,902,083 | |
| | | | |
Net Assets: | | | | |
Class A | | $ | 14,248,376 | |
Class C | | $ | 812,275 | |
Class R | | $ | 12,870 | |
Class Y | | $ | 12,808,436 | |
Class R5 | | $ | 10,063 | |
Class R6 | | $ | 10,063 | |
|
Shares outstanding, $0.01 par value per share,
with an unlimited number of shares authorized: | |
Class A | | | 1,417,798 | |
Class C | | | 80,856 | |
Class R | | | 1,281 | |
Class Y | | | 1,274,206 | |
Class R5 | | | 1,001 | |
Class R6 | | | 1,001 | |
Class A: | | | | |
Net asset value per share | | $ | 10.05 | |
Maximum offering price per share | | | | |
(Net asset value of $10.05 ¸ 95.75%) | | $ | 10.50 | |
Class C: | | | | |
Net asset value and offering price per share | | $ | 10.05 | |
Class R: | | | | |
Net asset value and offering price per share | | $ | 10.05 | |
Class Y: | | | | |
Net asset value and offering price per share | | $ | 10.05 | |
Class R5: | | | | |
Net asset value and offering price per share | | $ | 10.05 | |
Class R6: | | | | |
Net asset value and offering price per share | | $ | 10.05 | |
See accompanying Notes to Financial Statements which are an integral part of the financial statements.
14 Invesco Strategic Income Fund
Statement of Operations
For the period May 2, 2014 (commencement date) through October 31, 2014
| | | | |
Investment income: | | | | |
Interest (net of foreign withholding taxes of $929) | | $ | 396,878 | |
Dividends from affiliates | | | 103,845 | |
Total investment income | | | 500,723 | |
| |
Expenses: | | | | |
Advisory fees | | | 78,429 | |
Administrative services fees | | | 25,068 | |
Custodian fees | | | 6,946 | |
Distribution fees: | | | | |
Class A | | | 16,443 | |
Class C | | | 1,044 | |
Class R | | | 28 | |
Transfer agent fees — A, C, R and Y | | | 3,966 | |
Transfer agent fees — R5 | | | 5 | |
Transfer agent fees — R6 | | | 5 | |
Trustees’ and officers’ fees and benefits | | | 10,917 | |
Registration and filing fees | | | 46,244 | |
Professional services fees | | | 49,437 | |
Other | | | 18,727 | |
Total expenses | | | 257,259 | |
Less: Fees waived and expenses reimbursed | | | (179,025 | ) |
Net expenses | | | 78,234 | |
Net investment income | | | 422,489 | |
| |
Realized and unrealized gain (loss) from: | | | | |
Net realized gain (loss) from: | | | | |
Investment securities (includes net gains (losses) from securities sold to affiliates of $(1,000)) | | | (43,412 | ) |
Foreign currencies | | | (12,648 | ) |
Forward foreign currency contracts | | | 187,859 | |
Futures contracts | | | (37,587 | ) |
Swap agreements | | | 34,407 | |
| | | | 128,619 | |
Change in net unrealized appreciation (depreciation) of: | | | | |
Investment securities | | | (91,313 | ) |
Foreign currencies | | | (3,118 | ) |
Forward foreign currency contracts | | | 75,198 | |
Futures contracts | | | 47,435 | |
Swap agreements | | | (10,047 | ) |
| | | | 18,155 | |
Net realized and unrealized gain | | | 146,774 | |
Net increase in net assets resulting from operations | | $ | 569,263 | |
See accompanying Notes to Financial Statements which are an integral part of the financial statements.
15 Invesco Strategic Income Fund
Statement of Changes in Net Assets
For the period May 2, 2014 (commencement date) through October 31, 2014
| | | | |
| | | May 2, 2014
(commencement date) through October 31, 2014 | |
Operations: | | | | |
Net investment income | | $ | 422,489 | |
Net realized gain | | | 128,619 | |
Change in net unrealized appreciation | | | 18,155 | |
Net increase in net assets resulting from operations | | | 569,263 | |
| |
Distributions to shareholders from net investment income: | | | | |
Class A | | | (220,329 | ) |
Class C | | | (3,292 | ) |
Class R | | | (181 | ) |
Class Y | | | (225,541 | ) |
Class R5 | | | (179 | ) |
Class R6 | | | (179 | ) |
Total distributions from net investment income | | | (449,701 | ) |
| |
Share transactions–net: | | | | |
Class A | | | 14,190,714 | |
Class C | | | 814,539 | |
Class R | | | 12,833 | |
Class Y | | | 12,744,415 | |
Class R5 | | | 10,010 | |
Class R6 | | | 10,010 | |
Net increase in net assets resulting from share transactions | | | 27,782,521 | |
Net increase in net assets | | | 27,902,083 | |
| |
Net assets: | | | | |
Beginning of period | | | — | |
End of period (includes undistributed net investment income of $(9,474)) | | $ | 27,902,083 | |
Notes to Financial Statements
October 31, 2014
NOTE 1—Significant Accounting Policies
Invesco Strategic Income Fund (the “Fund”) is a series portfolio of AIM Investment Funds (Invesco Investment Funds) (the “Trust”). The Trust is organized as a Delaware statutory trust and is registered under the Investment Company Act of 1940, as amended (the “1940 Act”), as an open-end series management investment company consisting of twenty-four separate series portfolios, each authorized to issue an unlimited number of shares of beneficial interest. The assets, liabilities and operations of each portfolio are accounted for separately. Information presented in these financial statements pertains only to the Fund. Matters affecting each portfolio or class will be voted on exclusively by the shareholders of such portfolio or class.
The Fund’s primary investment objective is to provide current income and, secondarily, long-term growth of capital.
The Fund currently consists of six different classes of shares: Class A, Class C, Class R, Class Y, Class R5 and Class R6. Class A shares are sold with a front-end sales charge unless certain waiver criteria are met and under certain circumstances load waived shares may be subject to contingent deferred sales charges (“CDSC”). Class C shares are sold with a CDSC. Class R, Class Y, Class R5 and Class R6 shares are sold at net asset value.
The following is a summary of the significant accounting policies followed by the Fund in the preparation of its financial statements.
| A. | Security Valuations — Securities, including restricted securities, are valued according to the following policy. |
A security listed or traded on an exchange (except convertible securities) is valued at its last sales price or official closing price as of the close of the customary trading session on the exchange where the security is principally traded, or lacking any sales or official closing price on a particular day, the security may be valued at the closing bid price on that day. Securities traded in the over-the-counter market are valued based on prices furnished by independent pricing services or market makers. When such securities are valued by an independent pricing service they may be considered fair valued. Futures contracts are valued at the final settlement price set by an exchange on which they are principally traded. Listed options are valued at the mean between the last bid and ask prices from the exchange on which they are principally traded. Options not listed on an exchange are valued by an independent source at the mean between the last bid and ask prices. For purposes of determining net
16 Invesco Strategic Income Fund
asset value per share, futures and option contracts generally are valued 15 minutes after the close of the customary trading session of the New York Stock Exchange (“NYSE”).
Investments in open-end and closed-end registered investment companies that do not trade on an exchange are valued at the end of day net asset value per share. Investments in open-end and closed-end registered investment companies that trade on an exchange are valued at the last sales price or official closing price as of the close of the customary trading session on the exchange where the security is principally traded.
Swap agreements are fair valued using an evaluated quote provided by an independent pricing service. Evaluated quotes provided by the pricing service are valued based on a model which may include end of day net present values, spreads, ratings, industry, and company performance.
Debt obligations (including convertible securities) and unlisted equities are fair valued using an evaluated quote provided by an independent pricing service. Evaluated quotes provided by the pricing service may be determined without exclusive reliance on quoted prices, and may reflect appropriate factors such as institution-size trading in similar groups of securities, developments related to specific securities, dividend rate (for unlisted equities), yield (for debt obligations), quality, type of issue, coupon rate (for debt obligations), maturity (for debt obligations), individual trading characteristics and other market data. Debt obligations are subject to interest rate and credit risks. In addition, all debt obligations involve some risk of default with respect to interest and/or principal payments.
Foreign securities’ (including foreign exchange contracts) prices are converted into U.S. dollar amounts using the applicable exchange rates as of the close of the NYSE. If market quotations are available and reliable for foreign exchange-traded equity securities, the securities will be valued at the market quotations. Because trading hours for certain foreign securities end before the close of the NYSE, closing market quotations may become unreliable. If between the time trading ends on a particular security and the close of the customary trading session on the NYSE, events occur that the Adviser determines are significant and make the closing price unreliable, the Fund may fair value the security. If the event is likely to have affected the closing price of the security, the security will be valued at fair value in good faith using procedures approved by the Board of Trustees. Adjustments to closing prices to reflect fair value may also be based on a screening process of an independent pricing service to indicate the degree of certainty, based on historical data, that the closing price in the principal market where a foreign security trades is not the current value as of the close of the NYSE. Foreign securities’ prices meeting the approved degree of certainty that the price is not reflective of current value will be priced at the indication of fair value from the independent pricing service. Multiple factors may be considered by the independent pricing service in determining adjustments to reflect fair value and may include information relating to sector indices, American Depositary Receipts and domestic and foreign index futures. Foreign securities may have additional risks including exchange rate changes, potential for sharply devalued currencies and high inflation, political and economic upheaval, the relative lack of issuer information, relatively low market liquidity and the potential lack of strict financial and accounting controls and standards.
Securities for which market prices are not provided by any of the above methods may be valued based upon quotes furnished by independent sources. The last bid price may be used to value equity securities. The mean between the last bid and ask prices is used to value debt obligations, including corporate loans.
Securities for which market quotations are not readily available or became unreliable are valued at fair value as determined in good faith by or under the supervision of the Trust’s officers following procedures approved by the Board of Trustees. Issuer specific events, market trends, bid/ask quotes of brokers and information providers and other market data may be reviewed in the course of making a good faith determination of a security’s fair value.
The Fund may invest in securities that are subject to interest rate risk, meaning the risk that the prices will generally fall as interest rates rise and, conversely, the prices will generally rise as interest rates fall. Specific securities differ in their sensitivity to changes in interest rates depending on their individual characteristics. Changes in interest rates may result in increased market volatility, which may affect the value and/or liquidity of certain of the Fund’s investments.
Valuations change in response to many factors including the historical and prospective earnings of the issuer, the value of the issuer’s assets, general economic conditions, interest rates, investor perceptions and market liquidity. Because of the inherent uncertainties of valuation, the values reflected in the financial statements may materially differ from the value received upon actual sale of those investments.
| B. | Securities Transactions and Investment Income — Securities transactions are accounted for on a trade date basis. Realized gains or losses on sales are computed on the basis of specific identification of the securities sold. Interest income (net of withholding tax, if any) is recorded on the accrual basis from settlement date. Paydown gains and losses on mortgage and asset-backed securities are recorded as adjustments to interest income. Dividend income (net of withholding tax, if any) is recorded on the ex-dividend date. Bond premiums and discounts are amortized and/or accreted for financial reporting purposes. |
The Fund may periodically participate in litigation related to Fund investments. As such, the Fund may receive proceeds from litigation settlements. Any proceeds received are included in the Statement of Operations as realized gain (loss) for investments no longer held and as unrealized gain (loss) for investments still held.
Brokerage commissions and mark ups are considered transaction costs and are recorded as an increase to the cost basis of securities purchased and/or a reduction of proceeds on a sale of securities. Such transaction costs are included in the determination of net realized and unrealized gain (loss) from investment securities reported in the Statement of Operations and the Statement of Changes in Net Assets and the net realized and unrealized gains (losses) on securities per share in the Financial Highlights. Transaction costs are included in the calculation of the Fund’s net asset value and, accordingly, they reduce the Fund’s total returns. These transaction costs are not considered operating expenses and are not reflected in net investment income reported in the Statement of Operations and Statement of Changes in Net Assets, or the net investment income per share and ratios of expenses and net investment income reported in the Financial Highlights, nor are they limited by any expense limitation arrangements between the Fund and the investment adviser.
The Fund allocates realized and unrealized capital gains and losses to a class based on the relative net assets of each class. The Fund allocates income to a class based on the relative value of the settled shares of each class.
| C. | Country Determination — For the purposes of making investment selection decisions and presentation in the Schedule of Investments, the investment adviser may determine the country in which an issuer is located and/or credit risk exposure based on various factors. These factors include the laws of the country under which the issuer is organized, where the issuer maintains a principal office, the country in which the issuer derives 50% or more of its total revenues and the country that has the primary market for the issuer’s securities, as well as other criteria. Among |
17 Invesco Strategic Income Fund
| | the other criteria that may be evaluated for making this determination are the country in which the issuer maintains 50% or more of its assets, the type of security, financial guarantees and enhancements, the nature of the collateral and the sponsor organization. Country of issuer and/or credit risk exposure has been determined to be the United States of America, unless otherwise noted. |
| D. | Distributions — Distributions from net investment income, if any, are declared and paid monthly. Distributions from net realized capital gain, if any, are generally declared and paid annually and recorded on the ex-dividend date. The Fund may elect to treat a portion of the proceeds from redemptions as distributions for federal income tax purposes. |
| E. | Federal Income Taxes — The Fund intends to comply with the requirements of Subchapter M of the Internal Revenue Code of 1986, as amended (the “Internal Revenue Code”), necessary to qualify as a regulated investment company and to distribute substantially all of the Fund’s taxable earnings to shareholders. As such, the Fund will not be subject to federal income taxes on otherwise taxable income (including net realized capital gain) that is distributed to shareholders. Therefore, no provision for federal income taxes is recorded in the financial statements. |
The Fund recognizes the tax benefits of uncertain tax positions only when the position is more likely than not to be sustained. Management has analyzed the Fund’s uncertain tax positions and concluded that no liability for unrecognized tax benefits should be recorded related to uncertain tax positions. Management is not aware of any tax positions for which it is reasonably possible that the total amounts of unrecognized tax benefits will change materially in the next 12 months.
The Fund files tax returns in the U.S. Federal jurisdiction and certain other jurisdictions. Generally, the Fund is subject to examinations by such taxing authorities for up to three years after the filing of the return for the tax period.
| F. | Expenses — Fees provided for under the Rule 12b-1 plan of a particular class of the Fund are charged to the operations of such class. Transfer agency fees and expenses and other shareholder recordkeeping fees and expenses attributable to Class R5 and Class R6 are allocated to each share class based on relative net assets. Sub-accounting fees attributable to Class R5 are charged to the operations of the class. Transfer agency fees and expenses and other shareholder recordkeeping fees and expenses relating to all other classes are allocated among those classes based on relative net assets. All other expenses are allocated among the classes based on relative net assets. |
| G. | Accounting Estimates — The preparation of financial statements in conformity with accounting principles generally accepted in the United States of America (“GAAP”) requires management to make estimates and assumptions that affect the reported amounts of assets and liabilities at the date of the financial statements and the reported amounts of revenues and expenses during the reporting period including estimates and assumptions related to taxation. Actual results could differ from those estimates by a significant amount. In addition, the Fund monitors for material events or transactions that may occur or become known after the period-end date and before the date the financial statements are released to print. |
| H. | Indemnifications — Under the Trust’s organizational documents, each Trustee, officer, employee or other agent of the Trust is indemnified against certain liabilities that may arise out of the performance of their duties to the Fund. Additionally, in the normal course of business, the Fund enters into contracts, including the Fund’s servicing agreements, that contain a variety of indemnification clauses. The Fund’s maximum exposure under these arrangements is unknown as this would involve future claims that may be made against the Fund that have not yet occurred. The risk of material loss as a result of such indemnification claims is considered remote. |
| I. | Foreign Currency Translations — Foreign currency is valued at the close of the NYSE based on quotations posted by banks and major currency dealers. Portfolio securities and other assets and liabilities denominated in foreign currencies are translated into U.S. dollar amounts at date of valuation. Purchases and sales of portfolio securities (net of foreign taxes withheld on disposition) and income items denominated in foreign currencies are translated into U.S. dollar amounts on the respective dates of such transactions. The Fund does not separately account for the portion of the results of operations resulting from changes in foreign exchange rates on investments and the fluctuations arising from changes in market prices of securities held. The combined results of changes in foreign exchange rates and the fluctuation of market prices on investments (net of estimated foreign tax withholding) are included with the net realized and unrealized gain or loss from investments in the Statement of Operations. Reported net realized foreign currency gains or losses arise from (1) sales of foreign currencies, (2) currency gains or losses realized between the trade and settlement dates on securities transactions, and (3) the difference between the amounts of dividends, interest, and foreign withholding taxes recorded on the Fund’s books and the U.S. dollar equivalent of the amounts actually received or paid. Net unrealized foreign currency gains and losses arise from changes in the fair values of assets and liabilities, other than investments in securities at fiscal period end, resulting from changes in exchange rates. |
The Fund may invest in foreign securities, which may be subject to foreign taxes on income, gains on investments or currency repatriation, a portion of which may be recoverable. Foreign taxes, if any, are recorded based on the tax regulations and rates that exist in the foreign markets in which the Fund invests and are shown in the Statement of Operations.
| J. | Forward Foreign Currency Contracts — The Fund may engage in foreign currency transactions either on a spot (i.e. for prompt delivery and settlement) basis or through forward foreign currency contracts to manage or minimize currency or exchange rate risk. |
The Fund may also enter into forward foreign currency contracts for the purchase or sale of a security denominated in a foreign currency in order to “lock in” the U.S. dollar price of that security, or the Fund may also enter into forward foreign currency contracts that do not provide for physical settlement of the two currencies, but instead are settled by a single cash payment calculated as the difference between the agreed upon exchange rate and the spot rate at settlement based upon an agreed upon notional amount (non-deliverable forwards). The Fund will set aside liquid assets in an amount equal to daily mark-to-market obligation for forward foreign currency contracts.
A forward foreign currency contract is an obligation between two parties (“Counterparties”) to purchase or sell a specific currency for an agreed-upon price at a future date. The use of forward foreign currency contracts does not eliminate fluctuations in the price of the underlying securities the Fund owns or intends to acquire but establishes a rate of exchange in advance. Fluctuations in the value of these contracts are measured by the difference in the contract date and reporting date exchange rates and are recorded as unrealized appreciation (depreciation) until the contracts are closed. When the contracts are closed, realized gains (losses) are recorded. Realized and unrealized gains (losses) on the contracts are included in the Statement of Operations. The primary risks associated with forward foreign currency contracts include failure of the Counterparty to meet the terms of the contract and the value of the foreign currency changing unfavorably. These risks may be in excess of the amounts reflected in the Statement of Assets and Liabilities.
| K. | Futures Contracts — The Fund may enter into futures contracts to manage exposure to interest rate, equity and market price movements and/or currency risks. A futures contract is an agreement between Counterparties to purchase or sell a specified underlying security, currency or |
18 Invesco Strategic Income Fund
| | commodity (or delivery of a cash settlement price, in the case of an index future) for a fixed price at a future date. The Fund currently invests only in exchange-traded futures and they are standardized as to maturity date and underlying financial instrument. Initial margin deposits required upon entering into futures contracts are satisfied by the segregation of specific securities or cash as collateral at the futures commission merchant (broker). During the period the futures contracts are open, changes in the value of the contracts are recognized as unrealized gains or losses by recalculating the value of the contracts on a daily basis. Subsequent or variation margin payments are received or made depending upon whether unrealized gains or losses are incurred. These amounts are reflected as receivables or payables on the Statement of Assets and Liabilities. When the contracts are closed or expire, the Fund recognizes a realized gain or loss equal to the difference between the proceeds from, or cost of, the closing transaction and the Fund’s basis in the contract. The net realized gain (loss) and the change in unrealized gain (loss) on futures contracts held during the period is included on the Statement of Operations. The primary risks associated with futures contracts are market risk and the absence of a liquid secondary market. If the Fund were unable to liquidate a futures contract and/or enter into an offsetting closing transaction, the Fund would continue to be subject to market risk with respect to the value of the contracts and continue to be required to maintain the margin deposits on the futures contracts. Futures contracts have minimal counterparty risk since the exchange’s clearinghouse, as counterparty to all exchange-traded futures, guarantees the futures against default. Risks may exceed amounts recognized in the Statement of Assets and Liabilities. |
| L. | Put Options Purchased — The Fund may purchase put options including options on securities indexes and/or futures contracts. By purchasing a put option, the Fund obtains the right (but not the obligation) to sell the option’s underlying instrument at a fixed strike price. In return for this right, the Fund pays an option premium. The option’s underlying instrument may be a security, securities index, or a futures contract. |
Additionally, the Fund may enter into an option on a swap agreement, also called a “swaption”. A swaption is an option that gives the buyer the right, but not the obligation, to enter into a swap on a future date in exchange for paying a market-based premium. A receiver swaption gives the owner the right to receive the total return of a specified asset, reference rate or index. Swaptions also include options that allow an existing swap to be terminated or extended by one of the counterparties.
Put options may be used by the Fund to hedge securities it owns by locking in a minimum price at which the Fund can sell. If security prices fall, the put option could be exercised to offset all or a portion of the Fund’s resulting losses. At the same time, because the maximum the Fund has at risk is the cost of the option, purchasing put options does not eliminate the potential for the Fund to profit from an increase in the value of the securities hedged. Realized and unrealized gains and losses on these contracts are included in the Statement of Operations. A risk in buying an option is that the Fund pays a premium whether or not the option is exercised. In addition, there can be no assurance that a liquid secondary market will exist for any option purchased.
| M. | Swap Agreements — The Fund may enter into various swap transactions, including interest rate, total return, index, currency and credit default swap contracts (“CDS”) for investment purposes or to manage interest rate, currency or credit risk. Such transactions are agreements between Counterparties. A swap agreement may be negotiated bilaterally and traded over-the-counter (OTC) between two parties (‘uncleared/OTC”) or, in some instances, must be transacted through a future commission merchant (FCM) and cleared through a clearinghouse that serves as a central Counterparty (“centrally cleared swap”). These agreements may contain among other conditions, events of default and termination events, and various covenants and representations such as provisions that require the Fund to maintain a pre-determined level of net assets, and/or provide limits regarding the decline of the Fund’s NAV over specific periods of time. If the Fund were to trigger such provisions and have open derivative positions at that time, the Counterparty may be able to terminate such agreement and request immediate payment in an amount equal to the net liability positions, if any. |
Interest rate, total return, index, and currency swap agreements are two-party contracts entered into primarily to exchange the returns (or differentials in rates of returns) earned or realized on particular predetermined investments or instruments. The gross returns to be exchanged or “swapped” between the parties are calculated with respect to a notional amount, i.e., the return on or increase in value of a particular dollar amount invested at a particular interest rate or return of an underlying asset, in a particular foreign currency, or in a “basket” of securities representing a particular index.
In a centrally cleared swap, the Fund’s ultimate Counterparty is a central clearinghouse. The Fund initially will enter into centrally cleared swaps through an executing broker. When a Fund enters into a centrally cleared swap, it must deliver to the central Counterparty (via the FCM) an amount referred to as “initial margin.” Initial margin requirements are determined by the central Counterparty, but an FCM may require additional initial margin above the amount required by the central Counterparty. Initial margin deposits required upon entering into centrally cleared swaps are satisfied by cash or securities as collateral at the FCM. Securities deposited as initial margin are designated on the Schedule of Investments and cash deposited is recorded on the Statement of Assets and Liabilities. During the term of a cleared swap agreement, a “variation margin” amount may be required to be paid by the Fund or may be received by the Fund, based on the daily change in price of the underlying reference instrument subject to the swap agreement and is recorded as a receivable or payable for variation margin in the Statement of Assets and Liabilities until the centrally cleared swap is terminated at which time a realized gain or loss is recorded.
A CDS is an agreement between Counterparties to exchange the credit risk of an issuer. A buyer of a CDS is said to buy protection by paying a fixed payment over the life of the agreement and in some situations an upfront payment to the seller of the CDS. If a defined credit event occurs (such as payment default or bankruptcy), the Fund as a protection buyer would cease paying its fixed payment, the Fund would deliver eligible bonds issued by the reference entity to the seller, and the seller would pay the full notional value, or the “par value”, of the referenced obligation to the Fund. A seller of a CDS is said to sell protection and thus would receive a fixed payment over the life of the agreement and an upfront payment, if applicable. If a credit event occurs, the Fund as a protection seller would cease to receive the fixed payment stream, the Fund would pay the buyer “par value” or the full notional value of the referenced obligation, and the Fund would receive the eligible bonds issued by the reference entity. In turn, these bonds may be sold in order to realize a recovery value. Alternatively, the seller of the CDS and its Counterparty may agree to net the notional amount and the market value of the bonds and make a cash payment equal to the difference to the buyer of protection. If no credit event occurs, the Fund receives the fixed payment over the life of the agreement. As the seller, the Fund would effectively add leverage to its portfolio because, in addition to its total net assets, the Fund would be subject to investment exposure on the notional amount of the CDS. In connection with these agreements, cash and securities may be identified as collateral in accordance with the terms of the respective swap agreements to provide assets of value and recourse in the event of default under the swap agreement or bankruptcy/insolvency
19 Invesco Strategic Income Fund
of a party to the swap agreement. If a Counterparty becomes bankrupt or otherwise fails to perform its obligations due to financial difficulties, the Fund may experience significant delays in obtaining any recovery in a bankruptcy or other reorganization proceeding. The Fund may obtain only limited recovery or may obtain no recovery in such circumstances. The Fund’s maximum risk of loss from Counterparty risk, either as the protection seller or as the protection buyer, is the value of the contract. The risk may be mitigated by having a master netting arrangement between the Fund and the Counterparty and by the designation of collateral by the Counterparty to cover the Fund’s exposure to the Counterparty.
Implied credit spreads represent the current level at which protection could be bought or sold given the terms of the existing CDS contract and serve as an indicator of the current status of the payment/performance risk of the CDS. An implied spread that has widened or increased since entry into the initial contract may indicate a deteriorating credit profile and increased risk of default for the reference entity. A declining or narrowing spread may indicate an improving credit profile or decreased risk of default for the reference entity. Alternatively, credit spreads may increase or decrease reflecting the general tolerance for risk in the credit markets.
An interest rate swap is an agreement between Counterparties pursuant to which the parties exchange a floating rate payment for a fixed rate payment based on a specified notional amount.
A total return swap is an agreement in which one party makes payments based on a set rate, either fixed or variable, while the other party makes payments based on the return of an underlying asset, which includes both the income generated and capital gains, if any. The unrealized appreciation (depreciation) on total return swaps includes dividends on the underlying securities and financing rate payable from the Counterparty. At the maturity date, a net cash flow is exchanged where the total return is equivalent to the return of the underlying reference less a financing rate, if any. As a receiver, the Fund would receive payments based on any positive total return and would owe payments in the event of a negative total return. As the payer, the Fund would owe payments on any net positive total return, and would receive payment in the event of a negative total return.
Changes in the value of centrally cleared and OTC swap agreements are recognized as unrealized gains (losses) in the Statement of Operations by “marking to market” on a daily basis to reflect the value of the swap agreement at the end of each trading day. Payments received or paid at the beginning of the agreement are reflected as such on the Statement of Assets and Liabilities and may be referred to as upfront payments. The Fund accrues for the fixed payment stream and amortizes upfront payments, if any, on swap agreements on a daily basis with the net amount, recorded as a component of realized gain (loss) on the Statement of Operations. A liquidation payment received or made at the termination of a swap agreement is recorded as realized gain (loss) on the Statement of Operations. The Fund segregates liquid securities having a value at least equal to the amount of the potential obligation of a Fund under any swap transaction. Entering into these agreements involves, to varying degrees, lack of liquidity and elements of credit, market, and Counterparty risk in excess of amounts recognized on the Statement of Assets and Liabilities. Such risks involve the possibility that a swap is difficult to sell or liquidate; the Counterparty does not honor its obligations under the agreement and unfavorable interest rates and market fluctuations. It is possible that developments in the swaps market, including potential government regulation, could adversely affect the Fund’s ability to terminate existing swap agreements or to realize amounts to be received under such agreements.
Notional amounts of each individual credit default swap agreement outstanding as of October 31, 2014 for which the Fund is the seller of protection are disclosed in the Notes to Schedule of Investments. These potential amounts would be partially offset by any recovery values of the respective referenced obligations, upfront payments received upon entering into the agreement, or net amounts received from the settlement of buy protection credit default swap agreements entered into by the Fund for the same referenced entity or entities.
| N. | Reverse Repurchase Agreements — The Fund may enter into reverse repurchase agreements. Reverse repurchase agreements involve the sale of securities held by the Fund, with an agreement that the Fund will repurchase such securities at an agreed upon price and date. The Fund will use the proceeds of a reverse repurchase agreement (which are considered to be borrowings under the 1940 Act) to purchase other permitted securities either maturing, or under an agreement to resell, at a date simultaneous with or prior to the expiration of the reverse repurchase agreement. The agreements are collateralized by the underlying securities and are carried at the amount at which the securities subsequently will be repurchased as specified in the agreements. |
| O. | Leverage Risk — Leverage exists when a Fund can lose more than it originally invests because it purchases or sells an instrument or enters into a transaction without investing an amount equal to the full economic exposure of the instrument or transaction. |
| P. | Collateral — To the extent the Fund has designated or segregated a security as collateral and that security is subsequently sold, it is the Fund’s practice to replace such collateral no later than the next business day. |
NOTE 2—Advisory Fees and Other Fees Paid to Affiliates
The Trust has entered into a master investment advisory agreement with Invesco Advisers, Inc. (the “Adviser” or “Invesco”). Under the terms of the investment advisory agreement, the Fund pays an advisory fee to the Adviser based on the annual rate of the Fund’s average daily net assets as follows:
| | | | |
| Average Daily Net Assets | | Rate | |
First $1 billion | | | 0.60% | |
Next $3.5 billion | | | 0.55% | |
Over $4.5 billion | | | 0.45% | |
For the period May 2, 2014 (commencement date) through October 31, 2014, the effective advisory fees incurred by the Fund was 0.60%.
Under the terms of a master sub-advisory agreement between the Adviser and each of Invesco Asset Management Deutschland GmbH, Invesco Asset Management Limited, Invesco Asset Management (Japan) Limited, Invesco Australia Limited, Invesco Hong Kong Limited, Invesco Senior Secured Management, Inc., Invesco Canada Ltd. and Invesco Powershares Capital Management LLC (collectively, the “Affiliated Sub-Advisers”) the Adviser, not the Fund, may pay 40% of the fees paid to the Adviser to any such Affiliated Sub-Adviser(s) that provide(s) discretionary investment management services to the Fund based on the percentage of assets allocated to such Sub-Adviser(s).
The Adviser has contractually agreed, through at least February 29, 2016, to waive advisory fees and/or reimburse expenses of all shares to the extent necessary to limit total annual fund operating expenses after fee waiver and/or expense reimbursement (excluding certain items discussed
20 Invesco Strategic Income Fund
below) of Class A, Class C, Class R, Class Y, Class R5 and Class R6 shares to 0.82%, 1.57%, 1.07%, 0.57%, 0.57% and 0.57%, respectively, of average daily net assets. In determining the Adviser’s obligation to waive advisory fees and/or reimburse expenses, the following expenses are not taken into account, and could cause the total annual fund operating expenses after fee waiver and/or expense reimbursement to exceed the numbers reflected above: (1) interest; (2) taxes; (3) dividend expense on short sales; (4) extraordinary or non-routine items, including litigation expenses; and (5) expenses that the Fund has incurred but did not actually pay because of an expense offset arrangement. Acquired Fund Fees and Expenses are not operating expenses of a Fund directly, but are fees and expenses, including management fees of the investment companies in which a Fund invests. As a result, the total annual fund operating expenses after expense reimbursement may exceed the expense limits above. Unless Invesco continues the fee waiver agreement, it will terminate on February 29, 2016. The fee waiver agreement cannot be terminated during its term.
Further, the Adviser has contractually agreed, through at least June 30, 2016, to waive the advisory fee payable by the Fund in an amount equal to 100% of the net advisory fees the Adviser receives on the Fund’s investments in certain affiliated funds.
For the period May 2, 2014 (commencement date) through October 31, 2014, the Adviser waived advisory fees and reimbursed fund level expenses of $175,050 and reimbursed class level expenses of $1,996, $32, $2, $1,935, $5 and $5 for Class A, Class C, Class R, Class Y, Class R5 and Class R6 shares, respectively.
The Trust has entered into a master administrative services agreement with Invesco pursuant to which the Fund has agreed to pay Invesco for certain administrative costs incurred in providing accounting services to the Fund. For the period May 2, 2014 (commencement date) through October 31, 2014, expenses incurred under the agreement are shown in the Statement of Operations as Administrative services fees.
The Trust has entered into a transfer agency and service agreement with Invesco Investment Services, Inc. (“IIS”) pursuant to which the Fund has agreed to pay IIS a fee for providing transfer agency and shareholder services to the Fund and reimburse IIS for certain expenses incurred by IIS in the course of providing such services. IIS may make payments to intermediaries that provide omnibus account services, sub-accounting services and/or networking services. All fees payable by IIS to intermediaries that provide omnibus account services or sub-accounting are charged back to the Fund, subject to certain limitations approved by the Trust’s Board of Trustees. For the period May 2, 2014 (commencement date) through October 31, 2014, expenses incurred under the agreement are shown in the Statement of Operations as Transfer agent fees.
The Trust has entered into master distribution agreements with Invesco Distributors, Inc. (“IDI”) to serve as the distributor for the Class A, Class C, Class R, Class Y, Class R5 and Class R6 shares of the Fund. The Trust has adopted plans pursuant to Rule 12b-1 under the 1940 Act with respect to the Fund’s Class A, Class C and Class R shares (collectively, the “Plans”). The Fund, pursuant to the Plans, pays IDI compensation at the annual rate of 0.25% of the Fund’s average daily net assets of Class A shares, 1.00% of the average daily net assets of Class C shares and 0.50% of the average daily net assets of Class R shares. Of the Plan payments, up to 0.25% of the average daily net assets of each class of shares may be paid to furnish continuing personal shareholder services to customers who purchase and own shares of such classes. Any amounts not paid as a service fee under the Plans would constitute an asset-based sales charge. Rules of the Financial Industry Regulatory Authority (“FINRA”) impose a cap on the total sales charges, including asset-based sales charges, that may be paid by any class of shares of the Fund. For the period May 2, 2014 (commencement date) through October 31, 2014, expenses incurred under the Plans are shown in the Statement of Operations as Distribution fees.
Front-end sales commissions and CDSC (collectively, the “sales charges”) are not recorded as expenses of the Fund. Front-end sales commissions are deducted from proceeds from the sales of Fund shares prior to investment in Class A shares of the Fund. CDSC are deducted from redemption proceeds prior to remittance to the shareholder. During the period May 2, 2014 (commencement date) through October 31, 2014, IDI advised the Fund that IDI retained $1,835 in front-end sales commissions from the sale of Class A shares.
Certain officers and trustees of the Trust are officers and directors of the Adviser, IIS and/or IDI.
NOTE 3—Additional Valuation Information
GAAP defines fair value as the price that would be received to sell an asset or paid to transfer a liability in an orderly transaction between market participants at the measurement date, under current market conditions. GAAP establishes a hierarchy that prioritizes the inputs to valuation methods, giving the highest priority to readily available unadjusted quoted prices in an active market for identical assets (Level 1) and the lowest priority to significant unobservable inputs (Level 3), generally when market prices are not readily available or are unreliable. Based on the valuation inputs, the securities or other investments are tiered into one of three levels. Changes in valuation methods may result in transfers in or out of an investment’s assigned level:
| | Level 1 — | Prices are determined using quoted prices in an active market for identical assets. |
| | Level 2 — | Prices are determined using other significant observable inputs. Observable inputs are inputs that other market participants may use in pricing a security. These may include quoted prices for similar securities, interest rates, prepayment speeds, credit risk, yield curves, loss severities, default rates, discount rates, volatilities and others. |
| | Level 3 — | Prices are determined using significant unobservable inputs. In situations where quoted prices or observable inputs are unavailable (for example, when there is little or no market activity for an investment at the end of the period), unobservable inputs may be used. Unobservable inputs reflect the Fund’s own assumptions about the factors market participants would use in determining fair value of the securities or instruments and would be based on the best available information. |
21 Invesco Strategic Income Fund
The following is a summary of the tiered valuation input levels, as of October 31, 2014. The level assigned to the securities valuations may not be an indication of the risk or liquidity associated with investing in those securities. Because of the inherent uncertainties of valuation, the values reflected in the financial statements may materially differ from the value received upon actual sale of those investments.
| | | | | | | | | | | | | | | | |
| | | Level 1 | | | Level 2 | | | Level 3 | | | Total | |
Equity Securities | | $ | 8,210,136 | | | $ | — | | | $ | — | | | $ | 8,210,136 | |
U.S. Treasury Securities | | | — | | | | 1,695,255 | | | | — | | | | 1,695,255 | |
Asset-Backed Securities | | | — | | | | 11,489,190 | | | | — | | | | 11,489,190 | |
Corporate Debt Securities | | | — | | | | 4,046,798 | | | | — | | | | 4,046,798 | |
Municipal Obligations | | | — | | | | 1,835,248 | | | | — | | | | 1,835,248 | |
Foreign Debt Securities | | | — | | | | 777,728 | | | | — | | | | 777,728 | |
Foreign Sovereign Debt Securities | | | — | | | | 1,447,335 | | | | — | | | | 1,447,335 | |
Options Purchased | | | — | | | | 39,000 | | | | — | | | | 39,000 | |
| | | | 8,210,136 | | | | 21,330,554 | | | | — | | | | 29,540,690 | |
Forward Foreign Currency Contracts* | | | — | | | | 75,198 | | | | — | | | | 75,198 | |
Futures Contracts* | | | 47,435 | | | | — | | | | — | | | | 47,435 | |
Swap Agreements* | | | — | | | | (10,047 | ) | | | — | | | | (10,047 | ) |
Total Investments | | $ | 8,257,571 | | | $ | 21,395,705 | | | $ | — | | | $ | 29,653,276 | |
| * | Unrealized appreciation (depreciation). |
NOTE 4—Derivative Investments
Value of Derivative Investments at Period-End
The table below summarizes the value of the Fund’s derivative investments, detailed by primary risk exposure, held as of October 31, 2014:
| | | | | | | | |
| | | Value | |
| Risk Exposure/Derivative Type | | Assets | | | Liabilities | |
Credit risk: | | | | | | | | |
Swap agreements(a) | | $ | 5,061 | | | $ | (6,019 | ) |
Currency risk: | | | | | | | | |
Forward foreign currency contracts(b) | | | 109,656 | | | | (34,458 | ) |
Options purchased(c) | | | 39,000 | | | | — | |
Market risk: | | | | | | | | |
Swap agreements(d) | | | 3,011 | | | | — | |
Interest rate risk: | | | | | | | | |
Futures contracts(e) | | | 60,239 | | | | (12,804 | ) |
Swap agreements(a) | | | — | | | | (12,100 | ) |
Total | | $ | 216,967 | | | $ | (65,381 | ) |
| (a) | Includes cumulative appreciation (depreciation) of centrally cleared swap agreements. Only current day’s variation margin receivable (payable) is reported within the Statement of Assets and Liabilities. |
| (b) | Values are disclosed on the Statement of Assets and Liabilities under the caption Forward foreign currency contracts outstanding. |
| (c) | Options purchased at value as reported in the Schedule of Investments. |
| (d) | Values are disclosed on the Statement of Assets and Liabilities under the caption Unrealized appreciation on swap agreements — OTC. |
| (e) | Includes cumulative appreciation (depreciation) of futures contracts. Only current day’s variation margin receivable (payable) is reported within the Statement of Assets and Liabilities. |
22 Invesco Strategic Income Fund
Effect of Derivative Investments for the period May 2, 2014 (commencement date) through October 31, 2014
The table below summarizes the gains (losses) on derivative investments, detailed by primary risk exposure, recognized in earnings during the period:
| | | | | | | | | | | | |
| | | Location of Gain (Loss) on
Statement of Operations(a) | |
| | | Futures
Contracts | | | Forward Foreign Currency Contracts | | | Swap
Agreements | |
Realized Gain (Loss): | | | | | | | | | | | | |
Commodity risk | | $ | — | | | $ | — | | | $ | — | |
Credit risk | | | — | | | | — | | | | 41,366 | |
Currency risk | | | — | | | | 187,859 | | | | — | |
Interest rate risk | | | (37,587 | ) | | | — | | | | (6,880 | ) |
Market risk | | | — | | | | — | | | | (79 | ) |
Change in Unrealized Appreciation (Depreciation): | | | | | | | | | | | | |
Commodity risk | | $ | — | | | $ | — | | | $ | — | |
Credit risk | | | — | | | | — | | | | (958 | ) |
Currency risk | | | — | | | | 75,198 | | | | — | |
Interest rate risk | | | 47,435 | | | | — | | | | (12,100 | ) |
Market risk | | | — | | | | — | | | | 3,011 | |
Total | | $ | 9,848 | | | $ | 263,057 | | | $ | 24,360 | |
| (a) | Options purchased are included in the net realized gain (loss) from investment securities and net change in unrealized appreciation (depreciation) on investment securities. |
The table below summarizes the six month average notional value of forward foreign currency contracts; the five month average notional value of futures contracts and swap agreements; the four month average notional value of swaptions purchased and the three month average notional value of currency options purchased.
| | | | | | | | | | | | | | | | | | | | |
| | | Forward Foreign Currency Contracts | | | Futures
Contracts | | | Swap
Agreements | | | Currency Options
Purchased | | | Swaptions
Purchased | |
Average notional value | | $ | 5,614,308 | | | $ | 7,298,395 | | | $ | 5,337,200 | | | $ | 3,391,860 | | | $ | 9,175,000 | |
| | | | | | | | | | | | | | | | | | | | | | | | | | |
| Open Forward Foreign Currency Contracts | |
Settlement
Date | | Counterparty | | Contract to | | | Notional
Value | | | Unrealized
Appreciation
(Depreciation) | |
| | | Deliver | | | Receive | | | |
11/04/14 | | Goldman Sachs International | | | BRL | | | | 716,271 | | | | USD | | | | 290,000 | | | $ | 288,694 | | | $ | 1,306 | |
11/04/14 | | Goldman Sachs International | | | USD | | | | 298,123 | | | | BRL | | | | 716,271 | | | | 288,694 | | | | (9,429 | ) |
11/07/14 | | Barclays Bank PLC | | | JPY | | | | 15,000,000 | | | | USD | | | | 145,246 | | | | 133,564 | | | | 11,682 | |
11/07/14 | | Deutsche Bank Securities Inc. | | | JPY | | | | 57,109,750 | | | | USD | | | | 556,257 | | | | 508,523 | | | | 47,734 | |
11/07/14 | | Deutsche Bank Securities Inc. | | | USD | | | | 507,309 | | | | JPY | | | | 55,000,000 | | | | 489,737 | | | | (17,572 | ) |
12/02/14 | | Goldman Sachs International | | | BRL | | | | 716,271 | | | | USD | | | | 295,613 | | | | 286,237 | | | | 9,376 | |
12/11/14 | | Deutsche Bank Securities Inc. | | | CHF | | | | 353,488 | | | | USD | | | | 378,292 | | | | 367,529 | | | | 10,763 | |
12/11/14 | | Deutsche Bank Securities Inc. | | | SGD | | | | 700,000 | | | | USD | | | | 553,921 | | | | 544,738 | | | | 9,183 | |
12/15/14 | | Citigroup Global Markets Inc. | | | EUR | | | | 1,425,010 | | | | USD | | | | 1,805,894 | | | | 1,786,282 | | | | 19,612 | |
12/15/14 | | Citigroup Global Markets Inc. | | | USD | | | | 462,875 | | | | EUR | | | | 363,311 | | | | 455,418 | | �� | | (7,457 | ) |
Total Forward Foreign Currency Contracts — Currency Risk | | | | | | | | | | | | | | | | | | | | | | $ | 75,198 | |
Currency Abbreviation:
| | |
| BRL | | – Brazilian Real |
| CHF | | – Swiss Franc |
| EUR | | – Euro |
| JPY | | – Japanese Yen |
| SGD | | – Singapore Dollar |
| USD | | – U.S. Dollar |
23 Invesco Strategic Income Fund
| | | | | | | | | | | | | | | | | | | | |
| Open Futures Contracts | |
| Futures Contracts | | Type of
Contract | | | Number of Contracts | | | Expiration Month | | | Notional Value | | | Unrealized
Appreciation
(Depreciation) | |
90-Day Eurodollar | | | Long | | | | 50 | | | | December-2015 | | | $ | 12,395,625 | | | $ | (6,982 | ) |
90-Day Eurodollar | | | Short | | | | 50 | | | | December-2016 | | | | (12,271,250 | ) | | | 10,643 | |
U.S. Treasury 2 Year Notes | | | Short | | | | 7 | | | | December-2014 | | | | (1,536,938 | ) | | | (3,406 | ) |
U.S. Treasury 5 Year Notes | | | Short | | | | 25 | | | | December-2014 | | | | (2,985,742 | ) | | | 25,736 | |
U.S. Treasury 30 Year Notes | | | Long | | | | 7 | | | | December-2014 | | | | 987,656 | | | | 23,860 | |
U.S. Treasury Ultra Bonds | | | Short | | | | 1 | | | | December-2014 | | | | (156,813 | ) | | | (2,416 | ) |
Total Futures Contracts — Interest Rate Risk | | | | | | | | | | | | | | | | | | $ | 47,435 | |
| | | | | | | | | | | | | | | | | | | | | | | | |
| Open Centrally Cleared Interest Rate Swap Agreements — Interest Rate Risk | |
| Counterparty/Clearinghouse | | Pay/Receive
Floating Rate | | | Floating Rate Index | | | Fixed Rate | | | Termination Date | | | Notional Value | | | Unrealized
Appreciation (Depreciation) | |
Credit Suisse Securities (USA)/CME | | | Receive | | | | 3 Month USD LIBOR | | | | 1.28 | % | | | September-2017 | | | $ | (2,300,000 | ) | | $ | (12,100 | ) |
Abbreviations:
| | |
| CME | | – Chicago Mercantile Exchange |
| LIBOR | | – London Interbank Offered Rate |
| USD | | – U.S. Dollar |
| | | | | | | | | | | | | | | | | | | | | | | | | | | | | | |
| Open Centrally Cleared Credit Default Swap Agreements | |
| Counterparty/Clearinghouse | | Reference Entity | | Buy/Sell Protection | | | (Pay)/Receive Fixed Rate | | | Expiration
Date | | | Implied
Credit
Spread(a) | | | Notional Value | | | Upfront
Payments | | | Unrealized Appreciation (Depreciation) | |
Credit Suisse Securities (USA)/CME | | Markit CDX North America High Yield Index —
Series 22 | | | Sell | | | | 5.00 | % | | | 06/20/19 | | | | 3.18 | % | | $ | 693,000 | | | $ | 47,275 | | | $ | 5,061 | |
Credit Suisse Securities (USA)/CME | | Markit CDX North America Investment Grade Index —Series 23 | | | Buy | | | | (1.00 | )% | | | 12/20/19 | | | | 0.64 | % | | | (3,800,000 | ) | | | (61,528 | ) | | | (6,019 | ) |
Total Centrally Cleared Credit Default Swap Agreements — Credit Risk | | | | | | | | | | | | | | | | | | | $ | (14,253 | ) | | $ | (958 | ) |
Abbreviations:
| | |
| CME | | – Chicago Mercantile Exchange |
| (a) | Implied credit spreads represent the current level as of October 31, 2014 at which protection could be bought or sold given the terms of the existing credit default swap contract and serve as an indicator of the current status of the payment/performance risk of the credit default swap contract. An implied credit spread that has widened or increased since entry into the initial contract may indicate a deteriorating credit profile and increased risk of default for the reference entity. A declining or narrowing spread may indicate an improving credit profile or decreased risk of default for the reference entity. Alternatively, credit spreads may increase or decrease reflecting the general tolerance for risk in the credit markets generally. |
| | | | | | | | | | | | | | | | | | | | |
| Open Over-The-Counter Total Return Swap Agreements | |
| Description | | Type of
Contract | | Counterparty | | Number of
Contracts | | | Expiration
Date | | | Notional
Value | | | Unrealized
Appreciation
(Depreciation) | |
Receive a return equal to the S&P U.S. Leveraged Loan Index and pay a floating rate equal to the 3 Month USD LIBOR. | | Long | | Morgan Stanley & Co. International PLC | | | 7,000 | | | | 12/20/14 | | | $ | 700,000 | | | $ | 761 | |
Receive a return equal to the S&P U.S. Leveraged Loan Index and pay a floating rate equal to the 3 Month USD LIBOR. | | Long | | Morgan Stanley & Co. International PLC | | | 10,000 | | | | 12/20/14 | | | | 1,000,000 | | | | 2,250 | |
Total Total Return Swap Agreements — Market risk | | | | | | | | | | | | | | $ | 3,011 | |
Abbreviations:
| | |
| LIBOR | | – London Interbank Offered Rate |
| USD | | – U.S. Dollar |
24 Invesco Strategic Income Fund
Offsetting Assets and Liabilities
Accounting Standards Update (“ASU”) No. 2011-11, Disclosures about Offsetting Assets and Liabilities, which was subsequently clarified in Financial Accounting Standards Board ASU 2013-01 “Clarifying the Scope of Disclosures about Offsetting Assets and Liabilities” is intended to enhance disclosures about financial instruments and derivative instruments that are subject to offsetting arrangements on the Statement of Assets and Liabilities and to enable investors to better understand the effect of those arrangements on its financial position. In order for an arrangement to be eligible for netting, the Fund must have a basis to conclude that such netting arrangements are legally enforceable. The Fund enters into netting agreements and collateral agreements in an attempt to reduce the Fund’s Counterparty credit risk by providing for a single net settlement with a Counterparty of all financial transactions covered by the agreement in an event of default as defined under such agreement.
There were no derivative instruments subject to a netting agreement for which the Fund is not currently netting. The following tables present derivative instruments that are either subject to an enforceable netting agreement or offset by collateral arrangements as of October 31, 2014.
| | | | | | | | | | | | | | | | | | | | | | | | |
| Assets: | |
| | | Gross amounts
presented in
Statement of
Assets & Liabilities | | | Gross amounts
offset in
Statement of
Assets & Liabilities | | | Net amounts of assets
presented in the
Statement of Assets & Liabilities | | | Collateral Received | | | | |
| Counterparty | | | | | Financial
Instruments | | | Cash | | | Net
Amount | |
Barclays Bank PLC | | $ | 11,682 | | | $ | — | | | $ | 11,682 | | | $ | — | | | $ | — | | | $ | 11,682 | |
Citigroup Global Markets Inc. | | | 19,612 | | | | (7,457 | ) | | | 12,155 | | | | — | | | | — | | | | 12,155 | |
Credit Suisse Securities (USA)(a) | | | 52,342 | | | | (52,342 | ) | | | — | | | | — | | | | — | | | | — | |
Deutsche Bank Securities Inc. | | | 67,680 | | | | (17,572 | ) | | | 50,108 | | | | — | | | | — | | | | 50,108 | |
Goldman Sachs International | | | 10,682 | | | | (9,429 | ) | | | 1,253 | | | | — | | | | — | | | | 1,253 | |
Morgan Stanley & Co. International PLC | | | 3,011 | | | | (79 | ) | | | 2,932 | | | | — | | | | — | | | | 2,932 | |
Total | | $ | 165,009 | | | $ | (86,879 | ) | | $ | 78,130 | | | $ | — | | | $ | — | | | $ | 78,130 | |
| | | | | | |
| | | | | | | | | | | | | | | | | | | | | | | | |
| Liabilities: | |
| | | Gross amounts
presented in
Statement of
Assets & Liabilities | | | Gross amounts
offset in
Statement of
Assets & Liabilities | | | Net amounts of liabilities presented in the Statement of Assets & Liabilities | | | Collateral Pledged | | | | |
| Counterparty | | | | | Financial
Instruments | | | Cash | | | Net
Amount | |
Citigroup Global Markets Inc. | | $ | 7,457 | | | $ | (7,457 | ) | | $ | — | | | $ | — | | | $ | — | | | $ | — | |
Credit Suisse Securities (USA)(a) | | | 79,647 | | | | (52,342 | ) | | | 27,305 | | | | (27,305 | ) | | | — | | | | — | |
Deutsche Bank Securities Inc. | | | 17,572 | | | | (17,572 | ) | | | — | | | | — | | | | — | | | | — | |
Goldman Sachs International | | | 9,429 | | | | (9,429 | ) | | | — | | | | — | | | | — | | | | — | |
Morgan Stanley & Co. International PLC | | | 79 | | | | (79 | ) | | | — | | | | — | | | | — | | | | — | |
Total | | $ | 114,184 | | | $ | (86,879 | ) | | $ | 27,305 | | | $ | (27,305 | ) | | $ | — | | | $ | — | |
| (a) | Includes upfront payments and cumulative appreciation (depreciation) of centrally cleared swap agreements. |
NOTE 5—Investments in Affiliates
The Fund’s Adviser and the adviser for Invesco Floating Rate Fund are subsidiaries of Invesco Ltd. and therefore, Invesco Floating Rate Fund is considered to be affiliated with the Fund. The following is a summary of the transactions in, and earning from, investments in Invesco Floating Rate Fund for the period May 2, 2014 (commencement date) through October 31, 2014.
| | | | | | | | | | | | | | | | | | | | | | | | | | | | |
| | | May 2, 2014
(commencement date) | | | Purchases
at Cost | | | Proceeds
from Sales | | | Change in
Unrealized
Appreciation
(Depreciation) | | | Realized
Gain (Loss) | | | Value 10/31/14 | | | Dividend
Income | |
Invesco Floating Rate Fund | | $ | — | | | $ | 8,023,378 | | | $ | (2,028,500 | ) | | $ | (43,631 | ) | | $ | (2,401 | ) | | $ | 5,948,846 | | | $ | 103,275 | |
NOTE 6—Security Transactions with Affiliated Funds
The Fund is permitted to purchase or sell securities from or to certain other Invesco Funds under specified conditions outlined in procedures adopted by the Board of Trustees of the Trust. The procedures have been designed to ensure that any purchase or sale of securities by the Fund from or to another fund or portfolio that is or could be considered an affiliate by virtue of having a common investment adviser (or affiliated investment advisers), common Trustees and/or common officers complies with Rule 17a-7 of the 1940 Act. Further, as defined under the procedures, each transaction is effected at the current market price. Pursuant to these procedures, for the period May 2, 2014 (commencement date) through October 31, 2014, the Fund engaged in securities sales of $43,469, which resulted in net realized gains (losses) of $(1,000).
25 Invesco Strategic Income Fund
NOTE 7—Trustees’ and Officers’ Fees and Benefits
Trustees’ and Officers’ Fees and Benefits include amounts accrued by the Fund to pay remuneration to certain Trustees and Officers of the Fund. Trustees have the option to defer compensation payable by the Fund, and Trustees’ and Officers’ Fees and Benefits also include amounts accrued by the Fund to fund such deferred compensation amounts. Those Trustees who defer compensation have the option to select various Invesco Funds in which their deferral accounts shall be deemed to be invested. Obligations under the deferred compensation plan represent unsecured claims against the general assets of the Fund.
NOTE 8—Cash Balances and Borrowings
The Fund is permitted to temporarily carry a negative or overdrawn balance in its account with State Street Bank and Trust Company, the custodian bank. Such balances, if any at period end, are shown in the Statement of Assets and Liabilities under the payable caption Amount due custodian. To compensate the custodian bank for such overdrafts, the overdrawn Fund may either (1) leave funds as a compensating balance in the account so the custodian bank can be compensated by earning the additional interest; or (2) compensate by paying the custodian bank at a rate agreed upon by the custodian bank and Invesco, not to exceed the contractually agreed upon rate.
Reverse repurchase agreements outstanding as of October 31, 2014 were as follows:
| | | | | | | | | | | | | | | | |
| Counterparty | | Interest Rate | | | Maturity Date | | | Face Value | | | Face Value Including
Accrued Interest | |
Royal Bank of Canada | | | 1.07 | % | | | April 16, 2015 | | | $ | 530,000 | | | $ | 532,867 | |
Royal Bank of Canada | | | 0.92 | | | | April 16, 2015 | | | | 449,000 | | | | 451,088 | |
Total | | | | | | | | | | $ | 979,000 | | | $ | 983,955 | |
NOTE 9—Distributions to Shareholders and Tax Components of Net Assets
Tax Character of Distributions to Shareholders Paid During the period May 2, 2014 (commencement date) through October 31, 2014:
| | | | |
| | | 2014 | |
Ordinary income | | $ | 449,701 | |
Tax Components of Net Assets at Period-End:
| | | | |
| | | 2014 | |
Undistributed ordinary income | | $ | 121,911 | |
Undistributed long-term gain | | | 164,821 | |
Net unrealized appreciation (depreciation) — investments | | | (119,223 | ) |
Net unrealized appreciation (depreciation) — other investments | | | (3,981 | ) |
Temporary book/tax differences | | | (11,674 | ) |
Shares of beneficial interest | | | 27,750,229 | |
Total net assets | | $ | 27,902,083 | |
The difference between book-basis and tax-basis unrealized appreciation (depreciation) is due to differences in the timing of recognition of gains and losses on investments for tax and book purposes. The Fund’s net unrealized appreciation (depreciation) difference is attributable primarily to wash sales and bond premium amortization.
The temporary book/tax differences are a result of timing differences between book and tax recognition of income and/or expenses. The Fund’s temporary book/tax differences are the result of the trustee deferral of compensation and retirement plan benefits.
Capital loss carryforward is calculated and reported as of a specific date. Results of transactions and other activity after that date may affect the amount of capital loss carryforward actually available for the Fund to utilize. Capital losses generated in years beginning after December 22, 2010 can be carried forward for an unlimited period, whereas previous losses expire in eight tax years. Capital losses with an expiration period may not be used to offset capital gains until all net capital losses without an expiration date have been utilized. Capital loss carryforwards with no expiration date will retain their character as either short-term or long-term capital losses instead of as short-term capital losses as under prior law. The ability to utilize capital loss carryforwards in the future may be limited under the Internal Revenue Code and related regulations based on the results of future transactions.
The Fund does not have a capital loss carryforward as of October 31, 2014.
26 Invesco Strategic Income Fund
NOTE 10—Investment Securities
The aggregate amount of investment securities (other than short-term securities, U.S. Treasury obligations and money market funds, if any) purchased and sold by the Fund during the period May 2, 2014 (commencement date) through October 31, 2014 was $38,553,179 and $12,806,481, respectively. During the same period, purchases and sales of U.S. Treasury obligations were $1,844,953 and $302,379, respectively. Cost of investments on a tax basis includes the adjustments for financial reporting purposes as of the most recently completed federal income tax reporting period-end.
| | | | |
| Unrealized Appreciation (Depreciation) of Investment Securities on a Tax Basis | |
Aggregate unrealized appreciation of investment securities | | $ | 178,549 | |
Aggregate unrealized (depreciation) of investment securities | | | (297,772 | ) |
Net unrealized appreciation (depreciation) of investment securities | | $ | (119,223 | ) |
Cost of investments for tax purposes is $29,659,913.
NOTE 11—Reclassification of Permanent Differences
Primarily as a result of differing book/tax treatment of foreign currency transactions, bond premium amortization and stock issuance costs, on October 31, 2014, undistributed net investment income was increased by $17,738, undistributed net realized gain was increased by $14,554 and shares of beneficial interest was decreased by $32,292. This reclassification had no effect on the net assets of the Fund.
NOTE 12—Share Information
| | | | | | | | |
| | | Summary of Share Activity | |
| | | May 2, 2014
(commencement date) through
October 31, 2014(a) | |
| | | Shares | | | Amount | |
Sold: | | | | | | | | |
Class A | | | 1,417,557 | | | $ | 14,188,309 | |
Class C | | | 82,697 | | | | 833,074 | |
Class R | | | 1,279 | | | | 12,810 | |
Class Y | | | 1,283,979 | | | | 12,842,642 | |
Class R5 | | | 1,001 | | | | 10,010 | |
Class R6 | | | 1,001 | | | | 10,010 | |
| | |
Issued as reinvestment of dividends: | | | | | | | | |
Class A | | | 1,058 | | | | 10,624 | |
Class C | | | 315 | | | | 3,156 | |
Class R | | | 2 | | | | 23 | |
Class Y | | | 276 | | | | 2,773 | |
| | |
Reacquired: | | | | | | | | |
Class A | | | (817 | ) | | | (8,219 | ) |
Class C | | | (2,156 | ) | | | (21,691 | ) |
Class Y | | | (10,049 | ) | | | (101,000 | ) |
Net increase in share activity | | | 2,776,143 | | | $ | 27,782,521 | |
| (a) | 90% of the outstanding shares of the Fund are owned by the Adviser. |
27 Invesco Strategic Income Fund
NOTE 13—Financial Highlights
The following schedule presents financial highlights for a share of the Fund outstanding throughout the periods indicated.
| | | | | | | | | | | | | | | | | | | | | | | | | | | | | | | | | | | | | | | | | | | | | | | | |
| | | Net asset
value,
beginning
of period | | | Net
investment
income(a) | | | Net gains
on securities
(both
realized and
unrealized) | | | Total from
investment
operations | | | Dividends
from net
investment
income | | | Net asset
value, end
of period | | | Total
return(b) | | | Net assets,
end of period
(000’s omitted) | | | Ratio of
expenses
to average
net assets
with fee waivers
and/or expenses
absorbed | | | Ratio of
expenses
to average net
assets without
fee waivers
and/or expenses
absorbed | | | Ratio of net
investment
income
to average
net assets | | | Portfolio
turnover(c) | |
Class A | | | | | | | | | | | | | | | | | | | | | | | | | | | | | | | | | | | | | | | | | | | | | | | | |
Year ended 10/31/14(d) | | $ | 10.00 | | | $ | 0.16 | | | $ | 0.06 | | | $ | 0.22 | | | $ | (0.17 | ) | | $ | 10.05 | | | | 2.19 | % | | $ | 14,248 | | | | 0.71 | %(e)(f) | | | 2.08 | %(e) | | | 3.12 | %(e) | | | 57 | % |
Class C | | | | | | | | | | | | | | | | | | | | | | | | | | | | | | | | | | | | | | | | | | | | | | | | |
Year ended 10/31/14(d) | | | 10.00 | | | | 0.12 | | | | 0.07 | | | | 0.19 | | | | (0.14 | ) | | | 10.05 | | | | 1.86 | | | | 812 | | | | 1.46 | (e)(f) | | | 2.83 | (e) | | | 2.37 | (e) | | | 57 | |
Class R | | | | | | | | | | | | | | | | | | | | | | | | | | | | | | | | | | | | | | | | | | | | | | | | |
Year ended 10/31/14(d) | | | 10.00 | | | | 0.15 | | | | 0.06 | | | | 0.21 | | | | (0.16 | ) | | | 10.05 | | | | 2.08 | | | | 13 | | | | 0.96 | (e)(f) | | | 2.33 | (e) | | | 2.87 | (e) | | | 57 | |
Class Y | | | | | | | | | | | | | | | | | | | | | | | | | | | | | | | | | | | | | | | | | | | | | | | | |
Year ended 10/31/14(d) | | | 10.00 | | | | 0.17 | | | | 0.06 | | | | 0.23 | | | | (0.18 | ) | | | 10.05 | | | | 2.29 | | | | 12,808 | | | | 0.46 | (e)(f) | | | 1.83 | (e) | | | 3.37 | (e) | | | 57 | |
Class R5 | | | | | | | | | | | | | | | | | | | | | | | | | | | | | | | | | | | | | | | | | | | | | | | | |
Year ended 10/31/14(d) | | | 10.00 | | | | 0.17 | | | | 0.06 | | | | 0.23 | | | | (0.18 | ) | | | 10.05 | | | | 2.29 | | | | 10 | | | | 0.46 | (e)(f) | | | 1.90 | (e) | | | 3.37 | (e) | | | 57 | |
Class R6 | | | | | | | | | | | | | | | | | | | | | | | | | | | | | | | | | | | | | | | | | | | | | | | | |
Year ended 10/31/14(d) | | | 10.00 | | | | 0.17 | | | | 0.06 | | | | 0.23 | | | | (0.18 | ) | | | 10.05 | | | | 2.29 | | | | 10 | | | | 0.46 | (e)(f) | | | 1.90 | (e) | | | 3.37 | (e) | | | 57 | |
| (a) | Calculated using average shares outstanding. |
| (b) | Includes adjustments in accordance with accounting principles generally accepted in the United States of America and as such, the net asset value for financial reporting purposes and the returns based upon those net asset values may differ from the net asset value and returns for shareholder transactions. Does not include sales charges and is not annualized for periods less than one year, if applicable. |
| (c) | Portfolio turnover is calculated at the fund level and is not annualized for periods less than one year, if applicable. |
| (d) | Commencement date of May 2, 2014. |
| (e) | Ratios are annualized and based on average daily net assets (000’s omitted) of $13,118, $208, $11, $12,714, $10 and $10 for Class A, Class C, Class R, Class Y, Class R5 and Class R6 shares, respectively. |
| (f) | In addition to the fees and expenses which the Fund bears directly; the Fund indirectly bears a pro rata share of the fees and expenses of the underlying funds in which the Fund invests. Because the underlying funds have varied expenses and fee levels and the Fund may own different proportions at different times, the amount of fees and expenses incurred indirectly by the Fund will vary. Estimated underlying fund expenses are not expenses that are incurred directly by your Fund. They are expenses that are incurred directly by the underlying funds and are deducted from the value of the funds your Fund invests in. The effect of the estimated underlying fund expenses that you bear indirectly is included in your Fund’s total return. Estimated acquired fund fees from underlying funds were 0.14% for the period May 2, 2014 (commencement date) through October 31, 2014. |
28 Invesco Strategic Income Fund
Report of Independent Registered Public Accounting Firm
To the Board of Trustees of AIM Investment Funds (Invesco Investment Funds)
and Shareholders of Invesco Strategic Income Fund:
In our opinion, the accompanying statement of assets and liabilities, including the schedule of investments, and the related statements of operations and of changes in net assets and the financial highlights present fairly, in all material respects, the financial position of Invesco Strategic Income Fund (one of the funds constituting AIM Investment Funds (Invesco Investment Funds), hereafter referred to as the “Fund”) at October 31, 2014, and the results of its operations, the changes in its net assets and the financial highlights for the period May 2, 2014 (commencement of operations) through October 31, 2014, in conformity with accounting principles generally accepted in the United States of America. These financial statements and financial highlights (hereafter referred to as “financial statements”) are the responsibility of the Fund’s management. Our responsibility is to express an opinion on these financial statements based on our audit. We conducted our audit of these financial statements in accordance with the standards of the Public Company Accounting Oversight Board (United States). Those standards require that we plan and perform the audit to obtain reasonable assurance about whether the financial statements are free of material misstatement. An audit includes examining, on a test basis, evidence supporting the amounts and disclosures in the financial statements, assessing the accounting principles used and significant estimates made by management, and evaluating the overall financial statement presentation. We believe that our audit, which included confirmation of securities at October 31, 2014 by correspondence with the custodian and brokers, and the application of alternative auditing procedures where confirmations of security purchases have not been received, provide a reasonable basis for our opinion.
PRICEWATERHOUSECOOPERS LLP
December 29, 2014
Houston, Texas
29 Invesco Strategic Income Fund
Calculating your ongoing Fund expenses
Example
As a shareholder of the Fund, you incur two types of costs: (1) transaction costs, which may include sales charges (loads) on purchase payments or contingent deferred sales charges on redemptions, if any; and (2) ongoing costs, including management fees, distribution and/or service (12b-1) fees, and other Fund expenses. This example is intended to help you understand your ongoing costs (in dollars) of investing in the Fund and to compare these costs with ongoing costs of investing in other mutual funds. The example is based on an investment of $1,000 invested at the beginning of the period and held for the entire period May 2, 2014 (commencement date) through October 31, 2014.
Actual expenses
The table below provides information about actual account values and actual expenses. You may use the information in this table, together with the amount you invested, to estimate the expenses that you paid over the period. Simply divide your account value by $1,000 (for example, an $8,600 account value divided by $1,000 = 8.6), then multiply the result by the number in the table under the heading entitled “Actual Expenses Paid During Period” to estimate the expenses you paid on your account during this period (as of close of business May 2, 2014 (commencement date) through October 31, 2014).
Hypothetical example for comparison purposes
The table below also provides information about hypothetical account values and hypothetical expenses based on the Fund’s actual expense ratio and an assumed rate of return of 5% per year before expenses, which is not the Fund’s actual return.
The hypothetical account values and expenses may not be used to estimate the actual ending account balance or expenses you paid for the period. You may use this information to compare the ongoing costs of investing in the Fund and other funds. To do so, compare this 5% hypothetical example with the 5% hypothetical examples that appear in the shareholder reports of the other funds.
Please note that the expenses shown in the table are meant to highlight your ongoing costs only and do not reflect any transaction costs, such as sales charges (loads) on purchase payments or contingent deferred sales charges on redemptions, if any. Therefore, the hypothetical information is useful in comparing ongoing costs only, and will not help you determine the relative total costs of owning different funds. In addition, if these transaction costs were included, your costs would have been higher.
| | | | | | | | | | | | | | | | | | | | | | | | |
| Class | | Beginning Account Value (05/02/14) | | | ACTUAL | | | HYPOTHETICAL (5% annual return before expenses) | | | Annualized Expense Ratio | |
| | | Ending Account Value (10/31/14)1 | | | Expenses Paid During Period2 | | | Ending Account Value (10/31/14) | | | Expenses Paid During Period3 | | |
| A | | $ | 1,000.00 | | | $ | 1,021.90 | | | $ | 3.60 | | | $ | 1,021.63 | | | $ | 3.62 | | | | 0.71 | % |
| C | | | 1,000.00 | | | | 1,018.60 | | | | 7.39 | | | | 1,017.85 | | | | 7.43 | | | | 1.46 | |
| R | | | 1,000.00 | | | | 1,020.80 | | | | 4.86 | | | | 1,020.37 | | | | 4.89 | | | | 0.96 | |
| Y | | | 1,000.00 | | | | 1,022.90 | | | | 2.33 | | | | 1,022.89 | | | | 2.35 | | | | 0.46 | |
| R5 | | | 1,000.00 | | | | 1,022.90 | | | | 2.33 | | | | 1,022.89 | | | | 2.35 | | | | 0.46 | |
| R6 | | | 1,000.00 | | | | 1,022.90 | | | | 2.33 | | | | 1,022.89 | | | | 2.35 | | | | 0.46 | |
| 1 | The actual ending account value is based on the actual total return of the Fund for the period May 2, 2014 (commencement date) through October 31, 2014, after actual expenses and will differ from the hypothetical ending account value which is based on the Fund’s expense ratio and a hypothetical annual return of 5% before expenses. |
| 2 | Actual expenses are equal to the Fund’s annualized expense ratio as indicated above multiplied by the average account value over the period, multiplied by 183 (as of close of business May 2, 2014 (commencement date) through October 31, 2014)/365. Because the Fund has not been in existence for a full six-month period, the actual ending account value and expense information shown may not provide a meaningful comparison to fund expense information of classes that show such data for a full six-month period and, because the actual ending account value and expense information in the expense example covers a short time period, return and expense data may not be indicative of return and expense data for longer time periods. |
| 3 | Hypothetical expenses are equal to the annualized expense ratio indicated above multiplied by the average account value over the period, multiplied by 184/365 to reflect a one-half year period. The hypothetical ending account value and expenses may be used to compare ongoing costs of investing in the Fund and other funds because such data is based on a full six-month period. |
30 Invesco Strategic Income Fund
Initial Approval of Investment Advisory and Sub-Advisory Agreements
The Board of Trustees (the Board) of AIM Investment Funds (Invesco Investment Funds) (the Company) is required under the Investment Company Act of 1940, as amended, to approve the Invesco Strategic Income Fund (the Fund) investment advisory agreements before the Fund can commence operations. During meetings held on March 25-26, 2014, the Board as a whole and the disinterested or “independent” Trustees voting separately approved (i) an amendment to the Company’s Master Investment Advisory Agreement with Invesco Advisers, Inc. (Invesco Advisers and the investment advisory agreement) to add the Fund, and (ii) (a) an amendment to the Master Intergroup Sub-Advisory Contract for Mutual Funds with Invesco Asset Management Deutschland GmbH, Invesco Asset Management Limited, Invesco Asset Management (Japan) Limited, Invesco Australia Limited, Invesco Hong Kong Limited, Invesco Senior Secured Management, Inc. and Invesco Canada Ltd. to add the Fund, and (b) an amendment to the Sub-Advisory Contract with Invesco PowerShares Capital Management LLC to add the Fund (the sub-advisers, the Affiliated Sub-Advisers; and the contracts, the sub-advisory contracts). In doing so, the Board followed a process similar to the process that it follows in annually reviewing and approving investment advisory agreements and sub-advisory contracts for the series portfolios of funds advised by Invesco Advisers (the Invesco Funds) and considered the information provided in the most recent annual review process as well as the information provided with respect to the Fund. The Board (i) determined that the investment advisory agreement and sub-advisory contracts are in the best interests of the Fund and its shareholders and that the compensation payable to Invesco Advisers and the Affiliated Sub-Advisers under the Fund’s agreements is fair and reasonable and (ii) approved submission of the agreements to the initial shareholder of the Fund.
The Board’s Fund Evaluation Process
The Board’s Investments Committee has established three Sub-Committees that are responsible for overseeing the management of a number of the funds advised by Invesco Advisers (the Invesco Funds). The Fund will be assigned to one of the Sub-Committees. This Sub-Committee structure permits the Trustees to focus on the performance of the Invesco Funds that have been assigned to them. The Sub-Committees meet throughout the year to review the performance, fees, expenses and other matters related to their assigned Invesco Funds. Over the course of each year, the Sub-Committees meet with portfolio managers for their assigned Invesco Funds and other members of management and review with these individuals the performance, investment
objective(s), policies, strategies, limitations and investment risks of these funds.
In evaluating the fairness and reasonableness of compensation under the Fund’s investment advisory agreement and sub-advisory contracts, the Board considered, among other things, the factors discussed below. The Board was assisted in its review by the Senior Officer, an independent officer of the Funds and by independent legal counsel. The discussion below serves as a summary of the material factors and related conclusions that formed the basis for the Board’s approval of the Fund’s investment advisory agreement and sub-advisory contracts. The Trustees’ review and conclusions are based on the comprehensive consideration of all information presented to them and are not the result of any single determinative factor. Moreover, one Trustee may have weighed a particular piece of information or factor differently than another Trustee.
Factors and Conclusions and Summary of Evaluation of Investment Advisory and Sub-Advisory Agreements
| A. | Nature, Extent and Quality of Services Provided by Invesco Advisers and the Affiliated Sub-Advisers |
The Board reviewed the advisory services to be provided to the Fund by Invesco Advisers under the Fund’s investment advisory agreement and the credentials and experience of the officers and employees of Invesco Advisers who will provide these services. The Board’s review of the qualifications of Invesco Advisers to provide these services included the Board’s consideration of Invesco Advisers’ investment process oversight, independent credit analysis and investment risk management. The Board also considered non-advisory services that Invesco Advisers and its affiliates provide to the Invesco Funds and will provide to the Fund, such as various back office support functions, equity and fixed income trading operations, internal audit, distribution and legal and compliance. In determining whether to approve the Fund’s investment advisory agreement, the Board considered the existing relationship between Invesco Advisers and the Invesco Funds, as well as the Board’s knowledge of Invesco Advisers’ operations. The Board concluded that the nature, extent and quality of the advisory services to be provided to the Fund by Invesco Advisers are appropriate.
The Board reviewed the services that may be provided by the Affiliated Sub-Advisers under the sub-advisory contracts and the credentials and experience of the officers and employees of the Affiliated Sub-Advisers who may provide these services. The Board noted that the Affiliated Sub-Advisers have offices and personnel that are located in financial centers around the world. As a result, the Affiliated Sub-Advisers can provide research and investment
analysis on the markets and economies of various countries in which the Fund may invest, make recommendations regarding securities and assist with security trades. The Board concluded that the sub-advisory contracts will benefit the Fund and its shareholders by permitting Invesco Advisers to use the resources and talents of the Affiliated Sub-Advisers in managing the Fund. The Board concluded that the nature, extent and quality of the services that may be provided by the Affiliated Sub-Advisers are appropriate.
The Board did not consider the performance of the Fund because the Fund is new and has no performance history. The Board did review performance expectations for the Fund in different market environments.
| C. | Advisory and Sub-Advisory Fees and Fee Waivers |
The Board considered the contractual management fee rate of the Fund and the proposed fee waivers and expense limitations that will be in place for the Fund through May 31, 2015. The Board also considered the services to be provided by the Affiliated Sub-Advisers pursuant to the sub-advisory contracts and the services to be provided by Invesco Advisers pursuant to the Fund’s investment advisory agreement, as well as the allocation of fees between Invesco Advisers and the Affiliated Sub-Advisers pursuant to the sub-advisory contracts. The Board noted that the sub-advisory fees will have no direct effect on the Fund or its shareholders, as they are paid by Invesco Advisers to the Affiliated Sub-Advisers.
The Board also considered comparative advisory fee data provided by Invesco Advisers for comparable registered funds managed by third-party advisers. The Board noted that Invesco Advisers does not manage other funds or client accounts with investment strategies comparable to those of the Fund. The Board noted that the advisory fee is at or below the Lipper Multi-Sector Income Funds classification median fee at all breakpoints and that the advisory fee is at or below the fees of two key competitors identified by Invesco Advisers at all breakpoints and below the fee of one key competitor at certain breakpoints and above the fee of that competitor at other breakpoints.
Based upon the information provided and considerations described above, the Board concluded that the compensation payable to Invesco Advisers and the Affiliated Sub-Advisers is fair and reasonable.
| D. | Economies of Scale and Breakpoints |
The Board considered the extent to which there may be economies of scale in the provision of advisory services to the Fund. The Board also considered whether the Fund would benefit from such economies of scale through contractual breakpoints in the Fund’s advisory fee schedule and through expense waivers. The
31 Invesco Strategic Income Fund
Board also noted that the Fund will share directly in economies of scale through lower fees charged by third party service providers based on the combined size of all of the Invesco Funds and other clients advised by Invesco Advisers.
| E. | Profitability and Financial Resources |
The Board considered information from Invesco Advisers concerning the costs of the advisory and other services that Invesco Advisers and its affiliates provide to the Invesco Funds and the profitability of Invesco Advisers and its affiliates in providing these services. The Board received information from Invesco Advisers demonstrating that Invesco Advisers and each Affiliated Sub-Adviser are financially sound and have the resources necessary to perform their obligations under the Fund’s investment advisory agreement and sub-advisory contracts.
| F. | Collateral Benefits to Invesco Advisers and its Affiliates |
The Board considered various other benefits to be received by Invesco Advisers and its affiliates resulting from Invesco Advisers’ relationship with the Fund, including the fees to be received by Invesco Advisers and its affiliates for their provision of transfer agency and distribution services to the Fund. The Board considered the performance of Invesco Advisers and its affiliates in providing these services to other Invesco Funds and the organizational structure employed by Invesco Advisers and its affiliates to provide these services. The Board also considered that these services will be provided to the Fund pursuant to written contracts that are reviewed and approved on an annual basis by the Board; that the services are required for the operation of the Fund; that Invesco Advisers and its affiliates can provide services, the nature and quality of which are at least equal to those provided by others offering the same or similar services; and that the fees for such services are fair and reasonable in light of the usual and customary charges by others for services of the same nature and quality.
The Board considered the benefits realized by Invesco Advisers and the Affiliated Sub-Advisers as a result of portfolio brokerage transactions executed through “soft dollar” arrangements. The Board noted that soft dollar arrangements shift the payment obligation for research and execution services from Invesco Advisers and the Affiliated Sub-Advisers to the Invesco Funds and that the research received may be used with other clients of Invesco Advisers and may reduce Invesco Advisers’ and the Affiliated Sub-Advisers’ expenses. The Board also considered periodic reports that it receives from the Chief Compliance Officer of the Invesco Funds demonstrating that these arrangements are consistent with regulatory requirements. The Board did not deem the soft dollar arrangements to be inappropriate.
The Board considered the fact that the Fund’s uninvested cash and cash collateral from any securities lending arrangements may be invested in money market funds advised by Invesco Advisers pursuant to procedures
approved by the Board. The Board noted that Invesco Advisers will receive advisory fees from these affiliated money market funds attributable to such investments, although Invesco Advisers has contractually agreed to waive through at least June 30, 2014, the advisory fees payable by the Fund with respect to such investments. This waiver is in an amount equal to 100% of the net advisory fee Invesco Advisers or its affiliates receive from the affiliated money market funds with respect to the Fund’s investment in the affiliated money market funds of uninvested cash, but not cash collateral from securities lending arrangements. The Board concluded that the Fund’s investment of uninvested cash and cash collateral from any securities lending arrangements in the affiliated money market funds is fair and reasonable.
The Board also considered that the Fund may use an affiliated broker to execute certain trades and was advised that such trades will be executed in compliance with rules under the Investment Company Act of 1940, as amended.
32 Invesco Strategic Income Fund
Tax Information
Form 1099-DIV, Form 1042-S and other year-end tax information provide shareholders with actual calendar year amounts that should be included in their tax returns. Shareholders should consult their tax advisors.
The following distribution information is being provided as required by the Internal Revenue Code or to meet a specific state’s requirement.
The Fund designates the following amounts or, if subsequently determined to be different, the maximum amount allowable for its period May 2, 2014 (commencement date) through October 31, 2014:
| | | | |
Federal and State Income Tax | |
Qualified Dividend Income* | | | 0.00 | % |
Corporate Dividends Received Deduction* | | | 0.00 | % |
U.S. Treasury Obligations* | | | 1.30 | % |
| | * | The above percentages are based on ordinary income dividends paid to shareholders during the period May 2, 2014 (commencement date) through October 31, 2014. |
33 Invesco Strategic Income Fund
Trustees and Officers
The address of each trustee and officer is AIM Investment Funds (Invesco Investment Funds) (the “Trust”), 11 Greenway Plaza, Suite 1000, Houston, Texas 77046-1173. The trustees serve for the life of the Trust, subject to their earlier death, incapacitation, resignation, retirement or removal as more specifically provided in the Trust’s organizational documents. Each officer serves for a one year term or until their successors are elected and qualified. Column two below includes length of time served with predecessor entities, if any.
| | | | | | | | |
Name, Year of Birth and Position(s) Held with the Trust | | Trustee and/
or Officer Since | | Principal Occupation(s) During Past 5 Years | | Number of Funds in Fund Complex Overseen by Trustee | | Other Directorship(s) Held by Trustee During Past 5 Years |
| Interested Persons | | | | | | | | |
| Martin L. Flanagan1 — 1960 Trustee | | 2007 | | Executive Director, Chief Executive Officer and President, Invesco Ltd. (ultimate parent of Invesco and a global investment management firm); Advisor to the Board, Invesco Advisers, Inc. (formerly known as Invesco Institutional (N.A.), Inc.); Trustee, The Invesco Funds; Vice Chair, Investment Company Institute; and Member of Executive Board, SMU Cox School of Business Formerly: Chairman and Chief Executive Officer, Invesco Advisers, Inc. (registered investment adviser); Director, Chairman, Chief Executive Officer and President, IVZ Inc. (holding company), INVESCO Group Services, Inc. (service provider) and Invesco North American Holdings, Inc. (holding company); Director, Chief Executive Officer and President, Invesco Holding Company Limited (parent of Invesco and a global investment management firm); Director, Invesco Ltd.; Chairman, Investment Company Institute and President, Co-Chief Executive Officer, Co-President, Chief Operating Officer and Chief Financial Officer, Franklin Resources, Inc. (global investment management organization). | | 144 | | None |
Philip A. Taylor2 — 1954 Trustee, President and Principal Executive Officer | | 2006 | | Head of North American Retail and Senior Managing Director, Invesco Ltd.; Director, Co-Chairman, Co-President and Co-Chief Executive Officer, Invesco Advisers, Inc. (formerly known as Invesco Institutional (N.A.), Inc.) (registered investment adviser); Director, Chairman, Chief Executive Officer and President, Invesco Management Group, Inc. (formerly known as Invesco Aim Management Group, Inc.) (financial services holding company); Director and President, INVESCO Funds Group, Inc. (registered investment adviser and registered transfer agent); Director and Chairman, Invesco Investment Services, Inc. (formerly known as Invesco Aim Investment Services, Inc.) (registered transfer agent) and IVZ Distributors, Inc. (formerly known as INVESCO Distributors, Inc.) (registered broker dealer); Director, President and Chairman, Invesco Inc. (holding company) and Invesco Canada Holdings Inc. (holding company); Chief Executive Officer, Invesco Corporate Class Inc. (corporate mutual fund company) and Invesco Canada Fund Inc. (corporate mutual fund company); Director, Chairman and Chief Executive Officer, Invesco Canada Ltd. (formerly known as Invesco Trimark Ltd./Invesco Trimark Ltèe) (registered investment adviser and registered transfer agent); Trustee, President and Principal Executive Officer, The Invesco Funds (other than AIM Treasurer’s Series Trust (Invesco Treasurer’s Series Trust) and Short-Term Investments Trust); Trustee and Executive Vice President, The Invesco Funds (AIM Treasurer’s Series Trust (Invesco Treasurer’s Series Trust) and Short-Term Investments Trust only); Director, Invesco Investment Advisers LLC (formerly known as Van Kampen Asset Management); Director, Chief Executive Officer and President, Van Kampen Exchange Corp. Formerly: Director and Chairman, Van Kampen Investor Services Inc.; Director, Chief Executive Officer and President, 1371 Preferred Inc. (holding company) and Van Kampen Investments Inc.; Director and President, AIM GP Canada Inc. (general partner for limited partnerships) and Van Kampen Advisors, Inc.; Director and Chief Executive Officer, Invesco Trimark Dealer Inc. (registered broker dealer); Director, Invesco Distributors, Inc. (formerly known as Invesco Aim Distributors, Inc.) (registered broker dealer); Manager, Invesco PowerShares Capital Management LLC; Director, Chief Executive Officer and President, Invesco Advisers, Inc.; Director, Chairman, Chief Executive Officer and President, Invesco Aim Capital Management, Inc.; President, Invesco Trimark Dealer Inc. and Invesco Trimark Ltd./Invesco Trimark Ltèe; Director and President, AIM Trimark Corporate Class Inc. and AIM Trimark Canada Fund Inc.; Senior Managing Director, Invesco Holding Company Limited; Director and Chairman, Fund Management Company (former registered broker dealer); President and Principal Executive Officer, The Invesco Funds (AIM Treasurer’s Series Trust (Invesco Treasurer’s Series Trust), and Short-Term Investments Trust only); President, AIM Trimark Global Fund Inc. and AIM Trimark Canada Fund Inc. | | 144 | | None |
Wayne W. Whalen3 — 1939 Trustee | | 2010 | | Of Counsel, and prior to 2010, partner in the law firm of Skadden, Arps, Slate, Meagher & Flom LLP, legal counsel to certain funds in the Fund Complex | | 144 | | Director of the Mutual fund Directors Forum, a nonprofit membership organization for investment directors; Chairman and Director of the Abraham Lincoln Presidential Library Foundation; and Director of the Stevenson Center for Democracy |
| 1 | Mr. Flanagan is considered an interested person (within the meaning of Section 2(a)(19) of the 1940 Act) of the Trust because he is an officer of the Adviser to the Trust, and an officer and a director of Invesco Ltd., ultimate parent of the Adviser. |
| 2 | Mr. Taylor is considered an interested person (within the meaning of Section 2(a)(19) of the 1940 Act) of the Trust because he is an officer and a director of the Adviser. |
| 3 | Mr. Whalen is retiring effective December 31, 2014. He has been deemed to be an interested person of the Trust because of his prior service as counsel to the predecessor funds of certain Invesco open-end funds and his affiliation with the law firm that served as counsel to such predecessor funds and the Invesco closed-end funds. |
T-1 Invesco Strategic Income Fund
Trustees and Officers—(continued)
| | | | | | | | |
Name, Year of Birth and Position(s) Held with the Trust | | Trustee and/
or Officer Since | | Principal Occupation(s) During Past 5 Years | | Number of Funds in Fund Complex Overseen by Trustee | | Other Directorship(s) Held by Trustee During Past 5 Years |
| Independent Trustees | | | | | | | | |
Bruce L. Crockett — 1944 Trustee and Chair | | 2001 | | Chairman, Crockett Technologies Associates (technology consulting company) Formerly: Director, Captaris (unified messaging provider); Director, President and Chief Executive Officer, COMSAT Corporation; Chairman, Board of Governors of INTELSAT (international communications company); ACE Limited (insurance company); and Investment Company Institute | | 144 | | ALPS (Attorneys Liability Protection Society) (insurance company) |
David C. Arch — 1945 Trustee | | 2010 | | Chairman of Blistex Inc., a consumer health care products manufacturer | | 144 | | Board member of the Illinois Manufacturers’ Association; Member of the Board of Visitors, Institute for the Humanities, University of Michigan; Member of the Audit Committee of the Edward-Elmhurst Hospital |
Frank S. Bayley — 1939 Trustee | | 1987 | | Retired. Formerly: Director, Badgley Funds Inc. (registered investment company) (2 portfolios) and General Partner and Of Counsel, law firm of Baker & McKenzie, LLP | | 144 | | Director and Chairman, C.D. Stimson Company (a real estate investment company); Trustee, The Curtis Institute of Music |
James T. Bunch — 1942 Trustee | | 2003 | | Managing Member, Grumman Hill Group LLC (family office private equity investments) Formerly: Founder, Green Manning & Bunch Ltd. (investment banking firm) (1988-2010); Executive Committee, United States Golf Association; and Director, Policy Studies, Inc. and Van Gilder Insurance Corporation | | 144 | | Chairman, Board of Governors, Western Golf Association; Chairman, Evans Scholars Foundation; and Director, Denver Film Society |
Rodney F. Dammeyer — 1940 Trustee | | 2010 | | Chairman of CAC,LLC, (private company offering capital investment and management advisory services) Formerly: Prior to 2001, Managing Partner at Equity Group Corporate Investments; Prior to 1995, Chief Executive Officer of Itel Corporation (formerly Anixter International); Prior to 1985, experience includes Senior Vice President and Chief Financial Officer of Household International, Inc., Executive Vice President and Chief Financial Officer of Northwest Industries, Inc. and Partner of Arthur Andersen & Co.; From 1987 to 2010, Director/Trustee of investment companies in the Van Kampen Funds complex | | 144 | | Director of Quidel Corporation and Stericycle, Inc. |
Albert R. Dowden — 1941 Trustee | | 2001 | | Director of a number of public and private business corporations, including the Boss Group, Ltd. (private investment and management); Nature’s Sunshine Products, Inc. and Reich & Tang Funds (5 portfolios) (registered investment company) Formerly: Director, Homeowners of America Holding Corporation/Homeowners of America Insurance Company (property casualty company); Director, Continental Energy Services, LLC (oil and gas pipeline service); Director, CompuDyne Corporation (provider of product and services to the public security market) and Director, Annuity and Life Re (Holdings), Ltd. (reinsurance company); Director, President and Chief Executive Officer, Volvo Group North America, Inc.; Senior Vice President, AB Volvo; Director of various public and private corporations; Chairman, DHJ Media, Inc.; Director, Magellan Insurance Company; and Director, The Hertz Corporation, Genmar Corporation (boat manufacturer), National Media Corporation; Advisory Board of Rotary Power International (designer, manufacturer, and seller of rotary power engines); and Chairman, Cortland Trust, Inc. (registered investment company) | | 144 | | Director of: Nature’s Sunshine Products, Inc., Reich & Tang Funds, Homeowners of America Holding Corporation/ Homeowners of America Insurance Company, the Boss Group |
Jack M. Fields — 1952 Trustee | | 2001 | | Chief Executive Officer, Twenty First Century Group, Inc. (government affairs company); Owner and Chief Executive Officer, Dos Angeles Ranch, L.P. (cattle, hunting, corporate entertainment); and Discovery Global Education Fund (non-profit) Formerly: Chief Executive Officer, Texana Timber LP (sustainable forestry company); Director of Cross Timbers Quail Research Ranch (non-profit); and member of the U.S. House of Representatives | | 144 | | Insperity, Inc. (formerly known as Administaff) |
Prema Mathai-Davis — 1950 Trustee | | 2001 | | Retired. Formerly: Chief Executive Officer, YWCA of the U.S.A. | | 144 | | None |
Larry Soll — 1942 Trustee | | 2003 | | Retired. Formerly: Chairman, Chief Executive Officer and President, Synergen Corp. (a biotechnology company) | | 144 | | None |
Hugo F. Sonnenschein — 1940 Trustee | | 2010 | | President Emeritus and Honorary Trustee of the University of Chicago and the Adam Smith Distinguished Service Professor in the Department of Economics at the University of Chicago. Prior to 2000, President of the University of Chicago | | 144 | | Trustee of the University of Rochester and a member of its investment committee; Member of the National Academy of Sciences and the American Philosophical Society; Fellow of the American Academy of Arts and Sciences |
T-2 Invesco Strategic Income Fund
Trustees and Officers—(continued)
| | | | | | | | |
Name, Year of Birth and Position(s) Held with the Trust | | Trustee and/
or Officer Since | | Principal Occupation(s) During Past 5 Years | | Number of Funds in Fund Complex Overseen by Trustee | | Other Directorship(s) Held by Trustee During Past 5 Years |
| Independent Trustees—(continued) |
Raymond Stickel, Jr. — 1944 Trustee | | 2005 | | Retired. Formerly: Director, Mainstay VP Series Funds, Inc. (25 portfolios) and Partner, Deloitte & Touche | | 144 | | None |
Suzanne H. Woolsey — 1941 Trustee | | 2014 | | Chief Executive Officer of Woolsey Partners LLC | | 144 | | Emeritus Chair of the Board of Trustees of the Institute for Defense Analyses; Trustee of Colorado College; Trustee of California Institute of Technology; Prior to 2014, Director of Fluor Corp.; Prior to 2010, Trustee of the German Marshall Fund of the United States; Prior to 2010 Trustee of the Rocky Mountain Institute |
| Other Officers | | | | | | | | |
Russell C. Burk — 1958 Senior Vice President and Senior Officer | | 2005 | | Senior Vice President and Senior Officer, The Invesco Funds | | N/A | | N/A |
John M. Zerr — 1962 Senior Vice President, Chief Legal Officer and Secretary | | 2006 | | Director, Senior Vice President, Secretary and General Counsel, Invesco Management Group, Inc. (formerly known as Invesco Aim Management Group, Inc.) and Van Kampen Exchange Corp.; Senior Vice President, Invesco Advisers, Inc. (formerly known as Invesco Institutional (N.A.), Inc.) (registered investment adviser); Senior Vice President and Secretary, Invesco Distributors, Inc. (formerly known as Invesco Aim Distributors, Inc.); Director, Vice President and Secretary, Invesco Investment Services, Inc. (formerly known as Invesco Aim Investment Services, Inc.) and IVZ Distributors, Inc. (formerly known as INVESCO Distributors, Inc.); Director and Vice President, INVESCO Funds Group, Inc.; Senior Vice President, Chief Legal Officer and Secretary, The Invesco Funds; Manager, Invesco PowerShares Capital Management LLC; Director, Secretary and General Counsel, Invesco Investment Advisers LLC (formerly known as Van Kampen Asset Management); Secretary and General Counsel, Invesco Capital Markets, Inc. (formerly known as Van Kampen Funds Inc.) and Chief Legal Officer, PowerShares Exchange-Traded Fund Trust, PowerShares Exchange-Traded Fund Trust II, PowerShares India Exchange-Traded Fund Trust, PowerShares Actively Managed Exchange-Traded Fund Trust; and PowerShares Actively Managed Exchange-Traded Commodity Fund Trust Formerly: Director and Vice President, Van Kampen Advisors Inc.; Director, Vice President, Secretary and General Counsel, Van Kampen Investor Services Inc.; Director, Invesco Distributors, Inc. (formerly known as Invesco Aim Distributors, Inc.); Director, Senior Vice President, General Counsel and Secretary, Invesco Aim Advisers, Inc. and Van Kampen Investments Inc.; Director, Vice President and Secretary, Fund Management Company; Director, Senior Vice President, Secretary, General Counsel and Vice President, Invesco Aim Capital Management, Inc.; Chief Operating Officer and General Counsel, Liberty Ridge Capital, Inc. (an investment adviser); Vice President and Secretary, PBHG Funds (an investment company) and PBHG Insurance Series Fund (an investment company); Chief Operating Officer, General Counsel and Secretary, Old Mutual Investment Partners (a broker-dealer); General Counsel and Secretary, Old Mutual Fund Services (an administrator) and Old Mutual Shareholder Services (a shareholder servicing center); Executive Vice President, General Counsel and Secretary, Old Mutual Capital, Inc. (an investment adviser); and Vice President and Secretary, Old Mutual Advisors Funds (an investment company) | | N/A | | N/A |
Sheri Morris — 1964 Vice President, Treasurer and Principal Financial Officer | | 1999 | | Vice President, Treasurer and Principal Financial Officer, The Invesco Funds; Vice President, Invesco Advisers, Inc. (formerly known as Invesco Institutional (N.A.), Inc.) (registered investment adviser); and Vice President, PowerShares Exchange-Traded Fund Trust, PowerShares Exchange-Traded Fund Trust II, PowerShares India Exchange-Traded Fund Trust, PowerShares Actively Managed Exchange-Traded Fund Trust, and PowerShares Actively Managed Exchange-Traded Commodity Fund Trust Formerly: Vice President, Invesco Aim Advisers, Inc., Invesco Aim Capital Management, Inc. and Invesco Aim Private Asset Management, Inc.; Assistant Vice President and Assistant Treasurer, The Invesco Funds and Assistant Vice President, Invesco Advisers, Inc., Invesco Aim Capital Management, Inc. and Invesco Aim Private Asset Management, Inc.; and Treasurer, PowerShares Exchange-Traded Fund Trust, PowerShares Exchange-Traded Fund Trust II, PowerShares India Exchange-Traded Fund Trust and PowerShares Actively Managed Exchange-Traded Fund Trust | | N/A | | N/A |
T-3 Invesco Strategic Income Fund
Trustees and Officers—(continued)
| | | | | | | | |
Name, Year of Birth and Position(s) Held with the Trust | | Trustee and/
or Officer Since | | Principal Occupation(s) During Past 5 Years | | Number of Funds in Fund Complex Overseen by Trustee | | Other Directorship(s) Held by Trustee During Past 5 Years |
| Other Officers—(continued) | | | | | | | | |
Karen Dunn Kelley — 1960 Vice President | | 2004 | | Senior Managing Director, Investments; Director, Co-President, Co-Chief Executive Officer, and Co-Chairman, Invesco Advisers, Inc. (formerly known as Invesco Institutional (N.A.), Inc.) (registered investment adviser); Chairman, Invesco Senior Secured Management, Inc.; Senior Vice President, Invesco Management Group, Inc. (formerly known as Invesco Aim Management Group, Inc.); Executive Vice President, Invesco Distributors, Inc. (formerly known as Invesco Aim Distributors, Inc.); Director, Invesco Mortgage Capital Inc. and Invesco Management Company Limited; Director and President, INVESCO Asset Management (Bermuda) Ltd., Vice President, The Invesco Funds (other than AIM Treasurer’s Series Trust (Invesco Treasurer’s Series Trust) and Short-Term Investments Trust); and President and Principal Executive Officer, The Invesco Funds (AIM Treasurer’s Series Trust (Invesco Treasurer’s Series Trust) and Short-Term Investments Trust only) Formerly: Director, INVESCO Global Asset Management Limited and INVESCO Management S.A.; Senior Vice President, Van Kampen Investments Inc. and Invesco Advisers, Inc. (formerly known as Invesco Institutional (N.A.), Inc.) (registered investment adviser); Vice President, Invesco Advisers, Inc. (formerly known as Invesco Institutional (N.A.), Inc.); Director of Cash Management and Senior Vice President, Invesco Advisers, Inc. and Invesco Aim Capital Management, Inc.; Director and President, Fund Management Company; Chief Cash Management Officer, Director of Cash Management, Senior Vice President, and Managing Director, Invesco Aim Capital Management, Inc.; Director of Cash Management, Senior Vice President, and Vice President, Invesco Advisers, Inc. and The Invesco Funds (AIM Treasurer’s Series Trust (Invesco Treasurer’s Series Trust), and Short-Term Investments Trust only) | | N/A | | N/A |
Crissie M. Wisdom — 1969 Anti-Money Laundering Compliance Officer | | 2013 | | Anti-Money Laundering Compliance Officer, Invesco Advisers, Inc. (formerly known as Invesco Institutional (N.A.), Inc.) (registered investment adviser), Invesco Capital Markets, Inc. (formerly known as Van Kampen Funds Inc.), Invesco Distributors, Inc., Invesco Investment Services, Inc., Invesco Management Group, Inc., Van Kampen Exchange Corp., The Invesco Funds, and PowerShares Exchange-Traded Fund Trust, PowerShares Exchange-Traded Fund Trust II, PowerShares India Exchange-Traded Fund Trust, PowerShares Actively Managed Exchange-Traded Fund Trust and PowerShares Actively Managed Exchange-Traded Commodity Fund Trust; and Fraud Prevention Manager and Controls and Risk Analysis Manager for Invesco Investment Services, Inc. | | N/A | | N/A |
Todd L. Spillane — 1958 Chief Compliance Officer | | 2006 | | Senior Vice President, Invesco Management Group, Inc. (formerly known as Invesco Aim Management Group, Inc.) and Van Kampen Exchange Corp.; Senior Vice President and Chief Compliance Officer, Invesco Advisers, Inc. (registered investment adviser) (formerly known as Invesco Institutional (N.A.), Inc.); Chief Compliance Officer, The Invesco Funds; Vice President, Invesco Distributors, Inc. (formerly known as Invesco Aim Distributors, Inc.) and Invesco Investment Services, Inc. (formerly known as Invesco Aim Investment Services, Inc.) Formerly: Chief Compliance Officer, Invesco Funds (Chicago); Senior Vice President, Van Kampen Investments Inc.; Senior Vice President and Chief Compliance Officer, Invesco Aim Advisers, Inc. and Invesco Aim Capital Management, Inc.; Chief Compliance Officer, INVESCO Private Capital Investments, Inc. (holding company), Invesco Private Capital, Inc. (registered investment adviser), Invesco Global Asset Management (N.A.), Inc., Invesco Senior Secured Management, Inc. (registered investment adviser), Van Kampen Investor Services Inc., PowerShares Exchange-Traded Fund Trust, PowerShares Exchange-Traded Fund Trust II, PowerShares India Exchange-Traded Fund Trust and PowerShares Actively Managed Exchange-Traded Fund Trust; and Vice President, Invesco Aim Capital Management, Inc. and Fund Management Company | | N/A | | N/A |
The Statement of Additional Information of the Trust includes additional information about the Fund’s Trustees and is available upon request, without charge, by calling 1.800.959.4246. Please refer to the Fund’s prospectus for information on the Fund’s sub-advisers.
| | | | | | |
Office of the Fund 11 Greenway Plaza, Suite 1000 Houston, TX 77046-1173 | | Investment Adviser Invesco Advisers, Inc. 1555 Peachtree Street, N.E. Atlanta, GA 30309 | | Distributor Invesco Distributors, Inc. 11 Greenway Plaza, Suite 1000 Houston, TX 77046-1173 | | Auditors PricewaterhouseCoopers LLP 1000 Louisiana Street, Suite 5800 Houston, TX 77002-5678 |
| | | |
| | | | | | |
Counsel to the Fund Stradley Ronon Stevens & Young, LLP 2005 Market Street, Suite 2600 Philadelphia, PA 19103-7018 | | Counsel to the Independent Trustees Goodwin Procter LLP 901 New York Avenue, N.W. Washington, D.C. 20001 | | Transfer Agent Invesco Investment Services, Inc. 11 Greenway Plaza, Suite 1000 Houston, TX 77046-1173 | | Custodian State Street Bank and Trust Company 225 Franklin Street Boston, MA 02110-2801 |
T-4 Invesco Strategic Income Fund

Invesco mailing information
Send general correspondence to Invesco Investment Services, Inc., P.O. Box 219078, Kansas City, MO 64121-9078.
Important notice regarding delivery of security holder documents
To reduce Fund expenses, only one copy of most shareholder documents may be mailed to shareholders with multiple accounts at the same address (Householding). Mailing of your shareholder documents may be householded indefinitely unless you instruct us otherwise. If you do not want the mailing of these documents to be combined with those for other members of your household, please contact Invesco Investment Services, Inc. at 800 959 4246 or contact your financial institution. We will begin sending you individual copies for each account within 30 days after receiving your request.
Fund holdings and proxy voting information
The Fund provides a complete list of its holdings four times in each fiscal year, at the quarter ends. For the second and fourth quarters, the lists appear in the Fund’s semiannual and annual reports to shareholders. For the first and third quarters, the Fund files the lists with the Securities and Exchange Commission (SEC) on Form N-Q. The most recent list of portfolio holdings is available at invesco.com/completeqtrholdings. Shareholders can also look up the Fund’s Forms N-Q on the SEC website at sec.gov. Copies of the Fund’s Forms N-Q may be reviewed and copied at the SEC Public Reference Room in Washington, D.C. You can obtain information on the operation of the Public Reference Room, including information about duplicating fee charges, by calling 202 551 8090 or 800 732 0330, or by electronic request at the following email address: publicinfo@sec.gov. The SEC file numbers for the Fund are shown below.
A description of the policies and procedures that the Fund uses to determine how to vote proxies relating to portfolio securities is available without charge, upon request, from our Client Services department at 800 959 4246 or at invesco.com/proxyguidelines. The information is also available on the SEC website, sec.gov.
| | |
Information regarding how the Fund voted proxies related to its portfolio securities during the most recent 12-month period ended June 30 is available at invesco.com/proxysearch. The information is also available on the SEC website, sec.gov. | |  |
Invesco Advisers, Inc. is an investment adviser; it provides investment advisory services to individual and institutional clients and does not sell securities. Invesco Distributors, Inc. is the US distributor for Invesco Ltd.’s retail mutual funds, exchange-traded funds and institutional money market funds. Both are wholly owned, indirect subsidiaries of Invesco Ltd. | |
| | | | |
| SEC file numbers: 811-05426 and 033-19338 | | STI-AR-1 | | Invesco Distributors, Inc. |
Letters to Shareholders
| | |

Philip Taylor | | Dear Shareholders: This annual report includes information about your Fund, including performance data and a complete list of its investments as of the close of the reporting period. Inside, your Fund’s portfolio managers discuss how they managed your Fund and the factors that affected its performance during the reporting period. I hope you find this report of interest. During the reporting period covered by this report, the US economy showed signs of continued improvement. After contracting in the first quarter of 2014, the economy expanded strongly in the second quarter and unemployment trended lower. Much of the credit for this improvement goes to the US Federal Reserve (the Fed), which undertook an extraordinary asset purchase program following the global financial crisis. The Fed’s goal was to jumpstart the economy by encouraging banks to lend more, businesses to hire more and consumers to spend more. Signs of a stronger US economy prompted the Fed to reduce, or “taper,” its asset purchase program. Despite |
| this, interest rates remained near historical low levels due largely to heavy investor demand for bonds. While signs of economic improvement were evident in the US, European economies showed signs of weakening. That, together with geopolitical uncertainty and worries about the first diagnosed cases of Ebola outside of Africa, caused increased volatility in US and European equities. |
Extended periods of market strength can lull investors into complacency – just as prolonged periods of market weakness or volatility can discourage investors from initiating long-term investment plans. That’s why Invesco has always encouraged investors to work with a professional financial adviser who can stress the importance of starting to save and invest early and the importance of adhering to a disciplined investment plan – when times are good and when they’re uncertain. A financial adviser who knows your unique financial situation, investment goals and risk tolerance can be an invaluable partner as you seek to achieve your financial goals. He or she can offer a long-term perspective when markets are volatile and time-tested advice and guidance when your financial situation or investment goals change.
Timely information when and where you want it
Invesco’s efforts to help investors achieve their financial objectives include providing individual investors and financial professionals with timely information about the markets, the economy and investing – whenever and wherever they want it.
Our website, invesco.com/us, offers a wide range of market insights and investment perspectives. On the website, you’ll find detailed information about our funds, including prices, performance, holdings and portfolio manager commentaries. You can access information about your individual Invesco account whenever it’s convenient for you; just complete a simple, secure online registration. Use the “Log In” box on our home page to get started.
Invesco’s mobile app for iPad® (available free from the App StoreSM) allows you to obtain the same detailed information about your Fund and the same investment insights from our investment leaders, market strategists, economists and retirement experts on the go. You also can watch portfolio manager videos and have instant access to Invesco news and updates wherever you may be.
In addition to the resources accessible on our website and through our mobile app, you can obtain timely updates to help you stay informed about the markets, the economy and investing by connecting with Invesco on Twitter, LinkedIn or Facebook. You can access our blog at blog.invesco.us.com. Our goal is to provide you the information you want, when and where you want it.
Have questions?
For questions about your account, feel free to contact an Invesco client services representative at 800 959 4246. For Invesco-related questions or comments, please email me directly at phil@invesco.com.
All of us at Invesco look forward to serving your investment management needs for many years to come. Thank you for investing with us.
Sincerely,

Philip Taylor
Senior Managing Director, Invesco Ltd.
iPad is a trademark of Apple Inc., registered in the US and other countries. App Store is a service mark of Apple Inc. Invesco Distributors, Inc. is not affiliated with Apple Inc.
2 Invesco Unconstrained Bond Fund
| | |

Bruce Crockett | | Dear Fellow Shareholders: There are a variety of factors that can impact investment performance, many of which are uncontrollable by us as investors. These factors can include various economic trends and geopolitical developments. While the members of the Invesco Funds Board, which I chair, can’t dictate the performance of the Invesco funds, be assured that your Board works diligently throughout the year to focus on how your investments are managed. Our job is to represent you and your interests on a variety of fund management-related matters. We regularly monitor how the portfolio management teams of the Invesco funds are performing in light of ever-changing and often unpredictable economic and market conditions. We review the investment strategies and investment process employed by each fund’s management team as explained in the fund’s prospectus. |
| | Perhaps our most significant responsibility is conducting the annual review of the funds’ |
advisory and sub-advisory contracts with Invesco Advisers and its affiliates. This annual review, which is required by the Investment Company Act of 1940, focuses on the nature and quality of the services Invesco provides as the adviser to the Invesco funds and the reasonableness of the fees that it charges for those services. Each year, we spend months carefully reviewing information from Invesco that allows us to evaluate the quality of its services and the reasonableness of its fees. We also use information from a variety of independent sources, including materials provided by the independent senior officer of the Invesco funds, who reports directly to the independent trustees on the Board. Additionally, we meet with legal counsel and review performance and fee data prepared for us by Lipper Inc., an independent, third-party firm widely recognized as a leader in its field.
After a careful review, the members of the Invesco Funds Board approved the continuation of advisory and sub-advisory contracts with Invesco Advisers and its affiliates. Be assured that your Board will continue working on behalf of fund shareholders, keeping your needs and interests uppermost in our minds.
As always, please contact me at bruce@brucecrockett.com with any questions or concerns you may have. On behalf of the Board, we look forward to continuing to represent your interests and serving your needs.
Sincerely,

Bruce L. Crockett
Independent Chair
Invesco Funds Board of Trustees
3 Invesco Unconstrained Bond Fund
Management’s Discussion of Fund Performance
Performance summary
Invesco Unconstrained Bond Fund incepted on October 14, 2014. For the reporting period ended October 31, 2014, the Fund delivered a positive absolute return, at net asset value (NAV), and outperformed the 3-Month USD Libor Index, the Fund’s broad market/style-specific benchmark.
Additional performance information for your Fund appears later in this report.
Fund vs. Indexes
Cumulative total returns, 10/14/14 to 10/31/14, at net asset value (NAV). Performance shown does not include applicable contingent deferred sales charges (CDSC) or front-end sales charges, which would have reduced performance.
| | | | |
Class A Shares | | | 0.40 | % |
Class C Shares | | | 0.40 | |
Class R Shares | | | 0.40 | |
Class Y Shares | | | 0.40 | |
Class R5 Shares | | | 0.40 | |
Class R6 Shares | | | 0.40 | |
3-Month USD Libor Indexq (Broad Market/Style-Specific Index) | | | 0.01 | |
Lipper Alternative Credit Focus Funds Indexn (Peer Group Index) | | | 0.41 | |
Source(s): qBloomberg L.P.; nLipper Inc.
Market conditions and your Fund
During this short reporting period, bond investors favored credit risk assets despite slower economic activity and escalating geopolitical concerns. In this environment, the Fund’s total return for the partial month since its inception on October 14, 2014, was positive at NAV, and it outperformed its broad market/style-specific benchmark, the 3-Month USD Libor Index. The Fund’s return was impacted by a variety of active top-down and bottom-up investment decisions. Our sector rotation and security selection decisions were most impactful to the Fund’s performance over the reporting period.
Among the sector allocation decisions, our positions in bank loans, residential mortgage-backed securities (MBS), government bonds, municipal bonds and emerging market debt were the most favorable for the Fund’s absolute return, but their gains were softened by less favorable returns from investment grade corporate bonds and commercial mortgage-backed securities. Our security selection was also a contributor to our performance. Favorable security selection decisions were prevalent across the portfolio, including those among government bonds, corporate bonds and MBS holdings.
Please note that our strategy is implemented using derivative instruments, including futures, forwards, swaps and options. Therefore, a portion of the performance of the strategy, both positive and negative, can be attributed to these instruments. Derivatives can be a cost-effective way to gain or hedge exposure to certain risks. However, derivatives may amplify traditional investment risks through the creation of leverage and may be less liquid than traditional securities.
Thank you for your investment in Invesco Unconstrained Bond Fund.
The views and opinions expressed in management’s discussion of Fund performance are those of Invesco Advisers, Inc. These views and opinions are subject to change at any time based on factors such as market and economic conditions. These views and opinions may not be relied upon as investment advice or recommendations, or as an offer for a particular security. The information is not a complete analysis of every aspect of any market, country, industry, security or the Fund. Statements of fact are from sources considered reliable, but Invesco Advisers, Inc. makes no representation or warranty as to their completeness or accuracy. Although historical performance is no guarantee of future results, these insights may help you understand our investment management philosophy.
See important Fund and, if applicable, index disclosures later in this report.
| | | | |
| Portfolio Composition | | | |
| By security type | |
| | | | |
U.S. Treasury Securities | | | 39.0 | % |
Asset-Backed Securities | | | 28.7 | |
Common Stocks | | | 22.5 | |
| U.S. Dollar-Denominated Bonds and Notes | | | 6.2 | |
Non-U.S. Dollar-Denominated | | | | |
Bonds and Notes | | | 2.8 | |
Municipal Obligations | | | 1.4 | |
Money Market Funds | | | | |
| Plus Other Assets Less Liabilities | | | -0.6 | |
| | | | | | |
Top 10 Debt Holdings* | | | |
| | | |
| 1. | | U.S. Treasury Bills, 11/6/14 | | | 21.9 | % |
| 2. | | U.S. Treasury Bills, 4/30/15 | | | 17.1 | |
| 3. | | Freddie Mac, Series 2014-DN4, Class M2 | | | 2.4 | |
| 4. | | APIDOS CLO XIX, Series 2014-19A, Class C | | | 2.0 | |
| 5. | | Sudbury Mill CLO Ltd., Series 2013-1A, Class B1 | | | 2.0 | |
| 6. | | Standard Chartered Bank | | | 2.0 | |
| 7. | | Symphony CLO XV Ltd., Series 2014-15A, Class C | | | 1.9 | |
| 8. | | JP Morgan Mortgage Trust, Series 2005-A3, Class 7CA1 | | | 1.4 | |
| 9. | | JP Morgan Chase Commercial Mortgage Securities Trust, Series 2014-C20, Class B | | | 1.3 | |
10. | | JP Morgan Chase Commercial Mortgage Securities Trust, Series 2006-LDP6, Class AJ | | | 1.3 | |
| | | | |
| Total Net Assets | | $ | 25.1 million | |
| | | | |
| |
| Total Number of Holdings* | | | 50 | |
The Fund’s holdings are subject to change, and there is no assurance that the Fund will continue to hold any particular security.
*Excluding money market fund holdings.
4 Invesco Unconstrained Bond Fund
| | |
 | | Ivan Bakrac Portfolio Manager and Head of Multi-Sector Portfolio Management for Invesco Fixed Income, is manager |
| of Invesco Unconstrained Bond Fund. He joined Invesco in 2014. Mr. Bakrac earned a BBA in finance and investments from Baruch College and an MS in financial engineering from Polytechnic Institute of New York University. |
| | |
 | | Robert Waldner Chartered Financial Analyst, Portfolio Manager, is manager of Invesco Unconstrained Bond |
| Fund. He joined Invesco in 2013. Mr. Waldner earned a BSE degree in civil engineering from Princeton University. |
5 Invesco Unconstrained Bond Fund
Your Fund’s Performance
| | | | |
| Cumulative Total Returns | |
As of 10/31/14, including maximum applicable sales charges | |
| Class A Shares | | | | |
| Inception (10/14/14) | | | -3.83 | % |
| |
| Class C Shares | | | | |
| Inception (10/14/14) | | | -0.60 | % |
| |
| Class R Shares | | | | |
| Inception (10/14/14) | | | 0.40 | % |
| |
| Class Y Shares | | | | |
| Inception (10/14/14) | | | 0.40 | % |
| |
| Class R5 Shares | | | | |
| Inception (10/14/14) | | | 0.40 | % |
| |
| Class R6 Shares | | | | |
| Inception (10/14/14) | | | 0.40 | % |
The performance data quoted represent past performance and cannot guarantee comparable future results; current performance may be lower or higher. Please visit invesco.com/performance for the most recent month-end performance. Performance figures reflect reinvested distributions, changes in net asset value and the effect of the maximum
sales charge unless otherwise stated. Performance figures do not reflect deduction of taxes a shareholder would pay on Fund distributions or sale of Fund shares. Investment return and principal value will fluctuate so that you may have a gain or loss when you sell shares.
The net annual Fund operating expense ratio set forth in the most recent Fund prospectus as of the date of this report for Class A, Class C, Class R, Class Y, Class R5 and Class R6 shares was 1.09%, 1.84%, 1.34%, 0.84%, 0.84% and 0.84%, respectively.1,2 The total annual Fund operating expense ratio set forth in the most recent Fund prospectus as of the date of this report for Class A, Class C, Class R, Class Y, Class R5 and Class R6 shares was 2.09%, 2.84%, 2.34%, 1.84%, 1.93% and 1.88%, respectively. The expense ratios presented above may vary from the expense ratios presented in other sections of this report that are based on expenses incurred during the period covered by this report.
Class A share performance reflects the maximum 4.25% sales charge, and Class C share performance reflects the applicable contingent deferred sales charge (CDSC) for the period involved. The CDSC on Class C shares is 1% for the first year after purchase. Class R, Class Y, Class R5 and Class R6 shares do not have a front-end sales charge or a CDSC; therefore, performance is at net asset value.
The performance of the Fund’s share classes will differ primarily due to different sales charge structures and class expenses.
Had the adviser not waived fees and/or reimbursed expenses, performance would have been lower.
| 1 | Total annual Fund operating expenses after any contractual fee waivers and/or expense reimbursements by the adviser in effect through at least February 29, 2016. See current prospectus for more information. |
| 2 | Total annual Fund operating expenses after any contractual fee waivers and/or expense reimbursements by the adviser in effect through at least June 30, 2016. See current prospectus for more information. |
Invesco Unconstrained Bond Fund’s investment objective is to provide a positive absolute return over a full market cycle.
| n | | Unless otherwise stated, information presented in this report is as of October 31, 2014, and is based on total net assets. |
| n | | Unless otherwise noted, all data provided by Invesco. |
| n | | To access your Fund’s reports/prospectus, visit invesco.com/fundreports. |
About share classes
| n | | Class R shares are generally available only to employer sponsored retirement and benefit plans. Please see the prospectus for more information. |
| n | | Class Y shares are available only to certain investors. Please see the prospectus for more information. |
| n | | Class R5 shares and Class R6 shares are primarily intended for employer sponsored retirement and benefit plans that meet certain standards and for institutional investors. Please see the prospectus for more information. |
Principal risks of investing in the Fund
| n | | Changing fixed income market conditions risk. The current historically low interest rate environment was created in part by the Federal Reserve Board (FRB) and certain foreign central banks keeping the federal funds and equivalent foreign rates at or near zero. There is a risk that interest rates will rise |
| | when the FRB and central banks raise these rates. This risk is heightened due to the potential “tapering” of the FRB’s quantitative easing program and other similar foreign central bank actions. This tapering and eventual increase in the federal funds and equivalent foreign rates may expose fixed income markets to heightened volatility and reduced liquidity for certain fixed income investments, particularly those with longer maturities. In addition, decreases in fixed income dealer market-making capacity may also potentially lead to heightened volatility and reduced liquidity in the fixed income markets. As a result, the value of the Fund’s investments and share price may decline. Changes in central bank policies could also result in higher than normal shareholder redemptions, which could potentially increase portfolio turnover and the Fund’s transaction costs. |
| n | | Collateralized loan obligations risk. In addition to the normal interest rate, default and other risk of fixed income |
| | | securities, collateralized loan obligations carry additional risks, including the possibility that distributions from collateral securities will not be adequate to make interest or other payments, the quality of the collateral may decline in value or default, the Fund may invest in collateralized loan obligations that are subordinate to other classes, values may be volatile, and disputes with the issuer may produce unexpected investment results. |
| n | | Convertible securities risk. The Fund may own convertible securities, the value of which may be affected by market interest rates, the risk that the issuer will default, the value of the underlying stock or the right of the issuer to buy back the convertible securities. |
| n | | Credit risk. The issuer of instruments in which the Fund invests may be unable to meet interest and/or principal payments, thereby causing its instruments to decrease in value and lowering the issuer’s credit rating. |
6 Invesco Unconstrained Bond Fund
| n | | Currency/exchange rate risk. The dollar value of the Fund’s foreign investments will be affected by changes in the exchange rates between the dollar and the currencies in which those investments are traded. |
| n | | Derivatives risk. The value of a derivative instrument depends largely on (and is derived from) the value of an underlying security, currency, commodity, interest rate, index or other asset (each referred to as an underlying asset). In addition to risks relating to the underlying assets, the use of derivatives may include other, possibly greater, risks, including counterparty, leverage and liquidity risks. Counterparty risk is the risk that the counterparty to the derivative contract will default on its obligation to pay the Fund the amount owed or otherwise perform under the derivative contract. Derivatives create leverage risk because they do not require payment up front equal to the economic exposure created by owning the derivative. As a result, an adverse change in the value of the underlying asset could result in the Fund sustaining a loss that is substantially greater than the amount invested in the derivative, which may make the Fund’s returns more volatile and increase the risk of loss. Derivative instruments may also be less liquid than more traditional investments and the Fund may be unable to sell or close out its derivative positions at a desirable time or price. This risk may be more acute under adverse market conditions, during which the Fund may be most in need of liquidating its derivative positions. Derivatives may also be harder to value, less tax efficient and subject to changing government regulation that could impact the Fund’s ability to use certain derivatives or their cost. Also, derivatives used for hedging or to gain or limit exposure to a particular market segment may not provide the expected benefits, particularly during adverse market conditions. |
| n | | Emerging markets securities risk. The prices of securities issued by foreign companies and governments located in emerging markets countries may be affected more negatively by inflation, devaluation of their currencies, higher transaction costs, delays in settlement, adverse political developments, the introduction of capital controls, withholding taxes, nationalization of private assets, expropriation, social unrest, war or lack of timely information than those in developed countries. |
| n | | Floating rate risk. The Fund may invest in senior secured floating rate loans and debt securities that require collateral. There is a risk that the value of the |
| | collateral may not be sufficient to cover the amount owed, collateral securing a loan may be found invalid, and collateral may be used to pay other outstanding obligations of the borrower under applicable law or may be difficult to sell. There is also the risk that the collateral may be difficult to liquidate, or that a majority of the collateral may be illiquid. |
| n | | Foreign government debt risk. Investments in foreign government debt obligations involve certain risks in addition to those relating to foreign securities or debt securities generally. The issuer of the debt or the governmental authorities that control the repayment of the debt may be unable or unwilling to repay principal or interest when due in accordance with the terms of such debt, and the Fund may have limited recourse in the event of a default against the defaulting government. Without the approval of debt holders, some governmental debtors have in the past been able to reschedule or restructure their debt payments or declare moratoria on payments. |
| n | | Foreign securities risk. The Fund’s foreign investments may be affected by changes in a foreign country’s exchange rates, political and social instability, changes in economic or taxation policies, difficulties when enforcing obligations, decreased liquidity, and increased volatility. Foreign companies may be subject to less regulation resulting in less publicly available information about the companies. |
| n | | High yield bond (junk bond) risk. Junk bonds involve a greater risk of default or price changes due to changes in the credit quality of the issuer. The values of junk bonds fluctuate more than those of high-quality bonds in response to company, political, regulatory or economic developments. Values of junk bonds can decline significantly over short periods of time. |
| n | | Inflation-indexed security risk. The risk that the value of an inflation indexed security (such as Treasury Inflation-Protected Securities (TIPS) tends to decrease when real interest rates increase and increase when real interest rates decrease. Interest payments on inflation-indexed securities will vary along with changes in the Consumer Price Index. |
| n | | Interest rate risk. Interest rate risk refers to the risk that bond prices generally fall as interest rates rise; conversely, bond prices generally rise as interest rates fall. Specific bonds differ in their sensitivity to changes in interest rates depending on their individual characteristics, including duration. |
| n | | Liquidity risk. The Fund may hold illiquid securities that it is unable to sell at |
| | the preferred time or price and could lose its entire investment in such securities. The Fund’s significant use of derivative instruments may cause liquidity risk to be greater than other mutual funds that invest in more traditional assets such as stocks and bonds, which trade on markets with more market participants. |
| n | | Management risk. The investment techniques and risk analysis used by the Fund’s and the underlying funds’ portfolio managers may not produce the desired results. |
| n | | Market risk. The prices of and the income generated by the Fund’s securities may decline in response to, among other things, investor sentiment, general economic and market conditions, regional or global instability, and currency and interest rate fluctuations. |
| n | | Mortgage- and asset-backed securities risk. The Fund may invest in mortgage- and asset-backed securities that are subject to prepayment or call risk, which is the risk that the borrower’s payments may be received earlier or later than expected due to changes in prepayment rates on underlying loans. Faster prepayments often happen when interest rates are falling. As a result, the Fund may reinvest these early payments at lower interest rates, thereby reducing the Fund’s income. Conversely, when interest rates rise, prepayments may happen more slowly, causing the security to lengthen in duration. Longer duration securities tend to be more volatile. Securities may be prepaid at a price less than the original purchase value. An unexpectedly high rate of defaults on the mortgages held by a mortgage pool may adversely affect the value of mortgage-backed securities and could result in losses to the Fund. The risk of such defaults is generally higher in the case of mortgage pools that include subprime mortgages. Subprime mortgages refer to loans made to borrowers with weakened credit histories or with lower capacity to make timely payments on their mortgages. |
| n | | Municipal securities risk. The Fund may invest in municipal securities. Constitutional amendments, legislative enactments, executive orders, administrative regulations, voter initiatives, and the issuer’s regional economic conditions may affect the municipal security’s value, interest payments, repayment of principal and the Fund’s ability to sell it. Failure of a municipal security issuer to comply with applicable tax requirements may make income paid thereon taxable, resulting in a decline in the security’s value. In addition, there could be changes in applicable |
7 Invesco Unconstrained Bond Fund
tax laws or tax treatments that reduce or eliminate the current federal income tax exemption on municipal securities or otherwise adversely affect the current federal or state tax status of municipal securities.
| n | | Non-diversification risk. The Fund is non-diversified and can invest a greater portion of its assets in a small number of issuers or a single issuer. A change in the value of the issuer could affect the value of the Fund more than if it was a diversified fund. |
| n | | Prepayment risk. An issuer’s ability to prepay principal on a loan or debt security prior to maturity can limit the Fund’s potential gains. Prepayments may require the Fund to replace the loan or debt security with a lower yielding security, adversely affecting the Fund’s yield. |
| n | | Reinvestment risk. Reinvestment risk is the risk that a bond’s cash flows (coupon income and principal repayment) will be reinvested at an interest rate below that on the original bond. |
| n | | Reverse repurchase agreement risk. Reverse repurchase agreements involve the risk that the market value of securities to be repurchased may decline below the repurchase price or that the other party may default on its obligation, resulting in delays, additional costs or the restriction of proceeds from the sale. |
| n | | Short sales risk. Short sales may cause the Fund to repurchase a security at a higher price, thereby causing a loss. A short position in a security poses more risk than holding the same security long. As there is no limit on how much the price of the security can increase, the Fund’s exposure is unlimited. In order to establish a short position in a security, the Fund must borrow the security from a broker. The Fund may not always be able to borrow a security the Fund seeks to sell short at a particular time or at an acceptable price. The Fund also may not always be able to close out the short position by replacing the borrowed securities at a particular time or at an acceptable price. The Fund will incur increased transaction costs associated with selling securities short. In addition, taking short positions in securities results in a form of leverage which may cause the Fund to be volatile. |
| n | | To Be Announced (TBA) transactions risk. TBA transactions involve the risk that the securities received may be less |
| | favorable than what was anticipated by the Fund when entering into the TBA transaction. TBA transactions also involve the risk that a counterparty will fail to deliver the securities, exposing the Fund to further losses. Whether or not the Fund takes delivery of the securities at the termination date of a TBA transaction, the Fund will nonetheless be exposed to changes in the value of the underlying investments during the term of the agreement. When the Fund enters into a short sale of a TBA mortgage it does not own, the Fund may have to purchase deliverable mortgages to settle the short sale at a higher price than anticipated, thereby causing a loss. A short position in a TBA mortgage poses more risk than holding the same TBA mortgage long. As there is no limit on how much the price of mortgage securities can increase, the Fund’s exposure is unlimited. The Fund may not always be able to purchase mortgage securities to close out the short position at a particular time or at an acceptable price. A Fund will earmark or segregate liquid assets in an amount at least equal to its exposure for the duration of the contract. The Fund will incur increased transaction costs associated with selling TBA mortgages short. In addition, taking short positions in TBA mortgages results in a form of leverage which could increase the volatility of the Fund’s share price. |
| n | | US government obligations risk. The Fund may invest in obligations issued by US government agencies and instrumentalities that may receive varying levels of support from the government, which could affect the Fund’s ability to recover should they default. |
| n | | When-issued and delayed delivery risk. When-issued and delayed delivery transactions are subject to market risk as the value or yield of a security at delivery may be more or less than the purchase price or the yield generally available on securities when delivery occurs. In addition, the Fund is subject to counterparty risk because it relies on the buyer or seller, as the case may be, to consummate the transaction, and failure by the other party to complete the transaction may result in the Fund missing the opportunity of obtaining a price or yield considered to be advantageous. |
| n | | Zero coupon or pay-in-kind securities risk. The value, interest rates, and liquidity of non-cash paying |
| | instruments, such as zero coupon and pay-in-kind securities, are subject to greater fluctuation than other types of securities. The higher yields and interest rates on pay-in-kind securities reflect the payment deferral and increased credit risk associated with such instruments and that such investments may represent a higher credit risk than coupon loans. Pay-in-kind securities may have a potential variability in valuations because their continuing accruals require continuing judgments about the collectability of the deferred payments and the value of any associated collateral. |
About indexes used in this report
| n | | The 3-Month USD Libor Index is the average interest rate at which a selection of banks in London are prepared to lend to one another in American dollars with a maturity of three months. |
| n | | The Lipper Alternative Credit Focus Funds Index invests in a wide range of credit-structured vehicles by using either fundamental credit research analysis or quantitative credit portfolio modelling trying to benefit from any changes in credit quality, credit spreads and market liquidity. |
| n | | The Fund is not managed to track the performance of any particular index, including the index(es) described here, and consequently, the performance of the Fund may deviate significantly from the performance of the index(es). |
| n | | A direct investment cannot be made in an index. Unless otherwise indicated, index results include reinvested dividends, and they do not reflect sales charges. Performance of the peer group, if applicable, reflects fund expenses; performance of a market index does not. |
Other information
| n | | The returns shown in management’s discussion of Fund performance are based on net asset values (NAVs) calculated for shareholder transactions. Generally accepted accounting principles require adjustments to be made to the net assets of the Fund at period end for financial reporting purposes, and as such, the NAVs for shareholder transactions and the returns based on those NAVs may differ from the NAVs and returns reported in the Financial Highlights. |
| n | | Industry classifications used in this report are generally according to the Global Industry Classification Standard, which was developed by and is the exclusive property and a service mark of MSCI Inc. and Standard & Poor’s. |
This report must be accompanied or preceded by a currently effective Fund prospectus, which contains more complete information, including sales charges and expenses. Investors should read it carefully before investing.
NOT FDIC INSURED | MAY LOSE VALUE | NO BANK GUARANTEE
8 Invesco Unconstrained Bond Fund
Schedule of Investments(a)
October 31, 2014
| | | | | | | | |
| | | Principal
Amount | | | Value | |
U.S. Treasury Bills–38.98% | |
0.02%, 11/06/14(b)(c) | | $ | 5,500,000 | | | $ | 5,500,000 | |
0.05%, 04/30/15(b) | | | 4,300,000 | | | | 4,299,097 | |
Total U.S. Treasury Bills
(Cost $9,798,996) | | | | 9,799,097 | |
|
Asset-Backed Securities–28.65% | |
APIDOS CLO XIX (Cayman Islands), Series 2014-19A, Class C, Floating Rate Pass Through Ctfs.,
3.52%, 10/17/26(d)(e) | | | 500,000 | | | | 496,345 | |
Bear Stearns Commercial Mortgage Securities Trust, Series 2005-PWR8, Class AJ, Pass Through Ctfs., 4.75%, 06/11/41 | | | 250,000 | | | | 254,684 | |
Citigroup Commercial Mortgage Trust, Series 2014-388G, Class C, Floating Rate Pass Through Ctfs.,
1.55%, 06/15/33(d)(e) | | | 300,000 | | | | 299,576 | |
Citigroup Mortgage Loan Trust Inc.,
Series 2005-11, Class A2A, Floating Rate Pass Through Ctfs., 2.51%, 10/25/35(e) | | | 206,544 | | | | 204,771 | |
Series 2005-3, Class 2A2A, Floating Rate Pass Through Ctfs., 2.56%, 08/25/35(e) | | | 198,175 | | | | 198,232 | |
Freddie Mac, Series 2014-DN4, Class M2, Floating Rate STACR® Debt Notes,
2.55%, 10/25/24(e)(f) | | | 600,000 | | | | 600,000 | |
GMACM Mortgage Loan Trust, Series 2005-AR6, Class 4A1, Floating Rate Pass Through Ctfs., 4.94%, 11/19/35(e) | | | 138,261 | | | | 133,791 | |
GSAA Home Equity Trust, Series 2005-11, Class 3A5, Floating Rate Pass Through Ctfs., 0.52%, 10/25/35(e) | | | 250,000 | | | | 226,935 | |
JP Morgan Chase Commercial Mortgage Securities Trust,
Series 2006-LDP6, Class AJ, Variable Rate Pass Through Ctfs., 5.57%, 04/15/43(e) | | | 300,000 | | | | 313,307 | |
Series 2014-C20, Class B, Variable Rate Pass Through Ctfs., 4.40%, 07/15/47(e) | | | 300,000 | | | | 315,322 | |
JP Morgan Mortgage Trust,
Series 2005-A3, Class 7CA1, Floating Rate Pass Through Ctfs., 2.52%, 06/25/35(e) | | | 355,960 | | | | 338,267 | |
Series 2007-A1, Class 6A1, Floating Rate Pass Through Ctfs., 2.53%, 07/25/35(e) | | | 184,333 | | | | 183,355 | |
Series 2007-A2, Class 4A2, Floating Rate Pass Through Ctfs., 5.02%, 04/25/37(e) | | | 267,077 | | | | 246,342 | |
LB-UBS Commercial Mortgage Trust, Series 2005-C3, Class AJ, Pass Through Ctfs., 4.84%, 07/15/40 | | | 250,000 | | | | 253,479 | |
Series 2005-C7, Class AJ, Variable Rate Pass Through Ctfs., 5.32%, 11/15/40(e) | | | 250,000 | | | | 258,102 | |
| | | | | | | | |
| | | Principal
Amount | | | Value | |
Merrill Lynch Mortgage Investors Trust, Series 2005-A9, Class 2A1C, Floating Rate Pass Through Ctfs.,
2.50%, 12/25/35(e) | | $ | 260,000 | | | $ | 252,321 | |
Morgan Stanley Capital I Trust, Series 2005-HQ6, Class AJ, Variable Rate Pass Through Ctfs., 5.07%, 08/13/42(e) | | | 250,000 | | | | 255,433 | |
Octagon Investment Partners XVI Ltd. (Cayman Islands), Series 2013-1A, Class B1, Floating Rate Pass Through Ctfs., 1.83%, 07/17/25(d)(e) | | | 250,000 | | | | 237,225 | |
Sudbury Mill CLO Ltd. (Cayman Islands), Series 2013-1A, Class B1, Floating Rate Pass Through Ctfs.,
2.43%, 01/17/26(d)(e) | | | 500,000 | | | | 492,700 | |
Symphony CLO XV Ltd. (Cayman Islands), Series 2014-15A, Class C, Floating Rate Pass Through Ctfs., 3.43%, 10/17/26(d)(e) | | | 500,000 | | | | 485,600 | |
WaMu Mortgage Trust,
Series 2006-AR14, Class 1A4, Floating Rate Pass Through Ctfs., 2.02%, 11/25/36(e) | | | 127,045 | | | | 112,474 | |
Series 2007-HY1, Class 3A1, Floating Rate Pass Through Ctfs., 4.53%, 02/25/37(e) | | | 308,675 | | | | 284,072 | |
Wells Fargo Mortgage Backed Securities Trust,
Series 2005-AR14, Class A1, Floating Rate Pass Through Ctfs., 5.35%, 08/25/35(e) | | | 201,072 | | | | 203,692 | |
Series 2005-AR16, Class 4A2, Floating Rate Pass Through Ctfs., 2.61%, 10/25/35(e) | | | 302,602 | | | | 298,014 | |
WFRBS Commercial Mortgage Trust, Series 2014-C24, Class B, Floating Rate Pass Through Ctfs., 4.20%, 11/15/47(e) | | | 250,000 | | | | 257,483 | |
Total Asset-Backed Securities
(Cost $7,180,778) | | | | 7,201,522 | |
| | |
| | | Shares | | | | |
Common Stocks–22.51% | |
| Fixed Income Funds–22.51% | |
Invesco Floating Rate Fund, Class R6 (Cost $5,637,318)(g) | | | 720,060 | | | | 5,659,672 | |
| | |
| | | Principal
Amount | | | | |
U.S. Dollar Denominated Bonds & Notes–6.23% | |
| Apparel Retail–0.30% | |
Men’s Wearhouse Inc. (The), Sr. Unsec. Gtd. Notes, 7.00%, 07/01/22(d) | | $ | 74,000 | | | | 76,775 | |
|
| Casinos & Gaming–0.61% | |
MGM Resorts International, Sr. Unsec. Gtd. Global Notes, 6.75%, 10/01/20 | | | 69,000 | | | | 76,073 | |
See accompanying Notes to Financial Statements which are an integral part of the financial statements.
9 Invesco Unconstrained Bond Fund
| | | | | | | | |
| | | Principal
Amount | | | Value | |
| Casinos & Gaming–(continued) | |
Pinnacle Entertainment Inc., Sr. Unsec. Gtd. Global Notes, 6.38%, 08/01/21 | | $ | 71,000 | | | $ | 76,147 | |
| | | | | | | | 152,220 | |
|
| Construction Materials–0.25% | |
Building Materials Corp. of America, Sr. Unsec. Notes, 5.38%, 11/15/24(d) | | | 63,000 | | | | 63,236 | |
| | |
| Consumer Finance–0.60% | | | | | | | | |
Ally Financial Inc., Sr. Unsec. Gtd. Global Notes, 7.50%, 09/15/20 | | | 63,000 | | | | 75,600 | |
Navient Corp., Sr. Unsec. Medium-Term Notes, 4.88%, 06/17/19 | | | 74,000 | | | | 75,264 | |
| | | | | | | | 150,864 | |
|
| Diversified Banks–0.98% | |
Bank of America Corp., Unsec. Sub. Medium-Term Notes, 4.25%, 10/22/26 | | | 125,000 | | | | 124,531 | |
JPMorgan Chase & Co., Unsec. Sub. Global Notes, 3.88%, 09/10/24 | | | 122,000 | | | | 121,252 | |
| | | | | | | | 245,783 | |
|
| Health Care Distributors–1.19% | |
McKesson Corp., Sr. Unsec. Global Notes, 2.28%, 03/15/19 | | | 300,000 | | | | 299,609 | |
| | |
| Homebuilding–0.60% | | | | | | | | |
K. Hovnanian Enterprises Inc., Sr. Sec. Gtd. Notes, 7.25%, 10/15/20(d) | | | 71,000 | | | | 75,615 | |
KB Home, Sr. Unsec. Gtd. Notes, 7.00%, 12/15/21 | | | 70,000 | | | | 75,075 | |
| | | | | | | | 150,690 | |
|
| Investment Banking & Brokerage–0.49% | |
Morgan Stanley, Series G, Unsec. Sub. Medium-Term Notes, 4.35%, 09/08/26 | | | 122,000 | | | | 122,215 | |
|
| Specialized Finance–0.31% | |
CIT Group Inc., Sr. Unsec. Global Notes, 5.00%, 08/15/22 | | | 73,000 | | | | 77,198 | |
|
| Tires & Rubber–0.30% | |
Goodyear Tire & Rubber Co. (The), Sr. Unsec. Gtd. Notes, 8.25%, 08/15/20 | | | 69,000 | | | | 74,865 | |
|
| Trading Companies & Distributors–0.30% | |
International Lease Finance Corp., Sr. Unsec. Notes, 8.25%, 12/15/20 | | | 63,000 | | | | 76,388 | |
| | | | | | | | |
| | | Principal
Amount | | | Value | |
| Wireless Telecommunication Services–0.30% | |
Sprint Communications Inc., Sr. Unsec. Gtd. Notes, 9.00%, 11/15/18(d) | | $ | 64,000 | | | $ | 75,440 | |
Total U.S. Dollar Denominated Bonds
& Notes
(Cost $1,565,336) | | | | 1,565,283 | |
|
Non-U.S. Dollar Denominated Bonds &
Notes–2.80%(h) | |
| Diversified Banks–1.95% | |
Standard Chartered Bank (United Kingdom), Sr. Unsec. Medium-Term Euro Notes, 7.28%, 06/05/19(d) | | INR | 31,200,000 | | | | 490,282 | |
|
| Sovereign Debt–0.85% | |
Mexican Bonos (Mexico), Series M, Unsec. Bonds, 8.00%, 12/07/23 | | MXN | 2,500,000 | | | | 213,407 | |
Total Non-U.S. Dollar Denominated Bonds & Notes
(Cost $699,847) | | | | 703,689 | |
|
Municipal Obligations–1.41% | |
Golden State Tobacco Securitization Corp.; Series 2007 A-1, Sr. Tobacco Settlement Asset-Backed RB, 5.13%, 06/01/47 | | | 100,000 | | | | 74,752 | |
New York Liberty Development Corp. (3 World Trade Center); Series 2014, Class 2, Ref. RB, 5.38%, 11/15/40(d) | | | 200,000 | | | | 205,446 | |
Tobacco Settlement Financing Corp.; Series 2007 1A, Asset-Backed RB, 5.00%, 06/01/41 | | | 100,000 | | | | 75,045 | |
Total Municipal Obligations
(Cost $347,324) | | | | 355,243 | |
| | |
| | | Shares | | | | |
Money Market Funds–26.66% | |
Liquid Assets Portfolio, Institutional Class(i) | | | 3,350,604 | | | | 3,350,604 | |
Premier Portfolio, Institutional Class(i) | | | 3,350,603 | | | | 3,350,603 | |
Total Money Market Funds
(Cost $6,701,207) | | | | 6,701,207 | |
| |
Options Purchased–0.02%
| | | | | |
(Cost $3,211)(j) | | | | | | | 4,196 | |
TOTAL INVESTMENTS–127.26%
(Cost $31,934,017) | | | | 31,989,909 | |
OTHER ASSETS LESS LIABILITIES–(27.26)% | | | | (6,851,226 | ) |
NET ASSETS–100.00% | | | $ | 25,138,683 | |
Investment Abbreviations:
| | |
| CLO | | – Collateralized Loan Obligation |
| Ctfs. | | – Certificates |
| Gtd. | | – Guaranteed |
| INR | | – Indian Rupee |
| MXN | | – Mexican Peso |
| RB | | – Revenue Bonds |
| | |
| Ref. | | – Refunding |
| Sec. | | – Secured |
| Sr. | | – Senior |
| STACR® | | – Structured Agency Credit Risk |
| Sub. | | – Subordinated |
| Unsec. | | – Unsecured |
See accompanying Notes to Financial Statements which are an integral part of the financial statements.
10 Invesco Unconstrained Bond Fund
Notes to Schedule of Investments:
| (a) | Industry and/or sector classifications used in this report are generally according to the Global Industry Classification Standard, which was developed by and is the exclusive property and a service mark of MSCI Inc. and Standard & Poor’s. |
| (b) | Security traded on a discount basis. The interest rate shown represents the discount rate at the time of purchase by the Fund. |
| (c) | All or a portion of the value was pledged and/or designated as collateral to cover margin requirements for open futures contracts and swap agreements. See Notes 1K, 1M and 4. |
| (d) | Security purchased or received in a transaction exempt from registration under the Securities Act of 1933, as amended (the “1933 Act”). The security may be resold pursuant to an exemption from registration under the 1933 Act, typically to qualified institutional buyers. The aggregate value of these securities at October 31, 2014 was $2,998,240, which represented 11.93% of the Fund’s Net Assets. |
| (e) | Interest or dividend rate is redetermined periodically. Rate shown is the rate in effect on October 31, 2014. |
| (f) | Principal payments are determined by the delinquency and principal payment experience on the STACR® reference pool. Freddie Mac transfers credit risk from the mortgages in the reference pool to credit investors who invest in the STACR® debt notes. |
| (g) | Invesco Floating Rate Fund and the Fund are affiliated by either having the same investment adviser or an investment adviser under common control with the Fund’s investment adviser. The value of this security at October 31, 2014 represented 22.51% of the Fund’s Net Assets. See Note 5. |
| (h) | Foreign denominated security. Principal amount is denominated in the currency indicated. |
| (i) | The money market fund and the Fund are affiliated by having the same investment adviser. |
| (j) | The table below details options purchased: |
| | | | | | | | | | | | | | | | | | | | | | | | | | | | | | | | |
| Open Over-The-Counter Foreign Currency Options Purchased — Currency Risk | |
| Description | | Type of
Contract | | | Counterparty | | | Expiration
Date | | | Strike
Price | | | Notional
Value | | | Value | |
EUR versus USD | | | Put | | | | Bank of America, N.A. | | | | 01/22/15 | | | | USD | | | | 1.235 | | | | EUR | | | | 400,000 | | | $ | 4,196 | |
| | |
| EUR | | – Euro |
| USD | | – U.S. Dollar |
See accompanying Notes to Financial Statements which are an integral part of the financial statements.
11 Invesco Unconstrained Bond Fund
Statement of Assets and Liabilities
October 31, 2014
| | | | |
Assets: | |
Investments, at value (Cost $19,595,492) | | $ | 19,629,030 | |
Investments in affiliates, at value (Cost $12,338,525) | | | 12,360,879 | |
Total investments, at value (Cost $31,934,017) | | | 31,989,909 | |
Receivable for: | | | | |
Variation margin — futures contracts | | | 5,753 | |
Dividends and interest | | | 70,125 | |
Fund expenses absorbed | | | 51,002 | |
Forward foreign currency contracts outstanding | | | 23,242 | |
Swap receivables — OTC | | | 10,060 | |
Unrealized appreciation on swap agreements — OTC | | | 7,607 | |
Other assets | | | 2,396 | |
Total assets | | | 32,160,094 | |
|
Liabilities: | |
Payable for: | | | | |
Investments purchased | | | 6,949,794 | |
Variation margin — centrally cleared swap agreements | | | 2,811 | |
Accrued fees to affiliates | | | 1,572 | |
Accrued other operating expenses | | | 56,206 | |
Premiums received on swap agreements — OTC | | | 10,128 | |
Unrealized depreciation on swap agreements — OTC | | | 900 | |
Total liabilities | | | 7,021,411 | |
Net assets applicable to shares outstanding | | $ | 25,138,683 | |
|
Net assets consist of: | |
Shares of beneficial interest | | $ | 25,026,984 | |
Undistributed net investment income | | | 15,011 | |
Net unrealized appreciation | | | 96,688 | |
| | | $ | 25,138,683 | |
| | | | |
Net Assets: | |
Class A | | $ | 12,532,392 | |
Class C | | $ | 10,048 | |
Class R | | $ | 10,050 | |
Class Y | | $ | 12,566,087 | |
Class R5 | | $ | 10,053 | |
Class R6 | | $ | 10,053 | |
|
Shares outstanding, $0.01 par value per share,
with an unlimited number of shares authorized: | |
Class A | | | 1,248,056 | |
Class C | | | 1,001 | |
Class R | | | 1,001 | |
Class Y | | | 1,251,257 | |
Class R5 | | | 1,001 | |
Class R6 | | | 1,001 | |
Class A: | | | | |
Net asset value per share | | $ | 10.04 | |
Maximum offering price per share | | | | |
(Net asset value of $10.04 ¸ 95.75%) | | $ | 10.49 | |
Class C: | | | | |
Net asset value and offering price per share | | $ | 10.04 | |
Class R: | | | | |
Net asset value and offering price per share | | $ | 10.04 | |
Class Y: | | | | |
Net asset value and offering price per share | | $ | 10.04 | |
Class R5: | | | | |
Net asset value and offering price per share | | $ | 10.04 | |
Class R6: | | | | |
Net asset value and offering price per share | | $ | 10.04 | |
See accompanying Notes to Financial Statements which are an integral part of the financial statements.
12 Invesco Unconstrained Bond Fund
Statement of Operations
For the period October 14, 2014 (commencement date) through October 31, 2014
| | | | |
Investment income: | |
Dividends from affiliates | | $ | 12,353 | |
Interest | | | 6,963 | |
Total investment income | | | 19,316 | |
| |
Expenses: | | | | |
Advisory fees | | | 8,642 | |
Administrative services fees | | | 2,466 | |
Custodian fees | | | 1,183 | |
Distribution fees: | | | | |
Class A | | | 1,540 | |
Class C | | | 5 | |
Class R | | | 2 | |
Transfer agent fees — A, C, R and Y | | | 25 | |
Registration and filing fees | | | 7,892 | |
Professional services fees | | | 46,031 | |
Other | | | 3,454 | |
Total expenses | | | 71,240 | |
Less: Fees waived and expenses reimbursed | | | (61,998 | ) |
Net expenses | | | 9,242 | |
Net investment income | | | 10,074 | |
| |
Realized and unrealized gain (loss) from: | | | | |
Net realized gain (loss) from: | | | | |
Foreign currencies | | | (518 | ) |
Swap agreements | | | (771 | ) |
| | | | (1,289 | ) |
Change in net unrealized appreciation of: | | | | |
Investment securities | | | 55,892 | |
Foreign currencies | | | 141 | |
Forward foreign currency contracts | | | 23,242 | |
Futures contracts | | | 15,139 | |
Swap agreements | | | 2,274 | |
| | | | 96,688 | |
Net realized and unrealized gain | | | 95,399 | |
Net increase in net assets resulting from operations | | $ | 105,473 | |
See accompanying Notes to Financial Statements which are an integral part of the financial statements.
13 Invesco Unconstrained Bond Fund
Statement of Changes in Net Assets
For the period October 14, 2014 (commencement date) through October 31, 2014
| | | | |
| | | October 14, 2014
(commencement date)
through
October 31,
2014 | |
Operations: | |
Net investment income | | $ | 10,074 | |
Net realized gain (loss) | | | (1,289 | ) |
Change in net unrealized appreciation | | | 96,688 | |
Net increase in net assets resulting from operations | | | 105,473 | |
| |
Share transactions–net: | | | | |
Class A | | | 12,480,560 | |
Class C | | | 10,010 | |
Class R | | | 10,010 | |
Class Y | | | 12,512,610 | |
Class R5 | | | 10,010 | |
Class R6 | | | 10,010 | |
Net increase in net assets resulting from share transactions | | | 25,033,210 | |
Net increase in net assets | | | 25,138,683 | |
| |
Net assets: | | | | |
Beginning of year | | | — | |
End of year (includes undistributed net investment income of $15,011) | | $ | 25,138,683 | |
Notes to Financial Statements
October 31, 2014
NOTE 1—Significant Accounting Policies
Invesco Unconstrained Bond Fund (the “Fund”) is a series portfolio of AIM Investment Funds (Invesco Investment Funds) (the “Trust”). The Trust is organized as a Delaware statutory trust and is registered under the Investment Company Act of 1940, as amended (the “1940 Act”), as an open-end series management investment company consisting of twenty-four separate series portfolios, each authorized to issue an unlimited number of shares of beneficial interest. The assets, liabilities and operations of each portfolio are accounted for separately. Information presented in these financial statements pertains only to the Fund. Matters affecting each portfolio or class will be voted on exclusively by the shareholders of such portfolio or class. The Fund commenced operations on October 14, 2014.
The Fund’s investment objective is to provide a positive absolute return over a full market cycle.
The Fund currently consists of six different classes of shares: Class A, Class C, Class R, Class Y, Class R5 and Class R6. Class A shares are sold with a front-end sales charge unless certain waiver criteria are met and under certain circumstances load waived shares may be subject to contingent deferred sales charges (“CDSC”). Class C shares are sold with a CDSC. Class R, Class Y, Class R5 and Class R6 shares are sold at net asset value.
The following is a summary of the significant accounting policies followed by the Fund in the preparation of its financial statements.
| A. | Security Valuations — Securities, including restricted securities, are valued according to the following policy. |
Debt obligations (including convertible securities) and unlisted equities are fair valued using an evaluated quote provided by an independent pricing service. Evaluated quotes provided by the pricing service may be determined without exclusive reliance on quoted prices, and may reflect appropriate factors such as institution-size trading in similar groups of securities, developments related to specific securities, dividend rate (for unlisted equities), yield (for debt obligations), quality, type of issue, coupon rate (for debt obligations), maturity (for debt obligations), individual trading characteristics and other market data. Debt obligations are subject to interest rate and credit risks. In addition, all debt obligations involve some risk of default with respect to interest and/or principal payments.
A security listed or traded on an exchange (except convertible securities) is valued at its last sales price or official closing price as of the close of the customary trading session on the exchange where the security is principally traded, or lacking any sales or official closing price on a particular day, the security may be valued at the closing bid price on that day. Securities traded in the over-the-counter market are valued based on prices furnished by independent pricing services or market makers. When such securities are valued by an independent pricing service they may be considered fair valued. Futures contracts are valued at the final settlement price set by an exchange on which they are principally traded. Listed options are valued at the mean between the last bid and ask prices from the exchange on which they are principally traded. Options not listed on an exchange are valued by an independent source at the mean between the last bid and ask prices. For purposes of determining net asset value per share, futures and option contracts generally are valued 15 minutes after the close of the customary trading session of the New York Stock Exchange (“NYSE”).
Investments in open-end and closed-end registered investment companies that do not trade on an exchange are valued at the end of day net asset value per share. Investments in open-end and closed-end registered investment companies that trade on an exchange are valued at the last sales price or official closing price as of the close of the customary trading session on the exchange where the security is principally traded.
14 Invesco Unconstrained Bond Fund
Swap agreements are fair valued using an evaluated quote provided by an independent pricing service. Evaluated quotes provided by the pricing service are valued based on a model which may include end of day net present values, spreads, ratings, industry, and company performance.
Foreign securities’ (including foreign exchange contracts) prices are converted into U.S. dollar amounts using the applicable exchange rates as of the close of the NYSE. If market quotations are available and reliable for foreign exchange-traded equity securities, the securities will be valued at the market quotations. Because trading hours for certain foreign securities end before the close of the NYSE, closing market quotations may become unreliable. If between the time trading ends on a particular security and the close of the customary trading session on the NYSE, events occur that the Adviser determines are significant and make the closing price unreliable, the Fund may fair value the security. If the event is likely to have affected the closing price of the security, the security will be valued at fair value in good faith using procedures approved by the Board of Trustees. Adjustments to closing prices to reflect fair value may also be based on a screening process of an independent pricing service to indicate the degree of certainty, based on historical data, that the closing price in the principal market where a foreign security trades is not the current value as of the close of the NYSE. Foreign securities’ prices meeting the approved degree of certainty that the price is not reflective of current value will be priced at the indication of fair value from the independent pricing service. Multiple factors may be considered by the independent pricing service in determining adjustments to reflect fair value and may include information relating to sector indices, American Depositary Receipts and domestic and foreign index futures. Foreign securities may have additional risks including exchange rate changes, potential for sharply devalued currencies and high inflation, political and economic upheaval, the relative lack of issuer information, relatively low market liquidity and the potential lack of strict financial and accounting controls and standards.
Securities for which market prices are not provided by any of the above methods may be valued based upon quotes furnished by independent sources. The last bid price may be used to value equity securities. The mean between the last bid and ask prices is used to value debt obligations, including corporate loans.
Securities for which market quotations are not readily available or became unreliable are valued at fair value as determined in good faith by or under the supervision of the Trust’s officers following procedures approved by the Board of Trustees. Issuer specific events, market trends, bid/ask quotes of brokers and information providers and other market data may be reviewed in the course of making a good faith determination of a security’s fair value.
The Fund may invest in securities that are subject to interest rate risk, meaning the risk that the prices will generally fall as interest rates rise and, conversely, the prices will generally rise as interest rates fall. Specific securities differ in their sensitivity to changes in interest rates depending on their individual characteristics. Changes in interest rates may result in increased market volatility, which may affect the value and/or liquidity of certain of the Fund’s investments.
Valuations change in response to many factors including the historical and prospective earnings of the issuer, the value of the issuer’s assets, general economic conditions, interest rates, investor perceptions and market liquidity. Because of the inherent uncertainties of valuation, the values reflected in the financial statements may materially differ from the value received upon actual sale of those investments.
| B. | Securities Transactions and Investment Income — Securities transactions are accounted for on a trade date basis. Realized gains or losses on sales are computed on the basis of specific identification of the securities sold. Interest income (net of withholding tax, if any) is recorded on the accrual basis from settlement date. Paydown gains and losses on mortgage and asset-backed securities are recorded as adjustments to interest income. Dividend income (net of withholding tax, if any) is recorded on the ex-dividend date. Bond premiums and discounts are amortized and/or accreted for financial reporting purposes. |
The Fund may periodically participate in litigation related to Fund investments. As such, the Fund may receive proceeds from litigation settlements. Any proceeds received are included in the Statement of Operations as realized gain (loss) for investments no longer held and as unrealized gain (loss) for investments still held.
Brokerage commissions and mark ups are considered transaction costs and are recorded as an increase to the cost basis of securities purchased and/or a reduction of proceeds on a sale of securities. Such transaction costs are included in the determination of net realized and unrealized gain (loss) from investment securities reported in the Statement of Operations and the Statement of Changes in Net Assets and the net realized and unrealized gains (losses) on securities per share in the Financial Highlights. Transaction costs are included in the calculation of the Fund’s net asset value and, accordingly, they reduce the Fund’s total returns. These transaction costs are not considered operating expenses and are not reflected in net investment income reported in the Statement of Operations and Statement of Changes in Net Assets, or the net investment income per share and ratios of expenses and net investment income reported in the Financial Highlights, nor are they limited by any expense limitation arrangements between the Fund and the investment adviser.
The Fund allocates realized and unrealized capital gains and losses to a class based on the relative net assets of each class. The Fund allocates income to a class based on the relative value of the settled shares of each class.
| C. | Country Determination — For the purposes of making investment selection decisions and presentation in the Schedule of Investments, the investment adviser may determine the country in which an issuer is located and/or credit risk exposure based on various factors. These factors include the laws of the country under which the issuer is organized, where the issuer maintains a principal office, the country in which the issuer derives 50% or more of its total revenues and the country that has the primary market for the issuer’s securities, as well as other criteria. Among the other criteria that may be evaluated for making this determination are the country in which the issuer maintains 50% or more of its assets, the type of security, financial guarantees and enhancements, the nature of the collateral and the sponsor organization. Country of issuer and/or credit risk exposure has been determined to be the United States of America, unless otherwise noted. |
| D. | Distributions — Distributions from net investment income, if any, are declared and paid monthly. Distributions from net realized capital gain, if any, are generally declared and paid annually and recorded on the ex-dividend date. The Fund may elect to treat a portion of the proceeds from redemptions as distributions for federal income tax purposes. |
| E. | Federal Income Taxes — The Fund intends to comply with the requirements of Subchapter M of the Internal Revenue Code of 1986, as amended (the “Internal Revenue Code”), necessary to qualify as a regulated investment company and to distribute substantially all of the Fund’s taxable earnings to shareholders. As such, the Fund will not be subject to federal income taxes on otherwise taxable income (including net realized capital gain) that is distributed to shareholders. Therefore, no provision for federal income taxes is recorded in the financial statements. |
15 Invesco Unconstrained Bond Fund
The Fund recognizes the tax benefits of uncertain tax positions only when the position is more likely than not to be sustained. Management has analyzed the Fund’s uncertain tax positions and concluded that no liability for unrecognized tax benefits should be recorded related to uncertain tax positions. Management is not aware of any tax positions for which it is reasonably possible that the total amounts of unrecognized tax benefits will change materially in the next 12 months.
The Fund files tax returns in the U.S. Federal jurisdiction and certain other jurisdictions. Generally, the Fund is subject to examinations by such taxing authorities for up to three years after the filing of the return for the tax period.
| F. | Expenses — Fees provided for under the Rule 12b-1 plan of a particular class of the Fund are charged to the operations of such class. Transfer agency fees and expenses and other shareholder recordkeeping fees and expenses attributable to Class R5 and Class R6 are allocated to each share class based on relative net assets. Sub-accounting fees attributable to Class R5 are charged to the operations of the class. Transfer agency fees and expenses and other shareholder recordkeeping fees and expenses relating to all other classes are allocated among those classes based on relative net assets. All other expenses are allocated among the classes based on relative net assets. |
| G. | Accounting Estimates — The preparation of financial statements in conformity with accounting principles generally accepted in the United States of America (“GAAP”) requires management to make estimates and assumptions that affect the reported amounts of assets and liabilities at the date of the financial statements and the reported amounts of revenues and expenses during the reporting period including estimates and assumptions related to taxation. Actual results could differ from those estimates by a significant amount. In addition, the Fund monitors for material events or transactions that may occur or become known after the period-end date and before the date the financial statements are released to print. |
| H. | Indemnifications — Under the Trust’s organizational documents, each Trustee, officer, employee or other agent of the Trust is indemnified against certain liabilities that may arise out of the performance of their duties to the Fund. Additionally, in the normal course of business, the Fund enters into contracts, including the Fund’s servicing agreements, that contain a variety of indemnification clauses. The Fund’s maximum exposure under these arrangements is unknown as this would involve future claims that may be made against the Fund that have not yet occurred. The risk of material loss as a result of such indemnification claims is considered remote. |
| I. | Foreign Currency Translations — Foreign currency is valued at the close of the NYSE based on quotations posted by banks and major currency dealers. Portfolio securities and other assets and liabilities denominated in foreign currencies are translated into U.S. dollar amounts at date of valuation. Purchases and sales of portfolio securities (net of foreign taxes withheld on disposition) and income items denominated in foreign currencies are translated into U.S. dollar amounts on the respective dates of such transactions. The Fund does not separately account for the portion of the results of operations resulting from changes in foreign exchange rates on investments and the fluctuations arising from changes in market prices of securities held. The combined results of changes in foreign exchange rates and the fluctuation of market prices on investments (net of estimated foreign tax withholding) are included with the net realized and unrealized gain or loss from investments in the Statement of Operations. Reported net realized foreign currency gains or losses arise from (1) sales of foreign currencies, (2) currency gains or losses realized between the trade and settlement dates on securities transactions, and (3) the difference between the amounts of dividends, interest, and foreign withholding taxes recorded on the Fund’s books and the U.S. dollar equivalent of the amounts actually received or paid. Net unrealized foreign currency gains and losses arise from changes in the fair values of assets and liabilities, other than investments in securities at fiscal period end, resulting from changes in exchange rates. |
The Fund may invest in foreign securities, which may be subject to foreign taxes on income, gains on investments or currency repatriation, a portion of which may be recoverable. Foreign taxes, if any, are recorded based on the tax regulations and rates that exist in the foreign markets in which the Fund invests and are shown in the Statement of Operations.
| J. | Forward Foreign Currency Contracts — The Fund may engage in foreign currency transactions either on a spot (i.e. for prompt delivery and settlement) basis or through forward foreign currency contracts to manage or minimize currency or exchange rate risk. |
The Fund may also enter into forward foreign currency contracts for the purchase or sale of a security denominated in a foreign currency in order to “lock in” the U.S. dollar price of that security, or the Fund may also enter into forward foreign currency contracts that do not provide for physical settlement of the two currencies, but instead are settled by a single cash payment calculated as the difference between the agreed upon exchange rate and the spot rate at settlement based upon an agreed upon notional amount (non-deliverable forwards). The Fund will set aside liquid assets in an amount equal to daily mark-to-market obligation for forward foreign currency contracts.
A forward foreign currency contract is an obligation between two parties (“Counterparties”) to purchase or sell a specific currency for an agreed-upon price at a future date. The use of forward foreign currency contracts does not eliminate fluctuations in the price of the underlying securities the Fund owns or intends to acquire but establishes a rate of exchange in advance. Fluctuations in the value of these contracts are measured by the difference in the contract date and reporting date exchange rates and are recorded as unrealized appreciation (depreciation) until the contracts are closed. When the contracts are closed, realized gains (losses) are recorded. Realized and unrealized gains (losses) on the contracts are included in the Statement of Operations. The primary risks associated with forward foreign currency contracts include failure of the Counterparty to meet the terms of the contract and the value of the foreign currency changing unfavorably. These risks may be in excess of the amounts reflected in the Statement of Assets and Liabilities.
| K. | Futures Contracts — The Fund may enter into futures contracts to manage exposure to interest rate, equity and market price movements and/or currency risks. A futures contract is an agreement between Counterparties to purchase or sell a specified underlying security, currency or commodity (or delivery of a cash settlement price, in the case of an index future) for a fixed price at a future date. The Fund currently invests only in exchange-traded futures and they are standardized as to maturity date and underlying financial instrument. Initial margin deposits required upon entering into futures contracts are satisfied by the segregation of specific securities or cash as collateral at the futures commission merchant (broker). During the period the futures contracts are open, changes in the value of the contracts are recognized as unrealized gains or losses by recalculating the value of the contracts on a daily basis. Subsequent or variation margin payments are received or made depending upon whether unrealized gains or losses are incurred. These amounts are reflected as receivables or payables on the Statement of Assets and Liabilities. When the contracts are closed or expire, the Fund recognizes a realized gain or loss equal to the difference between the proceeds from, or cost of, the closing transaction and the Fund’s basis in the contract. The net realized gain (loss) and the change in unrealized gain (loss) on futures contracts held during the period is included on the Statement of Operations. The primary risks associated with futures contracts are market risk and the absence of a liquid secondary market. If the Fund were unable to liquidate a futures contract and/or enter into an offsetting |
16 Invesco Unconstrained Bond Fund
| | closing transaction, the Fund would continue to be subject to market risk with respect to the value of the contracts and continue to be required to maintain the margin deposits on the futures contracts. Futures contracts have minimal counterparty risk since the exchange’s clearinghouse, as counterparty to all exchange-traded futures, guarantees the futures against default. Risks may exceed amounts recognized in the Statement of Assets and Liabilities. |
| L. | Put Options Purchased and Written — The Fund may purchase and write put options including options on securities indexes and/or futures contracts. By purchasing a put option, the Fund obtains the right (but not the obligation) to sell the option’s underlying instrument at a fixed strike price. In return for this right, the Fund pays an option premium. The option’s underlying instrument may be a security, securities index, or a futures contract. Put options may be used by the Fund to hedge securities it owns by locking in a minimum price at which the Fund can sell. If security prices fall, the put option could be exercised to offset all or a portion of the Fund’s resulting losses. At the same time, because the maximum the Fund has at risk is the cost of the option, purchasing put options does not eliminate the potential for the Fund to profit from an increase in the value of the underlying portfolio securities. The Fund may write put options to earn additional income in the form of option premiums if it expects the price of the underlying instrument to remain stable or rise during the option period for American style or on expiration date for European style so that the option will not be exercised. The risk in this strategy is that the price of the underlying securities may decline by an amount greater than the premium received. Put options written are reported as a liability in the Statement of Assets and Liabilities. Realized and unrealized gains and losses on these contracts are included in the Statement of Operations. A risk in buying an option is that the Fund pays a premium whether or not the option is exercised. In addition, there can be no assurance that a liquid secondary market will exist for any option purchased. |
| M. | Swap Agreements — The Fund may enter into various swap transactions, including interest rate, total return, index, currency and credit default swap contracts (“CDS”) for investment purposes or to manage interest rate, currency or credit risk. Such transactions are agreements between Counterparties. A swap agreement may be negotiated bilaterally and traded over-the-counter (OTC) between two parties (‘uncleared/OTC”) or, in some instances, must be transacted through a future commission merchant (FCM) and cleared through a clearinghouse that serves as a central Counterparty (“centrally cleared swap”). These agreements may contain among other conditions, events of default and termination events, and various covenants and representations such as provisions that require the Fund to maintain a pre-determined level of net assets, and/or provide limits regarding the decline of the Fund’s NAV over specific periods of time. If the Fund were to trigger such provisions and have open derivative positions at that time, the Counterparty may be able to terminate such agreement and request immediate payment in an amount equal to the net liability positions, if any. |
Interest rate, total return, index, and currency swap agreements are two-party contracts entered into primarily to exchange the returns (or differentials in rates of returns) earned or realized on particular predetermined investments or instruments. The gross returns to be exchanged or “swapped” between the parties are calculated with respect to a notional amount, i.e., the return on or increase in value of a particular dollar amount invested at a particular interest rate or return of an underlying asset, in a particular foreign currency, or in a “basket” of securities representing a particular index.
In a centrally cleared swap, the Fund’s ultimate Counterparty is a central clearinghouse. The Fund initially will enter into centrally cleared swaps through an executing broker. When a Fund enters into a centrally cleared swap, it must deliver to the central Counterparty (via the FCM) an amount referred to as “initial margin.” Initial margin requirements are determined by the central Counterparty, but an FCM may require additional initial margin above the amount required by the central Counterparty. Initial margin deposits required upon entering into centrally cleared swaps are satisfied by cash or securities as collateral at the FCM. Securities deposited as initial margin are designated on the Schedule of Investments and cash deposited is recorded on the Statement of Assets and Liabilities. During the term of a cleared swap agreement, a “variation margin” amount may be required to be paid by the Fund or may be received by the Fund, based on the daily change in price of the underlying reference instrument subject to the swap agreement and is recorded as a receivable or payable for variation margin in the Statement of Assets and Liabilities until the centrally cleared swap is terminated at which time a realized gain or loss is recorded.
A CDS is an agreement between Counterparties to exchange the credit risk of an issuer. A buyer of a CDS is said to buy protection by paying a fixed payment over the life of the agreement and in some situations an upfront payment to the seller of the CDS. If a defined credit event occurs (such as payment default or bankruptcy), the Fund as a protection buyer would cease paying its fixed payment, the Fund would deliver eligible bonds issued by the reference entity to the seller, and the seller would pay the full notional value, or the “par value”, of the referenced obligation to the Fund. A seller of a CDS is said to sell protection and thus would receive a fixed payment over the life of the agreement and an upfront payment, if applicable. If a credit event occurs, the Fund as a protection seller would cease to receive the fixed payment stream, the Fund would pay the buyer “par value” or the full notional value of the referenced obligation, and the Fund would receive the eligible bonds issued by the reference entity. In turn, these bonds may be sold in order to realize a recovery value. Alternatively, the seller of the CDS and its Counterparty may agree to net the notional amount and the market value of the bonds and make a cash payment equal to the difference to the buyer of protection. If no credit event occurs, the Fund receives the fixed payment over the life of the agreement. As the seller, the Fund would effectively add leverage to its portfolio because, in addition to its total net assets, the Fund would be subject to investment exposure on the notional amount of the CDS. In connection with these agreements, cash and securities may be identified as collateral in accordance with the terms of the respective swap agreements to provide assets of value and recourse in the event of default under the swap agreement or bankruptcy/insolvency of a party to the swap agreement. If a Counterparty becomes bankrupt or otherwise fails to perform its obligations due to financial difficulties, the Fund may experience significant delays in obtaining any recovery in a bankruptcy or other reorganization proceeding. The Fund may obtain only limited recovery or may obtain no recovery in such circumstances. The Fund’s maximum risk of loss from Counterparty risk, either as the protection seller or as the protection buyer, is the value of the contract. The risk may be mitigated by having a master netting arrangement between the Fund and the Counterparty and by the designation of collateral by the Counterparty to cover the Fund’s exposure to the Counterparty.
Implied credit spreads represent the current level at which protection could be bought or sold given the terms of the existing CDS contract and serve as an indicator of the current status of the payment/performance risk of the CDS. An implied spread that has widened or increased since entry into the initial contract may indicate a deteriorating credit profile and increased risk of default for the reference entity. A declining or narrowing spread may indicate an improving credit profile or decreased risk of default for the reference entity. Alternatively, credit spreads may increase or decrease reflecting the general tolerance for risk in the credit markets.
17 Invesco Unconstrained Bond Fund
An interest rate swap is an agreement between Counterparties pursuant to which the parties exchange a floating rate payment for a fixed rate payment based on a specified notional amount.
A total return swap is an agreement in which one party makes payments based on a set rate, either fixed or variable, while the other party makes payments based on the return of an underlying asset, which includes both the income generated and capital gains, if any. The unrealized appreciation (depreciation) on total return swaps includes dividends on the underlying securities and financing rate payable from the Counterparty. At the maturity date, a net cash flow is exchanged where the total return is equivalent to the return of the underlying reference less a financing rate, if any. As a receiver, the Fund would receive payments based on any positive total return and would owe payments in the event of a negative total return. As the payer, the Fund would owe payments on any net positive total return, and would receive payment in the event of a negative total return.
Changes in the value of centrally cleared and OTC swap agreements are recognized as unrealized gains (losses) in the Statement of Operations by “marking to market” on a daily basis to reflect the value of the swap agreement at the end of each trading day. Payments received or paid at the beginning of the agreement are reflected as such on the Statement of Assets and Liabilities and may be referred to as upfront payments. The Fund accrues for the fixed payment stream and amortizes upfront payments, if any, on swap agreements on a daily basis with the net amount, recorded as a component of realized gain (loss) on the Statement of Operations. A liquidation payment received or made at the termination of a swap agreement is recorded as realized gain (loss) on the Statement of Operations. The Fund segregates liquid securities having a value at least equal to the amount of the potential obligation of a Fund under any swap transaction. Entering into these agreements involves, to varying degrees, lack of liquidity and elements of credit, market, and Counterparty risk in excess of amounts recognized on the Statement of Assets and Liabilities. Such risks involve the possibility that a swap is difficult to sell or liquidate; the Counterparty does not honor its obligations under the agreement and unfavorable interest rates and market fluctuations. It is possible that developments in the swaps market, including potential government regulation, could adversely affect the Fund’s ability to terminate existing swap agreements or to realize amounts to be received under such agreements.
Notional amounts of each individual credit default swap agreement outstanding as of October 31, 2014 for which the Fund is the seller of protection are disclosed in the Notes to Schedule of Investments. These potential amounts would be partially offset by any recovery values of the respective referenced obligations, upfront payments received upon entering into the agreement, or net amounts received from the settlement of buy protection credit default swap agreements entered into by the Fund for the same referenced entity or entities.
| N. | Leverage Risk — Leverage exists when a Fund can lose more than it originally invests because it purchases or sells an instrument or enters into a transaction without investing an amount equal to the full economic exposure of the instrument or transaction. |
| O. | Other Risks — The Fund is non-diversified and may invest in securities of fewer issuers than if it were diversified. Thus, the value of the Fund’s shares may vary more widely and the Fund may be subject to greater market and credit risk than if the Fund invested more broadly. |
The Fund may invest in lower-quality debt securities, i.e., “junk bonds”. Investments in lower-rated securities or unrated securities of comparable quality tend to be more sensitive to economic conditions than higher rated securities. Junk bonds involve a greater risk of default by the issuer because such securities are generally unsecured and are often subordinated to other creditors’ claim.
| P. | Collateral — To the extent the Fund has designated or segregated a security as collateral and that security is subsequently sold, it is the Fund’s practice to replace such collateral no later than the next business day. |
NOTE 2—Advisory Fees and Other Fees Paid to Affiliates
The Trust has entered into a master investment advisory agreement with Invesco Advisers, Inc. (the “Adviser” or “Invesco”). Under the terms of the investment advisory agreement, the Fund pays an advisory fee to the Adviser based on the annual rate of the Fund’s average daily net assets as follows:
| | | | |
| Average Daily Net Assets | | Rate | |
First $1 billion | | | 0.70% | |
Next $3.5 billion | | | 0.65% | |
Over $4.5 billion | | | 0.55% | |
For the period October 14, 2014 (commencement date) through October 31, 2014, the effective advisory fees incurred by the Fund was 0.70%.
Under the terms of a master sub-advisory agreement between the Adviser and each of Invesco Asset Management Deutschland GmbH, Invesco Asset Management Limited, Invesco Asset Management (Japan) Limited, Invesco Australia Limited, Invesco Hong Kong Limited, Invesco Senior Secured Management, Inc., Invesco Canada Ltd. and Invesco Powershares Capital Management LLC (collectively, the “Affiliated Sub-Advisers”) the Adviser, not the Fund, may pay 40% of the fees paid to the Adviser to any such Affiliated Sub-Adviser(s) that provide(s) discretionary investment management services to the Fund based on the percentage of assets allocated to such Sub-Adviser(s).
Effective October 14, 2014 (commencement date), the Adviser has contractually agreed, through February 29, 2016, to waive advisory fees and/or reimburse expenses of all shares to the extent necessary to limit total annual fund operating expenses after fee waiver and/or expense reimbursement (excluding certain items discussed below) of Class A, Class C, Class R, Class Y, Class R5 and Class R6 shares to 1.03%, 1.78%, 1.28%, 0.78%, 0.78% and 0.78%, respectively, of average daily net assets. In determining the Adviser’s obligation to waive advisory fees and/or reimburse expenses, the following expenses are not taken into account, and could cause the total annual fund operating expenses after fee waiver and/or expense reimbursement to exceed the numbers reflected above: (1) interest; (2) taxes; (3) dividend expense on short sales; (4) extraordinary or non-routine items, including litigation expenses; and (5) expenses that the Fund has incurred but did not actually pay because of an expense offset arrangement. Acquired Fund Fees and Expenses are not operating expenses of the Fund directly, but are fees and expenses, including management fees of the investment companies in which the Fund invests. As a result, the total annual fund operating expenses after expense reimbursement may exceed the expense limits above. The fee waiver agreement cannot be terminated during its term.
Further, the Adviser has contractually agreed, through at least June 30, 2016, to waive the advisory fee payable by the Fund in an amount equal to 100% of the net advisory fees the Adviser receives on the Fund’s investments in certain affiliated funds.
For the period October 14, 2014 (commencement date) through October 31, 2014, the Adviser waived advisory fees and reimbursed fund level expenses of $61,973 and reimbursed class level expenses of $12 and $13 for Class A and Class Y shares, respectively.
18 Invesco Unconstrained Bond Fund
The Trust has entered into a master administrative services agreement with Invesco pursuant to which the Fund has agreed to pay Invesco for certain administrative costs incurred in providing accounting services to the Fund. For the period October 14, 2014 (commencement date) through October 31, 2014, expenses incurred under the agreement are shown in the Statement of Operations as Administrative services fees.
The Trust has entered into a transfer agency and service agreement with Invesco Investment Services, Inc. (“IIS”) pursuant to which the Fund has agreed to pay IIS a fee for providing transfer agency and shareholder services to the Fund and reimburse IIS for certain expenses incurred by IIS in the course of providing such services. IIS may make payments to intermediaries that provide omnibus account services, sub-accounting services and/or networking services. All fees payable by IIS to intermediaries that provide omnibus account services or sub-accounting are charged back to the Fund, subject to certain limitations approved by the Trust’s Board of Trustees. For the period October 14, 2014 (commencement date) through October 31, 2014, expenses incurred under the agreement are shown in the Statement of Operations as Transfer agent fees.
The Trust has entered into master distribution agreements with Invesco Distributors, Inc. (“IDI”) to serve as the distributor for the Class A, Class C, Class R, Class Y, Class R5 and Class R6 shares of the Fund. The Trust has adopted plans pursuant to Rule 12b-1 under the 1940 Act with respect to the Fund’s Class A, Class C and Class R shares (collectively the “Plans”). The Fund, pursuant to the Plans, pays IDI compensation at the annual rate of 0.25% of the Fund’s average daily net assets of Class A shares, 1.00% of the average daily net assets of Class C shares and 0.50% of the average daily net assets of Class R shares. Of the Plan payments, up to 0.25% of the average daily net assets of each class of shares may be paid to furnish continuing personal shareholder services to customers who purchase and own shares of such classes. Any amounts not paid as a service fee under the Plans would constitute an asset-based sales charge. Rules of the Financial Industry Regulatory Authority (“FINRA”) impose a cap on the total sales charges, including asset-based sales charges, that may be paid by any class of shares of the Fund. For the period October 14, 2014 (commencement date) through October 31, 2014, expenses incurred under the Plans are shown in the Statement of Operations as Distribution fees.
Front-end sales commissions and CDSC (collectively, the “sales charges”) are not recorded as expenses of the Fund. Front-end sales commissions are deducted from proceeds from the sales of Fund shares prior to investment in Class A shares of the Fund. CDSC are deducted from redemption proceeds prior to remittance to the shareholder. During the period October 14, 2014 (commencement date) through October 31, 2014, IDI advised the Fund that IDI did not retain any front-end sales commissions from the sale of Class A shares or any CDSC imposed upon redemptions by shareholders.
Certain officers and trustees of the Trust are officers and directors of the Adviser, IIS and/or IDI.
NOTE 3—Additional Valuation Information
GAAP defines fair value as the price that would be received to sell an asset or paid to transfer a liability in an orderly transaction between market participants at the measurement date, under current market conditions. GAAP establishes a hierarchy that prioritizes the inputs to valuation methods, giving the highest priority to readily available unadjusted quoted prices in an active market for identical assets (Level 1) and the lowest priority to significant unobservable inputs (Level 3), generally when market prices are not readily available or are unreliable. Based on the valuation inputs, the securities or other investments are tiered into one of three levels. Changes in valuation methods may result in transfers in or out of an investment’s assigned level:
| | Level 1 — | Prices are determined using quoted prices in an active market for identical assets. |
| | Level 2 — | Prices are determined using other significant observable inputs. Observable inputs are inputs that other market participants may use in pricing a security. These may include quoted prices for similar securities, interest rates, prepayment speeds, credit risk, yield curves, loss severities, default rates, discount rates, volatilities and others. |
| | Level 3 — | Prices are determined using significant unobservable inputs. In situations where quoted prices or observable inputs are unavailable (for example, when there is little or no market activity for an investment at the end of the period), unobservable inputs may be used. Unobservable inputs reflect the Fund’s own assumptions about the factors market participants would use in determining fair value of the securities or instruments and would be based on the best available information. |
The following is a summary of the tiered valuation input levels, as of October 31, 2014. The level assigned to the securities valuations may not be an indication of the risk or liquidity associated with investing in those securities. Because of the inherent uncertainties of valuation, the values reflected in the financial statements may materially differ from the value received upon actual sale of those investments.
| | | | | | | | | | | | | | | | |
| | | Level 1 | | | Level 2 | | | Level 3 | | | Total | |
Equity Securities | | $ | 12,360,879 | | | $ | — | | | $ | — | | | $ | 12,360,879 | |
U.S. Treasury Securities | | | — | | | | 9,799,097 | | | | — | | | | 9,799,097 | |
Asset-Backed Securities | | | — | | | | 7,201,522 | | | | — | | | | 7,201,522 | |
Corporate Debt Securities | | | — | | | | 1,565,283 | | | | — | | | | 1,565,283 | |
Foreign Debt Securities | | | — | | | | 490,282 | | | | — | | | | 490,282 | |
Foreign Sovereign Debt Securities | | | — | | | | 213,407 | | | | — | | | | 213,407 | |
Municipal Obligations | | | — | | | | 355,243 | | | | — | | | | 355,243 | |
Options Purchased | | | — | | | | 4,196 | | | | — | | | | 4,196 | |
| | | | 12,360,879 | | | | 19,629,030 | | | | — | | | | 31,989,909 | |
Forward Foreign Currency Contracts* | | | — | | | | 23,242 | | | | — | | | | 23,242 | |
Futures Contracts* | | | 15,139 | | | | — | | | | — | | | | 15,139 | |
Swap Agreements* | | | — | | | | 2,274 | | | | — | | | | 2,274 | |
Total Investments | | $ | 12,376,018 | | | $ | 19,654,546 | | | $ | — | | | $ | 32,030,564 | |
| * | Unrealized appreciation. |
19 Invesco Unconstrained Bond Fund
NOTE 4—Derivative Investments
Value of Derivative Investments at Period-End
The table below summarizes the value of the Fund’s derivative investments, detailed by primary risk exposure, held as of October 31, 2014:
| | | | | | | | |
| | | Value | |
| Risk Exposure/Derivative Type | | Assets | | | Liabilities | |
Credit Risk: | | | | | | | | |
Swap agreements(a)(b) | | $ | 4,795 | | | $ | (4,433 | ) |
Currency Risk: | | | | | | | | |
Forward foreign currency contracts(c) | | | 23,242 | | | | — | |
Options purchased(d) | | | 4,196 | | | | — | |
Interest Rate Risk: | | | | | | | | |
Futures contracts(e) | | | 22,310 | | | | (7,171 | ) |
Market Risk: | | | | | | | | |
Swap agreements(a) | | | 2,812 | | | | (900 | ) |
Total | | $ | 57,355 | | | $ | (12,504 | ) |
| (a) | Values are disclosed on the Statement of Assets and Liabilities under the caption Unrealized appreciation on swap agreements — OTC and Unrealized depreciation on swap agreements — OTC. |
| (b) | Includes cumulative appreciation (depreciation) of centrally cleared swap agreements. Only current day’s variation margin receivable (payable) is reported within the Statement of Assets and Liabilities. |
| (c) | Values are disclosed on the Statement of Assets and Liabilities under the caption Forward foreign currency contracts outstanding. |
| (d) | Options purchased at value as reported in the Schedule of Investments. |
| (e) | Includes cumulative appreciation (depreciation) of futures contracts. Only current day’s variation margin receivable (payable) is reported within the Statement of Assets and Liabilities. |
Effect of Derivative Investments for October 14, 2014 (commencement date) through October 31, 2014
The table below summarizes the gains (losses) on derivative investments, detailed by primary risk exposure, recognized in earnings during the period:
| | | | | | | | | | | | |
| | | Location of Gain (Loss) on
Statement of Operations(a) | |
| | | Futures Contracts | | | Forward
Foreign Currency
Contracts | | | Swap Agreements | |
Realized Gain (Loss): | | | | | | | | | | | | |
Credit risk | | $ | — | | | $ | — | | | $ | (703 | ) |
Market risk | | | — | | | | — | | | | (68 | ) |
Change in Unrealized Appreciation: | | | | | | | | | | | | |
Credit risk | | | — | | | | — | | | | 362 | |
Currency risk | | | — | | | | 23,242 | | | | — | |
Interest rate risk | | | 15,139 | | | | — | | | | — | |
Market risk | | | — | | | | — | | | | 1,912 | |
Total | | $ | 15,139 | | | $ | 23,242 | | | $ | 1,503 | |
| (a) | Options purchased are included in the net realized gain from investment securities and net change in unrealized appreciation on investment securities. |
The table below summarizes the average notional value of futures contracts, forward foreign currency contracts, swap agreements and options purchased outstanding during the period.
| | | | | | | | | | | | | | | | |
| | | Futures Contracts | | | Forward
Foreign Currency
Contracts | | | Swap Agreements | | | Options Purchased | |
Average notional value | | $ | 28,530,781 | | | $ | 1,235,607 | | | $ | 4,950,000 | | | $ | 501,240 | |
| | | | | | | | | | | | | | | | | | | | | | | | | | |
| Open Forward Foreign Currency Contracts | |
Settlement
Date | | Counterparty | | Contract to | | | Notional
Value | | | Unrealized
Appreciation | |
| | | Deliver | | | Receive | | | |
11/17/14 | | Citigroup Global Markets Inc. | | | EUR | | | | 432,727 | | | | USD | | | | 551,199 | | | $ | 542,321 | | | $ | 8,878 | |
11/17/14 | | Citigroup Global Markets Inc. | | | JPY | | | | 22,214,762 | | | | USD | | | | 207,650 | | | | 197,820 | | | | 9,830 | |
11/17/14 | | Citigroup Global Markets Inc. | | | SGD | | | | 636,633 | | | | USD | | | | 500,000 | | | | 495,466 | | | | 4,534 | |
Total Forward Foreign Currency Contracts — Currency Risk | | | | | | | | | | | | | | | | | | | | | | $ | 23,242 | |
Currency Abbreviations:
| | |
| EUR | | – Euro |
| JPY | | – Japanese Yen |
| | |
| SGD | | – Singapore Dollar |
| USD | | – U.S. Dollar |
20 Invesco Unconstrained Bond Fund
| | | | | | | | | | | | | | | | | | | | |
| Open Futures Contracts | |
| Futures Contracts | | Type of Contract | | | Number of Contracts | | | Expiration Month | | | Notional Value | | | Unrealized Appreciation (Depreciation) | |
90-day Eurodollar | | | Long | | | | 50 | | | | December–2015 | | | $ | 12,395,625 | | | $ | (6,982 | ) |
90-day Eurodollar | | | Short | | | | 50 | | | | December–2016 | | | | (12,271,250 | ) | | | 10,643 | |
U.S. Treasury 2 Year Notes | | | Short | | | | 8 | | | | December–2014 | | | | (1,756,500 | ) | | | 2,483 | |
U.S. Treasury 5 Year Notes | | | Short | | | | 8 | | | | December–2014 | | | | (955,437 | ) | | | 5,295 | |
U.S. Treasury 10 Year Notes | | | Short | | | | 8 | | | | December–2014 | | | | (1,010,875 | ) | | | 3,889 | |
U.S. Treasury 30 Year Notes | | | Short | | | | 1 | | | | December–2014 | | | | (141,094 | ) | | | (189 | ) |
Total Futures Contracts — Interest Rate Risk | | | | | | | | | | | | | | | | | | $ | 15,139 | |
| | | | | | | | | | | | | | | | | | | | | | | | | | | | | | |
| Open Centrally Cleared Credit Default Swap Agreements — Credit Risk | |
Counterparty/ Clearinghouse | | Reference Entity | | Buy/Sell Protection | | | (Pay)/Receive Fixed Rate | | | Expiration Date | | | Implied Credit Spread(a) | | | Notional Value | | | Upfront Payments | | | Unrealized Appreciation (Depreciation) | |
| Credit Suisse Securities (USA)/CME | | Markit CDX North America
Investment Grade Index–
Series 23 | | | Buy | | | | (1.00 | )% | | | 12/20/19 | | | | 0.64 | % | | $ | (2,900,000 | ) | | $ | (47,116 | ) | | $ | (4,433 | ) |
Abbreviations:
| | |
| CME | | — Chicago Mercantile Exchange |
| | | | | | | | | | | | | | | | | | | | | | | | | | | | | | | | |
| Open Over-The-Counter Credit Default Swap Agreements — Credit Risk | |
| Counterparty | | Reference Entity | | | Buy/Sell Protection | | | (Pay)/Receive Fixed Rate | | | Expiration Date | | | Implied Credit Spread(a) | | | Notional Value | | | Upfront
Payments | | | Unrealized Appreciation | |
Goldman Sachs International | | | McKesson Corp. | | | | Buy | | | | (1.00 | )% | | | 03/20/19 | | | | 0.20 | % | | $ | (300,000 | ) | | $ | (10,128 | ) | | $ | 4,795 | |
| (a) | Implied credit spreads represent the current level as of October 31, 2014, at which protection could be bought or sold given the terms of the existing credit default swap contract and serve as an indicator of the current status of the payment/performance risk of the credit default swap contract. An implied credit spread that has widened or increased since entry into the initial contract may indicate a deteriorating credit profile and increased risk of default for the reference entity. A declining or narrowing spread may indicate an improving credit profile or decreased risk of default for the reference entity. Alternatively, credit spreads may increase or decrease reflecting the general tolerance for risk in the credit markets generally. |
| | | | | | | | | | | | | | | | | | | | | | |
| Open Over-The-Counter Total Return Swap Agreements | |
| Description | | Type of Contract | | | Counterparty | | Number of Contracts | | | Expiration Date | | | Notional Value | | | Unrealized Appreciation (Depreciation) | |
Receive a return equal to the S&P U.S. Leveraged Loan Index and pay a floating rate equal to the 3 Month LIBOR. | | | Long | | | Goldman Sachs International | | | 5,000 | | | | 12/20/14 | | | $ | 500,000 | | | $ | (900 | ) |
Receive a return equal to the S&P U.S. Leveraged Loan Index and pay a floating rate equal to the 3 Month LIBOR. | | | Long | | | Morgan Stanley & Co.
International PLC | | | 12,500 | | | | 12/20/14 | | | | 1,250,000 | | | | 2,812 | |
Total – Total Return Swap Agreements — Market Risk | | | $ | 1,912 | |
Abbreviations:
| | |
| LIBOR | | — London Interbank Offered Rate |
Offsetting Assets and Liabilities
Accounting Standards Update (“ASU”) No. 2011-11, Disclosures about Offsetting Assets and Liabilities, which was subsequently clarified in Financial Accounting Standards Board ASU 2013-01 “Clarifying the Scope of Disclosures about Offsetting Assets and Liabilities” is intended to enhance disclosures about financial instruments and derivative instruments that are subject to offsetting arrangements on the Statement of Assets and Liabilities and to enable investors to better understand the effect of those arrangements on its financial position. In order for an arrangement to be eligible for netting, the Fund must have a basis to conclude that such netting arrangements are legally enforceable. The Fund enters into netting agreements and collateral agreements in an attempt to reduce the Fund’s Counterparty credit risk by providing for a single net settlement with a Counterparty of all financial transactions covered by the agreement in an event of default as defined under such agreement.
21 Invesco Unconstrained Bond Fund
There were no derivative instruments subject to a netting agreement for which the Fund is not currently netting. The following tables present derivative instruments that are either subject to an enforceable netting agreement or offset by collateral arrangements as of October 31, 2014.
| | | | | | | | | | | | | | | | | | | | | | | | |
| Assets: | | | | | | | | | | | | | | | | | | |
| | | Gross amounts
presented in
Statement of
Assets & Liabilities | | | Gross amounts
offset in
Statement of
Assets & Liabilities | | | Net amounts of assets
presented in
Statement of Assets &
Liabilities | | | Collateral Received | | | | |
| Counterparty | | | | | Financial
Instruments | | | Cash | | | Net
Amount | |
Citigroup Global Markets Inc.(a) | | $ | 23,242 | | | $ | — | | | $ | 23,242 | | | $ | — | | | $ | — | | | $ | 23,242 | |
Goldman Sachs International(b) | | | 14,923 | | | | (10,128 | ) | | | 4,795 | | | | — | | | | — | | | | 4,795 | |
Morgan Stanley & Co. International PLC(b) | | | 2,812 | | | | (61 | ) | | | 2,751 | | | | — | | | | — | | | | 2,751 | |
Total | | $ | 40,977 | | | $ | (10,189 | ) | | $ | 30,788 | | | $ | — | | | $ | — | | | $ | 30,788 | |
| | | | | | |
| | | | | | | | | | | | | | | | | | | | | | | | |
| Liabilities: | | | | | | | | | | | | | | | | | | |
| | | Gross amounts presented in Statement of Assets & Liabilities | | | Gross amounts offset in Statement of Assets & Liabilities | | | Net amounts of liabilities presented in Statement of Assets &
Liabilities | | | Collateral Pledged | | | | |
| Counterparty | | | | | Financial Instruments | | | Cash | | | Net Amount | |
Credit Suisse Securities (USA)(c) | | $ | 51,549 | | | $ | — | | | $ | 51,549 | | | $ | (45,000 | ) | | $ | — | | | $ | 6,549 | |
Goldman Sachs International(b) | | | 11,035 | | | | (10,128 | ) | | | 907 | | | | — | | | | — | | | | 907 | |
Morgan Stanley & Co. International PLC(b) | | | 61 | | | | (61 | ) | | | — | | | | — | | | | — | | | | — | |
Total | | $ | 62,645 | | | $ | (10,189 | ) | | $ | 52,456 | | | $ | (45,000 | ) | | $ | — | | | $ | 7,456 | |
| (a) | Forward foreign currency contracts Counterparty. |
| (b) | Swap agreements — OTC Counterparty. |
| (c) | Swap agreements — centrally cleared Counterparty. Includes cumulative appreciation (depreciation). |
NOTE 5—Investments in Other Affiliates
The Fund’s Adviser and the adviser for Invesco Floating Rate Fund are subsidiaries of Invesco Ltd. and therefore, Invesco Floating Rate Fund is considered to be affiliated with the Fund. The following is a summary of the transactions in, and earning from, investments in Invesco Floating Rate Fund for the period October 14, 2014 (commencement date) through October 31, 2014.
| | | | | | | | | | | | | | | | | | | | | | | | | | | | |
| | | Value 10/14/14 | | | Purchases at Cost | | | Proceeds from Sales | | | Change in Unrealized Appreciation | | | Realized Gain | | | Value 10/31/14 | | | Dividend Income | |
Invesco Floating Rate Fund | | $ | — | | | $ | 5,637,318 | | | $ | — | | | $ | 22,354 | | | $ | — | | | $ | 5,659,672 | | | $ | 12,209 | |
NOTE 6—Trustees’ and Officers’ Fees and Benefits
Trustees’ and Officers’ Fees and Benefits include amounts accrued by the Fund to pay remuneration to certain Trustees and Officers of the Fund. Trustees have the option to defer compensation payable by the Fund, and Trustees’ and Officers’ Fees and Benefits also include amounts accrued by the Fund to fund such deferred compensation amounts. Those Trustees who defer compensation have the option to select various Invesco Funds in which their deferral accounts shall be deemed to be invested. Obligations under the deferred compensation and retirement plans represent unsecured claims against the general assets of the Fund.
NOTE 7—Cash Balances
The Fund is permitted to temporarily carry a negative or overdrawn balance in its account with State Street Bank and Trust Company, the custodian bank. Such balances, if any at period end, are shown in the Statement of Assets and Liabilities under the payable caption Amount due custodian. To compensate the custodian bank for such overdrafts, the overdrawn Fund may either (1) leave funds as a compensating balance in the account so the custodian bank can be compensated by earning the additional interest; or (2) compensate by paying the custodian bank at a rate agreed upon by the custodian bank and Invesco, not to exceed the contractually agreed upon rate.
22 Invesco Unconstrained Bond Fund
NOTE 8—Distributions to Shareholders and Tax Components of Net Assets
Tax Character of Distributions to Shareholders Paid During the Period October 14, 2014 (commencement date) through October 31, 2014:
There were no ordinary income or capital gain distributions during the period October 14, 2014 (commencement date) through October 31, 2014.
Tax Components of Net Assets at Period-End:
| | | | |
| | | 2014 | |
Undistributed ordinary income | | $ | 29,335 | |
Undistributed long-term gain | | | 20,899 | |
Net unrealized appreciation — investments | | | 55,501 | |
Net unrealized appreciation — other investments | | | 6,949 | |
Temporary book/tax differences | | | (985 | ) |
Shares of beneficial interest | | | 25,026,984 | |
Total net assets | | $ | 25,138,683 | |
The difference between book-basis and tax-basis unrealized appreciation (depreciation) is due to differences in the timing of recognition of gains and losses on investments for tax and book purposes. The Fund’s net unrealized appreciation difference is attributable primarily to bond premiums and foreign currency transactions.
The temporary book/tax differences are a result of timing differences between book and tax recognition of income and/or expenses. The Fund’s temporary book/tax differences are the result of the trustee deferral of compensation and retirement plan benefits.
The Fund does not have a capital loss carryforward as of October 31, 2014.
NOTE 9—Investment Securities
The aggregate amount of investment securities (other than short-term securities, U.S. Treasury obligations and money market funds, if any) purchased and sold by the Fund during the period October 14, 2014 (commencement date) through October 31, 2014 was $15,430,273 and $0, respectively. Cost of investments on a tax basis includes the adjustments for financial reporting purposes as of the most recently completed federal income tax reporting period-end.
| | | | |
| Unrealized Appreciation (Depreciation) of Investment Securities on a Tax Basis | |
Aggregate unrealized appreciation of investment securities | | $ | 64,388 | |
Aggregate unrealized (depreciation) of investment securities | | | (8,887 | ) |
Net unrealized appreciation of investment securities | | $ | 55,501 | |
Cost of investments for tax purposes is $31,934,408.
NOTE 10—Reclassification of Permanent Differences
Primarily as a result of differing book/tax treatment of stock issuance cost, swap income and foreign currency transactions on October 31, 2014, undistributed net investment income was increased by $4,937, undistributed net realized gain (loss) was increased by $1,289 and shares of beneficial interest was decreased by $6,226. This reclassification had no effect on the net assets of the Fund.
NOTE 11—Share Information
| | | | | | | | |
| | | Summary of Share Activity | |
| | | October 14, 2014
(commencement date) through
October 31, 2014(a) | |
| | | Shares | | | Amount | |
Sold: | | | | | | | | |
Class A | | | 1,248,056 | | | $ | 12,480,560 | |
Class C | | | 1,001 | | | | 10,010 | |
Class R | | | 1,001 | | | | 10,010 | |
Class Y | | | 1,251,257 | | | | 12,512,610 | |
Class R5 | | | 1,001 | | | | 10,010 | |
Class R6 | | | 1,001 | | | | 10,010 | |
Net increase in share activity | | | 2,503,317 | | | $ | 25,033,210 | |
| (a) | 100% of the outstanding shares of the Fund are owned by the Adviser. |
23 Invesco Unconstrained Bond Fund
NOTE 12—Financial Highlights
The following schedule presents financial highlights for a share of the Fund outstanding throughout the periods indicated.
| | | | | | | | | | | | | | | | | | | | | | | | | | | | | | | | | | | | | | | | | | | | |
| | | Net asset
value,
beginning
of period | | | Net
investment
income
(loss)(a) | | | Net gains
on securities
(both
realized and
unrealized) | | | Total from
investment
operations | | | Net asset
value, end
of period | | | Total
return(b) | | | Net assets,
end of period
(000’s omitted) | | | Ratio of
expenses
to average
net assets
with fee waivers
and/or expenses
absorbed | | | Ratio of
expenses
to average net
assets without
fee waivers
and/or expenses
absorbed | | | Ratio of net
investment
income (loss)
to average
net assets | | | Portfolio
turnover(c) | |
Class A | | | | | | | | | | | | | | | | | | | | | | | | | | | | | | | | | | | | | | | | | | | | |
Year ended 10/31/14(d) | | $ | 10.00 | | | $ | 0.00 | | | $ | 0.04 | | | $ | 0.04 | | | $ | 10.04 | | | | 0.40 | % | | $ | 12,532 | | | | 0.87 | %(e)(f) | | | 5.89 | %(e) | | | 0.69 | %(e) | | | 0 | % |
Class C | | | | | | | | | | | | | | | | | | | | | | | | | | | | | | | | | | | | | | | | | | | | |
Year ended 10/31/14(d) | | | 10.00 | | | | (0.00 | ) | | | 0.04 | | | | 0.04 | | | | 10.04 | | | | 0.40 | | | | 10 | | | | 1.62 | (e)(f) | | | 6.64 | (e) | | | (0.06 | )(e) | | | 0 | |
Class R | | | | | | | | | | | | | | | | | | | | | | | | | | | | | | | | | | | | | | | | | | | | |
Year ended 10/31/14(d) | | | 10.00 | | | | 0.00 | | | | 0.04 | | | | 0.04 | | | | 10.04 | | | | 0.40 | | | | 10 | | | | 1.12 | (e)(f) | | | 6.14 | (e) | | | 0.44 | (e) | | | 0 | |
Class Y | | | | | | | | | | | | | | | | | | | | | | | | | | | | | | | | | | | | | | | | | | | | |
Year ended 10/31/14(d) | | | 10.00 | | | | 0.00 | | | | 0.04 | | | | 0.04 | | | | 10.04 | | | | 0.40 | | | | 12,566 | | | | 0.62 | (e)(f) | | | 5.64 | (e) | | | 0.94 | (e) | | | 0 | |
Class R5 | | | | | | | | | | | | | | | | | | | | | | | | | | | | | | | | | | | | | | | | | | | | |
Year ended 10/31/14(d) | | | 10.00 | | | | 0.00 | | | | 0.04 | | | | 0.04 | | | | 10.04 | | | | 0.40 | | | | 10 | | | | 0.62 | (e)(f) | | | 5.74 | (e) | | | 0.94 | (e) | | | 0 | |
Class R6 | | | | | | | | | | | | | | | | | | | | | | | | | | | | | | | | | | | | | | | | | | | | |
Year ended 10/31/14(d) | | | 10.00 | | | | 0.00 | | | | 0.04 | | | | 0.04 | | | | 10.04 | | | | 0.40 | | | | 10 | | | | 0.62 | (e)(f) | | | 5.74 | (e) | | | 0.94 | (e) | | | 0 | |
| (a) | Calculated using average shares outstanding. |
| (b) | Includes adjustments in accordance with accounting principles generally accepted in the United States of America and as such, the net asset value for financial reporting purposes and the returns based upon those net asset values may differ from the net asset value and returns for shareholder transactions. Does not include sales charges and is not annualized for periods less than one year, if applicable. |
| (c) | Portfolio turnover is calculated at the fund level and is not annualized for periods less than one year, if applicable. |
| (d) | Commencement date of October 14, 2014. |
| (e) | Ratios are annualized and based on average daily net assets (000’s omitted) of $12,491, $10, $10, $12,504, $10 and $10 for Class A, Class C, Class R, Class Y, Class R5 and Class R6, respectively. |
| (f) | In addition to the fees and expenses which the Fund bears directly; the Fund indirectly bears a pro rata share of the fees and expenses of the underlying funds in which the Fund invests. Because the underlying funds have varied expenses and fee levels and the Fund may own different proportions at different times, the amount of fees and expenses incurred indirectly by the Fund will vary. Estimated underlying fund expenses are not expenses that are incurred directly by your Fund. They are expenses that are incurred directly by the underlying funds and are deducted from the value of the funds your Fund invests in. The effect of the estimated underlying fund expenses that you bear indirectly is included in your Fund’s total return. Estimated acquired fund fees from underlying funds were 0.10% for the period October 14, 2014 (commencement date) through October 31, 2014. |
24 Invesco Unconstrained Bond Fund
Report of Independent Registered Public Accounting Firm
To the Board of Trustees of AIM Investment Funds (Invesco Investment Funds)
and Shareholders of Invesco Unconstrained Bond Fund:
In our opinion, the accompanying statement of assets and liabilities, including the schedule of investments, and the related statements of operations and of changes in net assets and the financial highlights present fairly, in all material respects, the financial position of Invesco Unconstrained Bond Fund (one of the funds constituting AIM Investment Funds (Invesco Investment Funds), hereafter referred to as the “Fund”) at October 31, 2014, and the results of its operations, the changes in its net assets and the financial highlights for the period October 14, 2014 (commencement of operations) through October 31, 2014, in conformity with accounting principles generally accepted in the United States of America. These financial statements and financial highlights (hereafter referred to as “financial statements”) are the responsibility of the Fund’s management. Our responsibility is to express an opinion on these financial statements based on our audit. We conducted our audit of these financial statements in accordance with the standards of the Public Company Accounting Oversight Board (United States). Those standards require that we plan and perform the audit to obtain reasonable assurance about whether the financial statements are free of material misstatement. An audit includes examining, on a test basis, evidence supporting the amounts and disclosures in the financial statements, assessing the accounting principles used and significant estimates made by management, and evaluating the overall financial statement presentation. We believe that our audits, which included confirmation of securities at October 31, 2014 by correspondence with the custodian and brokers, and the application of alternative auditing procedures where confirmations of security purchases have not been received, provide a reasonable basis for our opinion.
PRICEWATERHOUSECOOPERS LLP
December 29, 2014
Houston, Texas
25 Invesco Unconstrained Bond Fund
Calculating your ongoing Fund expenses
Example
As a shareholder of the Fund, you incur two types of costs: (1) transaction costs, which may include sales charges (loads) on purchase payments or contingent deferred sales charges on redemptions, if any; and (2) ongoing costs, including management fees, distribution and/or service (12b-1) fees, and other Fund expenses. This example is intended to help you understand your ongoing costs (in dollars) of investing in the Fund and to compare these costs with ongoing costs of investing in other mutual funds. The actual ending account value and expenses in the example below are based on an investment of $1,000 invested as of the close of business on October 14, 2014 (commencement date) and held through October 31, 2014.
Actual expenses
The table below provides information about actual account values and actual expenses. You may use the information in this table, together with the amount you invested, to estimate the expenses that you paid over the period. Simply divide your account value by $1,000 (for example, an $8,600 account value divided by $1,000 = 8.6), then multiply the result by the number in the table under the heading entitled “Actual Expenses Paid During Period” to estimate the expenses you paid on your account during this period. Because the actual ending account value and expense information in the example is not based upon a six month period, the ending account value and expense information may not provide a meaningful comparison to mutual funds that provide such information for a full six month period.
Hypothetical example for comparison purposes
The table below also provides information about hypothetical account values and hypothetical expenses based on the Fund’s actual expense ratio and an assumed rate of return of 5% per year before expenses, which is not the Fund’s actual return.
The hypothetical account values and expenses may not be used to estimate the actual ending account balance or expenses you paid for the period. You may use this information to compare the ongoing costs of investing in the Fund and other funds. To do so, compare this 5% hypothetical example with the 5% hypothetical examples that appear in the shareholder reports of the other funds.
Please note that the expenses shown in the table are meant to highlight your ongoing costs only and do not reflect any transaction costs, such as sales charges (loads) on purchase payments or contingent deferred sales charges on redemptions, if any. Therefore, the hypothetical information is useful in comparing ongoing costs only, and will not help you determine the relative total costs of owning different funds. In addition, if these transaction costs were included, your costs would have been higher.
| | | | | | | | | | | | | | | | | | | | | | | | |
| Class | | Beginning
Account Value
(10/14/14) | | | ACTUAL | | | HYPOTHETICAL
(5% annual return before
expenses) | | | Annualized
Expense
Ratio | |
| | | Ending
Account Value
(10/31/14)1 | | | Expenses
Paid During
Period2 | | | Ending
Account Value
(10/31/14) | | | Expenses
Paid During
Period3 | | |
| A | | $ | 1,000.00 | | | $ | 1,004.00 | | | $ | 4.21 | | | $ | 1,020.80 | | | $ | 4.45 | | | | 0.87 | % |
| C | | | 1,000.00 | | | | 1,004.00 | | | | 8.20 | | | | 1,017.02 | | | | 8.26 | | | | 1.62 | |
| R | | | 1,000.00 | | | | 1,004.00 | | | | 5.68 | | | | 1,019.54 | | | | 5.72 | | | | 1.12 | |
| Y | | | 1,000.00 | | | | 1,004.00 | | | | 3.15 | | | | 1,022.06 | | | | 3.18 | | | | 0.62 | |
| R5 | | | 1,000.00 | | | | 1,004.00 | | | | 3.15 | | | | 1,022.06 | | | | 3.18 | | | | 0.62 | |
| R6 | | | 1,000.00 | | | | 1,004.00 | | | | 3.15 | | | | 1,022.06 | | | | 3.18 | | | | 0.62 | |
| 1 | The actual ending account value is based on the actual total return of the Fund for the period October 14, 2014 (commencement date) through October 31, 2014, after actual expenses and will differ from the hypothetical ending account value which is based on the Fund’s expense ratio and a hypothetical annual return of 5% before expenses. |
| 2 | Actual expenses are equal to the Fund’s annualized expense ratio as indicated above multiplied by the average account value over the period, multiplied by 18 (as of close of business on October 14, 2014 (commencement date) through October 31, 2014)/365. Because the Fund has not been in existence for a full six-month period, the actual ending account value and expense information shown may not provide a meaningful comparison to fund expense information of classes that show such data for a full six-month period and, because the actual ending account value and expense information in the expense example covers a short time period, return and expense data may not be indicative of return and expense data for longer time periods. |
| 3 | Hypothetical expenses are equal to the annualized expense ratio indicated above multiplied by the average account value over the period, multiplied by 184/365 to reflect a one-half year period. The hypothetical ending account value and expenses may be used to compare ongoing costs of investing in the Fund and other funds because such data is based on a full six-month period. |
26 Invesco Unconstrained Bond Fund
Initial Approval of Investment Advisory and Sub-Advisory Agreements
The Board of Trustees (the Board) of AIM Investment Funds (Invesco Investment Funds) (the Company) is required under the Investment Company Act of 1940, as amended, to approve the Invesco Unconstrained Bond Fund (the Fund) investment advisory agreements before the Fund can commence operations. During meetings held on September 16-17, 2014, the Board as a whole and the disinterested or “independent” Trustees voting separately approved (i) an amendment to the Company’s Master Investment Advisory Agreement with Invesco Advisers, Inc. (Invesco Advisers and the investment advisory agreement) to add the Fund, and (ii) (a) an amendment to the Master Intergroup Sub-Advisory Contract for Mutual Funds with Invesco Asset Management Deutschland GmbH, Invesco Asset Management Limited, Invesco Asset Management (Japan) Limited, Invesco Australia Limited, Invesco Hong Kong Limited, Invesco Senior Secured Management, Inc. and Invesco Canada Ltd. to add the Fund, and (b) an amendment to the Sub-Advisory Contract with Invesco PowerShares Capital Management LLC to add the Fund (the sub-advisers, the Affiliated Sub-Advisers; and the contracts, the sub-advisory contracts). In doing so, the Board followed a process similar to the process that it follows in annually reviewing and approving investment advisory agreements and sub-advisory contracts for the series portfolios of funds advised by Invesco Advisers and considered the information provided in the most recent annual review process as well as the information provided with respect to the Fund. The Board (i) determined that the investment advisory agreement and sub-advisory contracts are in the best interest of the Fund and its shareholders and that the compensation payable to Invesco Advisers and the Affiliated Sub-Advisers under the Fund’s agreements is fair and reasonable and (ii) approved submission of the agreements to the initial shareholder of the Fund.
The Board’s Fund Evaluation Process
The Board’s Investments Committee has established three Sub-Committees that are responsible for overseeing the management of a number of the funds advised by Invesco Advisers (the Invesco Funds). The Fund will be assigned to one of the Sub-Committees. The Sub-Committees meet throughout the year to review the performance, fees, expenses and other matters related to their assigned Invesco Funds. Over the course of each year, the Sub-Committees meet with portfolio managers for their assigned Invesco Funds and other members of management and review with these individuals the performance, investment objective(s), policies, strategies, limitations and investment risks of these funds.
In evaluating the fairness and reasonableness of compensation under the Fund’s investment advisory agreement and sub-advisory contracts, the Board considered, among other things, the factors discussed below. The Board was assisted in its review by the Senior Officer, an independent officer of the Invesco Funds, and by independent legal counsel. The discussion below serves as a summary of the material factors and related conclusions that formed the basis for the Board’s approval of the Fund’s investment advisory agreement and sub-advisory contracts. The Trustees’ review and conclusions are based on the comprehensive consideration of all information presented to them and are not the result of any single determinative factor. Moreover, one Trustee may have weighed a particular piece of information or factor differently than another Trustee.
Factors and Conclusions and Summary of Evaluation of Investment Advisory and Sub-Advisory Agreements
| A. | Nature, Extent and Quality of Services Provided by Invesco Advisers and the Affiliated Sub-Advisers |
The Board reviewed the advisory services to be provided to the Fund by Invesco Advisers under the Fund’s investment advisory agreement and the credentials and experience of the officers and employees of Invesco Advisers who will provide these services. The Board’s review of the qualifications of Invesco Advisers to provide these services included the Board’s consideration of Invesco Advisers’ investment process oversight, independent credit analysis and investment risk management. The Board also considered non-advisory services that Invesco Advisers and its affiliates provide to the Invesco Funds and will provide to the Fund, such as various back office support functions, equity and fixed income trading operations, internal audit, distribution and legal and compliance. In determining whether to approve the Fund’s investment advisory agreement, the Board considered the existing relationship between Invesco Advisers and the Invesco Funds, as well as the Board’s knowledge of Invesco Advisers’ operations. The Board concluded that the nature, extent and quality of the advisory services to be provided to the Fund by Invesco Advisers are appropriate.
The Board reviewed the services that may be provided by the Affiliated Sub-Advisers under the sub-advisory contracts and the credentials and experience of the officers and employees of the Affiliated Sub-Advisers who may provide these services. The Board noted that the Affiliated Sub-Advisers have offices and personnel that are located in financial centers around the world. As a result, the Affiliated Sub-Advisers can provide research and investment analysis on the markets and economies of
various countries in which the Fund may invest, make recommendations regarding securities and assist with security trades. The Board concluded that the sub-advisory contracts will benefit the Fund and its shareholders by permitting Invesco Advisers to use the resources and talents of the Affiliated Sub-Advisers in managing the Fund. The Board concluded that the nature, extent and quality of the services that may be provided by the Affiliated Sub-Advisers are appropriate.
The Board did not consider the performance of the Fund because the Fund is new and has no performance history. The Board did review performance expectations for the Fund.
| C. | Advisory and Sub-Advisory Fees and Fee Waivers |
The Board considered the proposed advisory fee schedule of the Fund and the proposed fee waivers and expense limitations that will be in place for the Fund through October 31, 2015. The Board also considered the services to be provided by the Affiliated Sub-Advisers pursuant to the sub-advisory contracts and the services to be provided by Invesco Advisers pursuant to the Fund’s investment advisory agreement, as well as the allocation of fees between Invesco Advisers and the Affiliated Sub-Advisers pursuant to the sub-advisory contracts. The Board noted that the sub-advisory fees will have no direct effect on the Fund or its shareholders, as they are paid by Invesco Advisers to the Affiliated Sub-Advisers.
The Board also considered comparative advisory fee data provided by Invesco Advisers with respect to comparable registered funds managed by third-party advisers. The Board noted that the advisory fee is at or below the Lipper Alternative Credit Focus Funds classification median fee at all break points and that the advisory fee is below the fee of one key competitor identified by Invesco Advisers and above the fee of four key competitors identified by Invesco Advisers. The Board noted that Invesco Advisers advises one other mutual fund with investment strategies similar to those of the Fund.
Based upon the information provided and considerations described above, the Board concluded that the compensation payable to Invesco Advisers and the Affiliated Sub-Advisers is fair and reasonable.
| D. | Economies of Scale and Breakpoints |
The Board considered the extent to which there may be economies of scale in the provision of advisory services to the Fund. The Board also considered whether the Fund would benefit from such economies of scale through contractual breakpoints in the Fund’s advisory fee schedule. The Board also noted that the Fund will share directly in economies of scale through lower fees charged by third party service providers based on the combined size of
27 Invesco Unconstrained Bond Fund
all of the Invesco Funds and other clients advised by Invesco Advisers.
| E. | Profitability and Financial Resources |
The Board considered information from Invesco Advisers concerning the costs of the advisory and other services that Invesco Advisers and its affiliates provide to the Invesco Funds and the profitability of Invesco Advisers and its affiliates in providing these services. The Board received information from Invesco Advisers demonstrating that Invesco Advisers and each Affiliated Sub-Adviser are financially sound and have the resources necessary to perform their obligations under the Fund’s investment advisory agreement and sub-advisory contracts.
| F. | Collateral Benefits to Invesco Advisers and its Affiliates |
The Board considered various other benefits to be received by Invesco Advisers and its affiliates resulting from Invesco Advisers’ relationship with the Fund, including the fees to be received by Invesco Advisers and its affiliates for their provision of transfer agency and distribution services to the Fund. The Board considered the performance of Invesco Advisers and its affiliates in providing these services to other Invesco Funds and the organizational structure employed by Invesco Advisers and its affiliates to provide these services. The Board also considered that these services will be provided to the Fund pursuant to written contracts that are reviewed and approved on an annual basis by the Board; that the services are required for the operation of the Fund; that Invesco Advisers and its affiliates can provide services, the nature and quality of which are at least equal to those provided by others offering the same or similar services; and that the fees for such services are fair and reasonable in light of the usual and customary charges by others for services of the same nature and quality.
The Board considered the benefits realized by Invesco Advisers and the Affiliated Sub-Advisers as a result of portfolio brokerage transactions executed through “soft dollar” arrangements. Invesco Advisers noted that the Fund does is not expected to execute brokerage transactions through “soft dollar” arrangements to any significant degree.
The Board considered the fact that the Fund’s uninvested cash and cash collateral from any securities lending arrangements may be invested in money market funds advised by Invesco Advisers pursuant to procedures approved by the Board. The Board noted that Invesco Advisers will receive advisory fees from these affiliated money market funds attributable to such investments, although Invesco Advisers has contractually agreed to waive through at least October 31, 2015, the advisory fees payable by the Fund with respect to such investments. This waiver is in an amount equal to 100% of the net advisory fee Invesco Advisers or its affiliates receive from the affiliated money market funds with respect to the Fund’s investment in the affiliated money market funds of uninvested cash, but not cash collateral from securities lending arrangements.
The Board concluded that the Fund’s investment of uninvested cash and cash collateral from any securities lending arrangements in the affiliated money market funds is fair and reasonable.
28 Invesco Unconstrained Bond Fund
Trustees and Officers
The address of each trustee and officer is AIM Investment Funds (Invesco Investment Funds) (the “Trust”), 11 Greenway Plaza, Suite 1000, Houston, Texas 77046-1173. The trustees serve for the life of the Trust, subject to their earlier death, incapacitation, resignation, retirement or removal as more specifically provided in the Trust’s organizational documents. Each officer serves for a one year term or until their successors are elected and qualified. Column two below includes length of time served with predecessor entities, if any.
| | | | | | | | |
Name, Year of Birth and Position(s) Held with the Trust | | Trustee and/
or Officer Since | | Principal Occupation(s) During Past 5 Years | | Number of Funds in Fund Complex Overseen by Trustee | | Other Directorship(s) Held by Trustee During Past 5 Years |
| Interested Persons | | | | | | | | |
| Martin L. Flanagan1 — 1960 Trustee | | 2007 | | Executive Director, Chief Executive Officer and President, Invesco Ltd. (ultimate parent of Invesco and a global investment management firm); Advisor to the Board, Invesco Advisers, Inc. (formerly known as Invesco Institutional (N.A.), Inc.); Trustee, The Invesco Funds; Vice Chair, Investment Company Institute; and Member of Executive Board, SMU Cox School of Business Formerly: Chairman and Chief Executive Officer, Invesco Advisers, Inc. (registered investment adviser); Director, Chairman, Chief Executive Officer and President, IVZ Inc. (holding company), INVESCO Group Services, Inc. (service provider) and Invesco North American Holdings, Inc. (holding company); Director, Chief Executive Officer and President, Invesco Holding Company Limited (parent of Invesco and a global investment management firm); Director, Invesco Ltd.; Chairman, Investment Company Institute and President, Co-Chief Executive Officer, Co-President, Chief Operating Officer and Chief Financial Officer, Franklin Resources, Inc. (global investment management organization). | | 144 | | None |
Philip A. Taylor2 — 1954 Trustee, President and Principal Executive Officer | | 2006 | | Head of North American Retail and Senior Managing Director, Invesco Ltd.; Director, Co-Chairman, Co-President and Co-Chief Executive Officer, Invesco Advisers, Inc. (formerly known as Invesco Institutional (N.A.), Inc.) (registered investment adviser); Director, Chairman, Chief Executive Officer and President, Invesco Management Group, Inc. (formerly known as Invesco Aim Management Group, Inc.) (financial services holding company); Director and President, INVESCO Funds Group, Inc. (registered investment adviser and registered transfer agent); Director and Chairman, Invesco Investment Services, Inc. (formerly known as Invesco Aim Investment Services, Inc.) (registered transfer agent) and IVZ Distributors, Inc. (formerly known as INVESCO Distributors, Inc.) (registered broker dealer); Director, President and Chairman, Invesco Inc. (holding company) and Invesco Canada Holdings Inc. (holding company); Chief Executive Officer, Invesco Corporate Class Inc. (corporate mutual fund company) and Invesco Canada Fund Inc. (corporate mutual fund company); Director, Chairman and Chief Executive Officer, Invesco Canada Ltd. (formerly known as Invesco Trimark Ltd./Invesco Trimark Ltèe) (registered investment adviser and registered transfer agent); Trustee, President and Principal Executive Officer, The Invesco Funds (other than AIM Treasurer’s Series Trust (Invesco Treasurer’s Series Trust) and Short-Term Investments Trust); Trustee and Executive Vice President, The Invesco Funds (AIM Treasurer’s Series Trust (Invesco Treasurer’s Series Trust) and Short-Term Investments Trust only); Director, Invesco Investment Advisers LLC (formerly known as Van Kampen Asset Management); Director, Chief Executive Officer and President, Van Kampen Exchange Corp. Formerly: Director and Chairman, Van Kampen Investor Services Inc.; Director, Chief Executive Officer and President, 1371 Preferred Inc. (holding company) and Van Kampen Investments Inc.; Director and President, AIM GP Canada Inc. (general partner for limited partnerships) and Van Kampen Advisors, Inc.; Director and Chief Executive Officer, Invesco Trimark Dealer Inc. (registered broker dealer); Director, Invesco Distributors, Inc. (formerly known as Invesco Aim Distributors, Inc.) (registered broker dealer); Manager, Invesco PowerShares Capital Management LLC; Director, Chief Executive Officer and President, Invesco Advisers, Inc.; Director, Chairman, Chief Executive Officer and President, Invesco Aim Capital Management, Inc.; President, Invesco Trimark Dealer Inc. and Invesco Trimark Ltd./Invesco Trimark Ltèe; Director and President, AIM Trimark Corporate Class Inc. and AIM Trimark Canada Fund Inc.; Senior Managing Director, Invesco Holding Company Limited; Director and Chairman, Fund Management Company (former registered broker dealer); President and Principal Executive Officer, The Invesco Funds (AIM Treasurer’s Series Trust (Invesco Treasurer’s Series Trust), and Short-Term Investments Trust only); President, AIM Trimark Global Fund Inc. and AIM Trimark Canada Fund Inc. | | 144 | | None |
Wayne W. Whalen3 — 1939 Trustee | | 2010 | | Of Counsel, and prior to 2010, partner in the law firm of Skadden, Arps, Slate, Meagher & Flom LLP, legal counsel to certain funds in the Fund Complex | | 144 | | Director of the Mutual fund Directors Forum, a nonprofit membership organization for investment directors; Chairman and Director of the Abraham Lincoln Presidential Library Foundation; and Director of the Stevenson Center for Democracy |
| 1 | Mr. Flanagan is considered an interested person (within the meaning of Section 2(a)(19) of the 1940 Act) of the Trust because he is an officer of the Adviser to the Trust, and an officer and a director of Invesco Ltd., ultimate parent of the Adviser. |
| 2 | Mr. Taylor is considered an interested person (within the meaning of Section 2(a)(19) of the 1940 Act) of the Trust because he is an officer and a director of the Adviser. |
| 3 | Mr. Whalen is retiring effective December 31, 2014. He has been deemed to be an interested person of the Trust because of his prior service as counsel to the predecessor funds of certain Invesco open-end funds and his affiliation with the law firm that served as counsel to such predecessor funds and the Invesco closed-end funds. |
T-1 Invesco Unconstrained Bond Fund
Trustees and Officers—(continued)
| | | | | | | | |
Name, Year of Birth and Position(s) Held with the Trust | | Trustee and/
or Officer Since | | Principal Occupation(s) During Past 5 Years | | Number of Funds in Fund Complex Overseen by Trustee | | Other Directorship(s) Held by Trustee During Past 5 Years |
| Independent Trustees | | | | | | | | |
Bruce L. Crockett — 1944 Trustee and Chair | | 2001 | | Chairman, Crockett Technologies Associates (technology consulting company) Formerly: Director, Captaris (unified messaging provider); Director, President and Chief Executive Officer, COMSAT Corporation; Chairman, Board of Governors of INTELSAT (international communications company); ACE Limited (insurance company); and Investment Company Institute | | 144 | | ALPS (Attorneys Liability Protection Society) (insurance company) |
David C. Arch — 1945 Trustee | | 2010 | | Chairman of Blistex Inc., a consumer health care products manufacturer | | 144 | | Board member of the Illinois Manufacturers’ Association; Member of the Board of Visitors, Institute for the Humanities, University of Michigan; Member of the Audit Committee of the Edward-Elmhurst Hospital |
Frank S. Bayley — 1939 Trustee | | 1987 | | Retired. Formerly: Director, Badgley Funds Inc. (registered investment company) (2 portfolios) and General Partner and Of Counsel, law firm of Baker & McKenzie, LLP | | 144 | | Director and Chairman, C.D. Stimson Company (a real estate investment company); Trustee, The Curtis Institute of Music |
James T. Bunch — 1942 Trustee | | 2003 | | Managing Member, Grumman Hill Group LLC (family office private equity investments) Formerly: Founder, Green Manning & Bunch Ltd. (investment banking firm) (1988-2010); Executive Committee, United States Golf Association; and Director, Policy Studies, Inc. and Van Gilder Insurance Corporation | | 144 | | Chairman, Board of Governors, Western Golf Association; Chairman, Evans Scholars Foundation; and Director, Denver Film Society |
Rodney F. Dammeyer — 1940 Trustee | | 2010 | | Chairman of CAC,LLC, (private company offering capital investment and management advisory services) Formerly: Prior to 2001, Managing Partner at Equity Group Corporate Investments; Prior to 1995, Chief Executive Officer of Itel Corporation (formerly Anixter International); Prior to 1985, experience includes Senior Vice President and Chief Financial Officer of Household International, Inc., Executive Vice President and Chief Financial Officer of Northwest Industries, Inc. and Partner of Arthur Andersen & Co.; From 1987 to 2010, Director/Trustee of investment companies in the Van Kampen Funds complex | | 144 | | Director of Quidel Corporation and Stericycle, Inc. |
Albert R. Dowden — 1941 Trustee | | 2001 | | Director of a number of public and private business corporations, including the Boss Group, Ltd. (private investment and management); Nature’s Sunshine Products, Inc. and Reich & Tang Funds (5 portfolios) (registered investment company) Formerly: Director, Homeowners of America Holding Corporation/Homeowners of America Insurance Company (property casualty company); Director, Continental Energy Services, LLC (oil and gas pipeline service); Director, CompuDyne Corporation (provider of product and services to the public security market) and Director, Annuity and Life Re (Holdings), Ltd. (reinsurance company); Director, President and Chief Executive Officer, Volvo Group North America, Inc.; Senior Vice President, AB Volvo; Director of various public and private corporations; Chairman, DHJ Media, Inc.; Director, Magellan Insurance Company; and Director, The Hertz Corporation, Genmar Corporation (boat manufacturer), National Media Corporation; Advisory Board of Rotary Power International (designer, manufacturer, and seller of rotary power engines); and Chairman, Cortland Trust, Inc. (registered investment company) | | 144 | | Director of: Nature’s Sunshine Products, Inc., Reich & Tang Funds, Homeowners of America Holding Corporation/ Homeowners of America Insurance Company, the Boss Group |
Jack M. Fields — 1952 Trustee | | 2001 | | Chief Executive Officer, Twenty First Century Group, Inc. (government affairs company); Owner and Chief Executive Officer, Dos Angeles Ranch, L.P. (cattle, hunting, corporate entertainment); and Discovery Global Education Fund (non-profit) Formerly: Chief Executive Officer, Texana Timber LP (sustainable forestry company); Director of Cross Timbers Quail Research Ranch (non-profit); and member of the U.S. House of Representatives | | 144 | | Insperity, Inc. (formerly known as Administaff) |
Prema Mathai-Davis — 1950 Trustee | | 2001 | | Retired. Formerly: Chief Executive Officer, YWCA of the U.S.A. | | 144 | | None |
Larry Soll — 1942 Trustee | | 2003 | | Retired. Formerly: Chairman, Chief Executive Officer and President, Synergen Corp. (a biotechnology company) | | 144 | | None |
Hugo F. Sonnenschein — 1940 Trustee | | 2010 | | President Emeritus and Honorary Trustee of the University of Chicago and the Adam Smith Distinguished Service Professor in the Department of Economics at the University of Chicago. Prior to 2000, President of the University of Chicago | | 144 | | Trustee of the University of Rochester and a member of its investment committee; Member of the National Academy of Sciences and the American Philosophical Society; Fellow of the American Academy of Arts and Sciences |
T-2 Invesco Unconstrained Bond Fund
Trustees and Officers—(continued)
| | | | | | | | |
Name, Year of Birth and Position(s) Held with the Trust | | Trustee and/
or Officer Since | | Principal Occupation(s) During Past 5 Years | | Number of Funds in Fund Complex Overseen by Trustee | | Other Directorship(s) Held by Trustee During Past 5 Years |
| Independent Trustees—(continued) |
Raymond Stickel, Jr. — 1944 Trustee | | 2005 | | Retired. Formerly: Director, Mainstay VP Series Funds, Inc. (25 portfolios) and Partner, Deloitte & Touche | | 144 | | None |
Suzanne H. Woolsey — 1941 Trustee | | 2014 | | Chief Executive Officer of Woolsey Partners LLC | | 144 | | Emeritus Chair of the Board of Trustees of the Institute for Defense Analyses; Trustee of Colorado College; Trustee of California Institute of Technology; Prior to 2014, Director of Fluor Corp.; Prior to 2010, Trustee of the German Marshall Fund of the United States; Prior to 2010 Trustee of the Rocky Mountain Institute |
| Other Officers | | | | | | | | |
Russell C. Burk — 1958 Senior Vice President and Senior Officer | | 2005 | | Senior Vice President and Senior Officer, The Invesco Funds | | N/A | | N/A |
John M. Zerr — 1962 Senior Vice President, Chief Legal Officer and Secretary | | 2006 | | Director, Senior Vice President, Secretary and General Counsel, Invesco Management Group, Inc. (formerly known as Invesco Aim Management Group, Inc.) and Van Kampen Exchange Corp.; Senior Vice President, Invesco Advisers, Inc. (formerly known as Invesco Institutional (N.A.), Inc.) (registered investment adviser); Senior Vice President and Secretary, Invesco Distributors, Inc. (formerly known as Invesco Aim Distributors, Inc.); Director, Vice President and Secretary, Invesco Investment Services, Inc. (formerly known as Invesco Aim Investment Services, Inc.) and IVZ Distributors, Inc. (formerly known as INVESCO Distributors, Inc.); Director and Vice President, INVESCO Funds Group, Inc.; Senior Vice President, Chief Legal Officer and Secretary, The Invesco Funds; Manager, Invesco PowerShares Capital Management LLC; Director, Secretary and General Counsel, Invesco Investment Advisers LLC (formerly known as Van Kampen Asset Management); Secretary and General Counsel, Invesco Capital Markets, Inc. (formerly known as Van Kampen Funds Inc.) and Chief Legal Officer, PowerShares Exchange-Traded Fund Trust, PowerShares Exchange-Traded Fund Trust II, PowerShares India Exchange-Traded Fund Trust, PowerShares Actively Managed Exchange-Traded Fund Trust; and PowerShares Actively Managed Exchange-Traded Commodity Fund Trust Formerly: Director and Vice President, Van Kampen Advisors Inc.; Director, Vice President, Secretary and General Counsel, Van Kampen Investor Services Inc.; Director, Invesco Distributors, Inc. (formerly known as Invesco Aim Distributors, Inc.); Director, Senior Vice President, General Counsel and Secretary, Invesco Aim Advisers, Inc. and Van Kampen Investments Inc.; Director, Vice President and Secretary, Fund Management Company; Director, Senior Vice President, Secretary, General Counsel and Vice President, Invesco Aim Capital Management, Inc.; Chief Operating Officer and General Counsel, Liberty Ridge Capital, Inc. (an investment adviser); Vice President and Secretary, PBHG Funds (an investment company) and PBHG Insurance Series Fund (an investment company); Chief Operating Officer, General Counsel and Secretary, Old Mutual Investment Partners (a broker-dealer); General Counsel and Secretary, Old Mutual Fund Services (an administrator) and Old Mutual Shareholder Services (a shareholder servicing center); Executive Vice President, General Counsel and Secretary, Old Mutual Capital, Inc. (an investment adviser); and Vice President and Secretary, Old Mutual Advisors Funds (an investment company) | | N/A | | N/A |
Sheri Morris — 1964 Vice President, Treasurer and Principal Financial Officer | | 1999 | | Vice President, Treasurer and Principal Financial Officer, The Invesco Funds; Vice President, Invesco Advisers, Inc. (formerly known as Invesco Institutional (N.A.), Inc.) (registered investment adviser); and Vice President, PowerShares Exchange-Traded Fund Trust, PowerShares Exchange-Traded Fund Trust II, PowerShares India Exchange-Traded Fund Trust, PowerShares Actively Managed Exchange-Traded Fund Trust, and PowerShares Actively Managed Exchange-Traded Commodity Fund Trust Formerly: Vice President, Invesco Aim Advisers, Inc., Invesco Aim Capital Management, Inc. and Invesco Aim Private Asset Management, Inc.; Assistant Vice President and Assistant Treasurer, The Invesco Funds and Assistant Vice President, Invesco Advisers, Inc., Invesco Aim Capital Management, Inc. and Invesco Aim Private Asset Management, Inc.; and Treasurer, PowerShares Exchange-Traded Fund Trust, PowerShares Exchange-Traded Fund Trust II, PowerShares India Exchange-Traded Fund Trust and PowerShares Actively Managed Exchange-Traded Fund Trust | | N/A | | N/A |
T-3 Invesco Unconstrained Bond Fund
Trustees and Officers—(continued)
| | | | | | | | |
Name, Year of Birth and Position(s) Held with the Trust | | Trustee and/
or Officer Since | | Principal Occupation(s) During Past 5 Years | | Number of Funds in Fund Complex Overseen by Trustee | | Other Directorship(s) Held by Trustee During Past 5 Years |
| Other Officers—(continued) | | | | | | | | |
Karen Dunn Kelley — 1960 Vice President | | 2004 | | Senior Managing Director, Investments; Director, Co-President, Co-Chief Executive Officer, and Co-Chairman, Invesco Advisers, Inc. (formerly known as Invesco Institutional (N.A.), Inc.) (registered investment adviser); Chairman, Invesco Senior Secured Management, Inc.; Senior Vice President, Invesco Management Group, Inc. (formerly known as Invesco Aim Management Group, Inc.); Executive Vice President, Invesco Distributors, Inc. (formerly known as Invesco Aim Distributors, Inc.); Director, Invesco Mortgage Capital Inc. and Invesco Management Company Limited; Director and President, INVESCO Asset Management (Bermuda) Ltd., Vice President, The Invesco Funds (other than AIM Treasurer’s Series Trust (Invesco Treasurer’s Series Trust) and Short-Term Investments Trust); and President and Principal Executive Officer, The Invesco Funds (AIM Treasurer’s Series Trust (Invesco Treasurer’s Series Trust) and Short-Term Investments Trust only) Formerly: Director, INVESCO Global Asset Management Limited and INVESCO Management S.A.; Senior Vice President, Van Kampen Investments Inc. and Invesco Advisers, Inc. (formerly known as Invesco Institutional (N.A.), Inc.) (registered investment adviser); Vice President, Invesco Advisers, Inc. (formerly known as Invesco Institutional (N.A.), Inc.); Director of Cash Management and Senior Vice President, Invesco Advisers, Inc. and Invesco Aim Capital Management, Inc.; Director and President, Fund Management Company; Chief Cash Management Officer, Director of Cash Management, Senior Vice President, and Managing Director, Invesco Aim Capital Management, Inc.; Director of Cash Management, Senior Vice President, and Vice President, Invesco Advisers, Inc. and The Invesco Funds (AIM Treasurer’s Series Trust (Invesco Treasurer’s Series Trust), and Short-Term Investments Trust only) | | N/A | | N/A |
Crissie M. Wisdom — 1969 Anti-Money Laundering Compliance Officer | | 2013 | | Anti-Money Laundering Compliance Officer, Invesco Advisers, Inc. (formerly known as Invesco Institutional (N.A.), Inc.) (registered investment adviser), Invesco Capital Markets, Inc. (formerly known as Van Kampen Funds Inc.), Invesco Distributors, Inc., Invesco Investment Services, Inc., Invesco Management Group, Inc., Van Kampen Exchange Corp., The Invesco Funds, and PowerShares Exchange-Traded Fund Trust, PowerShares Exchange-Traded Fund Trust II, PowerShares India Exchange-Traded Fund Trust, PowerShares Actively Managed Exchange-Traded Fund Trust and PowerShares Actively Managed Exchange-Traded Commodity Fund Trust; and Fraud Prevention Manager and Controls and Risk Analysis Manager for Invesco Investment Services, Inc. | | N/A | | N/A |
Todd L. Spillane — 1958 Chief Compliance Officer | | 2006 | | Senior Vice President, Invesco Management Group, Inc. (formerly known as Invesco Aim Management Group, Inc.) and Van Kampen Exchange Corp.; Senior Vice President and Chief Compliance Officer, Invesco Advisers, Inc. (registered investment adviser) (formerly known as Invesco Institutional (N.A.), Inc.); Chief Compliance Officer, The Invesco Funds; Vice President, Invesco Distributors, Inc. (formerly known as Invesco Aim Distributors, Inc.) and Invesco Investment Services, Inc. (formerly known as Invesco Aim Investment Services, Inc.) Formerly: Chief Compliance Officer, Invesco Funds (Chicago); Senior Vice President, Van Kampen Investments Inc.; Senior Vice President and Chief Compliance Officer, Invesco Aim Advisers, Inc. and Invesco Aim Capital Management, Inc.; Chief Compliance Officer, INVESCO Private Capital Investments, Inc. (holding company), Invesco Private Capital, Inc. (registered investment adviser), Invesco Global Asset Management (N.A.), Inc., Invesco Senior Secured Management, Inc. (registered investment adviser), Van Kampen Investor Services Inc., PowerShares Exchange-Traded Fund Trust, PowerShares Exchange-Traded Fund Trust II, PowerShares India Exchange-Traded Fund Trust and PowerShares Actively Managed Exchange-Traded Fund Trust; and Vice President, Invesco Aim Capital Management, Inc. and Fund Management Company | | N/A | | N/A |
The Statement of Additional Information of the Trust includes additional information about the Fund’s Trustees and is available upon request, without charge, by calling 1.800.959.4246. Please refer to the Fund’s prospectus for information on the Fund’s sub-advisers.
| | | | | | |
Office of the Fund 11 Greenway Plaza, Suite 1000 Houston, TX 77046-1173 | | Investment Adviser Invesco Advisers, Inc. 1555 Peachtree Street, N.E. Atlanta, GA 30309 | | Distributor Invesco Distributors, Inc. 11 Greenway Plaza, Suite 1000 Houston, TX 77046-1173 | | Auditors PricewaterhouseCoopers LLP 1000 Louisiana Street, Suite 5800 Houston, TX 77002-5678 |
| | | |
| | | | | | |
Counsel to the Fund Stradley Ronon Stevens & Young, LLP 2005 Market Street, Suite 2600 Philadelphia, PA 19103-7018 | | Counsel to the Independent Trustees Goodwin Procter LLP 901 New York Avenue, N.W. Washington, D.C. 20001 | | Transfer Agent Invesco Investment Services, Inc. 11 Greenway Plaza, Suite 1000 Houston, TX 77046-1173 | | Custodian State Street Bank and Trust Company 225 Franklin Street Boston, MA 02110-2801 |
T-4 Invesco Unconstrained Bond Fund

Invesco mailing information
Send general correspondence to Invesco Investment Services, Inc., P.O. Box 219078, Kansas City, MO 64121-9078.
Important notice regarding delivery of security holder documents
To reduce Fund expenses, only one copy of most shareholder documents may be mailed to shareholders with multiple accounts at the same address (Householding). Mailing of your shareholder documents may be householded indefinitely unless you instruct us otherwise. If you do not want the mailing of these documents to be combined with those for other members of your household, please contact Invesco Investment Services, Inc. at 800 959 4246 or contact your financial institution. We will begin sending you individual copies for each account within 30 days after receiving your request.
Fund holdings and proxy voting information
The Fund provides a complete list of its holdings four times in each fiscal year, at the quarter ends. For the second and fourth quarters, the lists appear in the Fund’s semiannual and annual reports to shareholders. For the first and third quarters, the Fund files the lists with the Securities and Exchange Commission (SEC) on Form N-Q. The most recent list of portfolio holdings is available at invesco.com/completeqtrholdings. Shareholders can also look up the Fund’s Forms N-Q on the SEC website at sec.gov. Copies of the Fund’s Forms N-Q may be reviewed and copied at the SEC Public Reference Room in Washington, D.C. You can obtain information on the operation of the Public Reference Room, including information about duplicating fee charges, by calling 202 551 8090 or 800 732 0330, or by electronic request at the following email address: publicinfo@sec.gov. The SEC file numbers for the Fund are shown below.
A description of the policies and procedures that the Fund uses to determine how to vote proxies relating to portfolio securities is available without charge, upon request, from our Client Services department at 800 959 4246 or at invesco.com/proxyguidelines. The information is also available on the SEC website, sec.gov.
| | |
Information regarding how the Fund voted proxies related to its portfolio securities during the most recent 12-month period ended June 30 is available at invesco.com/proxysearch. The information is also available on the SEC website, sec.gov. Invesco Advisers, Inc. is an investment adviser; it provides investment advisory services to individual and institutional clients and does not sell securities. Invesco Distributors, Inc. is the US distributor for Invesco Ltd.’s retail mutual funds, exchange-traded funds and institutional money market funds. Both are wholly owned, indirect subsidiaries of Invesco Ltd. | |  |
| | | | |
| SEC file numbers: 811-05426 and 033-19338 | | UCB-AR-1 | | Invesco Distributors, Inc. |
There were no amendments to the Code of Ethics (the “Code”) that applies to the Registrant’s Principal Executive Officer (“PEO”) and Principal Financial Officer (“PFO”) during the period covered by the report. The Registrant did not grant any waivers, including implicit waivers, from any provisions of the Code to the PEO or PFO during the period covered by this report.
| ITEM 3. | AUDIT COMMITTEE FINANCIAL EXPERT. |
The Board of Trustees has determined that the Registrant has at least one audit committee financial expert serving on its Audit Committee. The Audit Committee financial expert is Raymond Stickel, Jr. Mr. Stickel is “independent” within the meaning of that term as used in Form N-CSR.
| ITEM 4. | PRINCIPAL ACCOUNTANT FEES AND SERVICES. |
(a) to (d)
Fees Billed by PWC Related to the Registrant
PWC billed the Registrant aggregate fees for services rendered to the Registrant for the last two fiscal years as follows:
| | | | | | | | | | | | | | | | |
| | | Fees Billed for
Services Rendered to
the Registrant for
fiscal year end 2014 | | | (e)(2)
Percentage of Fees
Billed Applicable to
Non-Audit Services
Provided for fiscal
year end 2014
Pursuant to Waiver of
Pre-Approval
Requirement(1) | | | Fees Billed for
Services Rendered to
the Registrant for
fiscal year end 2013 | | | (e)(2)
Percentage of Fees
Billed Applicable to
Non-Audit Services
Provided for fiscal
year end 2013
Pursuant to Waiver of
Pre-Approval
Requirement(1) | |
Audit Fees | | $ | 892,000 | | | | N/A | | | $ | 473,785 | | | | N/A | |
Audit-Related Fees(2) | | $ | 0 | | | | 0 | % | | $ | 15,485 | | | | 0 | % |
Tax Fees(3) | | $ | 298,893 | | | | 0 | % | | $ | 145,748 | | | | 0 | % |
All Other Fees | | $ | 0 | | | | 0 | % | | $ | 0 | | | | 0 | % |
| | | | | | | | | | | | | | | | |
Total Fees | | $ | 1,190,893 | | | | 0 | % | | $ | 635,018 | | | | 0 | % |
(g) PWC billed the Registrant aggregate non-audit fees of $298,893 for the fiscal year ended 2014, and $161,233 for the fiscal year ended 2013, for non-audit services rendered to the Registrant.
| (1) | With respect to the provision of non-audit services, the pre-approval requirement is waived pursuant to a de minimis exception if (i) such services were not recognized as non-audit services by the Registrant at the time of engagement, (ii) the aggregate amount of all such services provided is no more than 5% of the aggregate audit and non-audit fees paid by the Registrant to PWC during a fiscal year; and (iii) such services are promptly brought to the attention of the Registrant’s Audit Committee and approved by the Registrant’s Audit Committee prior to the completion of the audit. |
| (2) | Audit-Related fees for the fiscal year end 2013 include fees billed for agreed upon procedures related to regulatory filings. |
| (3) | Tax fees for the fiscal year end 2014 include fees billed for reviewing tax returns. Tax fees for the fiscal year end 2013 includes fees billed for reviewing tax returns and consultation services. |
Fees Billed by PWC Related to Invesco and Invesco Affiliates
PWC billed Invesco Advisers, Inc. (“Invesco”), the Registrant’s adviser, and any entity controlling, controlled by or under common control with Invesco that provides ongoing services to the Registrant (“Invesco Affiliates”) aggregate fees for pre-approved non-audit services rendered to Invesco and Invesco Affiliates for the last two fiscal years as follows:
| | | | | | | | | | | | | | | | |
| | | Fees Billed for Non-
Audit Services
Rendered to Invesco
and Invesco Affiliates
for fiscal year end
2014 That Were
Required
to be Pre-Approved
by the Registrant’s
Audit Committee | | | (e)(2)
Percentage of Fees
Billed Applicable to
Non-Audit Services
Provided for fiscal year
end 2014 Pursuant to
Waiver of Pre-
Approval
Requirement(1) | | | Fees Billed for Non-
Audit Services
Rendered to Invesco
and Invesco Affiliates
for fiscal year end
2013 That Were
Required
to be Pre-Approved
by the Registrant’s
Audit Committee | | | (e)(2)
Percentage of Fees
Billed Applicable to
Non-Audit Services
Provided for fiscal year
end 2013 Pursuant to
Waiver of Pre-
Approval
Requirement(1) | |
Audit-Related Fees | | $ | 574,000 | | | | 0 | % | | $ | 574,000 | | | | 0 | % |
Tax Fees | | $ | 0 | | | | 0 | % | | $ | 0 | | | | 0 | % |
All Other Fees | | $ | 0 | | | | 0 | % | | $ | 0 | | | | 0 | % |
| | | | | | | | | | | | | | | | |
Total Fees(2) | | $ | 574,000 | | | | 0 | % | | $ | 574,000 | | | | 0 | % |
| (1) | With respect to the provision of non-audit services, the pre-approval requirement is waived pursuant to a de minimis exception if (i) such services were not recognized as non-audit services by the Registrant at the time of engagement, (ii) the aggregate amount of all such services provided is no more than 5% of the aggregate audit and non-audit fees paid by the Registrant, Invesco and Invesco Affiliates to PWC during a fiscal year; and (iii) such services are promptly brought to the attention of the Registrant’s Audit Committee and approved by the Registrant’s Audit Committee prior to the completion of the audit. |
| (2) | Audit-Related fees for the year end 2014 include fees billed related to reviewing controls at a service organization. |
(g) Including the fees for services not required to be pre-approved by the registrant’s audit committee, PWC billed Invesco and Invesco Affiliates aggregate non-audit fees of $2,939,346 for the fiscal year ended 2014, and $1,248,475 for the fiscal year ended 2013, for non-audit services rendered to Invesco and Invesco Affiliates.
(h) The Audit Committee also has considered whether the provision of non-audit services that were rendered to Invesco and Invesco Affiliates that were not required to be pre-approved pursuant to SEC regulations, if any, is compatible with maintaining PWC’s independence. To the extent that such services were provided, the Audit Committee determined that the provision of such services is compatible with PWC maintaining independence with respect to the Registrant.
(f) Not applicable.
(e)(1)
PRE-APPROVAL OF AUDIT AND NON-AUDIT SERVICES
POLICIES AND PROCEDURES
As adopted by the Audit Committees of
the Invesco Funds (the “Funds”)
Last Amended May 4, 2010
Statement of Principles
Under the Sarbanes-Oxley Act of 2002 and rules adopted by the Securities and Exchange Commission (“SEC”) (“Rules”), the Audit Committees of the Funds’ (the “Audit Committees”) Board of Trustees (the “Board”) are responsible for the appointment, compensation and oversight of the work of independent accountants (an “Auditor”). As part of this responsibility and to assure that the Auditor’s independence is not impaired, the Audit Committees pre-approve the audit and non-audit services provided to the Funds by each Auditor, as well as all non-audit services provided by the Auditor to the Funds’ investment adviser and to affiliates of the adviser that provide ongoing services to the Funds (“Service Affiliates”) if the services directly impact the Funds’ operations or financial reporting. The SEC Rules also specify the types of services that an Auditor may not provide to its audit client. The following policies and procedures comply with the requirements for pre-approval and provide a mechanism by which management of the Funds may request and secure pre-approval of audit and non-audit services in an orderly manner with minimal disruption to normal business operations.
Proposed services either may be pre-approved without consideration of specific case-by-case services by the Audit Committees (“general pre-approval”) or require the specific pre-approval of the Audit Committees (“specific pre-approval”). As set forth in these policies and procedures, unless a type of service has received general pre-approval, it will require specific pre-approval by the Audit Committees. Additionally, any fees exceeding 110% of estimated pre-approved fee levels provided at the time the service was pre-approved will also require specific approval by the Audit Committees before payment is made. The Audit Committees will also consider the impact of additional fees on the Auditor’s independence when determining whether to approve any additional fees for previously pre-approved services.
The Audit Committees will annually review and generally pre-approve the services that may be provided by each Auditor without obtaining specific pre-approval from the Audit Committee generally on an annual basis. The term of any general pre-approval runs from the date of such pre-approval through September 30th of the following year, unless the Audit Committees consider a different period and state otherwise. The Audit Committees will add to or subtract from the list of general pre-approved services from time to time, based on subsequent determinations.
The purpose of these policies and procedures is to set forth the guidelines to assist the Audit Committees in fulfilling their responsibilities.
Delegation
The Audit Committees may from time to time delegate pre-approval authority to one or more of its members who are Independent Trustees. All decisions to pre-approve a service by a delegated member shall be reported to the Audit Committees at the next quarterly meeting.
Audit Services
The annual audit services engagement terms will be subject to specific pre-approval of the Audit Committees. Audit services include the annual financial statement audit and other procedures such as tax provision work that is required to be performed by the independent auditor to be able to form an opinion on the Funds’ financial statements. The Audit Committees will obtain, review and consider sufficient information concerning the proposed Auditor to make a reasonable evaluation of the Auditor’s qualifications and independence.
In addition to the annual Audit services engagement, the Audit Committees may grant either general or specific pre-approval of other audit services, which are those services that only the independent auditor reasonably can provide. Other Audit services may include services such as issuing consents for the inclusion of audited financial statements with SEC registration statements, periodic reports and other documents filed with the SEC or other documents issued in connection with securities offerings.
Non-Audit Services
The Audit Committees may provide either general or specific pre-approval of any non-audit services to the Funds and its Service Affiliates if the Audit Committees believe that the provision of the service will not impair the independence of the Auditor, is consistent with the SEC’s Rules on auditor independence, and otherwise conforms to the Audit Committees’ general principles and policies as set forth herein.
Audit-Related Services
“Audit-related services” are assurance and related services that are reasonably related to the performance of the audit or review of the Fund’s financial statements or that are traditionally performed by the independent auditor. Audit-related services include, among others, accounting consultations related to accounting, financial reporting or disclosure matters not classified as “Audit services”; assistance with understanding and implementing new accounting and financial reporting guidance from rulemaking authorities; and agreed-upon procedures related to mergers, compliance with ratings agency requirements and interfund lending activities.
Tax Services
“Tax services” include, but are not limited to, the review and signing of the Funds’ federal tax returns, the review of required distributions by the Funds and consultations regarding tax matters such as the tax treatment of new investments or the impact of new regulations. The Audit Committees will scrutinize carefully the retention of the Auditor in connection with a transaction initially recommended by the Auditor, the major business purpose of which may be tax avoidance or the tax treatment of which may not be supported in the Internal Revenue Code and related regulations. The Audit Committees will consult with the Funds’ Treasurer (or his or her designee) and may consult with outside counsel or advisors as necessary to ensure the consistency of Tax services rendered by the Auditor with the foregoing policy.
No Auditor shall represent any Fund or any Service Affiliate before a tax court, district court or federal court of claims.
Under rules adopted by the Public Company Accounting Oversight Board and approved by the SEC, in connection with seeking Audit Committees’ pre-approval of permissible Tax services, the Auditor shall:
| | 1. | Describe in writing to the Audit Committees, which writing may be in the form of the proposed engagement letter: |
| | a. | The scope of the service, the fee structure for the engagement, and any side letter or amendment to the engagement letter, or any other agreement between the Auditor and the Fund, relating to the service; and |
| | b. | Any compensation arrangement or other agreement, such as a referral agreement, a referral fee or fee-sharing arrangement, between the Auditor and any person (other than the Fund) with respect to the promoting, marketing, or recommending of a transaction covered by the service; |
| | 2. | Discuss with the Audit Committees the potential effects of the services on the independence of the Auditor; and |
| | 3. | Document the substance of its discussion with the Audit Committees. |
All Other Auditor Services
The Audit Committees may pre-approve non-audit services classified as “All other services” that are not categorically prohibited by the SEC, as listed in Exhibit 1 to this policy.
Pre-Approval Fee Levels or Established Amounts
Pre-approval of estimated fees or established amounts for services to be provided by the Auditor under general or specific pre-approval policies will be set periodically by the Audit Committees. Any proposed fees exceeding 110% of the maximum estimated pre-approved fees or established amounts for pre-approved audit and non-audit services will be reported to the Audit Committees at the quarterly Audit Committees meeting and will require specific approval by the Audit Committees before payment is made. The Audit Committees will always factor in the overall relationship of fees for audit and non-audit services in determining whether to pre-approve any such services and in determining whether to approve any additional fees exceeding 110% of the maximum pre-approved fees or established amounts for previously pre-approved services.
Procedures
Generally on an annual basis, Invesco Advisers, Inc. (“Invesco”) will submit to the Audit Committees for general pre-approval, a list of non-audit services that the Funds or Service Affiliates of the Funds may request from the Auditor. The list will describe the non-audit services in reasonable detail and will include an estimated range of fees and such other information as the Audit Committee may request.
Each request for services to be provided by the Auditor under the general pre-approval of the Audit Committees will be submitted to the Funds’ Treasurer (or his or her designee) and must include a detailed description of the services to be rendered. The Treasurer or his or her designee will ensure that such services are included within the list of services that have received the general pre-approval of the Audit Committees. The Audit Committees will be informed at the next quarterly scheduled Audit Committees meeting of any such services for which the Auditor rendered an invoice and whether such services and fees had been pre-approved and if so, by what means.
Each request to provide services that require specific approval by the Audit Committees shall be submitted to the Audit Committees jointly by the Fund’s Treasurer or his or her designee and the Auditor, and must include a joint statement that, in their view, such request is consistent with the policies and procedures and the SEC Rules.
Each request to provide tax services under either the general or specific pre-approval of the Audit Committees will describe in writing: (i) the scope of the service, the fee structure for the engagement, and any side letter or amendment to the engagement letter, or any other agreement between the Auditor and the audit client, relating to the service; and (ii) any compensation arrangement or other agreement between the Auditor and any person (other than the audit client) with respect to the promoting, marketing, or recommending of a transaction covered by the service. The Auditor will discuss with the Audit Committees the potential effects of the services on the Auditor’s independence and will document the substance of the discussion.
Non-audit services pursuant to the de minimis exception provided by the SEC Rules will be promptly brought to the attention of the Audit Committees for approval, including documentation that each of the conditions for this exception, as set forth in the SEC Rules, has been satisfied.
On at least an annual basis, the Auditor will prepare a summary of all the services provided to any entity in the investment company complex as defined in section 2-01(f)(14) of Regulation S-X in sufficient detail as to the nature of the engagement and the fees associated with those services.
The Audit Committees have designated the Funds’ Treasurer to monitor the performance of all services provided by the Auditor and to ensure such services are in compliance with these policies and procedures. The Funds’ Treasurer will report to the Audit Committees on a periodic basis as to the results of such monitoring. Both the Funds’ Treasurer and management of Invesco will immediately report to the chairman of the Audit Committees any breach of these policies and procedures that comes to the attention of the Funds’ Treasurer or senior management of Invesco.
Exhibit 1 to Pre-Approval of Audit and Non-Audit Services Policies and Procedures
Conditionally Prohibited Non-Audit Services (not prohibited if the Fund can reasonably conclude that the results of the service would not be subject to audit procedures in connection with the audit of the Fund’s financial statements)
| | • | | Bookkeeping or other services related to the accounting records or financial statements of the audit client |
| | • | | Financial information systems design and implementation |
| | • | | Appraisal or valuation services, fairness opinions, or contribution-in-kind reports |
| | • | | Internal audit outsourcing services |
Categorically Prohibited Non-Audit Services
| | • | | Broker-dealer, investment adviser, or investment banking services |
| | • | | Expert services unrelated to the audit |
| | • | | Any service or product provided for a contingent fee or a commission |
| | • | | Services related to marketing, planning, or opining in favor of the tax treatment of confidential transactions or aggressive tax position transactions, a significant purpose of which is tax avoidance |
| | • | | Tax services for persons in financial reporting oversight roles at the Fund |
| | • | | Any other service that the Public Company Oversight Board determines by regulation is impermissible. |
| ITEM 5. | AUDIT COMMITTEE OF LISTED REGISTRANTS. |
Not applicable.
| ITEM 6. | SCHEDULE OF INVESTMENTS. |
Investments in securities of unaffiliated issuers is included as part of the reports to stockholders filed under Item 1 of this Form.
| ITEM 7. | DISCLOSURE OF PROXY VOTING POLICIES AND PROCEDURES FOR CLOSED-END MANAGEMENT INVESTMENT COMPANIES. |
Not applicable.
| ITEM 8. | PORTFOLIO MANAGERS OF CLOSED-END MANAGEMENT COMPANIES. |
Not applicable.
| ITEM 9. | PURCHASES OF EQUITY SECURITIES BY CLOSED-END MANAGEMENT INVESTMENT COMPANY AND AFFILIATED PURCHASERS. |
Not applicable.
| ITEM 10. | SUBMISSION OF MATTERS TO A VOTE OF SECURITY HOLDERS. |
None
| ITEM 11. | CONTROLS AND PROCEDURES. |
| (a) | As of November 21, 2014, an evaluation was performed under the supervision and with the participation of the officers of the Registrant, including the PEO and PFO, to assess the effectiveness of the Registrant’s disclosure controls and procedures, as that term is defined in Rule 30a-3(c) under the Investment Company Act of 1940 (the “Act”), as amended. Based on that evaluation, the Registrant’s officers, including the PEO and PFO, concluded that, as of November 21, 2014, the Registrant’s disclosure controls and procedures were reasonably designed to ensure: (1) that information required to be disclosed by the Registrant on Form N-CSR is recorded, processed, summarized and reported within the time periods specified by the rules and forms of the Securities and Exchange Commission; and (2) that material information relating to the Registrant is made known to the PEO and PFO as appropriate to allow timely decisions regarding required disclosure. |
| (b) | There have been no changes in the Registrant’s internal control over financial reporting (as defined in Rule 30a-3(d) under the Act) that occurred during the second fiscal quarter of the period covered by this report that have materially affected, or are reasonably likely to materially affect, the Registrant’s internal control over financial reporting. |
| | |
| |
| 12(a) (1) | | Code of Ethics. |
| |
| 12(a) (2) | | Certifications of principal executive officer and principal financial officer as required by Rule 30a-2(a) under the Investment Company Act of 1940. |
| |
| 12(a) (3) | | Not applicable. |
| |
| 12(b) | | Certifications of principal executive officer and principal financial officer as required by Rule 30a-2(b) under the Investment Company Act of 1940. |
SIGNATURES
Pursuant to the requirements of the Securities Exchange Act of 1934 and the Investment Company Act of 1940, the Registrant has duly caused this report to be signed on its behalf by the undersigned, thereunto duly authorized.
Registrant: AIM Investment Funds (Invesco Investment Funds)
| | |
| By: | | /s/ Philip A. Taylor |
| | Philip A. Taylor |
| | Principal Executive Officer |
| |
| Date: | | January 9, 2015 |
Pursuant to the requirements of the Securities and Exchange Act of 1934 and the Investment Company Act of 1940, this report has been signed below by the following persons on behalf of the Registrant and in the capacities and on the dates indicated.
| | |
| By: | | /s/ Philip A. Taylor |
| | Philip A. Taylor |
| | Principal Executive Officer |
| |
| Date: | | January 9, 2015 |
| | |
| By: | | /s/ Sheri Morris |
| | Sheri Morris |
| | Principal Financial Officer |
| |
| Date: | | January 9, 2015 |
EXHIBIT INDEX
| | |
| 12(a) (1) | | Code of Ethics. |
| |
| 12(a) (2) | | Certifications of principal executive officer and principal financial officer as required by Rule 30a-2(a) under the Investment Company Act of 1940. |
| |
| 12(a) (3) | | Not applicable. |
| |
| 12(b) | | Certifications of principal executive officer and principal financial officer as required by Rule 30a-2(b) under the Investment Company Act of 1940. |