|
OMB APPROVAL |
OMB Number: 3235-0570 Expires: January 31, 2017 Estimated average burden hours per response: 20.6 |
UNITED STATES
SECURITIES AND EXCHANGE COMMISSION
Washington, D.C. 20549
FORM N-CSR
CERTIFIED SHAREHOLDER REPORT OF REGISTERED
MANAGEMENT INVESTMENT COMPANIES
| | |
| Investment Company Act file number | | 811-05426 |
| | |
|
| AIM Investment Funds (Invesco Investment Funds)* |
| (Exact name of registrant as specified in charter) |
|
| 11 Greenway Plaza, Suite 1000 Houston, Texas 77046 |
| (Address of principal executive offices) (Zip code) |
|
| Philip A. Taylor 11 Greenway Plaza, Suite 1000 Houston, Texas 77046 |
| (Name and address of agent for service) |
| | | | | | |
| Registrant’s telephone number, including area code: (713) 626-1919 |
| | | | |
| | |
| Date of fiscal year end: | | 10/31 | | |
| | |
| Date of reporting period: | | 10/31/15 | | |
*Funds included are: Invesco All Cap Market Neutral Fund, Invesco Balanced-Risk Allocation Fund, Invesco Balanced-Risk Commodity Strategy Fund, Invesco Developing Markets Fund, Invesco Emerging Market Local Currency Debt Fund, Invesco Emerging Markets Equity Fund, Invesco Endeavor Fund, Invesco Global Health Care Fund, Invesco Global Infrastructure Fund, Invesco Global Market Neutral Fund, Invesco Global Markets Strategy Fund, Invesco Global Targeted Returns Fund, Invesco Greater China Fund, Invesco International Total Return Fund, Invesco Long/Short Equity Fund, Invesco Low Volatility Emerging Markets Fund, Invesco Macro International Equity Fund, Invesco Macro Long/Short Fund, Invesco MLP Fund, Invesco Pacific Growth Fund, Invesco Premium Income Fund and Invesco Select Companies Fund.
Item 1. Report to Stockholders.
| | | | |
| | |
 | | Annual Report to Shareholders | | October 31, 2015 |
| | |
| | Invesco All Cap Market Neutral Fund |
| | Nasdaq: |
| | A: CPNAX n C: CPNCX n R: CPNRX n Y: CPNYX n R5: CPNFX n R6: CPNSX |

Letters to Shareholders
| | |

Philip Taylor | | Dear Shareholders: This annual report includes information about your Fund, including performance data and a complete list of its investments as of the close of the reporting period. Inside is a discussion of how your Fund was managed and the factors that affected its performance during the reporting period. I hope you find this report of interest. The US economy expanded and unemployment declined throughout the reporting period. Continuing low energy prices benefited consumers, but a strong US dollar crimped corporate profits. The US Federal Reserve signaled that it was increasingly likely to raise interest rates, based on generally positive economic data, but uncertainty remained about when it might act. Overseas, the story was much different. Low energy prices hurt the economies of some oil-producing nations, such as Brazil and Russia. During the reporting period, the European |
| Central Bank as well as central banks in China and Japan – among other countries – either instituted or maintained extraordinarily accommodative monetary policies in response to economic weakness. |
Investor uncertainty, such as we saw for much of the reporting period – and market volatility, such as we saw at the end of the reporting period – are unfortunate facts of life when it comes to investing. Some investors use these things as excuses to delay saving and investing for their long-term financial goals. That’s why Invesco encourages investors to work with a professional financial adviser who can stress the importance of starting to save and invest early and the importance of adhering to a disciplined investment plan – when times are good and when they’re uncertain. A financial adviser who knows your unique financial situation, investment goals and risk tolerance can be an invaluable partner as you seek to achieve your financial goals. He or she can offer a long-term perspective when markets are volatile and time-tested advice and guidance when your financial situation or investment goals change.
Timely information when and where you want it
Invesco’s efforts to help investors achieve their financial objectives include providing individual investors and financial professionals with timely information about the markets, the economy and investing – whenever and wherever they want it.
Our website, invesco.com/us, offers a wide range of market insights and investment perspectives. On the website, you’ll find detailed information about our funds, including prices, performance, holdings and portfolio manager commentaries. You can access information about your account by completing a simple, secure online registration. Click on the “Need to register” link in the “Account Access” box on our homepage to get started.
Invesco’s mobile apps for iPhone® and iPad® (both available free from the App StoreSM) allow you to obtain the same detailed information, monitor your account and create customizable watch lists. Also, they allow you to access investment insights from our investment leaders, market strategists, economists and retirement experts. You can sign up to be alerted when new commentary is added, and you can watch portfolio manager videos and have instant access to Invesco news and updates wherever you may be.
In addition to the resources accessible on our website and through our mobile app, you can obtain timely updates to help you stay informed about the markets, the economy and investing by connecting with Invesco on Twitter, LinkedIn or Facebook. You can access our blog at blog.invesco.us.com. Our goal is to provide you the information you want, when and where you want it.
Have questions?
For questions about your account, feel free to contact an Invesco client services representative at 800 959 4246. For Invesco-related questions or comments, please email me directly at phil@invesco.com.
All of us at Invesco look forward to serving your investment management needs for many years to come. Thank you for investing with us.
Sincerely,

Philip Taylor
Senior Managing Director, Invesco Ltd.
iPhone and iPad are trademarks of Apple Inc., registered in the US and other countries. App Store is a service mark of Apple Inc. Invesco Distributors, Inc. is not affiliated with Apple Inc.
2 Invesco All Cap Market Neutral Fund
| | |

Bruce Crockett | | Dear Fellow Shareholders: Among the many important lessons I’ve learned in more than 40 years in a variety of business endeavors is the value of a trusted advocate. As independent chair of the Invesco Funds Board, I can assure you that the members of the Board are strong advocates for the interests of investors in Invesco’s mutual funds. We work hard to represent your interests through oversight of the quality of the investment management services your funds receive and other matters important to your investment, including but not limited to: n Ensuring that Invesco offers a diverse lineup of mutual funds that your financial adviser can use to strive to meet your financial needs as your investment goals change over time. n Monitoring how the portfolio management teams of the Invesco funds are performing in light of changing economic and market conditions. |
| n | | Assessing each portfolio management team’s investment performance within the context of the investment strategy described in the fund’s prospectus. |
| n | | Monitoring for potential conflicts of interests that may impact the nature of the services that your funds receive. |
We believe one of the most important services we provide our fund shareholders is the annual review of the funds’ advisory and sub-advisory contracts with Invesco Advisers and its affiliates. This review is required by the Investment Company Act of 1940 and focuses on the nature and quality of the services Invesco provides as the adviser to the Invesco funds and the reasonableness of the fees that it charges for those services. Each year, we spend months carefully reviewing information received from Invesco and a variety of independent sources, such as performance and fee data prepared by Lipper Inc., an independent, third-party firm widely recognized as a leader in its field. We also meet with our independent legal counsel and other independent advisers to review and help us assess the information that we have received. Our goal is to assure that you receive quality investment management services for a reasonable fee.
I trust the measures outlined above provide assurance that you have a worthy advocate when it comes to choosing the Invesco Funds.
As always, please contact me at bruce@brucecrockett.com with any questions or concerns you may have. On behalf of the Board, we look forward to continuing to represent your interests and serving your needs.
Sincerely,

Bruce L. Crockett
Independent Chair
Invesco Funds Board of Trustees
3 Invesco All Cap Market Neutral Fund
Management’s Discussion of Fund Performance
Performance summary
For the fiscal year ended October 31, 2015, Invesco All Cap Market Neutral Fund (the Fund), at net asset value (NAV), outperformed the Citigroup 90-Day Treasury Bill Index, the Fund’s broad market/style-specific benchmark.
Your Fund’s long-term performance appears later in this report.
Fund vs. Indexes
Total returns, 10/31/14 to 10/31/15, at net asset value (NAV). Performance shown does not include applicable contingent deferred sales charges (CDSC) or front-end sales charges, which would have reduced performance.
| | | | |
Class A Shares | | | 11.40 | % |
Class C Shares | | | 10.53 | |
Class R Shares | | | 11.05 | |
Class Y Shares | | | 11.66 | |
Class R5 Shares | | | 11.75 | |
Class R6 Shares | | | 11.66 | |
Citigroup 90-Day Treasury Bill Indexq (Broad Market/Style-Specific Index) | | | 0.02 | |
| Lipper Alternative Equity Market Neutral Indexn (Peer Group Index) | | | -1.72 | |
Source(s): qFactSet Research Systems Inc.; nLipper Inc.
Market conditions and your Fund
For the first half of the fiscal year ended October 31, 2015, US equity markets delivered positive returns as a strong domestic economy and successful exit from the US Federal Reserve’s (the Fed) quantitative easing made for an attractive investment backdrop. During the second half of the reporting period, equity markets cooled, given macroeconomic distractions. Market-moving headlines during the fiscal year included the rapid decline in oil prices, the strengthening US dollar given the potential for higher interest rates in the US, and slowing economic growth in China, which
had negative implications for growth globally. Toward the end of the fiscal year, the Fed’s continued delay on raising interest rates increased investor uncertainty and market volatility.
Despite solid economic growth in the US, the performance of individual economic sectors varied dramatically during the fiscal year. The information technology (IT) sector performed well, especially the Internet software and services industry. The consumer discretionary sector also performed well, led by retail and consumer services industries (such as entertainment, restaurants and leisure). This was due to lower gas prices, continued
low interest rates and increasing availability of credit, which boosted consumer confidence. The worst-performing sector was energy, due to an increased supply/ demand imbalance, followed by materials, which was hurt by concerns of slowing global demand.
The Fund generally follows a market neutral strategy, which is designed to produce a portfolio that experiences minimal influence from the return patterns of the general US stock market. The Fund implements its strategy by purchasing investments (long positions) with equity exposure that we believe to be undervalued, and selling short investments (short positions) with equity exposure that we believe to be overvalued. Stock selection is the primary source of return for the Fund, which uses offsetting long and short positions to generate return and manage risk.
As part of the investment process, the Fund evaluates fundamental and behavioral factors to forecast individual securities’ returns and risks, and ranks these securities based on their attractiveness relative to industry peers. In a market neutral construct, a positive spread between the top- and bottom-ranked stocks (long and short candidates for the portfolio) typically leads to outperformance relative to the Citigroup 90-Day Treasury Bill Index.
During the fiscal year, the Fund benefited most from a positive long/short spread in eight of 10 sectors. Overall, the
| | | | | | | | | | | | | | | | |
| Portfolio Composition | | | | | | | | | | | | | | | | |
| By sector, based on total net assets | | | | | | | | | | | | | | | | |
| | | Equity Securities | | | Gross | | | Net | |
| | | Long1 | | | Short2 | | | Exposure3 | | | Exposure4 | |
Health Care | | | 21.1 | % | | | 21.2 | % | | | 42.3 | % | | | -0.1 | % |
Information Technology | | | 16.5 | | | | 15.0 | | | | 31.5 | | | | 1.5 | |
Energy | | | 15.8 | | | | 15.1 | | | | 30.9 | | | | 0.7 | |
Financials | | | 7.6 | | | | 9.2 | | | | 16.8 | | | | -1.6 | |
Consumer Discretionary | | | 7.5 | | | | 8.6 | | | | 16.1 | | | | -1.1 | |
Industrials | | | 7.1 | | | | 4.4 | | | | 11.5 | | | | 2.7 | |
Materials | | | 4.9 | | | | 5.7 | | | | 10.6 | | | | -0.8 | |
Consumer Staples | | | 3.7 | | | | 3.5 | | | | 7.2 | | | | 0.2 | |
Telecommunication Services | | | 0.7 | | | | 1.2 | | | | 1.9 | | | | -0.5 | |
Utilities | | | 0.1 | | | | 1.0 | | | | 1.1 | | | | -0.9 | |
Money Market Funds Plus Other Assets Less Liabilities | | | 15.0 | | | | – | | | | 15.0 | | | | 15.0 | |
Total | | | 100.0 | | | | 84.9 | | | | 184.9 | | | | 15.1 | |
| 1 | Represents the value of the equity securities in the portfolio. |
| 2 | Represents the value of the equity securities underlying the Fund’s equity short portfolio swap. |
| 3 | Represents the cumulative exposure of the Fund’s long and short positions. |
| 4 | Represents the net exposure of the Fund’s long and short positions. |
| | | | |
Total Net Assets | | | $32.9 million | |
Data presented here are as of October 31, 2015.
4 Invesco All Cap Market Neutral Fund
best results came from the IT, health care, industrials and financials sectors. Modestly detracting from overall performance was the long/short spread in the consumer discretionary and energy sectors.
In the IT sector, the Fund’s short holdings within the computers/electronics industry declined more in price than the long holdings of its industry peers, while both long and short holdings in the semiconductor industry contributed to Fund performance. Strong Fund results for the fiscal year in the health care sector resulted primarily from short holdings in the biotechnology industry and long holdings in the health care equipment and services industry. Within the industrials sector, long and short positions in the airline industry and short positions in the commercial and professional services industry generated a positive spread and contributed to Fund performance for the reporting period. Strong results from the financials sector were due to short positions in the diversified financials industry and long positions in the insurance industry.
In the energy sector, the Fund’s long holdings underperformed its short holdings, specifically within the oil and gas exploration and production industry. The Fund’s short holdings within the consumer discretionary sector outperformed its long holdings in that sector, specifically within the media industry.
At the end of the reporting period, the Fund’s largest gross sector exposures were in the health care, IT, energy and consumer discretionary sectors.
Please note that the Fund may utilize derivative instruments that include equity total return swaps and futures contracts. During the reporting period, the Fund utilized equity total return swaps to efficiently implement its strategy, but did not use future contracts. The implementation impact of using equity total return swaps is a component of transaction costs. Derivatives may amplify traditional investment risks through the creation of leverage and may be less liquid than traditional securities.
Thank you for your investment in Invesco All Cap Market Neutral Fund.
The views and opinions expressed in management’s discussion of Fund performance are those of Invesco Advisers, Inc. These views and opinions are subject to change at any time based on factors such as market and economic conditions. These views and opinions may not be relied upon as investment advice or recommendations, or as an offer for a particular security. The information is not a complete analysis of every aspect of any market, country, industry, security or the Fund. Statements of fact are from sources considered reliable, but Invesco Advisers, Inc. makes no representation or warranty as to their completeness or accuracy. Although historical performance is no guarantee of future results, these insights may help you understand our investment management philosophy.
See important Fund and, if applicable, index disclosures later in this report.
| | |
 | | Michael Abata Chartered Financial Analyst, Portfolio Manager, is manager of Invesco All Cap |
| Market Neutral Fund. He joined Invesco in 2011. Mr. Abata earned a BA in economics from Binghamton University. |
| |
 | | Charles Ko Chartered Financial Analyst, Portfolio Manager, is manager of Invesco All Cap |
| Market Neutral Fund. He joined Invesco in 2012. Mr. Ko earned a BS from MIT and an MBA from Yale University. |
| |
 | | Anthony Munchak Chartered Financial Analyst, Portfolio Manager, is manager of Invesco All Cap |
| Market Neutral Fund. He joined Invesco in 2000. Mr. Munchak earned a BS and an MS in finance from Boston College and an MBA from Bentley College. |
| |
 | | Glen Murphy Chartered Financial Analyst, Portfolio Manager, is manager of Invesco All Cap |
| Market Neutral Fund. He joined Invesco in 1995. Mr. Murphy earned a BA in business administration from the University of Massachusetts Amherst and an MS in finance from Boston College. |
| |
 | | Francis Orlando Chartered Financial Analyst, Portfolio Manager, is manager of Invesco All Cap |
| Market Neutral Fund. He joined Invesco in 1987. Mr. Orlando earned a BA in business administration from Merrimack College and an MBA from Boston University. |
| |
 | | Andrew Waisburd Portfolio Manager, is manager of Invesco All Cap Market Neutral Fund. He joined |
| Invesco in 2008. Mr. Waisburd earned a BS in statistics from Cornell University and an MS and a PhD in finance from Indiana University. |
5 Invesco All Cap Market Neutral Fund
Your Fund’s Long-Term Performance
Results of a $10,000 Investment – Oldest Share Class(es) Since Inception
Fund and index data from 12/17/13
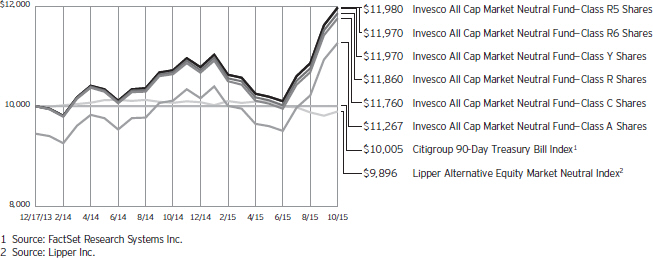
Past performance cannot guarantee comparable future results.
The data shown in the chart include reinvested distributions, applicable sales charges and Fund expenses including
management fees. Index results include reinvested dividends, but they do not reflect sales charges. Performance of the peer group, if applicable, reflects fund expenses and management fees;
performance of a market index does not. Performance shown in the chart and table(s) does not reflect deduction of taxes a shareholder would pay on Fund distributions or sale of Fund shares.
continued from page 8
| n | | The Fund is not managed to track the performance of any particular index, including the index(es) described here, and consequently, the performance of the Fund may deviate significantly from the performance of the index(es). |
| n | | A direct investment cannot be made in an index. Unless otherwise indicated, index results include reinvested dividends, and they do not reflect sales charges. Performance of the peer group, if applicable, reflects fund expenses; performance of a market index does not. |
Other information
| n | | The returns shown in management’s discussion of Fund performance are based on net asset values (NAVs) calculated for shareholder transactions. Generally accepted accounting principles require adjustments to be made to the net assets of the Fund at period end for financial reporting purposes, and as such, the NAVs for shareholder transactions and the returns based on those NAVs may differ from the NAVs and returns reported in the Financial Highlights. |
| n | | Industry classifications used in this report are generally according to the Global Industry Classification Standard, which was developed by and is the exclusive property and a service mark of MSCI Inc. and Standard & Poor’s. |
6 Invesco All Cap Market Neutral Fund
| | | | |
| Average Annual Total Returns | |
| As of 10/31/15, including maximum applicable sales charges | |
| |
Class A Shares | | | | |
Inception (12/17/13) | | | 6.58 | % |
1 Year | | | 5.30 | |
| |
Class C Shares | | | | |
Inception (12/17/13) | | | 9.05 | % |
1 Year | | | 9.53 | |
| |
Class R Shares | | | | |
Inception (12/17/13) | | | 9.54 | % |
1 Year | | | 11.05 | |
| |
Class Y Shares | | | | |
Inception (12/17/13) | | | 10.09 | % |
1 Year | | | 11.66 | |
| |
Class R5 Shares | | | | |
Inception (12/17/13) | | | 10.14 | % |
1 Year | | | 11.75 | |
| |
Class R6 Shares | | | | |
Inception (12/17/13) | | | 10.09 | % |
1 Year | | | 11.66 | |
The performance data quoted represent past performance and cannot guarantee comparable future results; current performance may be lower or higher. Please visit invesco.com/performance for the most recent month-end performance. Performance figures reflect reinvested distributions, changes in net asset value and the effect of the maximum sales charge unless otherwise stated. Investment return and principal value will fluctuate so that you may have a gain or loss when you sell shares.
The net annual Fund operating expense ratio set forth in the most recent Fund prospectus as of the date of this report for Class A, Class C, Class R, Class Y, Class R5 and Class R6 shares was 1.62%, 2.37%, 1.87%, 1.37%, 1.37% and 1.37%, respectively.1,2 The total annual Fund operating expense ratio set forth in the most recent Fund prospectus as of the date of this report for Class A, Class C, Class R, Class Y, Class R5 and Class R6 shares was 4.37%, 5.12%, 4.62%, 4.12%, 4.09% and 4.08%, respectively. The expense ratios presented above may vary from the expense ratios presented in other sections of this report that are based on expenses incurred during the period covered by this report.
Class A share performance reflects the maximum 5.50% sales charge, and Class C share performance reflects the
| | | | |
| Average Annual Total Returns | |
| As of 9/30/15, the most recent calendar quarter end, including maximum applicable sales charges | |
| |
Class A Shares | | | | |
Inception (12/17/13) | | | 5.14 | % |
1 Year | | | 2.66 | |
| |
Class C Shares | | | | |
Inception (12/17/13) | | | 7.72 | % |
1 Year | | | 6.74 | |
| |
Class R Shares | | | | |
Inception (12/17/13) | | | 8.24 | % |
1 Year | | | 8.37 | |
| |
Class Y Shares | | | | |
Inception (12/17/13) | | | 8.77 | % |
1 Year | | | 8.90 | |
| |
Class R5 Shares | | | | |
Inception (12/17/13) | | | 8.77 | % |
1 Year | | | 8.80 | |
| |
Class R6 Shares | | | | |
Inception (12/17/13) | | | 8.77 | % |
1 Year | | | 8.90 | |
applicable contingent deferred sales charge (CDSC) for the period involved. The CDSC on Class C shares is 1% for the first year after purchase. Class R, Class Y, Class R5 and Class R6 class shares do not have a front-end sales charge or a CDSC; therefore, performance is at net asset value.
The performance of the Fund’s share classes will differ primarily due to different sales charge structures and class expenses.
Fund performance reflects any applicable fee waivers and/or expense reimbursements. Had the adviser not waived fees and/or reimbursed expenses currently or in the past, returns would have been lower. See current prospectus for more information.
| 1 | Total annual Fund operating expenses after any contractual fee waivers and/or expense reimbursements by the adviser in effect through at least February 28, 2017. See current prospectus for more information. |
| 2 | Total annual Fund operating expenses after any contractual fee waivers and/or expense reimbursements by the adviser in effect through at least June 30, 2017. See current prospectus for more information. |
7 Invesco All Cap Market Neutral Fund
Invesco All Cap Market Neutral Fund’s investment objective is to seek to provide a positive return over a full market cycle from a broadly diversified portfolio of stocks while seeking to limit exposure to the general risks associated with stock market investing.
| n | | Unless otherwise stated, information presented in this report is as of October 31, 2015, and is based on total net assets. |
| n | | Unless otherwise noted, all data provided by Invesco. |
| n | | To access your Fund’s reports/prospectus, visit invesco.com/fundreports. |
About share classes
| n | | Class R shares are generally available only to employer sponsored retirement and benefit plans. Please see the prospectus for more information. |
| n | | Class Y shares are available only to certain investors. Please see the prospectus for more information. |
| n | | Class R5 shares and Class R6 shares are primarily intended for employer sponsored retirement and benefit plans that meet certain standards and for institutional investors. Please see the prospectus for more information. |
Principal risks of investing
in the Fund
| n | | Active trading risk. The Fund engages in frequent trading of portfolio securities. Active trading results in added expenses and may result in a lower return and increased tax liability. |
| n | | Derivatives risk. The value of a derivative instrument depends largely on (and is derived from) the value of an underlying security, currency, commodity, interest rate, index or other asset (each referred to as an underlying asset). In addition to risks relating to the underlying assets, the use of derivatives may include other, possibly greater, risks, including counterparty, leverage and liquidity risks. Counterparty risk is the risk that the counterparty to the derivative contract will default on its obligation to pay the Fund the amount owed or otherwise perform under the derivative contract. Derivatives create leverage risk because they do not require payment up front equal to the economic exposure created by owning the derivative. As a result, an adverse change in the value of the underlying asset could result in the Fund sustaining a loss that is substantially greater than the amount invested in the derivative, which may make the Fund’s returns more volatile and increase the risk of loss. Derivative instruments may also be less liquid than more traditional investments and the Fund |
| | | may be unable to sell or close out its derivative positions at a desirable time or price. This risk may be more acute under adverse market conditions, during which the Fund may be most in need of liquidating its derivative positions. Derivatives may also be harder to value, less tax efficient and subject to changing government regulation that could impact the Fund’s ability to use certain derivatives or their cost. Also, derivatives used for hedging or to gain or limit exposure to a particular market segment may not provide the expected benefits, particularly during adverse market conditions. These risks are greater for the Fund than mutual funds that do not use derivative instruments or that use derivative instruments to a lesser extent than the Fund to implement their investment strategy. |
| n | | Management risk. The investment techniques and risk analysis used by the Fund’s portfolio managers may not produce the desired results. In particular, there is no guarantee that the portfolio manager’s stock selection process will produce a market neutral portfolio that reduces or eliminates the Fund’s exposure to general US stock market risk, sector or industry-specific risk or market capitalization risk. In addition, the Fund’s market neutral investment strategy will likely cause the Fund to underperform the broader US equity market during market rallies. Such underperformance could be significant during sudden or significant market rallies. Although the Fund seeks to provide a positive return, investors may lose money by investing in the Fund. |
| n | | Market risk. The prices of and the income generated by the Fund’s securities may decline in response to, among other things, investor sentiment, general economic and market conditions, regional or global instability, and currency and interest rate fluctuations. |
| n | | Short sales risk. Short sales may cause the Fund to repurchase a security at a higher price, thereby causing the Fund to incur a loss. A short position in a security poses |
| | | more risk than holding the same security long. As there is no limit on how much the price of the security can increase, the Fund’s exposure is unlimited. In order to establish a short position in a security, the Fund must borrow the security from a broker. The Fund may not always be able to borrow a security the Fund seeks to sell short at a particular time or at an acceptable price. The Fund also may not always be able to close out the short position by replacing the borrowed securities at a particular time or at an acceptable price. The Fund will incur increased transaction costs associated with selling securities short. In addition, taking short positions in securities results in a form of leverage which may cause the Fund to be volatile. |
| n | | Small- and mid-capitalization risks. Stocks of small- and mid-sized companies tend to be more vulnerable to adverse developments and may have little or no operating history or track record of success, and limited product lines, markets, management and financial resources. The securities of small- and mid-sized companies may be more volatile due to less market interest and less publicly available information about the issuer. They also may be illiquid or restricted as to resale, or may trade less frequently and in smaller volumes, all of which may cause difficulty when establishing or closing a position at a desirable price. |
About indexes used in this report
| n | | The Citigroup 90-Day Treasury Bill Index is an unmanaged index representative of three-month Treasury bills. |
| n | | The Lipper Alternative Equity Market Neutral Index is an unmanaged index considered representative of funds that employ portfolio strategies generating consistent returns in both up and down markets by selecting positions with a total net market exposure of zero. |
| | |
This report must be accompanied or preceded by a currently effective Fund prospectus, which contains more complete information, including sales charges and expenses. Investors should read it carefully before investing. | | continued on page 6 |
NOT FDIC INSURED | MAY LOSE VALUE | NO BANK GUARANTEE | | |
8 Invesco All Cap Market Neutral Fund
Schedule of Investments(a)
October 31, 2015
| | | | | | | | |
| | | Shares | | | Value | |
Common Stocks & Other Equity Interests–85.04% | |
| Aerospace & Defense–1.34% | | | | | | | | |
Ducommun Inc.(b) | | | 4,000 | | | $ | 86,560 | |
Huntington Ingalls Industries, Inc. | | | 2,950 | | | | 353,823 | |
| | | | | | | | 440,383 | |
|
| Agricultural & Farm Machinery–0.28% | |
AGCO Corp. | | | 1,900 | | | | 91,941 | |
|
| Agricultural Products–0.90% | |
Bunge Ltd. | | | 4,050 | | | | 295,488 | |
|
| Air Freight & Logistics–0.49% | |
Atlas Air Worldwide Holdings, Inc.(b) | | | 3,900 | | | | 160,836 | |
|
| Airlines–0.88% | |
JetBlue Airways Corp.(b) | | | 11,650 | | | | 289,386 | |
|
| Alternative Carriers–0.64% | |
Inteliquent, Inc. | | | 10,200 | | | | 211,344 | |
|
| Application Software–0.04% | |
Aware, Inc. | | | 4,000 | | | | 12,920 | |
|
| Auto Parts & Equipment–0.74% | |
China Automotive Systems, Inc. (China) | | | 9,900 | | | | 59,400 | |
Tower International Inc.(b) | | | 6,700 | | | | 184,049 | |
| | | | | | | | 243,449 | |
|
| Biotechnology–11.97% | |
Adamas Pharmaceuticals, Inc.(b) | | | 7,200 | | | | 106,272 | |
Anacor Pharmaceuticals, Inc.(b) | | | 3,050 | | | | 342,850 | |
Applied Genetic Technologies Corp.(b) | | | 2,250 | | | | 27,000 | |
BioSpecifics Technologies Corp.(b) | | | 3,150 | | | | 183,992 | |
China Biologic Products Inc. (China)(b) | | | 150 | | | | 17,091 | |
Concert Pharmaceuticals, Inc.(b) | | | 8,850 | | | | 200,984 | |
Cytokinetics, Inc.(b) | | | 17,950 | | | | 154,550 | |
Eagle Pharmaceuticals, Inc.(b) | | | 4,850 | | | | 308,993 | |
Infinity Pharmaceuticals, Inc.(b) | | | 21,800 | | | | 225,630 | |
MacroGenics, Inc.(b) | | | 11,050 | | | | 343,323 | |
Myriad Genetics, Inc.(b) | | | 9,850 | | | | 397,644 | |
NewLink Genetics Corp.(b) | | | 8,100 | | | | 309,987 | |
PDL BioPharma Inc. | | | 23,900 | | | | 109,462 | |
Pfenex Inc.(b) | | | 10,150 | | | | 183,512 | |
Progenics Pharmaceuticals, Inc.(b) | | | 33,750 | | | | 247,725 | |
Repligen Corp.(b) | | | 12,300 | | | | 408,852 | |
United Therapeutics Corp.(b) | | | 2,500 | | | | 366,575 | |
| | | | | | | | 3,934,442 | |
|
| Broadcasting–0.12% | |
TEGNA Inc. | | | 1,450 | | | | 39,208 | |
|
| Building Products–0.45% | |
Owens Corning | | | 3,250 | | | | 147,973 | |
| | | | | | | | |
| | | Shares | | | Value | |
| Cable & Satellite–1.33% | |
Comcast Corp.–Class A | | | 7,000 | | | $ | 438,340 | |
|
| Casinos & Gaming–1.15% | |
Isle of Capri Casinos, Inc.(b) | | | 19,700 | | | | 376,861 | |
|
| Coal & Consumable Fuels–0.07% | |
Peabody Energy Corp.(b) | | | 1,893 | | | | 24,211 | |
|
| Commercial Printing–0.76% | |
Ennis Inc. | | | 12,500 | | | | 250,375 | |
|
| Commodity Chemicals–1.33% | |
LyondellBasell Industries N.V.–Class A | | | 4,700 | | | | 436,677 | |
|
| Communications Equipment–0.82% | |
Black Box Corp. | | | 3,450 | | | | 42,124 | |
Cisco Systems, Inc. | | | 450 | | | | 12,983 | |
Polycom, Inc.(b) | | | 15,650 | | | | 215,657 | |
| | | | | | | | 270,764 | |
|
| Computer & Electronics Retail–1.02% | |
Best Buy Co., Inc. | | | 9,600 | | | | 336,288 | |
|
| Consumer Electronics–0.33% | |
ZAGG Inc.(b) | | | 12,850 | | | | 108,968 | |
|
| Consumer Finance–0.53% | |
Nelnet, Inc.–Class A | | | 2,300 | | | | 82,294 | |
Santander Consumer USA Holdings Inc. | | | 5,150 | | | | 92,752 | |
| | | | | | | | 175,046 | |
|
| Data Processing & Outsourced Services–1.32% | |
Global Payments Inc. | | | 700 | | | | 95,487 | |
Information Services Group, Inc. | | | 14,750 | | | | 54,133 | |
NeuStar, Inc.–Class A(b) | | | 7,650 | | | | 208,003 | |
Planet Payment Inc.(b) | | | 25,500 | | | | 76,500 | |
| | | | | | | | 434,123 | |
|
| Distillers & Vintners–0.09% | |
MGP Ingredients, Inc. | | | 1,650 | | | | 28,595 | |
|
| Diversified Banks–0.79% | |
Citigroup Inc. | | | 4,900 | | | | 260,533 | |
|
| Diversified Chemicals–0.08% | |
Chemours Co. (The) | | | 3,850 | | | | 26,681 | |
|
| Diversified Metals & Mining–0.37% | |
Turquoise Hill Resources Ltd. (Canada)(b) | | | 44,200 | | | | 120,224 | |
|
| Drug Retail–0.35% | |
CVS Health Corp. | | | 1,150 | | | | 113,597 | |
|
| Education Services–0.33% | |
Cambium Learning Group Inc.(b) | | | 10,250 | | | | 49,303 | |
K12 Inc.(b) | | | 5,950 | | | | 57,774 | |
| | | | | | | | 107,077 | |
See accompanying Notes to Financial Statements which are an integral part of the financial statements.
9 Invesco All Cap Market Neutral Fund
| | | | | | | | |
| | | Shares | | | Value | |
| Electric Utilities–0.08% | |
Exelon Corp. | | | 950 | | | $ | 26,524 | |
|
| Electrical Components & Equipment–0.32% | |
General Cable Corp. | | | 6,800 | | | | 104,652 | |
|
| Electronic Manufacturing Services–0.95% | |
Celestica Inc. (Canada)(b) | | | 8,100 | | | | 90,882 | |
Multi-Fineline Electronix, Inc.(b) | | | 11,850 | | | | 220,173 | |
| | | | | | | | 311,055 | |
|
| Footwear–0.06% | |
Rocky Brands, Inc. | | | 1,600 | | | | 20,400 | |
|
| Gold–1.35% | |
Newmont Mining Corp. | | | 22,700 | | | | 441,742 | |
|
| Health Care Equipment–0.72% | |
Hologic, Inc.(b) | | | 5,350 | | | | 207,901 | |
LeMaitre Vascular, Inc. | | | 2,250 | | | | 29,970 | |
| | | | 237,871 | |
| | |
| Health Care REIT’s–0.10% | | | | | | | | |
Care Capital Properties, Inc. | | | 1,000 | | | | 32,950 | |
| | |
| Health Care Services–0.94% | | | | | | | | |
Almost Family Inc.(b) | | | 1,750 | | | | 72,415 | |
LHC Group Inc.(b) | | | 3,800 | | | | 171,247 | |
Premier Inc.–Class A(b) | | | 1,550 | | | | 52,405 | |
RadNet, Inc.(b) | | | 1,900 | | | | 12,559 | |
| | | | 308,626 | |
| | |
| Homebuilding–0.09% | | | | | | | | |
TopBuild Corp.(b) | | | 1,050 | | | | 29,537 | |
| | |
| Hotel and Resort REIT’s–0.33% | | | | | | | | |
Summit Hotel Properties, Inc. | | | 8,400 | | | | 109,872 | |
| | |
| Household Products–0.35% | | | | | | | | |
Central Garden & Pet Co.–Class A(b) | | | 6,800 | | | | 114,784 | |
|
| Human Resource & Employment Services–0.99% | |
Insperity, Inc. | | | 7,000 | | | | 325,220 | |
|
| Independent Power Producers & Energy Traders–0.05% | |
Talen Energy Corp.(b) | | | 1,950 | | | | 16,926 | |
| | |
| Integrated Oil & Gas–2.42% | | | | | | | | |
Cenovus Energy Inc. (Canada) | | | 24,200 | | | | 360,822 | |
Suncor Energy, Inc. (Canada) | | | 14,550 | | | | 432,571 | |
| | | | 793,393 | |
|
| Integrated Telecommunication Services–0.07% | |
Windstream Holdings Inc. | | | 3,750 | | | | 24,413 | |
| | |
| Internet Retail–0.73% | | | | | | | | |
Nutrisystem, Inc. | | | 10,400 | | | | 240,552 | |
| | |
| Internet Software & Services–2.73% | | | | | | | | |
Demand Media, Inc.(b) | | | 6,750 | | | | 29,363 | |
DHI Group, Inc.(b) | | | 21,500 | | | | 194,575 | |
| | | | | | | | |
| | | Shares | | | Value | |
| Internet Software & Services–(continued) | | | | | |
Earthlink Holdings Corp. | | | 50,300 | | | $ | 430,065 | |
Monster Worldwide, Inc.(b) | | | 20,950 | | | | 131,356 | |
TechTarget, Inc.(b) | | | 5,000 | | | | 46,650 | |
United Online, Inc.(b) | | | 5,650 | | | | 65,992 | |
| | | | 898,001 | |
|
| IT Consulting & Other Services–2.17% | |
Hackett Group, Inc. (The) | | | 10,750 | | | | 159,960 | |
Leidos Holdings, Inc. | | | 9,200 | | | | 483,644 | |
NCI, Inc.–Class A | | | 4,550 | | | | 70,707 | |
| | | | 714,311 | |
| | |
| Leisure Products–0.20% | | | | | | | | |
Nautilus, Inc.(b) | | | 3,900 | | | | 66,456 | |
|
| Life Sciences Tools & Services–1.26% | |
Cambrex Corp.(b) | | | 9,000 | | | | 413,730 | |
| | |
| Managed Health Care–1.29% | | | | | | | | |
Molina Healthcare, Inc.(b) | | | 5,650 | | | | 350,300 | |
Triple-S Management Corp.–Class B (Puerto Rico)(b) | | | 3,550 | | | | 73,094 | |
| | | | 423,394 | |
| | |
| Mortgage REIT’s–0.55% | | | | | | | | |
Annaly Capital Management Inc. | | | 18,000 | | | | 179,100 | |
| | |
| Movies & Entertainment–0.16% | | | | | | | | |
Walt Disney Co. (The) | | | 450 | | | | 51,183 | |
| | |
| Oil & Gas Drilling–1.62% | | | | | | | | |
Noble Corp. PLC | | | 35,200 | | | | 474,144 | |
Pioneer Energy Services Corp.(b) | | | 25,100 | | | | 57,981 | |
| | | | 532,125 | |
| |
| Oil & Gas Equipment & Services–0.95% | | | | | |
Superior Energy Services, Inc. | | | 21,950 | | | | 310,812 | |
|
| Oil & Gas Exploration & Production–5.16% | |
Baytex Energy Corp. (Canada) | | | 29,950 | | | | 121,896 | |
Canadian Natural Resources Ltd. (Canada) | | | 19,000 | | | | 441,180 | |
Clayton Williams Energy, Inc.(b) | | | 5,950 | | | | 354,441 | |
Denbury Resources Inc. | | | 41,800 | | | | 147,972 | |
Enerplus Corp. (Canada) | | | 28,700 | | | | 135,177 | |
Newfield Exploration Co.(b) | | | 8,000 | | | | 321,520 | |
Panhandle Oil & Gas, Inc.–Class A | | | 5,950 | | | | 109,361 | |
Penn West Petroleum Ltd. (Canada) | | | 54,650 | | | | 63,941 | |
| | | | 1,695,488 | |
| |
| Oil & Gas Refining & Marketing–5.56% | | | | | |
Adams Resources & Energy, Inc. | | | 1,150 | | | | 51,129 | |
Alon USA Energy, Inc. | | | 17,950 | | | | 300,662 | |
REX American Resources Corp.(b) | | | 3,550 | | | | 194,931 | |
Tesoro Corp. | | | 4,100 | | | | 438,413 | |
Valero Energy Corp. | | | 7,000 | | | | 461,440 | |
Western Refining, Inc. | | | 9,150 | | | | 380,823 | |
| | | | | | | | 1,827,398 | |
See accompanying Notes to Financial Statements which are an integral part of the financial statements.
10 Invesco All Cap Market Neutral Fund
| | | | | | | | |
| | | Shares | | | Value | |
| Packaged Foods & Meats–2.02% | | | | | | | | |
Dean Foods Co. | | | 13,700 | | | $ | 248,107 | |
Pilgrim’s Pride Corp. | | | 21,900 | | | | 415,881 | |
| | | | | | | | 663,988 | |
| | |
| Paper Packaging–1.25% | | | | | | | | |
AEP Industries Inc.(b) | | | 800 | | | | 64,000 | |
Avery Dennison Corp. | | | 5,350 | | | | 347,589 | |
| | | | | | | | 411,589 | |
| | |
| Paper Products–0.27% | | | | | | | | |
Mercer International, Inc. (Canada)(b) | | | 8,200 | | | | 88,560 | |
| | |
| Pharmaceuticals–4.93% | | | | | | | | |
Cumberland Pharmaceuticals Inc.(b) | | | 3,450 | | | | 21,390 | |
Heska Corp.(b) | | | 3,050 | | | | 93,818 | |
Lannett Co., Inc.(b) | | | 2,100 | | | | 94,017 | |
Pfizer Inc. | | | 11,700 | | | | 395,694 | |
Sagent Pharmaceuticals Inc.(b) | | | 8,600 | | | | 144,566 | |
SciClone Pharmaceuticals, Inc.(b) | | | 23,300 | | | | 177,546 | |
Sucampo Pharmaceuticals, Inc.–Class A(b) | | | 20,800 | | | | 402,688 | |
Supernus Pharmaceuticals Inc.(b) | | | 17,650 | | | | 291,225 | |
| | | | | | | | 1,620,944 | |
| |
| Property & Casualty Insurance–3.28% | | | | | |
Ambac Financial Group, Inc.(b) | | | 21,800 | | | | 352,070 | |
Assured Guaranty Ltd. | | | 15,500 | | | | 425,320 | |
Universal Insurance Holdings, Inc. | | | 9,500 | | | | 299,725 | |
| | | | | | | | 1,077,115 | |
| | |
| Real Estate Services–0.76% | | | | | | | | |
Altisource Portfolio Solutions S.A.(b) | | | 9,350 | | | | 250,673 | |
| | |
| Regional Banks–0.04% | | | | | | | | |
Century Bancorp, Inc.–Class A | | | 300 | | | | 13,335 | |
| | |
| Restaurants–1.01% | | | | | | | | |
Darden Restaurants, Inc. | | | 5,350 | | | | 331,111 | |
| | |
| Semiconductors–4.78% | | | | | | | | |
Integrated Device Technology, Inc.(b) | | | 19,100 | | | | 487,050 | |
Intel Corp. | | | 14,150 | | | | 479,119 | |
| | | | | | | | |
| | | Shares | | | Value | |
| Semiconductors–(continued) | | | | | | | | |
NeoPhotonics Corp.(b) | | | 18,750 | | | $ | 155,063 | |
NVIDIA Corp. | | | 15,850 | | | | 449,664 | |
| | | | | | | | 1,570,896 | |
| | |
| Specialized REIT’s–1.23% | | | | | | | | |
CoreSite Realty Corp. | | | 7,350 | | | | 403,882 | |
| | |
| Steel–0.30% | | | | | | | | |
Steel Dynamics, Inc. | | | 5,350 | | | | 98,815 | |
| |
| Technology Distributors–1.13% | | | | | |
Tech Data Corp.(b) | | | 5,100 | | | | 371,229 | |
|
| Technology Hardware, Storage & Peripherals–2.51% | |
Apple Inc. | | | 3,550 | | | | 424,225 | |
NetApp, Inc. | | | 11,750 | | | | 399,500 | |
| | | | | | | | 823,725 | |
| | |
| Tires & Rubber–0.32% | | | | | | | | |
Cooper Tire & Rubber Co. | | | 2,500 | | | | 104,475 | |
|
| Trading Companies & Distributors–0.39% | |
Titan Machinery, Inc.(b) | | | 10,450 | | | | 127,804 | |
| | |
| Trucking–1.10% | | | | | | | | |
P.A.M. Transportation Services, Inc.(b) | | | 260 | | | | 9,285 | |
USA Truck Inc.(b) | | | 3,350 | | | | 60,903 | |
YRC Worldwide, Inc.(b) | | | 15,850 | | | | 289,421 | |
| | | | | | | | 359,609 | |
Total Common Stocks & Other Equity Interests
(Cost $26,932,692) | | | | 27,943,995 | |
|
Money Market Funds–12.03% | |
Liquid Assets Portfolio–Institutional Class, 0.16%(c) | | | 1,975,990 | | | | 1,975,990 | |
Premier Portfolio–Institutional Class, 0.12%(c) | | | 1,975,989 | | | | 1,975,989 | |
Total Money Market Funds
(Cost $3,951,979) | | | | 3,951,979 | |
TOTAL INVESTMENTS–97.07%
(Cost $30,884,671) | | | | 31,895,974 | |
OTHER ASSETS LESS LIABILITIES–2.93% | | | | 961,425 | |
NET ASSETS–100.00% | | | | | | $ | 32,857,399 | |
Investment Abbreviations:
| | |
| REIT | | – Real Estate Investment Trust |
Notes to Schedule of Investments:
| (a) | Industry and/or sector classifications used in this report are generally according to the Global Industry Classification Standard, which was developed by and is the exclusive property and a service mark of MSCI Inc. and Standard & Poor’s. |
| (b) | Non-income producing security. |
| (c) | The money market fund and the Fund are affiliated by having the same investment adviser. The rate shown is the 7-day SEC standardized yield as of October 31, 2015. |
| | | | | | | | | | | | | | | | | | | | | | | | |
| Open Total Return Swap Agreements | |
| Reference Entity | | Counterparty | | | Expiration Date | | | Floating Rate
Index(1) | | | Notional
Value | | | Unrealized Appreciation
(Depreciation) | | | Net Value of
Reference
Entities | |
Equity Securities — Short | | | Morgan Stanley & Co. LLC | | | | 04/24/17 | | | | Federal Funds floating rate | | | $ | (28,270,746 | ) | | $ | 353,475 | (2) | | $ | (27,899,314 | ) |
| (1) | The Fund receives or pays the total return on the short positions underlying the total return swap and receives a specific Federal Funds floating rate. |
| (2) | Amount includes $(17,957) of dividends payable long and financing fees payable from the Fund to the Counterparty. |
See accompanying Notes to Financial Statements which are an integral part of the financial statements.
11 Invesco All Cap Market Neutral Fund
The following table represents the individual short positions and related values of equity securities underlying the total return swap with Morgan Stanley & Co. LLC as of October 31, 2015.
| | | | | | | | |
| | | Shares | | | Value | |
Equity Securities — Short | | | | | | | | |
| Airlines | | | | | | | | |
Copa Holdings S.A. (Panama)–Class A | | | (1,550 | ) | | $ | (78,306 | ) |
Spirit Airlines Inc. | | | (10,450 | ) | | | (387,904 | ) |
| | | | | (466,210 | ) |
| | |
| Airport Services | | | | | | | | |
Macquarie Infrastructure Corp. | | | (3,050 | ) | | | (242,627 | ) |
| |
| Apparel, Accessories & Luxury Goods | | | | | |
Kate Spade & Co. | | | (18,350 | ) | | | (329,750 | ) |
Michael Kors Holdings Ltd. | | | (800 | ) | | | (30,912 | ) |
| | | | | (360,662 | ) |
| | |
| Application Software | | | | | | | | |
Datawatch Corp. | | | (3,200 | ) | | | (17,472 | ) |
Digital Turbine, Inc. | | | (17,550 | ) | | | (29,133 | ) |
Guidewire Software , Inc. | | | (1,150 | ) | | | (66,964 | ) |
| | | | | (113,569 | ) |
| |
| Asset Management & Custody Banks | | | | | |
Financial Engines Inc. | | | (7,400 | ) | | | (237,984 | ) |
| | |
| Automobile Manufacturers | | | | | | | | |
Tesla Motors, Inc. | | | (1,250 | ) | | | (258,662 | ) |
| | |
| Biotechnology | | | | | | | | |
Abeona Therapeutics, Inc. | | | (4,500 | ) | | | (17,775 | ) |
Advaxis, Inc. | | | (11,950 | ) | | | (132,526 | ) |
Agios Pharmaceuticals, Inc. | | | (5,450 | ) | | | (397,087 | ) |
Amicus Therapeutics, Inc. | | | (57,650 | ) | | | (432,375 | ) |
Aquinox Pharmaceuticals, Inc. (Canada) | | | (7,900 | ) | | | (120,791 | ) |
ARCA biopharma, Inc. | | | (4,350 | ) | | | (22,272 | ) |
Arrowhead Research Corp. | | | (22,550 | ) | | | (116,133 | ) |
Caladrius Biosciences, Inc. | | | (12,550 | ) | | | (15,562 | ) |
CorMedix Inc. | | | (10,300 | ) | | | (26,162 | ) |
CytRx Corp. | | | (21,150 | ) | | | (58,797 | ) |
Exact Sciences Corp. | | | (11,300 | ) | | | (94,129 | ) |
Fibrocell Science, Inc. | | | (20,400 | ) | | | (77,928 | ) |
Galectin Therapeutics Inc. | | | (4,310 | ) | | | (11,766 | ) |
Genocea Biosciences, Inc. | | | (13,600 | ) | | | (65,144 | ) |
Ignyta, Inc. | | | (9,800 | ) | | | (100,000 | ) |
Intercept Pharmaceuticals, Inc. | | | (2,550 | ) | | | (400,860 | ) |
Keryx Biopharmaceuticals, Inc. | | | (34,550 | ) | | | (154,784 | ) |
La Jolla Pharmaceutical Co. | | | (8,400 | ) | | | (209,916 | ) |
Medgenics, Inc. (Israel) | | | (11,600 | ) | | | (75,980 | ) |
Mirati Therapeutics, Inc. | | | (9,050 | ) | | | (320,189 | ) |
Navidea Biopharmaceuticals Inc. | | | (41,350 | ) | | | (83,527 | ) |
Northwest Biotherapeutics, Inc. | | | (17,650 | ) | | | (86,132 | ) |
Ohr Pharmaceutical, Inc. | | | (7,000 | ) | | | (20,510 | ) |
Ovascience Inc. | | | (10,350 | ) | | | (134,240 | ) |
Puma Biotechnology, Inc. | | | (4,700 | ) | | | (387,374 | ) |
| | | | | | | | |
| | | Shares | | | Value | |
| Biotechnology–(continued) | | | | | | | | |
TG Therapeutics, Inc. | | | (2,950 | ) | | $ | (36,491 | ) |
Trovagene, Inc. | | | (11,650 | ) | | | (50,211 | ) |
| | | | | (3,648,661 | ) |
| | |
| Casinos & Gaming | | | | | | | | |
Empire Resorts, Inc. | | | (2,200 | ) | | | (10,208 | ) |
Wynn Resorts Ltd. | | | (6,250 | ) | | | (437,188 | ) |
| | | | | (447,396 | ) |
| | |
| Coal & Consumable Fuels | | | | | | | | |
CONSOL Energy Inc. | | | (32,550 | ) | | | (216,783 | ) |
Solazyme Inc. | | | (22,850 | ) | | | (74,948 | ) |
| | | | | (291,731 | ) |
| | |
| Commodity Chemicals | | | | | | | | |
Methanex Corp. (Canada) | | | (3,600 | ) | | | (143,748 | ) |
| | |
| Communications Equipment | | | | | | | | |
NetScout Systems, Inc. | | | (5,650 | ) | | | (202,666 | ) |
ViaSat, Inc. | | | (3,350 | ) | | | (220,966 | ) |
| | | | | (423,632 | ) |
| | |
| Computer & Electronics Retail | | | | | | | | |
Conn’s, Inc. | | | (2,500 | ) | | | (47,425 | ) |
| | |
| Construction & Engineering | | | | | | | | |
HC2 Holdings, Inc. | | | (4,250 | ) | | | (32,130 | ) |
MasTec, Inc. | | | (9,650 | ) | | | (161,830 | ) |
| | | | | (193,960 | ) |
| | |
| Construction Materials | | | | | | | | |
Eagle Materials Inc. | | | (6,350 | ) | | | (419,291 | ) |
Martin Marietta Materials, Inc. | | | (950 | ) | | | (147,392 | ) |
| | | | | (566,683 | ) |
| | |
| Consumer Electronics | | | | | | | | |
Turtle Beach Corp. | | | (6,670 | ) | | | (15,674 | ) |
| | |
| Diversified Metals & Mining | | | | | | | | |
Freeport-McMoRan Inc. | | | (34,850 | ) | | | (410,185 | ) |
| | |
| Diversified REIT’s | | | | | | | | |
NorthStar Realty Finance Corp. | | | (36,300 | ) | | | (435,963 | ) |
VEREIT, Inc. | | | (40,000 | ) | | | (330,400 | ) |
| | | | | (766,363 | ) |
| | |
| Education Services | | | | | | | | |
2U, Inc. | | | (2,600 | ) | | | (54,548 | ) |
| |
| Electrical Components & Equipment | | | | | |
American Superconductor Corp. | | | (6,800 | ) | | | (36,924 | ) |
SolarCity Corp. | | | (6,050 | ) | | | (179,382 | ) |
| | | | | (216,306 | ) |
See accompanying Notes to Financial Statements which are an integral part of the financial statements.
12 Invesco All Cap Market Neutral Fund
| | | | | | | | |
| | | Shares | | | Value | |
| Electronic Equipment Manufacturers | | | | | |
CUI Global, Inc. | | | (9,700 | ) | | $ | (60,722 | ) |
Zebra Technologies Corp.–Class A | | | (5,350 | ) | | | (411,415 | ) |
| | | | | (472,137 | ) |
| | |
| Fertilizers & Agricultural Chemicals | | | | | | | | |
AgroFresh Solutions, Inc. | | | (7,150 | ) | | | (50,550 | ) |
| | |
| Food Distributors | | | | | | | | |
United Natural Foods, Inc. | | | (7,350 | ) | | | (370,808 | ) |
| | |
| Food Retail | | | | | | | | |
Sprouts Farmers Market, Inc. | | | (1,450 | ) | | | (29,551 | ) |
| | |
| Gold | | | | | | | | |
Franco-Nevada Corp. (Canada) | | | (7,450 | ) | | | (377,641 | ) |
| | |
| Health Care Equipment | | | | | | | | |
CytoSorbents Corp. | | | (12,150 | ) | | | (90,396 | ) |
GenMark Diagnostics Inc. | | | (16,950 | ) | | | (107,802 | ) |
OncoSec Medical Inc. | | | (5,950 | ) | | | (25,347 | ) |
Tandem Diabetes Care, Inc. | | | (14,400 | ) | | | (130,608 | ) |
TriVascular Technologies, Inc. | | | (3,800 | ) | | | (25,688 | ) |
Veracyte, Inc. | | | (12,850 | ) | | | (83,654 | ) |
| | | | | (463,495 | ) |
| | |
| Health Care Supplies | | | | | | | | |
Cerus Corp. | | | (37,550 | ) | | | (179,114 | ) |
Cooper Cos., Inc. (The) | | | (2,800 | ) | | | (426,608 | ) |
STAAR Surgical Co. | | | (7,950 | ) | | | (64,793 | ) |
TearLab Corp. | | | (7,410 | ) | | | (14,449 | ) |
| | | | | (684,964 | ) |
| | |
| Homebuilding | | | | | | | | |
New Home Co. Inc. (The) | | | (1,150 | ) | | | (16,456 | ) |
|
| Independent Power Producers & Energy Traders | |
Dynegy Inc. | | | (17,200 | ) | | | (334,196 | ) |
| | |
| Industrial Machinery | | | | | | | | |
ARC Group Worldwide, Inc. | | | (5,150 | ) | | | (10,403 | ) |
Chart Industries, Inc. | | | (3,350 | ) | | | (57,586 | ) |
| | | | | (67,989 | ) |
| | |
| Insurance Brokers | | | | | | | | |
eHealth, Inc. | | | (7,100 | ) | | | (84,845 | ) |
| | |
| Integrated Oil & Gas | | | | | | | | |
Chevron Corp. | | | (4,700 | ) | | | (427,136 | ) |
| | |
| Internet Retail | | | | | | | | |
Amazon.com, Inc. | | | (640 | ) | | | (400,576 | ) |
| | |
| Internet Software & Services | | | | | | | | |
Alphabet Inc.–Class A | | | (560 | ) | | | (412,938 | ) |
TrueCar, Inc. | | | (32,250 | ) | | | (198,015 | ) |
| | | | | (610,953 | ) |
| | | | | | | | |
| | | Shares | | | Value | |
| Life Sciences Tools & Services | | | | | | | | |
Accelerate Diagnostics, Inc. | | | (12,700 | ) | | $ | (212,979 | ) |
Illumina, Inc. | | | (800 | ) | | | (114,624 | ) |
NanoString Technologies, Inc. | | | (6,000 | ) | | | (87,060 | ) |
| | | | | (414,663 | ) |
| | |
| Marine | | | | | | | | |
Kirby Corp. | | | (900 | ) | | | (58,761 | ) |
| | |
| Mortgage REIT’s | | | | | | | | |
Altisource Residential Corp. | | | (16,200 | ) | | | (233,118 | ) |
Orchid Island Capital Inc. | | | (2,600 | ) | | | (23,088 | ) |
| | | | | (256,206 | ) |
| | |
| Motorcycle Manufacturers | | | | | | | | |
Kandi Technologies Group Inc. (China) | | | (17,800 | ) | | | (167,498 | ) |
| | |
| Movies & Entertainment | | | | | | | | |
IMAX Corp. | | | (4,250 | ) | | | (163,157 | ) |
Lions Gate Entertainment Corp. | | | (10,450 | ) | | | (407,237 | ) |
| | | | | (570,394 | ) |
| | |
| Oil & Gas Drilling | | | | | | | | |
Diamond Offshore Drilling, Inc. | | | (1,650 | ) | | | (32,802 | ) |
Unit Corp. | | | (7,000 | ) | | | (88,270 | ) |
| | | | | (121,072 | ) |
| | |
| Oil & Gas Equipment & Services | | | | | | | | |
Bristow Group, Inc. | | | (5,050 | ) | | | (175,387 | ) |
CARBO Ceramics Inc. | | | (2,200 | ) | | | (38,544 | ) |
Geospace Technologies Corp. | | | (1,150 | ) | | | (17,664 | ) |
Helix Energy Solutions Group Inc. | | | (14,800 | ) | | | (85,544 | ) |
McDermott International, Inc. | | | (28,800 | ) | | | (132,768 | ) |
| | | | | (449,907 | ) |
| |
| Oil & Gas Exploration & Production | | | | | |
Antero Resources Corp. | | | (2,400 | ) | | | (56,568 | ) |
Eclipse Resources Corp. | | | (62,700 | ) | | | (134,805 | ) |
Gulfport Energy Corp. | | | (13,750 | ) | | | (418,963 | ) |
Laredo Petroleum Inc. | | | (25,250 | ) | | | (289,870 | ) |
Memorial Resource Development Corp. | | | (10,800 | ) | | | (191,052 | ) |
Oasis Petroleum Inc. | | | (19,350 | ) | | | (225,041 | ) |
SM Energy Co. | | | (3,750 | ) | | | (125,062 | ) |
Southwestern Energy Co. | | | (39,350 | ) | | | (434,424 | ) |
Whiting Petroleum Corp. | | | (24,800 | ) | | | (427,304 | ) |
| | | | | (2,303,089 | ) |
| |
| Oil & Gas Storage & Transportation | | | | | |
Cheniere Energy, Inc. | | | (8,900 | ) | | | (440,728 | ) |
GasLog Ltd. (Monaco) | | | (16,200 | ) | | | (187,434 | ) |
Golar LNG Ltd. (Bermuda) | | | (13,500 | ) | | | (391,635 | ) |
Pembina Pipeline Corp. (Canada) | | | (1,750 | ) | | | (43,960 | ) |
SemGroup Corp–Class A | | | (6,400 | ) | | | (291,520 | ) |
| | | | | (1,355,277 | ) |
See accompanying Notes to Financial Statements which are an integral part of the financial statements.
13 Invesco All Cap Market Neutral Fund
| | | | | | | | |
| | | Shares | | | Value | |
| Packaged Foods & Meats | | | | | | | | |
Inventure Foods, Inc. | | | (2,950 | ) | | $ | (25,547 | ) |
Keurig Green Mountain Inc. | | | (7,250 | ) | | | (367,938 | ) |
| | | | | (393,485 | ) |
| | |
| Personal Products | | | | | | | | |
Elizabeth Arden, Inc. | | | (2,850 | ) | | | (35,739 | ) |
| | |
| Pharmaceuticals | | | | | | | | |
Aerie Pharmaceuticals, Inc. | | | (10,950 | ) | | | (249,770 | ) |
Agile Therapeutics, Inc. | | | (1,600 | ) | | | (12,704 | ) |
Akorn, Inc. | | | (16,250 | ) | | | (434,525 | ) |
Alimera Sciences Inc. | | | (14,300 | ) | | | (43,043 | ) |
Ampio Pharmaceuticals, Inc. | | | (13,550 | ) | | | (47,289 | ) |
Assembly Biosciences, Inc. | | | (6,400 | ) | | | (61,440 | ) |
BioDelivery Sciences International, Inc. | | | (24,450 | ) | | | (131,541 | ) |
Egalet Corp. | | | (6,350 | ) | | | (52,705 | ) |
Omeros Corp. | | | (4,550 | ) | | | (57,011 | ) |
Pacira Pharmaceuticals, Inc. | | | (5,250 | ) | | | (262,238 | ) |
TherapeuticsMD, Inc. | | | (39,750 | ) | | | (233,333 | ) |
XenoPort Inc. | | | (30,650 | ) | | | (187,271 | ) |
| | | | | (1,772,870 | ) |
| | |
| Property & Casualty Insurance | | | | | | | | |
Mercury General Corp. | | | (850 | ) | | | (45,909 | ) |
White Mountains Insurance Group, Ltd. | | | (535 | ) | | | (422,650 | ) |
| | | | | | | | (468,559 | ) |
| | |
| Real Estate Development | | | | | | | | |
Howard Hughes Corp. (The) | | | (3,350 | ) | | | (413,993 | ) |
| | |
| Real Estate Services | | | | | | | | |
Kennedy-Wilson Holdings Inc. | | | (13,300 | ) | | | (326,116 | ) |
| | |
| Reinsurance | | | | | | | | |
Greenlight Capital Re, Ltd.–Class A | | | (14,800 | ) | | | (325,008 | ) |
| | |
| Restaurants | | | | | | | | |
Kona Grill, Inc. | | | (5,450 | ) | | | (74,937 | ) |
| | |
| Semiconductor Equipment | | | | | | | | |
Rubicon Technology, Inc. | | | (7,700 | ) | | | (8,470 | ) |
SunEdison, Inc. | | | (45,250 | ) | | | (330,325 | ) |
| | | | | (338,795 | ) |
| | |
| Semiconductors | | | | | | | | |
Micron Technology, Inc. | | | (25,000 | ) | | | (414,000 | ) |
Qorvo, Inc. | | | (9,350 | ) | | | (410,746 | ) |
QuickLogic Corp. | | | (15,200 | ) | | | (20,976 | ) |
SunPower Corp. | | | (11,150 | ) | | | (299,266 | ) |
| | | | | (1,144,988 | ) |
| | |
| Soft Drinks | | | | | | | | |
Coca-Cola Co. (The) | | | (7,650 | ) | | | (323,977 | ) |
| | |
| Specialty Chemicals | | | | | | | | |
Platform Specialty Products Corp. | | | (18,350 | ) | | | (191,574 | ) |
Senomyx, Inc. | | | (20,400 | ) | | | (100,980 | ) |
| | | | | (292,554 | ) |
| | | | | | | | |
| | | Shares | | | Value | |
| Specialty Stores | | | | | | | | |
Cabela’s Inc. | | | (10,100 | ) | | $ | (395,617 | ) |
| | |
| Steel | | | | | | | | |
A. M. Castle & Co. | | | (7,400 | ) | | | (17,686 | ) |
| | |
| Systems Software | | | | | | | | |
CommVault Systems, Inc. | | | (3,850 | ) | | | (156,002 | ) |
NetSuite Inc. | | | (4,900 | ) | | | (416,843 | ) |
Tableau Software Inc.–Class A | | | (4,850 | ) | | | (407,206 | ) |
| | | | | (980,051 | ) |
|
| Technology Hardware, Storage & Peripherals | |
3D Systems Corp. | | | (12,750 | ) | | | (128,265 | ) |
Nimble Storage, Inc. | | | (11,450 | ) | | | (258,770 | ) |
Silicon Graphics International Corp. | | | (17,250 | ) | | | (75,383 | ) |
Stratasys, Ltd | | | (13,300 | ) | | | (339,150 | ) |
Violin Memory, Inc. | | | (34,550 | ) | | | (55,625 | ) |
| | | | | (857,193 | ) |
| | |
| Thrifts & Mortgage Finance | | | | | | | | |
Nationstar Mortgage Holdings, Inc. | | | (11,650 | ) | | | (154,595 | ) |
| |
| Trading Companies & Distributors | | | | | |
NOW Inc. | | | (11,450 | ) | | | (189,039 | ) |
| |
| Wireless Telecommunication Services | | | | | |
Sprint Corp. | | | (84,550 | ) | | | (399,922 | ) |
Total Equity Securities — Short | | | $ | (27,899,314 | ) |
See accompanying Notes to Financial Statements which are an integral part of the financial statements.
14 Invesco All Cap Market Neutral Fund
Statement of Assets and Liabilities
October 31, 2015
| | | | |
Assets: | |
Investments, at value (Cost $26,932,692) | | $ | 27,943,995 | |
Investments in affiliated money market funds, at value and cost | | | 3,951,979 | |
Total investments, at value (Cost $30,884,671) | | | 31,895,974 | |
Receivable for: | | | | |
Deposits with brokers for swap agreements | | | 30,523 | |
Investments sold | | | 1,949,841 | |
Fund shares sold | | | 453,015 | |
Dividends | | | 18,975 | |
Investment for trustee deferred compensation and retirement plans | | | 4,298 | |
Unrealized appreciation on swap agreements — OTC | | | 371,213 | |
Other assets | | | 8,193 | |
Total assets | | | 34,732,032 | |
|
Liabilities: | |
Payable for: | | | | |
Investments purchased | | | 1,735,731 | |
Fund shares reacquired | | | 75 | |
Swaps payable | | | 27,826 | |
Accrued fees to affiliates | | | 28,604 | |
Accrued trustees’ and officers’ fees and benefits | | | 1,562 | |
Accrued other operating expenses | | | 58,799 | |
Trustee deferred compensation and retirement plans | | | 4,298 | |
Unrealized depreciation on swap agreements — OTC | | | 17,738 | |
Total liabilities | | | 1,874,633 | |
Net assets applicable to shares outstanding | | $ | 32,857,399 | |
|
Net assets consist of: | |
Shares of beneficial interest | | $ | 29,419,453 | |
Undistributed net investment income | | | 4,240,112 | |
Undistributed net realized gain (loss) | | | (2,166,944 | ) |
Net unrealized appreciation | | | 1,364,778 | |
| | | $ | 32,857,399 | |
| | | | |
Net Assets: | |
Class A | | $ | 12,811,787 | |
Class C | | $ | 1,772,118 | |
Class R | | $ | 22,693 | |
Class Y | | $ | 16,906,880 | |
Class R5 | | $ | 598,754 | |
Class R6 | | $ | 745,167 | |
|
Shares outstanding, $0.01 par value per share,
with an unlimited number of shares authorized: | |
Class A | | | 1,075,002 | |
Class C | | | 150,706 | |
Class R | | | 1,913 | |
Class Y | | | 1,412,044 | |
Class R5 | | | 50,001 | |
Class R6 | | | 62,235 | |
Class A: | | | | |
Net asset value per share | | $ | 11.92 | |
Maximum offering price per share | | | | |
(Net asset value of $11.92 ¸ 94.50%) | | $ | 12.61 | |
Class C: | | | | |
Net asset value and offering price per share | | $ | 11.76 | |
Class R: | | | | |
Net asset value and offering price per share | | $ | 11.86 | |
Class Y: | | | | |
Net asset value and offering price per share | | $ | 11.97 | |
Class R5: | | | | |
Net asset value and offering price per share | | $ | 11.97 | |
Class R6: | | | | |
Net asset value and offering price per share | | $ | 11.97 | |
See accompanying Notes to Financial Statements which are an integral part of the financial statements.
15 Invesco All Cap Market Neutral Fund
Statement of Operations
For the year ended October 31, 2015
| | | | |
Investment income: | |
Dividends (net of foreign withholding taxes of $4,325) | | $ | 420,834 | |
Dividends from affiliated money market funds | | | 2,368 | |
Interest | | | 82,160 | |
Total investment income | | | 505,362 | |
| |
Expenses: | | | | |
Advisory fees | | | 343,246 | |
Administrative services fees | | | 50,000 | |
Custodian fees | | | 11,190 | |
Distribution fees: | | | | |
Class A | | | 26,495 | |
Class C | | | 10,528 | |
Class R | | | 1,288 | |
Dividends on short sales | | | 89,368 | |
Interest, facilities and maintenance fees | | | 484,166 | |
Transfer agent fees — A, C, R and Y | | | 28,236 | |
Transfer agent fees — R5 | | | 89 | |
Transfer agent fees — R6 | | | 73 | |
Trustees’ and officers’ fees and benefits | | | 19,117 | |
Registration and filing fees | | | 81,262 | |
Professional services fees | | | 63,633 | |
Other | | | 29,585 | |
Total expenses | | | 1,238,276 | |
Less: Fees waived and expenses reimbursed | | | (254,425 | ) |
Net expenses | | | 983,851 | |
Net investment income (loss) | | | (478,489 | ) |
| |
Realized and unrealized gain (loss) from: | | | | |
Net realized gain (loss) from: | | | | |
Investment securities | | | 85,886 | |
Securities sold short | | | (1,859,307 | ) |
Swap agreements | | | 4,716,396 | |
| | | | 2,942,975 | |
Change in net unrealized appreciation (depreciation) of: | | | | |
Investment securities | | | (75,525 | ) |
Securities sold short | | | (501,159 | ) |
Swap agreements | | | 353,475 | |
| | | | (223,209 | ) |
Net realized and unrealized gain | | | 2,719,766 | |
Net increase in net assets resulting from operations | | $ | 2,241,277 | |
See accompanying Notes to Financial Statements which are an integral part of the financial statements.
16 Invesco All Cap Market Neutral Fund
Statement of Changes in Net Assets
For the year ended October 31, 2015 and the period December 17, 2013 (commencement date) through October 31, 2014
| | | | | | | | |
| | | October 31,
2015 | | | December 17, 2013
(commencement date) through
October 31,
2014 | |
Operations: | | | | | |
Net investment income (loss) | | $ | (478,489 | ) | | $ | (315,332 | ) |
Net realized gain (loss) | | | 2,942,975 | | | | (387,164 | ) |
Change in net unrealized appreciation (depreciation) | | | (223,209 | ) | | | 1,587,987 | |
Net increase in net assets resulting from operations | | | 2,241,277 | | | | 885,491 | |
| | |
Share transactions–net: | | | | | | | | |
Class A | | | 2,123,323 | | | | 9,349,083 | |
Class C | | | 837,576 | | | | 848,820 | |
Class R | | | (19,669 | ) | | | 38,619 | |
Class Y | | | 1,182,147 | | | | 14,247,251 | |
Class R5 | | | (112,330 | ) | | | 604,228 | |
Class R6 | | | 83,572 | | | | 548,011 | |
Net increase in net assets resulting from share transactions | | | 4,094,619 | | | | 25,636,012 | |
Net increase in net assets | | | 6,335,896 | | | | 26,521,503 | |
| | |
Net assets: | | | | | | | | |
Beginning of year | | | 26,521,503 | | | | — | |
End of year (includes undistributed net investment income (loss) of $4,240,112 and $(1,547), respectively) | | $ | 32,857,399 | | | $ | 26,521,503 | |
See accompanying Notes to Financial Statements which are an integral part of the financial statements.
17 Invesco All Cap Market Neutral Fund
Statement of Cash Flows
For the year ended October 31, 2015
| | | | |
Cash provided by operating activities: | | | | |
Net increase in net assets resulting from operations | | $ | 2,241,277 | |
|
Adjustments to reconcile the change in net assets applicable from operations to net cash provided by (used in) operating activities: | |
Purchases of investments | | | (50,274,072 | ) |
Net change in unrealized appreciation from swap agreements | | | (353,475 | ) |
Proceeds from sales of investments | | | 42,373,554 | |
Decrease in receivables and other assets | | | 23,915,794 | |
Payments to cover securities sold short | | | (57,983,012 | ) |
Proceeds from securities sold short | | | 31,319,623 | |
Net realized gain (loss) from securities sold short | | | 1,859,307 | |
Net change in unrealized depreciation on securities sold short | | | 501,159 | |
Increase in accrued expenses and other payables | | | 6,265 | |
Net realized gain from investment securities | | | (85,886 | ) |
Net change in unrealized depreciation on investment securities | | | 75,525 | |
Net cash provided by (used in) operating activities | | | (6,403,941 | ) |
| |
Cash provided by financing activities: | | | | |
Proceeds from shares of beneficial interest sold | | | 31,206,307 | |
Disbursements from shares of beneficial interest reacquired | | | (27,674,390 | ) |
Net cash provided by financing activities | | | 3,531,917 | |
Net increase (decrease) in cash and cash equivalents | | | (2,872,024 | ) |
Cash at beginning of year | | | 6,824,003 | |
Cash at end of year | | $ | 3,951,979 | |
Notes to Financial Statements
October 31, 2015
NOTE 1—Significant Accounting Policies
Invesco All Cap Market Neutral Fund (the “Fund”) is a series portfolio of AIM Investment Funds (Invesco Investment Funds) (the “Trust”). The Trust is organized as a Delaware statutory trust and is registered under the Investment Company Act of 1940, as amended (the “1940 Act”), as an open-end series management investment company consisting of twenty-four separate series portfolios, each authorized to issue an unlimited number of shares of beneficial interest. The assets, liabilities and operations of each portfolio are accounted for separately. Information presented in these financial statements pertains only to the Fund. Matters affecting each portfolio or class will be voted on exclusively by the shareholders of such portfolio or class.
The Fund’s investment objective is to provide a positive return over a full market cycle from a broadly diversified portfolio of stocks while seeking to limit exposure to the general risks associated with stock market investing.
The Fund currently consists of six different classes of shares: Class A, Class C, Class R, Class Y, Class R5 and Class R6. Class A shares are sold with a front-end sales charge unless certain waiver criteria are met and under certain circumstances load waived shares may be subject to contingent deferred sales charges (“CDSC”). Class C shares are sold with a CDSC. Class R, Class Y, Class R5 and Class R6 shares are sold at net asset value.
The following is a summary of the significant accounting policies followed by the Fund in the preparation of its financial statements.
| A. | Security Valuations — Securities, including restricted securities, are valued according to the following policy. |
A security listed or traded on an exchange (except convertible securities) is valued at its last sales price or official closing price as of the close of the customary trading session on the exchange where the security is principally traded, or lacking any sales or official closing price on a particular day, the security may be valued at the closing bid price on that day. Securities traded in the over-the-counter market are valued based on prices furnished by independent pricing services or market makers. When such securities are valued by an independent pricing service they may be considered fair valued. Futures contracts are valued at the final settlement price set by an exchange on which they are principally traded. Listed options are valued at the mean between the last bid and asked prices from the exchange on which they are principally traded. Options not listed on an exchange are valued by an independent source at the mean between the last bid and asked prices. For purposes of determining net asset value (“NAV”) per share, futures and option contracts generally are valued 15 minutes after the close of the customary trading session of the New York Stock Exchange (“NYSE”).
Investments in open-end and closed-end registered investment companies that do not trade on an exchange are valued at the end-of-day net asset value per share. Investments in open-end and closed-end registered investment companies that trade on an exchange are valued at the last sales price or official closing price as of the close of the customary trading session on the exchange where the security is principally traded.
Debt obligations (including convertible securities) and unlisted equities are fair valued using an evaluated quote provided by an independent pricing service. Evaluated quotes provided by the pricing service may be determined without exclusive reliance on quoted prices, and may reflect appropriate factors such as institution-size trading in similar groups of securities, developments related to specific securities, dividend rate (for unlisted equities), yield (for debt obligations), quality, type of issue, coupon rate (for debt obligations), maturity (for debt obligations), individual trading characteristics and other market data. Debt obligations are subject to interest rate and credit risks. In addition, all debt obligations involve some risk of default with respect to interest and/or principal payments.
18 Invesco All Cap Market Neutral Fund
Foreign securities’ (including foreign exchange contracts) prices are converted into U.S. dollar amounts using the applicable exchange rates as of the close of the NYSE. If market quotations are available and reliable for foreign exchange-traded equity securities, the securities will be valued at the market quotations. Because trading hours for certain foreign securities end before the close of the NYSE, closing market quotations may become unreliable. If between the time trading ends on a particular security and the close of the customary trading session on the NYSE, events occur that the Adviser determines are significant and make the closing price unreliable, the Fund may fair value the security. If the event is likely to have affected the closing price of the security, the security will be valued at fair value in good faith using procedures approved by the Board of Trustees. Adjustments to closing prices to reflect fair value may also be based on a screening process of an independent pricing service to indicate the degree of certainty, based on historical data, that the closing price in the principal market where a foreign security trades is not the current value as of the close of the NYSE. Foreign securities’ prices meeting the approved degree of certainty that the price is not reflective of current value will be priced at the indication of fair value from the independent pricing service. Multiple factors may be considered by the independent pricing service in determining adjustments to reflect fair value and may include information relating to sector indices, American Depositary Receipts and domestic and foreign index futures. Foreign securities may have additional risks including exchange rate changes, potential for sharply devalued currencies and high inflation, political and economic upheaval, the relative lack of issuer information, relatively low market liquidity and the potential lack of strict financial and accounting controls and standards.
Securities for which market prices are not provided by any of the above methods may be valued based upon quotes furnished by independent sources. The last bid price may be used to value equity securities. The mean between the last bid and asked prices is used to value debt obligations, including corporate loans.
Securities for which market quotations are not readily available or became unreliable are valued at fair value as determined in good faith by or under the supervision of the Trust’s officers following procedures approved by the Board of Trustees. Issuer specific events, market trends, bid/asked quotes of brokers and information providers and other market data may be reviewed in the course of making a good faith determination of a security’s fair value.
The Fund may invest in securities that are subject to interest rate risk, meaning the risk that the prices will generally fall as interest rates rise and, conversely, the prices will generally rise as interest rates fall. Specific securities differ in their sensitivity to changes in interest rates depending on their individual characteristics. Changes in interest rates may result in increased market volatility, which may affect the value and/or liquidity of certain Fund investments.
Valuations change in response to many factors including the historical and prospective earnings of the issuer, the value of the issuer’s assets, general economic conditions, interest rates, investor perceptions and market liquidity. Because of the inherent uncertainties of valuation, the values reflected in the financial statements may materially differ from the value received upon actual sale of those investments.
| B. | Securities Transactions and Investment Income — Securities transactions are accounted for on a trade date basis. Realized gains or losses on sales are computed on the basis of specific identification of the securities sold. Interest income and short stock rebate income are recorded on the accrual basis. Dividend income (net of withholding tax, if any) and dividend expense on short sales are recorded on the ex-dividend date. Premiums and discounts are amortized and/or accreted for financial reporting purposes. |
The Fund may periodically participate in litigation related to Fund investments. As such, the Fund may receive proceeds from litigation settlements. Any proceeds received are included in the Statement of Operations as realized gain (loss) for investments no longer held and as unrealized gain (loss) for investments still held.
Brokerage commissions and mark ups are considered transaction costs and are recorded as an increase to the cost basis of securities purchased and/or a reduction of proceeds on a sale of securities. Such transaction costs are included in the determination of net realized and unrealized gain (loss) from investment securities reported in the Statement of Operations and the Statement of Changes in Net Assets and the net realized and unrealized gains (losses) on securities per share in the Financial Highlights. Transaction costs are included in the calculation of the Fund’s net asset value and, accordingly, they reduce the Fund’s total returns. These transaction costs are not considered operating expenses and are not reflected in net investment income reported in the Statement of Operations and the Statement of Changes in Net Assets, or the net investment income per share and the ratios of expenses and net investment income reported in the Financial Highlights, nor are they limited by any expense limitation arrangements between the Fund and the investment adviser.
The Fund allocates income and realized and unrealized capital gains and losses to a class based on the relative net assets of each class.
| C. | Country Determination — For the purposes of making investment selection decisions and presentation in the Schedule of Investments, the investment adviser may determine the country in which an issuer is located and/or credit risk exposure based on various factors. These factors include the laws of the country under which the issuer is organized, where the issuer maintains a principal office, the country in which the issuer derives 50% or more of its total revenues and the country that has the primary market for the issuer’s securities, as well as other criteria. Among the other criteria that may be evaluated for making this determination are the country in which the issuer maintains 50% or more of its assets, the type of security, financial guarantees and enhancements, the nature of the collateral and the sponsor organization. Country of issuer and/or credit risk exposure has been determined to be the United States of America, unless otherwise noted. |
| D. | Distributions — Distributions from net investment income and net realized capital gain, if any, are generally declared and paid annually and recorded on the ex-dividend date. The Fund may elect to treat a portion of the proceeds from redemptions as distributions for federal income tax purposes. |
| E. | Federal Income Taxes — The Fund intends to comply with the requirements of Subchapter M of the Internal Revenue Code of 1986, as amended (the “Internal Revenue Code”), necessary to qualify as a regulated investment company and to distribute substantially all of the Fund’s taxable earnings to shareholders. As such, the Fund will not be subject to federal income taxes on otherwise taxable income (including net realized capital gain) that is distributed to shareholders. Therefore, no provision for federal income taxes is recorded in the financial statements. |
The Fund recognizes the tax benefits of uncertain tax positions only when the position is more likely than not to be sustained. Management has analyzed the Fund’s uncertain tax positions and concluded that no liability for unrecognized tax benefits should be recorded related to uncertain tax positions. Management is not aware of any tax positions for which it is reasonably possible that the total amounts of unrecognized tax benefits will change materially in the next 12 months.
The Fund files tax returns in the U.S. Federal jurisdiction and certain other jurisdictions. Generally, the Fund is subject to examinations by such taxing authorities for up to three years after the filing of the return for the tax period.
19 Invesco All Cap Market Neutral Fund
| F. | Expenses — Fees provided for under the Rule 12b-1 plan of a particular class of the Fund are charged to the operations of such class. Transfer agency fees and expenses and other shareholder recordkeeping fees and expenses attributable to Class R5 and Class R6 are allocated to each share class based on relative net assets. Sub-accounting fees attributable to Class R5 are charged to the operations of the class. Transfer agency fees and expenses and other shareholder recordkeeping fees and expenses relating to all other classes are allocated among those classes based on relative net assets. All other expenses are allocated among the classes based on relative net assets. |
| G. | Accounting Estimates — The preparation of financial statements in conformity with accounting principles generally accepted in the United States of America (“GAAP”) requires management to make estimates and assumptions that affect the reported amounts of assets and liabilities at the date of the financial statements and the reported amounts of revenues and expenses during the reporting period including estimates and assumptions related to taxation. Actual results could differ from those estimates by a significant amount. In addition, the Fund monitors for material events or transactions that may occur or become known after the period-end date and before the date the financial statements are released to print. |
| H. | Indemnifications — Under the Trust’s organizational documents, each Trustee, officer, employee or other agent of the Trust is indemnified against certain liabilities that may arise out of the performance of their duties to the Fund. Additionally, in the normal course of business, the Fund enters into contracts, including the Fund’s servicing agreements, that contain a variety of indemnification clauses. The Fund’s maximum exposure under these arrangements is unknown as this would involve future claims that may be made against the Fund that have not yet occurred. The risk of material loss as a result of such indemnification claims is considered remote. |
| I. | Cash and Cash Equivalents — For the purposes of the Statement of Cash Flows, the Fund defines Cash and Cash Equivalents as cash (including foreign currency), money market funds and other investments held in lieu of cash and excludes investments made with cash collateral received. |
| J. | Securities Sold Short — The Fund may enter into short sales of securities which it concurrently holds (“covered”) or for which it holds no corresponding position (“not covered”). Securities sold short represent a liability of the Fund to acquire specific securities at prevailing market prices at a future date in order to satisfy the obligation to deliver the securities sold. The liability is recorded on the books of the Fund at the market value of the common stock determined each day in accordance with the Fund’s security valuations policy. The Fund will incur a loss if the price of the security increases between the date of short sale and the date on which the Fund replaces the borrowed security. The Fund realizes a gain if the price of the security declines between those dates. For positions not covered, there is no ceiling on the ultimate price paid for the securities to cover the short position and therefore, the loss could exceed the amount of proceeds received. |
The Fund is required to segregate cash or securities as collateral in margin accounts with the broker at a level that is equal to the obligation to the broker who delivered such securities to the buyer on behalf of the Fund. The short stock rebate presented in the Statement of Operations represents the net income earned on short sale proceeds held on deposit with the broker and margin interest earned or incurred on short sale transactions. The Fund may also earn or incur margin interest on short sale transactions. Margin interest is the income earned (or expenses incurred) as a result of the market value of securities sold short being less than (or greater than) the proceeds received on the short sales. Margin interest earned is shown in the Statement of Operations as Interest and margin interest expenses incurred are shown in the Statement of Operations as Interest, facilities and maintenance fees.
| K. | Swap Agreements — The Fund may enter into various swap transactions, including interest rate, total return, volatility, variance, index, currency and credit default swap contracts (“CDS”) for investment purposes or to manage interest rate, equity, currency or credit risk. Such transactions are agreements between two parties (“Counterparties”). These agreements may contain among other conditions, events of default and termination events, and various covenants and representations such as provisions that require the Fund to maintain a pre-determined level of net assets, and/or provide limits regarding the decline of the Fund’s NAV over specific periods of time. If the Fund were to trigger such provisions and have open derivative positions at that time, the Counterparty may be able to terminate such agreement and request immediate payment in an amount equal to the net liability positions, if any. |
Interest rate, total return, volatility, variance, index, and currency swap agreements are two-party contracts entered into primarily to exchange the returns (or differentials in rates of returns) earned or realized on particular predetermined investments or instruments. The gross returns to be exchanged or “swapped” between the parties are calculated with respect to a notional amount, i.e., the return on or increase in value of a particular dollar amount invested at a particular interest rate or return of an underlying asset, in a particular foreign currency, or in a “basket” of securities representing a particular index.
A total return swap is an agreement in which one party makes payments based on a set rate, either fixed or variable, while the other party makes payments based on the return of an underlying asset, which includes both the income generated and capital gains, if any. The unrealized appreciation (depreciation) on total return swaps includes dividends on the underlying equity securities and financing rate payable from the Counterparty. At the maturity date, a net cash flow is exchanged where the total return is equivalent to the return of the underlying reference less a financing rate, if any. As a receiver, the Fund would receive payments based on any positive total return and would owe payments in the event of a negative total return. As the payer, the Fund would owe payments on any net positive total return, and would receive payment in the event of a negative total return.
Changes in the value of swap agreements are recognized as unrealized gains (losses) in the Statement of Operations by “marking to market” on a daily basis to reflect the value of the swap agreement at the end of each trading day. Payments received or paid at the beginning of the agreement are reflected as such on the Statement of Assets and Liabilities and may be referred to as upfront payments. The Fund accrues for the fixed payment stream and amortizes upfront payments, if any, on swap agreements on a daily basis with the net amount, recorded as a component of realized gain (loss) on the Statement of Operations. A liquidation payment received or made at the termination of a swap agreement is recorded as realized gain (loss) on the Statement of Operations. The Fund segregates liquid securities having a value at least equal to the amount of the potential obligation of a Fund under any swap transaction. Entering into these agreements involves, to varying degrees, lack of liquidity and elements of credit, market, and Counterparty risk in excess of amounts recognized on the Statement of Assets and Liabilities. Such risks involve the possibility that a swap is difficult to sell or liquidate; the Counterparty does not honor its obligations under the agreement and unfavorable interest rates and market fluctuations. It is possible that developments in the swaps market, including potential government regulation, could adversely affect the Fund’s ability to terminate existing swap agreements or to realize amounts to be received under such agreements. A short position in a security poses more risk than holding the same security long. As there is no limit on how much the price of the security can increase, the Fund’s exposure is unlimited.
20 Invesco All Cap Market Neutral Fund
| L. | Leverage Risk — Leverage exists when the Fund can lose more than it originally invests because it purchases or sells an instrument or enters into a transaction without investing an amount equal to the full economic exposure of the instrument or transaction. |
| M. | Collateral — To the extent the Fund has designated or segregated a security as collateral and that security is subsequently sold, it is the Fund’s practice to replace such collateral no later than the next business day. |
NOTE 2—Advisory Fees and Other Fees Paid to Affiliates
The Trust has entered into a master investment advisory agreement with Invesco Advisers, Inc. (the “Adviser” or “Invesco”). Under the terms of the investment advisory agreement, the Fund pays an advisory fee to the Adviser based on the annual rate of the Fund’s average daily net assets as follows:
| | | | |
| Average Daily Net Assets | | Rate | |
First $10 billion | | | 1.25% | |
Over $10 billion | | | 1.15% | |
For the year ended October 31, 2015, the effective advisory fees incurred by the Fund was 1.25%.
Under the terms of a master sub-advisory agreement between the Adviser and each of Invesco Asset Management Deutschland GmbH, Invesco Asset Management Limited, Invesco Asset Management (Japan) Limited, Invesco Hong Kong Limited, Invesco Senior Secured Management, Inc., Invesco Canada Ltd. and Invesco PowerShares Capital Management LLC (collectively, the “Affiliated Sub-Advisers”) the Adviser, not the Fund, may pay 40% of the fees paid to the Adviser to any such Affiliated Sub-Adviser(s) that provide(s) discretionary investment management services to the Fund based on the percentage of assets allocated to such Affiliated Sub-Adviser(s).
The Adviser has contractually agreed, through at least February 28, 2017, to waive advisory fees and/or reimburse expenses to the extent necessary to limit total annual fund operating expenses after fee waiver and/or expense reimbursement (excluding certain items discussed below) of Class A, Class C, Class R, Class Y, Class R5 and Class R6 shares to 1.62%, 2.37%, 1.87%, 1.37%, 1.37% and 1.37% of average daily net assets, respectively. In determining the Adviser’s obligation to waive advisory fees and/or reimburse expenses, the following expenses are not taken into account, and could cause total annual fund operating expenses after fee waiver and/or expense reimbursement to exceed the numbers reflected above: (1) interest; (2) taxes; (3) dividend expense on short sales; (4) extraordinary or non-routine items, including litigation expenses; and (5) expenses that the Fund has incurred but did not actually pay because of an expense offset arrangement. Unless Invesco continues the fee waiver agreement, it will terminate on February 28, 2017. The fee waiver agreement cannot be terminated during its term.
Further, the Adviser has contractually agreed, through at least June 30, 2017, to waive the advisory fee payable by the Fund in an amount equal to 100% of the net advisory fees the Adviser receives from the affiliated money market funds on investments by the Fund of uninvested cash in such affiliated money market funds.
For the year ended October 31, 2015, the Adviser waived advisory fees of $226,026 and reimbursed class level expenses of $11,389, $1,131, $277, $15,439, $89 and $74 of Class A, Class C, Class R, Class Y, Class R5 and Class R6 shares, respectively.
The Trust has entered into a master administrative services agreement with Invesco pursuant to which the Fund has agreed to pay Invesco for certain administrative costs incurred in providing accounting services to the Fund. For the year ended October 31, 2015, expenses incurred under the agreement are shown in the Statement of Operations as Administrative services fees.
The Trust has entered into a transfer agency and service agreement with Invesco Investment Services, Inc. (“IIS”) pursuant to which the Fund has agreed to pay IIS a fee for providing transfer agency and shareholder services to the Fund and reimburse IIS for certain expenses incurred by IIS in the course of providing such services. IIS may make payments to intermediaries that provide omnibus account services, sub-accounting services and/or networking services. All fees payable by IIS to intermediaries that provide omnibus account services or sub-accounting are charged back to the Fund, subject to certain limitations approved by the Trust’s Board of Trustees. For the year ended October 31, 2015, expenses incurred under the agreement are shown in the Statement of Operations as Transfer agent fees.
The Trust has entered into master distribution agreements with Invesco Distributors, Inc. (“IDI”) to serve as the distributor for the Class A, Class C, Class R, Class Y, Class R5 and Class R6 shares of the Fund. The Trust has adopted plans pursuant to Rule 12b-1 under the 1940 Act with respect to the Fund’s Class A, Class C and Class R shares (collectively the “Plans”). The Fund, pursuant to the Plans, pays IDI compensation at the annual rate of 0.25% of the Fund’s average daily net assets of Class A shares, 1.00% of the average daily net assets of Class C shares and 0.50% of the average daily net assets of Class R shares. Of the Plan payments, up to 0.25% of the average daily net assets of each class of shares may be paid to furnish continuing personal shareholder services to customers who purchase and own shares of such classes. Any amounts not paid as a service fee under the Plans would constitute an asset-based sales charge. Rules of the Financial Industry Regulatory Authority (“FINRA”) impose a cap on the total sales charges, including asset-based sales charges, that may be paid by any class of shares of the Fund. For the year ended October 31, 2015, expenses incurred under the Plans are shown in the Statement of Operations as Distribution fees.
Front-end sales commissions and CDSC (collectively, the “sales charges”) are not recorded as expenses of the Fund. Front-end sales commissions are deducted from proceeds from the sales of Fund shares prior to investment in Class A shares of the Fund. CDSC are deducted from redemption proceeds prior to remittance to the shareholder. During the year ended October 31, 2015, IDI advised the Fund that IDI retained $4,930 in front-end sales commissions from the sale of Class A shares and $1,317 from Class C shares, respectively, for CDSC imposed upon redemptions by shareholders.
Certain officers and trustees of the Trust are officers and directors of the Adviser, IIS and/or IDI.
NOTE 3—Additional Valuation Information
GAAP defines fair value as the price that would be received to sell an asset or paid to transfer a liability in an orderly transaction between market participants at the measurement date, under current market conditions. GAAP establishes a hierarchy that prioritizes the inputs to valuation methods, giving the highest priority to readily available unadjusted quoted prices in an active market for identical assets (Level 1) and the lowest priority to significant unobservable inputs (Level 3), generally when market prices are not readily available or are unreliable. Based on the valuation inputs, the securities or other investments are tiered into one of three levels. Changes in valuation methods may result in transfers in or out of an investment’s assigned level:
| | Level 1 — | Prices are determined using quoted prices in an active market for identical assets. |
21 Invesco All Cap Market Neutral Fund
| | Level 2 — | Prices are determined using other significant observable inputs. Observable inputs are inputs that other market participants may use in pricing a security. These may include quoted prices for similar securities, interest rates, prepayment speeds, credit risk, yield curves, loss severities, default rates, discount rates, volatilities and others. |
| | Level 3 — | Prices are determined using significant unobservable inputs. In situations where quoted prices or observable inputs are unavailable (for example, when there is little or no market activity for an investment at the end of the period), unobservable inputs may be used. Unobservable inputs reflect the Fund’s own assumptions about the factors market participants would use in determining fair value of the securities or instruments and would be based on the best available information. |
The following is a summary of the tiered valuation input levels, as of October 31, 2015. The level assigned to the securities valuations may not be an indication of the risk or liquidity associated with investing in those securities. Because of the inherent uncertainties of valuation, the values reflected in the financial statements may materially differ from the value received upon actual sale of those investments.
| | | | | | | | | | | | | | | | |
| | | Level 1 | | | Level 2 | | | Level 3 | | | Total | |
Equity Securities | | $ | 31,895,974 | | | $ | — | | | $ | — | | | $ | 31,895,974 | |
Swap Agreements* | | | — | | | | 353,475 | | | | — | | | | 353,475 | |
Total Investments | | $ | 31,895,974 | | | $ | 353,475 | | | $ | — | | | $ | 32,249,449 | |
| * | Unrealized appreciation. |
NOTE 4—Derivative Investments
Value of Derivative Investments at Period-End
The table below summarizes the value of the Fund’s derivative investments, detailed by primary risk exposure, held as of October 31, 2015:
| | | | | | | | |
| | | Value | |
| Risk Exposure/Derivative Type | | Assets | | | Liabilities | |
Equity risk: | | | | | | | | |
Swap agreements(a) | | $ | 371,213 | | | $ | (17,738 | ) |
| (a) | Values are disclosed on the Statement of Assets and Liabilities under the captions Unrealized appreciation on swap agreements — OTC and Unrealized depreciation on swap agreements — OTC. |
Effect of Derivative Investments for the year ended October 31, 2015
The table below summarizes the gains on derivative investments, detailed by primary risk exposure, recognized in earnings during the period:
| | | | |
| | | Location of Gain on
Statement of Operations | |
| | | Swap
Agreements | |
Realized Gain: | | | | |
Equity risk | | $ | 4,716,396 | |
Change in Net Unrealized Appreciation: | | | | |
Equity risk | | | 353,475 | |
Total | | $ | 5,069,871 | |
The table below summarizes the average notional value of swap agreements outstanding during the period.
| | | | |
| | | Swap
Agreements | |
Average notional value | | $ | 21,595,089 | |
Offsetting Assets and Liabilities
Accounting Standards Update (“ASU”) No. 2011-11, Disclosures about Offsetting Assets and Liabilities, which was subsequently clarified in Financial Accounting Standards Board ASU 2013-01 “Clarifying the Scope of Disclosures about Offsetting Assets and Liabilities” is intended to enhance disclosures about financial instruments and derivative instruments that are subject to offsetting arrangements on the Statement of Assets and Liabilities and to enable investors to better understand the effect of those arrangements on the Fund’s financial position. In order for an arrangement to be eligible for netting, the Fund must have a basis to conclude that such netting arrangements are legally enforceable. The Fund enters into netting agreements and collateral agreements in an attempt to reduce the Fund’s Counterparty credit risk by providing for a single net settlement with a Counterparty of all financial transactions covered by the agreement in an event of default as defined under such agreement.
The following tables present derivative instruments that are either subject to an enforceable netting agreement or offset by collateral arrangements as of October 31, 2015.
| | | | | | | | | | | | | | | | | | | | |
| | | Gross amounts
of Recognized
Assets | | | Gross Amounts Not Offset in the
Statement of Assets and Liabilities | | | | |
| | | | Financial
Instruments | | | Collateral Received | | | Net
Amount | |
| Counterparty | | | | Non-Cash | | | Cash | | |
Morgan Stanley & Co. LLC | | $ | 371,213 | | | $ | (45,564 | ) | | $ | — | | | $ | — | | | $ | 325,649 | |
22 Invesco All Cap Market Neutral Fund
| | | | | | | | | | | | | | | | | | | | |
| | | Gross amounts
of Recognized
Liabilities | | | Gross Amounts Not Offset in the
Statement of Assets and Liabilities | | | | |
| | | | Financial
Instruments | | | Collateral Pledged | | | Net
Amount | |
| Counterparty | | | | Non-Cash | | | Cash | | |
Morgan Stanley & Co. LLC | | $ | 45,564 | | | $ | (45,564 | ) | | $ | — | | | $ | — | | | $ | — | |
NOTE 5—Trustees’ and Officers’ Fees and Benefits
Trustees’ and Officers’ Fees and Benefits include amounts accrued by the Fund to pay remuneration to certain Trustees and Officers of the Fund. Trustees have the option to defer compensation payable by the Fund, and Trustees’ and Officers’ Fees and Benefits also include amounts accrued by the Fund to fund such deferred compensation amounts. Those Trustees who defer compensation have the option to select various Invesco Funds in which their deferral accounts shall be deemed to be invested. Obligations under the deferred compensation plan represent unsecured claims against the general assets of the Fund.
NOTE 6—Cash Balances
The Fund is permitted to temporarily carry a negative or overdrawn balance in its account with State Street Bank and Trust Company, the custodian bank. Such balances, if any at period end, are shown in the Statement of Assets and Liabilities under the payable caption Amount due custodian. To compensate the custodian bank for such overdrafts, the overdrawn Fund may either (1) leave funds as a compensating balance in the account so the custodian bank can be compensated by earning the additional interest; or (2) compensate by paying the custodian bank at a rate agreed upon by the custodian bank and Invesco, not to exceed the contractually agreed upon rate.
NOTE 7—Distributions to Shareholders and Tax Components of Net Assets
There were no ordinary income and long-term gain distributions paid during the period October 31, 2014 through October 31, 2015.
Tax Components of Net Assets at Period-End:
| | | | |
| | | 2015 | |
Undistributed ordinary income | | $ | 4,597,599 | |
Net unrealized appreciation — investments | | | 799,863 | |
Temporary book/tax differences | | | (4,013 | ) |
Capital loss carryforward | | | (1,955,503 | ) |
Shares of beneficial interest | | | 29,419,453 | |
Total net assets | | $ | 32,857,399 | |
The difference between book-basis and tax-basis unrealized appreciation (depreciation) is due to differences in the timing of recognition of gains and losses on investments for tax and book purposes. The Fund’s net unrealized appreciation difference is attributable primarily to wash sales.
The temporary book/tax differences are a result of timing differences between book and tax recognition of income and/or expenses. The Fund’s temporary book/tax differences are the result of the trustee deferral of compensation and retirement plan benefits.
Capital loss carryforward is calculated and reported as of a specific date. Results of transactions and other activity after that date may affect the amount of capital loss carryforward actually available for the Fund to utilize. The ability to utilize capital loss carryforward in the future may be limited under the Internal Revenue Code and related regulations based on the results of future transactions.
The Fund has a capital loss carryforward as of October 31, 2015, which expires as follows:
| | | | | | | | | | | | |
| Capital Loss Carryforward* | |
| Expiration | | Short-Term | | | Long-Term | | | Total | |
Not subject to expiration | | $ | 1,955,503 | | | $ | | | | $ | 1,955,503 | |
| * | Capital loss carryforward as of the date listed above is reduced for limitations, if any, to the extent required by the Internal Revenue Code and may be further limited depending upon a variety of factors, including the realization of net unrealized gains or losses as of the date of any reorganization. |
NOTE 8—Investment Securities
The aggregate amount of investment securities (other than short-term securities, U.S. Treasury obligations and money market funds, if any) purchased and sold by the Fund during the year ended October 31, 2015 was $46,663,510 and $43,223,173, respectively. Cost of investments on a tax basis includes the adjustments for financial reporting purposes as of the most recently completed federal income tax reporting period-end.
| | | | |
| Unrealized Appreciation (Depreciation) of Investment Securities on a Tax Basis | |
Aggregate unrealized appreciation of investment securities | | $ | 2,741,631 | |
Aggregate unrealized (depreciation) of investment securities | | | (1,941,768 | ) |
Net unrealized appreciation of investment securities | | $ | 799,863 | |
Cost of investments for tax purposes is $31,096,111.
23 Invesco All Cap Market Neutral Fund
NOTE 9—Reclassification of Permanent Differences
Primarily as a result of differing book/tax treatment of swap agreement income, short sales and net operating loss, on October 31, 2015, undistributed net investment income was increased by $4,720,148, undistributed net realized gain (loss) was decreased by $4,721,588 and shares of beneficial interest was increased by $1,440. This reclassification had no effect on the net assets of the Fund.
NOTE 10—Share Information
| | | | | | | | | | | | | | | | |
| | | Summary of Share Activity | |
| | | Year ended
October 31, 2015(a) | | | December 17, 2013
(commencement date) through
October 31, 2014 | |
| | | Shares | | | Amount | | | Shares | | | Amount | |
Sold: | | | | | | | | | | | | | | | | |
Class A | | | 1,145,421 | | | $ | 12,745,791 | | | | 951,991 | | | $ | 9,785,091 | |
Class C | | | 193,382 | | | | 2,124,532 | | | | 130,154 | | | | 1,361,251 | |
Class R | | | 23,122 | | | | 252,070 | | | | 3,713 | | | | 38,619 | |
Class Y | | | 1,461,895 | | | | 16,219,741 | | | | 1,373,449 | | | | 14,321,343 | |
Class R5 | | | — | | | | — | | | | 60,560 | | | | 606,027 | |
Class R6 | | | 12,424 | | | | 134,891 | | | | 54,496 | | | | 548,011 | |
| | | | |
Reacquired: | | | | | | | | | | | | | | | | |
Class A | | | (980,822 | ) | | | (10,622,468 | ) | | | (41,588 | ) | | | (436,008 | ) |
Class C | | | (123,275 | ) | | | (1,286,956 | ) | | | (49,555 | ) | | | (512,431 | ) |
Class R | | | (24,922 | ) | | | (271,739 | ) | | | — | | | | — | |
Class Y | | | (1,416,243 | ) | | | (15,037,594 | ) | | | (7,057 | ) | | | (74,092 | ) |
Class R5 | | | (10,386 | ) | | | (112,330 | ) | | | (173 | ) | | | (1,799 | ) |
Class R6 | | | (4,685 | ) | | | (51,319 | ) | | | — | | | | — | |
Net increase in share activity | | | 275,911 | | | $ | 4,094,619 | | | | 2,475,990 | | | $ | 25,636,012 | |
| (a) | There is an entity that is a record owner of more than 5% of the outstanding shares of the Fund and owns 36% of the outstanding shares of the Fund. IDI has an agreement with this entity to sell Fund shares. The Fund, Invesco and/or Invesco affiliates may make payments to this entity, which is considered to be related to the Fund, for providing services to the Fund, Invesco and/or Invesco affiliates including but not limited to services such as, securities brokerage, distribution, third party record keeping and account servicing. The Fund has no knowledge as to whether all or any portion of the shares owned of record by this entity is also owned beneficially. |
| | In addition, 36% of the outstanding shares of the Fund are owned by affiliated mutual funds. Affiliated mutual funds are mutual funds that are advised by Invesco. |
24 Invesco All Cap Market Neutral Fund
NOTE 11—Financial Highlights
The following schedule presents financial highlights for a share of the Fund outstanding throughout the periods indicated.
| | | | | | | | | | | | | | | | | | | | | | | | | | | | | | | | | | | | | | | | | | | | | | | | | | | | | | | | |
| | | Net asset
value,
beginning
of period | | | Net
investment
income
(loss)(a) | | | Net gains
on securities
(both
realized and
unrealized) | | | Total from
investment
operations | | | Net asset
value, end
of period | | | Total
return(b) | | | Net assets,
end of period
(000’s omitted) | | | Ratio of
expenses
to average
net assets
(including
interest
expense and
dividends on
short sales
expense)
with fee waivers
and/or expenses
absorbed | | | Ratio of
expenses
to average
net assets
(including
interest
expense and
dividends on
short sales
expense)
without fee waivers
and/or expenses
absorbed | | | Ratio of
expenses
to average
net assets
(excluding
interest
expense and
dividends on
short sales
expense)
with fee waivers
and/or expenses
absorbed | | | Ratio of
expenses
to average
net assets
(excluding
interest
expense and
dividends on
short sales
expense)
without fee waivers
and/or expenses
absorbed | | | Ratio of net
investment
income (loss)
to average
net assets | | | Ratio of
interest
expense and
dividends on
short sales
to average
net assets | | | Portfolio
turnover(c) | |
Class A | | | | | | | | | | | | | | | | | | | | | | | | | | | | | | | | | | | | | | | | | | | | | | | | | | | | | | | | |
Year ended 10/31/15 | | $ | 10.70 | | | $ | (0.20 | ) | | $ | 1.42 | | | $ | 1.22 | | | $ | 11.92 | | | | 11.40 | % | | $ | 12,812 | | | | 3.69 | %(d) | | | 4.62 | %(d) | | | 1.60 | %(d) | | | 2.53 | %(d) | | | (1.85 | )%(d) | | | 2.09 | %(d) | | | 175 | % |
Year ended 10/31/14(e) | | | 10.00 | | | | (0.27 | ) | | | 0.97 | | | | 0.70 | | | | 10.70 | | | | 7.00 | | | | 9,742 | | | | 4.53 | (f) | | | 7.28 | (f) | | | 1.60 | (f) | | | 4.35 | (f) | | | (3.03 | )(f) | | | 2.93 | (f) | | | 105 | |
Class C | | | | | | | | | | | | | | | | | | | | | | | | | | | | | | | | | | | | | | | | | | | | | | | | | | | | | | | | |
Year ended 10/31/15 | | | 10.63 | | | | (0.28 | ) | | | 1.41 | | | | 1.13 | | | | 11.76 | | | | 10.63 | | | | 1,772 | | | | 4.44 | (d) | | | 5.37 | (d) | | | 2.35 | (d) | | | 3.28 | (d) | | | (2.60 | )(d) | | | 2.09 | (d) | | | 175 | |
Year ended 10/31/14(e) | | | 10.00 | | | | (0.34 | ) | | | 0.97 | | | | 0.63 | | | | 10.63 | | | | 6.30 | | | | 857 | | | | 5.28 | (f) | | | 8.03 | (f) | | | 2.35 | (f) | | | 5.10 | (f) | | | (3.78 | )(f) | | | 2.93 | (f) | | | 105 | |
Class R | | | | | | | | | | | | | | | | | | | | | | | | | | | | | | | | | | | | | | | | | | | | | | | | | | | | | | | | |
Year ended 10/31/15 | | | 10.68 | | | | (0.22 | ) | | | 1.40 | | | | 1.18 | | | | 11.86 | | | | 11.05 | | | | 23 | | | | 3.94 | (d) | | | 4.87 | (d) | | | 1.85 | (d) | | | 2.78 | (d) | | | (2.10 | )(d) | | | 2.09 | (d) | | | 175 | |
Year ended 10/31/14(e) | | | 10.00 | | | | (0.29 | ) | | | 0.97 | | | | 0.68 | | | | 10.68 | | | | 6.80 | | | | 40 | | | | 4.78 | (f) | | | 7.53 | (f) | | | 1.85 | (f) | | | 4.60 | (f) | | | (3.28 | )(f) | | | 2.93 | (f) | | | 105 | |
Class Y | | | | | | | | | | | | | | | | | | | | | | | | | | | | | | | | | | | | | | | | | | | | | | | | | | | | | | | | |
Year ended 10/31/15 | | | 10.72 | | | | (0.17 | ) | | | 1.42 | | | | 1.25 | | | | 11.97 | | | | 11.66 | | | | 16,907 | | | | 3.44 | (d) | | | 4.37 | (d) | | | 1.35 | (d) | | | 2.28 | (d) | | | (1.60 | )(d) | | | 2.09 | (d) | | | 175 | |
Year ended 10/31/14(e) | | | 10.00 | | | | (0.25 | ) | | | 0.97 | | | | 0.72 | | | | 10.72 | | | | 7.20 | | | | 14,651 | | | | 4.28 | (f) | | | 7.03 | (f) | | | 1.35 | (f) | | | 4.10 | (f) | | | (2.78 | )(f) | | | 2.93 | (f) | | | 105 | |
Class R5 | | | | | | | | | | | | | | | | | | | | | | | | | | | | | | | | | | | | | | | | | | | | | | | | | | | | | | | | |
Year ended 10/31/15 | | | 10.72 | | | | (0.17 | ) | | | 1.42 | | | | 1.25 | | | | 11.97 | | | | 11.66 | | | | 599 | | | | 3.44 | (d) | | | 4.28 | (d) | | | 1.35 | (d) | | | 2.19 | (d) | | | (1.60 | )(d) | | | 2.09 | (d) | | | 175 | |
Year ended 10/31/14(e) | | | 10.00 | | | | (0.25 | ) | | | 0.97 | | | | 0.72 | | | | 10.72 | | | | 7.20 | | | | 648 | | | | 4.28 | (f) | | | 7.00 | (f) | | | 1.35 | (f) | | | 4.07 | (f) | | | (2.78 | )(f) | | | 2.93 | (f) | | | 105 | |
Class R6 | | | | | | | | | | | | | | | | | | | | | | | | | | | | | | | | | | | | | | | | | | | | | | | | | | | | | | | | |
Year ended 10/31/15 | | | 10.72 | | | | (0.17 | ) | | | 1.42 | | | | 1.25 | | | | 11.97 | | | | 11.66 | | | | 745 | | | | 3.44 | (d) | | | 4.28 | (d) | | | 1.35 | (d) | | | 2.19 | (d) | | | (1.60 | )(d) | | | 2.09 | (d) | | | 175 | |
Year ended 10/31/14(e) | | | 10.00 | | | | (0.25 | ) | | | 0.97 | | | | 0.72 | | | | 10.72 | | | | 7.20 | | | | 584 | | | | 4.28 | (f) | | | 6.99 | (f) | | | 1.35 | (f) | | | 4.06 | (f) | | | (2.78 | )(f) | | | 2.93 | (f) | | | 105 | |
| (a) | Calculated using average shares outstanding. |
| (b) | Includes adjustments in accordance with accounting principles generally accepted in the United States of America and as such, the net asset value for financial reporting purposes and the returns based upon those net asset values may differ from the net asset value and returns for shareholder transactions. Does not include sales charges and is not annualized for periods less than one year, if applicable. |
| (c) | Portfolio turnover is calculated at the fund level and is not annualized for periods less than one year, if applicable. |
| (d) | Ratios are based on average daily net assets (000’s omitted) of $10,598, $1,053, $258, $14,367, $556 and $628 for Class A, Class C, Class R, Class Y, Class R5 and Class R6 shares, respectively. |
| (e) | Commencement date of December 17, 2013. |
25 Invesco All Cap Market Neutral Fund
Report of Independent Registered Public Accounting Firm
To the Board of Trustees of AIM Investment Funds (Invesco Investment Funds)
and Shareholders of Invesco All Cap Market Neutral Fund:
In our opinion, the accompanying statement of assets and liabilities, including the schedule of investments, and the related statements of operations, of changes in net assets and of cash flows and the financial highlights present fairly, in all material respects, the financial position of Invesco All Cap Market Neutral Fund (one of the funds constituting AIM Investment Funds (Invesco Investment Funds), hereafter referred to as the “Fund”) at October 31, 2015, the results of its operations and its cash flows for the year then ended, the changes in its net assets and the financial highlights for the year then ended and for the period December 17, 2013 (commencement of operations) through October 31, 2014, in conformity with accounting principles generally accepted in the United States of America. These financial statements and financial highlights (hereafter referred to as “financial statements”) are the responsibility of the Fund’s management. Our responsibility is to express an opinion on these financial statements based on our audits. We conducted our audits of these financial statements in accordance with the standards of the Public Company Accounting Oversight Board (United States). Those standards require that we plan and perform the audit to obtain reasonable assurance about whether the financial statements are free of material misstatement. An audit includes examining, on a test basis, evidence supporting the amounts and disclosures in the financial statements, assessing the accounting principles used and significant estimates made by management, and evaluating the overall financial statement presentation. We believe that our audits, which included confirmation of securities at October 31, 2015 by correspondence with the custodian and brokers, and the application of alternative auditing procedures where confirmations of security purchases have not been received, provide a reasonable basis for our opinion.
PRICEWATERHOUSECOOPERS LLP
December 23, 2015
Houston, Texas
26 Invesco All Cap Market Neutral Fund
Calculating your ongoing Fund expenses
Example
As a shareholder of the Fund, you incur two types of costs: (1) transaction costs, which may include sales charges (loads) on purchase payments or contingent deferred sales charges on redemptions, if any; and (2) ongoing costs, including management fees, distribution and/or service (12b-1) fees, and other Fund expenses. This example is intended to help you understand your ongoing costs (in dollars) of investing in the Fund and to compare these costs with ongoing costs of investing in other mutual funds. The example is based on an investment of $1,000 invested at the beginning of the period and held for the entire period May 1, 2015 through October 31, 2015.
Actual expenses
The table below provides information about actual account values and actual expenses. You may use the information in this table, together with the amount you invested, to estimate the expenses that you paid over the period. Simply divide your account value by $1,000 (for example, an $8,600 account value divided by $1,000 = 8.6), then multiply the result by the number in the table under the heading entitled “Actual Expenses Paid During Period” to estimate the expenses you paid on your account during this period.
Hypothetical example for comparison purposes
The table below also provides information about hypothetical account values and hypothetical expenses based on the Fund’s actual expense ratio and an assumed rate of return of 5% per year before expenses, which is not the Fund’s actual return.
The hypothetical account values and expenses may not be used to estimate the actual ending account balance or expenses you paid for the period. You may use this information to compare the ongoing costs of investing in the Fund and other funds. To do so, compare this 5% hypothetical example with the 5% hypothetical examples that appear in the shareholder reports of the other funds.
Please note that the expenses shown in the table are meant to highlight your ongoing costs only and do not reflect any transaction costs, such as sales charges (loads) on purchase payments or contingent deferred sales charges on redemptions, if any. Therefore, the hypothetical information is useful in comparing ongoing costs only, and will not help you determine the relative total costs of owning different funds. In addition, if these transaction costs were included, your costs would have been higher.
| | | | | | | | | | | | | | | | | | | | | | | | |
| Class | | Beginning
Account Value
(05/01/15) | | | ACTUAL | | | HYPOTHETICAL (5% annual return before
expenses) | | | Annualized
Expense
Ratio | |
| | | Ending
Account Value
(10/31/15)1 | | | Expenses
Paid During
Period2 | | | Ending
Account Value
(10/31/15) | | | Expenses
Paid During
Period2 | | |
| A | | $ | 1,000.00 | | | $ | 1,167.50 | | | $ | 8.80 | | | $ | 1,017.09 | | | $ | 8.19 | | | | 1.61 | % |
| C | | | 1,000.00 | | | | 1,163.20 | | | | 12.87 | | | | 1,013.31 | | | | 11.98 | | | | 2.36 | |
| R | | | 1,000.00 | | | | 1,165.00 | | | | 10.15 | | | | 1,015.83 | | | | 9.45 | | | | 1.86 | |
| Y | | | 1,000.00 | | | | 1,167.80 | | | | 7.43 | | | | 1,018.35 | | | | 6.92 | | | | 1.36 | |
| R5 | | | 1,000.00 | | | | 1,168.80 | | | | 7.43 | | | | 1,018.35 | | | | 6.92 | | | | 1.36 | |
| R6 | | | 1,000.00 | | | | 1,167.80 | | | | 7.43 | | | | 1,018.35 | | | | 6.92 | | | | 1.36 | |
| 1 | The actual ending account value is based on the actual total return of the Fund for the period May 1, 2015 through October 31, 2015, after actual expenses and will differ from the hypothetical ending account value which is based on the Fund’s expense ratio and a hypothetical annual return of 5% before expenses. |
| 2 | Expenses are equal to the Fund’s annualized expense ratio as indicated above multiplied by the average account value over the period, multiplied by 184/365 to reflect the most recent fiscal half year. |
27 Invesco All Cap Market Neutral Fund
Approval of Investment Advisory and Sub-Advisory Contracts
The Board of Trustees (the Board) of AIM Investment Funds (Invesco Investment Funds) is required under the Investment Company Act of 1940, as amended, to approve annually the renewal of Invesco All Cap Market Neutral Fund’s (the Fund) investment advisory agreements. During contract renewal meetings held on
June 9-10, 2015, the Board as a whole, and the disinterested or “independent” Trustees, who comprise over 75% of the Board, voting separately, approved the continuance for the Fund of the Master Investment Advisory Agreement with Invesco Advisers, Inc. (Invesco Advisers and the investment advisory agreement) and the Master Intergroup Sub-Advisory Contract for Mutual Funds with Invesco Asset Management Deutschland GmbH, Invesco Asset Management Limited, Invesco Asset Management (Japan) Limited, Invesco Hong Kong Limited, Invesco Senior Secured Management, Inc., Invesco Canada Ltd. and Invesco PowerShares Capital Management LLC (collectively, the Affiliated Sub-Advisers and the sub-advisory contracts) for another year, effective July 1, 2015.
In evaluating the fairness and reasonableness of compensation under the Fund’s investment advisory agreement and sub-advisory contracts, the Board considered, among other things, the factors discussed below. The Board determined that continuation of the Fund’s investment advisory agreement and the sub-advisory contracts is in the best interest of the Fund and its shareholders and that the compensation payable to Invesco Advisers and the Affiliated Sub-Advisers under the agreements is fair and reasonable.
The Board’s Fund Evaluation Process
The Board’s Investments Committee has established three Sub-Committees, each of which is primarily responsible for overseeing the performance and investment management services provided by Invesco Advisers and the Affiliated Sub-Advisers to a number of the funds advised by Invesco Advisers (the Invesco Funds). The Sub-Committees meet throughout the year to review the performance of their assigned Invesco Funds, including reviewing materials prepared under the direction of the independent Senior Officer, an officer of the Invesco Funds who reports directly to the independent Trustees. Over the course of each year, the Sub-Committees meet with portfolio managers for their assigned Invesco Funds and other members of management to review the performance, investment objective(s), policies, strategies, limitations and investment risks of these funds. The Board had the benefit of reports from the Sub-Committees and Investments Committee throughout the year in considering approval of the continuance of each Invesco Fund’s investment advisory agreement and sub-advisory contracts for another year.
During the contract renewal process, the Board receives comparative performance and fee data regarding the Invesco Funds prepared by Invesco Advisers and Lipper Inc. (Lipper), an independent provider of investment company data. The Board also receives a report and this independent written evaluation from the Senior Officer. The Senior Officer’s evaluation is prepared as part of his responsibility to manage the process by which the Invesco Funds’ proposed management fees are negotiated during the annual contract renewal process to ensure they are negotiated in a manner that is at arms’ length and reasonable. In addition to meetings with Invesco Advisers and fund counsel, the independent Trustees also discuss the continuance of the investment advisory agreement and sub-advisory contracts in separate sessions with the Senior Officer and with independent legal counsel.
The Trustees recognized that the advisory fee rates for the Invesco Funds are, in many cases, the result of years of review and negotiation. The Trustees’ deliberations and conclusions in a particular year may be based in part on their deliberations and conclusions regarding these arrangements throughout the year and in prior years. The Trustees’ review and conclusions are based on the comprehensive consideration of all information presented to them and are not the result of any single determinative factor. Moreover, one Trustee may have weighed a particular piece of information or factor differently than another Trustee.
The discussion below is a summary of the Senior Officer’s independent written evaluation with respect to the Fund’s investment advisory agreement as well as a discussion of the material factors and related conclusions that formed the basis for the Board’s approval of the Fund’s investment advisory agreement and sub-advisory contracts. Unless otherwise stated, this information is current as of June 10, 2015, and does not reflect consideration of factors that became known to the Board after that date.
Factors and Conclusions and Summary of Independent Written Fee Evaluation
| A. | Nature, Extent and Quality of Services Provided by Invesco Advisers and the Affiliated Sub-Advisers |
The Board reviewed the advisory services provided to the Fund by Invesco Advisers under the Fund’s investment advisory agreement, the performance of Invesco Advisers in providing these services, and the credentials and experience of the officers and employees of Invesco Advisers who provide these services, including the Fund’s portfolio manager or managers. The Board’s review of the qualifications of Invesco Advisers to provide advisory services included the Board’s consideration of Invesco Advisers’ investment
process oversight, independent credit analysis and investment risk management. The Board also considered non-advisory services that Invesco Advisers and its affiliates provide to the Invesco Funds such as various back office support functions, equity and fixed income trading operations, internal audit, distribution, valuation and legal and compliance.
In determining whether to continue the Fund’s investment advisory agreement, the Board considered the benefits of reapproving an existing relationship and the greater uncertainty that may be associated with entering into a new relationship. The Board concluded that the nature, extent and quality of the services provided to the Fund by Invesco Advisers are appropriate and satisfactory and consistent with the terms of the Fund’s investment advisory agreement.
The Board reviewed the services that may be provided by the Affiliated Sub-Advisers under the sub-advisory contracts and the credentials and experience of the officers and employees of the Affiliated Sub-Advisers who provide these services. The Board noted that the Affiliated Sub-Advisers have offices and personnel that are located in financial centers around the world. As a result, the Affiliated Sub-Advisers can provide research and investment analysis on the markets and economies of various countries in which the Fund may invest, make recommendations regarding securities and assist with security trades. The Board concluded that the sub-advisory contracts benefit the Fund and its shareholders by permitting Invesco Advisers to use the resources and talents of the Affiliated Sub-Advisers in managing the Fund. The Board concluded that the nature, extent and quality of the services that may be provided by the Affiliated Sub-Advisers are appropriate and satisfactory and consistent with the terms of the Fund’s sub-advisory contracts.
The Board noted that the Fund recently began operations and that no comparative performance data was available.
| C. | Advisory and Sub-Advisory Fees |
The Board noted that no comparative fee information was available for the Fund.
The Board noted that Invesco Advisers has contractually agreed to waive fees and/or limit expenses of the Fund through at least February 29, 2016 in an amount necessary to limit total annual operating expenses to a specified percentage of average daily net assets for each class of the Fund.
The Board noted that Invesco Advisers and the Affiliated Sub-Advisers do not manage other mutual funds with investment strategies comparable to those of the Fund.
The Board also considered the fees charged by Invesco Advisers and the Affiliated Sub-Advisers to other client accounts with investment strategies comparable to those of
28 Invesco All Cap Market Neutral Fund
the Fund. The Board noted that Invesco Advisers or the Affiliated Sub-Advisers may charge lower fees to large institutional clients. Invesco Advisers reviewed with the Board the significantly greater scope of services it provides to the Invesco Funds relative to certain other types of client accounts. These additional services include provision of administrative services, officers and office space, oversight of service providers, preparation of annual registration statement updates and financial information and regulatory compliance under the Investment Company Act of 1940, as amended.
Invesco Advisers also reviewed generally the higher frequency of shareholder purchases and redemptions in the Invesco Funds relative to the flow of assets for other client accounts. Invesco Advisers advised the Board that advance notice of redemptions is often provided to Invesco Advisers by institutional clients. The Board did note that sub-advisory fee rates charged by the Affiliated Sub-Advisers to manage the Invesco Funds and to manage other client accounts tended to be more comparable, reflecting a similar scope of services. The information received by the Board demonstrated that the aggregate services provided to the Invesco Funds were sufficiently different from those provided to institutional clients to support the difference in fees.
The Board also considered the services that may be provided by the Affiliated Sub-Advisers pursuant to the sub-advisory contracts, as well as the fees payable by Invesco Advisers to the Affiliated Sub-Advisers pursuant to the sub-advisory contracts. The Board also noted that the sub-advisory fees are not paid directly by the Fund, but rather, are payable by Invesco Advisers to the Affiliated Sub-Advisers.
| D. | Economies of Scale and Breakpoints |
The Board considered the extent to which there are economies of scale in the provision of advisory services to the Fund. The Board also considered whether the Fund benefits from economies of scale through contractual breakpoints in the Fund’s advisory fee schedule. The Board also noted that the Fund shares directly in economies of scale through lower fees charged by third party service providers based on the combined size of the Invesco Funds and other clients advised by Invesco Advisers.
| E. | Profitability and Financial Resources |
The Board reviewed information from Invesco Advisers concerning the costs of the advisory and other services that Invesco Advisers and its affiliates provide to the Fund and the Invesco Funds and the profitability of Invesco Advisers and its affiliates in providing these services. The Board received information from Invesco Advisers about the methodology used to prepare the profitability information. The Board noted that Invesco Advisers continues to operate at a net profit from services Invesco Advisers and its affiliates provide to the Invesco Funds. The Board noted that the Fund had not been in operation long enough to become
profitable and that Invesco Advisers was continuing to take entrepreneurial risk in operating the Fund. The Board received and accepted information from Invesco Advisers demonstrating that Invesco Advisers and each Affiliated Sub-Adviser are financially sound and have the resources necessary to perform their obligations under the investment advisory agreement and sub-advisory contracts.
| F. | Collateral Benefits to Invesco Advisers and its Affiliates |
The Board considered various other benefits received by Invesco Advisers and its affiliates from the relationship with the Fund, including the fees received for providing transfer agency and distribution services to the Fund. The Board considered the performance of Invesco Advisers and its affiliates in providing these services and the organizational structure employed to provide these services. The Board also considered that these services are provided to the Fund pursuant to written contracts that are reviewed and approved on an annual basis by the Board; and that the services are required for the operation of the Fund.
The Board considered the benefits realized by Invesco Advisers and the Affiliated Sub-Advisers as a result of portfolio brokerage transactions executed through “soft dollar” arrangements. The Board noted that soft dollar arrangements shift the payment obligation for research services from Invesco Advisers and the Affiliated Sub-Advisers to the Invesco Funds and that the research received may be used with other clients of Invesco Advisers and may reduce Invesco Advisers’ and the Affiliated Sub-Advisers’ expenses. The Board also considered that it receives periodic reports from the Chief Compliance Officer of the Invesco Funds demonstrating that these arrangements are consistent with regulatory requirements. The Board did not deem the soft dollar arrangements to be inappropriate.
The Board considered that the Fund’s uninvested cash and cash collateral from any securities lending arrangements may be invested in money market funds advised by Invesco Advisers pursuant to procedures approved by the Board. The Board noted that Invesco Advisers receives advisory fees from these affiliated money market funds attributable to such investments, although Invesco Advisers has contractually agreed to waive through varying periods the advisory fees payable by the Invesco Funds with respect to investments in the affiliated money market funds. The waiver is in an amount equal to 100% of the net advisory fee Invesco Advisers receives from the affiliated money market funds with respect to the Fund’s investment in the affiliated money market funds of uninvested cash, but not cash collateral. The Board concluded that the amount of advisory fees received by Invesco Advisors from the Fund’s investment of cash collateral from any securities lending arrangements in the affiliated money market funds is fair and reasonable.
The Board also considered the Fund may use an affiliated broker to execute certain trades for the Fund to, among other things, control information leakage, and were advised that such trades would be executed in compliance with rules under the Investment Company Act of 1940, as amended, and consistent with best execution obligations.
29 Invesco All Cap Market Neutral Fund
Trustees and Officers
The address of each trustee and officer is AIM Investment Funds (Invesco Investment Funds) (the “Trust”), 11 Greenway Plaza, Suite 1000, Houston, Texas 77046-1173. The trustees serve for the life of the Trust, subject to their earlier death, incapacitation, resignation, retirement or removal as more specifically provided in the Trust’s organizational documents. Each officer serves for a one year term or until their successors are elected and qualified. Column two below includes length of time served with predecessor entities, if any.
| | | | | | | | |
Name, Year of Birth and
Position(s) Held with the Trust | | Trustee and/
or Officer Since | | Principal Occupation(s)
During Past 5 Years | | Number of Funds in Fund Complex Overseen by Trustee | | Other Directorship(s) Held by Trustee During Past 5 Years |
| Interested Persons | | | | | | | | |
| Martin L. Flanagan1 — 1960 Trustee | | 2007 | | Executive Director, Chief Executive Officer and President, Invesco Ltd. (ultimate parent of Invesco and a global investment management firm); Advisor to the Board, Invesco Advisers, Inc. (formerly known as Invesco Institutional (N.A.), Inc.); Trustee, The Invesco Funds; Vice Chair, Investment Company Institute; and Member of Executive Board, SMU Cox School of Business Formerly: Chairman and Chief Executive Officer, Invesco Advisers, Inc. (registered investment adviser); Director, Chairman, Chief Executive Officer and President, IVZ Inc. (holding company), INVESCO Group Services, Inc. (service provider) and Invesco North American Holdings, Inc. (holding company); Director, Chief Executive Officer and President, Invesco Holding Company Limited (parent of Invesco and a global investment management firm); Director, Invesco Ltd.; Chairman, Investment Company Institute and President, Co-Chief Executive Officer, Co-President, Chief Operating Officer and Chief Financial Officer, Franklin Resources, Inc. (global investment management organization). | | 145 | | None |
Philip A. Taylor2 — 1954
Trustee, President and Principal Executive Officer | | 2006 | | Head of North American Retail and Senior Managing Director, Invesco Ltd.; Director, Co-Chairman, Co-President and Co-Chief Executive Officer, Invesco Advisers, Inc. (formerly known as Invesco Institutional (N.A.), Inc.) (registered investment adviser); Director, Chairman, Chief Executive Officer and President, Invesco Management Group, Inc. (formerly known as Invesco Aim Management Group, Inc.) (financial services holding company); Director and President, INVESCO Funds Group, Inc. (registered investment adviser and registered transfer agent); Director and Chairman, Invesco Investment Services, Inc. (formerly known as Invesco Aim Investment Services, Inc.) (registered transfer agent) and IVZ Distributors, Inc. (formerly known as INVESCO Distributors, Inc.) (registered broker dealer); Chief Executive Officer, Invesco Corporate Class Inc. (corporate mutual fund company) Director, Chairman and Chief Executive Officer, Invesco Canada Ltd. (formerly known as Invesco Trimark Ltd./Invesco Trimark Ltèe) (registered investment adviser and registered transfer agent); Trustee, President and Principal Executive Officer, The Invesco Funds (other than AIM Treasurer’s Series Trust (Invesco Treasurer’s Series Trust), Short-Term Investments Trust and Invesco Management Trust); Trustee and Executive Vice President, The Invesco Funds (AIM Treasurer’s Series Trust (Invesco Treasurer’s Series Trust), Short-Term Investments Trust and Invesco Management Trust only); Director, Invesco Investment Advisers LLC (formerly known as Van Kampen Asset Management); Director, Chief Executive Officer and President, Van Kampen Exchange Corp. Formerly: Director, President and Chairman, Invesco Inc. (holding company), Invesco Canada Holdings Inc. (holding company), Trimark Investments Ltd./Placements Trimark Ltèe and Invesco Financial Services Ltd/Services Financiers Invesco Ltèe; Chief Executive Officer, Invesco Canada Fund Inc (corporate mutual fund company); Director and Chairman, Van Kampen Investor Services Inc.; Director, Chief Executive Officer and President, 1371 Preferred Inc. (holding company) and Van Kampen Investments Inc.; Director and President, AIM GP Canada Inc. (general partner for limited partnerships) and Van Kampen Advisors, Inc.; Director and Chief Executive Officer, Invesco Trimark Dealer Inc. (registered broker dealer); Director, Invesco Distributors, Inc. (formerly known as Invesco Aim Distributors, Inc.) (registered broker dealer); Manager, Invesco PowerShares Capital Management LLC; Director, Chief Executive Officer and President, Invesco Advisers, Inc.; Director, Chairman, Chief Executive Officer and President, Invesco Aim Capital Management, Inc.; President, Invesco Trimark Dealer Inc. and Invesco Trimark Ltd./Invesco Trimark Ltèe; Director and President, AIM Trimark Corporate Class Inc. and AIM Trimark Canada Fund Inc.; Senior Managing Director, Invesco Holding Company Limited; Director and Chairman, Fund Management Company (former registered broker dealer); President and Principal Executive Officer, The Invesco Funds (AIM Treasurer’s Series Trust (Invesco Treasurer’s Series Trust), and Short-Term Investments Trust only); President, AIM Trimark Global Fund Inc. and AIM Trimark Canada Fund Inc.. | | 145 | | None |
| 1 | Mr. Flanagan is considered an interested person (within the meaning of Section 2(a)(19) of the 1940 Act) of the Trust because he is an officer of the Adviser to the Trust, and an officer and a director of Invesco Ltd., ultimate parent of the Adviser. |
| 2 | Mr. Taylor is considered an interested person (within the meaning of Section 2(a)(19) of the 1940 Act) of the Trust because he is an officer and a director of the Adviser. |
T-1 Invesco All Cap Market Neutral Fund
Trustees and Officers—(continued)
| | | | | | | | |
Name, Year of Birth and Position(s) Held with the Trust | | Trustee and/ or Officer Since | | Principal Occupation(s) During Past 5 Years | | Number of Funds in Fund Complex Overseen by Trustee | | Other Directorship(s) Held by Trustee During Past 5 Years |
| Independent Trustees | | | | | | | | |
Bruce L. Crockett — 1944 Trustee and Chair | | 2003 | | Chairman, Crockett Technologies Associates (technology consulting company) Formerly: Director, Captaris (unified messaging provider); Director, President and Chief Executive Officer, COMSAT Corporation; Chairman, Board of Governors of INTELSAT (international communications company); ACE Limited (insurance company); Independent Directors Council and Investment Company Institute | | 145 | | ALPS (Attorneys Liability Protection Society) (insurance company) and Globe Specialty Metals, Inc. (metallurgical company) |
David C. Arch — 1945 Trustee | | 2010 | | Chairman of Blistex Inc., a consumer health care products manufacturer | | 145 | | Board member of the Illinois Manufacturers’ Association; Member of the Board of Visitors, Institute for the Humanities, University of Michigan; Member of the Audit Committee of the Edward-Elmhurst Hospital |
James T. Bunch — 1942 Trustee | | 2000 | | Managing Member, Grumman Hill Group LLC (family office/private equity investments) Formerly: Founder, Green Manning & Bunch Ltd. (investment banking firm) (1988-2010); Executive Committee, United States Golf Association; and Chairman, Board of Governors, Western Golf Association | | 145 | | Chairman of the Board of Trustees, Evans Scholars Foundation; and Chairman of the Board, Denver Film Society |
Rodney F. Dammeyer — 1940 Trustee | | 2010 | | Chairman of CAC, LLC, (private company offering capital investment and management advisory services) Formerly: Prior to 2001, Managing Partner at Equity Group Corporate Investments; Prior to 1995, Chief Executive Officer of Itel Corporation (formerly Anixter International); Prior to 1985, experience includes Senior Vice President and Chief Financial Officer of Household International, Inc., Executive Vice President and Chief Financial Officer of Northwest Industries, Inc. and Partner of Arthur Andersen & Co.; From 1987 to 2010, Director/Trustee of investment companies in the Van Kampen Funds complex | | 145 | | Director of Quidel Corporation and Stericycle, Inc. |
Albert R. Dowden — 1941 Trustee | | 2003 | | Director of a number of public and private business corporations, including the Boss Group, Ltd. (private investment and management); Nature’s Sunshine Products, Inc. and Reich & Tang Funds (5 portfolios) (registered investment company) Formerly: Director, Homeowners of America Holding Corporation/Homeowners of America Insurance Company (property casualty company); Director, Continental Energy Services, LLC (oil and gas pipeline service); Director, CompuDyne Corporation (provider of product and services to the public security market) and Director, Annuity and Life Re (Holdings), Ltd. (reinsurance company); Director, President and Chief Executive Officer, Volvo Group North America, Inc.; Senior Vice President, AB Volvo; Director of various public and private corporations; Chairman, DHJ Media, Inc.; Director, Magellan Insurance Company; and Director, The Hertz Corporation, Genmar Corporation (boat manufacturer), National Media Corporation; Advisory Board of Rotary Power International (designer, manufacturer, and seller of rotary power engines); and Chairman, Cortland Trust, Inc. (registered investment company) | | 145 | | Director of: Nature’s Sunshine Products, Inc., Reich & Tang Funds, Homeowners of America Holding Corporation/ Homeowners of America Insurance Company, the Boss Group |
Jack M. Fields — 1952 Trustee | | 2003 | | Chief Executive Officer, Twenty First Century Group, Inc. (government affairs company); Owner and Chief Executive Officer, Dos Angeles Ranch, L.P. (cattle, hunting, corporate entertainment); and Discovery Global Education Fund (non-profit) Formerly: Chief Executive Officer, Texana Timber LP (sustainable forestry company); Director of Cross Timbers Quail Research Ranch (non-profit); and member of the U.S. House of Representatives | | 145 | | Insperity, Inc. (formerly known as Administaff) |
Prema Mathai-Davis — 1950 Trustee | | 2003 | | Retired. Formerly: Chief Executive Officer, YWCA of the U.S.A. | | 145 | | None |
Larry Soll — 1942 Trustee | | 1997 | | Retired. Formerly: Chairman, Chief Executive Officer and President, Synergen Corp. (a biotechnology company) | | 145 | | None |
Hugo F. Sonnenschein — 1940 Trustee | | 2010 | | President Emeritus and Honorary Trustee of the University of Chicago and the Adam Smith Distinguished Service Professor in the Department of Economics at the University of Chicago. Prior to 2000, President of the University of Chicago | | 145 | | Trustee of the University of Rochester and a member of its investment committee; Member of the National Academy of Sciences and the American Philosophical Society; Fellow of the American Academy of Arts and Sciences |
Raymond Stickel, Jr. — 1944 Trustee | | 2005 | | Retired. Formerly: Director, Mainstay VP Series Funds, Inc. (25 portfolios) and Partner, Deloitte & Touche | | 145 | | None |
T-2 Invesco All Cap Market Neutral Fund
Trustees and Officers—(continued)
| | | | | | | | |
Name, Year of Birth and Position(s) Held with the Trust | | Trustee and/ or Officer Since | | Principal Occupation(s) During Past 5 Years | | Number of Funds in Fund Complex Overseen by Trustee | | Other Directorship(s) Held by Trustee During Past 5 Years |
| Independent Trustees—(continued) |
Suzanne H. Woolsey — 1941 Trustee | | 2014 | | Chief Executive Officer of Woolsey Partners LLC | | 145 | | Emeritus Chair of the Board of Trustees of the Institute for Defense Analyses; Trustee of Colorado College; Trustee of California Institute of Technology; Prior to 2014, Director of Fluor Corp.; Prior to 2010, Trustee of the German Marshall Fund of the United States; Prior to 2010 Trustee of the Rocky Mountain Institute |
| Other Officers | | | | | | | | |
Russell C. Burk — 1958
Senior Vice President and Senior Officer | | 2005 | | Senior Vice President and Senior Officer, The Invesco Funds | | N/A | | N/A |
John M. Zerr — 1962
Senior Vice President, Chief Legal Officer and Secretary | | 2006 | | Director, Senior Vice President, Secretary and General Counsel, Invesco Management Group, Inc. (formerly known as Invesco Aim Management Group, Inc.) and Van Kampen Exchange Corp.; Senior Vice President, Invesco Advisers, Inc. (formerly known as Invesco Institutional (N.A.), Inc.) (registered investment adviser); Senior Vice President and Secretary, Invesco Distributors, Inc. (formerly known as Invesco Aim Distributors, Inc.); Director, Vice President and Secretary, Invesco Investment Services, Inc. (formerly known as Invesco Aim Investment Services, Inc.) and IVZ Distributors, Inc. (formerly known as INVESCO Distributors, Inc.); Director and Vice President, INVESCO Funds Group, Inc.; Senior Vice President, Chief Legal Officer and Secretary, The Invesco Funds; Managing Director, Invesco PowerShares Capital Management LLC; Director, Secretary and General Counsel, Invesco Investment Advisers LLC (formerly known as Van Kampen Asset Management); Secretary and General Counsel, Invesco Capital Markets, Inc. (formerly known as Van Kampen Funds Inc.) and Chief Legal Officer, PowerShares Exchange-Traded Fund Trust, PowerShares Exchange-Traded Fund Trust II, PowerShares India Exchange-Traded Fund Trust, PowerShares Actively Managed Exchange-Traded Fund Trust, and PowerShares Actively Managed Exchange-Traded Commodity Fund Trust Formerly: Director and Vice President, Van Kampen Advisors Inc.; Director, Vice President, Secretary and General Counsel, Van Kampen Investor Services Inc.; Director, Invesco Distributors, Inc. (formerly known as Invesco Aim Distributors, Inc.); Director, Senior Vice President, General Counsel and Secretary, Invesco Aim Advisers, Inc. and Van Kampen Investments Inc.; Director, Vice President and Secretary, Fund Management Company; Director, Senior Vice President, Secretary, General Counsel and Vice President, Invesco Aim Capital Management, Inc.; Chief Operating Officer and General Counsel, Liberty Ridge Capital, Inc. (an investment adviser); Vice President and Secretary, PBHG Funds (an investment company) and PBHG Insurance Series Fund (an investment company); Chief Operating Officer, General Counsel and Secretary, Old Mutual Investment Partners (a broker-dealer); General Counsel and Secretary, Old Mutual Fund Services (an administrator) and Old Mutual Shareholder Services (a shareholder servicing center); Executive Vice President, General Counsel and Secretary, Old Mutual Capital, Inc. (an investment adviser); and Vice President and Secretary, Old Mutual Advisors Funds (an investment company) | | N/A | | N/A |
Sheri Morris — 1964
Vice President, Treasurer and Principal Financial Officer | | 2003 | | Vice President, Treasurer and Principal Financial Officer, The Invesco Funds; Vice President, Invesco Advisers, Inc. (formerly known as Invesco Institutional (N.A.), Inc.) (registered investment adviser); and Vice President, PowerShares Exchange-Traded Fund Trust, PowerShares Exchange-Traded Fund Trust II, PowerShares India Exchange-Traded Fund Trust, PowerShares Actively Managed Exchange-Traded Fund Trust, and PowerShares Actively Managed Exchange-Traded Commodity Fund Trust Formerly: Vice President, Invesco Aim Advisers, Inc., Invesco Aim Capital Management, Inc. and Invesco Aim Private Asset Management, Inc.; Assistant Vice President and Assistant Treasurer, The Invesco Funds and Assistant Vice President, Invesco Advisers, Inc., Invesco Aim Capital Management, Inc. and Invesco Aim Private Asset Management, Inc.; and Treasurer, PowerShares Exchange-Traded Fund Trust, PowerShares Exchange-Traded Fund Trust II, PowerShares India Exchange-Traded Fund Trust and PowerShares Actively Managed Exchange-Traded Fund Trust | | N/A | | N/A |
T-3 Invesco All Cap Market Neutral Fund
Trustees and Officers—(continued)
| | | | | | | | |
Name, Year of Birth and
Position(s) Held with the Trust | | Trustee and/
or Officer Since | | Principal Occupation(s)
During Past 5 Years | | Number of Funds in Fund Complex Overseen by Trustee | | Other Directorship(s) Held by Trustee During Past 5 Years |
| Other Officers—(continued) | | | | | | | | |
Karen Dunn Kelley — 1960
Vice President | | 2003 | | Senior Managing Director, Investments, Invesco Ltd.; Director, Co-President, Co-Chief Executive Officer, and Co-Chairman, Invesco Advisers, Inc. (formerly known as Invesco Institutional (N.A.), Inc.) (registered investment adviser); Chairman, Invesco Senior Secured Management, Inc.; Senior Vice President, Invesco Management Group, Inc. (formerly known as Invesco Aim Management Group, Inc.); Executive Vice President, Invesco Distributors, Inc. (formerly known as Invesco Aim Distributors, Inc.); Director, Invesco Mortgage Capital Inc. and Invesco Management Company Limited; Vice President, The Invesco Funds (other than AIM Treasurer’s Series Trust (Invesco Treasurer’s Series Trust), Short-Term Investments Trust and Invesco Management Trust); and President and Principal Executive Officer, The Invesco Funds (AIM Treasurer’s Series Trust (Invesco Treasurer’s Series Trust), Short-Term Investments Trust and Invesco Management Trust only) Formerly: Director and President, INVESCO Asset Management (Bermuda) Ltd., Director, INVESCO Global Asset Management Limited and INVESCO Management S.A.; Senior Vice President, Van Kampen Investments Inc. and Invesco Advisers, Inc. (formerly known as Invesco Institutional (N.A.), Inc.) (registered investment adviser); Vice President, Invesco Advisers, Inc. (formerly known as Invesco Institutional (N.A.), Inc.); Director of Cash Management and Senior Vice President, Invesco Advisers, Inc. and Invesco Aim Capital Management, Inc.; Director and President, Fund Management Company; Chief Cash Management Officer, Director of Cash Management, Senior Vice President, and Managing Director, Invesco Aim Capital Management, Inc.; Director of Cash Management, Senior Vice President, and Vice President, Invesco Advisers, Inc. and The Invesco Funds (AIM Treasurer’s Series Trust (Invesco Treasurer’s Series Trust), and Short-Term Investments Trust only) | | N/A | | N/A |
Crissie M. Wisdom — 1969 Anti-Money Laundering Compliance Officer | | 2013 | | Anti-Money Laundering Compliance Officer, Invesco Advisers, Inc. (formerly known as Invesco Institutional (N.A.), Inc.) (registered investment adviser), Invesco Capital Markets, Inc. (formerly known as Van Kampen Funds Inc.), Invesco Distributors, Inc., Invesco Investment Services, Inc., Invesco Management Group, Inc., Van Kampen Exchange Corp., The Invesco Funds, and PowerShares Exchange-Traded Fund Trust, PowerShares Exchange-Traded Fund Trust II, PowerShares India Exchange-Traded Fund Trust, PowerShares Actively Managed Exchange-Traded Fund Trust and PowerShares Actively Managed Exchange-Traded Commodity Fund Trust; Anti-Money Laundering Compliance Officer and Bank Secrecy Act Officer, INVESCO National Trust Company and Invesco Trust Company; and Fraud Prevention Manager and Controls and Risk Analysis Manager for Invesco Investment Services, Inc.. | | N/A | | N/A |
Lisa O. Brinkley — 1959 Chief Compliance Officer | | 2015 | | Senior Vice President and Chief Compliance Officer, Invesco Advisers, Inc. (registered investment adviser) (formerly known as Invesco Institutional (N.A., Inc.); and Chief Compliance Officer, The Invesco Funds Formerly: Global Assurance Officer, Invesco Ltd. and Vice President, The Invesco Funds; Chief Compliance Officer, Invesco Distributors, Inc. (formerly known as Invesco Aim Distributors, Inc.), Invesco Investment Services, Inc.(formerly known as Invesco Aim Investment Services, Inc.) and Van Kampen Investor Services Inc.; Senior Vice President, Invesco Management Group, Inc.; Senior Vice President and Chief Compliance Officer, Invesco Advisers, Inc. and The Invesco Funds; Vice President and Chief Compliance Officer, Invesco Aim Capital Management, Inc. and Invesco Distributors, Inc.; Vice President, Invesco Investment Services, Inc. and Fund Management Company. | | N/A | | N/A |
The Statement of Additional Information of the Trust includes additional information about the Fund’s Trustees and is available upon request, without charge, by calling 1.800.959.4246. Please refer to the Fund’s prospectus for information on the Fund’s sub-advisers.
| | | | | | |
Office of the Fund 11 Greenway Plaza, Suite 1000 Houston, TX 77046-1173 | | Investment Adviser Invesco Advisers, Inc. 1555 Peachtree Street, N.E. Atlanta, GA 30309 | | Distributor
Invesco Distributors, Inc. 11 Greenway Plaza, Suite 1000 Houston, TX 77046-1173 | | Auditors PricewaterhouseCoopers LLP 1000 Louisiana Street, Suite 5800 Houston, TX 77002-5678 |
| | | |
| | | | | | |
Counsel to the Fund Stradley Ronon Stevens & Young, LLP 2005 Market Street, Suite 2600 Philadelphia, PA 19103-7018 | | Counsel to the Independent Trustees Goodwin Procter LLP 901 New York Avenue, N.W. Washington, D.C. 20001 | | Transfer Agent Invesco Investment Services, Inc. 11 Greenway Plaza, Suite 1000 Houston, TX 77046-1173 | | Custodian State Street Bank and Trust Company 225 Franklin Street Boston, MA 02110-2801 |
T-4 Invesco All Cap Market Neutral Fund

Invesco mailing information
Send general correspondence to Invesco Investment Services, Inc., P.O. Box 219078, Kansas City, MO 64121-9078.
Important notice regarding delivery of security holder documents
To reduce Fund expenses, only one copy of most shareholder documents may be mailed to shareholders with multiple accounts at the same address (Householding). Mailing of your shareholder documents may be householded indefinitely unless you instruct us otherwise. If you do not want the mailing of these documents to be combined with those for other members of your household, please contact Invesco Investment Services, Inc. at 800 959 4246 or contact your financial institution. We will begin sending you individual copies for each account within 30 days after receiving your request.
Fund holdings and proxy voting information
The Fund provides a complete list of its holdings four times in each fiscal year, at the quarter ends. For the second and fourth quarters, the lists appear in the Fund’s semiannual and annual reports to shareholders. For the first and third quarters, the Fund files the lists with the Securities and Exchange Commission (SEC) on Form N-Q. The most recent list of portfolio holdings is available at invesco.com/completeqtrholdings. Shareholders can also look up the Fund’s Forms N-Q on the SEC website at sec.gov. Copies of the Fund’s Forms N-Q may be reviewed and copied at the SEC Public Reference Room in Washington, D.C. You can obtain information on the operation of the Public Reference Room, including information about duplicating fee charges, by calling 202 551 8090 or 800 732 0330, or by electronic request at the following email address: publicinfo@sec.gov. The SEC file numbers for the Fund are shown below.
A description of the policies and procedures that the Fund uses to determine how to vote proxies relating to portfolio securities is available without charge, upon request, from our Client Services department at 800 959 4246 or at invesco.com/proxyguidelines. The information is also available on the SEC website, sec.gov.
| | |
Information regarding how the Fund voted proxies related to its portfolio securities during the most recent 12-month period ended June 30 is available at invesco.com/proxysearch. The information is also available on the SEC website, sec.gov. Invesco Advisers, Inc. is an investment adviser; it provides investment advisory services to individual and institutional clients and does not sell securities. Invesco Distributors, Inc. is the US distributor for Invesco Ltd.’s retail mutual funds, exchange-traded funds and institutional money market funds. Both are wholly owned, indirect subsidiaries of Invesco Ltd. | |  |
| | | | |
| SEC file numbers: 811-05426 and 033-19338 | | ACMN-AR-1 | | Invesco Distributors, Inc. |
| | | | |
| | |
 | | Annual Report to Shareholders | | October 31, 2015 |
| | |
| | Invesco Balanced-Risk Allocation Fund |
| | Nasdaq: |
| | A: ABRZX n B: ABRBX n C: ABRCX n R: ABRRX n Y: ABRYX n R5: ABRIX n R6: ALLFX |

Letters to Shareholders
| | |

Philip Taylor | | Dear Shareholders: This annual report includes information about your Fund, including performance data and a complete list of its investments as of the close of the reporting period. Inside is a discussion of how your Fund was managed and the factors that affected its performance during the reporting period. I hope you find this report of interest. The US economy expanded and unemployment declined throughout the reporting period. Continuing low energy prices benefited consumers, but a strong US dollar crimped corporate profits. The US Federal Reserve signaled that it was increasingly likely to raise interest rates, based on generally positive economic data, but uncertainty remained about when it might act. Overseas, the story was much different. Low energy prices hurt the economies of some oil-producing nations, such as Brazil and Russia. During the reporting period, the European Central |
Bank as well as central banks in China and Japan – among other countries – either instituted or maintained extraordinarily accommodative monetary policies in response to economic weakness. Investor uncertainty, such as we saw for much of the reporting period – and market volatility, such as we saw at the end of the reporting period – are unfortunate facts of life when it comes to investing. Some investors use these things as excuses to delay saving and investing for their long-term financial goals. That’s why Invesco encourages investors to work with a professional financial adviser who can stress the importance of starting to save and invest early and the importance of adhering to a disciplined investment plan – when times are good and when they’re uncertain. A financial adviser who knows your unique financial situation, investment goals and risk tolerance can be an invaluable partner as you seek to achieve your financial goals. He or she can offer a long-term perspective when markets are volatile and time-tested advice and guidance when your financial situation or investment goals change. |
Timely information when and where you want it
Invesco’s efforts to help investors achieve their financial objectives include providing individual investors and financial professionals with timely information about the markets, the economy and investing – whenever and wherever they want it.
Our website, invesco.com/us, offers a wide range of market insights and investment perspectives. On the website, you’ll find detailed information about our funds, including prices, performance, holdings and portfolio manager commentaries. You can access information about your account by completing a simple, secure online registration. Click on the “Need to register” link in the “Account Access” box on our homepage to get started.
Invesco’s mobile apps for iPhone® and iPad® (both available free from the App StoreSM) allow you to obtain the same detailed information, monitor your account and create customizable watch lists. Also, they allow you to access investment insights from our investment leaders, market strategists, economists and retirement experts. You can sign up to be alerted when new commentary is added, and you can watch portfolio manager videos and have instant access to Invesco news and updates wherever you may be.
In addition to the resources accessible on our website and through our mobile app, you can obtain timely updates to help you stay informed about the markets, the economy and investing by connecting with Invesco on Twitter, LinkedIn or Facebook. You can access our blog at blog.invesco.us.com. Our goal is to provide you the information you want, when and where you want it.
Have questions?
For questions about your account, feel free to contact an Invesco client services representative at 800 959 4246. For Invesco-related questions or comments, please email me directly at phil@invesco.com.
All of us at Invesco look forward to serving your investment management needs for many years to come. Thank you for investing with us.
Sincerely,

Philip Taylor
Senior Managing Director, Invesco Ltd.
iPhone and iPad are trademarks of Apple Inc., registered in the US and other countries. App Store is a service mark of Apple Inc. Invesco Distributors, Inc. is not affiliated with Apple Inc.
2 Invesco Balanced-Risk Allocation Fund
| | |

Bruce Crockett | | Dear Fellow Shareholders: Among the many important lessons I’ve learned in more than 40 years in a variety of business endeavors is the value of a trusted advocate. As independent chair of the Invesco Funds Board, I can assure you that the members of the Board are strong advocates for the interests of investors in Invesco’s mutual funds. We work hard to represent your interests through oversight of the quality of the investment management services your funds receive and other matters important to your investment, including but not limited to: n Ensuring that Invesco offers a diverse lineup of mutual funds that your financial adviser can use to strive to meet your financial needs as your investment goals change over time. n Monitoring how the portfolio management teams of the Invesco funds are performing in light of changing economic and market conditions. |
| n | | Assessing each portfolio management team’s investment performance within the context of the investment strategy described in the fund’s prospectus. |
| n | | Monitoring for potential conflicts of interests that may impact the nature of the services that your funds receive. |
We believe one of the most important services we provide our fund shareholders is the annual review of the funds’ advisory and sub-advisory contracts with Invesco Advisers and its affiliates. This review is required by the Investment Company Act of 1940 and focuses on the nature and quality of the services Invesco provides as the adviser to the Invesco funds and the reasonableness of the fees that it charges for those services. Each year, we spend months carefully reviewing information received from Invesco and a variety of independent sources, such as performance and fee data prepared by Lipper Inc., an independent, third-party firm widely recognized as a leader in its field. We also meet with our independent legal counsel and other independent advisers to review and help us assess the information that we have received. Our goal is to assure that you receive quality investment management services for a reasonable fee.
I trust the measures outlined above provide assurance that you have a worthy advocate when it comes to choosing the Invesco Funds.
As always, please contact me at bruce@brucecrockett.com with any questions or concerns you may have. On behalf of the Board, we look forward to continuing to represent your interests and serving your needs.
Sincerely,

Bruce L. Crockett
Independent Chair
Invesco Funds Board of Trustees
3 Invesco Balanced-Risk Allocation Fund
Management’s Discussion of Fund Performance
Performance summary
For the fiscal year ended October 31, 2015, Class A shares of Invesco Balanced- Risk Allocation Fund (the Fund), at net asset value (NAV), underperformed the Fund’s custom style-specific benchmarks, the Custom Invesco Balanced Risk Allocation Broad Index and the Custom Invesco Balanced Risk Allocation Style Index.
Your Fund’s long-term performance appears later in this report.
Fund vs. Indexes
Total returns, 10/31/14 to 10/31/15, at net asset value (NAV). Performance shown does not include applicable contingent deferred sales charges (CDSC) or front-end sales charges, which would have reduced performance.
| | | | | |
Class A Shares | | | | -1.64 | % |
Class B Shares | | | | -2.40 | |
Class C Shares | | | | -2.32 | |
Class R Shares | | | | -1.86 | |
Class Y Shares | | | | -1.40 | |
Class R5 Shares | | | | -1.39 | |
Class R6 Shares | | | | -1.27 | |
| S&P 500 Index▼ (Broad Market Index) | | | | 5.20 | |
| Custom Invesco Balanced-Risk Allocation Broad Indexn (Style-Specific Index) | | | | 4.23 | |
Custom Invesco Balanced-Risk Allocation Style Indexn (Style-Specific Index) | | | | 2.10 | |
Lipper Alternative Global Macro Funds Index¿ (Peer Group Index) | | | | -3.30 | |
Source(s): ▼FactSet Research Systems Inc.; nInvesco, FactSet Research Systems Inc.; ¿Lipper Inc.
Market conditions and your Fund
During the fiscal year ended October 31, 2015, global markets produced mixed results due to volatility from a variety of geopolitical issues, and the Fund at NAV ended the reporting period in negative territory. The Fund invests in derivatives, such as swaps and futures, which are expected to correspond to US and international fixed income, equity and commodity markets. The strategic portion of the investment process involves first selecting representative assets for each asset class from a universe of over 50 assets. Next, we seek to construct the portfolio so that an approximately equal amount of risk comes from the equity, fixed income and commodity allocations. Tactical adjustments to the Fund’s portfolio are then made on a monthly basis to try and take advantage of short-term market dynamics.
The Fund’s positive performance from strategic positioning in equity and fixed income markets, obtained through the use of swaps and futures, boosted Fund results for the reporting period. Tactical positioning within fixed income and commodities, achieved through the use of swaps and futures, also contributed positively to Fund
results while tactical positioning within equities through the use of swaps and futures detracted from Fund results. The net effect was a positive contribution from our tactical allocation process to Fund results for the fiscal year.
Government bonds ended 2014 on a positive note as investors sought refuge in high-quality government bonds as volatility returned to equities and cyclical commodity prices softened substantially. The ending of quantitative easing (QE) in the US, similar to previous wind-downs of asset purchase programs, reintroduced volatility into equity markets and resulted in price weakness. The decision by OPEC not to curtail production rates of crude oil led to renewed equity market weakness in December, particularly within the energy space, resulting in stocks ending 2014 with a whimper rather than a bang. Energy-related commodities saw significant double-digit losses for crude oil and distillates due to increased supply, weakening demand and OPEC’s decision to maintain production levels. The tactical allocation process aided Fund results for November and December of 2014, with the Fund’s fixed income and commodity
allocations accounting for the bulk of the contribution.
Equity markets rebounded in the first quarter of 2015, especially those where central banks were still actively involved in quantitative easing. Most bond markets saw yields decline over the span of the same quarter, continuing the strong price gains from 2014. Factors supporting lower yields included the continued rout in commodity prices, which also tempered fears of an increase in inflationary pressures, renewed geopolitical tensions in the Middle East, and ongoing negotiations regarding Greece’s efforts to secure fresh funding from its international creditors. Commodities continued their decline over the first quarter of 2015 in large part due to the ongoing collapse in energy and agricultural prices. The tactical allocation element contributed to the Fund’s quarterly results, with equities, fixed income and commodities all contributing fairly equally to Fund results.
The Fund finished the second quarter of 2015 on a weak note as small gains from equity and commodity exposures were not enough to compensate for losses from government bond exposure. Within equities, gains from the beginning of the second quarter were largely erased in June as the resurgence of the Greek financial troubles and a meaningful correction in Chinese equities triggered a substantial increase in volatility. Commodity markets generated mixed results with agricultural commodities posting gains, primarily because of strength in grains late in the reporting period and on indications of easing supply glut for certain key agricultural commodities and fears of lower crop yields due to recent heavy rainfall in key growing regions. Government bonds posted large losses for the second quarter of 2015 as threats of an increase in US interest rates, improving economic data out of Europe and rising inflationary readings led to a substantial repricing of the highest quality fixed income markets. Tactical allocation tilts across all three asset classes detracted from Fund returns, mainly driven by exposure to the various commodity complexes. The bulk of the shortfall occurred during the month of April, when the Fund had generally under-
| | | | |
| Target Risk Allocation and Notional Asset Weights as of 10/31/15 |
By asset class | | |
| Asset Class | | Target Risk
Allocation* | | Notional Asset
Weights** |
Equities | | 31.66% | | 32.56% |
Fixed Income | | 49.99 | | 89.15 |
Commodities | | 18.35 | | 22.83 |
Total | | 100.00 | | 144.54 |
* Reflects the risk that each asset class is expected to contribute to the overall risk of the Fund as measured by standard deviation and estimates of risk based on historical data. Standard deviation measures the annualized fluctuations (volatility) of monthly returns.
** Proprietary models determine the Notional Asset Weights necessary to achieve the Target Risk Allocations. Total Notional Asset Weight greater than 100% is achieved through derivatives and other instruments that create leverage.
| | | | |
Total Net Assets | | | $7.2 billion | |
4 Invesco Balanced-Risk Allocation Fund
weight exposure to commodities in the face of a strong price bounce in commodity prices, particularly within energy and industrial metals.
Bonds rebounded in the third quarter of 2015. Nervous investors sought a perceived safe haven from the continuing decline in commodity prices and renewed volatility in equity prices. During the quarter, economic activity and inflation was weak globally, which enhanced the appeal for bonds and allayed concerns of sustained interest rate hikes across major markets. All of the bond markets in which the Fund invested posted gains for the quarter. Several factors caused weakness in equities during the third quarter of 2015, including the surprise Chinese renminbi devaluation, disappointing gross domestic product data from Europe and Canada, weak manufacturing data from a host of countries and uncertainty regarding the US Federal Reserve’s (the Fed’s) policy direction. The combination of these factors suggested that global economic growth was slowing well beyond what equity prices had reflected. Consequently, several equity markets experienced double-digit declines, notably Hong Kong, Japan and US small-cap companies, while only two equity markets (Europe and Japan) sustained gains year-to-date through the end of the quarter. Commodity markets continued to decline during the third quarter of 2015 with energy suffering the steepest price declines, as US stockpiles remained well above the five-year seasonal average and a weakening Chinese economy and an increase in Iranian oil production added to fear of a global oil glut. The Fund’s tactical allocation process contributed to Fund returns for the third quarter of 2015. The Fund’s general overweight exposure to bonds proved timely and benefited Fund performance. Tactical shifts to equities in the Fund’s portfolio detracted from Fund performance, due primarily to the Fund’s overweight exposure to all equity markets during August when volatility returned to equities, outweighing otherwise positive results from equity positioning in July and September of 2015. The Fund’s defensive posture towards commodities paid off with positive contributions from the Fund’s tactical commodity allocations in every month during the third quarter of 2015.
The fiscal year ended with equities rebounding in October as developed markets experienced a strong rebound off of the recent lows set during the turbulence of the third quarter of 2015. Gains across the developed equity markets in which the Fund invested resulted in contributions to Fund performance. The driving force behind the gains had less to do with economic data, which continued to be tepid, than the actions and jawboning from central banks. For example, during the month
of October, Sweden expanded its QE program, China cut lending rates and reserve requirements and the European Central Bank hinted at further rate cuts and potential expansion of its already massive QE program to counter expectations of downside risks to growth. While equities enjoyed a strong month, the foundations of those gains may not be durable. The Fund’s commodity exposure, obtained through the use of swaps and futures, also helped Fund results. On an absolute basis, agriculture was the primary contributor to Fund results in October 2015 due to gains in sugar and cotton. Sugar prices were the leading performer across the Fund’s commodity exposures given conjectures that the El Nino weather pattern would disrupt sugar cane harvests in Brazil and India. Bond markets saw yields push higher over October in Australia, Canada, the UK and the US as risk appetite shifted in favor of equities on the strong rebound in share prices. Yields declined in Germany and Japan as official forecasts for growth indicated downside risks. In the US, the release of Fed meeting minutes pressured bond prices as the commentary suggested that the Fed was becoming more hawkish, noting modest domestic growth and less focus on foreign market behavior. The statements left open the possibility of a December 2015 rate hike, dampening enthusiasm for Treasuries.
Please note that our strategy is principally implemented with derivative instruments that include futures, commodity-linked notes and total return swaps. Therefore, all or most of the performance of the strategy, both positive and negative, can be attributed to these instruments. Derivatives can be a cost-effective way to gain exposure to asset classes. However, derivatives may amplify traditional investment risks through the creation of leverage and may be less liquid than traditional securities.
Thank you for your continued commitment to Invesco Balanced-Risk Allocation Fund.
The views and opinions expressed in management’s discussion of Fund performance are those of Invesco Advisers, Inc. These views and opinions are subject to change at any time based on factors such as market and economic conditions. These views and opinions may not be relied upon as investment advice or recommendations, or as an offer for a particular security. The information is not a complete analysis of every aspect of any market, country, industry, security or the Fund. Statements of fact are from sources considered reliable, but Invesco Advisers, Inc. makes no representation or warranty as to their completeness or accuracy. Although historical performance is no guarantee of future results, these insights may help you understand our investment management philosophy.
See important Fund and, if applicable, index disclosures later in this report.
| | |
 | | Mark Ahnrud Chartered Financial Analyst, Portfolio Manager, is lead manager of Invesco Balanced-Risk |
| Allocation Fund. He joined Invesco in 2000. Mr. Ahnrud earned a BS in finance and investments from Babson College and an MBA from Duke University Fuqua School of Business. |
| |
 | | Chris Devine Chartered Financial Analyst, Portfolio Manager, is manager of Invesco Balanced-Risk Allocation Fund. |
| He joined Invesco in 1998. Mr. Devine earned a BA in economics from Wake Forest University and an MBA from the University of Georgia. |
| |
 | | Scott Hixon Chartered Financial Analyst, Portfolio Manager, is manager of Invesco Balanced-Risk Allocation Fund. |
| He joined Invesco in 1994. Mr. Hixon earned a BBA in finance from Georgia Southern University and an MBA from Georgia State University. |
| |
 | | Christian Ulrich Chartered Financial Analyst, Portfolio Manager, is manager of Invesco Balanced-Risk Allocation Fund. |
| He joined Invesco in 2000. Mr. Ulrich earned the equivalent of a BBA from the KV Zurich Business School in Zurich, Switzerland. |
| |
 | | Scott Wolle Chartered Financial Analyst, Portfolio Manager, is manager of Invesco Balanced-Risk Allocation Fund. |
| He joined Invesco in 1999. Mr. Wolle earned a BS in finance from Virginia Polytechnic Institute and State University and an MBA from Duke University Fuqua School of Business. |
Assisted by the Invesco Global Asset Allocation Team
|
| 5 Invesco Balanced-Risk Allocation Fund |
Your Fund’s Long-Term Performance
Results of a $10,000 Investment – Oldest Share Class(es) Since Inception
Fund and index data from 6/2/09
Past performance cannot guarantee comparable future results.
The data shown in the chart include reinvested distributions, applicable sales charges and Fund expenses including management fees. Results for Class B shares are calculated as if a hypothetical
shareholder had liquidated his entire investment in the Fund at the close of the reporting period and paid the contingent deferred sales charges, if applicable. Index results include reinvested dividends, but they do not reflect sales charges. Performance of the peer group,
if applicable, reflects fund expenses and management fees; performance of a market index does not. Performance shown in the chart and table(s) does not reflect deduction of taxes a shareholder would pay on Fund distributions or sale of Fund shares.
|
| 6 Invesco Balanced-Risk Allocation Fund |
| | | | | |
Average Annual Total Returns As of 10/31/15, including maximum applicable
sales charges |
| |
| Class A Shares | | | | | |
| Inception (6/2/09) | | | | 6.67 | % |
| 5 Years | | | | 4.23 | |
| 1 Year | | | | -7.05 | |
| |
| Class B Shares | | | | | |
| Inception (6/2/09) | | | | 6.81 | % |
| 5 Years | | | | 4.31 | |
| 1 Year | | | | -6.95 | |
| |
| Class C Shares | | | | | |
| Inception (6/2/09) | | | | 6.81 | % |
| 5 Years | | | | 4.63 | |
| 1 Year | | | | -3.23 | |
| |
| Class R Shares | | | | | |
| Inception (6/2/09) | | | | 7.34 | % |
| 5 Years | | | | 5.16 | |
| 1 Year | | | | -1.86 | |
| |
| Class Y Shares | | | | | |
| Inception (6/2/09) | | | | 7.89 | % |
| 5 Years | | | | 5.68 | |
| 1 Year | | | | -1.40 | |
| |
| Class R5 Shares | | | | | |
| Inception (6/2/09) | | | | 7.90 | % |
| 5 Years | | | | 5.69 | |
| 1 Year | | | | -1.39 | |
| |
| Class R6 Shares | | | | | |
| Inception | | | | 7.81 | % |
| 5 Years | | | | 5.65 | |
| 1 Year | | | | -1.27 | |
Class R6 shares incepted on September 24, 2012. Performance shown prior to that date is that of Class A shares and includes the 12b-1 fees applicable to Class A shares.
The performance data quoted represent past performance and cannot guarantee comparable future results; current performance may be lower or higher. Please visit invesco.com/performance for the most recent month-end performance. Performance figures reflect reinvested distributions, changes in net asset value and the effect of the maximum sales charge unless otherwise stated. Investment return and principal value will fluctuate so that you may have a gain or loss when you sell shares.
The net annual Fund operating expense ratio set forth in the most recent Fund prospectus as of the date of this report for Class A, Class B, Class C, Class R, Class Y, Class R5 and Class R6 shares was 1.25%, 2.00%, 2.00%, 1.50%, 1.00%, 0.98% and
| | | | | |
| Average Annual Total Returns As of 9/30/15, the most recent calendar quarter
end, including maximum applicable sales charges |
| |
| Class A Shares | | | | | |
| Inception (6/2/09) | | | | 6.34 | % |
| 5 Years | | | | 3.92 | |
| 1 Year | | | | -8.17 | |
| |
| Class B Shares | | | | | |
| Inception (6/2/09) | | | | 6.48 | % |
| 5 Years | | | | 3.98 | |
| 1 Year | | | | -8.03 | |
| |
| Class C Shares | | | | | |
| Inception (6/2/09) | | | | 6.48 | % |
| 5 Years | | | | 4.30 | |
| 1 Year | | | | -4.43 | |
| |
| Class R Shares | | | | | |
| Inception (6/2/09) | | | | 7.01 | % |
| 5 Years | | | | 4.82 | |
| 1 Year | | | | -3.06 | |
| |
| Class Y Shares | | | | | |
| Inception (6/2/09) | | | | 7.56 | % |
| 5 Years | | | | 5.35 | |
| 1 Year | | | | -2.59 | |
| |
| Class R5 Shares | | | | | |
| Inception (6/2/09) | | | | 7.58 | % |
| 5 Years | | | | 5.38 | |
| 1 Year | | | | -2.48 | |
| |
| Class R6 Shares | | | | | |
| Inception | | | | 7.48 | % |
| 5 Years | | | | 5.33 | |
| 1 Year | | | | -2.45 | |
0.88%, respectively.1,2 The total annual Fund operating expense ratio set forth in the most recent Fund prospectus as of the date of this report for Class A, Class B, Class C, Class R, Class Y, Class R5 and Class R6 shares was 1.29%, 2.04%, 2.04%, 1.54%, 1.04%, 1.02% and 0.92%, respectively.1 The expense ratios presented above may vary from the expense ratios presented in other sections of this report that are based on expenses incurred during the period covered by this report.
Class A share performance reflects the maximum 5.50% sales charge, and Class B and Class C share performance reflects the applicable contingent deferred sales charge (CDSC) for the period involved. The CDSC on Class B shares declines from 5% beginning at the time of purchase to 0% at the beginning of the seventh year. The CDSC on Class C shares is 1% for the first year after purchase. Class R, Class Y, Class R5 and Class R6 shares do not have a front-end sales charge or a
CDSC; therefore, performance is at net asset value.
The performance of the Fund’s share classes will differ primarily due to different sales charge structures and class expenses.
Fund performance reflects any applicable fee waivers and/or expense reimbursements. Had the adviser not waived fees and/or reimbursed expenses currently or in the past, returns would have been lower. See current prospectus for more information.
| 1 | The expense ratio includes acquired fund fees and expenses of the underlying funds in which the Fund invests of 0.05% for Invesco Balanced-Risk Allocation Fund. |
| 2 | Total annual Fund operating expenses after any contractual fee waivers and/or expense reimbursements by the adviser in effect through at least June 30, 2017. See current prospectus for more information. |
|
| 7 Invesco Balanced-Risk Allocation Fund |
Invesco Balanced-Risk Allocation Fund’s investment objective is to provide total return with a low to moderate correlation to traditional financial market indices.
| | n | | Unless otherwise stated, information presented in this report is as of October 31, 2015, and is based on total net assets. |
| | n | | Unless otherwise noted, all data provided by Invesco. |
| | n | | To access your Fund’s reports/prospectus, visit invesco.com/fundreports. |
About share classes
| n | | Class B shares may not be purchased for new or additional investments. Please see the prospectus for more information. |
| n | | Class R shares are generally available only to employer sponsored retirement and benefit plans. Please see the prospectus for more information. |
| n | | Class Y shares are available only to certain investors. Please see the prospectus for more information. |
| n | | Class R5 shares and Class R6 shares are primarily intended for employer sponsored retirement and benefit plans that meet certain standards and for institutional investors. Please see the prospectus for more information. |
Principal risks of investing in the Fund
| n | | Changing fixed income market conditions risk. The current low interest rate environment was created in part by the Federal Reserve Board (FRB) and certain foreign central banks keeping the federal funds and equivalent foreign rates at or near zero. There is a risk that interest rates will rise when the FRB and central banks raise these rates. This risk is heightened due to the end of FRB’s quantitative easing program and the “tapering” of other similar foreign central bank actions. This eventual increase in the federal funds and equivalent foreign rates may expose fixed income markets to heightened volatility and reduced liquidity for certain fixed income investments, particularly those with longer maturities. In addition, decreases in fixed income dealer market-making capacity may also potentially lead to heightened volatility and reduced liquidity in the fixed income markets. As a result, the value of the Fund’s investments and share price may decline. Changes in central bank policies could also result in higher than normal shareholder redemptions, which could potentially increase portfolio |
| | | turnover and the Fund’s transaction costs. |
| n | | Commodities tax risk. The tax treatment of commodity-linked derivative instruments may be adversely affected by changes in legislation, regulations or other legally binding authority. If, as a result of any such adverse action, the income of the Fund from certain commodity-linked derivatives was treated as non-qualifying income, the Fund might fail to qualify as a regulated investment company and be subject to federal income tax at the Fund level. The Fund has received private letter rulings from the Internal Revenue Service confirming that income derived from the Fund’s investments in the Subsidiary and a form of commodity-linked note constitutes qualifying income to the Fund. However, the Internal Revenue Service suspended issuance in July 2011 of any further private letter rulings pending a review of its position. Should the Internal Revenue Service issue guidance, or Congress enact legislation, that adversely affects the tax treatment of the Fund’s use of commodity-linked notes, or the Subsidiary, it could limit the Fund’s ability to pursue its investment strategy. In this event, the Fund’s Board of Trustees may authorize a significant change in investment strategy or Fund liquidation. The Fund also may incur transaction and other costs to comply with any new or additional guidance from the Internal Revenue Service. |
| n | | Commodity-linked notes risk. The Fund’s investments in commodity-linked notes may involve substantial risks, including risk of loss of a significant portion of their principal value. In addition to risks associated with the underlying commodities, they may be subject to additional special risks, such as the lack of a secondary trading market and temporary price distortions due to speculators and/or the continuous rolling over of futures contracts underlying the notes. Commodity-linked |
| | | notes are also subject to counterparty risk, which is the risk that the other party to the contract will not fulfill its contractual obligation to complete the transaction with the Fund. |
| n | | Commodity risk. The Fund’s significant investment exposure to the commodities markets and/or a particular sector of the commodities markets, which may subject the Fund to greater volatility than investments in traditional securities, such as stocks and bonds. The commodities markets may fluctuate widely based on a variety of factors, including changes in overall market movements, domestic and foreign political and economic events and policies, war, acts of terrorism, changes in domestic or foreign interest rates and/ or investor expectations concerning interest rates, domestic and foreign inflation rates and investment and trading activities of mutual funds, hedge funds and commodities funds. Prices of various commodities may also be affected by factors such as drought, floods, weather, livestock disease, embargoes, tariffs and other regulatory developments. The prices of commodities can also fluctuate widely due to supply and demand disruptions in major producing or consuming regions. Because the Fund’s performance is linked to the performance of potentially volatile commodities, investors should be willing to assume the risks of potentially significant fluctuations in the value of the Fund’s shares. |
| n | | Correlation risk. Changes in the value of two investments or asset classes may not track or offset each other in the manner anticipated by the portfolio managers. Because the Fund’s investment strategy seeks to balance risk across three asset classes and, within each asset class, to balance risk across different countries and commodities, to the extent either the three asset classes or the selected countries and commodities are correlated in a way not anticipated by the portfolio managers the Fund’s risk allocation process may not succeed in achieving its investment objective. |
| n | | Credit risk. The issuer of instruments in which the Fund invests may be unable to meet interest and/or principal payments, thereby causing its instruments |
|
This report must be accompanied or preceded by a currently effective Fund prospectus, which contains more complete information, including sales charges and expenses. Investors should read it carefully before investing. |
|
|
| NOT FDIC INSURED | MAY LOSE VALUE | NO BANK GUARANTEE |
|
| 8 Invesco Balanced-Risk Allocation Fund |
| | to decrease in value and lowering the issuer’s credit rating. |
| n | | Currency/exchange rate risk. The dollar value of the Fund’s foreign investments will be affected by changes in the exchange rates between the dollar and the currencies in which those investments are traded. |
| n | | Derivatives risk. The value of a derivative instrument depends largely on (and is derived from) the value of an underlying security, currency, commodity, interest rate, index or other asset (each referred to as an underlying asset). In addition to risks relating to the underlying assets, the use of derivatives may include other, possibly greater, risks, including counterparty, leverage and liquidity risks. Counterparty risk is the risk that the counterparty to the derivative contract will default on its obligation to pay the Fund the amount owed or otherwise perform under the derivative contract. Derivatives create leverage risk because they do not require payment up front equal to the economic exposure created by owning the derivative. As a result, an adverse change in the value of the underlying asset could result in the Fund sustaining a loss that is substantially greater than the amount invested in the derivative, which may make the Fund’s returns more volatile and increase the risk of loss. Derivative instruments may also be less liquid than more traditional investments and the Fund may be unable to sell or close out its derivative positions at a desirable time or price. This risk may be more acute under adverse market conditions, during which the Fund may be most in need of liquidating its derivative positions. Derivatives may also be harder to value, less tax efficient and subject to changing government regulation that could impact the Fund’s ability to use certain derivatives or their cost. Also, derivatives used for hedging or to gain or limit exposure to a particular market segment may not provide the expected benefits, particularly during adverse market conditions. These risks are greater for the Fund than most other mutual funds because the Fund will implement its investment strategy primarily through derivative instruments rather than direct investments in stocks and bonds. |
| n | | Developing/emerging markets securities risk. The prices of securities issued by foreign companies and governments located in developing/emerging markets countries may be affected more negatively by inflation, devaluation of their currencies, higher transaction costs, delays in settlement, adverse political developments, the introduction of capital controls, withholding taxes, nationalization of private assets, expropriation, social unrest, war or lack of timely information than those in developed countries. |
| n | | Exchange-traded funds risk. An investment by the Fund in exchange-traded funds generally presents the same primary risks as an investment in a mutual fund. In addition, an exchange-traded fund may be subject to the following: (1) a discount of the exchange-traded fund’s shares to its net asset value; (2) failure to develop an active trading market for the exchange-traded fund’s shares; (3) the listing exchange halting trading of the exchange-traded fund’s shares; (4) failure of the exchange-traded fund’s shares to track the referenced asset; and (5) holding troubled securities in the referenced index or basket of investments. Investments in exchange-traded funds may involve duplication of management fees and certain other expenses, as the Fund indirectly bears its proportionate share of any expenses paid by the exchange-traded funds in which it invests. Further, certain of the exchange-traded funds in which the Fund may invest are leveraged. The more the Fund invests in such leveraged exchange-traded funds, the more this leverage will magnify any losses on those investments. |
| n | | Exchange-traded notes risk. Exchange-traded notes are subject to credit risk, including the credit risk of the issuer, and the value of the exchange-traded note may drop due to a downgrade in the issuer’s credit rating, despite the underlying market benchmark or strategy remaining unchanged. The value of an exchange-traded note may also be influenced by time to maturity, level of supply and demand for the exchange-traded note, volatility and lack of liquidity in the underlying market, changes in the applicable interest rates, changes in the issuer’s credit rating, and economic, |
| | | legal, political, or geographic events that affect the referenced underlying market or strategy. Exchange-traded notes are also subject to the risk that the other party to the contract will not fulfill its contractual obligations, which may cause losses or additional costs to the Fund. |
| n | | Foreign government debt risk. Investments in foreign government debt obligations involve certain risks in addition to those relating to foreign securities or debt securities generally. The issuer of the debt or the governmental authorities that control the repayment of the debt may be unable or unwilling to repay principal or interest when due in accordance with the terms of such debt, and the Fund may have limited recourse in the event of a default against the defaulting government. Without the approval of debt holders, some governmental debtors have in the past been able to reschedule or restructure their debt payments or declare moratoria on payments. |
| n | | Foreign securities risk. The Fund’s foreign investments may be affected by changes in a foreign country’s exchange rates, political and social instability; changes in economic or taxation policies, difficulties when enforcing obligations, decreased liquidity, and increased volatility. Foreign companies may be subject to less regulation resulting in less publicly available information about the companies. |
| n | | Interest rate risk. Interest rate risk refers to the risk that bond prices generally fall as interest rates rise; conversely, bond prices generally rise as interest rates fall. Specific bonds differ in their sensitivity to changes in interest rates depending on their individual characteristics, including duration. The risk may be magnified due to the Fund’s use of derivatives that provided leveraged exposure to government bonds. |
| n | | Liquidity risk. The Fund may hold illiquid securities that it is unable to sell at the preferred time or price and could lose its entire investment in such securities. The Fund’s significant use of derivative instruments may cause liquidity risk to be greater than other mutual funds that invest in more traditional assets such as stocks and bonds, which trade on markets with more market participants. |
|
| 9 Invesco Balanced-Risk Allocation Fund |
| n | | Management risk. The investment techniques and risk analysis used by the Fund’s portfolio managers may not produce the desired results. Because the Fund’s investment process relies heavily on its asset allocation process, market movements that are counter to the portfolio managers’ expectations may have a significant adverse effect on the Fund’s net asset value. Further, the portfolio managers’ use of short derivative positions and instruments that provide economic leverage increases the volatility of the Fund’s net asset value, which increases the potential of greater losses that may cause the Fund to liquidate positions when it may not be advantageous to do so. |
| n | | Market risk. The prices of and the income generated by the Fund’s securities may decline in response to, among other things, investor sentiment, general economic and market conditions, regional or global instability, and currency and interest rate fluctuations. |
| n | | Subsidiary risk. By investing in the Subsidiary, the Fund is indirectly exposed to risks associated with the Subsidiary’s investments. The Subsidiary is not registered under the Investment Company Act of 1940, as amended (1940 Act), and, except as otherwise noted in this prospectus is not subject to the investor protections of the 1940 Act. Changes in the laws of the United States and/or the Cayman Islands, under which the Fund and the Subsidiary, respectively, are organized, could result in the inability of the Fund and/or the Subsidiary to operate as described in this prospectus and could negatively affect the Fund and its shareholders. |
| n | | US government obligations risk. The Fund may invest in obligations issued by US government agencies and instrumentalities that may receive varying levels of support from the government, which could affect the Fund’s ability to recover should they default. |
| n | | Volatility risk. The Fund may have investments that appreciate or decrease significantly in value over short periods of time. This may cause the Fund’s net asset value per share to experience significant increases or declines in value over short periods of time. |
About indexes used in this report
| n | | The S&P 500® Index is an unmanaged index considered representative of the US stock market. |
| n | | The Custom Invesco Balanced-Risk Allocation Broad Index consists of 60% S&P 500 Index and 40% Barclays U.S. Aggregate Index. |
| n | | The Custom Invesco Balanced-Risk Allocation Style Index consists of 60% MSCI World Index and 40% Barclays U.S. Aggregate Index. Effective December 1, 2009, the fixed income component of the Custom Invesco Balanced Risk Allocation Style Index changed from the JP Morgan GBI Global (Traded) Index to the Barclays U.S. Aggregate Index. |
| n | | The Lipper Alternative Global Macro Funds Index is an unmanaged index considered representative of alternative global macro funds tracked by Lipper. |
| n | | The MSCI World IndexSM is an unmanaged index considered representative of stocks of developed countries. The index return is computed using the net return, which withholds applicable taxes for nonresident investors. |
| n | | The Barclays U.S. Aggregate Index is an unmanaged index considered representative of the U.S. investment-grade, fixed-rate bond market. |
| n | | The JP Morgan GBI Global (Traded) Index is a total return, market-cap weighted index that is rebalanced monthly and includes the following countries: Australia, Belgium, Canada, Denmark, Germany, Italy, Japan, Netherlands, Spain, Sweden, United Kingdom and US. |
| n | | The Fund is not managed to track the performance of any particular index, including the index(es) described here, and consequently, the performance of the Fund may deviate significantly from the performance of the index(es). |
| n | | A direct investment cannot be made in an index. Unless otherwise indicated, index results include reinvested dividends, and they do not reflect sales charges. Performance of the peer group, if applicable, reflects fund expenses; performance of a market index does not. |
Other information
| n | | The returns shown in management’s discussion of Fund performance are based on net asset values (NAVs) calculated for shareholder transactions. Generally accepted accounting principles require adjustments to be made to the net assets of the Fund at period end for financial reporting purposes, and as such, the NAVs for shareholder transactions and the returns based on those NAVs may differ from the NAVs and returns reported in the Financial Highlights. |
|
| 10 Invesco Balanced-Risk Allocation Fund |
Consolidated Schedule of Investments
October 31, 2015
| | | | | | | | | | | | | | | | |
| | | Interest
Rate | | | Maturity
Date | | | Principal
Amount | | | Value | |
U.S. Treasury Securities–34.19% | |
| U.S. Treasury Bills–10.41%(a) | |
U.S. Treasury Bills(b) | | | 0.08 | % | | | 01/07/16 | | | $ | 37,600,000 | | | $ | 37,595,859 | |
U.S. Treasury Bills(b) | | | 0.10 | % | | | 01/14/16 | | | | 56,400,000 | | | | 56,391,413 | |
U.S. Treasury Bills(b) | | | 0.13 | % | | | 01/21/16 | | | | 52,640,000 | | | | 52,632,386 | |
U.S. Treasury Bills | | | 0.13 | % | | | 01/21/16 | | | | 218,120,000 | | | | 218,088,452 | |
U.S. Treasury Bills(b) | | | 0.14 | % | | | 01/28/16 | | | | 64,900,000 | | | | 64,888,224 | |
U.S. Treasury Bills | | | 0.14 | % | | | 01/28/16 | | | | 168,280,000 | | | | 168,249,466 | |
U.S. Treasury Bills(b) | | | 0.00 | % | | | 03/03/16 | | | | 48,160,000 | | | | 48,145,298 | |
U.S. Treasury Bills(b) | | | 0.00 | % | | | 03/10/16 | | | | 35,150,000 | | | | 35,138,653 | |
U.S. Treasury Bills(b) | | | 0.25 | % | | | 03/17/16 | | | | 65,830,000 | | | | 65,806,353 | |
| | | | | | | | | | | | | | | | 746,936,104 | |
|
| U.S. Treasury Notes–23.78% | |
U.S. Treasury Notes(b)(c)(d) | | | 0.07 | % | | | 01/31/16 | | | | 128,630,000 | | | | 128,638,378 | |
U.S. Treasury Notes(d) | | | 0.07 | % | | | 01/31/16 | | | | 413,350,000 | | | | 413,376,921 | |
U.S. Treasury Notes(b)(d) | | | 0.09 | % | | | 04/30/16 | | | | 213,526,000 | | | | 213,552,447 | |
U.S. Treasury Notes(d) | | | 0.09 | % | | | 04/30/16 | | | | 346,240,000 | | | | 346,282,885 | |
U.S. Treasury Notes(d) | | | 0.09 | % | | | 07/31/16 | | | | 475,520,000 | | | | 475,563,848 | |
U.S. Treasury Notes(b)(d) | | | 0.09 | % | | | 07/31/16 | | | | 127,900,000 | | | | 127,911,794 | |
| | | | | | | | | | | | | | | | 1,705,326,273 | |
Total U.S. Treasury Securities (Cost $2,452,044,261) | | | | | | | | | | | | | | | 2,452,262,377 | |
| | | | |
| | | | | | Expiration
Date | | | | | | | |
Commodity-Linked Securities–3.50% | | | | | | | | | | | | | | | | |
Canadian Imperial Bank of Commerce, Commodity Linked EMTN, U.S. Federal Funds Effective Rate minus 0.04% (linked to Canadian Imperial Bank of Commerce Custom 3 Agriculture Commodity Index, multiplied by 2) (Canada)(b)(e) | | | | | | | 06/21/16 | | | | 72,200,000 | | | | 69,817,883 | |
Cargill, Inc., Commodity Linked Notes, one month LIBOR rate minus 0.10% (linked to the Monthly Rebalance Commodity Excess Return Index, multiplied by 2)(b)(e) | | | | | | | 06/12/16 | | | | 134,694,924 | | | | 132,906,352 | |
RBC Capital Markets, LLC, Commodity Linked Notes, U.S. Federal Funds Effective Rate minus 0.04% (linked to the RBC Enhanced Agricultural Basket 02 Excess Return Index, multiplied by 2) (Canada)(b)(e) | | | | | | | 06/07/16 | | | | 50,000,000 | | | | 48,536,794 | |
Total Commodity-Linked Securities (Cost $256,894,924) | | | | | | | | | | | | | | | 251,261,029 | |
| | | | |
| | | | | | | | | Shares | | | | |
Money Market Funds–56.59% | | | | | | | | | | | | | | | | |
Liquid Assets Portfolio–Institutional Class 0.16%(f) | | | | | | | | | | | 550,178,766 | | | | 550,178,766 | |
Premier Portfolio–Institutional Class, 0.12%(f) | | | | | | | | | | | 550,178,767 | | | | 550,178,767 | |
STIC (Global Series) PLC–U.S. Dollar Liquidity Portfolio (Ireland)–Institutional Class, 0.11%(b)(f) | | | | | | | | | | | 556,079,009 | | | | 556,079,009 | |
Treasury Portfolio–Institutional Class, 0.02%(f) | | | | | | | | | | | 2,402,993,463 | | | | 2,402,993,463 | |
Total Money Market Funds (Cost $4,059,430,005) | | | | | | | | | | | | | | | 4,059,430,005 | |
TOTAL INVESTMENTS–94.28% (Cost $6,768,369,190) | | | | | | | | | | | | | | | 6,762,953,411 | |
OTHER ASSETS LESS LIABILITIES–5.72% | | | | | | | | | | | | | | | 410,073,983 | |
NET ASSETS–100.00% | | | | | | | | | | | | | | $ | 7,173,027,394 | |
See accompanying Notes to Consolidated Financial Statements which are an integral part of the financial statements.
11 Invesco Balanced-Risk Allocation Fund
| | | | | | | | | | | | | | | | | | | | | | |
| Open Futures Contracts at Period-End(g) | |
| Futures Contracts | | Type of
Contract | | | | | Number of
Contracts | | | Expiration
Month | | | Notional
Value | | | Unrealized Appreciation (Depreciation) | |
Brent Crude(b) | | | Long | | | | | | 1,500 | | | | March-2016 | | | $ | 77,595,000 | | | $ | (1,785,905 | ) |
Gasoline Reformulated Blendstock Oxygenate Blending(b) | | | Long | | | | | | 2,040 | | | | December-2015 | | | | 117,518,688 | | | | 5,540,385 | |
Heating Oil(b) | | | Long | | | | | | 60 | | | | April-2016 | | | | 3,964,716 | | | | (16,703 | ) |
Natural Gas(b) | | | Long | | | | | | 330 | | | | December-2015 | | | | 7,659,300 | | | | (1,805,179 | ) |
Silver(b) | | | Long | | | | | | 2,290 | | | | December-2015 | | | | 178,242,150 | | | | 2,557,154 | |
WTI Crude(b) | | | Long | | | | | | 1,315 | | | | December-2015 | | | | 61,265,850 | | | | 1,467,245 | |
Subtotal — Commodity Risk | | | | | | | | | | | | | | | | | | | | $ | 5,956,997 | |
| | | | | | |
| | | | | | | | | | | | | | | | | | | | | | |
Australian 10 Year Bonds | | | Long | | | | | | 10,430 | | | | December-2015 | | | $ | 962,144,626 | | | $ | 8,169,880 | |
Canada 10 Year Bonds | | | Long | | | | | | 12,040 | | | | December-2015 | | | | 1,293,584,155 | | | | (24,905,376 | ) |
Euro Bonds | | | Long | | | | | | 7,130 | | | | December-2015 | | | | 1,232,661,758 | | | | 25,429,499 | |
Japan 10 Year Bonds | | | Long | | | | | | 770 | | | | December-2015 | | | | 947,967,183 | | | | 5,081,187 | |
Long Gilt | | | Long | | | | | | 7,250 | | | | December-2015 | | | | 1,316,215,388 | | | | (3,149,352 | ) |
U.S. Treasury 20 Year Bonds | | | Long | | | | | | 4,590 | | | | December-2015 | | | | 718,048,125 | | | | 1,881,074 | |
Subtotal — Interest Rate Risk | | | | | | | | | | | | | | | | | | | | $ | 12,506,912 | |
| | | | | | |
| | | | | | | | | | | | | | | | | | | | | | |
Dow Jones EURO STOXX 50 Index | | | Long | | | | | | 11,050 | | | | December-2015 | | | $ | 413,521,841 | | | $ | 22,400,695 | |
E-Mini S&P 500 Index | | | Long | | | | | | 2,880 | | | | December-2015 | | | | 298,612,800 | | | | 19,408,742 | |
FTSE 100 Index | | | Long | | | | | | 4,800 | | | | December-2015 | | | | 467,720,448 | | | | 14,999,022 | |
Hang Seng Index | | | Long | | | | | | 2,830 | | | | November-2015 | | | | 414,133,873 | | | | (6,385,405 | ) |
Russell 2000 Index Mini | | | Long | | | | | | 3,140 | | | | December-2015 | | | | 363,706,200 | | | | 6,259,736 | |
Tokyo Stock Price Index | | | Long | | | | | | 3,540 | | | | December-2015 | | | | 457,204,773 | | | | 37,611,846 | |
Subtotal — Equity Risk | | | | | | | | | | | | | | | | | | | | $ | 94,294,636 | |
Total Future Contracts | | | | | | | | | | | | | | | | | | | | $ | 112,758,545 | |
| | | | | | |
| | | | | | | | | | | | | | | | | | | | | | |
| Open Over-The-Counter Total Return Swap Agreements at Period-End | |
| Long Swap Agreements | | Type of
Contract | | | Counterparty | | Number of
Contracts | | | Termination
Date | | | Notional
Value | | | Unrealized
Appreciation
(Depreciation) | |
Receive a return equal to Barclays Commodity Strategy 1452 Excess Return Index and pay the product of (i) 0.33% of the Notional value multiplied by (ii) days in the period divided by 365(b) | | | Long | | | Barclays Bank PLC | | | 123,000 | | | | October-2016 | | | $ | 52,195,456 | | | $ | (577,904 | ) |
Receive a return equal to CIBC Dynamic Roll LME Copper Excess Return Index and pay the product of (i) 0.30% of the Notional value multiplied by (ii) days in the period divided by 365(b) | | | Long | | | Canadian Imperial Bank of Commerce | | | 2,275,000 | | | | April-2016 | | | | 151,973,868 | | | | (4,495,855 | ) |
Receive a return equal to Monthly Rebalance Commodity Excess Return Index and pay the product of (i) 0.47% of the Notional value multiplied by (ii) days in the period divided by 365(b) | | | Long | | | Cargill, Inc. | | | 84,000 | | | | May-2016 | | | | 81,575,525 | | | | 0 | |
Receive a return equal to Single Commodity Index Excess Return and pay the product of (i) 0.12% of the Notional value multiplied by (ii) days in the period divided by 365(b) | | | Long | | | Cargill, Inc. | | | 37,200 | | | | January-2016 | | | | 30,305,035 | | | | 0 | |
Receive a return equal to the Goldman Sachs Alpha Basket B784 Excess Return Strategy Index and pay the product of (i) 0.40% of the Notional Amount multiplied by (ii) days in the period divided by 365(b) | | | Long | | | Goldman Sachs International | | | 9,000 | | | | May-2016 | | | | 2,438,942 | | | | 0 | |
See accompanying Notes to Consolidated Financial Statements which are an integral part of the financial statements.
12 Invesco Balanced-Risk Allocation Fund
| | | | | | | | | | | | | | | | | | | | | | |
| Long Swap Agreements | | Type of
Contract | | | Counterparty | | Number of
Contracts | | | Termination
Date | | | Notional
Value | | | Unrealized
Appreciation
(Depreciation) | |
Receive a return equal to the J.P. Morgan Contag Beta Gas Oil Excess Return Index and pay the product of (i) 0.25% of the Notional Amount multiplied by (ii) days in the period divided by 365(b) | | | Long | | | J.P. Morgan Chase Bank, N.A. | | | 57,000 | | | | April-2016 | | | $ | 13,012,980 | | | $ | 303,970 | |
Receive a return equal to S&P GSCI Gold Index Excess Return and pay the product of (i) 0.09% of the Notional value multiplied by (ii) days in the period divided by 365(b) | | | Long | | | J.P. Morgan Chase Bank, N.A. | | | 1,125,000 | | | | October-2016 | | | | 109,662,750 | | | | (2,322,900 | ) |
Receive a return equal to the Merrill Lynch Gold Excess Return Index and pay the product of (i) 0.14% of the Notional Amount multiplied by (ii) days in the period divided by 365(b) | | | Long | | | Merrill Lynch International | | | 899,000 | | | | June-2016 | | | | 134,430,527 | | | | 0 | |
Receive a return equal to the MLCX Aluminum Annual ER Index and pay the product of (i) 0.28% of the Notional Amount multiplied by (ii) days in the period divided by 365(b) | | | Long | | | Merrill Lynch International | | | 43,000 | | | | September-2016 | | | | 3,721,845 | | | | 0 | |
Receive a return equal to S&P GSCI Aluminum Dynamic Roll Index Excess Return and pay the product of (i) 0.38% of the Notional value multiplied by (ii) days in the period divided by 365(b) | | | Long | | | Morgan Stanley Capital Services LLC | | | 1,660,000 | | | | October-2016 | | | | 147,253,371 | | | | (9,150,832 | ) |
Total Commodity Risk — Swap Agreements | | | | | | | | | | | | | | | | | | | | $ | (16,243,521 | ) |
Investment Abbreviations:
| | | | |
|
| EMTN | | – Euro Medium Term Notes |
| LIBOR | | – London Interbank Offered Rate |
Index Information:
| | |
| Canadian Imperial Bank of Commerce Custom 3 Agriculture Index | | – a basket of indices that provide exposure to various components of the agriculture markets. The underlying commodities comprising the indices are: Coffee ‘C’, Corn, Cotton, Sugar, Soybeans, Soybean meal, Soybean oil, and Wheat. |
| Monthly Rebalance Commodity Excess Return Index | | – a commodity index composed of futures contracts on Coffee ‘C’, Corn, Cotton No.2, Soybean Meal, Soybeal Oil, Soybeans, Sugar No.11 and Wheat. |
| RBC Enhanced Agricultural Basket 02 Excess Return Index | | – a commodity index composed of futures contracts on Corn, Coffee, Wheat, Cotton, Soybeans, Soybean meal, Soybean oil and Sugar. |
| Barclays Commodity Strategy 1452 Excess Return Index | | – a commodity index that provide exposure to future contracts on copper. |
| Single Commodity Index Excess Return | | – a commodity index composed of future contracts on gold. |
| Goldman Sachs Alpha Basket B784 Excess Return Strategy Index | | – a basket of indices that provide exposure to various components of the agriculture markets. The underlying commodities comprising the indices are: Corn, Coffee, Cotton, Soybeans, Soybean meal, Soybean oil, Sugar and Wheat. |
Notes to Schedule of Investments:
| (a) | Security traded on a discount basis. The interest rate shown represents the discount rate at the time of purchase by the Fund. |
| (b) | The investment is owned by the Subsidiary. See Note 5. |
| (c) | All or a portion of the value was designated as collateral to cover margin requirements for swap agreements. See Note 1L and Note 4. |
| (d) | Interest or dividend rate is redetermined periodically. Rate shown is the rate in effect on October 31, 2015. |
| (e) | Security purchased or received in a transaction exempt from registration under the Securities Act of 1933, as amended (the “1933 Act”). The security may be resold pursuant to an exemption from registration under the 1933 Act, typically to qualified institutional buyers. The aggregate value of these securities at October 31, 2015 was $251,261,029, which represented 3.50% of the Fund’s Net Assets. |
| (f) | The money market fund and the Fund are affiliated by having the same investment adviser. The rate shown is the 7-day SEC standardized yield as of October 31, 2015. |
| (g) | Futures collateralized by $440,520,000 cash held with Merrill Lynch, the futures commission merchant. |
See accompanying Notes to Consolidated Financial Statements which are an integral part of the financial statements.
13 Invesco Balanced-Risk Allocation Fund
Consolidated Statement of Assets and Liabilities
October 31, 2015
| | | | |
Assets: | |
Investments, at value (Cost $2,708,939,185) | | $ | 2,703,523,406 | |
Investments in affiliated money market funds, at value and cost | | | 4,059,430,005 | |
Total investments, at value (Cost $6,768,369,190) | | | 6,762,953,411 | |
Receivable for: | | | | |
Deposits with brokers for open futures contracts and swap agreements | | | 442,218,335 | |
Variation margin — futures contracts | | | 2,079,367 | |
Fund shares sold | | | 5,396,115 | |
Dividends and interest | | | 580,522 | |
Fund expenses absorbed | | | 192,353 | |
Swaps receivables | | | 6,298,756 | |
Investment for trustee deferred compensation and retirement plans | | | 548,119 | |
Unrealized appreciation on swap agreements — OTC | | | 303,970 | |
Other assets | | | 106,234 | |
Total assets | | | 7,220,677,182 | |
|
Liabilities: | |
Payable for: | | | | |
Fund shares reacquired | | | 25,376,041 | |
Accrued fees to affiliates | | | 4,005,091 | |
Accrued trustees’ and officers’ fees and benefits | | | 9,216 | |
Accrued other operating expenses | | | 647,337 | |
Swaps payable | | | 421,925 | |
Trustee deferred compensation and retirement plans | | | 642,687 | |
Unrealized depreciation on swap agreements — OTC | | | 16,547,491 | |
Total liabilities | | | 47,649,788 | |
Net assets applicable to shares outstanding | | $ | 7,173,027,394 | |
|
Net assets consist of: | |
Shares of beneficial interest | | $ | 6,743,515,324 | |
Undistributed net investment income (loss) | | | 183,388,056 | |
Undistributed net realized gain (loss) | | | 155,024,769 | |
Net unrealized appreciation | | | 91,099,245 | |
| | | $ | 7,173,027,394 | |
| | | | |
Net Assets: | |
Class A | | $ | 2,371,656,871 | |
Class B | | $ | 13,241,852 | |
Class C | | $ | 1,584,982,403 | |
Class R | | $ | 25,689,678 | |
Class Y | | $ | 2,600,015,386 | |
Class R5 | | $ | 158,826,223 | |
Class R6 | | $ | 418,614,981 | |
|
Shares outstanding, $0.01 par value per share,
with an unlimited number of shares authorized: | |
Class A | | | 210,434,175 | |
Class B | | | 1,220,910 | |
Class C | | | 146,135,054 | |
Class R | | | 2,311,004 | |
Class Y | | | 227,942,745 | |
Class R5 | | | 13,917,834 | |
Class R6 | | | 36,633,954 | |
Class A: | | | | |
Net asset value per share | | $ | 11.27 | |
Maximum offering price per share | | | | |
(Net asset value of $11.27 ¸ 94.50%) | | $ | 11.93 | |
Class B: | | | | |
Net asset value and offering price per share | | $ | 10.85 | |
Class C: | | | | |
Net asset value and offering price per share | | $ | 10.85 | |
Class R: | | | | |
Net asset value and offering price per share | | $ | 11.12 | |
Class Y: | | | | |
Net asset value and offering price per share | | $ | 11.41 | |
Class R5: | | | | |
Net asset value and offering price per share | | $ | 11.41 | |
Class R6: | | | | |
Net asset value and offering price per share | | $ | 11.43 | |
See accompanying Notes to Consolidated Financial Statements which are an integral part of the financial statements.
14 Invesco Balanced-Risk Allocation Fund
Consolidated Statement of Operations
For the year ended October 31, 2015
| | | | |
Investment income: | |
Dividends from affiliated money market funds | | $ | 1,996,744 | |
Interest | | | 2,206,212 | |
Total investment income | | | 4,202,956 | |
| |
Expenses: | | | | |
Advisory fees | | | 73,008,890 | |
Administrative services fees | | | 738,080 | |
Custodian fees | | | 256,400 | |
Distribution fees: | | | | |
Class A | | | 6,828,367 | |
Class B | | | 172,196 | |
Class C | | | 17,965,908 | |
Class R | | | 141,334 | |
Transfer agent fees — A, B, C, R and Y | | | 9,908,330 | |
Transfer agent fees — R5 | | | 171,196 | |
Transfer agent fees — R6 | | | 6,557 | |
Trustees’ and officers’ fees and benefits | | | 145,091 | |
Other | | | 1,665,411 | |
Total expenses | | | 111,007,760 | |
Less: Fees waived and expense offset arrangement(s) | | | (4,371,963 | ) |
Net expenses | | | 106,635,797 | |
Net investment income (loss) | | | (102,432,841 | ) |
| |
Realized and unrealized gain (loss) from: | | | | |
Net realized gain (loss) from: | | | | |
Investment securities | | | (75,442,841 | ) |
Foreign currencies | | | (2,896,663 | ) |
Futures contracts | | | 153,907,563 | |
Swap agreements | | | (156,325,603 | ) |
| | | | (80,757,544 | ) |
Change in net unrealized appreciation (depreciation) of: | | | | |
Investment securities | | | (4,639,646 | ) |
Futures contracts | | | 67,145,293 | |
Swap agreements | | | (20,386,148 | ) |
| | | | 42,119,499 | |
Net realized and unrealized gain (loss) | | | (38,638,045 | ) |
Net increase (decrease) in net assets resulting from operations | | $ | (141,070,886 | ) |
See accompanying Notes to Consolidated Financial Statements which are an integral part of the financial statements.
15 Invesco Balanced-Risk Allocation Fund
Consolidated Statement of Changes in Net Assets
For the years ended October 31, 2015 and 2014
| | | | | | | | |
| | | 2015 | | | 2014 | |
Operations: | | | | | |
Net investment income (loss) | | $ | (102,432,841 | ) | | $ | (121,312,189 | ) |
Net realized gain (loss) | | | (80,757,544 | ) | | | 758,417,753 | |
Change in net unrealized appreciation (depreciation) | | | 42,119,499 | | | | (337,108,788 | ) |
Net increase (decrease) in net assets resulting from operations | | | (141,070,886 | ) | | | 299,996,776 | |
| | |
Distributions to shareholders from net investment income: | | | | | | | | |
Class A | | | (56,654,014 | ) | | | — | |
Class B | | | (243,139 | ) | | | — | |
Class C | | | (22,928,504 | ) | | | — | |
Class R | | | (492,454 | ) | | | — | |
Class Y | | | (81,503,225 | ) | | | — | |
Class R5 | | | (4,180,439 | ) | | | — | |
Class R6 | | | (11,328,824 | ) | | | — | |
Total distributions from net investment income | | | (177,330,599 | ) | | | — | |
| | |
Distributions to shareholders from net realized gains: | | | | | | | | |
Class A | | | (152,016,609 | ) | | | (283,367,752 | ) |
Class B | | | (1,108,269 | ) | | | (2,208,248 | ) |
Class C | | | (104,512,062 | ) | | | (178,493,603 | ) |
Class R | | | (1,529,651 | ) | | | (2,094,860 | ) |
Class Y | | | (191,523,927 | ) | | | (320,352,034 | ) |
Class R5 | | | (9,729,719 | ) | | | (13,942,287 | ) |
Class R6 | | | (25,148,843 | ) | | | (37,054,031 | ) |
Total distributions from net realized gains | | | (485,569,080 | ) | | | (837,512,815 | ) |
| | |
Share transactions–net: | | | | | | | | |
Class A | | | (315,179,338 | ) | | | (1,118,220,825 | ) |
Class B | | | (5,990,731 | ) | | | (8,976,629 | ) |
Class C | | | (176,875,307 | ) | | | (491,595,208 | ) |
Class R | | | 83,322 | | | | (557,151 | ) |
Class Y | | | (777,963,492 | ) | | | (938,385,675 | ) |
Class R5 | | | (12,008,689 | ) | | | (12,756,282 | ) |
Class R6 | | | (20,668,805 | ) | | | (22,311,912 | ) |
Net increase (decrease) in net assets resulting from share transactions | | | (1,308,603,040 | ) | | | (2,592,803,682 | ) |
Net increase (decrease) in net assets | | | (2,112,573,605 | ) | | | (3,130,319,721 | ) |
| | |
Net assets: | | | | | | | | |
Beginning of year | | | 9,285,600,999 | | | | 12,415,920,720 | |
End of year (includes undistributed net investment income (loss) of $183,388,056 and $177,753,382, respectively) | | $ | 7,173,027,394 | | | $ | 9,285,600,999 | |
Notes to Consolidated Financial Statements
October 31, 2015
NOTE 1—Significant Accounting Policies
Invesco Balanced-Risk Allocation Fund (the “Fund”) is a series portfolio of AIM Investment Funds (Invesco Investment Funds) (the “Trust”). The Trust is organized as a Delaware statutory trust and is registered under the Investment Company Act of 1940, as amended (the “1940 Act”), as an open-end series management investment company consisting of twenty-four separate series portfolios, each authorized to issue an unlimited number of shares of beneficial interest. The assets, liabilities and operations of each portfolio are accounted for separately. Information presented in these consolidated financial statements pertains only to the Fund. Matters affecting each portfolio or class will be voted on exclusively by the shareholders of such portfolio or class.
16 Invesco Balanced-Risk Allocation Fund
The Fund will seek to gain exposure to the commodity markets primarily through investments in the Invesco Cayman Commodity Fund I Ltd. (the “Subsidiary”), a wholly-owned subsidiary of the Fund organized under the laws of the Cayman Islands. The Subsidiary was organized by the Fund to invest in commodity-linked derivatives. The Fund may invest up to 25% of its total assets in the Subsidiary.
The Fund’s investment objective is to provide total return with a low to moderate correlation to traditional financial market indices.
The Fund currently consists of seven different classes of shares: Class A, Class B, Class C, Class R, Class Y, Class R5 and Class R6. Class A shares are sold with a front-end sales charge unless certain waiver criteria are met and under certain circumstances load waived shares may be subject to contingent deferred sales charges (“CDSC”). Class C shares are sold with a CDSC. Class R, Class Y, Class R5 and Class R6 shares are sold at net asset value. Effective November 30, 2010, new or additional investments in Class B shares are no longer permitted. Existing shareholders of Class B shares may continue to reinvest dividends and capital gains distributions in Class B shares until they convert to Class A shares. Also, shareholders in Class B shares will be able to exchange those shares for Class B shares of other Invesco Funds offering such shares until they convert to Class A shares. Generally, Class B shares will automatically convert to Class A shares on or about the month-end, which is at least eight years after the date of purchase. Redemption of Class B shares prior to the conversion date will be subject to a CDSC.
The following is a summary of the significant accounting policies followed by the Fund in the preparation of its consolidated financial statements.
| A. | Security Valuations — Securities, including restricted securities, are valued according to the following policy. |
Debt obligations (including convertible securities) and unlisted equities are fair valued using an evaluated quote provided by an independent pricing service. Evaluated quotes provided by the pricing service may be determined without exclusive reliance on quoted prices, and may reflect appropriate factors such as institution-size trading in similar groups of securities, developments related to specific securities, dividend rate (for unlisted equities), yield (for debt obligations), quality, type of issue, coupon rate (for debt obligations), maturity (for debt obligations), individual trading characteristics and other market data. Debt obligations are subject to interest rate and credit risks. In addition, all debt obligations involve some risk of default with respect to interest and/or principal payments.
A security listed or traded on an exchange (except convertible securities) is valued at its last sales price or official closing price as of the close of the customary trading session on the exchange where the security is principally traded, or lacking any sales or official closing price on a particular day, the security may be valued at the closing bid price on that day. Securities traded in the over-the-counter market are valued based on prices furnished by independent pricing services or market makers. When such securities are valued by an independent pricing service they may be considered fair valued. Futures contracts are valued at the final settlement price set by an exchange on which they are principally traded. Listed options are valued at the mean between the last bid and asked prices from the exchange on which they are principally traded. Options not listed on an exchange are valued by an independent source at the mean between the last bid and asked prices. For purposes of determining net asset value (“NAV”) per share, futures and option contracts generally are valued 15 minutes after the close of the customary trading session of the New York Stock Exchange (“NYSE”).
Investments in open-end and closed-end registered investment companies that do not trade on an exchange are valued at the end-of-day net asset value per share. Investments in open-end and closed-end registered investment companies that trade on an exchange are valued at the last sales price or official closing price as of the close of the customary trading session on the exchange where the security is principally traded.
Swap agreements are fair valued using an evaluated quote, if available, provided by an independent pricing service. Evaluated quotes provided by the pricing service are valued based on a model which may include end-of-day net present values, spreads, ratings, industry, company performance and returns of referenced assets.
Foreign securities’ (including foreign exchange contracts) prices are converted into U.S. dollar amounts using the applicable exchange rates as of the close of the NYSE. If market quotations are available and reliable for foreign exchange-traded equity securities, the securities will be valued at the market quotations. Because trading hours for certain foreign securities end before the close of the NYSE, closing market quotations may become unreliable. If between the time trading ends on a particular security and the close of the customary trading session on the NYSE, events occur that the Adviser determines are significant and make the closing price unreliable, the Fund may fair value the security. If the event is likely to have affected the closing price of the security, the security will be valued at fair value in good faith using procedures approved by the Board of Trustees. Adjustments to closing prices to reflect fair value may also be based on a screening process of an independent pricing service to indicate the degree of certainty, based on historical data, that the closing price in the principal market where a foreign security trades is not the current value as of the close of the NYSE. Foreign securities’ prices meeting the approved degree of certainty that the price is not reflective of current value will be priced at the indication of fair value from the independent pricing service. Multiple factors may be considered by the independent pricing service in determining adjustments to reflect fair value and may include information relating to sector indices, American Depositary Receipts and domestic and foreign index futures. Foreign securities may have additional risks including exchange rate changes, potential for sharply devalued currencies and high inflation, political and economic upheaval, the relative lack of issuer information, relatively low market liquidity and the potential lack of strict financial and accounting controls and standards.
Securities for which market prices are not provided by any of the above methods may be valued based upon quotes furnished by independent sources. The last bid price may be used to value equity securities. The mean between the last bid and asked prices is used to value debt obligations, including corporate loans.
Securities for which market quotations are not readily available or became unreliable are valued at fair value as determined in good faith by or under the supervision of the Trust’s officers following procedures approved by the Board of Trustees. Issuer specific events, market trends, bid/asked quotes of brokers and information providers and other market data may be reviewed in the course of making a good faith determination of a security’s fair value.
The Fund may invest in securities that are subject to interest rate risk, meaning the risk that the prices will generally fall as interest rates rise and, conversely, the prices will generally rise as interest rates fall. Specific securities differ in their sensitivity to changes in interest rates depending on their individual characteristics. Changes in interest rates may result in increased market volatility, which may affect the value and/or liquidity of certain Fund investments.
Valuations change in response to many factors including the historical and prospective earnings of the issuer, the value of the issuer’s assets, general economic conditions, interest rates, investor perceptions and market liquidity. Because of the inherent uncertainties of valuation, the values reflected in the consolidated financial statements may materially differ from the value received upon actual sale of those investments.
17 Invesco Balanced-Risk Allocation Fund
| B. | Securities Transactions and Investment Income — Securities transactions are accounted for on a trade date basis. Realized gains or losses on sales are computed on the basis of specific identification of the securities sold. Interest income (net of withholding tax, if any) is recorded on the accrual basis from settlement date. Dividend income (net of withholding tax, if any) is recorded on the ex-dividend date. Bond premiums and discounts are amortized and/or accreted for financial reporting purposes. |
The Fund may periodically participate in litigation related to Fund investments. As such, the Fund may receive proceeds from litigation settlements. Any proceeds received are included in the Consolidated Statement of Operations as realized gain (loss) for investments no longer held and as unrealized gain (loss) for investments still held.
Brokerage commissions and mark ups are considered transaction costs and are recorded as an increase to the cost basis of securities purchased and/or a reduction of proceeds on a sale of securities. Such transaction costs are included in the determination of net realized and unrealized gain (loss) from investment securities reported in the Consolidated Statement of Operations and the Consolidated Statement of Changes in Net Assets and the net realized and unrealized gains (losses) on securities per share in the Consolidated Financial Highlights. Transaction costs are included in the calculation of the Fund’s net asset value and, accordingly, they reduce the Fund’s total returns. These transaction costs are not considered operating expenses and are not reflected in net investment income reported in the Consolidated Statement of Operations and the Consolidated Statement of Changes in Net Assets, or the net investment income per share and the ratios of expenses and net investment income reported in the Consolidated Financial Highlights, nor are they limited by any expense limitation arrangements between the Fund and the investment adviser.
The Fund allocates income and realized and unrealized capital gains and losses to a class based on the relative net assets of each class.
| C. | Country Determination — For the purposes of making investment selection decisions and presentation in the Consolidated Schedule of Investments, the investment adviser may determine the country in which an issuer is located and/or credit risk exposure based on various factors. These factors include the laws of the country under which the issuer is organized, where the issuer maintains a principal office, the country in which the issuer derives 50% or more of its total revenues and the country that has the primary market for the issuer’s securities, as well as other criteria. Among the other criteria that may be evaluated for making this determination are the country in which the issuer maintains 50% or more of its assets, the type of security, financial guarantees and enhancements, the nature of the collateral and the sponsor organization. Country of issuer and/or credit risk exposure has been determined to be the United States of America, unless otherwise noted. |
| D. | Distributions — Distributions from net investment income and net realized capital gain, if any, are generally declared and paid annually and recorded on the ex-dividend date. The Fund may elect to treat a portion of the proceeds from redemptions as distributions for federal income tax purposes. |
| E. | Federal Income Taxes — The Fund intends to comply with the requirements of Subchapter M of the Internal Revenue Code of 1986, as amended (the “Internal Revenue Code”), necessary to qualify as a regulated investment company and to distribute substantially all of the Fund’s taxable earnings to shareholders. As such, the Fund will not be subject to federal income taxes on otherwise taxable income (including net realized capital gain) that is distributed to shareholders. Therefore, no provision for federal income taxes is recorded in the consolidated financial statements. |
The Fund recognizes the tax benefits of uncertain tax positions only when the position is more likely than not to be sustained. Management has analyzed the Fund’s uncertain tax positions and concluded that no liability for unrecognized tax benefits should be recorded related to uncertain tax positions. Management is not aware of any tax positions for which it is reasonably possible that the total amounts of unrecognized tax benefits will change materially in the next 12 months.
The Subsidiary is classified as a controlled foreign corporation under Subchapter N of the Internal Revenue Code. Therefore, the Fund is required to increase its taxable income by its share of the Subsidiary’s income. Net investment losses of the Subsidiary cannot be deducted by the Fund in the current period nor carried forward to offset taxable income in future periods.
The Fund files tax returns in the U.S. Federal jurisdiction and certain other jurisdictions. Generally the Fund is subject to examinations by such taxing authorities for up to three years after the filing of the return for the tax period.
| F. | Expenses — Fees provided for under the Rule 12b-1 plan of a particular class of the Fund are charged to the operations of such class. Transfer agency fees and expenses and other shareholder recordkeeping fees and expenses attributable to Class R5 and Class R6 are allocated to each share class based on relative net assets. Sub-accounting fees attributable to Class R5 are charged to the operations of the class. Transfer agency fees and expenses and other shareholder recordkeeping fees and expenses relating to all other classes are allocated among those classes based on relative net assets. All other expenses are allocated among the classes based on relative net assets. |
| G. | Accounting Estimates — The financial statements are prepared on a consolidated basis in conformity with accounting principles generally accepted in the United States of America (“GAAP”), which requires management to make estimates and assumptions that affect the reported amounts of assets and liabilities at the date of the financial statements and the reported amounts of revenues and expenses during the reporting period including estimates and assumptions related to taxation. Actual results could differ from those estimates by a significant amount. The accompanying financial statements reflect the financial position of the Fund and its Subsidiary and the results of operations on a consolidated basis. All inter-company accounts and transactions have been eliminated in consolidation. |
In addition, the Fund monitors for material events or transactions that may occur or become known after the period-end date and before the date the consolidated financial statements are released to print.
| H. | Indemnifications — Under the Trust’s organizational documents, each Trustee, officer, employee or other agent of the Trust, and under the Subsidiary’s organizational documents, the directors and officers of the Subsidiary, are indemnified against certain liabilities that may arise out of the performance of their duties to the Fund and/or the Subsidiary, respectively. Additionally, in the normal course of business, the Fund enters into contracts, including the Fund’s servicing agreements, that contain a variety of indemnification clauses. The Fund’s maximum exposure under these arrangements is unknown as this would involve future claims that may be made against the Fund that have not yet occurred. The risk of material loss as a result of such indemnification claims is considered remote. |
| I. | Structured Securities — The Fund may invest in structured securities. Structured securities are a type of derivative security whose value is determined by reference to changes in the value of underlying securities, currencies, interest rates, commodities, indices or other financial indicators (“reference instruments”). Most structured securities are fixed-income securities that have maturities of three years or less. Structured |
18 Invesco Balanced-Risk Allocation Fund
| | securities may be positively or negatively indexed (i.e., their principal value or interest rates may increase or decrease if the underlying reference instrument appreciates) and may have return characteristics similar to direct investments in the underlying reference instrument. |
Structured securities may entail a greater degree of market risk than other types of debt securities because the investor bears the risk of the reference instruments. In addition to the credit risk of structured securities and the normal risks of price changes in response to changes in interest rates, the principal amount of structured notes or indexed securities may decrease as a result of changes in the value of the underlying reference instruments. Changes in the daily value of structured securities are recorded as unrealized gains (losses) in the Consolidated Statement of Operations. When the structured securities mature or are sold, the Fund recognizes a realized gain (loss) on the Consolidated Statement of Operations.
| J. | Foreign Currency Translations — Foreign currency is valued at the close of the NYSE based on quotations posted by banks and major currency dealers. Portfolio securities and other assets and liabilities denominated in foreign currencies are translated into U.S. dollar amounts at date of valuation. Purchases and sales of portfolio securities (net of foreign taxes withheld on disposition) and income items denominated in foreign currencies are translated into U.S. dollar amounts on the respective dates of such transactions. The Fund does not separately account for the portion of the results of operations resulting from changes in foreign exchange rates on investments and the fluctuations arising from changes in market prices of securities held. The combined results of changes in foreign exchange rates and the fluctuation of market prices on investments (net of estimated foreign tax withholding) are included with the net realized and unrealized gain or loss from investments in the Consolidated Statement of Operations. Reported net realized foreign currency gains or losses arise from (1) sales of foreign currencies, (2) currency gains or losses realized between the trade and settlement dates on securities transactions, and (3) the difference between the amounts of dividends, interest, and foreign withholding taxes recorded on the Fund’s books and the U.S. dollar equivalent of the amounts actually received or paid. Net unrealized foreign currency gains and losses arise from changes in the fair values of assets and liabilities, other than investments in securities at fiscal period end, resulting from changes in exchange rates. |
The Fund may invest in foreign securities, which may be subject to foreign taxes on income, gains on investments or currency repatriation, a portion of which may be recoverable. Foreign taxes, if any, are recorded based on the tax regulations and rates that exist in the foreign markets in which the Fund invests and are shown in the Consolidated Statement of Operations.
| K. | Futures Contracts — The Fund may enter into futures contracts to manage exposure to interest rate, equity and market price movements and/or currency risks. A futures contract is an agreement between two parties (“Counterparties”) to purchase or sell a specified underlying security, currency or commodity (or delivery of a cash settlement price, in the case of an index future) for a fixed price at a future date. The Fund currently invests only in exchange-traded futures and they are standardized as to maturity date and underlying financial instrument. Initial margin deposits required upon entering into futures contracts are satisfied by the segregation of specific securities or cash as collateral at the futures commission merchant (broker). During the period the futures contracts are open, changes in the value of the contracts are recognized as unrealized gains or losses by recalculating the value of the contracts on a daily basis. Subsequent or variation margin payments are received or made depending upon whether unrealized gains or losses are incurred. These amounts are reflected as receivables or payables on the Consolidated Statement of Assets and Liabilities. When the contracts are closed or expire, the Fund recognizes a realized gain or loss equal to the difference between the proceeds from, or cost of, the closing transaction and the Fund’s basis in the contract. The net realized gain (loss) and the change in unrealized gain (loss) on futures contracts held during the period is included on the Consolidated Statement of Operations. The primary risks associated with futures contracts are market risk and the absence of a liquid secondary market. If the Fund were unable to liquidate a futures contract and/or enter into an offsetting closing transaction, the Fund would continue to be subject to market risk with respect to the value of the contracts and continue to be required to maintain the margin deposits on the futures contracts. Futures contracts have minimal Counterparty risk since the exchange’s clearinghouse, as Counterparty to all exchange-traded futures, guarantees the futures against default. Risks may exceed amounts recognized in the Consolidated Statement of Assets and Liabilities. |
| L. | Swap Agreements — The Fund may enter into various swap transactions, including interest rate, total return, index, currency and credit default swap contracts (“CDS”) for investment purposes or to manage interest rate, currency or credit risk. Such transactions are agreements between Counterparties. These agreements may contain among other conditions, events of default and termination events, and various covenants and representations such as provisions that require the Fund to maintain a pre-determined level of net assets, and/or provide limits regarding the decline of the Fund’s NAV over specific periods of time. If the Fund were to trigger such provisions and have open derivative positions at that time, the Counterparty may be able to terminate such agreement and request immediate payment in an amount equal to the net liability positions, if any. |
Interest rate, total return, index, and currency swap agreements are two-party contracts entered into primarily to exchange the returns (or differentials in rates of returns) earned or realized on particular predetermined investments or instruments. The gross returns to be exchanged or “swapped” between the parties are calculated with respect to a notional amount, i.e., the return on or increase in value of a particular dollar amount invested at a particular interest rate or return of an underlying asset, in a particular foreign currency, or in a “basket” of securities representing a particular index. At the maturity date, a net cash flow is exchanged where the total return is equivalent to the return of the underlying reference less a financing rate, if any. As a receiver, the Fund would receive payments based on any positive total return and would owe payments in the event of a negative total return. As the payer, the Fund would owe payments on any net positive total return, and would receive payment in the event of a negative total return.
Changes in the value of swap agreements are recognized as unrealized gains (losses) in the Consolidated Statement of Operations by “marking to market” on a daily basis to reflect the value of the swap agreement at the end of each trading day. Payments received or paid at the beginning of the agreement are reflected as such on the Consolidated Statement of Assets and Liabilities and may be referred to as upfront payments. The Fund accrues for the fixed payment stream and amortizes upfront payments, if any, on swap agreements on a daily basis with the net amount, recorded as a component of realized gain (loss) on the Consolidated Statement of Operations. A liquidation payment received or made at the termination of a swap agreement is recorded as realized gain (loss) on the Consolidated Statement of Operations. The Fund segregates liquid securities having a value at least equal to the amount of the potential obligation of a Fund under any swap transaction. Entering into these agreements involves, to varying degrees, lack of liquidity and elements of credit, market, and Counterparty risk in excess of amounts recognized on the Consolidated Statement of Assets and Liabilities. Such risks involve the possibility that a swap is difficult to sell or liquidate; the Counterparty does not honor its obligations under the agreement and unfavorable interest rates and market fluctuations. It is possible that
19 Invesco Balanced-Risk Allocation Fund
developments in the swaps market, including potential government regulation, could adversely affect the Fund’s ability to terminate existing swap agreements or to realize amounts to be received under such agreements. A short position in a security poses more risk than holding the same security long. As there is no limit on how much the price of the security can increase, the Fund’s exposure is unlimited.
| M. | Other Risks — The Fund will seek to gain exposure to commodity markets primarily through an investment in the Subsidiary and through investments in exchange traded funds and commodity-linked derivatives. The Subsidiary, unlike the Fund, may invest without limitation in commodities, commodity-linked derivatives and other securities, such as exchange traded notes, that may provide leveraged and non-leveraged exposure to commodity markets. The Fund is indirectly exposed to the risks associated with the Subsidiary’s investments. |
| N. | Leverage Risk — Leverage exists when the Fund can lose more than it originally invests because it purchases or sells an instrument or enters into a transaction without investing an amount equal to the full economic exposure of the instrument or transaction. |
| O. | Collateral — To the extent the Fund has designated or segregated a security as collateral and that security is subsequently sold, it is the Fund’s practice to replace such collateral no later than the next business day. |
NOTE 2—Advisory Fees and Other Fees Paid to Affiliates
The Trust has entered into a master investment advisory agreement with Invesco Advisers, Inc. (the “Adviser” or “Invesco”). Under the terms of the investment advisory agreement, the Fund pays an advisory fee to the Adviser less the amount paid by the Subsidiary to the Adviser based on the annual rate of the Fund’s average daily net assets as follows:
| | | | | | |
| Average Daily Net Assets | | Rate |
First $250 million | | | 0 | .95% | | |
Next $250 million | | | 0 | .925% | | |
Next $500 million | | | 0 | .90% | | |
Next $1.5 billion | | | 0 | .875% | | |
Next $2.5 billion | | | 0 | .85% | | |
Next $2.5 billion | | | 0 | .825% | | |
Next $2.5 billion | | | 0 | .80% | | |
Over $10 billion | | | 0 | .775% | | |
For the year ended October 31, 2015, the effective advisory fees incurred by the Fund was 0.85%.
The Subsidiary has entered into a separate contract with the Adviser whereby the Adviser provides investment advisory and other services to the Subsidiary. In consideration of these services, the Subsidiary pays an advisory fee to the Adviser based on the annual rate of the Subsidiary’s average daily net assets as set forth in the table above.
Under the terms of a master sub-advisory agreement between the Adviser and each of Invesco Asset Management Deutschland GmbH, Invesco Asset Management Limited, Invesco Asset Management (Japan) Limited, Invesco Hong Kong Limited, Invesco Senior Secured Management, Inc. and Invesco Canada Ltd. (collectively, the “Affiliated Sub-Advisers”) the Adviser, not the Fund, may pay 40% of the fees paid to the Adviser to any such Affiliated Sub-Adviser(s) that provide(s) discretionary investment management services to the Fund based on the percentage of assets allocated to such Affiliated Sub-Adviser(s).
The Adviser has contractually agreed, through at least June 30, 2016, to waive advisory fees and/or reimburse expenses to the extent necessary to limit total annual fund operating expenses after fee waiver and/or expense reimbursement (excluding certain items discussed below) of Class A, Class B, Class C, Class R, Class Y, Class R5 and Class R6 shares to 2.00%, 2.75%, 2.75%, 2.25%, 1.75%, 1.75% and 1.75% of average daily net assets, respectively. In determining the Adviser’s obligation to waive advisory fees and/or reimburse expenses, the following expenses are not taken into account, and could cause the total annual fund operating expenses after fee waiver and/or reimbursement to exceed the numbers reflected above: (1) interest; (2) taxes; (3) dividend expense on short sales; (4) extraordinary or non-routine items, including litigation expenses; and (5) expenses that the Fund has incurred but did not actually pay because of an expense offset arrangement. Acquired Fund Fees and Expenses are not operating expenses of the Fund directly, but are fees and expenses, including management fees, of the investment companies in which the Fund invests. As a result, the total annual fund operating expenses after expense reimbursement may exceed the expense limits above. Unless Invesco continues the fee waiver agreement, it will terminate on June 30, 2016. The fee waiver agreement cannot be terminated during its term. The Adviser did not waive fees and/or reimburse expenses during the period under this expense limitation.
Further, the Adviser has contractually agreed, through at least June 30, 2017, to waive the advisory fee payable by the Fund in an amount equal to 100% of the net advisory fees the Adviser receives on the Fund’s investments in certain affiliated funds.
For the year ended October 31, 2015, the Adviser waived advisory fees of $4,357,563.
The Trust has entered into a master administrative services agreement with Invesco pursuant to which the Fund has agreed to pay Invesco for certain administrative costs incurred in providing accounting services to the Fund. For the year ended October 31, 2015, expenses incurred under the agreement are shown in the Consolidated Statement of Operations as Administrative services fees.
The Trust has entered into a transfer agency and service agreement with Invesco Investment Services, Inc. (“IIS”) pursuant to which the Fund has agreed to pay IIS a fee for providing transfer agency and shareholder services to the Fund and reimburse IIS for certain expenses incurred by IIS in the course of providing such services. IIS may make payments to intermediaries that provide omnibus account services, sub-accounting services and/or networking services. All fees payable by IIS to intermediaries that provide omnibus account services or sub-accounting are charged back to the Fund, subject to certain limitations approved by the Trust’s Board of Trustees. For the year ended October 31, 2015, expenses incurred under the agreement are shown in the Consolidated Statement of Operations as Transfer agent fees.
The Trust has entered into master distribution agreements with Invesco Distributors, Inc. (“IDI”) to serve as the distributor for the Class A, Class B, Class C, Class R, Class Y, Class R5 and Class R6 shares of the Fund. The Trust has adopted plans pursuant to Rule 12b-1 under the 1940 Act with respect to the Fund’s Class A, Class B, Class C and Class R shares (collectively, the “Plans”). The Fund, pursuant to the Plans, pays IDI compensation at the annual rate of 0.25% of the Fund’s average daily net assets of Class A shares, 1.00% of the average daily net assets of Class B and Class C
20 Invesco Balanced-Risk Allocation Fund
shares and 0.50% of the average daily net assets of Class R shares. Of the Plan payments, up to 0.25% of the average daily net assets of each class of shares may be paid to furnish continuing personal shareholder services to customers who purchase and own shares of such classes. Any amounts not paid as a service fee under the Plans would constitute an asset-based sales charge. Rules of the Financial Industry Regulatory Authority (“FINRA”) impose a cap on the total sales charges, including asset-based sales charges, that may be paid by any class of shares of the Fund. For the year ended October 31, 2015, expenses incurred under the Plans are shown in the Consolidated Statement of Operations as Distribution fees.
Front-end sales commissions and CDSC (collectively, the “sales charges”) are not recorded as expenses of the Fund. Front-end sales commissions are deducted from proceeds from the sales of Fund shares prior to investment in Class A shares of the Fund. CDSC are deducted from redemption proceeds prior to remittance to the shareholder. During the year ended October 31, 2015, IDI advised the Fund that IDI retained $857,295 in front-end sales commissions from the sale of Class A shares and $40,377, $8,186 and $147,821 from Class A, Class B and Class C shares, respectively, for CDSC imposed on redemptions by shareholders.
Certain officers and trustees of the Trust are officers and directors of the Adviser, IIS and/or IDI.
NOTE 3—Additional Valuation Information
GAAP defines fair value as the price that would be received to sell an asset or paid to transfer a liability in an orderly transaction between market participants at the measurement date, under current market conditions. GAAP establishes a hierarchy that prioritizes the inputs to valuation methods, giving the highest priority to readily available unadjusted quoted prices in an active market for identical assets (Level 1) and the lowest priority to significant unobservable inputs (Level 3), generally when market prices are not readily available or are unreliable. Based on the valuation inputs, the securities or other investments are tiered into one of three levels. Changes in valuation methods may result in transfers in or out of an investment’s assigned level:
| | Level 1 — | Prices are determined using quoted prices in an active market for identical assets. |
| | Level 2 — | Prices are determined using other significant observable inputs. Observable inputs are inputs that other market participants may use in pricing a security. These may include quoted prices for similar securities, interest rates, prepayment speeds, credit risk, yield curves, loss severities, default rates, discount rates, volatilities and others. |
| | Level 3 — | Prices are determined using significant unobservable inputs. In situations where quoted prices or observable inputs are unavailable (for example, when there is little or no market activity for an investment at the end of the period), unobservable inputs may be used. Unobservable inputs reflect the Fund’s own assumptions about the factors market participants would use in determining fair value of the securities or instruments and would be based on the best available information. |
The following is a summary of the tiered valuation input levels, as of October 31, 2015. The level assigned to the securities valuations may not be an indication of the risk or liquidity associated with investing in those securities. Because of the inherent uncertainties of valuation, the values reflected in the financial statements may materially differ from the value received upon actual sale of those investments.
| | | | | | | | | | | | | | | | |
| | | Level 1 | | | Level 2 | | | Level 3 | | | Total | |
Money Market Funds | | $ | 4,059,430,005 | | | $ | — | | | $ | — | | | $ | 4,059,430,005 | |
U.S. Treasury Securities | | | — | | | | 2,452,262,377 | | | | — | | | | 2,452,262,377 | |
Commodity-Linked Securities | | | — | | | | 251,261,029 | | | | — | | | | 251,261,029 | |
| | | $ | 4,059,430,005 | | | $ | 2,703,523,406 | | | $ | — | | | $ | 6,762,953,411 | |
Futures Contracts* | | | 112,758,545 | | | | — | | | | — | | | | 112,758,545 | |
Swap Agreements* | | | — | | | | (16,243,521 | ) | | | — | | | | (16,243,521 | ) |
Total Investments | | $ | 4,172,188,550 | | | $ | 2,687,279,885 | | | $ | — | | | $ | 6,859,468,435 | |
| * | Unrealized appreciation (depreciation). |
NOTE 4—Derivative Investments
Value of Derivative Investments at Period-End
The table below summarizes the value of the Fund’s derivative investments, detailed by primary risk exposure, held as of October 31, 2015:
| | | | | | | | |
| | | Value | |
| Risk Exposure/Derivative Type | | Assets | | | Liabilities | |
Commodity risk: | | | | | | | | |
Futures contracts(a) | | $ | 9,564,784 | | | $ | (3,607,787 | ) |
Swap agreements(b) | | | 303,970 | | | | (16,547,491 | ) |
Interest rate risk: | | | | | | | | |
Futures contracts(a) | | | 40,561,640 | | | | (28,054,728 | ) |
Equity risk: | | | | | | | | |
Futures contracts(a) | | | 100,680,041 | | | | (6,385,405 | ) |
Total | | $ | 151,110,435 | | | $ | (54,595,411 | ) |
| (a) | Includes cumulative appreciation (depreciation) of futures contracts. Only current day’s variation margin receivable (payable) is reported within the Consolidated Statement of Assets and Liabilities. |
| | Values are disclosed on the Consolidated Statement of Assets and Liabilities under the captions Unrealized appreciation on swap agreements — OTC and Unrealized depreciation on swap agreements — OTC. |
21 Invesco Balanced-Risk Allocation Fund
Effect of Derivative Investments for the year ended October 31, 2015
The table below summarizes the gains (losses) on derivative investments, detailed by primary risk exposure, recognized in earnings during the period:
| | | | | | | | |
| | | Location of Gain (Loss) on
Consolidated Statement of Operations | |
| | | Futures
Contracts | | | Swap
Agreements | |
Realized Gain (Loss): | | | | | | | | |
Commodity risk | | $ | (281,158,878 | ) | | $ | (167,325,972 | ) |
Interest rate risk | | | 448,490,978 | | | | 13,838,130 | |
Equity risk | | | (13,424,537 | ) | | | (2,837,761 | ) |
Change in Net Unrealized Appreciation (Depreciation): | | | | | | | | |
Commodity risk | | $ | 72,358,772 | | | $ | (15,048,111 | ) |
Interest rate risk | | | (108,088,255 | ) | | | (3,934,665 | ) |
Equity risk | | | 102,874,776 | | | | (1,403,372 | ) |
Total | | $ | 221,052,856 | | | $ | (176,711,751 | ) |
The table below summarizes the average notional value of futures contracts and swap agreements outstanding during the period.
| | | | | | | | |
| | | Futures
Contracts | | | Swap
Agreements | |
Average notional value | | $ | 10,792,539,100 | | | $ | 1,148,407,231 | |
Offsetting Assets and Liabilities
Accounting Standards Update (“ASU”) No. 2011-11, Disclosures about Offsetting Assets and Liabilities, which was subsequently clarified in Financial Accounting Standards Board ASU 2013-01 “Clarifying the Scope of Disclosures about Offsetting Assets and Liabilities” is intended to enhance disclosures about financial instruments and derivative instruments that are subject to offsetting arrangements on the Consolidated Statement of Assets and Liabilities and to enable investors to better understand the effect of those arrangements on the Fund’s financial position. In order for an arrangement to be eligible for netting, the Fund must have a basis to conclude that such netting arrangements are legally enforceable. The Fund enters into netting agreements and collateral agreements in an attempt to reduce the Fund’s Counterparty credit risk by providing for a single net settlement with a Counterparty of all financial transactions covered by the agreement in an event of default as defined under such agreement.
The following tables present derivative instruments that are either subject to an enforceable netting agreement or offset by collateral arrangements as of October 31, 2015.
| | | | | | | | | | | | | | | | | | | | |
| | | Gross amounts
of Recognized
Assets | | | Gross Amounts Not Offset in the
Consolidated Statement of Assets and
Liabilities | | | Net
Amount | |
| | | | Financial
Instruments | | | Collateral Received | | |
| Counterparty | | | | Non-Cash | | | Cash | | |
Subsidiary | | | | | | | | | | | | | | | | | | | | |
Cargill, Inc. | | $ | 3,139,326 | | | $ | (34,605 | ) | | $ | — | | | $ | — | | | $ | 3,104,721 | |
Goldman Sachs International | | | 73,702 | | | | (12,765 | ) | | | — | | | | — | | | | 60,937 | |
J.P. Morgan Chase Bank, N.A. | | | 303,970 | | | | (303,970 | ) | | | — | | | | — | | | | — | |
Merrill Lynch International | | | 3,085,728 | | | | (319,850 | ) | | | — | | | | — | | | | 2,765,878 | |
Total | | $ | 6,602,726 | | | $ | (671,190 | ) | | $ | — | | | $ | — | | | $ | 5,931,536 | |
| | | |
| | | Gross amounts
of Recognized
Liabilities | | | Gross Amounts Not Offset in the
Consolidated Statement of Assets and Liabilities | | | Net
Amount | |
| | | | Financial
Instruments | | | Collateral Pledged | | |
| Counterparty | | | | Non-Cash | | | Cash | | |
Subsidiary | | | | | | | | | | | | | | | | | | | | |
Barclays Bank PLC | | $ | 582,623 | | | $ | — | | | $ | (582,623 | ) | | $ | — | | | $ | — | |
Canadian Imperial Bank of Commerce | | | 4,519,609 | | | | — | | | | (4,519,609 | ) | | | — | | | | — | |
Cargill, Inc. | | | 34,605 | | | | (34,605 | ) | | | — | | | | — | | | | — | |
Goldman Sachs International | | | 12,765 | | | | (12,765 | ) | | | — | | | | — | | | | — | |
J.P. Morgan Chase Bank, N.A. | | | 2,326,136 | | | | (303,970 | ) | | | (2,022,166 | ) | | | — | | | | — | |
Merrill Lynch International | | | 319,850 | | | | (319,850 | ) | | | — | | | | — | | | | — | |
Morgan Stanley Capital Services LLC | | | 9,173,828 | | | | — | | | | (9,173,828 | ) | | | — | | | | — | |
Total | | $ | 16,969,416 | | | $ | (671,190 | ) | | $ | (16,298,226 | ) | | $ | — | | | $ | — | |
22 Invesco Balanced-Risk Allocation Fund
NOTE 5—Subsidiary Information
The Fund’s Consolidated Schedule of Investments includes the holdings, including any investments in derivatives, of both the Fund and the Subsidiary. The Fund’s Consolidated Statement of Assets and Liabilities, Consolidated Statement of Operations and Consolidated Statement of Changes in Net Assets include the account balances of both the Fund and the Subsidiary and all interfund transactions have been eliminated.
The table below summarizes the financial information of the Subsidiary recognized in the consolidated financial statements referred to above.
| | | | |
| Selected Financial Information | | Invesco Cayman
Commodity Fund I Ltd.
(the “Subsidiary”) | |
Total assets | | $ | 1,706,984,160 | |
Total liabilities | | | (16,975,897 | ) |
Net assets | | | 1,690,008,263 | |
Total investment income | | | 1,182,014 | |
Net investment income (loss) | | | (16,939,842 | ) |
Net realized gain (loss) from: | | | | |
Investment securities | | | (75,418,510 | ) |
Futures contracts | | | (281,158,878 | ) |
Swap agreements | | | (167,328,602 | ) |
Change in net unrealized appreciation (depreciation) of: | | | | |
Investment securities | | | (4,556,354 | ) |
Futures contracts | | | 72,358,773 | |
Swap agreements | | | (15,048,111 | ) |
Increase (decrease) in net assets resulting from operations | | $ | (488,091,524 | ) |
NOTE 6—Expense Offset Arrangement(s)
The expense offset arrangement is comprised of transfer agency credits which result from balances in demand deposit accounts used by the transfer agent for clearing shareholder transactions. For the year ended October 31, 2015, the Fund received credits from this arrangement, which resulted in the reduction of the Fund’s total expenses of $14,400.
NOTE 7—Trustees’ and Officers’ Fees and Benefits
Trustees’ and Officers’ Fees and Benefits include amounts accrued by the Fund to pay remuneration to certain Trustees and Officers of the Fund. Trustees have the option to defer compensation payable by the Fund, and Trustees’ and Officers’ Fees and Benefits also include amounts accrued by the Fund to fund such deferred compensation amounts. Those Trustees who defer compensation have the option to select various Invesco Funds in which their deferral accounts shall be deemed to be invested. Finally, certain current Trustees were eligible to participate in a retirement plan that provided for benefits to be paid upon retirement to Trustees over a period of time based on the number of years of service. The Fund may have certain former Trustees who also participate in a retirement plan and receive benefits under such plan. Trustees’ and Officers’ Fees and Benefits include amounts accrued by the Fund to fund such retirement benefits. Obligations under the deferred compensation and retirement plans represent unsecured claims against the general assets of the Fund.
NOTE 8—Cash Balances
The Fund is permitted to temporarily carry a negative or overdrawn balance in its account with State Street Bank and Trust Company, the custodian bank. Such balances, if any at period end, are shown in the Consolidated Statement of Assets and Liabilities under the payable caption Amount due custodian. To compensate the custodian bank for such overdrafts, the overdrawn Fund may either (1) leave funds as a compensating balance in the account so the custodian bank can be compensated by earning the additional interest; or (2) compensate by paying the custodian bank at a rate agreed upon by the custodian bank and Invesco, not to exceed the contractually agreed upon rate.
23 Invesco Balanced-Risk Allocation Fund
NOTE 9—Distributions to Shareholders and Tax Components of Net Assets
Tax Character of Distributions to Shareholders Paid During the Fiscal Years Ended October 31, 2015 and 2014:
| | | | | | | | |
| | | 2015 | | | 2014 | |
Ordinary income | | $ | 424,395,963 | | | $ | 472,187,821 | |
Long-term capital gain | | | 238,503,716 | | | | 365,324,994 | |
Total distributions | | $ | 662,899,679 | | | $ | 837,512,815 | |
Tax Components of Net Assets at Period-End:
| | | | |
| | | 2015 | |
Undistributed ordinary income | | $ | 304,687,401 | |
Undistributed long-term gain | | | 111,379,628 | |
Net unrealized appreciation (depreciation) — investments | | | (5,474,053 | ) |
Net unrealized appreciation — other investments | | | 19,572,130 | |
Temporary book/tax differences | | | (653,036 | ) |
Shares of beneficial interest | | | 6,743,515,324 | |
Total net assets | | $ | 7,173,027,394 | |
The difference between book-basis and tax-basis unrealized appreciation (depreciation) is due to differences in the timing of recognition of gains and losses on investments for tax and book purposes. The Fund’s net unrealized appreciation (depreciation) difference is attributable primarily to wash sales.
The temporary book/tax differences are a result of timing differences between book and tax recognition of income and/or expenses. The Fund’s temporary book/tax differences are the result of the trustee deferral of compensation and retirement plan benefits.
Capital loss carryforward is calculated and reported as of a specific date. Results of transactions and other activity after that date may affect the amount of capital loss carryforward actually available for the Fund to utilize. Capital losses generated in years beginning after December 22, 2010 can be carried forward for an unlimited period, whereas previous losses expire in eight tax years. Capital losses with an expiration period may not be used to offset capital gains until all net capital losses without an expiration date have been utilized. Capital loss carryforwards with no expiration date will retain their character as either short-term or long-term capital losses instead of as short-term capital losses as under prior law. The ability to utilize capital loss carryforwards in the future may be limited under the Internal Revenue Code and related regulations based on the results of future transactions.
The Fund does not have a capital loss carryforward as of October 31, 2015.
NOTE 10—Investment Securities
The aggregate amount of investment securities (other than short-term securities, U.S. Treasury obligations and money market funds, if any) purchased and sold by the Fund during the year ended October 31, 2015 was $340,100,998 and $197,865,238, respectively. Cost of investments on a tax basis includes the adjustments for financial reporting purposes as of the most recently completed federal income tax reporting period-end.
| | | | |
| Unrealized Appreciation (Depreciation) of Investment Securities on a Tax Basis | |
Aggregate unrealized appreciation of investment securities | | $ | 285,927 | |
Aggregate unrealized (depreciation) of investment securities | | | (5,759,980 | ) |
Net unrealized appreciation (depreciation) of investment securities | | $ | (5,474,053 | ) |
Cost of investments for tax purposes is $6,768,427,464.
NOTE 11—Reclassification of Permanent Differences
Primarily as a result of differing book/tax treatment of income from the Subsidiary, swap agreements and foreign currency transactions, on October 31, 2015, undistributed net investment income (loss) was increased by $285,398,114, undistributed net realized gain was increased by $198,137,056 and shares of beneficial interest was decreased by $483,535,170. This reclassification had no effect on the net assets of the Fund.
24 Invesco Balanced-Risk Allocation Fund
NOTE 12—Share Information
| | | | | | | | | | | | | | | | |
| | | Summary of Share Activity | |
| | | Years ended October 31, | |
| | | 2015(a) | | | 2014 | |
| | | Shares | | | Amount | | | Shares | | | Amount | |
Sold: | | | | | | | | | | | | | | | | |
Class A | | | 43,654,078 | | | $ | 512,090,070 | | | | 51,806,417 | | | $ | 632,415,865 | |
Class B | | | 64,824 | | | | 734,775 | | | | 140,674 | | | | 1,658,625 | |
Class C | | | 20,321,786 | | | | 230,708,386 | | | | 21,791,794 | | | | 258,168,002 | |
Class R | | | 641,261 | | | | 7,394,690 | | | | 662,774 | | | | 7,969,161 | |
Class Y | | | 84,612,580 | | | | 1,001,576,661 | | | | 121,129,080 | | | | 1,500,251,125 | |
Class R5 | | | 1,701,447 | | | | 20,065,413 | | | | 2,925,655 | | | | 35,680,316 | |
Class R6 | | | 3,580,174 | | | | 42,622,159 | | | | 2,635,178 | | | | 32,603,862 | |
| | | | |
Issued as reinvestment of dividends: | | | | | | | | | | | | | | | | |
Class A | | | 16,242,163 | | | | 186,297,618 | | | | 21,748,196 | | | | 252,496,557 | |
Class B | | | 115,320 | | | | 1,281,199 | | | | 185,614 | | | | 2,090,018 | |
Class C | | | 10,454,377 | | | | 116,148,130 | | | | 14,422,261 | | | | 162,394,677 | |
Class R | | | 176,446 | | | | 2,000,904 | | | | 181,423 | | | | 2,082,729 | |
Class Y | | | 15,160,636 | | | | 175,560,162 | | | | 17,088,467 | | | | 200,276,835 | |
Class R5 | | | 1,161,565 | | | | 13,462,539 | | | | 1,112,677 | | | | 13,040,575 | |
Class R6 | | | 3,133,557 | | | | 36,317,925 | | | | 3,157,016 | | | | 37,031,793 | |
| | | | |
Automatic conversion of Class B shares to Class A shares: | | | | | | | | | | | | | | | | |
Class A | | | 371,264 | | | | 4,348,290 | | | | 443,300 | | | | 5,425,537 | |
Class B | | | (384,362 | ) | | | (4,348,290 | ) | | | (458,284 | ) | | | (5,425,537 | ) |
| | | | |
Reacquired: | | | | | | | | | | | | | | | | |
Class A | | | (87,559,656 | ) | | | (1,017,915,316 | ) | | | (164,742,314 | ) | | | (2,008,558,784 | ) |
Class B | | | (325,008 | ) | | | (3,658,415 | ) | | | (621,650 | ) | | | (7,299,735 | ) |
Class C | | | (46,655,632 | ) | | | (523,731,823 | ) | | | (77,686,916 | ) | | | (912,157,887 | ) |
Class R | | | (815,247 | ) | | | (9,312,272 | ) | | | (885,517 | ) | | | (10,609,041 | ) |
Class Y | | | (167,648,057 | ) | | | (1,955,100,315 | ) | | | (215,629,161 | ) | | | (2,638,913,635 | ) |
Class R5 | | | (3,887,143 | ) | | | (45,536,641 | ) | | | (5,001,408 | ) | | | (61,477,173 | ) |
Class R6 | | | (8,438,929 | ) | | | (99,608,889 | ) | | | (7,536,409 | ) | | | (91,947,567 | ) |
Net increase (decrease) in share activity | | | (114,322,556 | ) | | $ | (1,308,603,040 | ) | | | (213,131,133 | ) | | $ | (2,592,803,682 | ) |
| (a) | There is an entity that is a record owner of more than 5% of the outstanding shares of the Fund and owns 38% of the outstanding shares of the Fund. IDI has an agreement with this entity to sell Fund shares. The Fund, Invesco and/or Invesco affiliates may make payments to this entity, which is considered to be related to the Fund, for providing services to the Fund, Invesco and/or Invesco affiliates including but not limited to services such as, securities brokerage, distribution, third party record keeping and account servicing. The Fund has no knowledge as to whether all or any portion of the shares owned of record by this entity is also owned beneficially. |
| | In addition, 5% of the outstanding shares of the Fund are owned by affiliated mutual funds. Affiliated mutual funds are mutual funds that are advised by Invesco. |
25 Invesco Balanced-Risk Allocation Fund
NOTE 13—Financial Highlights
The following schedule presents financial highlights for a share of the Fund outstanding throughout the periods indicated.
| | | | | | | | | | | | | | | | | | | | | | | | | | | | | | | | | | | | | | | | | | | | | | | | | | | | | | | | |
| | | Net asset
value,
beginning
of period | | | Net
investment
income
(loss)(a) | | | Net gains
(losses)
on securities
(both
realized and
unrealized) | | | Total from
investment
operations | | | Dividends
from net
investment
income | | | Distributions
from net
realized
gains | | | Total
distributions | | | Net asset
value, end
of period | | | Total
return(b) | | | Net assets,
end of period
(000’s omitted) | | | Ratio of
expenses
to average
net assets
with fee waivers
and/or expenses
absorbed | | | Ratio of
expenses
to average net
assets without
fee waivers
and/or expenses
absorbed | | | Ratio of net
investment
income (loss) to average
net assets | | | Portfolio
turnover(c) | |
Class A | |
Year ended 10/31/15 | | $ | 12.36 | | | $ | (0.14 | ) | | $ | (0.05 | ) | | $ | (0.19 | ) | | $ | (0.24 | ) | | $ | (0.66 | ) | | $ | (0.90 | ) | | $ | 11.27 | | | | (1.64 | )% | | $ | 2,371,657 | | | | 1.21 | %(d) | | | 1.26 | %(d) | | | (1.16 | )%(d) | | | 10 | % |
Year ended 10/31/14 | | | 12.88 | | | | (0.14 | ) | | | 0.53 | | | | 0.39 | | | | — | | | | (0.91 | ) | | | (0.91 | ) | | | 12.36 | | | | 3.52 | | | | 2,938,957 | | | | 1.20 | | | | 1.24 | | | | (1.16 | ) | | | 72 | |
Year ended 10/31/13 | | | 12.88 | | | | (0.14 | ) | | | 0.78 | | | | 0.64 | | | | (0.29 | ) | | | (0.35 | ) | | | (0.64 | ) | | | 12.88 | | | | 5.15 | | | | 4,229,859 | | | | 1.14 | | | | 1.21 | | | | (1.07 | ) | | | 0 | |
Year ended 10/31/12 | | | 12.01 | | | | (0.13 | ) | | | 1.46 | | | | 1.33 | | | | (0.34 | ) | | | (0.12 | ) | | | (0.46 | ) | | | 12.88 | | | | 11.39 | | | | 3,600,577 | | | | 1.10 | | | | 1.22 | | | | (1.00 | ) | | | 282 | |
Year ended 10/31/11 | | | 11.68 | | | | (0.11 | ) | | | 1.11 | | | | 1.00 | | | | (0.47 | ) | | | (0.20 | ) | | | (0.67 | ) | | | 12.01 | | | | 9.13 | | | | 1,001,088 | | | | 1.04 | | | | 1.31 | | | | (0.95 | ) | | | 163 | (e) |
Class B | | | | | | | | | | | | | | | | | | | | | | | | | | | | | | | | | | | | | | | | | | | | | | | | | | | | | | | | |
Year ended 10/31/15 | | | 11.92 | | | | (0.22 | ) | | | (0.05 | ) | | | (0.27 | ) | | | (0.14 | ) | | | (0.66 | ) | | | (0.80 | ) | | | 10.85 | | | | (2.40 | ) | | | 13,242 | | | | 1.96 | (d) | | | 2.01 | (d) | | | (1.91 | )(d) | | | 10 | |
Year ended 10/31/14 | | | 12.53 | | | | (0.23 | ) | | | 0.53 | | | | 0.30 | | | | — | | | | (0.91 | ) | | | (0.91 | ) | | | 11.92 | | | | 2.85 | | | | 20,853 | | | | 1.95 | | | | 1.99 | | | | (1.91 | ) | | | 72 | |
Year ended 10/31/13 | | | 12.59 | | | | (0.22 | ) | | | 0.75 | | | | 0.53 | | | | (0.24 | ) | | | (0.35 | ) | | | (0.59 | ) | | | 12.53 | | | | 4.34 | | | | 31,381 | | | | 1.89 | | | | 1.96 | | | | (1.82 | ) | | | 0 | |
Year ended 10/31/12 | | | 11.81 | | | | (0.21 | ) | | | 1.42 | | | | 1.21 | | | | (0.31 | ) | | | (0.12 | ) | | | (0.43 | ) | | | 12.59 | | | | 10.52 | | | | 32,246 | | | | 1.85 | | | | 1.97 | | | | (1.75 | ) | | | 282 | |
Year ended 10/31/11 | | | 11.56 | | | | (0.19 | ) | | | 1.09 | | | | 0.90 | | | | (0.45 | ) | | | (0.20 | ) | | | (0.65 | ) | | | 11.81 | | | | 8.30 | | | | 17,722 | | | | 1.79 | | | | 2.06 | | | | (1.70 | ) | | | 163 | (e) |
Class C | | | | | | | | | | | | | | | | | | | | | | | | | | | | | | | | | | | | | | | | | | | | | | | | | | | | | | | | |
Year ended 10/31/15 | | | 11.91 | | | | (0.22 | ) | | | (0.04 | ) | | | (0.26 | ) | | | (0.14 | ) | | | (0.66 | ) | | | (0.80 | ) | | | 10.85 | | | | (2.32 | ) | | | 1,584,982 | | | | 1.96 | (d) | | | 2.01 | (d) | | | (1.91 | )(d) | | | 10 | |
Year ended 10/31/14 | | | 12.53 | | | | (0.23 | ) | | | 0.52 | | | | 0.29 | | | | — | | | | (0.91 | ) | | | (0.91 | ) | | | 11.91 | | | | 2.77 | | | | 1,930,318 | | | | 1.95 | | | | 1.99 | | | | (1.91 | ) | | | 72 | |
Year ended 10/31/13 | | | 12.59 | | | | (0.22 | ) | | | 0.75 | | | | 0.53 | | | | (0.24 | ) | | | (0.35 | ) | | | (0.59 | ) | | | 12.53 | | | | 4.34 | | | | 2,550,094 | | | | 1.89 | | | | 1.96 | | | | (1.82 | ) | | | 0 | |
Year ended 10/31/12 | | | 11.80 | | | | (0.21 | ) | | | 1.43 | | | | 1.22 | | | | (0.31 | ) | | | (0.12 | ) | | | (0.43 | ) | | | 12.59 | | | | 10.61 | | | | 1,898,066 | | | | 1.85 | | | | 1.97 | | | | (1.75 | ) | | | 282 | |
Year ended 10/31/11 | | | 11.56 | | | | (0.19 | ) | | | 1.08 | | | | 0.89 | | | | (0.45 | ) | | | (0.20 | ) | | | (0.65 | ) | | | 11.80 | | | | 8.21 | | | | 383,786 | | | | 1.79 | | | | 2.06 | | | | (1.70 | ) | | | 163 | (e) |
Class R | | | | | | | | | | | | | | | | | | | | | | | | | | | | | | | | | | | | | | | | | | | | | | | | | | | | | | | | |
Year ended 10/31/15 | | | 12.20 | | | | (0.16 | ) | | | (0.05 | ) | | | (0.21 | ) | | | (0.21 | ) | | | (0.66 | ) | | | (0.87 | ) | | | 11.12 | | | | (1.86 | ) | | | 25,690 | | | | 1.46 | (d) | | | 1.51 | (d) | | | (1.41 | )(d) | | | 10 | |
Year ended 10/31/14 | | | 12.75 | | | | (0.17 | ) | | | 0.53 | | | | 0.36 | | | | — | | | | (0.91 | ) | | | (0.91 | ) | | | 12.20 | | | | 3.30 | | | | 28,166 | | | | 1.45 | | | | 1.49 | | | | (1.41 | ) | | | 72 | |
Year ended 10/31/13 | | | 12.77 | | | | (0.17 | ) | | | 0.77 | | | | 0.60 | | | | (0.27 | ) | | | (0.35 | ) | | | (0.62 | ) | | | 12.75 | | | | 4.89 | | | | 29,964 | | | | 1.39 | | | | 1.46 | | | | (1.32 | ) | | | 0 | |
Year ended 10/31/12 | | | 11.93 | | | | (0.15 | ) | | | 1.44 | | | | 1.29 | | | | (0.33 | ) | | | (0.12 | ) | | | (0.45 | ) | | | 12.77 | | | | 11.12 | | | | 15,605 | | | | 1.35 | | | | 1.47 | | | | (1.25 | ) | | | 282 | |
Year ended 10/31/11 | | | 11.63 | | | | (0.14 | ) | | | 1.10 | | | | 0.96 | | | | (0.46 | ) | | | (0.20 | ) | | | (0.66 | ) | | | 11.93 | | | | 8.84 | | | | 2,956 | | | | 1.29 | | | | 1.56 | | | | (1.20 | ) | | | 163 | (e) |
Class Y | | | | | | | | | | | | | | | | | | | | | | | | | | | | | | | | | | | | | | | | | | | | | | | | | | | | | | | | |
Year ended 10/31/15 | | | 12.51 | | | | (0.11 | ) | | | (0.05 | ) | | | (0.16 | ) | | | (0.28 | ) | | | (0.66 | ) | | | (0.94 | ) | | | 11.41 | | | | (1.40 | ) | | | 2,600,015 | | | | 0.96 | (d) | | | 1.01 | (d) | | | (0.91 | )(d) | | | 10 | |
Year ended 10/31/14 | | | 12.99 | | | | (0.11 | ) | | | 0.54 | | | | 0.43 | | | | — | | | | (0.91 | ) | | | (0.91 | ) | | | 12.51 | | | | 3.81 | | | | 3,699,738 | | | | 0.95 | | | | 0.99 | | | | (0.91 | ) | | | 72 | |
Year ended 10/31/13 | | | 12.97 | | | | (0.10 | ) | | | 0.78 | | | | 0.68 | | | | (0.31 | ) | | | (0.35 | ) | | | (0.66 | ) | | | 12.99 | | | | 5.42 | | | | 4,846,950 | | | | 0.89 | | | | 0.96 | | | | (0.82 | ) | | | 0 | |
Year ended 10/31/12 | | | 12.07 | | | | (0.10 | ) | | | 1.47 | | | | 1.37 | | | | (0.35 | ) | | | (0.12 | ) | | | (0.47 | ) | | | 12.97 | | | | 11.69 | | | | 3,901,165 | | | | 0.85 | | | | 0.97 | | | | (0.75 | ) | | | 282 | |
Year ended 10/31/11 | | | 11.71 | | | | (0.08 | ) | | | 1.11 | | | | 1.03 | | | | (0.47 | ) | | | (0.20 | ) | | | (0.67 | ) | | | 12.07 | | | | 9.45 | | | | 553,001 | | | | 0.79 | | | | 1.06 | | | | (0.70 | ) | | | 163 | (e) |
Class R5 | | | | | | | | | | | | | | | | | | | | | | | | | | | | | | | | | | | | | | | | | | | | | | | | | | | | | | | | |
Year ended 10/31/15 | | | 12.51 | | | | (0.10 | ) | | | (0.06 | ) | | | (0.16 | ) | | | (0.28 | ) | | | (0.66 | ) | | | (0.94 | ) | | | 11.41 | | | | (1.39 | ) | | | 158,826 | | | | 0.93 | (d) | | | 0.98 | (d) | | | (0.88 | )(d) | | | 10 | |
Year ended 10/31/14 | | | 12.99 | | | | (0.11 | ) | | | 0.54 | | | | 0.43 | | | | — | | | | (0.91 | ) | | | (0.91 | ) | | | 12.51 | | | | 3.81 | | | | 186,943 | | | | 0.93 | | | | 0.97 | | | | (0.89 | ) | | | 72 | |
Year ended 10/31/13 | | | 12.97 | | | | (0.10 | ) | | | 0.78 | | | | 0.68 | | | | (0.31 | ) | | | (0.35 | ) | | | (0.66 | ) | | | 12.99 | | | | 5.45 | | | | 206,573 | | | | 0.86 | | | | 0.93 | | | | (0.79 | ) | | | 0 | |
Year ended 10/31/12 | | | 12.07 | | | | (0.08 | ) | | | 1.45 | | | | 1.37 | | | | (0.35 | ) | | | (0.12 | ) | | | (0.47 | ) | | | 12.97 | | | | 11.69 | | | | 164,371 | | | | 0.79 | | | | 0.90 | | | | (0.69 | ) | | | 282 | |
Year ended 10/31/11 | | | 11.72 | | | | (0.08 | ) | | | 1.11 | | | | 1.03 | | | | (0.48 | ) | | | (0.20 | ) | | | (0.68 | ) | | | 12.07 | | | | 9.36 | | | | 449,380 | | | | 0.79 | | | | 0.97 | | | | (0.70 | ) | | | 163 | (e) |
Class R6 | | | | | | | | | | | | | | | | | | | | | | | | | | | | | | | | | | | | | | | | | | | | | | | | | | | | | | | | |
Year ended 10/31/15 | | | 12.53 | | | | (0.09 | ) | | | (0.05 | ) | | | (0.14 | ) | | | (0.30 | ) | | | (0.66 | ) | | | (0.96 | ) | | | 11.43 | | | | (1.27 | ) | | | 418,615 | | | | 0.83 | (d) | | | 0.88 | (d) | | | (0.78 | )(d) | | | 10 | |
Year ended 10/31/14 | | | 12.99 | | | | (0.10 | ) | | | 0.55 | | | | 0.45 | | | | — | | | | (0.91 | ) | | | (0.91 | ) | | | 12.53 | | | | 3.97 | | | | 480,626 | | | | 0.83 | | | | 0.87 | | | | (0.79 | ) | | | 72 | |
Year ended 10/31/13 | | | 12.97 | | | | (0.09 | ) | | | 0.77 | | | | 0.68 | | | | (0.31 | ) | | | (0.35 | ) | | | (0.66 | ) | | | 12.99 | | | | 5.48 | | | | 521,099 | | | | 0.79 | | | | 0.86 | | | | (0.72 | ) | | | 0 | |
Year ended 10/31/12(f) | | | 13.13 | | | | (0.01 | ) | | | (0.15 | ) | | | (0.16 | ) | | | — | | | | — | | | | — | | | | 12.97 | | | | (3.14 | ) | | | 554,557 | | | | 0.76 | (g) | | | 0.85 | (g) | | | (0.66 | )(g) | | | 282 | |
| (a) | Calculated using average shares outstanding. |
| (b) | Includes adjustments in accordance with accounting principles generally accepted in the United States of America and as such, the net asset value for financial reporting purposes and the returns based upon those net asset values may differ from the net asset value and returns for shareholder transactions. Does not include sales charges and is not annualized for periods less than one year, if applicable. |
| (c) | Portfolio turnover is calculated at the fund level and is not annualized for periods less than one year, if applicable. |
| (d) | Ratios are based on average daily net assets (000’s omitted) of $2,731,347, $17,220, $1,796,591, $28,267, $3,394,711, $177,073 and $457,466 for Class A, Class B, Class C, Class R, Class Y, Class R5 and Class R6 shares, respectively. |
| (e) | Subsequent to issuance of its October 31, 2011 financial statements, the Fund revised the calculation of portfolio turnover as reflected in the financial highlights above. |
| (f) | Commencement date of September 24, 2012. |
26 Invesco Balanced-Risk Allocation Fund
Report of Independent Registered Public Accounting Firm
To the Board of Trustees of AIM Investment Funds (Invesco Investment Funds)
and Shareholders of Invesco Balanced-Risk Allocation Fund:
In our opinion, the accompanying consolidated statement of assets and liabilities, including the consolidated schedule of investments, and the related consolidated statements of operations and of changes in net assets and the financial highlights present fairly, in all material respects, the consolidated financial position of Invesco Balanced-Risk Allocation Fund (one of the funds constituting AIM Investment Funds (Invesco Investment Funds), hereafter referred to as the “Fund”) at October 31, 2015, the results of its operations for the year then ended, the changes in its net assets for each of the two years in the period then ended and the financial highlights for each of the five years in the period then ended, in conformity with accounting principles generally accepted in the United States of America. These consolidated financial statements and financial highlights (hereafter referred to as “financial statements”) are the responsibility of the Fund’s management. Our responsibility is to express an opinion on these financial statements based on our audits. We conducted our audits of these financial statements in accordance with the standards of the Public Company Accounting Oversight Board (United States). Those standards require that we plan and perform the audit to obtain reasonable assurance about whether the financial statements are free of material misstatement. An audit includes examining, on a test basis, evidence supporting the amounts and disclosures in the financial statements, assessing the accounting principles used and significant estimates made by management, and evaluating the overall financial statement presentation. We believe that our audits, which included confirmation of securities at October 31, 2015 by correspondence with the custodian and brokers, provide a reasonable basis for our opinion.
PRICEWATERHOUSECOOPERS LLP
December 23, 2015
Houston, Texas
27 Invesco Balanced-Risk Allocation Fund
Calculating your ongoing Fund expenses
Example
As a shareholder of the Fund, you incur two types of costs: (1) transaction costs, which may include sales charges (loads) on purchase payments or contingent deferred sales charges on redemptions, if any; and (2) ongoing costs, including distribution and/or service (12b-1) fees, and other Fund expenses. This example is intended to help you understand your ongoing costs (in dollars) of investing in the Fund and to compare these costs with ongoing costs of investing in other mutual funds. The example is based on an investment of $1,000 invested at the beginning of the period and held for the entire period May 1, 2015, through October 31, 2015.
In addition to the fees and expenses which the Fund bears directly, the Fund indirectly bears a pro rata share of the fees and expenses of the underlying funds in which the Fund invests. The amount of fees and expenses incurred indirectly by the Fund will vary because the underlying funds have varied expenses and fee levels and the Fund may own different proportions of the underlying funds at different times. Estimated underlying fund expenses are not expenses that are incurred directly by the Fund. They are expenses that are incurred directly by the underlying funds and are deducted from the value of the underlying funds the Fund invests in. The effect of the estimated underlying fund expenses that the Fund bears indirectly are included in the Fund’s total return.
Actual expenses
The table below provides information about actual account values and actual expenses. You may use the information in this table, together with the amount you invested, to estimate the expenses that you paid over the period. Simply divide your account value by $1,000 (for example, an $8,600 account value divided by $1,000 = 8.6), then multiply the result by the number in the table under the heading entitled “Actual Expenses Paid During Period” to estimate the expenses you paid on your account during this period.
Hypothetical example for comparison purposes
The table below also provides information about hypothetical account values and hypothetical expenses based on the Fund’s actual expense ratio and an assumed rate of return of 5% per year before expenses, which is not the Fund’s actual return.
The hypothetical account values and expenses may not be used to estimate the actual ending account balance or expenses you paid for the period. You may use this information to compare the ongoing costs of investing in the Fund and other funds. To do so, compare this 5% hypothetical example with the 5% hypothetical examples that appear in the shareholder reports of the other funds.
Please note that the expenses shown in the table are meant to highlight your ongoing costs only and do not reflect any transaction costs, such as sales charges (loads) on purchase payments or contingent deferred sales charges on redemptions, if any. Therefore, the hypothetical information is useful in comparing ongoing costs only, and will not help you determine the relative total costs of owning different funds. In addition, expenses shown in the table do not include the expenses of the underlying funds, which are borne indirectly by the Fund. If transaction costs and indirect expenses were included, your costs would have been higher.
| | | | | | | | | | | | | | | | | | | | | | | | |
| Class | | Beginning
Account Value
(05/01/15) | | | ACTUAL | | | HYPOTHETICAL
(5% annual return before
expenses) | | | Annualized
Expense
Ratio | |
| | | Ending
Account Value
(10/31/15)1 | | | Expenses
Paid During
Period2 | | | Ending
Account Value
(10/31/15) | | | Expenses
Paid During
Period2 | | |
| A | | $ | 1,000.00 | | | $ | 944.70 | | | $ | 5.93 | | | $ | 1,019.11 | | | $ | 6.16 | | | | 1.21 | % |
| B | | | 1,000.00 | | | | 941.00 | | | | 9.59 | | | | 1,015.32 | | | | 9.96 | | | | 1.96 | |
| C | | | 1,000.00 | | | | 941.00 | | | | 9.59 | | | | 1,015.32 | | | | 9.96 | | | | 1.96 | |
| R | | | 1,000.00 | | | | 944.00 | | | | 7.15 | | | | 1,017.85 | | | | 7.43 | | | | 1.46 | |
| Y | | | 1,000.00 | | | | 946.10 | | | | 4.71 | | | | 1,020.37 | | | | 4.89 | | | | 0.96 | |
| R5 | | | 1,000.00 | | | | 946.10 | | | | 4.56 | | | | 1,020.52 | | | | 4.74 | | | | 0.93 | |
| R6 | | | 1,000.00 | | | | 947.00 | | | | 4.07 | | | | 1,021.02 | | | | 4.23 | | | | 0.83 | |
| 1 | The actual ending account value is based on the actual total return of the Fund for the period May 1, 2015 through October 31, 2015, after actual expenses and will differ from the hypothetical ending account value which is based on the Fund’s expense ratio and a hypothetical annual return of 5% before expenses. |
| 2 | Expenses are equal to the Fund’s annualized expense ratio as indicated above multiplied by the average account value over the period, multiplied by 184/365 to reflect the most recent fiscal half year. |
28 Invesco Balanced-Risk Allocation Fund
Approval of Investment Advisory and Sub-Advisory Contracts
The Board of Trustees (the Board) of AIM Investment Funds (Invesco Investment Funds) Series is required under the Investment Company Act of 1940, as amended, to approve annually the renewal of Invesco Balanced-Risk Allocation Fund’s (the Fund) investment advisory agreements. During contract renewal meetings held on June 9-10, 2015, the Board as a whole, and the disinterested or “independent” Trustees, who comprise over 75% of the Board, voting separately, approved the continuance for the Fund of the Master Investment Advisory Agreement with Invesco Advisers, Inc. (Invesco Advisers and the investment advisory agreement) and the Master Intergroup Sub-Advisory Contract for Mutual Funds with Invesco Asset Management Deutschland GmbH, Invesco Asset Management Limited, Invesco Asset Management (Japan) Limited, Invesco Hong Kong Limited, Invesco Senior Secured Management, Inc. and Invesco Canada Ltd. (collectively, the Affiliated Sub-Advisers and the sub-advisory contracts) for another year, effective July 1, 2015.
In evaluating the fairness and reasonableness of compensation under the Fund’s investment advisory agreement and sub-advisory contracts, the Board considered, among other things, the factors discussed below. The Board determined that continuation of the Fund’s investment advisory agreement and the sub-advisory contracts are in the best interest of the Fund and its shareholders and that the compensation payable to Invesco Advisers and the Affiliated Sub-Advisers under the agreements is fair and reasonable.
The Board’s Fund Evaluation Process
The Board’s Investments Committee has established three Sub-Committees, each of which is primarily responsible for overseeing the performance and investment management services provided by Invesco Advisers and the Affiliated Sub-Advisers to a number of the funds advised by Invesco Advisers (the Invesco Funds). The Sub-Committees meet throughout the year to review the performance of their assigned Invesco Funds, including reviewing materials prepared under the direction of the independent Senior Officer, an officer of the Invesco Funds who reports directly to the independent Trustees. Over the course of each year, the Sub-Committees meet with portfolio managers for their assigned Invesco Funds and other members of management to review the performance, investment objective(s), policies, strategies, limitations and investment risks of these funds. The Board had the benefit of reports from the Sub-Committees and Investments Committee throughout the year in considering approval of the continuance of each Invesco Fund’s investment advisory agreement and sub-advisory contracts for another year.
During the contract renewal process, the Board receives comparative performance and fee data regarding the Invesco Funds prepared by Invesco Advisers and Lipper Inc. (Lipper), an independent provider of investment company data. The Board also receives a report and this independent written evaluation from the Senior Officer. The Senior Officer’s evaluation is prepared as part of his responsibility to manage the process by which the Invesco Funds’ proposed management fees are negotiated during the annual contract renewal process to ensure they are negotiated in a manner that is at arms’ length and reasonable. In addition to meetings with Invesco Advisers and fund counsel, the independent Trustees also discuss the continuance of the investment advisory agreement and sub-advisory contracts in separate sessions with the Senior Officer and with independent legal counsel.
The Trustees recognized that the advisory fee rates for the Invesco Funds are, in many cases, the result of years of review and negotiation. The Trustees’ deliberations and conclusions in a particular year may be based in part on their deliberations and conclusions regarding these same arrangements throughout the year and in prior years. The Trustees’ review and conclusions are based on the comprehensive consideration of all information presented to them and are not the result of any single determinative factor. Moreover, one Trustee may have weighed a particular piece of information or factor differently than another Trustee.
The discussion below is a summary of the Senior Officer’s independent written evaluation with respect to the Fund’s investment advisory agreement as well as a discussion of the material factors and related conclusions that formed the basis for the Board’s approval of the Fund’s investment advisory agreement and sub-advisory contracts. Unless otherwise stated, this information is current as of June 10, 2015, and does not reflect consideration of factors that became known to the Board after that date.
Factors and Conclusions and Summary of Independent Written Fee Evaluation
| A. | Nature, Extent and Quality of Services Provided by Invesco Advisers and the Affiliated Sub-Advisers |
The Board reviewed the advisory services provided to the Fund by Invesco Advisers under the Fund’s investment advisory agreement, the performance of Invesco Advisers in providing these services, and the credentials and experience of the officers and employees of Invesco Advisers who provide these services, including the Fund’s portfolio manager or managers. The Board’s review of the qualifications of Invesco Advisers to provide advisory services included the Board’s
consideration of Invesco Advisers’ investment process oversight, independent credit analysis and investment risk management. The Board also considered non-advisory services that Invesco Advisers and its affiliates provide to the Invesco Funds such as various back office support functions, equity and fixed income trading operations, internal audit, distribution, valuation and legal and compliance.
In determining whether to continue the Fund’s investment advisory agreement, the Board considered the benefits of reapproving an existing relationship and the greater uncertainty that may be associated with entering into a new relationship. The Board concluded that the nature, extent and quality of the services provided to the Fund by Invesco Advisers are appropriate and satisfactory and consistent with the terms of the Fund’s investment advisory agreement.
The Board reviewed the services that may be provided by the Affiliated Sub-Advisers under the sub-advisory contracts and the credentials and experience of the officers and employees of the Affiliated Sub-Advisers who provide these services. The Board noted that the Affiliated Sub-Advisers have offices and personnel that are located in financial centers around the world. As a result, the Affiliated Sub-Advisers can provide research and investment analysis on the markets and economies of various countries in which the Fund may invest, make recommendations regarding securities and assist with security trades. The Board concluded that the sub-advisory contracts benefit the Fund and its shareholders by permitting Invesco Advisers to use the resources and talents of the Affiliated Sub-Advisers in managing the Fund. The Board concluded that the nature, extent and quality of the services that may be provided by the Affiliated Sub-Advisers are appropriate and satisfactory and consistent with the terms of the Fund’s sub-advisory contracts.
The Board considered Fund performance as a relevant factor in considering whether to approve the investment advisory agreement. The Board did not view Fund performance as a relevant factor in considering whether to approve the sub-advisory contracts for the Fund, as no Affiliated Sub-Adviser currently manages assets of the Fund.
The Board compared the Fund’s performance during the past one, three and five calendar years to the performance of funds in the Lipper performance universe and against the Lipper Alternative Global Macro Funds Index. The Board noted that performance of Class A shares of the Fund was in the first quintile of its performance universe for the one and five year periods and the second quintile for the three year period (the first quintile being the best performing funds and the fifth quintile being the worst performing funds). The Board noted that
29 Invesco Balanced-Risk Allocation Fund
performance of Class A shares of the Fund was above the performance of the Index for the one, three and five year periods. The Trustees also reviewed more recent Fund performance and this review did not change their conclusions.
| C. | Advisory and Sub-Advisory Fees |
The Board compared the Fund’s contractual management fee rate to the contractual management fee rates of funds in the Fund’s Lipper expense group at a common asset level. The Board noted that the contractual management fee rate for Class A shares of the Fund was above the median contractual management fee rate of funds in its expense group. The Board noted that the term “contractual management fee” may include both advisory and certain administrative services fees, but that Lipper does not provide information on a fund by fund basis as to what is included. The Board noted that Invesco Advisers does not charge the Invesco Funds for the administrative services included in the term as defined by Lipper. The Board also reviewed the methodology used by Lipper in providing expense group information, which includes using each fund’s contractual management fee schedule (including any applicable breakpoints) as reported in the most recent prospectus or statement of additional information for each fund in the expense group.
The Board compared the Fund’s effective advisory fee rate (the advisory fee rate after advisory fee waivers and before other expense limitations/waivers) to the effective advisory fee rates of other funds advised by Invesco Advisers and its affiliates with investment strategies comparable to those of the Fund. The Board noted that the Fund’s rate was below the rate of one such mutual fund. The Board also noted how the Fund’s rate compared to the effective sub-adviser fee rate of three funds sub-advised by Invesco Advisers.
The Board also considered the fees charged by Invesco Advisers and the Affiliated Sub-Advisers to other client accounts with investment strategies comparable to those of the Fund. The Board noted that Invesco Advisers or the Affiliated Sub-Advisers may charge lower fees to large institutional clients. Invesco Advisers reviewed with the Board the significantly greater scope of services it provides to the Invesco Funds relative to certain other types of client accounts. These additional services include provision of administrative services, officers and office space, oversight of service providers, preparation of annual registration statement updates and financial information and regulatory compliance under the Investment Company Act of 1940, as amended.
Invesco Advisers also reviewed generally the higher frequency of shareholder purchases and redemptions in the Invesco Funds relative to the flow of assets for other client accounts. Invesco Advisers advised the Board that advance notice of redemptions is often provided to Invesco Advisers by institutional clients. The Board did note that sub-advisory fee rates charged by the
Affiliated Sub-Advisers to manage the Invesco Funds and to manage other client accounts tended to be more comparable, reflecting a similar scope of services. The information received by the Board demonstrated that the aggregate services provided to the Invesco Funds were sufficiently different from those provided to institutional clients to support the difference in fees.
The Board also considered the services that may be provided by the Affiliated Sub-Advisers pursuant to the sub-advisory contracts, as well as the fees payable by Invesco Advisers to the Affiliated Sub-Advisers pursuant to the sub-advisory contracts. The Board also noted that the sub-advisory fees are not paid directly by the Fund, but rather, are payable by Invesco Advisers to the Affiliated Sub-Advisers.
| D. | Economies of Scale and Breakpoints |
The Board considered the extent to which there are economies of scale in the provision of advisory services to the Fund. The Board also considered whether the Fund benefits from economies of scale through contractual breakpoints in the Fund’s advisory fee schedule. The Board also noted that the Fund shares directly in economies of scale through lower fees charged by third party service providers based on the combined size of the Invesco Funds and other clients advised by Invesco Advisers.
| E. | Profitability and Financial Resources |
The Board reviewed information from Invesco Advisers concerning the costs of the advisory and other services that Invesco Advisers and its affiliates provide to the Fund and the Invesco Funds and the profitability of Invesco Advisers and its affiliates in providing these services. The Board received information from Invesco Advisers about the methodology used to prepare the profitability information. The Board noted that Invesco Advisers continues to operate at a net profit from services Invesco Advisers and its affiliates provide to the Invesco Funds and the Fund. The Board did not deem the level of profits realized by Invesco Advisers and its affiliates from providing services to the Fund to be excessive given the nature, quality and extent of the services provided. The Board received and accepted information from Invesco Advisers demonstrating that Invesco Advisers and each Affiliated Sub-Adviser are financially sound and have the resources necessary to perform their obligations under the investment advisory agreement and sub-advisory contracts.
| F. | Collateral Benefits to Invesco Advisers and its Affiliates |
The Board considered various other benefits received by Invesco Advisers and its affiliates from the relationship with the Fund, including the fees received for providing transfer agency and distribution services to the Fund. The Board considered comparative information regarding fees charged for these services, including information provided by Lipper and other independent sources. The Board considered the performance of Invesco Advisers and its affiliates in providing these services and the
organizational structure employed to provide these services. The Board also considered that these services are provided to the Fund pursuant to written contracts that are reviewed and approved on an annual basis by the Board; and that the services are required for the operation of the Fund.
The Board considered the benefits realized by Invesco Advisers and the Affiliated Sub-Advisers as a result of portfolio brokerage transactions executed through “soft dollar” arrangements. Invesco Advisers noted that the Fund does not execute brokerage transaction through “soft dollar” arrangements to any significant degree.
The Board considered that the Fund’s uninvested cash and cash collateral from any securities lending arrangements may be invested in money market funds advised by Invesco Advisers pursuant to procedures approved by the Board. The Board noted that Invesco Advisers receives advisory fees from these affiliated money market funds attributable to such investments, although Invesco Advisers has contractually agreed to waive through varying periods the advisory fees payable by the Invesco Funds with respect to investments in the affiliated money market funds. The waiver is in an amount equal to 100% of the net advisory fee Invesco Advisers receives from the affiliated money market funds with respect to the Fund’s investment in the affiliated money market funds of uninvested cash, but not cash collateral. The Board concluded that the amount of advisory fees received by Invesco Advisors from the Fund’s investment of cash collateral from any securities lending arrangements in the affiliated money market funds is fair and reasonable.
30 Invesco Balanced-Risk Allocation Fund
Tax Information
Form 1099-DIV, Form 1042-S and other year-end tax information provide shareholders with actual calendar year amounts that should be included in their tax returns. Shareholders should consult their tax advisors.
The following distribution information is being provided as required by the Internal Revenue Code or to meet a specific state’s requirement.
The Fund designates the following amounts or, if subsequently determined to be different, the maximum amount allowable for its fiscal year ended October 31, 2015:
| | | | |
Federal and State Income Tax | |
Long-Term Capital Gain Distributions | | $ | 238,503,716 | |
Qualified Dividend Income* | | | 0 | % |
Corporate Dividends Received Deduction* | | | 0 | % |
U.S. Treasury Obligations* | | | 50.41 | % |
| | * | The above percentages are based on ordinary income dividends paid to shareholders during the Fund’s fiscal year. |
| | | | |
Non-Resident Alien Shareholders | |
Qualified Short-Term Gains | | $ | 247,065,364 | |
31 Invesco Balanced-Risk Allocation Fund
Trustees and Officers
The address of each trustee and officer is AIM Investment Funds (Invesco Investment Funds) (the “Trust”), 11 Greenway Plaza, Suite 1000, Houston, Texas 77046-1173. The trustees serve for the life of the Trust, subject to their earlier death, incapacitation, resignation, retirement or removal as more specifically provided in the Trust’s organizational documents. Each officer serves for a one year term or until their successors are elected and qualified. Column two below includes length of time served with predecessor entities, if any.
| | | | | | | | |
Name, Year of Birth and
Position(s) Held with the Trust | | Trustee and/
or Officer Since | | Principal Occupation(s)
During Past 5 Years | | Number of Funds in Fund Complex Overseen by Trustee | | Other Directorship(s) Held by Trustee During Past 5 Years |
| Interested Persons | | | | | | | | |
| Martin L. Flanagan1 — 1960 Trustee | | 2007 | | Executive Director, Chief Executive Officer and President, Invesco Ltd. (ultimate parent of Invesco and a global investment management firm); Advisor to the Board, Invesco Advisers, Inc. (formerly known as Invesco Institutional (N.A.), Inc.); Trustee, The Invesco Funds; Vice Chair, Investment Company Institute; and Member of Executive Board, SMU Cox School of Business Formerly: Chairman and Chief Executive Officer, Invesco Advisers, Inc. (registered investment adviser); Director, Chairman, Chief Executive Officer and President, IVZ Inc. (holding company), INVESCO Group Services, Inc. (service provider) and Invesco North American Holdings, Inc. (holding company); Director, Chief Executive Officer and President, Invesco Holding Company Limited (parent of Invesco and a global investment management firm); Director, Invesco Ltd.; Chairman, Investment Company Institute and President, Co-Chief Executive Officer, Co-President, Chief Operating Officer and Chief Financial Officer, Franklin Resources, Inc. (global investment management organization). | | 145 | | None |
Philip A. Taylor2 — 1954
Trustee, President and Principal Executive Officer | | 2006 | | Head of North American Retail and Senior Managing Director, Invesco Ltd.; Director, Co-Chairman, Co-President and Co-Chief Executive Officer, Invesco Advisers, Inc. (formerly known as Invesco Institutional (N.A.), Inc.) (registered investment adviser); Director, Chairman, Chief Executive Officer and President, Invesco Management Group, Inc. (formerly known as Invesco Aim Management Group, Inc.) (financial services holding company); Director and President, INVESCO Funds Group, Inc. (registered investment adviser and registered transfer agent); Director and Chairman, Invesco Investment Services, Inc. (formerly known as Invesco Aim Investment Services, Inc.) (registered transfer agent) and IVZ Distributors, Inc. (formerly known as INVESCO Distributors, Inc.) (registered broker dealer); Chief Executive Officer, Invesco Corporate Class Inc. (corporate mutual fund company) Director, Chairman and Chief Executive Officer, Invesco Canada Ltd. (formerly known as Invesco Trimark Ltd./Invesco Trimark Ltèe) (registered investment adviser and registered transfer agent); Trustee, President and Principal Executive Officer, The Invesco Funds (other than AIM Treasurer’s Series Trust (Invesco Treasurer’s Series Trust), Short-Term Investments Trust and Invesco Management Trust); Trustee and Executive Vice President, The Invesco Funds (AIM Treasurer’s Series Trust (Invesco Treasurer’s Series Trust), Short-Term Investments Trust and Invesco Management Trust only); Director, Invesco Investment Advisers LLC (formerly known as Van Kampen Asset Management); Director, Chief Executive Officer and President, Van Kampen Exchange Corp. Formerly: Director, President and Chairman, Invesco Inc. (holding company), Invesco Canada Holdings Inc. (holding company), Trimark Investments Ltd./Placements Trimark Ltèe and Invesco Financial Services Ltd/Services Financiers Invesco Ltèe; Chief Executive Officer, Invesco Canada Fund Inc (corporate mutual fund company); Director and Chairman, Van Kampen Investor Services Inc.; Director, Chief Executive Officer and President, 1371 Preferred Inc. (holding company) and Van Kampen Investments Inc.; Director and President, AIM GP Canada Inc. (general partner for limited partnerships) and Van Kampen Advisors, Inc.; Director and Chief Executive Officer, Invesco Trimark Dealer Inc. (registered broker dealer); Director, Invesco Distributors, Inc. (formerly known as Invesco Aim Distributors, Inc.) (registered broker dealer); Manager, Invesco PowerShares Capital Management LLC; Director, Chief Executive Officer and President, Invesco Advisers, Inc.; Director, Chairman, Chief Executive Officer and President, Invesco Aim Capital Management, Inc.; President, Invesco Trimark Dealer Inc. and Invesco Trimark Ltd./Invesco Trimark Ltèe; Director and President, AIM Trimark Corporate Class Inc. and AIM Trimark Canada Fund Inc.; Senior Managing Director, Invesco Holding Company Limited; Director and Chairman, Fund Management Company (former registered broker dealer); President and Principal Executive Officer, The Invesco Funds (AIM Treasurer’s Series Trust (Invesco Treasurer’s Series Trust), and Short-Term Investments Trust only); President, AIM Trimark Global Fund Inc. and AIM Trimark Canada Fund Inc.. | | 145 | | None |
| 1 | Mr. Flanagan is considered an interested person (within the meaning of Section 2(a)(19) of the 1940 Act) of the Trust because he is an officer of the Adviser to the Trust, and an officer and a director of Invesco Ltd., ultimate parent of the Adviser. |
| 2 | Mr. Taylor is considered an interested person (within the meaning of Section 2(a)(19) of the 1940 Act) of the Trust because he is an officer and a director of the Adviser. |
T-1 Invesco Balanced-Risk Allocation Fund
Trustees and Officers—(continued)
| | | | | | | | |
Name, Year of Birth and Position(s) Held with the Trust | | Trustee and/ or Officer Since | | Principal Occupation(s) During Past 5 Years | | Number of Funds in Fund Complex Overseen by Trustee | | Other Directorship(s) Held by Trustee During Past 5 Years |
| Independent Trustees | | | | | | | | |
Bruce L. Crockett — 1944 Trustee and Chair | | 2003 | | Chairman, Crockett Technologies Associates (technology consulting company) Formerly: Director, Captaris (unified messaging provider); Director, President and Chief Executive Officer, COMSAT Corporation; Chairman, Board of Governors of INTELSAT (international communications company); ACE Limited (insurance company); Independent Directors Council and Investment Company Institute | | 145 | | ALPS (Attorneys Liability Protection Society) (insurance company) and Globe Specialty Metals, Inc. (metallurgical company) |
David C. Arch — 1945 Trustee | | 2010 | | Chairman of Blistex Inc., a consumer health care products manufacturer | | 145 | | Board member of the Illinois Manufacturers’ Association; Member of the Board of Visitors, Institute for the Humanities, University of Michigan; Member of the Audit Committee of the Edward-Elmhurst Hospital |
James T. Bunch — 1942 Trustee | | 2000 | | Managing Member, Grumman Hill Group LLC (family office/private equity investments) Formerly: Founder, Green Manning & Bunch Ltd. (investment banking firm) (1988-2010); Executive Committee, United States Golf Association; and Chairman, Board of Governors, Western Golf Association | | 145 | | Chairman of the Board of Trustees, Evans Scholars Foundation; and Chairman of the Board, Denver Film Society |
Rodney F. Dammeyer — 1940 Trustee | | 2010 | | Chairman of CAC, LLC, (private company offering capital investment and management advisory services) Formerly: Prior to 2001, Managing Partner at Equity Group Corporate Investments; Prior to 1995, Chief Executive Officer of Itel Corporation (formerly Anixter International); Prior to 1985, experience includes Senior Vice President and Chief Financial Officer of Household International, Inc., Executive Vice President and Chief Financial Officer of Northwest Industries, Inc. and Partner of Arthur Andersen & Co.; From 1987 to 2010, Director/Trustee of investment companies in the Van Kampen Funds complex | | 145 | | Director of Quidel Corporation and Stericycle, Inc. |
Albert R. Dowden — 1941 Trustee | | 2003 | | Director of a number of public and private business corporations, including the Boss Group, Ltd. (private investment and management); Nature’s Sunshine Products, Inc. and Reich & Tang Funds (5 portfolios) (registered investment company) Formerly: Director, Homeowners of America Holding Corporation/Homeowners of America Insurance Company (property casualty company); Director, Continental Energy Services, LLC (oil and gas pipeline service); Director, CompuDyne Corporation (provider of product and services to the public security market) and Director, Annuity and Life Re (Holdings), Ltd. (reinsurance company); Director, President and Chief Executive Officer, Volvo Group North America, Inc.; Senior Vice President, AB Volvo; Director of various public and private corporations; Chairman, DHJ Media, Inc.; Director, Magellan Insurance Company; and Director, The Hertz Corporation, Genmar Corporation (boat manufacturer), National Media Corporation; Advisory Board of Rotary Power International (designer, manufacturer, and seller of rotary power engines); and Chairman, Cortland Trust, Inc. (registered investment company) | | 145 | | Director of: Nature’s Sunshine Products, Inc., Reich & Tang Funds, Homeowners of America Holding Corporation/ Homeowners of America Insurance Company, the Boss Group |
Jack M. Fields — 1952 Trustee | | 2003 | | Chief Executive Officer, Twenty First Century Group, Inc. (government affairs company); Owner and Chief Executive Officer, Dos Angeles Ranch, L.P. (cattle, hunting, corporate entertainment); and Discovery Global Education Fund (non-profit) Formerly: Chief Executive Officer, Texana Timber LP (sustainable forestry company); Director of Cross Timbers Quail Research Ranch (non-profit); and member of the U.S. House of Representatives | | 145 | | Insperity, Inc. (formerly known as Administaff) |
Prema Mathai-Davis — 1950 Trustee | | 2003 | | Retired. Formerly: Chief Executive Officer, YWCA of the U.S.A. | | 145 | | None |
Larry Soll — 1942 Trustee | | 1997 | | Retired. Formerly: Chairman, Chief Executive Officer and President, Synergen Corp. (a biotechnology company) | | 145 | | None |
Hugo F. Sonnenschein — 1940 Trustee | | 2010 | | President Emeritus and Honorary Trustee of the University of Chicago and the Adam Smith Distinguished Service Professor in the Department of Economics at the University of Chicago. Prior to 2000, President of the University of Chicago | | 145 | | Trustee of the University of Rochester and a member of its investment committee; Member of the National Academy of Sciences and the American Philosophical Society; Fellow of the American Academy of Arts and Sciences |
Raymond Stickel, Jr. — 1944 Trustee | | 2005 | | Retired. Formerly: Director, Mainstay VP Series Funds, Inc. (25 portfolios) and Partner, Deloitte & Touche | | 145 | | None |
T-2 Invesco Balanced-Risk Allocation Fund
Trustees and Officers—(continued)
| | | | | | | | |
Name, Year of Birth and Position(s) Held with the Trust | | Trustee and/ or Officer Since | | Principal Occupation(s) During Past 5 Years | | Number of Funds in Fund Complex Overseen by Trustee | | Other Directorship(s) Held by Trustee During Past 5 Years |
| Independent Trustees—(continued) |
Suzanne H. Woolsey — 1941 Trustee | | 2014 | | Chief Executive Officer of Woolsey Partners LLC | | 145 | | Emeritus Chair of the Board of Trustees of the Institute for Defense Analyses; Trustee of Colorado College; Trustee of California Institute of Technology; Prior to 2014, Director of Fluor Corp.; Prior to 2010, Trustee of the German Marshall Fund of the United States; Prior to 2010 Trustee of the Rocky Mountain Institute |
| Other Officers | | | | | | | | |
Russell C. Burk — 1958
Senior Vice President and Senior Officer | | 2005 | | Senior Vice President and Senior Officer, The Invesco Funds | | N/A | | N/A |
John M. Zerr — 1962
Senior Vice President, Chief Legal Officer and Secretary | | 2006 | | Director, Senior Vice President, Secretary and General Counsel, Invesco Management Group, Inc. (formerly known as Invesco Aim Management Group, Inc.) and Van Kampen Exchange Corp.; Senior Vice President, Invesco Advisers, Inc. (formerly known as Invesco Institutional (N.A.), Inc.) (registered investment adviser); Senior Vice President and Secretary, Invesco Distributors, Inc. (formerly known as Invesco Aim Distributors, Inc.); Director, Vice President and Secretary, Invesco Investment Services, Inc. (formerly known as Invesco Aim Investment Services, Inc.) and IVZ Distributors, Inc. (formerly known as INVESCO Distributors, Inc.); Director and Vice President, INVESCO Funds Group, Inc.; Senior Vice President, Chief Legal Officer and Secretary, The Invesco Funds; Managing Director, Invesco PowerShares Capital Management LLC; Director, Secretary and General Counsel, Invesco Investment Advisers LLC (formerly known as Van Kampen Asset Management); Secretary and General Counsel, Invesco Capital Markets, Inc. (formerly known as Van Kampen Funds Inc.) and Chief Legal Officer, PowerShares Exchange-Traded Fund Trust, PowerShares Exchange-Traded Fund Trust II, PowerShares India Exchange-Traded Fund Trust, PowerShares Actively Managed Exchange-Traded Fund Trust, and PowerShares Actively Managed Exchange-Traded Commodity Fund Trust Formerly: Director and Vice President, Van Kampen Advisors Inc.; Director, Vice President, Secretary and General Counsel, Van Kampen Investor Services Inc.; Director, Invesco Distributors, Inc. (formerly known as Invesco Aim Distributors, Inc.); Director, Senior Vice President, General Counsel and Secretary, Invesco Aim Advisers, Inc. and Van Kampen Investments Inc.; Director, Vice President and Secretary, Fund Management Company; Director, Senior Vice President, Secretary, General Counsel and Vice President, Invesco Aim Capital Management, Inc.; Chief Operating Officer and General Counsel, Liberty Ridge Capital, Inc. (an investment adviser); Vice President and Secretary, PBHG Funds (an investment company) and PBHG Insurance Series Fund (an investment company); Chief Operating Officer, General Counsel and Secretary, Old Mutual Investment Partners (a broker-dealer); General Counsel and Secretary, Old Mutual Fund Services (an administrator) and Old Mutual Shareholder Services (a shareholder servicing center); Executive Vice President, General Counsel and Secretary, Old Mutual Capital, Inc. (an investment adviser); and Vice President and Secretary, Old Mutual Advisors Funds (an investment company) | | N/A | | N/A |
Sheri Morris — 1964
Vice President, Treasurer and Principal Financial Officer | | 2003 | | Vice President, Treasurer and Principal Financial Officer, The Invesco Funds; Vice President, Invesco Advisers, Inc. (formerly known as Invesco Institutional (N.A.), Inc.) (registered investment adviser); and Vice President, PowerShares Exchange-Traded Fund Trust, PowerShares Exchange-Traded Fund Trust II, PowerShares India Exchange-Traded Fund Trust, PowerShares Actively Managed Exchange-Traded Fund Trust, and PowerShares Actively Managed Exchange-Traded Commodity Fund Trust Formerly: Vice President, Invesco Aim Advisers, Inc., Invesco Aim Capital Management, Inc. and Invesco Aim Private Asset Management, Inc.; Assistant Vice President and Assistant Treasurer, The Invesco Funds and Assistant Vice President, Invesco Advisers, Inc., Invesco Aim Capital Management, Inc. and Invesco Aim Private Asset Management, Inc.; and Treasurer, PowerShares Exchange-Traded Fund Trust, PowerShares Exchange-Traded Fund Trust II, PowerShares India Exchange-Traded Fund Trust and PowerShares Actively Managed Exchange-Traded Fund Trust | | N/A | | N/A |
T-3 Invesco Balanced-Risk Allocation Fund
Trustees and Officers—(continued)
| | | | | | | | |
Name, Year of Birth and
Position(s) Held with the Trust | | Trustee and/
or Officer Since | | Principal Occupation(s)
During Past 5 Years | | Number of Funds in Fund Complex Overseen by Trustee | | Other Directorship(s) Held by Trustee During Past 5 Years |
| Other Officers—(continued) | | | | | | | | |
Karen Dunn Kelley — 1960
Vice President | | 2003 | | Senior Managing Director, Investments, Invesco Ltd.; Director, Co-President, Co-Chief Executive Officer, and Co-Chairman, Invesco Advisers, Inc. (formerly known as Invesco Institutional (N.A.), Inc.) (registered investment adviser); Chairman, Invesco Senior Secured Management, Inc.; Senior Vice President, Invesco Management Group, Inc. (formerly known as Invesco Aim Management Group, Inc.); Executive Vice President, Invesco Distributors, Inc. (formerly known as Invesco Aim Distributors, Inc.); Director, Invesco Mortgage Capital Inc. and Invesco Management Company Limited; Vice President, The Invesco Funds (other than AIM Treasurer’s Series Trust (Invesco Treasurer’s Series Trust), Short-Term Investments Trust and Invesco Management Trust); and President and Principal Executive Officer, The Invesco Funds (AIM Treasurer’s Series Trust (Invesco Treasurer’s Series Trust), Short-Term Investments Trust and Invesco Management Trust only) Formerly: Director and President, INVESCO Asset Management (Bermuda) Ltd., Director, INVESCO Global Asset Management Limited and INVESCO Management S.A.; Senior Vice President, Van Kampen Investments Inc. and Invesco Advisers, Inc. (formerly known as Invesco Institutional (N.A.), Inc.) (registered investment adviser); Vice President, Invesco Advisers, Inc. (formerly known as Invesco Institutional (N.A.), Inc.); Director of Cash Management and Senior Vice President, Invesco Advisers, Inc. and Invesco Aim Capital Management, Inc.; Director and President, Fund Management Company; Chief Cash Management Officer, Director of Cash Management, Senior Vice President, and Managing Director, Invesco Aim Capital Management, Inc.; Director of Cash Management, Senior Vice President, and Vice President, Invesco Advisers, Inc. and The Invesco Funds (AIM Treasurer’s Series Trust (Invesco Treasurer’s Series Trust), and Short-Term Investments Trust only) | | N/A | | N/A |
Crissie M. Wisdom — 1969 Anti-Money Laundering Compliance Officer | | 2013 | | Anti-Money Laundering Compliance Officer, Invesco Advisers, Inc. (formerly known as Invesco Institutional (N.A.), Inc.) (registered investment adviser), Invesco Capital Markets, Inc. (formerly known as Van Kampen Funds Inc.), Invesco Distributors, Inc., Invesco Investment Services, Inc., Invesco Management Group, Inc., Van Kampen Exchange Corp., The Invesco Funds, and PowerShares Exchange-Traded Fund Trust, PowerShares Exchange-Traded Fund Trust II, PowerShares India Exchange-Traded Fund Trust, PowerShares Actively Managed Exchange-Traded Fund Trust and PowerShares Actively Managed Exchange-Traded Commodity Fund Trust; Anti-Money Laundering Compliance Officer and Bank Secrecy Act Officer, INVESCO National Trust Company and Invesco Trust Company; and Fraud Prevention Manager and Controls and Risk Analysis Manager for Invesco Investment Services, Inc.. | | N/A | | N/A |
Lisa O. Brinkley — 1959 Chief Compliance Officer | | 2015 | | Senior Vice President and Chief Compliance Officer, Invesco Advisers, Inc. (registered investment adviser) (formerly known as Invesco Institutional (N.A., Inc.); and Chief Compliance Officer, The Invesco Funds Formerly: Global Assurance Officer, Invesco Ltd. and Vice President, The Invesco Funds; Chief Compliance Officer, Invesco Distributors, Inc. (formerly known as Invesco Aim Distributors, Inc.), Invesco Investment Services, Inc.(formerly known as Invesco Aim Investment Services, Inc.) and Van Kampen Investor Services Inc.; Senior Vice President, Invesco Management Group, Inc.; Senior Vice President and Chief Compliance Officer, Invesco Advisers, Inc. and The Invesco Funds; Vice President and Chief Compliance Officer, Invesco Aim Capital Management, Inc. and Invesco Distributors, Inc.; Vice President, Invesco Investment Services, Inc. and Fund Management Company. | | N/A | | N/A |
The Statement of Additional Information of the Trust includes additional information about the Fund’s Trustees and is available upon request, without charge, by calling 1.800.959.4246. Please refer to the Fund’s prospectus for information on the Fund’s sub-advisers.
| | | | | | |
Office of the Fund 11 Greenway Plaza, Suite 1000 Houston, TX 77046-1173 | | Investment Adviser Invesco Advisers, Inc. 1555 Peachtree Street, N.E. Atlanta, GA 30309 | | Distributor
Invesco Distributors, Inc. 11 Greenway Plaza, Suite 1000 Houston, TX 77046-1173 | | Auditors PricewaterhouseCoopers LLP 1000 Louisiana Street, Suite 5800 Houston, TX 77002-5678 |
| | | |
| | | | | | |
Counsel to the Fund Stradley Ronon Stevens & Young, LLP 2005 Market Street, Suite 2600 Philadelphia, PA 19103-7018 | | Counsel to the Independent Trustees Goodwin Procter LLP 901 New York Avenue, N.W. Washington, D.C. 20001 | | Transfer Agent Invesco Investment Services, Inc. 11 Greenway Plaza, Suite 1000 Houston, TX 77046-1173 | | Custodian State Street Bank and Trust Company 225 Franklin Street Boston, MA 02110-2801 |
T-4 Invesco Balanced-Risk Allocation Fund

Invesco mailing information
Send general correspondence to Invesco Investment Services, Inc., P.O. Box 219078, Kansas City, MO 64121-9078.
Important notice regarding delivery of security holder documents
To reduce Fund expenses, only one copy of most shareholder documents may be mailed to shareholders with multiple accounts at the same address (Householding). Mailing of your shareholder documents may be householded indefinitely unless you instruct us otherwise. If you do not want the mailing of these documents to be combined with those for other members of your household, please contact Invesco Investment Services, Inc. at 800 959 4246 or contact your financial institution. We will begin sending you individual copies for each account within 30 days after receiving your request.
Fund holdings and proxy voting information
The Fund provides a complete list of its holdings four times in each fiscal year, at the quarter ends. For the second and fourth quarters, the lists appear in the Fund’s semiannual and annual reports to shareholders. For the first and third quarters, the Fund files the lists with the Securities and Exchange Commission (SEC) on Form N-Q. The most recent list of portfolio holdings is available at invesco.com/completeqtrholdings. Shareholders can also look up the Fund’s Forms N-Q on the SEC website at sec.gov. Copies of the Fund’s Forms N-Q may be reviewed and copied at the SEC Public Reference Room in Washington, D.C. You can obtain information on the operation of the Public Reference Room, including information about duplicating fee charges, by calling 202 551 8090 or 800 732 0330, or by electronic request at the following email address: publicinfo@sec.gov. The SEC file numbers for the Fund are shown below.
A description of the policies and procedures that the Fund uses to determine how to vote proxies relating to portfolio securities is available without charge, upon request, from our Client Services department at 800 959 4246 or at invesco.com/proxyguidelines. The information is also available on the SEC website, sec.gov.
| | |
Information regarding how the Fund voted proxies related to its portfolio securities during the most recent 12-month period ended June 30 is available at invesco.com/proxysearch. The information is also available on the SEC website, sec.gov. Invesco Advisers, Inc. is an investment adviser; it provides investment advisory services to individual and institutional clients and does not sell securities. Invesco Distributors, Inc. is the US distributor for Invesco Ltd.’s retail mutual funds, exchange-traded funds and institutional money market funds. Both are wholly owned, indirect subsidiaries of Invesco Ltd. | |  |
SEC file numbers: 811-05426 and 033-19338 IBRA-AR-1 Invesco Distributors, Inc.
| | | | |
| | |
 | | Annual Report to Shareholders | | October 31, 2015 |
| | |
| | Invesco Balanced-Risk Commodity Strategy Fund |
| | Nasdaq: |
| | A: BRCAX n B: BRCBX n C: BRCCX n R: BRCRX n Y: BRCYX n R5: BRCNX n R6: IBRFX |

Letters to Shareholders
| | |

Philip Taylor | | Dear Shareholders: This annual report includes information about your Fund, including performance data and a complete list of its investments as of the close of the reporting period. Inside is a discussion of how your Fund was managed and the factors that affected its performance during the reporting period. I hope you find this report of interest. The US economy expanded and unemployment declined throughout the reporting period. Continuing low energy prices benefited consumers, but a strong US dollar crimped corporate profits. The US Federal Reserve signaled that it was increasingly likely to raise interest rates, based on generally positive economic data, but uncertainty remained about when it might act. Overseas, the story was much different. Low energy prices hurt the economies of some oil-producing nations, such as Brazil and Russia. During the reporting period, the European |
| Central Bank as well as central banks in China and Japan – among other countries – either instituted or maintained extraordinarily accommodative monetary policies in response to economic weakness. |
Investor uncertainty, such as we saw for much of the reporting period – and market volatility, such as we saw at the end of the reporting period – are unfortunate facts of life when it comes to investing. Some investors use these things as excuses to delay saving and investing for their long-term financial goals. That’s why Invesco encourages investors to work with a professional financial adviser who can stress the importance of starting to save and invest early and the importance of adhering to a disciplined investment plan – when times are good and when they’re uncertain. A financial adviser who knows your unique financial situation, investment goals and risk tolerance can be an invaluable partner as you seek to achieve your financial goals. He or she can offer a long-term perspective when markets are volatile and time-tested advice and guidance when your financial situation or investment goals change.
Timely information when and where you want it
Invesco’s efforts to help investors achieve their financial objectives include providing individual investors and financial professionals with timely information about the markets, the economy and investing – whenever and wherever they want it.
Our website, invesco.com/us, offers a wide range of market insights and investment perspectives. On the website, you’ll find detailed information about our funds, including prices, performance, holdings and portfolio manager commentaries. You can access information about your account by completing a simple, secure online registration. Click on the “Need to register” link in the “Account Access” box on our homepage to get started.
Invesco’s mobile apps for iPhone® and iPad® (both available free from the App StoreSM) allow you to obtain the same detailed information, monitor your account and create customizable watch lists. Also, they allow you to access investment insights from our investment leaders, market strategists, economists and retirement experts. You can sign up to be alerted when new commentary is added, and you can watch portfolio manager videos and have instant access to Invesco news and updates wherever you may be.
In addition to the resources accessible on our website and through our mobile app, you can obtain timely updates to help you stay informed about the markets, the economy and investing by connecting with Invesco on Twitter, LinkedIn or Facebook. You can access our blog at blog.invesco.us.com. Our goal is to provide you the information you want, when and where you want it.
Have questions?
For questions about your account, feel free to contact an Invesco client services representative at 800 959 4246. For Invesco-related questions or comments, please email me directly at phil@invesco.com.
All of us at Invesco look forward to serving your investment management needs for many years to come. Thank you for investing with us.
Sincerely,

Philip Taylor
Senior Managing Director, Invesco Ltd.
iPhone and iPad are trademarks of Apple Inc., registered in the US and other countries. App Store is a service mark of Apple Inc. Invesco Distributors, Inc. is not affiliated with Apple Inc.
2 Invesco Balanced-Risk Commodity Strategy Fund
| | |

Bruce Crockett | | Dear Fellow Shareholders: Among the many important lessons I’ve learned in more than 40 years in a variety of business endeavors is the value of a trusted advocate. As independent chair of the Invesco Funds Board, I can assure you that the members of the Board are strong advocates for the interests of investors in Invesco’s mutual funds. We work hard to represent your interests through oversight of the quality of the investment management services your funds receive and other matters important to your investment, including but not limited to: n Ensuring that Invesco offers a diverse lineup of mutual funds that your financial adviser can use to strive to meet your financial needs as your investment goals change over time. n Monitoring how the portfolio management teams of the Invesco funds are performing in light of changing economic and market conditions. |
| n | | Assessing each portfolio management team’s investment performance within the context of the investment strategy described in the fund’s prospectus. |
| n | | Monitoring for potential conflicts of interests that may impact the nature of the services that your funds receive. |
We believe one of the most important services we provide our fund shareholders is the annual review of the funds’ advisory and sub-advisory contracts with Invesco Advisers and its affiliates. This review is required by the Investment Company Act of 1940 and focuses on the nature and quality of the services Invesco provides as the adviser to the Invesco funds and the reasonableness of the fees that it charges for those services. Each year, we spend months carefully reviewing information received from Invesco and a variety of independent sources, such as performance and fee data prepared by Lipper Inc., an independent, third-party firm widely recognized as a leader in its field. We also meet with our independent legal counsel and other independent advisers to review and help us assess the information that we have received. Our goal is to assure that you receive quality investment management services for a reasonable fee.
I trust the measures outlined above provide assurance that you have a worthy advocate when it comes to choosing the Invesco Funds.
As always, please contact me at bruce@brucecrockett.com with any questions or concerns you may have. On behalf of the Board, we look forward to continuing to represent your interests and serving your needs.
Sincerely,

Bruce L. Crockett
Independent Chair
Invesco Funds Board of Trustees
3 Invesco Balanced-Risk Commodity Strategy Fund
Management’s Discussion of Fund Performance
Performance summary
For the fiscal year ended October 31, 2015, Class A shares of Invesco Balanced-Risk Commodity Strategy Fund (the Fund), at net asset value (NAV), outperformed the Bloomberg Commodity Index, the Fund’s broad market/style-specific benchmark.
Your Fund’s long-term performance appears later in this report.
Fund vs. Indexes
Total returns, 10/31/14 to 10/31/15, at net asset value (NAV). Performance shown does not include applicable contingent deferred sales charges (CDSC) or front-end sales charges, which would have reduced performance.
| | | | |
Class A Shares | | | -18.66 | % |
Class B Shares | | | -19.24 | |
Class C Shares | | | -19.26 | |
Class R Shares | | | -18.90 | |
Class Y Shares | | | -18.45 | |
Class R5 Shares | | | -18.33 | |
Class R6 Shares | | | -18.20 | |
Bloomberg Commodity Indexq(Broad Market/Style-Specific Index) | | | -25.72 | |
Source(s): q Bloomberg LP
Market conditions and your Fund
The fiscal year ended October 31, 2015, was a difficult period for commodities with all four complexes – agriculture, energy, precious metals and industrial metals – posting negative results. The Fund’s performance for the reporting period was also negative. The Fund invests with a long bias in these four commodity complexes and makes tactical adjustments on a monthly basis to try and take advantage of short-term market dynamics. Tactical positioning within energy, industrial metals and precious metals obtained through the use of swaps and futures contributed to Fund performance for the reporting period.
The fiscal year began with a decline in commodity prices led by a sharp fall in oil prices and continued across the four previously mentioned primary commodity complexes. Energy losses intensified through the end of 2014 as OPEC decided to maintain current production levels. Industrial metals fell on weaker Chinese economic data while precious metals struggled against low inflation and the advancing US dollar. Agriculture supply levels remained suficient to keep prices
suppressed through the end of 2014. Commodities continued to fall in the first quarter of 2015 due to ongoing strength in the US dollar, high oil supply levels and concerns over the outlook for global growth. Prices in three of the four commodity complexes declined, with precious metals being the only contributor to Fund performance for the first quarter of 2015. The uninterrupted advance in the US dollar weighed on demand for US grain exports, which hurt agricultural prices. Energy-related commodities still struggled from surging US oil production and inventories. Industrial metals were weighed down by declining gross domestic product growth in China. Given this backdrop, the Fund’s tactical exposure obtained through the use of derivatives, mainly futures and swaps, benefited Fund results for the first quarter of 2015 due to a defensive posture across all commodity complexes.
Commodity prices finally generated positive returns during the second quarter of 2015 as the US dollar returned some of its first quarter gains. Results were mixed across the four primary commodity complexes, with energy and
agriculture-related commodities ending the quarter with higher prices, while industrial and precious metals prices declined. Energy-related commodities, which rallied strongly in April 2015, benefited from a slowing rig count in the US and military conflict between Saudi Arabia and Yemen. Agriculture-related commodities advanced on a late-quarter rally driven by a softening supply glut and fears that the El Nino weather phenomenon could have wreaked havoc in the summer, therefore negatively impacting crop yield. Industrial metals were weighed down by concerns over the Chinese economy, while precious metals were pressured by higher interest rates and also failed to benefit from potential safe-haven demand. The Fund’s tactical exposure obtained through the use of derivatives, mainly futures and swaps, detracted from Fund results in the second quarter of 2015 due to strong price reversals inter-quarter across all commodity complexes.
The bear market in commodities returned in earnest during the third quarter of 2015 as the Bloomberg Commodity Index reached a multi-decade low. Concerns over China’s economy (the biggest consumer of grains) slowing, the decline in energy and industrial and precious metals commodity markets, and the direction of US interest rates put pressure on the commodity asset class. All four complexes finished the third quarter of 2015 with losses. The decline in energy-related commodities was primarily due to bloated inventories and rising production. Agriculture-related commodities were weighed down by US dollar strength and optimistic harvest forecasts, while industrial metals fell in concert with weaker Chinese economic growth and China’s plunging stock market. Precious metals, more specifically gold, failed to deliver on their perceived safe-haven allure and were further pressured by the strength of the US dollar. The Fund’s tactical exposure achieved
| | | | |
Target Risk Allocation and Notional Asset Weights as of 10/31/15 |
By commodity sector | | |
| Commodity Sector | | Target Risk
Allocation* | | Notional Asset
Weights** |
Agriculture | | 34.18% | | 28.90% |
Energy | | 28.03 | | 18.19 |
Industrial Metals | | 16.86 | | 15.01 |
Precious Metals | | 20.93 | | 19.57 |
Total | | 100.00 | | 81.67 |
| * | Reflects the risk that each commodity sector is expected to contribute to the overall risk of the Fund as measured by standard deviation and estimates of risk based on historical data. Standard deviation measures the annualized fluctuations (volatility) of monthly returns. |
| ** | Proprietary models determine the Notional Asset Weights necessary to achieve the Target Risk Allocations. Total Notional Asset Weight greater than 100% is achieved through derivatives and other instruments that create leverage. |
| | | | |
Total Net Assets | | $ | 632.8 million | |
4 Invesco Balanced-Risk Commodity Strategy Fund
through the use of derivatives, mainly futures and swaps, was favorable for the third quarter of 2015 due to underweight exposures across the four commodity complexes.
The Fund finished the fiscal year with a modest decline in October 2015. Commodities continued to be weighed down by dollar strength, excess supplies and concerns over the Chinese economy. The Fund’s style-specific index was down 25.72% for the fiscal year ended October 31, 2015, posting the longest slide on record for the index dating to 1991. Results were mixed across the four primary commodity complexes – agriculture, energy, precious metals and industrial metals – in the final month of the Fund’s fiscal year with industrial metals being the primary detractor from Fund performance. Energy-related commodities declined, led by natural gas erasing any positive price performance seen from West Texas Intermediate and Brent crude oil prices that also detracted from Fund performance. Agriculture-related commodity prices were positive due to a rally in sugar and cotton, while precious metals prices were supported by dovish comments from the US Federal Reserve. Strategic positioning in these complexes helped Fund performance.
Please note that our strategy is principally implemented with derivative instruments that include futures, total return swaps and commodity linked-notes. Therefore, all or most of the performance of the Fund, both positive and negative, can be attributed to these instruments. Derivatives can be a cost-effective way to gain exposure to asset classes. However, derivatives may amplify traditional investment risks through the creation of leverage and may be less liquid than traditional securities.
Thank you for your continued commitment to Invesco Balanced-Risk Commodity Strategy Fund.
The views and opinions expressed in management’s discussion of Fund performance are those of Invesco Advisers, Inc. These views and opinions are subject to change at any time based on factors such as market and economic conditions. These views and opinions may not be relied upon as investment advice or recommendations, or as an offer for a particular security. The information is not a complete analysis of every aspect of any market, country, industry, security or the Fund. Statements of fact are from sources considered reliable, but Invesco Advisers, Inc. makes no representation or warranty as to their completeness or accuracy. Although historical performance is no guarantee of future results, these insights may help you understand our investment management philosophy.
See important Fund and, if applicable, index disclosures later in this report.
| | |
 | | Mark Ahnrud Chartered Financial Analyst, Portfolio Manager, is lead manager of Invesco Balanced-Risk |
| Commodity Strategy Fund. He joined Invesco in 2000. Mr. Ahnrud earned a BS in finance and investments from Babson College and an MBA from Duke University Fuqua School of Business. |
| |
 | | Chris Devine Chartered Financial Analyst, Portfolio Manager, is manager of Invesco Balanced-Risk Commodity |
| Strategy Fund. He joined Invesco in 1998. Mr. Devine earned a BA in economics from Wake Forest University and an MBA from the University of Georgia. |
| |
 | | Scott Hixon Chartered Financial Analyst, Portfolio Manager, is manager of Invesco Balanced-Risk Commodity |
| Strategy Fund. He joined Invesco in 1994. Mr. Hixon earned a BBA in finance from Georgia Southern University and an MBA from Georgia State University. |
| |
 | | Christian Ulrich Chartered Financial Analyst, Portfolio Manager, is manager of Invesco Balanced-Risk Commodity |
| Strategy Fund. He joined Invesco in 2000. Mr. Ulrich earned the equivalent of a BBA from the KV Zurich Business School in Zurich, Switzerland. |
| |

| | Scott Wolle Chartered Financial Analyst, Portfolio Manager, is manager of Invesco Balanced-Risk Commodity |
Strategy Fund. He joined Invesco in 1999. Mr. Wolle earned a BS in finance from Virginia Polytechnic Institute and State University and an MBA from Duke University Fuqua School of Business. |
| Assisted by the Invesco Global Asset Allocation Team |
5 Invesco Balanced-Risk Commodity Strategy Fund
Your Fund’s Long-Term Performance
Results of a $10,000 Investment – Oldest Share Class(es) Since Inception
Fund and index data from 11/30/10
Past performance cannot guarantee comparable future results.
The data shown in the chart include reinvested distributions, applicable sales charges and Fund expenses including management fees. Results for Class B shares are calculated as if a hypothetical
shareholder had liquidated his entire investment in the Fund at the close of the reporting period and paid the contingent deferred sales charges, if applicable. Index results include reinvested dividends, but they do not reflect sales charges. Performance of the peer group,
if applicable, reflects fund expenses and management fees; performance of a market index does not. Performance shown in the chart and table(s) does not reflect deduction of taxes a shareholder would pay on Fund distributions or sale of Fund shares.
6 Invesco Balanced-Risk Commodity Strategy Fund
| | | | |
| Average Annual Total Returns | |
As of 10/31/15, including maximum applicable sales charges | |
| |
Class A Shares | | | | |
Inception (11/30/10) | | | -9.07 | % |
1 Year | | | -23.15 | |
Class B Shares | | | | |
Inception (11/30/10) | | | -9.04 | % |
1 Year | | | -23.27 | |
Class C Shares | | | | |
Inception (11/30/10) | | | -8.70 | % |
1 Year | | | -20.07 | |
Class R Shares | | | | |
Inception (11/30/10) | | | -8.21 | % |
1 Year | | | -18.90 | |
| |
Class Y Shares | | | | |
Inception (11/30/10) | | | -7.74 | % |
1 Year | | | -18.45 | |
Class R5 Shares | | | | |
Inception (11/30/10) | | | -7.71 | % |
1 Year | | | -18.33 | |
Class R6 Shares | | | | |
Inception | | | -7.82 | % |
1 Year | | | -18.20 | |
Class R6 shares incepted on September 24, 2012. Performance shown prior to that date is that of Class A shares and includes the 12b-1 fees applicable to Class A shares.
The performance data quoted represent past performance and cannot guarantee comparable future results; current performance may be lower or higher. Please visit invesco.com/performance for the most recent month-end performance. Performance figures reflect reinvested distributions, changes in net asset value and the effect of the maximum sales charge unless otherwise stated. Investment return and principal value will fluctuate so that you may have a gain or loss when you sell shares.
The net annual Fund operating expense ratio set forth in the most recent Fund prospectus as of the date of this report for Class A, Class B, Class C, Class R, Class Y, Class R5 and Class R6 shares was 1.57%, 2.32%, 2.32%, 1.82%, 1.32%, 1.19% and 1.10%, respectively.1 The total annual Fund operating expense ratio set forth in the most recent Fund prospectus as of the date of this report for Class A, Class B, Class C, Class R, Class Y, Class R5 and Class R6 shares was 1.62%, 2.37%, 2.37%, 1.87%, 1.37%,
| | | | |
| Average Annual Total Returns | |
| As of 9/30/15, the most recent calendar quarter end, including maximum applicable sales charges | |
| |
Class A Shares | | | | |
Inception (11/30/10) | | | -9.43 | % |
1 Year | | | -23.34 | |
Class B Shares | | | | |
Inception (11/30/10) | | | -9.40 | % |
1 Year | | | -23.63 | |
Class C Shares | | | | |
Inception (11/30/10) | | | -9.05 | % |
1 Year | | | -20.44 | |
| |
Class R Shares | | | | |
Inception (11/30/10) | | | -8.56 | % |
1 Year | | | -19.27 | |
Class Y Shares | | | | |
Inception (11/30/10) | | | -8.07 | % |
1 Year | | | -18.71 | |
Class R5 Shares | | | | |
Inception (11/30/10) | | | -8.04 | % |
1 Year | | | -18.59 | |
Class R6 Shares | | | | |
Inception | | | -8.18 | % |
1 Year | | | -18.69 | |
1.24% and 1.15%, respectively. The expense ratios presented above may vary from the expense ratios presented in other sections of this report that are based on expenses incurred during the period covered by this report.
Class A share performance reflects the maximum 5.50% sales charge, and Class B and Class C share performance reflects the applicable contingent deferred sales charge (CDSC) for the period involved. The CDSC on Class B shares declines from 5% beginning at the time of purchase to 0% at the beginning of the seventh year. The CDSC on Class C shares is 1% for the first year after purchase. Class R, Class Y, Class R5 and Class R6 shares do not have a front-end sales charge or a CDSC; therefore, performance is at net asset value.
The performance of the Fund’s share classes will differ primarily due to different sales charge structures and class expenses.
Fund performance reflects any applicable fee waivers and/or expense reimbursements. Had the adviser not waived fees and/or reimbursed expenses currently or in the past, returns would have been lower. See current prospectus for more information.
| 1 | Total annual Fund operating expenses after any contractual fee waivers and/or expense reimbursements by the adviser in effect through at least June 30, 2017. See current prospectus for more information. |
7 Invesco Balanced-Risk Commodity Strategy Fund
Invesco Balanced-Risk Commodity Strategy Fund’s investment objective is to provide total return.
| n | | Unless otherwise stated, information presented in this report is as of October 31, 2015, and is based on total net assets. |
| n | | Unless otherwise noted, all data provided by Invesco. |
| n | | To access your Fund’s reports/prospectus, visit invesco.com/fundreports. |
About share classes
| n | | Class B shares may not be purchased for new or additional investments. Please see the prospectus for more information. |
| n | | Class R shares are generally available only to employer sponsored retirement and benefit plans. Please see the prospectus for more information. |
| n | | Class Y shares are available only to certain investors. Please see the prospectus for more information. |
| n | | Class R5 shares and Class R6 shares are primarily intended for employer sponsored retirement and benefit plans that meet certain standards and for institutional investors. Please see the prospectus for more information. |
Principal risks of investing
in the Fund
| n | | Commodities tax risk. The tax treatment of commodity-linked derivative instruments may be adversely affected by changes in legislation, regulations or other legally binding authority. If, as a result of any such adverse action, the income of the Fund from certain commodity-linked derivatives was treated as non-qualifying income, the Fund might fail to qualify as a regulated investment company and be subject to federal income tax at the Fund level. The Fund has received a private letter ruling from the Internal Revenue Service confirming that income derived from the Fund’s investment in a form of commodity-linked note constitutes qualifying income to the Fund. The Fund also has applied to the IRS for a private letter ruling relating to the Subsidiary. The Internal Revenue Service has issued a number of similar letter rulings, including to another Invesco fund (upon which only the fund that received the private letter ruling can rely), which indicate that income from a mutual fund’s investment in a wholly owned foreign subsidiary that invests in commodity- linked derivatives, such as the Subsidiary, constitutes qualifying income. However, the Internal Revenue Service suspended issuance in July 2011 of any further private letter rulings pending a review of its position. Should the |
Internal Revenue Service issue guidance, or Congress enact legislation, that adversely affects the tax treatment of the Fund’s use of commodity-linked notes or the Subsidiary (which guidance might be applied retroactively to the Fund’s investment in the Subsidiary), it could limit the Fund’s ability to pursue its investment strategy and the Fund might not qualify as a regulated investment company for one or more years. In this event, the Fund’s Board of Trustees may authorize a significant change in investment strategy or Fund liquidation. The Fund also may incur transaction and other costs to comply with any new or additional guidance from the Internal Revenue Service.
| n | | Commodity-linked notes risk. The Fund’s investments in commodity-linked notes may involve substantial risks, including risk of loss of a significant portion of their principal value. In addition to risks associated with the underlying commodities, they may be subject to additional special risks, such as the lack of a secondary trading market and temporary price distortions due to speculators and/or the continuous rolling over of futures contracts underlying the notes. Commodity-linked notes are also subject to counterparty risk, which is the risk that the other party to the contract will not fulfill its contractual obligation to complete the transaction with the Fund. |
| n | | Commodity risk. The Fund will concentrate its investments in commodities markets. The Fund’s significant investment exposure to the commodities markets and/or a particular sector of the commodities markets, which may subject the Fund to greater volatility than investments in traditional securities, such as stocks and bonds. The commodities markets may fluctuate widely based on a variety of factors, including changes in overall market movements, domestic and foreign political and economic events and policies, war, acts of terrorism, changes in domestic or foreign interest rates and/ or investor expectations concerning interest rates, domestic and foreign inflation rates and investment and trading activities of mutual funds, hedge funds |
and commodities funds. Prices of various commodities may also be affected by factors such as drought, floods, weather, livestock disease, embargoes, tariffs and other regulatory developments. The prices of commodities can also fluctuate widely due to supply and demand disruptions in major producing or consuming regions. Because the Fund’s performance is linked to the performance of potentially volatile commodities, investors should be willing to assume the risks of potentially significant fluctuations in the value of the Fund’s shares.
| n | | Correlation risk. Changes in the value of two investments or asset classes may not track or offset each other in the manner anticipated by the portfolio managers. Because the Fund’s investment strategy seeks to balance risk across the four sectors of the commodities markets and, within each commodity sector, to balance risk across different commodities, to the extent either the four sectors of the commodities markets or the selected commodities are correlated in a way not anticipated by the portfolio managers the Fund’s risk allocation process may not succeed in achieving its investment objective. |
| n | | Credit risk. The issuer of instruments in which the Fund invests may be unable to meet interest and/or principal payments, thereby causing its instruments to decrease in value and lowering the issuer’s credit rating. |
| n | | Derivatives risk. The value of a derivative instrument depends largely on (and is derived from) the value of an underlying security, currency, commodity, interest rate, index or other asset (each referred to as an underlying asset). In addition to risks relating to the underlying assets, the use of derivatives may include other, possibly greater, risks, including counterparty, leverage and liquidity risks. Counterparty risk is the risk that the counterparty to the derivative contract will default on its obligation to pay the Fund the amount owed or otherwise perform under the derivative contract. Derivatives create leverage risk because they do not require payment up front equal to the economic exposure created by owning the derivative. As a result, an adverse change in the value of the underlying asset could result in the Fund sustaining a loss that is substantially greater than the amount invested in the derivative, which may make the Fund’s returns more volatile and |
|
This report must be accompanied or preceded by a currently effective Fund prospectus, which contains more complete information, including sales charges and expenses. Investors should read it carefully before investing. |
|
NOT FDIC INSURED | MAY LOSE VALUE | NO BANK GUARANTEE |
8 Invesco Balanced-Risk Commodity Strategy Fund
increase the risk of loss. Derivative instruments may also be less liquid than more traditional investments and the Fund may be unable to sell or close out its derivative positions at a desirable time or price. This risk may be more acute under adverse market conditions, during which the Fund may be most in need of liquidating its derivative positions. Derivatives may also be harder to value, less tax efficient and subject to changing government regulation that could impact the Fund’s ability to use certain derivatives or their cost. Also, derivatives used for hedging or to gain or limit exposure to a particular market segment may not provide the expected benefits, particularly during adverse market conditions. These risks are greater for the Fund than most other mutual funds because the Fund will implement its investment strategy primarily through derivative instruments rather than direct investments in stocks and bonds.
| n | | Exchange-traded funds risk. An investment by the Fund in exchange-traded funds generally presents the same primary risks as an investment in a mutual fund. In addition, an exchange-traded fund may be subject to the following: (1) a discount of the exchange-traded fund’s shares to its net asset value; (2) failure to develop an active trading market for the exchange-traded fund’s shares; (3) the listing exchange halting trading of the exchange-traded fund’s shares; (4) failure of the exchange-traded fund’s shares to track the referenced asset; and (5) holding troubled securities in the referenced index or basket of investments. Investments in exchange-traded funds may involve duplication of management fees and certain other expenses, as the Fund indirectly bears its proportionate share of any expenses paid by the exchange-traded funds in which it invests. Further, certain of the exchange-traded funds in which the Fund may invest are leveraged. The more the Fund invests in such leveraged exchange-traded funds, the more this leverage will magnify any losses on those investments. |
| n | | Exchange-traded notes risk. Exchange-traded notes are subject to credit risk, including the credit risk of the issuer, and the value of the exchange-traded note may drop due to a downgrade in the issuer’s credit rating, despite the underlying market benchmark or strategy remaining unchanged. The value of |
an exchange-traded note may also be influenced by time to maturity, level of supply and demand for the exchange-traded note, volatility and lack of liquidity in the underlying market, changes in the applicable interest rates, changes in the issuer’s credit rating, and economic, legal, political, or geographic events that affect the referenced underlying market or strategy. Exchange-traded notes are also subject to the risk that the other party to the contract will not fulfill its contractual obligations, which may cause losses or additional costs to the Fund.
| n | | Interest rate risk. Interest rate risk refers to the risk that bond prices generally fall as interest rates rise; conversely, bond prices generally rise as interest rates fall. Specific bonds differ in their sensitivity to changes in interest rates depending on their individual characteristics, including duration. |
| n | | Liquidity risk. The Fund may hold illiquid securities that it is unable to sell at the preferred time or price and could lose its entire investment in such securities. The Fund’s significant use of derivative instruments may cause liquidity risk to be greater than other mutual funds that invest in more traditional assets such as stocks and bonds, which trade on markets with more market participants. |
| n | | Management risk. The investment techniques and risk analysis used by the Fund’s portfolio managers may not produce the desired results. Because the Fund’s investment process relies heavily on its asset allocation process, market movements that are counter to the portfolio managers’ expectations may have a significant adverse effect on the Fund’s net asset value. Further, the portfolio managers’ use of short derivative positions and instruments that provide economic leverage increases the volatility of the Fund’s net asset value, which increases the potential of greater losses that may cause the Fund to liquidate positions when it may not be advantageous to do so. |
| n | | Market risk. The prices of and the income generated by the Fund’s securities may decline in response to, among other things, investor sentiment, general economic and market conditions, regional or global instability, and currency and interest rate fluctuations. |
| n | | Subsidiary risk. By investing in the Subsidiary, the Fund is indirectly exposed to risks associated with the Subsidiary’s |
investments. The Subsidiary is not registered under the Investment Company Act of 1940, as amended (1940 Act), and, except as otherwise noted in this prospectus is not subject to the investor protections of the 1940 Act. Changes in the laws of the United States and/or the Cayman Islands, under which the Fund and the Subsidiary, respectively, are organized, could result in the inability of the Fund and/or the Subsidiary to operate as described in this prospectus and could negatively affect the Fund and its shareholders.
| n | | US government obligations risk. The Fund may invest in obligations issued by US government agencies and instrumentalities that may receive varying levels of support from the government, which could affect the Fund’s ability to recover should they default. |
| n | | Volatility risk. The Fund may have investments that appreciate or decrease significantly in value over short periods of time. This may cause the Fund’s net asset value per share to experience significant increases or declines in value over short periods of time. |
About indexes used in this report
| n | | The Bloomberg Commodity Index is an unmanaged index designed to be a highly liquid and diversified benchmark for the commodity futures market. |
| n | | The Fund is not managed to track the performance of any particular index, including the index(es) described here, and consequently, the performance of the Fund may deviate significantly from the performance of the index(es). |
| n | | A direct investment cannot be made in an index. Unless otherwise indicated, index results include reinvested dividends, and they do not reflect sales charges. Performance of the peer group, if applicable, reflects fund expenses; performance of a market index does not. |
Other information
| n | | The returns shown in management’s discussion of Fund performance are based on net asset values (NAVs) calculated for shareholder transactions. Generally accepted accounting principles require adjustments to be made to the net assets of the Fund at period end for financial reporting purposes, and as such, the NAVs for shareholder transactions and the returns based on those NAVs may differ from the NAVs and returns reported in the Financial Highlights. |
9 Invesco Balanced-Risk Commodity Strategy Fund
Consolidated Schedule of Investments
October 31, 2015
| | | | | | | | | | | | | | | | |
| | | Interest
Rate | | | Maturity
Date | | | Principal
Amount | | | Value | |
U.S. Treasury Securities–65.06% | | | | | | | | | | | | | | | | |
| U.S. Treasury Bills–26.28%(a) | | | | | | | | | | | | | | | | |
U.S. Treasury Bills(b)(c) | | | 0.08 | % | | | 01/07/16 | | | $ | 8,400,000 | | | $ | 8,399,075 | |
U.S. Treasury Bills(b)(c) | | | 0.10 | % | | | 01/14/16 | | | | 20,600,000 | | | | 20,596,863 | |
U.S. Treasury Bills | | | 0.10 | % | | | 01/14/16 | | | | 12,600,000 | | | | 12,598,082 | |
U.S. Treasury Bills(b)(d) | | | 0.13 | % | | | 01/21/16 | | | | 11,760,000 | | | | 11,758,299 | |
U.S. Treasury Bills(b)(d) | | | 0.14 | % | | | 01/28/16 | | | | 10,550,000 | | | | 10,548,086 | |
U.S. Treasury Bills | | | 0.14 | % | | | 01/28/16 | | | | 43,060,000 | | | | 43,052,187 | |
U.S. Treasury Bills(b)(d) | | | 0.24 | % | | | 03/03/16 | | | | 6,440,000 | | | | 6,438,034 | |
U.S. Treasury Bills | | | 0.24 | % | | | 03/03/16 | | | | 31,950,000 | | | | 31,940,246 | |
U.S. Treasury Bills(b) | | | 0.26 | % | | | 03/10/16 | | | | 2,210,000 | | | | 2,209,286 | |
U.S. Treasury Bills(b) | | | 0.25 | % | | | 03/17/16 | | | | 4,090,000 | | | | 4,088,531 | |
U.S. Treasury Bills | | | 0.25 | % | | | 03/17/16 | | | | 14,680,000 | | | | 14,674,727 | |
| | | | | | | | | | | | | | | | 166,303,416 | |
| | | | |
| U.S. Treasury Notes–38.78% | | | | | | | | | | | | | | | | |
U.S. Treasury Notes(b)(c)(e) | | | 0.07 | % | | | 01/31/16 | | | | 15,410,000 | | | | 15,411,004 | |
U.S. Treasury Notes(e) | | | 0.07 | % | | | 01/31/16 | | | | 62,880,000 | | | | 62,884,095 | |
U.S. Treasury Notes(b)(c)(e) | | | 0.09 | % | | | 04/30/16 | | | | 16,180,000 | | | | 16,182,004 | |
U.S. Treasury Notes(e) | | | 0.09 | % | | | 04/30/16 | | | | 95,510,000 | | | | 95,521,830 | |
U.S. Treasury Notes(b)(e) | | | 0.09 | % | | | 07/31/16 | | | | 11,450,000 | | | | 11,451,056 | |
U.S. Treasury Notes(e) | | | 0.09 | % | | | 07/31/16 | | | | 43,910,000 | | | | 43,914,049 | |
| | | | | | | | | | | | | | | | 245,364,038 | |
Total U.S. Treasury Securities (Cost $411,605,732) | | | | | | | | | | | | | | | 411,667,454 | |
| | | | |
| | | | | | | | | Shares | | | | |
Exchange Traded Funds–3.16% | | | | | | | | | | | | | | | | |
PowerShares DB Gold Fund (Cost $28,384,102)(f) | | | | | | | | | | | 535,000 | | | | 20,009,000 | |
| | | | |
| | | | | | Expiration
Date | | | Principal
Amount | | | | |
Commodity-Linked Securities–2.39% | | | | | | | | | | | | | | | | |
Barclays Bank PLC (United Kingdom), Series B, U.S. Federal Funds (Effective) rate minus 0.06% (linked to the Barclays Diversified Energy-Metals TR Index, multiplied by 3) (Cost $16,800,000)(g) | | | | | | | 09/06/16 | | | $ | 16,800,000 | | | | 15,146,112 | |
| | | | |
| | | | | | | | | Shares | | | | |
Money Market Funds–29.31% | | | | | | | | | | | | | | | | |
Liquid Assets Portfolio–Institutional Class, 0.16%(h) | | | | | | | | | | | 76,179,240 | | | | 76,179,240 | |
Premier Portfolio–Institutional Class, 0.12%(h) | | | | | | | | | | | 76,179,240 | | | | 76,179,240 | |
STIC (Global Series) PLC–U.S. Dollar Liquidity Portfolio (Ireland)–Institutional Class, 0.11%(b)(h) | | | | | | | | | | | 33,100,637 | | | | 33,100,637 | |
Total Money Market Funds (Cost $185,459,117) | | | | | | | | | | | | | | | 185,459,117 | |
TOTAL INVESTMENTS–99.92% (Cost $642,248,951) | | | | | | | | | | | | | | | 632,281,683 | |
OTHER ASSETS LESS LIABILITIES–0.08% | | | | | | | | | | | | | | | 481,361 | |
NET ASSETS–100.00% | | | | | | | | | | | | | | $ | 632,763,044 | |
See accompanying Notes to Consolidated Financial Statements which are an integral part of the financial statements.
10 Invesco Balanced-Risk Commodity Strategy Fund
| | | | | | | | | | | | | | | | | | | | | | |
| Open Futures Contracts | |
| Futures Contracts | | Type of
Contract | | | | | Number of
Contracts | | | Expiration
Month | | | Notional
Value | | | Unrealized
Appreciation
(Depreciation) | |
Coffee C(b) | | | Long | | | | | | 152 | | | | December-2015 | | | $ | 6,894,150 | | | $ | (936,003 | ) |
Corn(b) | | | Long | | | | | | 473 | | | | December-2015 | | | | 9,040,212 | | | | (729,476 | ) |
Cotton No. 2(b) | | | Long | | | | | | 726 | | | | December-2015 | | | | 22,985,160 | | | | (689,044 | ) |
LME Nickel(b) | | | Short | | | | | | 109 | | | | December-2015 | | | | (6,571,719 | ) | | | (181,823 | ) |
LME Zinc(b) | | | Short | | | | | | 186 | | | | December-2015 | | | | (7,908,488 | ) | | | 500,761 | |
Natural Gas(b) | | | Long | | | | | | 1,125 | | | | December-2015 | | | | 6,527,813 | | | | (2,116,219 | ) |
NYH RBOB Gasoline (Globex)(b) | | | Long | | | | | | 550 | | | | December-2015 | | | | 31,683,960 | | | | 2,075,337 | |
Soybean(b) | | | Long | | | | | | 865 | | | | July-2016 | | | | 38,935,812 | | | | 112,890 | |
Wheat(b) | | | Long | | | | | | 348 | | | | December-2015 | | | | 9,082,800 | | | | (789,036 | ) |
Total Futures Contracts — Commodity Risk | | | $ | (2,752,613 | ) |
| | | | | | |
| | | | | | | | | | | | | | | | | | | | | | |
| Open Over-The-Counter Total Return Swap Agreements | |
| Swap Agreements | | Type of
Contract | | | Counterparty | | Number of
Contracts | | | Termination
Date | | | Notional
Value | | | Unrealized
Appreciation
(Depreciation) | |
Receive a return equal to the Barclays Brent Crude Roll Yield Excess Return Index and pay the product of (i) 0.35% of the Notional Amount multiplied by (ii) days in the period divided by 365(b) | | | Long | | | Barclays Bank PLC | | | 69,200 | | | | March-2016 | | | $ | 21,220,803 | | | $ | 219,233 | |
Receive a return equal to the Barclays WTI Crude Roll Yield Excess Return Index and pay the product of (i) 0.35% of the Notional Amount multiplied by (ii) days in the period divided by 365(b) | | | Long | | | Barclays Bank PLC | | | 64,500 | | | | March-2016 | | | | 16,719,600 | | | | 80,606 | |
Receive a return equal to the Optimum GSCI Heating Oil Roll Yield 9m Excess Return Index and pay the product of (i) 0.37% of the Notional Amount multiplied by (ii) days in the period divided by 365(b) | | | Long | | | Barclays Bank PLC | | | 18,900 | | | | February-2016 | | | | 4,683,025 | | | | 4,509 | |
Receive a floating rate equal to the Optimum GSCI Live Cattle Roll Yield Excess Return Index and pay the product of (i) 0.47% of the Notional Amount multiplied by (ii) days in the period divided by 365(b) | | | Short | | | Barclays Bank PLC | | | 30,500 | | | | January-2016 | | | | (4,163,531 | ) | | | (118,965 | ) |
Pay/Receive a return equal to the Enhanced Strategy Cotton AB31 on the S&P GSCI Cotton Excess Return Index and pay the product of (i) 0.45% of the Notional Amount multiplied by (ii) days in the period divided by 365(b) | | | Long | | | Goldman Sachs International | | | 73,000 | | | | October-2016 | | | | 2,536,270 | | | | 42,988 | |
Receive a return equal to the Enhanced Strategy Sugar A141 on the S&P GSCI Sugar Excess Return Index and pay the product of (i) 0.37% of the Notional Amount multiplied by (ii) days in the period divided by 365(b) | | | Long | | | Goldman Sachs International | | | 154,500 | | | | March-2016 | | | | 32,523,749 | | | | 0 | |
Pay/Receive a floating rate equal to the S&P GSCI Brent Crude 1 Month Forward Index Excess Return and pay the product of (i) 0.12% of the Notional Amount multiplied by (ii) days in the period divided by 365(b) | | | Short | | | Goldman Sachs International | | | 13,600 | | | | June-2016 | | | | (7,696,028 | ) | | | 0 | |
Receive a return equal to the S&P GSCI Crude Oil 1 Month Forward Index Excess Return and pay the product of (i) 0.12% of the Notional Amount multiplied by (ii) days in the period divided by 365(b) | | | Long | | | Goldman Sachs International | | | 62,600 | | | | April-2016 | | | | 17,075,070 | | | | 0 | |
Receive a return equal to the S&P GSCI Gasoil 1 Month Forward Index Excess Return and pay the product of (i) 0.12% of the Notional Amount multiplied by (ii) days in the period divided by 365(b) | | | Long | | | Goldman Sachs International | | | 14,450 | | | | April-2016 | | | | 6,667,058 | | | | 0 | |
Pay/Receive a floating rate equal to the S&P GSCI Heating Oil 1 Month Forward Index Excess Return and pay the product of (i) 0.12% of the Notional Amount multiplied by (ii) days in the period divided by 365(b) | | | Short | | | Goldman Sachs International | | | 46,500 | | | | June-2016 | | | | (11,037,552 | ) | | | 0 | |
See accompanying Notes to Consolidated Financial Statements which are an integral part of the financial statements.
11 Invesco Balanced-Risk Commodity Strategy Fund
| | | | | | | | | | | | | | | | | | | | | | |
| Swap Agreements | | Type of
Contract | | | Counterparty | | Number of
Contracts | | | Termination
Date | | | Notional
Value | | | Unrealized
Appreciation
(Depreciation) | |
Pay/Receive a floating rate equal to the S&P GSCI Unleaded Gasoline 1 Month Forward Index Excess Return and pay the product of (i) 0.12% of the Notional Amount multiplied by (ii) days in the period divided by 365(b) | | | Short | | | Goldman Sachs International | | | 5,800 | | | | April-2016 | | | $ | (4,612,659 | ) | | $ | 0 | |
Receive a return equal to the S&P GSCI Soybean Meal Excess Return Index and pay the product of (i) 0.30% of the Notional Amount multiplied by (ii) days in the period divided by 365(b) | | | Long | | | Goldman Sachs International | | | 37,050 | | | | September-2016 | | | | 41,597,591 | | | | (285,025 | ) |
Receive a return equal to the J.P. Morgan Contag Beta Gas Oil Excess Return Index and pay the product of (i) 0.25% of the Notional Amount multiplied by (ii) days in the period divided by 365(b) | | | Long | | | JPMorgan Chase Bank, N.A. | | | 11,400 | | | | April-2016 | | | | 2,602,596 | | | | 60,794 | |
Receive a return equal to the S&P GSCI Gold Index Excess Return and pay the product of (i) 0.09% of the Notional Amount multiplied by (ii) days in the period divided by 365(b) | | | Long | | | JPMorgan Chase Bank, N.A. | | | 464,500 | | | | October-2016 | | | | 45,278,531 | | | | (959,100 | ) |
Receive a return equal to the Macquarie Single Commodity Silver type A Excess Return Index and pay the product of (i) 0.16% of the Notional Amount multiplied by (ii) days in the period divided by 365(b) | | | Long | | | Macquarie Bank Ltd. | | | 205,200 | | | | May-2016 | | | | 39,521,417 | | | | (839,863 | ) |
Receive a return equal to the Modified Macquarie Single Commodity Sugar type A Excess Return Index and pay the product of (i) 0.34% of the Notional Amount multiplied by (ii) days in the period divided by 365(b) | | | Long | | | Macquarie Bank Ltd. | | | 95,700 | | | | March-2016 | | | | 17,954,152 | | | | 122,640 | |
Receive a return equal to the Merrill Lynch Gold Excess Return Index and pay the product of (i) 0.14% of the Notional Amount multiplied by (ii) days in the period divided by 365(b) | | | Long | | | Merrill Lynch International | | | 50,300 | | | | June-2016 | | | | 7,521,530 | | | | 0 | |
Receive a return equal to the MLCX Aluminum Annual Excess Return Index and pay the product of (i) 0.28% of the Notional Amount multiplied by (ii) days in the period divided by 365(b) | | | Long | | | Merrill Lynch International | | | 487,800 | | | | September-2016 | | | | 42,221,305 | | | | 0 | |
Receive a return equal to the MLCX Dynamic Enhanced Copper Excess Return Index and pay the product of (i) 0.25% of the Notional Amount multiplied by (ii) days in the period divided by 365(b) | | | Long | | | Merrill Lynch International | | | 107,850 | | | | May-2016 | | | | 53,852,460 | | | | 0 | |
Receive a return equal to the MS Soybean Oil Dynamic Roll Index and pay the product of (i) 0.30% of the Notional Amount multiplied by (ii) days in the period divided by 365(b) | | | Long | | | Morgan Stanley Capital Services LLC | | | 47,000 | | | | April-2016 | | | | 6,424,374 | | | | (65,490 | ) |
Total Swap Agreements — Commodity Risk | | | | | | | | | | | | | | | | | | | | $ | (1,737,673 | ) |
Index Information:
| | |
| Barclays Diversified Energy-Metals Total Return Index | | – a basket of indices that provide exposure to various components of the energy and metals markets. The underlying commodities comprising the indices are: Gold, Silver, Copper, Brent Crude Oil, WTI Crude oil, Gasoil and Unleaded Gasoline. |
Notes to Consolidated Schedule of Investments:
| (a) | Security traded on a discount basis. The interest rate shown represents the discount rate at the time of purchase by the Fund. |
| (b) | The investment is owned by the Subsidiary. See Note 5. |
| (c) | All or a portion of the value was designated as collateral for open swap agreements. See Note 1K and Note 4. |
| (d) | All or a portion of the value was pledged as collateral to cover margin requirements for open futures contracts. See Note 1J and Note 4. |
| (e) | Interest or dividend rate is redetermined periodically. Rate shown is the rate in effect on October 31, 2015. |
| (f) | Affiliated company during the period. The Investment Company Act of 1940 defines an “affiliated person” as an issuance in which a fund holds 5% or more of the outstanding voting securities. The Fund has not owned enough of the outstanding voting securities of the issuer to have control (as defined in the Investment Company Act of 1940) of that issuer. The value of this security as of October 31, 2015 represented 3.16% of the Fund’s Net Assets. See Note 6. |
| (g) | Security purchased or received in transaction exempt from registration under the Securities Act of 1933, as amended (the “1933 Act”). The security may be resold pursuant to an exemption from registration under the 1933 Act, typically to qualified institutional buyers. The value of this security at October 31, 2015 represented 2.39% of the Fund’s Net Assets. |
| (h) | The money market fund and the Fund are affiliated by having the same investment adviser. The rate shown is the 7-day SEC standardized yield as of October 31, 2015. |
See accompanying Notes to Consolidated Financial Statements which are an integral part of the financial statements.
12 Invesco Balanced-Risk Commodity Strategy Fund
Consolidated Statement of Assets and Liabilities
October 31, 2015
| | | | |
Assets: | |
Investments, at value (Cost $428,405,732) | | $ | 426,813,566 | |
Investments in affiliates, at value (Cost $213,843,219) | | | 205,468,117 | |
Total investments, at value (Cost $642,248,951) | | | 632,281,683 | |
Receivable for: | | | | |
Variation margin — futures | | | 2,086,830 | |
Fund shares sold | | | 659,399 | |
Dividends and interest | | | 76,527 | |
Swaps receivables | | | 4,615,808 | |
Investment for trustee deferred compensation and retirement plans | | | 65,461 | |
Unrealized appreciation on swap agreements — OTC | | | 530,770 | |
Other assets | | | 49,099 | |
Total assets | | | 640,365,577 | |
|
Liabilities: | |
Payable for: | | | | |
Fund shares reacquired | | | 355,464 | |
Swaps payable | | | 4,585,856 | |
Accrued fees to affiliates | | | 232,125 | |
Accrued trustees’ and officers’ fees and benefits | | | 2,261 | |
Accrued other operating expenses | | | 20,893 | |
Trustee deferred compensation and retirement plans | | | 137,491 | |
Unrealized depreciation on swap agreements — OTC | | | 2,268,443 | |
Total liabilities | | | 7,602,533 | |
Net assets applicable to shares outstanding | | $ | 632,763,044 | |
|
Net assets consist of: | |
Shares of beneficial interest | | $ | 683,402,903 | |
Undistributed net investment income | | | 4,027,493 | |
Undistributed net realized gain (loss) | | | (40,209,798 | ) |
Net unrealized appreciation (depreciation) | | | (14,457,554 | ) |
| | | $ | 632,763,044 | |
| | | | |
Net Assets: | | | | |
Class A | | $ | 34,891,605 | |
Class B | | $ | 258,205 | |
Class C | | $ | 2,544,255 | |
Class R | | $ | 362,929 | |
Class Y | | $ | 217,527,537 | |
Class R5 | | $ | 259,674,355 | |
Class R6 | | $ | 117,504,158 | |
|
Shares outstanding, $0.01 par value per share,
with an unlimited number of shares authorized: | |
Class A | | | 5,337,979 | |
Class B | | | 40,754 | |
Class C | | | 402,146 | |
Class R | | | 55,982 | |
Class Y | | | 32,812,396 | |
Class R5 | | | 39,113,032 | |
Class R6 | | | 17,673,156 | |
Class A: | | | | |
Net asset value per share | | $ | 6.54 | |
Maximum offering price per share | | | | |
(Net asset value of $6.54 ¸ 94.50%) | | $ | 6.92 | |
Class B: | | | | |
Net asset value and offering price per share | | $ | 6.34 | |
Class C: | | | | |
Net asset value and offering price per share | | $ | 6.33 | |
Class R: | | | | |
Net asset value and offering price per share | | $ | 6.48 | |
Class Y: | | | | |
Net asset value and offering price per share | | $ | 6.63 | |
Class R5: | | | | |
Net asset value and offering price per share | | $ | 6.64 | |
Class R6: | | | | |
Net asset value and offering price per share | | $ | 6.65 | |
See accompanying Notes to Consolidated Financial Statements which are an integral part of the financial statements.
13 Invesco Balanced-Risk Commodity Strategy Fund
Consolidated Statement of Operations
For the year ended October 31, 2015
| | | | |
Investment income: | |
Dividends from affiliates | | $ | 141,208 | |
Interest | | | 370,775 | |
Total investment income | | | 511,983 | |
| |
Expenses: | | | | |
Advisory fees | | | 7,000,528 | |
Administrative services fees | | | 186,700 | |
Custodian fees | | | 19,642 | |
Distribution fees: | | | | |
Class A | | | 98,571 | |
Class B | | | 3,569 | |
Class C | | | 29,316 | |
Class R | | | 1,860 | |
Transfer agent fees — A, B, C, R and Y | | | 707,370 | |
Transfer agent fees — R5 | | | 270,115 | |
Trustees’ and officers’ fees and benefits | | | 37,353 | |
Other | | | 215,120 | |
Total expenses | | | 8,570,144 | |
Less: Fees waived and expense offset arrangement(s) | | | (301,230 | ) |
Net expenses | | | 8,268,914 | |
Net investment income (loss) | | | (7,756,931 | ) |
| |
Realized and unrealized gain (loss) from: | | | | |
Net realized gain (loss) from: | | | | |
Investment securities | | | (21,872,743 | ) |
Futures contracts | | | (11,235,378 | ) |
Swap agreements | | | (101,390,388 | ) |
| | | | (134,498,509 | ) |
Change in net unrealized appreciation (depreciation) of: | | | | |
Investment securities | | | 5,092,501 | |
Futures contracts | | | (9,694,025 | ) |
Swap agreements | | | 7,051,562 | |
| | | | 2,450,038 | |
Net realized and unrealized gain (loss) | | | (132,048,471 | ) |
Net increase (decrease) in net assets resulting from operations | | $ | (139,805,402 | ) |
See accompanying Notes to Consolidated Financial Statements which are an integral part of the financial statements.
14 Invesco Balanced-Risk Commodity Strategy Fund
Consolidated Statement of Changes in Net Assets
For the years ended October 31, 2015 and 2014
| | | | | | | | |
| | | 2015 | | | 2014 | |
Operations: | | | | | |
Net investment income (loss) | | $ | (7,756,931 | ) | | $ | (7,753,789 | ) |
Net realized gain (loss) | | | (134,498,509 | ) | | | (73,181,888 | ) |
Change in net unrealized appreciation (depreciation) | | | 2,450,038 | | | | (5,977,815 | ) |
Net increase (decrease) in net assets resulting from operations | | | (139,805,402 | ) | | | (86,913,492 | ) |
| | |
Share transactions–net: | | | | | | | | |
Class A | | | (4,063,412 | ) | | | (15,519,112 | ) |
Class B | | | (174,641 | ) | | | (497,940 | ) |
Class C | | | (420,247 | ) | | | (814,012 | ) |
Class R | | | 70,412 | | | | (84,233 | ) |
Class Y | | | 302,605 | | | | 49,824,052 | |
Class R5 | | | 44,452,063 | | | | 36,076,794 | |
Class R6 | | | 11,895,316 | | | | 21,545,333 | |
Net increase in net assets resulting from share transactions | | | 52,062,096 | | | | 90,530,882 | |
Net increase (decrease) in net assets | | | (87,743,306 | ) | | | 3,617,390 | |
| | |
Net assets: | | | | | | | | |
Beginning of year | | | 720,506,350 | | | | 716,888,960 | |
End of year (includes undistributed net investment income of $4,027,493 and $10,708,705, respectively) | | $ | 632,763,044 | | | $ | 720,506,350 | |
Notes to Consolidated Financial Statements
October 31, 2015
NOTE 1—Significant Accounting Policies
Invesco Balanced-Risk Commodity Strategy Fund (the “Fund”) is a series portfolio of AIM Investment Funds (Invesco Investment Funds) (the “Trust”). The Trust is organized as a Delaware statutory trust and is registered under the Investment Company Act of 1940, as amended (the “1940 Act”), as an open-end series management investment company consisting of twenty-four separate series portfolios, each authorized to issue an unlimited number of shares of beneficial interest. The assets, liabilities and operations of each portfolio are accounted for separately. Information presented in these consolidated financial statements pertains only to the Fund. Matters affecting each portfolio or class will be voted on exclusively by the shareholders of such portfolio or class.
The Fund will seek to gain exposure to the commodity markets primarily through investments in the Invesco Cayman Commodity Fund III Ltd. (the “Subsidiary”), a wholly-owned subsidiary of the Fund organized under the laws of the Cayman Islands. The Subsidiary was organized by the Fund to invest in commodity-linked derivatives. The Fund may invest up to 25% of its total assets in the Subsidiary.
The Fund’s investment objective is to provide total return.
The Fund currently consists of seven different classes of shares: Class A, Class B, Class C, Class R, Class Y, Class R5 and Class R6. Class A shares are sold with a front-end sales charge unless certain waiver criteria are met and under certain circumstances load waived shares may be subject to contingent deferred sales charges (“CDSC”). Class C shares are sold with a CDSC. Class R, Class Y, Class R5 and Class R6 shares are sold at net asset value. Effective November 30, 2010, new or additional investments in Class B shares are no longer permitted. Existing shareholders of Class B shares may continue to reinvest dividends and capital gains distributions in Class B shares until they convert to Class A shares. Also, shareholders in Class B shares will be able to exchange those shares for Class B shares of other Invesco Funds offering such shares until they convert to Class A shares. Generally, Class B shares will automatically convert to Class A shares on or about the month-end, which is at least eight years after the date of purchase. Redemption of Class B shares prior to the conversion date will be subject to a CDSC.
The following is a summary of the significant accounting policies followed by the Fund in the preparation of its consolidated financial statements.
| A. | Security Valuations — Securities, including restricted securities, are valued according to the following policy. |
Debt obligations (including convertible securities) and unlisted equities are fair valued using an evaluated quote provided by an independent pricing service. Evaluated quotes provided by the pricing service may be determined without exclusive reliance on quoted prices, and may reflect appropriate factors such as institution-size trading in similar groups of securities, developments related to specific securities, dividend rate (for unlisted equities), yield (for debt obligations), quality, type of issue, coupon rate (for debt obligations), maturity (for debt obligations), individual trading characteristics and other market data. Debt obligations are subject to interest rate and credit risks. In addition, all debt obligations involve some risk of default with respect to interest and/or principal payments.
A security listed or traded on an exchange (except convertible securities) is valued at its last sales price or official closing price as of the close of the customary trading session on the exchange where the security is principally traded, or lacking any sales or official closing price on a particular day, the security may be valued at the closing bid price on that day. Securities traded in the over-the-counter market are valued based on prices furnished by independent pricing services or market makers. When such securities are valued by an independent pricing service they may be considered fair valued. Futures contracts are valued at the final settlement price set by an exchange on which they are principally traded.
15 Invesco Balanced-Risk Commodity Strategy Fund
Listed options are valued at the mean between the last bid and asked prices from the exchange on which they are principally traded. Options not listed on an exchange are valued by an independent source at the mean between the last bid and asked prices. For purposes of determining net asset value (“NAV”) per share, futures and option contracts generally are valued 15 minutes after the close of the customary trading session of the New York Stock Exchange (“NYSE”).
Investments in open-end and closed-end registered investment companies that do not trade on an exchange are valued at the end-of-day net asset value per share. Investments in open-end and closed-end registered investment companies that trade on an exchange are valued at the last sales price or official closing price as of the close of the customary trading session on the exchange where the security is principally traded.
Swap agreements are fair valued using an evaluated quote, if available, provided by an independent pricing service. Evaluated quotes provided by the pricing service are valued based on a model which may include end-of-day net present values, spreads, ratings, industry, company performance and returns of referenced assets.
Foreign securities’ (including foreign exchange contracts) prices are converted into U.S. dollar amounts using the applicable exchange rates as of the close of the NYSE. If market quotations are available and reliable for foreign exchange-traded equity securities, the securities will be valued at the market quotations. Because trading hours for certain foreign securities end before the close of the NYSE, closing market quotations may become unreliable. If between the time trading ends on a particular security and the close of the customary trading session on the NYSE, events occur that the Adviser determines are significant and make the closing price unreliable, the Fund may fair value the security. If the event is likely to have affected the closing price of the security, the security will be valued at fair value in good faith using procedures approved by the Board of Trustees. Adjustments to closing prices to reflect fair value may also be based on a screening process of an independent pricing service to indicate the degree of certainty, based on historical data, that the closing price in the principal market where a foreign security trades is not the current value as of the close of the NYSE. Foreign securities’ prices meeting the approved degree of certainty that the price is not reflective of current value will be priced at the indication of fair value from the independent pricing service. Multiple factors may be considered by the independent pricing service in determining adjustments to reflect fair value and may include information relating to sector indices, American Depositary Receipts and domestic and foreign index futures. Foreign securities may have additional risks including exchange rate changes, potential for sharply devalued currencies and high inflation, political and economic upheaval, the relative lack of issuer information, relatively low market liquidity and the potential lack of strict financial and accounting controls and standards.
Securities for which market prices are not provided by any of the above methods may be valued based upon quotes furnished by independent sources. The last bid price may be used to value equity securities. The mean between the last bid and asked prices is used to value debt obligations, including corporate loans.
Securities for which market quotations are not readily available or became unreliable are valued at fair value as determined in good faith by or under the supervision of the Trust’s officers following procedures approved by the Board of Trustees. Issuer specific events, market trends, bid/asked quotes of brokers and information providers and other market data may be reviewed in the course of making a good faith determination of a security’s fair value.
The Fund may invest in securities that are subject to interest rate risk, meaning the risk that the prices will generally fall as interest rates rise and, conversely, the prices will generally rise as interest rates fall. Specific securities differ in their sensitivity to changes in interest rates depending on their individual characteristics. Changes in interest rates may result in increased market volatility, which may affect the value and/or liquidity of certain Fund investments.
Valuations change in response to many factors including the historical and prospective earnings of the issuer, the value of the issuer’s assets, general economic conditions, interest rates, investor perceptions and market liquidity. Because of the inherent uncertainties of valuation, the values reflected in the consolidated financial statements may materially differ from the value received upon actual sale of those investments.
| B. | Securities Transactions and Investment Income — Securities transactions are accounted for on a trade date basis. Realized gains or losses on sales are computed on the basis of specific identification of the securities sold. Interest income (net of withholding tax, if any) is recorded on the accrual basis from settlement date. Dividend income (net of withholding tax, if any) is recorded on the ex-dividend date. Bond premiums and discounts are amortized and/or accreted for financial reporting purposes. |
The Fund may periodically participate in litigation related to Fund investments. As such, the Fund may receive proceeds from litigation settlements. Any proceeds received are included in the Consolidated Statement of Operations as realized gain (loss) for investments no longer held and as unrealized gain (loss) for investments still held.
Brokerage commissions and mark ups are considered transaction costs and are recorded as an increase to the cost basis of securities purchased and/or a reduction of proceeds on a sale of securities. Such transaction costs are included in the determination of net realized and unrealized gain (loss) from investment securities reported in the Consolidated Statement of Operations and the Consolidated Statement of Changes in Net Assets and the net realized and unrealized gains (losses) on securities per share in the Consolidated Financial Highlights. Transaction costs are included in the calculation of the Fund’s net asset value and, accordingly, they reduce the Fund’s total returns. These transaction costs are not considered operating expenses and are not reflected in net investment income reported in the Consolidated Statement of Operations and the Consolidated Statement of Changes in Net Assets, or the net investment income per share and the ratios of expenses and net investment income reported in the Consolidated Financial Highlights, nor are they limited by any expense limitation arrangements between the Fund and the investment adviser.
The Fund allocates income and realized and unrealized capital gains and losses to a class based on the relative net assets of each class.
| C. | Country Determination — For the purposes of making investment selection decisions and presentation in the Consolidated Schedule of Investments, the investment adviser may determine the country in which an issuer is located and/or credit risk exposure based on various factors. These factors include the laws of the country under which the issuer is organized, where the issuer maintains a principal office, the country in which the issuer derives 50% or more of its total revenues and the country that has the primary market for the issuer’s securities, as well as other criteria. Among the other criteria that may be evaluated for making this determination are the country in which the issuer maintains 50% or more of its assets, the type of security, financial guarantees and enhancements, the nature of the collateral and the sponsor organization. Country of issuer and/or credit risk exposure has been determined to be the United States of America, unless otherwise noted. |
16 Invesco Balanced-Risk Commodity Strategy Fund
| D. | Distributions — Distributions from net investment income and net realized capital gain, if any, are generally declared and paid annually and recorded on the ex-dividend date. The Fund may elect to treat a portion of the proceeds from redemptions as distributions for federal income tax purposes. |
| E. | Federal Income Taxes — The Fund intends to comply with the requirements of Subchapter M of the Internal Revenue Code of 1986, as amended (the “Internal Revenue Code”), necessary to qualify as a regulated investment company and to distribute substantially all of the Fund’s taxable earnings to shareholders. As such, the Fund will not be subject to federal income taxes on otherwise taxable income (including net realized capital gain) that is distributed to shareholders. Therefore, no provision for federal income taxes is recorded in the consolidated financial statements. |
The Fund recognizes the tax benefits of uncertain tax positions only when the position is more likely than not to be sustained. Management has analyzed the Fund’s uncertain tax positions and concluded that no liability for unrecognized tax benefits should be recorded related to uncertain tax positions. Management is not aware of any tax positions for which it is reasonably possible that the total amounts of unrecognized tax benefits will change materially in the next 12 months.
The Subsidiary is classified as a controlled foreign corporation under Subchapter N of the Internal Revenue Code. Therefore, the Fund is required to increase its taxable income by its share of the Subsidiary’s income. Net investment losses of the Subsidiary cannot be deducted by the Fund in the current period nor carried forward to offset taxable income in future periods.
The Fund files tax returns in the U.S. Federal jurisdiction and certain other jurisdictions. Generally the Fund is subject to examinations by such taxing authorities for up to three years after the filing of the return for the tax period.
| F. | Expenses — Fees provided for under the Rule 12b-1 plan of a particular class of the Fund are charged to the operations of such class. Transfer agency fees and expenses and other shareholder recordkeeping fees and expenses attributable to Class R5 and Class R6 are allocated to each share class based on relative net assets. Sub-accounting fees attributable to Class R5 are charged to the operations of the class. Transfer agency fees and expenses and other shareholder recordkeeping fees and expenses relating to all other classes are allocated among those classes based on relative net assets. All other expenses are allocated among the classes based on relative net assets. |
| G. | Accounting Estimates — The financial statements are prepared on a consolidated basis in conformity with accounting principles generally accepted in the United States of America (“GAAP”), which requires management to make estimates and assumptions that affect the reported amounts of assets and liabilities at the date of the financial statements and the reported amounts of revenues and expenses during the reporting period including estimates and assumptions related to taxation. Actual results could differ from those estimates by a significant amount. The accompanying financial statements reflect the financial position of the Fund and its Subsidiary and the results of operations on a consolidated basis. All inter-company accounts and transactions have been eliminated in consolidation. |
In addition, the Fund monitors for material events or transactions that may occur or become known after the period-end date and before the date the consolidated financial statements are released to print.
| H. | Indemnifications — Under the Trust’s organizational documents, each Trustee, officer, employee or other agent of the Trust, and under the Subsidiary’s organizational documents, the directors and officers of the Subsidiary, are indemnified against certain liabilities that may arise out of the performance of their duties to the Fund and/or the Subsidiary, respectively. Additionally, in the normal course of business, the Fund enters into contracts, including the Fund’s servicing agreements, that contain a variety of indemnification clauses. The Fund’s maximum exposure under these arrangements is unknown as this would involve future claims that may be made against the Fund that have not yet occurred. The risk of material loss as a result of such indemnification claims is considered remote. |
| I. | Structured Securities — The Fund may invest in structured securities. Structured securities are a type of derivative security whose value is determined by reference to changes in the value of underlying securities, currencies, interest rates, commodities, indices or other financial indicators (“reference instruments”). Most structured securities are fixed-income securities that have maturities of three years or less. Structured securities may be positively or negatively indexed (i.e., their principal value or interest rates may increase or decrease if the underlying reference instrument appreciates) and may have return characteristics similar to direct investments in the underlying reference instrument. |
Structured securities may entail a greater degree of market risk than other types of debt securities because the investor bears the risk of the reference instruments. In addition to the credit risk of structured securities and the normal risks of price changes in response to changes in interest rates, the principal amount of structured notes or indexed securities may decrease as a result of changes in the value of the underlying reference instruments. Changes in the daily value of structured securities are recorded as unrealized gains (losses) in the Consolidated Statement of Operations. When the structured securities mature or are sold, the Fund recognizes a realized gain (loss) on the Consolidated Statement of Operations.
| J. | Futures Contracts — The Fund may enter into futures contracts to manage exposure to interest rate, equity and market price movements and/or currency risks. A futures contract is an agreement between two parties (“Counterparties”) to purchase or sell a specified underlying security, currency or commodity (or delivery of a cash settlement price, in the case of an index future) for a fixed price at a future date. The Fund currently invests only in exchange-traded futures and they are standardized as to maturity date and underlying financial instrument. Initial margin deposits required upon entering into futures contracts are satisfied by the segregation of specific securities or cash as collateral at the futures commission merchant (broker). During the period the futures contracts are open, changes in the value of the contracts are recognized as unrealized gains or losses by recalculating the value of the contracts on a daily basis. Subsequent or variation margin payments are received or made depending upon whether unrealized gains or losses are incurred. These amounts are reflected as receivables or payables on the Consolidated Statement of Assets and Liabilities. When the contracts are closed or expire, the Fund recognizes a realized gain or loss equal to the difference between the proceeds from, or cost of, the closing transaction and the Fund’s basis in the contract. The net realized gain (loss) and the change in unrealized gain (loss) on futures contracts held during the period is included on the Consolidated Statement of Operations. The primary risks associated with futures contracts are market risk and the absence of a liquid secondary market. If the Fund were unable to liquidate a futures contract and/or enter into an offsetting closing transaction, the Fund would continue to be subject to market risk with respect to the value of the contracts and continue to be required to maintain the margin deposits on the futures contracts. Futures contracts have minimal Counterparty risk since the exchange’s clearinghouse, as Counterparty to all exchange-traded futures, guarantees the futures against default. Risks may exceed amounts recognized in the Consolidated Statement of Assets and Liabilities. |
17 Invesco Balanced-Risk Commodity Strategy Fund
| K. | Swap Agreements — The Fund may enter into various swap transactions, including interest rate, total return, index, currency and credit default swap contracts (“CDS”) for investment purposes or to manage interest rate, currency or credit risk. Such transactions are agreements between Counterparties. These agreements may contain among other conditions, events of default and termination events, and various covenants and representations such as provisions that require the Fund to maintain a pre-determined level of net assets, and/or provide limits regarding the decline of the Fund’s NAV over specific periods of time. If the Fund were to trigger such provisions and have open derivative positions at that time, the Counterparty may be able to terminate such agreement and request immediate payment in an amount equal to the net liability positions, if any. |
Interest rate, total return, index, and currency swap agreements are two-party contracts entered into primarily to exchange the returns (or differentials in rates of returns) earned or realized on particular predetermined investments or instruments. The gross returns to be exchanged or “swapped” between the parties are calculated with respect to a notional amount, i.e., the return on or increase in value of a particular dollar amount invested at a particular interest rate or return of an underlying asset, in a particular foreign currency, or in a “basket” of securities representing a particular index. At the maturity date, a net cash flow is exchanged where the total return is equivalent to the return of the underlying reference less a financing rate, if any. As a receiver, the Fund would receive payments based on any positive total return and would owe payments in the event of a negative total return. As the payer, the Fund would owe payments on any net positive total return, and would receive payment in the event of a negative total return.
Changes in the value of swap agreements are recognized as unrealized gains (losses) in the Consolidated Statement of Operations by “marking to market” on a daily basis to reflect the value of the swap agreement at the end of each trading day. Payments received or paid at the beginning of the agreement are reflected as such on the Consolidated Statement of Assets and Liabilities and may be referred to as upfront payments. The Fund accrues for the fixed payment stream and amortizes upfront payments, if any, on swap agreements on a daily basis with the net amount, recorded as a component of realized gain (loss) on the Consolidated Statement of Operations. A liquidation payment received or made at the termination of a swap agreement is recorded as realized gain (loss) on the Consolidated Statement of Operations. The Fund segregates liquid securities having a value at least equal to the amount of the potential obligation of a Fund under any swap transaction. Entering into these agreements involves, to varying degrees, lack of liquidity and elements of credit, market, and Counterparty risk in excess of amounts recognized on the Consolidated Statement of Assets and Liabilities. Such risks involve the possibility that a swap is difficult to sell or liquidate; the Counterparty does not honor its obligations under the agreement and unfavorable interest rates and market fluctuations. It is possible that developments in the swaps market, including potential government regulation, could adversely affect the Fund’s ability to terminate existing swap agreements or to realize amounts to be received under such agreements. A short position in a security poses more risk than holding the same security long. As there is no limit on how much the price of the security can increase, the Fund’s exposure is unlimited.
| L. | Other Risks — The Fund will seek to gain exposure to commodity markets primarily through an investment in the Subsidiary and through investments in exchange traded funds and commodity-linked derivatives. The Subsidiary, unlike the Fund, may invest without limitation in commodities, commodity-linked derivatives and other securities, such as exchange traded notes, that may provide leveraged and non-leveraged exposure to commodity markets. The Fund is indirectly exposed to the risks associated with the Subsidiary’s investments. |
The Fund is non-diversified and may invest in securities of fewer issuers than if it were diversified. Thus, the value of the Fund’s shares may vary more widely and the Fund may be subject to greater market and credit risk than if the Fund invested more broadly.
| M. | Leverage Risk — Leverage exists when the Fund can lose more than it originally invests because it purchases or sells an instrument or enters into a transaction without investing an amount equal to the full economic exposure of the instrument or transaction. |
| N. | Collateral — To the extent the Fund has designated or segregated a security as collateral and that security is subsequently sold, it is the Fund’s practice to replace such collateral no later than the next business day. |
NOTE 2—Advisory Fees and Other Fees Paid to Affiliates
The Trust has entered into a master investment advisory agreement with Invesco Advisers, Inc. (the “Adviser” or “Invesco”). Under the terms of the investment advisory agreement, the Fund pays an advisory fee to the Adviser less the amount paid by the Subsidiary to the Adviser based on the annual rate of the Fund’s average daily net assets as follows:
| | | | | | |
| Average Daily Net Assets | | Rate |
First $250 million | | | 1 | .05% | | |
Next $250 million | | | 1 | .025% | | |
Next $500 million | | | 1 | .00% | | |
Next $1.5 billion | | | 0 | .975% | | |
Next $2.5 billion | | | 0 | .95% | | |
Next $2.5 billion | | | 0 | .925% | | |
Next $2.5 billion | | | 0 | .90% | | |
Over $10 billion | | | 0 | .875% | | |
For the year ended October 31, 2015, the effective advisory fees incurred by the Fund was 1.03%.
The Subsidiary has entered into a separate contract with the Adviser whereby the Adviser provides investment advisory and other services to the Subsidiary. In consideration of these services, the Subsidiary pays an advisory fee to the Adviser based on the annual rate of the Subsidiary’s average daily net assets as set forth in the table above.
Under the terms of a master sub-advisory agreement between the Adviser and each of Invesco Asset Management Deutschland GmbH, Invesco Asset Management Limited, Invesco Asset Management (Japan) Limited, Invesco Hong Kong Limited, Invesco Senior Secured Management, Inc. and Invesco Canada Ltd. (collectively, the “Affiliated Sub-Advisers”) the Adviser, not the Fund, may pay 40% of the fees paid to the Adviser to any such Affiliated Sub-Adviser(s) that provide(s) discretionary investment management services to the Fund based on the percentage of assets allocated to such Affiliated Sub-Adviser(s).
18 Invesco Balanced-Risk Commodity Strategy Fund
The Adviser has contractually agreed, through at least June 30, 2016, to waive advisory fees and/or reimburse expenses to the extent necessary to limit total annual fund operating expenses after fee waivers and/or reimbursements (excluding certain items discussed below) of Class A, Class B, Class C, Class R, Class Y, Class R5 and Class R6 shares to 2.00%, 2.75%, 2.75%, 2.25%, 1.75%, 1.75% and 1.75% of average daily net assets, respectively. In determining the Adviser’s obligation to waive advisory fees and/or reimburse expenses, the following expenses are not taken into account, and could cause total annual fund operating expenses after fee waiver and/or expense reimbursement to exceed the numbers reflected above: (1) interest; (2) taxes; (3) dividend expense on short sales; (4) extraordinary or non-routine items, including litigation expenses; and (5) expenses that the Fund has incurred but did not actually pay because of an expense offset arrangement. Acquired Fund Fees and Expenses are not operating expenses of the Fund directly, but are fees and expenses, including management fees, of the investment companies in which the Fund invests. As a result, the total annual fund operating expenses after expense reimbursement may exceed the expense limits above. Unless Invesco continues the fee waiver agreement, it will terminate on June 30, 2016. The fee waiver agreement cannot be terminated during its term. The Adviser did not waive fees and/or reimburse expenses during the period under this expense limitation.
Further, the Adviser has contractually agreed, through at least June 30, 2017, to waive the advisory fee payable by the Fund in an amount equal to 100% of the net advisory fees the Adviser receives from the affiliated money market funds on investments by the Fund of uninvested cash in such affiliated money market funds.
For the year ended October 31, 2015, the Adviser waived advisory fees of $298,961.
The Trust has entered into a master administrative services agreement with Invesco pursuant to which the Fund has agreed to pay Invesco for certain administrative costs incurred in providing accounting services to the Fund. For the year ended October 31, 2015, expenses incurred under the agreement are shown in the Consolidated Statement of Operations as Administrative services fees.
The Trust has entered into a transfer agency and service agreement with Invesco Investment Services, Inc. (“IIS”) pursuant to which the Fund has agreed to pay IIS a fee for providing transfer agency and shareholder services to the Fund and reimburse IIS for certain expenses incurred by IIS in the course of providing such services. IIS may make payments to intermediaries that provide omnibus account services, sub-accounting services and/or networking services. All fees payable by IIS to intermediaries that provide omnibus account services or sub-accounting are charged back to the Fund, subject to certain limitations approved by the Trust’s Board of Trustees. For the year ended October 31, 2015, expenses incurred under the agreement are shown in the Consolidated Statement of Operations as Transfer agent fees.
The Trust has entered into master distribution agreements with Invesco Distributors, Inc. (“IDI”) to serve as the distributor for the Class A, Class B, Class C, Class R, Class Y, Class R5 and Class R6 shares of the Fund. The Trust has adopted plans pursuant to Rule 12b-1 under the 1940 Act with respect to the Fund’s Class A, Class B, Class C and Class R shares (collectively, the “Plans”). The Fund, pursuant to the Plans, pays IDI compensation at the annual rate of 0.25% of the Fund’s average daily net assets of Class A shares, 1.00% of the average daily net assets of Class B and Class C shares and 0.50% of the average daily net assets of Class R shares. Of the Plan payments, up to 0.25% of the average daily net assets of each class of shares may be paid to furnish continuing personal shareholder services to customers who purchase and own shares of such classes. Any amounts not paid as a service fee under the Plans would constitute an asset-based sales charge. Rules of the Financial Industry Regulatory Authority (“FINRA”) impose a cap on the total sales charges, including asset-based sales charges, that may be paid by any class of shares of the Fund. For the year ended
October 31, 2015, expenses incurred under the Plans are shown in the Consolidated Statement of Operations as Distribution fees.
Front-end sales commissions and CDSC (collectively, the “sales charges”) are not recorded as expenses of the Fund. Front-end sales commissions are deducted from proceeds from the sales of Fund shares prior to investment in Class A shares of the Fund. CDSC are deducted from redemption proceeds prior to remittance to the shareholder. During the year ended October 31, 2015, IDI advised the Fund that IDI retained $2,484 in front-end sales commissions from the sale of Class A shares and $201, $415 and $479 from Class A, Class B and Class C shares, respectively, for CDSC imposed on redemptions by shareholders.
Certain officers and trustees of the Trust are officers and directors of the Adviser, IIS and/or IDI.
NOTE 3—Additional Valuation Information
GAAP defines fair value as the price that would be received to sell an asset or paid to transfer a liability in an orderly transaction between market participants at the measurement date, under current market conditions. GAAP establishes a hierarchy that prioritizes the inputs to valuation methods, giving the highest priority to readily available unadjusted quoted prices in an active market for identical assets (Level 1) and the lowest priority to significant unobservable inputs (Level 3), generally when market prices are not readily available or are unreliable. Based on the valuation inputs, the securities or other investments are tiered into one of three levels. Changes in valuation methods may result in transfers in or out of an investment’s assigned level:
| | Level 1 — | Prices are determined using quoted prices in an active market for identical assets. |
| | Level 2 — | Prices are determined using other significant observable inputs. Observable inputs are inputs that other market participants may use in pricing a security. These may include quoted prices for similar securities, interest rates, prepayment speeds, credit risk, yield curves, loss severities, default rates, discount rates, volatilities and others. |
| | Level 3 — | Prices are determined using significant unobservable inputs. In situations where quoted prices or observable inputs are unavailable (for example, when there is little or no market activity for an investment at the end of the period), unobservable inputs may be used. Unobservable inputs reflect the Fund’s own assumptions about the factors market participants would use in determining fair value of the securities or instruments and would be based on the best available information. |
19 Invesco Balanced-Risk Commodity Strategy Fund
The following is a summary of the tiered valuation input levels, as of October 31, 2015. The level assigned to the securities valuations may not be an indication of the risk or liquidity associated with investing in those securities. Because of the inherent uncertainties of valuation, the values reflected in the financial statements may materially differ from the value received upon actual sale of those investments.
| | | | | | | | | | | | | | | | |
| | | Level 1 | | | Level 2 | | | Level 3 | | | Total | |
Commodity-Linked Securities | | $ | — | | | $ | 15,146,112 | | | $ | — | | | $ | 15,146,112 | |
Exchange Traded Fund | | | 20,009,000 | | | | — | | | | — | | | | 20,009,000 | |
U.S. Treasury Securities | | | — | | | | 411,667,454 | | | | — | | | | 411,667,454 | |
Money Market Funds | | | 185,459,117 | | | | — | | | | — | | | | 185,459,117 | |
| | | $ | 205,468,117 | | | $ | 426,813,566 | | | $ | — | | | $ | 632,281,683 | |
Futures* | | | (2,752,613 | ) | | | — | | | | — | | | | (2,752,613 | ) |
Swap Agreements* | | | — | | | | (1,737,673 | ) | | | — | | | | (1,737,673 | ) |
Total Investments | | $ | 202,715,504 | | | $ | 425,075,893 | | | $ | — | | | $ | 627,791,397 | |
| * | Unrealized appreciation (depreciation). |
NOTE 4—Derivative Investments
Value of Derivative Investments at Period-End
The table below summarizes the value of the Fund’s derivative investments, detailed by primary risk exposure, held as of October 31, 2015:
| | | | | | | | |
| | | Value | |
| Risk Exposure/Derivative Type | | Assets | | | Liabilities | |
Commodity risk: | | | | | | | | |
Futures contracts(a) | | $ | 2,688,988 | | | $ | (5,441,601 | ) |
Swap agreements(b) | | | 530,770 | | | | (2,268,443 | ) |
Total | | $ | 3,219,758 | | | $ | (7,710,044 | ) |
| (a) | Includes cumulative appreciation (depreciation) of futures contracts. Only current day’s variation margin receivable is reported within the Consolidated Statement of Assets and Liabilities. |
| (b) | Values are disclosed on the Consolidated Statement of Assets and Liabilities under the caption Unrealized appreciation on swap agreements — OTC and Unrealized depreciation on swap agreements — OTC. |
Effect of Derivative Investments for the year ended October 31, 2015
The table below summarizes the gains (losses) on derivative investments, detailed by primary risk exposure, recognized in earnings during the period:
| | | | | | | | |
| | | Location of Gain (Loss) on
Consolidated Statement of Operations | |
| | | Futures
Contracts | | | Swap
Agreements | |
Realized Gain (Loss): | | | | | | | | |
Commodity risk | | $ | (11,235,378 | ) | | $ | (101,390,388 | ) |
Change in Net Unrealized Appreciation (Depreciation): | | | | | | | | |
Commodity risk | | | (9,694,025 | ) | | | 7,051,562 | |
Total | | $ | (20,929,403 | ) | | $ | (94,338,826 | ) |
The table below summarizes the average notional value of futures contracts and swap agreements outstanding during the period.
| | | | | | | | |
| | | Futures
Contracts | | | Swap
Agreements | |
Average notional value | | $ | 141,167,463 | | | $ | 464,184,887 | |
Offsetting Assets and Liabilities
Accounting Standards Update (“ASU”) No. 2011-11, Disclosures about Offsetting Assets and Liabilities, which was subsequently clarified in Financial Accounting Standards Board ASU 2013-01 “Clarifying the Scope of Disclosures about Offsetting Assets and Liabilities” is intended to enhance disclosures about financial instruments and derivative instruments that are subject to offsetting arrangements on the Consolidated Statement of Assets and Liabilities and to enable investors to better understand the effect of those arrangements on the Fund’s financial position. In order for an arrangement to be eligible for netting, the Fund must have a basis to conclude that such netting arrangements are legally enforceable. The Fund enters into netting agreements and collateral agreements in an attempt to reduce the Fund’s Counterparty credit risk by providing for a single net settlement with a Counterparty of all financial transactions covered by the agreement in an event of default as defined under such agreement.
20 Invesco Balanced-Risk Commodity Strategy Fund
The following tables present derivative instruments that are either subject to an enforceable netting agreement or offset by collateral arrangements as of October 31, 2015.
| | | | | | | | | | | | | | | | | | | | |
| | | Gross amounts
of Recognized
Assets | | | Gross Amounts Not Offset in the Consolidated
Statement of Assets and Liabilities | | | Net
Amount | |
| | | | Financial
Instruments | | | Collateral Received | | |
| Counterparty | | | | Non-Cash | | | Cash | | |
Subsidiary | | | | | | | | | | | | | | | | | | | | |
Barclays Bank PLC | | $ | 305,245 | | | $ | (134,956 | ) | | $ | — | | | $ | — | | | $ | 170,289 | |
Goldman Sachs International | | | 4,478,690 | | | | (643,994 | ) | | | — | | | | — | | | | 3,834,696 | |
JPMorgan Chase Bank, N.A. | | | 60,794 | | | | (60,794 | ) | | | — | | | | — | | | | — | |
Macquarie Bank Ltd. | | | 122,640 | | | | (122,640 | ) | | | — | | | | — | | | | — | |
Merrill Lynch International | | | 179,205 | | | | (179,205 | ) | | | — | | | | — | | | | — | |
Morgan Stanley Capital Services LLC | | | 4 | | | | (4 | ) | | | — | | | | — | | | | — | |
Total | | $ | 5,146,578 | | | $ | (1,141,593 | ) | | $ | — | | | $ | — | | | $ | 4,004,985 | |
| | | | | |
| | | | | | | | | | | | | | | | | | | | |
| | | Gross amounts
of Recognized
Liabilities | | | Gross Amounts Not Offset in the Consolidated
Statement of Assets and Liabilities | | | Net
Amount | |
| | | | Financial
Instruments | | | Collateral Pledged | | |
| Counterparty | | | | Non-Cash | | | Cash | | |
Subsidiary | | | | | | | | | | | | | | | | | | | | |
Barclays Bank PLC | | $ | 134,956 | | | $ | (134,956 | ) | | $ | — | | | $ | — | | | $ | — | |
Goldman Sachs International | | | 643,994 | | | | (643,994 | ) | | | — | | | | — | | | | — | |
JPMorgan Chase Bank, N.A. | | | 960,265 | | | | (60,794 | ) | | | (899,471 | ) | | | — | | | | — | |
Macquarie Bank Ltd. | | | 1,111,205 | | | | (122,640 | ) | | | (988,565 | ) | | | — | | | | — | |
Merrill Lynch International | | | 3,937,597 | | | | (179,205 | ) | | | (3,758,392 | ) | | | — | | | | — | |
Morgan Stanley Capital Services LLC | | | 66,282 | | | | (4 | ) | | | — | | | | — | | | | 66,278 | |
Total | | $ | 6,854,299 | | | $ | (1,141,593 | ) | | $ | (5,646,428 | ) | | $ | — | | | $ | 66,278 | |
NOTE 5—Subsidiary Information
The Fund’s Consolidated Schedule of Investments includes the holdings, including any investments in derivatives, of both the Fund and the Subsidiary. The Fund’s Consolidated Statement of Assets and Liabilities, Consolidated Statement of Operations and Consolidated Statement of Changes in Net Assets include the account balances of both the Fund and the Subsidiary and all interfund transactions have been eliminated.
The table below summarizes the financial information of the Subsidiary recognized in the consolidated financial statements referred to above.
| | | | |
| Selected Financial Information | | Invesco Cayman
Commodity Fund III
Ltd. (the “Subsidiary”) | |
Total assets | | $ | 147,428,817 | |
Total liabilities | | | (6,858,294 | ) |
Net assets | | | 140,570,523 | |
Total investment income | | | 117,707 | |
Net investment income (loss) | | | (1,540,592 | ) |
Net realized gain (loss) from: | | | | |
Investment securities | | | 2,310 | |
Futures contracts | | | (11,235,377 | ) |
Swap agreements | | | (101,390,388 | ) |
Change in net unrealized appreciation (depreciation) of: | | | | |
Investment securities | | | 1,426 | |
Futures contracts | | | (9,694,025 | ) |
Swap agreements | | | 7,051,561 | |
Increase (decrease) in net assets resulting from operations | | $ | (116,805,085 | ) |
21 Invesco Balanced-Risk Commodity Strategy Fund
NOTE 6—Investments in Other Affiliates
The 1940 Act defines an “affiliated person” as an issuance in which a fund holds 5% or more of the outstanding voting securities. The Fund has not owned enough of the outstanding voting securities of the issuer to have control (as defined in the 1940 Act) of that issuer. The following is a summary of the investments in other affiliates for the year ended October 31, 2015.
| | | | | | | | | | | | | | | | | | | | | | | | | | | | |
| | | Value
10/31/14 | | | Purchases
at Cost | | | Proceeds
from Sales | | | Change in
Unrealized
Appreciation
(Depreciation) | | | Realized
Gain (Loss) | | | Value
10/31/15 | | | Dividend
Income | |
PowerShares DB Gold Fund | | $ | 21,024,180 | | | $ | — | | | $ | (280,626 | ) | | $ | (610,593 | ) | | $ | (123,961 | ) | | $ | 20,009,000 | | | $ | — | |
NOTE 7—Expense Offset Arrangement(s)
The expense offset arrangement is comprised of transfer agency credits which result from balances in demand deposit accounts used by the transfer agent for clearing shareholder transactions. For the year ended October 31, 2015, the Fund received credits from this arrangement, which resulted in the reduction of the Fund’s total expenses of $2,269.
NOTE 8—Trustees’ and Officers’ Fees and Benefits
Trustees’ and Officers’ Fees and Benefits include amounts accrued by the Fund to pay remuneration to certain Trustees and Officers of the Fund. Trustees have the option to defer compensation payable by the Fund, and Trustees’ and Officers’ Fees and Benefits also include amounts accrued by the Fund to fund such deferred compensation amounts. Those Trustees who defer compensation have the option to select various Invesco Funds in which their deferral accounts shall be deemed to be invested. Finally, certain current Trustees were eligible to participate in a retirement plan that provided for benefits to be paid upon retirement to Trustees over a period of time based on the number of years of service. The Fund may have certain former Trustees who also participate in a retirement plan and receive benefits under such plan. Trustees’ and Officers’ Fees and Benefits include amounts accrued by the Fund to fund such retirement benefits. Obligations under the deferred compensation and retirement plans represent unsecured claims against the general assets of the Fund.
NOTE 9—Cash Balances
The Fund is permitted to temporarily carry a negative or overdrawn balance in its account with State Street Bank and Trust Company, the custodian bank. Such balances, if any at period end, are shown in the Consolidated Statement of Assets and Liabilities under the payable caption Amount due custodian. To compensate the custodian bank for such overdrafts, the overdrawn Fund may either (1) leave funds as a compensating balance in the account so the custodian bank can be compensated by earning the additional interest; or (2) compensate by paying the custodian bank at a rate agreed upon by the custodian bank and Invesco, not to exceed the contractually agreed upon rate.
NOTE 10—Distributions to Shareholders and Tax Components of Net Assets
There were no ordinary income and long-term gain distributions paid for the years ended October 31, 2014 and October 31, 2015.
Tax Components of Net Assets at Period-End:
| | | | |
| | | 2015 | |
Net unrealized appreciation (depreciation) — investments | | $ | (2,937,916 | ) |
Net unrealized appreciation — other investments | | | 318,937 | |
Temporary book/tax differences | | | (136,507 | ) |
Capital loss carryforward | | | (42,621,346 | ) |
Late-year ordinary loss deferral | | | (5,263,027 | ) |
Shares of beneficial interest | | | 683,402,903 | |
Total net assets | | $ | 632,763,044 | |
The difference between book-basis and tax-basis unrealized appreciation (depreciation) is due to differences in the timing of recognition of gains and losses on investments for tax and book purposes. The Fund’s net unrealized appreciation (depreciation) difference is attributable primarily to wash sales and partnerships adjustments.
The temporary book/tax differences are a result of timing differences between book and tax recognition of income and/or expenses. The Fund’s temporary book/tax differences are the result of the trustee deferral of compensation and retirement plan benefits.
Capital loss carryforward is calculated and reported as of a specific date. Results of transactions and other activity after that date may affect the amount of capital loss carryforward actually available for the Fund to utilize. Capital losses generated in years beginning after December 22, 2010 can be carried forward for an unlimited period, whereas previous losses expire in eight tax years. Capital losses with an expiration period may not be used to offset capital gains until all net capital losses without an expiration date have been utilized. Capital loss carryforwards with no expiration date will retain their character as either short-term or long-term capital losses instead of as short-term capital losses as under prior law. The ability to utilize capital loss carryforwards in the future may be limited under the Internal Revenue Code and related regulations based on the results of future transactions.
22 Invesco Balanced-Risk Commodity Strategy Fund
The Fund has a capital loss carryforward as of October 31, 2015, which expires as follows:
| | | | | | | | | | | | |
| Capital Loss Carryforward* | |
| Expiration | | Short-Term | | | Long-Term | | | Total | |
October 31, 2016 | | $ | 276,503 | | | $ | — | | | $ | 276,503 | |
Not subject to expiration | | | 34,888,091 | | | | 7,456,752 | | | | 42,344,843 | |
| | | $ | 35,164,594 | | | $ | 7,456,752 | | | $ | 42,621,346 | |
| * | Capital loss carryforward as of the date listed above is reduced for limitations, if any, to the extent required by the Internal Revenue Code and may be further limited depending upon a variety of factors, including the realization of net unrealized gains or losses as of the date of any reorganization. |
NOTE 11—Investment Securities
The aggregate amount of investment securities (other than short-term securities, U.S. Treasury obligations and money market funds, if any) purchased and sold by the Fund during the year ended October 31, 2015 was $48,749,000 and $30,628,136, respectively. During the same period, purchases and sales of U.S. Treasury obligations were $40,550,560 and $19,004,224, respectively. Cost of investments on a tax basis includes the adjustments for financial reporting purposes as of the most recently completed federal income tax reporting period-end.
| | | | |
| Unrealized Appreciation (Depreciation) of Investment Securities on a Tax Basis | |
Aggregate unrealized appreciation of investment securities | | $ | 65,185 | |
Aggregate unrealized (depreciation) of investment securities | | | (3,003,101 | ) |
Net unrealized appreciation (depreciation) of investment securities | | $ | (2,937,916 | ) |
Cost of investments for tax purposes is $635,219,599. | | | | |
NOTE 12—Reclassification of Permanent Differences
Primarily as a result of differing book/tax treatment of swap agreement income, net operating losses and net investment losses from subsidiary, on October 31, 2015, undistributed net investment income was increased by $1,075,719, undistributed net realized gain (loss) was increased by $124,749,934 and shares of beneficial interest was decreased by $125,825,653. This reclassification had no effect on the net assets of the Fund.
NOTE 13—Share Information
| | | | | | | | | | | | | | | | |
| | | Summary of Share Activity | |
| | | Years ended October 31, | |
| | | 2015(a) | | | 2014 | |
| | | Shares | | | Amount | | | Shares | | | Amount | |
Sold: | | | | | | | | | | | | | | | | |
Class A | | | 1,108,280 | | | $ | 7,837,926 | | | | 2,976,484 | | | $ | 26,030,155 | |
Class B | | | 1,605 | | | | 10,000 | | | | 904 | | | | 7,902 | |
Class C | | | 75,087 | | | | 523,510 | | | | 95,677 | | | | 824,090 | |
Class R | | | 11,649 | | | | 84,240 | | | | 15,425 | | | | 135,101 | |
Class Y | | | 37,995,426 | | | | 284,276,655 | | | | 33,970,673 | | | | 301,075,976 | |
Class R5 | | | 9,523,280 | | | | 69,940,562 | | | | 6,288,265 | | | | 55,370,590 | |
Class R6 | | | 4,086,457 | | | | 29,552,374 | | | | 3,104,708 | | | | 27,058,977 | |
| | | | |
Automatic conversion of Class B shares to Class A shares: | | | | | | | | | | | | | | | | |
Class A | | | 9,717 | | | | 68,576 | | | | 36,589 | | | | 323,416 | |
Class B | | | (9,992 | ) | | | (68,576 | ) | | | (37,280 | ) | | | (323,416 | ) |
| | | | |
Reacquired: | | | | | | | | | | | | | | | | |
Class A | | | (1,670,209 | ) | | | (11,969,914 | ) | | | (4,784,440 | ) | | | (41,872,683 | ) |
Class B | | | (16,316 | ) | | | (116,065 | ) | | | (21,273 | ) | | | (182,426 | ) |
Class C | | | (133,757 | ) | | | (943,757 | ) | | | (191,231 | ) | | | (1,638,102 | ) |
Class R | | | (2,039 | ) | | | (13,828 | ) | | | (24,847 | ) | | | (219,334 | ) |
Class Y | | | (38,158,873 | ) | | | (283,974,050 | ) | | | (28,413,450 | ) | | | (251,251,924 | ) |
Class R5 | | | (3,555,024 | ) | | | (25,488,499 | ) | | | (2,277,011 | ) | | | (19,293,796 | ) |
Class R6 | | | (2,526,951 | ) | | | (17,657,058 | ) | | | (622,491 | ) | | | (5,513,644 | ) |
Net increase in share activity | | | 6,738,340 | | | $ | 52,062,096 | | | | 10,116,702 | | | $ | 90,530,882 | |
| (a) | There is an entity that is a record owner of more than 5% of the outstanding shares of the Fund and owns 41% of the outstanding shares of the Fund. IDI has an agreement with this entity to sell Fund shares. The Fund, Invesco and/or Invesco affiliates may make payments to this entity, which is considered to be related to the Fund, for providing services to the Fund, Invesco and/or Invesco affiliates including but not limited to services such as securities brokerage, distribution, third party record keeping and account servicing. The Trust has no knowledge as to whether all or any portion of the shares owned of record by this entity are also owned beneficially. |
| | In addition, 18% of the outstanding shares of the Fund are owned by affiliated mutual funds. Affiliated mutual funds are mutual funds that are advised by Invesco. |
23 Invesco Balanced-Risk Commodity Strategy Fund
NOTE 14—Financial Highlights
The following schedule presents financial highlights for a share of the Fund outstanding throughout the periods indicated.
| | | | | | | | | | | | | | | | | | | | | | | | | | | | | | | | | | | | | | | | | | | | | | | | |
| | | Net asset
value,
beginning
of period | | | Net
investment
income
(loss)(a) | | | Net gains
(losses)
on securities
(both
realized and
unrealized) | | | Total from
investment
operations | | | Dividends
from net
investment
income | | | Net asset
value, end
of period | | | Total
return(b) | | | Net assets,
end of period
(000’s omitted) | | | Ratio of
expenses
to average
net assets
with feewaivers
and/or expenses
absorbed | | | Ratio of
expenses
to average net
assets without
fee waivers
and/or expenses
absorbed | | | Ratio of net
investment
income (loss)
to average
net assets | | | Portfolio
turnover(c) | |
Class A | | | | | | | | | | | | | | | | | | | | | | | | | | | | | | | | | | | | | | | | | | | | | | | | |
Year ended 10/31/15 | | $ | 8.04 | | | $ | (0.10 | ) | | $ | (1.40 | ) | | $ | (1.50 | ) | | $ | — | | | $ | 6.54 | | | | (18.66 | )% | | $ | 34,892 | | | | 1.55 | %(d) | | | 1.59 | %(d) | | | (1.47 | )%(d) | | | 17 | % |
Year ended 10/31/14 | | | 9.05 | | | | (0.11 | ) | | | (0.90 | ) | | | (1.01 | ) | | | — | | | | 8.04 | | | | (11.16 | ) | | | 47,339 | | | | 1.30 | | | | 1.57 | | | | (1.25 | ) | | | 21 | |
Year ended 10/31/13 | | | 10.73 | | | | (0.11 | ) | | | (1.35 | ) | | | (1.46 | ) | | | (0.22 | ) | | | 9.05 | | | | (13.89 | ) | | | 69,350 | | | | 1.22 | | | | 1.47 | | | | (1.14 | ) | | | 47 | |
Year ended 10/31/12 | | | 10.42 | | | | (0.12 | ) | | | 0.43 | | | | 0.31 | | | | — | | | | 10.73 | | | | 2.97 | | | | 99,577 | | | | 1.22 | | | | 1.46 | | | | (1.13 | ) | | | 152 | |
Year ended 10/31/11(e) | | | 10.00 | | | | (0.12 | ) | | | 0.54 | | | | 0.42 | | | | — | | | | 10.42 | | | | 4.20 | | | | 7,659 | | | | 1.22 | (f) | | | 1.54 | (f) | | | (1.13 | )(f) | | | 0 | |
Class B | | | | | | | | | | | | | | | | | | | | | | | | | | | | | | | | | | | | | | | | | | | | | | | | |
Year ended 10/31/15 | | | 7.85 | | | | (0.16 | ) | | | (1.35 | ) | | | (1.51 | ) | | | — | | | | 6.34 | | | | (19.24 | ) | | | 258 | | | | 2.30 | (d) | | | 2.34 | (d) | | | (2.22 | )(d) | | | 17 | |
Year ended 10/31/14 | | | 8.91 | | | | (0.17 | ) | | | (0.89 | ) | | | (1.06 | ) | | | — | | | | 7.85 | | | | (11.90 | ) | | | 514 | | | | 2.05 | | | | 2.32 | | | | (2.00 | ) | | | 21 | |
Year ended 10/31/13 | | | 10.59 | | | | (0.18 | ) | | | (1.33 | ) | | | (1.51 | ) | | | (0.17 | ) | | | 8.91 | | | | (14.44 | ) | | | 1,096 | | | | 1.97 | | | | 2.22 | | | | (1.89 | ) | | | 47 | |
Year ended 10/31/12 | | | 10.36 | | | | (0.20 | ) | | | 0.43 | | | | 0.23 | | | | — | | | | 10.59 | | | | 2.22 | | | | 3,773 | | | | 1.97 | | | | 2.21 | | | | (1.88 | ) | | | 152 | |
Year ended 10/31/11(e) | | | 10.00 | | | | (0.19 | ) | | | 0.55 | | | | 0.36 | | | | — | | | | 10.36 | | | | 3.60 | | | | 277 | | | | 1.97 | (f) | | | 2.29 | (f) | | | (1.88 | )(f) | | | 0 | |
Class C | | | | | | | | | | | | | | | | | | | | | | | | | | | | | | | | | | | | | | | | | | | | | | | | |
Year ended 10/31/15 | | | 7.84 | | | | (0.15 | ) | | | (1.36 | ) | | | (1.51 | ) | | | — | | | | 6.33 | | | | (19.26 | ) | | | 2,544 | | | | 2.30 | (d) | | | 2.34 | (d) | | | (2.22 | )(d) | | | 17 | |
Year ended 10/31/14 | | | 8.89 | | | | (0.17 | ) | | | (0.88 | ) | | | (1.05 | ) | | | — | | | | 7.84 | | | | (11.81 | ) | | | 3,612 | | | | 2.05 | | | | 2.32 | | | | (2.00 | ) | | | 21 | |
Year ended 10/31/13 | | | 10.58 | | | | (0.18 | ) | | | (1.34 | ) | | | (1.52 | ) | | | (0.17 | ) | | | 8.89 | | | | (14.55 | ) | | | 4,948 | | | | 1.97 | | | | 2.22 | | | | (1.89 | ) | | | 47 | |
Year ended 10/31/12 | | | 10.35 | | | | (0.20 | ) | | | 0.43 | | | | 0.23 | | | | — | | | | 10.58 | | | | 2.22 | | | | 8,585 | | | | 1.97 | | | | 2.21 | | | | (1.88 | ) | | | 152 | |
Year ended 10/31/11(e) | | | 10.00 | | | | (0.19 | ) | | | 0.54 | | | | 0.35 | | | | — | | | | 10.35 | | | | 3.50 | | | | 1,822 | | | | 1.97 | (f) | | | 2.29 | (f) | | | (1.88 | )(f) | | | 0 | |
Class R | | | | | | | | | | | | | | | | | | | | | | | | | | | | | | | | | | | | | | | | | | | | | | | | |
Year ended 10/31/15 | | | 7.99 | | | | (0.12 | ) | | | (1.39 | ) | | | (1.51 | ) | | | — | | | | 6.48 | | | | (18.90 | ) | | | 363 | | | | 1.80 | (d) | | | 1.84 | (d) | | | (1.72 | )(d) | | | 17 | |
Year ended 10/31/14 | | | 9.02 | | | | (0.13 | ) | | | (0.90 | ) | | | (1.03 | ) | | | — | | | | 7.99 | | | | (11.42 | ) | | | 371 | | | | 1.55 | | | | 1.82 | | | | (1.50 | ) | | | 21 | |
Year ended 10/31/13 | | | 10.71 | | | | (0.13 | ) | | | (1.36 | ) | | | (1.49 | ) | | | (0.20 | ) | | | 9.02 | | | | (14.13 | ) | | | 504 | | | | 1.47 | | | | 1.72 | | | | (1.39 | ) | | | 47 | |
Year ended 10/31/12 | | | 10.42 | | | | (0.15 | ) | | | 0.44 | | | | 0.29 | | | | — | | | | 10.71 | | | | 2.78 | | | | 386 | | | | 1.47 | | | | 1.71 | | | | (1.38 | ) | | | 152 | |
Year ended 10/31/11(e) | | | 10.00 | | | | (0.14 | ) | | | 0.56 | | | | 0.42 | | | | — | | | | 10.42 | | | | 4.20 | | | | 111 | | | | 1.47 | (f) | | | 1.79 | (f) | | | (1.38 | )(f) | | | 0 | |
Class Y | | | | | | | | | | | | | | | | | | | | | | | | | | | | | | | | | | | | | | | | | | | | | | | | |
Year ended 10/31/15 | | | 8.13 | | | | (0.09 | ) | | | (1.41 | ) | | | (1.50 | ) | | | — | | | | 6.63 | | | | (18.45 | ) | | | 217,528 | | | | 1.30 | (d) | | | 1.34 | (d) | | | (1.22 | )(d) | | | 17 | |
Year ended 10/31/14 | | | 9.13 | | | | (0.09 | ) | | | (0.91 | ) | | | (1.00 | ) | | | — | | | | 8.13 | | | | (10.95 | ) | | | 268,106 | | | | 1.05 | | | | 1.32 | | | | (1.00 | ) | | | 21 | |
Year ended 10/31/13 | | | 10.81 | | | | (0.09 | ) | | | (1.36 | ) | | | (1.45 | ) | | | (0.23 | ) | | | 9.13 | | | | (13.69 | ) | | | 250,463 | | | | 0.97 | | | | 1.22 | | | | (0.89 | ) | | | 47 | |
Year ended 10/31/12 | | | 10.47 | | | | (0.09 | ) | | | 0.43 | | | | 0.34 | | | | — | | | | 10.81 | | | | 3.25 | | | | 240,404 | | | | 0.97 | | | | 1.21 | | | | (0.88 | ) | | | 152 | |
Year ended 10/31/11(e) | | | 10.00 | | | | (0.09 | ) | | | 0.56 | | | | 0.47 | | | | — | | | | 10.47 | | | | 4.70 | | | | 59,063 | | | | 0.97 | (f) | | | 1.29 | (f) | | | (0.88 | )(f) | | | 0 | |
Class R5 | | | | | | | | | | | | | | | | | | | | | | | | | | | | | | | | | | | | | | | | | | | | | | | | |
Year ended 10/31/15 | | | 8.13 | | | | (0.08 | ) | | | (1.41 | ) | | | (1.49 | ) | | | — | | | | 6.64 | | | | (18.33 | ) | | | 259,674 | | | | 1.15 | (d) | | | 1.19 | (d) | | | (1.07 | )(d) | | | 17 | |
Year ended 10/31/14 | | | 9.13 | | | | (0.09 | ) | | | (0.91 | ) | | | (1.00 | ) | | | — | | | | 8.13 | | | | (10.95 | ) | | | 269,490 | | | | 1.02 | | | | 1.19 | | | | (0.97 | ) | | | 21 | |
Year ended 10/31/13 | | | 10.80 | | | | (0.09 | ) | | | (1.35 | ) | | | (1.44 | ) | | | (0.23 | ) | | | 9.13 | | | | (13.61 | ) | | | 266,031 | | | | 0.97 | | | | 1.20 | | | | (0.89 | ) | | | 47 | |
Year ended 10/31/12 | | | 10.47 | | | | (0.09 | ) | | | 0.42 | | | | 0.33 | | | | — | | | | 10.80 | | | | 3.15 | | | | 238,710 | | | | 0.97 | | | | 1.14 | | | | (0.88 | ) | | | 152 | |
Year ended 10/31/11(e) | | | 10.00 | | | | (0.09 | ) | | | 0.56 | | | | 0.47 | | | | — | | | | 10.47 | | | | 4.70 | | | | 102,857 | | | | 0.97 | (f) | | | 1.21 | (f) | | | (0.88 | )(f) | | | 0 | |
Class R6 | | | | | | | | | | | | | | | | | | | | | | | | | | | | | | | | | | | | | | | | | | | | | | | | |
Year ended 10/31/15 | | | 8.13 | | | | (0.07 | ) | | | (1.41 | ) | | | (1.48 | ) | | | — | | | | 6.65 | | | | (18.20 | ) | | | 117,504 | | | | 1.05 | (d) | | | 1.09 | (d) | | | (0.97 | )(d) | | | 17 | |
Year ended 10/31/14 | | | 9.13 | | | | (0.08 | ) | | | (0.92 | ) | | | (1.00 | ) | | | — | | | | 8.13 | | | | (10.95 | ) | | | 131,076 | | | | 0.99 | | | | 1.10 | | | | (0.94 | ) | | | 21 | |
Year ended 10/31/13 | | | 10.80 | | | | (0.08 | ) | | | (1.36 | ) | | | (1.44 | ) | | | (0.23 | ) | | | 9.13 | | | | (13.61 | ) | | | 124,497 | | | | 0.97 | | | | 1.12 | | | | (0.89 | ) | | | 47 | |
Year ended 10/31/12(e) | | | 11.15 | | | | (0.01 | ) | | | (0.34 | ) | | | (0.35 | ) | | | — | | | | 10.80 | | | | (3.14 | ) | | | 101,349 | | | | 0.97 | (f) | | | 1.15 | (f) | | | (0.88 | )(f) | | | 152 | |
| (a) | Calculated using average shares outstanding. |
| (b) | Includes adjustments in accordance with accounting principles generally accepted in the United States of America and as such, the net asset value for financial reporting purposes and the returns based upon those net asset values may differ from the net asset value and returns for shareholder transactions. Does not include sales charges and is not annualized for periods less than one year, if applicable. |
| (c) | Portfolio turnover is calculated at the fund level and is not annualized for periods less than one year, if applicable. For the period ended October 31, 2012, the portfolio turnover calculation excludes the value of securities purchased of $32,276,528 and sold of $14,234,590 in the effort to realign the Fund’s portfolio holdings after the reorganization of Invesco Commodities Strategy Fund into the Fund. |
| (d) | Ratios are based on average daily net assets (000’s omitted) of $39,428, $357, $2,932, $372, $241,126, $270,119 and $126,969 for Class A, Class B, Class C, Class R, Class Y, Class R5 and Class R6 shares, respectively. |
| (e) | Commencement date of November 30, 2010 for Class A, Class B, Class C, Class R, Class Y and Class R5 shares. Commencement date of September 24, 2012 for Class R6 shares. |
24 Invesco Balanced-Risk Commodity Strategy Fund
Report of Independent Registered Public Accounting Firm
To the Board of Trustees of AIM Investment Funds (Invesco Investment Funds)
and Shareholders of Invesco Balanced-Risk Commodity Strategy Fund:
In our opinion, the accompanying consolidated statement of assets and liabilities, including the consolidated schedule of investments, and the related consolidated statements of operations and of changes in net assets and the financial highlights present fairly, in all material respects, the consolidated financial position of Invesco Balanced-Risk Commodity Strategy Fund (one of the funds constituting AIM Investment Funds (Invesco Investment Funds), hereafter referred to as the “Fund”) at October 31, 2015, the results of its operations for the year then ended, the changes in its net assets for each of the two years in the period then ended and the financial highlights for each of the four years in the period then ended and for the period November 30, 2010 (commencement of operations) through October 31, 2011, in conformity with accounting principles generally accepted in the United States of America. These consolidated financial statements and financial highlights (hereafter referred to as “financial statements”) are the responsibility of the Fund’s management. Our responsibility is to express an opinion on these financial statements based on our audits. We conducted our audits of these financial statements in accordance with the standards of the Public Company Accounting Oversight Board (United States). Those standards require that we plan and perform the audit to obtain reasonable assurance about whether the financial statements are free of material misstatement. An audit includes examining, on a test basis, evidence supporting the amounts and disclosures in the financial statements, assessing the accounting principles used and significant estimates made by management, and evaluating the overall financial statement presentation. We believe that our audits, which included confirmation of securities at October 31, 2015 by correspondence with the custodian and brokers, provide a reasonable basis for our opinion.
PRICEWATERHOUSECOOPERS LLP
December 23, 2015
Houston, Texas
25 Invesco Balanced-Risk Commodity Strategy Fund
Calculating your ongoing Fund expenses
Example
As a shareholder of the Fund, you incur two types of costs: (1) transaction costs, which may include sales charges (loads) on purchase payments or contingent deferred sales charges on redemptions, if any; and (2) ongoing costs, including distribution and/or service (12b-1) fees, and other Fund expenses. This example is intended to help you understand your ongoing costs (in dollars) of investing in the Fund and to compare these costs with ongoing costs of investing in other mutual funds. The example is based on an investment of $1,000 invested at the beginning of the period and held for the entire period May 1, 2015, through October 31, 2015.
In addition to the fees and expenses which the Fund bears directly, the Fund indirectly bears a pro rata share of the fees and expenses of the underlying funds in which the Fund invests. The amount of fees and expenses incurred indirectly by the Fund will vary because the underlying funds have varied expenses and fee levels and the Fund may own different proportions of the underlying funds at different times. Estimated underlying fund expenses are not expenses that are incurred directly by the Fund. They are expenses that are incurred directly by the underlying funds and are deducted from the value of the underlying funds the Fund invests in. The effect of the estimated underlying fund expenses that the Fund bears indirectly are included in the Fund’s total return.
Actual expenses
The table below provides information about actual account values and actual expenses. You may use the information in this table, together with the amount you invested, to estimate the expenses that you paid over the period. Simply divide your account value by $1,000 (for example, an $8,600 account value divided by $1,000 = 8.6), then multiply the result by the number in the table under the heading entitled “Actual Expenses Paid During Period” to estimate the expenses you paid on your account during this period.
Hypothetical example for comparison purposes
The table below also provides information about hypothetical account values and hypothetical expenses based on the Fund’s actual expense ratio and an assumed rate of return of 5% per year before expenses, which is not the Fund’s actual return.
The hypothetical account values and expenses may not be used to estimate the actual ending account balance or expenses you paid for the period. You may use this information to compare the ongoing costs of investing in the Fund and other funds. To do so, compare this 5% hypothetical example with the 5% hypothetical examples that appear in the shareholder reports of the other funds.
Please note that the expenses shown in the table are meant to highlight your ongoing costs only and do not reflect any transaction costs, such as sales charges (loads) on purchase payments or contingent deferred sales charges on redemptions, if any. Therefore, the hypothetical information is useful in comparing ongoing costs only, and will not help you determine the relative total costs of owning different funds. In addition, expenses shown in the table do not include the expenses of the underlying funds, which are borne indirectly by the Fund. If transaction costs and indirect expenses were included, your costs would have been higher.
| | | | | | | | | | | | | | | | | | | | | | | | |
| Class | | Beginning
Account Value
(05/01/15) | | | ACTUAL | | | HYPOTHETICAL (5% annual return before
expenses) | | | Annualized
Expense Ratio | |
| | | Ending
Account Value
(10/31/15)1 | | | Expenses
Paid During
Period2 | | | Ending
Account Value
(10/31/15) | | | Expenses
Paid During
Period2 | | |
| A | | $ | 1,000.00 | | | $ | 887.40 | | | $ | 7.42 | | | $ | 1,017.34 | | | $ | 7.93 | | | | 1.56 | % |
| B | | | 1,000.00 | | | | 884.20 | | | | 10.97 | | | | 1,013.56 | | | | 11.72 | | | | 2.31 | |
| C | | | 1,000.00 | | | | 884.10 | | | | 10.97 | | | | 1,013.56 | | | | 11.72 | | | | 2.31 | |
| R | | | 1,000.00 | | | | 885.20 | | | | 8.60 | | | | 1,016.08 | | | | 9.20 | | | | 1.81 | |
| Y | | | 1,000.00 | | | | 887.60 | | | | 6.23 | | | | 1,018.60 | | | | 6.67 | | | | 1.31 | |
| R5 | | | 1,000.00 | | | | 888.90 | | | | 5.52 | | | | 1,019.36 | | | | 5.90 | | | | 1.16 | |
| R6 | | | 1,000.00 | | | | 889.00 | | | | 5.05 | | | | 1,019.86 | | | | 5.40 | | | | 1.06 | |
| 1 | The actual ending account value is based on the actual total return of the Fund for the period May 1, 2015 through October 31, 2015, after actual expenses and will differ from the hypothetical ending account value which is based on the Fund’s expense ratio and a hypothetical annual return of 5% before expenses. |
| 2 | Expenses are equal to the Fund’s annualized expense ratio as indicated above multiplied by the average account value over the period, multiplied by 184/365 to reflect the most recent fiscal half year. |
26 Invesco Balanced-Risk Commodity Strategy Fund
Approval of Investment Advisory and Sub-Advisory Contracts
The Board of Trustees (the Board) of AIM Investment Funds (Invesco Investment Funds) is required under the Investment Company Act of 1940, as amended, to approve annually the renewal of Invesco Balanced-Risk Commodity Strategy Fund’s (the Fund) investment advisory agreements. During contract renewal meetings held on June 9-10, 2015, the Board as a whole, and the disinterested or “independent” Trustees, who comprise over 75% of the Board, voting separately, approved the continuance for the Fund of the Master Investment Advisory Agreement with Invesco Advisers, Inc. (Invesco Advisers and the investment advisory agreement) and the Master Intergroup Sub-Advisory Contract for Mutual Funds with Invesco Asset Management Deutschland GmbH, Invesco Asset Management Limited, Invesco Asset Management (Japan) Limited, Invesco Hong Kong Limited, Invesco Senior Secured Management, Inc. and Invesco Canada Ltd. (collectively, the Affiliated Sub-Advisers and the sub-advisory contracts) for another year, effective July 1, 2015.
In evaluating the fairness and reasonableness of compensation under the Fund’s investment advisory agreement and sub-advisory contracts, the Board considered, among other things, the factors discussed below. The Board determined that continuation of the Fund’s investment advisory agreement and the sub-advisory contracts are in the best interest of the Fund and its shareholders and that the compensation payable to Invesco Advisers and the Affiliated Sub-Advisers under the agreements is fair and reasonable.
The Board’s Fund Evaluation Process
The Board’s Investments Committee has established three Sub-Committees, each of which is primarily responsible for overseeing the performance and investment management services provided by Invesco Advisers and the Affiliated Sub-Advisers to a number of the funds advised by Invesco Advisers (the Invesco Funds). The Sub-Committees meet throughout the year to review the performance of their assigned Invesco Funds, including reviewing materials prepared under the direction of the independent Senior Officer, an officer of the Invesco Funds who reports directly to the independent Trustees. Over the course of each year, the Sub-Committees meet with portfolio managers for their assigned Invesco Funds and other members of management to review the performance, investment objective(s), policies, strategies, limitations and investment risks of these funds. The Board had the benefit of reports form the Sub-Committees and Investments Committee throughout the year in considering approval of the continuance of each Invesco Fund’s investment advisory agreement and sub-advisory contracts for another year.
During the contract renewal process, the Board receives comparative performance and fee data regarding the Invesco Funds prepared by Invesco Advisers and Lipper Inc. (Lipper), an independent provider of investment company data. The Board also receives a report and this independent written evaluation from the Senior Officer. The Senior Officer’s evaluation is prepared as part of his responsibility to manage the process by which the Invesco Funds’ proposed management fees are negotiated during the annual contract renewal process to ensure they are negotiated in a manner that is at arms’ length and reasonable. In addition to meetings with Invesco Advisers and fund counsel, the independent Trustees also discuss the continuance of the investment advisory agreement and sub-advisory contracts in separate sessions with the Senior Officer and with independent legal counsel.
The Trustees recognized that the advisory fee rates for the Invesco Funds are, in many cases, the result of years of review and negotiation. The Trustees’ deliberations and conclusions in a particular year may be based in part on their deliberations and conclusions regarding these same arrangements throughout the year and in prior years. The Trustees’ review and conclusions are based on the comprehensive consideration of all information presented to them and are not the result of any single determinative factor. Moreover, one Trustee may have weighed a particular piece of information or factor differently than another Trustee.
The discussion below is a summary of the Senior Officer’s independent written evaluation with respect to the Fund’s investment advisory agreement as well as a discussion of the material factors and related conclusions that formed the basis for the Board’s approval of the Fund’s investment advisory agreement and sub-advisory contracts. Unless otherwise stated, this information is current as of June 10, 2015, and does not reflect consideration of factors that became known to the Board after that date.
Factors and Conclusions and Summary of Independent Written Fee Evaluation
| A. | Nature, Extent and Quality of Services Provided by Invesco Advisers and the Affiliated Sub-Advisers |
The Board reviewed the advisory services provided to the Fund by Invesco Advisers under the Fund’s investment advisory agreement, the performance of Invesco Advisers in providing these services, and the credentials and experience of the officers and employees of Invesco Advisers who provide these services, including the Fund’s portfolio manager or managers. The Board’s review of the qualifications of Invesco Advisers to provide advisory services included the Board’s
consideration of Invesco Advisers’ investment process oversight, independent credit analysis and investment risk management. The Board also considered non-advisory services that Invesco Advisers and its affiliates provide to the Invesco Funds such as various back office support functions, equity and fixed income trading operations, internal audit, distribution, valuation and legal and compliance.
In determining whether to continue the Fund’s investment advisory agreement, the Board considered the benefits of reapproving an existing relationship and the greater uncertainty that may be associated with entering into a new relationship. The Board concluded that the nature, extent and quality of the services provided to the Fund by Invesco Advisers are appropriate and satisfactory and consistent with the terms of the Fund’s investment advisory agreement.
The Board reviewed the services that may be provided by the Affiliated Sub-Advisers under the sub-advisory contracts and the credentials and experience of the officers and employees of the Affiliated Sub-Advisers who provide these services. The Board noted that the Affiliated Sub-Advisers have offices and personnel that are located in financial centers around the world. As a result, the Affiliated Sub-Advisers can provide research and investment analysis on the markets and economies of various countries in which the Fund may invest, make recommendations regarding securities and assist with security trades. The Board concluded that the sub-advisory contracts benefit the Fund and its shareholders by permitting Invesco Advisers to use the resources and talents of the Affiliated Sub-Advisers in managing the Fund. The Board concluded that the nature, extent and quality of the services that may be provided by the Affiliated Sub-Advisers are appropriate and satisfactory and consistent with the terms of the Fund’s sub-advisory contracts.
The Board considered Fund performance as a relevant factor in considering whether to approve the investment advisory agreement. The Board did not view Fund performance as a relevant factor in considering whether to approve the sub-advisory contracts for the Fund, as no Affiliated Sub-Adviser currently manages assets of the Fund.
The Board noted that only four calendar years of comparative performance data was available for the Fund. The Board compared the Fund’s performance during the past one, three and four calendar years to the performance of funds in the Lipper performance universe and against the Lipper Commodities General Funds Index. The Board noted that performance of Class A shares of the Fund was in the second quintile of its performance universe for the one and four year periods and the third quintile for the three year period (the first quintile being
27 Invesco Balanced-Risk Commodity Strategy Fund
the best performing funds and the fifth quintile being the worst performing funds). The Board noted that performance of Class A shares of the Fund was below the performance of the Index for the one, three and four year periods. Invesco Advisers noted that recent performance was helped by being underweight to Energy relative to the Fund’s peers. The Trustees also reviewed more recent Fund performance and this review did not change their conclusions.
| C. | Advisory and Sub-Advisory Fees |
The Board compared the Fund’s contractual management fee rate to the contractual management fee rates of funds in the Fund’s Lipper expense group at a common asset level. The Board noted that the contractual management fee rate for Class A shares of the Fund was at the median contractual management fee rate of funds in its expense group. The Board noted that the term “contractual management fee” may include both advisory and certain administrative services fees, but that Lipper does not provide information on a fund by fund basis as to what is included. The Board noted that Invesco Advisers does not charge the Invesco Funds for the administrative services included in the term as defined by Lipper. The Board also reviewed the methodology used by Lipper in providing expense group information, which includes using each fund’s contractual management fee schedule (including any applicable breakpoints) as reported in the most recent prospectus or statement of additional information for each fund in the expense group.
The Board noted that Invesco Advisers and its affiliates do not manage other mutual funds or client accounts with investment strategies comparable to those of the Fund.
The Board did consider the fees charged by Invesco Advisers and the Affiliated Sub-Advisers to other client accounts that are managed using an investment process substantially similar to the investment process use for the Fund. The Board noted that Invesco Advisers or the Affiliated Sub-Advisers may charge lower fees to large institutional clients. Invesco Advisers reviewed with the Board the significantly greater scope of services it provides to the Invesco Funds relative to certain other types of client accounts. These additional services include provision of administrative services, officers and office space, oversight of service providers, preparation of annual registration statement updates and financial information and regulatory compliance under the Investment Company Act of 1940, as amended.
Invesco Advisers also reviewed generally the higher frequency of shareholder purchases and redemptions in the Invesco Funds relative to the flow of assets for other client accounts. Invesco Advisers advised the Board that advance notice of redemptions is often provided to Invesco Advisers by institutional clients. The Board did note that sub-advisory fee rates charged by the Affiliated Sub-Advisers to manage the Invesco Funds and to manage other client accounts tended to be more comparable, reflecting a
similar scope of services. The information received by the Board demonstrated that the aggregate services provided to the Invesco Funds were sufficiently different from those provided to institutional clients to support the difference in fees.
The Board also considered the services that may be provided by the Affiliated Sub-Advisers pursuant to the sub-advisory contracts, as well as the fees payable by Invesco Advisers to the Affiliated Sub-Advisers pursuant to the sub-advisory contracts. The Board also noted that the sub-advisory fees are not paid directly by the Fund, but rather, are payable by Invesco Advisers to the Affiliated Sub-Advisers.
| D. | Economies of Scale and Breakpoints |
The Board considered the extent to which there are economies of scale in the provision of advisory services to the Fund. The Board also considered whether the Fund benefits from economies of scale through contractual breakpoints in the Fund’s advisory fee schedule. The Board also noted that the Fund shares directly in economies of scale through lower fees charged by third party service providers based on the combined size of the Invesco Funds and other clients advised by Invesco Advisers.
| E. | Profitability and Financial Resources |
The Board reviewed information from Invesco Advisers concerning the costs of the advisory and other services that Invesco Advisers and its affiliates provide to the Fund and the Invesco Funds and the profitability of Invesco Advisers and its affiliates in providing these services. The Board received information from Invesco Advisers about the methodology used to prepare the profitability information. The Board noted that Invesco Advisers continues to operate at a net profit from services Invesco Advisers and its affiliates provide to the Invesco Funds and the Fund. The Board did not deem the level of profits realized by Invesco Advisers and its affiliates from providing services to the Fund to be excessive given the nature, quality and extent of the services provided. The Board received and accepted information from Invesco Advisers demonstrating that Invesco Advisers and each Affiliated Sub-Adviser are financially sound and have the resources necessary to perform their obligations under the investment advisory agreement and sub-advisory contracts.
| F. | Collateral Benefits to Invesco Advisers and its Affiliates |
The Board considered various other benefits received by Invesco Advisers and its affiliates from the relationship with the Fund, including the fees received for providing transfer agency and distribution services to the Fund. The Board considered comparative information regarding fees charged for these services, including information provided by Lipper and other independent sources. The Board considered the performance of Invesco Advisers and its affiliates in providing these services and the organizational structure employed to provide these services. The Board also considered that these services are provided to the Fund
pursuant to written contracts that are reviewed and approved on an annual basis by the Board; and that the services are required for the operation of the Fund.
The Board considered the benefits realized by Invesco Advisers and the Affiliated Sub-Advisers as a result of portfolio brokerage transactions executed through “soft dollar” arrangements. Invesco Advisers noted that the Fund does not execute brokerage transaction through “soft dollar” arrangements to any significant degree.
The Board considered that the Fund’s uninvested cash and cash collateral from any securities lending arrangements may be invested in money market funds advised by Invesco Advisers pursuant to procedures approved by the Board. The Board noted that Invesco Advisers receives advisory fees from these affiliated money market funds attributable to such investments, although Invesco Advisers has contractually agreed to waive through varying periods the advisory fees payable by the Invesco Funds with respect to investments in the affiliated money market funds. The waiver is in an amount equal to 100% of the net advisory fee Invesco Advisers receives from the affiliated money market funds with respect to the Fund’s investment in the affiliated money market funds of uninvested cash, but not cash collateral. The Board concluded that the amount of advisory fees received by Invesco Advisors from the Fund’s investment of cash collateral from any securities lending arrangements in the affiliated money market funds is fair and reasonable.
28 Invesco Balanced-Risk Commodity Strategy Fund
Trustees and Officers
The address of each trustee and officer is AIM Investment Funds (Invesco Investment Funds) (the “Trust”), 11 Greenway Plaza, Suite 1000, Houston, Texas 77046-1173. The trustees serve for the life of the Trust, subject to their earlier death, incapacitation, resignation, retirement or removal as more specifically provided in the Trust’s organizational documents. Each officer serves for a one year term or until their successors are elected and qualified. Column two below includes length of time served with predecessor entities, if any.
| | | | | | | | |
Name, Year of Birth and
Position(s) Held with the Trust | | Trustee and/
or Officer Since | | Principal Occupation(s)
During Past 5 Years | | Number of Funds in Fund Complex Overseen by Trustee | | Other Directorship(s) Held by Trustee During Past 5 Years |
| Interested Persons | | | | | | | | |
| Martin L. Flanagan1 — 1960 Trustee | | 2007 | | Executive Director, Chief Executive Officer and President, Invesco Ltd. (ultimate parent of Invesco and a global investment management firm); Advisor to the Board, Invesco Advisers, Inc. (formerly known as Invesco Institutional (N.A.), Inc.); Trustee, The Invesco Funds; Vice Chair, Investment Company Institute; and Member of Executive Board, SMU Cox School of Business Formerly: Chairman and Chief Executive Officer, Invesco Advisers, Inc. (registered investment adviser); Director, Chairman, Chief Executive Officer and President, IVZ Inc. (holding company), INVESCO Group Services, Inc. (service provider) and Invesco North American Holdings, Inc. (holding company); Director, Chief Executive Officer and President, Invesco Holding Company Limited (parent of Invesco and a global investment management firm); Director, Invesco Ltd.; Chairman, Investment Company Institute and President, Co-Chief Executive Officer, Co-President, Chief Operating Officer and Chief Financial Officer, Franklin Resources, Inc. (global investment management organization). | | 145 | | None |
Philip A. Taylor2 — 1954
Trustee, President and Principal Executive Officer | | 2006 | | Head of North American Retail and Senior Managing Director, Invesco Ltd.; Director, Co-Chairman, Co-President and Co-Chief Executive Officer, Invesco Advisers, Inc. (formerly known as Invesco Institutional (N.A.), Inc.) (registered investment adviser); Director, Chairman, Chief Executive Officer and President, Invesco Management Group, Inc. (formerly known as Invesco Aim Management Group, Inc.) (financial services holding company); Director and President, INVESCO Funds Group, Inc. (registered investment adviser and registered transfer agent); Director and Chairman, Invesco Investment Services, Inc. (formerly known as Invesco Aim Investment Services, Inc.) (registered transfer agent) and IVZ Distributors, Inc. (formerly known as INVESCO Distributors, Inc.) (registered broker dealer); Chief Executive Officer, Invesco Corporate Class Inc. (corporate mutual fund company) Director, Chairman and Chief Executive Officer, Invesco Canada Ltd. (formerly known as Invesco Trimark Ltd./Invesco Trimark Ltèe) (registered investment adviser and registered transfer agent); Trustee, President and Principal Executive Officer, The Invesco Funds (other than AIM Treasurer’s Series Trust (Invesco Treasurer’s Series Trust), Short-Term Investments Trust and Invesco Management Trust); Trustee and Executive Vice President, The Invesco Funds (AIM Treasurer’s Series Trust (Invesco Treasurer’s Series Trust), Short-Term Investments Trust and Invesco Management Trust only); Director, Invesco Investment Advisers LLC (formerly known as Van Kampen Asset Management); Director, Chief Executive Officer and President, Van Kampen Exchange Corp. Formerly: Director, President and Chairman, Invesco Inc. (holding company), Invesco Canada Holdings Inc. (holding company), Trimark Investments Ltd./Placements Trimark Ltèe and Invesco Financial Services Ltd/Services Financiers Invesco Ltèe; Chief Executive Officer, Invesco Canada Fund Inc (corporate mutual fund company); Director and Chairman, Van Kampen Investor Services Inc.; Director, Chief Executive Officer and President, 1371 Preferred Inc. (holding company) and Van Kampen Investments Inc.; Director and President, AIM GP Canada Inc. (general partner for limited partnerships) and Van Kampen Advisors, Inc.; Director and Chief Executive Officer, Invesco Trimark Dealer Inc. (registered broker dealer); Director, Invesco Distributors, Inc. (formerly known as Invesco Aim Distributors, Inc.) (registered broker dealer); Manager, Invesco PowerShares Capital Management LLC; Director, Chief Executive Officer and President, Invesco Advisers, Inc.; Director, Chairman, Chief Executive Officer and President, Invesco Aim Capital Management, Inc.; President, Invesco Trimark Dealer Inc. and Invesco Trimark Ltd./Invesco Trimark Ltèe; Director and President, AIM Trimark Corporate Class Inc. and AIM Trimark Canada Fund Inc.; Senior Managing Director, Invesco Holding Company Limited; Director and Chairman, Fund Management Company (former registered broker dealer); President and Principal Executive Officer, The Invesco Funds (AIM Treasurer’s Series Trust (Invesco Treasurer’s Series Trust), and Short-Term Investments Trust only); President, AIM Trimark Global Fund Inc. and AIM Trimark Canada Fund Inc.. | | 145 | | None |
| 1 | Mr. Flanagan is considered an interested person (within the meaning of Section 2(a)(19) of the 1940 Act) of the Trust because he is an officer of the Adviser to the Trust, and an officer and a director of Invesco Ltd., ultimate parent of the Adviser. |
| 2 | Mr. Taylor is considered an interested person (within the meaning of Section 2(a)(19) of the 1940 Act) of the Trust because he is an officer and a director of the Adviser. |
T-1 Invesco Balanced-Risk Commodity Strategy Fund
Trustees and Officers—(continued)
| | | | | | | | |
Name, Year of Birth and Position(s) Held with the Trust | | Trustee and/ or Officer Since | | Principal Occupation(s) During Past 5 Years | | Number of Funds in Fund Complex Overseen by Trustee | | Other Directorship(s) Held by Trustee During Past 5 Years |
| Independent Trustees | | | | | | | | |
Bruce L. Crockett — 1944 Trustee and Chair | | 2003 | | Chairman, Crockett Technologies Associates (technology consulting company) Formerly: Director, Captaris (unified messaging provider); Director, President and Chief Executive Officer, COMSAT Corporation; Chairman, Board of Governors of INTELSAT (international communications company); ACE Limited (insurance company); Independent Directors Council and Investment Company Institute | | 145 | | ALPS (Attorneys Liability Protection Society) (insurance company) and Globe Specialty Metals, Inc. (metallurgical company) |
David C. Arch — 1945 Trustee | | 2010 | | Chairman of Blistex Inc., a consumer health care products manufacturer | | 145 | | Board member of the Illinois Manufacturers’ Association; Member of the Board of Visitors, Institute for the Humanities, University of Michigan; Member of the Audit Committee of the Edward-Elmhurst Hospital |
James T. Bunch — 1942 Trustee | | 2000 | | Managing Member, Grumman Hill Group LLC (family office/private equity investments) Formerly: Founder, Green Manning & Bunch Ltd. (investment banking firm) (1988-2010); Executive Committee, United States Golf Association; and Chairman, Board of Governors, Western Golf Association | | 145 | | Chairman of the Board of Trustees, Evans Scholars Foundation; and Chairman of the Board, Denver Film Society |
Rodney F. Dammeyer — 1940 Trustee | | 2010 | | Chairman of CAC, LLC, (private company offering capital investment and management advisory services) Formerly: Prior to 2001, Managing Partner at Equity Group Corporate Investments; Prior to 1995, Chief Executive Officer of Itel Corporation (formerly Anixter International); Prior to 1985, experience includes Senior Vice President and Chief Financial Officer of Household International, Inc., Executive Vice President and Chief Financial Officer of Northwest Industries, Inc. and Partner of Arthur Andersen & Co.; From 1987 to 2010, Director/Trustee of investment companies in the Van Kampen Funds complex | | 145 | | Director of Quidel Corporation and Stericycle, Inc. |
Albert R. Dowden — 1941 Trustee | | 2003 | | Director of a number of public and private business corporations, including the Boss Group, Ltd. (private investment and management); Nature’s Sunshine Products, Inc. and Reich & Tang Funds (5 portfolios) (registered investment company) Formerly: Director, Homeowners of America Holding Corporation/Homeowners of America Insurance Company (property casualty company); Director, Continental Energy Services, LLC (oil and gas pipeline service); Director, CompuDyne Corporation (provider of product and services to the public security market) and Director, Annuity and Life Re (Holdings), Ltd. (reinsurance company); Director, President and Chief Executive Officer, Volvo Group North America, Inc.; Senior Vice President, AB Volvo; Director of various public and private corporations; Chairman, DHJ Media, Inc.; Director, Magellan Insurance Company; and Director, The Hertz Corporation, Genmar Corporation (boat manufacturer), National Media Corporation; Advisory Board of Rotary Power International (designer, manufacturer, and seller of rotary power engines); and Chairman, Cortland Trust, Inc. (registered investment company) | | 145 | | Director of: Nature’s Sunshine Products, Inc., Reich & Tang Funds, Homeowners of America Holding Corporation/ Homeowners of America Insurance Company, the Boss Group |
Jack M. Fields — 1952 Trustee | | 2003 | | Chief Executive Officer, Twenty First Century Group, Inc. (government affairs company); Owner and Chief Executive Officer, Dos Angeles Ranch, L.P. (cattle, hunting, corporate entertainment); and Discovery Global Education Fund (non-profit) Formerly: Chief Executive Officer, Texana Timber LP (sustainable forestry company); Director of Cross Timbers Quail Research Ranch (non-profit); and member of the U.S. House of Representatives | | 145 | | Insperity, Inc. (formerly known as Administaff) |
Prema Mathai-Davis — 1950 Trustee | | 2003 | | Retired. Formerly: Chief Executive Officer, YWCA of the U.S.A. | | 145 | | None |
Larry Soll — 1942 Trustee | | 1997 | | Retired. Formerly: Chairman, Chief Executive Officer and President, Synergen Corp. (a biotechnology company) | | 145 | | None |
Hugo F. Sonnenschein — 1940 Trustee | | 2010 | | President Emeritus and Honorary Trustee of the University of Chicago and the Adam Smith Distinguished Service Professor in the Department of Economics at the University of Chicago. Prior to 2000, President of the University of Chicago | | 145 | | Trustee of the University of Rochester and a member of its investment committee; Member of the National Academy of Sciences and the American Philosophical Society; Fellow of the American Academy of Arts and Sciences |
Raymond Stickel, Jr. — 1944 Trustee | | 2005 | | Retired. Formerly: Director, Mainstay VP Series Funds, Inc. (25 portfolios) and Partner, Deloitte & Touche | | 145 | | None |
T-2 Invesco Balanced-Risk Commodity Strategy Fund
Trustees and Officers—(continued)
| | | | | | | | |
Name, Year of Birth and Position(s) Held with the Trust | | Trustee and/ or Officer Since | | Principal Occupation(s) During Past 5 Years | | Number of Funds in Fund Complex Overseen by Trustee | | Other Directorship(s) Held by Trustee During Past 5 Years |
| Independent Trustees—(continued) |
Suzanne H. Woolsey — 1941 Trustee | | 2014 | | Chief Executive Officer of Woolsey Partners LLC | | 145 | | Emeritus Chair of the Board of Trustees of the Institute for Defense Analyses; Trustee of Colorado College; Trustee of California Institute of Technology; Prior to 2014, Director of Fluor Corp.; Prior to 2010, Trustee of the German Marshall Fund of the United States; Prior to 2010 Trustee of the Rocky Mountain Institute |
| Other Officers | | | | | | | | |
Russell C. Burk — 1958
Senior Vice President and Senior Officer | | 2005 | | Senior Vice President and Senior Officer, The Invesco Funds | | N/A | | N/A |
John M. Zerr — 1962
Senior Vice President, Chief Legal Officer and Secretary | | 2006 | | Director, Senior Vice President, Secretary and General Counsel, Invesco Management Group, Inc. (formerly known as Invesco Aim Management Group, Inc.) and Van Kampen Exchange Corp.; Senior Vice President, Invesco Advisers, Inc. (formerly known as Invesco Institutional (N.A.), Inc.) (registered investment adviser); Senior Vice President and Secretary, Invesco Distributors, Inc. (formerly known as Invesco Aim Distributors, Inc.); Director, Vice President and Secretary, Invesco Investment Services, Inc. (formerly known as Invesco Aim Investment Services, Inc.) and IVZ Distributors, Inc. (formerly known as INVESCO Distributors, Inc.); Director and Vice President, INVESCO Funds Group, Inc.; Senior Vice President, Chief Legal Officer and Secretary, The Invesco Funds; Managing Director, Invesco PowerShares Capital Management LLC; Director, Secretary and General Counsel, Invesco Investment Advisers LLC (formerly known as Van Kampen Asset Management); Secretary and General Counsel, Invesco Capital Markets, Inc. (formerly known as Van Kampen Funds Inc.) and Chief Legal Officer, PowerShares Exchange-Traded Fund Trust, PowerShares Exchange-Traded Fund Trust II, PowerShares India Exchange-Traded Fund Trust, PowerShares Actively Managed Exchange-Traded Fund Trust, and PowerShares Actively Managed Exchange-Traded Commodity Fund Trust Formerly: Director and Vice President, Van Kampen Advisors Inc.; Director, Vice President, Secretary and General Counsel, Van Kampen Investor Services Inc.; Director, Invesco Distributors, Inc. (formerly known as Invesco Aim Distributors, Inc.); Director, Senior Vice President, General Counsel and Secretary, Invesco Aim Advisers, Inc. and Van Kampen Investments Inc.; Director, Vice President and Secretary, Fund Management Company; Director, Senior Vice President, Secretary, General Counsel and Vice President, Invesco Aim Capital Management, Inc.; Chief Operating Officer and General Counsel, Liberty Ridge Capital, Inc. (an investment adviser); Vice President and Secretary, PBHG Funds (an investment company) and PBHG Insurance Series Fund (an investment company); Chief Operating Officer, General Counsel and Secretary, Old Mutual Investment Partners (a broker-dealer); General Counsel and Secretary, Old Mutual Fund Services (an administrator) and Old Mutual Shareholder Services (a shareholder servicing center); Executive Vice President, General Counsel and Secretary, Old Mutual Capital, Inc. (an investment adviser); and Vice President and Secretary, Old Mutual Advisors Funds (an investment company) | | N/A | | N/A |
Sheri Morris — 1964
Vice President, Treasurer and Principal Financial Officer | | 2003 | | Vice President, Treasurer and Principal Financial Officer, The Invesco Funds; Vice President, Invesco Advisers, Inc. (formerly known as Invesco Institutional (N.A.), Inc.) (registered investment adviser); and Vice President, PowerShares Exchange-Traded Fund Trust, PowerShares Exchange-Traded Fund Trust II, PowerShares India Exchange-Traded Fund Trust, PowerShares Actively Managed Exchange-Traded Fund Trust, and PowerShares Actively Managed Exchange-Traded Commodity Fund Trust Formerly: Vice President, Invesco Aim Advisers, Inc., Invesco Aim Capital Management, Inc. and Invesco Aim Private Asset Management, Inc.; Assistant Vice President and Assistant Treasurer, The Invesco Funds and Assistant Vice President, Invesco Advisers, Inc., Invesco Aim Capital Management, Inc. and Invesco Aim Private Asset Management, Inc.; and Treasurer, PowerShares Exchange-Traded Fund Trust, PowerShares Exchange-Traded Fund Trust II, PowerShares India Exchange-Traded Fund Trust and PowerShares Actively Managed Exchange-Traded Fund Trust | | N/A | | N/A |
T-3 Invesco Balanced-Risk Commodity Strategy Fund
Trustees and Officers—(continued)
| | | | | | | | |
Name, Year of Birth and
Position(s) Held with the Trust | | Trustee and/
or Officer Since | | Principal Occupation(s)
During Past 5 Years | | Number of Funds in Fund Complex Overseen by Trustee | | Other Directorship(s) Held by Trustee During Past 5 Years |
| Other Officers—(continued) | | | | | | | | |
Karen Dunn Kelley — 1960
Vice President | | 2003 | | Senior Managing Director, Investments, Invesco Ltd.; Director, Co-President, Co-Chief Executive Officer, and Co-Chairman, Invesco Advisers, Inc. (formerly known as Invesco Institutional (N.A.), Inc.) (registered investment adviser); Chairman, Invesco Senior Secured Management, Inc.; Senior Vice President, Invesco Management Group, Inc. (formerly known as Invesco Aim Management Group, Inc.); Executive Vice President, Invesco Distributors, Inc. (formerly known as Invesco Aim Distributors, Inc.); Director, Invesco Mortgage Capital Inc. and Invesco Management Company Limited; Vice President, The Invesco Funds (other than AIM Treasurer’s Series Trust (Invesco Treasurer’s Series Trust), Short-Term Investments Trust and Invesco Management Trust); and President and Principal Executive Officer, The Invesco Funds (AIM Treasurer’s Series Trust (Invesco Treasurer’s Series Trust), Short-Term Investments Trust and Invesco Management Trust only) Formerly: Director and President, INVESCO Asset Management (Bermuda) Ltd., Director, INVESCO Global Asset Management Limited and INVESCO Management S.A.; Senior Vice President, Van Kampen Investments Inc. and Invesco Advisers, Inc. (formerly known as Invesco Institutional (N.A.), Inc.) (registered investment adviser); Vice President, Invesco Advisers, Inc. (formerly known as Invesco Institutional (N.A.), Inc.); Director of Cash Management and Senior Vice President, Invesco Advisers, Inc. and Invesco Aim Capital Management, Inc.; Director and President, Fund Management Company; Chief Cash Management Officer, Director of Cash Management, Senior Vice President, and Managing Director, Invesco Aim Capital Management, Inc.; Director of Cash Management, Senior Vice President, and Vice President, Invesco Advisers, Inc. and The Invesco Funds (AIM Treasurer’s Series Trust (Invesco Treasurer’s Series Trust), and Short-Term Investments Trust only) | | N/A | | N/A |
Crissie M. Wisdom — 1969 Anti-Money Laundering Compliance Officer | | 2013 | | Anti-Money Laundering Compliance Officer, Invesco Advisers, Inc. (formerly known as Invesco Institutional (N.A.), Inc.) (registered investment adviser), Invesco Capital Markets, Inc. (formerly known as Van Kampen Funds Inc.), Invesco Distributors, Inc., Invesco Investment Services, Inc., Invesco Management Group, Inc., Van Kampen Exchange Corp., The Invesco Funds, and PowerShares Exchange-Traded Fund Trust, PowerShares Exchange-Traded Fund Trust II, PowerShares India Exchange-Traded Fund Trust, PowerShares Actively Managed Exchange-Traded Fund Trust and PowerShares Actively Managed Exchange-Traded Commodity Fund Trust; Anti-Money Laundering Compliance Officer and Bank Secrecy Act Officer, INVESCO National Trust Company and Invesco Trust Company; and Fraud Prevention Manager and Controls and Risk Analysis Manager for Invesco Investment Services, Inc.. | | N/A | | N/A |
Lisa O. Brinkley — 1959 Chief Compliance Officer | | 2015 | | Senior Vice President and Chief Compliance Officer, Invesco Advisers, Inc. (registered investment adviser) (formerly known as Invesco Institutional (N.A., Inc.); and Chief Compliance Officer, The Invesco Funds Formerly: Global Assurance Officer, Invesco Ltd. and Vice President, The Invesco Funds; Chief Compliance Officer, Invesco Distributors, Inc. (formerly known as Invesco Aim Distributors, Inc.), Invesco Investment Services, Inc.(formerly known as Invesco Aim Investment Services, Inc.) and Van Kampen Investor Services Inc.; Senior Vice President, Invesco Management Group, Inc.; Senior Vice President and Chief Compliance Officer, Invesco Advisers, Inc. and The Invesco Funds; Vice President and Chief Compliance Officer, Invesco Aim Capital Management, Inc. and Invesco Distributors, Inc.; Vice President, Invesco Investment Services, Inc. and Fund Management Company. | | N/A | | N/A |
The Statement of Additional Information of the Trust includes additional information about the Fund’s Trustees and is available upon request, without charge, by calling 1.800.959.4246. Please refer to the Fund’s prospectus for information on the Fund’s sub-advisers.
| | | | | | |
Office of the Fund 11 Greenway Plaza, Suite 1000 Houston, TX 77046-1173 | | Investment Adviser Invesco Advisers, Inc. 1555 Peachtree Street, N.E. Atlanta, GA 30309 | | Distributor
Invesco Distributors, Inc. 11 Greenway Plaza, Suite 1000 Houston, TX 77046-1173 | | Auditors PricewaterhouseCoopers LLP 1000 Louisiana Street, Suite 5800 Houston, TX 77002-5678 |
| | | |
| | | | | | |
Counsel to the Fund Stradley Ronon Stevens & Young, LLP 2005 Market Street, Suite 2600 Philadelphia, PA 19103-7018 | | Counsel to the Independent Trustees Goodwin Procter LLP 901 New York Avenue, N.W. Washington, D.C. 20001 | | Transfer Agent Invesco Investment Services, Inc. 11 Greenway Plaza, Suite 1000 Houston, TX 77046-1173 | | Custodian State Street Bank and Trust Company 225 Franklin Street Boston, MA 02110-2801 |
T-4 Invesco Balanced-Risk Commodity Strategy Fund

Invesco mailing information
Send general correspondence to Invesco Investment Services, Inc., P.O. Box 219078, Kansas City, MO 64121-9078.
Important notice regarding delivery of security holder documents
To reduce Fund expenses, only one copy of most shareholder documents may be mailed to shareholders with multiple accounts at the same address (Householding). Mailing of your shareholder documents may be householded indefinitely unless you instruct us otherwise. If you do not want the mailing of these documents to be combined with those for other members of your household, please contact Invesco Investment Services, Inc. at 800 959 4246 or contact your financial institution. We will begin sending you individual copies for each account within 30 days after receiving your request.
Fund holdings and proxy voting information
The Fund provides a complete list of its holdings four times in each fiscal year, at the quarter ends. For the second and fourth quarters, the lists appear in the Fund’s semiannual and annual reports to shareholders. For the first and third quarters, the Fund files the lists with the Securities and Exchange Commission (SEC) on Form N-Q. The most recent list of portfolio holdings is available at invesco.com/completeqtrholdings. Shareholders can also look up the Fund’s Forms N-Q on the SEC website at sec.gov. Copies of the Fund’s Forms N-Q may be reviewed and copied at the SEC Public Reference Room in Washington, D.C. You can obtain information on the operation of the Public Reference Room, including information about duplicating fee charges, by calling 202 551 8090 or 800 732 0330, or by electronic request at the following email address: publicinfo@sec.gov. The SEC file numbers for the Fund are shown below.
A description of the policies and procedures that the Fund uses to determine how to vote proxies relating to portfolio securities is available without charge, upon request, from our Client Services department at 800 959 4246 or at invesco.com/proxyguidelines. The information is also available on the SEC website, sec.gov.
| | |
Information regarding how the Fund voted proxies related to its portfolio securities during the most recent 12-month period ended June 30 is available at invesco.com/proxysearch. The information is also available on the SEC website, sec.gov. Invesco Advisers, Inc. is an investment adviser; it provides investment advisory services to individual and institutional clients and does not sell securities. Invesco Distributors, Inc. is the US distributor for Invesco Ltd.’s retail mutual funds, exchange-traded funds and institutional money market funds. Both are wholly owned, indirect subsidiaries of Invesco Ltd. | |  |
| | | | |
| SEC file numbers: 811-05426 and 033-19338 | | BRCS-AR-1 | | Invesco Distributors, Inc. |
| | | | |
| | |
 | | Annual Report to Shareholders | | October 31, 2015 |
| | |
| | Invesco Greater China Fund |
| | Nasdaq: |
| | A: AACFX n B: ABCFX n C: CACFX n Y: AMCYX n R5: IACFX |

Letters to Shareholders
| | | | |

Philip Taylor | | | | Dear Shareholders: This annual report includes information about your Fund, including performance data and a complete list of its investments as of the close of the reporting period. Inside is a discussion of how your Fund was managed and the factors that affected its performance during the reporting period. I hope you find this report of interest. The US economy expanded and unemployment declined throughout the reporting period. Continuing low energy prices benefited consumers, but a strong US dollar crimped corporate profits. The US Federal Reserve signaled that it was increasingly likely to raise interest rates, based on generally positive economic data, but uncertainty remained about when it might act. Overseas, the story was much different. Low energy prices hurt the economies of some oil-producing nations, such as Brazil and Russia. During the reporting period, the European Central |
Bank as well as central banks in China and Japan – among other countries – either instituted or maintained extraordinarily accommodative monetary policies in response to economic weakness.
Investor uncertainty, such as we saw for much of the reporting period – and market volatility, such as we saw at the end of the reporting period – are unfortunate facts of life when it comes to investing. Some investors use these things as excuses to delay saving and investing for their long-term financial goals. That’s why Invesco encourages investors to work with a professional financial adviser who can stress the importance of starting to save and invest early and the importance of adhering to a disciplined investment plan – when times are good and when they’re uncertain. A financial adviser who knows your unique financial situation, investment goals and risk tolerance can be an invaluable partner as you seek to achieve your financial goals. He or she can offer a long-term perspective when markets are volatile and time-tested advice and guidance when your financial situation or investment goals change.
Timely information when and where you want it
Invesco’s efforts to help investors achieve their financial objectives include providing individual investors and financial professionals with timely information about the markets, the economy and investing – whenever and wherever they want it.
Our website, invesco.com/us, offers a wide range of market insights and investment perspectives. On the website, you’ll find detailed information about our funds, including prices, performance, holdings and portfolio manager commentaries. You can access information about your account by completing a simple, secure online registration. Click on the “Need to register” link in the “Account Access” box on our homepage to get started.
Invesco’s mobile apps for iPhone® and iPad® (both available free from the App StoreSM) allow you to obtain the same detailed information, monitor your account and create customizable watch lists. Also, they allow you to access investment insights from our investment leaders, market strategists, economists and retirement experts. You can sign up to be alerted when new commentary is added, and you can watch portfolio manager videos and have instant access to Invesco news and updates wherever you may be.
In addition to the resources accessible on our website and through our mobile app, you can obtain timely updates to help you stay informed about the markets, the economy and investing by connecting with Invesco on Twitter, LinkedIn or Facebook. You can access our blog at blog.invesco.us.com. Our goal is to provide you the information you want, when and where you want it.
Have questions?
For questions about your account, feel free to contact an Invesco client services representative at 800 959 4246. For Invesco-related questions or comments, please email me directly at phil@invesco.com.
All of us at Invesco look forward to serving your investment management needs for many years to come. Thank you for investing with us.
Sincerely,

Philip Taylor
Senior Managing Director, Invesco Ltd.
iPhone and iPad are trademarks of Apple Inc., registered in the US and other countries. App Store is a service mark of Apple Inc. Invesco Distributors, Inc. is not affiliated with Apple Inc.
2 Invesco Greater China Fund
| | | | | | |

Bruce Crockett | | | | Dear Fellow Shareholders: Among the many important lessons I’ve learned in more than 40 years in a variety of business endeavors is the value of a trusted advocate. As independent chair of the Invesco Funds Board, I can assure you that the members of the Board are strong advocates for the interests of investors in Invesco’s mutual funds. We work hard to represent your interests through oversight of the quality of the investment management services your funds receive and other matters important to your investment, including but not limited to: |
| | | | n | | Ensuring that Invesco offers a diverse lineup of mutual funds that your financial adviser can use to strive to meet your financial needs as your investment goals change over time. |
| | | | n | | Monitoring how the portfolio management teams of the Invesco funds are performing in light of changing economic and market conditions. |
| n | | Assessing each portfolio management team’s investment performance within the context of the investment strategy described in the fund’s prospectus. |
| n | | Monitoring for potential conflicts of interests that may impact the nature of the services that your funds receive. |
We believe one of the most important services we provide our fund shareholders is the annual review of the funds’ advisory and sub-advisory contracts with Invesco Advisers and its affiliates. This review is required by the Investment Company Act of 1940 and focuses on the nature and quality of the services Invesco provides as the adviser to the Invesco funds and the reasonableness of the fees that it charges for those services. Each year, we spend months carefully reviewing information received from Invesco and a variety of independent sources, such as performance and fee data prepared by Lipper Inc., an independent, third-party firm widely recognized as a leader in its field. We also meet with our independent legal counsel and other independent advisers to review and help us assess the information that we have received. Our goal is to assure that you receive quality investment management services for a reasonable fee.
I trust the measures outlined above provide assurance that you have a worthy advocate when it comes to choosing the Invesco Funds.
As always, please contact me at bruce@brucecrockett.com with any questions or concerns you may have. On behalf of the Board, we look forward to continuing to represent your interests and serving your needs.
Sincerely,

Bruce L. Crockett
Independent Chair
Invesco Funds Board of Trustees
3 Invesco Greater China Fund
Management’s Discussion of Fund Performance
Performance summary
For the fiscal year ended October 31, 2015, Class A shares of Invesco Greater China Fund (the Fund), at net asset value (NAV), outperformed the MSCI Golden Dragon Index, the Fund’s broad market/style-specific benchmark.
Your Fund’s long-term performance appears later in this report.
Fund vs. Indexes
Total returns, 10/31/14 to 10/31/15, at net asset value (NAV). Performance shown does not include applicable contingent deferred sales charges (CDSC) or front-end sales charges, which would have reduced performance.
| | | | | |
| Class A Shares | | | | 6.47 | % |
| Class B Shares | | | | 5.69 | |
| Class C Shares | | | | 5.65 | |
| Class Y Shares | | | | 6.73 | |
| Class R5 Shares | | | | 6.93 | |
| MSCI Golden Dragon Index▼ (Broad Market/Style-Specific Index)* | | | | -3.32 | |
| MSCI EAFE Index▼ (Former Broad Market Index)* | | | | -0.07 | |
| MSCI China 10/40 Index▼ (Former Style-Specific Index)* | | | | -0.56 | |
| Lipper China Region Funds Index¡ (Peer Group Index) | | | | -4.60 | |
Source(s): ▼FactSet Research Systems Inc.; ¡Lipper Inc.
| * | The Fund has elected to use the MSCI Golden Dragon Index to represent its broad market/style-specific benchmark rather than the MSCI EAFE Index and the MSCI China 10/40 Index because the MSCI Golden Dragon Index more closely reflects the performance of the types of securities in which the Fund invests. |
Market conditions and your Fund
International markets experienced increased volatility during the fiscal year ended October 31, 2015, driven largely by the continued slowdown in energy markets and the economic downturn in China. Developed markets were generally able to withstand these headwinds, even as more fragile emerging markets began to falter.
Chinese equities had a strong start to the fiscal year and recorded solid gains especially the restricted A-share market. Markets rose as the government unveiled positive measures to reform the financial system combined with policy easing to support growth. For example, the government introduced a local government financing vehicle debt swap program to help de-risk the Chinese banking system, which helped investor sentiment. The People’s Bank of China (PBOC)
also eased monetary policy, which helped to replenish liquidity in the system while also supporting the equity markets. This helped the Greater China markets become the best-performing markets in Asia in the first quarter of 2015, and the liquidity driven rally in China spilled over to Hong Kong and Taiwan.
Chinese equities declined sharply at the beginning of the third quarter in 2015. In the summer of 2015, fears of a potential economic slowdown in China dominated headlines and Chinese markets experienced a sharp downturn. The combination of a slowing Chinese economy, excessive margin financing and the fading impact of monetary policy easing contributed to a sharp sell-off in domestic Chinese equities – particularly in the restricted A-share market. The
Chinese government eventually implemented measures to temper the sell-off including a freeze on initial public offerings and the launch of a stabilization fund backed by brokers. Markets stumbled once more in the third quarter of 2015 as the PBOC adjusted the Chinese renminbi fixing mechanism to allow the market to play a greater role in setting the exchange rate, which led to some volatility of the renminbi against the US dollar.
The Fund experienced several changes during the fiscal year. Effective March 30, 2015, Mike Shiao replaced Joseph Tang as Portfolio Manager of the Fund. Mr. Shiao is the Chief Investment Officer of Invesco’s Greater China equities team. He joined Invesco in 2002 and has more than 23 years investing experience. In June, the Fund was renamed Invesco Greater China Fund, and it adopted a principal investment strategy under which the Fund invests at least 80% of its net assets in equity or equity-related instruments issued by companies located or operating in Greater China (includes mainland China, Hong Kong, Macau and Taiwan). The Fund also changed its investment process to a bottom-up fundamental analysis with a “sustainable value” investment style and changed its broad market/style-specific benchmark to the MSCI Golden Dragon Index.
Relative outperformance versus the Fund’s broad market/style-specific benchmark was primarily driven by stock selection and underweight exposure to the financials sector. The Fund’s holdings in the insurance and banking industries led relative performance in the sector. Beijing-based China Life Insurance Company was the largest contributor to performance within the sector. The
| | | | | |
Portfolio Composition | |
By sector | | | | % of total net assets | |
| | | | | |
| Information Technology | | | | 27.2 | % |
| Consumer Discretionary | | | | 24.2 | |
| Financials | | | | 12.8 | |
| Consumer Staples | | | | 12.5 | |
| Telecommunications Services | | | | 8.4 | |
| Industrials | | | | 8.0 | |
| Energy | | | | 3.9 | |
| Utilities | | | | 1.7 | |
| Health Care | | | | 0.6 | |
| Money Market Funds | | | | | |
| Plus Other Assets Less Liabilities | | | | 0.7 | |
| | | | | | | | | |
Top 10 Equity Holdings* |
| | | | % of total net assets | | |
| | | | | | | | | |
| 1. | | China Mobile Ltd. | | | | 8.4 | % |
| 2. | | Tencent Holdings Ltd. | | | | 6.1 | |
| 3. | | AIA Group Ltd. | | | | 5.5 | |
| 4. | | Taiwan Semiconductor Manufacturing Co. Ltd. | | | | 5.3 | |
| 5. | | Ping An Insurance (Group) Co. of China Ltd. - Class H | | | | 4.8 | |
| 6. | | CK Hutchison Holdings Ltd. | | | | 4.6 | |
| 7. | | Minth Group Ltd. | | | | 4.2 | |
| 8. | | Sun Art Retail Group Ltd. | | | | 4.2 | |
| 9. | | China Petroleum & Chemical Corp. - Class H | | | | 3.9 | |
10. | | FIH Mobile Ltd. | | | | 3.9 | |
| | | | | |
Total Net Assets | | | | $73.1 million | |
| |
| Total Number of Holdings* | | | | 32 | |
The Fund’s holdings are subject to change, and there is no assurance that the Fund will continue to hold any particular security.
*Excluding money market fund holdings.
Data presented here are as of October 31, 2015.
4 Invesco Greater China Fund
nation’s largest insurer experienced a significant rise in the first half of the fiscal year as the stock market rally boosted investment returns and its premium income expanded. We sold the holding in the second quarter of 2015 before the company declined along with the rest of the market.
Stock selection in and overweight exposure to the consumer discretionary sector also contributed to the Fund’s relative performance. Footwear manufacturer Yue Yuen Industrial Holdings was a significant contributor to the Fund’s performance during the reporting period. The company was boosted in the third quarter of 2015 after posting some gains on the back of positive earnings and attractive dividend yields. Pou Sheng International, a sportswear retailer in mainland China, and Hong Kong-based furniture company Man Wah Holdings also contributed to relative performance.
Stock selection in the consumer staples and information technology sectors also contributed to relative performance. In the consumer staples sector, China Mengniu Dairy, China’s largest producer of milk and ice cream, was one of the leading individual contributors to the Fund’s performance. We sold our holding in China Mengniu Dairy before the close of the fiscal year. Internet and mobile services company Tencent Holdings was the leading contributor to performance in the information technology sector.
Some of the Fund’s outperformance was offset by stock selection in and underweight exposure to the industrials sector. Beijing Enterprises Holdings was the leading detractor from relative performance within the sector. Not owning several strong-performing companies held in the Fund’s broad market/style-specific index also detracted from relative performance.
Overweight exposure to the health care and energy sectors also detracted from relative results. In the health care sector, relative underperformance was driven by the Fund’s pharmaceutical holdings, which included Shanghai Pharmaceuticals, Guangzhou Baiyunshan Pharmaceuticals and Luye Pharma Group. We sold our holdings in Shanghai Pharmaceuticals, Guangzhou Baiyunshan Pharmaceuticals and Luye Pharma Group before the close of the reporting period. Within the energy sector, oil and gas companies PetroChina, China Shenua Energy and CNOOC detracted from both absolute and relative results. PetroChina, China Shenua Energy and CNOOC were no longer held by the Fund at the close of the fiscal year.
China’s economy continues to transition to a “new normal” level of more sustainable growth – moving away from a manufacturing dominant economic model to one with greater dependence placed on consumer demand. In monitoring the progress in China’s transformation, we focus on how the government simultaneously manages two key challenges: first, unwinding the accumulated imbalances in debt and capacity while preventing growth from slowing too sharply, and second, continuing to advance structural reforms to improve markets and growth opportunities. With our bottom-up approach, we continue to look for companies that have earnings visibility, a long-term competitive advantage, sound balance sheets and reasonable valuations.
Thank you for your continued investment in Invesco Greater China Fund.
The views and opinions expressed in management’s discussion of Fund performance are those of Invesco Advisers, Inc. These views and opinions are subject to change at any time based on factors such as market and economic conditions. These views and opinions may not be relied upon as investment advice or recommendations, or as an offer for a particular security. The information is not a complete analysis of every aspect of any market, country, industry, security or the Fund. Statements of fact are from sources considered reliable, but Invesco Advisers, Inc. makes no representation or warranty as to their completeness or accuracy. Although historical performance is no guarantee of future results, these insights may help you understand our investment management philosophy.
See important Fund and, if applicable, index disclosures later in this report.
| | |
 | | Mike Shiao Portfolio Manager and Chief Investment Officer of Invesco’s Greater China equities team, is manager of |
Invesco Greater China Fund. He joined Invesco in 2002. Mr. Shiao earned a bachelor’s degree from National Chung Hsing University, Taiwan and an MS in finance from Drexel University.
5 Invesco Greater China Fund
Your Fund’s Long-Term Performance
Results of a $10,000 Investment – Oldest Share Class(es) since Inception
Fund and index data from 3/31/06
Past performance cannot guarantee comparable future results.
During the reporting period, the Fund elected to use the MSCI Golden Dragon Index to represent its broad market/style-specific benchmark rather than the MSCI EAFE Index and the MSCI China 10/40 Index because the MSCI Golden Dragon Index more closely reflects the performance of the types of securities in which the Fund invests. Because this is the first reporting period since we have adopted
the new index, SEC guidelines require that we compare performance to both the old and new indexes.
The data shown in the chart include reinvested distributions, applicable sales charges and Fund expenses including management fees. Results for Class B shares are calculated as if a hypothetical shareholder had liquidated his entire investment in the Fund at the close of the reporting period and paid the contingent deferred sales charges, if applicable.
Index results include reinvested dividends, but they do not reflect sales charges. Performance of the peer group, if applicable, reflects fund expenses and management fees; performance of a market index does not. Performance shown in the chart and table(s) does not reflect deduction of taxes a shareholder would pay on Fund distributions or sale of Fund shares.
continued from page 8
subject to the creditworthiness of the issuing bank or broker-dealer.
| n | | Preferred securities risk. Preferred securities may include provisions that permit the issuer, in its discretion, to defer or omit distributions for a certain period of time. If the Fund owns a security that is deferring or omitting its distributions, the Fund may be required to report the distribution on its tax returns, even though it may not have received this income. Further, preferred securities may lose substantial value due to the omission or deferment of dividend payments. |
| n | | Small- and mid-capitalization risks. Stocks of small- and mid-sized companies tend to be more vulnerable to adverse developments and may have little or no operating history or track record |
of success, and limited product lines, markets, management and financial resources. The securities of small- and mid-sized companies may be more volatile due to less market interest and less publicly available information about the issuer. They also may be illiquid or restricted as to resale, or may trade less frequently and in smaller volumes, all of which may cause difficulty when establishing or closing a position at a desirable price.
| n | | Unique economic and political risks of investing in China. China remains a totalitarian country with the following risks: nationalization, expropriation, or confiscation of property; difficulty in obtaining and/or enforcing judgments; alteration or discontinuation of economic reforms; military conflicts, either |
internal or with other countries; inflation, currency fluctuations and fluctuations in inflation and interest rates that may have negative effects on the economy and securities markets of China; and China’s dependency on the economies of other Asian countries, many of which are developing countries.
About indexes used in this report
| n | | The MSCI Golden Dragon Index is an unmanaged index considered representative of equity market performance of large- and mid-cap China securities and non-domestic China securities listed in Hong Kong and Taiwan. The index is computed using the net return, which withholds applicable taxes for non-resident investors. |
continued on page 7
6 Invesco Greater China Fund
| | | | | |
| Average Annual Total Returns |
As of 10/31/15, including maximum applicable sales charges |
| | | | | |
| |
| Class A Shares | | | | | |
| Inception (3/31/06) | | | | 8.37 | % |
| 5 Years | | | | -1.31 | |
| 1 Year | | | | 0.61 | |
| |
| Class B Shares | | | | | |
Inception (3/31/06) | | | | 8.34 | % |
5 Years | | | | -1.32 | |
1 Year | | | | 0.69 | |
| |
| Class C Shares | | | | | |
| Inception (3/31/06) | | | | 8.19 | % |
| 5 Years | | | | -0.93 | |
| 1 Year | | | | 4.65 | |
| |
Class Y Shares | | | | | |
Inception | | | | 9.20 | % |
5 Years | | | | 0.07 | |
1 Year | | | | 6.73 | |
| |
| Class R5 Shares | | | | | |
| Inception (3/31/06) | | | | 9.52 | % |
| 5 Years | | | | 0.28 | |
| 1 Year | | | | 6.93 | |
Class Y shares incepted on October 3, 2008. Performance shown prior to that date is that of Class A shares and includes the 12b-1 fees applicable to Class A shares.
The performance data quoted represent past performance and cannot guarantee comparable future results; current performance may be lower or higher. Please visit
| | | | | |
| Average Annual Total Returns |
As of 9/30/15, the most recent calendar quarter end, including maximum applicable sales charges |
| | | | | |
| |
Class A Shares | | | | | |
Inception (3/31/06) | | | | 7.57 | % |
| 5 Years | | | | -1.84 | |
| 1 Year | | | | -1.85 | |
| |
| Class B Shares | | | | | |
| Inception (3/31/06) | | | | 7.54 | % |
| 5 Years | | | | -1.86 | |
| 1 Year | | | | -1.90 | |
| |
Class C Shares | | | | | |
Inception (3/31/06) | | | | 7.40 | % |
5 Years | | | | -1.46 | |
1 Year | | | | 2.11 | |
| |
| Class Y Shares | | | | | |
| Inception | | | | 8.41 | % |
| 5 Years | | | | -0.46 | |
| 1 Year | | | | 4.17 | |
| |
| Class R5 Shares | | | | | |
| Inception (3/31/06) | | | | 8.72 | % |
| 5 Years | | | | -0.26 | |
| 1 Year | | | | 4.38 | |
invesco.com/performance for the most recent month-end performance. Performance figures reflect reinvested distributions, changes in net asset value and the effect of the maximum sales charge unless otherwise stated. Investment return and principal value will fluctuate so that you may have a gain or loss when you sell shares.
The total annual Fund operating
expense ratio set forth in the most recent Fund prospectus as of the date of this report for Class A, Class B, Class C, Class Y and Class R5 shares was 1.85%, 2.60%, 2.60%, 1.60% and 1.39%, respectively. The expense ratios presented above may vary from the expense ratios presented in other sections of this report that are based on expenses incurred during the period covered by this report.
Class A share performance reflects the maximum 5.50% sales charge, and Class B and Class C share performance reflects the applicable contingent deferred sales charge (CDSC) for the period involved. The CDSC on Class B shares declines from 5% beginning at the time of purchase to 0% at the beginning of the seventh year. The CDSC on Class C shares is 1% for the first year after purchase. Class Y and Class R5 shares do not have a front-end sales charge or a CDSC; therefore, performance is at net asset value.
The performance of the Fund’s share classes will differ primarily due to different sales charge structures and class expenses.
Fund performance reflects any applicable fee waivers and/or expense reimbursements. Had the adviser not waived fees and/or reimbursed expenses currently or in the past, returns would have been lower. See current prospectus for more information.
continued from page 6
| n | | The MSCI EAFE® Index is an unmanaged index considered representative of stocks of Europe, Australasia and the Far East. The index is computed using the net return, which withholds applicable taxes for non-resident investors. |
| n | | The MSCI China 10/40 Index is a free float-adjusted market-capitalization index that measures equity market performance in China, taking into consideration concentration constraints applicable to funds registered for sale in Europe pursuant to the UCITS III Directive. The index is computed using the net return, which withholds applicable taxes for non-resident investors. |
| n | | The Lipper China Region Funds Index is an unmanaged index considered representative of China region funds tracked by Lipper. |
| n | | The Fund is not managed to track the performance of any particular index, including the index(es) described here, and consequently, the performance of the Fund may deviate significantly from the performance of the index(es). |
| n | | A direct investment cannot be made in an index. Unless otherwise indicated, index results include reinvested dividends, and they do not reflect sales charges. Performance of the peer group, if applicable, reflects fund expenses; performance of a market index does not. |
Other information
| n | | The returns shown in management’s discussion of Fund performance are based on net asset values (NAVs) calculated for shareholder transactions. |
Generally accepted accounting principles require adjustments to be made to the net assets of the Fund at period end for financial reporting purposes, and as such, the NAVs for shareholder transactions and the returns based on those NAVs may differ from the NAVs and returns reported in the Financial Highlights.
| n | | Industry classifications used in this report are generally according to the Global Industry Classification Standard, which was developed by and is the exclusive property and a service mark of MSCI Inc. and Standard & Poor’s. |
7 Invesco Greater China Fund
Invesco Greater China Fund’s investment objective is long-term growth of capital.
| n | | Unless otherwise stated, information presented in this report is as of October 31, 2015, and is based on total net assets. |
| n | | Unless otherwise noted, all data provided by Invesco. |
| n | | To access your Fund’s reports/prospectus, visit invesco.com/fundreports. |
About share classes
| n | | Class B shares may not be purchased for new or additional investments. Please see the prospectus for more information. |
| n | | Class Y shares are available only to certain investors. Please see the prospectus for more information. |
| n | | Class R5 shares are primarily intended for employer sponsored retirement and benefit plans that meet certain standards and for institutional investors. Please see the prospectus for more information. |
Principal risks of investing in the Fund
| n | | Active trading risk. The Fund engages in frequent trading of portfolio securities. Active trading results in added expenses and may result in a lower return and increased tax liability. |
| n | | Changing fixed income market conditions risk. The current low interest rate environment was created in part by the Federal Reserve Board (FRB) and certain foreign central banks keeping the federal funds and equivalent foreign rates at or near zero. There is a risk that interest rates will rise when the FRB and central banks raise these rates. This risk is heightened due to the FRB’s quantitative easing program and the “tapering” of other similar foreign central bank actions. This eventual increase in the federal funds and equivalent foreign rates may expose fixed income markets to heightened volatility and reduced liquidity for certain fixed income investments, particularly those with longer maturities. In addition, decreases in fixed income dealer market-making capacity may also potentially lead to heightened volatility and reduced liquidity in the fixed income markets. As a result, the value of the Fund’s investments and share price may decline. Changes in central bank policies could also result in higher than normal shareholder redemptions, which could potentially increase portfolio turnover and the Fund’s transaction costs. |
| n | | Convertible securities risk. The Fund may own convertible securities, the value of which may be affected by market interest rates, the risk that the issuer |
will default, the value of the underlying stock or the right of the issuer to buy back the convertible securities.
| n | | Credit risk. The issuer of instruments in which the Fund invests may be unable to meet interest and/or principal payments, thereby causing its instruments to decrease in value and lowering the issuer’s credit rating. |
| n | | Depositary receipts risk. Depositary receipts involve many of the same risks as those associated with direct investment in foreign securities. In addition, the underlying issuers of certain depositary receipts, particularly unsponsored or unregistered depositary receipts, are under no obligation to distribute shareholder communications to the holders of such receipts or to pass through to them any voting rights with respect to the deposited securities. |
| n | | Developing/emerging markets securities risk. The prices of securities issued by foreign companies and governments located in developing/emerging markets countries may be affected more negatively by inflation, devaluation of their currencies, higher transaction costs, delays in settlement, adverse political developments, the introduction of capital controls, withholding taxes, nationalization of private assets, expropriation, social unrest, war or lack of timely information than those in developed countries. |
| n | | Foreign government debt risk. Investments in foreign government debt obligations involve certain risks in addition to those relating to foreign securities or debt securities generally. The issuer of the debt or the governmental authorities that control the repayment of the debt may be unable or unwilling to repay principal or interest when due in accordance with the terms of such debt, and the Fund may have limited recourse in the event of a default against the defaulting government. Without the approval of debt holders, some governmental debtors have in the past been able to reschedule or restructure their debt payments or declare moratoria on payments. |
| n | | Foreign securities risk. The Fund’s foreign investments may be affected by changes in a foreign country’s exchange rates, political and social instability, changes in economic or taxation policies, difficulties when enforcing obligations, decreased liquidity, and increased volatility. Foreign companies may be subject to less regulation resulting in less publicly available information about the companies. |
| n | | Geographic focus risk. From time to time the Fund may invest a substantial amount of its assets in securities of issuers located in a single country or a limited number of countries. If the Fund focuses its investments in this manner, it assumes the risk that economic, political and social conditions in those countries will have a significant impact on its investment performance. The Fund’s investment performance may also be more volatile if it focuses its investments in certain countries, especially emerging markets countries. |
| n | | Interest rate risk. Interest rate risk refers to the risk that bond prices generally fall as interest rates rise; conversely, bond prices generally rise as interest rates fall. Specific bonds differ in their sensitivity to changes in interest rates depending on their individual characteristics, including duration. |
| n | | Management risk. The investment techniques and risk analysis used by the Fund’s portfolio managers may not produce the desired results. |
| n | | Market risk. The prices of and the income generated by the Fund’s securities may decline in response to, among other things, investor sentiment, general economic and market conditions, regional or global instability, and currency and interest rate fluctuations. |
| n | | Participation notes risk. Investments in participation notes involve the same risks associated with a direct investment in the underlying security, currency or market they seek to replicate. In addition, the Fund has no rights under participation notes against the issuer of the underlying security and is |
continued on page 6
|
| This report must be accompanied or preceded by a currently effective Fund prospectus, which contains more complete information, including sales charges and expenses. Investors should read it carefully before investing. |
NOT FDIC INSURED | MAY LOSE VALUE | NO BANK GUARANTEE
8 Invesco Greater China Fund
Schedule of Investments(a)
October 31, 2015
| | | | | | | | |
| | | Shares | | | Value | |
Common Stocks & Other Equity Interests–99.32%(b) | |
| Apparel Retail–1.37% | |
Pou Sheng International (Holdings) Ltd. (Hong Kong)(c) | | | 6,303,000 | | | $ | 1,004,459 | |
|
| Auto Parts & Equipment–4.21% | |
Minth Group Ltd. | | | 1,492,000 | | | | 3,081,951 | |
|
| Automobile Manufacturers–0.27% | |
Jiangling Motors Corp., Ltd.–Class B | | �� | 61,500 | | | | 197,058 | |
|
| Electronic Components–3.17% | |
Chin-Poon Industrial Co., Ltd. (Taiwan) | | | 932,000 | | | | 1,241,313 | |
Largan Precision Co., Ltd. (Taiwan) | | | 14,000 | | | | 1,076,956 | |
| | | | | | | | 2,318,269 | |
|
| Electronic Manufacturing Services–6.30% | |
FIH Mobile Ltd. | | | 5,924,000 | | | | 2,817,095 | |
Hon Hai Precision Industry Co., Ltd. (Taiwan) | | | 677,150 | | | | 1,788,244 | |
| | | | | | | | 4,605,339 | |
|
| Food Retail–2.77% | |
President Chain Store Corp. (Taiwan) | | | 307,000 | | | | 2,025,125 | |
|
| Footwear–5.31% | |
Stella International Holdings Ltd. | | | 761,500 | | | | 1,879,525 | |
Yue Yuen Industrial (Holdings) Ltd. (Hong Kong) | | | 550,000 | | | | 2,004,912 | |
| | | | | | | | 3,884,437 | |
|
| Gas Utilities–1.72% | |
Towngas China Co. Ltd. (Hong Kong) | | | 1,849,000 | | | | 1,257,151 | |
|
| Health Care Equipment–0.56% | |
MicroPort Scientific Corp.(c) | | | 988,000 | | | | 411,461 | |
|
| Home Furnishings–2.71% | |
Man Wah Holdings Ltd. (Hong Kong) | | | 1,743,600 | | | | 1,981,822 | |
|
| Hotels, Resorts & Cruise Lines–1.56% | |
Shanghai Jinjiang International Hotels Development Co., Ltd.–Class B | | | 356,891 | | | | 1,139,910 | |
|
| Hypermarkets & Super Centers–4.20% | |
Sun Art Retail Group Ltd. (Hong Kong) | | | 3,752,000 | | | | 3,068,166 | |
|
| Industrial Conglomerates–7.97% | |
Beijing Enterprises Holdings Ltd. | | | 395,500 | | | | 2,494,892 | |
CK Hutchison Holdings Ltd. (Hong Kong) | | | 244,000 | | | | 3,333,219 | |
| | | | | | | | 5,828,111 | |
|
| Integrated Oil & Gas–3.93% | |
China Petroleum & Chemical Corp.–Class H | | | 3,990,000 | | | | 2,877,676 | |
|
| Internet Retail–4.05% | |
E-commerce China Dangdang, Inc.–Class A,–ADR(c) | | | 121,640 | | | | 823,503 | |
| | | | | | | | |
| | | Shares | | | Value | |
| Internet Retail–(continued) | |
Vipshop Holdings Ltd.–ADR(c) | | | 104,311 | | | $ | 2,140,462 | |
| | | | | | | | 2,963,965 | |
|
| Internet Software & Services–12.49% | |
Baidu, Inc.–ADR(c) | | | 9,955 | | | | 1,866,264 | |
Tencent Holdings Ltd. | | | 238,000 | | | | 4,466,586 | |
Weibo Corp.–ADR(c) | | | 173,677 | | | | 2,799,673 | |
| | | | | | | | 9,132,523 | |
|
| Life & Health Insurance–10.26% | |
AIA Group Ltd. (Hong Kong) | | | 683,600 | | | | 3,991,751 | |
Ping An Insurance (Group) Co. of China Ltd.–Class H | | | 627,500 | | | | 3,509,951 | |
| | | | | | | | 7,501,702 | |
|
| Packaged Foods & Meats–2.17% | |
Uni-President China Holdings Ltd. | | | 1,940,000 | | | | 1,587,271 | |
|
| Personal Products–3.31% | |
Hengan International Group Co. Ltd. | | | 224,500 | | | | 2,420,052 | |
|
| Property & Casualty Insurance–2.57% | |
PICC Property and Casualty Co. Ltd.–Class H | | | 830,080 | | | | 1,880,628 | |
|
| Restaurants–2.40% | |
Ajisen China Holdings Ltd. (Hong Kong) | | | 3,673,000 | | | | 1,753,017 | |
|
| Semiconductors–5.26% | |
Taiwan Semiconductor Manufacturing Co. Ltd. (Taiwan) | | | 913,000 | | | | 3,843,286 | |
|
| Specialty Stores–2.34% | |
Chow Tai Fook Jewellery Group Ltd. (Hong Kong) | | | 2,003,400 | | | | 1,713,744 | |
|
| Wireless Telecommunication Services–8.42% | |
China Mobile Ltd. | | | 517,500 | | | | 6,156,250 | |
Total Common Stocks & Other Equity Interests
(Cost $75,918,626) | | | | 72,633,373 | |
|
Money Market Funds–0.88% | |
Liquid Assets Portfolio–Institutional Class, 0.16%(d) | | | 322,958 | | | | 322,958 | |
Premier Portfolio–Institutional Class, 0.12%(d) | | | 322,957 | | | | 322,957 | |
Total Money Market Funds
(Cost $645,915) | | | | 645,915 | |
TOTAL INVESTMENTS–100.20%
(Cost $76,564,541) | | | | 73,279,288 | |
OTHER ASSETS LESS LIABILITIES–(0.20)% | | | | (145,977 | ) |
NET ASSETS–100.00% | | | $ | 73,133,311 | |
See accompanying Notes to Financial Statements which are an integral part of the financial statements.
9 Invesco Greater China Fund
Investment Abbreviations:
| | |
| ADR | | – American Depositary Receipt |
Notes to Schedule of Investments:
| (a) | Industry and/or sector classifications used in this report are generally according to the Global Industry Classification Standard, which was developed by and is the exclusive property and a service mark of MSCI Inc. and Standard & Poor’s. |
| (b) | Country of issuer and/or credit risk exposure listed in Common Stocks & Other Equity Interests has been determined to be China unless otherwise noted. |
| (c) | Non-income producing security. |
| (d) | The money market fund and the Fund are affiliated by having the same investment adviser. The rate shown is the 7-day SEC standardized yield as of October 31, 2015. |
See accompanying Notes to Financial Statements which are an integral part of the financial statements.
10 Invesco Greater China Fund
Statement of Assets and Liabilities
October 31, 2015
| | | | |
Assets: | |
Investments, at value (Cost $75,918,626) | | $ | 72,633,373 | |
Investments in affiliated money market funds, at value and cost | | | 645,915 | |
Total investments, at value (Cost $76,564,541) | | | 73,279,288 | |
Receivable for: | | | | |
Fund shares sold | | | 183,529 | |
Dividends | | | 29,163 | |
Investment for trustee deferred compensation and retirement plans | | | 47,742 | |
Other assets | | | 17,943 | |
Total assets | | | 73,557,665 | |
|
Liabilities: | |
Payable for: | | | | |
Investments purchased | | | 197,949 | |
Fund shares reacquired | | | 39,017 | |
Accrued fees to affiliates | | | 69,207 | |
Accrued trustees’ and officers’ fees and benefits | | | 1,454 | |
Accrued other operating expenses | | | 63,780 | |
Trustee deferred compensation and retirement plans | | | 52,947 | |
Total liabilities | | | 424,354 | |
Net assets applicable to shares outstanding | | $ | 73,133,311 | |
|
Net assets consist of: | |
Shares of beneficial interest | | $ | 110,633,462 | |
Undistributed net investment income | | | 539,600 | |
Undistributed net realized gain (loss) | | | (34,754,495 | ) |
Net unrealized appreciation (depreciation) | | | (3,285,256 | ) |
| | | $ | 73,133,311 | |
| | | | |
Net Assets: | |
Class A | | $ | 53,087,021 | |
Class B | | $ | 2,599,906 | |
Class C | | $ | 13,921,555 | |
Class Y | | $ | 3,449,495 | |
Class R5 | | $ | 75,334 | |
|
Shares outstanding, $0.01 par value per share,
with an unlimited number of shares authorized: | |
Class A | | | 2,516,243 | |
Class B | | | 127,289 | |
Class C | | | 682,716 | |
Class Y | | | 163,199 | |
Class R5 | | | 3,559 | |
Class A: | | | | |
Net asset value per share | | $ | 21.10 | |
Maximum offering price per share | | | | |
(Net asset value of $21.10 ¸ 94.50%) | | $ | 22.33 | |
Class B: | | | | |
Net asset value and offering price per share | | $ | 20.43 | |
Class C: | | | | |
Net asset value and offering price per share | | $ | 20.39 | |
Class Y: | | | | |
Net asset value and offering price per share | | $ | 21.14 | |
Class R5: | | | | |
Net asset value and offering price per share | | $ | 21.17 | |
See accompanying Notes to Financial Statements which are an integral part of the financial statements.
11 Invesco Greater China Fund
Statement of Operations
For the year ended October 31, 2015
| | | | |
Investment income: | |
Dividends (net of foreign withholding taxes of $216,581) | | $ | 2,284,418 | |
Dividends from affiliated money market funds | | | 1,310 | |
Total investment income | | | 2,285,728 | |
| |
Expenses: | | | | |
Advisory fees | | | 781,926 | |
Administrative services fees | | | 50,000 | |
Custodian fees | | | 60,916 | |
Distribution fees: | | | | |
Class A | | | 150,259 | |
Class B | | | 41,491 | |
Class C | | | 154,668 | |
Transfer Agent Fees — A, B, C and Y | | | 266,206 | |
Transfer agent fees — R5 | | | 67 | |
Trustees’ and officers’ fees and benefits | | | 20,773 | |
Other | | | 185,848 | |
Total expenses | | | 1,712,154 | |
Less: Fees waived and expense offset arrangement(s) | | | (3,686 | ) |
Net expenses | | | 1,708,468 | |
Net investment income | | | 577,260 | |
| |
Realized and unrealized gain (loss) from: | | | | |
Net realized gain (loss) from: | | | | |
Investment securities | | | 7,049,823 | |
Foreign currencies | | | (15,669 | ) |
| | | | 7,034,154 | |
Change in net unrealized appreciation (depreciation) of: | | | | |
Investment securities | | | (2,934,575 | ) |
Foreign currencies | | | 28 | |
| | | | (2,934,547 | ) |
Net realized and unrealized gain | | | 4,099,607 | |
Net increase in net assets resulting from operations | | $ | 4,676,867 | |
See accompanying Notes to Financial Statements which are an integral part of the financial statements.
12 Invesco Greater China Fund
Statement of Changes in Net Assets
For the years ended October 31, 2015 and 2014
| | | | | | | | |
| | | 2015 | | | 2014 | |
Operations: | |
Net investment income (loss) | | $ | 577,260 | | | $ | (318,816 | ) |
Net realized gain | | | 7,034,154 | | | | 12,285,009 | |
Change in net unrealized appreciation (depreciation) | | | (2,934,547 | ) | | | (13,395,379 | ) |
Net increase (decrease) in net assets resulting from operations | | | 4,676,867 | | | | (1,429,186 | ) |
| | |
Distributions to shareholders from net investment income: | | | | | | | | |
Class A | | | (268,684 | ) | | | (846,845 | ) |
Class B | | | — | | | | (16,420 | ) |
Class C | | | — | | | | (47,698 | ) |
Class Y | | | (25,936 | ) | | | (59,852 | ) |
Class R5 | | | (865 | ) | | | (5,462 | ) |
Total distributions from net investment income | | | (295,485 | ) | | | (976,277 | ) |
| | |
Share transactions–net: | | | | | | | | |
Class A | | | (13,093,503 | ) | | | (11,916,527 | ) |
Class B | | | (3,019,590 | ) | | | (2,003,637 | ) |
Class C | | | (2,861,129 | ) | | | (4,995,375 | ) |
Class Y | | | (1,077,083 | ) | | | 52,909 | |
Class R5 | | | (31,944 | ) | | | (307,144 | ) |
Net increase (decrease) in net assets resulting from share transactions | | | (20,083,249 | ) | | | (19,169,774 | ) |
Net increase (decrease) in net assets | | | (15,701,867 | ) | | | (21,575,237 | ) |
|
Net assets: | |
Beginning of year | | | 88,835,178 | | | | 110,410,415 | |
End of year (includes undistributed net investment income of $539,600 and $234,405, respectively) | | $ | 73,133,311 | | | $ | 88,835,178 | |
Notes to Financial Statements
October 31, 2015
NOTE 1—Significant Accounting Policies
Invesco Greater China Fund, formerly Invesco China Fund, (the “Fund”) is a series portfolio of AIM Investment Funds (Invesco Investment Funds) (the “Trust”). The Trust is organized as a Delaware statutory trust and is registered under the Investment Company Act of 1940, as amended (the “1940 Act”), as an open-end series management investment company consisting of twenty-four separate series portfolios, each authorized to issue an unlimited number of shares of beneficial interest. The assets, liabilities and operations of each portfolio are accounted for separately. Information presented in these financial statements pertains only to the Fund. Matters affecting each portfolio or class will be voted on exclusively by the shareholders of such portfolio or class.
The Fund’s investment objective is long-term growth of capital.
The Fund currently consists of five different classes of shares: Class A, Class B, Class C, Class Y and Class R5. Class A shares are sold with a front-end sales charge unless certain waiver criteria are met and under certain circumstances load waived shares may be subject to contingent deferred sales charges (“CDSC”). Class C shares are sold with a CDSC. Class Y and Class R5 shares are sold at net asset value. Effective November 30, 2010, new or additional investments in Class B shares are no longer permitted. Existing shareholders of Class B shares may continue to reinvest dividends and capital gains distributions in Class B shares until they convert to Class A shares. Also, shareholders in Class B shares will be able to exchange those shares for Class B shares of other Invesco Funds offering such shares until they convert to Class A shares. Generally, Class B shares will automatically convert to Class A shares on or about the month-end, which is at least eight years after the date of purchase. Redemption of Class B shares prior to the conversion date will be subject to a CDSC.
The following is a summary of the significant accounting policies followed by the Fund in the preparation of its financial statements.
| A. | Security Valuations — Securities, including restricted securities, are valued according to the following policy. |
A security listed or traded on an exchange (except convertible securities) is valued at its last sales price or official closing price as of the close of the customary trading session on the exchange where the security is principally traded, or lacking any sales or official closing price on a particular day, the security may be valued at the closing bid price on that day. Securities traded in the over-the-counter market are valued based on prices furnished by independent pricing services or market makers. When such securities are valued by an independent pricing service they may be considered fair valued. Futures contracts are valued at the final settlement price set by an exchange on which they are principally traded. Listed options are valued at the mean between the last bid and asked prices from the exchange on which they are principally traded. Options not listed on an exchange are valued by an independent source at the mean between the last bid and asked prices. For purposes of determining net
13 Invesco Greater China Fund
asset value (“NAV”) per share, futures and option contracts generally are valued 15 minutes after the close of the customary trading session of the New York Stock Exchange (“NYSE”).
Investments in open-end and closed-end registered investment companies that do not trade on an exchange are valued at the end-of-day net asset value per share. Investments in open-end and closed-end registered investment companies that trade on an exchange are valued at the last sales price or official closing price as of the close of the customary trading session on the exchange where the security is principally traded.
Debt obligations (including convertible securities) and unlisted equities are fair valued using an evaluated quote provided by an independent pricing service. Evaluated quotes provided by the pricing service may be determined without exclusive reliance on quoted prices, and may reflect appropriate factors such as institution-size trading in similar groups of securities, developments related to specific securities, dividend rate (for unlisted equities), yield (for debt obligations), quality, type of issue, coupon rate (for debt obligations), maturity (for debt obligations), individual trading characteristics and other market data. Debt obligations are subject to interest rate and credit risks. In addition, all debt obligations involve some risk of default with respect to interest and/or principal payments.
Foreign securities’ (including foreign exchange contracts) prices are converted into U.S. dollar amounts using the applicable exchange rates as of the close of the NYSE. If market quotations are available and reliable for foreign exchange-traded equity securities, the securities will be valued at the market quotations. Because trading hours for certain foreign securities end before the close of the NYSE, closing market quotations may become unreliable. If between the time trading ends on a particular security and the close of the customary trading session on the NYSE, events occur that the Adviser determines are significant and make the closing price unreliable, the Fund may fair value the security. If the event is likely to have affected the closing price of the security, the security will be valued at fair value in good faith using procedures approved by the Board of Trustees. Adjustments to closing prices to reflect fair value may also be based on a screening process of an independent pricing service to indicate the degree of certainty, based on historical data, that the closing price in the principal market where a foreign security trades is not the current value as of the close of the NYSE. Foreign securities’ prices meeting the approved degree of certainty that the price is not reflective of current value will be priced at the indication of fair value from the independent pricing service. Multiple factors may be considered by the independent pricing service in determining adjustments to reflect fair value and may include information relating to sector indices, American Depositary Receipts and domestic and foreign index futures. Foreign securities may have additional risks including exchange rate changes, potential for sharply devalued currencies and high inflation, political and economic upheaval, the relative lack of issuer information, relatively low market liquidity and the potential lack of strict financial and accounting controls and standards.
Securities for which market prices are not provided by any of the above methods may be valued based upon quotes furnished by independent sources. The last bid price may be used to value equity securities. The mean between the last bid and asked prices is used to value debt obligations, including corporate loans.
Securities for which market quotations are not readily available or became unreliable are valued at fair value as determined in good faith by or under the supervision of the Trust’s officers following procedures approved by the Board of Trustees. Issuer specific events, market trends, bid/asked quotes of brokers and information providers and other market data may be reviewed in the course of making a good faith determination of a security’s fair value.
The Fund may invest in securities that are subject to interest rate risk, meaning the risk that the prices will generally fall as interest rates rise and, conversely, the prices will generally rise as interest rates fall. Specific securities differ in their sensitivity to changes in interest rates depending on their individual characteristics. Changes in interest rates may result in increased market volatility, which may affect the value and/or liquidity of certain Fund investments.
Valuations change in response to many factors including the historical and prospective earnings of the issuer, the value of the issuer’s assets, general economic conditions, interest rates, investor perceptions and market liquidity. Because of the inherent uncertainties of valuation, the values reflected in the financial statements may materially differ from the value received upon actual sale of those investments.
| B. | Securities Transactions and Investment Income — Securities transactions are accounted for on a trade date basis. Realized gains or losses on sales are computed on the basis of specific identification of the securities sold. Interest income (net of withholding tax, if any) is recorded on the accrual basis from settlement date. Dividend income (net of withholding tax, if any) is recorded on the ex-dividend date. |
The Fund may periodically participate in litigation related to Fund investments. As such, the Fund may receive proceeds from litigation settlements. Any proceeds received are included in the Statement of Operations as realized gain (loss) for investments no longer held and as unrealized gain (loss) for investments still held.
Brokerage commissions and mark ups are considered transaction costs and are recorded as an increase to the cost basis of securities purchased and/or a reduction of proceeds on a sale of securities. Such transaction costs are included in the determination of net realized and unrealized gain (loss) from investment securities reported in the Statement of Operations and the Statement of Changes in Net Assets and the net realized and unrealized gains (losses) on securities per share in the Financial Highlights. Transaction costs are included in the calculation of the Fund’s net asset value and, accordingly, they reduce the Fund’s total returns. These transaction costs are not considered operating expenses and are not reflected in net investment income reported in the Statement of Operations and the Statement of Changes in Net Assets, or the net investment income per share and the ratios of expenses and net investment income reported in the Financial Highlights, nor are they limited by any expense limitation arrangements between the Fund and the investment adviser.
The Fund allocates income and realized and unrealized capital gains and losses to a class based on the relative net assets of each class.
| C. | Country Determination — For the purposes of making investment selection decisions and presentation in the Schedule of Investments, the investment adviser may determine the country in which an issuer is located and/or credit risk exposure based on various factors. These factors include the laws of the country under which the issuer is organized, where the issuer maintains a principal office, the country in which the issuer derives 50% or more of its total revenues and the country that has the primary market for the issuer’s securities, as well as other criteria. Among the other criteria that may be evaluated for making this determination are the country in which the issuer maintains 50% or more of its assets, the type of security, financial guarantees and enhancements, the nature of the collateral and the sponsor organization. Country of issuer and/or credit risk exposure has been determined to be the United States of America, unless otherwise noted. |
| D. | Distributions — Distributions from net investment income and net realized capital gain, if any, are generally declared and paid annually and recorded on the ex-dividend date. The Fund may elect to treat a portion of the proceeds from redemptions as distributions for federal income tax purposes. |
14 Invesco Greater China Fund
| E. | Federal Income Taxes — The Fund intends to comply with the requirements of Subchapter M of the Internal Revenue Code of 1986, as amended (the “Internal Revenue Code”), necessary to qualify as a regulated investment company and to distribute substantially all of the Fund’s taxable earnings to shareholders. As such, the Fund will not be subject to federal income taxes on otherwise taxable income (including net realized capital gain) that is distributed to shareholders. Therefore, no provision for federal income taxes is recorded in the financial statements. |
The Fund recognizes the tax benefits of uncertain tax positions only when the position is more likely than not to be sustained. Management has analyzed the Fund’s uncertain tax positions and concluded that no liability for unrecognized tax benefits should be recorded related to uncertain tax positions. Management is not aware of any tax positions for which it is reasonably possible that the total amounts of unrecognized tax benefits will change materially in the next 12 months.
The Fund files tax returns in the U.S. Federal jurisdiction and certain other jurisdictions. Generally, the Fund is subject to examinations by such taxing authorities for up to three years after the filing of the return for the tax period.
| F. | Expenses — Fees provided for under the Rule 12b-1 plan of a particular class of the Fund are charged to the operations of such class. Transfer agency fees and expenses and other shareholder recordkeeping fees and expenses attributable to Class R5 are charged to such class. Transfer agency fees and expenses and other shareholder recordkeeping fees and expenses relating to all other classes are allocated among those classes based on relative net assets. All other expenses are allocated among the classes based on relative net assets. |
| G. | Accounting Estimates — The preparation of financial statements in conformity with accounting principles generally accepted in the United States of America (“GAAP”) requires management to make estimates and assumptions that affect the reported amounts of assets and liabilities at the date of the financial statements and the reported amounts of revenues and expenses during the reporting period including estimates and assumptions related to taxation. Actual results could differ from those estimates by a significant amount. In addition, the Fund monitors for material events or transactions that may occur or become known after the period-end date and before the date the financial statements are released to print. |
| H. | Indemnifications — Under the Trust’s organizational documents, each Trustee, officer, employee or other agent of the Trust is indemnified against certain liabilities that may arise out of the performance of their duties to the Fund. Additionally, in the normal course of business, the Fund enters into contracts, including the Fund’s servicing agreements, that contain a variety of indemnification clauses. The Fund’s maximum exposure under these arrangements is unknown as this would involve future claims that may be made against the Fund that have not yet occurred. The risk of material loss as a result of such indemnification claims is considered remote. |
| I. | Foreign Currency Translations — Foreign currency is valued at the close of the NYSE based on quotations posted by banks and major currency dealers. Portfolio securities and other assets and liabilities denominated in foreign currencies are translated into U.S. dollar amounts at date of valuation. Purchases and sales of portfolio securities (net of foreign taxes withheld on disposition) and income items denominated in foreign currencies are translated into U.S. dollar amounts on the respective dates of such transactions. The Fund does not separately account for the portion of the results of operations resulting from changes in foreign exchange rates on investments and the fluctuations arising from changes in market prices of securities held. The combined results of changes in foreign exchange rates and the fluctuation of market prices on investments (net of estimated foreign tax withholding) are included with the net realized and unrealized gain or loss from investments in the Statement of Operations. Reported net realized foreign currency gains or losses arise from (1) sales of foreign currencies, (2) currency gains or losses realized between the trade and settlement dates on securities transactions, and (3) the difference between the amounts of dividends, interest, and foreign withholding taxes recorded on the Fund’s books and the U.S. dollar equivalent of the amounts actually received or paid. Net unrealized foreign currency gains and losses arise from changes in the fair values of assets and liabilities, other than investments in securities at fiscal period end, resulting from changes in exchange rates. |
The Fund may invest in foreign securities, which may be subject to foreign taxes on income, gains on investments or currency repatriation, a portion of which may be recoverable. Foreign taxes, if any, are recorded based on the tax regulations and rates that exist in the foreign markets in which the Fund invests and are shown in the Statement of Operations.
| J. | Forward Foreign Currency Contracts — The Fund may engage in foreign currency transactions either on a spot (i.e. for prompt delivery and settlement) basis, or through forward foreign currency contracts, to manage or minimize currency or exchange rate risk. |
The Fund may also enter into forward foreign currency contracts for the purchase or sale of a security denominated in a foreign currency in order to “lock in” the U.S. dollar price of that security, or the Fund may also enter into forward foreign currency contracts that do not provide for physical settlement of the two currencies, but instead are settled by a single cash payment calculated as the difference between the agreed upon exchange rate and the spot rate at settlement based upon an agreed upon notional amount (non-deliverable forwards). The Fund will set aside liquid assets in an amount equal to daily mark-to-market obligation for forward foreign currency contracts.
A forward foreign currency contract is an obligation between two parties (“Counterparties”) to purchase or sell a specific currency for an agreed-upon price at a future date. The use of forward foreign currency contracts does not eliminate fluctuations in the price of the underlying securities the Fund owns or intends to acquire but establishes a rate of exchange in advance. Fluctuations in the value of these contracts are measured by the difference in the contract date and reporting date exchange rates and are recorded as unrealized appreciation (depreciation) until the contracts are closed. When the contracts are closed, realized gains (losses) are recorded. Realized and unrealized gains (losses) on the contracts are included in the Statement of Operations. The primary risks associated with forward foreign currency contracts include failure of the Counterparty to meet the terms of the contract and the value of the foreign currency changing unfavorably. These risks may be in excess of the amounts reflected in the Statement of Assets and Liabilities.
| K. | Other Risks — Investing in a single-country mutual fund involves greater risk than investing in a more diversified fund due to lack of exposure to other countries. The political and economic conditions and changes in regulatory, tax or economic policy in a single country could significantly affect the market in that country and in surrounding or related countries. |
Investing in developing countries can add additional risk, such as high rates of inflation or sharply devalued currencies against the U.S. dollar.
Transaction costs are often higher and there may be delays in settlement procedures.
Certain securities issued by companies in China may be less liquid, harder to sell or more volatile than U.S. securities.
15 Invesco Greater China Fund
NOTE 2—Advisory Fees and Other Fees Paid to Affiliates
The Trust has entered into a master investment advisory agreement with Invesco Advisers, Inc. (the “Adviser” or “Invesco”). Under the terms of the investment advisory agreement, the Fund pays an advisory fee to the Adviser based on the annual rate of the Fund’s average daily net assets as follows:
| | | | | | |
| Average Daily Net Assets | | Rate |
First $250 million | | | 0 | .935% | | |
Next $250 million | | | 0 | .91% | | |
Next $500 million | | | 0 | .885% | | |
Next $1.5 billion | | | 0 | .86% | | |
Next $2.5 billion | | | 0 | .835% | | |
Next $2.5 billion | | | 0 | .81% | | |
Next $2.5 billion | | | 0 | .785% | | |
Over $10 billion | | | 0 | .76% | | |
For the year ended October 31, 2015, the effective advisory fees incurred by the Fund was 0.94%.
Under the terms of a master sub-advisory agreement between the Adviser and each of Invesco Asset Management Deutschland GmbH, Invesco Asset Management Limited, Invesco Asset Management (Japan) Limited, Invesco Hong Kong Limited, Invesco Senior Secured Management, Inc., and Invesco Canada Ltd. (collectively, the “Affiliated Sub-Advisers”) the Adviser, not the Fund, may pay 40% of the fees paid to the Adviser to any such Affiliated Sub-Adviser(s) that provide(s) discretionary investment management services to the Fund based on the percentage of assets allocated to such Affiliated Sub-Adviser(s).
The Adviser has contractually agreed, through at least June 30, 2016, to waive advisory fees and/or reimburse expenses to the extent necessary to limit total annual fund operating expenses after fee waiver and/or expense reimbursement (excluding certain items discussed below) of Class A, Class B, Class C, Class Y and Class R5 shares to 2.25%, 3.00%, 3.00%, 2.00% and 2.00% of average daily net assets, respectively. In determining the Adviser’s obligation to waive advisory fees and/or reimburse expenses, the following expenses are not taken into account, and could cause the total annual fund operating expenses after fee waiver and/or reimbursement to exceed the numbers reflected above: (1) interest; (2) taxes; (3) dividend expense on short sales; (4) extraordinary or non-routine items, including litigation expenses; and (5) expenses that the Fund has incurred but did not actually pay because of an expense offset arrangement. Unless Invesco continues the fee waiver agreement, it will terminate on June 30, 2016. The Adviser did not waive fees and/or reimburse expenses during the period under this expense limitation.
Further, the Adviser has contractually agreed, through at least June 30, 2017, to waive the advisory fee payable by the Fund in an amount equal to 100% of the net advisory fees the Adviser receives from the affiliated money market funds on investments by the Fund of uninvested cash in such affiliated money market funds.
For the year ended October 31, 2015, the Adviser waived advisory fees of $2,768.
The Trust has entered into a master administrative services agreement with Invesco pursuant to which the Fund has agreed to pay Invesco for certain administrative costs incurred in providing accounting services to the Fund. For the year ended October 31, 2015, expenses incurred under the agreement are shown in the Statement of Operations as Administrative services fees.
The Trust has entered into a transfer agency and service agreement with Invesco Investment Services, Inc. (“IIS”) pursuant to which the Fund has agreed to pay IIS a fee for providing transfer agency and shareholder services to the Fund and reimburse IIS for certain expenses incurred by IIS in the course of providing such services. IIS may make payments to intermediaries that provide omnibus account services, sub-accounting services and/or networking services. All fees payable by IIS to intermediaries that provide omnibus account services or sub-accounting are charged back to the Fund, subject to certain limitations approved by the Trust’s Board of Trustees. For the year ended October 31, 2015, expenses incurred under the agreement are shown in the Statement of Operations as Transfer agent fees.
The Trust has entered into master distribution agreements with Invesco Distributors, Inc. (“IDI”) to serve as the distributor for the Class A, Class B, Class C, Class Y and Class R5 shares of the Fund. The Trust has adopted plans pursuant to Rule 12b-1 under the 1940 Act with respect to the Fund’s Class A, Class B and Class C shares (collectively, the “Plans”). The Fund, pursuant to the Plans, pays IDI compensation at the annual rate of 0.25% of the Fund’s average daily net assets of Class A shares and 1.00% of the average daily net assets of Class B and Class C shares. Of the Plan payments, up to 0.25% of the average daily net assets of each class of shares may be paid to furnish continuing personal shareholder services to customers who purchase and own shares of such classes. Any amounts not paid as a service fee under the Plans would constitute an asset-based sales charge. Rules of the Financial Industry Regulatory Authority (“FINRA”) impose a cap on the total sales charges, including asset-based sales charges, that may be paid by any class of shares of the Fund. For the year ended October 31, 2015, expenses incurred under the Plans are shown in the Statement of Operations as Distribution fees.
Front-end sales commissions and CDSC (collectively, the “sales charges”) are not recorded as expenses of the Fund. Front-end sales commissions are deducted from proceeds from the sales of Fund shares prior to investment in Class A shares of the Fund. CDSC are deducted from redemption proceeds prior to remittance to the shareholder. During the year ended October 31, 2015, IDI advised the Fund that IDI retained $16,809 in front-end sales commissions from the sale of Class A shares and $487, $4,881 and $1,693 from Class A, Class B and Class C shares, respectively, for CDSC imposed on redemptions by shareholders.
Certain officers and trustees of the Trust are officers and directors of the Adviser, IIS and/or IDI.
16 Invesco Greater China Fund
NOTE 3—Additional Valuation Information
GAAP defines fair value as the price that would be received to sell an asset or paid to transfer a liability in an orderly transaction between market participants at the measurement date, under current market conditions. GAAP establishes a hierarchy that prioritizes the inputs to valuation methods, giving the highest priority to readily available unadjusted quoted prices in an active market for identical assets (Level 1) and the lowest priority to significant unobservable inputs (Level 3), generally when market prices are not readily available or are unreliable. Based on the valuation inputs, the securities or other investments are tiered into one of three levels. Changes in valuation methods may result in transfers in or out of an investment’s assigned level:
| | Level 1 — | Prices are determined using quoted prices in an active market for identical assets. |
| | Level 2 — | Prices are determined using other significant observable inputs. Observable inputs are inputs that other market participants may use in pricing a security. These may include quoted prices for similar securities, interest rates, prepayment speeds, credit risk, yield curves, loss severities, default rates, discount rates, volatilities and others. |
| | Level 3 — | Prices are determined using significant unobservable inputs. In situations where quoted prices or observable inputs are unavailable (for example, when there is little or no market activity for an investment at the end of the period), unobservable inputs may be used. Unobservable inputs reflect the Fund’s own assumptions about the factors market participants would use in determining fair value of the securities or instruments and would be based on the best available information. |
The following is a summary of the tiered valuation input levels, as of October 31, 2015. The level assigned to the securities valuations may not be an indication of the risk or liquidity associated with investing in those securities. Because of the inherent uncertainties of valuation, the values reflected in the financial statements may materially differ from the value received upon actual sale of those investments.
During the year ended October 31, 2015, there were transfers from Level 1 to Level 2 of $6,347,214, due to foreign fair value adjustments.
| | | | | | | | | | | | | | | | |
| | | Level 1 | | | Level 2 | | | Level 3 | | | Total | |
Consumer Discretionary | | $ | 5,817,619 | | | $ | 11,902,744 | | | $ | — | | | $ | 17,720,363 | |
Consumer Staples | | | — | | | | 9,100,614 | | | | — | | | | 9,100,614 | |
Energy | | | — | | | | 2,877,676 | | | | — | | | | 2,877,676 | |
Financials | | | — | | | | 9,382,330 | | | | — | | | | 9,382,330 | |
Health Care | | | — | | | | 411,461 | | | | — | | | | 411,461 | |
Industrials | | | — | | | | 5,828,111 | | | | — | | | | 5,828,111 | |
Information Technology | | | 4,665,937 | | | | 15,233,480 | | | | — | | | | 19,899,417 | |
Telecommunication Services | | | — | | | | 6,156,250 | | | | — | | | | 6,156,250 | |
Utilities | | | — | | | | 1,257,151 | | | | — | | | | 1,257,151 | |
Money Market Funds | | | 645,915 | | | | — | | | | — | | | | 645,915 | |
Total Investments | | $ | 11,129,471 | | | $ | 62,149,817 | | | $ | — | | | $ | 73,279,288 | |
NOTE 4—Expense Offset Arrangement(s)
The expense offset arrangement is comprised of transfer agency credits which result from balances in demand deposit accounts used by the transfer agent for clearing shareholder transactions. For the year ended October 31, 2015, the Fund received credits from this arrangement, which resulted in the reduction of the Fund’s total expenses of $918.
NOTE 5—Trustees’ and Officers’ Fees and Benefits
Trustees’ and Officers’ Fees and Benefits include amounts accrued by the Fund to pay remuneration to certain Trustees and Officers of the Fund. Trustees have the option to defer compensation payable by the Fund, and Trustees’ and Officers’ Fees and Benefits also include amounts accrued by the Fund to fund such deferred compensation amounts. Those Trustees who defer compensation have the option to select various Invesco Funds in which their deferral accounts shall be deemed to be invested. Finally, certain current Trustees were eligible to participate in a retirement plan that provided for benefits to be paid upon retirement to Trustees over a period of time based on the number of years of service. The Fund may have certain former Trustees who also participate in a retirement plan and receive benefits under such plan. Trustees’ and Officers’ Fees and Benefits include amounts accrued by the Fund to fund such retirement benefits. Obligations under the deferred compensation and retirement plans represent unsecured claims against the general assets of the Fund.
NOTE 6—Cash Balances
The Fund is permitted to temporarily carry a negative or overdrawn balance in its account with State Street Bank and Trust Company, the custodian bank. Such balances, if any at period end, are shown in the Statement of Assets and Liabilities under the payable caption Amount due custodian. To compensate the custodian bank for such overdrafts, the overdrawn Fund may either (1) leave funds as a compensating balance in the account so the custodian bank can be compensated by earning the additional interest; or (2) compensate by paying the custodian bank at a rate agreed upon by the custodian bank and Invesco, not to exceed the contractually agreed upon rate.
17 Invesco Greater China Fund
NOTE 7—Distributions to Shareholders and Tax Components of Net Assets
Tax Character of Distributions to Shareholders Paid During the Fiscal Years Ended October 31, 2015 and 2014:
| | | | | | | | |
| | | 2015 | | | 2014 | |
Ordinary income | | $ | 295,485 | | | $ | 976,277 | |
Tax Components of Net Assets at Period-End:
| | | | |
| | | 2015 | |
Undistributed ordinary income | | $ | 591,297 | |
Net unrealized appreciation (depreciation) — investments | | | (3,310,263 | ) |
Net unrealized appreciation (depreciation) — other investments | | | (3 | ) |
Temporary book/tax differences | | | (51,697 | ) |
Capital loss carryforward | | | (34,729,485 | ) |
Shares of beneficial interest | | | 110,633,462 | |
Total net assets | | $ | 73,133,311 | |
The difference between book-basis and tax-basis unrealized appreciation (depreciation) is due to differences in the timing of recognition of gains and losses on investments for tax and book purposes. The Fund’s net unrealized appreciation (depreciation) difference is attributable primarily to wash sales.
The temporary book/tax differences are a result of timing differences between book and tax recognition of income and/or expenses. The Fund’s temporary book/tax differences are the result of the trustee deferral of compensation and retirement plan benefits.
Capital loss carryforward is calculated and reported as of a specific date. Results of transactions and other activity after that date may affect the amount of capital loss carryforward actually available for the Fund to utilize. Capital losses generated in years beginning after December 22, 2010 can be carried forward for an unlimited period, whereas previous losses expire in eight tax years. Capital losses with an expiration period may not be used to offset capital gains until all net capital losses without an expiration date have been utilized. Capital loss carryforwards with no expiration date will retain their character as either short-term or long-term capital losses instead of as short-term capital losses as under prior law. The ability to utilize capital loss carryforwards in the future may be limited under the Internal Revenue Code and related regulations based on the results of future transactions.
The Fund has a capital loss carryforward as of October 31, 2015, which expires as follows:
| | | | | | | | | | | | |
| Capital Loss Carryforward* | |
| Expiration | | Short-Term | | | Long-Term | | | Total | |
October 31, 2016 | | $ | 23,381,627 | | | $ | — | | | $ | 23,381,627 | |
October 31, 2017 | | | 11,347,858 | | | | — | | | | 11,347,858 | |
| | | $ | 34,729,485 | | | $ | — | | | $ | 34,729,485 | |
| * | Capital loss carryforward as of the date listed above is reduced for limitations, if any, to the extent required by the Internal Revenue Code and may be further limited depending upon a variety of factors, including the realization of net unrealized gains or losses as of the date of any reorganization. |
NOTE 8—Investment Securities
The aggregate amount of investment securities (other than short-term securities, U.S. Treasury obligations and money market funds, if any) purchased and sold by the Fund during the year ended October 31, 2015 was $105,406,284 and $124,676,441, respectively. Cost of investments on a tax basis includes the adjustments for financial reporting purposes as of the most recently completed federal income tax reporting period-end.
| | | | |
| Unrealized Appreciation (Depreciation) of Investment Securities on a Tax Basis | |
Aggregate unrealized appreciation of investment securities | | $ | 3,059,732 | |
Aggregate unrealized (depreciation) of investment securities | | | (6,369,995 | ) |
Net unrealized appreciation (depreciation) of investment securities | | $ | (3,310,263 | ) |
Cost of investments for tax purposes is $76,589,551.
NOTE 9—Reclassification of Permanent Differences
Primarily as a result of differing book/tax treatment of passive foreign investment companies, on October 31, 2015, undistributed net investment income was increased by $23,420 and undistributed net realized gain (loss) was decreased by $23,420. This reclassification had no effect on the net assets of the Fund.
18 Invesco Greater China Fund
NOTE 10—Share Information
| | | | | | | | | | | | | | | | |
| | | Summary of Share Activity | |
| | | Years ended October 31, | |
| | | 2015(a) | | | 2014 | |
| | | Shares | | | Amount | | | Shares | | | Amount | |
Sold: | | | | | | | | | | | | | | | | |
Class A | | | 544,471 | | | $ | 12,200,811 | | | | 720,306 | | | $ | 14,781,137 | |
Class B | | | 2,757 | | | | 54,843 | | | | 10,113 | | | | 199,431 | |
Class C | | | 101,802 | | | | 2,205,552 | | | | 55,095 | | | | 1,084,665 | |
Class Y | | | 135,375 | | | | 3,100,738 | | | | 105,131 | | | | 2,148,178 | |
Class R5 | | | 1,144 | | | | 22,484 | | | | 998 | | | | 19,651 | |
| | | | |
Issued as reinvestment of dividends: | | | | | | | | | | | | | | | | |
Class A | | | 13,413 | | | | 255,787 | | | | 36,522 | | | | 773,530 | |
Class B | | | — | | | | — | | | | 736 | | | | 15,234 | |
Class C | | | — | | | | — | | | | 2,087 | | | | 43,148 | |
Class Y | | | 1,259 | | | | 24,002 | | | | 2,588 | | | | 54,829 | |
Class R5 | | | 37 | | | | 721 | | | | 242 | | | | 5,129 | |
| | | | |
Automatic conversion of Class B shares to Class A shares: | | | | | | | | | | | | | | | | |
Class A | | | 69,008 | | | | 1,476,447 | | | | 28,520 | | | | 569,466 | |
Class B | | | (71,079 | ) | | | (1,476,447 | ) | | | (29,290 | ) | | | (569,466 | ) |
| | | | |
Reacquired: | | | | | | | | | | | | | | | | |
Class A | | | (1,269,798 | ) | | | (27,026,548 | ) | | | (1,401,485 | ) | | | (28,040,660 | ) |
Class B | | | (78,472 | ) | | | (1,597,986 | ) | | | (83,442 | ) | | | (1,648,836 | ) |
Class C | | | (246,214 | ) | | | (5,066,681 | ) | | | (315,673 | ) | | | (6,123,188 | ) |
Class Y | | | (198,394 | ) | | | (4,201,823 | ) | | | (105,289 | ) | | | (2,150,098 | ) |
Class R5 | | | (2,801 | ) | | | (55,149 | ) | | | (16,233 | ) | | | (331,924 | ) |
Net increase (decrease) in share activity | | | (997,492 | ) | | $ | (20,083,249 | ) | | | (989,074 | ) | | $ | (19,169,774 | ) |
| (a) | There are entities that are record owners of more than 5% of the outstanding shares of the Fund and in the aggregate own 18% of the outstanding shares of the Fund. IDI has an agreement with these entities to sell Fund shares. The Fund, Invesco and/or Invesco affiliates may make payments to these entities, which are considered to be related to the Fund, for providing services to the Fund, Invesco and/or Invesco affiliates including but not limited to services such as securities brokerage, distribution, third party record keeping and account servicing. The Fund has no knowledge as to whether all or any portion of the shares owned of record by these entities are also owned beneficially. |
19 Invesco Greater China Fund
NOTE 11—Financial Highlights
The following schedule presents financial highlights for a share of the Fund outstanding throughout the periods indicated.
| | | | | | | | | | | | | | | | | | | | | | | | | | | | | | | | | | | | | | | | | | | | | | | | |
| | | Net asset
value,
beginning
of period | | | Net
investment
income
(loss)(a) | | | Net gains
(losses) on
securities
(both
realized and
unrealized) | | | Total from
investment
operations | | | Dividends
from net
investment
income | | | Net asset
value, end
of period(b) | | | Total
return(c) | | | Net assets,
end of period
(000’s omitted) | | | Ratio of
expenses
to average
net assets
with fee waivers
and/or expenses
absorbed | | | Ratio of
expenses
to average net
assets without
fee waivers
and/or expenses
absorbed | | | Ratio of net
investment
income (loss)
to average
net assets | | | Portfolio
turnover(d) | |
Class A | | | | | | | | | | | | | | | | | | | | | | | | | | | | | | | | | | | | | | | | | | | | | | | | |
Year ended 10/31/15 | | $ | 19.93 | | | $ | 0.18 | | | $ | 1.08 | | | $ | 1.26 | | | $ | (0.09 | ) | | $ | 21.10 | | | | 6.36 | % | | $ | 53,087 | | | | 1.88 | %(e) | | | 1.88 | %(e) | | | 0.85 | %(e) | | | 130 | % |
Year ended 10/31/14 | | | 20.31 | | | | (0.03 | ) | | | (0.13 | ) | | | (0.16 | ) | | | (0.22 | ) | | | 19.93 | | | | (0.87 | ) | | | 62,957 | | | | 1.85 | | | | 1.85 | | | | (0.15 | ) | | | 124 | |
Year ended 10/31/13 | | | 17.90 | | | | 0.09 | | | | 2.44 | | | | 2.53 | | | | (0.12 | ) | | | 20.31 | | | | 14.18 | | | | 76,691 | | | | 1.78 | | | | 1.78 | | | | 0.50 | | | | 148 | |
Year ended 10/31/12 | | | 17.52 | | | | 0.11 | | | | 0.37 | | | | 0.48 | | | | (0.10 | ) | | | 17.90 | | | | 2.79 | | | | 82,713 | | | | 1.80 | | | | 1.80 | | | | 0.64 | | | | 109 | |
Year ended 10/31/11 | | | 21.93 | | | | 0.12 | | | | (4.49 | ) | | | (4.37 | ) | | | (0.04 | ) | | | 17.52 | | | | (19.96 | ) | | | 102,248 | | | | 1.67 | | | | 1.67 | | | | 0.57 | | | | 97 | |
Class B | | | | | | | | | | | | | | | | | | | | | | | | | | | | | | | | | | | | | | | | | | | | | | | | |
Year ended 10/31/15 | | | 19.35 | | | | 0.02 | | | | 1.06 | | | | 1.08 | | | | — | | | | 20.43 | | | | 5.58 | | | | 2,600 | | | | 2.63 | (e) | | | 2.63 | (e) | | | 0.10 | (e) | | | 130 | |
Year ended 10/31/14 | | | 19.71 | | | | (0.18 | ) | | | (0.14 | ) | | | (0.32 | ) | | | (0.04 | ) | | | 19.35 | | | | (1.61 | ) | | | 5,303 | | | | 2.60 | | | | 2.60 | | | | (0.90 | ) | | | 124 | |
Year ended 10/31/13 | | | 17.39 | | | | (0.05 | ) | | | 2.37 | | | | 2.32 | | | | — | | | | 19.71 | | | | 13.34 | | | | 7,411 | | | | 2.53 | | | | 2.53 | | | | (0.25 | ) | | | 148 | |
Year ended 10/31/12 | | | 17.05 | | | | (0.02 | ) | | | 0.36 | | | | 0.34 | | | | — | | | | 17.39 | | | | 1.99 | | | | 9,703 | | | | 2.55 | | | | 2.55 | | | | (0.11 | ) | | | 109 | |
Year ended 10/31/11 | | | 21.46 | | | | (0.04 | ) | | | (4.37 | ) | | | (4.41 | ) | | | — | | | | 17.05 | | | | (20.55 | ) | | | 13,988 | | | | 2.42 | | | | 2.42 | | | | (0.18 | ) | | | 97 | |
Class C | | | | | | | | | | | | | | | | | | | | | | | | | | | | | | | | | | | | | | | | | | | | | | | | |
Year ended 10/31/15 | | | 19.32 | | | | 0.02 | | | | 1.05 | | | | 1.07 | | | | — | | | | 20.39 | | | | 5.54 | | | | 13,922 | | | | 2.63 | (e) | | | 2.63 | (e) | | | 0.10 | (e) | | | 130 | |
Year ended 10/31/14 | | | 19.68 | | | | (0.18 | ) | | | (0.14 | ) | | | (0.32 | ) | | | (0.04 | ) | | | 19.32 | | | | (1.62 | ) | | | 15,978 | | | | 2.60 | | | | 2.60 | | | | (0.90 | ) | | | 124 | |
Year ended 10/31/13 | | | 17.36 | | | | (0.05 | ) | | | 2.37 | | | | 2.32 | | | | — | | | | 19.68 | | | | 13.36 | | | | 21,366 | | | | 2.53 | | | | 2.53 | | | | (0.25 | ) | | | 148 | |
Year ended 10/31/12 | | | 17.02 | | | | (0.02 | ) | | | 0.36 | | | | 0.34 | | | | — | | | | 17.36 | | | | 2.00 | | | | 24,728 | | | | 2.55 | | | | 2.55 | | | | (0.11 | ) | | | 109 | |
Year ended 10/31/11 | | | 21.43 | | | | (0.04 | ) | | | (4.37 | ) | | | (4.41 | ) | | | — | | | | 17.02 | | | | (20.58 | ) | | | 32,319 | | | | 2.42 | | | | 2.42 | | | | (0.18 | ) | | | 97 | |
Class Y | | | | | | | | | | | | | | | | | | | | | | | | | | | | | | | | | | | | | | | | | | | | | | | | |
Year ended 10/31/15 | | | 19.98 | | | | 0.23 | | | | 1.08 | | | | 1.31 | | | | (0.15 | ) | | | 21.14 | | | | 6.62 | | | | 3,449 | | | | 1.63 | (e) | | | 1.63 | (e) | | | 1.10 | (e) | | | 130 | |
Year ended 10/31/14 | | | 20.36 | | | | 0.02 | | | | (0.13 | ) | | | (0.11 | ) | | | (0.27 | ) | | | 19.98 | | | | (0.62 | ) | | | 4,494 | | | | 1.60 | | | | 1.60 | | | | 0.10 | | | | 124 | |
Year ended 10/31/13 | | | 17.95 | | | | 0.14 | | | | 2.44 | | | | 2.58 | | | | (0.17 | ) | | | 20.36 | | | | 14.43 | | | | 4,531 | | | | 1.53 | | | | 1.53 | | | | 0.75 | | | | 148 | |
Year ended 10/31/12 | | | 17.58 | | | | 0.15 | | | | 0.38 | | | | 0.53 | | | | (0.16 | ) | | | 17.95 | | | | 3.08 | | | | 4,384 | | | | 1.55 | | | | 1.55 | | | | 0.89 | | | | 109 | |
Year ended 10/31/11 | | | 22.01 | | | | 0.17 | | | | (4.51 | ) | | | (4.34 | ) | | | (0.09 | ) | | | 17.58 | | | | (19.78 | ) | | | 6,483 | | | | 1.42 | | | | 1.42 | | | | 0.82 | | | | 97 | |
Class R5 | | | | | | | | | | | | | | | | | | | | | | | | | | | | | | | | | | | | | | | | | | | | | | | | |
Year ended 10/31/15 | | | 20.01 | | | | 0.28 | | | | 1.08 | | | | 1.36 | | | | (0.20 | ) | | | 21.17 | | | | 6.88 | | | | 75 | | | | 1.41 | (e) | | | 1.41 | (e) | | | 1.32 | (e) | | | 130 | |
Year ended 10/31/14 | | | 20.38 | | | | 0.06 | | | | (0.14 | ) | | | (0.08 | ) | | | (0.29 | ) | | | 20.01 | | | | (0.46 | ) | | | 104 | | | | 1.39 | | | | 1.39 | | | | 0.31 | | | | 124 | |
Year ended 10/31/13 | | | 17.97 | | | | 0.18 | | | | 2.45 | | | | 2.63 | | | | (0.22 | ) | | | 20.38 | | | | 14.71 | | | | 411 | | | | 1.33 | | | | 1.33 | | | | 0.95 | | | | 148 | |
Year ended 10/31/12 | | | 17.61 | | | | 0.20 | | | | 0.37 | | | | 0.57 | | | | (0.21 | ) | | | 17.97 | | | | 3.29 | | | | 757 | | | | 1.30 | | | | 1.30 | | | | 1.14 | | | | 109 | |
Year ended 10/31/11 | | | 22.04 | | | | 0.21 | | | | (4.51 | ) | | | (4.30 | ) | | | (0.13 | ) | | | 17.61 | | | | (19.61 | ) | | | 770 | | | | 1.23 | | | | 1.23 | | | | 1.01 | | | | 97 | |
| (a) | Calculated using average shares outstanding. |
| (b) | Includes redemption fees added to shares of beneficial interest which were less than $0.005 per share for the fiscal years ended October 31, 2012 and prior. |
| (c) | Includes adjustments in accordance with accounting principles generally accepted in the united States of America and as such, the net asset value for financial reporting purposes and the returns based upon those net asset values may differ from the net asset value and returns for shareholder transactions. Does not include sales charges and is not annualized for periods less than on year, if applicable. |
| (d) | Portfolio turnover is calculated at the fund level and is not annualized for periods less than one year, if applicable. |
| (e) | Ratios are based on average daily net assets (000’s omitted) of $60,104, $4,149, $15,467, $3,842 and $67 for Class A, Class B, Class C, Class Y and Class R5 shares, respectively. |
20 Invesco Greater China Fund
Report of Independent Registered Public Accounting Firm
To the Board of Trustees of AIM Investment Funds (Invesco Investment Funds)
and Shareholders of Invesco Greater China Fund:
In our opinion, the accompanying statement of assets and liabilities, including the schedule of investments, and the related statements of operations and of changes in net assets and the financial highlights present fairly, in all material respects, the financial position of Invesco Greater China Fund (formerly known as Invesco China Fund; one of the funds constituting AIM Investment Funds (Invesco Investment Funds), hereafter referred to as the “Fund”) at October 31, 2015, the results of its operations for the year then ended, the changes in its net assets for each of the two years in the period then ended and the financial highlights for each of the five years in the period then ended, in conformity with accounting principles generally accepted in the United States of America. These financial statements and financial highlights (hereafter referred to as “financial statements”) are the responsibility of the Fund’s management. Our responsibility is to express an opinion on these financial statements based on our audits. We conducted our audits of these financial statements in accordance with the standards of the Public Company Accounting Oversight Board (United States). Those standards require that we plan and perform the audit to obtain reasonable assurance about whether the financial statements are free of material misstatement. An audit includes examining, on a test basis, evidence supporting the amounts and disclosures in the financial statements, assessing the accounting principles used and significant estimates made by management, and evaluating the overall financial statement presentation. We believe that our audits, which included confirmation of securities at October 31, 2015 by correspondence with the custodian and brokers, and the application of alternative auditing procedures where confirmations of security purchases have not been received, provide a reasonable basis for our opinion.
PRICEWATERHOUSECOOPERS LLP
December 23, 2015
Houston, Texas
21 Invesco Greater China Fund
Calculating your ongoing Fund expenses
Example
As a shareholder of the Fund, you incur two types of costs: (1) transaction costs, which may include sales charges (loads) on purchase payments or contingent deferred sales charges on redemptions, if any; and (2) ongoing costs, including management fees, distribution and/or service (12b-1) fees, and other Fund expenses. This example is intended to help you understand your ongoing costs (in dollars) of investing in the Fund and to compare these costs with ongoing costs of investing in other mutual funds. The example is based on an investment of $1,000 invested at the beginning of the period and held for the entire period May 1, 2015 through October 31, 2015.
Actual expenses
The table below provides information about actual account values and actual expenses. You may use the information in this table, together with the amount you invested, to estimate the expenses that you paid over the period. Simply divide your account value by $1,000 (for example, an $8,600 account value divided by $1,000 = 8.6), then multiply the result by the number in the table under the heading entitled “Actual Expenses Paid During Period” to estimate the expenses you paid on your account during this period.
Hypothetical example for comparison purposes
The table below also provides information about hypothetical account values and hypothetical expenses based on the Fund’s actual expense ratio and an assumed rate of return of 5% per year before expenses, which is not the Fund’s actual return.
The hypothetical account values and expenses may not be used to estimate the actual ending account balance or expenses you paid for the period. You may use this information to compare the ongoing costs of investing in the Fund and other funds. To do so, compare this 5% hypothetical example with the 5% hypothetical examples that appear in the shareholder reports of the other funds.
Please note that the expenses shown in the table are meant to highlight your ongoing costs only and do not reflect any transaction costs, such as sales charges (loads) on purchase payments or contingent deferred sales charges on redemptions, if any. Therefore, the hypothetical information is useful in comparing ongoing costs only, and will not help you determine the relative total costs of owning different funds. In addition, if these transaction costs were included, your costs would have been higher.
| | | | | | | | | | | | | | | | | | | | | | | | |
| Class | | Beginning
Account Value
(05/01/15) | | | ACTUAL | | | HYPOTHETICAL (5% annual return before
expenses) | | | Annualized
Expense
Ratio | |
| | | Ending
Account Value
(10/31/15)1 | | | Expenses
Paid During
Period2 | | | Ending
Account Value
(10/31/15) | | | Expenses
Paid During
Period2 | | |
| A | | $ | 1,000.00 | | | $ | 866.90 | | | $ | 9.08 | | | $ | 1,015.48 | | | $ | 9.80 | | | | 1.93 | % |
| B | | | 1,000.00 | | | | 863.90 | | | | 12.59 | | | | 1,011.70 | | | | 13.59 | | | | 2.68 | |
| C | | | 1,000.00 | | | | 863.70 | | | | 12.59 | | | | 1,011.70 | | | | 13.59 | | | | 2.68 | |
| Y | | | 1,000.00 | | | | 868.20 | | | | 7.91 | | | | 1,016.74 | | | | 8.54 | | | | 1.68 | |
| R5 | | | 1,000.00 | | | | 869.10 | | | | 6.93 | | | | 1,017.80 | | | | 7.48 | | | | 1.47 | |
| 1 | The actual ending account value is based on the actual total return of the Fund for the period May 1, 2015 through October 31, 2015, after actual expenses and will differ from the hypothetical ending account value which is based on the Fund’s expense ratio and a hypothetical annual return of 5% before expenses. |
| 2 | Expenses are equal to the Fund’s annualized expense ratio as indicated above multiplied by the average account value over the period, multiplied by184/365 to reflect the most recent fiscal half year. |
22 Invesco Greater China Fund
Approval of Investment Advisory and Sub-Advisory Contracts
The Board of Trustees (the Board) of AIM Investment Funds (Invesco Investment Funds) is required under the Investment Company Act of 1940, as amended, to approve annually the renewal of Invesco Greater China Fund’s (the Fund) investment advisory agreements. During contract renewal meetings held on June 9-10, 2015, the Board as a whole, and the disinterested or “independent” Trustees, who comprise over 75% of the Board, voting separately, approved the continuance for the Fund of the Master Investment Advisory Agreement with Invesco Advisers, Inc. (Invesco Advisers and the investment advisory agreement) and the Master Intergroup Sub-Advisory Contract for Mutual Funds with Invesco Asset Management Deutschland GmbH, Invesco Asset Management Limited, Invesco Asset Management (Japan) Limited, Invesco Hong Kong Limited, Invesco Senior Secured Management, Inc. and Invesco Canada Ltd. (collectively, the Affiliated Sub-Advisers and the sub-advisory contracts) for another year, effective July 1, 2015.
In evaluating the fairness and reasonableness of compensation under the Fund’s investment advisory agreement and sub-advisory contracts, the Board considered, among other things, the factors discussed below. The Board determined that continuation of the Fund’s investment advisory agreement and the sub-advisory contracts is in the best interest of the Fund and its shareholders and that the compensation payable to Invesco Advisers and the Affiliated Sub-Advisers under the agreements is fair and reasonable.
The Board’s Fund Evaluation Process
The Board’s Investments Committee has established three Sub-Committees, each of which is primarily responsible for overseeing the performance and investment management services provided by Invesco Advisers and the Affiliated Sub-Advisers to a number of the funds advised by Invesco Advisers (the Invesco Funds). The Sub-Committees meet throughout the year to review the performance of their assigned Invesco Funds, including reviewing materials prepared under the direction of the independent Senior Officer, an officer of the Invesco Funds who reports directly to the independent Trustees. Over the course of each year, the Sub-Committees meet with portfolio managers for their assigned Invesco Funds and other members of management to review the performance, investment objective(s), policies, strategies, limitations and investment risks of these funds. The Board had the benefit of reports from the Sub-Committees and Investments Committee throughout the year in considering approval of the continuance of each Invesco Fund’s investment advisory agreement and sub-advisory contracts for another year.
During the contract renewal process, the Board receives comparative performance and fee data regarding the Invesco Funds prepared by Invesco Advisers and Lipper Inc. (Lipper), an independent provider of investment company data. The Board also receives a report and this independent written evaluation from the Senior Officer. The Senior Officer’s evaluation is prepared as part of his responsibility to manage the process by which the Invesco Funds’ proposed management fees are negotiated during the annual contract renewal process to ensure they are negotiated in a manner that is at arms’ length and reasonable. In addition to meetings with Invesco Advisers and fund counsel, the independent Trustees also discuss the continuance of the investment advisory agreement and sub-advisory contracts in separate sessions with the Senior Officer and with independent legal counsel.
The Trustees recognized that the advisory fee rates for the Invesco Funds are, in many cases, the result of years of review and negotiation. The Trustees’ deliberations and conclusions in a particular year may be based in part on their deliberations and conclusions regarding these arrangements throughout the year and in prior years. The Trustees’ review and conclusions are based on the comprehensive consideration of all information presented to them and are not the result of any single determinative factor. Moreover, one Trustee may have weighed a particular piece of information or factor differently than another Trustee.
The discussion below is a summary of the Senior Officer’s independent written evaluation with respect to the Fund’s investment advisory agreement as well as a discussion of the material factors and related conclusions that formed the basis for the Board’s approval of the Fund’s investment advisory agreement and sub-advisory contracts. Unless otherwise stated, this information is current as of June 10, 2015, and does not reflect consideration of factors that became known to the Board after that date.
Factors and Conclusions and Summary of Independent Written Fee Evaluation
| A. | Nature, Extent and Quality of Services Provided by Invesco Advisers and the Affiliated Sub-Advisers |
The Board reviewed the advisory services provided to the Fund by Invesco Advisers under the Fund’s investment advisory agreement, the performance of Invesco Advisers in providing these services, and the credentials and experience of the officers and employees of Invesco Advisers who provide these services, including the Fund’s portfolio manager or managers. The Board’s review of the qualifications of Invesco Advisers to provide advisory services included the Board’s consideration of Invesco Advisers’ investment
process oversight, independent credit analysis and investment risk management. The Board also considered non-advisory services that Invesco Advisers and its affiliates provide to the Invesco Funds such as various back office support functions, equity and fixed income trading operations, internal audit, distribution, valuation and legal and compliance.
In determining whether to continue the Fund’s investment advisory agreement, the Board considered the benefits of reapproving an existing relationship and the greater uncertainty that may be associated with entering into a new relationship. The Board concluded that the nature, extent and quality of the services provided to the Fund by Invesco Advisers are appropriate and satisfactory and consistent with the terms of the Fund’s investment advisory agreement.
The Board reviewed the services that may be provided by the Affiliated Sub-Advisers under the sub-advisory contracts and the credentials and experience of the officers and employees of the Affiliated Sub-Advisers who provide these services. The Board noted that the Affiliated Sub-Advisers have offices and personnel that are located in financial centers around the world. As a result, the Affiliated Sub-Advisers can provide research and investment analysis on the markets and economies of various countries in which the Fund may invest, make recommendations regarding securities and assist with security trades. The Board concluded that the sub-advisory contracts benefit the Fund and its shareholders by permitting Invesco Advisers to use the resources and talents of the Affiliated Sub-Advisers in managing the Fund. The Board concluded that the nature, extent and quality of the services provided by the Affiliated Sub-Advisers are appropriate and satisfactory and consistent with the terms of the Fund’s sub-advisory contracts.
The Board considered Fund performance as a relevant factor in considering whether to approve the investment advisory agreement as well as the sub-advisory contracts for the Fund, as Invesco Hong Kong Limited currently manages assets of the Fund.
The Board compared the Fund’s performance during the past one, three and five calendar years to the performance of funds in the Lipper performance universe and against the Lipper China Region Funds Index. The Board noted that performance of Class A shares of the Fund was in the fifth quintile of its performance universe for the one and five year periods and the fourth quintile for the three year period (the first quintile being the best performing funds and the fifth quintile being the worst performing funds). The Board noted that performance of Class A shares of the Fund was below the performance of the Index for the one, three and five year periods. Invesco Advisers advised the Board
23 Invesco Greater China Fund
that further changes to the management team is being considered. The Trustees also reviewed more recent Fund performance and this review did not change their conclusions.
| C. | Advisory and Sub-Advisory Fees |
The Board compared the Fund’s contractual management fee rate to the contractual management fee rates of funds in the Fund’s Lipper expense group at a common asset level. The Board noted that the contractual management fee rate for Class A shares of the Fund was below the median contractual management fee rate of funds in its expense group. The Board noted that the term “contractual management fee” may include both advisory and certain administrative services fees, but that Lipper does not provide information on a fund by fund basis as to what is included. The Board noted that Invesco Advisers does not charge the Invesco Funds for the administrative services included in the term as defined by Lipper. The Board also reviewed the methodology used by Lipper in providing expense group information, which includes using each fund’s contractual management fee schedule (including any applicable breakpoints) as reported in the most recent prospectus or statement of additional information for each fund in the expense group.
The Board also compared the Fund’s effective advisory fee rate (the advisory fee rate after advisory fee waivers and before other expense limitations/waivers) to the effective advisory fee rates of other mutual funds advised by Invesco Advisers and its affiliates with investment strategies comparable to those of the Fund. The Board also noted how the Fund’s rate compared to the effective sub-adviser fee rate of two funds sub-advised by Invesco Advisers.
The Board noted that Invesco Advisers and the Affiliated Sub-Advisers do not manage other client accounts with investment strategies comparable to those of the Fund.
The Board also considered the services provided by the Affiliated Sub-Advisers pursuant to the sub-advisory contracts, as well as the fees payable by Invesco Advisers to Affiliated Sub-Advisers pursuant to the sub-advisory contracts. The Board noted that Invesco Advisers retains overall responsibility for, and provides services to, sub-advised Invesco Funds, including oversight of the Affiliated Sub-Advisers as well as the additional services described herein other than day-to-day portfolio management. The Board also noted that the sub-advisory fees are not paid directly by the Fund, but rather, are payable by Invesco Advisers to the Affiliated Sub-Advisers.
| D. | Economies of Scale and Breakpoints |
The Board considered the extent to which there are economies of scale in the provision of advisory services to the Fund. The Board also considered whether the Fund benefits from economies of scale through contractual breakpoints in the Fund’s advisory fee schedule. The Board also noted that the Fund shares directly in economies of scale through lower fees charged by third party service providers
based on the combined size of the Invesco Funds and other clients advised by Invesco Advisers.
| E. | Profitability and Financial Resources |
The Board reviewed information from Invesco Advisers concerning the costs of the advisory and other services that Invesco Advisers and its affiliates provide to the Fund and the Invesco Funds and the profitability of Invesco Advisers and its affiliates in providing these services. The Board received information from Invesco Advisers about the methodology used to prepare the profitability information. The Board noted that Invesco Advisers continues to operate at a net profit from services Invesco Advisers and its affiliates provide to the Invesco Funds and the Fund. The Board did not deem the level of profits realized by Invesco Advisers and its affiliates from providing services to the Fund to be excessive given the nature, quality and extent of the services provided. The Board received and accepted information from Invesco Advisers demonstrating that Invesco Advisers and each Affiliated Sub-Adviser are financially sound and have the resources necessary to perform their obligations under the investment advisory agreement and sub-advisory contracts.
| F. | Collateral Benefits to Invesco Advisers and its Affiliates |
The Board considered various other benefits received by Invesco Advisers and its affiliates from the relationship with the Fund, including the fees received for providing transfer agency and distribution services to the Fund. The Board considered comparative information regarding fees charged for these services, including information provided by Lipper and other independent sources. The Board considered the performance of Invesco Advisers and its affiliates in providing these services and the organizational structure employed to provide these services. The Board also considered that these services are provided to the Fund pursuant to written contracts that are reviewed and approved on an annual basis by the Board; and that the services are required for the operation of the Fund.
The Board considered the benefits realized by Invesco Advisers and the Affiliated Sub-Advisers as a result of portfolio brokerage transactions executed through “soft dollar” arrangements. The Board noted that soft dollar arrangements shift the payment obligation for research services from Invesco Advisers and the Affiliated Sub-Advisers to the Invesco Funds and that the research received may be used with other clients of Invesco Advisers and may reduce Invesco Advisers’ and the Affiliated Sub-Advisers’ expenses. The Board also considered that it receives periodic reports from the Chief Compliance Officer of the Invesco Funds demonstrating that these arrangements are consistent with regulatory requirements. The Board did not deem the soft dollar arrangements to be inappropriate.
The Board considered that the Fund’s uninvested cash and cash collateral from any securities lending arrangements may be
invested in money market funds advised by Invesco Advisers pursuant to procedures approved by the Board. The Board noted that Invesco Advisers receives advisory fees from these affiliated money market funds attributable to such investments, although Invesco Advisers has contractually agreed to waive through varying periods the advisory fees payable by the Invesco Funds with respect to investments in the affiliated money market funds. The waiver is in an amount equal to 100% of the net advisory fee Invesco Advisers receives from the affiliated money market funds with respect to the Fund’s investment in the affiliated money market funds of uninvested cash, but not cash collateral. The Board concluded that the amount of advisory fees received by Invesco Advisors from the Fund’s investment of cash collateral from any securities lending arrangements in the affiliated money market funds is fair and reasonable.
The Board also considered the Fund may use an affiliated broker to execute certain trades for the Fund to, among other things, control information leakage, and were advised such trades would be executed in compliance with rules under the Investment Company Act of 1940, as amended, and consistent with best execution obligations.
24 Invesco Greater China Fund
Tax Information
Form 1099-DIV, Form 1042-S and other year–end tax information provide shareholders with actual calendar year amounts that should be included in their tax returns. Shareholders should consult their tax advisors.
The following distribution information is being provided as required by the Internal Revenue Code or to meet a specific state’s requirement.
The Fund designates the following amounts or, if subsequently determined to be different, the maximum amount allowable for its fiscal year ended October 31, 2015:
| | | | |
Federal and State Income Tax | |
Qualified Dividend Income* | | | 100 | % |
Corporate Dividends Received Deduction* | | | 0.41 | % |
U.S. Treasury Obligations* | | | 0 | % |
Foreign Taxes | | $ | 0.0609 | per share |
Foreign Source Income | | $ | 0.7114 | per share |
| | * | The above percentages are based on ordinary income dividends paid to shareholders during the Fund’s fiscal year. |
25 Invesco Greater China Fund
Trustees and Officers
The address of each trustee and officer is AIM Investment Funds (Invesco Investment Funds) (the “Trust”), 11 Greenway Plaza, Suite 1000, Houston, Texas 77046-1173. The trustees serve for the life of the Trust, subject to their earlier death, incapacitation, resignation, retirement or removal as more specifically provided in the Trust’s organizational documents. Each officer serves for a one year term or until their successors are elected and qualified. Column two below includes length of time served with predecessor entities, if any.
| | | | | | | | |
Name, Year of Birth and
Position(s) Held with the Trust | | Trustee and/
or Officer Since | | Principal Occupation(s)
During Past 5 Years | | Number of Funds in Fund Complex Overseen by Trustee | | Other Directorship(s) Held by Trustee During Past 5 Years |
| Interested Persons | | | | | | | | |
| Martin L. Flanagan1 — 1960 Trustee | | 2007 | | Executive Director, Chief Executive Officer and President, Invesco Ltd. (ultimate parent of Invesco and a global investment management firm); Advisor to the Board, Invesco Advisers, Inc. (formerly known as Invesco Institutional (N.A.), Inc.); Trustee, The Invesco Funds; Vice Chair, Investment Company Institute; and Member of Executive Board, SMU Cox School of Business Formerly: Chairman and Chief Executive Officer, Invesco Advisers, Inc. (registered investment adviser); Director, Chairman, Chief Executive Officer and President, IVZ Inc. (holding company), INVESCO Group Services, Inc. (service provider) and Invesco North American Holdings, Inc. (holding company); Director, Chief Executive Officer and President, Invesco Holding Company Limited (parent of Invesco and a global investment management firm); Director, Invesco Ltd.; Chairman, Investment Company Institute and President, Co-Chief Executive Officer, Co-President, Chief Operating Officer and Chief Financial Officer, Franklin Resources, Inc. (global investment management organization). | | 145 | | None |
Philip A. Taylor2 — 1954
Trustee, President and Principal Executive Officer | | 2006 | | Head of North American Retail and Senior Managing Director, Invesco Ltd.; Director, Co-Chairman, Co-President and Co-Chief Executive Officer, Invesco Advisers, Inc. (formerly known as Invesco Institutional (N.A.), Inc.) (registered investment adviser); Director, Chairman, Chief Executive Officer and President, Invesco Management Group, Inc. (formerly known as Invesco Aim Management Group, Inc.) (financial services holding company); Director and President, INVESCO Funds Group, Inc. (registered investment adviser and registered transfer agent); Director and Chairman, Invesco Investment Services, Inc. (formerly known as Invesco Aim Investment Services, Inc.) (registered transfer agent) and IVZ Distributors, Inc. (formerly known as INVESCO Distributors, Inc.) (registered broker dealer); Chief Executive Officer, Invesco Corporate Class Inc. (corporate mutual fund company) Director, Chairman and Chief Executive Officer, Invesco Canada Ltd. (formerly known as Invesco Trimark Ltd./Invesco Trimark Ltèe) (registered investment adviser and registered transfer agent); Trustee, President and Principal Executive Officer, The Invesco Funds (other than AIM Treasurer’s Series Trust (Invesco Treasurer’s Series Trust), Short-Term Investments Trust and Invesco Management Trust); Trustee and Executive Vice President, The Invesco Funds (AIM Treasurer’s Series Trust (Invesco Treasurer’s Series Trust), Short-Term Investments Trust and Invesco Management Trust only); Director, Invesco Investment Advisers LLC (formerly known as Van Kampen Asset Management); Director, Chief Executive Officer and President, Van Kampen Exchange Corp. Formerly: Director, President and Chairman, Invesco Inc. (holding company), Invesco Canada Holdings Inc. (holding company), Trimark Investments Ltd./Placements Trimark Ltèe and Invesco Financial Services Ltd/Services Financiers Invesco Ltèe; Chief Executive Officer, Invesco Canada Fund Inc (corporate mutual fund company); Director and Chairman, Van Kampen Investor Services Inc.; Director, Chief Executive Officer and President, 1371 Preferred Inc. (holding company) and Van Kampen Investments Inc.; Director and President, AIM GP Canada Inc. (general partner for limited partnerships) and Van Kampen Advisors, Inc.; Director and Chief Executive Officer, Invesco Trimark Dealer Inc. (registered broker dealer); Director, Invesco Distributors, Inc. (formerly known as Invesco Aim Distributors, Inc.) (registered broker dealer); Manager, Invesco PowerShares Capital Management LLC; Director, Chief Executive Officer and President, Invesco Advisers, Inc.; Director, Chairman, Chief Executive Officer and President, Invesco Aim Capital Management, Inc.; President, Invesco Trimark Dealer Inc. and Invesco Trimark Ltd./Invesco Trimark Ltèe; Director and President, AIM Trimark Corporate Class Inc. and AIM Trimark Canada Fund Inc.; Senior Managing Director, Invesco Holding Company Limited; Director and Chairman, Fund Management Company (former registered broker dealer); President and Principal Executive Officer, The Invesco Funds (AIM Treasurer’s Series Trust (Invesco Treasurer’s Series Trust), and Short-Term Investments Trust only); President, AIM Trimark Global Fund Inc. and AIM Trimark Canada Fund Inc.. | | 145 | | None |
| 1 | Mr. Flanagan is considered an interested person (within the meaning of Section 2(a)(19) of the 1940 Act) of the Trust because he is an officer of the Adviser to the Trust, and an officer and a director of Invesco Ltd., ultimate parent of the Adviser. |
| 2 | Mr. Taylor is considered an interested person (within the meaning of Section 2(a)(19) of the 1940 Act) of the Trust because he is an officer and a director of the Adviser. |
T-1 Invesco Greater China Fund
Trustees and Officers—(continued)
| | | | | | | | |
Name, Year of Birth and Position(s) Held with the Trust | | Trustee and/ or Officer Since | | Principal Occupation(s) During Past 5 Years | | Number of Funds in Fund Complex Overseen by Trustee | | Other Directorship(s) Held by Trustee During Past 5 Years |
| Independent Trustees | | | | | | | | |
Bruce L. Crockett — 1944 Trustee and Chair | | 2003 | | Chairman, Crockett Technologies Associates (technology consulting company) Formerly: Director, Captaris (unified messaging provider); Director, President and Chief Executive Officer, COMSAT Corporation; Chairman, Board of Governors of INTELSAT (international communications company); ACE Limited (insurance company); Independent Directors Council and Investment Company Institute | | 145 | | ALPS (Attorneys Liability Protection Society) (insurance company) and Globe Specialty Metals, Inc. (metallurgical company) |
David C. Arch — 1945 Trustee | | 2010 | | Chairman of Blistex Inc., a consumer health care products manufacturer | | 145 | | Board member of the Illinois Manufacturers’ Association; Member of the Board of Visitors, Institute for the Humanities, University of Michigan; Member of the Audit Committee of the Edward-Elmhurst Hospital |
James T. Bunch — 1942 Trustee | | 2000 | | Managing Member, Grumman Hill Group LLC (family office/private equity investments) Formerly: Founder, Green Manning & Bunch Ltd. (investment banking firm) (1988-2010); Executive Committee, United States Golf Association; and Chairman, Board of Governors, Western Golf Association | | 145 | | Chairman of the Board of Trustees, Evans Scholars Foundation; and Chairman of the Board, Denver Film Society |
Rodney F. Dammeyer — 1940 Trustee | | 2010 | | Chairman of CAC, LLC, (private company offering capital investment and management advisory services) Formerly: Prior to 2001, Managing Partner at Equity Group Corporate Investments; Prior to 1995, Chief Executive Officer of Itel Corporation (formerly Anixter International); Prior to 1985, experience includes Senior Vice President and Chief Financial Officer of Household International, Inc., Executive Vice President and Chief Financial Officer of Northwest Industries, Inc. and Partner of Arthur Andersen & Co.; From 1987 to 2010, Director/Trustee of investment companies in the Van Kampen Funds complex | | 145 | | Director of Quidel Corporation and Stericycle, Inc. |
Albert R. Dowden — 1941 Trustee | | 2003 | | Director of a number of public and private business corporations, including the Boss Group, Ltd. (private investment and management); Nature’s Sunshine Products, Inc. and Reich & Tang Funds (5 portfolios) (registered investment company) Formerly: Director, Homeowners of America Holding Corporation/Homeowners of America Insurance Company (property casualty company); Director, Continental Energy Services, LLC (oil and gas pipeline service); Director, CompuDyne Corporation (provider of product and services to the public security market) and Director, Annuity and Life Re (Holdings), Ltd. (reinsurance company); Director, President and Chief Executive Officer, Volvo Group North America, Inc.; Senior Vice President, AB Volvo; Director of various public and private corporations; Chairman, DHJ Media, Inc.; Director, Magellan Insurance Company; and Director, The Hertz Corporation, Genmar Corporation (boat manufacturer), National Media Corporation; Advisory Board of Rotary Power International (designer, manufacturer, and seller of rotary power engines); and Chairman, Cortland Trust, Inc. (registered investment company) | | 145 | | Director of: Nature’s Sunshine Products, Inc., Reich & Tang Funds, Homeowners of America Holding Corporation/ Homeowners of America Insurance Company, the Boss Group |
Jack M. Fields — 1952 Trustee | | 2003 | | Chief Executive Officer, Twenty First Century Group, Inc. (government affairs company); Owner and Chief Executive Officer, Dos Angeles Ranch, L.P. (cattle, hunting, corporate entertainment); and Discovery Global Education Fund (non-profit) Formerly: Chief Executive Officer, Texana Timber LP (sustainable forestry company); Director of Cross Timbers Quail Research Ranch (non-profit); and member of the U.S. House of Representatives | | 145 | | Insperity, Inc. (formerly known as Administaff) |
Prema Mathai-Davis — 1950 Trustee | | 2003 | | Retired. Formerly: Chief Executive Officer, YWCA of the U.S.A. | | 145 | | None |
Larry Soll — 1942 Trustee | | 1997 | | Retired. Formerly: Chairman, Chief Executive Officer and President, Synergen Corp. (a biotechnology company) | | 145 | | None |
Hugo F. Sonnenschein — 1940 Trustee | | 2010 | | President Emeritus and Honorary Trustee of the University of Chicago and the Adam Smith Distinguished Service Professor in the Department of Economics at the University of Chicago. Prior to 2000, President of the University of Chicago | | 145 | | Trustee of the University of Rochester and a member of its investment committee; Member of the National Academy of Sciences and the American Philosophical Society; Fellow of the American Academy of Arts and Sciences |
Raymond Stickel, Jr. — 1944 Trustee | | 2005 | | Retired. Formerly: Director, Mainstay VP Series Funds, Inc. (25 portfolios) and Partner, Deloitte & Touche | | 145 | | None |
T-2 Invesco Greater China Fund
Trustees and Officers—(continued)
| | | | | | | | |
Name, Year of Birth and Position(s) Held with the Trust | | Trustee and/ or Officer Since | | Principal Occupation(s) During Past 5 Years | | Number of Funds in Fund Complex Overseen by Trustee | | Other Directorship(s) Held by Trustee During Past 5 Years |
| Independent Trustees—(continued) |
Suzanne H. Woolsey — 1941 Trustee | | 2014 | | Chief Executive Officer of Woolsey Partners LLC | | 145 | | Emeritus Chair of the Board of Trustees of the Institute for Defense Analyses; Trustee of Colorado College; Trustee of California Institute of Technology; Prior to 2014, Director of Fluor Corp.; Prior to 2010, Trustee of the German Marshall Fund of the United States; Prior to 2010 Trustee of the Rocky Mountain Institute |
| Other Officers | | | | | | | | |
Russell C. Burk — 1958
Senior Vice President and Senior Officer | | 2005 | | Senior Vice President and Senior Officer, The Invesco Funds | | N/A | | N/A |
John M. Zerr — 1962
Senior Vice President, Chief Legal Officer and Secretary | | 2006 | | Director, Senior Vice President, Secretary and General Counsel, Invesco Management Group, Inc. (formerly known as Invesco Aim Management Group, Inc.) and Van Kampen Exchange Corp.; Senior Vice President, Invesco Advisers, Inc. (formerly known as Invesco Institutional (N.A.), Inc.) (registered investment adviser); Senior Vice President and Secretary, Invesco Distributors, Inc. (formerly known as Invesco Aim Distributors, Inc.); Director, Vice President and Secretary, Invesco Investment Services, Inc. (formerly known as Invesco Aim Investment Services, Inc.) and IVZ Distributors, Inc. (formerly known as INVESCO Distributors, Inc.); Director and Vice President, INVESCO Funds Group, Inc.; Senior Vice President, Chief Legal Officer and Secretary, The Invesco Funds; Managing Director, Invesco PowerShares Capital Management LLC; Director, Secretary and General Counsel, Invesco Investment Advisers LLC (formerly known as Van Kampen Asset Management); Secretary and General Counsel, Invesco Capital Markets, Inc. (formerly known as Van Kampen Funds Inc.) and Chief Legal Officer, PowerShares Exchange-Traded Fund Trust, PowerShares Exchange-Traded Fund Trust II, PowerShares India Exchange-Traded Fund Trust, PowerShares Actively Managed Exchange-Traded Fund Trust, and PowerShares Actively Managed Exchange-Traded Commodity Fund Trust Formerly: Director and Vice President, Van Kampen Advisors Inc.; Director, Vice President, Secretary and General Counsel, Van Kampen Investor Services Inc.; Director, Invesco Distributors, Inc. (formerly known as Invesco Aim Distributors, Inc.); Director, Senior Vice President, General Counsel and Secretary, Invesco Aim Advisers, Inc. and Van Kampen Investments Inc.; Director, Vice President and Secretary, Fund Management Company; Director, Senior Vice President, Secretary, General Counsel and Vice President, Invesco Aim Capital Management, Inc.; Chief Operating Officer and General Counsel, Liberty Ridge Capital, Inc. (an investment adviser); Vice President and Secretary, PBHG Funds (an investment company) and PBHG Insurance Series Fund (an investment company); Chief Operating Officer, General Counsel and Secretary, Old Mutual Investment Partners (a broker-dealer); General Counsel and Secretary, Old Mutual Fund Services (an administrator) and Old Mutual Shareholder Services (a shareholder servicing center); Executive Vice President, General Counsel and Secretary, Old Mutual Capital, Inc. (an investment adviser); and Vice President and Secretary, Old Mutual Advisors Funds (an investment company) | | N/A | | N/A |
Sheri Morris — 1964
Vice President, Treasurer and Principal Financial Officer | | 2003 | | Vice President, Treasurer and Principal Financial Officer, The Invesco Funds; Vice President, Invesco Advisers, Inc. (formerly known as Invesco Institutional (N.A.), Inc.) (registered investment adviser); and Vice President, PowerShares Exchange-Traded Fund Trust, PowerShares Exchange-Traded Fund Trust II, PowerShares India Exchange-Traded Fund Trust, PowerShares Actively Managed Exchange-Traded Fund Trust, and PowerShares Actively Managed Exchange-Traded Commodity Fund Trust Formerly: Vice President, Invesco Aim Advisers, Inc., Invesco Aim Capital Management, Inc. and Invesco Aim Private Asset Management, Inc.; Assistant Vice President and Assistant Treasurer, The Invesco Funds and Assistant Vice President, Invesco Advisers, Inc., Invesco Aim Capital Management, Inc. and Invesco Aim Private Asset Management, Inc.; and Treasurer, PowerShares Exchange-Traded Fund Trust, PowerShares Exchange-Traded Fund Trust II, PowerShares India Exchange-Traded Fund Trust and PowerShares Actively Managed Exchange-Traded Fund Trust | | N/A | | N/A |
T-3 Invesco Greater China Fund
Trustees and Officers—(continued)
| | | | | | | | |
Name, Year of Birth and
Position(s) Held with the Trust | | Trustee and/
or Officer Since | | Principal Occupation(s)
During Past 5 Years | | Number of Funds in Fund Complex Overseen by Trustee | | Other Directorship(s) Held by Trustee During Past 5 Years |
| Other Officers—(continued) | | | | | | | | |
Karen Dunn Kelley — 1960
Vice President | | 2003 | | Senior Managing Director, Investments, Invesco Ltd.; Director, Co-President, Co-Chief Executive Officer, and Co-Chairman, Invesco Advisers, Inc. (formerly known as Invesco Institutional (N.A.), Inc.) (registered investment adviser); Chairman, Invesco Senior Secured Management, Inc.; Senior Vice President, Invesco Management Group, Inc. (formerly known as Invesco Aim Management Group, Inc.); Executive Vice President, Invesco Distributors, Inc. (formerly known as Invesco Aim Distributors, Inc.); Director, Invesco Mortgage Capital Inc. and Invesco Management Company Limited; Vice President, The Invesco Funds (other than AIM Treasurer’s Series Trust (Invesco Treasurer’s Series Trust), Short-Term Investments Trust and Invesco Management Trust); and President and Principal Executive Officer, The Invesco Funds (AIM Treasurer’s Series Trust (Invesco Treasurer’s Series Trust), Short-Term Investments Trust and Invesco Management Trust only) Formerly: Director and President, INVESCO Asset Management (Bermuda) Ltd., Director, INVESCO Global Asset Management Limited and INVESCO Management S.A.; Senior Vice President, Van Kampen Investments Inc. and Invesco Advisers, Inc. (formerly known as Invesco Institutional (N.A.), Inc.) (registered investment adviser); Vice President, Invesco Advisers, Inc. (formerly known as Invesco Institutional (N.A.), Inc.); Director of Cash Management and Senior Vice President, Invesco Advisers, Inc. and Invesco Aim Capital Management, Inc.; Director and President, Fund Management Company; Chief Cash Management Officer, Director of Cash Management, Senior Vice President, and Managing Director, Invesco Aim Capital Management, Inc.; Director of Cash Management, Senior Vice President, and Vice President, Invesco Advisers, Inc. and The Invesco Funds (AIM Treasurer’s Series Trust (Invesco Treasurer’s Series Trust), and Short-Term Investments Trust only) | | N/A | | N/A |
Crissie M. Wisdom — 1969 Anti-Money Laundering Compliance Officer | | 2013 | | Anti-Money Laundering Compliance Officer, Invesco Advisers, Inc. (formerly known as Invesco Institutional (N.A.), Inc.) (registered investment adviser), Invesco Capital Markets, Inc. (formerly known as Van Kampen Funds Inc.), Invesco Distributors, Inc., Invesco Investment Services, Inc., Invesco Management Group, Inc., Van Kampen Exchange Corp., The Invesco Funds, and PowerShares Exchange-Traded Fund Trust, PowerShares Exchange-Traded Fund Trust II, PowerShares India Exchange-Traded Fund Trust, PowerShares Actively Managed Exchange-Traded Fund Trust and PowerShares Actively Managed Exchange-Traded Commodity Fund Trust; Anti-Money Laundering Compliance Officer and Bank Secrecy Act Officer, INVESCO National Trust Company and Invesco Trust Company; and Fraud Prevention Manager and Controls and Risk Analysis Manager for Invesco Investment Services, Inc.. | | N/A | | N/A |
Lisa O. Brinkley — 1959 Chief Compliance Officer | | 2015 | | Senior Vice President and Chief Compliance Officer, Invesco Advisers, Inc. (registered investment adviser) (formerly known as Invesco Institutional (N.A., Inc.); and Chief Compliance Officer, The Invesco Funds Formerly: Global Assurance Officer, Invesco Ltd. and Vice President, The Invesco Funds; Chief Compliance Officer, Invesco Distributors, Inc. (formerly known as Invesco Aim Distributors, Inc.), Invesco Investment Services, Inc. (formerly known as Invesco Aim Investment Services, Inc.) and Van Kampen Investor Services Inc.; Senior Vice President, Invesco Management Group, Inc.; Senior Vice President and Chief Compliance Officer, Invesco Advisers, Inc. and The Invesco Funds; Vice President and Chief Compliance Officer, Invesco Aim Capital Management, Inc. and Invesco Distributors, Inc.; Vice President, Invesco Investment Services, Inc. and Fund Management Company. | | N/A | | N/A |
The Statement of Additional Information of the Trust includes additional information about the Fund’s Trustees and is available upon request, without charge, by calling 1.800.959.4246. Please refer to the Fund’s prospectus for information on the Fund’s sub-advisers.
| | | | | | |
Office of the Fund 11 Greenway Plaza, Suite 1000 Houston, TX 77046-1173 | | Investment Adviser Invesco Advisers, Inc. 1555 Peachtree Street, N.E. Atlanta, GA 30309 | | Distributor
Invesco Distributors, Inc. 11 Greenway Plaza, Suite 1000 Houston, TX 77046-1173 | | Auditors PricewaterhouseCoopers LLP 1000 Louisiana Street, Suite 5800 Houston, TX 77002-5678 |
| | | |
| | | | | | |
Counsel to the Fund Stradley Ronon Stevens & Young, LLP 2005 Market Street, Suite 2600 Philadelphia, PA 19103-7018 | | Counsel to the Independent Trustees Goodwin Procter LLP 901 New York Avenue, N.W. Washington, D.C. 20001 | | Transfer Agent Invesco Investment Services, Inc. 11 Greenway Plaza, Suite 1000 Houston, TX 77046-1173 | | Custodian State Street Bank and Trust Company 225 Franklin Street Boston, MA 02110-2801 |
T-4 Invesco Greater China Fund

Invesco mailing information
Send general correspondence to Invesco Investment Services, Inc., P.O. Box 219078, Kansas City, MO 64121-9078.
Important notice regarding delivery of security holder documents
To reduce Fund expenses, only one copy of most shareholder documents may be mailed to shareholders with multiple accounts at the same address (Householding). Mailing of your shareholder documents may be householded indefinitely unless you instruct us otherwise. If you do not want the mailing of these documents to be combined with those for other members of your household, please contact Invesco Investment Services, Inc. at 800 959 4246 or contact your financial institution. We will begin sending you individual copies for each account within 30 days after receiving your request.
Fund holdings and proxy voting information
The Fund provides a complete list of its holdings four times in each fiscal year, at the quarter ends. For the second and fourth quarters, the lists appear in the Fund’s semiannual and annual reports to shareholders. For the first and third quarters, the Fund files the lists with the Securities and Exchange Commission (SEC) on Form N-Q. The most recent list of portfolio holdings is available at invesco.com/completeqtrholdings. Shareholders can also look up the Fund’s Forms N-Q on the SEC website at sec.gov. Copies of the Fund’s Forms N-Q may be reviewed and copied at the SEC Public Reference Room in Washington, D.C. You can obtain information on the operation of the Public Reference Room, including information about duplicating fee charges, by calling 202 551 8090 or 800 732 0330, or by electronic request at the following email address: publicinfo@sec.gov. The SEC file numbers for the Fund are shown below.
A description of the policies and procedures that the Fund uses to determine how to vote proxies relating to portfolio securities is available without charge, upon request, from our Client Services department at 800 959 4246 or at invesco.com/proxyguidelines. The information is also available on the SEC website, sec.gov.
| | |
Information regarding how the Fund voted proxies related to its portfolio securities during the most recent 12-month period ended June 30 is available at invesco.com/proxysearch. The information is also available on the SEC website, sec.gov. Invesco Advisers, Inc. is an investment adviser; it provides investment advisory services to individual and institutional clients and does not sell securities. Invesco Distributors, Inc. is the US distributor for Invesco Ltd.’s retail mutual funds, exchange-traded funds and institutional money market funds. Both are wholly owned, indirect subsidiaries of Invesco Ltd. | |  |
| | | | |
| SEC file numbers: 811-05426 and 033-19338 | | CHI-AR-1 | | Invesco Distributors, Inc. |
| | | | |
| | |
 | | Annual Report to Shareholders | | October 31, 2015 |
| | |
| | Invesco Developing Markets Fund |
| | Nasdaq: |
| | A: GTDDX n B: GTDBX n C: GTDCX n Y: GTDYX n R5: GTDIX n R6: GTDFX |

Letters to Shareholders
| | |

Philip Taylor | | Dear Shareholders: This annual report includes information about your Fund, including performance data and a complete list of its investments as of the close of the reporting period. Inside is a discussion of how your Fund was managed and the factors that affected its performance during the reporting period. I hope you find this report of interest. The US economy expanded and unemployment declined throughout the reporting period. Continuing low energy prices benefited consumers, but a strong US dollar crimped corporate profits. The US Federal Reserve signaled that it was increasingly likely to raise interest rates, based on generally positive economic data, but uncertainty remained about when it might act. Overseas, the story was much different. Low energy prices hurt the economies of some oil-producing nations, such as Brazil and Russia. During the reporting period, the European |
| Central Bank as well as central banks in China and Japan – among other countries – either instituted or maintained extraordinarily accommodative monetary policies in response to economic weakness. |
Investor uncertainty, such as we saw for much of the reporting period – and market volatility, such as we saw at the end of the reporting period – are unfortunate facts of life when it comes to investing. Some investors use these things as excuses to delay saving and investing for their long-term financial goals. That’s why Invesco encourages investors to work with a professional financial adviser who can stress the importance of starting to save and invest early and the importance of adhering to a disciplined investment plan – when times are good and when they’re uncertain. A financial adviser who knows your unique financial situation, investment goals and risk tolerance can be an invaluable partner as you seek to achieve your financial goals. He or she can offer a long-term perspective when markets are volatile and time-tested advice and guidance when your financial situation or investment goals change.
Timely information when and where you want it
Invesco’s efforts to help investors achieve their financial objectives include providing individual investors and financial professionals with timely information about the markets, the economy and investing – whenever and wherever they want it.
Our website, invesco.com/us, offers a wide range of market insights and investment perspectives. On the website, you’ll find detailed information about our funds, including prices, performance, holdings and portfolio manager commentaries. You can access information about your account by completing a simple, secure online registration. Click on the “Need to register” link in the “Account Access” box on our homepage to get started.
Invesco’s mobile apps for iPhone® and iPad® (both available free from the App StoreSM) allow you to obtain the same detailed information, monitor your account and create customizable watch lists. Also, they allow you to access investment insights from our investment leaders, market strategists, economists and retirement experts. You can sign up to be alerted when new commentary is added, and you can watch portfolio manager videos and have instant access to Invesco news and updates wherever you may be.
In addition to the resources accessible on our website and through our mobile app, you can obtain timely updates to help you stay informed about the markets, the economy and investing by connecting with Invesco on Twitter, LinkedIn or Facebook. You can access our blog at blog.invesco.us.com. Our goal is to provide you the information you want, when and where you want it.
Have questions?
For questions about your account, feel free to contact an Invesco client services representative at 800 959 4246. For Invesco-related questions or comments, please email me directly at phil@invesco.com.
All of us at Invesco look forward to serving your investment management needs for many years to come. Thank you for investing with us.
Sincerely,

Philip Taylor
Senior Managing Director, Invesco Ltd.
iPhone and iPad are trademarks of Apple Inc., registered in the US and other countries. App Store is a service mark of Apple Inc. Invesco Distributors, Inc. is not affiliated with Apple Inc.
2 Invesco Developing Markets Fund
| | |

Bruce Crockett | | Dear Fellow Shareholders: Among the many important lessons I’ve learned in more than 40 years in a variety of business endeavors is the value of a trusted advocate. As independent chair of the Invesco Funds Board, I can assure you that the members of the Board are strong advocates for the interests of investors in Invesco’s mutual funds. We work hard to represent your interests through oversight of the quality of the investment management services your funds receive and other matters important to your investment, including but not limited to: n Ensuring that Invesco offers a diverse lineup of mutual funds that your financial adviser can use to strive to meet your financial needs as your investment goals change over time. n Monitoring how the portfolio management teams of the Invesco funds are performing in light of changing economic and market conditions. |
| n | | Assessing each portfolio management team’s investment performance within the context of the investment strategy described in the fund’s prospectus. |
| n | | Monitoring for potential conflicts of interests that may impact the nature of the services that your funds receive. |
We believe one of the most important services we provide our fund shareholders is the annual review of the funds’ advisory and sub-advisory contracts with Invesco Advisers and its affiliates. This review is required by the Investment Company Act of 1940 and focuses on the nature and quality of the services Invesco provides as the adviser to the Invesco funds and the reasonableness of the fees that it charges for those services. Each year, we spend months carefully reviewing information received from Invesco and a variety of independent sources, such as performance and fee data prepared by Lipper Inc., an independent, third-party firm widely recognized as a leader in its field. We also meet with our independent legal counsel and other independent advisers to review and help us assess the information that we have received. Our goal is to assure that you receive quality investment management services for a reasonable fee.
I trust the measures outlined above provide assurance that you have a worthy advocate when it comes to choosing the Invesco Funds. As always, please contact me at bruce@brucecrockett.com with any questions or concerns you may have. On behalf of the Board, we look forward to continuing to represent your interests and serving your needs.
Sincerely,

Bruce L. Crockett
Independent Chair
Invesco Funds Board of Trustees
3 Invesco Developing Markets Fund
Management’s Discussion of Fund Performance
Performance summary
For the fiscal year ended October 31, 2015, Class A shares of Invesco Developing Markets Fund (the Fund), at net asset value (NAV), underperformed the MSCI Emerging Markets Index, the Fund’s broad market/style-specific benchmark.
Your Fund’s long-term performance appears later in this report.
Fund vs. Indexes
Total returns, 10/31/14 to 10/31/15, at net asset value (NAV). Performance shown does not include applicable contingent deferred sales charges (CDSC) or front-end sales charges, which would have reduced performance.
| | | | |
Class A Shares | | | -21.18 | % |
Class B Shares | | | -21.77 | |
Class C Shares | | | -21.77 | |
Class Y Shares | | | -21.00 | |
Class R5 Shares | | | -20.89 | |
Class R6 Shares | | | -20.84 | |
MSCI Emerging Markets Indexq (Broad Market/Style-Specific Index)* | | | -14.53 | |
MSCI EAFE Indexq (Former Broad Market Index)* | | | -0.07 | |
Lipper Emerging Market Funds Indexn (Peer Group Index) | | | -15.26 | |
Source(s): qFactSet Research Systems Inc.; nLipper Inc.
| * | The Fund has elected to use the MSCI Emerging Markets Index to represent its broad market/style-specific benchmark rather than the MSCI EAFE Index because the MSCI Emerging Markets Index more closely reflects the performance of the types of securities in which the Fund invests. |
Market conditions and your Fund
International markets experienced increased volatility during the fiscal year ended October 31, 2015, driven largely by the continued slowdown in energy markets and the economic downturn in China. Developed markets were generally able to withstand these headwinds, even as more fragile emerging markets began to falter.
Emerging markets were very volatile during the fiscal year. Many were particularly weakened early in the reporting period due to the lower commodity prices and the strengthening US dollar. Coupled with soft exports, weak commodity prices made emerging markets vulnerable to increased current account deficits. Weak currencies also led to higher inflation and interest rates. Most economies were not robust enough to offset this weakness in commodities and exports and needed to enact monetary easing policy to help
their economies. Most notably, China, Korea, India and Thailand began to cut interest rates or initiate others forms of monetary easing in order to support their economies.
Market volatility increased in the summer of 2015 as fears of a potential economic slowdown in China dominated headlines. The combination of a slowing Chinese economy, a sharp sell-off in domestic Chinese equities and the devaluation of China’s currency, the renminbi, contributed to a strong correction in global equity markets.
The third quarter of 2015 was particularly difficult for emerging markets as stocks and currencies tumbled even further. Much of the currency weakness was a byproduct of foreign investors selling their fixed income investments in emerging markets. Several currencies, including the Brazilian real, the Turkish lira and the Malaysian ringgit were at all-time lows or close to all-time lows.
Tremendous volatility across
equities, commodities and currencies led to declines across almost all benchmark index sectors during the reporting period. The Fund was not immune to this broad-based decline.
At the sector level, Fund holdings in the energy sector and underweight exposure to the materials sector were the most significant contributors to relative performance versus the broad market/style-specific benchmark. The Fund’s modest cash position was also a contributor to relative performance during the reporting period as markets were quite volatile. Conversely, Fund holdings in the financials, consumer discretionary, information technology, utilities and consumer staples sectors were significant detractors from relative performance.
From a geographic perspective, Fund holdings in Turkmenistan, Mexico and Poland were the largest contributors to relative performance versus the MSCI Emerging Markets Index. In contrast, overweight exposure to the Brazilian and Chinese markets were the largest detractors from relative performance. Not having any exposure in India dragged on relative performance, as well. The Indian market is quite small and valuations were expensive; during the fiscal year, the market traded at much higher valuations than other markets around the globe.
In Brazil, the economy fell into recession in the third quarter of 2015, largely due to a sharp drop in oil and commodity prices; the economy remained weak since then. Furthermore, Brazil’s sovereign debt was downgraded to junk status by Standard & Poor’s in the third quarter of 2015 due to political chaos and the weak economic backdrop. Brazil’s currency, the real, also fell due to the macroeconomic
| | | | | | |
| Portfolio Composition | |
By sector | | | % of total net assets | |
| | | | |
Financials | | | 33.1 | % |
| Information Technology | | | 14.3 | |
| Consumer Staples | | | 13.2 | |
| Consumer Discretionary | | | 9.5 | |
| Telecommunications Services | | | 8.0 | |
| Health Care | | | 6.0 | |
| Materials | | | 4.1 | |
| Energy | | | 3.0 | |
| Utilities | | | 2.2 | |
| Industrials | | | 1.4 | |
| Money Market Funds Plus Other Assets Less Liabilities | | | 5.2 | |
| | | | |
| Top 10 Equity Holdings* |
| | % of total net assets |
| | | | | | |
1. | | Industrial & Commercial Bank of China Ltd.–Class H | | | 4.0 | % |
2. | | Kasikornbank PCL | | | 3.4 | |
3. | | BM&FBOVESPA S.A. | | | 3.3 | |
4. | | Grupo Televisa S.A.B.–ADR | | | 3.2 | |
5. | | Haci Omer Sabanci Holding A.S. | | | 3.0 | |
6. | | Samsung Electronics Co., Ltd. | | | 2.8 | |
7. | | Taiwan Semiconductor Manufacturing Co. Ltd. | | | 2.7 | |
8. | | Fomento Economico Mexicano, S.A.B. de
C.V.–ADR | | | 2.7 | |
9. | | PT Telekomunikasi Indonesia Persero Tbk | | | 2.5 | |
10. | | China Mobile Ltd. | | | 2.5 | |
| | | | |
Total Net Assets | | | $2.4 billion | |
| |
| Total Number of Holdings* | | | 61 | |
The Fund’s holdings are subject to change, and there is no assurance that the Fund will continue to hold any particular security.
*Excluding money market fund holdings.
Data presented here are as of October 31, 2015.
4 Invesco Developing Markets Fund
backdrop. The real depreciated over 20% in the third quarter of 2015 alone,1 and inflation in Brazil was higher than it’s been in the past decade.
In China, monetary policy produced a low-quality rally early in the fiscal year, but the combination of a slowing Chinese economy, excessive margin financing and the fading impact of monetary policy easing contributed to a sharp sell-off in domestic Chinese equities – particularly in the restricted A-share market. The Chinese government eventually implemented measures to temper the sell-off including a freeze on initial public offerings and the launch of a stabilization fund backed by brokers, but most of the early market gains were wiped out. At the tail-end of the fiscal year, the devaluation of the renminbi spooked investors and caused Chinese markets to decline once again.
Despite the current weakness in Brazil and China, the Fund remained overweight in these countries relative to its broad market/style-specific index. This is because we believe in the long-term strength and quality of the companies we own, which we believe offer attractive business models, balance sheets, management teams and valuations.
From an individual securities perspective, Dragon Oil was the most significant contributor to the Fund’s relative performance versus the broad market/style-specific index. Dragon Oil is an oil, gas and mineral exploration and production company based in Turkmenistan. The company’s share price was positively impacted earlier in the calendar year when Emirate National Oil Company (not a Fund holding) agreed to acquire the company. NetEase, an Internet and video game company in China, also contributed to the Fund’s relative performance. South Korean technology giant Samsung Electronics was a significant contributor to relative performance, as well.
In contrast, due to the economic recession in Brazil, many of the largest individual detractors from the Fund’s relative performance versus the MSCI Emerging Markets Index were based in Brazil. Banco Bradesco was largest detractor from the Fund’s relative results during the reporting period. This well-run Brazilian bank was impacted by a weak macroeconomic environment and a sharp depreciation in the Brazilian real. Banco Bradesco is conservatively managed and it has a strong competitive position with a well-managed loan book. BR Malls Participacoes, a mall operator in Brazil, was also a detractor from the Fund’s relative performance. Indonesia’s largest natural gas and distribution company,
Perusahaan Gas Negara, was a detractor during the reporting period, as well.
As bottom-up investors, our primary focus is on finding high-quality growth companies that are trading at attractive valuations through a process we call earnings, quality and valuation (EQV). Macroeconomic and political movements are not our primary concern and do not drive our stock selection decisions.
Over the reporting period, we continued to look for opportunities to improve the growth potential and quality of the Fund’s portfolio by adding companies based on our earnings, quality and valuation outlook for each company. As disconcerting as volatility may be, we believe it tends to create long-term opportunities for our shareholders. It’s rare to find a thriving business at a compelling valuation when everything is going right; those valuations typically occur when fear dominates the market. On a stock-by-stock basis, we saw the decline over the past fiscal year in broad global equities as a buying opportunity.
As always, regardless of the macroeconomic environment, we remain focused on a bottom-up investment approach of identifying attractive companies that fit our EQV-focused investment process. We continue to look for high-quality growth companies that exhibit the following characteristics: strong organic revenue growth; high returns on capital; pricing power; strong balance sheets; cash generation; and reasonable valuations. In addition, we continue to favor companies that are able to consistently generate cash during weak economic environments. We believe that this balanced EQV-focused approach may help deliver attractive returns over the long term.
We thank you for your continued investment in Invesco Developing Markets Fund.
1 Source: Bloomberg LP
The views and opinions expressed in management’s discussion of Fund performance are those of Invesco Advisers, Inc. These views and opinions are subject to change at any time based on factors such as market and economic conditions. These views and opinions may not be relied upon as investment advice or recommendations, or as an offer for a particular security. The information is not a complete analysis of every aspect of any market, country, industry, security or the Fund. Statements of fact are from sources considered reliable, but Invesco Advisers, Inc. makes no representation or warranty as to their completeness or accuracy. Although historical performance is no guarantee of future results, these insights may help you understand our investment management philosophy.
See important Fund and, if applicable, index disclosures later in this report.
| | |
 | | Shuxin (Steve) Cao Chartered Financial Analyst, Portfolio Manager, is lead manager of Invesco Developing Markets Fund. He joined |
| Invesco in 1997. Mr. Cao earned a BA in English from the Tianjin Foreign Language Institute and an MBA from Texas A&M University. He is also a Certified Public Accountant. |
| |
 | | Borge Endresen Chartered Financial Analyst, Portfolio Manager, is lead manager of Invesco Developing Markets Fund. He joined |
| Invesco in 1999. Mr. Endresen earned a BS in finance from the University of Oregon and an MBA from The University of Texas at Austin. |
| |
 | | Brent Bates Chartered Financial Analyst, Portfolio Manager, is manager of Invesco Developing Markets Fund. He joined Invesco in |
| 1996. Mr. Bates earned a BBA from Texas A&M University and is a Certified Public Accountant. |
| |
 | | Mark Jason Chartered Financial Analyst, Portfolio Manager, is manager of Invesco Developing Markets Fund. He joined Invesco in |
| 2001. Mr. Jason earned a BS in finance and a BS in real estate from California State University, Northridge. |
5 Invesco Developing Markets Fund
Your Fund’s Long-Term Performance
Results of a $10,000 Investment – Oldest Share Class(es)
Fund and index data from 10/31/05
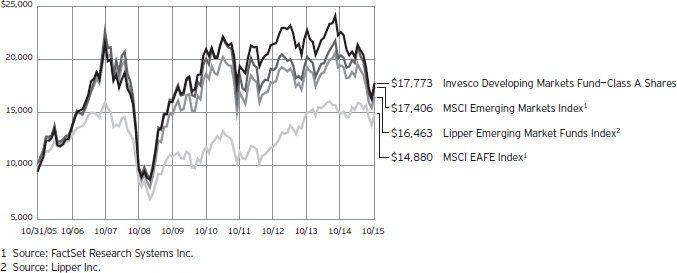
Past performance cannot guarantee comparable future results.
During the reporting period, the Fund elected to use the MSCI Emerging Markets Index to represent its broad market/ style-specific benchmark rather than the MSCI EAFE Index because the MSCI Emerging Markets Index more closely reflects the performance of the types of securities in which the Fund invests.
Because this is the first reporting period since we have adopted the new index, SEC guidelines require that we compare performance to both the old and new indexes.
The data shown in the chart include reinvested distributions, applicable sales charges and Fund expenses including management fees. Index results include reinvested dividends, but they do not
reflect sales charges. Performance of the peer group, if applicable, reflects fund expenses and management fees; performance of a market index does not. Performance shown in the chart and table(s) does not reflect deduction of taxes a shareholder would pay on Fund distributions or sale of Fund shares.
continued from page 8
About indexes used in this report
| n | | The MSCI Emerging Markets IndexSM is an unmanaged index considered representative of stocks of developing countries. The index is computed using the net return, which withholds applicable taxes for non-resident investors. |
| n | | The MSCI EAFE® Index is an unmanaged index considered representative of stocks of Europe, Australasia and the Far East. The index is computed using the net return, which with-holds applicable taxes for non-resident investors. |
| n | | The Lipper Emerging Market Funds Index is an unmanaged index considered representative of emerging market funds tracked by Lipper. |
| n | | The Fund is not managed to track the performance of any particular index, including the index(es) described here, and consequently, the performance of the Fund may deviate significantly from the performance of the index(es). |
| n | | A direct investment cannot be made in an index. Unless otherwise indicated, index results include reinvested dividends, and they do not reflect sales charges. Performance of the peer group, if applicable, reflects fund expenses; performance of a market index does not. |
Other information
| n | | CPA® and Certified Public Accountant® are trademarks owned by the American Institute of Certified Public Accountants. |
| n | | The returns shown in management’s discussion of Fund performance are based on net asset values (NAVs) calculated for shareholder transactions. Generally accepted accounting principles require adjustments to be made to the net assets of the Fund at period end for financial reporting purposes, and as such, the NAVs for shareholder transactions and the returns based on those |
NAVs may differ from the NAVs and returns reported in the Financial Highlights.
| n | | Industry classifications used in this report are generally according to the Global Industry Classification Standard, which was developed by and is the exclusive property and a service mark of MSCI Inc. and Standard & Poor’s. |
6 Invesco Developing Markets Fund
| | | | |
Average Annual Total Returns | |
As of 10/31/15, including maximum applicable sales charges | |
| |
Class A Shares | | | | |
Inception (1/11/94) | | | 4.25 | % |
10 Years | | | 5.92 | |
5 Years | | | -4.32 | |
1 Year | | | -25.52 | |
| |
Class B Shares | | | | |
Inception (11/3/97) | | | 5.28 | % |
10 Years | | | 5.89 | |
5 Years | | | -4.32 | |
1 Year | | | -25.60 | |
| |
Class C Shares | | | | |
Inception (3/1/99) | | | 8.42 | % |
10 Years | | | 5.73 | |
5 Years | | | -3.95 | |
1 Year | | | -22.53 | |
| |
Class Y Shares | | | | |
10 Years | | | 6.71 | % |
5 Years | | | -2.99 | |
1 Year | | | -21.00 | |
| |
Class R5 Shares | | | | |
Inception (10/25/05) | | | 7.09 | % |
10 Years | | | 6.98 | |
5 Years | | | -2.85 | |
1 Year | | | -20.89 | |
| |
Class R6 Shares | | | | |
10 Years | | | 6.66 | % |
5 Years | | | -2.97 | |
1 Year | | | -20.84 | |
Class Y shares incepted on October 3, 2008. Performance shown prior to that date is that of Class A shares and includes the 12b-1 fees applicable to Class A shares.
Class R5 shares incepted on October 25, 2005. Performance shown prior to that date is that of Class A shares and includes the 12b-1 fees applicable to Class A shares.
Class R6 shares incepted on September 24, 2012. Performance shown prior to that date is that of Class A shares and includes the 12b-1 fees applicable to Class A shares.
The performance data quoted represent past performance and cannot guarantee comparable future results; current performance may be lower or higher. Please visit invesco.com/performance for the most recent month-end performance. Performance figures reflect reinvested distributions, changes in net asset value and the effect of the maximum sales charge unless otherwise stated. Investment return and principal
| | | | |
| Average Annual Total Returns | |
| As of 9/30/15, the most recent calendar quarter end, including maximum applicable sales charges | |
| |
Class A Shares | | | | |
Inception (1/11/94) | | | 3.86 | % |
10 Years | | | 4.33 | |
5 Years | | | -5.37 | |
1 Year | | | -30.66 | |
| |
Class B Shares | | | | |
Inception (11/3/97) | | | 4.80 | % |
10 Years | | | 4.30 | |
5 Years | | | -5.38 | |
1 Year | | | -30.73 | |
| |
Class C Shares | | | | |
Inception (3/1/99) | | | 7.92 | % |
10 Years | | | 4.15 | |
5 Years | | | -5.01 | |
1 Year | | | -27.88 | |
| |
Class Y Shares | | | | |
10 Years | | | 5.11 | % |
5 Years | | | -4.06 | |
1 Year | | | -26.44 | |
| |
Class R5 Shares | | | | |
10 Years | | | 5.38 | % |
5 Years | | | -3.91 | |
1 Year | | | -26.31 | |
| |
Class R6 Shares | | | | |
10 Years | | | 5.07 | % |
5 Years | | | -4.05 | |
1 Year | | | -26.30 | |
value will fluctuate so that you may have a gain or loss when you sell shares.
The net annual Fund operating expense ratio set forth in the most recent Fund prospectus as of the date of this report for Class A, Class B, Class C, Class Y, Class R5 and Class R6 shares was 1.41%, 2.16%, 2.16%, 1.16%, 1.01% and 0.99%, respectively.1 The total annual Fund operating expense ratio set forth in the most recent Fund prospectus as of the date of this report for Class A, Class B, Class C, Class Y, Class R5 and Class R6 shares was 1.43%, 2.18%, 2.18%, 1.18%, 1.03% and 1.01%, respectively. The expense ratios presented above may vary from the expense ratios presented in other sections of this report that are based on expenses incurred during the period covered by this report.
Class A share performance reflects the maximum 5.50% sales charge, and Class B and Class C share performance reflects the applicable contingent
deferred sales charge (CDSC) for the period involved. The CDSC on
Class B shares declines from 5% beginning at the time of purchase to 0% at the beginning of the seventh year. The CDSC on Class C shares is 1% for the first year after purchase. Class Y, Class R5 and Class R6 shares do not have a front-end sales charge or a CDSC; therefore, performance is at net asset value.
The performance of the Fund’s share classes will differ primarily due to different sales charge structures and class expenses.
Fund performance reflects any applicable fee waivers and/or expense reimbursements. Had the adviser not waived fees and/or reimbursed expenses currently or in the past, returns would have been lower. See current prospectus for more information.
| 1 | Total annual Fund operating expenses after any contractual fee waivers and/or expense reimbursements by the adviser in effect through at least June 30, 2017. See current prospectus for more information. |
7 Invesco Developing Markets Fund
Invesco Developing Markets Fund’s investment objective is long-term growth of capital.
| n | | Unless otherwise stated, information presented in this report is as of October 31, 2015, and is based on total net assets. |
| n | | Unless otherwise noted, all data provided by Invesco. |
| n | | To access your Fund’s reports/prospectus, visit invesco.com/fundreports. |
About share classes
| n | | Class B shares may not be purchased for new or additional investments. Please see the prospectus for more information. |
| n | | Class Y shares are available to only certain investors. Please see the prospectus for more information. |
| n | | Class R5 shares and Class R6 shares are primarily intended for employer sponsored retirement and benefit plans that meet certain standards and for institutional investors. Please see the prospectus for more information. |
Principal risks of investing
in the Fund
| n | | Depositary receipts risk. Depositary receipts involve many of the same risks as those associated with direct investment in foreign securities. In addition, the underlying issuers of certain depositary receipts, particularly unsponsored or unregistered depositary receipts, are under no obligation to distribute shareholder communications to the holders of such receipts or to pass through to them any voting rights with respect to the deposited securities. |
| n | | Derivatives risk. The value of a derivative instrument depends largely on (and is derived from) the value of an underlying security, currency, commodity, interest rate, index or other asset (each referred to as an underlying asset). In addition to risks relating to the underlying assets, the use of derivatives may include other, possibly greater, risks, including counterparty, leverage and liquidity risks. Counterparty risk is the risk that the counterparty to the derivative contract will default on its obligation to pay the Fund the amount owed or otherwise perform under the derivative contract. Derivatives create leverage risk because they do not require payment up front equal to the economic exposure created by owning the derivative. As a result, an adverse change in the value of the underlying asset could result in the Fund sustaining a loss that is substantially greater than the amount invested in the derivative, which may make the Fund’s returns |
| | | more volatile and increase the risk of loss. Derivative instruments may also be less liquid than more traditional investments and the Fund may be unable to sell or close out its derivative positions at a desirable time or price. This risk may be more acute under adverse market conditions, during which the Fund may be most in need of liquidating its derivative positions. Derivatives may also be harder to value, less tax efficient and subject to changing government regulation that could impact the Fund’s ability to use certain derivatives or their cost. Also, derivatives used for hedging or to gain or limit exposure to a particular market segment may not provide the expected benefits, particularly during adverse market conditions. |
| n | | Developing/emerging markets securities risk. The prices of securities issued by foreign companies and governments located in developing/emerging markets countries may be affected more negatively by inflation, devaluation of their currencies, higher transaction costs, delays in settlement, adverse political developments, the introduction of capital controls, withholding taxes, nationalization of private assets, expropriation, social unrest, war or lack of timely information than those in developed countries. |
| n | | Foreign securities risk. The Fund’s foreign investments may be affected by changes in a foreign country’s exchange rates, political and social instability, changes in economic or taxation policies, difficulties when enforcing obligations, decreased liquidity, and increased volatility. Foreign companies may be subject to less regulation resulting in less publicly available information about the companies. |
| n | | Geographic focus risk. From time to time the Fund may invest a substantial amount of its assets in securities of issuers located in a single country or a limited number of countries. If the Fund focuses its investments in this manner, it assumes the risk that economic, political and social conditions in those countries will have a significant |
| | | impact on its investment performance. The Fund’s investment performance may also be more volatile if it focuses its investments in certain countries, especially emerging markets countries. |
| n | | Growth investing risk. Growth stocks tend to be more expensive relative to their earnings or assets compared with other types of stock. As a result they tend to be more sensitive to changes in their earnings and can be more volatile. |
| n | | Management risk. The investment techniques and risk analysis used by the Fund’s portfolio managers may not produce the desired results. |
| n | | Market risk. The prices of and the income generated by the Fund’s securities may decline in response to, among other things, investor sentiment, general economic and market conditions, regional or global instability, and currency and interest rate fluctuations. |
| n | | Preferred securities risk. Preferred securities may include provisions that permit the issuer, in its discretion, to defer or omit distributions for a certain period of time. If the Fund owns a security that is deferring or omitting its distributions, the Fund may be required to report the distribution on its tax returns, even though it may not have received this income. Further, preferred securities may lose substantial value due to the omission or deferment of dividend payments. |
| n | | Small-and mid-capitalization risks. Stocks of small-and mid-sized companies tend to be more vulnerable to adverse developments and may have little or no operating history or track record of success, and limited product lines, markets, management and financial resources. The securities of small-and mid-sized companies may be more volatile due to less market interest and less publicly available information about the issuer. They also may be illiquid or restricted as to resale, or may trade less frequently and in smaller volumes, all of which may cause difficulty when establishing or closing a position at a desirable price. |
continued on page 6
|
This report must be accompanied or preceded by a currently effective Fund prospectus, which contains more complete information, including sales charges and expenses. Investors should read it carefully before investing. |
|
NOT FDIC INSURED | MAY LOSE VALUE | NO BANK GUARANTEE |
8 Invesco Developing Markets Fund
Schedule of Investments
October 31, 2015
| | | | | | | | |
| | | Shares | | | Value | |
Common Stocks & Other Equity Interests–94.82% | |
| Brazil–15.71% | |
Arcos Dorados Holdings, Inc.–Class A | | | 5,024,709 | | | $ | 15,476,104 | |
Banco Bradesco S.A.–ADR | | | 6,438,439 | | | | 35,025,108 | |
BM&FBOVESPA S.A. | | | 26,972,120 | | | | 79,770,188 | |
BR Malls Participacoes S.A. | | | 9,696,600 | | | | 28,174,628 | |
BRF S.A. | | | 1,277,040 | | | | 19,911,302 | |
CETIP S.A.–Mercados Organizados | | | 6,683,986 | | | | 59,130,369 | |
Cielo S.A. | | | 4,950,056 | | | | 47,014,359 | |
Diagnosticos da America S.A. | | | 3,877,300 | | | | 9,042,943 | |
Duratex S.A. | | | 12,013,544 | | | | 19,946,734 | |
Fleury S.A.(a) | | | 8,702,000 | | | | 37,001,448 | |
Totvs S.A. | | | 2,764,600 | | | | 24,507,441 | |
Wilson Sons Ltd.–BDR | | | 962,600 | | | | 8,241,011 | |
| | | | | 383,241,635 | |
|
| China–20.78% | |
Baidu, Inc.–ADR(b) | | | 275,889 | | | | 51,720,911 | |
Belle International Holdings Ltd. | | | 38,056,000 | | | | 37,021,939 | |
China Mobile Ltd. | | | 5,075,500 | | | | 60,378,832 | |
CNOOC Ltd. | | | 17,186,000 | | | | 19,546,901 | |
Golden Eagle Retail Group Ltd. | | | 16,533,000 | | | | 21,267,258 | |
Industrial & Commercial Bank of China Ltd.–Class H | | | 152,644,000 | | | | 96,861,392 | |
Kweichow Moutai Co., Ltd.–Class A | | | 1,151,061 | | | | 38,850,290 | |
Lee & Man Paper Manufacturing Ltd. | | | 80,495,000 | | | | 50,059,386 | |
NetEase, Inc.–ADR | | | 382,337 | | | | 55,259,167 | |
Stella International Holdings Ltd. | | | 11,189,000 | | | | 27,616,559 | |
Want Want China Holdings Ltd. | | | 58,470,000 | | | | 48,539,402 | |
| | | | | 507,122,037 | |
|
| Egypt–0.28% | |
Egyptian Financial Group-Hermes Holding Co.(b) | | | 6,185,376 | | | | 6,936,957 | |
|
| France–1.10% | |
Bollore S.A. | | | 5,436,306 | | | | 26,914,332 | |
|
| Hong Kong–3.17% | |
Galaxy Entertainment Group Ltd. | | | 6,518,000 | | | | 22,179,275 | |
WH Group Ltd.(b)(c) | | | 99,909,000 | | | | 55,110,560 | |
| | | | | 77,289,835 | |
|
| Hungary–2.30% | |
Richter Gedeon Nyrt | | | 3,354,462 | | | | 55,998,736 | |
|
| Indonesia–5.35% | |
PT Bank Central Asia Tbk | | | 24,641,600 | | | | 23,138,906 | |
PT Bank Mandiri Persero Tbk | | | 43,158,100 | | | | 27,298,581 | |
PT Perusahaan Gas Negara Persero Tbk | | | 88,499,600 | | | | 19,273,168 | |
PT Telekomunikasi Indonesia Persero Tbk | | | 307,341,700 | | | | 60,811,577 | |
| | | | | 130,522,232 | |
| | | | | | | | |
| | | Shares | | | Value | |
| Israel–3.01% | |
Israel Chemicals Ltd. | | | 5,210,384 | | | $ | 28,827,641 | |
Teva Pharmaceutical Industries Ltd.–ADR | | | 755,127 | | | | 44,695,967 | |
| | | | | 73,523,608 | |
|
| Malaysia–1.93% | |
Public Bank Berhad | | | 11,209,800 | | | | 47,057,055 | |
|
| Mexico–7.99% | |
America Movil S.A.B. de C.V.–Series L–ADR | | | 1,145,257 | | | | 20,397,027 | |
Fomento Economico Mexicano, S.A.B. de C.V.–ADR | | | 666,070 | | | | 66,000,876 | |
Grupo Televisa S.A.B.–ADR | | | 2,663,649 | | | | 77,618,703 | |
Kimberly-Clark de Mexico, S.A.B. de C.V.–Class A | | | 12,925,370 | | | | 30,926,879 | |
| | | | | 194,943,485 | |
|
| Nigeria–1.60% | |
Zenith Bank PLC | | | 440,176,509 | | | | 38,922,360 | |
|
| Peru–2.37% | |
Credicorp Ltd. | | | 510,856 | | | | 57,818,682 | |
|
| Philippines–4.76% | |
Energy Development Corp. | | | 246,329,900 | | | | 34,752,488 | |
Philippine Long Distance Telephone Co. | | | 872,360 | | | | 41,120,276 | |
SM Prime Holdings Inc. | | | 87,603,800 | | | | 40,221,675 | |
| | | | | 116,094,439 | |
|
| Poland–0.94% | |
Eurocash S.A. | | | 1,695,093 | | | | 22,860,662 | |
|
| Russia–6.41% | |
Gazprom PAO–ADR | | | 3,731,713 | | | | 15,710,512 | |
Mobile TeleSystems PJSC–ADR | | | 1,836,494 | | | | 12,910,553 | |
Sberbank PAO(b) | | | 37,218,144 | | | | 52,768,666 | |
Sberbank PAO–Preference Shares(b) | | | 35,854,175 | | | | 38,458,801 | |
Yandex N.V.–Class A(b) | | | 2,272,126 | | | | 36,581,229 | |
| | | | | 156,429,761 | |
|
| South Africa–0.54% | |
Sasol Ltd. | | | 413,584 | | | | 13,169,207 | |
|
| South Korea–4.02% | |
Hyundai Department Store Co., Ltd. | | | 269,109 | | | | 29,480,124 | |
Samsung Electronics Co., Ltd. | | | 57,290 | | | | 68,598,048 | |
| | | | | 98,078,172 | |
|
| Taiwan–2.72% | |
Taiwan Semiconductor Manufacturing Co. Ltd. | | | 15,781,000 | | | | 66,430,345 | |
|
| Thailand–4.17% | |
Kasikornbank PCL | | | 16,970,800 | | | | 82,128,293 | |
See accompanying Notes to Financial Statements which are an integral part of the financial statements.
9 Invesco Developing Markets Fund
| | | | | | | | |
| | | Shares | | | Value | |
| Thailand–(continued) | |
Siam Commercial Bank PCL (The) | | | 5,282,100 | | | $ | 19,708,168 | |
| | | | | 101,836,461 | |
|
| Turkey–5.67% | |
Anadolu Efes Biracilik ve Malt Sanayii A.S. | | | 3,642,001 | | | | 28,730,286 | |
Eczacibasi Ilac Sanayi ve Ticaret A.S. | | | 12,359,196 | | | | 10,300,743 | |
Haci Omer Sabanci Holding A.S. | | | 23,428,223 | | | | 74,286,146 | |
Tupras-Turkiye Petrol Rafinerileri A.S.(b) | | | 950,357 | | | | 25,098,604 | |
| | | | | | | | 138,415,779 | |
Total Common Stocks & Other Equity Interests
(Cost $2,568,016,438) | | | | 2,313,605,780 | |
| | | | | | | | |
| | | Shares | | | Value | |
Money Market Funds–4.91% | |
Liquid Assets Portfolio–Institutional Class, 0.16%(d) | | | 59,968,737 | | | $ | 59,968,737 | |
Premier Portfolio–Institutional Class, 0.12%(d) | | | 59,968,738 | | | | 59,968,738 | |
Total Money Market Funds
(Cost $119,937,475) | | | | 119,937,475 | |
TOTAL INVESTMENTS–99.73%
(Cost $2,687,953,913) | | | | 2,433,543,255 | |
OTHER ASSETS LESS LIABILITIES–0.27% | | | | 6,537,080 | |
NET ASSETS–100.00% | | | $ | 2,440,080,335 | |
Investment Abbreviations:
| | |
| ADR | | – American Depositary Receipt |
| BDR | | – Brazilian Depositary Receipt |
Notes to Schedule of Investments:
| (a) | Affiliated company during the period. The Investment Company Act of 1940 defines an “affiliated person” as an issuance in which a fund holds 5% or more of the outstanding voting securities. The Fund has not owned enough of the outstanding voting securities of the issuer to have control (as defined in the Investment Company Act of 1940) of that issuer. The value of this security as of October 31, 2015 represented 1.52% of the Fund’s Net Assets. See Note 4. |
| (b) | Non-income producing security. |
| (c) | Security purchased or received in transaction exempt from registration under the Securities Act of 1933, as amended (the “1933 Act”). The security may be resold pursuant to an exemption from registration under the 1933 Act, typically to qualified institutional buyers. The value of this security at October 31, 2015 represented 2.26% of the Fund’s Net Assets. |
| (d) | The money market fund and the Fund are affiliated by having the same investment adviser. The rate shown is the 7-day SEC standardized yield as of October 31, 2015. |
See accompanying Notes to Financial Statements which are an integral part of the financial statements.
10 Invesco Developing Markets Fund
Statement of Assets and Liabilities
October 31, 2015
| | | | |
Assets: | |
Investments, at value (Cost $2,491,337,811) | | $ | 2,276,604,332 | |
Investments in affiliates, at value (Cost $196,616,102) | | | 156,938,923 | |
Total investments, at value (Cost $2,687,953,913) | | | 2,433,543,255 | |
Foreign currencies, at value (Cost $1,052,675) | | | 900,149 | |
Receivable for: | | | | |
Investments sold | | | 15,183,943 | |
Fund shares sold | | | 6,427,922 | |
Dividends | | | 1,191,769 | |
Investment for trustee deferred compensation and retirement plans | | | 318,740 | |
Other assets | | | 64,202 | |
Total assets | | | 2,457,629,980 | |
|
Liabilities: | |
Payable for: | | | | |
Fund shares reacquired | | | 8,094,383 | |
Accrued foreign taxes | | | 7,271,552 | |
Accrued fees to affiliates | | | 1,272,845 | |
Accrued trustees’ and officers’ fees and benefits | | | 4,169 | |
Accrued other operating expenses | | | 538,971 | |
Trustee deferred compensation and retirement plans | | | 367,725 | |
Total liabilities | | | 17,549,645 | |
Net assets applicable to shares outstanding | | $ | 2,440,080,335 | |
|
Net assets consist of: | |
Shares of beneficial interest | | $ | 2,824,778,757 | |
Undistributed net investment income | | | 26,487,068 | |
Undistributed net realized gain (loss) | | | (156,457,736 | ) |
Net unrealized appreciation (depreciation) | | | (254,727,754 | ) |
| | | $ | 2,440,080,335 | |
| | | | |
Net Assets: | |
Class A | | $ | 795,041,725 | |
Class B | | $ | 12,710,429 | |
Class C | | $ | 82,394,732 | |
Class Y | | $ | 1,016,382,019 | |
Class R5 | | $ | 352,778,510 | |
Class R6 | | $ | 180,772,920 | |
|
Shares outstanding, $0.01 par value per share,
with an unlimited number of shares authorized: | |
Class A | | | 30,762,575 | |
Class B | | | 507,101 | |
Class C | | | 3,291,286 | |
Class Y | | | 39,211,951 | |
Class R5 | | | 13,620,934 | |
Class R6 | | | 6,980,628 | |
Class A: | | | | |
Net asset value per share | | $ | 25.84 | |
Maximum offering price per share | | | | |
(Net asset value of $25.84 ¸ 94.50%) | | $ | 27.34 | |
Class B: | | | | |
Net asset value and offering price per share | | $ | 25.06 | |
Class C: | | | | |
Net asset value and offering price per share | | $ | 25.03 | |
Class Y: | | | | |
Net asset value and offering price per share | | $ | 25.92 | |
Class R5: | | | | |
Net asset value and offering price per share | | $ | 25.90 | |
Class R6: | | | | |
Net asset value and offering price per share | | $ | 25.90 | |
See accompanying Notes to Financial Statements which are an integral part of the financial statements.
11 Invesco Developing Markets Fund
Statement of Operations
For the year ended October 31, 2015
| | | | |
Investment income: | |
Dividends (net of foreign withholding taxes of $7,506,195) | | $ | 72,637,001 | |
Dividends from affiliates | | | 2,545,123 | |
Total investment income | | | 75,182,124 | |
| |
Expenses: | | | | |
Advisory fees | | | 27,306,844 | |
Administrative services fees | | | 569,291 | |
Custodian fees | | | 2,771,873 | |
Distribution fees: | | | | |
Class A | | | 2,440,020 | |
Class B | | | 198,372 | |
Class C | | | 1,083,918 | |
Transfer agent fees — A, B, C and Y | | | 4,599,547 | |
Transfer agent fees — R5 | | | 197,676 | |
Transfer agent fees — R6 | | | 7,068 | |
Trustees’ and officers’ fees and benefits | | | 69,666 | |
Other | | | 752,664 | |
Total expenses | | | 39,996,939 | |
Less: Fees waived and expense offset arrangement(s) | | | (316,525 | ) |
Net expenses | | | 39,680,414 | |
Net investment income | | | 35,501,710 | |
| |
Realized and unrealized gain (loss) from: | | | | |
Net realized gain (loss) from: | | | | |
Investment securities (net of foreign taxes of $1,605,181) | | | (84,413,670 | ) |
Foreign currencies | | | (6,908,555 | ) |
| | | | (91,322,225 | ) |
Change in net unrealized appreciation (depreciation) of: | | | | |
Investment securities (net of foreign taxes on holdings of $8,776,170) | | | (689,734,981 | ) |
Foreign currencies | | | 512,802 | |
| | | | (689,222,179 | ) |
Net realized and unrealized gain (loss) | | | (780,544,404 | ) |
Net increase (decrease) in net assets resulting from operations | | $ | (745,042,694 | ) |
See accompanying Notes to Financial Statements which are an integral part of the financial statements.
12 Invesco Developing Markets Fund
Statement of Changes in Net Assets
For the years ended October 31, 2015 and 2014
| | | | | | | | |
| | | 2015 | | | 2014 | |
Operations: | | | | | |
Net investment income | | $ | 35,501,710 | | | $ | 46,413,399 | |
Net realized gain (loss) | | | (91,322,225 | ) | | | 82,011,550 | |
Change in net unrealized appreciation (depreciation) | | | (689,222,179 | ) | | | (152,864,896 | ) |
Net increase (decrease) in net assets resulting from operations | | | (745,042,694 | ) | | | (24,439,947 | ) |
| | |
Distributions to shareholders from net investment income: | | | | | | | | |
Class A | | | (11,257,345 | ) | | | (12,047,271 | ) |
Class B | | | (46,124 | ) | | | (2,825 | ) |
Class C | | | (226,637 | ) | | | (10,919 | ) |
Class Y | | | (20,165,279 | ) | | | (12,316,478 | ) |
Class R5 | | | (9,883,834 | ) | | | (7,997,307 | ) |
Class R6 | | | (2,640,173 | ) | | | (1,920,886 | ) |
Total distributions from net investment income | | | (44,219,392 | ) | | | (34,295,686 | ) |
| | |
Distributions to shareholders from net realized gains: | | | | | | | | |
Class A | | | (18,963,500 | ) | | | (4,079,975 | ) |
Class B | | | (466,766 | ) | | | (122,369 | ) |
Class C | | | (2,293,467 | ) | | | (472,989 | ) |
Class Y | | | (26,008,645 | ) | | | (3,205,244 | ) |
Class R5 | | | (11,459,346 | ) | | | (1,883,230 | ) |
Class R6 | | | (3,014,719 | ) | | | (437,629 | ) |
Total distributions from net realized gains | | | (62,206,443 | ) | | | (10,201,436 | ) |
| | |
Share transactions–net: | | | | | | | | |
Class A | | | (191,882,572 | ) | | | (216,412,571 | ) |
Class B | | | (10,229,125 | ) | | | (14,987,379 | ) |
Class C | | | (26,078,129 | ) | | | (26,665,246 | ) |
Class Y | | | (72,994,311 | ) | | | 312,954,650 | |
Class R5 | | | (200,072,110 | ) | | | 30,137,043 | |
Class R6 | | | 46,374,190 | | | | 27,066,204 | |
Net increase (decrease) in net assets resulting from share transactions | | | (454,882,057 | ) | | | 112,092,701 | |
Net increase (decrease) in net assets | | | (1,306,350,586 | ) | | | 43,155,632 | |
| | |
Net assets: | | | | | | | | |
Beginning of year | | | 3,746,430,921 | | | | 3,703,275,289 | |
End of year (includes undistributed net investment income of $26,487,068 and $43,759,663, respectively) | | $ | 2,440,080,335 | | | $ | 3,746,430,921 | |
Notes to Financial Statements
October 31, 2015
NOTE 1—Significant Accounting Policies
Invesco Developing Markets Fund (the “Fund”) is a series portfolio of AIM Investment Funds (Invesco Investment Funds) (the “Trust”). The Trust is organized as a Delaware statutory trust and is registered under the Investment Company Act of 1940, as amended (the “1940 Act”), as an open-end series management investment company consisting of twenty-four separate series portfolios, each authorized to issue an unlimited number of shares of beneficial interest. The assets, liabilities and operations of each portfolio are accounted for separately. Information presented in these financial statements pertains only to the Fund. Matters affecting each portfolio or class will be voted on exclusively by the shareholders of such portfolio or class.
The Fund’s investment objective is long-term growth of capital.
The Fund currently consists of six different classes of shares: Class A, Class B, Class C, Class Y, Class R5 and Class R6. Class A shares are sold with a front-end sales charge unless certain waiver criteria are met and under certain circumstances load waived shares may be subject to contingent deferred sales charges (“CDSC”). Class C shares are sold with a CDSC. Class Y, Class R5 and Class R6 shares are sold at net asset value. Effective November 30, 2010, new or additional investments in Class B shares are no longer permitted. Existing shareholders of Class B shares may continue to reinvest dividends and capital gains distributions in Class B shares until they convert to Class A shares. Also, shareholders in Class B shares will be
13 Invesco Developing Markets Fund
able to exchange those shares for Class B shares of other Invesco Funds offering such shares until they convert to Class A shares. Generally, Class B shares will automatically convert to Class A shares on or about the month-end, which is at least eight years after the date of purchase. Redemption of Class B shares prior to the conversion date will be subject to a CDSC.
The following is a summary of the significant accounting policies followed by the Fund in the preparation of its financial statements.
| A. | Security Valuations — Securities, including restricted securities, are valued according to the following policy. |
A security listed or traded on an exchange (except convertible securities) is valued at its last sales price or official closing price as of the close of the customary trading session on the exchange where the security is principally traded, or lacking any sales or official closing price on a particular day, the security may be valued at the closing bid price on that day. Securities traded in the over-the-counter market are valued based on prices furnished by independent pricing services or market makers. When such securities are valued by an independent pricing service they may be considered fair valued. Futures contracts are valued at the final settlement price set by an exchange on which they are principally traded. Listed options are valued at the mean between the last bid and asked prices from the exchange on which they are principally traded. Options not listed on an exchange are valued by an independent source at the mean between the last bid and asked prices. For purposes of determining net asset value (“NAV”) per share, futures and option contracts generally are valued 15 minutes after the close of the customary trading session of the New York Stock Exchange (“NYSE”).
Investments in open-end and closed-end registered investment companies that do not trade on an exchange are valued at the end-of-day net asset value per share. Investments in open-end and closed-end registered investment companies that trade on an exchange are valued at the last sales price or official closing price as of the close of the customary trading session on the exchange where the security is principally traded.
Debt obligations (including convertible securities) and unlisted equities are fair valued using an evaluated quote provided by an independent pricing service. Evaluated quotes provided by the pricing service may be determined without exclusive reliance on quoted prices, and may reflect appropriate factors such as institution-size trading in similar groups of securities, developments related to specific securities, dividend rate (for unlisted equities), yield (for debt obligations), quality, type of issue, coupon rate (for debt obligations), maturity (for debt obligations), individual trading characteristics and other market data. Debt obligations are subject to interest rate and credit risks. In addition, all debt obligations involve some risk of default with respect to interest and/or principal payments.
Foreign securities’ (including foreign exchange contracts) prices are converted into U.S. dollar amounts using the applicable exchange rates as of the close of the NYSE. If market quotations are available and reliable for foreign exchange-traded equity securities, the securities will be valued at the market quotations. Because trading hours for certain foreign securities end before the close of the NYSE, closing market quotations may become unreliable. If between the time trading ends on a particular security and the close of the customary trading session on the NYSE, events occur that the Adviser determines are significant and make the closing price unreliable, the Fund may fair value the security. If the event is likely to have affected the closing price of the security, the security will be valued at fair value in good faith using procedures approved by the Board of Trustees. Adjustments to closing prices to reflect fair value may also be based on a screening process of an independent pricing service to indicate the degree of certainty, based on historical data, that the closing price in the principal market where a foreign security trades is not the current value as of the close of the NYSE. Foreign securities’ prices meeting the approved degree of certainty that the price is not reflective of current value will be priced at the indication of fair value from the independent pricing service. Multiple factors may be considered by the independent pricing service in determining adjustments to reflect fair value and may include information relating to sector indices, American Depositary Receipts and domestic and foreign index futures. Foreign securities may have additional risks including exchange rate changes, potential for sharply devalued currencies and high inflation, political and economic upheaval, the relative lack of issuer information, relatively low market liquidity and the potential lack of strict financial and accounting controls and standards.
Securities for which market prices are not provided by any of the above methods may be valued based upon quotes furnished by independent sources. The last bid price may be used to value equity securities. The mean between the last bid and asked prices is used to value debt obligations, including corporate loans.
Securities for which market quotations are not readily available or became unreliable are valued at fair value as determined in good faith by or under the supervision of the Trust’s officers following procedures approved by the Board of Trustees. Issuer specific events, market trends, bid/asked quotes of brokers and information providers and other market data may be reviewed in the course of making a good faith determination of a security’s fair value.
The Fund may invest in securities that are subject to interest rate risk, meaning the risk that the prices will generally fall as interest rates rise and, conversely, the prices will generally rise as interest rates fall. Specific securities differ in their sensitivity to changes in interest rates depending on their individual characteristics. Changes in interest rates may result in increased market volatility, which may affect the value and/or liquidity of certain Fund investments.
Valuations change in response to many factors including the historical and prospective earnings of the issuer, the value of the issuer’s assets, general economic conditions, interest rates, investor perceptions and market liquidity. Because of the inherent uncertainties of valuation, the values reflected in the financial statements may materially differ from the value received upon actual sale of those investments.
| B. | Securities Transactions and Investment Income — Securities transactions are accounted for on a trade date basis. Realized gains or losses on sales are computed on the basis of specific identification of the securities sold. Interest income (net of withholding tax, if any) is recorded on the accrual basis from settlement date. Dividend income (net of withholding tax, if any) is recorded on the ex-dividend date. |
The Fund may periodically participate in litigation related to Fund investments. As such, the Fund may receive proceeds from litigation settlements. Any proceeds received are included in the Statement of Operations as realized gain (loss) for investments no longer held and as unrealized gain (loss) for investments still held.
Brokerage commissions and mark ups are considered transaction costs and are recorded as an increase to the cost basis of securities purchased and/or a reduction of proceeds on a sale of securities. Such transaction costs are included in the determination of net realized and unrealized gain (loss) from investment securities reported in the Statement of Operations and the Statement of Changes in Net Assets and the net realized and unrealized gains (losses) on securities per share in the Financial Highlights. Transaction costs are included in the calculation of the Fund’s net asset value and, accordingly, they reduce the Fund’s total returns. These transaction costs are not considered operating expenses and are not reflected in net investment income reported in the Statement of Operations and the Statement of Changes in Net Assets, or the net investment income per share and the ratios of expenses and net investment income reported in the Financial Highlights, nor are they limited by any expense limitation arrangements between the Fund and the investment adviser.
14 Invesco Developing Markets Fund
The Fund allocates income and realized and unrealized capital gains and losses to a class based on the relative net assets of each class.
| C. | Country Determination — For the purposes of making investment selection decisions and presentation in the Schedule of Investments, the investment adviser may determine the country in which an issuer is located and/or credit risk exposure based on various factors. These factors include the laws of the country under which the issuer is organized, where the issuer maintains a principal office, the country in which the issuer derives 50% or more of its total revenues and the country that has the primary market for the issuer’s securities, as well as other criteria. Among the other criteria that may be evaluated for making this determination are the country in which the issuer maintains 50% or more of its assets, the type of security, financial guarantees and enhancements, the nature of the collateral and the sponsor organization. Country of issuer and/or credit risk exposure has been determined to be the United States of America, unless otherwise noted. |
| D. | Distributions — Distributions from net investment income and net realized capital gain, if any, are generally declared and paid annually and recorded on the ex-dividend date. The Fund may elect to treat a portion of the proceeds from redemptions as distributions for federal income tax purposes. |
| E. | Federal Income Taxes — The Fund intends to comply with the requirements of Subchapter M of the Internal Revenue Code of 1986, as amended (the “Internal Revenue Code”), necessary to qualify as a regulated investment company and to distribute substantially all of the Fund’s taxable earnings to shareholders. As such, the Fund will not be subject to federal income taxes on otherwise taxable income (including net realized capital gain) that is distributed to shareholders. Therefore, no provision for federal income taxes is recorded in the financial statements. |
The Fund recognizes the tax benefits of uncertain tax positions only when the position is more likely than not to be sustained. Management has analyzed the Fund’s uncertain tax positions and concluded that no liability for unrecognized tax benefits should be recorded related to uncertain tax positions. Management is not aware of any tax positions for which it is reasonably possible that the total amounts of unrecognized tax benefits will change materially in the next 12 months.
The Fund files tax returns in the U.S. Federal jurisdiction and certain other jurisdictions. Generally, the Fund is subject to examinations by such taxing authorities for up to three years after the filing of the return for the tax period.
| F. | Expenses — Fees provided for under the Rule 12b-1 plan of a particular class of the Fund are charged to the operations of such class. Transfer agency fees and expenses and other shareholder recordkeeping fees and expenses attributable to Class R5 and Class R6 are allocated to each share class based on relative net assets. Sub-accounting fees attributable to Class R5 are charged to the operations of the class. Transfer agency fees and expenses and other shareholder recordkeeping fees and expenses relating to all other classes are allocated among those classes based on relative net assets. All other expenses are allocated among the classes based on relative net assets. |
| G. | Accounting Estimates — The preparation of financial statements in conformity with accounting principles generally accepted in the United States of America (“GAAP”) requires management to make estimates and assumptions that affect the reported amounts of assets and liabilities at the date of the financial statements and the reported amounts of revenues and expenses during the reporting period including estimates and assumptions related to taxation. Actual results could differ from those estimates by a significant amount. In addition, the Fund monitors for material events or transactions that may occur or become known after the period-end date and before the date the financial statements are released to print. |
| H. | Indemnifications — Under the Trust’s organizational documents, each Trustee, officer, employee or other agent of the Trust is indemnified against certain liabilities that may arise out of the performance of their duties to the Fund. Additionally, in the normal course of business, the Fund enters into contracts, including the Fund’s servicing agreements, that contain a variety of indemnification clauses. The Fund’s maximum exposure under these arrangements is unknown as this would involve future claims that may be made against the Fund that have not yet occurred. The risk of material loss as a result of such indemnification claims is considered remote. |
| I. | Foreign Currency Translations — Foreign currency is valued at the close of the NYSE based on quotations posted by banks and major currency dealers. Portfolio securities and other assets and liabilities denominated in foreign currencies are translated into U.S. dollar amounts at date of valuation. Purchases and sales of portfolio securities (net of foreign taxes withheld on disposition) and income items denominated in foreign currencies are translated into U.S. dollar amounts on the respective dates of such transactions. The Fund does not separately account for the portion of the results of operations resulting from changes in foreign exchange rates on investments and the fluctuations arising from changes in market prices of securities held. The combined results of changes in foreign exchange rates and the fluctuation of market prices on investments (net of estimated foreign tax withholding) are included with the net realized and unrealized gain or loss from investments in the Statement of Operations. Reported net realized foreign currency gains or losses arise from (1) sales of foreign currencies, (2) currency gains or losses realized between the trade and settlement dates on securities transactions, and (3) the difference between the amounts of dividends, interest, and foreign withholding taxes recorded on the Fund’s books and the U.S. dollar equivalent of the amounts actually received or paid. Net unrealized foreign currency gains and losses arise from changes in the fair values of assets and liabilities, other than investments in securities at fiscal period end, resulting from changes in exchange rates. |
The Fund may invest in foreign securities, which may be subject to foreign taxes on income, gains on investments or currency repatriation, a portion of which may be recoverable. Foreign taxes, if any, are recorded based on the tax regulations and rates that exist in the foreign markets in which the Fund invests and are shown in the Statement of Operations.
| J. | Forward Foreign Currency Contracts — The Fund may engage in foreign currency transactions either on a spot (i.e. for prompt delivery and settlement) basis, or through forward foreign currency contracts, to manage or minimize currency or exchange rate risk. |
The Fund may also enter into forward foreign currency contracts for the purchase or sale of a security denominated in a foreign currency in order to “lock in” the U.S. dollar price of that security, or the Fund may also enter into forward foreign currency contracts that do not provide for physical settlement of the two currencies, but instead are settled by a single cash payment calculated as the difference between the agreed upon exchange rate and the spot rate at settlement based upon an agreed upon notional amount (non-deliverable forwards). The Fund will set aside liquid assets in an amount equal to daily mark-to-market obligation for forward foreign currency contracts.
A forward foreign currency contract is an obligation between two parties (“Counterparties”) to purchase or sell a specific currency for an agreed-upon price at a future date. The use of forward foreign currency contracts does not eliminate fluctuations in the price of the underlying securities the Fund owns or intends to acquire but establishes a rate of exchange in advance. Fluctuations in the value of these contracts are measured by the difference in the contract date and reporting date exchange rates and are recorded as unrealized appreciation (depreciation) until the contracts are closed. When the contracts are closed, realized gains (losses) are recorded. Realized and unrealized gains (losses) on the
15 Invesco Developing Markets Fund
contracts are included in the Statement of Operations. The primary risks associated with forward foreign currency contracts include failure of the Counterparty to meet the terms of the contract and the value of the foreign currency changing unfavorably. These risks may be in excess of the amounts reflected in the Statement of Assets and Liabilities.
NOTE 2—Advisory Fees and Other Fees Paid to Affiliates
The Trust has entered into a master investment advisory agreement with Invesco Advisers, Inc. (the “Adviser” or “Invesco”). Under the terms of the investment advisory agreement, the Fund pays an advisory fee to the Adviser based on the annual rate of the Fund’s average daily net assets as follows:
| | | | | | |
| Average Daily Net Assets | | Rate |
First $250 million | | | 0 | .935% | | |
Next $250 million | | | 0 | .91% | | |
Next $500 million | | | 0 | .885% | | |
Next $1.5 billion | | | 0 | .86% | | |
Next $2.5 billion | | | 0 | .835% | | |
Next $2.5 billion | | | 0 | .81% | | |
Next $2.5 billion | | | 0 | .785% | | |
Over $10 billion | | | 0 | .76% | | |
For the year ended October 31, 2015, the effective advisory fees incurred by the Fund was 0.87%.
Under the terms of a master sub-advisory agreement between the Adviser and each of Invesco Asset Management Deutschland GmbH, Invesco Asset Management Limited, Invesco Asset Management (Japan) Limited, Invesco Hong Kong Limited, Invesco Senior Secured Management, Inc. and Invesco Canada Ltd. (collectively, the “Affiliated Sub-Advisers”) the Adviser, not the Fund, may pay 40% of the fees paid to the Adviser to any such Affiliated Sub-Adviser(s) that provide(s) discretionary investment management services to the Fund based on the percentage of assets allocated to such Affiliated Sub-Adviser(s).
The Adviser has contractually agreed, through at least June 30, 2016, to waive advisory fees and/or reimburse expenses to the extent necessary to limit total annual fund operating expenses after fee waivers and/or reimbursements (excluding certain items discussed below) of Class A, Class B, Class C, Class Y, Class R5 and Class R6 shares to 2.25%, 3.00%, 3.00%, 2.00%, 2.00% and 2.00% of average daily net assets, respectively. In determining the Adviser’s obligation to waive advisory fees and/or reimburse expenses, the following expenses are not taken into account, and could cause total annual fund operating expenses to exceed the numbers reflected above: (1) interest; (2) taxes; (3) dividend expense on short sales; (4) extraordinary or non-routine items, including litigation expenses; and (5) expenses that the Fund has incurred but did not actually pay because of an expense offset arrangement. Unless Invesco continues the fee waiver agreement, it will terminate on June 30, 2016. The fee waiver agreement cannot be terminated during its term. The Adviser did not waive fees and/or reimburse expenses during the period under this expense limitation.
Further, the Adviser has contractually agreed, through at least June 30, 2017, to waive the advisory fee payable by the Fund in an amount equal to 100% of the net advisory fees the Adviser receives from the affiliated money market funds on investments by the Fund of uninvested cash in such affiliated money market funds.
For the year ended October 31, 2015, the Adviser waived advisory fees of $312,001.
The Trust has entered into a master administrative services agreement with Invesco pursuant to which the Fund has agreed to pay Invesco for certain administrative costs incurred in providing accounting services to the Fund. For the year ended October 31, 2015, expenses incurred under the agreement are shown in the Statement of Operations as Administrative services fees.
The Trust has entered into a transfer agency and service agreement with Invesco Investment Services, Inc. (“IIS”) pursuant to which the Fund has agreed to pay IIS a fee for providing transfer agency and shareholder services to the Fund and reimburse IIS for certain expenses incurred by IIS in the course of providing such services. IIS may make payments to intermediaries that provide omnibus account services, sub-accounting services and/or networking services. All fees payable by IIS to intermediaries that provide omnibus account services or sub-accounting are charged back to the Fund, subject to certain limitations approved by the Trust’s Board of Trustees. For the year ended October 31, 2015, expenses incurred under the agreement are shown in the Statement of Operations as Transfer agent fees.
The Trust has entered into master distribution agreements with Invesco Distributors, Inc. (“IDI”) to serve as the distributor for the Class A, Class B, Class C, Class Y, Class R5 and Class R6 shares of the Fund. The Trust has adopted plans pursuant to Rule 12b-1 under the 1940 Act with respect to the Fund’s Class A, Class B and Class C shares (collectively, the “Plans”). The Fund, pursuant to the Plans, pays IDI compensation at the annual rate of 0.25% of the Fund’s average daily net assets of Class A shares and 1.00% of the average daily net assets of Class B and Class C shares. Of the Plan payments, up to 0.25% of the average daily net assets of each class of shares may be paid to furnish continuing personal shareholder services to customers who purchase and own shares of such classes. Any amounts not paid as a service fee under the Plans would constitute an asset-based sales charge. Rules of the Financial Industry Regulatory Authority (“FINRA”) impose a cap on the total sales charges, including asset-based sales charges, that may be paid by any class of shares of the Fund. For the year ended October 31, 2015, expenses incurred under the Plans are shown in the Statement of Operations as Distribution fees.
Front-end sales commissions and CDSC (collectively, the “sales charges”) are not recorded as expenses of the Fund. Front-end sales commissions are deducted from proceeds from the sales of Fund shares prior to investment in Class A shares of the Fund. CDSC are deducted from redemption proceeds prior to remittance to the shareholder. During the year ended October 31, 2015, IDI advised the Fund that IDI retained $25,668 in front-end sales commissions from the sale of Class A shares and $2,459, $12,406 and $3,386 from Class A, Class B and Class C shares, respectively, for CDSC imposed on redemptions by shareholders.
Certain officers and trustees of the Trust are officers and directors of the Adviser, IIS and/or IDI.
16 Invesco Developing Markets Fund
NOTE 3—Additional Valuation Information
GAAP defines fair value as the price that would be received to sell an asset or paid to transfer a liability in an orderly transaction between market participants at the measurement date, under current market conditions. GAAP establishes a hierarchy that prioritizes the inputs to valuation methods, giving the highest priority to readily available unadjusted quoted prices in an active market for identical assets (Level 1) and the lowest priority to significant unobservable inputs (Level 3), generally when market prices are not readily available or are unreliable. Based on the valuation inputs, the securities or other investments are tiered into one of three levels. Changes in valuation methods may result in transfers in or out of an investment’s assigned level:
| | Level 1 — | Prices are determined using quoted prices in an active market for identical assets. |
| | Level 2 — | Prices are determined using other significant observable inputs. Observable inputs are inputs that other market participants may use in pricing a security. These may include quoted prices for similar securities, interest rates, prepayment speeds, credit risk, yield curves, loss severities, default rates, discount rates, volatilities and others. |
| | Level 3 — | Prices are determined using significant unobservable inputs. In situations where quoted prices or observable inputs are unavailable (for example, when there is little or no market activity for an investment at the end of the period), unobservable inputs may be used. Unobservable inputs reflect the Fund’s own assumptions about the factors market participants would use in determining fair value of the securities or instruments and would be based on the best available information. |
The following is a summary of the tiered valuation input levels, as of October 31, 2015. The level assigned to the securities valuations may not be an indication of the risk or liquidity associated with investing in those securities. Because of the inherent uncertainties of valuation, the values reflected in the financial statements may materially differ from the value received upon actual sale of those investments.
During the year ended October 31, 2015, there were transfers from Level 1 to Level 2 of $323,038,199 and from Level 2 to Level 1 of $143,904,146, due to foreign fair value adjustments.
| | | | | | | | | | | | | | | | |
| | | Level 1 | | | Level 2 | | | Level 3 | | | Total | |
Brazil | | $ | 383,241,635 | | | $ | — | | | $ | — | | | $ | 383,241,635 | |
China | | | 165,269,275 | | | | 341,852,762 | | | | — | | | | 507,122,037 | |
Egypt | | | 6,936,957 | | | | — | | | | — | | | | 6,936,957 | |
France | | | 26,914,332 | | | | — | | | | — | | | | 26,914,332 | |
Hong Kong | | | — | | | | 77,289,835 | | | | — | | | | 77,289,835 | |
Hungary | | | 55,998,736 | | | | — | | | | — | | | | 55,998,736 | |
Indonesia | | | — | | | | 130,522,232 | | | | — | | | | 130,522,232 | |
Israel | | | 73,523,608 | | | | — | | | | — | | | | 73,523,608 | |
Malaysia | | | — | | | | 47,057,055 | | | | — | | | | 47,057,055 | |
Mexico | | | 194,943,485 | | | | — | | | | — | | | | 194,943,485 | |
Nigeria | | | 38,922,360 | | | | — | | | | — | | | | 38,922,360 | |
Peru | | | 57,818,682 | | | | — | | | | — | | | | 57,818,682 | |
Philippines | | | — | | | | 116,094,439 | | | | — | | | | 116,094,439 | |
Poland | | | — | | | | 22,860,662 | | | | — | | | | 22,860,662 | |
Russia | | | 65,202,294 | | | | 91,227,467 | | | | — | | | | 156,429,761 | |
South Africa | | | — | | | | 13,169,207 | | | | — | | | | 13,169,207 | |
South Korea | | | — | | | | 98,078,172 | | | | — | | | | 98,078,172 | |
Taiwan | | | — | | | | 66,430,345 | | | | — | | | | 66,430,345 | |
Thailand | | | 82,128,293 | | | | 19,708,168 | | | | — | | | | 101,836,461 | |
Turkey | | | 64,129,633 | | | | 74,286,146 | | | | — | | | | 138,415,779 | |
United States | | | 119,937,475 | | | | — | | | | — | | | | 119,937,475 | |
Total Investments | | $ | 1,334,966,765 | | | $ | 1,098,576,490 | | | $ | — | | | $ | 2,433,543,255 | |
NOTE 4—Investments in Other Affiliates
The 1940 Act defines an “affiliated person” as an issuance in which a fund holds 5% or more of the outstanding voting securities. The Fund has not owned enough of the outstanding voting securities of the issuer to have control (as defined in the 1940 Act) of that issuer. The following is a summary of the investments in other affiliates for the year ended October 31, 2015.
| | | | | | | | | | | | | | | | | | | | | | | | | | | | |
| | | Value 10/31/14 | | | Purchases
at Cost | | | Proceeds
from Sales | | | Change in
Unrealized
Appreciation
(Depreciation) | | | Realized
Gain (Loss) | | | Value 10/31/15 | | | Dividend
Income | |
Fleury S.A. | | $ | 57,697,280 | | | $ | — | | | $ | — | | | $ | (20,695,832 | ) | | $ | — | | | $ | 37,001,448 | | | $ | 2,415,212 | |
17 Invesco Developing Markets Fund
NOTE 5—Expense Offset Arrangement(s)
The expense offset arrangement is comprised of transfer agency credits which result from balances in demand deposit accounts used by the transfer agent for clearing shareholder transactions. For the year ended October 31, 2015, the Fund received credits from this arrangement, which resulted in the reduction of the Fund’s total expenses of $4,524.
NOTE 6—Trustees’ and Officers’ Fees and Benefits
Trustees’ and Officers’ Fees and Benefits include amounts accrued by the Fund to pay remuneration to certain Trustees and Officers of the Fund. Trustees have the option to defer compensation payable by the Fund, and Trustees’ and Officers’ Fees and Benefits also include amounts accrued by the Fund to fund such deferred compensation amounts. Those Trustees who defer compensation have the option to select various Invesco Funds in which their deferral accounts shall be deemed to be invested. Finally, certain current Trustees were eligible to participate in a retirement plan that provided for benefits to be paid upon retirement to Trustees over a period of time based on the number of years of service. The Fund may have certain former Trustees who also participate in a retirement plan and receive benefits under such plan. Trustees’ and Officers’ Fees and Benefits include amounts accrued by the Fund to fund such retirement benefits. Obligations under the deferred compensation and retirement plans represent unsecured claims against the general assets of the Fund.
NOTE 7—Cash Balances
The Fund is permitted to temporarily carry a negative or overdrawn balance in its account with State Street Bank and Trust Company, the custodian bank. Such balances, if any at period end, are shown in the Statement of Assets and Liabilities under the payable caption Amount due custodian. To compensate the custodian bank for such overdrafts, the overdrawn Fund may either (1) leave funds as a compensating balance in the account so the custodian bank can be compensated by earning the additional interest; or (2) compensate by paying the custodian bank at a rate agreed upon by the custodian bank and Invesco, not to exceed the contractually agreed upon rate.
NOTE 8—Distributions to Shareholders and Tax Components of Net Assets
Tax Character of Distributions to Shareholders Paid During the Fiscal Years Ended October 31, 2015 and 2014:
| | | | | | | | |
| | | 2015 | | | 2014 | |
Ordinary income | | $ | 44,260,569 | | | $ | 34,295,686 | |
Long-term capital gain | | | 62,165,266 | | | | 10,201,436 | |
Total distributions | | $ | 106,425,835 | | | $ | 44,497,122 | |
Tax Components of Net Assets at Period-End:
| | | | |
| | | 2015 | |
Undistributed ordinary income | | $ | 26,857,845 | |
Net unrealized appreciation (depreciation) — investments | | | (258,714,437 | ) |
Net unrealized appreciation (depreciation) — other investments | | | (317,096 | ) |
Temporary book/tax differences | | | (370,777 | ) |
Capital loss carryforward | | | (152,153,957 | ) |
Shares of beneficial interest | | | 2,824,778,757 | |
Total net assets | | $ | 2,440,080,335 | |
The difference between book-basis and tax-basis unrealized appreciation (depreciation) is due to differences in the timing of recognition of gains and losses on investments for tax and book purposes. The Fund’s net unrealized appreciation (depreciation) difference is attributable primarily to wash sales.
The temporary book/tax differences are a result of timing differences between book and tax recognition of income and/or expenses. The Fund’s temporary book/tax differences are the result of the trustee deferral of compensation and retirement plan benefits.
Capital loss carryforward is calculated and reported as of a specific date. Results of transactions and other activity after that date may affect the amount of capital loss carryforward actually available for the Fund to utilize. Capital losses generated in years beginning after December 22, 2010 can be carried forward for an unlimited period, whereas previous losses expire in eight tax years. Capital losses with an expiration period may not be used to offset capital gains until all net capital losses without an expiration date have been utilized. Capital loss carryforwards with no expiration date will retain their character as either short-term or long-term capital losses instead of as short-term capital losses as under prior law. The ability to utilize capital loss carryforwards in the future may be limited under the Internal Revenue Code and related regulations based on the results of future transactions.
The Fund has a capital loss carryforward as of October 31, 2015, which expires as follows:
| | | | | | | | | | | | |
| Capital Loss Carryforward* | |
| Expiration | | Short-Term | | | Long-Term | | | Total | |
October 31, 2017 | | $ | 69,160,296 | | | $ | — | | | $ | 69,160,296 | |
No expiration | | | 17,215,587 | | | | 65,778,074 | | | | 82,993,661 | |
| | | $ | 86,375,883 | | | $ | 65,778,074 | | | $ | 152,153,957 | |
| * | Capital loss carryforward as of the date listed above is reduced for limitations, if any, to the extent required by the Internal Revenue Code and may be further limited depending upon a variety of factors, including the realization of net unrealized gains or losses as of the date of any reorganization. |
18 Invesco Developing Markets Fund
NOTE 9—Investment Securities
The aggregate amount of investment securities (other than short-term securities, U.S. Treasury obligations and money market funds, if any) purchased and sold by the Fund during the year ended October 31, 2015 was $259,358,834 and $525,613,012, respectively. Cost of investments on a tax basis includes the adjustments for financial reporting purposes as of the most recently completed federal income tax reporting period-end.
| | | | |
| Unrealized Appreciation (Depreciation) of Investment Securities on a Tax Basis | |
Aggregate unrealized appreciation of investment securities | | $ | 367,547,057 | |
Aggregate unrealized (depreciation) of investment securities | | | (626,261,494 | ) |
Net unrealized appreciation (depreciation) of investment securities | | $ | (258,714,437 | ) |
Cost of investments for tax purposes is $2,692,257,692.
NOTE 10—Reclassification of Permanent Differences
Primarily as a result of differing book/tax treatment of foreign currency transactions and foreign capital gain taxes, on October 31, 2015, undistributed net investment income was decreased by $8,554,913 and undistributed net realized gain (loss) was increased by $8,554,913. This reclassification had no effect on the net assets of the Fund.
NOTE 11—Share Information
| | | | | | | | | | | | | | | | |
| | | Summary of Share Activity | |
| | | Years ended October 31, | |
| | | 2015(a) | | | 2014 | |
| | | Shares | | | Amount | | | Shares | | | Amount | |
Sold: | | | | | | | | | | | | | | | | |
Class A | | | 5,164,688 | | | $ | 150,282,799 | | | | 8,257,632 | | | $ | 273,541,592 | |
Class B | | | 5,133 | | | | 146,970 | | | | 10,861 | | | | 347,856 | |
Class C | | | 125,838 | | | | 3,571,339 | | | | 226,474 | | | | 7,313,496 | |
Class Y | | | 22,922,032 | | | | 689,193,614 | | | | 22,344,096 | | | | 748,475,518 | |
Class R5 | | | 4,254,113 | | | | 125,236,418 | | | | 5,637,496 | | | | 186,296,539 | |
Class R6 | | | 2,249,248 | | | | 63,230,870 | | | | 1,385,050 | | | | 46,296,571 | |
| | | | |
Issued as reinvestment of dividends: | | | | | | | | | | | | | | | | |
Class A | | | 895,102 | | | | 26,763,551 | | | | 486,238 | | | | 15,549,891 | |
Class B | | | 15,823 | | | | 462,034 | | | | 3,822 | | | | 119,198 | |
Class C | | | 78,547 | | | | 2,290,442 | | | | 13,377 | | | | 416,707 | |
Class Y | | | 935,688 | | | | 28,005,135 | | | | 424,903 | | | | 13,609,646 | |
Class R5 | | | 510,501 | | | | 15,243,554 | | | | 218,548 | | | | 6,984,793 | |
Class R6 | | | 189,444 | | | | 5,654,891 | | | | 73,819 | | | | 2,358,515 | |
| | | | |
Automatic conversion of Class B shares to Class A shares: | | | | | | | | | | | | | | | | |
Class A | | | 209,759 | | | | 6,203,277 | | | | 236,223 | | | | 7,818,467 | |
Class B | | | (215,577 | ) | | | (6,203,277 | ) | | | (243,026 | ) | | | (7,818,467 | ) |
| | | | |
Reacquired: | | | | | | | | | | | | | | | | |
Class A | | | (12,551,420 | ) | | | (375,132,199 | ) | | | (15,350,377 | ) | | | (513,322,521 | ) |
Class B | | | (163,634 | ) | | | (4,634,852 | ) | | | (239,213 | ) | | | (7,635,966 | ) |
Class C | | | (1,131,871 | ) | | | (31,939,910 | ) | | | (1,079,625 | ) | | | (34,395,449 | ) |
Class Y | | | (27,825,234 | ) | | | (790,193,060 | ) | | | (13,596,039 | ) | | | (449,130,514 | ) |
Class R5 | | | (11,400,501 | ) | | | (340,552,082 | ) | | | (4,914,751 | ) | | | (163,144,289 | ) |
Class R6 | | | (757,305 | ) | | | (22,511,571 | ) | | | (631,854 | ) | | | (21,588,882 | ) |
Net increase (decrease) in share activity | | | (16,489,626 | ) | | $ | (454,882,057 | ) | | | 3,263,654 | | | $ | 112,092,701 | |
| (a) | There are entities that are record owners of more than 5% of the outstanding shares of the Fund and in the aggregate own 46% of the outstanding shares of the Fund. IDI has an agreement with these entities to sell Fund shares. The Fund, Invesco and/or Invesco affiliates may make payments to these entities, which are considered to be related to the Fund, for providing services to the Fund, Invesco and/or Invesco affiliates including but not limited to services such as securities brokerage, distribution, third party record keeping and account servicing. The Fund has no knowledge as to whether all or any portion of the shares owned of record by these entities are also owned beneficially. |
| | In addition, 6% of the outstanding shares of the Fund are owned by affiliated mutual funds. Affiliated mutual funds are other mutual funds that are also advised by Invesco. |
19 Invesco Developing Markets Fund
NOTE 12—Financial Highlights
The following schedule presents financial highlights for a share of the Fund outstanding throughout the periods indicated.
| | | | | | | | | | | | | | | | | | | | | | | | | | | | | | | | | | | | | | | | | | | | | | | | | | | | | | | | |
| | | Net asset
value,
beginning
of period | | | Net
investment
income(a) | | | Net gains
(losses)
on securities
(both
realized and
unrealized)(b) | | | Total from
investment
operations | | | Dividends
from net
investment
income | | | Distributions
from net
realized
gains | | | Total
distributions | | | Net asset
value, end
of period | | | Total
return(c) | | | Net assets,
end of period
(000’s omitted) | | | Ratio of
expenses
to average
net assets
with fee waivers
and/or expenses
absorbed | | | Ratio of
expenses
to average net
assets without
fee waivers
and/or expenses
absorbed | | | Ratio of net
investment
income
to average
net assets | | | Portfolio
turnover(d) | |
Class A | |
Year ended 10/31/15 | | $ | 33.77 | | | $ | 0.28 | | | $ | (7.32 | ) | | $ | (7.04 | ) | | $ | (0.33 | ) | | $ | (0.56 | ) | | $ | (0.89 | ) | | $ | 25.84 | | | | (21.20 | )% | | $ | 795,042 | | | | 1.43 | %(e) | | | 1.44 | %(e) | | | 0.96 | %(e) | | | 9 | % |
Year ended 10/31/14 | | | 34.42 | | | | 0.38 | | | | (0.65 | ) | | | (0.27 | ) | | | (0.28 | ) | | | (0.10 | ) | | | (0.38 | ) | | | 33.77 | | | | (0.73 | ) | | | 1,251,018 | | | | 1.39 | | | | 1.41 | | | | 1.13 | | | | 13 | |
Year ended 10/31/13 | | | 32.70 | | | | 0.30 | | | | 1.66 | | | | 1.96 | | | | (0.24 | ) | | | — | | | | (0.24 | ) | | | 34.42 | | | | 6.03 | | | | 1,494,412 | | | | 1.38 | | | | 1.40 | | | | 0.89 | | | | 14 | |
Year ended 10/31/12 | | | 30.38 | | | | 0.29 | | | | 2.86 | | | | 3.15 | | | | (0.23 | ) | | | (0.60 | ) | | | (0.83 | ) | | | 32.70 | | | | 10.72 | | | | 1,371,476 | | | | 1.44 | | | | 1.45 | | | | 0.93 | | | | 19 | |
Year ended 10/31/11 | | | 33.15 | | | | 0.36 | | | | (2.87 | ) | | | (2.51 | ) | | | (0.23 | ) | | | (0.03 | ) | | | (0.26 | ) | | | 30.38 | | | | (7.62 | ) | | | 1,388,008 | | | | 1.45 | | | | 1.47 | | | | 1.11 | | | | 17 | |
Class B | | | | | | | | | | | | | | | | | | | | | | | | | | | | | | | | | | | | | | | | | | | | | | | | | | | | | | | | |
Year ended 10/31/15 | | | 32.72 | | | | 0.06 | | | | (7.11 | ) | | | (7.05 | ) | | | (0.05 | ) | | | (0.56 | ) | | | (0.61 | ) | | | 25.06 | | | | (21.80 | ) | | | 12,710 | | | | 2.18 | (e) | | | 2.19 | (e) | | | 0.21 | (e) | | | 9 | |
Year ended 10/31/14 | | | 33.31 | | | | 0.12 | | | | (0.61 | ) | | | (0.49 | ) | | | (0.00 | ) | | | (0.10 | ) | | | (0.10 | ) | | | 32.72 | | | | (1.46 | ) | | | 28,314 | | | | 2.14 | | | | 2.16 | | | | 0.38 | | | | 13 | |
Year ended 10/31/13 | | | 31.66 | | | | 0.04 | | | | 1.61 | | | | 1.65 | | | | — | | | | — | | | | — | | | | 33.31 | | | | 5.21 | | | | 44,403 | | | | 2.13 | | | | 2.15 | | | | 0.14 | | | | 14 | |
Year ended 10/31/12 | | | 29.42 | | | | 0.06 | | | | 2.78 | | | | 2.84 | | | | — | | | | (0.60 | ) | | | (0.60 | ) | | | 31.66 | | | | 9.89 | | | | 59,539 | | | | 2.19 | | | | 2.20 | | | | 0.18 | | | | 19 | |
Year ended 10/31/11 | | | 32.16 | | | | 0.11 | | | | (2.78 | ) | | | (2.67 | ) | | | (0.04 | ) | | | (0.03 | ) | | | (0.07 | ) | | | 29.42 | | | | (8.30 | ) | | | 71,066 | | | | 2.20 | | | | 2.22 | | | | 0.36 | | | | 17 | |
Class C | | | | | | | | | | | | | | | | | | | | | | | | | | | | | | | | | | | | | | | | | | | | | | | | | | | | | | | | |
Year ended 10/31/15 | | | 32.68 | | | | 0.06 | | | | (7.10 | ) | | | (7.04 | ) | | | (0.05 | ) | | | (0.56 | ) | | | (0.61 | ) | | | 25.03 | | | | (21.80 | ) | | | 82,395 | | | | 2.18 | (e) | | | 2.19 | (e) | | | 0.21 | (e) | | | 9 | |
Year ended 10/31/14 | | | 33.27 | | | | 0.12 | | | | (0.61 | ) | | | (0.49 | ) | | | (0.00 | ) | | | (0.10 | ) | | | (0.10 | ) | | | 32.68 | | | | (1.47 | ) | | | 137,867 | | | | 2.14 | | | | 2.16 | | | | 0.38 | | | | 13 | |
Year ended 10/31/13 | | | 31.62 | | | | 0.04 | | | | 1.61 | | | | 1.65 | | | | — | | | | — | | | | — | | | | 33.27 | | | | 5.22 | | | | 168,313 | | | | 2.13 | | | | 2.15 | | | | 0.14 | | | | 14 | |
Year ended 10/31/12 | | | 29.38 | | | | 0.06 | | | | 2.78 | | | | 2.84 | | | | — | | | | (0.60 | ) | | | (0.60 | ) | | | 31.62 | | | | 9.90 | | | | 189,142 | | | | 2.19 | | | | 2.20 | | | | 0.18 | | | | 19 | |
Year ended 10/31/11 | | | 32.12 | | | | 0.11 | | | | (2.78 | ) | | | (2.67 | ) | | | (0.04 | ) | | | (0.03 | ) | | | (0.07 | ) | | | 29.38 | | | | (8.31 | ) | | | 213,879 | | | | 2.20 | | | | 2.22 | | | | 0.36 | | | | 17 | |
Class Y | | | | | | | | | | | | | | | | | | | | | | | | | | | | | | | | | | | | | | | | | | | | | | | | | | | | | | | | |
Year ended 10/31/15 | | | 33.90 | | | | 0.36 | | | | (7.35 | ) | | | (6.99 | ) | | | (0.43 | ) | | | (0.56 | ) | | | (0.99 | ) | | | 25.92 | | | | (21.00 | ) | | | 1,016,382 | | | | 1.18 | (e) | | | 1.19 | (e) | | | 1.21 | (e) | | | 9 | |
Year ended 10/31/14 | | | 34.55 | | | | 0.46 | | | | (0.64 | ) | | | (0.18 | ) | | | (0.37 | ) | | | (0.10 | ) | | | (0.47 | ) | | | 33.90 | | | | (0.47 | ) | | | 1,463,586 | | | | 1.14 | | | | 1.16 | | | | 1.38 | | | | 13 | |
Year ended 10/31/13 | | | 32.83 | | | | 0.38 | | | | 1.66 | | | | 2.04 | | | | (0.32 | ) | | | — | | | | (0.32 | ) | | | 34.55 | | | | 6.27 | | | | 1,175,003 | | | | 1.13 | | | | 1.15 | | | | 1.14 | | | | 14 | |
Year ended 10/31/12 | | | 30.50 | | | | 0.37 | | | | 2.87 | | | | 3.24 | | | | (0.31 | ) | | | (0.60 | ) | | | (0.91 | ) | | | 32.83 | | | | 11.01 | | | | 729,007 | | | | 1.19 | | | | 1.20 | | | | 1.18 | | | | 19 | |
Year ended 10/31/11 | | | 33.26 | | | | 0.44 | | | | (2.88 | ) | | | (2.44 | ) | | | (0.29 | ) | | | (0.03 | ) | | | (0.32 | ) | | | 30.50 | | | | (7.39 | ) | | | 364,320 | | | | 1.20 | | | | 1.22 | | | | 1.36 | | | | 17 | |
Class R5 | | | | | | | | | | | | | | | | | | | | | | | | | | | | | | | | | | | | | | | | | | | | | | | | | | | | | | | | |
Year ended 10/31/15 | | | 33.87 | | | | 0.40 | | | | (7.33 | ) | | | (6.93 | ) | | | (0.48 | ) | | | (0.56 | ) | | | (1.04 | ) | | | 25.90 | | | | (20.87 | ) | | | 352,779 | | | | 1.03 | (e) | | | 1.04 | (e) | | | 1.36 | (e) | | | 9 | |
Year ended 10/31/14 | | | 34.52 | | | | 0.51 | | | | (0.66 | ) | | | (0.15 | ) | | | (0.40 | ) | | | (0.10 | ) | | | (0.50 | ) | | | 33.87 | | | | (0.35 | ) | | | 686,180 | | | | 0.99 | | | | 1.01 | | | | 1.53 | | | | 13 | |
Year ended 10/31/13 | | | 32.80 | | | | 0.42 | | | | 1.67 | | | | 2.09 | | | | (0.37 | ) | | | — | | | | (0.37 | ) | | | 34.52 | | | | 6.43 | | | | 666,769 | | | | 1.01 | | | | 1.03 | | | | 1.26 | | | | 14 | |
Year ended 10/31/12 | | | 30.48 | | | | 0.42 | | | | 2.86 | | | | 3.28 | | | | (0.36 | ) | | | (0.60 | ) | | | (0.96 | ) | | | 32.80 | | | | 11.19 | | | | 513,884 | | | | 1.03 | | | | 1.04 | | | | 1.34 | | | | 19 | |
Year ended 10/31/11 | | | 33.22 | | | | 0.49 | | | | (2.87 | ) | | | (2.38 | ) | | | (0.33 | ) | | | (0.03 | ) | | | (0.36 | ) | | | 30.48 | | | | (7.24 | ) | | | 472,161 | | | | 1.02 | | | | 1.04 | | | | 1.54 | | | | 17 | |
Class R6 | | | | | | | | | | | | | | | | | | | | | | | | | | | | | | | | | | | | | | | | | | | | | | | | | | | | | | | | |
Year ended 10/31/15 | | | 33.87 | | | | 0.41 | | | | (7.33 | ) | | | (6.92 | ) | | | (0.49 | ) | | | (0.56 | ) | | | (1.05 | ) | | | 25.90 | | | | (20.84 | ) | | | 180,773 | | | | 1.00 | (e) | | | 1.01 | (e) | | | 1.39 | (e) | | | 9 | |
Year ended 10/31/14 | | | 34.52 | | | | 0.52 | | | | (0.65 | ) | | | (0.13 | ) | | | (0.42 | ) | | | (0.10 | ) | | | (0.52 | ) | | | 33.87 | | | | (0.31 | ) | | | 179,467 | | | | 0.97 | | | | 0.99 | | | | 1.55 | | | | 13 | |
Year ended 10/31/13 | | | 32.81 | | | | 0.44 | | | | 1.66 | | | | 2.10 | | | | (0.39 | ) | | | — | | | | (0.39 | ) | | | 34.52 | | | | 6.46 | | | | 154,375 | | | | 0.97 | | | | 0.99 | | | | 1.30 | | | | 14 | |
Year ended 10/31/12(f) | | | 32.73 | | | | 0.05 | | | | 0.03 | | | | 0.08 | | | | — | | | | — | | | | — | | | | 32.81 | | | | 0.24 | | | | 122,749 | | | | 0.96 | (g) | | | 0.98 | (g) | | | 1.41 | (g) | | | 19 | |
| (a) | Calculated using average shares outstanding. |
| (b) | Includes redemption fees added to shares of beneficial interest for Class A, Class B, Class C, Class Y and Class R5 shares, which were less than $0.005 per share for the fiscal years ended October 31, 2012 and prior. |
| (c) | Includes adjustments in accordance with accounting principles generally accepted in the United States of America and as such, the net asset value for financial reporting purposes and the returns based upon those net asset values may differ from the net asset value and returns for shareholder transactions. Does not include sales charges and is not annualized for periods less than one year, if applicable. |
| (d) | Portfolio turnover is calculated at the fund level and is not annualized for periods less than one year, if applicable. For the year ended October 31, 2011, the portfolio turnover calculation excludes the value of securities purchased of $179,562,130 and sold of $23,686,059 in the effort to realign the Fund’s portfolio holdings after the reorganization of Invesco Van Kampen Emerging Markets Fund into the Fund. |
| (e) | Ratios are based on average daily net assets (000’s omitted) of $976,008, $19,837, $108,392, $1,338,805, $525,309 and $174,684 for Class A, Class B, Class C, Class Y, Class R5 and Class R6 shares, respectively. |
| (f) | Commencement date of September 24, 2012. |
20 Invesco Developing Markets Fund
Report of Independent Registered Public Accounting Firm
To the Board of Trustees of AIM Investment Funds (Invesco Investment Funds)
and Shareholders of Invesco Developing Markets Fund:
In our opinion, the accompanying statement of assets and liabilities, including the schedule of investments, and the related statements of operations and of changes in net assets and the financial highlights present fairly, in all material respects, the financial position of Invesco Developing Markets Fund (one of the funds constituting AIM Investment Funds (Invesco Investment Funds), hereafter referred to as the “Fund”) at October 31, 2015, the results of its operations for the year then ended, the changes in its net assets for each of the two years in the period then ended and the financial highlights for each of the five years in the period then ended, in conformity with accounting principles generally accepted in the United States of America. These financial statements and financial highlights (hereafter referred to as “financial statements”) are the responsibility of the Fund’s management. Our responsibility is to express an opinion on these financial statements based on our audits. We conducted our audits of these financial statements in accordance with the standards of the Public Company Accounting Oversight Board (United States). Those standards require that we plan and perform the audit to obtain reasonable assurance about whether the financial statements are free of material misstatement. An audit includes examining, on a test basis, evidence supporting the amounts and disclosures in the financial statements, assessing the accounting principles used and significant estimates made by management, and evaluating the overall financial statement presentation. We believe that our audits, which included confirmation of securities at October 31, 2015 by correspondence with the custodian, provide a reasonable basis for our opinion.
PRICEWATERHOUSECOOPERS LLP
December 23, 2015
Houston, Texas
21 Invesco Developing Markets Fund
Calculating your ongoing Fund expenses
Example
As a shareholder of the Fund, you incur two types of costs: (1) transaction costs, which may include sales charges (loads) on purchase payments or contingent deferred sales charges on redemptions, if any; and (2) ongoing costs, including management fees, distribution and/or service (12b-1) fees, and other Fund expenses. This example is intended to help you understand your ongoing costs (in dollars) of investing in the Fund and to compare these costs with ongoing costs of investing in other mutual funds. The example is based on an investment of $1,000 invested at the beginning of the period and held for the entire period May 1, 2015 through October 31, 2015.
Actual expenses
The table below provides information about actual account values and actual expenses. You may use the information in this table, together with the amount you invested, to estimate the expenses that you paid over the period. Simply divide your account value by $1,000 (for example, an $8,600 account value divided by $1,000 = 8.6), then multiply the result by the number in the table under the heading entitled “Actual Expenses Paid During Period” to estimate the expenses you paid on your account during this period.
Hypothetical example for comparison purposes
The table below also provides information about hypothetical account values and hypothetical expenses based on the Fund’s actual expense ratio and an assumed rate of return of 5% per year before expenses, which is not the Fund’s actual return.
The hypothetical account values and expenses may not be used to estimate the actual ending account balance or expenses you paid for the period. You may use this information to compare the ongoing costs of investing in the Fund and other funds. To do so, compare this 5% hypothetical example with the 5% hypothetical examples that appear in the shareholder reports of the other funds.
Please note that the expenses shown in the table are meant to highlight your ongoing costs only and do not reflect any transaction costs, such as sales charges (loads) on purchase payments or contingent deferred sales charges on redemptions, if any. Therefore, the hypothetical information is useful in comparing ongoing costs only, and will not help you determine the relative total costs of owning different funds. In addition, if these transaction costs were included, your costs would have been higher.
| | | | | | | | | | | | | | | | | | | | | | | | |
| Class | | Beginning
Account Value
(05/01/15) | | | ACTUAL | | | HYPOTHETICAL
(5% annual return before
expenses) | | | Annualized
Expense
Ratio | |
| | | Ending
Account Value
(10/31/15)1 | | | Expenses
Paid During
Period2 | | | Ending
Account Value
(10/31/15) | | | Expenses
Paid During
Period2 | | |
| A | | $ | 1,000.00 | | | $ | 832.00 | | | $ | 6.60 | | | $ | 1,018.00 | | | $ | 7.27 | | | | 1.43 | % |
| B | | | 1,000.00 | | | | 828.80 | | | | 10.05 | | | | 1,014.22 | | | | 11.07 | | | | 2.18 | |
| C | | | 1,000.00 | | | | 828.90 | | | | 10.05 | | | | 1,014.22 | | | | 11.07 | | | | 2.18 | |
| Y | | | 1,000.00 | | | | 832.90 | | | | 5.45 | | | | 1,019.26 | | | | 6.01 | | | | 1.18 | |
| R5 | | | 1,000.00 | | | | 833.30 | | | | 4.76 | | | | 1,020.01 | | | | 5.24 | | | | 1.03 | |
| R6 | | | 1,000.00 | | | | 833.90 | | | | 4.62 | | | | 1,020.16 | | | | 5.09 | | | | 1.00 | |
| 1 | The actual ending account value is based on the actual total return of the Fund for the period May 1, 2015 through October 31, 2015, after actual expenses and will differ from the hypothetical ending account value which is based on the Fund’s expense ratio and a hypothetical annual return of 5% before expenses. |
| 2 | Expenses are equal to the Fund’s annualized expense ratio as indicated above multiplied by the average account value over the period, multiplied by 184/365 to reflect the most recent fiscal half year. |
22 Invesco Developing Markets Fund
Approval of Investment Advisory and Sub-Advisory Contracts
The Board of Trustees (the Board) of AIM Investment Funds (Invesco Investment Funds) is required under the Investment Company Act of 1940, as amended, to approve annually the renewal of Invesco Developing Markets Fund’s (the Fund) investment advisory agreements. During contract renewal meetings held on June 9-10, 2015, the Board as a whole, and the disinterested or “independent” Trustees, who comprise over 75% of the Board, voting separately, approved the continuance for the Fund of the Master Investment Advisory Agreement with Invesco Advisers, Inc. (Invesco Advisers and the investment advisory agreement) and the Master Intergroup Sub-Advisory Contract for Mutual Funds with Invesco Asset Management Deutschland GmbH, Invesco Asset Management Limited, Invesco Asset Management (Japan) Limited, Invesco Hong Kong Limited, Invesco Senior Secured Management, Inc. and Invesco Canada Ltd. (collectively, the Affiliated Sub-Advisers and the sub-advisory contracts) for another year, effective July 1, 2015.
In evaluating the fairness and reasonableness of compensation under the Fund’s investment advisory agreement and sub-advisory contracts, the Board considered, among other things, the factors discussed below. The Board determined that continuation of the Fund’s investment advisory agreement and the sub-advisory contracts is in the best interest of the Fund and its shareholders and that the compensation payable to Invesco Advisers and the Affiliated Sub-Advisers under the agreements is fair and reasonable.
The Board’s Fund Evaluation Process
The Board’s Investments Committee has established three Sub-Committees, each of which is primarily responsible for overseeing the performance and investment management services provided by Invesco Advisers and the Affiliated Sub-Advisers to a number of the funds advised by Invesco Advisers (the Invesco Funds). The Sub-Committees meet throughout the year to review the performance of their assigned Invesco Funds, including reviewing materials prepared under the direction of the independent Senior Officer, an officer of the Invesco Funds who reports directly to the independent Trustees. Over the course of each year, the Sub-Committees meet with portfolio managers for their assigned Invesco Funds and other members of management to review the performance, investment objective(s), policies, strategies, limitations and investment risks of these funds. The Board had the benefit of reports from the Sub-Committees and Investments Committee throughout the year in considering approval of the continuance of each Invesco Fund’s investment advisory agreement and sub-advisory contracts for another year.
During the contract renewal process, the Board receives comparative performance and fee data regarding the Invesco Funds prepared by Invesco Advisers and Lipper Inc. (Lipper), an independent provider of investment company data. The Board also receives a report and this independent written evaluation from the Senior Officer. The Senior Officer’s evaluation is prepared as part of his responsibility to manage the process by which the Invesco Funds’ proposed management fees are negotiated during the annual contract renewal process to ensure they are negotiated in a manner that is at arms’ length and reasonable. In addition to meetings with Invesco Advisers and fund counsel, the independent Trustees also discuss the continuance of the investment advisory agreement and sub-advisory contracts in separate sessions with the Senior Officer and with independent legal counsel.
The Trustees recognized that the advisory fee rates for the Invesco Funds are, in many cases, the result of years of review and negotiation. The Trustees’ deliberations and conclusions in a particular year may be based in part on their deliberations and conclusions regarding these arrangements throughout the year and in prior years. The Trustees’ review and conclusions are based on the comprehensive consideration of all information presented to them and are not the result of any single determinative factor. Moreover, one Trustee may have weighed a particular piece of information or factor differently than another Trustee.
The discussion below is a summary of the Senior Officer’s independent written evaluation with respect to the Fund’s investment advisory agreement as well as a discussion of the material factors and related conclusions that formed the basis for the Board’s approval of the Fund’s investment advisory agreement and sub-advisory contracts. Unless otherwise stated, this information is current as of June 10, 2015, and does not reflect consideration of factors that became known to the Board after that date.
Factors and Conclusions and Summary of Independent Written Fee Evaluation
| A. | Nature, Extent and Quality of Services Provided by Invesco Advisers and the Affiliated Sub-Advisers |
The Board reviewed the advisory services provided to the Fund by Invesco Advisers under the Fund’s investment advisory agreement, the performance of Invesco Advisers in providing these services, and the credentials and experience of the officers and employees of Invesco Advisers who provide these services, including the Fund’s portfolio manager or managers. The Board’s review of the qualifications of Invesco Advisers to provide advisory services included the Board’s consideration of Invesco Advisers’ investment
process oversight, independent credit analysis and investment risk management. The Board also considered non-advisory services that Invesco Advisers and its affiliates provide to the Invesco Funds such as various back office support functions, equity and fixed income trading operations, internal audit, distribution, valuation and legal and compliance.
In determining whether to continue the Fund’s investment advisory agreement, the Board considered the benefits of reapproving an existing relationship and the greater uncertainty that may be associated with entering into a new relationship. The Board concluded that the nature, extent and quality of the services provided to the Fund by Invesco Advisers are appropriate and satisfactory and consistent with the terms of the Fund’s investment advisory agreement.
The Board reviewed the services that may be provided by the Affiliated Sub-Advisers under the sub-advisory contracts and the credentials and experience of the officers and employees of the Affiliated Sub-Advisers who provide these services. The Board noted that the Affiliated Sub-Advisers have offices and personnel that are located in financial centers around the world. As a result, the Affiliated Sub-Advisers can provide research and investment analysis on the markets and economies of various countries in which the Fund may invest, make recommendations regarding securities and assist with security trades. The Board concluded that the sub-advisory contracts benefit the Fund and its shareholders by permitting Invesco Advisers to use the resources and talents of the Affiliated Sub-Advisers in managing the Fund. The Board concluded that the nature, extent and quality of the services that may be provided by the Affiliated Sub-Advisers are appropriate and satisfactory and consistent with the terms of the Fund’s sub-advisory contracts.
The Board considered Fund performance as a relevant factor in considering whether to approve the investment advisory agreement. The Board did not view Fund performance as a relevant factor in considering whether to approve the sub-advisory contracts for the Fund, as no Affiliated Sub-Adviser currently manages assets of the Fund.
The Board compared the Fund’s performance during the past one, three and five calendar years to the performance of funds in the Lipper performance universe and against the Lipper Emerging Markets Funds Index. The Board noted that performance of Class A shares of the Fund was in the third quintile of its performance universe for the one and three year periods and the second quintile for the five year period (the first quintile being the best performing funds and the fifth quintile being the worst performing funds). The Board noted that performance of Class A shares of the Fund was below the
23 Invesco Developing Markets Fund
performance of the Index for the one and three year periods and above the performance of the Index for the five year period. The Trustees also reviewed more recent Fund performance and this review did not change their conclusions.
| C. | Advisory and Sub-Advisory Fees |
The Board compared the Fund’s contractual management fee rate to the contractual management fee rates of funds in the Fund’s Lipper expense group at a common asset level. The Board noted that the contractual management fee rate for Class A shares of the Fund was below the median contractual management fee rate of funds in its expense group. The Board noted that the term “contractual management fee” may include both advisory and certain administrative services fees, but that Lipper does not provide information on a fund by fund basis as to what is included. The Board noted that Invesco Advisers does not charge the Invesco Funds for the administrative services included in the term as defined by Lipper. The Board also reviewed the methodology used by Lipper in providing expense group information, which includes using each fund’s contractual management fee schedule (including any applicable breakpoints) as reported in the most recent prospectus or statement of additional information for each fund in the expense group.
The Board also compared the Fund’s effective advisory fee rate (the advisory fee rate after advisory fee waivers and before other expense limitations/waivers) to the effective advisory fee rates of other mutual funds advised by Invesco Advisers and its affiliates with investment strategies comparable to those of the Fund. The Board noted that the Fund’s rate was below the rate of one such mutual fund.
The Board noted that Invesco Advisers and the Affiliated Sub-Advisers do not manage other client accounts with investment strategies comparable to those of the Fund.
The Board also considered the services that may be provided by the Affiliated Sub-Advisers pursuant to the sub-advisory contracts, as well as the fees payable by Invesco Advisers to the Affiliated Sub-Advisers pursuant to the sub-advisory contracts. The Board also noted that the sub-advisory fees are not paid directly by the Fund, but rather, are payable by Invesco Advisers to the Affiliated Sub-Advisers.
| D. | Economies of Scale and Breakpoints |
The Board considered the extent to which there are economies of scale in the provision of advisory services to the Fund. The Board also considered whether the Fund benefits from economies of scale through contractual breakpoints in the Fund’s advisory fee schedule. The Board also noted that the Fund shares directly in economies of scale through lower fees charged by third party service providers based on the combined size of the Invesco Funds and other clients advised by Invesco Advisers.
| E. | Profitability and Financial Resources |
The Board reviewed information from Invesco Advisers concerning the costs of the advisory
and other services that Invesco Advisers and its affiliates provide to the Fund and the Invesco Funds and the profitability of Invesco Advisers and its affiliates in providing these services. The Board received information from Invesco Advisers about the methodology used to prepare the profitability information. The Board noted that Invesco Advisers continues to operate at a net profit from services Invesco Advisers and its affiliates provide to the Invesco Funds and the Fund. The Board did not deem the level of profits realized by Invesco Advisers and its affiliates from providing services to the Fund to be excessive given the nature, quality and extent of the services provided. The Board received and accepted information from Invesco Advisers demonstrating that Invesco Advisers and each Affiliated Sub-Adviser are financially sound and have the resources necessary to perform their obligations under the investment advisory agreement and sub-advisory contracts.
| F. | Collateral Benefits to Invesco Advisers and its Affiliates |
The Board considered various other benefits received by Invesco Advisers and its affiliates from the relationship with the Fund, including the fees received for providing transfer agency and distribution services to the Fund. The Board considered comparative information regarding fees charged for these services, including information provided by Lipper and other independent sources. The Board considered the performance of Invesco Advisers and its affiliates in providing these services and the organizational structure employed to provide these services. The Board also considered that these services are provided to the Fund pursuant to written contracts that are reviewed and approved on an annual basis by the Board; and that the services are required for the operation of the Fund.
The Board considered the benefits realized by Invesco Advisers and the Affiliated Sub-Advisers as a result of portfolio brokerage transactions executed through “soft dollar” arrangements. The Board noted that soft dollar arrangements shift the payment obligation for research services from Invesco Advisers and the Affiliated Sub-Advisers to the Invesco Funds and that the research received may be used with other clients of Invesco Advisers and may reduce Invesco Advisers’ and the Affiliated Sub-Advisers’ expenses. The Board also considered that it receives periodic reports from the Chief Compliance Officer of the Invesco Funds demonstrating that these arrangements are consistent with regulatory requirements. The Board did not deem the soft dollar arrangements to be inappropriate.
The Board considered that the Fund’s uninvested cash and cash collateral from any securities lending arrangements may be invested in money market funds advised by Invesco Advisers pursuant to procedures approved by the Board. The Board noted that Invesco Advisers receives advisory fees from these affiliated money market funds attributable to such investments, although
Invesco Advisers has contractually agreed to waive through varying periods the advisory fees payable by the Invesco Funds with respect to investments in the affiliated money market funds. The waiver is in an amount equal to 100% of the net advisory fee Invesco Advisers receives from the affiliated money market funds with respect to the Fund’s investment in the affiliated money market funds of uninvested cash, but not cash collateral. The Board concluded that the amount of advisory fees received by Invesco Advisors from the Fund’s investment of cash collateral from any securities lending arrangements in the affiliated money market funds is fair and reasonable.
The Board also considered the Fund may use an affiliated broker to execute certain trades for the Fund to, among other things, control information leakage, and were advised that such trades would be executed in compliance with rules under the Investment Company Act of 1940, as amended, and consistent with best execution obligations.
24 Invesco Developing Markets Fund
Tax Information
Form 1099-DIV, Form 1042-S and other year–end tax information provide shareholders with actual calendar year amounts that should be included in their tax returns. Shareholders should consult their tax advisors.
The following distribution information is being provided as required by the Internal Revenue Code or to meet a specific state’s requirement.
The Fund designates the following amounts or, if subsequently determined to be different, the maximum amount allowable for its fiscal year ended October 31, 2015:
| | | | |
Federal and State Income Tax | |
Long-Term Capital Gain Distributions | | $ | 62,165,266 | |
Qualified Dividend Income* | | | 100.00 | % |
Corporate Dividends Received Deduction* | | | 0.00 | % |
U.S. Treasury Obligations* | | | 0.00 | % |
| | * | The above percentages are based on ordinary income dividends paid to shareholders during the Fund’s fiscal year. |
25 Invesco Developing Markets Fund
Trustees and Officers
The address of each trustee and officer is AIM Investment Funds (Invesco Investment Funds) (the “Trust”), 11 Greenway Plaza, Suite 1000, Houston, Texas 77046-1173. The trustees serve for the life of the Trust, subject to their earlier death, incapacitation, resignation, retirement or removal as more specifically provided in the Trust’s organizational documents. Each officer serves for a one year term or until their successors are elected and qualified. Column two below includes length of time served with predecessor entities, if any.
| | | | | | | | |
Name, Year of Birth and
Position(s) Held with the Trust | | Trustee and/
or Officer Since | | Principal Occupation(s)
During Past 5 Years | | Number of Funds in Fund Complex Overseen by Trustee | | Other Directorship(s) Held by Trustee During Past 5 Years |
| Interested Persons | | | | | | | | |
| Martin L. Flanagan1 — 1960 Trustee | | 2007 | | Executive Director, Chief Executive Officer and President, Invesco Ltd. (ultimate parent of Invesco and a global investment management firm); Advisor to the Board, Invesco Advisers, Inc. (formerly known as Invesco Institutional (N.A.), Inc.); Trustee, The Invesco Funds; Vice Chair, Investment Company Institute; and Member of Executive Board, SMU Cox School of Business Formerly: Chairman and Chief Executive Officer, Invesco Advisers, Inc. (registered investment adviser); Director, Chairman, Chief Executive Officer and President, IVZ Inc. (holding company), INVESCO Group Services, Inc. (service provider) and Invesco North American Holdings, Inc. (holding company); Director, Chief Executive Officer and President, Invesco Holding Company Limited (parent of Invesco and a global investment management firm); Director, Invesco Ltd.; Chairman, Investment Company Institute and President, Co-Chief Executive Officer, Co-President, Chief Operating Officer and Chief Financial Officer, Franklin Resources, Inc. (global investment management organization). | | 145 | | None |
Philip A. Taylor2 — 1954
Trustee, President and Principal Executive Officer | | 2006 | | Head of North American Retail and Senior Managing Director, Invesco Ltd.; Director, Co-Chairman, Co-President and Co-Chief Executive Officer, Invesco Advisers, Inc. (formerly known as Invesco Institutional (N.A.), Inc.) (registered investment adviser); Director, Chairman, Chief Executive Officer and President, Invesco Management Group, Inc. (formerly known as Invesco Aim Management Group, Inc.) (financial services holding company); Director and President, INVESCO Funds Group, Inc. (registered investment adviser and registered transfer agent); Director and Chairman, Invesco Investment Services, Inc. (formerly known as Invesco Aim Investment Services, Inc.) (registered transfer agent) and IVZ Distributors, Inc. (formerly known as INVESCO Distributors, Inc.) (registered broker dealer); Chief Executive Officer, Invesco Corporate Class Inc. (corporate mutual fund company) Director, Chairman and Chief Executive Officer, Invesco Canada Ltd. (formerly known as Invesco Trimark Ltd./Invesco Trimark Ltèe) (registered investment adviser and registered transfer agent); Trustee, President and Principal Executive Officer, The Invesco Funds (other than AIM Treasurer’s Series Trust (Invesco Treasurer’s Series Trust), Short-Term Investments Trust and Invesco Management Trust); Trustee and Executive Vice President, The Invesco Funds (AIM Treasurer’s Series Trust (Invesco Treasurer’s Series Trust), Short-Term Investments Trust and Invesco Management Trust only); Director, Invesco Investment Advisers LLC (formerly known as Van Kampen Asset Management); Director, Chief Executive Officer and President, Van Kampen Exchange Corp. Formerly: Director, President and Chairman, Invesco Inc. (holding company), Invesco Canada Holdings Inc. (holding company), Trimark Investments Ltd./Placements Trimark Ltèe and Invesco Financial Services Ltd/Services Financiers Invesco Ltèe; Chief Executive Officer, Invesco Canada Fund Inc (corporate mutual fund company); Director and Chairman, Van Kampen Investor Services Inc.; Director, Chief Executive Officer and President, 1371 Preferred Inc. (holding company) and Van Kampen Investments Inc.; Director and President, AIM GP Canada Inc. (general partner for limited partnerships) and Van Kampen Advisors, Inc.; Director and Chief Executive Officer, Invesco Trimark Dealer Inc. (registered broker dealer); Director, Invesco Distributors, Inc. (formerly known as Invesco Aim Distributors, Inc.) (registered broker dealer); Manager, Invesco PowerShares Capital Management LLC; Director, Chief Executive Officer and President, Invesco Advisers, Inc.; Director, Chairman, Chief Executive Officer and President, Invesco Aim Capital Management, Inc.; President, Invesco Trimark Dealer Inc. and Invesco Trimark Ltd./Invesco Trimark Ltèe; Director and President, AIM Trimark Corporate Class Inc. and AIM Trimark Canada Fund Inc.; Senior Managing Director, Invesco Holding Company Limited; Director and Chairman, Fund Management Company (former registered broker dealer); President and Principal Executive Officer, The Invesco Funds (AIM Treasurer’s Series Trust (Invesco Treasurer’s Series Trust), and Short-Term Investments Trust only); President, AIM Trimark Global Fund Inc. and AIM Trimark Canada Fund Inc.. | | 145 | | None |
| 1 | Mr. Flanagan is considered an interested person (within the meaning of Section 2(a)(19) of the 1940 Act) of the Trust because he is an officer of the Adviser to the Trust, and an officer and a director of Invesco Ltd., ultimate parent of the Adviser. |
| 2 | Mr. Taylor is considered an interested person (within the meaning of Section 2(a)(19) of the 1940 Act) of the Trust because he is an officer and a director of the Adviser. |
T-1 Invesco Developing Markets Fund
Trustees and Officers—(continued)
| | | | | | | | |
Name, Year of Birth and Position(s) Held with the Trust | | Trustee and/ or Officer Since | | Principal Occupation(s) During Past 5 Years | | Number of Funds in Fund Complex Overseen by Trustee | | Other Directorship(s) Held by Trustee During Past 5 Years |
| Independent Trustees | | | | | | | | |
Bruce L. Crockett — 1944 Trustee and Chair | | 2003 | | Chairman, Crockett Technologies Associates (technology consulting company) Formerly: Director, Captaris (unified messaging provider); Director, President and Chief Executive Officer, COMSAT Corporation; Chairman, Board of Governors of INTELSAT (international communications company); ACE Limited (insurance company); Independent Directors Council and Investment Company Institute | | 145 | | ALPS (Attorneys Liability Protection Society) (insurance company) and Globe Specialty Metals, Inc. (metallurgical company) |
David C. Arch — 1945 Trustee | | 2010 | | Chairman of Blistex Inc., a consumer health care products manufacturer | | 145 | | Board member of the Illinois Manufacturers’ Association; Member of the Board of Visitors, Institute for the Humanities, University of Michigan; Member of the Audit Committee of the Edward-Elmhurst Hospital |
James T. Bunch — 1942 Trustee | | 2000 | | Managing Member, Grumman Hill Group LLC (family office/private equity investments) Formerly: Founder, Green Manning & Bunch Ltd. (investment banking firm) (1988-2010); Executive Committee, United States Golf Association; and Chairman, Board of Governors, Western Golf Association | | 145 | | Chairman of the Board of Trustees, Evans Scholars Foundation; and Chairman of the Board, Denver Film Society |
Rodney F. Dammeyer — 1940 Trustee | | 2010 | | Chairman of CAC, LLC, (private company offering capital investment and management advisory services) Formerly: Prior to 2001, Managing Partner at Equity Group Corporate Investments; Prior to 1995, Chief Executive Officer of Itel Corporation (formerly Anixter International); Prior to 1985, experience includes Senior Vice President and Chief Financial Officer of Household International, Inc., Executive Vice President and Chief Financial Officer of Northwest Industries, Inc. and Partner of Arthur Andersen & Co.; From 1987 to 2010, Director/Trustee of investment companies in the Van Kampen Funds complex | | 145 | | Director of Quidel Corporation and Stericycle, Inc. |
Albert R. Dowden — 1941 Trustee | | 2003 | | Director of a number of public and private business corporations, including the Boss Group, Ltd. (private investment and management); Nature’s Sunshine Products, Inc. and Reich & Tang Funds (5 portfolios) (registered investment company) Formerly: Director, Homeowners of America Holding Corporation/Homeowners of America Insurance Company (property casualty company); Director, Continental Energy Services, LLC (oil and gas pipeline service); Director, CompuDyne Corporation (provider of product and services to the public security market) and Director, Annuity and Life Re (Holdings), Ltd. (reinsurance company); Director, President and Chief Executive Officer, Volvo Group North America, Inc.; Senior Vice President, AB Volvo; Director of various public and private corporations; Chairman, DHJ Media, Inc.; Director, Magellan Insurance Company; and Director, The Hertz Corporation, Genmar Corporation (boat manufacturer), National Media Corporation; Advisory Board of Rotary Power International (designer, manufacturer, and seller of rotary power engines); and Chairman, Cortland Trust, Inc. (registered investment company) | | 145 | | Director of: Nature’s Sunshine Products, Inc., Reich & Tang Funds, Homeowners of America Holding Corporation/ Homeowners of America Insurance Company, the Boss Group |
Jack M. Fields — 1952 Trustee | | 2003 | | Chief Executive Officer, Twenty First Century Group, Inc. (government affairs company); Owner and Chief Executive Officer, Dos Angeles Ranch, L.P. (cattle, hunting, corporate entertainment); and Discovery Global Education Fund (non-profit) Formerly: Chief Executive Officer, Texana Timber LP (sustainable forestry company); Director of Cross Timbers Quail Research Ranch (non-profit); and member of the U.S. House of Representatives | | 145 | | Insperity, Inc. (formerly known as Administaff) |
Prema Mathai-Davis — 1950 Trustee | | 2003 | | Retired. Formerly: Chief Executive Officer, YWCA of the U.S.A. | | 145 | | None |
Larry Soll — 1942 Trustee | | 1997 | | Retired. Formerly: Chairman, Chief Executive Officer and President, Synergen Corp. (a biotechnology company) | | 145 | | None |
Hugo F. Sonnenschein — 1940 Trustee | | 2010 | | President Emeritus and Honorary Trustee of the University of Chicago and the Adam Smith Distinguished Service Professor in the Department of Economics at the University of Chicago. Prior to 2000, President of the University of Chicago | | 145 | | Trustee of the University of Rochester and a member of its investment committee; Member of the National Academy of Sciences and the American Philosophical Society; Fellow of the American Academy of Arts and Sciences |
Raymond Stickel, Jr. — 1944 Trustee | | 2005 | | Retired. Formerly: Director, Mainstay VP Series Funds, Inc. (25 portfolios) and Partner, Deloitte & Touche | | 145 | | None |
T-2 Invesco Developing Markets Fund
Trustees and Officers—(continued)
| | | | | | | | |
Name, Year of Birth and Position(s) Held with the Trust | | Trustee and/ or Officer Since | | Principal Occupation(s) During Past 5 Years | | Number of Funds in Fund Complex Overseen by Trustee | | Other Directorship(s) Held by Trustee During Past 5 Years |
| Independent Trustees—(continued) |
Suzanne H. Woolsey — 1941 Trustee | | 2014 | | Chief Executive Officer of Woolsey Partners LLC | | 145 | | Emeritus Chair of the Board of Trustees of the Institute for Defense Analyses; Trustee of Colorado College; Trustee of California Institute of Technology; Prior to 2014, Director of Fluor Corp.; Prior to 2010, Trustee of the German Marshall Fund of the United States; Prior to 2010 Trustee of the Rocky Mountain Institute |
| Other Officers | | | | | | | | |
Russell C. Burk — 1958
Senior Vice President and Senior Officer | | 2005 | | Senior Vice President and Senior Officer, The Invesco Funds | | N/A | | N/A |
John M. Zerr — 1962
Senior Vice President, Chief Legal Officer and Secretary | | 2006 | | Director, Senior Vice President, Secretary and General Counsel, Invesco Management Group, Inc. (formerly known as Invesco Aim Management Group, Inc.) and Van Kampen Exchange Corp.; Senior Vice President, Invesco Advisers, Inc. (formerly known as Invesco Institutional (N.A.), Inc.) (registered investment adviser); Senior Vice President and Secretary, Invesco Distributors, Inc. (formerly known as Invesco Aim Distributors, Inc.); Director, Vice President and Secretary, Invesco Investment Services, Inc. (formerly known as Invesco Aim Investment Services, Inc.) and IVZ Distributors, Inc. (formerly known as INVESCO Distributors, Inc.); Director and Vice President, INVESCO Funds Group, Inc.; Senior Vice President, Chief Legal Officer and Secretary, The Invesco Funds; Managing Director, Invesco PowerShares Capital Management LLC; Director, Secretary and General Counsel, Invesco Investment Advisers LLC (formerly known as Van Kampen Asset Management); Secretary and General Counsel, Invesco Capital Markets, Inc. (formerly known as Van Kampen Funds Inc.) and Chief Legal Officer, PowerShares Exchange-Traded Fund Trust, PowerShares Exchange-Traded Fund Trust II, PowerShares India Exchange-Traded Fund Trust, PowerShares Actively Managed Exchange-Traded Fund Trust, and PowerShares Actively Managed Exchange-Traded Commodity Fund Trust Formerly: Director and Vice President, Van Kampen Advisors Inc.; Director, Vice President, Secretary and General Counsel, Van Kampen Investor Services Inc.; Director, Invesco Distributors, Inc. (formerly known as Invesco Aim Distributors, Inc.); Director, Senior Vice President, General Counsel and Secretary, Invesco Aim Advisers, Inc. and Van Kampen Investments Inc.; Director, Vice President and Secretary, Fund Management Company; Director, Senior Vice President, Secretary, General Counsel and Vice President, Invesco Aim Capital Management, Inc.; Chief Operating Officer and General Counsel, Liberty Ridge Capital, Inc. (an investment adviser); Vice President and Secretary, PBHG Funds (an investment company) and PBHG Insurance Series Fund (an investment company); Chief Operating Officer, General Counsel and Secretary, Old Mutual Investment Partners (a broker-dealer); General Counsel and Secretary, Old Mutual Fund Services (an administrator) and Old Mutual Shareholder Services (a shareholder servicing center); Executive Vice President, General Counsel and Secretary, Old Mutual Capital, Inc. (an investment adviser); and Vice President and Secretary, Old Mutual Advisors Funds (an investment company) | | N/A | | N/A |
Sheri Morris — 1964
Vice President, Treasurer and Principal Financial Officer | | 2003 | | Vice President, Treasurer and Principal Financial Officer, The Invesco Funds; Vice President, Invesco Advisers, Inc. (formerly known as Invesco Institutional (N.A.), Inc.) (registered investment adviser); and Vice President, PowerShares Exchange-Traded Fund Trust, PowerShares Exchange-Traded Fund Trust II, PowerShares India Exchange-Traded Fund Trust, PowerShares Actively Managed Exchange-Traded Fund Trust, and PowerShares Actively Managed Exchange-Traded Commodity Fund Trust Formerly: Vice President, Invesco Aim Advisers, Inc., Invesco Aim Capital Management, Inc. and Invesco Aim Private Asset Management, Inc.; Assistant Vice President and Assistant Treasurer, The Invesco Funds and Assistant Vice President, Invesco Advisers, Inc., Invesco Aim Capital Management, Inc. and Invesco Aim Private Asset Management, Inc.; and Treasurer, PowerShares Exchange-Traded Fund Trust, PowerShares Exchange-Traded Fund Trust II, PowerShares India Exchange-Traded Fund Trust and PowerShares Actively Managed Exchange-Traded Fund Trust | | N/A | | N/A |
T-3 Invesco Developing Markets Fund
Trustees and Officers—(continued)
| | | | | | | | |
Name, Year of Birth and
Position(s) Held with the Trust | | Trustee and/
or Officer Since | | Principal Occupation(s)
During Past 5 Years | | Number of Funds in Fund Complex Overseen by Trustee | | Other Directorship(s) Held by Trustee During Past 5 Years |
| Other Officers—(continued) | | | | | | | | |
Karen Dunn Kelley — 1960
Vice President | | 2003 | | Senior Managing Director, Investments, Invesco Ltd.; Director, Co-President, Co-Chief Executive Officer, and Co-Chairman, Invesco Advisers, Inc. (formerly known as Invesco Institutional (N.A.), Inc.) (registered investment adviser); Chairman, Invesco Senior Secured Management, Inc.; Senior Vice President, Invesco Management Group, Inc. (formerly known as Invesco Aim Management Group, Inc.); Executive Vice President, Invesco Distributors, Inc. (formerly known as Invesco Aim Distributors, Inc.); Director, Invesco Mortgage Capital Inc. and Invesco Management Company Limited; Vice President, The Invesco Funds (other than AIM Treasurer’s Series Trust (Invesco Treasurer’s Series Trust), Short-Term Investments Trust and Invesco Management Trust); and President and Principal Executive Officer, The Invesco Funds (AIM Treasurer’s Series Trust (Invesco Treasurer’s Series Trust), Short-Term Investments Trust and Invesco Management Trust only) Formerly: Director and President, INVESCO Asset Management (Bermuda) Ltd., Director, INVESCO Global Asset Management Limited and INVESCO Management S.A.; Senior Vice President, Van Kampen Investments Inc. and Invesco Advisers, Inc. (formerly known as Invesco Institutional (N.A.), Inc.) (registered investment adviser); Vice President, Invesco Advisers, Inc. (formerly known as Invesco Institutional (N.A.), Inc.); Director of Cash Management and Senior Vice President, Invesco Advisers, Inc. and Invesco Aim Capital Management, Inc.; Director and President, Fund Management Company; Chief Cash Management Officer, Director of Cash Management, Senior Vice President, and Managing Director, Invesco Aim Capital Management, Inc.; Director of Cash Management, Senior Vice President, and Vice President, Invesco Advisers, Inc. and The Invesco Funds (AIM Treasurer’s Series Trust (Invesco Treasurer’s Series Trust), and Short-Term Investments Trust only) | | N/A | | N/A |
Crissie M. Wisdom — 1969 Anti-Money Laundering Compliance Officer | | 2013 | | Anti-Money Laundering Compliance Officer, Invesco Advisers, Inc. (formerly known as Invesco Institutional (N.A.), Inc.) (registered investment adviser), Invesco Capital Markets, Inc. (formerly known as Van Kampen Funds Inc.), Invesco Distributors, Inc., Invesco Investment Services, Inc., Invesco Management Group, Inc., Van Kampen Exchange Corp., The Invesco Funds, and PowerShares Exchange-Traded Fund Trust, PowerShares Exchange-Traded Fund Trust II, PowerShares India Exchange-Traded Fund Trust, PowerShares Actively Managed Exchange-Traded Fund Trust and PowerShares Actively Managed Exchange-Traded Commodity Fund Trust; Anti-Money Laundering Compliance Officer and Bank Secrecy Act Officer, INVESCO National Trust Company and Invesco Trust Company; and Fraud Prevention Manager and Controls and Risk Analysis Manager for Invesco Investment Services, Inc. | | N/A | | N/A |
Lisa O. Brinkley — 1959 Chief Compliance Officer | | 2015 | | Senior Vice President and Chief Compliance Officer, Invesco Advisers, Inc. (registered investment adviser) (formerly known as Invesco Institutional (N.A., Inc.); and Chief Compliance Officer, The Invesco Funds Formerly: Global Assurance Officer, Invesco Ltd. and Vice President, The Invesco Funds; Chief Compliance Officer, Invesco Distributors, Inc. (formerly known as Invesco Aim Distributors, Inc.), Invesco Investment Services, Inc. (formerly known as Invesco Aim Investment Services, Inc.) and Van Kampen Investor Services Inc.; Senior Vice President, Invesco Management Group, Inc.; Senior Vice President and Chief Compliance Officer, Invesco Advisers, Inc. and The Invesco Funds; Vice President and Chief Compliance Officer, Invesco Aim Capital Management, Inc. and Invesco Distributors, Inc.; Vice President, Invesco Investment Services, Inc. and Fund Management Company. | | N/A | | N/A |
The Statement of Additional Information of the Trust includes additional information about the Fund’s Trustees and is available upon request, without charge, by calling 1.800.959.4246. Please refer to the Fund’s prospectus for information on the Fund’s sub-advisers.
| | | | | | |
Office of the Fund 11 Greenway Plaza, Suite 1000 Houston, TX 77046-1173 | | Investment Adviser Invesco Advisers, Inc. 1555 Peachtree Street, N.E. Atlanta, GA 30309 | | Distributor
Invesco Distributors, Inc. 11 Greenway Plaza, Suite 1000 Houston, TX 77046-1173 | | Auditors PricewaterhouseCoopers LLP 1000 Louisiana Street, Suite 5800 Houston, TX 77002-5678 |
| | | |
| | | | | | |
Counsel to the Fund Stradley Ronon Stevens & Young, LLP 2005 Market Street, Suite 2600 Philadelphia, PA 19103-7018 | | Counsel to the Independent Trustees Goodwin Procter LLP 901 New York Avenue, N.W. Washington, D.C. 20001 | | Transfer Agent Invesco Investment Services, Inc. 11 Greenway Plaza, Suite 1000 Houston, TX 77046-1173 | | Custodian State Street Bank and Trust Company 225 Franklin Street Boston, MA 02110-2801 |
T-4 Invesco Developing Markets Fund

Invesco mailing information
Send general correspondence to Invesco Investment Services, Inc., P.O. Box 219078, Kansas City, MO 64121-9078.
Important notice regarding delivery of security holder documents
To reduce Fund expenses, only one copy of most shareholder documents may be mailed to shareholders with multiple accounts at the same address (Householding). Mailing of your shareholder documents may be householded indefinitely unless you instruct us otherwise. If you do not want the mailing of these documents to be combined with those for other members of your household, please contact Invesco Investment Services, Inc. at 800 959 4246 or contact your financial institution. We will begin sending you individual copies for each account within 30 days after receiving your request.
Fund holdings and proxy voting information
The Fund provides a complete list of its holdings four times in each fiscal year, at the quarter ends. For the second and fourth quarters, the lists appear in the Fund’s semiannual and annual reports to shareholders. For the first and third quarters, the Fund files the lists with the Securities and Exchange Commission (SEC) on Form N-Q. The most recent list of portfolio holdings is available at invesco.com/completeqtrholdings. Shareholders can also look up the Fund’s Forms N-Q on the SEC website at sec.gov. Copies of the Fund’s Forms N-Q may be reviewed and copied at the SEC Public Reference Room in Washington, D.C. You can obtain information on the operation of the Public Reference Room, including information about duplicating fee charges, by calling 202 551 8090 or 800 732 0330, or by electronic request at the following email address: publicinfo@sec.gov. The SEC file numbers for the Fund are shown below.
A description of the policies and procedures that the Fund uses to determine how to vote proxies relating to portfolio securities is available without charge, upon request, from our Client Services department at 800 959 4246 or at invesco.com/proxyguidelines. The information is also available on the SEC website, sec.gov.
| | |
Information regarding how the Fund voted proxies related to its portfolio securities during the most recent 12-month period ended June 30 is available at invesco.com/proxysearch. The information is also available on the SEC website, sec.gov. Invesco Advisers, Inc. is an investment adviser; it provides investment advisory services to individual and institutional clients and does not sell securities. Invesco Distributors, Inc. is the US distributor for Invesco Ltd.’s retail mutual funds, exchange-traded funds and institutional money market funds. Both are wholly owned, indirect subsidiaries of Invesco Ltd. | |  |
| | | | |
| SEC file numbers: 811-05426 and 033-19338 | | DVM-AR-1 | | Invesco Distributors, Inc. |
| | | | |
| | |
 | | Annual Report to Shareholders | | October 31, 2015 |
| | |
| | Invesco Emerging Market Local Currency Debt Fund |
| | Nasdaq: |
| | A: IAEMX n B: IBEMX n C: ICEMX n R: IREMX n Y: IYEMX n R5: IIEMX n R6: IFEMX |

Letters to Shareholders
| | |

Philip Taylor | | Dear Shareholders: This annual report includes information about your Fund, including performance data and a complete list of its investments as of the close of the reporting period. Inside is a discussion of how your Fund was managed and the factors that affected its performance during the reporting period. I hope you find this report of interest. The US economy expanded and unemployment declined throughout the reporting period. Continuing low energy prices benefited consumers, but a strong US dollar crimped corporate profits. The US Federal Reserve signaled that it was increasingly likely to raise interest rates, based on generally positive economic data, but uncertainty remained about when it might act. Overseas, the story was much different. Low energy prices hurt the economies of some oil-producing nations, such as Brazil and Russia. During the reporting period, the European |
| Central Bank as well as central banks in China and Japan – among other countries – either instituted or maintained extraordinarily accommodative monetary policies in response to economic weakness. |
Investor uncertainty, such as we saw for much of the reporting period – and market volatility, such as we saw at the end of the reporting period – are unfortunate facts of life when it comes to investing. Some investors use these things as excuses to delay saving and investing for their long-term financial goals. That’s why Invesco encourages investors to work with a professional financial adviser who can stress the importance of starting to save and invest early and the importance of adhering to a disciplined investment plan – when times are good and when they’re uncertain. A financial adviser who knows your unique financial situation, investment goals and risk tolerance can be an invaluable partner as you seek to achieve your financial goals. He or she can offer a long-term perspective when markets are volatile and time-tested advice and guidance when your financial situation or investment goals change.
Timely information when and where you want it
Invesco’s efforts to help investors achieve their financial objectives include providing individual investors and financial professionals with timely information about the markets, the economy and investing – whenever and wherever they want it.
Our website, invesco.com/us, offers a wide range of market insights and investment perspectives. On the website, you’ll find detailed information about our funds, including prices, performance, holdings and portfolio manager commentaries. You can access information about your account by completing a simple, secure online registration. Click on the “Need to register” link in the “Account Access” box on our homepage to get started.
Invesco’s mobile apps for iPhone® and iPad® (both available free from the App StoreSM) allow you to obtain the same detailed information, monitor your account and create customizable watch lists. Also, they allow you to access investment insights from our investment leaders, market strategists, economists and retirement experts. You can sign up to be alerted when new commentary is added, and you can watch portfolio manager videos and have instant access to Invesco news and updates wherever you may be.
In addition to the resources accessible on our website and through our mobile app, you can obtain timely updates to help you stay informed about the markets, the economy and investing by connecting with Invesco on Twitter, LinkedIn or Facebook. You can access our blog at blog.invesco.us.com. Our goal is to provide you the information you want, when and where you want it.
Have questions?
For questions about your account, feel free to contact an Invesco client services representative at 800 959 4246. For Invesco-related questions or comments, please email me directly at phil@invesco.com.
All of us at Invesco look forward to serving your investment management needs for many years to come. Thank you for investing with us.
Sincerely,

Philip Taylor
Senior Managing Director, Invesco Ltd.
iPhone and iPad are trademarks of Apple Inc., registered in the US and other countries. App Store is a service mark of Apple Inc. Invesco Distributors, Inc. is not affiliated with Apple Inc.
2 Invesco Emerging Market Local Currency Debt Fund
| | |

Bruce Crockett | | Dear Fellow Shareholders: Among the many important lessons I’ve learned in more than 40 years in a variety of business endeavors is the value of a trusted advocate. As independent chair of the Invesco Funds Board, I can assure you that the members of the Board are strong advocates for the interests of investors in Invesco’s mutual funds. We work hard to represent your interests through oversight of the quality of the investment management services your funds receive and other matters important to your investment, including but not limited to: n Ensuring that Invesco offers a diverse lineup of mutual funds that your financial adviser can use to strive to meet your financial needs as your investment goals change over time. n Monitoring how the portfolio management teams of the Invesco funds are performing in light of changing economic and market conditions. |
| n | | Assessing each portfolio management team’s investment performance within the context of the investment strategy described in the fund’s prospectus. |
| n | | Monitoring for potential conflicts of interests that may impact the nature of the services that your funds receive. |
We believe one of the most important services we provide our fund shareholders is the annual review of the funds’ advisory and sub-advisory contracts with Invesco Advisers and its affiliates. This review is required by the Investment Company Act of 1940 and focuses on the nature and quality of the services Invesco provides as the adviser to the Invesco funds and the reasonableness of the fees that it charges for those services. Each year, we spend months carefully reviewing information received from Invesco and a variety of independent sources, such as performance and fee data prepared by Lipper Inc., an independent, third-party firm widely recognized as a leader in its field. We also meet with our independent legal counsel and other independent advisers to review and help us assess the information that we have received. Our goal is to assure that you receive quality investment management services for a reasonable fee.
I trust the measures outlined above provide assurance that you have a worthy advocate when it comes to choosing the Invesco Funds.
As always, please contact me at bruce@brucecrockett.com with any questions or concerns you may have. On behalf of the Board, we look forward to continuing to represent your interests and serving your needs.
Sincerely,

Bruce L. Crockett
Independent Chair
Invesco Funds Board of Trustees
3 Invesco Emerging Market Local Currency Debt Fund
Management’s Discussion of Fund Performance
Performance summary
For the fiscal year ended October 31, 2015, Class A shares of Invesco Emerging Market Local Currency Debt Fund (the Fund), at net asset value (NAV), outper-formed the JP Morgan Government Bond Index-Emerging Markets (GBI-EM) Global Diversified Index, the Fund’s broad market/style-specific index.
Your Fund’s long-term performance appears later in this report.
Fund vs. Indexes
Total returns, 10/31/14 to 10/31/15, at net asset value (NAV). Performance shown does not include applicable contingent deferred sales charges (CDSC) or front-end sales charges, which would have reduced performance.
| | | | |
Class A Shares | | | -16.20 | % |
Class B Shares | | | -16.72 | |
Class C Shares | | | -16.82 | |
Class R Shares | | | -16.43 | |
Class Y Shares | | | -15.99 | |
Class R5 Shares | | | -15.89 | |
Class R6 Shares | | | -15.89 | |
| JP Morgan Government Bond Index–Emerging Markets (GBI-EM) Global Diversified Indexq (Broad Market/Style-Specific Index) | | | -17.42 | |
Lipper Emerging Markets Debt Funds Indexn (Peer Group Index) | | | -5.26 | |
Source(s): qFactSet Research Systems Inc.; nLipper Inc.
Market conditions and your Fund
During the fiscal year ended October 31, 2015, emerging market local currency bonds continued to exhibit volatility. Local currency bond carry was more than offset by depreciation of bond prices and emerging market currencies versus the US dollar. Heading into the fiscal year, the emerging market local debt asset class, as measured by the Fund’s broad market/style-specific index, was yielding 6.41%,1 and for the fiscal year, it returned 3.94%1 in local currency terms. However, emerging market currencies depreciated substantially leading to a -17.42%1 fiscal year return for the Fund’s broad market/style-specific index in US dollar terms.
Emerging market local-currency bonds spent the majority of the fiscal year under pressure from a number of forces
including dollar strength, slower global growth, falling commodity prices and a rebalancing China. Returns for the asset class were negative for nine months of the fiscal year, in large part due to the currency component of performance. Over the prior decade, emerging market currencies had broadly strengthened versus the US dollar. Currency appreciation was driven by higher growth rates in emerging markets as well as low interest rates in the US following the financial crisis. As a result, emerging market local currency debt had outperformed emerging market hard currency sovereign and corporate debt over the past decade.
However, emerging markets gradually became less competitive because of their higher real exchange rates, coupled with declining productivity and increased domestic debt. Many emerging markets
developed macroeconomic imbalances as a result. Currency depreciation often serves as the escape valve for making necessary adjustments to rebalance the economy and restore economic health in emerging markets. This theme played out in large part during the fiscal year as currencies sold off significantly versus the US dollar. While the impact on returns for US dollar-based investors was clearly negative, improved currency valuations led to tighter domestic financial conditions, which in turn may reduce domestic demand and help restore macro balance for these economies.
For the reporting period, the primary contributors to the Fund’s performance versus its broad market/style-specific index were its off-index position in US dollars, its off-index position in India, and security selection in Brazil. Underweight positions in Nigera and Turkey versus the Fund’s broad market/style-specific index, and security selection in Russia and South Africa were the largest detractors from Fund performance.
As of the end of the reporting period, we were at a seeming inflection point in markets. There were initial signs of upward growth momentum for the global economy, as reflected in higher Purchasing Managers Index. Market technicals were at the same time favorable. This mix could be potentially powerful for risk markets going into year-end 2015. However at the close of the reporting period, financial conditions in many countries remained strained and we did not see confirmation of a change in trend in some markets. We therefore await confirmation of these signals before turning more directionally bullish. We continue to believe the emerging markets external adjustment – via currency depreciation – is relatively mature, whereas the
| | | | | | |
| Portfolio Composition | |
By industry | | | % of total net assets | |
| | | | |
Sovereign Debt | | | 63.0 | % |
| Diversified Banks | | | 18.3 | |
| Wireless Telecommunication Services | | | 3.6 | |
| Diversified Capital Markets | | | 2.7 | |
| Investment Banking & Brokerage | | | 2.6 | |
| Diversified REITs | | | 2.4 | |
| Independent Power Producers & Energy Traders | | | 1.5 | |
| Multi-Sector Holdings | | | 1.4 | |
| Electric Utilities | | | 0.8 | |
| Integrated Oil & Gas | | | 0.4 | |
Money Market Funds Plus Other Assets Less Liabilities | | | 3.3 | |
| | | | |
| Top 10 Debt Issuers* |
| | % of total net assets |
| | | | | | |
1. | | Standard Chartered Bank | | | 10.4 | % |
2. | | Turkey Government Bond | | | 9.5 | |
3. | | Malaysia Government Bond | | | 7.1 | |
4. | | Poland Government Bond | | | 7.0 | |
5. | | Mexican Bonos | | | 6.9 | |
6. | | South Africa Government Bond | | | 5.9 | |
7. | | Russian Federal Bond–OFZ | | | 4.5 | |
8. | | Thailand Government Bond | | | 4.4 | |
9. | | Hungary Government Bond | | | 3.8 | |
10. | | America Movil S.A.B. de C.V. | | | 3.6 | |
| | | | |
Total Net Assets | | | $46.0 million | |
| |
| Total Number of Holdings* | | | 62 | |
The Fund’s holdings are subject to change, and there is no assurance that the Fund will continue to hold any particular security.
*Excluding money market fund holdings.
Data presented here are as of October 31, 2015.
4 Invesco Emerging Market Local Currency Debt Fund
domestic adjustment – via impairment in the credit channel – is relatively nascent.
At the close of the reporting period, for local currency bonds, differentiation within the universe remained a critical consideration. We continue to favor countries with stronger credit profiles and where there is considerable risk premia and scope for further monetary policy easing. In emerging markets currencies, economic rebalancing via currency markets reached an inflection point. The significant emerging market currency depreciation that has occurred since 2011 made emerging market countries more externally competitive, and as a result, trade balances are starting to improve. This may act to stabilize emerging market currencies. However, the prospect of further capital outflows prevents us from becoming more constructive on emerging market currencies at this time. Therefore, volatility in emerging market currencies may likely persist for the time being. But as domestic economic rebalancing in emerging market countries may take place, we expect emerging market currencies may begin to stabilize. We believe this may occur as soon as the latter half of 2016.
Thank you for placing your trust in Invesco and for your investment in Invesco Emerging Market Local Currency Debt Fund.
1 Source: J.P. Morgan
The views and opinions expressed in management’s discussion of Fund performance are those of Invesco Advisers, Inc. These views and opinions are subject to change at any time based on factors such as market and economic conditions. These views and opinions may not be relied upon as investment advice or recommendations, or as an offer for a particular security. The information is not a complete analysis of every aspect of any market, country, industry, security or the Fund. Statements of fact are from sources considered reliable, but Invesco Advisers, Inc. makes no representation or warranty as to their completeness or accuracy. Although historical performance is no guarantee of future results, these insights may help you understand our investment management philosophy.
See important Fund and, if applicable, index disclosures later in this report.
| | |
 | | Avi Hooper Chartered Financial Analyst, Portfolio Manager, is manager of Invesco Emerging Market Local Currency |
| Debt Fund. He joined Invesco in 2010. Mr. Hooper earned a BAS with a focus in accounting and finance from York University. |
| |
 | | Jorge Ordonez Portfolio Manager, is manager of Invesco Emerging Market Local Currency Debt Fund. He joined Invesco in |
| 2015. Mr. Ordonez earned a BA in economics from Haverford College and an MBA with a concentration in finance from the Tuck School of Business at Dartmouth. |
| |
 | | Joseph Portera Portfolio Manager, is manager of Invesco Emerging Market Local Currency Debt Fund. |
| He joined Invesco in 2012. Mr. Portera earned BA and MA degrees in Soviet studies and an MA in international political economy and development from Fordham University. |
| |
 | | Rashique Rahman Portfolio Manager, is manager of Invesco Emerging Market Local Currency Debt Fund. |
| Mr. Rahman is the Head of Emerging Markets for Invesco Fixed Income. He joined Invesco in 2014. Mr. Rahman earned a BA in economics and political science from the University of California, Los Angeles, and an MA in international affairs, as well as an MBA, from Columbia University. |
5 Invesco Emerging Market Local Currency Debt Fund
Your Fund’s Long-Term Performance
Results of a $10,000 Investment – Oldest Share Class(es) Since Inception
Fund and index data from 6/16/10
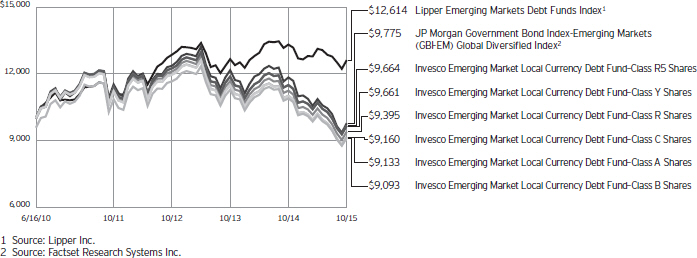
Past performance cannot guarantee comparable future results.
The data shown in the chart include reinvested distributions, applicable sales charges and Fund expenses including management fees. Results for Class B shares are calculated as if a hypothetical
shareholder had liquidated his entire investment in the Fund at the close of the reporting period and paid the contingent deferred sales charges, if applicable. Index results include reinvested dividends, but they do not reflect sales charges. Performance of the peer group,
if applicable, reflects fund expenses and management fees; performance of a market index does not. Performance shown in the chart and table(s) does not reflect deduction of taxes a shareholder would pay on Fund distributions or sale of Fund shares.
6 Invesco Emerging Market Local Currency Debt Fund
| | | | |
| Average Annual Total Returns | |
| As of 10/31/15, including maximum applicable sales charges | |
| |
Class A Shares | | | | |
Inception (6/16/10) | | | -1.67 | % |
5 Years | | | -4.15 | |
1 Year | | | -19.79 | |
| |
Class B Shares | | | | |
Inception (6/16/10) | | | -1.75 | % |
5 Years | | | -4.32 | |
1 Year | | | -20.72 | |
| |
Class C Shares | | | | |
Inception (6/16/10) | | | -1.62 | % |
5 Years | | | -4.03 | |
1 Year | | | -17.62 | |
| |
Class R Shares | | | | |
Inception (6/16/10) | | | -1.15 | % |
5 Years | | | -3.59 | |
1 Year | | | -16.43 | |
| |
Class Y Shares | | | | |
Inception (6/16/10) | | | -0.64 | % |
5 Years | | | -3.08 | |
1 Year | | | -15.99 | |
| |
Class R5 Shares | | | | |
Inception (6/16/10) | | | -0.63 | % |
5 Years | | | -3.06 | |
1 Year | | | -15.89 | |
| |
Class R6 Shares | | | | |
Inception | | | -0.74 | % |
5 Years | | | -3.17 | |
1 Year | | | -15.89 | |
Class R6 shares incepted on September 24, 2012. Performance shown prior to that date is that of Class A shares and includes the 12b-1 fees applicable to Class A shares.
The performance data quoted represent past performance and cannot guarantee comparable future results; current performance may be lower or higher. Please visit invesco.com/performance for the most recent month-end performance. Performance figures reflect reinvested distributions, changes in net asset value and the effect of the maximum sales charge unless otherwise stated. Investment return and principal value will fluctuate so that you may have a gain or loss when you sell shares.
The net annual Fund operating expense ratio set forth in the most recent Fund prospectus as of the date of this report for Class A, Class B, Class C, Class R, Class Y, Class R5 and Class R6 shares was 1.24%, 1.99%,
| | | | |
| Average Annual Total Returns | |
| As of 9/30/15, the most recent calendar quarter end, including maximum applicable sales charges | |
| |
Class A Shares | | | | |
Inception (6/16/10) | | | -2.45 | % |
5 Years | | | -4.64 | |
1 Year | | | -22.17 | |
| |
Class B Shares | | | | |
Inception (6/16/10) | | | -2.55 | % |
5 Years | | | -4.84 | |
1 Year | | | -23.26 | |
| |
Class C Shares | | | | |
Inception (6/16/10) | | | -2.39 | % |
5 Years | | | -4.53 | |
1 Year | | | -20.14 | |
| |
Class R Shares | | | | |
Inception (6/16/10) | | | -1.93 | % |
5 Years | | | -4.07 | |
1 Year | | | -18.99 | |
| |
Class Y Shares | | | | |
Inception (6/16/10) | | | -1.41 | % |
5 Years | | | -3.57 | |
1 Year | | | -18.56 | |
| |
Class R5 Shares | | | | |
Inception (6/16/10) | | | -1.41 | % |
5 Years | | | -3.56 | |
1 Year | | | -18.46 | |
| |
Class R6 Shares | | | | |
Inception | | | -1.54 | % |
5 Years | | | -3.69 | |
1 Year | | | -18.58 | |
1.99%, 1.49%, 0.99%, 0.99% and 0.99%, respectively.1 The total annual Fund operating expense ratio set forth in the most recent Fund prospectus as of the date of this report for Class A, Class B, Class C, Class R, Class Y, Class R5 and Class R6 shares was 1.84%, 2.59%, 2.59%, 2.09%, 1.59%, 1.31% and 1.30%, respectively. The expense ratios presented above may vary from the expense ratios presented in other sections of this report that are based on expenses incurred during the period covered by this report.
Class A share performance reflects the maximum 4.25% sales charge, and Class B and Class C share performance reflects the applicable contingent deferred sales charge (CDSC) for the period involved. The CDSC on Class B shares declines from 5% beginning at the time of purchase to 0% at the beginning of the seventh year. The CDSC on Class C shares is 1% for the first year after purchase. Class R, Class Y,
Class R5 and Class R6 shares do not have a front-end sales charge or a CDSC; therefore, performance is at net asset value.
The performance of the Fund’s share classes will differ primarily due to different sales charge structures and class expenses.
Fund performance reflects any applicable fee waivers and/or expense reimbursements. Had the adviser not waived fees and/or reimbursed expenses currently or in the past, returns would have been lower. See current prospectus for more information.
| 1 | Total annual Fund operating expenses after any contractual fee waivers and/or expense reimbursements by the adviser in effect through at least February 28, 2017. See current prospectus for more information. |
7 Invesco Emerging Market Local Currency Debt Fund
Invesco Emerging Market Local Currency Debt Fund’s investment objective is total return through growth of capital and current income.
| n | | Unless otherwise stated, information presented in this report is as of October 31, 2015, and is based on total net assets. |
| n | | Unless otherwise noted, all data provided by Invesco. |
| n | | To access your Fund’s reports/prospectus, visit invesco.com/fundreports. |
About share classes
| n | | Class B shares may not be purchased for new or additional investments. Please see the prospectus for more information. |
| n | | Class R shares are generally available only to employer sponsored retirement and benefit plans. Please see the prospectus for more information. |
| n | | Class Y shares are available only to certain investors. Please see the prospectus for more information. |
| n | | Class R5 shares and Class R6 shares are primarily intended for employer sponsored retirement and benefit plans that meet certain standards and for institutional investors. Please see the prospectus for more information. |
Principal risks of investing
in the Fund
| n | | Cash/cash equivalents risk. Holding cash or cash equivalents may negatively affect performance. |
| n | | Changing fixed income market conditions risk. The current low interest rate environment was created in part by the Federal Reserve Board (FRB) and certain foreign central banks keeping the federal funds and equivalent foreign rates at or near zero. There is a risk that interest rates will rise when the FRB and central banks raise these rates. This risk is heightened due to the FRB’s quantitative easing program and the “tapering” of other similar foreign central bank actions. This eventual increase in the federal funds and equivalent foreign rates may expose fixed income markets to heightened volatility and reduced liquidity for certain fixed income investments, particularly those with longer maturities. In addition, decreases in fixed income dealer market-making capacity may also potentially lead to heightened volatility and reduced liquidity in the fixed income markets. As a result, the value of the Fund’s investments and share price may decline. Changes in central bank policies could also result in higher than normal shareholder redemptions, which could potentially increase |
| | | portfolio turnover and the Fund’s transaction costs. |
| n | | Credit linked notes risk. Risks of credit linked notes include those risks associated with the underlying reference obligation including but not limited to market risk, interest rate risk, credit risk, default risk and foreign currency risk. In the case of a credit linked note created with credit default swaps, the structure will be “funded” such that the par amount of the security will represent the maximum loss that could be incurred on the investment and no leverage is introduced. An investor in a credit linked note bears counterparty risk or the risk that the issuer of the credit linked note will default or become bankrupt and not make timely payment of principal and interest of the structured security. |
| n | | Credit risk. The issuer of instruments in which the Fund invests may be unable to meet interest and/or principal payments, thereby causing its instruments to decrease in value and lowering the issuer’s credit rating. |
| n | | Currency/exchange rate risk. The dollar value of the Fund’s foreign investments will be affected by changes in the exchange rates between the dollar and the currencies in which those investments are traded. |
| n | | Derivatives risk. The value of a derivative instrument depends largely on (and is derived from) the value of an underlying security, currency, commodity, interest rate, index or other asset (each referred to as an underlying asset). In addition to risks relating to the underlying assets, the use of derivatives may include other, possibly greater, risks, including counterparty, leverage and liquidity risks. Counterparty risk is the risk that the counterparty to the derivative contract will default on its obligation to pay the Fund the amount owed or otherwise perform under the derivative contract. Derivatives create leverage risk because they do not require payment up front equal to the economic exposure created by owning the derivative. As a result, an adverse change in the value of the underlying asset could result in the Fund sustaining a loss that is |
| | | substantially greater than the amount invested in the derivative, which may make the Fund’s returns more volatile and increase the risk of loss. Derivative instruments may also be less liquid than more traditional investments and the Fund may be unable to sell or close out its derivative positions at a desirable time or price. This risk may be more acute under adverse market conditions, during which the Fund may be most in need of liquidating its derivative positions. Derivatives may also be harder to value, less tax efficient and subject to changing government regulation that could impact the Fund’s ability to use certain derivatives or their cost. Also, derivatives used for hedging or to gain or limit exposure to a particular market segment may not provide the expected benefits, particularly during adverse market conditions. |
| n | | Developing/emerging markets securities risk. The prices of securities issued by foreign companies and governments located in developing/emerging markets countries may be affected more negatively by inflation, devaluation of their currencies, higher transaction costs, delays in settlement, adverse political developments, the introduction of capital controls, withholding taxes, nationalization of private assets, expropriation, social unrest, war or lack of timely information than those in developed countries. |
| n | | Foreign currency tax risk. If the U.S. Treasury Department were to exercise its authority to issue regulations that exclude from the definition of “qualifying income” foreign currency gains not directly related to the Fund’s business of investing in securities (which it has not done since such authority was granted to it in 1986, but has the right to do at any time), the Fund may be unable to qualify as a regulated investment company for one or more years. In this event, the Fund’s Board of Trustees may authorize a significant change in investment strategy or other action. |
|
This report must be accompanied or preceded by a currently effective Fund prospectus, which contains more complete information, including sales charges and expenses. Investors should read it carefully before investing. |
|
NOT FDIC INSURED | MAY LOSE VALUE | NO BANK GUARANTEE |
8 Invesco Emerging Market Local Currency Debt Fund
| n | | Foreign securities risk. The Fund’s foreign investments may be affected by changes in a foreign country’s exchange rates, political and social instability, changes in economic or taxation policies, difficulties when enforcing obligations, decreased liquidity, and increased volatility. Foreign companies may be subject to less regulation resulting in less publicly available information about the companies. |
| n | | Geographic focus risk. From time to time an underlying fund may invest a substantial amount of its assets in securities of issuers located in a single country or a limited number of countries. If an underlying fund focuses its investments in this manner, it assumes the risk that economic, political and social conditions in those countries will have a significant impact on its investment performance. An underlying fund’s investment performance may also be more volatile if it focuses its investments in certain countries, especially emerging market countries. |
| n | | High yield bond (junk bond) risk. Junk bonds involve a greater risk of default or price changes due to changes in the credit quality of the issuer. The values of junk bonds fluctuate more than those of high- quality bonds in response to company, political, regulatory or economic developments. Values of junk bonds can decline significantly over short periods of time. |
| n | | Interest rate risk. Interest rate risk refers to the risk that bond prices generally fall as interest rates rise; conversely, bond prices generally rise as interest rates fall. Specific bonds differ in their sensitivity to changes in interest rates depending on their individual characteristics, including duration. |
| n | | Management risk. The investment techniques and risk analysis used by the Fund’s portfolio managers may not produce the desired results. |
| n | | Market risk. The prices of and the income generated by the Fund’s securities may decline in response to, among other things, investor sentiment, general economic and market conditions, regional or global instability, and currency and interest rate fluctuations. |
| n | | Non-diversification risk. The Fund is non-diversified and can invest a greater portion of its assets in a small number of issuers or a single issuer. A change in the value of the issuer could affect the value of the Fund more than if it was a diversified fund. |
| n | | Reinvestment risk. Reinvestment risk is the risk that a bond’s cash flows (coupon income and principal repayment) will be reinvested at an interest rate below that on the original bond. |
| n | | Sovereign debt risk. Investments in foreign sovereign debt obligations involve certain risks in addition to those relating to foreign securities or debt securities generally. The issuer of the debt or the governmental authorities that control the repayment of the debt may be unable or unwilling to repay principal or interest when due in accordance with the terms of such debt, and the Fund may have limited recourse in the event of a default against the defaulting government. Without the approval of debt holders, some governmental debtors have in the past been able to reschedule or restructure their debt payments or declare moratoria on payments. |
About indexes used in this report
| n | | The JP Morgan Government Bond Index-Emerging Markets (GBI-EM) Global Diversified Index is a comprehensive global local emerging markets index comprising liquid, fixed-rate domestic currency government bonds. |
| n | | The Lipper Emerging Markets Debt Funds Index is an unmanaged index considered representative of emerging market debt funds tracked by Lipper. |
| n | | The Fund is not managed to track the performance of any particular index, including the index(es) described here, and consequently, the performance of the Fund may deviate significantly from the performance of the index(es). |
| n | | A direct investment cannot be made in an index. Unless otherwise indicated, index results include reinvested dividends, and they do not reflect sales charges. Performance of the peer group, if applicable, reflects fund expenses; performance of a market index does not. |
Other information
| n | | The returns shown in management’s discussion of Fund performance are based on net asset values (NAVs) calculated for shareholder transactions. Generally accepted accounting principles require adjustments to be made to the net assets of the Fund at period end for financial reporting purposes, and as such, the NAVs for shareholder transactions and the returns based on those NAVs may differ from the NAVs and returns reported in the Financial Highlights. |
| n | | Industry classifications used in this report are generally according to the Global Industry Classification Standard, which was developed by and is the exclusive property and a service mark of MSCI Inc. and Standard & Poor’s. |
9 Invesco Emerging Market Local Currency Debt Fund
Schedule of Investments
October 31, 2015
| | | | | | | | |
| | | Principal
Amount | | | Value | |
Non U.S. Dollar Denominated Bonds & Notes–76.52%(a) | |
| Brazil–7.83% | |
Banco Safra S.A.,
Sr. Unsec. Notes, 10.25%, 08/08/16(b) | | BRL | 956,000 | | | $ | 238,095 | |
REGS, Sr. Unsec. Euro Notes, | | | | | | | | |
10.25%, 08/08/16(b) | | BRL | 680,000 | | | | 169,356 | |
Brazil Letras do Tesouro Nacional, Unsec. Bonds, 0.00%, 07/01/16(c) | | BRL | 4,600,000 | | | | 1,088,224 | |
Brazil Notas do Tesouro Nacional, | | | | | | | | |
Series F, Unsec. Notes, 10.00%, 01/01/21 | | BRL | 4,758,000 | | | | 997,834 | |
10.00%, 01/01/23 | | BRL | 200,000 | | | | 39,726 | |
Itau Unibanco Holding S.A., | | | | | | | | |
Sr. Unsec. Notes, 10.50%, 11/23/15(b) | | BRL | 1,150,000 | | | | 296,853 | |
REGS, Sr. Unsec. Euro Notes, 10.50%, 11/23/15(b) | | BRL | 2,992,000 | | | | 772,334 | |
| | | | | | | | 3,602,422 | |
|
| Colombia–5.37% | |
Colombian Titulos De Tesoreria, Class B, Sr. Unsec. Bonds, 10.00%, 07/24/24 | | COP | 478,200,000 | | | | 187,982 | |
Unsec. Bonds, 7.75%, 09/18/30 | | COP | 3,800,000,000 | | | | 1,247,067 | |
Empresas Publicas de Medellin ESP, | | | | | | | | |
Sr. Unsec. Notes, 8.38%, 02/01/21(b) | | COP | 1,000,000,000 | | | | 345,923 | |
REGS, Sr. Unsec. Euro Notes, 8.38%, 02/01/21(b) | | COP | 2,000,000,000 | | | | 691,846 | |
| | | | | | | | 2,472,818 | |
|
| Hungary–3.84% | |
Hungary Government Bond, | | | | | | | | |
Series 20/B, Unsec. Bonds, 3.50%, 06/24/20 | | HUF | 130,000,000 | | | | 481,972 | |
Series 24/B, Unsec. Bonds, 3.00%, 06/26/24 | | HUF | 130,000,000 | | | | 445,268 | |
Series 25/B, Unsec. Bonds, 5.50%, 06/24/25 | | HUF | 201,500,000 | | | | 837,990 | |
| | | | | | | | 1,765,230 | |
|
| Malaysia–7.14% | |
Malaysia Government Bond, | | | | | | | | |
Series 0111, Sr. Unsec. Bonds, 4.16%, 07/15/21 | | MYR | 5,100,000 | | | | 1,195,794 | |
Series 0112, Sr. Unsec. Bonds, 3.42%, 08/15/22 | | MYR | 2,000,000 | | | | 447,782 | |
Series 0902, Sr. Unsec. Bonds, 4.38%, 11/29/19 | | MYR | 6,900,000 | | | | 1,643,346 | |
| | | | | | | | 3,286,922 | |
| | | | | | | | |
| | | Principal
Amount | | | Value | |
| Mexico–10.53% | |
America Movil S.A.B. de C.V., Sr. Unsec. Euro Notes, 7.13%, 12/9/24 | | MXN | 27,500,000 | | | $ | 1,648,578 | |
Mexican Bonos, | | | | | | | | |
Series M, Sr. Unsec. Bonds, 7.75%, 11/13/42 | | MXN | 30,500,000 | | | | 2,076,592 | |
Series M20, Sr. Unsec. Bonds, 10.00%, 12/05/24 | | MXN | 14,451,100 | | | | 1,121,838 | |
| | | | | | | | 4,847,008 | |
|
| Peru–1.25% | |
Peruvian Government International Bond, | | | | | | | | |
Sr. Unsec. Notes, 5.70%, 08/12/24(b) | | PEN | 300,000 | | | | 84,617 | |
8.20%, 08/12/26(b) | | PEN | 1,496,000 | | | | 492,243 | |
| | | | | | | | 576,860 | |
|
| Philippines–0.46% | |
Philippine Government International Bond, Sr. Unsec. Global Bonds, 3.90%, 11/26/22 | | PHP | 10,000,000 | | | | 211,531 | |
|
| Poland–6.98% | |
Poland Government Bond, | | | | | | | | |
Series 0725, Unsec. Bonds, 3.25%, 07/25/25 | | PLN | 4,400,000 | | | | 1,196,554 | |
Series 1020, Unsec. Bonds, 5.25%, 10/25/20 | | PLN | 800,000 | | | | 237,892 | |
Series 1021, Unsec. Bonds, 5.75%, 10/25/21 | | PLN | 1,015,000 | | | | 313,633 | |
Series 1023, Unsec. Bonds, 4.00%, 10/25/23 | | PLN | 5,122,000 | | | | 1,463,126 | |
| | | | | | | | 3,211,205 | |
|
| Romania–2.07% | |
Romania Government Bond, | | | | | | | | |
Series 10Y, Unsec. Bonds, 4.75%, 02/24/25 | | RON | 1,800,000 | | | | 495,192 | |
Series 5Y, Unsec. Bonds, 5.90%, 07/26/17 | | RON | 1,700,000 | | | | 456,376 | |
| | | | | | | | 951,568 | |
|
| Russia–4.46% | |
Russian Federal Bond — OFZ, | | | | | | | | |
Series 5080, Unsec. Bonds, 7.40%, 04/19/17 | | RUB | 11,500,000 | | | | 174,162 | |
Series 6206, Unsec. Bonds, 7.40%, 06/14/17 | | RUB | 37,000,000 | | | | 557,788 | |
Series 6208, Unsec. Bonds, 7.50%, 02/27/19 | | RUB | 40,000,000 | | | | 585,371 | |
Series 6212, Unsec. Bonds, 7.05%, 01/19/28 | | RUB | 47,916,000 | | | | 606,774 | |
Series 6215, Unsec. Bonds, 7.00%, 08/16/23 | | RUB | 9,615,000 | | | | 128,487 | |
| | | | | | | | 2,052,582 | |
See accompanying Notes to Financial Statements which are an integral part of the financial statements.
10 Invesco Emerging Market Local Currency Debt Fund
| | | | | | | | |
| | | Principal
Amount | | | Value | |
| South Africa–5.90% | |
South Africa Government Bond, Series R214, Sr. Unsec. Bonds, 6.50%, 02/28/41 | | ZAR | 50,000,000 | | | $ | 2,715,228 | |
|
| Supranational–4.20% | |
European Bank for Reconstruction & Development, Sr. Unsec. Medium-Term Euro Notes, 0.00%,
12/31/18(c) | | ZAR | 5,600,000 | | | | 321,243 | |
European Investment Bank, REGS, Sr. Unsec. Medium-Term Euro Notes, 7.20%, 07/9/19(b) | | IDR | 3,080,000,000 | | | | 199,238 | |
International Bank for Reconstruction & Development, | | | | | | | | |
Sr. Unsec. Medium-Term Euro Notes, 7.00%, 06/07/23 | | ZAR | 17,000,000 | | | | 1,102,761 | |
Series GDIF, Sr. Unsec. Medium-Term Euro Notes, 7.68%, 08/10/16 | | ZAR | 4,250,000 | | | | 307,054 | |
| | | | | | | | 1,930,296 | |
|
| Thailand–4.36% | |
Thailand Government Bond, | | | | | | | | |
Sr. Unsec. Bonds, 3.65%, 12/17/21 | | THB | 43,600,000 | | | | 1,307,152 | |
3.88%, 06/13/19 | | THB | 23,290,000 | | | | 698,427 | |
| | | | | | | | 2,005,579 | |
|
| Turkey–9.48% | |
Turkey Government Bond, | | | | | | | | |
Unsec. Bonds, 7.10%, 03/08/23 | | TRY | 2,030,000 | | | | 606,090 | |
8.00%, 03/12/25 | | TRY | 1,010,000 | | | | 314,369 | |
8.20%, 11/16/16 | | TRY | 4,850,000 | | | | 1,636,850 | |
8.50%, 07/10/19 | | TRY | 499,989 | | | | 165,057 | |
8.80%, 09/27/23 | | TRY | 1,079,000 | | | | 352,870 | |
9.00%, 07/24/24 | | TRY | 1,250,000 | | | | 411,364 | |
Series 5Y, Unsec. Bonds, 6.30%, 02/14/18 | | TRY | 1,637,811 | | | | 522,419 | |
Series CPI, Unsec. Bonds, 4.00%, 04/01/20 | | TRY | 967,591 | (d) | | | 350,406 | |
| | | | | | | | 4,359,425 | |
| | |
| United States–2.65% | | | | | | | | |
Morgan Stanley, Series G, Sr. Unsec. Medium-Term Euro Notes, 8.44%, 12/28/15 | | MXN | 20,000,000 | | | | 1,217,531 | |
Total Non U.S. Dollar Denominated Bonds & Notes (Cost $44,470,880) | | | | 35,206,205 | |
|
U.S. Dollar Denominated Bonds & Notes–4.06% | |
| Argentina–1.02% | |
Argentina Bonar Bonds, Series X, Sr. Unsec. Bonds, 7.00%, 04/17/17 | | $ | 470,000 | | | | 466,841 | |
| | | | | | | | |
| | | Principal
Amount | | | Value | |
| Colombia–1.35% | |
SUAM Finance B.V., REGS, Sr. Unsec. Gtd. Euro Notes, 4.88%, 04/17/24(b) | | $ | 600,000 | | | $ | 619,500 | |
|
| Peru–1.26% | |
Peruvian Government International Bond, Sr. Unsec. Global Bonds, 4.13%, 08/25/27 | | | 574,000 | | | | 580,636 | |
|
| Russia–0.43% | |
Gazprom OAO Via Gaz Capital S.A., Sr. Unsec. Notes, 4.30%,
11/12/15(b) | | | 200,000 | | | | 199,750 | |
Total U.S. Dollar Denominated Bonds & Notes
(Cost $1,835,307) | | | | 1,866,727 | |
|
Credit-Linked Securities–16.01% | |
Barclays Bank PLC, Series FR52, Sr. Unsec. Medium-Term Euro Notes, 10.50%, 08/19/30 (Credit-Linked to Indonesia Government Bonds, 10.50%, 08/15/30)
(Cost $1,572,496) | | IDR | 13,200,000,000 | | | | 1,075,077 | |
Deutsche Bank A.G., Sr. Unsec. Medium-Term Euro Notes, 8.38%, 03/17/34 (Credit-Linked to Indonesia Government Bonds, 8.38%, 03/15/34)
(Cost $1,350,670)(b) | | IDR | 18,300,000,000 | | | | 1,250,750 | |
JP Morgan Chase Bank N.A., Unsec. Medium-Term Euro Notes, 8.25%, 06/17/32 (Credit-Linked to Indonesia Government Bonds, 8.25%, 06/15/32)
(Cost $494,363)(b) | | IDR | 4,000,000,000 | | | | 270,791 | |
Standard Chartered Bank, Sr. Unsec. Medium-Term Euro Notes, 7.80%, 05/05/20 (Credit-Linked to India Government Bonds, 7.80%, 05/03/20)
(Cost $539,040) | | INR | 33,600,000 | | | | 517,944 | |
Standard Chartered Bank, Sr. Unsec. Medium-Term Euro Notes, 8.12%, 12/14/20 (Credit-Linked to India Government Bonds, 8.12%, 12/10/20)
(Cost $666,137) | | INR | 40,000,000 | | | | 624,240 | |
Standard Chartered Bank, Sr. Unsec. Medium-Term Euro Notes, 8.28%, 09/23/27 (Credit-Linked to India Government Bonds, 8.28%, 09/21/27)
(Cost $929,244) | | INR | 58,000,000 | | | | 918,130 | |
See accompanying Notes to Financial Statements which are an integral part of the financial statements.
11 Invesco Emerging Market Local Currency Debt Fund
| | | | | | | | |
| | | Principal
Amount | | | Value | |
Standard Chartered Bank, Sr. Unsec. Medium-Term Euro Notes, 8.38%, 03/17/34 (Credit-Linked to Indonesia Government Bonds, 8.38%, 03/15/34)
(Cost $1,421,791) | | IDR | 16,304,000,000 | | | $ | 1,114,341 | |
Standard Chartered Bank, Sr. Unsec. Medium-Term Euro Notes, 8.40%, 07/30/24 (Credit-Linked to India Government Bonds, 8.40%, 07/28/24)
(Cost $1,646,306)(b) | | INR | 100,000,000 | | | | 1,593,810 | |
Total Credit-Linked Securities
(Cost $8,620,047) | | | | 7,365,083 | |
| | | | | | | | |
| | |
Shares | | | Value | |
Money Market Funds–1.57% | |
Liquid Assets Portfolio–Institutional Class, 0.16%(e) | | | 361,606 | | | $ | 361,606 | |
Premier Portfolio–Institutional Class, 0.12%(e) | | | 361,605 | | | | 361,605 | |
Total Money Market Funds
(Cost $723,211) | | | | 723,211 | |
TOTAL INVESTMENTS–98.16%
(Cost $55,649,445) | | | | 45,161,226 | |
OTHER ASSETS LESS LIABILITIES–1.84% | | | | 848,469 | |
NET ASSETS–100.00% | | | | | | $ | 46,009,695 | |
Investment Abbreviations:
| | |
| BRL | | – Brazilian Real |
| COP | | – Colombian Peso |
| CPI. | | – Consumer Price Index |
| Gtd. | | – Guaranteed |
| HUF | | – Hungary Forint |
| IDR | | – Indonesian Rupiah |
| INR | | – Indian Rupee |
| MXN | | – Mexican Peso |
| MYR | | – Malaysian Ringgit |
| PEN | | – Peru Nuevo Sol |
| PHP | | – Philippines Peso |
| PLN | | – Poland Zloty |
| REGS | | – Regulation S |
| RON | | – Romanian Leu |
| RUB | | – Russian Rouble |
| Sr. | | – Senior |
| THB | | – Thailand Baht |
| TRY | | – New Turkish Lire |
| Unsec. | | – Unsecured |
| ZAR | | – South African Rand |
Notes to Schedule of Investments:
| (a) | Foreign denominated security. Principal amount is denominated in the currency indicated. |
| (b) | Security purchased or received in a transaction exempt from registration under the Securities Act of 1933, as amended (the “1933 Act”). The security may be resold pursuant to an exemption from registration under the 1933 Act, typically to qualified institutional buyers. The aggregate value of these securities at October 31, 2015 was $7,225,106, which represented 15.70% of the Fund’s Net Assets. |
| (c) | Zero coupon bond issued at a discount. |
| (d) | Principal amount of security and interest payments are adjusted for inflation. See Note 1J. |
| (e) | The money market fund and the Fund are affiliated by having the same investment adviser. The rate shown is the 7-day SEC standardized yield as of October 31, 2015. |
See accompanying Notes to Financial Statements which are an integral part of the financial statements.
12 Invesco Emerging Market Local Currency Debt Fund
Statement of Assets and Liabilities
October 31, 2015
| | | | |
Assets: | | | | |
Investments, at value (Cost $54,926,234) | | $ | 44,438,015 | |
Investments in affiliated money market funds, at value and cost | | | 723,211 | |
Total investments, at value (Cost $55,649,445) | | | 45,161,226 | |
Foreign currencies, at value (Cost $3,219) | | | 3,046 | |
Receivable for: | | | | |
Fund shares sold | | | 963 | |
Dividends and interest | | | 860,628 | |
Investment for trustee deferred compensation and retirement plans | | | 23,305 | |
Unrealized appreciation on forward foreign currency contracts outstanding | | | 269,981 | |
Other assets | | | 23,684 | |
Total assets | | | 46,342,833 | |
|
Liabilities: | |
Payable for: | | | | |
Fund shares reacquired | | | 19,600 | |
Accrued foreign taxes | | | 16,933 | |
Accrued fees to affiliates | | | 4,812 | |
Accrued trustees’ and officers’ fees and benefits | | | 1,667 | |
Accrued other operating expenses | | | 58,354 | |
Trustee deferred compensation and retirement plans | | | 24,306 | |
Unrealized depreciation on forward foreign currency contracts outstanding | | | 207,466 | |
Total liabilities | | | 333,138 | |
Net assets applicable to shares outstanding | | $ | 46,009,695 | |
|
Net assets consist of: | |
Shares of beneficial interest | | $ | 57,549,690 | |
Undistributed net investment income | | | (261,153 | ) |
Undistributed net realized gain (loss) | | | (828,790 | ) |
Net unrealized appreciation (depreciation) | | | (10,450,052 | ) |
| | | $ | 46,009,695 | |
| | | | |
Net Assets: | |
Class A | | $ | 6,281,813 | |
Class B | | $ | 295,584 | |
Class C | | $ | 1,385,252 | |
Class R | | $ | 363,075 | |
Class Y | | $ | 303,672 | |
Class R5 | | $ | 6,925 | |
Class R6 | | $ | 37,373,374 | |
|
Shares outstanding, $0.01 par value per share,
with an unlimited number of shares authorized: | |
Class A | | | 927,228 | |
Class B | | | 43,684 | |
Class C | | | 204,498 | |
Class R | | | 53,677 | |
Class Y | | | 44,835 | |
Class R5 | | | 1,023 | |
Class R6 | | | 5,522,787 | |
Class A: | | | | |
Net asset value per share | | $ | 6.77 | |
Maximum offering price per share | | | | |
(Net asset value of $6.77 ¸ 95.75%) | | $ | 7.07 | |
Class B: | | | | |
Net asset value and offering price per share | | $ | 6.77 | |
Class C: | | | | |
Net asset value and offering price per share | | $ | 6.77 | |
Class R: | | | | |
Net asset value and offering price per share | | $ | 6.76 | |
Class Y: | | | | |
Net asset value and offering price per share | | $ | 6.77 | |
Class R5: | | | | |
Net asset value and offering price per share | | $ | 6.77 | |
Class R6: | | | | |
Net asset value and offering price per share | | $ | 6.77 | |
See accompanying Notes to Financial Statements which are an integral part of the financial statements.
13 Invesco Emerging Market Local Currency Debt Fund
Statement of Operations
For the year ended October 31, 2015
| | | | |
Investment income: | |
Interest (net of foreign withholding taxes of $1,239) | | $ | 3,313,863 | |
Dividends from affiliated money market funds | | | 1,124 | |
Total investment income | | | 3,314,987 | |
| |
Expenses: | | | | |
Advisory fees | | | 371,197 | |
Administrative services fees | | | 50,000 | |
Custodian fees | | | 41,181 | |
Distribution fees: | | | | |
Class A | | | 18,700 | |
Class B | | | 3,382 | |
Class C | | | 16,531 | |
Class R | | | 2,065 | |
Transfer agent fees — A, B, C, R and Y | | | 33,112 | |
Transfer agent fees — R5 | | | 3 | |
Transfer agent fees — R6 | | | 132 | |
Trustees’ and officers’ fees and benefits | | | 19,699 | |
Registration and filing fees | | | 83,901 | |
Professional services fees | | | 53,099 | |
Other | | | 39,695 | |
Total expenses | | | 732,697 | |
Less: Fees waived, expenses reimbursed and expense offset arrangement(s) | | | (205,835 | ) |
Net expenses | | | 526,862 | |
Net investment income | | | 2,788,125 | |
| |
Realized and unrealized gain (loss) from: | | | | |
Net realized gain (loss) from: | | | | |
Investment securities | | | (4,924,576 | ) |
Foreign currencies | | | (428,646 | ) |
Forward foreign currency contracts | | | 498,906 | |
| | | | (4,854,316 | ) |
Change in net unrealized appreciation (depreciation) of: | | | | |
Investment securities (net of foreign taxes on holdings of $3,827) | | | (6,705,700 | ) |
Foreign currencies | | | 43,232 | |
Forward foreign currency contracts | | | (11,892 | ) |
| | | | (6,674,360 | ) |
Net realized and unrealized gain (loss) | | | (11,528,676 | ) |
Net increase (decrease) in net assets resulting from operations | | $ | (8,740,551 | ) |
See accompanying Notes to Financial Statements which are an integral part of the financial statements.
14 Invesco Emerging Market Local Currency Debt Fund
Statement of Changes in Net Assets
For the years ended October 31, 2015 and 2014
| | | | | | | | |
| | | 2015 | | | 2014 | |
Operations: | | | | | | | | |
Net investment income | | $ | 2,788,125 | | | $ | 2,928,911 | |
Net realized gain (loss) | | | (4,854,316 | ) | | | (3,886,953 | ) |
Change in net unrealized appreciation (depreciation) | | | (6,674,360 | ) | | | (647,735 | ) |
Net increase (decrease) in net assets resulting from operations | | | (8,740,551 | ) | | | (1,605,777 | ) |
| | |
Distributions to shareholders from net investment income: | | | | | | | | |
Class A | | | — | | | | (94,246 | ) |
Class B | | | — | | | | (2,855 | ) |
Class C | | | — | | | | (9,449 | ) |
Class R | | | — | | | | (6,808 | ) |
Class Y | | | — | | | | (717 | ) |
Class R5 | | | — | | | | (3,164 | ) |
Class R6 | | | — | | | | (241,187 | ) |
Total distributions from net investment income | | | — | | | | (358,426 | ) |
| | |
Return of capital: | | | | | | | | |
Class A | | | (368,524 | ) | | | (337,513 | ) |
Class B | | | (14,244 | ) | | | (12,582 | ) |
Class C | | | (68,983 | ) | | | (80,754 | ) |
Class R | | | (19,363 | ) | | | (16,593 | ) |
Class Y | | | (39,924 | ) | | | (104,758 | ) |
Class R5 | | | (2,106 | ) | | | (6,694 | ) |
Class R6 | | | (2,025,139 | ) | | | (1,427,178 | ) |
Total return of capital | | | (2,538,283 | ) | | | (1,986,072 | ) |
| | |
Share transactions–net: | | | | | | | | |
Class A | | | (1,355,045 | ) | | | (2,698,730 | ) |
Class B | | | 26,014 | | | | (182,834 | ) |
Class C | | | (469,716 | ) | | | (1,043,278 | ) |
Class R | | | (2,139 | ) | | | (268,622 | ) |
Class Y | | | (2,338,926 | ) | | | 1,522,783 | |
Class R5 | | | (163,230 | ) | | | (87,031 | ) |
Class R6 | | | 6,445,058 | | | | 9,033,125 | |
Net increase in net assets resulting from share transactions | | | 2,142,016 | | | | 6,275,413 | |
Net increase (decrease) in net assets | | | (9,136,818 | ) | | | 2,325,138 | |
| | |
Net assets: | | | | | | | | |
Beginning of year | | | 55,146,513 | | | | 52,821,375 | |
End of year (includes undistributed net investment income of $(261,153) and $(19,724), respectively) | | $ | 46,009,695 | | | $ | 55,146,513 | |
Notes to Financial Statements
October 31, 2015
NOTE 1—Significant Accounting Policies
Invesco Emerging Market Local Currency Debt Fund (the “Fund”) is a series portfolio of AIM Investment Funds (Invesco Investment Funds) (the “Trust”). The Trust is organized as a Delaware statutory trust and is registered under the Investment Company Act of 1940, as amended (the “1940 Act”), as an open-end series management investment company consisting of twenty-four separate series portfolios, each authorized to issue an unlimited number of shares of beneficial interest. The assets, liabilities and operations of each portfolio are accounted for separately. Information presented in these financial statements pertains only to the Fund. Matters affecting each portfolio or class will be voted on exclusively by the shareholders of such portfolio or class.
The Fund’s investment objective is total return through growth of capital and current income.
15 Invesco Emerging Market Local Currency Debt Fund
The Fund currently consists of seven different classes of shares: Class A, Class B, Class C, Class R, Class Y, Class R5 and Class R6. Class A shares are sold with a front-end sales charge unless certain waiver criteria are met and under certain circumstances load waived shares may be subject to contingent deferred sales charges (“CDSC”). Class C shares are sold with a CDSC. Class R, Class Y, Class R5 and Class R6 shares are sold at net asset value. Effective November 30, 2010, new or additional investments in Class B shares are no longer permitted. Existing shareholders of Class B shares may continue to reinvest dividends and capital gains distributions in Class B shares until they convert to Class A shares. Also, shareholders in Class B shares will be able to exchange those shares for Class B shares of other Invesco Funds offering such shares until they convert to Class A shares. Generally, Class B shares will automatically convert to Class A shares on or about the month-end, which is at least eight years after the date of purchase. Redemption of Class B shares prior to the conversion date will be subject to a CDSC.
The following is a summary of the significant accounting policies followed by the Fund in the preparation of its financial statements.
| A. | Security Valuations — Securities, including restricted securities, are valued according to the following policy. |
A security listed or traded on an exchange (except convertible securities) is valued at its last sales price or official closing price as of the close of the customary trading session on the exchange where the security is principally traded, or lacking any sales or official closing price on a particular day, the security may be valued at the closing bid price on that day. Securities traded in the over-the-counter market are valued based on prices furnished by independent pricing services or market makers. When such securities are valued by an independent pricing service they may be considered fair valued. Futures contracts are valued at the final settlement price set by an exchange on which they are principally traded. Listed options are valued at the mean between the last bid and asked prices from the exchange on which they are principally traded. Options not listed on an exchange are valued by an independent source at the mean between the last bid and asked prices. For purposes of determining net asset value (“NAV”) per share, futures and option contracts generally are valued 15 minutes after the close of the customary trading session of the New York Stock Exchange (“NYSE”).
Investments in open-end and closed-end registered investment companies that do not trade on an exchange are valued at the end-of-day net asset value per share. Investments in open-end and closed-end registered investment companies that trade on an exchange are valued at the last sales price or official closing price as of the close of the customary trading session on the exchange where the security is principally traded.
Debt obligations (including convertible securities) and unlisted equities are fair valued using an evaluated quote provided by an independent pricing service. Evaluated quotes provided by the pricing service may be determined without exclusive reliance on quoted prices, and may reflect appropriate factors such as institution-size trading in similar groups of securities, developments related to specific securities, dividend rate (for unlisted equities), yield (for debt obligations), quality, type of issue, coupon rate (for debt obligations), maturity (for debt obligations), individual trading characteristics and other market data. Debt obligations are subject to interest rate and credit risks. In addition, all debt obligations involve some risk of default with respect to interest and/or principal payments.
Foreign securities’ (including foreign exchange contracts) prices are converted into U.S. dollar amounts using the applicable exchange rates as of the close of the NYSE. If market quotations are available and reliable for foreign exchange-traded equity securities, the securities will be valued at the market quotations. Because trading hours for certain foreign securities end before the close of the NYSE, closing market quotations may become unreliable. If between the time trading ends on a particular security and the close of the customary trading session on the NYSE, events occur that the Adviser determines are significant and make the closing price unreliable, the Fund may fair value the security. If the event is likely to have affected the closing price of the security, the security will be valued at fair value in good faith using procedures approved by the Board of Trustees. Adjustments to closing prices to reflect fair value may also be based on a screening process of an independent pricing service to indicate the degree of certainty, based on historical data, that the closing price in the principal market where a foreign security trades is not the current value as of the close of the NYSE. Foreign securities’ prices meeting the approved degree of certainty that the price is not reflective of current value will be priced at the indication of fair value from the independent pricing service. Multiple factors may be considered by the independent pricing service in determining adjustments to reflect fair value and may include information relating to sector indices, American Depositary Receipts and domestic and foreign index futures. Foreign securities may have additional risks including exchange rate changes, potential for sharply devalued currencies and high inflation, political and economic upheaval, the relative lack of issuer information, relatively low market liquidity and the potential lack of strict financial and accounting controls and standards.
Securities for which market prices are not provided by any of the above methods may be valued based upon quotes furnished by independent sources. The last bid price may be used to value equity securities. The mean between the last bid and asked prices is used to value debt obligations, including corporate loans.
Securities for which market quotations are not readily available or became unreliable are valued at fair value as determined in good faith by or under the supervision of the Trust’s officers following procedures approved by the Board of Trustees. Issuer specific events, market trends, bid/asked quotes of brokers and information providers and other market data may be reviewed in the course of making a good faith determination of a security’s fair value.
The Fund may invest in securities that are subject to interest rate risk, meaning the risk that the prices will generally fall as interest rates rise and, conversely, the prices will generally rise as interest rates fall. Specific securities differ in their sensitivity to changes in interest rates depending on their individual characteristics. Changes in interest rates may result in increased market volatility, which may affect the value and/or liquidity of certain Fund investments.
Valuations change in response to many factors including the historical and prospective earnings of the issuer, the value of the issuer’s assets, general economic conditions, interest rates, investor perceptions and market liquidity. Because of the inherent uncertainties of valuation, the values reflected in the financial statements may materially differ from the value received upon actual sale of those investments.
| B. | Securities Transactions and Investment Income — Securities transactions are accounted for on a trade date basis. Realized gains or losses on sales are computed on the basis of specific identification of the securities sold. Interest income (net of withholding tax, if any) is recorded on the accrual basis from settlement date. Dividend income (net of withholding tax, if any) is recorded on the ex-dividend date. Bond premiums and discounts are amortized and/or accreted for financial reporting purposes. |
The Fund may periodically participate in litigation related to Fund investments. As such, the Fund may receive proceeds from litigation settlements. Any proceeds received are included in the Statement of Operations as realized gain (loss) for investments no longer held and as unrealized gain (loss) for investments still held.
16 Invesco Emerging Market Local Currency Debt Fund
Brokerage commissions and mark ups are considered transaction costs and are recorded as an increase to the cost basis of securities purchased and/or a reduction of proceeds on a sale of securities. Such transaction costs are included in the determination of net realized and unrealized gain (loss) from investment securities reported in the Statement of Operations and the Statement of Changes in Net Assets and the net realized and unrealized gains (losses) on securities per share in the Financial Highlights. Transaction costs are included in the calculation of the Fund’s net asset value and, accordingly, they reduce the Fund’s total returns. These transaction costs are not considered operating expenses and are not reflected in net investment income reported in the Statement of Operations and the Statement of Changes in Net Assets, or the net investment income per share and the ratios of expenses and net investment income reported in the Financial Highlights, nor are they limited by any expense limitation arrangements between the Fund and the investment adviser.
The Fund allocates income and realized and unrealized capital gains and losses to a class based on the relative net assets of each class.
| C. | Country Determination — For the purposes of making investment selection decisions and presentation in the Schedule of Investments, the investment adviser may determine the country in which an issuer is located and/or credit risk exposure based on various factors. These factors include the laws of the country under which the issuer is organized, where the issuer maintains a principal office, the country in which the issuer derives 50% or more of its total revenues and the country that has the primary market for the issuer’s securities, as well as other criteria. Among the other criteria that may be evaluated for making this determination are the country in which the issuer maintains 50% or more of its assets, the type of security, financial guarantees and enhancements, the nature of the collateral and the sponsor organization. Country of issuer and/or credit risk exposure has been determined to be the United States of America, unless otherwise noted. |
| D. | Distributions — Distributions from net investment income, if any, are declared and paid monthly. Distributions from net realized capital gain, if any, are generally declared and paid annually and recorded on the ex-dividend date. The Fund may elect to treat a portion of the proceeds from redemptions as distributions for federal income tax purposes. |
| E. | Federal Income Taxes — The Fund intends to comply with the requirements of Subchapter M of the Internal Revenue Code of 1986, as amended (the “Internal Revenue Code”), necessary to qualify as a regulated investment company and to distribute substantially all of the Fund’s taxable earnings to shareholders. As such, the Fund will not be subject to federal income taxes on otherwise taxable income (including net realized capital gain) that is distributed to shareholders. Therefore, no provision for federal income taxes is recorded in the financial statements. |
The Fund recognizes the tax benefits of uncertain tax positions only when the position is more likely than not to be sustained. Management has analyzed the Fund’s uncertain tax positions and concluded that no liability for unrecognized tax benefits should be recorded related to uncertain tax positions. Management is not aware of any tax positions for which it is reasonably possible that the total amounts of unrecognized tax benefits will change materially in the next 12 months.
The Fund files tax returns in the U.S. Federal jurisdiction and certain other jurisdictions. Generally, the Fund is subject to examinations by such taxing authorities for up to three years after the filing of the return for the tax period.
| F. | Expenses — Fees provided for under the Rule 12b-1 plan of a particular class of the Fund are charged to the operations of such class. Transfer agency fees and expenses and other shareholder recordkeeping fees and expenses attributable to Class R5 and Class R6 are allocated to each share class based on relative net assets. Sub-accounting fees attributable to Class R5 are charged to the operations of the class. Transfer agency fees and expenses and other shareholder recordkeeping fees and expenses relating to all other classes are allocated among those classes based on relative net assets. All other expenses are allocated among the classes based on relative net assets. |
| G. | Accounting Estimates — The preparation of financial statements in conformity with accounting principles generally accepted in the United States of America (“GAAP”) requires management to make estimates and assumptions that affect the reported amounts of assets and liabilities at the date of the financial statements and the reported amounts of revenues and expenses during the reporting period including estimates and assumptions related to taxation. Actual results could differ from those estimates by a significant amount. In addition, the Fund monitors for material events or transactions that may occur or become known after the period-end date and before the date the financial statements are released to print. |
| H. | Indemnifications — Under the Trust’s organizational documents, each Trustee, officer, employee or other agent of the Trust is indemnified against certain liabilities that may arise out of the performance of their duties to the Fund. Additionally, in the normal course of business, the Fund enters into contracts, including the Fund’s servicing agreements, that contain a variety of indemnification clauses. The Fund’s maximum exposure under these arrangements is unknown as this would involve future claims that may be made against the Fund that have not yet occurred. The risk of material loss as a result of such indemnification claims is considered remote. |
| I. | Structured Securities — The Fund may invest in structured securities. Structured securities are a type of derivative security whose value is determined by reference to changes in the value of underlying securities, currencies, interest rates, commodities, indices or other financial indicators (“reference instruments”). Most structured securities are fixed-income securities that have maturities of three years or less. Structured securities may be positively or negatively indexed (i.e., their principal value or interest rates may increase or decrease if the underlying reference instrument appreciates) and may have return characteristics similar to direct investments in the underlying reference instrument. Structured securities may entail a greater degree of market risk than other types of debt securities because the investor bears the risk of the reference instruments. In addition to the credit risk of structured securities and the normal risks of price changes in response to changes in interest rates, the principal amount of structured notes or indexed securities may decrease as a result of changes in the value of the underlying reference instruments. Changes in the daily value of structured securities are recorded as unrealized gains (losses) in the Statement of Operations. When the structured securities mature or are sold, the Fund recognizes a realized gain (loss) on the Statement of Operations. |
| J. | Treasury Inflation-Protected Securities — The Fund may invest in Treasury Inflation-Protected Securities (“TIPS”). TIPS are fixed income securities whose principal value is periodically adjusted to the rate of inflation. The principal value of TIPS will be adjusted upward or downward, and any increase or decrease in the principal amount of TIPS will be included as interest income in the Statement of Operations, even though investors do not receive their principal until maturity. |
| K. | Foreign Currency Translations — Foreign currency is valued at the close of the NYSE based on quotations posted by banks and major currency dealers. Portfolio securities and other assets and liabilities denominated in foreign currencies are translated into U.S. dollar amounts at date of valuation. Purchases and sales of portfolio securities (net of foreign taxes withheld on disposition) and income items denominated in foreign currencies are translated into U.S. dollar amounts on the respective dates of such transactions. The Fund does not separately account for the portion of the results of operations resulting from changes in foreign exchange rates on investments and the fluctuations arising from |
17 Invesco Emerging Market Local Currency Debt Fund
| | changes in market prices of securities held. The combined results of changes in foreign exchange rates and the fluctuation of market prices on investments (net of estimated foreign tax withholding) are included with the net realized and unrealized gain or loss from investments in the Statement of Operations. Reported net realized foreign currency gains or losses arise from (1) sales of foreign currencies, (2) currency gains or losses realized between the trade and settlement dates on securities transactions, and (3) the difference between the amounts of dividends, interest, and foreign withholding taxes recorded on the Fund’s books and the U.S. dollar equivalent of the amounts actually received or paid. Net unrealized foreign currency gains and losses arise from changes in the fair values of assets and liabilities, other than investments in securities at fiscal period end, resulting from changes in exchange rates. |
The Fund may invest in foreign securities, which may be subject to foreign taxes on income, gains on investments or currency repatriation, a portion of which may be recoverable. Foreign taxes, if any, are recorded based on the tax regulations and rates that exist in the foreign markets in which the Fund invests and are shown in the Statement of Operations.
| L. | Forward Foreign Currency Contracts — The Fund may engage in foreign currency transactions either on a spot (i.e. for prompt delivery and settlement) basis, or through forward foreign currency contracts, to manage or minimize currency or exchange rate risk. |
The Fund may also enter into forward foreign currency contracts for the purchase or sale of a security denominated in a foreign currency in order to “lock in” the U.S. dollar price of that security, or the Fund may also enter into forward foreign currency contracts that do not provide for physical settlement of the two currencies, but instead are settled by a single cash payment calculated as the difference between the agreed upon exchange rate and the spot rate at settlement based upon an agreed upon notional amount (non-deliverable forwards). The Fund will set aside liquid assets in an amount equal to daily mark-to-market obligation for forward foreign currency contracts.
A forward foreign currency contract is an obligation between two parties (“Counterparties”) to purchase or sell a specific currency for an agreed-upon price at a future date. The use of forward foreign currency contracts does not eliminate fluctuations in the price of the underlying securities the Fund owns or intends to acquire but establishes a rate of exchange in advance. Fluctuations in the value of these contracts are measured by the difference in the contract date and reporting date exchange rates and are recorded as unrealized appreciation (depreciation) until the contracts are closed. When the contracts are closed, realized gains (losses) are recorded. Realized and unrealized gains (losses) on the contracts are included in the Statement of Operations. The primary risks associated with forward foreign currency contracts include failure of the Counterparty to meet the terms of the contract and the value of the foreign currency changing unfavorably. These risks may be in excess of the amounts reflected in the Statement of Assets and Liabilities.
NOTE 2—Advisory Fees and Other Fees Paid to Affiliates
The Trust has entered into a master investment advisory agreement with Invesco Advisers, Inc. (the “Adviser” or “Invesco”). Under the terms of the investment advisory agreement, the Fund pays an advisory fee to the Adviser based on the annual rate of the Fund’s average daily net assets as follows:
| | | | |
| Average Daily Net Assets | | Rate | |
First $500 million | | | 0.75% | |
Next $500 million | | | 0.70% | |
Next $500 million | | | 0.67% | |
Over $1.5 billion | | | 0.65% | |
For the year ended October 31, 2015, the effective advisory fees incurred by the Fund was 0.75%.
Under the terms of a master sub-advisory agreement between the Adviser and each of Invesco Asset Management Deutschland GmbH, Invesco Asset Management Limited, Invesco Asset Management (Japan) Limited, Invesco Hong Kong Limited, Invesco Senior Secured Management, Inc. and Invesco Canada Ltd. (collectively, the “Affiliated Sub-Advisers”) the Adviser, not the Fund, may pay 40% of the fees paid to the Adviser to any such Affiliated Sub-Adviser(s) that provide(s) discretionary investment management services to the Fund based on the percentage of assets allocated to such Affiliated Sub-Adviser(s).
The Adviser has contractually agreed, through at least February 28, 2017, to waive advisory fees and/or reimburse expenses to the extent necessary to limit total annual fund operating expenses after fee waiver and/or expense reimbursement (excluding certain items discussed below) of Class A, Class B, Class C, Class R, Class Y, Class R5 and Class R6 shares to 1.24%, 1.99%, 1.99%, 1.49%, 0.99%, 0.99% and 0.99% of average daily net assets, respectively. In determining the Adviser’s obligation to waive advisory fees and/or reimburse expenses, the following expenses are not taken into account, and could cause the total annual fund operating expenses after fee waiver and/or expense reimbursement to exceed the numbers reflected above: (1) interest; (2) taxes; (3) dividend expense on short sales; (4) extraordinary or non-routine items, including litigation expenses; and (5) expenses that the Fund has incurred but did not actually pay because of an expense offset arrangement. Unless Invesco continues the fee waiver agreement, it will terminate on February 28, 2017. The fee waiver agreement cannot be terminated during its term.
Further, the Adviser has contractually agreed, through at least June 30, 2017, to waive the advisory fee payable by the Fund in an amount equal to 100% of the net advisory fees the Adviser receives from the affiliated money market funds on investments by the Fund of uninvested cash in such affiliated money market funds.
For the year ended October 31, 2015, the Adviser waived advisory fees of $172,588 and reimbursed class level expenses of $23,003, $1,040, $5,083, $1,270, $2,583, $3 and $132 of Class A, Class B, Class C, Class R, Class Y, Class R5 and Class R6 shares, respectively.
The Trust has entered into a master administrative services agreement with Invesco pursuant to which the Fund has agreed to pay Invesco for certain administrative costs incurred in providing accounting services to the Fund. For the year ended October 31, 2015, expenses incurred under the agreement are shown in the Statement of Operations as Administrative services fees.
The Trust has entered into a transfer agency and service agreement with Invesco Investment Services, Inc. (“IIS”) pursuant to which the Fund has agreed to pay IIS a fee for providing transfer agency and shareholder services to the Fund and reimburse IIS for certain expenses incurred by IIS in the course of providing such services. IIS may make payments to intermediaries that provide omnibus account services, sub-accounting services and/or networking services. All fees payable by IIS to intermediaries that provide omnibus account services or sub-accounting are charged back to the Fund,
18 Invesco Emerging Market Local Currency Debt Fund
subject to certain limitations approved by the Trust’s Board of Trustees. For the year ended October 31, 2015, expenses incurred under the agreement are shown in the Statement of Operations as Transfer agent fees.
The Trust has entered into master distribution agreements with Invesco Distributors, Inc. (“IDI”) to serve as the distributor for the Class A, Class B, Class C, Class R, Class Y, Class R5 and Class R6 shares of the Fund. The Trust has adopted plans pursuant to Rule 12b-1 under the 1940 Act with respect to the Fund’s Class A, Class B, Class C and Class R shares (collectively, the “Plans”). The Fund, pursuant to the Plans, pays IDI compensation at the annual rate of 0.25% of the Fund’s average daily net assets of Class A shares, 1.00% of the average daily net assets of Class B and Class C shares and 0.50% of the average daily net assets of Class R shares. Of the Plan payments, up to 0.25% of the average daily net assets of each class of shares may be paid to furnish continuing personal shareholder services to customers who purchase and own shares of such classes. Any amounts not paid as a service fee under the Plans would constitute an asset-based sales charge. Rules of the Financial Industry Regulatory Authority (“FINRA”) impose a cap on the total sales charges, including asset-based sales charges, that may be paid by any class of shares of the Fund. For the year ended October 31, 2015, expenses incurred under the Plans are shown in the Statement of Operations as Distribution fees.
Front-end sales commissions and CDSC (collectively, the “sales charges”) are not recorded as expenses of the Fund. Front-end sales commissions are deducted from proceeds from the sales of Fund shares prior to investment in Class A shares of the Fund. CDSC are deducted from redemption proceeds prior to remittance to the shareholder. During the year ended October 31, 2015, IDI advised the Fund that IDI retained $713 in front-end sales commissions from the sale of Class A shares and $475 and $99 from Class B and Class C shares, respectively, for CDSC imposed on redemptions by shareholders.
Certain officers and trustees of the Trust are officers and directors of the Adviser, IIS and/or IDI.
NOTE 3—Additional Valuation Information
GAAP defines fair value as the price that would be received to sell an asset or paid to transfer a liability in an orderly transaction between market participants at the measurement date, under current market conditions. GAAP establishes a hierarchy that prioritizes the inputs to valuation methods, giving the highest priority to readily available unadjusted quoted prices in an active market for identical assets (Level 1) and the lowest priority to significant unobservable inputs (Level 3), generally when market prices are not readily available or are unreliable. Based on the valuation inputs, the securities or other investments are tiered into one of three levels. Changes in valuation methods may result in transfers in or out of an investment’s assigned level:
| | Level 1 — | Prices are determined using quoted prices in an active market for identical assets. |
| | Level 2 — | Prices are determined using other significant observable inputs. Observable inputs are inputs that other market participants may use in pricing a security. These may include quoted prices for similar securities, interest rates, prepayment speeds, credit risk, yield curves, loss severities, default rates, discount rates, volatilities and others. |
| | Level 3 — | Prices are determined using significant unobservable inputs. In situations where quoted prices or observable inputs are unavailable (for example, when there is little or no market activity for an investment at the end of the period), unobservable inputs may be used. Unobservable inputs reflect the Fund’s own assumptions about the factors market participants would use in determining fair value of the securities or instruments and would be based on the best available information. |
The following is a summary of the tiered valuation input levels, as of October 31, 2015. The level assigned to the securities valuations may not be an indication of the risk or liquidity associated with investing in those securities. Because of the inherent uncertainties of valuation, the values reflected in the financial statements may materially differ from the value received upon actual sale of those investments.
| | | | | | | | | | | | | | | | |
| | | Level 1 | | | Level 2 | | | Level 3 | | | Total | |
Money Market Funds | | $ | 723,211 | | | $ | — | | | $ | — | | | $ | 723,211 | |
Credit-Linked Securities | | | — | | | | 7,365,083 | | | | — | | | | 7,365,083 | |
Foreign Debt Securities | | | — | | | | 8,480,468 | | | | — | | | | 8,480,468 | |
Foreign Sovereign Debt Securities | | | — | | | | 28,592,464 | | | | — | | | | 28,592,464 | |
| | | $ | 723,211 | | | $ | 44,438,015 | | | $ | — | | | $ | 45,161,226 | |
Forward Foreign Currency Contracts* | | | — | | | | 62,515 | | | | — | | | | 62,515 | |
Total Investments | | $ | 723,211 | | | $ | 44,500,530 | | | $ | — | | | $ | 45,223,741 | |
| * | Unrealized appreciation. |
NOTE 4—Derivative Investments
Value of Derivative Investments at Period-End
The table below summarizes the value of the Fund’s derivative investments, detailed by primary risk exposure, held as of October 31, 2015:
| | | | | | | | |
| | | Value | |
| Risk Exposure/Derivative Type | | Assets | | | Liabilities | |
Currency risk: | | | | | | | | |
Forward foreign currency contracts(a) | | $ | 269,981 | | | $ | (207,466 | ) |
| (a) | Values are disclosed on the Statement of Assets and Liabilities under the captions Unrealized appreciation on forward foreign currency contracts outstanding and Unrealized depreciation on forward foreign currency contracts outstanding. |
19 Invesco Emerging Market Local Currency Debt Fund
Effect of Derivative Investments for the year ended October 31, 2015
The table below summarizes the gains (losses) on derivative investments, detailed by primary risk exposure, recognized in earnings during the period:
| | | | |
| | | Location of Gain (Loss) on
Statement of Operations | |
| | | Forward
Foreign Currency
Contracts | |
Realized Gain: | | | | |
Currency risk | | $ | 498,906 | |
Change in Unrealized Appreciation (Depreciation): | | | | |
Currency risk | | | (11,892 | ) |
Total | | $ | 487,014 | |
The table below summarizes the average notional value of forward foreign currency contracts outstanding during the period.
| | | | |
| | | Forward
Foreign Currency
Contracts | |
Average notional value | | $ | 10,156,783 | |
| | | | | | | | | | | | | | | | | | | | | | | | | | |
| Open Forward Foreign Currency Contracts | |
Settlement
Date | | Counterparty | | Contract to | | | Notional
Value | | | Unrealized
Appreciation
(Depreciation) | |
| | | Deliver | | | Receive | | | |
11/04/15 | | Barclays Bank PLC | | | EUR | | | | 860,000 | | | | USD | | | | 951,127 | | | $ | 945,809 | | | $ | 5,318 | |
11/04/15 | | Goldman Sachs International | | | USD | | | | 967,672 | | | | EUR | | | | 860,000 | | | | 945,808 | | | | (21,864 | ) |
11/09/15 | | Goldman Sachs International | | | HUF | | | | 199,580,500 | | | | USD | | | | 705,544 | | | | 706,282 | | | | (738 | ) |
11/09/15 | | Deutsche Bank Securities Inc. | | | USD | | | | 931,695 | | | | PLN | | | | 3,589,100 | | | | 928,530 | | | | (3,165 | ) |
11/09/15 | | Goldman Sachs International | | | USD | | | | 700,000 | | | | HUF | | | | 199,580,500 | | | | 706,282 | | | | 6,282 | |
11/09/15 | | Goldman Sachs International | | | PLN | | | | 3,589,100 | | | | USD | | | | 956,756 | | | | 928,530 | | | | 28,226 | |
11/20/15 | | Deutsche Bank Securities Inc. | | | USD | | | | 488,201 | | | | ZAR | | | | 6,400,000 | | | | 460,681 | | | | (27,520 | ) |
11/20/15 | | Deutsche Bank Securities Inc. | | | MXN | | | | 12,000,000 | | | | USD | | | | 717,424 | | | | 725,235 | | | | (7,811 | ) |
11/20/15 | | Goldman Sachs International | | | USD | | | | 1,379,156 | | | | MXN | | | | 23,500,000 | | | | 1,420,253 | | | | 41,097 | |
11/20/15 | | Goldman Sachs International | | | USD | | | | 1,339,549 | | | | PLN | | | | 5,000,000 | | | | 1,293,079 | | | | (46,470 | ) |
11/20/15 | | Goldman Sachs International | | | USD | | | | 472,602 | | | | ZAR | | | | 6,300,000 | | | | 453,483 | | | | (19,119 | ) |
12/02/15 | | Goldman Sachs International | | | BRL | | | | 920,000 | | | | USD | | | | 231,098 | | | | 236,031 | | | | (4,933 | ) |
12/02/15 | | Goldman Sachs International | | | BRL | | | | 1,100,000 | | | | USD | | | | 277,708 | | | | 282,211 | | | | (4,503 | ) |
12/02/15 | | Goldman Sachs International | | | USD | | | | 966,798 | | | | BRL | | | | 3,800,000 | | | | 974,909 | | | | 8,111 | |
12/04/15 | | Goldman Sachs International | | | HUF | | | | 40,000,000 | | | | USD | | | | 141,343 | | | | 141,473 | | | | (130 | ) |
12/04/15 | | Goldman Sachs International | | | PLN | | | | 1,700,000 | | | | USD | | | | 448,194 | | | | 439,470 | | | | 8,724 | |
12/04/15 | | Goldman Sachs International | | | PLN | | | | 4,300,000 | | | | USD | | | | 1,134,176 | | | | 1,111,601 | | | | 22,575 | |
12/04/15 | | Goldman Sachs International | | | RON | | | | 2,200,000 | | | | USD | | | | 565,378 | | | | 545,378 | | | | 20,000 | |
12/04/15 | | Goldman Sachs International | | | TRY | | | | 1,400,000 | | | | USD | | | | 471,396 | | | | 475,222 | | | | (3,826 | ) |
12/04/15 | | Goldman Sachs International | | | TRY | | | | 1,400,000 | | | | USD | | | | 476,353 | | | | 475,223 | | | | 1,130 | |
12/04/15 | | Goldman Sachs International | | | USD | | | | 1,163,951 | | | | COP | | | | 3,500,000,000 | | | | 1,203,380 | | | | 39,429 | |
12/04/15 | | Goldman Sachs International | | | USD | | | | 275,293 | | | | IDR | | | | 4,000,000,000 | | | | 288,040 | | | | 12,747 | |
12/04/15 | | Goldman Sachs International | | | USD | | | | 461,017 | | | | IDR | | | | 6,800,000,000 | | | | 489,667 | | | | 28,650 | |
12/04/15 | | Goldman Sachs International | | | USD | | | | 276,498 | | | | RUB | | | | 18,000,000 | | | | 278,833 | | | | 2,335 | |
12/04/15 | | Goldman Sachs International | | | USD | | | | 912,548 | | | | RUB | | | | 60,000,000 | | | | 929,441 | | | | 16,893 | |
12/04/15 | | Goldman Sachs International | | | USD | | | | 562,905 | | | | THB | | | | 20,000,000 | | | | 559,635 | | | | (3,270 | ) |
12/04/15 | | Goldman Sachs International | | | USD | | | | 229,787 | | | | TRY | | | | 700,000 | | | | 237,611 | | | | 7,824 | |
12/04/15 | | Goldman Sachs International | | | USD | | | | 361,298 | | | | ZAR | | | | 5,000,000 | | | | 358,992 | | | | (2,306 | ) |
12/04/15 | | Goldman Sachs International | | | ZAR | | | | 5,000,000 | | | | USD | | | | 378,544 | | | | 358,992 | | | | 19,552 | |
12/04/15 | | Goldman Sachs International | | | COP | | | | 2,200,000,000 | | | | USD | | | | 750,085 | | | | 756,410 | | | | (6,325 | ) |
01/27/16 | | Goldman Sachs International | | | PLN | | | | 3,560,000 | | | | MXN | | | | 15,300,168 | | | | 928,318 | | | | 1,088 | |
02/19/16 | | Goldman Sachs International | | | CNY | | | | 4,500,000 | | | | USD | | | | 685,976 | | | | 703,564 | | | | (17,588 | ) |
09/02/16 | | Deutsche Bank Securities Inc. | | | CNY | | | | 10,200,000 | | | | USD | | | | 1,537,302 | | | | 1,575,200 | | | | (37,898 | ) |
Total open forward foreign currency contracts — Currency Risk | | | | | | | | | | | | | | | | | | | | | | $ | 62,515 | |
20 Invesco Emerging Market Local Currency Debt Fund
Currency Abbreviations:
| | |
| BRL | | – Brazilian Real |
| IDR | | – Indonesian Rupiah |
| THB | | – Thai Baht |
| CNY | | – Chinese Yuan Renminbi |
| MXN | | – Mexican Peso |
| | |
| TRY | | – Turkish Lira |
| COP | | – Colombian Peso |
| PLN | | – Poland Zloty |
| USD | | – U.S. Dollar |
| EUR | | – EURO |
| | |
| RON | | – Romanian Leu |
| ZAR | | – South African Rand |
| HUF | | – Hungarian Forint |
| RUB | | – Russian Ruble |
Offsetting Assets and Liabilities
Accounting Standards Update (“ASU”) No. 2011-11, Disclosures about Offsetting Assets and Liabilities, which was subsequently clarified in Financial Accounting Standards Board ASU 2013-01 “Clarifying the Scope of Disclosures about Offsetting Assets and Liabilities” is intended to enhance disclosures about financial instruments and derivative instruments that are subject to offsetting arrangements on the Statement of Assets and Liabilities and to enable investors to better understand the effect of those arrangements on the Fund’s financial position. In order for an arrangement to be eligible for netting, the Fund must have a basis to conclude that such netting arrangements are legally enforceable. The Fund enters into netting agreements and collateral agreements in an attempt to reduce the Fund’s Counterparty credit risk by providing for a single net settlement with a Counterparty of all financial transactions covered by the agreement in an event of default as defined under such agreement.
The following tables present derivative instruments that are either subject to an enforceable netting agreement or offset by collateral arrangements as of October 31, 2015.
| | | | | | | | | | | | | | | | | | | | |
| | | Gross amounts
of Recognized
Assets | | | Gross Amounts Not Offset in the
Statement of Assets and Liabilities | | | Net
Amount | |
| | | | Financial
Instruments | | | Collateral Received | | |
| Counterparty | | | | Non-Cash | | | Cash | | |
Barclays Bank PLC | | $ | 5,318 | | | $ | — | | | $ | — | | | $ | — | | | $ | 5,318 | |
Goldman Sachs International | | | 264,663 | | | | (131,072 | ) | | | — | | | | — | | | | 133,591 | |
Total | | $ | 269,981 | | | $ | (131,072 | ) | | $ | — | | | $ | — | | | $ | 138,909 | |
| | | | | |
| | | | | | | | | | | | | | | | | | | | |
| | | Gross amounts
of Recognized
Liabilities | | | Gross Amounts Not Offset in the
Statement of Assets and Liabilities | | | Net
Amount | |
| | | | Financial
Instruments | | | Collateral Pledged | | |
| Counterparty | | | | Non-Cash | | | Cash | | |
Deutsche Bank Securities Inc. | | $ | 76,394 | | | $ | — | | | $ | — | | | $ | — | | | $ | 76,394 | |
Goldman Sachs International | | | 131,072 | | | | (131,072 | ) | | | — | | | | — | | | | — | |
Total | | $ | 207,466 | | | $ | (131,072 | ) | | $ | — | | | $ | — | | | $ | 76,394 | |
NOTE 5—Expense Offset Arrangement(s)
The expense offset arrangement is comprised of transfer agency credits which result from balances in demand deposit accounts used by the transfer agent for clearing shareholder transactions. For the year ended October 31, 2015, the Fund received credits from this arrangement, which resulted in the reduction of the Fund’s total expenses of $133.
NOTE 6—Trustees’ and Officers’ Fees and Benefits
Trustees’ and Officers’ Fees and Benefits include amounts accrued by the Fund to pay remuneration to certain Trustees and Officers of the Fund. Trustees have the option to defer compensation payable by the Fund, and Trustees’ and Officers’ Fees and Benefits also include amounts accrued by the Fund to fund such deferred compensation amounts. Those Trustees who defer compensation have the option to select various Invesco Funds in which their deferral accounts shall be deemed to be invested. Finally, certain current Trustees were eligible to participate in a retirement plan that provided for benefits to be paid upon retirement to Trustees over a period of time based on the number of years of service. The Fund may have certain former Trustees who also participate in a retirement plan and receive benefits under such plan. Trustees’ and Officers’ Fees and Benefits include amounts accrued by the Fund to fund such retirement benefits. Obligations under the deferred compensation and retirement plans represent unsecured claims against the general assets of the Fund.
NOTE 7—Cash Balances
The Fund is permitted to temporarily carry a negative or overdrawn balance in its account with State Street Bank and Trust Company, the custodian bank. Such balances, if any at period end, are shown in the Statement of Assets and Liabilities under the payable caption Amount due custodian. To compensate the custodian bank for such overdrafts, the overdrawn Fund may either (1) leave funds as a compensating balance in the account so the custodian bank can be compensated by earning the additional interest; or (2) compensate by paying the custodian bank at a rate agreed upon by the custodian bank and Invesco, not to exceed the contractually agreed upon rate.
21 Invesco Emerging Market Local Currency Debt Fund
NOTE 8—Distributions to Shareholders and Tax Components of Net Assets
Tax Character of Distributions to Shareholders Paid During the Fiscal Years Ended October 31, 2015 and 2014:
| | | | | | | | |
| | | 2015 | | | 2014 | |
Ordinary income | | $ | — | | | $ | 358,426 | |
Return of capital | | | 2,538,283 | | | | 1,986,072 | |
Total distributions | | $ | 2,538,283 | | | $ | 2,344,498 | |
Tax Components of Net Assets at Period-End:
| | | | |
| | | 2015 | |
Net unrealized appreciation (depreciation) — investments | | $ | (10,760,540 | ) |
Net unrealized appreciation — other investments | | | 66,882 | |
Temporary book/tax differences | | | (23,001 | ) |
Capital loss carryforward | | | (823,336 | ) |
Shares of beneficial interest | | | 57,549,690 | |
Total net assets | | $ | 46,009,695 | |
The difference between book-basis and tax-basis unrealized appreciation (depreciation) is due to differences in the timing of recognition of gains and losses on investments for tax and book purposes. The Fund’s net unrealized appreciation (depreciation) difference is attributable primarily to wash sales.
The temporary book/tax differences are a result of timing differences between book and tax recognition of income and/or expenses. The Fund’s temporary book/tax differences are the result of the trustee deferral of compensation and retirement plan benefits.
Capital loss carryforward is calculated and reported as of a specific date. Results of transactions and other activity after that date may affect the amount of capital loss carryforward actually available for the Fund to utilize. Capital losses generated in years beginning after December 22, 2010 can be carried forward for an unlimited period, whereas previous losses expire in eight tax years. Capital losses with an expiration period may not be used to offset capital gains until all net capital losses without an expiration date have been utilized. Capital loss carryforwards with no expiration date will retain their character as either short-term or long-term capital losses instead of as short-term capital losses as under prior law. The ability to utilize capital loss carryforwards in the future may be limited under the Internal Revenue Code and related regulations based on the results of future transactions.
The Fund has a capital loss carryforward as of October 31, 2015, which expires as follows:
| | | | | | | | | | | | |
| Capital Loss Carryforward* | |
| Expiration | | Short-Term | | | Long-Term | | | Total | |
Not subject to expiration | | $ | 270,312 | | | $ | 553,024 | | | $ | 823,336 | |
| * | Capital loss carryforward as of the date listed above is reduced for limitations, if any, to the extent required by the Internal Revenue Code and may be further limited depending upon a variety of factors, including the realization of net unrealized gains or losses as of the date of any reorganization. |
NOTE 9—Investment Securities
The aggregate amount of investment securities (other than short-term securities, U.S. Treasury obligations and money market funds, if any) purchased and sold by the Fund during the year ended October 31, 2015 was $27,109,419 and $23,739,212, respectively. Cost of investments on a tax basis includes the adjustments for financial reporting purposes as of the most recently completed federal income tax reporting period-end.
| | | | |
| Unrealized Appreciation (Depreciation) of Investment Securities on a Tax Basis | |
Aggregate unrealized appreciation of investment securities | | $ | 90,015 | |
Aggregate unrealized (depreciation) of investment securities | | | (10,850,555 | ) |
Net unrealized appreciation (depreciation) of investment securities | | $ | (10,760,540 | ) |
Cost of investments for tax purposes is $55,921,766.
NOTE 10—Reclassification of Permanent Differences
Primarily as a result of differing book/tax treatment of foreign currency transactions, return of capital distributions and net operating loss, on October 31, 2015, undistributed net investment income was decreased by $491,271, undistributed net realized gain (loss) was increased by $4,895,750 and shares of beneficial interest was decreased by $4,404,479. This reclassification had no effect on the net assets of the Fund.
22 Invesco Emerging Market Local Currency Debt Fund
NOTE 11—Share Information
| | | | | | | | | | | | | | | | |
| | | Summary of Share Activity | |
| | | Years ended October 31, | |
| | | 2015(a) | | | 2014 | |
| | | Shares | | | Amount | | | Shares | | | Amount | |
Sold: | | | | | | | | | | | | | | | | |
Class A | | | 171,421 | | | $ | 1,323,790 | | | | 321,070 | | | $ | 2,828,536 | |
Class B | | | 23,303 | | | | 179,312 | | | | 1,439 | | | | 12,454 | |
Class C | | | 25,413 | | | | 192,441 | | | | 45,525 | | | | 401,566 | |
Class R | | | 3,719 | | | | 27,958 | | | | 4,893 | | | | 42,740 | |
Class Y | | | 48,034 | | | | 372,122 | | | | 431,545 | | | | 3,732,173 | |
Class R5 | | | — | | | | — | | | | 10,888 | | | | 94,010 | |
Class R6 | | | 1,007,671 | | | | 7,589,645 | | | | 1,094,766 | | | | 9,395,035 | |
| | | | |
Issued as reinvestment of dividends: | | | | | | | | | | | | | | | | |
Class A | | | 38,573 | | | | 288,494 | | | | 37,699 | | | | 329,768 | |
Class B | | | 1,855 | | | | 13,761 | | | | 1,571 | | | | 13,739 | |
Class C | | | 6,510 | | | | 48,750 | | | | 8,028 | | | | 70,247 | |
Class R | | | 2,549 | | | | 19,004 | | | | 2,638 | | | | 23,048 | |
Class Y | | | 2,763 | | | | 20,882 | | | | 3,740 | | | | 32,713 | |
Class R5 | | | 213 | | | | 1,707 | | | | 1,081 | | | | 9,459 | |
Class R6 | | | 272,414 | | | | 2,025,139 | | | | 191,001 | | | | 1,668,365 | |
| | | | |
Automatic conversion of Class B shares to Class A shares: | | | | | | | | | | | | | | | | |
Class A | | | 12,487 | | | | 90,553 | | | | 5,777 | | | | 50,624 | |
Class B | | | (12,503 | ) | | | (90,553 | ) | | | (5,783 | ) | | | (50,624 | ) |
| | | | |
Reacquired: | | | | | | | | | | | | | | | | |
Class A | | | (399,796 | ) | | | (3,057,882 | ) | | | (677,777 | ) | | | (5,907,658 | ) |
Class B | | | (10,146 | ) | | | (76,506 | ) | | | (18,311 | ) | | | (158,403 | ) |
Class C | | | (91,702 | ) | | | (710,907 | ) | | | (174,584 | ) | | | (1,515,091 | ) |
Class R | | | (6,892 | ) | | | (49,101 | ) | | | (37,933 | ) | | | (334,410 | ) |
Class Y | | | (348,793 | ) | | | (2,731,930 | ) | | | (259,214 | ) | | | (2,242,103 | ) |
Class R5 | | | (21,098 | ) | | | (164,937 | ) | | | (21,876 | ) | | | (190,500 | ) |
Class R6 | | | (427,880 | ) | | | (3,169,726 | ) | | | (231,999 | ) | | | (2,030,275 | ) |
Net increase in share activity | | | 298,115 | | | $ | 2,142,016 | | | | 734,184 | | | $ | 6,275,413 | |
| (a) | 81% of the outstanding shares of the Fund are owned by affiliated mutual funds. Affiliated mutual funds are other mutual funds that are also advised by Invesco. |
NOTE 12—Subsequent Event
Effective December 4, 2015, the Board of Trustees recently approved changes to the Fund’s investment strategies to reposition the Fund as an unconstrained emerging markets debt securities fund, including changing the Fund’s name to Invesco Emerging Markets Flexible Bond Fund. These changes are scheduled to take effect on or about February 26, 2016.
23 Invesco Emerging Market Local Currency Debt Fund
NOTE 13—Financial Highlights
The following schedule presents financial highlights for a share of the Fund outstanding throughout the periods indicated.
| | | | | | | | | | | | | | | | | | | | | | | | | | | | | | | | | | | | | | | | | | | | | | | | | | | | | | | | | | | | |
| | | Net asset
value,
beginning
of period | | | Net
investment
income(a) | | | Net gains
(losses)
on securities
(both
realized and
unrealized) | | | Total from
investment
operations | | | Dividends
from net
investment
income | | | Distributions
from net
realized
gains | | | Return
of capital | | | Total
distributions | | | Net asset
value, end
of period(b) | | | Total
return(c) | | | Net assets,
end of period
(000’s omitted) | | | Ratio of
expenses
to average
net assets
with fee waivers
and/or expenses
absorbed | | | Ratio of
expenses
to average net
assets without
fee waivers
and/or expenses
absorbed | | | Ratio of net
investment
income
to average
net assets | | | Portfolio
turnover(d) | |
Class A | | | | | | | | | | | | | | | | | | | | | | | | | | | | | | | | | | | | | | | | | | | | | | | | | | | | | | | | | | | | |
Year ended 10/31/15 | | $ | 8.49 | | | $ | 0.41 | | | $ | (1.76 | ) | | $ | (1.35 | ) | | $ | — | | | $ | — | | | $ | (0.37 | ) | | $ | (0.37 | ) | | $ | 6.77 | | | | (16.20 | )% | | $ | 6,282 | | | | 1.24 | %(e) | | | 1.89 | %(e) | | | 5.46 | %(e) | | | 50 | % |
Year ended 10/31/14 | | | 9.17 | | | | 0.46 | | | | (0.77 | ) | | | (0.31 | ) | | | (0.06 | ) | | | — | | | | (0.31 | ) | | | (0.37 | ) | | | 8.49 | | | | (3.44 | ) | | | 9,379 | | | | 1.24 | | | | 1.84 | | | | 5.29 | | | | 69 | |
Year ended 10/31/13 | | | 9.88 | | | | 0.48 | | | | (0.79 | ) | | | (0.31 | ) | | | (0.29 | ) | | | — | | | | (0.11 | ) | | | (0.40 | ) | | | 9.17 | | | | (3.25 | ) | | | 12,998 | | | | 1.24 | | | | 1.77 | | | | 4.96 | | | | 31 | |
Year ended 10/31/12 | | | 10.36 | �� | | | 0.50 | | | | 0.17 | | | | 0.67 | | | | (0.88 | ) | | | (0.24 | ) | | | (0.03 | ) | | | (1.15 | ) | | | 9.88 | | | | 7.50 | | | | 14,549 | | | | 1.24 | | | | 1.79 | | | | 5.17 | | | | 30 | |
Year ended 10/31/11 | | | 11.11 | | | | 0.53 | | | | (0.49 | ) | | | 0.04 | | | | (0.63 | ) | | | (0.16 | ) | | | — | | | | (0.79 | ) | | | 10.36 | | | | 0.34 | | | | 12,886 | | | | 1.23 | | | | 1.86 | | | | 4.97 | | | | 106 | |
Class B | | | | | | | | | | | | | | | | | | | | | | | | | | | | | | | | | | | | | | | | | | | | | | | | | | | | | | | | | | | | |
Year ended 10/31/15 | | | 8.48 | | | | 0.35 | | | | (1.75 | ) | | | (1.40 | ) | | | — | | | | — | | | | (0.31 | ) | | | (0.31 | ) | | | 6.77 | | | | (16.72 | ) | | | 296 | | | | 1.99 | (e) | | | 2.64 | (e) | | | 4.71 | (e) | | | 50 | |
Year ended 10/31/14 | | | 9.16 | | | | 0.40 | | | | (0.78 | ) | | | (0.38 | ) | | | (0.05 | ) | | | — | | | | (0.25 | ) | | | (0.30 | ) | | | 8.48 | | | | (4.17 | ) | | | 349 | | | | 1.99 | | | | 2.59 | | | | 4.54 | | | | 69 | |
Year ended 10/31/13 | | | 9.87 | | | | 0.41 | | | | (0.79 | ) | | | (0.38 | ) | | | (0.22 | ) | | | — | | | | (0.11 | ) | | | (0.33 | ) | | | 9.16 | | | | (3.98 | ) | | | 570 | | | | 1.99 | | | | 2.52 | | | | 4.21 | | | | 31 | |
Year ended 10/31/12 | | | 10.35 | | | | 0.43 | | | | 0.17 | | | | 0.60 | | | | (0.81 | ) | | | (0.24 | ) | | | (0.03 | ) | | | (1.08 | ) | | | 9.87 | | | | 6.70 | | | | 856 | | | | 1.99 | | | | 2.54 | | | | 4.42 | | | | 30 | |
Year ended 10/31/11 | | | 11.10 | | | | 0.45 | | | | (0.49 | ) | | | (0.04 | ) | | | (0.55 | ) | | | (0.16 | ) | | | — | | | | (0.71 | ) | | | 10.35 | | | | (0.42 | ) | | | 843 | | | | 1.98 | | | | 2.61 | | | | 4.22 | | | | 106 | |
Class C | | | | | | | | | | | | | | | | | | | | | | | | | | | | | | | | | | | | | | | | | | | | | | | | | | | | | | | | | | | | |
Year ended 10/31/15 | | | 8.49 | | | | 0.35 | | | | (1.75 | ) | | | (1.40 | ) | | | — | | | | — | | | | (0.32 | ) | | | (0.32 | ) | | | 6.77 | | | | (16.82 | ) | | | 1,385 | | | | 1.99 | (e) | | | 2.64 | (e) | | | 4.71 | (e) | | | 50 | |
Year ended 10/31/14 | | | 9.17 | | | | 0.40 | | | | (0.78 | ) | | | (0.38 | ) | | | (0.05 | ) | | | — | | | | (0.25 | ) | | | (0.30 | ) | | | 8.49 | | | | (4.16 | ) | | | 2,244 | | | | 1.99 | | | | 2.59 | | | | 4.54 | | | | 69 | |
Year ended 10/31/13 | | | 9.88 | | | | 0.41 | | | | (0.79 | ) | | | (0.38 | ) | | | (0.22 | ) | | | — | | | | (0.11 | ) | | | (0.33 | ) | | | 9.17 | | | | (3.97 | ) | | | 3,532 | | | | 1.99 | | | | 2.52 | | | | 4.21 | | | | 31 | |
Year ended 10/31/12 | | | 10.36 | | | | 0.43 | | | | 0.17 | | | | 0.60 | | | | (0.81 | ) | | | (0.24 | ) | | | (0.03 | ) | | | (1.08 | ) | | | 9.88 | | | | 6.70 | | | | 3,938 | | | | 1.99 | | | | 2.54 | | | | 4.42 | | | | 30 | |
Year ended 10/31/11 | | | 11.10 | | | | 0.45 | | | | (0.48 | ) | | | (0.03 | ) | | | (0.55 | ) | | | (0.16 | ) | | | — | | | | (0.71 | ) | | | 10.36 | | | | (0.33 | ) | | | 3,079 | | | | 1.98 | | | | 2.61 | | | | 4.22 | | | | 106 | |
Class R | | | | | | | | | | | | | | | | | | | | | | | | | | | | | | | | | | | | | | | | | | | | | | | | | | | | | | | | | | | | |
Year ended 10/31/15 | | | 8.48 | | | | 0.39 | | | | (1.76 | ) | | | (1.37 | ) | | | — | | | | — | | | | (0.35 | ) | | | (0.35 | ) | | | 6.76 | | | | (16.43 | ) | | | 363 | | | | 1.49 | (e) | | | 2.14 | (e) | | | 5.21 | (e) | | | 50 | |
Year ended 10/31/14 | | | 9.17 | | | | 0.44 | | | | (0.78 | ) | | | (0.34 | ) | | | (0.06 | ) | | | — | | | | (0.29 | ) | | | (0.35 | ) | | | 8.48 | | | | (3.79 | ) | | | 460 | | | | 1.49 | | | | 2.09 | | | | 5.04 | | | | 69 | |
Year ended 10/31/13 | | | 9.87 | | | | 0.46 | | | | (0.78 | ) | | | (0.32 | ) | | | (0.27 | ) | | | — | | | | (0.11 | ) | | | (0.38 | ) | | | 9.17 | | | | (3.39 | ) | | | 776 | | | | 1.49 | | | | 2.02 | | | | 4.71 | | | | 31 | |
Year ended 10/31/12 | | | 10.36 | | | | 0.48 | | | | 0.16 | | | | 0.64 | | | | (0.86 | ) | | | (0.24 | ) | | | (0.03 | ) | | | (1.13 | ) | | | 9.87 | | | | 7.13 | | | | 946 | | | | 1.49 | | | | 2.04 | | | | 4.92 | | | | 30 | |
Year ended 10/31/11 | | | 11.11 | | | | 0.49 | | | | (0.48 | ) | | | 0.01 | | | | (0.60 | ) | | | (0.16 | ) | | | — | | | | (0.76 | ) | | | 10.36 | | | | 0.09 | | | | 386 | | | | 1.48 | | | | 2.11 | | | | 4.72 | | | | 106 | |
Class Y | | | | | | | | | | | | | | | | | | | | | | | | | | | | | | | | | | | | | | | | | | | | | | | | | | | | | | | | | | | | |
Year ended 10/31/15 | | | 8.49 | | | | 0.45 | | | | (1.78 | ) | | | (1.33 | ) | | | — | | | | — | | | | (0.39 | ) | | | (0.39 | ) | | | 6.77 | | | | (15.99 | ) | | | 304 | | | | 0.99 | (e) | | | 1.64 | (e) | | | 5.71 | (e) | | | 50 | |
Year ended 10/31/14 | | | 9.17 | | | | 0.49 | | | | (0.78 | ) | | | (0.29 | ) | | | (0.06 | ) | | | — | | | | (0.33 | ) | | | (0.39 | ) | | | 8.49 | | | | (3.20 | ) | | | 2,911 | | | | 0.99 | | | | 1.59 | | | | 5.54 | | | | 69 | |
Year ended 10/31/13 | | | 9.88 | | | | 0.51 | | | | (0.79 | ) | | | (0.28 | ) | | | (0.32 | ) | | | — | | | | (0.11 | ) | | | (0.43 | ) | | | 9.17 | | | | (3.01 | ) | | | 1,529 | | | | 0.99 | | | | 1.52 | | | | 5.21 | | | | 31 | |
Year ended 10/31/12 | | | 10.37 | | | | 0.52 | | | | 0.17 | | | | 0.69 | | | | (0.91 | ) | | | (0.24 | ) | | | (0.03 | ) | | | (1.18 | ) | | | 9.88 | | | | 7.67 | | | | 1,867 | | | | 0.99 | | | | 1.54 | | | | 5.42 | | | | 30 | |
Year ended 10/31/11 | | | 11.11 | | | | 0.56 | | | | (0.49 | ) | | | 0.07 | | | | (0.65 | ) | | | (0.16 | ) | | | — | | | | (0.81 | ) | | | 10.37 | | | | 0.69 | | | | 1,131 | | | | 0.98 | | | | 1.61 | | | | 5.22 | | | | 106 | |
Class R5 | | | | | | | | | | | | | | | | | | | | | | | | | | | | | | | | | | | | | | | | | | | | | | | | | | | | | | | | | | | | |
Year ended 10/31/15 | | | 8.48 | | | | 0.45 | | | | (1.77 | ) | | | (1.32 | ) | | | — | | | | — | | | | (0.39 | ) | | | (0.39 | ) | | | 6.77 | | | | (15.89 | ) | | | 7 | | | | 0.99 | (e) | | | 1.34 | (e) | | | 5.71 | (e) | | | 50 | |
Year ended 10/31/14 | | | 9.16 | | | | 0.49 | | | | (0.78 | ) | | | (0.29 | ) | | | (0.06 | ) | | | — | | | | (0.33 | ) | | | (0.39 | ) | | | 8.48 | | | | (3.20 | ) | | | 186 | | | | 0.99 | | | | 1.31 | | | | 5.54 | | | | 69 | |
Year ended 10/31/13 | | | 9.87 | | | | 0.51 | | | | (0.79 | ) | | | (0.28 | ) | | | (0.32 | ) | | | — | | | | (0.11 | ) | | | (0.43 | ) | | | 9.16 | | | | (3.01 | ) | | | 291 | | | | 0.99 | | | | 1.36 | | | | 5.21 | | | | 31 | |
Year ended 10/31/12 | | | 10.35 | | | | 0.52 | | | | 0.18 | | | | 0.70 | | | | (0.91 | ) | | | (0.24 | ) | | | (0.03 | ) | | | (1.18 | ) | | | 9.87 | | | | 7.78 | | | | 457 | | | | 0.99 | | | | 1.28 | | | | 5.42 | | | | 30 | |
Year ended 10/31/11 | | | 11.11 | | | | 0.56 | | | | (0.51 | ) | | | 0.05 | | | | (0.65 | ) | | | (0.16 | ) | | | — | | | | (0.81 | ) | | | 10.35 | | | | 0.50 | | | | 28,952 | | | | 0.98 | | | | 1.36 | | | | 5.22 | | | | 106 | |
Class R6 | | | | | | | | | | | | | | | | | | | | | | | | | | | | | | | | | | | | | | | | | | | | | | | | | | | | | | | | | | | | |
Year ended 10/31/15 | | | 8.48 | | | | 0.43 | | | | (1.75 | ) | | | (1.32 | ) | | | — | | | | — | | | | (0.39 | ) | | | (0.39 | ) | | | 6.77 | | | | (15.89 | ) | | | 37,373 | | | | 0.99 | (e) | | | 1.33 | (e) | | | 5.71 | (e) | | | 50 | |
Year ended 10/31/14 | | | 9.16 | | | | 0.49 | | | | (0.78 | ) | | | (0.29 | ) | | | (0.06 | ) | | | — | | | | (0.33 | ) | | | (0.39 | ) | | | 8.48 | | | | (3.21 | ) | | | 39,617 | | | | 0.99 | | | | 1.30 | | | | 5.54 | | | | 69 | |
Year ended 10/31/13 | | | 9.87 | | | | 0.50 | | | | (0.78 | ) | | | (0.28 | ) | | | (0.32 | ) | | | — | | | | (0.11 | ) | | | (0.43 | ) | | | 9.16 | | | | (3.01 | ) | | | 33,125 | | | | 0.99 | | | | 1.29 | | | | 5.21 | | | | 31 | |
Year ended 10/31/12(f) | | | 9.83 | | | | 0.06 | | | | 0.01 | | | | 0.07 | | | | (0.00 | ) | | | — | | | | (0.03 | ) | | | (0.03 | ) | | | 9.87 | | | | 0.66 | | | | 30,375 | | | | 0.99 | (g) | | | 1.26 | (g) | | | 5.42 | (g) | | | 30 | |
| (a) | Calculated using average shares outstanding. |
| (b) | Includes redemption fees added to shares of beneficial interest for Class A, Class B, Class C, Class R, Class Y and Class R5 shares, which were less than $0.005 per share, for fiscal years ended October 31, 2012 and prior. |
| (c) | Includes adjustments in accordance with accounting principles generally accepted in the United States of America and as such, the net asset value for financial reporting purposes and the returns based upon those net asset values may differ from the net asset value and returns for shareholder transactions. Does not include sales charges and is not annualized for periods less than one year, if applicable. |
| (d) | Portfolio turnover is calculated at the fund level and is not annualized for periods less than one year, if applicable. |
| (e) | Ratios are based on average daily net assets (000’s omitted) of $7,480, $338, $1,653, $413, $840, $38 and $38,730 for Class A, Class B, Class C, Class R, Class Y, Class R5 and Class R6 shares, respectively. |
| (f) | Commencement date of September 24, 2012 for Class R6 shares. |
24 Invesco Emerging Market Local Currency Debt Fund
Report of Independent Registered Public Accounting Firm
To the Board of Trustees of AIM Investment Funds (Invesco Investment Funds)
and Shareholders of Invesco Emerging Market Local Currency Debt Fund:
In our opinion, the accompanying statement of assets and liabilities, including the schedule of investments, and the related statements of operations and of changes in net assets and the financial highlights present fairly, in all material respects, the financial position of Invesco Emerging Market Local Currency Debt Fund (one of the funds constituting AIM Investment Funds (Invesco Investment Funds), hereafter referred to as the “Fund”) at October 31, 2015, the results of its operations for the year then ended, the changes in its net assets for each of the two years in the period then ended and the financial highlights for each of the five years in the period then ended, in conformity with accounting principles generally accepted in the United States of America. These financial statements and financial highlights (hereafter referred to as “financial statements”) are the responsibility of the Fund’s management. Our responsibility is to express an opinion on these financial statements based on our audits. We conducted our audits of these financial statements in accordance with the standards of the Public Company Accounting Oversight Board (United States). Those standards require that we plan and perform the audit to obtain reasonable assurance about whether the financial statements are free of material misstatement. An audit includes examining, on a test basis, evidence supporting the amounts and disclosures in the financial statements, assessing the accounting principles used and significant estimates made by management, and evaluating the overall financial statement presentation. We believe that our audits, which included confirmation of securities at October 31, 2015 by correspondence with the custodian and brokers, provide a reasonable basis for our opinion.
PRICEWATERHOUSECOOPERS LLP
December 23, 2015
Houston, Texas
25 Invesco Emerging Market Local Currency Debt Fund
Calculating your ongoing Fund expenses
Example
As a shareholder of the Fund, you incur two types of costs: (1) transaction costs, which may include sales charges (loads) on purchase payments or contingent deferred sales charges on redemptions, if any; and (2) ongoing costs, including management fees, distribution and/or service (12b-1) fees, and other Fund expenses. This example is intended to help you understand your ongoing costs (in dollars) of investing in the Fund and to compare these costs with ongoing costs of investing in other mutual funds. The example is based on an investment of $1,000 invested at the beginning of the period and held for the entire period May 1, 2015 through October 31, 2015.
Actual expenses
The table below provides information about actual account values and actual expenses. You may use the information in this table, together with the amount you invested, to estimate the expenses that you paid over the period. Simply divide your account value by $1,000 (for example, an $8,600 account value divided by $1,000 = 8.6), then multiply the result by the number in the table under the heading entitled “Actual Expenses Paid During Period” to estimate the expenses you paid on your account during this period.
Hypothetical example for comparison purposes
The table below also provides information about hypothetical account values and hypothetical expenses based on the Fund’s actual expense ratio and an assumed rate of return of 5% per year before expenses, which is not the Fund’s actual return.
The hypothetical account values and expenses may not be used to estimate the actual ending account balance or expenses you paid for the period. You may use this information to compare the ongoing costs of investing in the Fund and other funds. To do so, compare this 5% hypothetical example with the 5% hypothetical examples that appear in the shareholder reports of the other funds.
Please note that the expenses shown in the table are meant to highlight your ongoing costs only and do not reflect any transaction costs, such as sales charges (loads) on purchase payments or contingent deferred sales charges on redemptions, if any. Therefore, the hypothetical information is useful in comparing ongoing costs only, and will not help you determine the relative total costs of owning different funds. In addition, if these transaction costs were included, your costs would have been higher.
| | | | | | | | | | | | | | | | | | | | | | | | |
| Class | | Beginning
Account Value
(05/01/15) | | | ACTUAL | | | HYPOTHETICAL
(5% annual return before
expenses) | | | Annualized
Expense
Ratio | |
| | | Ending
Account Value
(10/31/15)1 | | | Expenses
Paid During
Period2 | | | Ending
Account Value
(10/31/15) | | | Expenses
Paid During
Period2 | | |
| A | | $ | 1,000.00 | | | $ | 901.30 | | | $ | 5.94 | | | $ | 1,018.95 | | | $ | 6.31 | | | | 1.24 | % |
| B | | | 1,000.00 | | | | 898.00 | | | | 9.52 | | | | 1,015.17 | | | | 10.11 | | | | 1.99 | |
| C | | | 1,000.00 | | | | 897.90 | | | | 9.52 | | | | 1,015.17 | | | | 10.11 | | | | 1.99 | |
| R | | | 1,000.00 | | | | 900.00 | | | | 7.14 | | | | 1,017.69 | | | | 7.58 | | | | 1.49 | |
| Y | | | 1,000.00 | | | | 902.40 | | | | 4.75 | | | | 1,020.21 | | | | 5.04 | | | | 0.99 | |
| R5 | | | 1,000.00 | | | | 903.60 | | | | 4.75 | | | | 1,020.21 | | | | 5.04 | | | | 0.99 | |
| R6 | | | 1,000.00 | | | | 902.40 | | | | 4.75 | | | | 1,020.21 | | | | 5.04 | | | | 0.99 | |
| 1 | The actual ending account value is based on the actual total return of the Fund for the period May 1, 2015 through October 31, 2015, after actual expenses and will differ from the hypothetical ending account value which is based on the Fund’s expense ratio and a hypothetical annual return of 5% before expenses. |
| 2 | Expenses are equal to the Fund’s annualized expense ratio as indicated above multiplied by the average account value over the period, multiplied by 184/365 to reflect the most recent fiscal half year. |
26 Invesco Emerging Market Local Currency Debt Fund
Approval of Investment Advisory and Sub-Advisory Contracts
The Board of Trustees (the Board) of AIM Investment Funds (Invesco Investment Funds) is required under the Investment Company Act of 1940, as amended, to approve annually the renewal of Invesco Emerging Market Local Currency Debt Fund’s (the Fund) investment advisory agreements. During contract renewal meetings held on June 9-10, 2015, the Board as a whole, and the disinterested or “independent” Trustees, who comprise over 75% of the Board, voting separately, approved the continuance for the Fund of the Master Investment Advisory Agreement with Invesco Advisers, Inc. (Invesco Advisers and the investment advisory agreement) and the Master Intergroup Sub-Advisory Contract for Mutual Funds with Invesco Asset Management Deutschland GmbH, Invesco Asset Management Limited, Invesco Asset Management (Japan) Limited, Invesco Hong Kong Limited, Invesco Senior Secured Management, Inc. and Invesco Canada Ltd. (collectively, the Affiliated Sub-Advisers and the sub-advisory contracts) for another year, effective July 1, 2015.
In evaluating the fairness and reasonableness of compensation under the Fund’s investment advisory agreement and sub-advisory contracts, the Board considered, among other things, the factors discussed below. The Board determined that continuation of the Fund’s investment advisory agreement and the sub-advisory contracts is in the best interest of the Fund and its shareholders and that the compensation payable to Invesco Advisers and the Affiliated Sub-Advisers under the agreements is fair and reasonable.
The Board’s Fund Evaluation Process
The Board’s Investments Committee has established three Sub-Committees, each of which is primarily responsible for overseeing the performance and investment management services provided by Invesco Advisers and the Affiliated Sub-Advisers to a number of the funds advised by Invesco Advisers (the Invesco Funds). The Sub-Committees meet throughout the year to review the performance of their assigned Invesco Funds, including reviewing materials prepared under the direction of the independent Senior Officer, an officer of the Invesco Funds who reports directly to the independent Trustees. Over the course of each year, the Sub-Committees meet with portfolio managers for their assigned Invesco Funds and other members of management to review the performance, investment objective(s), policies, strategies, limitations and investment risks of these funds. The Board had the benefit of reports from the Sub-Committees and Investments Committee throughout the year in considering approval of the continuance of each Invesco Fund’s investment advisory agreement and sub-advisory contracts for another year.
During the contract renewal process, the Board receives comparative performance and fee data regarding the Invesco Funds prepared by Invesco Advisers and Lipper Inc. (Lipper), an independent provider of investment company data. The Board also receives a report and this independent written evaluation from the Senior Officer. The Senior Officer’s evaluation is prepared as part of his responsibility to manage the process by which the Invesco Funds’ proposed management fees are negotiated during the annual contract renewal process to ensure they are negotiated in a manner that is at arms’ length and reasonable. In addition to meetings with Invesco Advisers and fund counsel, the independent Trustees also discuss the continuance of the investment advisory agreement and sub-advisory contracts in separate sessions with the Senior Officer and with independent legal counsel.
The Trustees recognized that the advisory fee rates for the Invesco Funds are, in many cases, the result of years of review and negotiation. The Trustees’ deliberations and conclusions in a particular year may be based in part on their deliberations and conclusions regarding these arrangements throughout the year and in prior years. The Trustees’ review and conclusions are based on the comprehensive consideration of all information presented to them and are not the result of any single determinative factor. Moreover, one Trustee may have weighed a particular piece of information or factor differently than another Trustee.
The discussion below is a summary of the Senior Officer’s independent written evaluation with respect to the Fund’s investment advisory agreement as well as a discussion of the material factors and related conclusions that formed the basis for the Board’s approval of the Fund’s investment advisory agreement and sub-advisory contracts. Unless otherwise stated, this information is current as of June 10, 2015, and does not reflect consideration of factors that became known to the Board after that date.
Factors and Conclusions and Summary of Independent Written Fee Evaluation
| A. | Nature, Extent and Quality of Services Provided by Invesco Advisers and the Affiliated Sub-Advisers |
The Board reviewed the advisory services provided to the Fund by Invesco Advisers under the Fund’s investment advisory agreement, the performance of Invesco Advisers in providing these services, and the credentials and experience of the officers and employees of Invesco Advisers who provide these services, including the Fund’s portfolio manager or managers. The Board’s review of the qualifications of Invesco Advisers to provide advisory services included the Board’s consideration of Invesco Advisers’ investment
process oversight, independent credit analysis and investment risk management. The Board also considered non-advisory services that Invesco Advisers and its affiliates provide to the Invesco Funds such as various back office support functions, equity and fixed income trading operations, internal audit, distribution, valuation and legal and compliance.
In determining whether to continue the Fund’s investment advisory agreement, the Board considered the benefits of reapproving an existing relationship and the greater uncertainty that may be associated with entering into a new relationship. The Board concluded that the nature, extent and quality of the services provided to the Fund by Invesco Advisers are appropriate and satisfactory and consistent with the terms of the Fund’s investment advisory agreement.
The Board reviewed the services that may be provided by the Affiliated Sub-Advisers under the sub-advisory contracts and the credentials and experience of the officers and employees of the Affiliated Sub-Advisers who provide these services. The Board noted that the Affiliated Sub-Advisers have offices and personnel that are located in financial centers around the world. As a result, the Affiliated Sub-Advisers can provide research and investment analysis on the markets and economies of various countries in which the Fund may invest, make recommendations regarding securities and assist with security trades. The Board concluded that the sub-advisory contracts benefit the Fund and its shareholders by permitting Invesco Advisers to use the resources and talents of the Affiliated Sub-Advisers in managing the Fund. The Board concluded that the nature, extent and quality of the services that may be provided by the Affiliated Sub-Advisers are appropriate and satisfactory and consistent with the terms of the Fund’s sub-advisory contracts.
The Board considered Fund performance as a relevant factor in considering whether to approve the investment advisory agreement. The Board did not view Fund performance as a relevant factor in considering whether to approve the sub-advisory contracts for the Fund, as no Affiliated Sub-Adviser currently manages assets of the Fund.
The Board noted that only four calendar years of comparative performance data was available for the Fund. The Board compared the Fund’s performance during the past one, three, and four calendar years to the performance of funds in the Lipper performance universe and against the Lipper Emerging Markets Local Currency Debt Funds Index. The Board noted that performance of Class A shares of the Fund was in the fourth quintile of its performance universe for the one and four year periods and the third quintile for the three year period (the first quintile being the best performing funds
27 Invesco Emerging Market Local Currency Debt Fund
and the fifth quintile being the worst performing funds. The Board noted that performance of Class A shares of the Fund was below the performance of the Index for the one year period (there being no three or four year performance data for the Index). The Trustees also reviewed more recent Fund performance and this review did not change their conclusions.
| C. | Advisory and Sub-Advisory Fees |
The Board compared the Fund’s contractual management fee rate to the contractual management fee rates of funds in the Fund’s Lipper expense group at a common asset level. The Board noted that the contractual management fee rate for Class A shares of the Fund was below the median contractual management fee rate of funds in its expense group. The Board noted that the term “contractual management fee” may include both advisory and certain administrative services fees, but that Lipper does not provide information on a fund by fund basis as to what is included. The Board noted that Invesco Advisers does not charge the Invesco Funds for the administrative services included in the term as defined by Lipper. The Board also reviewed the methodology used by Lipper in providing expense group information, which includes using each fund’s contractual management fee schedule (including any applicable breakpoints) as reported in the most recent prospectus or statement of additional information for each fund in the expense group.
The Board noted that Invesco Advisers has contractually agreed to waive fees and/or limit expenses of the Fund through at least July 31, 2015 in an amount necessary to limit total annual operating expenses to a specified percentage of average daily net assets for each class of the Fund.
The Board also compared the Fund’s effective advisory fee rate (the advisory fee rate after advisory fee waivers and before other expense limitations/waivers) to the effective advisory fee rates of other mutual funds advised by Invesco Advisers and its affiliates with investment strategies comparable to those of the Fund. The Board also noted how the Fund’s rate compared to the effective sub-adviser fee rate of five mutual funds sub-advised by Invesco Advisers.
The Board also considered the fees charged by Invesco Advisers and the Affiliated Sub-Advisers to other client accounts with investment strategies comparable to those of the Fund. The Board noted that Invesco Advisers or the Affiliated Sub-Advisers may charge lower fees to large institutional clients. Invesco Advisers reviewed with the Board the significantly greater scope of services it provides to the Invesco Funds relative to certain other types of client accounts. These additional services include provision of administrative services, officers and office space, oversight of service providers, preparation of annual registration statement updates and financial information and regulatory compliance under
the Investment Company Act of 1940, as amended.
Invesco Advisers also reviewed generally the higher frequency of shareholder purchases and redemptions in the Invesco Funds relative to the flow of assets for other client accounts. Invesco Advisers advised the Board that advance notice of redemptions is often provided to Invesco Advisers by institutional clients. The Board did note that sub-advisory fee rates charged by the Affiliated Sub-Advisers to manage the Invesco Funds and to manage other client accounts tended to be more comparable, reflecting a similar scope of services. The information received by the Board demonstrated that the aggregate services provided to the Invesco Funds were sufficiently different from those provided to institutional clients to support the difference in fees.
The Board also considered the services that may be provided by the Affiliated Sub-Advisers pursuant to the sub-advisory contracts, as well as the fees payable by Invesco Advisers to the Affiliated Sub-Advisers pursuant to the sub-advisory contracts. The Board also noted that the sub-advisory fees are not paid directly by the Fund, but rather, are payable by Invesco Advisers to the Affiliated Sub-Advisers.
| D. | Economies of Scale and Breakpoints |
The Board considered the extent to which there are economies of scale in the provision of advisory services to the Fund. The Board also considered whether the Fund benefits from economies of scale through contractual breakpoints in the Fund’s advisory fee schedule. The Board also noted that the Fund shares directly in economies of scale through lower fees charged by third party service providers based on the combined size of the Invesco Funds and other clients advised by Invesco Advisers.
| E. | Profitability and Financial Resources |
The Board reviewed information from Invesco Advisers concerning the costs of the advisory and other services that Invesco Advisers and its affiliates provide to the Fund and the Invesco Funds and the profitability of Invesco Advisers and its affiliates in providing these services. The Board received information from Invesco Advisers about the methodology used to prepare the profitability information. The Board noted that Invesco Advisers continues to operate at a net profit from services Invesco Advisers and its affiliates provide to the Invesco Funds. The Board noted that although Invesco Advisers received a minimal amount of revenues from advising the Fund, Invesco Advisers and its subsidiaries did not make a profit from managing the Fund, although the Fund does incur its share of underlying fund fees and other allocable costs. The Board received and accepted information from Invesco Advisers demonstrating that Invesco Advisers and each Affiliated Sub-Adviser are financially sound and have the resources necessary to perform their obligations under the investment advisory agreement and sub-advisory contracts.
| F. | Collateral Benefits to Invesco Advisers and its Affiliates |
The Board considered various other benefits received by Invesco Advisers and its affiliates from the relationship with the Fund, including the fees received for providing transfer agency and distribution services to the Fund. The Board considered comparative information regarding fees charged for these services, including information provided by Lipper and other independent sources. The Board considered the performance of Invesco Advisers and its affiliates in providing these services and the organizational structure employed to provide these services. The Board also considered that these services are provided to the Fund pursuant to written contracts that are reviewed and approved on an annual basis by the Board; and that the services are required for the operation of the Fund.
The Board considered the benefits realized by Invesco Advisers and the Affiliated Sub-Advisers as a result of portfolio brokerage transactions executed through “soft dollar” arrangements. Invesco Advisers noted that the Fund does not execute brokerage transactions through “soft dollar” arrangements to any significant degree.
The Board considered that the Fund’s uninvested cash and cash collateral from any securities lending arrangements may be invested in money market funds advised by Invesco Advisers pursuant to procedures approved by the Board. The Board noted that Invesco Advisers receives advisory fees from these affiliated money market funds attributable to such investments, although Invesco Advisers has contractually agreed to waive through varying periods the advisory fees payable by the Invesco Funds with respect to investments in the affiliated money market funds. The waiver is in an amount equal to 100% of the net advisory fee Invesco Advisers receives from the affiliated money market funds with respect to the Fund’s investment in the affiliated money market funds of uninvested cash, but not cash collateral. The Board concluded that the amount of advisory fees received by Invesco Advisors from the Fund’s investment of cash collateral from any securities lending arrangements in the affiliated money market funds is fair and reasonable.
28 Invesco Emerging Market Local Currency Debt Fund
Tax Information
Form 1099-DIV, Form 1042-S and other year-end tax information provide shareholders with actual calendar year amounts that should be included in their tax returns. Shareholders should consult their tax advisors.
The following distribution information is being provided as required by the Internal Revenue Code or to meet a specific state’s requirement.
The Fund designates the following amounts or, if subsequently determined to be different, the maximum amount allowable for its fiscal year ended October 31, 2015:
| | | | |
Federal and State Income Tax | |
Qualified Dividend Income* | | | 0.00 | % |
Corporate Dividends Received Deduction* | | | 0.00 | % |
U.S. Treasury Obligations* | | | 0.00 | % |
| | * | The above percentages are based on ordinary income dividends paid to shareholders during the Fund’s fiscal year. |
29 Invesco Emerging Market Local Currency Debt Fund
Trustees and Officers
The address of each trustee and officer is AIM Investment Funds (Invesco Investment Funds) (the “Trust”), 11 Greenway Plaza, Suite 1000, Houston, Texas 77046-1173. The trustees serve for the life of the Trust, subject to their earlier death, incapacitation, resignation, retirement or removal as more specifically provided in the Trust’s organizational documents. Each officer serves for a one year term or until their successors are elected and qualified. Column two below includes length of time served with predecessor entities, if any.
| | | | | | | | |
Name, Year of Birth and
Position(s) Held with the Trust | | Trustee and/
or Officer Since | | Principal Occupation(s)
During Past 5 Years | | Number of Funds in Fund Complex Overseen by Trustee | | Other Directorship(s) Held by Trustee During Past 5 Years |
| Interested Persons | | | | | | | | |
| Martin L. Flanagan1 — 1960 Trustee | | 2007 | | Executive Director, Chief Executive Officer and President, Invesco Ltd. (ultimate parent of Invesco and a global investment management firm); Advisor to the Board, Invesco Advisers, Inc. (formerly known as Invesco Institutional (N.A.), Inc.); Trustee, The Invesco Funds; Vice Chair, Investment Company Institute; and Member of Executive Board, SMU Cox School of Business Formerly: Chairman and Chief Executive Officer, Invesco Advisers, Inc. (registered investment adviser); Director, Chairman, Chief Executive Officer and President, IVZ Inc. (holding company), INVESCO Group Services, Inc. (service provider) and Invesco North American Holdings, Inc. (holding company); Director, Chief Executive Officer and President, Invesco Holding Company Limited (parent of Invesco and a global investment management firm); Director, Invesco Ltd.; Chairman, Investment Company Institute and President, Co-Chief Executive Officer, Co-President, Chief Operating Officer and Chief Financial Officer, Franklin Resources, Inc. (global investment management organization). | | 145 | | None |
Philip A. Taylor2 — 1954
Trustee, President and Principal Executive Officer | | 2006 | | Head of North American Retail and Senior Managing Director, Invesco Ltd.; Director, Co-Chairman, Co-President and Co-Chief Executive Officer, Invesco Advisers, Inc. (formerly known as Invesco Institutional (N.A.), Inc.) (registered investment adviser); Director, Chairman, Chief Executive Officer and President, Invesco Management Group, Inc. (formerly known as Invesco Aim Management Group, Inc.) (financial services holding company); Director and President, INVESCO Funds Group, Inc. (registered investment adviser and registered transfer agent); Director and Chairman, Invesco Investment Services, Inc. (formerly known as Invesco Aim Investment Services, Inc.) (registered transfer agent) and IVZ Distributors, Inc. (formerly known as INVESCO Distributors, Inc.) (registered broker dealer); Chief Executive Officer, Invesco Corporate Class Inc. (corporate mutual fund company) Director, Chairman and Chief Executive Officer, Invesco Canada Ltd. (formerly known as Invesco Trimark Ltd./Invesco Trimark Ltèe) (registered investment adviser and registered transfer agent); Trustee, President and Principal Executive Officer, The Invesco Funds (other than AIM Treasurer’s Series Trust (Invesco Treasurer’s Series Trust), Short-Term Investments Trust and Invesco Management Trust); Trustee and Executive Vice President, The Invesco Funds (AIM Treasurer’s Series Trust (Invesco Treasurer’s Series Trust), Short-Term Investments Trust and Invesco Management Trust only); Director, Invesco Investment Advisers LLC (formerly known as Van Kampen Asset Management); Director, Chief Executive Officer and President, Van Kampen Exchange Corp. Formerly: Director, President and Chairman, Invesco Inc. (holding company), Invesco Canada Holdings Inc. (holding company), Trimark Investments Ltd./Placements Trimark Ltèe and Invesco Financial Services Ltd/Services Financiers Invesco Ltèe; Chief Executive Officer, Invesco Canada Fund Inc (corporate mutual fund company); Director and Chairman, Van Kampen Investor Services Inc.; Director, Chief Executive Officer and President, 1371 Preferred Inc. (holding company) and Van Kampen Investments Inc.; Director and President, AIM GP Canada Inc. (general partner for limited partnerships) and Van Kampen Advisors, Inc.; Director and Chief Executive Officer, Invesco Trimark Dealer Inc. (registered broker dealer); Director, Invesco Distributors, Inc. (formerly known as Invesco Aim Distributors, Inc.) (registered broker dealer); Manager, Invesco PowerShares Capital Management LLC; Director, Chief Executive Officer and President, Invesco Advisers, Inc.; Director, Chairman, Chief Executive Officer and President, Invesco Aim Capital Management, Inc.; President, Invesco Trimark Dealer Inc. and Invesco Trimark Ltd./Invesco Trimark Ltèe; Director and President, AIM Trimark Corporate Class Inc. and AIM Trimark Canada Fund Inc.; Senior Managing Director, Invesco Holding Company Limited; Director and Chairman, Fund Management Company (former registered broker dealer); President and Principal Executive Officer, The Invesco Funds (AIM Treasurer’s Series Trust (Invesco Treasurer’s Series Trust), and Short-Term Investments Trust only); President, AIM Trimark Global Fund Inc. and AIM Trimark Canada Fund Inc.. | | 145 | | None |
| 1 | Mr. Flanagan is considered an interested person (within the meaning of Section 2(a)(19) of the 1940 Act) of the Trust because he is an officer of the Adviser to the Trust, and an officer and a director of Invesco Ltd., ultimate parent of the Adviser. |
| 2 | Mr. Taylor is considered an interested person (within the meaning of Section 2(a)(19) of the 1940 Act) of the Trust because he is an officer and a director of the Adviser. |
T-1 Invesco Emerging Market Local Currency Debt Fund
Trustees and Officers—(continued)
| | | | | | | | |
Name, Year of Birth and Position(s) Held with the Trust | | Trustee and/ or Officer Since | | Principal Occupation(s) During Past 5 Years | | Number of Funds in Fund Complex Overseen by Trustee | | Other Directorship(s) Held by Trustee During Past 5 Years |
| Independent Trustees | | | | | | | | |
Bruce L. Crockett — 1944 Trustee and Chair | | 2003 | | Chairman, Crockett Technologies Associates (technology consulting company) Formerly: Director, Captaris (unified messaging provider); Director, President and Chief Executive Officer, COMSAT Corporation; Chairman, Board of Governors of INTELSAT (international communications company); ACE Limited (insurance company); Independent Directors Council and Investment Company Institute | | 145 | | ALPS (Attorneys Liability Protection Society) (insurance company) and Globe Specialty Metals, Inc. (metallurgical company) |
David C. Arch — 1945 Trustee | | 2010 | | Chairman of Blistex Inc., a consumer health care products manufacturer | | 145 | | Board member of the Illinois Manufacturers’ Association; Member of the Board of Visitors, Institute for the Humanities, University of Michigan; Member of the Audit Committee of the Edward-Elmhurst Hospital |
James T. Bunch — 1942 Trustee | | 2000 | | Managing Member, Grumman Hill Group LLC (family office/private equity investments) Formerly: Founder, Green Manning & Bunch Ltd. (investment banking firm) (1988-2010); Executive Committee, United States Golf Association; and Chairman, Board of Governors, Western Golf Association | | 145 | | Chairman of the Board of Trustees, Evans Scholars Foundation; and Chairman of the Board, Denver Film Society |
Rodney F. Dammeyer — 1940 Trustee | | 2010 | | Chairman of CAC, LLC, (private company offering capital investment and management advisory services) Formerly: Prior to 2001, Managing Partner at Equity Group Corporate Investments; Prior to 1995, Chief Executive Officer of Itel Corporation (formerly Anixter International); Prior to 1985, experience includes Senior Vice President and Chief Financial Officer of Household International, Inc., Executive Vice President and Chief Financial Officer of Northwest Industries, Inc. and Partner of Arthur Andersen & Co.; From 1987 to 2010, Director/Trustee of investment companies in the Van Kampen Funds complex | | 145 | | Director of Quidel Corporation and Stericycle, Inc. |
Albert R. Dowden — 1941 Trustee | | 2003 | | Director of a number of public and private business corporations, including the Boss Group, Ltd. (private investment and management); Nature’s Sunshine Products, Inc. and Reich & Tang Funds (5 portfolios) (registered investment company) Formerly: Director, Homeowners of America Holding Corporation/Homeowners of America Insurance Company (property casualty company); Director, Continental Energy Services, LLC (oil and gas pipeline service); Director, CompuDyne Corporation (provider of product and services to the public security market) and Director, Annuity and Life Re (Holdings), Ltd. (reinsurance company); Director, President and Chief Executive Officer, Volvo Group North America, Inc.; Senior Vice President, AB Volvo; Director of various public and private corporations; Chairman, DHJ Media, Inc.; Director, Magellan Insurance Company; and Director, The Hertz Corporation, Genmar Corporation (boat manufacturer), National Media Corporation; Advisory Board of Rotary Power International (designer, manufacturer, and seller of rotary power engines); and Chairman, Cortland Trust, Inc. (registered investment company) | | 145 | | Director of: Nature’s Sunshine Products, Inc., Reich & Tang Funds, Homeowners of America Holding Corporation/ Homeowners of America Insurance Company, the Boss Group |
Jack M. Fields — 1952 Trustee | | 2003 | | Chief Executive Officer, Twenty First Century Group, Inc. (government affairs company); Owner and Chief Executive Officer, Dos Angeles Ranch, L.P. (cattle, hunting, corporate entertainment); and Discovery Global Education Fund (non-profit) Formerly: Chief Executive Officer, Texana Timber LP (sustainable forestry company); Director of Cross Timbers Quail Research Ranch (non-profit); and member of the U.S. House of Representatives | | 145 | | Insperity, Inc. (formerly known as Administaff) |
Prema Mathai-Davis — 1950 Trustee | | 2003 | | Retired. Formerly: Chief Executive Officer, YWCA of the U.S.A. | | 145 | | None |
Larry Soll — 1942 Trustee | | 1997 | | Retired. Formerly: Chairman, Chief Executive Officer and President, Synergen Corp. (a biotechnology company) | | 145 | | None |
Hugo F. Sonnenschein — 1940 Trustee | | 2010 | | President Emeritus and Honorary Trustee of the University of Chicago and the Adam Smith Distinguished Service Professor in the Department of Economics at the University of Chicago. Prior to 2000, President of the University of Chicago | | 145 | | Trustee of the University of Rochester and a member of its investment committee; Member of the National Academy of Sciences and the American Philosophical Society; Fellow of the American Academy of Arts and Sciences |
Raymond Stickel, Jr. — 1944 Trustee | | 2005 | | Retired. Formerly: Director, Mainstay VP Series Funds, Inc. (25 portfolios) and Partner, Deloitte & Touche | | 145 | | None |
T-2 Invesco Emerging Market Local Currency Debt Fund
Trustees and Officers—(continued)
| | | | | | | | |
Name, Year of Birth and Position(s) Held with the Trust | | Trustee and/ or Officer Since | | Principal Occupation(s) During Past 5 Years | | Number of Funds in Fund Complex Overseen by Trustee | | Other Directorship(s) Held by Trustee During Past 5 Years |
| Independent Trustees—(continued) |
Suzanne H. Woolsey — 1941 Trustee | | 2014 | | Chief Executive Officer of Woolsey Partners LLC | | 145 | | Emeritus Chair of the Board of Trustees of the Institute for Defense Analyses; Trustee of Colorado College; Trustee of California Institute of Technology; Prior to 2014, Director of Fluor Corp.; Prior to 2010, Trustee of the German Marshall Fund of the United States; Prior to 2010 Trustee of the Rocky Mountain Institute |
| Other Officers | | | | | | | | |
Russell C. Burk — 1958
Senior Vice President and Senior Officer | | 2005 | | Senior Vice President and Senior Officer, The Invesco Funds | | N/A | | N/A |
John M. Zerr — 1962
Senior Vice President, Chief Legal Officer and Secretary | | 2006 | | Director, Senior Vice President, Secretary and General Counsel, Invesco Management Group, Inc. (formerly known as Invesco Aim Management Group, Inc.) and Van Kampen Exchange Corp.; Senior Vice President, Invesco Advisers, Inc. (formerly known as Invesco Institutional (N.A.), Inc.) (registered investment adviser); Senior Vice President and Secretary, Invesco Distributors, Inc. (formerly known as Invesco Aim Distributors, Inc.); Director, Vice President and Secretary, Invesco Investment Services, Inc. (formerly known as Invesco Aim Investment Services, Inc.) and IVZ Distributors, Inc. (formerly known as INVESCO Distributors, Inc.); Director and Vice President, INVESCO Funds Group, Inc.; Senior Vice President, Chief Legal Officer and Secretary, The Invesco Funds; Managing Director, Invesco PowerShares Capital Management LLC; Director, Secretary and General Counsel, Invesco Investment Advisers LLC (formerly known as Van Kampen Asset Management); Secretary and General Counsel, Invesco Capital Markets, Inc. (formerly known as Van Kampen Funds Inc.) and Chief Legal Officer, PowerShares Exchange-Traded Fund Trust, PowerShares Exchange-Traded Fund Trust II, PowerShares India Exchange-Traded Fund Trust, PowerShares Actively Managed Exchange-Traded Fund Trust, and PowerShares Actively Managed Exchange-Traded Commodity Fund Trust Formerly: Director and Vice President, Van Kampen Advisors Inc.; Director, Vice President, Secretary and General Counsel, Van Kampen Investor Services Inc.; Director, Invesco Distributors, Inc. (formerly known as Invesco Aim Distributors, Inc.); Director, Senior Vice President, General Counsel and Secretary, Invesco Aim Advisers, Inc. and Van Kampen Investments Inc.; Director, Vice President and Secretary, Fund Management Company; Director, Senior Vice President, Secretary, General Counsel and Vice President, Invesco Aim Capital Management, Inc.; Chief Operating Officer and General Counsel, Liberty Ridge Capital, Inc. (an investment adviser); Vice President and Secretary, PBHG Funds (an investment company) and PBHG Insurance Series Fund (an investment company); Chief Operating Officer, General Counsel and Secretary, Old Mutual Investment Partners (a broker-dealer); General Counsel and Secretary, Old Mutual Fund Services (an administrator) and Old Mutual Shareholder Services (a shareholder servicing center); Executive Vice President, General Counsel and Secretary, Old Mutual Capital, Inc. (an investment adviser); and Vice President and Secretary, Old Mutual Advisors Funds (an investment company) | | N/A | | N/A |
Sheri Morris — 1964
Vice President, Treasurer and Principal Financial Officer | | 2003 | | Vice President, Treasurer and Principal Financial Officer, The Invesco Funds; Vice President, Invesco Advisers, Inc. (formerly known as Invesco Institutional (N.A.), Inc.) (registered investment adviser); and Vice President, PowerShares Exchange-Traded Fund Trust, PowerShares Exchange-Traded Fund Trust II, PowerShares India Exchange-Traded Fund Trust, PowerShares Actively Managed Exchange-Traded Fund Trust, and PowerShares Actively Managed Exchange-Traded Commodity Fund Trust Formerly: Vice President, Invesco Aim Advisers, Inc., Invesco Aim Capital Management, Inc. and Invesco Aim Private Asset Management, Inc.; Assistant Vice President and Assistant Treasurer, The Invesco Funds and Assistant Vice President, Invesco Advisers, Inc., Invesco Aim Capital Management, Inc. and Invesco Aim Private Asset Management, Inc.; and Treasurer, PowerShares Exchange-Traded Fund Trust, PowerShares Exchange-Traded Fund Trust II, PowerShares India Exchange-Traded Fund Trust and PowerShares Actively Managed Exchange-Traded Fund Trust | | N/A | | N/A |
T-3 Invesco Emerging Market Local Currency Debt Fund
Trustees and Officers—(continued)
| | | | | | | | |
Name, Year of Birth and
Position(s) Held with the Trust | | Trustee and/
or Officer Since | | Principal Occupation(s)
During Past 5 Years | | Number of Funds in Fund Complex Overseen by Trustee | | Other Directorship(s) Held by Trustee During Past 5 Years |
| Other Officers—(continued) | | | | | | | | |
Karen Dunn Kelley — 1960
Vice President | | 2003 | | Senior Managing Director, Investments, Invesco Ltd.; Director, Co-President, Co-Chief Executive Officer, and Co-Chairman, Invesco Advisers, Inc. (formerly known as Invesco Institutional (N.A.), Inc.) (registered investment adviser); Chairman, Invesco Senior Secured Management, Inc.; Senior Vice President, Invesco Management Group, Inc. (formerly known as Invesco Aim Management Group, Inc.); Executive Vice President, Invesco Distributors, Inc. (formerly known as Invesco Aim Distributors, Inc.); Director, Invesco Mortgage Capital Inc. and Invesco Management Company Limited; Vice President, The Invesco Funds (other than AIM Treasurer’s Series Trust (Invesco Treasurer’s Series Trust), Short-Term Investments Trust and Invesco Management Trust); and President and Principal Executive Officer, The Invesco Funds (AIM Treasurer’s Series Trust (Invesco Treasurer’s Series Trust), Short-Term Investments Trust and Invesco Management Trust only) Formerly: Director and President, INVESCO Asset Management (Bermuda) Ltd., Director, INVESCO Global Asset Management Limited and INVESCO Management S.A.; Senior Vice President, Van Kampen Investments Inc. and Invesco Advisers, Inc. (formerly known as Invesco Institutional (N.A.), Inc.) (registered investment adviser); Vice President, Invesco Advisers, Inc. (formerly known as Invesco Institutional (N.A.), Inc.); Director of Cash Management and Senior Vice President, Invesco Advisers, Inc. and Invesco Aim Capital Management, Inc.; Director and President, Fund Management Company; Chief Cash Management Officer, Director of Cash Management, Senior Vice President, and Managing Director, Invesco Aim Capital Management, Inc.; Director of Cash Management, Senior Vice President, and Vice President, Invesco Advisers, Inc. and The Invesco Funds (AIM Treasurer’s Series Trust (Invesco Treasurer’s Series Trust), and Short-Term Investments Trust only) | | N/A | | N/A |
Crissie M. Wisdom — 1969 Anti-Money Laundering Compliance Officer | | 2013 | | Anti-Money Laundering Compliance Officer, Invesco Advisers, Inc. (formerly known as Invesco Institutional (N.A.), Inc.) (registered investment adviser), Invesco Capital Markets, Inc. (formerly known as Van Kampen Funds Inc.), Invesco Distributors, Inc., Invesco Investment Services, Inc., Invesco Management Group, Inc., Van Kampen Exchange Corp., The Invesco Funds, and PowerShares Exchange-Traded Fund Trust, PowerShares Exchange-Traded Fund Trust II, PowerShares India Exchange-Traded Fund Trust, PowerShares Actively Managed Exchange-Traded Fund Trust and PowerShares Actively Managed Exchange-Traded Commodity Fund Trust; Anti-Money Laundering Compliance Officer and Bank Secrecy Act Officer, INVESCO National Trust Company and Invesco Trust Company; and Fraud Prevention Manager and Controls and Risk Analysis Manager for Invesco Investment Services, Inc.. | | N/A | | N/A |
Lisa O. Brinkley — 1959 Chief Compliance Officer | | 2015 | | Senior Vice President and Chief Compliance Officer, Invesco Advisers, Inc. (registered investment adviser) (formerly known as Invesco Institutional (N.A., Inc.); and Chief Compliance Officer, The Invesco Funds Formerly: Global Assurance Officer, Invesco Ltd. and Vice President, The Invesco Funds; Chief Compliance Officer, Invesco Distributors, Inc. (formerly known as Invesco Aim Distributors, Inc.), Invesco Investment Services, Inc.(formerly known as Invesco Aim Investment Services, Inc.) and Van Kampen Investor Services Inc.; Senior Vice President, Invesco Management Group, Inc.; Senior Vice President and Chief Compliance Officer, Invesco Advisers, Inc. and The Invesco Funds; Vice President and Chief Compliance Officer, Invesco Aim Capital Management, Inc. and Invesco Distributors, Inc.; Vice President, Invesco Investment Services, Inc. and Fund Management Company. | | N/A | | N/A |
The Statement of Additional Information of the Trust includes additional information about the Fund’s Trustees and is available upon request, without charge, by calling 1.800.959.4246. Please refer to the Fund’s prospectus for information on the Fund’s sub-advisers.
| | | | | | |
Office of the Fund 11 Greenway Plaza, Suite 1000 Houston, TX 77046-1173 | | Investment Adviser Invesco Advisers, Inc. 1555 Peachtree Street, N.E. Atlanta, GA 30309 | | Distributor
Invesco Distributors, Inc. 11 Greenway Plaza, Suite 1000 Houston, TX 77046-1173 | | Auditors PricewaterhouseCoopers LLP 1000 Louisiana Street, Suite 5800 Houston, TX 77002-5678 |
| | | |
| | | | | | |
Counsel to the Fund Stradley Ronon Stevens & Young, LLP 2005 Market Street, Suite 2600 Philadelphia, PA 19103-7018 | | Counsel to the Independent Trustees Goodwin Procter LLP 901 New York Avenue, N.W. Washington, D.C. 20001 | | Transfer Agent Invesco Investment Services, Inc. 11 Greenway Plaza, Suite 1000 Houston, TX 77046-1173 | | Custodian State Street Bank and Trust Company 225 Franklin Street Boston, MA 02110-2801 |
T-4 Invesco Emerging Market Local Currency Debt Fund

Invesco mailing information
Send general correspondence to Invesco Investment Services, Inc., P.O. Box 219078, Kansas City, MO 64121-9078.
Important notice regarding delivery of security holder documents
To reduce Fund expenses, only one copy of most shareholder documents may be mailed to shareholders with multiple accounts at the same address (Householding). Mailing of your shareholder documents may be householded indefinitely unless you instruct us otherwise. If you do not want the mailing of these documents to be combined with those for other members of your household, please contact Invesco Investment Services, Inc. at 800 959 4246 or contact your financial institution. We will begin sending you individual copies for each account within 30 days after receiving your request.
Fund holdings and proxy voting information
The Fund provides a complete list of its holdings four times in each fiscal year, at the quarter ends. For the second and fourth quarters, the lists appear in the Fund’s semiannual and annual reports to shareholders. For the first and third quarters, the Fund files the lists with the Securities and Exchange Commission (SEC) on Form N-Q. The most recent list of portfolio holdings is available at invesco.com/completeqtrholdings. Shareholders can also look up the Fund’s Forms N-Q on the SEC website at sec.gov. Copies of the Fund’s Forms N-Q may be reviewed and copied at the SEC Public Reference Room in Washington, D.C. You can obtain information on the operation of the Public Reference Room, including information about duplicating fee charges, by calling 202 551 8090 or 800 732 0330, or by electronic request at the following email address: publicinfo@sec.gov. The SEC file numbers for the Fund are shown below.
A description of the policies and procedures that the Fund uses to determine how to vote proxies relating to portfolio securities is available without charge, upon request, from our Client Services department at 800 959 4246 or at invesco.com/proxyguidelines. The information is also available on the SEC website, sec.gov.
| | |
Information regarding how the Fund voted proxies related to its portfolio securities during the most recent 12-month period ended June 30 is available at invesco.com/proxysearch. The information is also available on the SEC website, sec.gov. Invesco Advisers, Inc. is an investment adviser; it provides investment advisory services to individual and institutional clients and does not sell securities. Invesco Distributors, Inc. is the US distributor for Invesco Ltd.’s retail mutual funds, exchange-traded funds and institutional money market funds. Both are wholly owned, indirect subsidiaries of Invesco Ltd. | |  |
| | | | |
| SEC file numbers: 811-05426 and 033-19338 | | EMLCD-AR-1 | | Invesco Distributors, Inc. |
| | | | |
| | |
 | | Annual Report to Shareholders | | October 31, 2015 |
| | |
| | Invesco Emerging Markets Equity Fund |
| | Nasdaq: |
| | A: IEMAX n C: IEMCX n R: IEMRX n Y: IEMYX n R5: IEMIX n R6: EMEFX |

Letters to Shareholders
| | | | |

Philip Taylor | | | | Dear Shareholders: This annual report includes information about your Fund, including performance data and a complete list of its investments as of the close of the reporting period. Inside is a discussion of how your Fund was managed and the factors that affected its performance during the reporting period. I hope you find this report of interest. The US economy expanded and unemployment declined throughout the reporting period. Continuing low energy prices benefited consumers, but a strong US dollar crimped corporate profits. The US Federal Reserve signaled that it was increasingly likely to raise interest rates, based on generally positive economic data, but uncertainty remained about when it might act. Overseas, the story was much different. Low energy prices hurt the economies of some oil-producing nations, such as Brazil and Russia. During the reporting period, the European Central |
Bank as well as central banks in China and Japan – among other countries – either instituted or maintained extraordinarily accommodative monetary policies in response to economic weakness.
Investor uncertainty, such as we saw for much of the reporting period – and market volatility, such as we saw at the end of the reporting period – are unfortunate facts of life when it comes to investing. Some investors use these things as excuses to delay saving and investing for their long-term financial goals. That’s why Invesco encourages investors to work with a professional financial adviser who can stress the importance of starting to save and invest early and the importance of adhering to a disciplined investment plan – when times are good and when they’re uncertain. A financial adviser who knows your unique financial situation, investment goals and risk tolerance can be an invaluable partner as you seek to achieve your financial goals. He or she can offer a long-term perspective when markets are volatile and time-tested advice and guidance when your financial situation or investment goals change.
Timely information when and where you want it
Invesco’s efforts to help investors achieve their financial objectives include providing individual investors and financial professionals with timely information about the markets, the economy and investing – whenever and wherever they want it.
Our website, invesco.com/us, offers a wide range of market insights and investment perspectives. On the website, you’ll find detailed information about our funds, including prices, performance, holdings and portfolio manager commentaries. You can access information about your account by completing a simple, secure online registration. Click on the “Need to register” link in the “Account Access” box on our homepage to get started.
Invesco’s mobile apps for iPhone® and iPad® (both available free from the App StoreSM) allow you to obtain the same detailed information, monitor your account and create customizable watch lists. Also, they allow you to access investment insights from our investment leaders, market strategists, economists and retirement experts. You can sign up to be alerted when new commentary is added, and you can watch portfolio manager videos and have instant access to Invesco news and updates wherever you may be.
In addition to the resources accessible on our website and through our mobile app, you can obtain timely updates to help you stay informed about the markets, the economy and investing by connecting with Invesco on Twitter, LinkedIn or Facebook. You can access our blog at blog.invesco.us.com. Our goal is to provide you the information you want, when and where you want it.
Have questions?
For questions about your account, feel free to contact an Invesco client services representative at 800 959 4246. For Invesco-related questions or comments, please email me directly at phil@invesco.com.
All of us at Invesco look forward to serving your investment management needs for many years to come. Thank you for investing with us.
Sincerely,

Philip Taylor
Senior Managing Director, Invesco Ltd.
iPhone and iPad are trademarks of Apple Inc., registered in the US and other countries. App Store is a service mark of Apple Inc. Invesco Distributors, Inc. is not affiliated with Apple Inc.
2 Invesco Emerging Markets Equity Fund
| | | | | | |

Bruce Crockett | | | | Dear Fellow Shareholders: Among the many important lessons I’ve learned in more than 40 years in a variety of business endeavors is the value of a trusted advocate. As independent chair of the Invesco Funds Board, I can assure you that the members of the Board are strong advocates for the interests of investors in Invesco’s mutual funds. We work hard to represent your interests through oversight of the quality of the investment management services your funds receive and other matters important to your investment, including but not limited to: |
| | | | n | | Ensuring that Invesco offers a diverse lineup of mutual funds that your financial adviser can use to strive to meet your financial needs as your investment goals change over time. |
| | | | n | | Monitoring how the portfolio management teams of the Invesco funds are performing in light of changing economic and market conditions. |
| n | | Assessing each portfolio management team’s investment performance within the context of the investment strategy described in the fund’s prospectus. |
| n | | Monitoring for potential conflicts of interests that may impact the nature of the services that your funds receive. |
We believe one of the most important services we provide our fund shareholders is the annual review of the funds’ advisory and sub-advisory contracts with Invesco Advisers and its affiliates. This review is required by the Investment Company Act of 1940 and focuses on the nature and quality of the services Invesco provides as the adviser to the Invesco funds and the reasonableness of the fees that it charges for those services. Each year, we spend months carefully reviewing information received from Invesco and a variety of independent sources, such as performance and fee data prepared by Lipper Inc., an independent, third-party firm widely recognized as a leader in its field. We also meet with our independent legal counsel and other independent advisers to review and help us assess the information that we have received. Our goal is to assure that you receive quality investment management services for a reasonable fee.
I trust the measures outlined above provide assurance that you have a worthy advocate when it comes to choosing the Invesco Funds.
As always, please contact me at bruce@brucecrockett.com with any questions or concerns you may have. On behalf of the Board, we look forward to continuing to represent your interests and serving your needs.
Sincerely,

Bruce L. Crockett
Independent Chair
Invesco Funds Board of Trustees
3 Invesco Emerging Markets Equity Fund
Management’s Discussion of Fund Performance
Performance summary
For the fiscal year ended October 31, 2015, Class A shares of Invesco Emerging Markets Equity Fund (the Fund), at net asset value (NAV), outperformed the Fund’s style-specific benchmark, the MSCI Emerging Markets Index.
Your Fund’s long-term performance appears later in this report.
Fund vs. Indexes
Total returns, 10/31/14 to 10/31/15, at net asset value (NAV). Performance shown does not include applicable contingent deferred sales charges (CDSC) or front-end sales charges, which would have reduced performance.
| | | | | |
| Class A Shares | | | | -13.57 | % |
| Class C Shares | | | | -14.27 | |
| Class R Shares | | | | -13.71 | |
| Class Y Shares | | | | -13.40 | |
| Class R5 Shares | | | | -13.40 | |
| Class R6 Shares | | | | -13.38 | |
| MSCI EAFE Index▼ (Broad Market Index) | | | | -0.07 | |
| MSCI Emerging Markets Index▼ (Style-Specific Index) | | | | -14.53 | |
| Lipper Emerging Market Funds Index¡ (Peer Group Index) | | | | -15.26 | |
Source(s): ▼FactSet Research Systems Inc. ¡Lipper Inc.
Market conditions and your Fund
International markets experienced increased volatility during the fiscal year ended October 31, 2015, driven largely by the continued slowdown in energy markets and the economic downturn in China. Developed markets were generally able to withstand these headwinds, even as more fragile emerging markets began to falter.
As the reporting period began in late 2014, international equity markets moved higher, although economic growth appeared to be somewhat stronger in the US than in the rest of the world. Equity markets globally were recovering from the initial crash of oil prices when OPEC added additional uncertainty by deciding to maintain high production despite low prices and slowing global growth. In this environment, commodity-based economies and most currencies underperformed those of the US.
Global markets were rattled again
amid growing concerns that Greece and the eurozone would fail to reach an agreement on a financial bailout plan. However, those fears subsided when a bailout was ultimately approved. The eurozone also benefited from generally positive economic data, which helped markets weather subsequent economic volatility.
In the summer of 2015, fears of a potential economic slowdown in China dominated headlines. The combination of a slowing Chinese economy, a sharp sell-off in domestic Chinese equities and the devaluation of China’s currency, the renminbi, contributed to a strong correction in global equity markets. Emerging markets, in particular, were hard hit by events in China and by continued weak commodity prices – as well as by the US Federal Reserve’s decision to delay raising interest rates, which increased investor uncertainty and market volatility.
The Fund stayed true to its process by emphasizing its quality
orientation in stock selection. Our stock selection in the materials, energy, consumer discretionary and industrials sectors made the largest contribution to the Fund’s results versus its style-specific benchmark. Holdings in the financials, telecommunication services, consumer staples, health care and information technology (IT) sectors detracted from performance for the reporting period.
From a geographic perspective, all geographic regions posted negative absolute returns for the reporting period. Stock selection in the Asia/Pacific region and Europe positively affected the Fund’s performance relative to its style-specific benchmark. Conversely, stock selection in Africa/Mideast and Latin America detracted from relative performance.
Within the Asia/Pacific region, Zhuzhou CSR Times Electric, a locomotive technology specialist, benefited from increased investment in Chinese infrastructure during the reporting period. Also within the region, Shenzhou International Group, a Chinese exporter and textile company, benefited from strong sales of its top customers, including Nike (not a Fund holding). Chinese currency weakness also helped boost Shenzhou’s results.
Within the financials sector, China Construction Bank (not held at the end of the reporting period), one of the largest banks in China, benefited from declining Chinese interest rates. The bank experienced increased volumes and lower non-performing loan provisions, which boosted the company’s stock price.
Conversely, Samsung Electronics detracted from Fund performance. The company’s stock was hurt by the difficult and competitive smartphone market. Also detracting from Fund performance was BB Seguridade Participacoes,
| | | | | |
Portfolio Composition | |
By sector | | | | % of total net assets | |
| | | | | |
| Financials | | | | 29.0 | % |
| Information Technology | | | | 21.5 | |
| Consumer Discretionary | | | | 18.9 | |
| Consumer Staples | | | | 17.0 | |
| Industrials | | | | 7.0 | |
| Health Care | | | | 4.4 | |
| Money Market Funds Plus Other Assets Less Liabilities | | | | 2.2 | |
| | | | | | | | | |
Top 10 Equity Holdings* |
| | | | % of total net assets | | |
| | | | | | | | | |
| 1. | | Tencent Holdings Ltd. | | | | 5.4 | % |
| 2. | | Taiwan Semiconductor Manufacturing Co. Ltd. | | | | 5.2 | |
| 3. | | Samsung Electronics Co., Ltd. | | | | 4.4 | |
| 4. | | Ping An Insurance (Group) Co. of China Ltd.-Class H | | | | 3.2 | |
| 5. | | President Chain Store Corp. | | | | 3.2 | |
| 6. | | Shenzhou International Group Holdings Ltd. | | | | 2.7 | |
| 7. | | Industrial & Commercial Bank of China Ltd.-Class H | | | | 2.7 | |
| 8. | | Baidu, Inc.-ADR | | | | 2.6 | |
| 9. | | Mr. Price Group Ltd. | | | | 2.6 | |
| 10. | | Bank of China Ltd.-Class H | | | | 2.5 | |
| | | | | |
Total Net Assets | | | | $25.9 million | |
| |
| Total Number of Holdings* | | | | 49 | |
The Fund’s holdings are subject to change, and there is no assurance that the Fund will continue to hold any particular security.
*Excluding money market fund holdings.
Data presented here are as of October 31, 2015.
4 Invesco Emerging Markets Equity Fund
Brazilian insurance broker. The weak local economy and depreciating currency negatively affected the stock’s performance. The stock price of retailer Via Varejo (not held at the end of the reporting period), declined due to continued weakness in the Brazilian economy.
Relative to its style-specific benchmark, the Fund ended the reporting period with overweight positions in the consumer discretionary, health care, industrials and IT sectors; and underweight positions in the energy, financials, materials, and telecommunication services sectors.
Geographically, the Fund maintained overweight positions in Brazil, China and Indonesia, and underweight positions in Hong Kong, South Korea, Malaysia, Russia, South Africa, Taiwan, Thailand and Turkey throughout the reporting period.
Market volatility continued from the last reporting period. While there are segments of the market that we continue to find attractive, particularly with a long-term perspective, valuations for the broader market are not inexpensive. We remain cautious, mindful of our mandate to provide protection in challenging markets, and are focused on high-quality companies with attractive valuations.
Thank you for your investment in Invesco Emerging Markets Equity Fund.
The views and opinions expressed in management’s discussion of Fund performance are those of Invesco Advisers, Inc. These views and opinions are subject to change at any time based on factors such as market and economic conditions. These views and opinions may not be relied upon as investment advice or recommendations, or as an offer for a particular security. The information is not a complete analysis of every aspect of any market, country, industry, security or the Fund. Statements of fact are from sources considered reliable, but Invesco Advisers, Inc. makes no representation or warranty as to their completeness or accuracy. Although historical performance is no guarantee of future results, these insights may help you understand our investment management philosophy.
See important Fund and, if applicable, index disclosures later in this report.
| | |
 | | Ingrid Baker Chartered Financial Analyst, Portfolio Manager, is manager of Invesco Emerging Markets Equity Fund. |
She joined Invesco in 1999. Ms. Baker earned a BA in international politics from Oberlin College and an MBA in finance from the University of Navarra.
Assisted by Invesco’s Global Core Equity Team
5 Invesco Emerging Markets Equity Fund
Your Fund’s Long-Term Performance
Results of a $10,000 Investment – Oldest Share Class(es) Since Inception
Fund and index data from 5/31/11
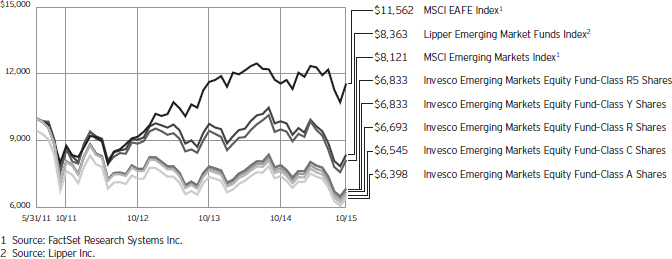
Past performance cannot guarantee comparable future results.
The data shown in the chart include reinvested distributions, applicable sales charges and Fund expenses including
management fees. Index results include reinvested dividends, but they do not reflect sales charges. Performance of the peer group, if applicable, reflects fund expenses and management fees;
performance of a market index does not. Performance shown in the chart and table(s) does not reflect deduction of taxes a shareholder would pay on Fund distributions or sale of Fund shares.
continued from page 8
Other information
| n | | The returns shown in management’s discussion of Fund performance are based on net asset values (NAVs) calculated for shareholder transactions. Generally accepted accounting principles require adjustments to be made to the net assets of the Fund at period end for financial reporting purposes, and as such, the NAVs for shareholder transactions and the returns based on those NAVs may differ from the NAVs and returns reported in the Financial Highlights. |
| n | | Industry classifications used in this report are generally according to the Global Industry Classification Standard, which was developed by and is the exclusive property and a service mark of MSCI Inc. and Standard & Poor’s. |
6 Invesco Emerging Markets Equity Fund
| | | | | |
| Average Annual Total Returns |
As of 10/31/15, including maximum applicable sales charges |
| | | | | |
| |
| Class A Shares | | | | | |
| Inception (5/31/11) | | | | -9.61 | % |
| 1 Year | | | | -18.30 | |
| |
| Class C Shares | | | | | |
| Inception (5/31/11) | | | | -9.14 | % |
| 1 Year | | | | -15.12 | |
| |
| Class R Shares | | | | | |
| Inception (5/31/11) | | | | -8.69 | % |
| 1 Year | | | | -13.71 | |
| |
| Class Y Shares | | | | | |
| Inception (5/31/11) | | | | -8.26 | % |
| 1 Year | | | | -13.40 | |
| |
| Class R5 Shares | | | | | |
| Inception (5/31/11) | | | | -8.26 | % |
| 1 Year | | | | -13.40 | |
| |
| Class R6 Shares | | | | | |
| Inception | | | | -8.30 | % |
| 1 Year | | | | -13.38 | |
Class R6 shares incepted on September 24, 2012. Performance shown prior to that date is that of Class A shares and includes the 12b-1 fees applicable to Class A shares.
The performance data quoted represent past performance and cannot guarantee comparable future results; current performance may be lower or higher. Please visit invesco.com/performance for the most recent month-end performance. Performance figures reflect reinvested distributions, changes in net asset value and the effect of the maximum sales charge unless otherwise stated. Investment return and principal value will fluctuate so that you may have a gain or loss when you sell shares.
The net annual Fund operating expense ratio set forth in the most recent Fund prospectus as of the date of this report for Class A, Class C, Class R, Class Y, Class R5 and Class R6 shares was 1.87%, 2.62%, 2.12%, 1.62%, 1.62% and 1.62%, respectively.1 The total annual Fund operating expense ratio set forth in the most recent Fund prospectus as of the date of this report for Class A, Class C, Class R, Class Y, Class R5 and Class R6 shares was 2.59%, 3.34%, 2.84%, 2.34%, 2.04% and 2.02%, respectively. The expense ratios presented above may vary from the expense ratios presented in other sections of this report that are based on expenses
| | | | | |
| Average Annual Total Returns |
As of 9/30/15, the most recent calendar quarter end, including maximum applicable sales charges |
| | | | | |
| |
| Class A Shares | | | | | |
| Inception (5/31/11) | | | | -10.90 | % |
| 1 Year | | | | -21.58 | |
| |
| Class C Shares | | | | | |
| Inception (5/31/11) | | | | -10.38 | % |
| 1 Year | | | | -18.37 | |
| |
| Class R Shares | | | | | |
| Inception (5/31/11) | | | | -9.94 | % |
| 1 Year | | | | -17.10 | |
| |
| Class Y Shares | | | | | |
| Inception (5/31/11) | | | | -9.54 | % |
| 1 Year | | | | -16.81 | |
| |
| Class R5 Shares | | | | | |
| Inception (5/31/11) | | | | -9.50 | % |
| 1 Year | | | | -16.68 | |
| |
| Class R6 Shares | | | | | |
| Inception | | | | -9.57 | % |
| 1 Year | | | | -16.79 | |
incurred during the period covered by this report.
Class A share performance reflects the maximum 5.50% sales charge, and Class C share performance reflects the applicable contingent deferred sales charge (CDSC) for the period involved. The CDSC on Class C shares is 1% for the first year after purchase. Class R, Class Y, Class R5 and Class R6 shares do not have a front-end sales charge or a CDSC; therefore, performance is at net asset value.
The performance of the Fund’s share classes will differ primarily due to different sales charge structures and class expenses.
Fund performance reflects any applicable fee waivers and/or expense reimbursements. Had the adviser not waived fees and/or reimbursed expenses currently or in the past, returns would have been lower. See current prospectus for more information.
| 1 | Total annual Fund operating expenses after any contractual fee waivers and/or expense reimbursements by the adviser in effect through at least February 28, 2017. See current prospectus for more information. |
7 Invesco Emerging Markets Equity Fund
Invesco Emerging Markets Equity Fund’s investment objective is long-term growth of capital.
| n | | Unless otherwise stated, information presented in this report is as of October 31, 2015, and is based on total net assets. |
| n | | Unless otherwise noted, all data provided by Invesco. |
| n | | To access your Fund’s reports/prospectus, visit invesco.com/fundreports. |
About share classes
| n | | Class R shares are generally available only to employer sponsored retirement and benefit plans. Please see the prospectus for more information. |
| n | | Class Y shares are available only to certain investors. Please see the prospectus for more information. |
| n | | Class R5 shares and Class R6 shares are primarily intended for employer sponsored retirement and benefit plans that meet certain standards and for institutional investors. Please see the prospectus for more information. |
Principal risks of investing
in the Fund
| n | | Depositary receipts risk. Depositary receipts involve many of the same risks as those associated with direct investment in foreign securities. In addition, the underlying issuers of certain depositary receipts, particularly unsponsored or unregistered depositary receipts, are under no obligation to distribute shareholder communications to the holders of such receipts or to pass through to them any voting rights with respect to the deposited securities. |
| n | | Developing/emerging markets securities risk. The prices of securities issued by foreign companies and governments located in developing/emerging markets countries may be affected more negatively by inflation, devaluation of their currencies, higher transaction costs, delays in settlement, adverse political developments, the introduction of capital controls, withholding taxes, nationalization of private assets, expropriation, social unrest, war or lack of timely information than those in developed countries. |
| n | | Foreign securities risk. The Fund’s foreign investments may be affected by changes in a foreign country’s exchange rates, political and social instability, changes in economic or taxation policies, difficulties when enforcing obligations, decreased liquidity, and increased volatility. Foreign companies may be subject to less |
| | regulation resulting in less publicly available information about the companies. |
| n | | Geographic focus risk. From time to time the Fund may invest a substantial amount of its assets in securities of issuers located in a single country or a limited number of countries. If the Fund focuses its investments in this manner, it assumes the risk that economic, political and social conditions in those countries will have a significant impact on its investment performance. The Fund’s investment performance may also be more volatile if it focuses its investments in certain countries, especially emerging markets countries. |
| n | | Management risk. The investment techniques and risk analysis used by the Fund’s portfolio managers may not produce the desired results. |
| n | | Market risk. The prices of and the income generated by the Fund’s securities may decline in response to, among other things, investor sentiment, general economic and market conditions, regional or global instability, and currency and interest rate fluctuations. |
| n | | Preferred securities risk. Preferred securities may include provisions that permit the issuer, in its discretion, to defer or omit distributions for a certain period of time. If the Fund owns a security that is deferring or omitting its distributions, the Fund may be required to report the distribution on its tax returns, even though it may not have received this income. Further, preferred securities may lose substantial value due to the omission or deferment of dividend payments. |
| n | | Small- and mid-capitalization risks. Stocks of small- and mid-sized companies tend to be more vulnerable to adverse developments and may have little or no operating history or track record of success, and limited product lines, markets, management and financial resources. The securities of small- and mid-sized companies may be more volatile due to less market interest and less publicly available |
| | information about the issuer. They also may be illiquid or restricted as to resale, or may trade less frequently and in smaller volumes, all of which may cause difficulty when establishing or closing a position at a desirable price. |
| n | | Value investing style risk. The Fund emphasizes a value style of investing, which focuses on undervalued companies with characteristics for improved valuations. This style of investing is subject to the risk that the valuations never improve or that the returns on value equity securities are less than returns on other styles of investing or the overall stock market. Value stocks also may decline in price, even though in theory they are already underpriced. |
About indexes used in this report
| n | | The MSCI EAFE® Index is an unmanaged index considered representative of stocks of Europe, Australasia and the Far East. The index is computed using the net return, which withholds applicable taxes for non-resident investors. |
| n | | The MSCI Emerging Markets IndexSM is an unmanaged index considered representative of stocks of developing countries. The index is computed using the net return, which withholds applicable taxes for non-resident investors. |
| n | | The Lipper Emerging Market Funds Index is an unmanaged index considered representative of emerging market funds tracked by Lipper. |
| n | | The Fund is not managed to track the performance of any particular index, including the index(es) described here, and consequently, the performance of the Fund may deviate significantly from the performance of the index(es). |
| n | | A direct investment cannot be made in an index. Unless otherwise indicated, index results include reinvested dividends, and they do not reflect sales charges. Performance of the peer group, if applicable, reflects fund expenses; performance of a market index does not. |
continued on page 6
|
| This report must be accompanied or preceded by a currently effective Fund prospectus, which contains more complete information, including sales charges and expenses. Investors should read it carefully before investing. |
|
NOT FDIC INSURED | MAY LOSE VALUE | NO BANK GUARANTEE |
8 Invesco Emerging Markets Equity Fund
Schedule of Investments
October 31, 2015
| | | | | | | | |
| | | Shares | | | Value | |
Common Stocks & Other Equity Interests–97.76% | |
| Brazil–6.66% | | | | | | | | |
BB Seguridade Participacoes S.A. | | | 76,400 | | | $ | 527,225 | |
Grendene S.A. | | | 94,800 | | | | 443,922 | |
Multiplus S.A. | | | 32,400 | | | | 288,646 | |
Raia Drogasil S.A. | | | 45,100 | | | | 467,895 | |
| | | | | 1,727,688 | |
| | |
| China–23.80% | | | | | | | | |
Baidu, Inc.–ADR(a) | | | 3,656 | | | | 685,390 | |
Bank of China Ltd.–Class H | | | 1,382,000 | | | | 650,936 | |
Industrial & Commercial Bank of China Ltd.–Class H | | | 1,082,000 | | | | 686,591 | |
Phoenix Healthcare Group Co. Ltd. | | | 263,500 | | | | 400,489 | |
Ping An Insurance (Group) Co. of China Ltd.–Class H | | | 146,500 | | | | 819,455 | |
Shenzhou International Group Holdings Ltd. | | | 143,000 | | | | 702,633 | |
Sinopharm Group Co. Ltd.–Class H | | | 107,200 | | | | 441,525 | |
Tencent Holdings Ltd. | | | 75,100 | | | | 1,409,414 | |
Zhuzhou CSR Times Electric Co., Ltd.–Class H | | | 58,000 | | | | 375,795 | |
| | | | | 6,172,228 | |
| | |
| Hong Kong–5.42% | | | | | | | | |
AIA Group Ltd. | | | 103,400 | | | | 603,784 | |
Standard Chartered PLC | | | 20,250 | | | | 222,307 | |
Techtronic Industries Co. Ltd. | | | 159,000 | | | | 580,308 | |
| | | | | 1,406,399 | |
| | |
| India–11.06% | | | | | | | | |
Axis Bank Ltd. | | | 69,744 | | | | 506,285 | |
Britannia Industries Ltd. | | | 6,414 | | | | 316,983 | |
Eicher Motors Ltd. | | | 1,356 | | | | 367,731 | |
Emami Ltd. | | | 20,900 | | | | 343,162 | |
LIC Housing Finance Ltd. | | | 51,728 | | | | 378,909 | |
Maruti Suzuki India Ltd. | | | 4,956 | | | | 337,024 | |
Tata Consultancy Services Ltd. | | | 16,220 | | | | 619,239 | |
| | | | | 2,869,333 | |
| | |
| Indonesia–4.73% | | | | | | | | |
PT Bank Rakyat Indonesia Persero Tbk | | | 764,300 | | | | 583,866 | |
PT Matahari Department Store Tbk | | | 533,200 | | | | 642,261 | |
| | | | | 1,226,127 | |
| | |
| Malaysia–0.98% | | | | | | | | |
Berjaya Auto Berhad | | | 526,240 | | | | 253,607 | |
| | |
| Mexico–5.50% | | | | | | | | |
Fomento Economico Mexicano, S.A.B. de C.V.–ADR | | | 6,265 | | | | 620,799 | |
Grupo Financiero Inbursa, S.A.B. de C.V.–Class O | | | 270,900 | | | | 542,754 | |
Kimberly-Clark de Mexico, S.A.B. de C.V.–Class A | | | 110,400 | | | | 264,157 | |
| | | | | 1,427,710 | |
| | | | | | | | |
| | | Shares | | | Value | |
| Peru–1.93% | | | | | | | | |
Credicorp Ltd. | | | 2,740 | | | $ | 310,113 | |
Intercorp Financial Services Inc. | | | 7,606 | | | | 190,150 | |
| | | | | 500,263 | |
| | |
| Russia–3.06% | | | | | | | | |
Magnit PJSC–REGS–GDR(b) | | | 8,518 | | | | 386,889 | |
Sberbank PAO–ADR | | | 66,723 | | | | 407,711 | |
| | | | | 794,600 | |
| | |
| South Africa–4.06% | | | | | | | | |
Clicks Group Ltd. | | | 51,732 | | | | 377,835 | |
Mr. Price Group Ltd. | | | 44,110 | | | | 676,188 | |
| | | | | 1,054,023 | |
| | |
| South Korea–14.08% | | | | | | | | |
AMOREPACIFIC Corp. | | | 1,373 | | | | 451,777 | |
AMOREPACIFIC Group | | | 2,621 | | | | 366,934 | |
CJ CGV Co., Ltd. | | | 5,148 | | | | 466,247 | |
Hanssem Co., Ltd. | | | 2,462 | | | | 501,649 | |
KEPCO Plant Service & Engineering Co., Ltd. | | | 4,824 | | | | 439,876 | |
Medy-Tox Inc. | | | 672 | | | | 284,719 | |
Samsung Electronics Co., Ltd. | | | 952 | | | | 1,139,908 | |
| | | | | 3,651,110 | |
| | |
| Taiwan–10.72% | | | | | | | | |
King Slide Works Co., Ltd. | | | 48,000 | | | | 624,884 | |
President Chain Store Corp. | | | 124,000 | | | | 817,966 | |
Taiwan Semiconductor Manufacturing Co. Ltd. | | | 318,000 | | | | 1,338,626 | |
| | | | | 2,781,476 | |
| | |
| Thailand–4.05% | | | | | | | | |
Delta Electronics (Thailand) PCL | | | 165,400 | | | | 390,729 | |
Kasikornbank PCL | | | 81,800 | | | | 395,862 | |
Thanachart Capital PCL | | | 280,500 | | | | 263,621 | |
| | | | | 1,050,212 | |
| | |
| United States–1.71% | | | | | | | | |
Market Vectors® Vietnam ETF | | | 26,100 | | | | 442,656 | |
Total Common Stocks & Other Equity Interests
(Cost $25,927,415) | | | | 25,357,432 | |
| | |
Money Market Funds–1.03% | | | | | | | | |
Liquid Assets Portfolio–Institutional Class, 0.16%(c) | | | 133,179 | | | | 133,179 | |
Premier Portfolio–Institutional Class, 0.12%(c) | | | 133,179 | | | | 133,179 | |
Total Money Market Funds
(Cost $266,358) | | | | | | | 266,358 | |
TOTAL INVESTMENTS–98.79% (Cost $26,193,773) | | | | 25,623,790 | |
OTHER ASSETS LESS LIABILITIES–1.21% | | | | 315,092 | |
NET ASSETS–100.00% | | | $ | 25,938,882 | |
Investment Abbreviations:
| | |
| ADR | | – American Depositary Receipt |
| ETF | | – Exchange-Traded Fund |
| | |
| GDR | | – Global Depositary Receipt |
| REGS | | – Regulation S |
Notes to Schedule of Investments:
| (a) | Non-income producing security. |
| (b) | Security purchased or received in transaction exempt from registration under the Securities Act of 1933, as amended (the “1933 Act”). The security may be resold pursuant to an exemption from registration under the 1933 Act, typically to qualified institutional buyers. The value of this security at October 31, 2015 represented 1.49% of the Fund’s Net Assets. |
| (c) | The money market fund and the Fund are affiliated by having the same investment adviser. The rate shown is the 7-day SEC standardized yield as of October 31, 2015. |
See accompanying Notes to Financial Statements which are an integral part of the financial statements.
9 Invesco Emerging Markets Equity Fund
Statement of Assets and Liabilities
October 31, 2015
| | | | |
Assets: | | | | |
Investments, at value (Cost $25,927,415) | | $ | 25,357,432 | |
Investments in affiliated money market funds, at value and cost | | | 266,358 | |
Total investments, at value (Cost $26,193,773) | | | 25,623,790 | |
Foreign currencies, at value (Cost $175,480) | | | 173,837 | |
Receivable for: | | | | |
Investments sold | | | 287,404 | |
Fund shares sold | | | 69,504 | |
Dividends | | | 11,450 | |
Fund expenses absorbed | | | 8,036 | |
Investment for trustee deferred compensation and retirement plans | | | 16,630 | |
Other assets | | | 19,394 | |
Total assets | | | 26,210,045 | |
| |
Liabilities: | | | | |
Payable for: | | | | |
Investments purchased | | | 167,293 | |
Fund shares reacquired | | | 22,228 | |
Accrued fees to affiliates | | | 14,367 | |
Accrued trustees’ and officers’ fees and benefits | | | 1,451 | |
Accrued other operating expenses | | | 48,450 | |
Trustee deferred compensation and retirement plans | | | 17,374 | |
Total liabilities | | | 271,163 | |
Net assets applicable to shares outstanding | | $ | 25,938,882 | |
| |
Net assets consist of: | | | | |
Shares of beneficial interest | | $ | 32,250,697 | |
Undistributed net investment income | | | (16,270 | ) |
Undistributed net realized gain (loss) | | | (5,722,402 | ) |
Net unrealized appreciation (depreciation) | | | (573,143 | ) |
| | | $ | 25,938,882 | |
| | | | |
Net Assets: | | | | |
Class A | | $ | 10,516,181 | |
Class C | | $ | 2,571,635 | |
Class R | | $ | 1,188,024 | |
Class Y | | $ | 3,606,752 | |
Class R5 | | $ | 884,990 | |
Class R6 | | $ | 7,171,300 | |
|
Shares outstanding, $0.01 par value per share,
with an unlimited number of shares authorized: | |
Class A | | | 1,611,517 | |
Class C | | | 399,901 | |
Class R | | | 182,869 | |
Class Y | | | 552,406 | |
Class R5 | | | 135,481 | |
Class R6 | | | 1,097,158 | |
Class A: | | | | |
Net asset value per share | | $ | 6.53 | |
Maximum offering price per share | | | | |
(Net asset value of $6.53 ¸ 94.50%) | | $ | 6.91 | |
Class C: | | | | |
Net asset value and offering price per share | | $ | 6.43 | |
Class R: | | | | |
Net asset value and offering price per share | | $ | 6.50 | |
Class Y: | | | | |
Net asset value and offering price per share | | $ | 6.53 | |
Class R5: | | | | |
Net asset value and offering price per share | | $ | 6.53 | |
Class R6: | | | | |
Net asset value and offering price per share | | $ | 6.54 | |
See accompanying Notes to Financial Statements which are an integral part of the financial statements.
10 Invesco Emerging Markets Equity Fund
Statement of Operations
For the year ended October 31, 2015
| | | | |
Investment income: | |
Dividends (net of foreign withholding taxes of $65,840) | | $ | 576,493 | |
Dividends from affiliated money market funds | | | 456 | |
Total investment income | | | 576,949 | |
| |
Expenses: | | | | |
Advisory fees | | | 258,989 | |
Administrative services fees | | | 50,000 | |
Custodian fees | | | 57,293 | |
Distribution fees: | | | | |
Class A | | | 28,796 | |
Class C | | | 27,372 | |
Class R | | | 6,091 | |
Transfer agent fees — A, C, R, and Y | | | 66,936 | |
Transfer agent fees — R5 | | | 34 | |
Transfer agent fees — R6 | | | 51 | |
Trustees’ and officers’ fees and benefits | | | 19,078 | |
Registration and filing fees | | | 74,344 | |
Professional services fees | | | 52,092 | |
Other | | | 36,003 | |
Total expenses | | | 677,079 | |
Less: Fees waived, expenses reimbursed and expense offset arrangement(s) | | | (172,775 | ) |
Net expenses | | | 504,304 | |
Net investment income | | | 72,645 | |
| |
Realized and unrealized gain (loss) from: | | | | |
Net realized gain (loss) from: | | | | |
Investment securities | | | (3,103,414 | ) |
Foreign currencies | | | (45,417 | ) |
| | | | (3,148,831 | ) |
Change in net unrealized appreciation (depreciation) of: | | | | |
Investment securities (net of foreign taxes on holdings of $7,555) | | | (703,920 | ) |
Foreign currencies | | | (1,892 | ) |
| | | | (705,812 | ) |
Net realized and unrealized gain (loss) | | | (3,854,643 | ) |
Net increase (decrease) in net assets resulting from operations | | $ | (3,781,998 | ) |
See accompanying Notes to Financial Statements which are an integral part of the financial statements.
11 Invesco Emerging Markets Equity Fund
Statement of Changes in Net Assets
For the years ended October 31, 2015 and 2014
| | | | | | | | |
| | | 2015 | | | 2014 | |
Operations: | | | | | |
Net investment income | | $ | 72,645 | | | $ | 202,600 | |
Net realized gain (loss) | | | (3,148,831 | ) | | | (270,741 | ) |
Change in net unrealized appreciation (depreciation) | | | (705,812 | ) | | | 122,931 | |
Net increase (decrease) in net assets resulting from operations | | | (3,781,998 | ) | | | 54,790 | |
| | |
Distributions to shareholders from net investment income: | | | | | | | | |
Class A | | | (44,461 | ) | | | (121,978 | ) |
Class C | | | — | | | | (8,695 | ) |
Class R | | | (2,660 | ) | | | (5,311 | ) |
Class Y | | | (24,019 | ) | | | (4,449 | ) |
Class R5 | | | (6,406 | ) | | | (3,472 | ) |
Class R6 | | | (59,556 | ) | | | (81,720 | ) |
Total distributions from net investment income | | | (137,102 | ) | | | (225,625 | ) |
| | |
Share transactions–net: | | | | | | | | |
Class A | | | 1,351,218 | | | | (4,506,049 | ) |
Class C | | | 163,778 | | | | 640,555 | |
Class R | | | 35,294 | | | | 588,496 | |
Class Y | | | 854,056 | | | | 2,890,104 | |
Class R5 | | | 141,935 | | | | 516,559 | |
Class R6 | | | 183,789 | | | | (472,445 | ) |
Net increase (decrease) in net assets resulting from share transactions | | | 2,730,070 | | | | (342,780 | ) |
Net increase (decrease) in net assets | | | (1,189,030 | ) | | | (513,615 | ) |
| | |
Net assets: | | | | | | | | |
Beginning of year | | | 27,127,912 | | | | 27,641,527 | |
End of year (includes undistributed net investment income of $(16,270) and $122,868, respectively) | | $ | 25,938,882 | | | $ | 27,127,912 | |
Notes to Financial Statements
October 31, 2015
NOTE 1—Significant Accounting Policies
Invesco Emerging Markets Equity Fund (the “Fund”) is a series portfolio of AIM Investment Funds (Invesco Investment Funds) (the “Trust”). The Trust is organized as a Delaware statutory trust and is registered under the Investment Company Act of 1940, as amended (the “1940 Act”), as an open-end series management investment company consisting of twenty-four separate series portfolios, each authorized to issue an unlimited number of shares of beneficial interest. The assets, liabilities and operations of each portfolio are accounted for separately. Information presented in these financial statements pertains only to the Fund. Matters affecting each portfolio or class will be voted on exclusively by the shareholders of such portfolio or class.
The Fund’s investment objective is long-term growth of capital.
The Fund currently consists of six different classes of shares: Class A, Class C, Class R, Class Y, Class R5 and Class R6. Class A shares are sold with a front-end sales charge unless certain waiver criteria are met and under certain circumstances load waived shares may be subject to contingent deferred sales charges (“CDSC”). Class C shares are sold with a CDSC. Class R, Class Y, Class R5 and Class R6 shares are sold at net asset value.
The following is a summary of the significant accounting policies followed by the Fund in the preparation of its financial statements.
| A. | Security Valuations — Securities, including restricted securities, are valued according to the following policy. |
A security listed or traded on an exchange (except convertible securities) is valued at its last sales price or official closing price as of the close of the customary trading session on the exchange where the security is principally traded, or lacking any sales or official closing price on a particular day, the security may be valued at the closing bid price on that day. Securities traded in the over-the-counter market are valued based on prices furnished by independent pricing services or market makers. When such securities are valued by an independent pricing service they may be considered fair valued. Futures contracts are valued at the final settlement price set by an exchange on which they are principally traded. Listed options are valued at the mean between the last bid and asked prices from the exchange on which they are principally traded. Options not listed on an exchange are valued by an independent source at the mean between the last bid and asked prices. For purposes of determining net asset value (“NAV”) per share, futures and option contracts generally are valued 15 minutes after the close of the customary trading session of the New York Stock Exchange (“NYSE”).
12 Invesco Emerging Markets Equity Fund
Investments in open-end and closed-end registered investment companies that do not trade on an exchange are valued at the end-of-day net asset value per share. Investments in open-end and closed-end registered investment companies that trade on an exchange are valued at the last sales price or official closing price as of the close of the customary trading session on the exchange where the security is principally traded.
Debt obligations (including convertible securities) and unlisted equities are fair valued using an evaluated quote provided by an independent pricing service. Evaluated quotes provided by the pricing service may be determined without exclusive reliance on quoted prices, and may reflect appropriate factors such as institution-size trading in similar groups of securities, developments related to specific securities, dividend rate (for unlisted equities), yield (for debt obligations), quality, type of issue, coupon rate (for debt obligations), maturity (for debt obligations), individual trading characteristics and other market data. Debt obligations are subject to interest rate and credit risks. In addition, all debt obligations involve some risk of default with respect to interest and/or principal payments.
Foreign securities’ (including foreign exchange contracts) prices are converted into U.S. dollar amounts using the applicable exchange rates as of the close of the NYSE. If market quotations are available and reliable for foreign exchange-traded equity securities, the securities will be valued at the market quotations. Because trading hours for certain foreign securities end before the close of the NYSE, closing market quotations may become unreliable. If between the time trading ends on a particular security and the close of the customary trading session on the NYSE, events occur that the Adviser determines are significant and make the closing price unreliable, the Fund may fair value the security. If the event is likely to have affected the closing price of the security, the security will be valued at fair value in good faith using procedures approved by the Board of Trustees. Adjustments to closing prices to reflect fair value may also be based on a screening process of an independent pricing service to indicate the degree of certainty, based on historical data, that the closing price in the principal market where a foreign security trades is not the current value as of the close of the NYSE. Foreign securities’ prices meeting the approved degree of certainty that the price is not reflective of current value will be priced at the indication of fair value from the independent pricing service. Multiple factors may be considered by the independent pricing service in determining adjustments to reflect fair value and may include information relating to sector indices, American Depositary Receipts and domestic and foreign index futures. Foreign securities may have additional risks including exchange rate changes, potential for sharply devalued currencies and high inflation, political and economic upheaval, the relative lack of issuer information, relatively low market liquidity and the potential lack of strict financial and accounting controls and standards.
Securities for which market prices are not provided by any of the above methods may be valued based upon quotes furnished by independent sources. The last bid price may be used to value equity securities. The mean between the last bid and asked prices is used to value debt obligations, including corporate loans.
Securities for which market quotations are not readily available or became unreliable are valued at fair value as determined in good faith by or under the supervision of the Trust’s officers following procedures approved by the Board of Trustees. Issuer specific events, market trends, bid/asked quotes of brokers and information providers and other market data may be reviewed in the course of making a good faith determination of a security’s fair value.
The Fund may invest in securities that are subject to interest rate risk, meaning the risk that the prices will generally fall as interest rates rise and, conversely, the prices will generally rise as interest rates fall. Specific securities differ in their sensitivity to changes in interest rates depending on their individual characteristics. Changes in interest rates may result in increased market volatility, which may affect the value and/or liquidity of certain Fund investments.
Valuations change in response to many factors including the historical and prospective earnings of the issuer, the value of the issuer’s assets, general economic conditions, interest rates, investor perceptions and market liquidity. Because of the inherent uncertainties of valuation, the values reflected in the financial statements may materially differ from the value received upon actual sale of those investments.
| B. | Securities Transactions and Investment Income — Securities transactions are accounted for on a trade date basis. Realized gains or losses on sales are computed on the basis of specific identification of the securities sold. Interest income (net of withholding tax, if any) is recorded on the accrual basis from settlement date. Dividend income (net of withholding tax, if any) is recorded on the ex-dividend date. |
The Fund may periodically participate in litigation related to Fund investments. As such, the Fund may receive proceeds from litigation settlements. Any proceeds received are included in the Statement of Operations as realized gain (loss) for investments no longer held and as unrealized gain (loss) for investments still held.
Brokerage commissions and mark ups are considered transaction costs and are recorded as an increase to the cost basis of securities purchased and/or a reduction of proceeds on a sale of securities. Such transaction costs are included in the determination of net realized and unrealized gain (loss) from investment securities reported in the Statement of Operations and the Statement of Changes in Net Assets and the net realized and unrealized gains (losses) on securities per share in the Financial Highlights. Transaction costs are included in the calculation of the Fund’s net asset value and, accordingly, they reduce the Fund’s total returns. These transaction costs are not considered operating expenses and are not reflected in net investment income reported in the Statement of Operations and the Statement of Changes in Net Assets, or the net investment income per share and the ratios of expenses and net investment income reported in the Financial Highlights, nor are they limited by any expense limitation arrangements between the Fund and the investment adviser.
The Fund allocates income and realized and unrealized capital gains and losses to a class based on the relative net assets of each class.
| C. | Country Determination — For the purposes of making investment selection decisions and presentation in the Schedule of Investments, the investment adviser may determine the country in which an issuer is located and/or credit risk exposure based on various factors. These factors include the laws of the country under which the issuer is organized, where the issuer maintains a principal office, the country in which the issuer derives 50% or more of its total revenues and the country that has the primary market for the issuer’s securities, as well as other criteria. Among the other criteria that may be evaluated for making this determination are the country in which the issuer maintains 50% or more of its assets, the type of security, financial guarantees and enhancements, the nature of the collateral and the sponsor organization. Country of issuer and/or credit risk exposure has been determined to be the United States of America, unless otherwise noted. |
| D. | Distributions — Distributions from net investment income and net realized capital gain, if any, are generally declared and paid annually and recorded on the ex-dividend date. The Fund may elect to treat a portion of the proceeds from redemptions as distributions for federal income tax purposes. |
| E. | Federal Income Taxes — The Fund intends to comply with the requirements of Subchapter M of the Internal Revenue Code of 1986, as amended (the “Internal Revenue Code”), necessary to qualify as a regulated investment company and to distribute substantially all of the Fund’s |
13 Invesco Emerging Markets Equity Fund
| | taxable earnings to shareholders. As such, the Fund will not be subject to federal income taxes on otherwise taxable income (including net realized capital gain) that is distributed to shareholders. Therefore, no provision for federal income taxes is recorded in the financial statements. |
The Fund recognizes the tax benefits of uncertain tax positions only when the position is more likely than not to be sustained. Management has analyzed the Fund’s uncertain tax positions and concluded that no liability for unrecognized tax benefits should be recorded related to uncertain tax positions. Management is not aware of any tax positions for which it is reasonably possible that the total amounts of unrecognized tax benefits will change materially in the next 12 months.
The Fund files tax returns in the U.S. Federal jurisdiction and certain other jurisdictions. Generally, the Fund is subject to examinations by such taxing authorities for up to three years after the filing of the return for the tax period.
| F. | Expenses — Fees provided for under the Rule 12b-1 plan of a particular class of the Fund are charged to the operations of such class. Transfer agency fees and expenses and other shareholder recordkeeping fees and expenses attributable to Class R5 and Class R6 are allocated to each share class based on relative net assets. Sub-accounting fees attributable to Class R5 are charged to the operations of the class. Transfer agency fees and expenses and other shareholder recordkeeping fees and expenses relating to all other classes are allocated among those classes based on relative net assets. All other expenses are allocated among the classes based on relative net assets. |
| G. | Accounting Estimates — The preparation of financial statements in conformity with accounting principles generally accepted in the United States of America (“GAAP”) requires management to make estimates and assumptions that affect the reported amounts of assets and liabilities at the date of the financial statements and the reported amounts of revenues and expenses during the reporting period including estimates and assumptions related to taxation. Actual results could differ from those estimates by a significant amount. In addition, the Fund monitors for material events or transactions that may occur or become known after the period-end date and before the date the financial statements are released to print. |
| H. | Indemnifications — Under the Trust’s organizational documents, each Trustee, officer, employee or other agent of the Trust is indemnified against certain liabilities that may arise out of the performance of their duties to the Fund. Additionally, in the normal course of business, the Fund enters into contracts, including the Fund’s servicing agreements, that contain a variety of indemnification clauses. The Fund’s maximum exposure under these arrangements is unknown as this would involve future claims that may be made against the Fund that have not yet occurred. The risk of material loss as a result of such indemnification claims is considered remote. |
| I. | Foreign Currency Translations — Foreign currency is valued at the close of the NYSE based on quotations posted by banks and major currency dealers. Portfolio securities and other assets and liabilities denominated in foreign currencies are translated into U.S. dollar amounts at date of valuation. Purchases and sales of portfolio securities (net of foreign taxes withheld on disposition) and income items denominated in foreign currencies are translated into U.S. dollar amounts on the respective dates of such transactions. The Fund does not separately account for the portion of the results of operations resulting from changes in foreign exchange rates on investments and the fluctuations arising from changes in market prices of securities held. The combined results of changes in foreign exchange rates and the fluctuation of market prices on investments (net of estimated foreign tax withholding) are included with the net realized and unrealized gain or loss from investments in the Statement of Operations. Reported net realized foreign currency gains or losses arise from (1) sales of foreign currencies, (2) currency gains or losses realized between the trade and settlement dates on securities transactions, and (3) the difference between the amounts of dividends, interest, and foreign withholding taxes recorded on the Fund’s books and the U.S. dollar equivalent of the amounts actually received or paid. Net unrealized foreign currency gains and losses arise from changes in the fair values of assets and liabilities, other than investments in securities at fiscal period end, resulting from changes in exchange rates. |
The Fund may invest in foreign securities, which may be subject to foreign taxes on income, gains on investments or currency repatriation, a portion of which may be recoverable. Foreign taxes, if any, are recorded based on the tax regulations and rates that exist in the foreign markets in which the Fund invests and are shown in the Statement of Operations.
| J. | Forward Foreign Currency Contracts — The Fund may engage in foreign currency transactions either on a spot (i.e. for prompt delivery and settlement) basis, or through forward foreign currency contracts, to manage or minimize currency or exchange rate risk. |
The Fund may also enter into forward foreign currency contracts for the purchase or sale of a security denominated in a foreign currency in order to “lock in” the U.S. dollar price of that security, or the Fund may also enter into forward foreign currency contracts that do not provide for physical settlement of the two currencies, but instead are settled by a single cash payment calculated as the difference between the agreed upon exchange rate and the spot rate at settlement based upon an agreed upon notional amount (non-deliverable forwards). The Fund will set aside liquid assets in an amount equal to daily mark-to-market obligation for forward foreign currency contracts.
A forward foreign currency contract is an obligation between two parties (“Counterparties”) to purchase or sell a specific currency for an agreed-upon price at a future date. The use of forward foreign currency contracts does not eliminate fluctuations in the price of the underlying securities the Fund owns or intends to acquire but establishes a rate of exchange in advance. Fluctuations in the value of these contracts are measured by the difference in the contract date and reporting date exchange rates and are recorded as unrealized appreciation (depreciation) until the contracts are closed. When the contracts are closed, realized gains (losses) are recorded. Realized and unrealized gains (losses) on the contracts are included in the Statement of Operations. The primary risks associated with forward foreign currency contracts include failure of the Counterparty to meet the terms of the contract and the value of the foreign currency changing unfavorably. These risks may be in excess of the amounts reflected in the Statement of Assets and Liabilities.
14 Invesco Emerging Markets Equity Fund
NOTE 2—Advisory Fees and Other Fees Paid to Affiliates
The Trust has entered into a master investment advisory agreement with Invesco Advisers, Inc. (the “Adviser” or “Invesco”). Under the terms of the investment advisory agreement, the Fund pays an advisory fee to the Adviser based on the annual rate of the Fund’s average daily net assets as follows:
| | | | | | |
| Average Daily Net Assets | | Rate |
First $250 million | | | 0 | .935% | | |
Next $250 million | | | 0 | .91% | | |
Next $500 million | | | 0 | .885% | | |
Next $1.5 billion | | | 0 | .86% | | |
Next $2.5 billion | | | 0 | .835% | | |
Next $2.5 billion | | | 0 | .81% | | |
Next $2.5 billion | | | 0 | .785% | | |
Over $10 billion | | | 0 | .76% | | |
For the year ended October 31, 2015, the effective advisory fees incurred by the Fund was 0.94%.
Under the terms of a master sub-advisory agreement between the Adviser and each of Invesco Asset Management Deutschland GmbH, Invesco Asset Management Limited, Invesco Asset Management (Japan) Limited, Invesco Hong Kong Limited, Invesco Senior Secured Management, Inc. and Invesco Canada Ltd. (collectively, the “Affiliated Sub-Advisers”) the Adviser, not the Fund, may pay 40% of the fees paid to the Adviser to any such Affiliated Sub-Adviser(s) that provide(s) discretionary investment management services to the Fund based on the percentage of assets allocated to such Affiliated Sub-Adviser(s).
The Adviser has contractually agreed, through at least February 28, 2017, to waive advisory fees and/or reimburse expenses to the extent necessary to limit total annual fund operating expenses after fee waiver and/or expense reimbursement (excluding certain items discussed below) of Class A, Class C, Class R, Class Y, Class R5 and Class R6 shares to 1.85%, 2.60%, 2.10%, 1.60%, 1.60% and 1.60% of average daily net assets, respectively. In determining the Adviser’s obligation to waive advisory fees and/or reimburse expenses, the following expenses are not taken into account, and could cause the total annual fund operating expenses after fee waiver and/or expense reimbursement to exceed the numbers reflected above: (1) interest; (2) taxes; (3) dividend expense on short sales; (4) extraordinary or non-routine items, including litigation expenses; and (5) expenses that the Fund has incurred but did not actually pay because of an expense offset arrangement. Unless Invesco continues the fee waiver agreement, it will terminate on February 28, 2017. The fee waiver agreement cannot be terminated during its term.
Further, the Adviser has contractually agreed, through at least June 30, 2017, to waive the advisory fee payable by the Fund in an amount equal to 100% of the net advisory fees the Adviser receives from the affiliated money market funds on investments by the Fund of uninvested cash (excluding investments of cash collateral from securities lending) in such affiliated money market funds.
For the year ended October 31, 2015, the Adviser waived advisory fees of $105,755 and reimbursed class level expenses of $40,458, $9,615, $4,279, $12,338, $34 and $51 for Class A, Class C, Class R, Class Y, Class R5 and Class R6 shares, respectively.
The Trust has entered into a master administrative services agreement with Invesco pursuant to which the Fund has agreed to pay Invesco for certain administrative costs incurred in providing accounting services to the Fund. For the year ended October 31, 2015, expenses incurred under the agreement are shown in the Statement of Operations as Administrative services fees.
The Trust has entered into a transfer agency and service agreement with Invesco Investment Services, Inc. (“IIS”) pursuant to which the Fund has agreed to pay IIS a fee for providing transfer agency and shareholder services to the Fund and reimburse IIS for certain expenses incurred by IIS in the course of providing such services. IIS may make payments to intermediaries that provide omnibus account services, sub-accounting services and/or networking services. All fees payable by IIS to intermediaries that provide omnibus account services or sub-accounting are charged back to the Fund, subject to certain limitations approved by the Trust’s Board of Trustees. For the year ended October 31, 2015, expenses incurred under the agreement are shown in the Statement of Operations as Transfer agent fees.
The Trust has entered into master distribution agreements with Invesco Distributors, Inc. (“IDI”) to serve as the distributor for the Class A, Class C, Class R, Class Y, Class R5 and Class R6 shares of the Fund. The Trust has adopted plans pursuant to Rule 12b-1 under the 1940 Act with respect to the Fund’s Class A, Class C and Class R shares (collectively the “Plans”). The Fund, pursuant to the Plans, pays IDI compensation at the annual rate of 0.25% of the Fund’s average daily net assets of Class A shares, 1.00% of the average daily net assets of Class C shares and 0.50% of the average daily net assets of Class R shares. Of the Plan payments, up to 0.25% of the average daily net assets of each class of shares may be paid to furnish continuing personal shareholder services to customers who purchase and own shares of such classes. Any amounts not paid as a service fee under the Plans would constitute an asset-based sales charge. Rules of the Financial Industry Regulatory Authority (“FINRA”) impose a cap on the total sales charges, including asset-based sales charges, that may be paid by any class of shares of the Fund. For the year ended October 31, 2015, expenses incurred under the Plans are shown in the Statement of Operations as Distribution fees.
Front-end sales commissions and CDSC (collectively, the “sales charges”) are not recorded as expenses of the Fund. Front-end sales commissions are deducted from proceeds from the sales of Fund shares prior to investment in Class A shares of the Fund. CDSC are deducted from redemption proceeds prior to remittance to the shareholder. During the year ended October 31, 2015, IDI advised the Fund that IDI retained $8,221 in front-end sales commissions from the sale of Class A shares and $37 and $659 from Class A and Class C shares, respectively, for CDSC imposed upon redemptions by shareholders.
Certain officers and trustees of the Trust are officers and directors of the Adviser, IIS and/or IDI.
15 Invesco Emerging Markets Equity Fund
NOTE 3—Additional Valuation Information
GAAP defines fair value as the price that would be received to sell an asset or paid to transfer a liability in an orderly transaction between market participants at the measurement date, under current market conditions. GAAP establishes a hierarchy that prioritizes the inputs to valuation methods, giving the highest priority to readily available unadjusted quoted prices in an active market for identical assets (Level 1) and the lowest priority to significant unobservable inputs (Level 3), generally when market prices are not readily available or are unreliable. Based on the valuation inputs, the securities or other investments are tiered into one of three levels. Changes in valuation methods may result in transfers in or out of an investment’s assigned level:
| | Level 1 — | Prices are determined using quoted prices in an active market for identical assets. |
| | Level 2 — | Prices are determined using other significant observable inputs. Observable inputs are inputs that other market participants may use in pricing a security. These may include quoted prices for similar securities, interest rates, prepayment speeds, credit risk, yield curves, loss severities, default rates, discount rates, volatilities and others. |
| | Level 3 — | Prices are determined using significant unobservable inputs. In situations where quoted prices or observable inputs are unavailable (for example, when there is little or no market activity for an investment at the end of the period), unobservable inputs may be used. Unobservable inputs reflect the Fund’s own assumptions about the factors market participants would use in determining fair value of the securities or instruments and would be based on the best available information. |
The following is a summary of the tiered valuation input levels, as of October 31, 2015. The level assigned to the securities valuations may not be an indication of the risk or liquidity associated with investing in those securities. Because of the inherent uncertainties of valuation, the values reflected in the financial statements may materially differ from the value received upon actual sale of those investments.
During the year ended October 31, 2015, there were transfers from Level 1 to Level 2 of $2,231,957 due to foreign fair value adjustments.
| | | | | | | | | | | | | | | | |
| | | Level 1 | | | Level 2 | | | Level 3 | | | Total | |
Brazil | | $ | 1,727,688 | | | $ | — | | | $ | — | | | $ | 1,727,688 | |
China | | | 1,085,879 | | | | 5,086,349 | | | | — | | | | 6,172,228 | |
Hong Kong | | | — | | | | 1,406,399 | | | | — | | | | 1,406,399 | |
India | | | 343,162 | | | | 2,526,171 | | | | — | | | | 2,869,333 | |
Indonesia | | | — | | | | 1,226,127 | | | | — | | | | 1,226,127 | |
Malaysia | | | — | | | | 253,607 | | | | — | | | | 253,607 | |
Mexico | | | 1,427,710 | | | | — | | | | — | | | | 1,427,710 | |
Peru | | | 500,263 | | | | — | | | | — | | | | 500,263 | |
Russia | | | — | | | | 794,600 | | | | — | | | | 794,600 | |
South Africa | | | 377,835 | | | | 676,188 | | | | — | | | | 1,054,023 | |
South Korea | | | 439,876 | | | | 3,211,234 | | | | — | | | | 3,651,110 | |
Taiwan | | | — | | | | 2,781,476 | | | | — | | | | 2,781,476 | |
Thailand | | | 659,483 | | | | 390,729 | | | | — | | | | 1,050,212 | |
United States | | | 709,014 | | | | — | | | | — | | | | 709,014 | |
Total Investments | | $ | 7,270,910 | | | $ | 18,352,880 | | | $ | — | | | $ | 25,623,790 | |
NOTE 4—Expense Offset Arrangement(s)
The expense offset arrangement is comprised of transfer agency credits which result from balances in demand deposit accounts used by the transfer agent for clearing shareholder transactions. For the year ended October 31, 2015, the Fund received credits from this arrangement, which resulted in the reduction of the Fund’s total expenses of $245.
NOTE 5—Trustees’ and Officers’ Fees and Benefits
Trustees’ and Officers’ Fees and Benefits include amounts accrued by the Fund to pay remuneration to certain Trustees and Officers of the Fund. Trustees have the option to defer compensation payable by the Fund, and Trustees’ and Officers’ Fees and Benefits also include amounts accrued by the Fund to fund such deferred compensation amounts. Those Trustees who defer compensation have the option to select various Invesco Funds in which their deferral accounts shall be deemed to be invested. Finally, certain current Trustees were eligible to participate in a retirement plan that provided for benefits to be paid upon retirement to Trustees over a period of time based on the number of years of service. The Fund may have certain former Trustees who also participate in a retirement plan and receive benefits under such plan. Trustees’ and Officers’ Fees and Benefits include amounts accrued by the Fund to fund such retirement benefits. Obligations under the deferred compensation and retirement plans represent unsecured claims against the general assets of the Fund.
NOTE 6—Cash Balances
The Fund is permitted to temporarily carry a negative or overdrawn balance in its account with State Street Bank and Trust Company, the custodian bank. Such balances, if any at period end, are shown in the Statement of Assets and Liabilities under the payable caption Amount due custodian. To compensate the custodian bank for such overdrafts, the overdrawn Fund may either (1) leave funds as a compensating balance in the account so the custodian bank can be compensated by earning the additional interest; or (2) compensate by paying the custodian bank at a rate agreed upon by the custodian bank and Invesco, not to exceed the contractually agreed upon rate.
16 Invesco Emerging Markets Equity Fund
NOTE 7—Distributions to Shareholders and Tax Components of Net Assets
Tax Character of Distributions to Shareholders Paid During the Fiscal Years Ended October 31, 2015 and 2014:
| | | | | | | | |
| | | 2015 | | | 2014 | |
Ordinary income | | $ | 137,102 | | | $ | 225,625 | |
Tax Components of Net Assets at Period-End:
| | | | |
| | | 2015 | |
Net unrealized appreciation (depreciation) — investments | | $ | (599,582 | ) |
Net unrealized appreciation (depreciation) — other investments | | | (3,160 | ) |
Temporary book/tax differences | | | (16,270 | ) |
Capital loss carryforward | | | (5,692,803 | ) |
Shares of beneficial interest | | | 32,250,697 | |
Total net assets | | $ | 25,938,882 | |
The difference between book-basis and tax-basis unrealized appreciation (depreciation) is due to differences in the timing of recognition of gains and losses on investments for tax and book purposes. The Fund’s net unrealized appreciation (depreciation) difference is attributable primarily to wash sales.
The temporary book/tax differences are a result of timing differences between book and tax recognition of income and/or expenses. The Fund’s temporary book/tax differences are the result of the trustee deferral of compensation and retirement plan benefits.
Capital loss carryforward is calculated and reported as of a specific date. Results of transactions and other activity after that date may affect the amount of capital loss carryforward actually available for the Fund to utilize. Capital losses generated in years beginning after December 22, 2010 can be carried forward for an unlimited period, whereas previous losses expire in eight tax years. Capital losses with an expiration period may not be used to offset capital gains until all net capital losses without an expiration date have been utilized. Capital loss carryforwards with no expiration date will retain their character as either short-term or long-term capital losses instead of as short-term capital losses as under prior law. The ability to utilize capital loss carryforwards in the future may be limited under the Internal Revenue Code and related regulations based on the results of future transactions.
The Fund has a capital loss carryforward as of October 31, 2015, which expires as follows:
| | | | | | | | | | | | |
| Capital Loss Carryforward* | |
| Expiration | | Short-Term | | | Long-Term | | | Total | |
Not subject to expiration | | $ | 3,523,545 | | | $ | 2,169,258 | | | $ | 5,692,803 | |
| * | Capital loss carryforward as of the date listed above is reduced for limitations, if any, to the extent required by the Internal Revenue Code and may be further limited depending upon a variety of factors, including the realization of net unrealized gains or losses as of the date of any reorganization. |
NOTE 8—Investment Securities
The aggregate amount of investment securities (other than short-term securities, U.S. Treasury obligations and money market funds, if any) purchased and sold by the Fund during the year ended October 31, 2015 was $28,947,374 and $26,055,902, respectively. Cost of investments on a tax basis includes the adjustments for financial reporting purposes as of the most recently completed federal income tax reporting period-end.
| | | | |
| Unrealized Appreciation (Depreciation) of Investment Securities on a Tax Basis | |
Aggregate unrealized appreciation of investment securities | | $ | 1,748,201 | |
Aggregate unrealized (depreciation) of investment securities | | | (2,347,783 | ) |
Net unrealized appreciation (depreciation) of investment securities | | $ | (599,582 | ) |
Cost of investments for tax purposes is $26,223,372.
NOTE 9—Reclassification of Permanent Differences
Primarily as a result of differing book/tax treatment of foreign currency transactions and foreign capital gain, on October 31, 2015, undistributed net investment income was decreased by $74,681, undistributed net realized gain (loss) was increased by $82,255 and shares of beneficial interest was decreased by $7,574. This reclassification had no effect on the net assets of the Fund.
17 Invesco Emerging Markets Equity Fund
NOTE 10—Share Information
| | | | | | | | | | | | | | | | |
| | | Summary of Share Activity | |
| | | Years ended October 31, | |
| | | 2015(a) | | | 2014 | |
| | | Shares | | | Amount | | | Shares | | | Amount | |
Sold: | | | | | | | | | | | | | | | | |
Class A | | | 1,104,682 | | | $ | 7,871,597 | | | | 826,496 | | | $ | 6,210,865 | |
Class C | | | 141,652 | | | | 995,838 | | | | 179,248 | | | | 1,317,911 | |
Class R | | | 69,316 | | | | 486,729 | | | | 97,020 | | | | 714,181 | |
Class Y | | | 134,043 | | | | 961,871 | | | | 391,758 | | | | 3,010,217 | |
Class R5 | | | 27,217 | | | | 210,117 | | | | 69,420 | | | | 513,251 | |
Class R6 | | | 115,002 | | | | 814,045 | | | | 51,867 | | | | 386,284 | |
| | | | |
Issued as reinvestment of dividends: | | | | | | | | | | | | | | | | |
Class A | | | 6,447 | | | | 44,096 | | | | 13,876 | | | | 100,046 | |
Class C | | | — | | | | — | | | | 1,162 | | | | 8,339 | |
Class R | | | 387 | | | | 2,645 | | | | 730 | | | | 5,260 | |
Class Y | | | 3,508 | | | | 23,965 | | | | 607 | | | | 4,377 | |
Class R5 | | | 918 | | | | 6,282 | | | | 459 | | | | 3,308 | |
Class R6 | | | 8,707 | | | | 59,556 | | | | 11,319 | | | | 81,720 | |
| | | | |
Reacquired: | | | | | | | | | | | | | | | | |
Class A | | | (904,652 | ) | | | (6,564,475 | ) | | | (1,443,468 | ) | | | (10,816,960 | ) |
Class C | | | (118,737 | ) | | | (832,060 | ) | | | (93,773 | ) | | | (685,695 | ) |
Class R | | | (64,467 | ) | | | (454,080 | ) | | | (17,429 | ) | | | (130,945 | ) |
Class Y | | | (19,136 | ) | | | (131,780 | ) | | | (16,439 | ) | | | (124,490 | ) |
Class R5 | | | (10,622 | ) | | | (74,464 | ) | | | — | | | | — | |
Class R6 | | | (94,195 | ) | | | (689,812 | ) | | | (125,987 | ) | | | (940,449 | ) |
Net increase (decrease) in share activity | | | 400,070 | | | $ | 2,730,070 | | | | (53,134 | ) | | $ | (342,780 | ) |
| (a) | There are entities that are record owners of more than 5% of the outstanding shares of the Fund and in the aggregate own 26% of the outstanding shares of the Fund. IDI has an agreement with these entities to sell Fund shares. The Fund, Invesco and/or Invesco affiliates may make payments to these entities, which are considered to be related to the Fund, for providing services to the Fund, Invesco and/or Invesco affiliates including but not limited to services such as securities brokerage, distribution, third party record keeping and account servicing. The Fund has no knowledge as to whether all or any portion of the shares owned of record by these entities are also owned beneficially. |
| | In addition, 28% of the outstanding shares of the Fund are owned by affiliated mutual funds. Affiliated mutual funds are other mutual funds that are also advised by Invesco. |
18 Invesco Emerging Markets Equity Fund
NOTE 11—Financial Highlights
The following schedule presents financial highlights for a share of the Fund outstanding throughout the periods indicated.
| | | | | | | | | | | | | | | | | | | | | | | | | | | | | | | | | | | | | | | | | | | | | | | | | | | | | | | | |
| | | Net asset
value,
beginning
of period | | | Net
investment
income
(loss)(a) | | | Net gains
(losses)
on securities
(both
realized and
unrealized) | | | Total from
investment
operations | | | Dividends
from net
investment
income | | | Distributions
from net
realized
gains | | | Total
distributions | | | Net asset
value, end
of period | | | Total
return(b) | | | Net assets,
end of period
(000’s omitted) | | | Ratio of
expenses
to average
net assets
with fee waivers
and/or expenses
absorbed | | | Ratio of
expenses
to average net
assets without
fee waivers
and/or expenses
absorbed | | | Ratio of net
investment
income (loss)
to average
net assets | | | Portfolio
turnover(c) | |
Class A | | | | | | | | | | | | | | | | | | | | | | | | | | | | | | | | | | | | | | | | | | | | | | | | | | | | | | | | |
Year ended 10/31/15 | | $ | 7.58 | | | $ | 0.02 | | | $ | (1.04 | ) | | $ | (1.02 | ) | | $ | (0.03 | ) | | $ | — | | | $ | (0.03 | ) | | $ | 6.53 | | | | (13.45 | )% | | $ | 10,516 | | | | 1.85 | %(d) | | | 2.58 | %(d) | | | 0.23 | %(d) | | | 97 | % |
Year ended 10/31/14 | | | 7.61 | | | | 0.06 | | | | (0.03 | ) | | | 0.03 | | | | (0.06 | ) | | | — | | | | (0.06 | ) | | | 7.58 | | | | 0.44 | | | | 10,654 | | | | 1.85 | | | | 2.57 | | | | 0.74 | | | | 94 | |
Year ended 10/31/13 | | | 7.61 | | | | 0.05 | | | | 0.03 | | | | 0.08 | | | | (0.08 | ) | | | — | | | | (0.08 | ) | | | 7.61 | | | | 1.06 | | | | 15,284 | | | | 1.85 | | | | 2.75 | | | | 0.68 | | | | 41 | |
Year ended 10/31/12 | | | 8.07 | | | | 0.11 | | | | (0.47 | ) | | | (0.36 | ) | | | (0.07 | ) | | | (0.03 | ) | | | (0.10 | ) | | | 7.61 | | | | (4.51 | ) | | | 10,187 | | | | 1.85 | | | | 3.44 | | | | 1.36 | | | | 34 | |
Year ended 10/31/11(e) | | | 10.00 | | | | 0.03 | | | | (1.96 | ) | | | (1.93 | ) | | | — | | | | — | | | | — | | | | 8.07 | | | | (19.30 | ) | | | 4,019 | | | | 1.84 | (f) | | | 5.28 | (f) | | | 0.87 | (f) | | | 16 | |
Class C | | | | | | | | | | | | | | | | | | | | | | | | | | | | | | | | | | | | | | | | | | | | | | | | | | | | | | | | |
Year ended 10/31/15 | | | 7.49 | | | | (0.04 | ) | | | (1.02 | ) | | | (1.06 | ) | | | — | | | | — | | | | — | | | | 6.43 | | | | (14.15 | ) | | | 2,572 | | | | 2.60 | (d) | | | 3.33 | (d) | | | (0.52 | )(d) | | | 97 | |
Year ended 10/31/14 | | | 7.55 | | | | — | | | | (0.03 | ) | | | (0.03 | ) | | | (0.03 | ) | | | — | | | | (0.03 | ) | | | 7.49 | | | | (0.40 | ) | | | 2,825 | | | | 2.60 | | | | 3.32 | | | | (0.01 | ) | | | 94 | |
Year ended 10/31/13 | | | 7.55 | | | | (0.01 | ) | | | 0.04 | | | | 0.03 | | | | (0.03 | ) | | | — | | | | (0.03 | ) | | | 7.55 | | | | 0.40 | | | | 2,191 | | | | 2.60 | | | | 3.50 | | | | (0.07 | ) | | | 41 | |
Year ended 10/31/12 | | | 8.05 | | | | 0.04 | | | | (0.47 | ) | | | (0.43 | ) | | | (0.04 | ) | | | (0.03 | ) | | | (0.07 | ) | | | 7.55 | | | | (5.28 | ) | | | 1,150 | | | | 2.60 | | | | 4.19 | | | | 0.61 | | | | 34 | |
Year ended 10/31/11(e) | | | 10.00 | | | | 0.00 | | | | (1.95 | ) | | | (1.95 | ) | | | — | | | | — | | | | — | | | | 8.05 | | | | (19.50 | ) | | | 236 | | | | 2.59 | (f) | | | 6.03 | (f) | | | 0.12 | (f) | | | 16 | |
Class R | | | | | | | | | | | | | | | | | | | | | | | | | | | | | | | | | | | | | | | | | | | | | | | | | | | | | | | | |
Year ended 10/31/15 | | | 7.55 | | | | (0.00 | ) | | | (1.03 | ) | | | (1.03 | ) | | | (0.02 | ) | | | — | | | | (0.02 | ) | | | 6.50 | | | | (13.71 | ) | | | 1,188 | | | | 2.10 | (d) | | | 2.83 | (d) | | | (0.02 | )(d) | | | 97 | |
Year ended 10/31/14 | | | 7.59 | | | | 0.04 | | | | (0.03 | ) | | | 0.01 | | | | (0.05 | ) | | | — | | | | (0.05 | ) | | | 7.55 | | | | 0.17 | | | | 1,341 | | | | 2.10 | | | | 2.82 | | | | 0.49 | | | | 94 | |
Year ended 10/31/13 | | | 7.58 | | | | 0.03 | | | | 0.04 | | | | 0.07 | | | | (0.06 | ) | | | — | | | | (0.06 | ) | | | 7.59 | | | | 0.97 | | | | 739 | | | | 2.10 | | | | 3.00 | | | | 0.43 | | | | 41 | |
Year ended 10/31/12 | | | 8.06 | | | | 0.08 | | | | (0.47 | ) | | | (0.39 | ) | | | (0.06 | ) | | | (0.03 | ) | | | (0.09 | ) | | | 7.58 | | | | (4.86 | ) | | | 76 | | | | 2.10 | | | | 3.69 | | | | 1.11 | | | | 34 | |
Year ended 10/31/11(e) | | | 10.00 | | | | 0.02 | | | | (1.96 | ) | | | (1.94 | ) | | | — | | | | — | | | | — | | | | 8.06 | | | | (19.40 | ) | | | 9 | | | | 2.09 | (f) | | | 5.53 | (f) | | | 0.62 | (f) | | | 16 | |
Class Y | | | | | | | | | | | | | | | | | | | | | | | | | | | | | | | | | | | | | | | | | | | | | | | | | | | | | | | | |
Year ended 10/31/15 | | | 7.59 | | | | 0.03 | | | | (1.04 | ) | | | (1.01 | ) | | | (0.05 | ) | | | — | | | | (0.05 | ) | | | 6.53 | | | | (13.28 | ) | | | 3,607 | | | | 1.60 | (d) | | | 2.33 | (d) | | | 0.48 | (d) | | | 97 | |
Year ended 10/31/14 | | | 7.62 | | | | 0.08 | | | | (0.04 | ) | | | 0.04 | | | | (0.07 | ) | | | — | | | | (0.07 | ) | | | 7.59 | | | | 0.60 | | | | 3,295 | | | | 1.60 | | | | 2.32 | | | | 0.99 | | | | 94 | |
Year ended 10/31/13 | | | 7.61 | | | | 0.07 | | | | 0.04 | | | | 0.11 | | | | (0.10 | ) | | | — | | | | (0.10 | ) | | | 7.62 | | | | 1.42 | | | | 442 | | | | 1.60 | | | | 2.50 | | | | 0.93 | | | | 41 | |
Year ended 10/31/12 | | | 8.07 | | | | 0.12 | | | | (0.47 | ) | | | (0.35 | ) | | | (0.08 | ) | | | (0.03 | ) | | | (0.11 | ) | | | 7.61 | | | | (4.31 | ) | | | 281 | | | | 1.60 | | | | 3.19 | | | | 1.61 | | | | 34 | |
Year ended 10/31/11(e) | | | 10.00 | | | | 0.04 | | | | (1.97 | ) | | | (1.93 | ) | | | — | | | | — | | | | — | | | | 8.07 | | | | (19.30 | ) | | | 38 | | | | 1.59 | (f) | | | 5.03 | (f) | | | 1.12 | (f) | | | 16 | |
Class R5 | | | | | | | | | | | | | | | | | | | | | | | | | | | | | | | | | | | | | | | | | | | | | | | | | | | | | | | | |
Year ended 10/31/15 | | | 7.60 | | | | 0.03 | | | | (1.05 | ) | | | (1.02 | ) | | | (0.05 | ) | | | — | | | | (0.05 | ) | | | 6.53 | | | | (13.40 | ) | | | 885 | | | | 1.60 | (d) | | | 1.98 | (d) | | | 0.48 | (d) | | | 97 | |
Year ended 10/31/14 | | | 7.62 | | | | 0.07 | | | | (0.02 | ) | | | 0.05 | | | | (0.07 | ) | | | — | | | | (0.07 | ) | | | 7.60 | | | | 0.74 | | | | 896 | | | | 1.60 | | | | 2.02 | | | | 0.99 | | | | 94 | |
Year ended 10/31/13 | | | 7.61 | | | | 0.07 | | | | 0.04 | | | | 0.11 | | | | (0.10 | ) | | | — | | | | (0.10 | ) | | | 7.62 | | | | 1.42 | | | | 366 | | | | 1.60 | | | | 2.26 | | | | 0.93 | | | | 41 | |
Year ended 10/31/12 | | | 8.07 | | | | 0.12 | | | | (0.47 | ) | | | (0.35 | ) | | | (0.08 | ) | | | (0.03 | ) | | | (0.11 | ) | | | 7.61 | | | | (4.31 | ) | | | 118 | | | | 1.60 | | | | 2.90 | | | | 1.61 | | | | 34 | |
Year ended 10/31/11(e) | | | 10.00 | | | | 0.04 | | | | (1.97 | ) | | | (1.93 | ) | | | — | | | | — | | | | — | | | | 8.07 | | | | (19.30 | ) | | | 7,720 | | | | 1.59 | (f) | | | 4.86 | (f) | | | 1.12 | (f) | | | 16 | |
Class R6 | | | | | | | | | | | | | | | | | | | | | | | | | | | | | | | | | | | | | | | | | | | | | | | | | | | | | | | | |
Year ended 10/31/15 | | | 7.60 | | | | 0.03 | | | | (1.04 | ) | | | (1.01 | ) | | | (0.05 | ) | | | — | | | | (0.05 | ) | | | 6.54 | | | | (13.26 | ) | | | 7,171 | | | | 1.60 | (d) | | | 1.98 | (d) | | | 0.48 | (d) | | | 97 | |
Year ended 10/31/14 | | | 7.62 | | | | 0.07 | | | | (0.02 | ) | | | 0.05 | | | | (0.07 | ) | | | — | | | | (0.07 | ) | | | 7.60 | | | | 0.73 | | | | 8,116 | | | | 1.60 | | | | 2.00 | | | | 0.99 | | | | 94 | |
Year ended 10/31/13 | | | 7.62 | | | | 0.07 | | | | 0.03 | | | | 0.10 | | | | (0.10 | ) | | | — | | | | (0.10 | ) | | | 7.62 | | | | 1.28 | | | | 8,619 | | | | 1.60 | | | | 2.21 | | | | 0.93 | | | | 41 | |
Year ended 10/31/12(e) | | | 7.85 | | | | 0.01 | | | | (0.24 | ) | | | (0.23 | ) | | | — | | | | — | | | | — | | | | 7.62 | | | | (2.93 | ) | | | 7,488 | | | | 1.60 | (f) | | | 1.79 | (f) | | | 1.61 | (f) | | | 34 | |
| (a) | Calculated using average shares outstanding. |
| (b) | Includes adjustments in accordance with accounting principles generally accepted in the United States of America and as such, the net asset value for financial reporting purposes and the returns based upon those net asset values may differ from the net asset value and returns for shareholder transactions. Does not include sales charges and is not annualized for periods less than one year, if applicable. |
| (c) | Portfolio turnover is calculated at the fund level and is not annualized for periods less than one year, if applicable. |
| (d) | Ratios are based on average daily net assets (000’s omitted) of $11,518, $2,737, $1,218, $3,513, $881 and $7,831 for Class A, Class C, Class R, Class Y, Class R5 and Class R6 shares, respectively. |
| (e) | Commencement date of May 31, 2011 for Class A, Class C, Class R, Class Y and Class R5 shares and September 24, 2012 for Class R6 shares. |
19 Invesco Emerging Markets Equity Fund
Report of Independent Registered Public Accounting Firm
To the Board of Trustees of AIM Investment Funds (Invesco Investment Funds)
and Shareholders of Invesco Emerging Markets Equity Fund:
In our opinion, the accompanying statement of assets and liabilities, including the schedule of investments, and the related statements of operations and of changes in net assets and the financial highlights present fairly, in all material respects, the financial position of Invesco Emerging Markets Equity Fund (one of the funds constituting AIM Investment Funds (Invesco Investment Funds), hereafter referred to as the “Fund”) at October 31, 2015, the results of its operations for the year then ended, the changes in its net assets for each of the two years in the period then ended and the financial highlights for each of the four years in the period then ended and for the period May 31, 2011 (commencement of operations) through October 31, 2011, in conformity with accounting principles generally accepted in the United States of America. These financial statements and financial highlights (hereafter referred to as “financial statements”) are the responsibility of the Fund’s management. Our responsibility is to express an opinion on these financial statements based on our audits. We conducted our audits of these financial statements in accordance with the standards of the Public Company Accounting Oversight Board (United States). Those standards require that we plan and perform the audit to obtain reasonable assurance about whether the financial statements are free of material misstatement. An audit includes examining, on a test basis, evidence supporting the amounts and disclosures in the financial statements, assessing the accounting principles used and significant estimates made by management, and evaluating the overall financial statement presentation. We believe that our audits, which included confirmation of securities at October 31, 2015 by correspondence with the custodian and brokers, and the application of alternative auditing procedures where confirmations of security purchases have not been received, provide a reasonable basis for our opinion.
PRICEWATERHOUSECOOPERS LLP
December 23, 2015
Houston, Texas
20 Invesco Emerging Markets Equity Fund
Calculating your ongoing Fund expenses
Example
As a shareholder of the Fund, you incur two types of costs: (1) transaction costs, which may include sales charges (loads) on purchase payments or contingent deferred sales charges on redemptions, if any; and (2) ongoing costs, including management fees, distribution and/or service (12b-1) fees, and other Fund expenses. This example is intended to help you understand your ongoing costs (in dollars) of investing in the Fund and to compare these costs with ongoing costs of investing in other mutual funds. The example is based on an investment of $1,000 invested at the beginning of the period and held for the entire period May 1, 2015 through October 31, 2015.
Actual expenses
The table below provides information about actual account values and actual expenses. You may use the information in this table, together with the amount you invested, to estimate the expenses that you paid over the period. Simply divide your account value by $1,000 (for example, an $8,600 account value divided by $1,000 = 8.6), then multiply the result by the number in the table under the heading entitled “Actual Expenses Paid During Period” to estimate the expenses you paid on your account during this period.
Hypothetical example for comparison purposes
The table below also provides information about hypothetical account values and hypothetical expenses based on the Fund’s actual expense ratio and an assumed rate of return of 5% per year before expenses, which is not the Fund’s actual return.
The hypothetical account values and expenses may not be used to estimate the actual ending account balance or expenses you paid for the period. You may use this information to compare the ongoing costs of investing in the Fund and other funds. To do so, compare this 5% hypothetical example with the 5% hypothetical examples that appear in the shareholder reports of the other funds.
Please note that the expenses shown in the table are meant to highlight your ongoing costs only and do not reflect any transaction costs, such as sales charges (loads) on purchase payments or contingent deferred sales charges on redemptions, if any. Therefore, the hypothetical information is useful in comparing ongoing costs only, and will not help you determine the relative total costs of owning different funds. In addition, if these transaction costs were included, your costs would have been higher.
| | | | | | | | | | | | | | | | | | | | | | | | |
| Class | | Beginning
Account Value
(05/01/15) | | | ACTUAL | | | HYPOTHETICAL (5% annual return before
expenses) | | | Annualized
Expense
Ratio | |
| | | Ending
Account Value
(10/31/15)1 | | | Expenses
Paid During
Period2 | | | Ending
Account Value
(10/31/15) | | | Expenses
Paid During
Period2 | | |
| A | | $ | 1,000.00 | | | $ | 850.30 | | | $ | 8.63 | | | $ | 1,015.88 | | | $ | 9.40 | | | | 1.85 | % |
| C | | | 1,000.00 | | | | 846.10 | | | | 12.10 | | | | 1,012.10 | | | | 13.19 | | | | 2.60 | |
| R | | | 1,000.00 | | | | 848.60 | | | | 9.78 | | | | 1,014.62 | | | | 10.66 | | | | 2.10 | |
| Y | | | 1,000.00 | | | | 850.30 | | | | 7.46 | | | | 1,017.14 | | | | 8.13 | | | | 1.60 | |
| R5 | | | 1,000.00 | | | | 850.30 | | | | 7.46 | | | | 1,017.14 | | | | 8.13 | | | | 1.60 | |
| R6 | | | 1,000.00 | | | | 851.60 | | | | 7.47 | | | | 1,017.14 | | | | 8.13 | | | | 1.60 | |
| 1 | The actual ending account value is based on the actual total return of the Fund for the period May 1, 2015 through October 31, 2015, after actual expenses and will differ from the hypothetical ending account value which is based on the Fund’s expense ratio and a hypothetical annual return of 5% before expenses. |
| 2 | Expenses are equal to the Fund’s annualized expense ratio as indicated above multiplied by the average account value over the period, multiplied by 184/365 to reflect the most recent fiscal half year. |
21 Invesco Emerging Markets Equity Fund
Approval of Investment Advisory and Sub-Advisory Contracts
The Board of Trustees (the Board) of AIM Investment Funds (Invesco Investment Funds) is required under the Investment Company Act of 1940, as amended, to approve annually the renewal of Invesco Emerging Markets Equity Fund’s (the Fund) investment advisory agreements. During contract renewal meetings held on June 9-10, 2015, the Board as a whole, and the disinterested or “independent” Trustees, who comprise over 75% of the Board, voting separately, approved the continuance for the Fund of the Master Investment Advisory Agreement with Invesco Advisers, Inc. (Invesco Advisers and the investment advisory agreement) and the Master Intergroup Sub-Advisory Contract for Mutual Funds with Invesco Asset Management Deutschland GmbH, Invesco Asset Management Limited, Invesco Asset Management (Japan) Limited, Invesco Hong Kong Limited, Invesco Senior Secured Management, Inc. and Invesco Canada Ltd. (collectively, the Affiliated Sub-Advisers and the sub-advisory contracts) for another year, effective July 1, 2015.
In evaluating the fairness and reasonableness of compensation under the Fund’s investment advisory agreement and sub-advisory contracts, the Board considered, among other things, the factors discussed below. The Board determined that continuation of the Fund’s investment advisory agreement and the sub-advisory contracts are in the best interest of the Fund and its shareholders and that the compensation payable to Invesco Advisers and the Affiliated Sub-Advisers under the agreements is fair and reasonable.
The Board’s Fund Evaluation Process
The Board’s Investments Committee has established three Sub-Committees, each of which is primarily responsible for overseeing the performance and investment management services provided by Invesco Advisers and the Affiliated Sub-Advisers to a number of the funds advised by Invesco Advisers (the Invesco Funds). The Sub-Committees meet throughout the year to review the performance of their assigned Invesco Funds, including reviewing materials prepared under the direction of the independent Senior Officer, an officer of the Invesco Funds who reports directly to the independent Trustees. Over the course of each year, the Sub-Committees meet with portfolio managers for their assigned Invesco Funds and other members of management to review the performance, investment objective(s), policies, strategies, limitations and investment risks of these funds. The Board had the benefit of reports form the Sub-Committees and Investments Committee throughout the year in considering approval of the continuance of each Invesco Fund’s investment advisory agreement and sub-advisory contracts for another year.
During the contract renewal process, the Board receives comparative performance and fee data regarding the Invesco Funds prepared by Invesco Advisers and Lipper Inc. (Lipper), an independent provider of investment company data. The Board also receives a report and this independent written evaluation from the Senior Officer. The Senior Officer’s evaluation is prepared as part of his responsibility to manage the process by which the Invesco Funds’ proposed management fees are negotiated during the annual contract renewal process to ensure they are negotiated in a manner that is at arms’ length and reasonable. In addition to meetings with Invesco Advisers and fund counsel, the independent Trustees also discuss the continuance of the investment advisory agreement and sub-advisory contracts in separate sessions with the Senior Officer and with independent legal counsel.
The Trustees recognized that the advisory fee rates for the Invesco Funds are, in many cases, the result of years of review and negotiation. The Trustees’ deliberations and conclusions in a particular year may be based in part on their deliberations and conclusions regarding these same arrangements throughout the year and in prior years. The Trustees’ review and conclusions are based on the comprehensive consideration of all information presented to them and are not the result of any single determinative factor. Moreover, one Trustee may have weighed a particular piece of information or factor differently than another Trustee.
The discussion below is a summary of the Senior Officer’s independent written evaluation with respect to the Fund’s investment advisory agreement as well as a discussion of the material factors and related conclusions that formed the basis for the Board’s approval of the Fund’s investment advisory agreement and sub-advisory contracts. Unless otherwise stated, this information is current as of June 10, 2015, and does not reflect consideration of factors that became known to the Board after that date.
Factors and Conclusions and Summary of Independent Written Fee Evaluation
| A. | Nature, Extent and Quality of Services Provided by Invesco Advisers and the Affiliated Sub-Advisers |
The Board reviewed the advisory services provided to the Fund by Invesco Advisers under the Fund’s investment advisory agreement, the performance of Invesco Advisers in providing these services, and the credentials and experience of the officers and employees of Invesco Advisers who provide these services, including the Fund’s portfolio manager or managers. The Board’s review of the qualifications of Invesco Advisers to provide advisory services included the Board’s
consideration of Invesco Advisers’ investment process oversight, independent credit analysis and investment risk management. The Board also considered non-advisory services that Invesco Advisers and its affiliates provide to the Invesco Funds such as various back office support functions, equity and fixed income trading operations, internal audit, distribution, valuation and legal and compliance.
In determining whether to continue the Fund’s investment advisory agreement, the Board considered the benefits of reapproving an existing relationship and the greater uncertainty that may be associated with entering into a new relationship. The Board concluded that the nature, extent and quality of the services provided to the Fund by Invesco Advisers are appropriate and satisfactory and consistent with the terms of the Fund’s investment advisory agreement.
The Board reviewed the services that may be provided by the Affiliated Sub-Advisers under the sub-advisory contracts and the credentials and experience of the officers and employees of the Affiliated Sub-Advisers who provide these services. The Board noted that the Affiliated Sub-Advisers have offices and personnel that are located in financial centers around the world. As a result, the Affiliated Sub-Advisers can provide research and investment analysis on the markets and economies of various countries in which the Fund may invest, make recommendations regarding securities and assist with security trades. The Board concluded that the sub-advisory contracts benefit the Fund and its shareholders by permitting Invesco Advisers to use the resources and talents of the Affiliated Sub-Advisers in managing the Fund. The Board concluded that the nature, extent and quality of the services that may be provided by the Affiliated Sub-Advisers are appropriate and satisfactory and consistent with the terms of the Fund’s sub-advisory contracts.
The Board considered Fund performance as a relevant factor in considering whether to approve the investment advisory agreement. The Board did not view Fund performance as a relevant factor in considering whether to approve the sub-advisory contracts for the Fund, as no Affiliated Sub-Adviser currently manages assets of the Fund.
The Board noted that the Fund recently began operations and that comparative performance data for only the past three calendar years was available. The Board compared the Fund’s performance during the past three calendar years to the performance of funds in the Lipper performance universe and against the Lipper Emerging Markets Funds Index. The Board noted that the Fund’s performance of Class A shares of the Fund was in the fourth quintile of its performance universe for the one year period and in the fifth
22 Invesco Emerging Markets Equity Fund
quintile for the three year period (the first quintile being the best performing funds and the fifth quintile being the worst performing funds). The Board noted that performance of Class A shares of the Fund was below the performance of the Index for the one and three year periods. Invesco Advisers noted that the portfolio management team had been reorganized in February 2014. The Trustees also reviewed more recent Fund performance and this review did not change their conclusions.
| C. | Advisory and Sub-Advisory Fees |
The Board compared the Fund’s contractual management fee rate to the contractual management fee rates of funds in the Fund’s Lipper expense group at a common asset level. The Board noted that the contractual management fee rate for Class A shares of the Fund was below the median contractual management fee rate of funds in its expense group. The Board noted that the term “contractual management fee” may include both advisory and certain administrative services fees, but that Lipper does not provide information on a fund by fund basis as to what is included. The Board noted that Invesco Advisers does not charge the Invesco Funds for the administrative services included in the term as defined by Lipper. The Board also reviewed the methodology used by Lipper in providing expense group information, which includes using each fund’s contractual management fee schedule (including any applicable breakpoints) as reported in the most recent prospectus or statement of additional information for each fund in the expense group.
The Board noted that Invesco Advisers has contractually agreed to waive fees and/or limit expenses of the Fund through at least February 29, 2016 in an amount necessary to limit total annual operating expenses to a specified percentage of average daily net assets for each class of the Fund.
The Board also compared the Fund’s effective advisory fee rate (the advisory fee rate after advisory fee waivers and before other expense limitations/waivers) to the effective advisory fee rates of other funds advised by Invesco Advisers and its affiliates with investment strategies comparable to those of the Fund. The Board noted that the Fund’s rate was above the rate of one such mutual fund. The Board noted that Invesco Advisers and the Affiliated Sub-Advisers do not manage other client accounts with investment strategies comparable to those of the Fund.
| D. | Economies of Scale and Breakpoints |
The Board considered the extent to which there are economies of scale in the provision of advisory services to the Fund. The Board also considered whether the Fund benefits from economies of scale through contractual breakpoints in the Fund’s advisory fee schedule. The Board also noted that the Fund shares directly in economies of scale through lower fees charged by third party service providers based on the combined size of the Invesco
Funds and other clients advised by Invesco Advisers.
| E. | Profitability and Financial Resources |
The Board reviewed information from Invesco Advisers concerning the costs of the advisory and other services that Invesco Advisers and its affiliates provide to the Fund and the Invesco Funds and the profitability of Invesco Advisers and its affiliates in providing these services. The Board received information from Invesco Advisers about the methodology used to prepare the profitability information. The Board noted that Invesco Advisers continues to operate at a net profit from services Invesco Advisers and its affiliates provide to the Invesco Funds. The Board noted that Invesco Advisers and its affiliates did not make a profit from managing the Fund as a result of fee and expense waivers. The Board received and accepted information from Invesco Advisers demonstrating that Invesco Advisers and each Affiliated Sub-Adviser are financially sound and have the resources necessary to perform their obligations under the investment advisory agreement and sub-advisory contracts.
| F. | Collateral Benefits to Invesco Advisers and its Affiliates |
The Board considered various other benefits received by Invesco Advisers and its affiliates from the relationship with the Fund, including the fees received for providing transfer agency and distribution services to the Fund. The Board considered comparative information regarding fees charged for these services, including information provided by Lipper and other independent sources. The Board considered the performance of Invesco Advisers and its affiliates in providing these services and the organizational structure employed to provide these services. The Board also considered that these services are provided to the Fund pursuant to written contracts that are reviewed and approved on an annual basis by the Board; and that the services are required for the operation of the Fund.
The Board considered the benefits realized by Invesco Advisers and the Affiliated Sub-Advisers as a result of portfolio brokerage transactions executed through “soft dollar” arrangements. The Board noted that soft dollar arrangements shift the payment obligation for research services from Invesco Advisers and the Affiliated Sub-Advisers to the Invesco Funds and that the research received may be used with other clients of Invesco Advisers and may reduce Invesco Advisers’ and the Affiliated Sub-Advisers’ expenses. The Board also considered that it receives periodic reports from the Chief Compliance Officer of the Invesco Funds demonstrating that these arrangements are consistent with regulatory requirements. The Board did not deem the soft dollar arrangements to be inappropriate.
The Board considered that the Fund’s uninvested cash and cash collateral from any securities lending arrangements may be invested in money market funds advised by Invesco Advisers pursuant to procedures
approved by the Board. The Board noted that Invesco Advisers receives advisory fees from these affiliated money market funds attributable to such investments, although Invesco Advisers has contractually agreed to waive through varying periods the advisory fees payable by the Invesco Funds with respect to investments in the affiliated money market funds. The waiver is in an amount equal to 100% of the net advisory fee Invesco Advisers receives from the affiliated money market funds with respect to the Fund’s investment in the affiliated money market funds of uninvested cash, but not cash collateral. The Board concluded that the amount of advisory fees received by Invesco Advisors from the Fund’s investment of cash collateral from any securities lending arrangements in the affiliated money market funds is fair and reasonable.
The Board also considered the Fund may use an affiliated broker to execute certain trades for the Fund to among other things, control information leakage, and were advised that such trades would be executed in compliance with rules under the Investment Company Act of 1940, as amended, and consistent with best execution obligations.
23 Invesco Emerging Markets Equity Fund
Tax Information
Form 1099-DIV, Form 1042-S and other year–end tax information provide shareholders with actual calendar year amounts that should be included in their tax returns. Shareholders should consult their tax advisors.
The following distribution information is being provided as required by the Internal Revenue Code or to meet a specific state’s requirement.
The Fund designates the following amounts or, if subsequently determined to be different, the maximum amount allowable for its fiscal year ended October 31, 2015:
| | | | |
Federal and State Income Tax | |
Qualified Dividend Income* | | | 99.39 | % |
Corporate Dividends Received Deduction* | | | 0.05 | % |
U.S. Treasury Obligations* | | | 0 | % |
| | * | The above percentages are based on ordinary income dividends paid to shareholders during the Fund’s fiscal year. |
24 Invesco Emerging Markets Equity Fund
Trustees and Officers
The address of each trustee and officer is AIM Investment Funds (Invesco Investment Funds) (the “Trust”), 11 Greenway Plaza, Suite 1000, Houston, Texas 77046-1173. The trustees serve for the life of the Trust, subject to their earlier death, incapacitation, resignation, retirement or removal as more specifically provided in the Trust’s organizational documents. Each officer serves for a one year term or until their successors are elected and qualified. Column two below includes length of time served with predecessor entities, if any.
| | | | | | | | |
Name, Year of Birth and
Position(s) Held with the Trust | | Trustee and/
or Officer Since | | Principal Occupation(s)
During Past 5 Years | | Number of Funds in Fund Complex Overseen by Trustee | | Other Directorship(s) Held by Trustee During Past 5 Years |
| Interested Persons | | | | | | | | |
| Martin L. Flanagan1 — 1960 Trustee | | 2007 | | Executive Director, Chief Executive Officer and President, Invesco Ltd. (ultimate parent of Invesco and a global investment management firm); Advisor to the Board, Invesco Advisers, Inc. (formerly known as Invesco Institutional (N.A.), Inc.); Trustee, The Invesco Funds; Vice Chair, Investment Company Institute; and Member of Executive Board, SMU Cox School of Business Formerly: Chairman and Chief Executive Officer, Invesco Advisers, Inc. (registered investment adviser); Director, Chairman, Chief Executive Officer and President, IVZ Inc. (holding company), INVESCO Group Services, Inc. (service provider) and Invesco North American Holdings, Inc. (holding company); Director, Chief Executive Officer and President, Invesco Holding Company Limited (parent of Invesco and a global investment management firm); Director, Invesco Ltd.; Chairman, Investment Company Institute and President, Co-Chief Executive Officer, Co-President, Chief Operating Officer and Chief Financial Officer, Franklin Resources, Inc. (global investment management organization). | | 145 | | None |
Philip A. Taylor2 — 1954
Trustee, President and Principal Executive Officer | | 2006 | | Head of North American Retail and Senior Managing Director, Invesco Ltd.; Director, Co-Chairman, Co-President and Co-Chief Executive Officer, Invesco Advisers, Inc. (formerly known as Invesco Institutional (N.A.), Inc.) (registered investment adviser); Director, Chairman, Chief Executive Officer and President, Invesco Management Group, Inc. (formerly known as Invesco Aim Management Group, Inc.) (financial services holding company); Director and President, INVESCO Funds Group, Inc. (registered investment adviser and registered transfer agent); Director and Chairman, Invesco Investment Services, Inc. (formerly known as Invesco Aim Investment Services, Inc.) (registered transfer agent) and IVZ Distributors, Inc. (formerly known as INVESCO Distributors, Inc.) (registered broker dealer); Chief Executive Officer, Invesco Corporate Class Inc. (corporate mutual fund company) Director, Chairman and Chief Executive Officer, Invesco Canada Ltd. (formerly known as Invesco Trimark Ltd./Invesco Trimark Ltèe) (registered investment adviser and registered transfer agent); Trustee, President and Principal Executive Officer, The Invesco Funds (other than AIM Treasurer’s Series Trust (Invesco Treasurer’s Series Trust), Short-Term Investments Trust and Invesco Management Trust); Trustee and Executive Vice President, The Invesco Funds (AIM Treasurer’s Series Trust (Invesco Treasurer’s Series Trust), Short-Term Investments Trust and Invesco Management Trust only); Director, Invesco Investment Advisers LLC (formerly known as Van Kampen Asset Management); Director, Chief Executive Officer and President, Van Kampen Exchange Corp. Formerly: Director, President and Chairman, Invesco Inc. (holding company), Invesco Canada Holdings Inc. (holding company), Trimark Investments Ltd./Placements Trimark Ltèe and Invesco Financial Services Ltd/Services Financiers Invesco Ltèe; Chief Executive Officer, Invesco Canada Fund Inc (corporate mutual fund company); Director and Chairman, Van Kampen Investor Services Inc.; Director, Chief Executive Officer and President, 1371 Preferred Inc. (holding company) and Van Kampen Investments Inc.; Director and President, AIM GP Canada Inc. (general partner for limited partnerships) and Van Kampen Advisors, Inc.; Director and Chief Executive Officer, Invesco Trimark Dealer Inc. (registered broker dealer); Director, Invesco Distributors, Inc. (formerly known as Invesco Aim Distributors, Inc.) (registered broker dealer); Manager, Invesco PowerShares Capital Management LLC; Director, Chief Executive Officer and President, Invesco Advisers, Inc.; Director, Chairman, Chief Executive Officer and President, Invesco Aim Capital Management, Inc.; President, Invesco Trimark Dealer Inc. and Invesco Trimark Ltd./Invesco Trimark Ltèe; Director and President, AIM Trimark Corporate Class Inc. and AIM Trimark Canada Fund Inc.; Senior Managing Director, Invesco Holding Company Limited; Director and Chairman, Fund Management Company (former registered broker dealer); President and Principal Executive Officer, The Invesco Funds (AIM Treasurer’s Series Trust (Invesco Treasurer’s Series Trust), and Short-Term Investments Trust only); President, AIM Trimark Global Fund Inc. and AIM Trimark Canada Fund Inc.. | | 145 | | None |
| 1 | Mr. Flanagan is considered an interested person (within the meaning of Section 2(a)(19) of the 1940 Act) of the Trust because he is an officer of the Adviser to the Trust, and an officer and a director of Invesco Ltd., ultimate parent of the Adviser. |
| 2 | Mr. Taylor is considered an interested person (within the meaning of Section 2(a)(19) of the 1940 Act) of the Trust because he is an officer and a director of the Adviser. |
T-1 Invesco Emerging Markets Equity Fund
Trustees and Officers—(continued)
| | | | | | | | |
Name, Year of Birth and Position(s) Held with the Trust | | Trustee and/ or Officer Since | | Principal Occupation(s) During Past 5 Years | | Number of Funds in Fund Complex Overseen by Trustee | | Other Directorship(s) Held by Trustee During Past 5 Years |
| Independent Trustees | | | | | | | | |
Bruce L. Crockett — 1944 Trustee and Chair | | 2003 | | Chairman, Crockett Technologies Associates (technology consulting company) Formerly: Director, Captaris (unified messaging provider); Director, President and Chief Executive Officer, COMSAT Corporation; Chairman, Board of Governors of INTELSAT (international communications company); ACE Limited (insurance company); Independent Directors Council and Investment Company Institute | | 145 | | ALPS (Attorneys Liability Protection Society) (insurance company) and Globe Specialty Metals, Inc. (metallurgical company) |
David C. Arch — 1945 Trustee | | 2010 | | Chairman of Blistex Inc., a consumer health care products manufacturer | | 145 | | Board member of the Illinois Manufacturers’ Association; Member of the Board of Visitors, Institute for the Humanities, University of Michigan; Member of the Audit Committee of the Edward-Elmhurst Hospital |
James T. Bunch — 1942 Trustee | | 2000 | | Managing Member, Grumman Hill Group LLC (family office/private equity investments) Formerly: Founder, Green Manning & Bunch Ltd. (investment banking firm) (1988-2010); Executive Committee, United States Golf Association; and Chairman, Board of Governors, Western Golf Association | | 145 | | Chairman of the Board of Trustees, Evans Scholars Foundation; and Chairman of the Board, Denver Film Society |
Rodney F. Dammeyer — 1940 Trustee | | 2010 | | Chairman of CAC, LLC, (private company offering capital investment and management advisory services) Formerly: Prior to 2001, Managing Partner at Equity Group Corporate Investments; Prior to 1995, Chief Executive Officer of Itel Corporation (formerly Anixter International); Prior to 1985, experience includes Senior Vice President and Chief Financial Officer of Household International, Inc., Executive Vice President and Chief Financial Officer of Northwest Industries, Inc. and Partner of Arthur Andersen & Co.; From 1987 to 2010, Director/Trustee of investment companies in the Van Kampen Funds complex | | 145 | | Director of Quidel Corporation and Stericycle, Inc. |
Albert R. Dowden — 1941 Trustee | | 2003 | | Director of a number of public and private business corporations, including the Boss Group, Ltd. (private investment and management); Nature’s Sunshine Products, Inc. and Reich & Tang Funds (5 portfolios) (registered investment company) Formerly: Director, Homeowners of America Holding Corporation/Homeowners of America Insurance Company (property casualty company); Director, Continental Energy Services, LLC (oil and gas pipeline service); Director, CompuDyne Corporation (provider of product and services to the public security market) and Director, Annuity and Life Re (Holdings), Ltd. (reinsurance company); Director, President and Chief Executive Officer, Volvo Group North America, Inc.; Senior Vice President, AB Volvo; Director of various public and private corporations; Chairman, DHJ Media, Inc.; Director, Magellan Insurance Company; and Director, The Hertz Corporation, Genmar Corporation (boat manufacturer), National Media Corporation; Advisory Board of Rotary Power International (designer, manufacturer, and seller of rotary power engines); and Chairman, Cortland Trust, Inc. (registered investment company) | | 145 | | Director of: Nature’s Sunshine Products, Inc., Reich & Tang Funds, Homeowners of America Holding Corporation/ Homeowners of America Insurance Company, the Boss Group |
Jack M. Fields — 1952 Trustee | | 2003 | | Chief Executive Officer, Twenty First Century Group, Inc. (government affairs company); Owner and Chief Executive Officer, Dos Angeles Ranch, L.P. (cattle, hunting, corporate entertainment); and Discovery Global Education Fund (non-profit) Formerly: Chief Executive Officer, Texana Timber LP (sustainable forestry company); Director of Cross Timbers Quail Research Ranch (non-profit); and member of the U.S. House of Representatives | | 145 | | Insperity, Inc. (formerly known as Administaff) |
Prema Mathai-Davis — 1950 Trustee | | 2003 | | Retired. Formerly: Chief Executive Officer, YWCA of the U.S.A. | | 145 | | None |
Larry Soll — 1942 Trustee | | 1997 | | Retired. Formerly: Chairman, Chief Executive Officer and President, Synergen Corp. (a biotechnology company) | | 145 | | None |
Hugo F. Sonnenschein — 1940 Trustee | | 2010 | | President Emeritus and Honorary Trustee of the University of Chicago and the Adam Smith Distinguished Service Professor in the Department of Economics at the University of Chicago. Prior to 2000, President of the University of Chicago | | 145 | | Trustee of the University of Rochester and a member of its investment committee; Member of the National Academy of Sciences and the American Philosophical Society; Fellow of the American Academy of Arts and Sciences |
Raymond Stickel, Jr. — 1944 Trustee | | 2005 | | Retired. Formerly: Director, Mainstay VP Series Funds, Inc. (25 portfolios) and Partner, Deloitte & Touche | | 145 | | None |
T-2 Invesco Emerging Markets Equity Fund
Trustees and Officers—(continued)
| | | | | | | | |
Name, Year of Birth and Position(s) Held with the Trust | | Trustee and/ or Officer Since | | Principal Occupation(s) During Past 5 Years | | Number of Funds in Fund Complex Overseen by Trustee | | Other Directorship(s) Held by Trustee During Past 5 Years |
| Independent Trustees—(continued) |
Suzanne H. Woolsey — 1941 Trustee | | 2014 | | Chief Executive Officer of Woolsey Partners LLC | | 145 | | Emeritus Chair of the Board of Trustees of the Institute for Defense Analyses; Trustee of Colorado College; Trustee of California Institute of Technology; Prior to 2014, Director of Fluor Corp.; Prior to 2010, Trustee of the German Marshall Fund of the United States; Prior to 2010 Trustee of the Rocky Mountain Institute |
| Other Officers | | | | | | | | |
Russell C. Burk — 1958
Senior Vice President and Senior Officer | | 2005 | | Senior Vice President and Senior Officer, The Invesco Funds | | N/A | | N/A |
John M. Zerr — 1962
Senior Vice President, Chief Legal Officer and Secretary | | 2006 | | Director, Senior Vice President, Secretary and General Counsel, Invesco Management Group, Inc. (formerly known as Invesco Aim Management Group, Inc.) and Van Kampen Exchange Corp.; Senior Vice President, Invesco Advisers, Inc. (formerly known as Invesco Institutional (N.A.), Inc.) (registered investment adviser); Senior Vice President and Secretary, Invesco Distributors, Inc. (formerly known as Invesco Aim Distributors, Inc.); Director, Vice President and Secretary, Invesco Investment Services, Inc. (formerly known as Invesco Aim Investment Services, Inc.) and IVZ Distributors, Inc. (formerly known as INVESCO Distributors, Inc.); Director and Vice President, INVESCO Funds Group, Inc.; Senior Vice President, Chief Legal Officer and Secretary, The Invesco Funds; Managing Director, Invesco PowerShares Capital Management LLC; Director, Secretary and General Counsel, Invesco Investment Advisers LLC (formerly known as Van Kampen Asset Management); Secretary and General Counsel, Invesco Capital Markets, Inc. (formerly known as Van Kampen Funds Inc.) and Chief Legal Officer, PowerShares Exchange-Traded Fund Trust, PowerShares Exchange-Traded Fund Trust II, PowerShares India Exchange-Traded Fund Trust, PowerShares Actively Managed Exchange-Traded Fund Trust, and PowerShares Actively Managed Exchange-Traded Commodity Fund Trust Formerly: Director and Vice President, Van Kampen Advisors Inc.; Director, Vice President, Secretary and General Counsel, Van Kampen Investor Services Inc.; Director, Invesco Distributors, Inc. (formerly known as Invesco Aim Distributors, Inc.); Director, Senior Vice President, General Counsel and Secretary, Invesco Aim Advisers, Inc. and Van Kampen Investments Inc.; Director, Vice President and Secretary, Fund Management Company; Director, Senior Vice President, Secretary, General Counsel and Vice President, Invesco Aim Capital Management, Inc.; Chief Operating Officer and General Counsel, Liberty Ridge Capital, Inc. (an investment adviser); Vice President and Secretary, PBHG Funds (an investment company) and PBHG Insurance Series Fund (an investment company); Chief Operating Officer, General Counsel and Secretary, Old Mutual Investment Partners (a broker-dealer); General Counsel and Secretary, Old Mutual Fund Services (an administrator) and Old Mutual Shareholder Services (a shareholder servicing center); Executive Vice President, General Counsel and Secretary, Old Mutual Capital, Inc. (an investment adviser); and Vice President and Secretary, Old Mutual Advisors Funds (an investment company) | | N/A | | N/A |
Sheri Morris — 1964
Vice President, Treasurer and Principal Financial Officer | | 2003 | | Vice President, Treasurer and Principal Financial Officer, The Invesco Funds; Vice President, Invesco Advisers, Inc. (formerly known as Invesco Institutional (N.A.), Inc.) (registered investment adviser); and Vice President, PowerShares Exchange-Traded Fund Trust, PowerShares Exchange-Traded Fund Trust II, PowerShares India Exchange-Traded Fund Trust, PowerShares Actively Managed Exchange-Traded Fund Trust, and PowerShares Actively Managed Exchange-Traded Commodity Fund Trust Formerly: Vice President, Invesco Aim Advisers, Inc., Invesco Aim Capital Management, Inc. and Invesco Aim Private Asset Management, Inc.; Assistant Vice President and Assistant Treasurer, The Invesco Funds and Assistant Vice President, Invesco Advisers, Inc., Invesco Aim Capital Management, Inc. and Invesco Aim Private Asset Management, Inc.; and Treasurer, PowerShares Exchange-Traded Fund Trust, PowerShares Exchange-Traded Fund Trust II, PowerShares India Exchange-Traded Fund Trust and PowerShares Actively Managed Exchange-Traded Fund Trust | | N/A | | N/A |
T-3 Invesco Emerging Markets Equity Fund
Trustees and Officers—(continued)
| | | | | | | | |
Name, Year of Birth and
Position(s) Held with the Trust | | Trustee and/
or Officer Since | | Principal Occupation(s)
During Past 5 Years | | Number of Funds in Fund Complex Overseen by Trustee | | Other Directorship(s) Held by Trustee During Past 5 Years |
| Other Officers—(continued) | | | | | | | | |
Karen Dunn Kelley — 1960
Vice President | | 2003 | | Senior Managing Director, Investments, Invesco Ltd.; Director, Co-President, Co-Chief Executive Officer, and Co-Chairman, Invesco Advisers, Inc. (formerly known as Invesco Institutional (N.A.), Inc.) (registered investment adviser); Chairman, Invesco Senior Secured Management, Inc.; Senior Vice President, Invesco Management Group, Inc. (formerly known as Invesco Aim Management Group, Inc.); Executive Vice President, Invesco Distributors, Inc. (formerly known as Invesco Aim Distributors, Inc.); Director, Invesco Mortgage Capital Inc. and Invesco Management Company Limited; Vice President, The Invesco Funds (other than AIM Treasurer’s Series Trust (Invesco Treasurer’s Series Trust), Short-Term Investments Trust and Invesco Management Trust); and President and Principal Executive Officer, The Invesco Funds (AIM Treasurer’s Series Trust (Invesco Treasurer’s Series Trust), Short-Term Investments Trust and Invesco Management Trust only) Formerly: Director and President, INVESCO Asset Management (Bermuda) Ltd., Director, INVESCO Global Asset Management Limited and INVESCO Management S.A.; Senior Vice President, Van Kampen Investments Inc. and Invesco Advisers, Inc. (formerly known as Invesco Institutional (N.A.), Inc.) (registered investment adviser); Vice President, Invesco Advisers, Inc. (formerly known as Invesco Institutional (N.A.), Inc.); Director of Cash Management and Senior Vice President, Invesco Advisers, Inc. and Invesco Aim Capital Management, Inc.; Director and President, Fund Management Company; Chief Cash Management Officer, Director of Cash Management, Senior Vice President, and Managing Director, Invesco Aim Capital Management, Inc.; Director of Cash Management, Senior Vice President, and Vice President, Invesco Advisers, Inc. and The Invesco Funds (AIM Treasurer’s Series Trust (Invesco Treasurer’s Series Trust), and Short-Term Investments Trust only) | | N/A | | N/A |
Crissie M. Wisdom — 1969 Anti-Money Laundering Compliance Officer | | 2013 | | Anti-Money Laundering Compliance Officer, Invesco Advisers, Inc. (formerly known as Invesco Institutional (N.A.), Inc.) (registered investment adviser), Invesco Capital Markets, Inc. (formerly known as Van Kampen Funds Inc.), Invesco Distributors, Inc., Invesco Investment Services, Inc., Invesco Management Group, Inc., Van Kampen Exchange Corp., The Invesco Funds, and PowerShares Exchange-Traded Fund Trust, PowerShares Exchange-Traded Fund Trust II, PowerShares India Exchange-Traded Fund Trust, PowerShares Actively Managed Exchange-Traded Fund Trust and PowerShares Actively Managed Exchange-Traded Commodity Fund Trust; Anti-Money Laundering Compliance Officer and Bank Secrecy Act Officer, INVESCO National Trust Company and Invesco Trust Company; and Fraud Prevention Manager and Controls and Risk Analysis Manager for Invesco Investment Services, Inc.. | | N/A | | N/A |
Lisa O. Brinkley — 1959 Chief Compliance Officer | | 2015 | | Senior Vice President and Chief Compliance Officer, Invesco Advisers, Inc. (registered investment adviser) (formerly known as Invesco Institutional (N.A., Inc.); and Chief Compliance Officer, The Invesco Funds Formerly: Global Assurance Officer, Invesco Ltd. and Vice President, The Invesco Funds; Chief Compliance Officer, Invesco Distributors, Inc. (formerly known as Invesco Aim Distributors, Inc.), Invesco Investment Services, Inc. (formerly known as Invesco Aim Investment Services, Inc.) and Van Kampen Investor Services Inc.; Senior Vice President, Invesco Management Group, Inc.; Senior Vice President and Chief Compliance Officer, Invesco Advisers, Inc. and The Invesco Funds; Vice President and Chief Compliance Officer, Invesco Aim Capital Management, Inc. and Invesco Distributors, Inc.; Vice President, Invesco Investment Services, Inc. and Fund Management Company. | | N/A | | N/A |
The Statement of Additional Information of the Trust includes additional information about the Fund’s Trustees and is available upon request, without charge, by calling 1.800.959.4246. Please refer to the Fund’s prospectus for information on the Fund’s sub-advisers.
| | | | | | |
Office of the Fund 11 Greenway Plaza, Suite 1000 Houston, TX 77046-1173 | | Investment Adviser Invesco Advisers, Inc. 1555 Peachtree Street, N.E. Atlanta, GA 30309 | | Distributor
Invesco Distributors, Inc. 11 Greenway Plaza, Suite 1000 Houston, TX 77046-1173 | | Auditors PricewaterhouseCoopers LLP 1000 Louisiana Street, Suite 5800 Houston, TX 77002-5678 |
| | | |
| | | | | | |
Counsel to the Fund Stradley Ronon Stevens & Young, LLP 2005 Market Street, Suite 2600 Philadelphia, PA 19103-7018 | | Counsel to the Independent Trustees Goodwin Procter LLP 901 New York Avenue, N.W. Washington, D.C. 20001 | | Transfer Agent Invesco Investment Services, Inc. 11 Greenway Plaza, Suite 1000 Houston, TX 77046-1173 | | Custodian State Street Bank and Trust Company 225 Franklin Street Boston, MA 02110-2801 |
T-4 Invesco Emerging Markets Equity Fund

Invesco mailing information
Send general correspondence to Invesco Investment Services, Inc., P.O. Box 219078, Kansas City, MO 64121-9078.
Important notice regarding delivery of security holder documents
To reduce Fund expenses, only one copy of most shareholder documents may be mailed to shareholders with multiple accounts at the same address (Householding). Mailing of your shareholder documents may be householded indefinitely unless you instruct us otherwise. If you do not want the mailing of these documents to be combined with those for other members of your household, please contact Invesco Investment Services, Inc. at 800 959 4246 or contact your financial institution. We will begin sending you individual copies for each account within 30 days after receiving your request.
Fund holdings and proxy voting information
The Fund provides a complete list of its holdings four times in each fiscal year, at the quarter ends. For the second and fourth quarters, the lists appear in the Fund’s semiannual and annual reports to shareholders. For the first and third quarters, the Fund files the lists with the Securities and Exchange Commission (SEC) on Form N-Q. The most recent list of portfolio holdings is available at invesco.com/completeqtrholdings. Shareholders can also look up the Fund’s Forms N-Q on the SEC website at sec.gov. Copies of the Fund’s Forms N-Q may be reviewed and copied at the SEC Public Reference Room in Washington, D.C. You can obtain information on the operation of the Public Reference Room, including information about duplicating fee charges, by calling 202 551 8090 or 800 732 0330, or by electronic request at the following email address: publicinfo@sec.gov. The SEC file numbers for the Fund are shown below.
A description of the policies and procedures that the Fund uses to determine how to vote proxies relating to portfolio securities is available without charge, upon request, from our Client Services department at 800 959 4246 or at invesco.com/proxyguidelines. The information is also available on the SEC website, sec.gov.
| | |
Information regarding how the Fund voted proxies related to its portfolio securities during the most recent 12-month period ended June 30 is available at invesco.com/proxysearch. The information is also available on the SEC website, sec.gov. Invesco Advisers, Inc. is an investment adviser; it provides investment advisory services to individual and institutional clients and does not sell securities. Invesco Distributors, Inc. is the US distributor for Invesco Ltd.’s retail mutual funds, exchange-traded funds and institutional money market funds. Both are wholly owned, indirect subsidiaries of Invesco Ltd. | |  |
| | | | |
| SEC file numbers: 811-05426 and 033-19338 | | EME-AR-1 | | Invesco Distributors, Inc. |
| | | | |
| | |
 | | Annual Report to Shareholders | | October 31, 2015 |
| | |
| | Invesco Endeavor Fund |
| | Nasdaq: |
| | A: ATDAX n B: ATDBX n C: ATDCX n R: ATDRX n Y: ATDYX n R5: ATDIX n R6: ATDFX |

Letters to Shareholders
| | | | |

Philip Taylor | | | | Dear Shareholders: This annual report includes information about your Fund, including performance data and a complete list of its investments as of the close of the reporting period. Inside is a discussion of how your Fund was managed and the factors that affected its performance during the reporting period. I hope you find this report of interest. The US economy expanded and unemployment declined throughout the reporting period. Continuing low energy prices benefited consumers, but a strong US dollar crimped corporate profits. The US Federal Reserve signaled that it was increasingly likely to raise interest rates, based on generally positive economic data, but uncertainty remained about when it might act. Overseas, the story was much different. Low energy prices hurt the economies of some oil-producing nations, such as Brazil and Russia. During the reporting period, the European Central |
Bank as well as central banks in China and Japan – among other countries – either instituted or maintained extraordinarily accommodative monetary policies in response to economic weakness.
Investor uncertainty, such as we saw for much of the reporting period – and market volatility, such as we saw at the end of the reporting period – are unfortunate facts of life when it comes to investing. Some investors use these things as excuses to delay saving and investing for their long-term financial goals. That’s why Invesco encourages investors to work with a professional financial adviser who can stress the importance of starting to save and invest early and the importance of adhering to a disciplined investment plan – when times are good and when they’re uncertain. A financial adviser who knows your unique financial situation, investment goals and risk tolerance can be an invaluable partner as you seek to achieve your financial goals. He or she can offer a long-term perspective when markets are volatile and time-tested advice and guidance when your financial situation or investment goals change.
Timely information when and where you want it
Invesco’s efforts to help investors achieve their financial objectives include providing individual investors and financial professionals with timely information about the markets, the economy and investing – whenever and wherever they want it.
Our website, invesco.com/us, offers a wide range of market insights and investment perspectives. On the website, you’ll find detailed information about our funds, including prices, performance, holdings and portfolio manager commentaries. You can access information about your account by completing a simple, secure online registration. Click on the “Need to register” link in the “Account Access” box on our homepage to get started.
Invesco’s mobile apps for iPhone® and iPad® (both available free from the App StoreSM) allow you to obtain the same detailed information, monitor your account and create customizable watch lists. Also, they allow you to access investment insights from our investment leaders, market strategists, economists and retirement experts. You can sign up to be alerted when new commentary is added, and you can watch portfolio manager videos and have instant access to Invesco news and updates wherever you may be.
In addition to the resources accessible on our website and through our mobile app, you can obtain timely updates to help you stay informed about the markets, the economy and investing by connecting with Invesco on Twitter, LinkedIn or Facebook. You can access our blog at blog.invesco.us.com. Our goal is to provide you the information you want, when and where you want it.
Have questions?
For questions about your account, feel free to contact an Invesco client services representative at 800 959 4246. For Invesco-related questions or comments, please email me directly at phil@invesco.com.
All of us at Invesco look forward to serving your investment management needs for many years to come. Thank you for investing with us.
Sincerely,

Philip Taylor
Senior Managing Director, Invesco Ltd.
iPhone and iPad are trademarks of Apple Inc., registered in the US and other countries. App Store is a service mark of Apple Inc. Invesco Distributors, Inc. is not affiliated with Apple Inc.
2 Invesco Endeavor Fund
| | | | | | |

Bruce Crockett | | | | Dear Fellow Shareholders: Among the many important lessons I’ve learned in more than 40 years in a variety of business endeavors is the value of a trusted advocate. As independent chair of the Invesco Funds Board, I can assure you that the members of the Board are strong advocates for the interests of investors in Invesco’s mutual funds. We work hard to represent your interests through oversight of the quality of the investment management services your funds receive and other matters important to your investment, including but not limited to: |
| | | | n | | Ensuring that Invesco offers a diverse lineup of mutual funds that your financial adviser can use to strive to meet your financial needs as your investment goals change over time. |
| | | | n | | Monitoring how the portfolio management teams of the Invesco funds are performing in light of changing economic and market conditions. |
| n | | Assessing each portfolio management team’s investment performance within the context of the investment strategy described in the fund’s prospectus. |
| n | | Monitoring for potential conflicts of interests that may impact the nature of the services that your funds receive. |
We believe one of the most important services we provide our fund shareholders is the annual review of the funds’ advisory and sub-advisory contracts with Invesco Advisers and its affiliates. This review is required by the Investment Company Act of 1940 and focuses on the nature and quality of the services Invesco provides as the adviser to the Invesco funds and the reasonableness of the fees that it charges for those services. Each year, we spend months carefully reviewing information received from Invesco and a variety of independent sources, such as performance and fee data prepared by Lipper Inc., an independent, third-party firm widely recognized as a leader in its field. We also meet with our independent legal counsel and other independent advisers to review and help us assess the information that we have received. Our goal is to assure that you receive quality investment management services for a reasonable fee.
I trust the measures outlined above provide assurance that you have a worthy advocate when it comes to choosing the Invesco Funds.
As always, please contact me at bruce@brucecrockett.com with any questions or concerns you may have. On behalf of the Board, we look forward to continuing to represent your interests and serving your needs.
Sincerely,

Bruce L. Crockett
Independent Chair
Invesco Funds Board of Trustees
3 Invesco Endeavor Fund
Management’s Discussion of Fund Performance
| | | | | |
Performance summary For the fiscal year ended October 31, 2015, Class A shares of Invesco Endeavor Fund (the Fund), at net asset value (NAV), underperformed the Fund’s broad market, style-specific and peer group indexes, the S&P 500 Index, the Russell Midcap Index and the Lipper Mid-Cap Core Funds Index, respectively. Your Fund’s long-term performance appears later in this report. |
| | | | | |
Fund vs. Indexes Total returns, 10/31/14 to 10/31/15, at net asset value (NAV). Performance shown does not include applicable contingent deferred sales charges (CDSC) or front-end sales charges, which would have reduced performance. |
| | | | | |
| Class A Shares | | | | -5.80 | % |
| Class B Shares | | | | -6.50 | |
| Class C Shares | | | | -6.49 | |
| Class R Shares | | | | -6.04 | |
| Class Y Shares | | | | -5.61 | |
| Class R5 Shares | | | | -5.46 | |
| Class R6 Shares | | | | -5.36 | |
| S&P 500 Index▼ (Broad Market Index) | | | | 5.20 | |
| Russell Midcap Index▼ (Style-Specific Index) | | | | 2.77 | |
| Lipper Mid-Cap Core Funds Index¢ (Peer Group Index) | | | | 1.19 | |
| |
| Source(s): ▼FactSet Research Systems Inc.; ¢Lipper Inc. | | | | | |
Market conditions and your Fund
The US economy improved slowly, but steadily, during the fiscal year ended October 31, 2015 – although the health of individual economic sectors varied dramatically. The headline story was the continued slowdown in energy markets, as oil prices plummeted when too much supply overwhelmed slowing global demand. However, the more subtle story, which drove the economy forward during the year, was the improved position of the US consumer.
As the reporting period began in late 2014, economic growth appeared to be stronger in the US than in the rest of the world. US equity markets were recovering from the initial crash of oil prices when OPEC added additional uncertainty by deciding to maintain high production despite low prices and slowing global growth. In this environment, commodity-based economies and most currencies underperformed those of the US. The
continued strengthening of the US consumer led US equity markets higher through the spring. Continued low interest rates, the increasing availability of credit from lenders and an improving employment picture all contributed to higher consumer confidence. This strength also helped the market overcome fears that Greece and the eurozone would fail to reach an agreement on a financial bailout plan. In the summer of 2015, however, US equity markets moved sharply lower. A significant downturn in China’s financial markets and weak global economic growth led the US Federal Reserve to delay raising interest rates, which, in turn, increased investor uncertainty and market volatility. In October, however, the US market marched higher and recovered from its earlier decline, finishing higher for the fiscal year.
We view ourselves as business people buying businesses, and we consider the purchase of a stock as an ownership
interest in a business. We strive to develop a proprietary view of a business through in-depth, fundamental research that includes careful financial statement analysis and meetings with company management. We then seek to purchase businesses whose stock prices are below what we have calculated to be the true value of the company based on its future free cash flows.
Our investment approach focuses on individual businesses rather than market sectors. Therefore, your Fund shares little in common with sector weightings of the Fund’s indexes. However, if we were to broadly categorize businesses with which we had the most success during the reporting period, select information technology (IT) and industrials stocks were among the largest contributors to Fund performance. Select holdings in the energy and industrials sectors were among the largest detractors from Fund performance.
IT companies Activision Blizzard and CDW were the largest contributors to Fund performance during the fiscal year. Activision Blizzard is one of the world’s largest third-party game publishers and owns some of the largest and most well-known video game franchises including Call of Duty. The company was added to the S&P 500 Index during the third quarter of 2015 and reported success with some of its new video games, which boosted its share price. We sold some of our position in the company on this strength. CDW is the largest national IT value-added reseller in the US. Shares of the company rose after it reported better-than-expected earnings for the second quarter of 2015. We took some profits by selling part of our position in CDW toward the end of the reporting period.
Industrials sector company DCC was also a large contributor to Fund performance during the fiscal year. DCC is the
| | | | | |
| By sector | | | | % of total net assets | |
| | | | | |
Industrials | | | | 30.7 | % |
| Financials | | | | 17.9 | |
| Information Technology | | | | 13.3 | |
| Health Care | | | | 8.9 | |
| Energy | | | | 8.4 | |
| Consumer Discretionary | | | | 7.8 | |
| Money Market Funds Plus Other Assets Less Liabilities | | | | 13.0 | |
| | |
| Top 10 Equity Holdings* |
| | % of total net assets |
| | | | | | | |
1. | | Brookfield Property Partners L.P. | | | | 5.4 | % |
| 2. | | DCC PLC | | | | 3.9 | |
| 3. | | Encore Capital Group, Inc. | | | | 3.8 | |
| 4. | | Zimmer Biomet Holdings, Inc. | | | | 3.8 | |
| 5. | | Cognizant Technology Solutions Corp.-Class A | | | | 3.5 | |
| 6. | | Ross Stores, Inc. | | | | 3.3 | |
| 7. | | Echo Global Logistics, Inc. | | | | 3.3 | |
| 8. | | Unum Group | | | | 3.2 | |
| 9. | | Oaktree Capital Group LLC | | | | 3.2 | |
| 10. | | Titan Machinery, Inc. | | | | 3.2 | |
| | | | | |
| Total Net Assets | | | | $383.0 million | |
Total Number of Holdings* | | | | 31 | |
The Fund’s holdings are subject to change, and there is no assurance that the Fund will continue to hold any particular security.
*Excluding money market fund holdings.
Data presented here are as of October 31, 2015.
4 Invesco Endeavor Fund
largest distributor of heating oil in the UK. Shares of the company rose on the announcement of the acquisition of a large French gas distributor that further diversifies DCC’s energy distribution business outside the UK; this is expected to be accretive to earnings. DCC has a strong balance sheet and operates in highly fragmented industries, and thus should have the opportunity to continue to make more value-creating acquisitions for the business.
Also in the industrials sector, Orion Marine Group was one of the largest detractors from Fund performance. The company is a leading heavy civil marine contractor that provides a broad range of turnkey marine construction and specialty services along the Gulf Coast, Atlantic Seaboard, West Coast, Canada and Caribbean Basin. Shares of Orion Marine Group fell as a weak demand environment for dredging services and specific project delays hurt performance.
Several of the Fund’s energy sector holdings were among the largest detractors from performance during the fiscal year including Ultra Petroleum and Newalta. Ultra Petroleum is a low-cost US natural gas producer with some exposure to oil assets. The company’s share price declined in sympathy with oil prices. Though Ultra Petroleum focuses mainly on natural gas, there is a link with oil prices because they are substitutable commodities. We still have confidence in the company’s long-term fundamentals because it has over 25 years of reserves from its existing land base, giving it the flexibility to wait out low energy prices for an extended period. We added to the Fund’s position in Ultra Petroleum on price weakness. Newalta is a leading provider of waste management services across Canada, including the recycling and sale of oil products. Shares of the company fell as investors continued to be concerned about Newalta’s operating exposure to the energy sector at a time when energy prices are weakening.
During the fiscal year, we made some new investments and added to some of our existing holdings. We also sold several holdings based on valuations and other factors. The Fund’s large cash position was a result of existing holdings being acquired by other companies not held by the Fund over the past few years and therefore removed or sold from the portfolio as well as a lack of opportunities as markets continued to rise. We believe the cash may act as a shock absorber in the next market correction, while
providing us with the ability to invest in attractive opportunities as they present themselves.
We continued to focus on finding quality businesses trading at attractive values relative to what we believe are their long-term prospects. In contrast, the market is often driven by short-term events or outlooks in both good times and bad. Market volatility during the reporting period allowed us to take advantage of investment opportunities we believe may benefit the Fund in the long term.
While we can never predict future Fund performance, we pledge that we will adhere to our discipline of being business people who buy businesses – and we will continually strive to upgrade the quality of the Fund’s portfolio.
As always, we thank you for your investment in Invesco Endeavor Fund and for sharing our long-term investment perspective.
The views and opinions expressed in management’s discussion of Fund performance are those of Invesco Advisers, Inc. These views and opinions are subject to change at any time based on factors such as market and economic conditions. These views and opinions may not be relied upon as investment advice or recommendations, or as an offer for a particular security. The information is not a complete analysis of every aspect of any market, country, industry, security or the Fund. Statements of fact are from sources considered reliable, but Invesco Advisers, Inc. makes no representation or warranty as to their completeness or accuracy. Although historical performance is no guarantee of future results, these insights may help you understand our investment management philosophy.
See important Fund and, if applicable, index disclosures later in this report.
| | |
 | | Mark Uptigrove Chartered Financial Analyst, Portfolio Manager, is lead manager of Invesco Endeavor Fund. |
| He joined Invesco in 2005. Mr. Uptigrove earned a BA in finance from the University of Western Ontario and an MBA from the Richard Ivey School of Business. |
| | |
 | | Clayton Zacharias Chartered Financial Analyst, Portfolio Manager, is manager of Invesco Endeavor Fund. He joined |
| Invesco in 2002. Mr. Zacharias earned a BBA from Simon Fraser University. |
5 Invesco Endeavor Fund
Your Fund’s Long-Term Performance
Results of a $10,000 Investment – Oldest Share Class(es)
Fund and index data from 10/31/05
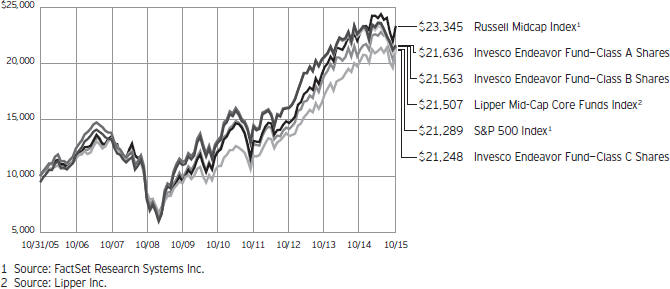
Past performance cannot guarantee comparable future results.
The data shown in the chart include reinvested distributions, applicable sales charges and Fund expenses including management fees. Results for Class B shares are calculated as if a hypothetical
shareholder had liquidated his entire investment in the Fund at the close of the reporting period and paid the contingent deferred sales charges, if applicable. Index results include reinvested dividends, but they do not reflect sales charges. Performance of the peer group,
if applicable, reflects fund expenses and management fees; performance of a market index does not. Performance shown in the chart and table(s) does not reflect deduction of taxes a shareholder would pay on Fund distributions or sale of Fund shares.
6 Invesco Endeavor Fund
| | | | | |
Average Annual Total Returns | | |
| | | | | |
| As of 10/31/15, including maximum applicable sales charges |
| | | | | |
| |
Class A Shares | | | | | |
Inception (11/4/03) | | | | 8.67 | % |
10 Years | | | | 8.02 | |
5 Years | | | | 9.50 | |
1 Year | | | | -10.97 | |
| |
Class B Shares | | | | | |
Inception (11/4/03) | | | | 8.66 | % |
10 Years | | | | 7.99 | |
5 Years | | | | 9.66 | |
1 Year | | | | -10.70 | |
| |
Class C Shares | | | | | |
Inception (11/4/03) | | | | 8.40 | % |
10 Years | | | | 7.83 | |
5 Years | | | | 9.93 | |
1 Year | | | | -7.33 | |
| |
Class R Shares | | | | | |
Inception (4/30/04) | | | | 8.53 | % |
10 Years | | | | 8.38 | |
5 Years | | | | 10.48 | |
1 Year | | | | -6.04 | |
| |
Class Y Shares | | | | | |
10 Years | | | | 8.83 | % |
5 Years | | | | 11.03 | |
1 Year | | | | -5.61 | |
| |
Class R5 Shares | | | | | |
Inception (4/30/04) | | | | 9.31 | % |
10 Years | | | | 9.16 | |
5 Years | | | | 11.20 | |
1 Year | | | | -5.46 | |
| |
Class R6 Shares | | | | | |
10 Years | | | | 8.79 | % |
5 Years | | | | 11.06 | |
1 Year | | | | -5.36 | |
Class Y shares incepted on October 3, 2008. Performance shown prior to that date is that of Class A shares and includes the 12b-1 fees applicable to Class A shares.
Class R6 shares incepted on September 24, 2012. Performance shown prior to that date is that of Class A shares and includes the 12b-1 fees applicable to Class A shares.
The performance data quoted represent past performance and cannot guarantee comparable future results; current performance may be lower or higher. Please visit invesco.com/performance for the most recent month-end performance. Performance figures reflect reinvested distributions, changes in net asset value and the effect of the maximum sales charge unless otherwise stated. Investment
| | | | | |
Average Annual Total Returns | | |
| | | | | |
| As of 9/30/15, the most recent calendar quarter end,including maximum applicable sales charges | | |
| | | | | |
| |
Class A Shares | | | | | |
Inception (11/4/03) | | | | 8.58 | % |
10 Years | | | | 7.69 | |
5 Years | | | | 9.88 | |
1 Year | | | | -11.34 | |
| |
Class B Shares | | | | | |
Inception (11/4/03) | | | | 8.56 | % |
10 Years | | | | 7.66 | |
5 Years | | | | 10.02 | |
1 Year | | | | -11.07 | |
| |
Class C Shares | | | | | |
Inception (11/4/03) | | | | 8.31 | % |
10 Years | | | | 7.50 | |
5 Years | | | | 10.30 | |
1 Year | | | | -7.72 | |
| |
Class R Shares | | | | | |
Inception (4/30/04) | | | | 8.44 | % |
10 Years | | | | 8.05 | |
5 Years | | | | 10.85 | |
1 Year | | | | -6.41 | |
| |
Class Y Shares | | | | | |
10 Years | | | | 8.50 | % |
5 Years | | | | 11.41 | |
1 Year | | | | -5.92 | |
| |
Class R5 Shares | | | | | |
Inception (4/30/04) | | | | 9.21 | % |
10 Years | | | | 8.83 | |
5 Years | | | | 11.58 | |
1 Year | | | | -5.86 | |
| |
Class R6 Shares | | | | | |
10 Years | | | | 8.45 | % |
5 Years | | | | 11.43 | |
1 Year | | | | -5.75 | |
return and principal value will fluctuate so that you may have a gain or loss when you sell shares.
The net annual Fund operating expense ratio set forth in the most recent Fund prospectus as of the date of this report for Class A, Class B, Class C, Class R, Class Y, Class R5 and Class R6 shares was 1.30%, 2.05%, 2.05%, 1.55%, 1.05%, 0.94% and 0.85%, respectively.1 The total annual Fund operating expense ratio set forth in the most recent Fund prospectus as of the date of this report for Class A, Class B, Class C, Class R, Class Y, Class R5 and Class R6 shares was 1.33%, 2.08%, 2.08%, 1.58%, 1.08%, 0.97% and 0.88%, respectively. The expense ratios presented above may vary from the expense ratios presented in other sections of this report that are
based on expenses incurred during the period covered by this report.
Class A share performance reflects the maximum 5.50% sales charge, and Class B and Class C share performance reflects the applicable contingent deferred sales charge (CDSC) for the period involved. The CDSC on Class B shares declines from 5% beginning at the time of purchase to 0% at the beginning of the seventh year. The CDSC on Class C shares is 1% for the first year after purchase. Class R, Class Y, Class R5 and Class R6 shares do not have a front-end sales charge or a CDSC; therefore, performance is at net asset value.
The performance of the Fund’s share classes will differ primarily due to different sales charge structures and class expenses.
Fund performance reflects any applicable fee waivers and/or expense reimbursements. Had the adviser not waived fees and/or reimbursed expenses currently or in the past, returns would have been lower. See current prospectus for more information.
| 1 | Total annual Fund operating expenses after any contractual fee waivers and/or expense reimbursements by the adviser in effect through at least June 30, 2017. See current prospectus for more information. |
7 Invesco Endeavor Fund
Invesco Endeavor Fund’s investment objective is long-term growth of capital.
| n | | Unless otherwise stated, information presented in this report is as of October 31, 2015, and is based on total net assets. |
| n | | Unless otherwise noted, all data provided by Invesco. |
| n | | To access your Fund’s reports/prospectus, visit invesco.com/fundreports. |
About share classes
| n | | Class B shares may not be purchased for new or additional investments. Please see the prospectus for more information. |
| n | | Class R shares are generally available only to employer sponsored retirement and benefit plans. Please see the prospectus for more information. |
| n | | Class Y shares are available only to certain investors. Please see the prospectus for more information. |
| n | | Class R5 shares and Class R6 shares are primarily intended for employer sponsored retirement and benefit plans that meet certain standards and for institutional investors. Please see the prospectus for more information. |
Principal risks of investing in the Fund
| n | | Cash/cash equivalents risk. Holding cash or cash equivalents may negatively affect performance. |
| n | | Debt securities risk. The Fund may invest in debt securities that are affected by changing interest rates and changes in their effective maturities and credit quality. |
| n | | Foreign securities risk. The Fund’s foreign investments may be affected by changes in a foreign country’s exchange rates, political and social instability, changes in economic or taxation policies, difficulties when enforcing obligations, decreased liquidity, and increased volatility. Foreign companies may be subject to less regulation resulting in less publicly available information about the companies. |
| n | | Management risk. The investment techniques and risk analysis used by the Fund’s portfolio managers may not produce the desired results. |
| n | | Market risk. The prices of and the income generated by the Fund’s securities may decline in response to, among other things, investor sentiment, general economic and market conditions, regional or global instability, and currency and interest rate fluctuations. |
| n | | Small- and mid-capitalization risks. Stocks of small- and mid-sized companies tend to be more vulnerable to adverse developments and may have little or no operating history or track record of success, and limited product lines, markets, management and financial resources. The securities of small- and mid-sized companies may be more volatile due to less market interest and less publicly available information about the issuer. They also may be illiquid or restricted as to resale, or may trade less frequently and in smaller volumes, all of which may cause difficulty when establishing or closing a position at a desirable price. |
| n | | US government obligations risk. The Fund may invest in obligations issued by US government agencies and instrumentalities that may receive varying levels of support from the government, which could affect the Fund’s ability to recover should they default. |
| n | | Value investing style risk. The Fund emphasizes a value style of investing, which focuses on undervalued companies with characteristics for improved valuations. This style of investing is subject to the risk that the valuations never improve or that the returns on value equity securities are less than returns on other styles of investing or the overall stock market. Value stocks also may decline in price, even though in theory they are already underpriced. |
About indexes used in this report
| n | | The S&P 500® Index is an unmanaged index considered representative of the US stock market. |
| n | | The Russell Midcap® Index is an unmanaged index considered representative of mid-cap stocks. The Russell Midcap Index is a trademark/service mark of the Frank Russell Co. Russell® is a trademark of the Frank Russell Co. |
| n | | The Lipper Mid-Cap Core Funds Index is an unmanaged index considered representative of mid-cap core funds tracked by Lipper. |
| n | | The Fund is not managed to track the performance of any particular index, including the index(es) described here, and consequently, the performance of the Fund may deviate significantly from the performance of the index(es). |
| n | | A direct investment cannot be made in an index. Unless otherwise indicated, index results include reinvested dividends, and they do not reflect sales charges. Performance of the peer group, if applicable, reflects fund expenses; performance of a market index does not. |
Other information
| n | | The returns shown in management’s discussion of Fund performance are based on net asset values (NAVs) calculated for shareholder transactions. Generally accepted accounting principles require adjustments to be made to the net assets of the Fund at period end for financial reporting purposes, and as such, the NAVs for shareholder transactions and the returns based on those NAVs may differ from the NAVs and returns reported in the Financial Highlights. |
| n | | Industry classifications used in this report are generally according to the Global Industry Classification Standard, which was developed by and is the exclusive property and a service mark of MSCI Inc. and Standard & Poor’s. |
|
| This report must be accompanied or preceded by a currently effective Fund prospectus, which contains more complete information, including sales charges and expenses. Investors should read it carefully before investing. |
NOT FDIC INSURED | MAY LOSE VALUE | NO BANK GUARANTEE
8 Invesco Endeavor Fund
Schedule of Investments(a)
October 31, 2015
| | | | | | | | |
| | | Shares | | | Value | |
Common Stocks & Other Equity Interests–87.04% | |
| Aerospace & Defense–2.71% | | | | | | | | |
Precision Castparts Corp. | | | 45,000 | | | $ | 10,386,450 | |
|
| Agricultural & Farm Machinery–2.48% | |
Deere & Co. | | | 121,955 | | | | 9,512,490 | |
|
| Air Freight & Logistics–3.25% | |
Echo Global Logistics, Inc.(b) | | | 523,511 | | | | 12,454,327 | |
|
| Airlines–2.96% | |
Ryanair Holdings PLC–ADR (Ireland) | | | 145,080 | | | | 11,343,805 | |
|
| Apparel Retail–5.54% | |
Francesca’s Holdings Corp.(b) | | | 601,006 | | | | 8,540,295 | |
Ross Stores, Inc. | | | 250,515 | | | | 12,671,049 | |
| | | | | | | | 21,211,344 | |
|
| Asset Management & Custody Banks–3.21% | |
Oaktree Capital Group LLC | | | 246,549 | | | | 12,292,933 | |
|
| Communications Equipment–3.12% | |
Plantronics, Inc. | | | 223,115 | | | | 11,963,426 | |
|
| Construction & Engineering–5.06% | |
Orion Marine Group, Inc.(b)(c) | | | 2,813,162 | | | | 10,999,464 | |
Quanta Services, Inc.(b) | | | 416,722 | | | | 8,380,279 | |
| | | | | | | | 19,379,743 | |
|
| Consumer Finance–3.84% | |
Encore Capital Group, Inc.(b) | | | 361,613 | | | | 14,717,649 | |
|
| Education Services–2.30% | |
Capella Education Co. | | | 195,491 | | | | 8,826,419 | |
|
| Health Care Distributors–1.93% | |
Patterson Cos. Inc. | | | 155,922 | | | | 7,390,703 | |
|
| Health Care Equipment–3.80% | |
Zimmer Biomet Holdings, Inc. | | | 139,130 | | | | 14,548,824 | |
|
| Home Entertainment Software–1.90% | |
Activision Blizzard, Inc. | | | 209,842 | | | | 7,294,108 | |
|
| Industrial Conglomerates–3.91% | |
DCC PLC (United Kingdom) | | | 186,624 | | | | 14,958,298 | |
|
| Integrated Oil & Gas–3.04% | |
Cenovus Energy Inc. (Canada) | | | 781,807 | | | | 11,646,097 | |
|
| IT Consulting & Other Services–3.46% | |
Cognizant Technology Solutions Corp.–
Class A(b) | | | 194,619 | | | | 13,255,500 | |
| | | | | | | | |
| | | Shares | | | Value | |
| Life & Health Insurance–3.23% | |
Unum Group | | | 357,374 | | | $ | 12,383,009 | |
|
| Managed Health Care–3.17% | |
UnitedHealth Group Inc. | | | 102,992 | | | | 12,130,398 | |
|
| Multi-Line Insurance–2.16% | |
Vienna Insurance Group AG Wiener Versicherung Gruppe (Austria) | | | 258,042 | | | | 8,263,347 | |
|
| Oil & Gas Drilling–0.93% | |
Patterson-UTI Energy, Inc. | | | 239,118 | | | | 3,560,467 | |
|
| Oil & Gas Equipment & Services–1.93% | |
Newalta Corp. (Canada) | | | 1,294,156 | | | | 7,382,736 | |
|
| Oil & Gas Exploration & Production–4.44% | |
Devon Energy Corp. | | | 189,984 | | | | 7,966,029 | |
Ultra Petroleum Corp.(b) | | | 1,653,175 | | | | 9,059,399 | |
| | | | | | | | 17,025,428 | |
|
| Real Estate Operating Companies–5.43% | |
Brookfield Property Partners L.P. | | | 883,377 | | | | 20,794,695 | |
|
| Research & Consulting Services–2.66% | |
FTI Consulting, Inc.(b) | | | 299,260 | | | | 10,177,833 | |
|
| Semiconductor Equipment–2.14% | |
Ultratech, Inc.(b) | | | 523,867 | | | | 8,188,041 | |
|
| Technology Distributors–2.66% | |
CDW Corp. | | | 228,099 | | | | 10,193,744 | |
|
| Trading Companies & Distributors–5.78% | |
Grafton Group PLC (United Kingdom)(d) | | | 954,395 | | | | 9,898,616 | |
Titan Machinery, Inc.(b) | | | 999,522 | | | | 12,224,154 | |
| | | | | | | | 22,122,770 | |
Total Common Stocks & Other Equity Interests
(Cost $314,666,224) | | | | 333,404,584 | |
|
Money Market Funds–12.43% | |
Liquid Assets Portfolio–Institutional Class, 0.16%(e) | | | 23,804,953 | | | | 23,804,953 | |
Premier Portfolio–Institutional Class, 0.12%(e) | | | 23,804,954 | | | | 23,804,954 | |
Total Money Market Funds
(Cost $47,609,907) | | | | 47,609,907 | |
TOTAL INVESTMENTS–99.47%
(Cost $362,276,131) | | | | 381,014,491 | |
OTHER ASSETS LESS LIABILITIES–0.53% | | | | 2,024,117 | |
NET ASSETS–100.00% | | | $ | 383,038,608 | |
Investment Abbreviations:
| | |
| ADR | | – American Depositary Receipt |
Notes to Schedule of Investments:
| (a) | Industry and/or sector classifications used in this report are generally according to the Global Industry Classification Standard, which was developed by and is the exclusive property and a service mark of MSCI Inc. and Standard & Poor’s. |
| (b) | Non-income producing security. |
| (c) | Affiliated company during the period. The Investment Company Act of 1940 defines an “affiliated person” as an issuance in which a fund holds 5% or more of the outstanding voting securities. The Fund has not owned enough of the outstanding voting securities of the issuer to have control (as defined in the Investment Company Act of 1940) of that issuer. The value of this security as of October 31, 2015 represented 2.87% of the Fund’s Net Assets. See Note 4. |
| (d) | Each unit represents one ordinary share, seventeen Class A shares and one Class C share. |
| (e) | The money market fund and the Fund are affiliated by having the same investment adviser. The rate shown is the 7-day SEC standardized yield as of October 31, 2015. |
See accompanying Notes to Financial Statements which are an integral part of the financial statements.
9 Invesco Endeavor Fund
Statement of Assets and Liabilities
October 31, 2015
| | | | |
Assets: | | | | |
Investments, at value (Cost $290,988,261) | | $ | 322,405,120 | |
Investments in affiliates, at value (Cost $71,287,870) | | | 58,609,371 | |
Total investments, at value (Cost $362,276,131) | | | 381,014,491 | |
Foreign currencies, at value (Cost $184) | | | 182 | |
Receivable for: | | | | |
Investments sold | | | 3,918,158 | |
Fund shares sold | | | 220,186 | |
Dividends | | | 522,200 | |
Investment for trustee deferred compensation and retirement plans | | | 61,912 | |
Other assets | | | 40,092 | |
Total assets | | | 385,777,221 | |
| |
Liabilities: | | | | |
Payable for: | | | | |
Investments purchased | | | 1,161,398 | |
Fund shares reacquired | | | 1,225,362 | |
Accrued fees to affiliates | | | 228,865 | |
Accrued trustees’ and officers’ fees and benefits | | | 1,949 | |
Accrued other operating expenses | | | 51,415 | |
Trustee deferred compensation and retirement plans | | | 69,624 | |
Total liabilities | | | 2,738,613 | |
Net assets applicable to shares outstanding | | $ | 383,038,608 | |
|
Net assets consist of: | |
Shares of beneficial interest | | $ | 320,288,570 | |
Undistributed net investment income | | | 12,384 | |
Undistributed net realized gain | | | 44,018,755 | |
Net unrealized appreciation | | | 18,718,899 | |
| | | $ | 383,038,608 | |
| | | | |
Net Assets: | |
Class A | | $ | 147,503,937 | |
Class B | | $ | 2,160,723 | |
Class C | | $ | 42,965,440 | |
Class R | | $ | 24,854,784 | |
Class Y | | $ | 40,425,233 | |
Class R5 | | $ | 33,853,625 | |
Class R6 | | $ | 91,274,866 | |
|
Shares outstanding, $0.01 par value per share,
with an unlimited number of shares authorized: | |
Class A | | | 7,643,978 | |
Class B | | | 123,358 | |
Class C | | | 2,451,306 | |
Class R | | | 1,323,140 | |
Class Y | | | 2,055,759 | |
Class R5 | | | 1,685,991 | |
Class R6 | | | 4,534,593 | |
Class A: | | | | |
Net asset value per share | | $ | 19.30 | |
Maximum offering price per share | | | | |
(Net asset value of $19.30 ¸ 94.50%) | | $ | 20.42 | |
Class B: | | | | |
Net asset value and offering price per share | | $ | 17.52 | |
Class C: | | | | |
Net asset value and offering price per share | | $ | 17.53 | |
Class R: | | | | |
Net asset value and offering price per share | | $ | 18.78 | |
Class Y: | | | | |
Net asset value and offering price per share | | $ | 19.66 | |
Class R5: | | | | |
Net asset value and offering price per share | | $ | 20.08 | |
Class R6: | | | | |
Net asset value and offering price per share | | $ | 20.13 | |
See accompanying Notes to Financial Statements which are an integral part of the financial statements.
10 Invesco Endeavor Fund
Statement of Operations
For the year ended October 31, 2015
| | | | |
Investment income: | |
Dividends (net of foreign withholding taxes of $223,952) | | $ | 5,605,824 | |
Dividends from affiliates | | | 60,862 | |
Total investment income | | | 5,666,686 | |
| |
Expenses: | | | | |
Advisory fees | | | 3,441,032 | |
Administrative services fees | | | 137,235 | |
Custodian fees | | | 25,670 | |
Distribution fees: | | | | |
Class A | | | 442,283 | |
Class B | | | 36,956 | |
Class C | | | 504,768 | |
Class R | | | 155,309 | |
Transfer agent fees — A, B, C, R and Y | | | 703,860 | |
Transfer agent fees — R5 | | | 42,411 | |
Transfer agent fees — R6 | | | 5,965 | |
Trustees’ and officers’ fees and benefits | | | 25,834 | |
Other | | | 204,053 | |
Total expenses | | | 5,725,376 | |
Less: Fees waived and expense offset arrangement(s) | | | (137,880 | ) |
Net expenses | | | 5,587,496 | |
Net investment income | | | 79,190 | |
| |
Realized and unrealized gain (loss) from: | | | | |
Net realized gain (loss) from: | | | | |
Investment securities | | | 44,384,483 | |
Foreign currencies | | | (64,070 | ) |
| | | | 44,320,413 | |
Change in net unrealized appreciation (depreciation) of: | | | | |
Investment securities | | | (68,626,707 | ) |
Foreign currencies | | | (12,988 | ) |
| | | | (68,639,695 | ) |
Net realized and unrealized gain (loss) | | | (24,319,282 | ) |
Net increase (decrease) in net assets resulting from operations | | $ | (24,240,092 | ) |
See accompanying Notes to Financial Statements which are an integral part of the financial statements.
11 Invesco Endeavor Fund
Statement of Changes in Net Assets
For the years ended October 31, 2015 and 2014
| | | | | | | | |
| | | 2015 | | | 2014 | |
Operations: | | | | | |
Net investment income (loss) | | $ | 79,190 | | | $ | (1,867,193 | ) |
Net realized gain | | | 44,320,413 | | | | 48,486,410 | |
Change in net unrealized appreciation (depreciation) | | | (68,639,695 | ) | | | 5,744,705 | |
Net increase (decrease) in net assets resulting from operations | | | (24,240,092 | ) | | | 52,363,922 | |
| | |
Distributions to shareholders from net investment income: | | | | | | | | |
Class A | | | — | | | | (102,781 | ) |
Class Y | | | — | | | | (236,467 | ) |
Class R5 | | | — | | | | (102,797 | ) |
Class R6 | | | — | | | | (360,531 | ) |
Total distributions from net investment income | | | — | | | | (802,576 | ) |
| | |
Distributions to shareholders from net realized gains: | | | | | | | | |
Class A | | | (16,971,372 | ) | | | (7,305,132 | ) |
Class B | | | (453,713 | ) | | | (250,992 | ) |
Class C | | | (5,169,171 | ) | | | (2,092,673 | ) |
Class R | | | (3,063,577 | ) | | | (1,486,839 | ) |
Class Y | | | (6,396,326 | ) | | | (3,765,978 | ) |
Class R5 | | | (4,210,075 | ) | | | (1,275,689 | ) |
Class R6 | | | (8,572,104 | ) | | | (3,726,638 | ) |
Total distributions from net realized gains | | | (44,836,338 | ) | | | (19,903,941 | ) |
| | |
Share transactions–net: | | | | | | | | |
Class A | | | (18,245,220 | ) | | | (772,225 | ) |
Class B | | | (2,074,219 | ) | | | (1,354,164 | ) |
Class C | | | (2,285,842 | ) | | | 1,283,102 | |
Class R | | | (5,006,283 | ) | | | (2,178,156 | ) |
Class Y | | | (22,528,058 | ) | | | (24,722,768 | ) |
Class R5 | | | (9,336,329 | ) | | | 15,279,456 | |
Class R6 | | | 4,570,049 | | | | 3,074,206 | |
Net increase (decrease) in net assets resulting from share transactions | | | (54,905,902 | ) | | | (9,390,549 | ) |
Net increase (decrease) in net assets | | | (123,982,332 | ) | | | 22,266,856 | |
| | |
Net assets: | | | | | | | | |
Beginning of year | | | 507,020,940 | | | | 484,754,084 | |
End of year (includes undistributed net investment income (loss) of $12,384 and $(25,096), respectively) | | $ | 383,038,608 | | | $ | 507,020,940 | |
Notes to Financial Statements
October 31, 2015
NOTE 1—Significant Accounting Policies
Invesco Endeavor Fund (the “Fund”) is a series portfolio of AIM Investment Funds (Invesco Investment Funds) (the “Trust”). The Trust is organized as a Delaware statutory trust and is registered under the Investment Company Act of 1940, as amended (the “1940 Act”), as an open-end series management investment company consisting of twenty-four separate series portfolios, each authorized to issue an unlimited number of shares of beneficial interest. The assets, liabilities and operations of each portfolio are accounted for separately. Information presented in these financial statements pertains only to the Fund. Matters affecting each portfolio or class will be voted on exclusively by the shareholders of such portfolio or class.
The Fund’s investment objective is long-term growth of capital.
The Fund currently consists of seven different classes of shares: Class A, Class B, Class C, Class R, Class Y, Class R5 and Class R6. Class A shares are sold with a front-end sales charge unless certain waiver criteria are met and under certain circumstances load waived shares may be subject to contingent deferred sales charges (“CDSC”). Class C shares are sold with a CDSC. Class R, Class Y, Class R5 and Class R6 shares are sold at net asset value. Effective November 30, 2010, new or additional investments in Class B shares are no longer permitted. Existing shareholders of Class B shares may continue to reinvest dividends and capital gains distributions in Class B shares until they convert to Class A shares. Also, shareholders in Class B
12 Invesco Endeavor Fund
shares will be able to exchange those shares for Class B shares of other Invesco Funds offering such shares until they convert to Class A shares. Generally, Class B shares will automatically convert to Class A shares on or about the month-end, which is at least eight years after the date of purchase. Redemption of Class B shares prior to the conversion date will be subject to a CDSC.
The following is a summary of the significant accounting policies followed by the Fund in the preparation of its financial statements.
| A. | Security Valuations — Securities, including restricted securities, are valued according to the following policy. |
A security listed or traded on an exchange (except convertible securities) is valued at its last sales price or official closing price as of the close of the customary trading session on the exchange where the security is principally traded, or lacking any sales or official closing price on a particular day, the security may be valued at the closing bid price on that day. Securities traded in the over-the-counter market are valued based on prices furnished by independent pricing services or market makers. When such securities are valued by an independent pricing service they may be considered fair valued. Futures contracts are valued at the final settlement price set by an exchange on which they are principally traded. Listed options are valued at the mean between the last bid and asked prices from the exchange on which they are principally traded. Options not listed on an exchange are valued by an independent source at the mean between the last bid and asked prices. For purposes of determining net asset value (“NAV”) per share, futures and option contracts generally are valued 15 minutes after the close of the customary trading session of the New York Stock Exchange (“NYSE”).
Investments in open-end and closed-end registered investment companies that do not trade on an exchange are valued at the end-of-day net asset value per share. Investments in open-end and closed-end registered investment companies that trade on an exchange are valued at the last sales price or official closing price as of the close of the customary trading session on the exchange where the security is principally traded.
Debt obligations (including convertible securities) and unlisted equities are fair valued using an evaluated quote provided by an independent pricing service. Evaluated quotes provided by the pricing service may be determined without exclusive reliance on quoted prices, and may reflect appropriate factors such as institution-size trading in similar groups of securities, developments related to specific securities, dividend rate (for unlisted equities), yield (for debt obligations), quality, type of issue, coupon rate (for debt obligations), maturity (for debt obligations), individual trading characteristics and other market data. Debt obligations are subject to interest rate and credit risks. In addition, all debt obligations involve some risk of default with respect to interest and/or principal payments.
Foreign securities’ (including foreign exchange contracts) prices are converted into U.S. dollar amounts using the applicable exchange rates as of the close of the NYSE. If market quotations are available and reliable for foreign exchange-traded equity securities, the securities will be valued at the market quotations. Because trading hours for certain foreign securities end before the close of the NYSE, closing market quotations may become unreliable. If between the time trading ends on a particular security and the close of the customary trading session on the NYSE, events occur that the Adviser determines are significant and make the closing price unreliable, the Fund may fair value the security. If the event is likely to have affected the closing price of the security, the security will be valued at fair value in good faith using procedures approved by the Board of Trustees. Adjustments to closing prices to reflect fair value may also be based on a screening process of an independent pricing service to indicate the degree of certainty, based on historical data, that the closing price in the principal market where a foreign security trades is not the current value as of the close of the NYSE. Foreign securities’ prices meeting the approved degree of certainty that the price is not reflective of current value will be priced at the indication of fair value from the independent pricing service. Multiple factors may be considered by the independent pricing service in determining adjustments to reflect fair value and may include information relating to sector indices, American Depositary Receipts and domestic and foreign index futures. Foreign securities may have additional risks including exchange rate changes, potential for sharply devalued currencies and high inflation, political and economic upheaval, the relative lack of issuer information, relatively low market liquidity and the potential lack of strict financial and accounting controls and standards.
Securities for which market prices are not provided by any of the above methods may be valued based upon quotes furnished by independent sources. The last bid price may be used to value equity securities. The mean between the last bid and asked prices is used to value debt obligations, including corporate loans.
Securities for which market quotations are not readily available or became unreliable are valued at fair value as determined in good faith by or under the supervision of the Trust’s officers following procedures approved by the Board of Trustees. Issuer specific events, market trends, bid/asked quotes of brokers and information providers and other market data may be reviewed in the course of making a good faith determination of a security’s fair value.
The Fund may invest in securities that are subject to interest rate risk, meaning the risk that the prices will generally fall as interest rates rise and, conversely, the prices will generally rise as interest rates fall. Specific securities differ in their sensitivity to changes in interest rates depending on their individual characteristics. Changes in interest rates may result in increased market volatility, which may affect the value and/or liquidity of certain Fund investments.
Valuations change in response to many factors including the historical and prospective earnings of the issuer, the value of the issuer’s assets, general economic conditions, interest rates, investor perceptions and market liquidity. Because of the inherent uncertainties of valuation, the values reflected in the financial statements may materially differ from the value received upon actual sale of those investments.
| B. | Securities Transactions and Investment Income — Securities transactions are accounted for on a trade date basis. Realized gains or losses on sales are computed on the basis of specific identification of the securities sold. Interest income (net of withholding tax, if any) is recorded on the accrual basis from settlement date. Dividend income (net of withholding tax, if any) is recorded on the ex-dividend date. |
The Fund may periodically participate in litigation related to Fund investments. As such, the Fund may receive proceeds from litigation settlements. Any proceeds received are included in the Statement of Operations as realized gain (loss) for investments no longer held and as unrealized gain (loss) for investments still held.
Brokerage commissions and mark ups are considered transaction costs and are recorded as an increase to the cost basis of securities purchased and/or a reduction of proceeds on a sale of securities. Such transaction costs are included in the determination of net realized and unrealized gain (loss) from investment securities reported in the Statement of Operations and the Statement of Changes in Net Assets and the net realized and unrealized gains (losses) on securities per share in the Financial Highlights. Transaction costs are included in the calculation of the Fund’s net asset value and, accordingly, they reduce the Fund’s total returns. These transaction costs are not considered operating expenses and are not reflected in net investment income reported in the Statement of Operations and the Statement of Changes in Net Assets, or the net
13 Invesco Endeavor Fund
investment income per share and the ratios of expenses and net investment income reported in the Financial Highlights, nor are they limited by any expense limitation arrangements between the Fund and the investment adviser.
The Fund allocates income and realized and unrealized capital gains and losses to a class based on the relative net assets of each class.
| C. | Country Determination — For the purposes of making investment selection decisions and presentation in the Schedule of Investments, the investment adviser may determine the country in which an issuer is located and/or credit risk exposure based on various factors. These factors include the laws of the country under which the issuer is organized, where the issuer maintains a principal office, the country in which the issuer derives 50% or more of its total revenues and the country that has the primary market for the issuer’s securities, as well as other criteria. Among the other criteria that may be evaluated for making this determination are the country in which the issuer maintains 50% or more of its assets, the type of security, financial guarantees and enhancements, the nature of the collateral and the sponsor organization. Country of issuer and/or credit risk exposure has been determined to be the United States of America, unless otherwise noted. |
| D. | Distributions — Distributions from net investment income and net realized capital gain, if any, are generally declared and paid annually and recorded on the ex-dividend date. The Fund may elect to treat a portion of the proceeds from redemptions as distributions for federal income tax purposes. |
| E. | Federal Income Taxes — The Fund intends to comply with the requirements of Subchapter M of the Internal Revenue Code of 1986, as amended (the “Internal Revenue Code”), necessary to qualify as a regulated investment company and to distribute substantially all of the Fund’s taxable earnings to shareholders. As such, the Fund will not be subject to federal income taxes on otherwise taxable income (including net realized capital gain) that is distributed to shareholders. Therefore, no provision for federal income taxes is recorded in the financial statements. |
The Fund recognizes the tax benefits of uncertain tax positions only when the position is more likely than not to be sustained. Management has analyzed the Fund’s uncertain tax positions and concluded that no liability for unrecognized tax benefits should be recorded related to uncertain tax positions. Management is not aware of any tax positions for which it is reasonably possible that the total amounts of unrecognized tax benefits will change materially in the next 12 months.
The Fund files tax returns in the U.S. Federal jurisdiction and certain other jurisdictions. Generally, the Fund is subject to examinations by such taxing authorities for up to three years after the filing of the return for the tax period.
| F. | Expenses — Fees provided for under the Rule 12b-1 plan of a particular class of the Fund are charged to the operations of such class. Transfer agency fees and expenses and other shareholder recordkeeping fees and expenses attributable to Class R5 and Class R6 are allocated to each share class based on relative net assets. Sub-accounting fees attributable to Class R5 are charged to the operations of the class. Transfer agency fees and expenses and other shareholder recordkeeping fees and expenses relating to all other classes are allocated among those classes based on relative net assets. All other expenses are allocated among the classes based on relative net assets. |
| G. | Accounting Estimates — The preparation of financial statements in conformity with accounting principles generally accepted in the United States of America (“GAAP”) requires management to make estimates and assumptions that affect the reported amounts of assets and liabilities at the date of the financial statements and the reported amounts of revenues and expenses during the reporting period including estimates and assumptions related to taxation. Actual results could differ from those estimates by a significant amount. In addition, the Fund monitors for material events or transactions that may occur or become known after the period-end date and before the date the financial statements are released to print. |
| H. | Indemnifications — Under the Trust’s organizational documents, each Trustee, officer, employee or other agent of the Trust is indemnified against certain liabilities that may arise out of the performance of their duties to the Fund. Additionally, in the normal course of business, the Fund enters into contracts, including the Fund’s servicing agreements, that contain a variety of indemnification clauses. The Fund’s maximum exposure under these arrangements is unknown as this would involve future claims that may be made against the Fund that have not yet occurred. The risk of material loss as a result of such indemnification claims is considered remote. |
| I. | Foreign Currency Translations — Foreign currency is valued at the close of the NYSE based on quotations posted by banks and major currency dealers. Portfolio securities and other assets and liabilities denominated in foreign currencies are translated into U.S. dollar amounts at date of valuation. Purchases and sales of portfolio securities (net of foreign taxes withheld on disposition) and income items denominated in foreign currencies are translated into U.S. dollar amounts on the respective dates of such transactions. The Fund does not separately account for the portion of the results of operations resulting from changes in foreign exchange rates on investments and the fluctuations arising from changes in market prices of securities held. The combined results of changes in foreign exchange rates and the fluctuation of market prices on investments (net of estimated foreign tax withholding) are included with the net realized and unrealized gain or loss from investments in the Statement of Operations. Reported net realized foreign currency gains or losses arise from (1) sales of foreign currencies, (2) currency gains or losses realized between the trade and settlement dates on securities transactions, and (3) the difference between the amounts of dividends, interest, and foreign withholding taxes recorded on the Fund’s books and the U.S. dollar equivalent of the amounts actually received or paid. Net unrealized foreign currency gains and losses arise from changes in the fair values of assets and liabilities, other than investments in securities at fiscal period end, resulting from changes in exchange rates. |
The Fund may invest in foreign securities, which may be subject to foreign taxes on income, gains on investments or currency repatriation, a portion of which may be recoverable. Foreign taxes, if any, are recorded based on the tax regulations and rates that exist in the foreign markets in which the Fund invests and are shown in the Statement of Operations.
| J. | Forward Foreign Currency Contracts — The Fund may engage in foreign currency transactions either on a spot (i.e. for prompt delivery and settlement) basis, or through forward foreign currency contracts, to manage or minimize currency or exchange rate risk. |
The Fund may also enter into forward foreign currency contracts for the purchase or sale of a security denominated in a foreign currency in order to “lock in” the U.S. dollar price of that security, or the Fund may also enter into forward foreign currency contracts that do not provide for physical settlement of the two currencies, but instead are settled by a single cash payment calculated as the difference between the agreed upon exchange rate and the spot rate at settlement based upon an agreed upon notional amount (non-deliverable forwards). The Fund will set aside liquid assets in an amount equal to daily mark-to-market obligation for forward foreign currency contracts.
A forward foreign currency contract is an obligation between two parties (“Counterparties”) to purchase or sell a specific currency for an agreed-upon price at a future date. The use of forward foreign currency contracts does not eliminate fluctuations in the price of the underlying securities the Fund owns or intends to acquire but establishes a rate of exchange in advance. Fluctuations in the value of these contracts are
14 Invesco Endeavor Fund
measured by the difference in the contract date and reporting date exchange rates and are recorded as unrealized appreciation (depreciation) until the contracts are closed. When the contracts are closed, realized gains (losses) are recorded. Realized and unrealized gains (losses) on the contracts are included in the Statement of Operations. The primary risks associated with forward foreign currency contracts include failure of the Counterparty to meet the terms of the contract and the value of the foreign currency changing unfavorably. These risks may be in excess of the amounts reflected in the Statement of Assets and Liabilities.
NOTE 2—Advisory Fees and Other Fees Paid to Affiliates
The Trust has entered into a master investment advisory agreement with Invesco Advisers, Inc. (the “Adviser” or “Invesco”). Under the terms of the investment advisory agreement, the Fund pays an advisory fee to the Adviser based on the annual rate of the Fund’s average daily net assets as follows:
| | | | | | |
| Average Daily Net Assets | | Rate |
First $250 million | | | 0 | .745% | | |
Next $250 million | | | 0 | .73% | | |
Next $500 million | | | 0 | .715% | | |
Next $1.5 billion | | | 0 | .70% | | |
Next $2.5 billion | | | 0 | .685% | | |
Next $2.5 billion | | | 0 | .67% | | |
Next $2.5 billion | | | 0 | .655% | | |
Over $10 billion | | | 0 | .64% | | |
For the year ended October 31, 2015, the effective advisory fees incurred by the Fund was 0.74%.
Under the terms of a master sub-advisory agreement between the Adviser and each of Invesco Asset Management Deutschland GmbH, Invesco Asset Management Limited, Invesco Asset Management (Japan) Limited, Invesco Hong Kong Limited, Invesco Senior Secured Management, Inc. and Invesco Canada Ltd. (collectively, the “Affiliated Sub-Advisers”) the Adviser, not the Fund, may pay 40% of the fees paid to the Adviser to any such Affiliated Sub-Adviser(s) that provide(s) discretionary investment management services to the Fund based on the percentage of assets allocated to such Affiliated Sub-Adviser(s).
The Adviser has contractually agreed, through at least June 30, 2016, to waive advisory fees and/or reimburse expenses to the extent necessary to limit total annual fund operating expenses after fee waiver and/or expense reimbursement (excluding certain items discussed below) of Class A, Class B, Class C, Class R, Class Y, Class R5 and Class R6 shares to 2.00%, 2.75%, 2.75%, 2.25%, 1.75%, 1.75% and 1.75% of average daily net assets, respectively. In determining the Adviser’s obligation to waive advisory fees and/or reimburse expenses, the following expenses are not taken into account, and could cause total annual fund operating expenses after fee waiver and/or expense reimbursement to exceed the numbers reflected above: (1) interest; (2) taxes; (3) dividend expense on short sales; (4) extraordinary or non-routine items, including litigation expenses; and (5) expenses that the Fund has incurred but did not actually pay because of an expense offset arrangement. Unless Invesco continues the fee waiver agreement, it will terminate on June 30, 2016. The fee waiver agreement cannot be terminated during its term. The Adviser did not waive fees and/or reimburse expenses during the period under this expense limitation.
Further, the Adviser has contractually agreed, through at least June 30, 2017, to waive the advisory fee payable by the Fund in an amount equal to 100% of the net advisory fees the Adviser receives from the affiliated money market funds on investments by the Fund of uninvested cash in such affiliated money market funds.
For the year ended October 31, 2015, the Adviser waived advisory fees of $136,528.
The Trust has entered into a master administrative services agreement with Invesco pursuant to which the Fund has agreed to pay Invesco for certain administrative costs incurred in providing accounting services to the Fund. For the year ended October 31, 2015, expenses incurred under the agreement are shown in the Statement of Operations as Administrative services fees.
The Trust has entered into a transfer agency and service agreement with Invesco Investment Services, Inc. (“IIS”) pursuant to which the Fund has agreed to pay IIS a fee for providing transfer agency and shareholder services to the Fund and reimburse IIS for certain expenses incurred by IIS in the course of providing such services. IIS may make payments to intermediaries that provide omnibus account services, sub-accounting services and/or networking services. All fees payable by IIS to intermediaries that provide omnibus account services or sub-accounting are charged back to the Fund, subject to certain limitations approved by the Trust’s Board of Trustees. For the year ended October 31, 2015, expenses incurred under the agreement are shown in the Statement of Operations as Transfer agent fees.
The Trust has entered into master distribution agreements with Invesco Distributors, Inc. (“IDI”) to serve as the distributor for the Class A, Class B, Class C, Class R, Class Y, Class R5 and Class R6 shares of the Fund. The Trust has adopted plans pursuant to Rule 12b-1 under the 1940 Act with respect to the Fund’s Class A, Class B, Class C and Class R shares (collectively, the “Plans”). The Fund, pursuant to the Plans, pays IDI compensation at the annual rate of 0.25% of the Fund’s average daily net assets of Class A shares, 1.00% of the average daily net assets of Class B and Class C shares and 0.50% of the average daily net assets of Class R shares. Of the Plan payments, up to 0.25% of the average daily net assets of each class of shares may be paid to furnish continuing personal shareholder services to customers who purchase and own shares of such classes. Any amounts not paid as a service fee under the Plans would constitute an asset-based sales charge. Rules of the Financial Industry Regulatory Authority (“FINRA”) impose a cap on the total sales charges, including asset-based sales charges, that may be paid by any class of shares of the Fund. For the year ended October 31, 2015, expenses incurred under the Plans are shown in the Statement of Operations as Distribution fees.
Front-end sales commissions and CDSC (collectively, the “sales charges”) are not recorded as expenses of the Fund. Front-end sales commissions are deducted from proceeds from the sales of Fund shares prior to investment in Class A shares of the Fund. CDSC are deducted from redemption proceeds prior to remittance to the shareholder. During the year ended October 31, 2015, IDI advised the Fund that IDI retained $48,587 in front-end sales commissions from the sale of Class A shares and $2,622, $2,470 and $3,222 from Class A, Class B and Class C shares, respectively, for CDSC imposed on redemptions by shareholders.
15 Invesco Endeavor Fund
Certain officers and trustees of the Trust are officers and directors of the Adviser, IIS and/or IDI.
NOTE 3—Additional Valuation Information
GAAP defines fair value as the price that would be received to sell an asset or paid to transfer a liability in an orderly transaction between market participants at the measurement date, under current market conditions. GAAP establishes a hierarchy that prioritizes the inputs to valuation methods, giving the highest priority to readily available unadjusted quoted prices in an active market for identical assets (Level 1) and the lowest priority to significant unobservable inputs (Level 3), generally when market prices are not readily available or are unreliable. Based on the valuation inputs, the securities or other investments are tiered into one of three levels. Changes in valuation methods may result in transfers in or out of an investment’s assigned level:
| | Level 1 — | Prices are determined using quoted prices in an active market for identical assets. |
| | Level 2 — | Prices are determined using other significant observable inputs. Observable inputs are inputs that other market participants may use in pricing a security. These may include quoted prices for similar securities, interest rates, prepayment speeds, credit risk, yield curves, loss severities, default rates, discount rates, volatilities and others. |
| | Level 3 — | Prices are determined using significant unobservable inputs. In situations where quoted prices or observable inputs are unavailable (for example, when there is little or no market activity for an investment at the end of the period), unobservable inputs may be used. Unobservable inputs reflect the Fund’s own assumptions about the factors market participants would use in determining fair value of the securities or instruments and would be based on the best available information. |
The following is a summary of the tiered valuation input levels, as of October 31, 2015. The level assigned to the securities valuations may not be an indication of the risk or liquidity associated with investing in those securities. Because of the inherent uncertainties of valuation, the values reflected in the financial statements may materially differ from the value received upon actual sale of those investments.
| | | | | | | | | | | | | | | | |
| | | Level 1 | | | Level 2 | | | Level 3 | | | Total | |
Equity Securities | | $ | 356,157,577 | | | $ | 24,856,914 | | | $ | — | | | $ | 381,014,491 | |
NOTE 4—Investments in Other Affiliates
The 1940 Act defines an “affiliated person” as an issuance in which a fund holds 5% or more of the outstanding voting securities. The Fund has not owned enough of the outstanding voting securities of the issuer to have control (as defined in the 1940 Act) of that issuer. The following is a summary of the investments in other affiliates for the year ended October 31, 2015.
| | | | | | | | | | | | | | | | | | | | | | | | | | | | |
| | | Value 10/31/14 | | | Purchases
at Cost | | | Proceeds from Sales | | | Change in
Unrealized
Appreciation
(Depreciation) | | | Realized
Gain | | | Value 10/31/15 | | | Interest/
Dividend
Income | |
Orion Marine Group, Inc. | | $ | 20,653,835 | | | $ | 6,398,609 | | | $ | — | | | $ | (16,052,980 | ) | | $ | — | | | $ | 10,999,464 | | | $ | — | |
Pike Corp. | | | 21,536,680 | | | | — | | | | (21,644,904 | ) | | | (5,149,332 | ) | | | 5,257,556 | | | | — | | | | — | |
Total | | $ | 42,190,515 | | | $ | 6,398,609 | | | $ | (21,644,904 | ) | | $ | (21,202,312 | ) | | $ | 5,257,556 | | | $ | 10,999,464 | | | $ | — | |
NOTE 5—Expense Offset Arrangement(s)
The expense offset arrangement is comprised of transfer agency credits which result from balances in demand deposit accounts used by the transfer agent for clearing shareholder transactions. For the year ended October 31, 2015, the Fund received credits from this arrangement, which resulted in the reduction of the Fund’s total expenses of $1,352.
NOTE 6—Trustees’ and Officers’ Fees and Benefits
Trustees’ and Officers’ Fees and Benefits include amounts accrued by the Fund to pay remuneration to certain Trustees and Officers of the Fund. Trustees have the option to defer compensation payable by the Fund, and Trustees’ and Officers’ Fees and Benefits also include amounts accrued by the Fund to fund such deferred compensation amounts. Those Trustees who defer compensation have the option to select various Invesco Funds in which their deferral accounts shall be deemed to be invested. Finally, certain current Trustees were eligible to participate in a retirement plan that provided for benefits to be paid upon retirement to Trustees over a period of time based on the number of years of service. The Fund may have certain former Trustees who also participate in a retirement plan and receive benefits under such plan. Trustees’ and Officers’ Fees and Benefits include amounts accrued by the Fund to fund such retirement benefits. Obligations under the deferred compensation and retirement plans represent unsecured claims against the general assets of the Fund.
NOTE 7—Cash Balances
The Fund is permitted to temporarily carry a negative or overdrawn balance in its account with State Street Bank and Trust Company, the custodian bank. Such balances, if any at period end, are shown in the Statement of Assets and Liabilities under the payable caption Amount due custodian. To compensate the custodian bank for such overdrafts, the overdrawn Fund may either (1) leave funds as a compensating balance in the account so the custodian bank can be compensated by earning the additional interest; or (2) compensate by paying the custodian bank at a rate agreed upon by the custodian bank and Invesco, not to exceed the contractually agreed upon rate.
16 Invesco Endeavor Fund
NOTE 8—Distributions to Shareholders and Tax Components of Net Assets
Tax Character of Distributions to Shareholders Paid During the Fiscal Years Ended October 31, 2015 and 2014:
| | | | | | | | |
| | | 2015 | | | 2014 | |
Ordinary income | | $ | 3,648,252 | | | $ | 3,605,339 | |
Long-term capital gain | | | 41,188,086 | | | | 17,101,178 | |
Total distributions | | $ | 44,836,338 | | | $ | 20,706,517 | |
Tax Components of Net Assets at Period-End:
| | | | |
| | | 2015 | |
Undistributed ordinary income | | $ | 8,302,568 | |
Undistributed long-term gain | | | 36,040,038 | |
Net unrealized appreciation — investments | | | 18,495,250 | |
Net unrealized appreciation (depreciation) — other investments | | | (19,461 | ) |
Temporary book/tax differences | | | (68,357 | ) |
Shares of beneficial interest | | | 320,288,570 | |
Total net assets | | $ | 383,038,608 | |
The difference between book-basis and tax-basis unrealized appreciation (depreciation) is due to differences in the timing of recognition of gains and losses on investments for tax and book purposes. The Fund’s net unrealized appreciation difference is attributable primarily to wash sales.
The temporary book/tax differences are a result of timing differences between book and tax recognition of income and/or expenses. The Fund’s temporary book/tax differences are the result of the trustee deferral of compensation and retirement plan benefits.
Capital loss carryforward is calculated and reported as of a specific date. Results of transactions and other activity after that date may affect the amount of capital loss carryforward actually available for the Fund to utilize. Capital losses generated in years beginning after December 22, 2010 can be carried forward for an unlimited period, whereas previous losses expire in eight tax years. Capital losses with an expiration period may not be used to offset capital gains until all net capital losses without an expiration date have been utilized. Capital loss carryforwards with no expiration date will retain their character as either short-term or long-term capital losses instead of as short-term capital losses as under prior law. The ability to utilize capital loss carryforwards in the future may be limited under the Internal Revenue Code and related regulations based on the results of future transactions.
The Fund does not have a capital loss carryforward as of October 31, 2015.
NOTE 9—Investment Securities
The aggregate amount of investment securities (other than short-term securities, U.S. Treasury obligations and money market funds, if any) purchased and sold by the Fund during the year ended October 31, 2015 was $100,888,941 and $153,919,248, respectively. Cost of investments on a tax basis includes the adjustments for financial reporting purposes as of the most recently completed federal income tax reporting period-end.
| | | | |
| Unrealized Appreciation (Depreciation) of Investment Securities on a Tax Basis | |
Aggregate unrealized appreciation of investment securities | | $ | 86,917,615 | |
Aggregate unrealized (depreciation) of investment securities | | | (68,422,365 | ) |
Net unrealized appreciation of investment securities | | $ | 18,495,250 | |
Cost of investments for tax purposes is $362,519,241.
NOTE 10—Reclassification of Permanent Differences
Primarily as a result of differing book/tax treatment of foreign currency transactions, partnerships and net operating loss, on October 31, 2015, undistributed net investment income was decreased by $41,710 and undistributed net realized gain was increased by $41,710. This reclassification had no effect on the net assets of the Fund.
17 Invesco Endeavor Fund
NOTE 11—Share Information
| | | | | | | | | | | | | | | | |
| | | Summary of Share Activity | |
| | | Years ended October 31, | |
| | | 2015(a) | | | 2014 | |
| | | Shares | | | Amount | | | Shares | | | Amount | |
Sold: | | | | | | | | | | | | | | | | |
Class A | | | 1,272,962 | | | $ | 26,412,566 | | | | 2,202,819 | | | $ | 47,616,201 | |
Class B | | | 9,544 | | | | 186,297 | | | | 16,309 | | | | 322,237 | |
Class C | | | 314,817 | | | | 5,940,578 | | | | 625,657 | | | | 12,500,340 | |
Class R | | | 373,372 | | | | 7,499,961 | | | | 563,317 | | | | 11,918,520 | |
Class Y | | | 845,439 | | | | 17,788,622 | | | | 1,372,425 | | | | 30,187,144 | |
Class R5 | | | 447,301 | | | | 9,680,718 | | | | 1,479,829 | | | | 33,518,859 | |
Class R6 | | | 466,434 | | | | 9,759,478 | | | | 612,303 | | | | 13,557,403 | |
| | | | |
Issued as reinvestment of dividends: | | | | | | | | | | | | | | | | |
Class A | | | 804,187 | | | | 15,947,033 | | | | 337,777 | | | | 6,877,134 | |
Class B | | | 23,396 | | | | 423,933 | | | | 12,504 | | | | 236,332 | |
Class C | | | 269,529 | | | | 4,886,566 | | | | 105,401 | | | | 1,993,123 | |
Class R | | | 158,224 | | | | 3,061,643 | | | | 74,491 | | | | 1,486,839 | |
Class Y | | | 248,068 | | | | 5,001,049 | | | | 106,184 | | | | 2,189,519 | |
Class R5 | | | 177,190 | | | | 3,644,799 | | | | 54,806 | | | | 1,149,279 | |
Class R6 | | | 416,122 | | | | 8,572,104 | | | | 194,812 | | | | 4,087,168 | |
| | | | |
Automatic conversion of Class B shares to Class A shares: | | | | | | | | | | | | | | | | |
Class A | | | 86,498 | | | | 1,786,311 | | | | 45,124 | | | | 978,925 | |
Class B | | | (94,907 | ) | | | (1,786,311 | ) | | | (48,729 | ) | | | (978,925 | ) |
| | | | |
Reacquired: | | | | | | | | | | | | | | | | |
Class A | | | (3,041,053 | ) | | | (62,391,130 | ) | | | (2,589,180 | ) | | | (56,244,485 | ) |
Class B | | | (47,852 | ) | | | (898,138 | ) | | | (46,881 | ) | | | (933,808 | ) |
Class C | | | (703,371 | ) | | | (13,112,986 | ) | | | (659,583 | ) | | | (13,210,361 | ) |
Class R | | | (777,312 | ) | | | (15,567,887 | ) | | | (732,292 | ) | | | (15,583,515 | ) |
Class Y | | | (2,176,314 | ) | | | (45,317,729 | ) | | | (2,646,470 | ) | | | (57,099,431 | ) |
Class R5 | | | (1,054,881 | ) | | | (22,661,846 | ) | | | (864,925 | ) | | | (19,388,682 | ) |
Class R6 | | | (647,593 | ) | �� | | (13,761,533 | ) | | | (637,396 | ) | | | (14,570,365 | ) |
Net increase (decrease) in share activity | | | (2,630,200 | ) | | $ | (54,905,902 | ) | | | (421,698 | ) | | $ | (9,390,549 | ) |
| (a) | There are entities that are record owners of more than 5% of the outstanding shares of the Fund and in the aggregate own 13% of the outstanding shares of the Fund. IDI has an agreement with these entities to sell Fund shares. The Fund, Invesco and/or Invesco affiliates may make payments to these entities, which are considered to be related to the Fund, for providing services to the Fund, Invesco and/or Invesco affiliates including but not limited to services such as securities brokerage, distribution, third party record keeping and account servicing. The Fund has no knowledge as to whether all or any portion of the shares owned of record by these entities are also owned beneficially. |
| | In addition, 21% of the outstanding shares of the Fund are owned by affiliated mutual funds. Affiliated mutual funds are other mutual funds that are also advised by Invesco. |
18 Invesco Endeavor Fund
NOTE 12—Financial Highlights
The following schedule presents financial highlights for a share of the Fund outstanding throughout the periods indicated.
| | | | | | | | | | | | | | | | | | | | | | | | | | | | | | | | | | | | | | | | | | | | | | | | | | | | | | | | |
| | | Net asset
value,
beginning
of period | | | Net
investment
income
(loss)(a) | | | Net gains
(losses)
on securities
(both
realized and
unrealized) | | | Total from
investment
operations | | | Dividends
from net
investment
income | | | Distributions
from net
realized
gains | | | Total
distributions | | | Net asset
value, end
of period | | | Total
return(b) | | | Net assets,
end of period
(000’s omitted) | | | Ratio of
expenses
to average
net assets
with fee waivers
and/or expenses
absorbed | | | Ratio of
expenses
to average net
assets without
fee waivers
and/or expenses
absorbed | | | Ratio of net
investment
income (loss)
to average
net assets | | | Portfolio
turnover(c) | |
Class A | | | | | | | | | | | | | | | | | | | | | | | | | | | | | | | | | | | | | | | | | | | | | | | | | | | | | | | | |
Year ended 10/31/15 | | $ | 22.57 | | | $ | (0.01 | ) | | $ | (1.25 | ) | | $ | (1.26 | ) | | $ | — | | | $ | (2.01 | ) | | $ | (2.01 | ) | | $ | 19.30 | | | | (5.80 | )% | | $ | 147,504 | | | | 1.26 | %(d) | | | 1.29 | %(d) | | | (0.04 | )%(d) | | | 27 | % |
Year ended 10/31/14 | | | 21.18 | | | | (0.09 | ) | | | 2.35 | | | | 2.26 | | | | (0.01 | ) | | | (0.86 | ) | | | (0.87 | ) | | | 22.57 | | | | 11.13 | | | | 192,326 | | | | 1.26 | | | | 1.29 | | | | (0.43 | ) | | | 27 | |
Year ended 10/31/13 | | | 18.19 | | | | (0.00 | ) | | | 4.78 | | | | 4.78 | | | | (0.06 | ) | | | (1.73 | ) | | | (1.79 | ) | | | 21.18 | | | | 28.78 | | | | 180,568 | | | | 1.26 | | | | 1.30 | | | | (0.02 | ) | | | 20 | |
Year ended 10/31/12 | | | 16.36 | | | | (0.08 | ) | | | 1.98 | | | | 1.90 | | | | — | | | | (0.07 | ) | | | (0.07 | ) | | | 18.19 | | | | 11.70 | | | | 102,508 | | | | 1.34 | | | | 1.37 | | | | (0.41 | ) | | | 37 | |
Year ended 10/31/11 | | | 14.78 | | | | (0.08 | ) | | | 1.66 | | | | 1.58 | | | | — | | | | — | | | | — | | | | 16.36 | | | | 10.69 | | | | 91,975 | | | | 1.34 | | | | 1.37 | | | | (0.49 | ) | | | 30 | |
Class B | | | | | | | | | | | | | | | | | | | | | | | | | | | | | | | | | | | | | | | | | | | | | | | | | | | | | | | | |
Year ended 10/31/15 | | | 20.82 | | | | (0.15 | ) | | | (1.14 | ) | | | (1.29 | ) | | | — | | | | (2.01 | ) | | | (2.01 | ) | | | 17.52 | | | | (6.50 | ) | | | 2,161 | | | | 2.01 | (d) | | | 2.04 | (d) | | | (0.79 | )(d) | | | 27 | |
Year ended 10/31/14 | | | 19.74 | | | | (0.24 | ) | | | 2.18 | | | | 1.94 | | | | — | | | | (0.86 | ) | | | (0.86 | ) | | | 20.82 | | | | 10.27 | | | | 4,855 | | | | 2.01 | | | | 2.04 | | | | (1.18 | ) | | | 27 | |
Year ended 10/31/13 | | | 17.16 | | | | (0.14 | ) | | | 4.49 | | | | 4.35 | | | | (0.04 | ) | | | (1.73 | ) | | | (1.77 | ) | | | 19.74 | | | | 27.89 | | | | 5,921 | | | | 2.01 | | | | 2.05 | | | | (0.77 | ) | | | 20 | |
Year ended 10/31/12 | | | 15.55 | | | | (0.19 | ) | | | 1.87 | | | | 1.68 | | | | — | | | | (0.07 | ) | | | (0.07 | ) | | | 17.16 | | | | 10.89 | | | | 6,195 | | | | 2.09 | | | | 2.12 | | | | (1.16 | ) | | | 37 | |
Year ended 10/31/11 | | | 14.16 | | | | (0.20 | ) | | | 1.59 | | | | 1.39 | | | | — | | | | — | | | | — | | | | 15.55 | | | | 9.82 | | | | 7,542 | | | | 2.09 | | | | 2.12 | | | | (1.24 | ) | | | 30 | |
Class C | | | | | | | | | | | | | | | | | | | | | | | | | | | | | | | | | | | | | | | | | | | | | | | | | | | | | | | | |
Year ended 10/31/15 | | | 20.83 | | | | (0.15 | ) | | | (1.14 | ) | | | (1.29 | ) | | | — | | | | (2.01 | ) | | | (2.01 | ) | | | 17.53 | | | | (6.49 | ) | | | 42,965 | | | | 2.01 | (d) | | | 2.04 | (d) | | | (0.79 | )(d) | | | 27 | |
Year ended 10/31/14 | | | 19.75 | | | | (0.24 | ) | | | 2.18 | | | | 1.94 | | | | — | | | | (0.86 | ) | | | (0.86 | ) | | | 20.83 | | | | 10.27 | | | | 53,542 | | | | 2.01 | | | | 2.04 | | | | (1.18 | ) | | | 27 | |
Year ended 10/31/13 | | | 17.17 | | | | (0.14 | ) | | | 4.49 | | | | 4.35 | | | | (0.04 | ) | | | (1.73 | ) | | | (1.77 | ) | | | 19.75 | | | | 27.87 | | | | 49,344 | | | | 2.01 | | | | 2.05 | | | | (0.77 | ) | | | 20 | |
Year ended 10/31/12 | | | 15.56 | | | | (0.19 | ) | | | 1.87 | | | | 1.68 | | | | — | | | | (0.07 | ) | | | (0.07 | ) | | | 17.17 | | | | 10.88 | | | | 26,513 | | | | 2.09 | | | | 2.12 | | | | (1.16 | ) | | | 37 | |
Year ended 10/31/11 | | | 14.17 | | | | (0.20 | ) | | | 1.59 | | | | 1.39 | | | | — | | | | — | | | | — | | | | 15.56 | | | | 9.81 | | | | 20,710 | | | | 2.09 | | | | 2.12 | | | | (1.24 | ) | | | 30 | |
Class R | | | | | | | | | | | | | | | | | | | | | | | | | | | | | | | | | | | | | | | | | | | | | | | | | | | | | | | | |
Year ended 10/31/15 | | | 22.08 | | | | (0.06 | ) | | | (1.23 | ) | | | (1.29 | ) | | | — | | | | (2.01 | ) | | | (2.01 | ) | | | 18.78 | | | | (6.09 | ) | | | 24,855 | | | | 1.51 | (d) | | | 1.54 | (d) | | | (0.29 | )(d) | | | 27 | |
Year ended 10/31/14 | | | 20.77 | | | | (0.14 | ) | | | 2.31 | | | | 2.17 | | | | — | | | | (0.86 | ) | | | (0.86 | ) | | | 22.08 | | | | 10.89 | | | | 34,634 | | | | 1.51 | | | | 1.54 | | | | (0.68 | ) | | | 27 | |
Year ended 10/31/13 | | | 17.91 | | | | (0.05 | ) | | | 4.69 | | | | 4.64 | | | | (0.05 | ) | | | (1.73 | ) | | | (1.78 | ) | | | 20.77 | | | | 28.43 | | | | 34,556 | | | | 1.51 | | | | 1.55 | | | | (0.27 | ) | | | 20 | |
Year ended 10/31/12 | | | 16.14 | | | | (0.11 | ) | | | 1.95 | | | | 1.84 | | | | — | | | | (0.07 | ) | | | (0.07 | ) | | | 17.91 | | | | 11.49 | | | | 23,412 | | | | 1.59 | | | | 1.62 | | | | (0.66 | ) | | | 37 | |
Year ended 10/31/11 | | | 14.63 | | | | (0.12 | ) | | | 1.63 | | | | 1.51 | | | | — | | | | — | | | | — | | | | 16.14 | | | | 10.32 | | | | 14,721 | | | | 1.59 | | | | 1.62 | | | | (0.74 | ) | | | 30 | |
Class Y | | | | | | | | | | | | | | | | | | | | | | | | | | | | | | | | | | | | | | | | | | | | | | | | | | | | | | | | |
Year ended 10/31/15 | | | 22.91 | | | | 0.04 | | | | (1.28 | ) | | | (1.24 | ) | | | — | | | | (2.01 | ) | | | (2.01 | ) | | | 19.66 | | | | (5.61 | ) | | | 40,425 | | | | 1.01 | (d) | | | 1.04 | (d) | | | 0.21 | (d) | | | 27 | |
Year ended 10/31/14 | | | 21.48 | | | | (0.04 | ) | | | 2.38 | | | | 2.34 | | | | (0.05 | ) | | | (0.86 | ) | | | (0.91 | ) | | | 22.91 | | | | 11.39 | | | | 71,898 | | | | 1.01 | | | | 1.04 | | | | (0.18 | ) | | | 27 | |
Year ended 10/31/13 | | | 18.38 | | | | 0.05 | | | | 4.84 | | | | 4.89 | | | | (0.06 | ) | | | (1.73 | ) | | | (1.79 | ) | | | 21.48 | | | | 29.15 | | | | 92,483 | | | | 1.01 | | | | 1.05 | | | | 0.23 | | | | 20 | |
Year ended 10/31/12 | | | 16.49 | | | | (0.03 | ) | | | 1.99 | | | | 1.96 | | | | — | | | | (0.07 | ) | | | (0.07 | ) | | | 18.38 | | | | 11.97 | | | | 22,529 | | | | 1.09 | | | | 1.12 | | | | (0.16 | ) | | | 37 | |
Year ended 10/31/11 | | | 14.86 | | | | (0.04 | ) | | | 1.67 | | | | 1.63 | | | | — | | | | — | | | | — | | | | 16.49 | | | | 10.97 | | | | 5,802 | | | | 1.09 | | | | 1.12 | | | | (0.24 | ) | | | 30 | |
Class R5 | | | | | | | | | | | | | | | | | | | | | | | | | | | | | | | | | | | | | | | | | | | | | | | | | | | | | | | | |
Year ended 10/31/15 | | | 23.32 | | | | 0.07 | | | | (1.30 | ) | | | (1.23 | ) | | | — | | | | (2.01 | ) | | | (2.01 | ) | | | 20.08 | | | | (5.46 | ) | | | 33,854 | | | | 0.89 | (d) | | | 0.92 | (d) | | | 0.33 | (d) | | | 27 | |
Year ended 10/31/14 | | | 21.84 | | | | (0.02 | ) | | | 2.43 | | | | 2.41 | | | | (0.07 | ) | | | (0.86 | ) | | | (0.93 | ) | | | 23.32 | | | | 11.51 | | | | 49,356 | | | | 0.90 | | | | 0.93 | | | | (0.07 | ) | | | 27 | |
Year ended 10/31/13 | | | 18.65 | | | | 0.07 | | | | 4.92 | | | | 4.99 | | | | (0.07 | ) | | | (1.73 | ) | | | (1.80 | ) | | | 21.84 | | | | 29.24 | | | | 31,593 | | | | 0.91 | | | | 0.95 | | | | 0.33 | | | | 20 | |
Year ended 10/31/12 | | | 16.69 | | | | 0.01 | | | | 2.02 | | | | 2.03 | | | | — | | | | (0.07 | ) | | | (0.07 | ) | | | 18.65 | | | | 12.25 | | | | 16,677 | | | | 0.87 | | | | 0.90 | | | | 0.06 | | | | 37 | |
Year ended 10/31/11 | | | 15.01 | | | | 0.00 | | | | 1.68 | | | | 1.68 | | | | — | | | | — | | | | — | | | | 16.69 | | | | 11.19 | | | | 87,733 | | | | 0.85 | | | | 0.88 | | | | 0.00 | | | | 30 | |
Class R6 | | | | | | | | | | | | | | | | | | | | | | | | | | | | | | | | | | | | | | | | | | | | | | | | | | | | | | | | |
Year ended 10/31/15 | | | 23.35 | | | | 0.09 | | | | (1.30 | ) | | | (1.21 | ) | | | — | | | | (2.01 | ) | | | (2.01 | ) | | | 20.13 | | | | (5.36 | ) | | | 91,275 | | | | 0.80 | (d) | | | 0.83 | (d) | | | 0.42 | (d) | | | 27 | |
Year ended 10/31/14 | | | 21.86 | | | | 0.01 | | | | 2.42 | | | | 2.43 | | | | (0.08 | ) | | | (0.86 | ) | | | (0.94 | ) | | | 23.35 | | | | 11.62 | | | | 100,410 | | | | 0.81 | | | | 0.84 | | | | 0.02 | | | | 27 | |
Year ended 10/31/13 | | | 18.65 | | | | 0.08 | | | | 4.93 | | | | 5.01 | | | | (0.07 | ) | | | (1.73 | ) | | | (1.80 | ) | | | 21.86 | | | | 29.37 | | | | 90,291 | | | | 0.82 | | | | 0.86 | | | | 0.42 | | | | 20 | |
Year ended 10/31/12(e) | | | 18.97 | | | | 0.00 | | | | (0.32 | ) | | | (0.32 | ) | | | — | | | | — | | | | — | | | | 18.65 | | | | (1.69 | ) | | | 74,513 | | | | 0.83 | (f) | | | 0.86 | (f) | | | 0.10 | (f) | | | 37 | |
| (a) | Calculated using average shares outstanding. |
| (b) | Includes adjustments in accordance with accounting principles generally accepted in the United States of America and as such, the net asset value for financial reporting purposes and the returns based upon those net asset values may differ from the net asset value and returns for shareholder transactions. Does not include sales charges and is not annualized for periods less than one year, if applicable. |
| (c) | Portfolio turnover is calculated at the fund level and is not annualized for periods less than one year, if applicable. |
| (d) | Ratios are based on average daily net assets (000’s omitted) of $176,913, $3,696, $50,477, $31,062, $62,303, $42,519 and $99,267 for Class A, Class B, Class C, Class R, Class Y, Class R5 and Class R6 shares, respectively. |
| (e) | Commencement date of September 24, 2012. |
19 Invesco Endeavor Fund
Report of Independent Registered Public Accounting Firm
To the Board of Trustees of AIM Investment Funds (Invesco Investment Funds)
and Shareholders of Invesco Endeavor Fund:
In our opinion, the accompanying statement of assets and liabilities, including the schedule of investments, and the related statements of operations and of changes in net assets and the financial highlights present fairly, in all material respects, the financial position of Invesco Endeavor Fund (one of the funds constituting AIM Investment Funds (Invesco Investment Funds), hereafter referred to as the “Fund”) at October 31, 2015, the results of its operations for the year then ended, the changes in its net assets for each of the two years in the period then ended and the financial highlights for each of the five years in the period then ended, in conformity with accounting principles generally accepted in the United States of America. These financial statements and financial highlights (hereafter referred to as “financial statements”) are the responsibility of the Fund’s management. Our responsibility is to express an opinion on these financial statements based on our audits. We conducted our audits of these financial statements in accordance with the standards of the Public Company Accounting Oversight Board (United States). Those standards require that we plan and perform the audit to obtain reasonable assurance about whether the financial statements are free of material misstatement. An audit includes examining, on a test basis, evidence supporting the amounts and disclosures in the financial statements, assessing the accounting principles used and significant estimates made by management, and evaluating the overall financial statement presentation. We believe that our audits, which included confirmation of securities at October 31, 2015 by correspondence with the custodian and brokers, and the application of alternative auditing procedures where confirmations of security purchases have not been received, provide a reasonable basis for our opinion.
PRICEWATERHOUSECOOPERS LLP
December 23, 2015
Houston, Texas
20 Invesco Endeavor Fund
Calculating your ongoing Fund expenses
Example
As a shareholder of the Fund, you incur two types of costs: (1) transaction costs, which may include sales charges (loads) on purchase payments or contingent deferred sales charges on redemptions, if any; and (2) ongoing costs, including management fees, distribution and/or service (12b-1) fees, and other Fund expenses. This example is intended to help you understand your ongoing costs (in dollars) of investing in the Fund and to compare these costs with ongoing costs of investing in other mutual funds. The example is based on an investment of $1,000 invested at the beginning of the period and held for the entire period May 1, 2015 through October 31, 2015.
Actual expenses
The table below provides information about actual account values and actual expenses. You may use the information in this table, together with the amount you invested, to estimate the expenses that you paid over the period. Simply divide your account value by $1,000 (for example, an $8,600 account value divided by $1,000 = 8.6), then multiply the result by the number in the table under the heading entitled “Actual Expenses Paid During Period” to estimate the expenses you paid on your account during this period.
Hypothetical example for comparison purposes
The table below also provides information about hypothetical account values and hypothetical expenses based on the Fund’s actual expense ratio and an assumed rate of return of 5% per year before expenses, which is not the Fund’s actual return.
The hypothetical account values and expenses may not be used to estimate the actual ending account balance or expenses you paid for the period. You may use this information to compare the ongoing costs of investing in the Fund and other funds. To do so, compare this 5% hypothetical example with the 5% hypothetical examples that appear in the shareholder reports of the other funds.
Please note that the expenses shown in the table are meant to highlight your ongoing costs only and do not reflect any transaction costs, such as sales charges (loads) on purchase payments or contingent deferred sales charges on redemptions, if any. Therefore, the hypothetical information is useful in comparing ongoing costs only, and will not help you determine the relative total costs of owning different funds. In addition, if these transaction costs were included, your costs would have been higher.
| | | | | | | | | | | | | | | | | | | | | | | | |
| Class | | Beginning
Account Value
(05/01/15) | | | ACTUAL | | | HYPOTHETICAL (5% annual return before
expenses) | | | Annualized
Expense
Ratio | |
| | | Ending
Account Value
(10/31/15)1 | | | Expenses
Paid During
Period2 | | | Ending
Account Value
(10/31/15) | | | Expenses
Paid During
Period2 | | |
A | | $ | 1,000.00 | | | $ | 914.70 | | | $ | 6.08 | | | $ | 1,018.85 | | | $ | 6.41 | | | | 1.26 | % |
B | | | 1,000.00 | | | | 911.10 | | | | 9.68 | | | | 1,015.07 | | | | 10.21 | | | | 2.01 | |
C | | | 1,000.00 | | | | 911.10 | | | | 9.68 | | | | 1,015.07 | | | | 10.21 | | | | 2.01 | |
R | | | 1,000.00 | | | | 913.50 | | | | 7.28 | | | | 1,017.59 | | | | 7.68 | | | | 1.51 | |
Y | | | 1,000.00 | | | | 915.30 | | | | 4.88 | | | | 1,020.11 | | | | 5.14 | | | | 1.01 | |
R5 | | | 1,000.00 | | | | 916.00 | | | | 4.30 | | | | 1,020.72 | | | | 4.53 | | | | 0.89 | |
| R6 | | | 1,000.00 | | | | 916.70 | | | | 3.86 | | | | 1,021.17 | | | | 4.08 | | | | 0.80 | |
| 1 | The actual ending account value is based on the actual total return of the Fund for the period May 1, 2015 through October 31, 2015, after actual expenses and will differ from the hypothetical ending account value which is based on the Fund’s expense ratio and a hypothetical annual return of 5% before expenses. |
| 2 | Expenses are equal to the Fund’s annualized expense ratio as indicated above multiplied by the average account value over the period, multiplied by 184/365 to reflect the most recent fiscal half year. |
21 Invesco Endeavor Fund
Approval of Investment Advisory and Sub-Advisory Contracts
The Board of Trustees (the Board) of AIM Investment Funds (Invesco Investment Funds) is required under the Investment Company Act of 1940, as amended, to approve annually the renewal of Invesco Endeavor Fund’s (the Fund) investment advisory agreements. During contract renewal meetings held on June 9-10, 2015, the Board as a whole, and the disinterested or “independent” Trustees, who comprise over 75% of the Board, voting separately, approved the continuance for the Fund of the Master Investment Advisory Agreement with Invesco Advisers, Inc. (Invesco Advisers and the investment advisory agreement) and the Master Intergroup Sub-Advisory Contract for Mutual Funds with Invesco Asset Management Deutschland GmbH, Invesco Asset Management Limited, Invesco Asset Management (Japan) Limited, Invesco Hong Kong Limited, Invesco Senior Secured Management, Inc. and Invesco Canada Ltd. (collectively, the Affiliated Sub-Advisers and the sub-advisory contracts) for another year, effective July 1, 2015.
In evaluating the fairness and reasonableness of compensation under the Fund’s investment advisory agreement and sub-advisory contracts, the Board considered, among other things, the factors discussed below. The Board determined that continuation of the Fund’s investment advisory agreement and the sub-advisory contracts is in the best interest of the Fund and its shareholders and that the compensation payable to Invesco Advisers and the Affiliated Sub-Advisers under the agreements is fair and reasonable.
The Board’s Fund Evaluation Process
The Board’s Investments Committee has established three Sub-Committees, each of which is primarily responsible for overseeing the performance and investment management services provided by Invesco Advisers and the Affiliated Sub-Advisers to a number of the funds advised by Invesco Advisers (the Invesco Funds). The Sub-Committees meet throughout the year to review the performance of their assigned Invesco Funds, including reviewing materials prepared under the direction of the independent Senior Officer, an officer of the Invesco Funds who reports directly to the independent Trustees. Over the course of each year, the Sub-Committees meet with portfolio managers for their assigned Invesco Funds and other members of management to review the performance, investment objective(s), policies, strategies, limitations and investment risks of these funds. The Board had the benefit of reports from the Sub-Committees and Investments Committee throughout the year in considering approval of the continuance of each Invesco Fund’s investment advisory agreement and sub-advisory contracts for another year.
During the contract renewal process, the Board receives comparative performance and fee data regarding the Invesco Funds prepared by Invesco Advisers and Lipper Inc. (Lipper), an independent provider of investment company data. The Board also receives a report and this independent written evaluation from the Senior Officer. The Senior Officer’s evaluation is prepared as part of his responsibility to manage the process by which the Invesco Funds’ proposed management fees are negotiated during the annual contract renewal process to ensure they are negotiated in a manner that is at arms’ length and reasonable. In addition to meetings with Invesco Advisers and fund counsel, the independent Trustees also discuss the continuance of the investment advisory agreement and sub-advisory contracts in separate sessions with the Senior Officer and with independent legal counsel.
The Trustees recognized that the advisory fee rates for the Invesco Funds are, in many cases, the result of years of review and negotiation. The Trustees’ deliberations and conclusions in a particular year may be based in part on their deliberations and conclusions regarding these same arrangements throughout the year and in prior years. The Trustees’ review and conclusions are based on the comprehensive consideration of all information presented to them and are not the result of any single determinative factor. Moreover, one Trustee may have weighed a particular piece of information or factor differently than another Trustee.
The discussion below is a summary of the Senior Officer’s independent written evaluation with respect to the Fund’s investment advisory agreement as well as a discussion of the material factors and related conclusions that formed the basis for the Board’s approval of the Fund’s investment advisory agreement and sub-advisory contracts. Unless otherwise stated, this information is current as of June 10, 2015, and does not reflect consideration of factors that became known to the Board after that date.
Factors and Conclusions and Summary of Independent Written Fee Evaluation
| A. | Nature, Extent and Quality of Services Provided by Invesco Advisers and the Affiliated Sub-Advisers |
The Board reviewed the advisory services provided to the Fund by Invesco Advisers under the Fund’s investment advisory agreement, the performance of Invesco Advisers in providing these services, and the credentials and experience of the officers and employees of Invesco Advisers who provide these services, including the Fund’s portfolio manager or managers. The Board’s review of the qualifications of Invesco Advisers to provide advisory services included the Board’s
consideration of Invesco Advisers’ investment process oversight, independent credit analysis and investment risk management. The Board also considered non-advisory services that Invesco Advisers and its affiliates provide to the Invesco Funds such as various back office support functions, equity and fixed income trading operations, internal audit, distribution, valuation and legal and compliance.
In determining whether to continue the Fund’s investment advisory agreement, the Board considered the benefits of reapproving an existing relationship and the greater uncertainty that may be associated with entering into a new relationship. The Board concluded that the nature, extent and quality of the services provided to the Fund by Invesco Advisers are appropriate and satisfactory and consistent with the terms of the Fund’s investment advisory agreement.
The Board reviewed the services that may be provided by the Affiliated Sub-Advisers under the sub-advisory contracts and the credentials and experience of the officers and employees of the Affiliated Sub-Advisers who provide these services. The Board noted that the Affiliated Sub-Advisers have offices and personnel that are located in financial centers around the world. As a result, the Affiliated Sub-Advisers can provide research and investment analysis on the markets and economies of various countries in which the Fund may invest, make recommendations regarding securities and assist with security trades. The Board concluded that the sub-advisory contracts benefit the Fund and its shareholders by permitting Invesco Advisers to use the resources and talents of the Affiliated Sub-Advisers in managing the Fund. The Board concluded that the nature, extent and quality of the services that may be provided by the Affiliated Sub-Advisers are appropriate and satisfactory and consistent with the terms of the Fund’s sub-advisory contracts.
The Board considered Fund performance as a relevant factor in considering whether to approve the investment advisory agreement as well as the sub-advisory contracts for the Fund, as Invesco Canada Ltd. currently manages assets of the Fund.
The Board compared the Fund’s performance during the past one, three and five calendar years to the performance of funds in the Lipper performance universe and against the Lipper Mid-Cap Core Funds Index. The Board noted that performance of Class A shares of the Fund was in the fourth quintile of its performance universe for the one and three year periods and the third quintile for the five year period (the first quintile being the best performing funds and the fifth quintile being the worst performing funds). The Board noted that performance of Class A shares of the Fund was below the performance of the Index for the one, three and
22 Invesco Endeavor Fund
five year periods. The Trustees also reviewed more recent Fund performance and this review did not change their conclusions.
| C. | Advisory and Sub-Advisory Fees |
The Board compared the Fund’s contractual management fee rate to the contractual management fee rates of funds in the Fund’s Lipper expense group at a common asset level. The Board noted that the contractual management fee rate for Class A shares of the Fund was below the median contractual management fee rate of funds in its expense group. The Board noted that the term “contractual management fee” may include both advisory and certain administrative services fees, but that Lipper does not provide information on a fund by fund basis as to what is included. The Board noted that Invesco Advisers does not charge the Invesco Funds for the administrative services included in the term as defined by Lipper. The Board also reviewed the methodology used by Lipper in providing expense group information, which includes using each fund’s contractual management fee schedule (including any applicable breakpoints) as reported in the most recent prospectus or statement of additional information for each fund in the expense group.
The Board also compared the Fund’s effective advisory fee rate (the advisory fee rate after advisory fee waivers and before other expense limitations/waivers) to the effective advisory fee rates of other funds advised by Invesco Advisers and its affiliates with investment strategies comparable to those of the Fund. The Board noted that the Fund’s rate was below the rate of one off-shore fund advised by Invesco Advisers.
The Board noted that Invesco Advisers and the Affiliated Sub-Advisers do not manage other client accounts with investment strategies comparable to those of the Fund.
The Board also considered the services provided by the Affiliated Sub-Advisers pursuant to the sub-advisory contracts, as well as the fees payable by Invesco Advisers to the Affiliated Sub-Advisers pursuant to the sub-advisory contracts. The Board noted that Invesco Advisers retains overall responsibility for, and provides services to, sub-advised Invesco Funds, including oversight of the Affiliated Sub-Advisers as well as the additional services described herein other than day-to-day portfolio management other than day-to-day portfolio management. The Board also noted that the sub-advisory fees are not paid directly by the Fund, but rather, are payable by Invesco Advisers to the Affiliated Sub-Advisers.
| D. | Economies of Scale and Breakpoints |
The Board considered the extent to which there are economies of scale in the provision of advisory services to the Fund. The Board also considered whether the Fund benefits from economies of scale through contractual breakpoints in the Fund’s advisory fee schedule. The Board also noted that the Fund shares directly in economies of scale through lower fees charged by third party service providers based on the combined size of the Invesco
Funds and other clients advised by Invesco Advisers.
| E. | Profitability and Financial Resources |
The Board reviewed information from Invesco Advisers concerning the costs of the advisory and other services that Invesco Advisers and its affiliates provide to the Fund and the Invesco Funds and the profitability of Invesco Advisers and its affiliates in providing these services. The Board received information from Invesco Advisers about the methodology used to prepare the profitability information. The Board noted that Invesco Advisers continues to operate at a net profit from services Invesco Advisers and its affiliates provide to the Invesco Funds and the Fund. The Board received and accepted information from Invesco Advisers demonstrating that Invesco Advisers and each Affiliated Sub-Adviser are financially sound and have the resources necessary to perform their obligations under the investment advisory agreement and sub-advisory contracts.
| F. | Collateral Benefits to Invesco Advisers and its Affiliates |
The Board considered various other benefits received by Invesco Advisers and its affiliates from the relationship with the Fund, including the fees received for providing transfer agency and distribution services to the Fund. The Board considered comparative information regarding fees charged for these services, including information provided by Lipper and other independent sources. The Board considered the performance of Invesco Advisers and its affiliates in providing these services and the organizational structure employed to provide these services. The Board also considered that these services are provided to the Fund pursuant to written contracts that are reviewed and approved on an annual basis by the Board; and that the services are required for the operation of the Fund.
The Board considered the benefits realized by Invesco Advisers and the Affiliated Sub-Advisers as a result of portfolio brokerage transactions executed through “soft dollar” arrangements. The Board noted that soft dollar arrangements shift the payment obligation for research services from Invesco Advisers and the Affiliated Sub-Advisers to the Invesco Funds and that the research received may be used with other clients of Invesco Advisers and may reduce Invesco Advisers’ and the Affiliated Sub-Advisers’ expenses. The Board also considered that it receives periodic reports from the Chief Compliance Officer of the Invesco Funds demonstrating that these arrangements are consistent with regulatory requirements. The Board did not deem the soft dollar arrangements to be inappropriate.
The Board considered that the Fund’s uninvested cash and cash collateral from any securities lending arrangements may be invested in money market funds advised by Invesco Advisers pursuant to procedures approved by the Board. The Board noted that Invesco Advisers receives advisory fees from these affiliated money market funds
attributable to such investments, although Invesco Advisers has contractually agreed to waive through varying periods the advisory fees payable by the Invesco Funds with respect to investments in the affiliated money market funds. The waiver is in an amount equal to 100% of the net advisory fee Invesco Advisers receives from the affiliated money market funds with respect to the Fund’s investment in the affiliated money market funds of uninvested cash, but not cash collateral. The Board concluded that the amount of advisory fees received by Invesco Advisors from the Fund’s investment of cash collateral from any securities lending arrangements in the affiliated money market funds is fair and reasonable.
The Board also considered the Fund may use an affiliated broker to execute certain trades for the Fund to among other things, control information leakage, and were advised that such trades would be executed in compliance with rules under the Investment Company Act of 1940, as amended, and consistent with best execution obligations.
23 Invesco Endeavor Fund
Tax Information
Form 1099-DIV, Form 1042-S and other year–end tax information provide shareholders with actual calendar year amounts that should be included in their tax returns. Shareholders should consult their tax advisors.
The following distribution information is being provided as required by the Internal Revenue Code or to meet a specific state’s requirement.
The Fund designates the following amounts or, if subsequently determined to be different, the maximum amount allowable for its fiscal year ended October 31, 2015:
| | | | |
Federal and State Income Tax | |
Long-Term Capital Gain Distributions | | $ | 41,188,086 | |
Qualified Dividend Income* | | | 99.91 | % |
Corporate Dividends Received Deduction* | | | 66.46 | % |
U.S. Treasury Obligations* | | | 0.00 | % |
| | * | The above percentages are based on ordinary income dividends paid to shareholders during the Fund’s fiscal year. |
| | | | |
Non-Resident Alien Shareholders | |
Qualified Short-Term Gains | | $ | 3,648,252 | |
24 Invesco Endeavor Fund
Trustees and Officers
The address of each trustee and officer is AIM Investment Funds (Invesco Investment Funds) (the “Trust”), 11 Greenway Plaza, Suite 1000, Houston, Texas 77046-1173. The trustees serve for the life of the Trust, subject to their earlier death, incapacitation, resignation, retirement or removal as more specifically provided in the Trust’s organizational documents. Each officer serves for a one year term or until their successors are elected and qualified. Column two below includes length of time served with predecessor entities, if any.
| | | | | | | | |
Name, Year of Birth and
Position(s) Held with the Trust | | Trustee and/
or Officer Since | | Principal Occupation(s)
During Past 5 Years | | Number of Funds in Fund Complex Overseen by Trustee | | Other Directorship(s) Held by Trustee During Past 5 Years |
| Interested Persons | | | | | | | | |
| Martin L. Flanagan1 — 1960 Trustee | | 2007 | | Executive Director, Chief Executive Officer and President, Invesco Ltd. (ultimate parent of Invesco and a global investment management firm); Advisor to the Board, Invesco Advisers, Inc. (formerly known as Invesco Institutional (N.A.), Inc.); Trustee, The Invesco Funds; Vice Chair, Investment Company Institute; and Member of Executive Board, SMU Cox School of Business Formerly: Chairman and Chief Executive Officer, Invesco Advisers, Inc. (registered investment adviser); Director, Chairman, Chief Executive Officer and President, IVZ Inc. (holding company), INVESCO Group Services, Inc. (service provider) and Invesco North American Holdings, Inc. (holding company); Director, Chief Executive Officer and President, Invesco Holding Company Limited (parent of Invesco and a global investment management firm); Director, Invesco Ltd.; Chairman, Investment Company Institute and President, Co-Chief Executive Officer, Co-President, Chief Operating Officer and Chief Financial Officer, Franklin Resources, Inc. (global investment management organization). | | 145 | | None |
Philip A. Taylor2 — 1954
Trustee, President and Principal Executive Officer | | 2006 | | Head of North American Retail and Senior Managing Director, Invesco Ltd.; Director, Co-Chairman, Co-President and Co-Chief Executive Officer, Invesco Advisers, Inc. (formerly known as Invesco Institutional (N.A.), Inc.) (registered investment adviser); Director, Chairman, Chief Executive Officer and President, Invesco Management Group, Inc. (formerly known as Invesco Aim Management Group, Inc.) (financial services holding company); Director and President, INVESCO Funds Group, Inc. (registered investment adviser and registered transfer agent); Director and Chairman, Invesco Investment Services, Inc. (formerly known as Invesco Aim Investment Services, Inc.) (registered transfer agent) and IVZ Distributors, Inc. (formerly known as INVESCO Distributors, Inc.) (registered broker dealer); Chief Executive Officer, Invesco Corporate Class Inc. (corporate mutual fund company) Director, Chairman and Chief Executive Officer, Invesco Canada Ltd. (formerly known as Invesco Trimark Ltd./Invesco Trimark Ltèe) (registered investment adviser and registered transfer agent); Trustee, President and Principal Executive Officer, The Invesco Funds (other than AIM Treasurer’s Series Trust (Invesco Treasurer’s Series Trust), Short-Term Investments Trust and Invesco Management Trust); Trustee and Executive Vice President, The Invesco Funds (AIM Treasurer’s Series Trust (Invesco Treasurer’s Series Trust), Short-Term Investments Trust and Invesco Management Trust only); Director, Invesco Investment Advisers LLC (formerly known as Van Kampen Asset Management); Director, Chief Executive Officer and President, Van Kampen Exchange Corp. Formerly: Director, President and Chairman, Invesco Inc. (holding company), Invesco Canada Holdings Inc. (holding company), Trimark Investments Ltd./Placements Trimark Ltèe and Invesco Financial Services Ltd/Services Financiers Invesco Ltèe; Chief Executive Officer, Invesco Canada Fund Inc (corporate mutual fund company); Director and Chairman, Van Kampen Investor Services Inc.; Director, Chief Executive Officer and President, 1371 Preferred Inc. (holding company) and Van Kampen Investments Inc.; Director and President, AIM GP Canada Inc. (general partner for limited partnerships) and Van Kampen Advisors, Inc.; Director and Chief Executive Officer, Invesco Trimark Dealer Inc. (registered broker dealer); Director, Invesco Distributors, Inc. (formerly known as Invesco Aim Distributors, Inc.) (registered broker dealer); Manager, Invesco PowerShares Capital Management LLC; Director, Chief Executive Officer and President, Invesco Advisers, Inc.; Director, Chairman, Chief Executive Officer and President, Invesco Aim Capital Management, Inc.; President, Invesco Trimark Dealer Inc. and Invesco Trimark Ltd./Invesco Trimark Ltèe; Director and President, AIM Trimark Corporate Class Inc. and AIM Trimark Canada Fund Inc.; Senior Managing Director, Invesco Holding Company Limited; Director and Chairman, Fund Management Company (former registered broker dealer); President and Principal Executive Officer, The Invesco Funds (AIM Treasurer’s Series Trust (Invesco Treasurer’s Series Trust), and Short-Term Investments Trust only); President, AIM Trimark Global Fund Inc. and AIM Trimark Canada Fund Inc.. | | 145 | | None |
| 1 | Mr. Flanagan is considered an interested person (within the meaning of Section 2(a)(19) of the 1940 Act) of the Trust because he is an officer of the Adviser to the Trust, and an officer and a director of Invesco Ltd., ultimate parent of the Adviser. |
| 2 | Mr. Taylor is considered an interested person (within the meaning of Section 2(a)(19) of the 1940 Act) of the Trust because he is an officer and a director of the Adviser. |
T-1 Invesco Endeavor Fund
Trustees and Officers—(continued)
| | | | | | | | |
Name, Year of Birth and Position(s) Held with the Trust | | Trustee and/ or Officer Since | | Principal Occupation(s) During Past 5 Years | | Number of Funds in Fund Complex Overseen by Trustee | | Other Directorship(s) Held by Trustee During Past 5 Years |
| Independent Trustees | | | | | | | | |
Bruce L. Crockett — 1944 Trustee and Chair | | 2003 | | Chairman, Crockett Technologies Associates (technology consulting company) Formerly: Director, Captaris (unified messaging provider); Director, President and Chief Executive Officer, COMSAT Corporation; Chairman, Board of Governors of INTELSAT (international communications company); ACE Limited (insurance company); Independent Directors Council and Investment Company Institute | | 145 | | ALPS (Attorneys Liability Protection Society) (insurance company) and Globe Specialty Metals, Inc. (metallurgical company) |
David C. Arch — 1945 Trustee | | 2010 | | Chairman of Blistex Inc., a consumer health care products manufacturer | | 145 | | Board member of the Illinois Manufacturers’ Association; Member of the Board of Visitors, Institute for the Humanities, University of Michigan; Member of the Audit Committee of the Edward-Elmhurst Hospital |
James T. Bunch — 1942 Trustee | | 2000 | | Managing Member, Grumman Hill Group LLC (family office/private equity investments) Formerly: Founder, Green Manning & Bunch Ltd. (investment banking firm) (1988-2010); Executive Committee, United States Golf Association; and Chairman, Board of Governors, Western Golf Association | | 145 | | Chairman of the Board of Trustees, Evans Scholars Foundation; and Chairman of the Board, Denver Film Society |
Rodney F. Dammeyer — 1940 Trustee | | 2010 | | Chairman of CAC, LLC, (private company offering capital investment and management advisory services) Formerly: Prior to 2001, Managing Partner at Equity Group Corporate Investments; Prior to 1995, Chief Executive Officer of Itel Corporation (formerly Anixter International); Prior to 1985, experience includes Senior Vice President and Chief Financial Officer of Household International, Inc., Executive Vice President and Chief Financial Officer of Northwest Industries, Inc. and Partner of Arthur Andersen & Co.; From 1987 to 2010, Director/Trustee of investment companies in the Van Kampen Funds complex | | 145 | | Director of Quidel Corporation and Stericycle, Inc. |
Albert R. Dowden — 1941 Trustee | | 2003 | | Director of a number of public and private business corporations, including the Boss Group, Ltd. (private investment and management); Nature’s Sunshine Products, Inc. and Reich & Tang Funds (5 portfolios) (registered investment company) Formerly: Director, Homeowners of America Holding Corporation/Homeowners of America Insurance Company (property casualty company); Director, Continental Energy Services, LLC (oil and gas pipeline service); Director, CompuDyne Corporation (provider of product and services to the public security market) and Director, Annuity and Life Re (Holdings), Ltd. (reinsurance company); Director, President and Chief Executive Officer, Volvo Group North America, Inc.; Senior Vice President, AB Volvo; Director of various public and private corporations; Chairman, DHJ Media, Inc.; Director, Magellan Insurance Company; and Director, The Hertz Corporation, Genmar Corporation (boat manufacturer), National Media Corporation; Advisory Board of Rotary Power International (designer, manufacturer, and seller of rotary power engines); and Chairman, Cortland Trust, Inc. (registered investment company) | | 145 | | Director of: Nature’s Sunshine Products, Inc., Reich & Tang Funds, Homeowners of America Holding Corporation/ Homeowners of America Insurance Company, the Boss Group |
Jack M. Fields — 1952 Trustee | | 2003 | | Chief Executive Officer, Twenty First Century Group, Inc. (government affairs company); Owner and Chief Executive Officer, Dos Angeles Ranch, L.P. (cattle, hunting, corporate entertainment); and Discovery Global Education Fund (non-profit) Formerly: Chief Executive Officer, Texana Timber LP (sustainable forestry company); Director of Cross Timbers Quail Research Ranch (non-profit); and member of the U.S. House of Representatives | | 145 | | Insperity, Inc. (formerly known as Administaff) |
Prema Mathai-Davis — 1950 Trustee | | 2003 | | Retired. Formerly: Chief Executive Officer, YWCA of the U.S.A. | | 145 | | None |
Larry Soll — 1942 Trustee | | 1997 | | Retired. Formerly: Chairman, Chief Executive Officer and President, Synergen Corp. (a biotechnology company) | | 145 | | None |
Hugo F. Sonnenschein — 1940 Trustee | | 2010 | | President Emeritus and Honorary Trustee of the University of Chicago and the Adam Smith Distinguished Service Professor in the Department of Economics at the University of Chicago. Prior to 2000, President of the University of Chicago | | 145 | | Trustee of the University of Rochester and a member of its investment committee; Member of the National Academy of Sciences and the American Philosophical Society; Fellow of the American Academy of Arts and Sciences |
Raymond Stickel, Jr. — 1944 Trustee | | 2005 | | Retired. Formerly: Director, Mainstay VP Series Funds, Inc. (25 portfolios) and Partner, Deloitte & Touche | | 145 | | None |
T-2 Invesco Endeavor Fund
Trustees and Officers—(continued)
| | | | | | | | |
Name, Year of Birth and Position(s) Held with the Trust | | Trustee and/ or Officer Since | | Principal Occupation(s) During Past 5 Years | | Number of Funds in Fund Complex Overseen by Trustee | | Other Directorship(s) Held by Trustee During Past 5 Years |
| Independent Trustees—(continued) |
Suzanne H. Woolsey — 1941 Trustee | | 2014 | | Chief Executive Officer of Woolsey Partners LLC | | 145 | | Emeritus Chair of the Board of Trustees of the Institute for Defense Analyses; Trustee of Colorado College; Trustee of California Institute of Technology; Prior to 2014, Director of Fluor Corp.; Prior to 2010, Trustee of the German Marshall Fund of the United States; Prior to 2010 Trustee of the Rocky Mountain Institute |
| Other Officers | | | | | | | | |
Russell C. Burk — 1958
Senior Vice President and Senior Officer | | 2005 | | Senior Vice President and Senior Officer, The Invesco Funds | | N/A | | N/A |
John M. Zerr — 1962
Senior Vice President, Chief Legal Officer and Secretary | | 2006 | | Director, Senior Vice President, Secretary and General Counsel, Invesco Management Group, Inc. (formerly known as Invesco Aim Management Group, Inc.) and Van Kampen Exchange Corp.; Senior Vice President, Invesco Advisers, Inc. (formerly known as Invesco Institutional (N.A.), Inc.) (registered investment adviser); Senior Vice President and Secretary, Invesco Distributors, Inc. (formerly known as Invesco Aim Distributors, Inc.); Director, Vice President and Secretary, Invesco Investment Services, Inc. (formerly known as Invesco Aim Investment Services, Inc.) and IVZ Distributors, Inc. (formerly known as INVESCO Distributors, Inc.); Director and Vice President, INVESCO Funds Group, Inc.; Senior Vice President, Chief Legal Officer and Secretary, The Invesco Funds; Managing Director, Invesco PowerShares Capital Management LLC; Director, Secretary and General Counsel, Invesco Investment Advisers LLC (formerly known as Van Kampen Asset Management); Secretary and General Counsel, Invesco Capital Markets, Inc. (formerly known as Van Kampen Funds Inc.) and Chief Legal Officer, PowerShares Exchange-Traded Fund Trust, PowerShares Exchange-Traded Fund Trust II, PowerShares India Exchange-Traded Fund Trust, PowerShares Actively Managed Exchange-Traded Fund Trust, and PowerShares Actively Managed Exchange-Traded Commodity Fund Trust Formerly: Director and Vice President, Van Kampen Advisors Inc.; Director, Vice President, Secretary and General Counsel, Van Kampen Investor Services Inc.; Director, Invesco Distributors, Inc. (formerly known as Invesco Aim Distributors, Inc.); Director, Senior Vice President, General Counsel and Secretary, Invesco Aim Advisers, Inc. and Van Kampen Investments Inc.; Director, Vice President and Secretary, Fund Management Company; Director, Senior Vice President, Secretary, General Counsel and Vice President, Invesco Aim Capital Management, Inc.; Chief Operating Officer and General Counsel, Liberty Ridge Capital, Inc. (an investment adviser); Vice President and Secretary, PBHG Funds (an investment company) and PBHG Insurance Series Fund (an investment company); Chief Operating Officer, General Counsel and Secretary, Old Mutual Investment Partners (a broker-dealer); General Counsel and Secretary, Old Mutual Fund Services (an administrator) and Old Mutual Shareholder Services (a shareholder servicing center); Executive Vice President, General Counsel and Secretary, Old Mutual Capital, Inc. (an investment adviser); and Vice President and Secretary, Old Mutual Advisors Funds (an investment company) | | N/A | | N/A |
Sheri Morris — 1964
Vice President, Treasurer and Principal Financial Officer | | 2003 | | Vice President, Treasurer and Principal Financial Officer, The Invesco Funds; Vice President, Invesco Advisers, Inc. (formerly known as Invesco Institutional (N.A.), Inc.) (registered investment adviser); and Vice President, PowerShares Exchange-Traded Fund Trust, PowerShares Exchange-Traded Fund Trust II, PowerShares India Exchange-Traded Fund Trust, PowerShares Actively Managed Exchange-Traded Fund Trust, and PowerShares Actively Managed Exchange-Traded Commodity Fund Trust Formerly: Vice President, Invesco Aim Advisers, Inc., Invesco Aim Capital Management, Inc. and Invesco Aim Private Asset Management, Inc.; Assistant Vice President and Assistant Treasurer, The Invesco Funds and Assistant Vice President, Invesco Advisers, Inc., Invesco Aim Capital Management, Inc. and Invesco Aim Private Asset Management, Inc.; and Treasurer, PowerShares Exchange-Traded Fund Trust, PowerShares Exchange-Traded Fund Trust II, PowerShares India Exchange-Traded Fund Trust and PowerShares Actively Managed Exchange-Traded Fund Trust | | N/A | | N/A |
T-3 Invesco Endeavor Fund
Trustees and Officers—(continued)
| | | | | | | | |
Name, Year of Birth and
Position(s) Held with the Trust | | Trustee and/
or Officer Since | | Principal Occupation(s)
During Past 5 Years | | Number of Funds in Fund Complex Overseen by Trustee | | Other Directorship(s) Held by Trustee During Past 5 Years |
| Other Officers—(continued) | | | | | | | | |
Karen Dunn Kelley — 1960
Vice President | | 2003 | | Senior Managing Director, Investments, Invesco Ltd.; Director, Co-President, Co-Chief Executive Officer, and Co-Chairman, Invesco Advisers, Inc. (formerly known as Invesco Institutional (N.A.), Inc.) (registered investment adviser); Chairman, Invesco Senior Secured Management, Inc.; Senior Vice President, Invesco Management Group, Inc. (formerly known as Invesco Aim Management Group, Inc.); Executive Vice President, Invesco Distributors, Inc. (formerly known as Invesco Aim Distributors, Inc.); Director, Invesco Mortgage Capital Inc. and Invesco Management Company Limited; Vice President, The Invesco Funds (other than AIM Treasurer’s Series Trust (Invesco Treasurer’s Series Trust), Short-Term Investments Trust and Invesco Management Trust); and President and Principal Executive Officer, The Invesco Funds (AIM Treasurer’s Series Trust (Invesco Treasurer’s Series Trust), Short-Term Investments Trust and Invesco Management Trust only) Formerly: Director and President, INVESCO Asset Management (Bermuda) Ltd., Director, INVESCO Global Asset Management Limited and INVESCO Management S.A.; Senior Vice President, Van Kampen Investments Inc. and Invesco Advisers, Inc. (formerly known as Invesco Institutional (N.A.), Inc.) (registered investment adviser); Vice President, Invesco Advisers, Inc. (formerly known as Invesco Institutional (N.A.), Inc.); Director of Cash Management and Senior Vice President, Invesco Advisers, Inc. and Invesco Aim Capital Management, Inc.; Director and President, Fund Management Company; Chief Cash Management Officer, Director of Cash Management, Senior Vice President, and Managing Director, Invesco Aim Capital Management, Inc.; Director of Cash Management, Senior Vice President, and Vice President, Invesco Advisers, Inc. and The Invesco Funds (AIM Treasurer’s Series Trust (Invesco Treasurer’s Series Trust), and Short-Term Investments Trust only) | | N/A | | N/A |
Crissie M. Wisdom — 1969 Anti-Money Laundering Compliance Officer | | 2013 | | Anti-Money Laundering Compliance Officer, Invesco Advisers, Inc. (formerly known as Invesco Institutional (N.A.), Inc.) (registered investment adviser), Invesco Capital Markets, Inc. (formerly known as Van Kampen Funds Inc.), Invesco Distributors, Inc., Invesco Investment Services, Inc., Invesco Management Group, Inc., Van Kampen Exchange Corp., The Invesco Funds, and PowerShares Exchange-Traded Fund Trust, PowerShares Exchange-Traded Fund Trust II, PowerShares India Exchange-Traded Fund Trust, PowerShares Actively Managed Exchange-Traded Fund Trust and PowerShares Actively Managed Exchange-Traded Commodity Fund Trust; Anti-Money Laundering Compliance Officer and Bank Secrecy Act Officer, INVESCO National Trust Company and Invesco Trust Company; and Fraud Prevention Manager and Controls and Risk Analysis Manager for Invesco Investment Services, Inc.. | | N/A | | N/A |
Lisa O. Brinkley — 1959 Chief Compliance Officer | | 2015 | | Senior Vice President and Chief Compliance Officer, Invesco Advisers, Inc. (registered investment adviser) (formerly known as Invesco Institutional (N.A., Inc.); and Chief Compliance Officer, The Invesco Funds Formerly: Global Assurance Officer, Invesco Ltd. and Vice President, The Invesco Funds; Chief Compliance Officer, Invesco Distributors, Inc. (formerly known as Invesco Aim Distributors, Inc.), Invesco Investment Services, Inc.(formerly known as Invesco Aim Investment Services, Inc.) and Van Kampen Investor Services Inc.; Senior Vice President, Invesco Management Group, Inc.; Senior Vice President and Chief Compliance Officer, Invesco Advisers, Inc. and The Invesco Funds; Vice President and Chief Compliance Officer, Invesco Aim Capital Management, Inc. and Invesco Distributors, Inc.; Vice President, Invesco Investment Services, Inc. and Fund Management Company. | | N/A | | N/A |
The Statement of Additional Information of the Trust includes additional information about the Fund’s Trustees and is available upon request, without charge, by calling 1.800.959.4246. Please refer to the Fund’s prospectus for information on the Fund’s sub-advisers.
| | | | | | |
Office of the Fund 11 Greenway Plaza, Suite 1000 Houston, TX 77046-1173 | | Investment Adviser Invesco Advisers, Inc. 1555 Peachtree Street, N.E. Atlanta, GA 30309 | | Distributor
Invesco Distributors, Inc. 11 Greenway Plaza, Suite 1000 Houston, TX 77046-1173 | | Auditors PricewaterhouseCoopers LLP 1000 Louisiana Street, Suite 5800 Houston, TX 77002-5678 |
| | | |
| | | | | | |
Counsel to the Fund Stradley Ronon Stevens & Young, LLP 2005 Market Street, Suite 2600 Philadelphia, PA 19103-7018 | | Counsel to the Independent Trustees Goodwin Procter LLP 901 New York Avenue, N.W. Washington, D.C. 20001 | | Transfer Agent Invesco Investment Services, Inc. 11 Greenway Plaza, Suite 1000 Houston, TX 77046-1173 | | Custodian State Street Bank and Trust Company 225 Franklin Street Boston, MA 02110-2801 |
T-4 Invesco Endeavor Fund

Invesco mailing information
Send general correspondence to Invesco Investment Services, Inc., P.O. Box 219078, Kansas City, MO 64121-9078.
Important notice regarding delivery of security holder documents
To reduce Fund expenses, only one copy of most shareholder documents may be mailed to shareholders with multiple accounts at the same address (Householding). Mailing of your shareholder documents may be householded indefinitely unless you instruct us otherwise. If you do not want the mailing of these documents to be combined with those for other members of your household, please contact Invesco Investment Services, Inc. at 800 959 4246 or contact your financial institution. We will begin sending you individual copies for each account within 30 days after receiving your request.
Fund holdings and proxy voting information
The Fund provides a complete list of its holdings four times in each fiscal year, at the quarter ends. For the second and fourth quarters, the lists appear in the Fund’s semiannual and annual reports to shareholders. For the first and third quarters, the Fund files the lists with the Securities and Exchange Commission (SEC) on Form N-Q. The most recent list of portfolio holdings is available at invesco.com/completeqtrholdings. Shareholders can also look up the Fund’s Forms N-Q on the SEC website at sec.gov. Copies of the Fund’s Forms N-Q may be reviewed and copied at the SEC Public Reference Room in Washington, D.C. You can obtain information on the operation of the Public Reference Room, including information about duplicating fee charges, by calling 202 551 8090 or 800 732 0330, or by electronic request at the following email address: publicinfo@sec.gov. The SEC file numbers for the Fund are shown below.
A description of the policies and procedures that the Fund uses to determine how to vote proxies relating to portfolio securities is available without charge, upon request, from our Client Services department at 800 959 4246 or at invesco.com/proxyguidelines. The information is also available on the SEC website, sec.gov.
| | |
Information regarding how the Fund voted proxies related to its portfolio securities during the most recent 12-month period ended June 30 is available at invesco.com/proxysearch. The information is also available on the SEC website, sec.gov. Invesco Advisers, Inc. is an investment adviser; it provides investment advisory services to individual and institutional clients and does not sell securities. Invesco Distributors, Inc. is the US distributor for Invesco Ltd.’s retail mutual funds, exchange-traded funds and institutional money market funds. Both are wholly owned, indirect subsidiaries of Invesco Ltd. | |  |
| | | | |
| SEC file numbers: 811-05426 and 033-19338 | | END-AR-1 | | Invesco Distributors, Inc. |
| | | | |
| | |
 | | Annual Report to Shareholders | | October 31, 2015 |
| | |
| | Invesco Global Health Care Fund |
| | Nasdaq: |
| | A: GGHCX n B: GTHBX n C: GTHCX n Y: GGHYX n Investor: GTHIX: |

Letters to Shareholders
| | | | |

Philip Taylor | | | | Dear Shareholders: This annual report includes information about your Fund, including performance data and a complete list of its investments as of the close of the reporting period. Inside is a discussion of how your Fund was managed and the factors that affected its performance during the reporting period. I hope you find this report of interest. The US economy expanded and unemployment declined throughout the reporting period. Continuing low energy prices benefited consumers, but a strong US dollar crimped corporate profits. The US Federal Reserve signaled that it was increasingly likely to raise interest rates, based on generally positive economic data, but uncertainty remained about when it might act. Overseas, the story was much different. Low energy prices hurt the economies of some oil-producing nations, such as Brazil and Russia. During the reporting period, the European Central |
Bank as well as central banks in China and Japan – among other countries – either instituted or maintained extraordinarily accommodative monetary policies in response to economic weakness.
Investor uncertainty, such as we saw for much of the reporting period – and market volatility, such as we saw at the end of the reporting period – are unfortunate facts of life when it comes to investing. Some investors use these things as excuses to delay saving and investing for their long-term financial goals. That’s why Invesco encourages investors to work with a professional financial adviser who can stress the importance of starting to save and invest early and the importance of adhering to a disciplined investment plan – when times are good and when they’re uncertain. A financial adviser who knows your unique financial situation, investment goals and risk tolerance can be an invaluable partner as you seek to achieve your financial goals. He or she can offer a long-term perspective when markets are volatile and time-tested advice and guidance when your financial situation or investment goals change.
Timely information when and where you want it
Invesco’s efforts to help investors achieve their financial objectives include providing individual investors and financial professionals with timely information about the markets, the economy and investing – whenever and wherever they want it.
Our website, invesco.com/us, offers a wide range of market insights and investment perspectives. On the website, you’ll find detailed information about our funds, including prices, performance, holdings and portfolio manager commentaries. You can access information about your account by completing a simple, secure online registration. Click on the “Need to register” link in the “Account Access” box on our homepage to get started.
Invesco’s mobile apps for iPhone® and iPad® (both available free from the App StoreSM) allow you to obtain the same detailed information, monitor your account and create customizable watch lists. Also, they allow you to access investment insights from our investment leaders, market strategists, economists and retirement experts. You can sign up to be alerted when new commentary is added, and you can watch portfolio manager videos and have instant access to Invesco news and updates wherever you may be.
In addition to the resources accessible on our website and through our mobile app, you can obtain timely updates to help you stay informed about the markets, the economy and investing by connecting with Invesco on Twitter, LinkedIn or Facebook. You can access our blog at blog.invesco.us.com. Our goal is to provide you the information you want, when and where you want it.
Have questions?
For questions about your account, feel free to contact an Invesco client services representative at 800 959 4246. For Invesco-related questions or comments, please email me directly at phil@invesco.com.
All of us at Invesco look forward to serving your investment management needs for many years to come. Thank you for investing with us.
Sincerely,

Philip Taylor
Senior Managing Director, Invesco Ltd.
iPhone and iPad are trademarks of Apple Inc., registered in the US and other countries. App Store is a service mark of Apple Inc. Invesco Distributors, Inc. is not affiliated with Apple Inc.
2 Invesco Global Health Care Fund
| | | | | | |

Bruce Crockett | | | | Dear Fellow Shareholders: Among the many important lessons I’ve learned in more than 40 years in a variety of business endeavors is the value of a trusted advocate. As independent chair of the Invesco Funds Board, I can assure you that the members of the Board are strong advocates for the interests of investors in Invesco’s mutual funds. We work hard to represent your interests through oversight of the quality of the investment management services your funds receive and other matters important to your investment, including but not limited to: |
| | | | n | | Ensuring that Invesco offers a diverse lineup of mutual funds that your financial adviser can use to strive to meet your financial needs as your investment goals change over time. |
| | | | n | | Monitoring how the portfolio management teams of the Invesco funds are performing in light of changing economic and market conditions. |
| n | | Assessing each portfolio management team’s investment performance within the context of the investment strategy described in the fund’s prospectus. |
| n | | Monitoring for potential conflicts of interests that may impact the nature of the services that your funds receive. |
We believe one of the most important services we provide our fund shareholders is the annual review of the funds’ advisory and sub-advisory contracts with Invesco Advisers and its affiliates. This review is required by the Investment Company Act of 1940 and focuses on the nature and quality of the services Invesco provides as the adviser to the Invesco funds and the reasonableness of the fees that it charges for those services. Each year, we spend months carefully reviewing information received from Invesco and a variety of independent sources, such as performance and fee data prepared by Lipper Inc., an independent, third-party firm widely recognized as a leader in its field. We also meet with our independent legal counsel and other independent advisers to review and help us assess the information that we have received. Our goal is to assure that you receive quality investment management services for a reasonable fee.
I trust the measures outlined above provide assurance that you have a worthy advocate when it comes to choosing the Invesco Funds.
As always, please contact me at bruce@brucecrockett.com with any questions or concerns you may have. On behalf of the Board, we look forward to continuing to represent your interests and serving your needs.
Sincerely,

Bruce L. Crockett
Independent Chair
Invesco Funds Board of Trustees
3 Invesco Global Health Care Fund
Management’s Discussion of Fund Performance
| | | | | |
Performance summary For the fiscal year ended October 31, 2015, Class A shares of Invesco Global Health Care Fund (the Fund), at net asset value (NAV), underperformed the MSCI World Health Care Index, the Fund’s style-specific benchmark. Your Fund’s long-term performance appears later in this report. |
| | | | | |
Fund vs. Indexes Total returns, 10/31/14 to 10/31/15, at net asset value (NAV). Performance shown does not include applicable contingent deferred sales charges (CDSC) or front-end sales charges, which would have reduced performance. |
| | | | | |
| Class A Shares | | | | 3.59 | % |
| Class B Shares | | | | 2.82 | |
| Class C Shares | | | | 2.78 | |
| Class Y Shares | | | | 3.82 | |
| Investor Class Shares | | | | 3.59 | |
| MSCI World Index▼ (Broad Market Index) | | | | 1.77 | |
| MSCI World Health Care Index▼ (Style-Specific Index) | | | | 6.29 | |
| Lipper Global Health/Biotechnology Funds Index¡ (Peer Group Index) | | | | 9.23 | |
Source(s): ▼FactSet Research Systems Inc.; ¡Lipper Inc. | | | | | |
Market conditions and your Fund
Global markets experienced increased volatility during the fiscal year ended October 31, 2015, driven largely by the continued slowdown in energy markets and the economic downturn in China. Developed markets were generally able to withstand these headwinds as more fragile emerging markets began to falter.
As the reporting period began in late 2014, global equity markets moved higher, although economic growth appeared to be somewhat stronger in the US than in the rest of the world. Equity markets globally were recovering from the initial crash of oil prices when OPEC added additional uncertainty by deciding to maintain high production despite low prices and slowing global growth. In this environment, commodity-based economies and most currencies underperformed those of the US.
Global markets were rattled amid growing concerns that Greece and the eurozone would fail to reach an agreement on a financial bailout plan. However, those fears subsided when a bailout was ultimately approved.
The eurozone also benefited from generally positive economic data, which helped markets weather subsequent economic volatility.
In the summer of 2015, fears of a potential economic slowdown in China dominated headlines. The combination of a slowing Chinese economy, a sharp sell-off in domestic Chinese equities and the devaluation of China’s currency contributed to a strong correction in global equity markets. Emerging markets, in particular, were significantly hit by events in China and by continued weak commodity prices – as well as by the US Federal Reserve’s decision to delay raising interest rates, which increased investor uncertainty and market volatility.
Though most of the major US equity market indexes delivered gains, global indexes were mixed, as developed market equities outperformed emerging market equities. Six of the 10 sectors of the MSCI World Index, the Fund’s broad market benchmark, had positive returns. The consumer discretionary sector had the highest return, while the energy sector had a double-digit loss for the reporting period. Within the broad market index, the health care sector also posted gains.
In the fall of 2015, the health care sector experienced significant pressure as US presidential candidates and a series of press articles focused attention on drug pricing and price increases. This caused a selloff particularly in the biotechnology and specialty pharmaceutical industries. Relative to the Fund’s style-specific index and on an absolute basis, the biotechnology and pharmaceuticals industries were the largest contributors to Fund performance. The Fund’s drug retail holdings also benefited Fund performance.
The top individual contributor to the Fund’s return was Incyte, a biopharmaceutical firm focused primarily on oncology drugs. During the reporting period, the company reported strong sales of Jakafi, its drug used to treat a rare bone marrow disorder.
Another strong contributor to Fund results was Salix Pharmaceuticals (not held at the end of the reporting period), a company that specializes in developing and marketing products for the prevention and treatment of gastrointestinal disorders. Reflecting an ongoing trend towards consolidation within the health care sector, Valeant (not a fund holding) acquired Salix in April for approximately $11 billion.
On the negative side, the Fund’s underperformance was largely attributable to stock selection and an overweight position in the health care facilities industry versus its style-specific benchmark. Within the industry, a number of holdings were among the Fund’s largest detractors, including hospital operators, Community Health Systems and Tenet Healthcare. Both companies reported declining profits and weaker earnings as the initial benefits from the Affordable Care Act waned, and the rate of uninsured admissions increased.
Stock selection in the health care equipment industry, and stock selection
| | | | | |
Portfolio Composition | |
By sector | | | | % of total net assets | |
| | | | | |
| |
| Health Care | | | | 97.3 | % |
| Consumer Staples | | | | 1.2 | |
| Industrials | | | | 0.1 | |
Money Market Funds Plus Other Assets Less Liabilities | | | | 1.4 | |
| | | | | | | | | |
Top 10 Equity Holdings* |
| | | | % of total net assets | | |
| | | | | | | | | |
| 1. | | Allergan PLC | | | | 5.3 | % |
| 2. | | Shire PLC-ADR | | | | 4.5 | |
| 3. | | Biogen Inc. | | | | 4.1 | |
| 4. | | Roche Holding AG | | | | 4.1 | |
| 5. | | Merck & Co., Inc. | | | | 3.8 | |
| 6. | | Celgene Corp. | | | | 3.0 | |
| 7. | | AbbVie Inc. | | | | 2.8 | |
| 8. | | Bristol-Myers Squibb Co. | | | | 2.7 | |
| 9. | | Sanofi-ADR | | | | 2.5 | |
| 10. | | Incyte Corp. | | | | 2.5 | |
| | | | | |
Total Net Assets | | | | $1.9 billion | |
| | | | | |
| |
Total Number of Holdings* | | | | 77 | |
The Fund’s holdings are subject to change, and there is no assurance that the Fund will continue to hold any particular security.
*Excluding money market fund holdings.
Data presented here are as of October 31, 2015.
4 Invesco Global Health Care Fund
and an underweight allocation in the health care services and managed care industries also detracted from Fund results during the reporting period.
During the reporting period, we used currency forward contracts to hedge currency exposure of non-US-based companies held in the Fund. We used derivatives solely for hedging and not for speculative purposes or leverage. The use of currency forward contracts had a positive impact on the Fund’s performance relative to the Fund’s style-specific benchmark. This was primarily due to the continued strength of the US dollar relative to many major foreign currencies.
During the reporting period, we reduced our exposure to the health care facilities, health care equipment, and health care distributors industries, and we increased our exposure to the biotechnology and pharmaceutical industries. The large-cap pharmaceuticals industry was the Fund’s largest industry exposure, but we maintained an underweight allocation in the industry compared to the Fund’s style-specific benchmark. The Fund’s largest overweight position was in the biotechnology industry.
We continue to emphasize specialty pharmaceuticals and biotechnology stocks based on generally robust product portfolios, strong development pipelines and our view that many of these companies could be targets for acquisition. We remain primarily focused on companies with new product cycles, less reimbursement risk and less competition.
At the end of the reporting period, the Fund was primarily invested in US stocks, and the Fund’s non-US allocation was focused mainly on European large-cap pharmaceuticals, which had fewer patent expiration concerns than their US counterparts.
As always, thank you for your continued investment in Invesco Global Health Care Fund.
The views and opinions expressed in management’s discussion of Fund performance are those of Invesco Advisers, Inc. These views and opinions are subject to change at any time based on factors such as market and economic conditions. These views and opinions may not be relied upon as investment advice or recommendations, or as an offer for a particular security. The information is not a complete analysis of every aspect of any market, country, industry, security or the Fund. Statements of fact are from sources considered reliable, but Invesco Advisers, Inc. makes no representation or warranty as to their completeness or accuracy. Although historical performance is no guarantee of future results, these insights may help you understand our investment management philosophy.
See important Fund and, if applicable, index disclosures later in this report.
| | |
 | | Derek Taner Chartered Financial Analyst, Portfolio Manager, is manager of Invesco Global Health Care Fund. He joined Invesco in 2005. |
| Mr. Taner earned a BS in business administration with an emphasis in accounting and finance and an MBA from the University of California, Berkeley Haas School of Business. |
5 Invesco Global Health Care Fund
Your Fund’s Long-Term Performance
Results of a $10,000 Investment — Oldest Share Class(es)
Fund and index data from 10/31/05
Past performance cannot guarantee comparable future results.
The data shown in the chart include reinvested distributions, applicable sales charges and Fund expenses including
management fees. Index results include reinvested dividends, but they do not reflect sales charges. Performance of the peer group, if applicable, reflects fund expenses and management fees;
performance of a market index does not. Performance shown in the chart and table(s) does not reflect deduction of taxes a shareholder would pay on Fund distributions or sale of Fund shares.
continued from page 8
less publicly available information about the issuer. They also may be illiquid or restricted as to resale, or may trade less frequently and in smaller volumes, all of which may cause difficulty when establishing or closing a position at a desirable price.
About indexes used in this report
| n | | The MSCI World Index is an unmanaged index considered representative of stocks of developed countries. The index is computed using the net return, which withholds applicable taxes for non-resident investors. |
| n | | The MSCI World Health Care Index is an unmanaged index considered representative of health care stocks of developed countries. The index is computed using the net return, which withholds applicable taxes for non-resident investors. |
| n | | The Lipper Global Health/Biotechnology Funds Index is an unmanaged index considered representative of global health/biotechnology funds tracked by Lipper. |
| n | | The Fund is not managed to track the performance of any particular index, including the index(es) described here, and consequently, the performance of the Fund may deviate significantly from the performance of the index(es). |
| n | | A direct investment cannot be made in an index. Unless otherwise indicated, index results include reinvested dividends, and they do not reflect sales charges. Performance of the peer group, if applicable, reflects fund expenses; performance of a market index does not. |
Other information
| n | | The returns shown in management’s discussion of Fund performance are based on net asset values (NAVs) calculated for shareholder transactions. Generally accepted accounting principles require adjustments to be made to the net assets of the Fund at period end for financial reporting purposes, and as such, the NAVs for shareholder transactions and the returns based on those NAVs may differ from the NAVs and returns reported in the Financial Highlights. |
| n | | Industry classifications used in this report are generally according to the Global Industry Classification Standard, which was developed by and is the exclusive property and a service mark of MSCI Inc. and Standard & Poor’s. |
6 Invesco Global Health Care Fund
| | | | | |
| Average Annual Total Returns |
| As of 10/31/15, including maximum applicable sales charges |
| | | | | |
| |
Class A Shares | | | | | |
| Inception (8/7/89) | | | | 11.21 | % |
| 10 Years | | | | 9.20 | |
| 5 Years | | | | 16.26 | |
| 1 Year | | | | -2.11 | |
| |
| Class B Shares | | | | | |
| Inception (4/1/93) | | | | 11.50 | % |
| 10 Years | | | | 9.16 | |
| 5 Years | | | | 16.47 | |
| 1 Year | | | | -1.65 | |
| |
| Class C Shares | | | | | |
| Inception (3/1/99) | | | | 8.86 | % |
| 10 Years | | | | 8.99 | |
| 5 Years | | | | 16.69 | |
| 1 Year | | | | 1.89 | |
| |
| Class Y Shares | | | | | |
| 10 Years | | | | 10.01 | % |
| 5 Years | | | | 17.87 | |
| 1 Year | | | | 3.82 | |
| |
| Investor Class Shares | | | | | |
| Inception (7/15/05) | | | | 9.77 | % |
| 10 Years | | | | 9.82 | |
| 5 Years | | | | 17.57 | |
| 1 Year | | | | 3.59 | |
| | | | | |
| Average Annual Total Returns |
| As of 9/30/15, the most recent calendar quarter end, including maximum applicable sales charges |
| | | | | |
| |
| Class A Shares | | | | | |
| Inception (8/7/89) | | | | 11.04 | % |
| 10 Years | | | | 8.43 | |
| 5 Years | | | | 15.68 | |
| 1 Year | | | | -3.56 | |
| |
| Class B Shares | | | | | |
| Inception (4/1/93) | | | | 11.31 | % |
| 10 Years | | | | 8.39 | |
| 5 Years | | | | 15.90 | |
| 1 Year | | | | -3.13 | |
| |
| Class C Shares | | | | | |
| Inception (3/1/99) | | | | 8.60 | % |
| 10 Years | | | | 8.23 | |
| 5 Years | | | | 16.12 | |
| 1 Year | | | | 0.39 | |
| |
| Class Y Shares | | | | | |
| 10 Years | | | | 9.23 | % |
| 5 Years | | | | 17.29 | |
| 1 Year | | | | 2.30 | |
| |
| Investor Class Shares | | | | | |
| Inception (7/15/05) | | | | 9.34 | % |
| 10 Years | | | | 9.04 | |
| 5 Years | | | | 17.00 | |
| 1 Year | | | | 2.05 | |
Class Y shares incepted on October 3, 2008. Performance shown prior to that date is that of Class A shares and includes the 12b-1 fees applicable to Class A shares.
The performance data quoted represent past performance and cannot guarantee comparable future results; current performance may be lower or higher. Please visit invesco.com/performance for the most recent month-end performance. Performance figures reflect reinvested distributions, changes in net asset value and the effect of the maximum sales charge unless otherwise stated. Investment return and principal value will fluctuate so that you may have a gain or loss when you sell shares.
The net annual Fund operating expense ratio set forth in the most recent Fund prospectus as of the date of this report for Class A, Class B, Class C, Class Y and Investor Class shares was 1.08%,1.83%, 1.83%, 0.83% and 1.08%, respectively.1 The total annual Fund operating expense ratio set forth in the most recent Fund prospectus as of the date of this report for Class A, Class B, Class C, Class Y and Investor Class shares was
1.09%,1.84%, 1.84%, 0.84% and 1.09%, respectively. The expense ratios presented above may vary from the expense ratios presented in other sections of this report that are based on expenses incurred during the period covered by this report.
Class A share performance reflects the maximum 5.50% sales charge, and Class B and Class C share performance reflects the applicable contingent deferred sales charge (CDSC) for the period involved. The CDSC on Class B shares declines from 5% beginning at the time of purchase to 0% at the beginning of the seventh year. The CDSC on Class C shares is 1% for the first year after purchase. Class Y shares and Investor Class shares do not have a front-end sales charge or a CDSC; therefore, performance is at net asset value.
The performance of the Fund’s share classes will differ primarily due to different sales charge structures and class expenses.
Fund performance reflects any applicable fee waivers and/or expense reimbursements. Had the adviser not waived fees and/or reimbursed
expenses currently or in the past, returns would have been lower. See current prospectus for more information.
| 1 | Total annual Fund operating expenses after any contractual fee waivers and/or expense reimbursements by the adviser in effect through at least June 30, 2017. See current prospectus for more information. |
7 Invesco Global Health Care Fund
Invesco Global Health Care Fund’s investment objective is long-term growth of capital.
| n | | Unless otherwise stated, information presented in this report is as of October 31, 2015, and is based on total net assets. |
| n | | Unless otherwise noted, all data provided by Invesco. |
| n | | To access your Fund’s reports/prospectus, visit invesco.com/fundreports. |
About share classes
| n | | Class B shares may not be purchased for new or additional investments. Please see the prospectus for more information. |
| n | | Class Y shares are available only to certain investors. Please see the prospectus for more information. |
| n | | Investor Class shares are closed to new investors. Contact your financial adviser about purchasing our other share classes. Please see the prospectus for more information. |
Principal risks of investing in the Fund
| n | | Convertible securities risk. The Fund may own convertible securities, the value of which may be affected by market interest rates, the risk that the issuer will default, the value of the underlying stock or the right of the issuer to buy back the convertible securities. |
| n | | Depositary receipts risk. Depositary receipts involve many of the same risks as those associated with direct investment in foreign securities. In addition, the underlying issuers of certain depositary receipts, particularly unsponsored or unregistered depositary receipts, are under no obligation to distribute shareholder communications to the holders of such receipts or to pass through to them any voting rights with respect to the deposited securities. |
| n | | Derivatives risk. The value of a derivative instrument depends largely on (and is derived from) the value of an underlying security, currency, commodity, interest rate, index or other asset (each referred to as an underlying asset). In addition to risks relating to the underlying assets, the use of derivatives may include other, possibly greater, risks, including counterparty, leverage and liquidity risks. Counter-party risk is the risk that the counter-party to the derivative contract will default on its obligation to pay the Fund the amount owed or otherwise perform under the derivative contract. Derivatives create leverage risk because they do not require payment up front equal to the economic exposure created by owning the derivative. As a result, an adverse change in the value of the underlying asset could result in the |
| | | Fund sustaining a loss that is substantially greater than the amount invested in the derivative, which may make the Fund’s returns more volatile and increase the risk of loss. Derivative instruments may also be less liquid than more traditional investments and the Fund may be unable to sell or close out its derivative positions at a desirable time or price. This risk may be more acute under adverse market conditions, during which the Fund may be most in need of liquidating its derivative positions. Derivatives may also be harder to value, less tax efficient and subject to changing government regulation that could impact the Fund’s ability to use certain derivatives or their cost. Also, derivatives used for hedging or to gain or limit exposure to a particular market segment may not provide the expected benefits, particularly during adverse market conditions. |
| n | | Developing/emerging markets securities risk. The prices of securities issued by foreign companies and governments located in developing/emerging markets countries may be affected more negatively by inflation, devaluation of their currencies, higher transaction costs, delays in settlement, adverse political developments, the introduction of capital controls, withholding taxes, nationalization of private assets, expropriation, social unrest, war or lack of timely information than those in developed countries. |
| n | | Foreign securities risk. The Fund’s foreign investments may be affected by changes in a foreign country’s exchange rates, political and social instability, changes in economic or taxation policies, difficulties when enforcing obligations, decreased liquidity, and increased volatility. Foreign companies may be subject to less regulation resulting in less publicly available information about the companies. |
| n | | Geographic focus risk. From time to time the Fund may invest a substantial amount of its assets in securities of issuers located in a single country or a limited number of countries. If the Fund focuses its investments in this manner, |
| | | it assumes the risk that economic, political and social conditions in those countries will have a significant impact on its investment performance. The Fund’s investment performance may also be more volatile if it focuses its investments in certain countries, especially emerging markets countries. |
| n | | Health care sector risk. The Fund will concentrate its investments in the securities of domestic and foreign issuers in the health care industry. The Fund’s performance is vulnerable to factors affecting the health care industry, including government regulation, obsolescence caused by scientific advances and technological innovations. |
| n | | Management risk. The investment techniques and risk analysis used by the Fund’s portfolio managers may not produce the desired results. |
| n | | Market risk. The prices of and the income generated by the Fund’s securities may decline in response to, among other things, investor sentiment, general economic and market conditions, regional or global instability, and currency and interest rate fluctuations. |
| n | | Preferred securities risk. Preferred securities may include provisions that permit the issuer, in its discretion, to defer or omit distributions for a certain period of time. If the Fund owns a security that is deferring or omitting its distributions, the Fund may be required to report the distribution on its tax returns, even though it may not have received this income. Further, preferred securities may lose substantial value due to the omission or deferment of dividend payments. |
| n | | Small- and mid-capitalization risks. Stocks of small- and mid-sized companies tend to be more vulnerable to adverse developments and may have little or no operating history or track record of success, and limited product lines, markets, management and financial resources. The securities of small- and mid-sized companies may be more volatile due to less market interest and |
continued on page 6
|
| This report must be accompanied or preceded by a currently effective Fund prospectus, which contains more complete information, including sales charges and expenses. Investors should read it carefully before investing. |
NOT FDIC INSURED | MAY LOSE VALUE | NO BANK GUARANTEE
8 Invesco Global Health Care Fund
Schedule of Investments(a)
October 31, 2015
| | | | | | | | |
| | | Shares | | | Value | |
Common Stocks & Other Equity Interests–98.56% | |
| Biotechnology–32.39% | |
AbbVie Inc. | | | 863,687 | | | $ | 51,432,561 | |
ACADIA Pharmaceuticals Inc.(b) | | | 322,242 | | | | 11,220,467 | |
Alder Biopharmaceuticals, Inc.(b) | | | 378,389 | | | | 12,100,880 | |
Alexion Pharmaceuticals, Inc.(b) | | | 167,191 | | | | 29,425,616 | |
AMAG Pharmaceuticals, Inc.(b) | | | 206,470 | | | | 8,258,800 | |
Amgen Inc. | | | 289,502 | | | | 45,793,427 | |
Atara Biotherapeutics Inc.(b) | | | 73,921 | | | | 1,904,944 | |
Biogen Inc. (b) | | | 259,318 | | | | 75,334,472 | |
BioMarin Pharmaceutical Inc.(b) | | | 347,028 | | | | 40,616,157 | |
Bluebird Bio, Inc.(b) | | | 149,755 | | | | 11,550,603 | |
Celgene Corp. (b) | | | 450,131 | | | | 55,235,575 | |
DBV Technologies S.A.–ADR (France)(b) | | | 525,061 | | | | 18,203,865 | |
Dyax Corp.(b) | | | 425,368 | | | | 11,710,381 | |
Evolutionary Genomics, Inc.(b)(c) | | | 9,944 | | | | 29,060 | |
Flexion Therapeutics, Inc.(b) | | | 270,244 | | | | 4,453,621 | |
Gilead Sciences, Inc. | | | 275,056 | | | | 29,741,805 | |
Heron Therapeutics, Inc.(b) | | | 604,076 | | | | 16,563,764 | |
Incyte Corp.(b) | | | 393,175 | | | | 46,209,858 | |
Medivation Inc.(b) | | | 453,814 | | | | 19,087,417 | |
Neurocrine Biosciences, Inc.(b) | | | 246,537 | | | | 12,102,501 | |
Prothena Corp. PLC (Ireland)(b) | | | 174,016 | | | | 8,963,564 | |
REGENXBIO Inc.(b) | | | 201,684 | | | | 3,118,035 | |
Sarepta Therapeutics, Inc.(b) | | | 297,865 | | | | 7,166,632 | |
Spark Therapeutics, Inc.(b) | | | 234,287 | | | | 12,628,069 | |
Synergy Pharmaceuticals, Inc.(b) | | | 1,432,859 | | | | 9,184,626 | |
United Therapeutics Corp.(b) | | | 71,093 | | | | 10,424,367 | |
Vanda Pharmaceuticals Inc.(b) | | | 217,399 | | | | 2,334,865 | |
Vertex Pharmaceuticals Inc.(b) | | | 368,457 | | | | 45,961,326 | |
| | | | | | | | 600,757,258 | |
|
| Drug Retail–1.16% | |
Raia Drogasil S.A. (Brazil) | | | 945,978 | | | | 9,814,160 | |
Rite Aid Corp.(b) | | | 1,473,665 | | | | 11,612,480 | |
| | | | | | | | 21,426,640 | |
|
| Health Care Distributors–1.85% | |
Cardinal Health, Inc. | | | 226,456 | | | | 18,614,683 | |
McKesson Corp. | | | 88,248 | | | | 15,778,743 | |
| | | | | | | | 34,393,426 | |
|
| Health Care Equipment–3.79% | |
Olympus Corp. (Japan) | | | 717,200 | | | | 24,095,215 | |
ResMed Inc. | | | 418,830 | | | | 24,128,796 | |
Wright Medical Group N.V.(b) | | | 1,140,738 | | | | 22,050,466 | |
| | | | | | | | 70,274,477 | |
|
| Health Care Facilities–4.08% | |
Brookdale Senior Living Inc.(b) | | | 723,058 | | | | 15,119,143 | |
Community Health Systems Inc.(b) | | | 252,125 | | | | 7,069,585 | |
HCA Holdings, Inc.(b) | | | 412,007 | | | | 28,341,961 | |
| | | | | | | | |
| | | Shares | | | Value | |
| Health Care Facilities–(continued) | |
Tenet Healthcare Corp.(b) | | | 147,173 | | | $ | 4,616,817 | |
Universal Health Services, Inc.–Class B | | | 167,720 | | | | 20,476,935 | |
| | | | | | | | 75,624,441 | |
|
| Health Care Services–2.43% | |
Air Methods Corp.(b) | | | 309,568 | | | | 12,670,618 | |
Express Scripts Holding Co.(b) | | | 364,270 | | | | 31,465,643 | |
InnovaCare Inc. (Puerto Rico) (Acquired 12/12/2012;
Cost $2,123,434)(b)(e) | | | 805,748 | | | | 1,007,185 | |
| | | | | | | | 45,143,446 | |
|
| Life Sciences Tools & Services–2.06% | |
Agilent Technologies, Inc. | | | 292,823 | | | | 11,056,997 | |
Thermo Fisher Scientific, Inc. | | | 208,222 | | | | 27,231,273 | |
| | | | | | | | 38,288,270 | |
|
| Managed Health Care–4.09% | |
Aetna Inc. | | | 319,666 | | | | 36,691,263 | |
Qualicorp S.A. (Brazil) | | | 674,900 | | | | 2,836,450 | |
UnitedHealth Group Inc. | | | 308,879 | | | | 36,379,769 | |
| | | | | | | | 75,907,482 | |
|
| Pharmaceuticals–46.71% | |
Agile Therapeutics, Inc.(b) | | | 453,601 | | | | 3,601,592 | |
Akorn, Inc.(b) | | | 343,364 | | | | 9,181,553 | |
Allergan PLC(b) | | | 321,475 | | | | 99,165,393 | |
AstraZeneca PLC–ADR (United Kingdom) | | | 1,149,396 | | | | 36,654,238 | |
Bayer AG (Germany) | | | 212,721 | | | | 28,387,319 | |
Bristol-Myers Squibb Co. | | | 755,180 | | | | 49,804,121 | |
Cempra, Inc.(b) | | | 281,479 | | | | 6,248,834 | |
Dermira, Inc.(b) | | | 481,189 | | | | 12,987,291 | |
Eli Lilly and Co. | | | 477,760 | | | | 38,970,883 | |
Endo International PLC(b) | | | 461,956 | | | | 27,712,740 | |
GlaxoSmithKline PLC–ADR (United Kingdom) | | | 483,354 | | | | 20,813,223 | |
Hikma Pharmaceuticals PLC (Jordan) | | | 556,147 | | | | 18,555,596 | |
Jazz Pharmaceuticals PLC(b) | | | 172,512 | | | | 23,682,447 | |
Johnson & Johnson | | | 267,322 | | | | 27,007,542 | |
Lipocine Inc.(b) | | | 722,936 | | | | 8,646,315 | |
Locus Pharmaceuticals, Inc. Cost (Acquired 11/21/2000-05/09/2007; Cost $6,852,940)(b)(d)(e) | | | 258,824 | | | | 0 | |
Medicines Co. (The)(b) | | | 362,503 | | | | 12,412,103 | |
Merck & Co., Inc. | | | 1,279,027 | | | | 69,911,616 | |
Mylan N.V.(b) | | | 447,005 | | | | 19,708,450 | |
Nippon Shinyaku Co., Ltd. (Japan) | | | 568,000 | | | | 22,202,391 | |
Novartis AG–ADR (Switzerland) | | | 496,245 | | | | 44,875,435 | |
Pfizer Inc. | | | 912,864 | | | | 30,873,061 | |
Roche Holding AG (Switzerland) | | | 277,079 | | | | 75,061,584 | |
Sanofi–ADR (France) | | | 921,663 | | | | 46,396,515 | |
Shire PLC–ADR (Ireland) | | | 369,410 | | | | 83,874,541 | |
See accompanying Notes to Financial Statements which are an integral part of the financial statements.
9 Invesco Global Health Care Fund
| | | | | | | | |
| | | Shares | | | Value | |
| Pharmaceuticals–(continued) | |
Supernus Pharmaceuticals Inc.(b) | | | 795,389 | | | $ | 13,123,919 | |
Teva Pharmaceutical Industries Ltd.–ADR (Israel) | | | 510,192 | | | | 30,198,264 | |
Zogenix, Inc.(b) | | | 547,363 | | | | 6,453,410 | |
| | | | | | | | 866,510,376 | |
Total Common Stocks & Other Equity Interests (Cost $1,305,159,665) | | | | 1,828,325,816 | |
|
Preferred Stock–0.00% | |
| Health Care Equipment–0.00% | |
Intact Medical Corp.,–Series C, Pfd. (Acquired 03/26/2001; Cost $2,000,001)(d)(e) | | | 2,439,026 | | | | 0 | |
| | | | | | | | |
| | | Shares | | | Value | |
Money Market Funds–2.80% | |
Liquid Assets Portfolio–Institutional Class, 0.16%(f) | | | 25,932,630 | | | $ | 25,932,630 | |
Premier Portfolio–Institutional Class, 0.12%(f) | | | 25,932,631 | | | | 25,932,631 | |
Total Money Market Funds
(Cost $51,865,261) | | | | 51,865,261 | |
TOTAL INVESTMENTS–101.36% (Cost $1,359,024,927) | | | | 1,880,191,077 | |
OTHER ASSETS LESS LIABILITIES–(1.36)% | | | | (25,195,718 | ) |
NET ASSETS–100.00% | | | $ | 1,854,995,359 | |
Investment Abbreviations:
| | |
| ADR | | – American Depositary Receipt |
| Pfd. | | – Preferred |
Notes to Schedule of Investments:
| (a) | Industry and/or sector classifications used in this report are generally according to the Global Industry Classification Standard, which was developed by and is the exclusive property and a service mark of MSCI Inc. and Standard & Poor’s. |
| (b) | Non-income producing security. |
| (c) | Affiliated company during the period. The Investment Company Act of 1940 defines an “affiliated person” as an issuance in which a fund holds 5% or more of the outstanding voting securities. The Fund has not owned enough of the outstanding voting securities of the issuer to have control (as defined in the Investment Company Act of 1940) of that issuer. The value of this security as of October 31, 2015 represented less than 1% of the Fund’s Net Assets. See Note 4. |
| (d) | Security is considered venture capital. See Note 1K. |
| (e) | Security purchased or received in a transaction exempt from registration under the Securities Act of 1933, as amended (the “1933 Act”). The security may be resold pursuant to an exemption from registration under the 1933 Act, typically to qualified institutional buyers. The aggregate value of these securities at October 31, 2015 was $1,007,185, which represented less than 1% of the Fund’s Net Assets. |
| (f) | The money market fund and the Fund are affiliated by having the same investment adviser. The rate shown is the 7-day SEC standardized yield as of October 31, 2015. |
See accompanying Notes to Financial Statements which are an integral part of the financial statements.
10 Invesco Global Health Care Fund
Statement of Assets and Liabilities
October 31, 2015
| | | | |
Assets: | |
Investments, at value (Cost $1,306,751,176) | | $ | 1,828,296,756 | |
Investments in affiliates, at value (Cost $52,273,751) | | | 51,894,321 | |
Total investments, at value (Cost $1,359,024,927) | | | 1,880,191,077 | |
Foreign currencies, at value (Cost $411,888) | | | 379,874 | |
Receivable for: | | | | |
Investments sold | | | 28,065,572 | |
Fund shares sold | | | 1,079,598 | |
Dividends | | | 1,734,271 | |
Unrealized appreciation on forward foreign currency contracts outstanding | | | 1,130,867 | |
Investment for trustee deferred compensation and retirement plans | | | 257,071 | |
Other assets | | | 529,928 | |
Total assets | | | 1,913,368,258 | |
|
Liabilities: | |
Payable for: | | | | |
Investments purchased | | | 55,229,764 | |
Fund shares reacquired | | | 1,621,664 | |
Accrued fees to affiliates | | | 1,047,808 | |
Accrued trustees’ and officers’ fees and benefits | | | 3,315 | |
Accrued other operating expenses | | | 116,966 | |
Trustee deferred compensation and retirement plans | | | 353,382 | |
Total liabilities | | | 58,372,899 | |
Net assets applicable to shares outstanding | | $ | 1,854,995,359 | |
|
Net assets consist of: | |
Shares of beneficial interest | | $ | 1,087,098,979 | |
Undistributed net investment income | | | (351,837 | ) |
Undistributed net realized gain | | | 246,049,726 | |
Net unrealized appreciation | | | 522,198,491 | |
| | | $ | 1,854,995,359 | |
| | | | |
Net Assets: | |
Class A | | $ | 981,963,331 | |
Class B | | $ | 11,261,745 | |
Class C | | $ | 107,975,892 | |
Class Y | | $ | 39,443,068 | |
Investor Class | | $ | 714,351,323 | |
|
Shares outstanding, $0.01 par value per share,
with an unlimited number of shares authorized: | |
Class A | | | 22,470,084 | |
Class B | | | 336,022 | |
Class C | | | 3,217,424 | |
Class Y | | | 891,596 | |
Investor Class | | | 16,342,103 | |
Class A: | | | | |
Net asset value per share | | $ | 43.70 | |
Maximum offering price per share | | | | |
(Net asset value of $43.70 ¸ 94.50%) | | $ | 46.24 | |
Class B: | | | | |
Net asset value and offering price per share | | $ | 33.51 | |
Class C: | | | | |
Net asset value and offering price per share | | $ | 33.56 | |
Class Y: | | | | |
Net asset value and offering price per share | | $ | 44.24 | |
Investor Class: | | | | |
Net asset value and offering price per share | | $ | 43.71 | |
See accompanying Notes to Financial Statements which are an integral part of the financial statements.
11 Invesco Global Health Care Fund
Statement of Operations
For the year ended October 31, 2015
| | | | |
Investment income: | |
Dividends (net of foreign withholding taxes of $1,082,339) | | $ | 21,084,414 | |
Dividends from affiliates | | | 35,903 | |
Total investment income | | | 21,120,317 | |
| |
Expenses: | | | | |
Advisory fees | | | 11,736,201 | |
Administrative services fees | | | 422,583 | |
Custodian fees | | | 103,632 | |
Distribution fees: | | | | |
Class A | | | 2,550,915 | |
Class B | | | 139,167 | |
Class C | | | 1,018,822 | |
Investor Class | | | 1,919,438 | |
Transfer agent fees | | | 2,913,505 | |
Trustees’ and officers’ fees and benefits | | | 58,178 | |
Other | | | 348,080 | |
Total expenses | | | 21,210,521 | |
Less: Fees waived and expense offset arrangement(s) | | | (116,560 | ) |
Net expenses | | | 21,093,961 | |
Net investment income | | | 26,356 | |
| |
Realized and unrealized gain (loss) from: | | | | |
Net realized gain (loss) from: | | | | |
Investment securities | | | 244,384,894 | |
Foreign currencies | | | (123,192 | ) |
Forward foreign currency contracts | | | 3,064,000 | |
| | | | 247,325,702 | |
Change in net unrealized appreciation (depreciation) of: | | | | |
Investment securities | | | (191,902,232 | ) |
Foreign currencies | | | (44,855 | ) |
Forward foreign currency contracts | | | 755,022 | |
| | | | (191,192,065 | ) |
Net realized and unrealized gain | | | 56,133,637 | |
Net increase in net assets resulting from operations | | $ | 56,159,993 | |
See accompanying Notes to Financial Statements which are an integral part of the financial statements.
12 Invesco Global Health Care Fund
Statement of Changes in Net Assets
For the years ended October 31, 2015 and 2014
| | | | | | | | |
| | | 2015 | | | 2014 | |
Operations: | | | | | |
Net investment income | | $ | 26,356 | | | $ | 58,178 | |
Net realized gain | | | 247,325,702 | | | | 188,397,887 | |
Change in net unrealized appreciation (depreciation) | | | (191,192,065 | ) | | | 192,207,160 | |
Net increase in net assets resulting from operations | | | 56,159,993 | | | | 380,663,225 | |
| | |
Distributions to shareholders from net investment income: | | | | | | | | |
Class A | | | — | | | | (230,447 | ) |
Class Y | | | (10,150 | ) | | | (38,777 | ) |
Investor Class | | | — | | | | (188,300 | ) |
Total distributions from net investment income | | | (10,150 | ) | | | (457,524 | ) |
| | |
Distributions to shareholders from net realized gains: | | | | | | | | |
Class A | | | (96,831,067 | ) | | | (63,185,146 | ) |
Class B | | | (1,886,195 | ) | | | (1,740,995 | ) |
Class C | | | (11,181,210 | ) | | | (6,192,771 | ) |
Class Y | | | (3,429,565 | ) | | | (1,299,385 | ) |
Investor Class | | | (76,198,284 | ) | | | (51,630,115 | ) |
Total distributions from net realized gains | | | (189,526,321 | ) | | | (124,048,412 | ) |
| | |
Share transactions–net: | | | | | | | | |
Class A | | | 145,018,935 | | | | 37,141,167 | |
Class B | | | (1,629,291 | ) | | | (4,813,537 | ) |
Class C | | | 37,253,754 | | | | 14,047,592 | |
Class Y | | | 10,969,883 | | | | 11,863,196 | |
Investor Class | | | 32,925,819 | | | | 14,818,302 | |
Net increase in net assets resulting from share transactions | | | 224,539,100 | | | | 73,056,720 | |
Net increase in net assets | | | 91,162,622 | | | | 329,214,009 | |
| | |
Net assets: | | | | | | | | |
Beginning of year | | | 1,763,832,737 | | | | 1,434,618,728 | |
End of year (includes undistributed net investment income of $(351,837) and $(330,610), respectively) | | $ | 1,854,995,359 | | | $ | 1,763,832,737 | |
Notes to Financial Statements
October 31, 2015
NOTE 1—Significant Accounting Policies
Invesco Global Health Care Fund (the “Fund”) is a series portfolio of AIM Investment Funds (Invesco Investment Funds) (the “Trust”). The Trust is organized as a Delaware statutory trust and is registered under the Investment Company Act of 1940, as amended (the “1940 Act”), as an open-end series management investment company consisting of twenty-four separate series portfolios, each authorized to issue an unlimited number of shares of beneficial interest. The assets, liabilities and operations of each portfolio are accounted for separately. Information presented in these financial statements pertains only to the Fund. Matters affecting each portfolio or class will be voted on exclusively by the shareholders of such portfolio or class.
The Fund’s investment objective is long-term growth of capital.
The Fund currently consists of five different classes of shares: Class A, Class B, Class C, Class Y and Investor Class. Investor Class shares of the Fund are offered only to certain grandfathered investors. Class A shares are sold with a front-end sales charge unless certain waiver criteria are met and under certain circumstances load waived shares may be subject to contingent deferred sales charges (“CDSC”). Class C shares are sold with a CDSC. Class Y and Investor Class shares are sold at net asset value. Effective November 30, 2010, new or additional investments in Class B shares are no longer permitted. Existing shareholders of Class B shares may continue to reinvest dividends and capital gains distributions in Class B shares until they convert to Class A shares. Also, shareholders in Class B shares will be able to exchange those shares for Class B shares of other Invesco Funds offering such shares until they convert to Class A shares. Generally, Class B shares will automatically convert to Class A shares on or about the month-end, which is at least eight years after the date of purchase. Redemption of Class B shares prior to the conversion date will be subject to a CDSC.
13 Invesco Global Health Care Fund
The following is a summary of the significant accounting policies followed by the Fund in the preparation of its financial statements.
| A. | Security Valuations — Securities, including restricted securities, are valued according to the following policy. |
A security listed or traded on an exchange (except convertible securities) is valued at its last sales price or official closing price as of the close of the customary trading session on the exchange where the security is principally traded, or lacking any sales or official closing price on a particular day, the security may be valued at the closing bid price on that day. Securities traded in the over-the-counter market are valued based on prices furnished by independent pricing services or market makers. When such securities are valued by an independent pricing service they may be considered fair valued. Futures contracts are valued at the final settlement price set by an exchange on which they are principally traded. Listed options are valued at the mean between the last bid and asked prices from the exchange on which they are principally traded. Options not listed on an exchange are valued by an independent source at the mean between the last bid and asked prices. For purposes of determining net asset value (“NAV”) per share, futures and option contracts generally are valued 15 minutes after the close of the customary trading session of the New York Stock Exchange (“NYSE”).
Investments in open-end and closed-end registered investment companies that do not trade on an exchange are valued at the end-of-day net asset value per share. Investments in open-end and closed-end registered investment companies that trade on an exchange are valued at the last sales price or official closing price as of the close of the customary trading session on the exchange where the security is principally traded.
Debt obligations (including convertible securities) and unlisted equities are fair valued using an evaluated quote provided by an independent pricing service. Evaluated quotes provided by the pricing service may be determined without exclusive reliance on quoted prices, and may reflect appropriate factors such as institution-size trading in similar groups of securities, developments related to specific securities, dividend rate (for unlisted equities), yield (for debt obligations), quality, type of issue, coupon rate (for debt obligations), maturity (for debt obligations), individual trading characteristics and other market data. Debt obligations are subject to interest rate and credit risks. In addition, all debt obligations involve some risk of default with respect to interest and/or principal payments.
Foreign securities’ (including foreign exchange contracts) prices are converted into U.S. dollar amounts using the applicable exchange rates as of the close of the NYSE. If market quotations are available and reliable for foreign exchange-traded equity securities, the securities will be valued at the market quotations. Because trading hours for certain foreign securities end before the close of the NYSE, closing market quotations may become unreliable. If between the time trading ends on a particular security and the close of the customary trading session on the NYSE, events occur that the Adviser determines are significant and make the closing price unreliable, the Fund may fair value the security. If the event is likely to have affected the closing price of the security, the security will be valued at fair value in good faith using procedures approved by the Board of Trustees. Adjustments to closing prices to reflect fair value may also be based on a screening process of an independent pricing service to indicate the degree of certainty, based on historical data, that the closing price in the principal market where a foreign security trades is not the current value as of the close of the NYSE. Foreign securities’ prices meeting the approved degree of certainty that the price is not reflective of current value will be priced at the indication of fair value from the independent pricing service. Multiple factors may be considered by the independent pricing service in determining adjustments to reflect fair value and may include information relating to sector indices, American Depositary Receipts and domestic and foreign index futures. Foreign securities may have additional risks including exchange rate changes, potential for sharply devalued currencies and high inflation, political and economic upheaval, the relative lack of issuer information, relatively low market liquidity and the potential lack of strict financial and accounting controls and standards.
Securities for which market prices are not provided by any of the above methods may be valued based upon quotes furnished by independent sources. The last bid price may be used to value equity securities. The mean between the last bid and asked prices is used to value debt obligations, including corporate loans.
Securities for which market quotations are not readily available or became unreliable are valued at fair value as determined in good faith by or under the supervision of the Trust’s officers following procedures approved by the Board of Trustees. Issuer specific events, market trends, bid/asked quotes of brokers and information providers and other market data may be reviewed in the course of making a good faith determination of a security’s fair value.
The Fund may invest in securities that are subject to interest rate risk, meaning the risk that the prices will generally fall as interest rates rise and, conversely, the prices will generally rise as interest rates fall. Specific securities differ in their sensitivity to changes in interest rates depending on their individual characteristics. Changes in interest rates may result in increased market volatility, which may affect the value and/or liquidity of certain Fund investments.
Valuations change in response to many factors including the historical and prospective earnings of the issuer, the value of the issuer’s assets, general economic conditions, interest rates, investor perceptions and market liquidity. Because of the inherent uncertainties of valuation, the values reflected in the financial statements may materially differ from the value received upon actual sale of those investments.
| B. | Securities Transactions and Investment Income — Securities transactions are accounted for on a trade date basis. Realized gains or losses on sales are computed on the basis of specific identification of the securities sold. Interest income (net of withholding tax, if any) is recorded on the accrual basis from settlement date. Dividend income (net of withholding tax, if any) is recorded on the ex-dividend date. |
The Fund may periodically participate in litigation related to Fund investments. As such, the Fund may receive proceeds from litigation settlements. Any proceeds received are included in the Statement of Operations as realized gain (loss) for investments no longer held and as unrealized gain (loss) for investments still held.
Brokerage commissions and mark ups are considered transaction costs and are recorded as an increase to the cost basis of securities purchased and/or a reduction of proceeds on a sale of securities. Such transaction costs are included in the determination of net realized and unrealized gain (loss) from investment securities reported in the Statement of Operations and the Statement of Changes in Net Assets and the net realized and unrealized gains (losses) on securities per share in the Financial Highlights. Transaction costs are included in the calculation of the Fund’s net asset value and, accordingly, they reduce the Fund’s total returns. These transaction costs are not considered operating expenses and are not reflected in net investment income reported in the Statement of Operations and the Statement of Changes in Net Assets, or the net investment income per share and the ratios of expenses and net investment income reported in the Financial Highlights, nor are they limited by any expense limitation arrangements between the Fund and the investment adviser.
The Fund allocates income and realized and unrealized capital gains and losses to a class based on the relative net assets of each class.
14 Invesco Global Health Care Fund
| C. | Country Determination — For the purposes of making investment selection decisions and presentation in the Schedule of Investments, the investment adviser may determine the country in which an issuer is located and/or credit risk exposure based on various factors. These factors include the laws of the country under which the issuer is organized, where the issuer maintains a principal office, the country in which the issuer derives 50% or more of its total revenues and the country that has the primary market for the issuer’s securities, as well as other criteria. Among the other criteria that may be evaluated for making this determination are the country in which the issuer maintains 50% or more of its assets, the type of security, financial guarantees and enhancements, the nature of the collateral and the sponsor organization. Country of issuer and/or credit risk exposure has been determined to be the United States of America, unless otherwise noted. |
| D. | Distributions — Distributions from net investment income and net realized capital gain, if any, are generally declared and paid annually and recorded on the ex-dividend date. The Fund may elect to treat a portion of the proceeds from redemptions as distributions for federal income tax purposes. |
| E. | Federal Income Taxes — The Fund intends to comply with the requirements of Subchapter M of the Internal Revenue Code of 1986, as amended (the “Internal Revenue Code”), necessary to qualify as a regulated investment company and to distribute substantially all of the Fund’s taxable earnings to shareholders. As such, the Fund will not be subject to federal income taxes on otherwise taxable income (including net realized capital gain) that is distributed to shareholders. Therefore, no provision for federal income taxes is recorded in the financial statements. |
The Fund recognizes the tax benefits of uncertain tax positions only when the position is more likely than not to be sustained. Management has analyzed the Fund’s uncertain tax positions and concluded that no liability for unrecognized tax benefits should be recorded related to uncertain tax positions. Management is not aware of any tax positions for which it is reasonably possible that the total amounts of unrecognized tax benefits will change materially in the next 12 months.
The Fund files tax returns in the U.S. Federal jurisdiction and certain other jurisdictions. Generally, the Fund is subject to examinations by such taxing authorities for up to three years after the filing of the return for the tax period.
| F. | Expenses — Fees provided for under the Rule 12b-1 plan of a particular class of the Fund and which are directly attributable to that class are charged to the operations of such class. All other expenses are allocated among the classes based on relative net assets. |
| G. | Accounting Estimates — The preparation of financial statements in conformity with accounting principles generally accepted in the United States of America (“GAAP”) requires management to make estimates and assumptions that affect the reported amounts of assets and liabilities at the date of the financial statements and the reported amounts of revenues and expenses during the reporting period including estimates and assumptions related to taxation. Actual results could differ from those estimates by a significant amount. In addition, the Fund monitors for material events or transactions that may occur or become known after the period-end date and before the date the financial statements are released to print. |
| H. | Indemnifications — Under the Trust’s organizational documents, each Trustee, officer, employee or other agent of the Trust is indemnified against certain liabilities that may arise out of the performance of their duties to the Fund. Additionally, in the normal course of business, the Fund enters into contracts, including the Fund’s servicing agreements, that contain a variety of indemnification clauses. The Fund’s maximum exposure under these arrangements is unknown as this would involve future claims that may be made against the Fund that have not yet occurred. The risk of material loss as a result of such indemnification claims is considered remote. |
| I. | Foreign Currency Translations — Foreign currency is valued at the close of the NYSE based on quotations posted by banks and major currency dealers. Portfolio securities and other assets and liabilities denominated in foreign currencies are translated into U.S. dollar amounts at date of valuation. Purchases and sales of portfolio securities (net of foreign taxes withheld on disposition) and income items denominated in foreign currencies are translated into U.S. dollar amounts on the respective dates of such transactions. The Fund does not separately account for the portion of the results of operations resulting from changes in foreign exchange rates on investments and the fluctuations arising from changes in market prices of securities held. The combined results of changes in foreign exchange rates and the fluctuation of market prices on investments (net of estimated foreign tax withholding) are included with the net realized and unrealized gain or loss from investments in the Statement of Operations. Reported net realized foreign currency gains or losses arise from (1) sales of foreign currencies, (2) currency gains or losses realized between the trade and settlement dates on securities transactions, and (3) the difference between the amounts of dividends, interest, and foreign withholding taxes recorded on the Fund’s books and the U.S. dollar equivalent of the amounts actually received or paid. Net unrealized foreign currency gains and losses arise from changes in the fair values of assets and liabilities, other than investments in securities at fiscal period end, resulting from changes in exchange rates. |
The Fund may invest in foreign securities, which may be subject to foreign taxes on income, gains on investments or currency repatriation, a portion of which may be recoverable. Foreign taxes, if any, are recorded based on the tax regulations and rates that exist in the foreign markets in which the Fund invests and are shown in the Statement of Operations.
| J. | Forward Foreign Currency Contracts — The Fund may engage in foreign currency transactions either on a spot (i.e. for prompt delivery and settlement) basis, or through forward foreign currency contracts, to manage or minimize currency or exchange rate risk. |
The Fund may also enter into forward foreign currency contracts for the purchase or sale of a security denominated in a foreign currency in order to “lock in” the U.S. dollar price of that security, or the Fund may also enter into forward foreign currency contracts that do not provide for physical settlement of the two currencies, but instead are settled by a single cash payment calculated as the difference between the agreed upon exchange rate and the spot rate at settlement based upon an agreed upon notional amount (non-deliverable forwards). The Fund will set aside liquid assets in an amount equal to daily mark-to-market obligation for forward foreign currency contracts.
A forward foreign currency contract is an obligation between two parties (“Counterparties”) to purchase or sell a specific currency for an agreed-upon price at a future date. The use of forward foreign currency contracts does not eliminate fluctuations in the price of the underlying securities the Fund owns or intends to acquire but establishes a rate of exchange in advance. Fluctuations in the value of these contracts are measured by the difference in the contract date and reporting date exchange rates and are recorded as unrealized appreciation (depreciation) until the contracts are closed. When the contracts are closed, realized gains (losses) are recorded. Realized and unrealized gains (losses) on the contracts are included in the Statement of Operations. The primary risks associated with forward foreign currency contracts include failure of the Counterparty to meet the terms of the contract and the value of the foreign currency changing unfavorably. These risks may be in excess of the amounts reflected in the Statement of Assets and Liabilities.
15 Invesco Global Health Care Fund
| K. | Other Risks — The Fund’s performance is vulnerable to factors affecting the health care industry, including government regulation, obsolescence caused by scientific advances and technological innovations. |
The Fund has invested in non-publicly traded companies, some of which are in the startup or development stages. These investments are inherently risky, as the market for the technologies or products these companies are developing are typically in the early stages and may never materialize. The Fund could lose its entire investment in these companies. These investments are valued at fair value as determined in good faith in accordance with procedures approved by the Board of Trustees. Investments in privately held venture capital securities are illiquid.
NOTE 2—Advisory Fees and Other Fees Paid to Affiliates
The Trust has entered into a master investment advisory agreement with Invesco Advisers, Inc. (the “Adviser” or “Invesco”). Under the terms of the investment advisory agreement, the Fund pays an advisory fee to the Adviser based on the annual rate of the Fund’s average daily net assets as follows:
| | | | | | |
| Average Daily Net Assets | | Rate |
First $350 million | | | 0 | .75% | | |
Next $350 million | | | 0 | .65% | | |
Next $1.3 billion | | | 0 | .55% | | |
Next $2 billion | | | 0 | .45% | | |
Next $2 billion | | | 0 | .40% | | |
Next $2 billion | | | 0 | .375% | | |
Over $8 billion | | | 0 | .35% | | |
For the year ended October 31, 2015, the effective advisory fees incurred by the Fund was 0.60%.
Under the terms of a master sub-advisory agreement between the Adviser and each of Invesco Asset Management Deutschland GmbH, Invesco Asset Management Limited, Invesco Asset Management (Japan) Limited, Invesco Hong Kong Limited, Invesco Senior Secured Management, Inc., and Invesco Canada Ltd. (collectively, the “Affiliated Sub-Advisers”) the Adviser, not the Fund, may pay 40% of the fees paid to the Adviser to any such Affiliated Sub-Adviser(s) that provide(s) discretionary investment management services to the Fund based on the percentage of assets allocated to such Affiliated Sub-Adviser(s).
The Adviser has contractually agreed, through at least June 30, 2016, to waive advisory fees and/or reimburse expenses to the extent necessary to limit total annual fund operating expenses after fee waiver and/or expense reimbursement (excluding certain items discussed below) of Class A, Class B, Class C, Class Y and Investor Class shares to 2.00%, 2.75%, 2.75%, 1.75% and 2.00% of average daily net assets, respectively. In determining the Adviser’s obligation to waive advisory fees and/or reimburse expenses, the following expenses are not taken into account, and could cause total annual fund operating expenses after fee waiver and/or expense reimbursement to exceed the numbers reflected above: (1) interest; (2) taxes; (3) dividend expense on short sales; (4) extraordinary or non-routine items, including litigation expenses; and (5) expenses that the Fund has incurred but did not actually pay because of an expense offset arrangement. Unless Invesco continues the fee waiver agreement, it will terminate on June 30, 2016. The fee waiver agreement cannot be terminated during its term. The Adviser did not waive fees and/or reimburse expenses during the period under this expense limitation.
Further, the Adviser has contractually agreed, through at least June 30, 2017, to waive the advisory fee payable by the Fund in an amount equal to 100% of the net advisory fees the Adviser receives from the affiliated money market funds on investments by the Fund of uninvested cash in such affiliated money market funds.
For the year ended October 31, 2015, the Adviser waived advisory fees of $107,644.
The Trust has entered into a master administrative services agreement with Invesco pursuant to which the Fund has agreed to pay Invesco for certain administrative costs incurred in providing accounting services to the Fund. For the year ended October 31, 2015, expenses incurred under the agreement are shown in the Statement of Operations as Administrative services fees.
The Trust has entered into a transfer agency and service agreement with Invesco Investment Services, Inc. (“IIS”) pursuant to which the Fund has agreed to pay IIS a fee for providing transfer agency and shareholder services to the Fund and reimburse IIS for certain expenses incurred by IIS in the course of providing such services. IIS may make payments to intermediaries that provide omnibus account services, sub-accounting services and/or networking services. All fees payable by IIS to intermediaries that provide omnibus account services or sub-accounting are charged back to the Fund, subject to certain limitations approved by the Trust’s Board of Trustees. For the year ended October 31, 2015, the expenses incurred under the agreement are shown in the Statement of Operations as Transfer agent fees.
The Trust has entered into master distribution agreements with Invesco Distributors, Inc. (“IDI”) to serve as the distributor for the Class A, Class B, Class C, Class Y and Investor Class shares of the Fund. The Trust has adopted plans pursuant to Rule 12b-1 under the 1940 Act with respect to the Fund’s Class A, Class B, Class C and Investor Class shares (collectively, the “Plans”). The Fund, pursuant to the Plans, pays IDI compensation at the annual rate of 0.25% of the Fund’s average daily net assets of Class A shares, 1.00% of the average daily net assets of Class B and Class C shares and 0.25% of the average daily net assets of Investor Class shares. Of the Plan payments, up to 0.25% of the average daily net assets of each class of shares may be paid to furnish continuing personal shareholder services to customers who purchase and own shares of such classes. Any amounts not paid as a service fee under the Plans would constitute an asset-based sales charge. Rules of the Financial Industry Regulatory Authority (“FINRA”) impose a cap on the total sales charges, including asset-based sales charges, that may be paid by any class of shares of the Fund. For the year ended October 31, 2015, expenses incurred under the Plans are shown in the Statement of Operations as Distribution fees.
Front-end sales commissions and CDSC (collectively, the “sales charges”) are not recorded as expenses of the Fund. Front-end sales commissions are deducted from proceeds from the sales of Fund shares prior to investment in Class A shares of the Fund. CDSC are deducted from redemption proceeds prior to remittance to the shareholder. During the year ended October 31, 2015, IDI advised the Fund that IDI retained $348,553 in front-end sales commissions from the sale of Class A shares and $7,559, $1,797 and $10,595 from Class A, Class B and Class C shares, respectively, for CDSC imposed on redemptions by shareholders.
16 Invesco Global Health Care Fund
For the year ended October 31, 2015, the Fund incurred $7,261 in brokerage commissions with Invesco Capital Markets, Inc., an affiliate of the Adviser and IDI, for portfolio transactions executed on behalf of the Fund.
Certain officers and trustees of the Trust are officers and directors of the Adviser, IIS and/or IDI.
NOTE 3—Additional Valuation Information
GAAP defines fair value as the price that would be received to sell an asset or paid to transfer a liability in an orderly transaction between market participants at the measurement date, under current market conditions. GAAP establishes a hierarchy that prioritizes the inputs to valuation methods, giving the highest priority to readily available unadjusted quoted prices in an active market for identical assets (Level 1) and the lowest priority to significant unobservable inputs (Level 3), generally when market prices are not readily available or are unreliable. Based on the valuation inputs, the securities or other investments are tiered into one of three levels. Changes in valuation methods may result in transfers in or out of an investment’s assigned level:
| | Level 1 — | Prices are determined using quoted prices in an active market for identical assets. |
| | Level 2 — | Prices are determined using other significant observable inputs. Observable inputs are inputs that other market participants may use in pricing a security. These may include quoted prices for similar securities, interest rates, prepayment speeds, credit risk, yield curves, loss severities, default rates, discount rates, volatilities and others. |
| | Level 3 — | Prices are determined using significant unobservable inputs. In situations where quoted prices or observable inputs are unavailable (for example, when there is little or no market activity for an investment at the end of the period), unobservable inputs may be used. Unobservable inputs reflect the Fund’s own assumptions about the factors market participants would use in determining fair value of the securities or instruments and would be based on the best available information. |
The following is a summary of the tiered valuation input levels, as of October 31, 2015. The level assigned to the securities valuations may not be an indication of the risk or liquidity associated with investing in those securities. Because of the inherent uncertainties of valuation, the values reflected in the financial statements may materially differ from the value received upon actual sale of those investments.
| | | | | | | | | | | | | | | | |
| | | Level 1 | | | Level 2 | | | Level 3 | | | Total | |
Equity Securities | | $ | 1,757,795,642 | | | $ | 121,359,190 | | | $ | 1,036,245 | | | $ | 1,880,191,077 | |
Forward Foreign Currency Contracts* | | | — | | | | 1,130,867 | | | | — | | | | 1,130,867 | |
Total Investments | | $ | 1,757,795,642 | | | $ | 122,490,057 | | | $ | 1,036,245 | | | $ | 1,881,321,944 | |
| * | Unrealized appreciation. |
NOTE 4—Investments in Other Affiliates
The 1940 Act defines affiliates as those issuances in which a fund holds 5% or more of the outstanding voting securities. The Fund has not owned enough of the outstanding voting securities of the issuer to have control (as defined in the 1940 Act) of that issuer. The following is a summary of the investments in other affiliates for the year ended October 31, 2015.
| | | | | | | | | | | | | | | | | | | | | | | | | | | | |
| | | Value 10/31/14 | | | Purchases
at Cost | | | Proceeds from Sales | | | Change in
Unrealized
Appreciation
(Depreciation) | | | Realized
Gain | | | Value 10/31/15 | | | Dividend
Income | |
Evolutionary Genomics, Inc. | | $ | 29,832 | | | $ | — | | | $ | — | | | $ | (772 | ) | | $ | — | | | $ | 29,060 | | | $ | — | |
NOTE 5—Derivative Investments
Value of Derivative Investments at Period-End
The table below summarizes the value of the Fund’s derivative investments, detailed by primary risk exposure, held as of October 31, 2015:
| | | | | | | | |
| | | Value | |
| Risk Exposure/Derivative Type | | Assets | | | Liabilities | |
Currency risk: | | | | | | | | |
Forward foreign currency contracts(a) | | $ | 1,130,867 | | | $ | — | |
| (a) | Values are disclosed on the Statement of Assets and Liabilities under the caption Unrealized appreciation on forward foreign currency contracts outstanding. |
Effect of Derivative Investments for the year ended October 31, 2015
The table below summarizes the gains on derivative investments, detailed by primary risk exposure, recognized in earnings during the period:
| | | | |
| | | Location of Gain on
Statement of Operations | |
| | | Forward
Foreign Currency
Contracts | |
Realized Gain: | | | | |
Currency risk | | $ | 3,064,000 | |
Change in Net Unrealized Appreciation: | | | | |
Currency risk | | | 755,022 | |
Total | | $ | 3,819,022 | |
17 Invesco Global Health Care Fund
The table below summarizes the average notional value of forward foreign currency contracts outstanding during the period.
| | | | |
| | | Forward
Foreign Currency
Contracts | |
Average notional value | | $ | 60,648,262 | |
| | | | | | | | | | | | | | | | | | | | | | | | | | |
| Open Forward Foreign Currency Contracts | |
Settlement
Date | | Counterparty | | Contract to | | | Notional
Value | | | Unrealized
Appreciation | |
| | | Deliver | | | Receive | | | |
11/12/2015 | | Citigroup Global Markets Inc. | | | CHF | | | | 17,504,000 | | | | USD | | | | 18,395,810 | | | $ | 17,717,809 | | | $ | 678,001 | |
11/12/2015 | | Citigroup Global Markets Inc. | | | EUR | | | | 11,994,000 | | | | USD | | | | 13,645,059 | | | | 13,192,193 | | | | 452,866 | |
Total Open Forward Foreign Currency Contracts — Currency Risk | | | | | | | | | | | | | | | | | | | | | | $ | 1,130,867 | |
Currency Abbreviations:
| | |
| CHF | | – Swiss Franc |
| EUR | | – Euro |
| USD | | – U.S. Dollar |
Offsetting Assets and Liabilities
Accounting Standards Update (“ASU”) No. 2011-11, Disclosures about Offsetting Assets and Liabilities, which was subsequently clarified in Financial Accounting Standards Board ASU 2013-01 “Clarifying the Scope of Disclosures about Offsetting Assets and Liabilities” is intended to enhance disclosures about financial instruments and derivative instruments that are subject to offsetting arrangements on the Statement of Assets and Liabilities and to enable investors to better understand the effect of those arrangements on the Fund’s financial position. In order for an arrangement to be eligible for netting, the Fund must have a basis to conclude that such netting arrangements are legally enforceable. The Fund enters into netting agreements and collateral agreements in an attempt to reduce the Fund’s Counterparty credit risk by providing for a single net settlement with a Counterparty of all financial transactions covered by the agreement in an event of default as defined under such agreement.
The following tables present derivative instruments that are either subject to an enforceable netting agreement or offset by collateral arrangements as of October 31, 2015.
| | | | | | | | | | | | | | | | | | | | |
| Counterparty | | Gross amounts
of Recognized
Assets | | | Gross Amounts Not Offset in the
Statement of Assets and Liabilities | | | Net
Amount | |
| | | Financial
Instruments | | | Collateral Received | | |
| | | | Non-Cash | | | Cash | | |
Citigroup Global Markets Inc. | | $ | 1,130,867 | | | $ | — | | | $ | — | | | $ | — | | | $ | 1,130,867 | |
Total | | $ | 1,130,867 | | | $ | — | | | $ | — | | | $ | — | | | $ | 1,130,867 | |
NOTE 6—Expense Offset Arrangement(s)
The expense offset arrangement is comprised of transfer agency credits which result from balances in demand deposit accounts used by the transfer agent for clearing shareholder transactions. For the year ended October 31, 2015, the Fund received credits from this arrangement, which resulted in the reduction of the Fund’s total expenses of $8,916.
NOTE 7—Trustees’ and Officers’ Fees and Benefits
Trustees’ and Officers’ Fees and Benefits include amounts accrued by the Fund to pay remuneration to certain Trustees and Officers of the Fund. Trustees have the option to defer compensation payable by the Fund, and Trustees’ and Officers’ Fees and Benefits also include amounts accrued by the Fund to fund such deferred compensation amounts. Those Trustees who defer compensation have the option to select various Invesco Funds in which their deferral accounts shall be deemed to be invested. Finally, certain current Trustees were eligible to participate in a retirement plan that provided for benefits to be paid upon retirement to Trustees over a period of time based on the number of years of service. The Fund may have certain former Trustees who also participate in a retirement plan and receive benefits under such plan. Trustees’ and Officers’ Fees and Benefits include amounts accrued by the Fund to fund such retirement benefits. Obligations under the deferred compensation and retirement plans represent unsecured claims against the general assets of the Fund.
NOTE 8—Cash Balances
The Fund is permitted to temporarily carry a negative or overdrawn balance in its account with State Street Bank and Trust Company, the custodian bank. Such balances, if any at period end, are shown in the Statement of Assets and Liabilities under the payable caption Amount due custodian. To compensate the custodian bank for such overdrafts, the overdrawn Fund may either (1) leave funds as a compensating balance in the account so the custodian bank can be compensated by earning the additional interest; or (2) compensate by paying the custodian bank at a rate agreed upon by the custodian bank and Invesco, not to exceed the contractually agreed upon rate.
18 Invesco Global Health Care Fund
NOTE 9—Distributions to Shareholders and Tax Components of Net Assets
Tax Character of Distributions to Shareholders Paid During the Fiscal Years Ended October 31, 2015 and 2014:
| | | | | | | | |
| | | 2015 | | | 2014 | |
Ordinary income | | $ | 279,221 | | | $ | 8,906,497 | |
Long-term capital gain | | | 189,257,250 | | | | 115,599,439 | |
Total distributions | | $ | 189,536,471 | | | $ | 124,505,936 | |
Tax Components of Net Assets at Period-End:
| | | | |
| | | 2015 | |
Undistributed ordinary income | | $ | 15,091,375 | |
Undistributed long-term gain | | | 232,093,620 | |
Net unrealized appreciation — investments | | | 521,161,748 | |
Net unrealized appreciation (depreciation) — other investments | | | (98,526 | ) |
Temporary book/tax differences | | | (351,837 | ) |
Shares of beneficial interest | | | 1,087,098,979 | |
Total net assets | | $ | 1,854,995,359 | |
The difference between book-basis and tax-basis unrealized appreciation (depreciation) is due to differences in the timing of recognition of gains and losses on investments for tax and book purposes. The Fund’s net unrealized appreciation difference is attributable primarily to wash sales.
The temporary book/tax differences are a result of timing differences between book and tax recognition of income and/or expenses. The Fund’s temporary book/tax differences are the result of the trustee deferral of compensation and retirement plan benefits.
Capital loss carryforward is calculated and reported as of a specific date. Results of transactions and other activity after that date may affect the amount of capital loss carryforward actually available for the Fund to utilize. Capital losses generated in years beginning after December 22, 2010 can be carried forward for an unlimited period, whereas previous losses expire in eight tax years. Capital losses with an expiration period may not be used to offset capital gains until all net capital losses without an expiration date have been utilized. Capital loss carryforwards with no expiration date will retain their character as either short-term or long-term capital losses instead of as short-term capital losses as under prior law. The ability to utilize capital loss carryforwards in the future may be limited under the Internal Revenue Code and related regulations based on the results of future transactions.
The Fund does not have a capital loss carryforward as of October 31, 2015.
NOTE 10—Investment Securities
The aggregate amount of investment securities (other than short-term securities, U.S. Treasury obligations and money market funds, if any) purchased and sold by the Fund during the year ended October 31, 2015 was $1,008,654,628 and $869,536,625, respectively. Cost of investments on a tax basis includes the adjustments for financial reporting purposes as of the most recently completed federal income tax reporting period-end.
| | | | |
| Unrealized Appreciation (Depreciation) of Investment Securities on a Tax Basis | |
Aggregate unrealized appreciation of investment securities | | $ | 645,642,177 | |
Aggregate unrealized (depreciation) of investment securities | | | (124,480,429 | ) |
Net unrealized appreciation of investment securities | | $ | 521,161,748 | |
Cost of investments for tax purposes is $1,359,029,329.
NOTE 11—Reclassification of Permanent Differences
Primarily as a result of differing book/tax treatment of foreign currency transactions and net operating loss reclass, on October 31, 2015, undistributed net investment income was decreased by $37,433 and undistributed net realized gain was increased by $37,433. This reclassification had no effect on the net assets of the Fund.
19 Invesco Global Health Care Fund
NOTE 12—Share Information
| | | | | | | | | | | | | | | | |
| | | Summary of Share Activity | |
| | | Years ended October 31, | |
| | | 2015(a) | | | 2014 | |
| | | Shares | | | Amount | | | Shares | | | Amount | |
Sold: | | | | | | | | | | | | | | | | |
Class A | | | 4,820,008 | | | $ | 224,680,172 | | | | 2,715,150 | | | $ | 115,916,700 | |
Class B | | | 72,539 | | | | 2,629,513 | | | | 35,192 | | | | 1,190,462 | |
Class C | | | 1,215,711 | | | | 43,961,950 | | | | 603,693 | | | | 20,492,015 | |
Class Y | | | 391,782 | | | | 18,343,412 | | | | 450,295 | | | | 19,762,485 | |
Investor Class | | | 676,871 | | | | 31,570,967 | | | | 552,996 | | | | 23,531,976 | |
| | | | |
Issued as reinvestment of dividends: | | | | | | | | | | | | | | | | |
Class A | | | 2,356,009 | | | | 100,342,466 | | | | 1,509,701 | | | | 57,549,788 | |
Class B | | | 57,678 | | | | 1,896,452 | | | | 54,553 | | | | 1,667,133 | |
Class C | | | 348,383 | | | | 11,472,253 | | | | 191,750 | | | | 5,865,634 | |
Class Y | | | 79,354 | | | | 3,413,789 | | | | 29,989 | | | | 1,150,983 | |
Investor Class | | | 1,757,199 | | | | 74,856,681 | | | | 1,304,978 | | | | 49,758,810 | |
| | | | |
Automatic conversion of Class B shares to Class A shares: | | | | | | | | | | | | | | | | |
Class A | | | 93,858 | | | | 4,317,788 | | | | 120,598 | | | | 5,084,757 | |
Class B | | | (121,735 | ) | | | (4,317,788 | ) | | | (150,679 | ) | | | (5,084,757 | ) |
| | | | |
Reacquired: | | | | | | | | | | | | | | | | |
Class A | | | (4,060,530 | ) | | | (184,321,491 | ) | | | (3,336,720 | ) | | | (141,410,078 | ) |
Class B | | | (52,195 | ) | | | (1,837,468 | ) | | | (76,661 | ) | | | (2,586,375 | ) |
Class C | | | (516,160 | ) | | | (18,180,449 | ) | | | (364,711 | ) | | | (12,310,057 | ) |
Class Y | | | (232,396 | ) | | | (10,787,318 | ) | | | (208,192 | ) | | | (9,050,272 | ) |
Investor Class | | | (1,598,601 | ) | | | (73,501,829 | ) | | | (1,389,131 | ) | | | (58,472,484 | ) |
Net increase in share activity | | | 5,287,775 | | | $ | 224,539,100 | | | | 2,042,801 | | | $ | 73,056,720 | |
| (a) | There are entities that are record owners of more than 5% of the outstanding shares of the Fund and in the aggregate own 14% of the outstanding shares of the Fund. IDI has an agreement with these entities to sell Fund shares. The Fund, Invesco and/or Invesco affiliates may make payments to these entities, which are considered to be related to the Fund, for providing services to the Fund, Invesco and/or Invesco affiliates including but not limited to services such as securities brokerage, distribution, third party record keeping and account servicing. The Fund has no knowledge as to whether all or any portion of the shares owned of record by these entities are also owned beneficially. |
20 Invesco Global Health Care Fund
NOTE 13—Financial Highlights
The following schedule presents financial highlights for a share of the Fund outstanding throughout the periods indicated.
| | | | | | | | | | | | | | | | | | | | | | | | | | | | | | | | | | | | | | | | | | | | | | | | | | | | | | | | |
| | | Net asset
value,
beginning
of period | | | Net
investment
income
(loss)(a) | | | Net gains
on securities
(both
realized and
unrealized) | | | Total from
investment
operations | | | Dividends
from net
investment
income | | | Distributions
from net
realized
gains | | | Total
distributions | | | Net asset
value, end
of period(b) | | | Total
return(c) | | | Net assets,
end of period
(000’s omitted) | | | Ratio of
expenses
to average
net assets
with fee waivers
and/or expenses
absorbed | | | Ratio of
expenses
to average net
assets without
fee waivers
and/or expenses
absorbed | | | Ratio of net
investment
income (loss)
to average
net assets | | | Portfolio
turnover(d) | |
Class A | |
Year ended 10/31/15 | | $ | 47.08 | | | $ | 0.02 | | | $ | 1.53 | | | $ | 1.55 | | | $ | — | | | $ | (4.93 | ) | | $ | (4.93 | ) | | $ | 43.70 | | | | 3.56 | % | | $ | 981,963 | | | | 1.04 | %(e) | | | 1.05 | %(e) | | | 0.04 | %(e) | | | 47 | % |
Year ended 10/31/14 | | | 40.38 | | | | 0.01 | | | | 10.15 | | | | 10.16 | | | | (0.01 | ) | | | (3.45 | ) | | | (3.46 | ) | | | 47.08 | | | | 27.20 | | | | 906,858 | | | | 1.07 | | | | 1.08 | | | | 0.04 | | | | 24 | |
Year ended 10/31/13 | | | 32.09 | | | | 0.07 | | | | 10.63 | | | | 10.70 | | | | (0.17 | ) | | | (2.24 | ) | | | (2.41 | ) | | | 40.38 | | | | 35.79 | | | | 737,071 | | | | 1.10 | | | | 1.11 | | | | 0.21 | | | | 37 | |
Year ended 10/31/12 | | | 27.75 | | | | 0.12 | | | | 4.84 | | | | 4.96 | | | | (0.14 | ) | | | (0.48 | ) | | | (0.62 | ) | | | 32.09 | | | | 18.34 | | | | 563,802 | | | | 1.17 | | | | 1.18 | | | | 0.40 | | | | 39 | |
Year ended 10/31/11 | | | 26.15 | | | | (0.03 | ) | | | 1.63 | (f) | | | 1.60 | | | | — | | | | — | | | | — | | | | 27.75 | | | | 6.12 | (f) | | | 540,451 | | | | 1.20 | | | | 1.21 | | | | (0.09 | ) | | | 37 | |
Class B | |
Year ended 10/31/15 | | | 37.50 | | | | (0.25 | ) | | | 1.19 | | | | 0.94 | | | | — | | | | (4.93 | ) | | | (4.93 | ) | | | 33.51 | | | | 2.76 | | | | 11,262 | | | | 1.79 | (e) | | | 1.80 | (e) | | | (0.71 | )(e) | | | 47 | |
Year ended 10/31/14 | | | 33.06 | | | | (0.24 | ) | | | 8.13 | | | | 7.89 | | | | — | | | | (3.45 | ) | | | (3.45 | ) | | | 37.50 | | | | 26.26 | | | | 14,239 | | | | 1.82 | | | | 1.83 | | | | (0.71 | ) | | | 24 | |
Year ended 10/31/13 | | | 26.72 | | | | (0.16 | ) | | | 8.74 | | | | 8.58 | | | | — | | | | (2.24 | ) | | | (2.24 | ) | | | 33.06 | | | | 34.81 | | | | 17,101 | | | | 1.85 | | | | 1.86 | | | | (0.54 | ) | | | 37 | |
Year ended 10/31/12 | | | 23.24 | | | | (0.09 | ) | | | 4.05 | | | | 3.96 | | | | — | | | | (0.48 | ) | | | (0.48 | ) | | | 26.72 | | | | 17.45 | | | | 19,765 | | | | 1.92 | | | | 1.93 | | | | (0.35 | ) | | | 39 | |
Year ended 10/31/11 | | | 22.07 | | | | (0.20 | ) | | | 1.37 | (f) | | | 1.17 | | | | — | | | | — | | | | — | | | | 23.24 | | | | 5.30 | (f) | | | 29,064 | | | | 1.95 | | | | 1.96 | | | | (0.84 | ) | | | 37 | |
Class C | |
Year ended 10/31/15 | | | 37.54 | | | | (0.25 | ) | | | 1.20 | | | | 0.95 | | | | — | | | | (4.93 | ) | | | (4.93 | ) | | | 33.56 | | | | 2.78 | | | | 107,976 | | | | 1.79 | (e) | | | 1.80 | (e) | | | (0.71 | )(e) | | | 47 | |
Year ended 10/31/14 | | | 33.09 | | | | (0.24 | ) | | | 8.14 | | | | 7.90 | | | | — | | | | (3.45 | ) | | | (3.45 | ) | | | 37.54 | | | | 26.26 | | | | 81,439 | | | | 1.82 | | | | 1.83 | | | | (0.71 | ) | | | 24 | |
Year ended 10/31/13 | | | 26.75 | | | | (0.16 | ) | | | 8.74 | | | | 8.58 | | | | — | | | | (2.24 | ) | | | (2.24 | ) | | | 33.09 | | | | 34.76 | | | | 57,536 | | | | 1.85 | | | | 1.86 | | | | (0.54 | ) | | | 37 | |
Year ended 10/31/12 | | | 23.26 | | | | (0.09 | ) | | | 4.06 | | | | 3.97 | | | | — | | | | (0.48 | ) | | | (0.48 | ) | | | 26.75 | | | | 17.48 | | | | 35,388 | | | | 1.92 | | | | 1.93 | | | | (0.35 | ) | | | 39 | |
Year ended 10/31/11 | | | 22.09 | | | | (0.20 | ) | | | 1.37 | (f) | | | 1.17 | | | | — | | | | — | | | | — | | | | 23.26 | | | | 5.30 | (f) | | | 32,702 | | | | 1.95 | | | | 1.96 | | | | (0.84 | ) | | | 37 | |
Class Y | |
Year ended 10/31/15 | | | 47.51 | | | | 0.14 | | | | 1.53 | | | | 1.67 | | | | (0.01 | ) | | | (4.93 | ) | | | (4.94 | ) | | | 44.24 | | | | 3.82 | | | | 39,443 | | | | 0.79 | (e) | | | 0.80 | (e) | | | 0.29 | (e) | | | 47 | |
Year ended 10/31/14 | | | 40.71 | | | | 0.13 | | | | 10.22 | | | | 10.35 | | | | (0.10 | ) | | | (3.45 | ) | | | (3.55 | ) | | | 47.51 | | | | 27.52 | | | | 31,016 | | | | 0.82 | | | | 0.83 | | | | 0.29 | | | | 24 | |
Year ended 10/31/13 | | | 32.34 | | | | 0.16 | | | | 10.70 | | | | 10.86 | | | | (0.25 | ) | | | (2.24 | ) | | | (2.49 | ) | | | 40.71 | | | | 36.10 | | | | 15,502 | | | | 0.85 | | | | 0.86 | | | | 0.46 | | | | 37 | |
Year ended 10/31/12 | | | 27.96 | | | | 0.20 | | | | 4.87 | | | | 5.07 | | | | (0.21 | ) | | | (0.48 | ) | | | (0.69 | ) | | | 32.34 | | | | 18.66 | | | | 6,769 | | �� | | 0.92 | | | | 0.93 | | | | 0.65 | | | | 39 | |
Year ended 10/31/11 | | | 26.28 | | | | 0.05 | | | | 1.63 | (f) | | | 1.68 | | | | — | | | | — | | | | — | | | | 27.96 | | | | 6.39 | (f) | | | 5,628 | | | | 0.95 | | | | 0.96 | | | | 0.16 | | | | 37 | |
Investor Class | |
Year ended 10/31/15 | | | 47.09 | | | | 0.02 | | | | 1.53 | | | | 1.55 | | | | — | | | | (4.93 | ) | | | (4.93 | ) | | | 43.71 | | | | 3.57 | | | | 714,351 | | | | 1.04 | (e) | | | 1.05 | (e) | | | 0.04 | (e) | | | 47 | |
Year ended 10/31/14 | | | 40.39 | | | | 0.01 | | | | 10.15 | | | | 10.16 | | | | (0.01 | ) | | | (3.45 | ) | | | (3.46 | ) | | | 47.09 | | | | 27.19 | | | | 730,280 | | | | 1.07 | | | | 1.08 | | | | 0.04 | | | | 24 | |
Year ended 10/31/13 | | | 32.10 | | | | 0.07 | | | | 10.63 | | | | 10.70 | | | | (0.17 | ) | | | (2.24 | ) | | | (2.41 | ) | | | 40.39 | | | | 35.78 | | | | 607,408 | | | | 1.10 | | | | 1.11 | | | | 0.21 | | | | 37 | |
Year ended 10/31/12 | | | 27.76 | | | | 0.12 | | | | 4.84 | | | | 4.96 | | | | (0.14 | ) | | | (0.48 | ) | | | (0.62 | ) | | | 32.10 | | | | 18.34 | | | | 481,385 | | | | 1.17 | | | | 1.18 | | | | 0.40 | | | | 39 | |
Year ended 10/31/11 | | | 26.16 | | | | (0.03 | ) | | | 1.63 | (f) | | | 1.60 | | | | — | | | | — | | | | — | | | | 27.76 | | | | 6.12 | (f) | | | 446,149 | | | | 1.20 | | | | 1.21 | | | | (0.09 | ) | | | 37 | |
| (a) | Calculated using average shares outstanding. |
| (b) | Includes redemption fees added to shares of beneficial interest for Class A, Class B, Class C, Class Y and Investor Class shares which were less than $0.005 per share, for fiscal years ended October 31, 2012 and prior. |
| (c) | Includes adjustments in accordance with accounting principles generally accepted in the United States of America and as such, the net asset value for financial reporting purposes and the returns based upon those net asset values may differ from the net asset value and returns for shareholder transactions. Does not include sales charges and is not annualized for periods less than one year, if applicable. |
| (d) | Portfolio turnover is calculated at the fund level and is not annualized for periods less than one year, if applicable. For the period ended October 31, 2011, the portfolio turnover calculation excludes the value of securities purchased of $121,012,126 and sold of $51,261,834 in the effort to realign the Fund’s portfolio holdings after the reorganization of Invesco Health Sciences Fund into the Fund. |
| (e) | Ratios are based on average daily net assets (000’s omitted) of $1,020,366, $13,917, $101,882, $39,005 and $767,775 for Class A, Class B, Class C, Class Y and Investor Class shares, respectively. |
| (f) | Includes litigation proceeds received during the period. Had the litigation proceeds not been received net gains on securities (both realized and unrealized) per share for the year ended October 31, 2011 would have been $1.44, $1.18, $1.18, $1.44 and $1.44 for Class A, Class B, Class C, Class Y and Investor Class shares, respectively and total returns would have been lower. |
21 Invesco Global Health Care Fund
Report of Independent Registered Public Accounting Firm
To the Board of Trustees of AIM Investment Funds (Invesco Investment Funds)
and Shareholders of Invesco Global Health Care Fund:
In our opinion, the accompanying statement of assets and liabilities, including the schedule of investments, and the related statements of operations and of changes in net assets and the financial highlights present fairly, in all material respects, the financial position of Invesco Global Health Care Fund (one of the funds constituting AIM Investment Funds (Invesco Investment Funds), hereafter referred to as the “Fund”) at October 31, 2015, the results of its operations for the year then ended, the changes in its net assets for each of the two years in the period then ended and the financial highlights for each of the five years in the period then ended, in conformity with accounting principles generally accepted in the United States of America. These financial statements and financial highlights (hereafter referred to as “financial statements”) are the responsibility of the Fund’s management. Our responsibility is to express an opinion on these financial statements based on our audits. We conducted our audits of these financial statements in accordance with the standards of the Public Company Accounting Oversight Board (United States). Those standards require that we plan and perform the audit to obtain reasonable assurance about whether the financial statements are free of material misstatement. An audit includes examining, on a test basis, evidence supporting the amounts and disclosures in the financial statements, assessing the accounting principles used and significant estimates made by management, and evaluating the overall financial statement presentation. We believe that our audits, which included confirmation of securities at October 31, 2015 by correspondence with the custodian and brokers, and the application of alternative auditing procedures where confirmations of security purchases have not been received, provide a reasonable basis for our opinion.
PRICEWATERHOUSECOOPERS LLP
December 23, 2015
Houston, Texas
22 Invesco Global Health Care Fund
Calculating your ongoing Fund expenses
Example
As a shareholder of the Fund, you incur two types of costs: (1) transaction costs, which may include sales charges (loads) on purchase payments or contingent deferred sales charges on redemptions, if any; and (2) ongoing costs, including management fees, distribution and/or service (12b-1) fees, and other Fund expenses. This example is intended to help you understand your ongoing costs (in dollars) of investing in the Fund and to compare these costs with ongoing costs of investing in other mutual funds. The example is based on an investment of $1,000 invested at the beginning of the period and held for the entire period May 1, 2015 through October 31, 2015.
Actual expenses
The table below provides information about actual account values and actual expenses. You may use the information in this table, together with the amount you invested, to estimate the expenses that you paid over the period. Simply divide your account value by $1,000 (for example, an $8,600 account value divided by $1,000 = 8.6), then multiply the result by the number in the table under the heading entitled “Actual Expenses Paid During Period” to estimate the expenses you paid on your account during this period.
Hypothetical example for comparison purposes
The table below also provides information about hypothetical account values and hypothetical expenses based on the Fund’s actual expense ratio and an assumed rate of return of 5% per year before expenses, which is not the Fund’s actual return.
The hypothetical account values and expenses may not be used to estimate the actual ending account balance or expenses you paid for the period. You may use this information to compare the ongoing costs of investing in the Fund and other funds. To do so, compare this 5% hypothetical example with the 5% hypothetical examples that appear in the shareholder reports of the other funds.
Please note that the expenses shown in the table are meant to highlight your ongoing costs only and do not reflect any transaction costs, such as sales charges (loads) on purchase payments or contingent deferred sales charges on redemptions, if any. Therefore, the hypothetical information is useful in comparing ongoing costs only, and will not help you determine the relative total costs of owning different funds. In addition, if these transaction costs were included, your costs would have been higher.
| | | | | | | | | | | | | | | | | | | | | | | | |
| Class | | Beginning
Account Value
(05/01/15) | | | ACTUAL | | | HYPOTHETICAL
(5% annual return before
expenses) | | | Annualized
Expense
Ratio | |
| | | Ending
Account Value
(10/31/15)1 | | | Expenses
Paid During
Period2 | | | Ending
Account Value
(10/31/15) | | | Expenses
Paid During
Period2 | | |
| A | | $ | 1,000.00 | | | $ | 950.60 | | | $ | 5.21 | | | $ | 1,019.86 | | | $ | 5.40 | | | | 1.06 | % |
| B | | | 1,000.00 | | | | 947.20 | | | | 8.88 | | | | 1,016.08 | | | | 9.20 | | | | 1.81 | |
| C | | | 1,000.00 | | | | 947.00 | | | | 8.88 | | | | 1,016.08 | | | | 9.20 | | | | 1.81 | |
| Y | | | 1,000.00 | | | | 951.80 | | | | 3.98 | | | | 1,021.12 | | | | 4.13 | | | | 0.81 | |
| Investor | | | 1,000.00 | | | | 950.60 | | | | 5.21 | | | | 1,019.86 | | | | 5.40 | | | | 1.06 | |
| 1 | The actual ending account value is based on the actual total return of the Fund for the period May 1, 2015 through October 31, 2015, after actual expenses and will differ from the hypothetical ending account value which is based on the Fund’s expense ratio and a hypothetical annual return of 5% before expenses. |
| 2 | Expenses are equal to the Fund’s annualized expense ratio as indicated above multiplied by the average account value over the period, multiplied by 184/365 to reflect the most recent fiscal half year. |
23 Invesco Global Health Care Fund
Approval of Investment Advisory and Sub-Advisory Contracts
The Board of Trustees (the Board) of AIM Investment Funds (Invesco Investment Funds) is required under the Investment Company Act of 1940, as amended, to approve annually the renewal of Invesco Global Health Care Fund’s (the Fund) investment advisory agreements. During contract renewal meetings held on June 9-10, 2015, the Board as a whole, and the disinterested or “independent” Trustees, who comprise over 75% of the Board, voting separately, approved the continuance for the Fund of the Master Investment Advisory Agreement with Invesco Advisers, Inc. (Invesco Advisers and the investment advisory agreement) and the Master Intergroup Sub-Advisory Contract for Mutual Funds with Invesco Asset Management Deutschland GmbH, Invesco Asset Management Limited, Invesco Asset Management (Japan) Limited, Invesco Hong Kong Limited, Invesco Senior Secured Management, Inc. and Invesco Canada Ltd. (collectively, the Affiliated Sub-Advisers and the sub-advisory contracts) for another year, effective July 1, 2015.
In evaluating the fairness and reasonableness of compensation under the Fund’s investment advisory agreement and sub-advisory contracts, the Board considered, among other things, the factors discussed below. The Board determined that continuation of the Fund’s investment advisory agreement and the sub-advisory contracts are in the best interest of the Fund and its shareholders and that the compensation payable to Invesco Advisers and the Affiliated Sub-Advisers under the agreements is fair and reasonable.
The Board’s Fund Evaluation Process
The Board’s Investments Committee has established three Sub-Committees, each of which is primarily responsible for overseeing the performance and investment management services provided by Invesco Advisers and the Affiliated Sub-Advisers to a number of the funds advised by Invesco Advisers (the Invesco Funds). The Sub-Committees meet throughout the year to review the performance of their assigned Invesco Funds, including reviewing materials prepared under the direction of the independent Senior Officer, an officer of the Invesco Funds who reports directly to the independent Trustees. Over the course of each year, the Sub-Committees meet with portfolio managers for their assigned Invesco Funds and other members of management to review the performance, investment objective(s), policies, strategies, limitations and investment risks of these funds. The Board had the benefit of reports form the Sub-Committees and Investments Committee throughout the year in considering approval of the continuance of each Invesco Fund’s investment advisory agreement and sub-advisory contracts for another year.
During the contract renewal process, the Board receives comparative performance and fee data regarding the Invesco Funds prepared by Invesco Advisers and Lipper Inc. (Lipper), an independent provider of investment company data. The Board also receives a report and this independent written evaluation from the Senior Officer. The Senior Officer’s evaluation is prepared as part of his responsibility to manage the process by which the Invesco Funds’ proposed management fees are negotiated during the annual contract renewal process to ensure they are negotiated in a manner that is at arms’ length and reasonable. In addition to meetings with Invesco Advisers and fund counsel, the independent Trustees also discuss the continuance of the investment advisory agreement and sub-advisory contracts in separate sessions with the Senior Officer and with independent legal counsel.
The Trustees recognized that the advisory fee rates for the Invesco Funds are, in many cases, the result of years of review and negotiation. The Trustees’ deliberations and conclusions in a particular year may be based in part on their deliberations and conclusions regarding these same arrangements throughout the year and in prior years. The Trustees’ review and conclusions are based on the comprehensive consideration of all information presented to them and are not the result of any single determinative factor. Moreover, one Trustee may have weighed a particular piece of information or factor differently than another Trustee.
The discussion below is a summary of the Senior Officer’s independent written evaluation with respect to the Fund’s investment advisory agreement as well as a discussion of the material factors and related conclusions that formed the basis for the Board’s approval of the Fund’s investment advisory agreement and sub-advisory contracts. Unless otherwise stated, this information is current as of June 10, 2015, and does not reflect consideration of factors that became known to the Board after that date.
Factors and Conclusions and Summary of Independent Written Fee Evaluation
| A. | Nature, Extent and Quality of Services Provided by Invesco Advisers and the Affiliated Sub-Advisers |
The Board reviewed the advisory services provided to the Fund by Invesco Advisers under the Fund’s investment advisory agreement, the performance of Invesco Advisers in providing these services, and the credentials and experience of the officers and employees of Invesco Advisers who provide these services, including the Fund’s portfolio manager or managers. The Board’s review of the qualifications of Invesco Advisers to provide advisory services included the Board’s
consideration of Invesco Advisers’ investment process oversight, independent credit analysis and investment risk management. The Board also considered non-advisory services that Invesco Advisers and its affiliates provide to the Invesco Funds such as various back office support functions, equity and fixed income trading operations, internal audit, distribution, valuation and legal and compliance.
In determining whether to continue the Fund’s investment advisory agreement, the Board considered the benefits of reapproving an existing relationship and the greater uncertainty that may be associated with entering into a new relationship. The Board concluded that the nature, extent and quality of the services provided to the Fund by Invesco Advisers are appropriate and satisfactory and consistent with the terms of the Fund’s investment advisory agreement.
The Board reviewed the services that may be provided by the Affiliated Sub-Advisers under the sub-advisory contracts and the credentials and experience of the officers and employees of the Affiliated Sub-Advisers who provide these services. The Board noted that the Affiliated Sub-Advisers have offices and personnel that are located in financial centers around the world. As a result, the Affiliated Sub-Advisers can provide research and investment analysis on the markets and economies of various countries in which the Fund may invest, make recommendations regarding securities and assist with security trades. The Board concluded that the sub-advisory contracts benefit the Fund and its shareholders by permitting Invesco Advisers to use the resources and talents of the Affiliated Sub-Advisers in managing the Fund. The Board concluded that the nature, extent and quality of the services that may be provided by the Affiliated Sub-Advisers are appropriate and satisfactory and consistent with the terms of the Fund’s sub-advisory contracts.
The Board considered Fund performance as a relevant factor in considering whether to approve the investment advisory agreement. The Board did not view Fund performance as a relevant factor in considering whether to approve the sub-advisory contracts for the Fund, as no Affiliated Sub-Adviser currently manages assets of the Fund.
The Board compared the Fund’s performance during the past one, three and five calendar years to the performance of funds in the Lipper performance universe and against the Lipper Global Health/Biotechnology Funds Index. The Board noted that performance of Class A shares of the Fund was in the fourth quintile of its performance universe for the one, three and five year periods (the first quintile being the best performing funds and the fifth quintile being the worst performing funds). The Board noted that performance of Class A shares of the
24 Invesco Global Health Care Fund
Fund was below the performance of the Index for the one, three and five year periods. Invesco Advisers noted that the Fund was under allocated to Pharmaceuticals. The Trustees also reviewed more recent Fund performance and this review did not change their conclusions.
| C. | Advisory and Sub-Advisory Fees |
The Board compared the Fund’s contractual management fee rate to the contractual management fee rates of funds in the Fund’s Lipper expense group at a common asset level. The Board noted that the contractual management fee rate for Class A shares of the Fund was below the median contractual management fee rate of funds in its expense group. The Board noted that the term “contractual management fee” may include both advisory and certain administrative services fees, but that Lipper does not provide information on a fund by fund basis as to what is included. The Board noted that Invesco Advisers does not charge the Invesco Funds for the administrative services included in the term as defined by Lipper. The Board also reviewed the methodology used by Lipper in providing expense group information, which includes using each fund’s contractual management fee schedule (including any applicable breakpoints) as reported in the most recent prospectus or statement of additional information for each fund in the expense group.
The Board also compared the Fund’s effective advisory fee rate (the advisory fee rate after advisory fee waivers and before other expense limitations/waivers) to the effective advisory fee rates of other funds advised by Invesco Advisers and its affiliates with investment strategies comparable to those of the Fund. The Board noted that the Fund’s rate was below the effective advisory fee rate of one off-shore fund advised by Invesco Advisers. The Board noted that Invesco Advisers and the Affiliated Sub-Advisers do not manage other client accounts with investment strategies comparable to those of the Fund.
The Board also considered the services that may be provided by the Affiliated Sub-Advisers pursuant to the sub-advisory contracts, as well as the fees payable by Invesco Advisers to the Affiliated Sub-Advisers pursuant to the sub-advisory contracts. The Board also noted that the sub-advisory fees are not paid directly by the Fund, but rather, are payable by Invesco Advisers to the Affiliated Sub-Advisers.
| D. | Economies of Scale and Breakpoints |
The Board considered the extent to which there are economies of scale in the provision of advisory services to the Fund. The Board also considered whether the Fund benefits from economies of scale through contractual breakpoints in the Fund’s advisory fee schedule. The Board also noted that the Fund shares directly in economies of scale through lower fees charged by third party service providers based on the combined size of the Invesco Funds and other clients advised by Invesco Advisers.
| E. | Profitability and Financial Resources |
The Board reviewed information from Invesco Advisers concerning the costs of the advisory and other services that Invesco Advisers and its affiliates provide to the Fund and the Invesco Funds and the profitability of Invesco Advisers and its affiliates in providing these services. The Board received information from Invesco Advisers about the methodology used to prepare the profitability information. The Board noted that Invesco Advisers continues to operate at a net profit from services Invesco Advisers and its affiliates provide to the Invesco Funds and the Fund. The Board did not deem the level of profits realized by Invesco Advisers and its affiliates from providing services to the Fund to be excessive given the nature, quality and extent of the services provided. The Board received and accepted information from Invesco Advisers demonstrating that Invesco Advisers and each Affiliated Sub-Adviser are financially sound and have the resources necessary to perform their obligations under the investment advisory agreement and sub-advisory contracts.
| F. | Collateral Benefits to Invesco Advisers and its Affiliates |
The Board considered various other benefits received by Invesco Advisers and its affiliates from the relationship with the Fund, including the fees received for providing transfer agency and distribution services to the Fund. The Board considered comparative information regarding fees charged for these services, including information provided by Lipper and other independent sources. The Board considered the performance of Invesco Advisers and its affiliates in providing these services and the organizational structure employed to provide these services. The Board also considered that these services are provided to the Fund pursuant to written contracts that are reviewed and approved on an annual basis by the Board; and that the services are required for the operation of the Fund.
The Board considered the benefits realized by Invesco Advisers and the Affiliated Sub-Advisers as a result of portfolio brokerage transactions executed through “soft dollar” arrangements. The Board noted that soft dollar arrangements shift the payment obligation for research services from Invesco Advisers and the Affiliated Sub-Advisers to the Invesco Funds and that the research received may be used with other clients of Invesco Advisers and may reduce Invesco Advisers’ and the Affiliated Sub-Advisers’ expenses. The Board also considered that it receives periodic reports from the Chief Compliance Officer of the Invesco Funds demonstrating that these arrangements are consistent with regulatory requirements. The Board did not deem the soft dollar arrangements to be inappropriate.
The Board considered that the Fund’s uninvested cash and cash collateral from any securities lending arrangements may be invested in money market funds advised by Invesco Advisers pursuant to procedures approved by the Board. The Board noted that
Invesco Advisers receives advisory fees from these affiliated money market funds attributable to such investments, although Invesco Advisers has contractually agreed to waive through varying periods the advisory fees payable by the Invesco Funds with respect to investments in the affiliated money market funds. The waiver is in an amount equal to 100% of the net advisory fee Invesco Advisers receives from the affiliated money market funds with respect to the Fund’s investment in the affiliated money market funds of uninvested cash, but not cash collateral. The Board concluded that the amount of advisory fees received by Invesco Advisors from the Fund’s investment of cash collateral from any securities lending arrangements in the affiliated money market funds is fair and reasonable.
The Board also considered the Fund may use an affiliated broker to execute certain trades for the Fund to among other things, control information leakage, and were advised that such trades would be executed in compliance with rules under the Investment Company Act of 1940, as amended, and consistent with best execution obligations.
25 Invesco Global Health Care Fund
Tax Information
Form 1099-DIV, Form 1042-S and other year-end tax information provide shareholders with actual calendar year amounts that should be included in their tax returns. Shareholders should consult their tax advisors.
The following distribution information is being provided as required by the Internal Revenue Code or to meet a specific state’s requirement.
The Fund designates the following amounts or, if subsequently determined to be different, the maximum amount allowable for its fiscal year ended October 31, 2015:
| | | | |
Federal and State Income Tax | |
Long-Term Capital Gain Distributions | | $ | 189,257,250 | |
Qualified Dividend Income* | | | 100 | % |
Corporate Dividends Received Deduction* | | | 98.86 | % |
U.S. Treasury Obligations* | | | 0 | % |
| | * | The above percentages are based on ordinary income dividends paid to shareholders during the Fund’s fiscal year. |
| | | | |
Non-Resident Alien Shareholders | |
Qualified Short-Term Gains | | $ | 270,009 | |
26 Invesco Global Health Care Fund
Trustees and Officers
The address of each trustee and officer is AIM Investment Funds (Invesco Investment Funds) (the “Trust”), 11 Greenway Plaza, Suite 1000, Houston, Texas 77046-1173. The trustees serve for the life of the Trust, subject to their earlier death, incapacitation, resignation, retirement or removal as more specifically provided in the Trust’s organizational documents. Each officer serves for a one year term or until their successors are elected and qualified. Column two below includes length of time served with predecessor entities, if any.
| | | | | | | | |
Name, Year of Birth and
Position(s) Held with the Trust | | Trustee and/
or Officer Since | | Principal Occupation(s)
During Past 5 Years | | Number of Funds in Fund Complex Overseen by Trustee | | Other Directorship(s) Held by Trustee During Past 5 Years |
| Interested Persons | | | | | | | | |
| Martin L. Flanagan1 — 1960 Trustee | | 2007 | | Executive Director, Chief Executive Officer and President, Invesco Ltd. (ultimate parent of Invesco and a global investment management firm); Advisor to the Board, Invesco Advisers, Inc. (formerly known as Invesco Institutional (N.A.), Inc.); Trustee, The Invesco Funds; Vice Chair, Investment Company Institute; and Member of Executive Board, SMU Cox School of Business Formerly: Chairman and Chief Executive Officer, Invesco Advisers, Inc. (registered investment adviser); Director, Chairman, Chief Executive Officer and President, IVZ Inc. (holding company), INVESCO Group Services, Inc. (service provider) and Invesco North American Holdings, Inc. (holding company); Director, Chief Executive Officer and President, Invesco Holding Company Limited (parent of Invesco and a global investment management firm); Director, Invesco Ltd.; Chairman, Investment Company Institute and President, Co-Chief Executive Officer, Co-President, Chief Operating Officer and Chief Financial Officer, Franklin Resources, Inc. (global investment management organization). | | 145 | | None |
Philip A. Taylor2 — 1954
Trustee, President and Principal Executive Officer | | 2006 | | Head of North American Retail and Senior Managing Director, Invesco Ltd.; Director, Co-Chairman, Co-President and Co-Chief Executive Officer, Invesco Advisers, Inc. (formerly known as Invesco Institutional (N.A.), Inc.) (registered investment adviser); Director, Chairman, Chief Executive Officer and President, Invesco Management Group, Inc. (formerly known as Invesco Aim Management Group, Inc.) (financial services holding company); Director and President, INVESCO Funds Group, Inc. (registered investment adviser and registered transfer agent); Director and Chairman, Invesco Investment Services, Inc. (formerly known as Invesco Aim Investment Services, Inc.) (registered transfer agent) and IVZ Distributors, Inc. (formerly known as INVESCO Distributors, Inc.) (registered broker dealer); Chief Executive Officer, Invesco Corporate Class Inc. (corporate mutual fund company) Director, Chairman and Chief Executive Officer, Invesco Canada Ltd. (formerly known as Invesco Trimark Ltd./Invesco Trimark Ltèe) (registered investment adviser and registered transfer agent); Trustee, President and Principal Executive Officer, The Invesco Funds (other than AIM Treasurer’s Series Trust (Invesco Treasurer’s Series Trust), Short-Term Investments Trust and Invesco Management Trust); Trustee and Executive Vice President, The Invesco Funds (AIM Treasurer’s Series Trust (Invesco Treasurer’s Series Trust), Short-Term Investments Trust and Invesco Management Trust only); Director, Invesco Investment Advisers LLC (formerly known as Van Kampen Asset Management); Director, Chief Executive Officer and President, Van Kampen Exchange Corp. Formerly: Director, President and Chairman, Invesco Inc. (holding company), Invesco Canada Holdings Inc. (holding company), Trimark Investments Ltd./Placements Trimark Ltèe and Invesco Financial Services Ltd/Services Financiers Invesco Ltèe; Chief Executive Officer, Invesco Canada Fund Inc (corporate mutual fund company); Director and Chairman, Van Kampen Investor Services Inc.; Director, Chief Executive Officer and President, 1371 Preferred Inc. (holding company) and Van Kampen Investments Inc.; Director and President, AIM GP Canada Inc. (general partner for limited partnerships) and Van Kampen Advisors, Inc.; Director and Chief Executive Officer, Invesco Trimark Dealer Inc. (registered broker dealer); Director, Invesco Distributors, Inc. (formerly known as Invesco Aim Distributors, Inc.) (registered broker dealer); Manager, Invesco PowerShares Capital Management LLC; Director, Chief Executive Officer and President, Invesco Advisers, Inc.; Director, Chairman, Chief Executive Officer and President, Invesco Aim Capital Management, Inc.; President, Invesco Trimark Dealer Inc. and Invesco Trimark Ltd./Invesco Trimark Ltèe; Director and President, AIM Trimark Corporate Class Inc. and AIM Trimark Canada Fund Inc.; Senior Managing Director, Invesco Holding Company Limited; Director and Chairman, Fund Management Company (former registered broker dealer); President and Principal Executive Officer, The Invesco Funds (AIM Treasurer’s Series Trust (Invesco Treasurer’s Series Trust), and Short-Term Investments Trust only); President, AIM Trimark Global Fund Inc. and AIM Trimark Canada Fund Inc.. | | 145 | | None |
| 1 | Mr. Flanagan is considered an interested person (within the meaning of Section 2(a)(19) of the 1940 Act) of the Trust because he is an officer of the Adviser to the Trust, and an officer and a director of Invesco Ltd., ultimate parent of the Adviser. |
| 2 | Mr. Taylor is considered an interested person (within the meaning of Section 2(a)(19) of the 1940 Act) of the Trust because he is an officer and a director of the Adviser. |
T-1 Invesco Global Health Care Fund
Trustees and Officers—(continued)
| | | | | | | | |
Name, Year of Birth and Position(s) Held with the Trust | | Trustee and/ or Officer Since | | Principal Occupation(s) During Past 5 Years | | Number of Funds in Fund Complex Overseen by Trustee | | Other Directorship(s) Held by Trustee During Past 5 Years |
| Independent Trustees | | | | | | | | |
Bruce L. Crockett — 1944 Trustee and Chair | | 2003 | | Chairman, Crockett Technologies Associates (technology consulting company) Formerly: Director, Captaris (unified messaging provider); Director, President and Chief Executive Officer, COMSAT Corporation; Chairman, Board of Governors of INTELSAT (international communications company); ACE Limited (insurance company); Independent Directors Council and Investment Company Institute | | 145 | | ALPS (Attorneys Liability Protection Society) (insurance company) and Globe Specialty Metals, Inc. (metallurgical company) |
David C. Arch — 1945 Trustee | | 2010 | | Chairman of Blistex Inc., a consumer health care products manufacturer | | 145 | | Board member of the Illinois Manufacturers’ Association; Member of the Board of Visitors, Institute for the Humanities, University of Michigan; Member of the Audit Committee of the Edward-Elmhurst Hospital |
James T. Bunch — 1942 Trustee | | 2000 | | Managing Member, Grumman Hill Group LLC (family office/private equity investments) Formerly: Founder, Green Manning & Bunch Ltd. (investment banking firm) (1988-2010); Executive Committee, United States Golf Association; and Chairman, Board of Governors, Western Golf Association | | 145 | | Chairman of the Board of Trustees, Evans Scholars Foundation; and Chairman of the Board, Denver Film Society |
Rodney F. Dammeyer — 1940 Trustee | | 2010 | | Chairman of CAC, LLC, (private company offering capital investment and management advisory services) Formerly: Prior to 2001, Managing Partner at Equity Group Corporate Investments; Prior to 1995, Chief Executive Officer of Itel Corporation (formerly Anixter International); Prior to 1985, experience includes Senior Vice President and Chief Financial Officer of Household International, Inc., Executive Vice President and Chief Financial Officer of Northwest Industries, Inc. and Partner of Arthur Andersen & Co.; From 1987 to 2010, Director/Trustee of investment companies in the Van Kampen Funds complex | | 145 | | Director of Quidel Corporation and Stericycle, Inc. |
Albert R. Dowden — 1941 Trustee | | 2003 | | Director of a number of public and private business corporations, including the Boss Group, Ltd. (private investment and management); Nature’s Sunshine Products, Inc. and Reich & Tang Funds (5 portfolios) (registered investment company) Formerly: Director, Homeowners of America Holding Corporation/Homeowners of America Insurance Company (property casualty company); Director, Continental Energy Services, LLC (oil and gas pipeline service); Director, CompuDyne Corporation (provider of product and services to the public security market) and Director, Annuity and Life Re (Holdings), Ltd. (reinsurance company); Director, President and Chief Executive Officer, Volvo Group North America, Inc.; Senior Vice President, AB Volvo; Director of various public and private corporations; Chairman, DHJ Media, Inc.; Director, Magellan Insurance Company; and Director, The Hertz Corporation, Genmar Corporation (boat manufacturer), National Media Corporation; Advisory Board of Rotary Power International (designer, manufacturer, and seller of rotary power engines); and Chairman, Cortland Trust, Inc. (registered investment company) | | 145 | | Director of: Nature’s Sunshine Products, Inc., Reich & Tang Funds, Homeowners of America Holding Corporation/ Homeowners of America Insurance Company, the Boss Group |
Jack M. Fields — 1952 Trustee | | 2003 | | Chief Executive Officer, Twenty First Century Group, Inc. (government affairs company); Owner and Chief Executive Officer, Dos Angeles Ranch, L.P. (cattle, hunting, corporate entertainment); and Discovery Global Education Fund (non-profit) Formerly: Chief Executive Officer, Texana Timber LP (sustainable forestry company); Director of Cross Timbers Quail Research Ranch (non-profit); and member of the U.S. House of Representatives | | 145 | | Insperity, Inc. (formerly known as Administaff) |
Prema Mathai-Davis — 1950 Trustee | | 2003 | | Retired. Formerly: Chief Executive Officer, YWCA of the U.S.A. | | 145 | | None |
Larry Soll — 1942 Trustee | | 1997 | | Retired. Formerly: Chairman, Chief Executive Officer and President, Synergen Corp. (a biotechnology company) | | 145 | | None |
Hugo F. Sonnenschein — 1940 Trustee | | 2010 | | President Emeritus and Honorary Trustee of the University of Chicago and the Adam Smith Distinguished Service Professor in the Department of Economics at the University of Chicago. Prior to 2000, President of the University of Chicago | | 145 | | Trustee of the University of Rochester and a member of its investment committee; Member of the National Academy of Sciences and the American Philosophical Society; Fellow of the American Academy of Arts and Sciences |
Raymond Stickel, Jr. — 1944 Trustee | | 2005 | | Retired. Formerly: Director, Mainstay VP Series Funds, Inc. (25 portfolios) and Partner, Deloitte & Touche | | 145 | | None |
T-2 Invesco Global Health Care Fund
Trustees and Officers—(continued)
| | | | | | | | |
Name, Year of Birth and Position(s) Held with the Trust | | Trustee and/ or Officer Since | | Principal Occupation(s) During Past 5 Years | | Number of Funds in Fund Complex Overseen by Trustee | | Other Directorship(s) Held by Trustee During Past 5 Years |
| Independent Trustees—(continued) |
Suzanne H. Woolsey — 1941 Trustee | | 2014 | | Chief Executive Officer of Woolsey Partners LLC | | 145 | | Emeritus Chair of the Board of Trustees of the Institute for Defense Analyses; Trustee of Colorado College; Trustee of California Institute of Technology; Prior to 2014, Director of Fluor Corp.; Prior to 2010, Trustee of the German Marshall Fund of the United States; Prior to 2010 Trustee of the Rocky Mountain Institute |
| Other Officers | | | | | | | | |
Russell C. Burk — 1958
Senior Vice President and Senior Officer | | 2005 | | Senior Vice President and Senior Officer, The Invesco Funds | | N/A | | N/A |
John M. Zerr — 1962
Senior Vice President, Chief Legal Officer and Secretary | | 2006 | | Director, Senior Vice President, Secretary and General Counsel, Invesco Management Group, Inc. (formerly known as Invesco Aim Management Group, Inc.) and Van Kampen Exchange Corp.; Senior Vice President, Invesco Advisers, Inc. (formerly known as Invesco Institutional (N.A.), Inc.) (registered investment adviser); Senior Vice President and Secretary, Invesco Distributors, Inc. (formerly known as Invesco Aim Distributors, Inc.); Director, Vice President and Secretary, Invesco Investment Services, Inc. (formerly known as Invesco Aim Investment Services, Inc.) and IVZ Distributors, Inc. (formerly known as INVESCO Distributors, Inc.); Director and Vice President, INVESCO Funds Group, Inc.; Senior Vice President, Chief Legal Officer and Secretary, The Invesco Funds; Managing Director, Invesco PowerShares Capital Management LLC; Director, Secretary and General Counsel, Invesco Investment Advisers LLC (formerly known as Van Kampen Asset Management); Secretary and General Counsel, Invesco Capital Markets, Inc. (formerly known as Van Kampen Funds Inc.) and Chief Legal Officer, PowerShares Exchange-Traded Fund Trust, PowerShares Exchange-Traded Fund Trust II, PowerShares India Exchange-Traded Fund Trust, PowerShares Actively Managed Exchange-Traded Fund Trust, and PowerShares Actively Managed Exchange-Traded Commodity Fund Trust Formerly: Director and Vice President, Van Kampen Advisors Inc.; Director, Vice President, Secretary and General Counsel, Van Kampen Investor Services Inc.; Director, Invesco Distributors, Inc. (formerly known as Invesco Aim Distributors, Inc.); Director, Senior Vice President, General Counsel and Secretary, Invesco Aim Advisers, Inc. and Van Kampen Investments Inc.; Director, Vice President and Secretary, Fund Management Company; Director, Senior Vice President, Secretary, General Counsel and Vice President, Invesco Aim Capital Management, Inc.; Chief Operating Officer and General Counsel, Liberty Ridge Capital, Inc. (an investment adviser); Vice President and Secretary, PBHG Funds (an investment company) and PBHG Insurance Series Fund (an investment company); Chief Operating Officer, General Counsel and Secretary, Old Mutual Investment Partners (a broker-dealer); General Counsel and Secretary, Old Mutual Fund Services (an administrator) and Old Mutual Shareholder Services (a shareholder servicing center); Executive Vice President, General Counsel and Secretary, Old Mutual Capital, Inc. (an investment adviser); and Vice President and Secretary, Old Mutual Advisors Funds (an investment company) | | N/A | | N/A |
Sheri Morris — 1964
Vice President, Treasurer and Principal Financial Officer | | 2003 | | Vice President, Treasurer and Principal Financial Officer, The Invesco Funds; Vice President, Invesco Advisers, Inc. (formerly known as Invesco Institutional (N.A.), Inc.) (registered investment adviser); and Vice President, PowerShares Exchange-Traded Fund Trust, PowerShares Exchange-Traded Fund Trust II, PowerShares India Exchange-Traded Fund Trust, PowerShares Actively Managed Exchange-Traded Fund Trust, and PowerShares Actively Managed Exchange-Traded Commodity Fund Trust Formerly: Vice President, Invesco Aim Advisers, Inc., Invesco Aim Capital Management, Inc. and Invesco Aim Private Asset Management, Inc.; Assistant Vice President and Assistant Treasurer, The Invesco Funds and Assistant Vice President, Invesco Advisers, Inc., Invesco Aim Capital Management, Inc. and Invesco Aim Private Asset Management, Inc.; and Treasurer, PowerShares Exchange-Traded Fund Trust, PowerShares Exchange-Traded Fund Trust II, PowerShares India Exchange-Traded Fund Trust and PowerShares Actively Managed Exchange-Traded Fund Trust | | N/A | | N/A |
T-3 Invesco Global Health Care Fund
Trustees and Officers—(continued)
| | | | | | | | |
Name, Year of Birth and
Position(s) Held with the Trust | | Trustee and/
or Officer Since | | Principal Occupation(s)
During Past 5 Years | | Number of Funds in Fund Complex Overseen by Trustee | | Other Directorship(s) Held by Trustee During Past 5 Years |
| Other Officers—(continued) | | | | | | | | |
Karen Dunn Kelley — 1960
Vice President | | 2003 | | Senior Managing Director, Investments, Invesco Ltd.; Director, Co-President, Co-Chief Executive Officer, and Co-Chairman, Invesco Advisers, Inc. (formerly known as Invesco Institutional (N.A.), Inc.) (registered investment adviser); Chairman, Invesco Senior Secured Management, Inc.; Senior Vice President, Invesco Management Group, Inc. (formerly known as Invesco Aim Management Group, Inc.); Executive Vice President, Invesco Distributors, Inc. (formerly known as Invesco Aim Distributors, Inc.); Director, Invesco Mortgage Capital Inc. and Invesco Management Company Limited; Vice President, The Invesco Funds (other than AIM Treasurer’s Series Trust (Invesco Treasurer’s Series Trust), Short-Term Investments Trust and Invesco Management Trust); and President and Principal Executive Officer, The Invesco Funds (AIM Treasurer’s Series Trust (Invesco Treasurer’s Series Trust), Short-Term Investments Trust and Invesco Management Trust only) Formerly: Director and President, INVESCO Asset Management (Bermuda) Ltd., Director, INVESCO Global Asset Management Limited and INVESCO Management S.A.; Senior Vice President, Van Kampen Investments Inc. and Invesco Advisers, Inc. (formerly known as Invesco Institutional (N.A.), Inc.) (registered investment adviser); Vice President, Invesco Advisers, Inc. (formerly known as Invesco Institutional (N.A.), Inc.); Director of Cash Management and Senior Vice President, Invesco Advisers, Inc. and Invesco Aim Capital Management, Inc.; Director and President, Fund Management Company; Chief Cash Management Officer, Director of Cash Management, Senior Vice President, and Managing Director, Invesco Aim Capital Management, Inc.; Director of Cash Management, Senior Vice President, and Vice President, Invesco Advisers, Inc. and The Invesco Funds (AIM Treasurer’s Series Trust (Invesco Treasurer’s Series Trust), and Short-Term Investments Trust only) | | N/A | | N/A |
Crissie M. Wisdom — 1969 Anti-Money Laundering Compliance Officer | | 2013 | | Anti-Money Laundering Compliance Officer, Invesco Advisers, Inc. (formerly known as Invesco Institutional (N.A.), Inc.) (registered investment adviser), Invesco Capital Markets, Inc. (formerly known as Van Kampen Funds Inc.), Invesco Distributors, Inc., Invesco Investment Services, Inc., Invesco Management Group, Inc., Van Kampen Exchange Corp., The Invesco Funds, and PowerShares Exchange-Traded Fund Trust, PowerShares Exchange-Traded Fund Trust II, PowerShares India Exchange-Traded Fund Trust, PowerShares Actively Managed Exchange-Traded Fund Trust and PowerShares Actively Managed Exchange-Traded Commodity Fund Trust; Anti-Money Laundering Compliance Officer and Bank Secrecy Act Officer, INVESCO National Trust Company and Invesco Trust Company; and Fraud Prevention Manager and Controls and Risk Analysis Manager for Invesco Investment Services, Inc.. | | N/A | | N/A |
Lisa O. Brinkley — 1959 Chief Compliance Officer | | 2015 | | Senior Vice President and Chief Compliance Officer, Invesco Advisers, Inc. (registered investment adviser) (formerly known as Invesco Institutional (N.A., Inc.); and Chief Compliance Officer, The Invesco Funds Formerly: Global Assurance Officer, Invesco Ltd. and Vice President, The Invesco Funds; Chief Compliance Officer, Invesco Distributors, Inc. (formerly known as Invesco Aim Distributors, Inc.), Invesco Investment Services, Inc.(formerly known as Invesco Aim Investment Services, Inc.) and Van Kampen Investor Services Inc.; Senior Vice President, Invesco Management Group, Inc.; Senior Vice President and Chief Compliance Officer, Invesco Advisers, Inc. and The Invesco Funds; Vice President and Chief Compliance Officer, Invesco Aim Capital Management, Inc. and Invesco Distributors, Inc.; Vice President, Invesco Investment Services, Inc. and Fund Management Company. | | N/A | | N/A |
The Statement of Additional Information of the Trust includes additional information about the Fund’s Trustees and is available upon request, without charge, by calling 1.800.959.4246. Please refer to the Fund’s prospectus for information on the Fund’s sub-advisers.
| | | | | | |
Office of the Fund 11 Greenway Plaza, Suite 1000 Houston, TX 77046-1173 | | Investment Adviser Invesco Advisers, Inc. 1555 Peachtree Street, N.E. Atlanta, GA 30309 | | Distributor
Invesco Distributors, Inc. 11 Greenway Plaza, Suite 1000 Houston, TX 77046-1173 | | Auditors PricewaterhouseCoopers LLP 1000 Louisiana Street, Suite 5800 Houston, TX 77002-5678 |
| | | |
| | | | | | |
Counsel to the Fund Stradley Ronon Stevens & Young, LLP 2005 Market Street, Suite 2600 Philadelphia, PA 19103-7018 | | Counsel to the Independent Trustees Goodwin Procter LLP 901 New York Avenue, N.W. Washington, D.C. 20001 | | Transfer Agent Invesco Investment Services, Inc. 11 Greenway Plaza, Suite 1000 Houston, TX 77046-1173 | | Custodian State Street Bank and Trust Company 225 Franklin Street Boston, MA 02110-2801 |
T-4 Invesco Global Health Care Fund

Invesco mailing information
Send general correspondence to Invesco Investment Services, Inc., P.O. Box 219078, Kansas City, MO 64121-9078.
Important notice regarding delivery of security holder documents
To reduce Fund expenses, only one copy of most shareholder documents may be mailed to shareholders with multiple accounts at the same address (Householding). Mailing of your shareholder documents may be householded indefinitely unless you instruct us otherwise. If you do not want the mailing of these documents to be combined with those for other members of your household, please contact Invesco Investment Services, Inc. at 800 959 4246 or contact your financial institution. We will begin sending you individual copies for each account within 30 days after receiving your request.
Fund holdings and proxy voting information
The Fund provides a complete list of its holdings four times in each fiscal year, at the quarter ends. For the second and fourth quarters, the lists appear in the Fund’s semiannual and annual reports to shareholders. For the first and third quarters, the Fund files the lists with the Securities and Exchange Commission (SEC) on Form N-Q. The most recent list of portfolio holdings is available at invesco.com/completeqtrholdings. Shareholders can also look up the Fund’s Forms N-Q on the SEC website at sec.gov. Copies of the Fund’s Forms N-Q may be reviewed and copied at the SEC Public Reference Room in Washington, D.C. You can obtain information on the operation of the Public Reference Room, including information about duplicating fee charges, by calling 202 551 8090 or 800 732 0330, or by electronic request at the following email address: publicinfo@sec.gov. The SEC file numbers for the Fund are shown below.
A description of the policies and procedures that the Fund uses to determine how to vote proxies relating to portfolio securities is available without charge, upon request, from our Client Services department at 800 959 4246 or at invesco.com/proxyguidelines. The information is also available on the SEC website, sec.gov.
| | |
Information regarding how the Fund voted proxies related to its portfolio securities during the most recent 12-month period ended June 30 is available at invesco.com/proxysearch. The information is also available on the SEC website, sec.gov. Invesco Advisers, Inc. is an investment adviser; it provides investment advisory services to individual and institutional clients and does not sell securities. Invesco Distributors, Inc. is the US distributor for Invesco Ltd.’s retail mutual funds, exchange-traded funds and institutional money market funds. Both are wholly owned, indirect subsidiaries of Invesco Ltd. | |  |
| | | | |
| SEC file numbers: 811-05426 and 033-19338 | | GHC-AR-1 | | Invesco Distributors, Inc. |
| | | | |
| | |
 | | Annual Report to Shareholders | | October 31, 2015 |
| | |
| | Invesco Global Infrastructure Fund |
| | Nasdaq: |
| | A: GIZAX n C: GIZCX n R: GIZRX n Y: GIZYX n R5: GIZFX n R6: GIZSX |

Letters to Shareholders
| | |

Philip Taylor | | Dear Shareholders: This annual report includes information about your Fund, including performance data and a complete list of its investments as of the close of the reporting period. Inside is a discussion of how your Fund was managed and the factors that affected its performance during the reporting period. I hope you find this report of interest. The US economy expanded and unemployment declined throughout the reporting period. Continuing low energy prices benefited consumers, but a strong US dollar crimped corporate profits. The US Federal Reserve signaled that it was increasingly likely to raise interest rates, based on generally positive economic data, but uncertainty remained about when it might act. Overseas, the story was much different. Low energy prices hurt the economies of some oil-producing nations, such as Brazil and Russia. During the reporting period, the European Central |
Bank as well as central banks in China and Japan – among other countries – either instituted or maintained extraordinarily accommodative monetary policies in response to economic weakness. Investor uncertainty, such as we saw for much of the reporting period – and market volatility, such as we saw at the end of the reporting period – are unfortunate facts of life when it comes to investing. Some investors use these things as excuses to delay saving and investing for their long-term financial goals. That’s why Invesco encourages investors to work with a professional financial adviser who can stress the importance of starting to save and invest early and the importance of adhering to a disciplined investment plan – when times are good and when they’re uncertain. A financial adviser who knows your unique financial situation, investment goals and risk tolerance can be an invaluable partner as you seek to achieve your financial goals. He or she can offer a long-term perspective when markets are volatile and time-tested advice and guidance when your financial situation or investment goals change. |
Timely information when and where you want it
Invesco’s efforts to help investors achieve their financial objectives include providing individual investors and financial professionals with timely information about the markets, the economy and investing – whenever and wherever they want it.
Our website, invesco.com/us, offers a wide range of market insights and investment perspectives. On the website, you’ll find detailed information about our funds, including prices, performance, holdings and portfolio manager commentaries. You can access information about your account by completing a simple, secure online registration. Click on the “Need to register” link in the “Account Access” box on our homepage to get started.
Invesco’s mobile apps for iPhone® and iPad® (both available free from the App StoreSM) allow you to obtain the same detailed information, monitor your account and create customizable watch lists. Also, they allow you to access investment insights from our investment leaders, market strategists, economists and retirement experts. You can sign up to be alerted when new commentary is added, and you can watch portfolio manager videos and have instant access to Invesco news and updates wherever you may be.
In addition to the resources accessible on our website and through our mobile app, you can obtain timely updates to help you stay informed about the markets, the economy and investing by connecting with Invesco on Twitter, LinkedIn or Facebook. You can access our blog at blog.invesco.us.com. Our goal is to provide you the information you want, when and where you want it.
Have questions?
For questions about your account, feel free to contact an Invesco client services representative at 800 959 4246. For Invesco-related questions or comments, please email me directly at phil@invesco.com.
All of us at Invesco look forward to serving your investment management needs for many years to come. Thank you for investing with us.
Sincerely,

Philip Taylor
Senior Managing Director, Invesco Ltd.
iPhone and iPad are trademarks of Apple Inc., registered in the US and other countries. App Store is a service mark of Apple Inc. Invesco Distributors, Inc. is not affiliated with Apple Inc.
2 Invesco Global Infrastructure Fund
| | |

Bruce Crockett | | Dear Fellow Shareholders: Among the many important lessons I’ve learned in more than 40 years in a variety of business endeavors is the value of a trusted advocate. As independent chair of the Invesco Funds Board, I can assure you that the members of the Board are strong advocates for the interests of investors in Invesco’s mutual funds. We work hard to represent your interests through oversight of the quality of the investment management services your funds receive and other matters important to your investment, including but not limited to: n Ensuring that Invesco offers a diverse lineup of mutual funds that your financial adviser can use to strive to meet your financial needs as your investment goals change over time. n Monitoring how the portfolio management teams of the Invesco funds are performing in light of changing economic and market conditions. |
| n | | Assessing each portfolio management team’s investment performance within the context of the investment strategy described in the fund’s prospectus. |
| n | | Monitoring for potential conflicts of interests that may impact the nature of the services that your funds receive. |
We believe one of the most important services we provide our fund shareholders is the annual review of the funds’ advisory and sub-advisory contracts with Invesco Advisers and its affiliates. This review is required by the Investment Company Act of 1940 and focuses on the nature and quality of the services Invesco provides as the adviser to the Invesco funds and the reasonableness of the fees that it charges for those services. Each year, we spend months carefully reviewing information received from Invesco and a variety of independent sources, such as performance and fee data prepared by Lipper Inc., an independent, third-party firm widely recognized as a leader in its field. We also meet with our independent legal counsel and other independent advisers to review and help us assess the information that we have received. Our goal is to assure that you receive quality investment management services for a reasonable fee.
I trust the measures outlined above provide assurance that you have a worthy advocate when it comes to choosing the Invesco Funds.
As always, please contact me at bruce@brucecrockett.com with any questions or concerns you may have. On behalf of the Board, we look forward to continuing to represent your interests and serving your needs.
Sincerely,

Bruce L. Crockett
Independent Chair
Invesco Funds Board of Trustees
3 Invesco Global Infrastructure Fund
Management’s Discussion of Fund Performance
Performance summary
For the fiscal year ended October 31, 2015, Class A shares of Invesco Global Infrastructure Fund (the Fund), at net asset value (NAV), underperformed the Fund’s broad market and style-specific benchmarks, the MSCI World Index and the Dow Jones Brookfield Global Infrastructure Index, respectively.
Your Fund’s long-term performance appears later in this report.
Fund vs. Indexes
Total returns, 10/31/14 to 10/31/15, at net asset value (NAV). Performance shown does not include applicable contingent deferred sales charges (CDSC) or front-end sales charges, which would have reduced performance.
| | | | | |
Class A Shares | | |
| -8.85
| %
|
Class C Shares | | | | -9.56 | |
Class R Shares | | | | -9.18 | |
Class Y Shares | | | | -8.70 | |
Class R5 Shares | | | | -8.70 | |
Class R6 Shares | | | | -8.70 | |
| MSCI World Index▼ (Broad Market Index) | | | | 1.77 | |
| Dow Jones Brookfield Global Infrastructure Index▼ (Style-Specific Index) | | | | -6.72 | |
| Lipper Global Infrastructure Funds Classification Average (Peer Group)¢ | | | | -6.00 | |
| |
| Source(s): ▼FactSet Research Systems Inc.; ¢Lipper Inc. | | | | | |
Market conditions and your Fund
While overall global growth remained positive during the fiscal year ended October 31, 2015, there was a material dispersion in growth sustainability across major economies and world regions. The US economy had been trending relatively well, with strong economic growth and lower unemployment despite the pull-back in crude oil prices and volatility among equities. China, Japan and the eurozone, however, struggled to deliver a consistent growth pattern, and as such, the use of unconventional means of economic stimulus remained necessary. Economic rebalancing and balance sheet repair still remained key themes in many world economies and were reflected in below long-term average gross domestic product growth and very modest inflationary pressures.
In response to weak commodity prices, increased signs of vulnerability in several
emerging market economies and deterioration in the high yield fixed income market, the US Federal Reserve decided to wait before raising interest rates. Rates on 10-year US Treasuries ended the reporting period essentially unchanged.
Overall, global equities, as measured by the MSCI World Index, were relatively flat for most of the fiscal year, following strong performance in January and February of 2015. However, in August and September of 2015 equity markets across the globe sold off due to weakness in emerging economies, partly caused by persistently low commodity prices. Global equities managed to recover in the final month of the fiscal year, ending the reporting period with a small positive return. At the sector level, the energy, materials, utilities and financials sectors produced negative returns and were the market laggards during the reporting period.
In general, global infrastructure stocks – which have a heavy emphasis within
the energy and utilities sectors – produced negative returns and under-performed broad market global equities during the reporting period, as represented by the MSCI World Index. The Fund also produced negative returns during the reporting period and under-performed its style-specific benchmark, the Dow Jones Brookfield Global Infrastructure Index, primarily as a result of market allocation.
Energy equities experienced steep losses during the fiscal year as a result of the sharp decline in energy prices. Fracturing technology, which allows for the extraction of hydrocarbons from previously uneconomical locations, brought new life to the US energy industry and resulted in substantial growth in oil and gas production. Unexpected supply from Libya and Iraq, as well as the unwillingness by OPEC to cut production, further increased existing supply. Simultaneously, energy demand expectations were reduced as a result of the weakened outlook for global economic growth. These factors led to imbalances in supply and demand, causing energy prices to decline over 40% during the fiscal year with crude oil falling from $81 to $47 per barrel and natural gas falling from $4.50 to $2.33/thousand cubic feet.1 Utilities were also under pressure during much of the fiscal year given the volatility in interest rates and following the sector’s strong performance in 2014.
On an absolute basis, Fund holdings in midstream services were the largest detractors from performance during the fiscal year. Holdings in electric utilities and gas distribution also detracted from absolute returns for the reporting period. Contributors to absolute Fund performance for the reporting period came from several infrastructure sectors including tolls, telecommunications, water, airports, diversified, and ports and rail.
|
| Portfolio Composition |
By infrastructure sectors % of total net assets |
| | | | | |
Midstream Services | | | | 27.2 | % |
| Gas Distribution | | | | 20.6 | |
| Telecommunications | | | | 12.8 | |
| Electric Utilities | | | | 12.7 | |
| Tolls | | | | 6.4 | |
| Airports | | | | 6.4 | |
| Water | | | | 6.2 | |
| Ports & Rail | | | | 3.2 | |
| Diversified | | | | 2.4 | |
Money Market Funds
Plus Other Assets Less Liabilities | | | | 2.1 | |
| | | | | | | |
| Top 10 Equity Holdings* |
% of total net assets |
| | | | | | | |
| | | 1. Enbridge Inc. | | | | 6.5 | % |
| | | 2. Kinder Morgan Inc. | | | | 6.1 | |
| | | 3. National Grid PLC | | | | 6.0 | |
| | | 4. American Tower Corp. | | | | 5.2 | |
| | | 5. Crown Castle International Corp. | | | | 4.2 | |
| | | 6. Atlantia S.p.A. | | | | 3.8 | |
| | | 7. Williams Cos., Inc. (The) | | | | 3.8 | |
| | | 8. PG&E Corp. | | | | 3.6 | |
| | | 9. Eversource Energy | | | | 3.6 | |
| | 10. TransCanada Corp. | | | | 3.4 | |
| | | | | |
Total Net Assets | | | | $7.9 million | |
| |
| Total Number of Holdings* | | | | 60 | |
The Fund’s holdings are subject to change, and there is no assurance that the Fund will continue to hold any particular security.
*Excluding money market fund holdings.
Data presented here are as of October 31, 2015.
|
| 4 Invesco Global Infrastructure Fund |
The top individual detractors from absolute Fund performance for the reporting period were midstream services companies, given the significant volatility in energy prices. Kinder Morgan was the largest detractor from absolute Fund performance, despite a positive relative return for the reporting period. Market sentiment impacted Kinder Morgan’s share price since its reorganization from its master limited partnership structure in 2014. Williams Companies was also a top detractor from absolute performance. During the reporting period, the company received an unsolicited bid from Energy Transfer Equity. While the offer was initially rebuffed, the companies reached an agreement and the deal was awaiting shareholder and regulatory approval at the close of the reporting period. Energy Transfer Equity was no longer held at the end of the reporting period.
Atlantia S.p.A., an Italian company that owns high quality toll roads primarily connecting major urban centers in Italy, was the largest contributor to the Fund’s absolute performance for the reporting period. The company also owns toll roads in Brazil, Chile, India and Poland, as well as the Roman airport network. We had a favorable view on the long length of the company’s contracts given the potential for prolonged low interest rates in Europe, the company’s diversified asset base, current yield and distribution growth prospects. Crown Castle International, the largest provider of shared wireless infrastructure with approximately 40,000 towers in the US, was another top contributor to absolute Fund performance for the fiscal year.
Relative to the Fund’s style-specific benchmark, an overweight position in midstream services companies was a significant detractor from relative Fund performance for the fiscal year, although security selection within the sector was positive. Security selection and underweight exposure to the electric utilities and gas distribution sectors also hurt relative Fund performance for the fiscal year.
Security selection in the midstream services, ports and rail, and diversified infrastructure sectors as well as security selection and overweight exposure to the tolls infrastructure sector contributed the most to relative Fund performance for the reporting period.
During the reporting period, the Fund had underweight exposure to the more regulated infrastructure sectors – gas distribution, electric utilities and water – while it held an overweight allocation to the more competitive sectors and sectors where users pay for services such as telecommunications, airports, tolls and midstream services, where growth characteristics remained relatively attractive. Diverging trends in the use of economic stimulus are shaping yield demand and leverage characteristics in individual countries. In general, the Fund remained focused on companies with above-average earnings growth characteristics, sound balance sheets and strategic infrastructure assets that provide a relatively stable underlying earnings stream.
We thank you for your investment in Invesco Global Infrastructure Fund.
| 1 | Source: Bloomberg Finance LP |
The views and opinions expressed in management’s discussion of Fund performance are those of Invesco Advisers, Inc. These views and opinions are subject to change at any time based on factors such as market and economic conditions. These views and opinions may not be relied upon as investment advice or recommendations, or as an offer for a particular security. The information is not a complete analysis of every aspect of any market, country, industry, security or the Fund. Statements of fact are from sources considered reliable, but Invesco Advisers, Inc. makes no representation or warranty as to their completeness or accuracy. Although historical performance is no guarantee of future results, these insights may help you understand our investment management philosophy.
See important Fund and, if applicable, index disclosures later in this report.
| | |
 | | Joe Rodriguez, Jr. Portfolio Manager, is lead manager of Invesco Global Infrastructure Fund. He is Head of Global Securities with Invesco |
Real Estate, where he oversees all phases of the unit, including securities research and administration. Mr. Rodriguez joined Invesco in 1990. He earned a BBA in economics and finance and an MBA in finance from Baylor University. |
 | | Mark Blackburn Chartered Financial Analyst, Portfolio Manager, is manager of Invesco Global Infrastructure Fund. He joined Invesco in 1998. |
Mr. Blackburn earned a BS in accounting from Louisiana State University and an MBA from Southern Methodist University. |

| | James Cowen Portfolio Manager, is manager of Invesco Global Infrastructure Fund. He joined Invesco in 2000. Mr. Cowen earned a |
Master of Town and Country Planning degree from the University of Manchester and a Master of Philosophy degree in land economy from Cambridge University. |

| | Paul Curbo Chartered Financial Analyst, Portfolio Manager, is manager of Invesco Global Infrastructure Fund. He joined Invesco in 1998. |
Mr. Curbo earned a BBA in finance from The University of Texas at Austin. |
 | | Darin Turner Portfolio Manager, is manager of Invesco Global Infrastructure Fund. He joined Invesco in 2005. Mr. Turner earned a |
BBA in finance from Baylor University, an MS in real estate from The University of Texas at Arlington and an MBA specializing in investments from Southern Methodist University. |
 | | Ping-Ying Wang Chartered Financial Analyst, Portfolio Manager, is manager of Invesco Global Infrastructure Fund. She joined Invesco |
| in 1998. Ms. Wang earned a BS in international finance from the People’s University of China and a PhD in finance from The University of Texas at Dallas. |
|
| 5 Invesco Global Infrastructure Fund |
Your Fund’s Long-Term Performance
Results of a $10,000 Investment – Oldest Share Class(es) since Inception
Fund and index data from 5/2/14
Past performance cannot guarantee comparable future results.
The data shown in the chart include reinvested distributions, applicable sales charges and Fund expenses including management fees. Index results include reinvested dividends, but they do not reflect sales charges. Performance of the peer group, if applicable, reflects fund expenses and management fees; performance of a market index does not.
Performance shown in the chart and table(s) does not reflect deduction of taxes a shareholder would pay on Fund distributions or sale of Fund shares.
|
| 6 Invesco Global Infrastructure Fund |
| | | | | |
Average Annual Total Returns As of 10/31/15, including maximum applicable
sales charges |
| |
| Class A Shares | | | | | |
| Inception (5/2/14) | | | | -5.22 | % |
| 1 Year | | | | -13.86 | |
| |
| Class C Shares | | | | | |
| Inception (5/2/14) | | | | -2.34 | % |
| 1 Year | | | | -10.45 | |
| |
| Class R Shares | | | | | |
| Inception (5/2/14) | | | | -1.86 | % |
| 1 Year | | | | -9.18 | |
| |
| Class Y Shares | | | | | |
| Inception (5/2/14) | | | | -1.37 | % |
| 1 Year | | | | -8.70 | |
| |
| Class R5 Shares | | | | | |
| Inception (5/2/14) | | | | -1.37 | % |
| 1 Year | | | | -8.70 | |
| |
| Class R6 Shares | | | | | |
| Inception (5/2/14) | | | | -1.37 | % |
| 1 Year | | | | -8.70 | |
The performance data quoted represent past performance and cannot guarantee comparable future results; current performance may be lower or higher. Please visit invesco.com/performance for the most recent month-end performance. Performance figures reflect reinvested distributions, changes in net asset value and the effect of the maximum sales charge unless otherwise stated. Investment return and principal value will fluctuate so that you may have a gain or loss when you sell shares.
The net annual Fund operating expense ratio set forth in the most recent Fund prospectus as of the date of this report for Class A, Class C, Class R, Class Y, Class R5 and Class R6 shares was 1.40%, 2.15%, 1.65%, 1.15%, 1.15% and 1.15%, respectively.1,2 The total annual Fund operating expense ratio set forth in the most recent Fund prospectus as of the date of this report for Class A, Class C, Class R, Class Y, Class R5 and Class R6 shares was 8.61%, 9.36%, 8.86%, 8.36%, 8.35% and 8.35%, respectively. The expense ratios presented above may vary from the expense ratios presented in other sections of this report that are based on expenses incurred during the period covered by this report.
| | | | | |
| Average Annual Total Returns As of 9/30/15, the most recent calendar quarter
end, including maximum applicable sales charges |
| |
| Class A Shares | | | | | |
| Inception (5/2/14) | | | | -9.06 | % |
| 1 Year | | | | -16.84 | |
| |
| Class C Shares | | | | | |
| Inception (5/2/14) | | | | -6.08 | % |
| 1 Year | | | | -13.54 | |
| |
| Class R Shares | | | | | |
| Inception (5/2/14) | | | | -5.58 | % |
| 1 Year | | | | -12.22 | |
| |
| Class Y Shares | | | | | |
| Inception (5/2/14) | | | | -5.15 | % |
| 1 Year | | | | -11.77 | |
| |
| Class R5 Shares | | | | | |
| Inception (5/2/14) | | | | -5.15 | % |
| 1 Year | | | | -11.77 | |
| |
| Class R6 Shares | | | | | |
| Inception (5/2/14) | | | | -5.15 | % |
| 1 Year | | | | -11.77 | |
Class A share performance reflects the maximum 5.50% sales charge, and Class C share performance reflects the applicable contingent deferred sales charge (CDSC) for the period involved. The CDSC on Class C shares is 1% for the first year after purchase. Class R, Class Y, Class R5 and Class R6 class shares do not have a front-end sales charge or a CDSC; therefore, performance is at net asset value.
The performance of the Fund’s share classes will differ primarily due to different sales charge structures and class expenses.
Fund performance reflects any applicable fee waivers and/or expense reimbursements. Had the adviser not waived fees and/or reimbursed expenses currently or in the past, returns would have been lower. See current prospectus for more information.
| 1 | Total annual Fund operating expenses after any contractual fee waivers and/or expense reimbursements by the adviser in effect through at least February 28, 2017. See current prospectus for more information. |
| 2 | Total annual Fund operating expenses after any contractual fee waivers and/or expense reimbursements by the adviser in effect through at least June 30, 2017. See current prospectus for more information. |
|
| 7 Invesco Global Infrastructure Fund |
Invesco Global Infrastructure Fund’s investment objective is total return through growth of capital and current income.
| n | | Unless otherwise stated, information presented in this report is as of October 31, 2015, and is based on total net assets. |
| n | | Unless otherwise noted, all data provided by Invesco. |
| n | | To access your Fund’s reports/prospectus, visit invesco.com/fundreports. |
About share classes
| n | | Class R shares are generally available only to employer sponsored retirement and benefit plans. Please see the prospectus for more information. |
| n | | Class Y shares are available only to certain investors. Please see the prospectus for more information. |
| n | | Class R5 shares and Class R6 shares are primarily intended for employer sponsored retirement and benefit plans that meet certain standards and for institutional investors. Please see the prospectus for more information. |
Principal risks of investing in the Fund
| n | | Credit risk. The issuer of instruments in which the Fund invests may be unable to meet interest and/or principal payments, thereby causing its instruments to decrease in value and lowering the issuer’s credit rating. |
| n | | Currency/exchange rate risk. The dollar value of the Fund’s foreign investments will be affected by changes in the exchange rates between the dollar and the currencies in which those investments are traded. |
| n | | Depositary receipts risk. Depositary receipts involve many of the same risks as those associated with direct investment in foreign securities. In addition, the underlying issuers of certain depositary receipts, particularly unsponsored or unregistered depositary receipts, are under no obligation to distribute shareholder communications to the holders of such receipts or to pass through to them any voting rights with respect to the deposited securities. |
| n | | Derivatives risk. The value of a derivative instrument depends largely on (and is derived from) the value of an underlying security, currency, commodity, interest rate, index or other asset (each referred to as an underlying asset). In addition to risks relating to the underlying assets, the use of derivatives may include other, possibly greater, risks, including counterparty, leverage and |
| | liquidity risks. Counterparty risk is the risk that the counterparty to the derivative contract will default on its obligation to pay the Fund the amount owed or otherwise perform under the derivative contract. Derivatives create leverage risk because they do not require payment up front equal to the economic exposure created by owning the derivative. As a result, an adverse change in the value of the underlying asset could result in the Fund sustaining a loss that is substantially greater than the amount invested in the derivative, which may make the Fund’s returns more volatile and increase the risk of loss. Derivative instruments may also be less liquid than more traditional investments and the Fund may be unable to sell or close out its derivative positions at a desirable time or price. This risk may be more acute under adverse market conditions, during which the Fund may be most in need of liquidating its derivative positions. Derivatives may also be harder to value, less tax efficient and subject to changing government regulation that could impact the Fund’s ability to use certain derivatives or their cost. Also, derivatives used for hedging or to gain or limit exposure to a particular market segment may not provide the expected benefits, particularly during adverse market conditions. |
| n | | Emerging markets securities risk. The prices of securities issued by foreign companies and governments located in emerging markets countries may be affected more negatively by inflation, devaluation of their currencies, higher transaction costs, delays in settlement, adverse political developments, the introduction of capital controls, withholding taxes, nationalization of private assets, expropriation, social unrest, war or lack of timely information than those in developed countries. |
| n | | Energy sector risk. Certain of the businesses in which the Fund invests may be adversely affected by foreign, federal or state regulations governing energy |
| | production, distribution and sale as well as supply-and-demand for energy resources. Although individual security selection drives the performance of the Fund, short-term fluctuations in energy prices may cause price fluctuations in its shares. |
| n | | Foreign securities risk. The Fund’s foreign investments may be affected by changes in a foreign country’s exchange rates, political and social instability, changes in economic or taxation policies, difficulties when enforcing obligations, decreased liquidity, and increased volatility. Foreign companies may be subject to less regulation resulting in less publicly available information about the companies. |
| n | | Geographic focus risk. From time to time the Fund may invest a substantial amount of its assets in securities of issuers located in a single country or a limited number of countries. If the Fund focuses its investments in this manner, it assumes the risk that economic, political and social conditions in those countries will have a significant impact on its investment performance. |
| n | | High yield bond (junk bond) risk. Junk bonds involve a greater risk of default or price changes due to changes in the credit quality of the issuer. The values of junk bonds fluctuate more than those of high- quality bonds in response to company, political, regulatory or economic developments. Values of junk bonds can decline significantly over short periods of time. |
| n | | Infrastructure-related companies risk. The Fund will concentrate its investments in the infrastructure industry. Infrastructure-related companies are subject to a variety of factors that may adversely affect their business or operations, including costs associated with environmental, governmental and other regulations, high interest costs in connection with capital construction programs, high leverage, the effects of economic slowdown, surplus capacity, increased competition from other providers of services, uncertainties concerning the availability of fuel at reasonable prices, the effects of energy conservation policies, unfavorable tax laws or accounting policies, and other factors. Infrastructure-related companies are also affected by environmental |
|
This report must be accompanied or preceded by a currently effective Fund prospectus, which contains more complete information, including sales charges and expenses. Investors should read it carefully before investing. |
|
|
| NOT FDIC INSURED | MAY LOSE VALUE | NO BANK GUARANTEE |
|
| 8 Invesco Global Infrastructure Fund |
| | damage due to a company’s operations or an accident, difficulty in raising capital in adequate amounts on reasonable terms in periods of high inflation and unsettled capital markets, increased susceptibility to terrorist acts or political actions, and general changes in market sentiment towards infrastructure assets. |
| n | | Interest rate risk. Interest rate risk refers to the risk that bond prices generally fall as interest rates rise; conversely, bond prices generally rise as interest rates fall. Specific bonds differ in their sensitivity to changes in interest rates depending on their individual characteristics, including duration. |
| n | | Management risk. The investment techniques and risk analysis used by the Fund’s portfolio managers may not produce the desired results. |
| n | | Market risk. The prices of and the income generated by the Fund’s securities may decline in response to, among other things, investor sentiment, general economic and market conditions, regional or global instability, and currency and interest rate fluctuations. |
| n | | MLP risk. An MLP is a public limited partnership or limited liability company. Although the characteristics of MLPs closely resemble a traditional limited partnership, a major difference is that MLPs may trade on a public exchange or in the over-the-counter market. The ability to trade on a public exchange or in the over-the-counter market provides a certain amount of liquidity not found in many limited partnership investments. However, MLP interests may be less liquid and subject to more abrupt or erratic price movements than conventional publicly traded securities. The risks of investing in an MLP are similar to those of investing in a partnership and include more flexible governance structures, which could result in less protection for investors than investments in a corporation. Investors in an MLP would normally not be liable for the debts of the MLP beyond the amount that the investor has contributed but investors may not be shielded to the same extent that a shareholder of a corporation would be. MLPs are generally considered interest-rate sensitive investments. During periods of interest rate volatility, these investments may not provide attractive returns. MLPs that concentrate in a particular industry or a particular geographic region are subject to risks associated with such industry or region. Additionally, if the Fund were to invest more than 25% of its total assets in |
| | MLPs that are taxed as partnerships this could cause the Fund to lose its status as regulated investment company under Subchapter M of the Internal Revenue Code. |
| n | | MLP tax risk. MLPs taxed as partnerships do not pay US federal income tax at the partnership level. Rather, each partner is allocated a share of the partnership’s income, gains, losses, deductions and expenses. A change in current tax law, or a change in the underlying business mix of a given MLP, could result in an MLP being treated as a corporation for US federal income tax purposes, which would result in such MLP being required to pay US federal income tax on its taxable income. The classification of an MLP as a corporation for US federal income tax purposes would have the effect of reducing the amount of cash available for distribution by the MLP. Thus, if any of the MLPs owned by the Fund were treated as a corporation for US federal income tax purposes, it could result in a reduction of the value of the Fund’s investment, and consequently your investment in the Fund and lower income. MLPs taxed as partnerships file a partnership tax return for US federal, state and local income tax purposes and communicate to each investor in such MLP the investor’s allocable share of the MLP’s income, gains, losses, deductions and expenses via a “Schedule K-1.” Each year, the Fund will send you an annual tax statement (Form 1099) to assist you in completing your federal, state and local tax returns. An MLP might need to amend its partnership tax return and, in turn, send amended Schedules K-1 to investors in the MLP, such as the Fund. When necessary, the Fund will send you a corrected Form 1099 to reflect Schedule K-1 information reclassified by an MLP, which could, in turn, require you to amend your federal, state or local tax returns. |
| n | | Non-diversification risk. The Fund is non-diversified and can invest a greater portion of its assets in a small number of issuers or a single issuer. A change in the value of the issuer could affect the value of the Fund more than if it was a diversified fund. |
| n | | Small- and mid-capitalization risks. Stocks of small- and mid-sized companies tend to be more vulnerable to adverse developments and may have little or no operating history or track record of success, and limited product lines, markets, management and financial resources. The securities of small- and mid-sized companies may be more volatile |
| | | due to less market interest and less publicly available information about the issuer. They also may be illiquid or restricted as to resale, or may trade less frequently and in smaller volumes, all of which may cause difficulty when establishing or closing a position at a desirable price. |
About indexes used in this report
| n | | The MSCI World IndexSM is an unmanaged index considered representative of stocks of developed countries. The index is computed using the net return, which withholds applicable taxes for non-resident investors. |
| n | | The Dow Jones Brookfield Global Infrastructure Index intends to measure all sectors of the infrastructure market and includes companies domiciled globally that qualify as “pure- play” infrastructure companies–companies whose primary business is the ownership and operation of infrastructure assets, activities that generally generate long-term stable cash flows. |
| n | | The Lipper Global Infrastructure Funds Classification Average represents an average of all of the funds in the Lipper Global Infrastructure Funds Category classification. |
| n | | The Fund is not managed to track the performance of any particular index, including the index(es) described here, and consequently, the performance of the Fund may deviate significantly from the performance of the index(es). |
| n | | A direct investment cannot be made in an index. Unless otherwise indicated, index results include reinvested dividends, and they do not reflect sales charges. Performance of the peer group, if applicable, reflects fund expenses; performance of a market index does not. |
Other information
| n | | The returns shown in management’s discussion of Fund performance are based on net asset values (NAVs) calculated for shareholder transactions. Generally accepted accounting principles require adjustments to be made to the net assets of the Fund at period end for financial reporting purposes, and as such, the NAVs for shareholder transactions and the returns based on those NAVs may differ from the NAVs and returns reported in the Financial Highlights. |
9 Invesco Global Infrastructure Fund
Schedule of Investments
October 31, 2015
| | | | | | | | |
| | | Shares | | | Value | |
Common Stocks & Other Equity Interests–97.94% | |
| Australia–4.35% | |
APA Group | | | 19,228 | | | $ | 126,146 | |
Macquarie Atlas Roads Group | | | 22,076 | | | | 63,693 | |
Sydney Airport | | | 15,459 | | | | 71,104 | |
Transurban Group | | | 10,907 | | | | 81,200 | |
| | | | | | | | 342,143 | |
|
| Canada–11.25% | |
Enbridge Inc. | | | 12,020 | | | | 513,725 | |
Inter Pipeline Ltd. | | | 1,396 | | | | 26,154 | |
Keyera Corp. | | | 2,653 | | | | 81,860 | |
TransCanada Corp. | | | 7,824 | | | | 263,253 | |
| | | | | | | | 884,992 | |
|
| China–4.02% | |
Beijing Capital International Airport Co. Ltd.–Class H | | | 52,000 | | | | 55,696 | |
Beijing Enterprises Holdings Ltd. | | | 3,000 | | | | 18,925 | |
Beijing Enterprises Water Group Ltd. | | | 60,000 | | | | 47,608 | |
China Merchants Holdings International Co. Ltd. | | | 26,000 | | | | 86,067 | |
China Resources Gas Group Ltd. | | | 7,335 | | | | 20,085 | |
ENN Energy Holdings Ltd. | | | 8,000 | | | | 45,844 | |
Zhejiang Expressway Co., Ltd.–Class H | | | 34,000 | | | | 41,716 | |
| | | | | | | | 315,941 | |
|
| France–4.21% | |
Aeroports de Paris | | | 1,035 | | | | 129,964 | |
Eiffage S.A. | | | 313 | | | | 19,534 | |
Eutelsat Communications S.A. | | | 1,886 | | | | 62,158 | |
Groupe Eurotunnel SE–REGS(a) | | | 7,135 | | | | 99,903 | |
Vinci S.A. | | | 293 | | | | 19,777 | |
| | | | | | | | 331,336 | |
|
| Hong Kong–1.54% | |
China Gas Holdings Ltd. | | | 10,000 | | | | 15,865 | |
Hong Kong & China Gas Co. Ltd. | | | 52,200 | | | | 105,784 | |
| | | | | | | | 121,649 | |
|
| Italy–5.92% | |
Atlantia S.p.A. | | | 10,753 | | | | 297,992 | |
Snam S.p.A. | | | 28,949 | | | | 149,739 | |
Societa Iniziative Autostradali e Servizi S.p.A. | | | 1,574 | | | | 18,053 | |
| | | | | | | | 465,784 | |
|
| Japan–1.93% | |
East Japan Railway Co. | | | 200 | | | | 18,985 | |
Japan Airport Terminal Co., Ltd. | | | 700 | | | | 37,965 | |
Tokyo Gas Co., Ltd. | | | 15,000 | | | | 74,064 | |
West Japan Railway Co. | | | 300 | | | | 20,988 | |
| | | | | | | | 152,002 | |
| | | | | | | | |
| | | Shares | | | Value | |
| Mexico–0.59% | |
Grupo Aeroportuario del Sureste S.A.B. de C.V.–ADR | | | 298 | | | $ | 46,113 | |
|
| Netherlands–0.33% | |
Koninklijke Vopak NV | | | 656 | | | | 26,322 | |
|
| New Zealand–0.50% | |
Auckland International Airport Ltd. | | | 11,102 | | | | 39,423 | |
|
| Spain–5.00% | |
Aena S.A.(b) | | | 1,087 | | | | 121,330 | |
Ferrovial S.A. | | | 5,947 | | | | 150,157 | |
Red Electrica Corp. S.A. | | | 1,384 | | | | 122,063 | |
| | | | | | | | 393,550 | |
|
| United Kingdom–8.59% | |
National Grid PLC | | | 33,111 | | | | 471,323 | |
Pennon Group PLC | | | 3,168 | | | | 39,530 | |
Severn Trent PLC | | | 2,075 | | | | 71,673 | |
United Utilities Group PLC | | | 6,136 | | | | 93,323 | |
| | | | | | | | 675,849 | |
|
| United States–49.71% | |
American Tower Corp. | | | 3,996 | | | | 408,511 | |
American Water Works Co., Inc. | | | 2,178 | | | | 124,930 | |
Atmos Energy Corp. | | | 2,950 | | | | 185,850 | |
California Water Service Group | | | 5,034 | | | | 112,560 | |
Cheniere Energy, Inc.(b) | | | 1,982 | | | | 98,149 | |
Consolidated Edison, Inc. | | | 746 | | | | 49,049 | |
Crown Castle International Corp. | | | 3,880 | | | | 331,585 | |
Eversource Energy | | | 5,508 | | | | 280,577 | |
InfraREIT Inc. | | | 7,491 | | | | 178,885 | |
ITC Holdings Corp. | | | 2,555 | | | | 83,600 | |
Kinder Morgan Inc. | | | 17,629 | | | | 482,153 | |
NiSource Inc. | | | 7,938 | | | | 152,092 | |
ONE Gas, Inc. | | | 1,178 | | | | 57,533 | |
ONEOK, Inc. | | | 1,600 | | | | 54,272 | |
PG&E Corp. | | | 5,344 | | | | 285,370 | |
SBA Communications Corp.–Class A(b) | | | 1,728 | | | | 205,666 | |
SemGroup Corp.–Class A | | | 842 | | | | 38,353 | |
Sempra Energy | | | 2,394 | | | | 245,170 | |
Spectra Energy Corp. | | | 7,759 | | | | 221,675 | |
Targa Resources Corp. | | | 342 | | | | 19,545 | |
Williams Cos., Inc. (The) | | | 7,500 | | | | 295,800 | |
| | | | | | | | 3,911,325 | |
Total Common Stocks & Other Equity Interests
(Cost $7,712,127) | | | | 7,706,429 | |
See accompanying Notes to Financial Statements which are an integral part of the financial statements.
10 Invesco Global Infrastructure Fund
| | | | | | | | |
| | | Shares | | | Value | |
Money Market Funds–1.09% | | | | | | | | |
Liquid Assets Portfolio–Institutional Class, 0.16%(c) | | | 42,789 | | | $ | 42,789 | |
Premier Portfolio–Institutional
Class, 0.12%(c) | | | 42,790 | | | | 42,790 | |
Total Money Market Funds
(Cost $85,579) | | | | 85,579 | |
TOTAL INVESTMENTS–99.03%
(Cost $7,797,706) | | | | 7,792,008 | |
OTHER ASSETS LESS LIABILITIES–0.97% | | | | 76,519 | |
NET ASSETS–100.00% | | | $ | 7,868,527 | |
Investment Abbreviations:
| | |
| ADR | | – American Depositary Receipt |
| REGS | | – Regulation S |
Notes to Schedule of Investments:
| (a) | Security purchased or received in transaction exempt from registration under the Securities Act of 1933, as amended (the “1933 Act”). The security may be resold pursuant to an exemption from registration under the 1933 Act, typically to qualified institutional buyers. The value of this security at October 31, 2015 represented 1.27% of the Fund’s Net Assets. |
| (b) | Non-income producing security. |
| (c) | The money market fund and the Fund are affiliated by having the same investment adviser. The rate shown is the 7-day SEC standardized yield as of October 31, 2015. |
See accompanying Notes to Financial Statements which are an integral part of the financial statements.
11 Invesco Global Infrastructure Fund
Statement of Assets and Liabilities
October 31, 2015
| | | | |
Assets: | |
Investments, at value (Cost $7,712,127) | | $ | 7,706,429 | |
Investments in affiliated money market funds, at value and cost | | | 85,579 | |
Total investments, at value (Cost $7,797,706) | | | 7,792,008 | |
Foreign currencies, at value (Cost $22,903) | | | 22,876 | |
Receivable for: | | | | |
Investments sold | | | 35,007 | |
Fund shares sold | | | 52,650 | |
Dividends | | | 14,028 | |
Fund expenses absorbed | | | 39,638 | |
Investment for trustee deferred compensation and retirement plans | | | 3,256 | |
Other assets | | | 16,183 | |
Total assets | | | 7,975,646 | |
|
Liabilities: | |
Payable for: | | | | |
Investments purchased | | | 33,908 | |
Fund shares reacquired | | | 6,020 | |
Accrued fees to affiliates | | | 2,778 | |
Accrued trustees’ and officers’ fees and benefits | | | 1,543 | |
Accrued other operating expenses | | | 59,614 | |
Trustee deferred compensation and retirement plans | | | 3,256 | |
Total liabilities | | | 107,119 | |
Net assets applicable to shares outstanding | | $ | 7,868,527 | |
|
Net assets consist of: | |
Shares of beneficial interest | | $ | 8,413,588 | |
Undistributed net investment income | | | 1,429 | |
Undistributed net realized gain (loss) | | | (540,811 | ) |
Net unrealized appreciation (depreciation) | | | (5,679 | ) |
| | | $ | 7,868,527 | |
| | | | |
Net Assets: | |
Class A | | $ | 3,261,617 | |
Class C | | $ | 279,309 | |
Class R | | $ | 27,025 | |
Class Y | | $ | 4,222,513 | |
Class R5 | | $ | 9,512 | |
Class R6 | | $ | 68,551 | |
|
Shares outstanding, $0.01 par value per share,
with an unlimited number of shares authorized: | |
Class A | | | 343,365 | |
Class C | | | 29,466 | |
Class R | | | 2,847 | |
Class Y | | | 444,374 | |
Class R5 | | | 1,001 | |
Class R6 | | | 7,215 | |
Class A: | | | | |
Net asset value per share | | $ | 9.50 | |
Maximum offering price per share | | | | |
(Net asset value of $9.50 ¸ 94.50%) | | $ | 10.05 | |
Class C: | | | | |
Net asset value and offering price per share | | $ | 9.48 | |
Class R: | | | | |
Net asset value and offering price per share | | $ | 9.49 | |
Class Y: | | | | |
Net asset value and offering price per share | | $ | 9.50 | |
Class R5: | | | | |
Net asset value and offering price per share | | $ | 9.50 | |
Class R6: | | | | |
Net asset value and offering price per share | | $ | 9.50 | |
See accompanying Notes to Financial Statements which are an integral part of the financial statements.
12 Invesco Global Infrastructure Fund
Statement of Operations
For the year ended October 31, 2015
| | | | |
Investment income: | |
Dividends (net of foreign withholding taxes of $9,255) | | $ | 202,241 | |
Dividends from affiliated money market funds | | | 98 | |
Total investment income | | | 202,339 | |
| |
Expenses: | | | | |
Advisory fees | | | 55,100 | |
Administrative services fees | | | 50,000 | |
Custodian fees | | | 56,390 | |
Distribution fees: | | | | |
Class A | | | 7,628 | |
Class C | | | 3,069 | |
Class R | | | 88 | |
Transfer agent fees — A, C, R and Y | | | 10,412 | |
Transfer agent fees — R5 | | | 5 | |
Transfer agent fees — R6 | | | 26 | |
Trustees’ and officers’ fees and benefits | | | 18,919 | |
Registration and filing fees | | | 98,863 | |
Professional services fees | | | 80,982 | |
Other | | | 30,065 | |
Total expenses | | | 411,547 | |
Less: Fees waived and expenses reimbursed | | | (325,523 | ) |
Net expenses | | | 86,024 | |
Net investment income | | | 116,315 | |
| |
Realized and unrealized gain (loss) from: | | | | |
Net realized gain (loss) from: | | | | |
Investment securities | | | (549,353 | ) |
Foreign currencies | | | (3,584 | ) |
| | | | (552,937 | ) |
Change in net unrealized appreciation (depreciation) of: | | | | |
Investment securities | | | (238,158 | ) |
Foreign currencies | | | 290 | |
| | | | (237,868 | ) |
Net realized and unrealized gain (loss) | | | (790,805 | ) |
Net increase (decrease) in net assets resulting from operations | | $ | (674,490 | ) |
See accompanying Notes to Financial Statements which are an integral part of the financial statements.
13 Invesco Global Infrastructure Fund
Statement of Changes in Net Assets
For the year ended October 31, 2015 and the period May 2, 2014 (commencement date) through October 31, 2014
| | | | | | | | |
| | | October 31,
2015 | | | May 2, 2014
(commencement date) through
October 31,
2014 | |
Operations: | | | | | |
Net investment income | | $ | 116,315 | | | $ | 35,336 | |
Net realized gain (loss) | | | (552,937 | ) | | | (3,004 | ) |
Change in net unrealized appreciation (depreciation) | | | (237,868 | ) | | | 232,189 | |
Net increase (decrease) in net assets resulting from operations | | | (674,490 | ) | | | 264,521 | |
| | |
Distributions to shareholders from net investment income: | | | | | | | | |
Class A | | | (60,858 | ) | | | (12,024 | ) |
Class C | | | (3,618 | ) | | | (540 | ) |
Class R | | | (312 | ) | | | (55 | ) |
Class Y | | | (67,818 | ) | | | (12,343 | ) |
Class R5 | | | (240 | ) | | | (59 | ) |
Class R6 | | | (1,238 | ) | | | (59 | ) |
Total distributions from net investment income | | | (134,084 | ) | | | (25,080 | ) |
| | |
Distributions to shareholders from net realized gains: | | | | | | | | |
Class A | | | (2,842 | ) | | | — | |
Class C | | | (250 | ) | | | — | |
Class R | | | (17 | ) | | | — | |
Class Y | | | (2,396 | ) | | | — | |
Class R5 | | | (11 | ) | | | — | |
Class R6 | | | (50 | ) | | | — | |
Total distributions from net realized gains | | | (5,566 | ) | | | — | |
| | |
Share transactions–net: | | | | | | | | |
Class A | | | 1,132,351 | | | | 2,397,806 | |
Class C | | | 135,558 | | | | 184,137 | |
Class R | | | 15,617 | | | | 12,460 | |
Class Y | | | 2,334,806 | | | | 2,148,433 | |
Class R5 | | | — | | | | 10,010 | |
Class R6 | | | 36,561 | | | | 35,487 | |
Net increase in net assets resulting from share transactions | | | 3,654,893 | | | | 4,788,333 | |
Net increase in net assets | | | 2,840,753 | | | | 5,027,774 | |
| | |
Net assets: | | | | | | | | |
Beginning of year | | | 5,027,774 | | | | — | |
End of year (includes undistributed net investment income of $1,429 and $39,323, respectively) | | $ | 7,868,527 | | | $ | 5,027,774 | |
Notes to Financial Statements
October 31, 2015
NOTE 1—Significant Accounting Policies
Invesco Global Infrastructure Fund (the “Fund”) is a series portfolio of AIM Investment Funds (Invesco Investment Funds) (the “Trust”). The Trust is organized as a Delaware statutory trust and is registered under the Investment Company Act of 1940, as amended (the “1940 Act”), as an open-end series management investment company consisting of twenty-four separate series portfolios, each authorized to issue an unlimited number of shares of beneficial interest. The assets, liabilities and operations of each portfolio are accounted for separately. Information presented in these financial statements pertains only to the Fund. Matters affecting each portfolio or class will be voted on exclusively by the shareholders of such portfolio or class.
The Fund’s investment objective is total return through growth of capital and current income.
The Fund currently consists of six different classes of shares: Class A, Class C, Class R, Class Y, Class R5 and Class R6. Class A shares are sold with a front-end sales charge unless certain waiver criteria are met and under certain circumstances load waived shares may be subject to contingent deferred sales charges (“CDSC”). Class C shares are sold with a CDSC. Class R, Class Y, Class R5 and Class R6 shares are sold at net asset value.
14 Invesco Global Infrastructure Fund
The following is a summary of the significant accounting policies followed by the Fund in the preparation of its financial statements.
| A. | Security Valuations — Securities, including restricted securities, are valued according to the following policy. |
A security listed or traded on an exchange (except convertible securities) is valued at its last sales price or official closing price as of the close of the customary trading session on the exchange where the security is principally traded, or lacking any sales or official closing price on a particular day, the security may be valued at the closing bid price on that day. Securities traded in the over-the-counter market are valued based on prices furnished by independent pricing services or market makers. When such securities are valued by an independent pricing service they may be considered fair valued. Futures contracts are valued at the final settlement price set by an exchange on which they are principally traded. Listed options are valued at the mean between the last bid and asked prices from the exchange on which they are principally traded. Options not listed on an exchange are valued by an independent source at the mean between the last bid and asked prices. For purposes of determining net asset value (“NAV”) per share, futures and option contracts generally are valued 15 minutes after the close of the customary trading session of the New York Stock Exchange (“NYSE”).
Investments in open-end and closed-end registered investment companies that do not trade on an exchange are valued at the end-of-day net asset value per share. Investments in open-end and closed-end registered investment companies that trade on an exchange are valued at the last sales price or official closing price as of the close of the customary trading session on the exchange where the security is principally traded.
Debt obligations (including convertible securities) and unlisted equities are fair valued using an evaluated quote provided by an independent pricing service. Evaluated quotes provided by the pricing service may be determined without exclusive reliance on quoted prices, and may reflect appropriate factors such as institution-size trading in similar groups of securities, developments related to specific securities, dividend rate (for unlisted equities), yield (for debt obligations), quality, type of issue, coupon rate (for debt obligations), maturity (for debt obligations), individual trading characteristics and other market data. Debt obligations are subject to interest rate and credit risks. In addition, all debt obligations involve some risk of default with respect to interest and/or principal payments.
Foreign securities’ (including foreign exchange contracts) prices are converted into U.S. dollar amounts using the applicable exchange rates as of the close of the NYSE. If market quotations are available and reliable for foreign exchange-traded equity securities, the securities will be valued at the market quotations. Because trading hours for certain foreign securities end before the close of the NYSE, closing market quotations may become unreliable. If between the time trading ends on a particular security and the close of the customary trading session on the NYSE, events occur that the Adviser determines are significant and make the closing price unreliable, the Fund may fair value the security. If the event is likely to have affected the closing price of the security, the security will be valued at fair value in good faith using procedures approved by the Board of Trustees. Adjustments to closing prices to reflect fair value may also be based on a screening process of an independent pricing service to indicate the degree of certainty, based on historical data, that the closing price in the principal market where a foreign security trades is not the current value as of the close of the NYSE. Foreign securities’ prices meeting the approved degree of certainty that the price is not reflective of current value will be priced at the indication of fair value from the independent pricing service. Multiple factors may be considered by the independent pricing service in determining adjustments to reflect fair value and may include information relating to sector indices, American Depositary Receipts and domestic and foreign index futures. Foreign securities may have additional risks including exchange rate changes, potential for sharply devalued currencies and high inflation, political and economic upheaval, the relative lack of issuer information, relatively low market liquidity and the potential lack of strict financial and accounting controls and standards.
Securities for which market prices are not provided by any of the above methods may be valued based upon quotes furnished by independent sources. The last bid price may be used to value equity securities. The mean between the last bid and asked prices is used to value debt obligations, including corporate loans.
Securities for which market quotations are not readily available or became unreliable are valued at fair value as determined in good faith by or under the supervision of the Trust’s officers following procedures approved by the Board of Trustees. Issuer specific events, market trends, bid/asked quotes of brokers and information providers and other market data may be reviewed in the course of making a good faith determination of a security’s fair value.
The Fund may invest in securities that are subject to interest rate risk, meaning the risk that the prices will generally fall as interest rates rise and, conversely, the prices will generally rise as interest rates fall. Specific securities differ in their sensitivity to changes in interest rates depending on their individual characteristics. Changes in interest rates may result in increased market volatility, which may affect the value and/or liquidity of certain Fund investments.
Valuations change in response to many factors including the historical and prospective earnings of the issuer, the value of the issuer’s assets, general economic conditions, interest rates, investor perceptions and market liquidity. Because of the inherent uncertainties of valuation, the values reflected in the financial statements may materially differ from the value received upon actual sale of those investments.
| B. | Securities Transactions and Investment Income — Securities transactions are accounted for on a trade date basis. Realized gains or losses on sales are computed on the basis of specific identification of the securities sold. Interest income (net of withholding tax, if any) is recorded on the accrual basis from settlement date. Dividend income (net of withholding tax, if any) is recorded on the ex-dividend date. |
The Fund may periodically participate in litigation related to Fund investments. As such, the Fund may receive proceeds from litigation settlements. Any proceeds received are included in the Statement of Operations as realized gain (loss) for investments no longer held and as unrealized gain (loss) for investments still held.
Brokerage commissions and mark ups are considered transaction costs and are recorded as an increase to the cost basis of securities purchased and/or a reduction of proceeds on a sale of securities. Such transaction costs are included in the determination of net realized and unrealized gain (loss) from investment securities reported in the Statement of Operations and the Statement of Changes in Net Assets and the net realized and unrealized gains (losses) on securities per share in the Financial Highlights. Transaction costs are included in the calculation of the Fund’s net asset value and, accordingly, they reduce the Fund’s total returns. These transaction costs are not considered operating expenses and are not reflected in net investment income reported in the Statement of Operations and the Statement of Changes in Net Assets, or the net investment income per share and the ratios of expenses and net investment income reported in the Financial Highlights, nor are they limited by any expense limitation arrangements between the Fund and the investment adviser.
The Fund allocates income and realized and unrealized capital gains and losses to a class based on the relative net assets of each class.
15 Invesco Global Infrastructure Fund
| C. | Country Determination — For the purposes of making investment selection decisions and presentation in the Schedule of Investments, the investment adviser may determine the country in which an issuer is located and/or credit risk exposure based on various factors. These factors include the laws of the country under which the issuer is organized, where the issuer maintains a principal office, the country in which the issuer derives 50% or more of its total revenues and the country that has the primary market for the issuer’s securities, as well as other criteria. Among the other criteria that may be evaluated for making this determination are the country in which the issuer maintains 50% or more of its assets, the type of security, financial guarantees and enhancements, the nature of the collateral and the sponsor organization. Country of issuer and/or credit risk exposure has been determined to be the United States of America, unless otherwise noted. |
| D. | Distributions — Distributions from net investment income, if any, are declared and paid quarterly and are recorded on the ex-dividend date. Distributions from net realized capital gain, if any, are generally declared and paid annually and recorded on the ex-dividend date. The Fund may elect to treat a portion of the proceeds from redemptions as distributions for federal income tax purposes. |
| E. | Master Limited Partnerships — The Fund invests in Master Limited Partnerships (“MLPs”). MLPs are publicly traded partnerships and limited liability companies taxed as partnerships under the Internal Revenue Code of 1986, as amended (the “Internal Revenue Code”). The Fund invests in MLPs engaged in, among other things, the transportation, storage, processing, refining, marketing, exploration, production and mining of minerals and natural resources. The Fund is a partner in each MLP; accordingly, the Fund is required to take into account the Fund’s allocable share of income, gains, losses, deductions, expenses, and tax credits recognized by each MLP. |
MLP’s may be less liquid and subject to more abrupt or erratic price movements than conventional publicly traded securities.
The Fund is non-diversified and will invest in securities of fewer issues than if it were diversified.
| F. | Return of Capital — Distributions received from the Fund’s investments in MLPs generally are comprised of income and return of capital. The Fund records investment income and return of capital based on estimates made at the time such distributions are received. The return of capital portion of the distribution is a reduction to investment income that results in an equivalent reduction in the cost basis of the associated investments and increases net realized gains (losses) and change in unrealized appreciation (depreciation). Such estimates are based on historical information available from each MLP and other industry sources. These estimates will subsequently be revised and may materially differ primarily based on information received from the MLPs after their tax reporting periods are concluded. |
| G. | Federal Income Taxes — The Fund intends to comply with the requirements of Subchapter M of the Internal Revenue Code of 1986, as amended (the “Internal Revenue Code”), necessary to qualify as a regulated investment company and to distribute substantially all of the Fund’s taxable earnings to shareholders. As such, the Fund will not be subject to federal income taxes on otherwise taxable income (including net realized capital gain) that is distributed to shareholders. Therefore, no provision for federal income taxes is recorded in the financial statements. |
The Fund recognizes the tax benefits of uncertain tax positions only when the position is more likely than not to be sustained. Management has analyzed the Fund’s uncertain tax positions and concluded that no liability for unrecognized tax benefits should be recorded related to uncertain tax positions. Management is not aware of any tax positions for which it is reasonably possible that the total amounts of unrecognized tax benefits will change materially in the next 12 months.
The Fund files tax returns in the U.S. Federal jurisdiction and certain other jurisdictions. Generally, the Fund is subject to examinations by such taxing authorities for up to three years after the filing of the return for the tax period.
| H. | Expenses — Fees provided for under the Rule 12b-1 plan of a particular class of the Fund are charged to the operations of such class. Transfer agency fees and expenses and other shareholder recordkeeping fees and expenses attributable to Class R5 and Class R6 are allocated to each share class based on relative net assets. Sub-accounting fees attributable to Class R5 are charged to the operations of the class. Transfer agency fees and expenses and other shareholder recordkeeping fees and expenses relating to all other classes are allocated among those classes based on relative net assets. All other expenses are allocated among the classes based on relative net assets. |
| I. | Accounting Estimates — The preparation of financial statements in conformity with accounting principles generally accepted in the United States of America (“GAAP”) requires management to make estimates and assumptions that affect the reported amounts of assets and liabilities at the date of the financial statements and the reported amounts of revenues and expenses during the reporting period including estimates and assumptions related to taxation. Actual results could differ from those estimates by a significant amount. In addition, the Fund monitors for material events or transactions that may occur or become known after the period-end date and before the date the financial statements are released to print. |
| J. | Indemnifications — Under the Trust’s organizational documents, each Trustee, officer, employee or other agent of the Trust is indemnified against certain liabilities that may arise out of the performance of their duties to the Fund. Additionally, in the normal course of business, the Fund enters into contracts, including the Fund’s servicing agreements, that contain a variety of indemnification clauses. The Fund’s maximum exposure under these arrangements is unknown as this would involve future claims that may be made against the Fund that have not yet occurred. The risk of material loss as a result of such indemnification claims is considered remote. |
| K. | Foreign Currency Translations — Foreign currency is valued at the close of the NYSE based on quotations posted by banks and major currency dealers. Portfolio securities and other assets and liabilities denominated in foreign currencies are translated into U.S. dollar amounts at date of valuation. Purchases and sales of portfolio securities (net of foreign taxes withheld on disposition) and income items denominated in foreign currencies are translated into U.S. dollar amounts on the respective dates of such transactions. The Fund does not separately account for the portion of the results of operations resulting from changes in foreign exchange rates on investments and the fluctuations arising from changes in market prices of securities held. The combined results of changes in foreign exchange rates and the fluctuation of market prices on investments (net of estimated foreign tax withholding) are included with the net realized and unrealized gain or loss from investments in the Statement of Operations. Reported net realized foreign currency gains or losses arise from (1) sales of foreign currencies, (2) currency gains or losses realized between the trade and settlement dates on securities transactions, and (3) the difference between the amounts of dividends, interest, and foreign withholding taxes recorded on the Fund’s books and the U.S. dollar equivalent of the amounts actually received or paid. Net unrealized foreign currency gains and losses arise from changes in the fair values of assets and liabilities, other than investments in securities at fiscal period end, resulting from changes in exchange rates. |
The Fund may invest in foreign securities, which may be subject to foreign taxes on income, gains on investments or currency repatriation, a portion of which may be recoverable. Foreign taxes, if any, are recorded based on the tax regulations and rates that exist in the foreign markets in which the Fund invests and are shown in the Statement of Operations.
16 Invesco Global Infrastructure Fund
| L. | Forward Foreign Currency Contracts — The Fund may engage in foreign currency transactions either on a spot (i.e. for prompt delivery and settlement) basis, or through forward foreign currency contracts, to manage or minimize currency or exchange rate risk. |
The Fund may also enter into forward foreign currency contracts for the purchase or sale of a security denominated in a foreign currency in order to “lock in” the U.S. dollar price of that security, or the Fund may also enter into forward foreign currency contracts that do not provide for physical settlement of the two currencies, but instead are settled by a single cash payment calculated as the difference between the agreed upon exchange rate and the spot rate at settlement based upon an agreed upon notional amount (non-deliverable forwards). The Fund will set aside liquid assets in an amount equal to daily mark-to-market obligation for forward foreign currency contracts.
A forward foreign currency contract is an obligation between two parties (“Counterparties”) to purchase or sell a specific currency for an agreed-upon price at a future date. The use of forward foreign currency contracts does not eliminate fluctuations in the price of the underlying securities the Fund owns or intends to acquire but establishes a rate of exchange in advance. Fluctuations in the value of these contracts are measured by the difference in the contract date and reporting date exchange rates and are recorded as unrealized appreciation (depreciation) until the contracts are closed. When the contracts are closed, realized gains (losses) are recorded. Realized and unrealized gains (losses) on the contracts are included in the Statement of Operations. The primary risks associated with forward foreign currency contracts include failure of the Counterparty to meet the terms of the contract and the value of the foreign currency changing unfavorably. These risks may be in excess of the amounts reflected in the Statement of Assets and Liabilities.
NOTE 2—Advisory Fees and Other Fees Paid to Affiliates
The Trust has entered into a master investment advisory agreement with Invesco Advisers, Inc. (the “Adviser” or “Invesco”). Under the terms of the investment advisory agreement, the Fund pays an advisory fee to the Adviser based on the annual rate of the Fund’s average daily net assets as follows:
| | | | | | |
| Average Daily Net Assets | | Rate |
First $2.5 billion | | | 0 | .84% | | |
Next $2 billion | | | 0 | .80% | | |
Next $3.5 billion | | | 0 | .785% | | |
Over $8 billion | | | 0 | .77% | | |
For the year ended October 31, 2015, the effective advisory fees incurred by the Fund was 0.84%.
Under the terms of a master sub-advisory agreement between the Adviser and each of Invesco Asset Management Deutschland GmbH, Invesco Asset Management Limited, Invesco Asset Management (Japan) Limited, Invesco Hong Kong Limited, Invesco Senior Secured Management, Inc., Invesco Canada Ltd. and Invesco PowerShares Capital Management LLC (collectively, the “Affiliated Sub-Advisers”) the Adviser, not the Fund, may pay 40% of the fees paid to the Adviser to any such Affiliated Sub-Adviser(s) that provide(s) discretionary investment management services to the Fund based on the percentage of assets allocated to such Affiliated Sub-Adviser(s).
The Adviser has contractually agreed, through at least February 28, 2017, to waive advisory fees and/or reimburse expenses of all shares to the extent necessary to limit total annual fund operating expenses after fee waiver and/or expense reimbursement (excluding certain items discussed below) of Class A, Class C, Class R, Class Y, Class R5 and Class R6 shares to 1.40%, 2.15%, 1.65%, 1.15%, 1.15% and 1.15%, respectively, of average daily net assets. In determining the Adviser’s obligation to waive advisory fees and/or reimburse expenses, the following expenses are not taken into account, and could cause the total annual fund operating expenses after fee waiver and/or expense reimbursement to exceed the numbers reflected above: (1) interest; (2) taxes; (3) dividend expense on short sales; (4) extraordinary or non-routine items, including litigation expenses; and (5) expenses that the Fund has incurred but did not actually pay because of an expense offset arrangement. Unless Invesco continues the fee waiver agreement, it will terminate on February 28, 2017. The fee waiver agreement cannot be terminated during its term.
Further, the Adviser has contractually agreed, through at least June 30, 2017, to waive the advisory fee payable by the Fund in an amount equal to 100% of the net advisory fees the Adviser receives from the affiliated money market funds on investments by the Fund of uninvested cash in such affiliated money market funds.
For the year ended October 31, 2015, the Adviser waived advisory fees and reimbursed fund level expenses of $315,080 and reimbursed class level expenses of $4,891, $492, $28, $5,001, $5 and $26 of Class A, Class C, Class R, Class Y, Class R5 and Class R6 shares, respectively.
The Trust has entered into a transfer agency and service agreement with Invesco Investment Services, Inc. (“IIS”) pursuant to which the Fund has agreed to pay IIS a fee for providing transfer agency and shareholder services to the Fund and reimburse IIS for certain expenses incurred by IIS in the course of providing such services. IIS may make payments to intermediaries that provide omnibus account services, sub-accounting services and/or networking services. All fees payable by IIS to intermediaries that provide omnibus account services or sub-accounting are charged back to the Fund, subject to certain limitations approved by the Trust’s Board of Trustees. For the year ended October 31, 2015, expenses incurred under the agreement are shown in the Statement of Operations as Transfer agent fees.
The Trust has entered into a master administrative services agreement with Invesco pursuant to which the Fund has agreed to pay Invesco for certain administrative costs incurred in providing accounting services to the Fund. For the year ended October 31, 2015, expenses incurred under the agreement are shown in the Statement of Operations as Administrative services fees.
The Trust has entered into master distribution agreements with Invesco Distributors, Inc. (“IDI”) to serve as the distributor for the Class A, Class C, Class R, Class Y, Class R5 and Class R6 shares of the Fund. The Trust has adopted plans pursuant to Rule 12b-1 under the 1940 Act with respect to the Fund’s Class A, Class C and Class R shares (collectively, the “Plans”). The Fund, pursuant to the Plans, pays IDI compensation at the annual rate of 0.25% of the Fund’s average daily net assets of Class A shares, 1.00% of the average daily net assets of Class C shares and 0.50% of the average daily net assets of Class R shares. Of the Plan payments, up to 0.25% of the average daily net assets of each class of shares may be paid to furnish continuing personal shareholder services to customers who purchase and own shares of such classes. Any amounts not paid as a service fee under the Plans would constitute an asset-based sales charge. Rules of the Financial Industry Regulatory Authority (“FINRA”) impose a cap on the total sales charges, including asset-based sales charges, that may be paid by any class of shares of the Fund. For the year ended October 31, 2015, expenses incurred under the Plans are shown in the Statement of Operations as Distribution fees.
17 Invesco Global Infrastructure Fund
Front-end sales commissions and CDSC (collectively, the “sales charges”) are not recorded as expenses of the Fund. Front-end sales commissions are deducted from proceeds from the sales of Fund shares prior to investment in Class A shares of the Fund. CDSC are deducted from redemption proceeds prior to remittance to the shareholder. During the year ended October 31, 2015, IDI advised the Fund that IDI retained $2,694 in front-end sales commissions from the sale of Class A shares and $12 and $15 from Class A and Class C shares, respectively, for CDSC imposed upon redemptions by shareholders.
Certain officers and trustees of the Trust are officers and directors of the Adviser, IIS and/or IDI.
NOTE 3—Additional Valuation Information
GAAP defines fair value as the price that would be received to sell an asset or paid to transfer a liability in an orderly transaction between market participants at the measurement date, under current market conditions. GAAP establishes a hierarchy that prioritizes the inputs to valuation methods, giving the highest priority to readily available unadjusted quoted prices in an active market for identical assets (Level 1) and the lowest priority to significant unobservable inputs (Level 3), generally when market prices are not readily available or are unreliable. Based on the valuation inputs, the securities or other investments are tiered into one of three levels. Changes in valuation methods may result in transfers in or out of an investment’s assigned level:
| | Level 1 — | Prices are determined using quoted prices in an active market for identical assets. |
| | Level 2 — | Prices are determined using other significant observable inputs. Observable inputs are inputs that other market participants may use in pricing a security. These may include quoted prices for similar securities, interest rates, prepayment speeds, credit risk, yield curves, loss severities, default rates, discount rates, volatilities and others. |
| | Level 3 — | Prices are determined using significant unobservable inputs. In situations where quoted prices or observable inputs are unavailable (for example, when there is little or no market activity for an investment at the end of the period), unobservable inputs may be used. Unobservable inputs reflect the Fund’s own assumptions about the factors market participants would use in determining fair value of the securities or instruments and would be based on the best available information. |
The following is a summary of the tiered valuation input levels, as of October 31, 2015. The level assigned to the securities valuations may not be an indication of the risk or liquidity associated with investing in those securities. Because of the inherent uncertainties of valuation, the values reflected in the financial statements may materially differ from the value received upon actual sale of those investments.
During the year ended October 31, 2015, there were transfers from Level 1 to Level 2 of $443,440 and from Level 2 to Level 1 of $550,669, due to foreign fair value adjustments.
| | | | | | | | | | | | | | | | |
| | | Level 1 | | | Level 2 | | | Level 3 | | | Total | |
Australia | | $ | 278,450 | | | $ | 63,693 | | | $ | — | | | $ | 342,143 | |
Canada | | | 884,992 | | | | — | | | | — | | | | 884,992 | |
China | | | — | | | | 315,941 | | | | — | | | | 315,941 | |
France | | | 39,311 | | | | 292,025 | | | | — | | | | 331,336 | |
Hong Kong | | | — | | | | 121,649 | | | | — | | | | 121,649 | |
Italy | | | 316,045 | | | | 149,739 | | | | — | | | | 465,784 | |
Japan | | | — | | | | 152,002 | | | | — | | | | 152,002 | |
Mexico | | | 46,113 | | | | — | | | | — | | | | 46,113 | |
Netherlands | | | — | | | | 26,322 | | | | — | | | | 26,322 | |
New Zealand | | | — | | | | 39,423 | | | | — | | | | 39,423 | |
Spain | | | 393,550 | | | | — | | | | — | | | | 393,550 | |
United Kingdom | | | — | | | | 675,849 | | | | — | | | | 675,849 | |
United States | | | 3,996,904 | | | | — | | | | — | | | | 3,996,904 | |
Total Investments | | $ | 5,955,365 | | | $ | 1,836,643 | | | $ | — | | | $ | 7,792,008 | |
NOTE 4—Trustees’ and Officers’ Fees and Benefits
Trustees’ and Officers’ Fees and Benefits include amounts accrued by the Fund to pay remuneration to certain Trustees and Officers of the Fund. Trustees have the option to defer compensation payable by the Fund, and Trustees’ and Officers’ Fees and Benefits also include amounts accrued by the Fund to fund such deferred compensation amounts. Those Trustees who defer compensation have the option to select various Invesco Funds in which their deferral accounts shall be deemed to be invested. Obligations under the deferred compensation plan represent unsecured claims against the general assets of the Fund.
NOTE 5—Cash Balances
The Fund is permitted to temporarily carry a negative or overdrawn balance in its account with State Street Bank and Trust Company, the custodian bank. Such balances, if any at period end, are shown in the Statement of Assets and Liabilities under the payable caption Amount due custodian. To compensate the custodian bank for such overdrafts, the overdrawn Fund may either (1) leave funds as a compensating balance in the account so the custodian bank can be compensated by earning the additional interest; or (2) compensate by paying the custodian bank at a rate agreed upon by the custodian bank and Invesco, not to exceed the contractually agreed upon rate.
18 Invesco Global Infrastructure Fund
NOTE 6—Distributions to Shareholders and Tax Components of Net Assets
Tax Character of Distributions to Shareholders Paid During the Fiscal Year Ended October 31, 2015 and the period May 2, 2014 (commencement date) through October 31, 2014:
| | | | | | | | |
| | | 2015 | | | 2014 | |
Ordinary income | | $ | 139,650 | | | $ | 25,080 | |
Tax Components of Net Assets at Period-End:
| | | | |
| | | 2015 | |
Undistributed ordinary income | | $ | 4,473 | |
Net unrealized appreciation (depreciation) — investments | | | (205,566 | ) |
Net unrealized appreciation — other investments | | | 19 | |
Temporary book/tax differences | | | (3,044 | ) |
Capital loss carryforward | | | (340,943 | ) |
Shares of beneficial interest | | | 8,413,588 | |
Total net assets | | $ | 7,868,527 | |
The difference between book-basis and tax-basis unrealized appreciation (depreciation) is due to differences in the timing of recognition of gains and losses on investments for tax and book purposes. The Fund’s net unrealized appreciation (depreciation) difference is attributable primarily to wash sales.
The temporary book/tax differences are a result of timing differences between book and tax recognition of income and/or expenses. The Fund’s temporary book/tax differences are the result of the trustee deferral of compensation and retirement plan benefits.
Capital loss carryforward is calculated and reported as of a specific date. Results of transactions and other activity after that date may affect the amount of capital loss carryforward actually available for the Fund to utilize. Capital losses generated in years beginning after December 22, 2010 can be carried forward for an unlimited period, whereas previous losses expire in eight tax years. Capital losses with an expiration period may not be used to offset capital gains until all net capital losses without an expiration date have been utilized. Capital loss carryforwards with no expiration date will retain their character as either short-term or long-term capital losses instead of as short-term capital losses as under prior law. The ability to utilize capital loss carryforwards in the future may be limited under the Internal Revenue Code and related regulations based on the results of future transactions.
The Fund has a capital loss carryforward as of October 31, 2015, which expires as follows:
| | | | | | | | | | | | |
| Capital Loss Carryforward* | |
| Expiration | | Short-Term | | | Long-Term | | | Total | |
Not subject to expiration | | $ | 339,495 | | | $ | 1,448 | | | $ | 340,943 | |
| * | Capital loss carryforward as of the date listed above is reduced for limitations, if any, to the extent required by the Internal Revenue Code and may be further limited depending upon a variety of factors, including the realization of net unrealized gains or losses as of the date of any reorganization. |
NOTE 7—Investment Securities
The aggregate amount of investment securities (other than short-term securities, U.S. Treasury obligations and money market funds, if any) purchased and sold by the Fund during the year ended October 31, 2015 was $8,926,881 and $5,330,963, respectively. Cost of investments on a tax basis includes the adjustments for financial reporting purposes as of the most recently completed federal income tax reporting period-end.
| | | | |
| Unrealized Appreciation (Depreciation) of Investment Securities on a Tax Basis | |
Aggregate unrealized appreciation of investment securities | | $ | 374,492 | |
Aggregate unrealized (depreciation) of investment securities | | | (580,058 | ) |
Net unrealized (depreciation) of investment securities | | $ | (205,566 | ) |
Cost of investments for tax purposes is $7,997,574.
NOTE 8—Reclassification of Permanent Differences
Primarily as a result of differing book/tax treatment of partnership reclassifications and foreign currency transactions, on October 31, 2015, undistributed net investment income was decreased by $20,125, undistributed net realized gain (loss) was increased by $20,301 and shares of beneficial interest was decreased by $176. This reclassification had no effect on the net assets of the Fund.
19 Invesco Global Infrastructure Fund
NOTE 9—Share Information
| | | | | | | | | | | | | | | | |
| | | Summary of Share Activity | |
| | | Year ended
October 31, 2015(a) | | | May 2, 2014
(commencement Date) through
October 31, 2014 | |
| | | Shares | | | Amount | | | Shares | | | Amount | |
Sold: | | | | | | | | | | | | | | | | |
Class A | | | 143,984 | | | $ | 1,475,203 | | | | 314,147 | | | $ | 3,210,131 | |
Class C | | | 29,868 | | | | 308,833 | | | | 21,242 | | | | 226,573 | |
Class R | | | 1,695 | | | | 16,483 | | | | 1,231 | | | | 12,450 | |
Class Y | | | 240,411 | | | | 2,436,493 | | | | 214,947 | | | | 2,154,251 | |
Class R5 | | | — | | | | — | | | | 1,001 | | | | 10,010 | |
Class R6 | | | 4,688 | | | | 46,838 | | | | 3,567 | | | | 35,487 | |
| | | | |
Issued as reinvestment of dividends: | | | | | | | | | | | | | | | | |
Class A | | | 2,847 | | | | 28,336 | | | | 397 | | | | 4,258 | |
Class C | | | 350 | | | | 3,495 | | | | 47 | | | | 508 | |
Class R | | | 13 | | | | 129 | | | | 1 | | | | 10 | |
Class Y | | | 3,117 | | | | 30,694 | | | | 297 | | | | 3,184 | |
Class R6 | | | 105 | | | | 1,036 | | | | — | | | | — | |
| | | | |
Reacquired: | | | | | | | | | | | | | | | | |
Class A | | | (37,680 | ) | | | (371,188 | ) | | | (80,330 | ) | | | (816,583 | ) |
Class C | | | (17,777 | ) | | | (176,770 | ) | | | (4,264 | ) | | | (42,944 | ) |
Class R | | | (93 | ) | | | (995 | ) | | | — | | | | — | |
Class Y | | | (13,557 | ) | | | (132,381 | ) | | | (841 | ) | | | (9,002 | ) |
Class R6 | | | (1,145 | ) | | | (11,313 | ) | | | — | | | | — | |
Net increase in share activity | | | 356,826 | | | $ | 3,654,893 | | | | 471,442 | | | $ | 4,788,333 | |
| (a) | There are entities that are record owners of more than 5% of the outstanding shares of the Fund and in the aggregate own 44% of the outstanding shares of the Fund. IDI has an agreement with these entities to sell Fund shares. The Fund, Invesco and/or Invesco affiliates may make payments to these entities, which are considered to be related to the Fund, for providing services to the Fund, Invesco and/or Invesco affiliates including but not limited to services such as securities brokerage, distribution, third party record keeping and account servicing. The Fund has no knowledge as to whether all or any portion of the shares owned of record by these entities are also owned beneficially. |
| | In addition, 36% of the outstanding shares of the Fund are owned by the Adviser. |
20 Invesco Global Infrastructure Fund
NOTE 10—Financial Highlights
The following schedule presents financial highlights for a share of the Fund outstanding throughout the periods indicated.
| | | | | | | | | | | | | | | | | | | | | | | | | | | | | | | | | | | | | | | | | | | | | | | | | | | | | | | | |
| | | Net asset
value,
beginning
of period | | | Net
investment
income(a) | | | Net gains
(losses) on
securities
(both
realized and
unrealized) | | | Total from
investment
operations | | | Dividends
from net
investment
income | | | Distributions
from net
realized
gains | | | Total
distributions | | | Net asset
value, end
of period | | | Total
return(b) | | | Net assets,
end of period
(000’s omitted) | | | Ratio of
expenses
to average
net assets
with fee waivers
and/or expenses
absorbed | | | Ratio of
expenses
to average net
assets without
fee waivers
and/or expenses
absorbed | | | Ratio of net
investment
income to average
net assets | | | Portfolio
turnover(c) | |
Class A | | | | | | | | | | | | | | | | | | | | | | | | | | | | | | | | | | | | | | | | | | | | | | | | | |
Year ended 10/31/15 | | $ | 10.66 | | | $ | 0.17 | | | $ | (1.11 | ) | | $ | (0.94 | ) | | $ | (0.21 | ) | | $ | (0.01 | ) | | $ | (0.22 | ) | | $ | 9.50 | | | | (8.85 | )% | | $ | 3,262 | | | | 1.40 | %(d) | | | 6.36 | %(d) | | | 1.68 | %(d) | | | 84 | % |
Year ended 10/31/14(f) | | | 10.00 | | | | 0.08 | | | | 0.63 | | | | 0.71 | | | | (0.05 | ) | | | — | | | | (0.05 | ) | | | 10.66 | | | | 7.12 | | | | 2,497 | | | | 1.39 | (e) | | | 8.60 | (e) | | | 1.51 | (e) | | | 19 | |
Class C | | | | | | | | | | | | | | | | | | | | | | | | | | | | | | | | | | | | | | | | | | | | | | | | | | | | | | | | |
Year ended 10/31/15 | | | 10.64 | | | | 0.09 | | | | (1.10 | ) | | | (1.01 | ) | | | (0.14 | ) | | | (0.01 | ) | | | (0.15 | ) | | | 9.48 | | | | (9.56 | ) | | | 279 | | | | 2.15 | (d) | | | 7.11 | (d) | | | 0.93 | (d) | | | 84 | |
Year ended 10/31/14(f) | | | 10.00 | | | | 0.04 | | | | 0.63 | | | | 0.67 | | | | (0.03 | ) | | | — | | | | (0.03 | ) | | | 10.64 | | | | 6.71 | | | | 181 | | | | 2.14 | (e) | | | 9.35 | (e) | | | 0.76 | (e) | | | 19 | |
Class R | | | | | | | | | | | | | | | | | | | | | | | | | | | | | | | | | | | | | | | | | | | | | | | | | | | | | | | | |
Year ended 10/31/15 | | | 10.66 | | | | 0.14 | | | | (1.11 | ) | | | (0.97 | ) | | | (0.19 | ) | | | (0.01 | ) | | | (0.20 | ) | | | 9.49 | | | | (9.18 | ) | | | 27 | | | | 1.65 | (d) | | | 6.61 | (d) | | | 1.43 | (d) | | | 84 | |
Year ended 10/31/14(f) | | | 10.00 | | | | 0.07 | | | | 0.64 | | | | 0.71 | | | | (0.05 | ) | | | — | | | | (0.05 | ) | | | 10.66 | | | | 7.05 | | | | 13 | | | | 1.64 | (e) | | | 8.85 | (e) | | | 1.26 | (e) | | | 19 | |
Class Y | | | | | | | | | | | | | | | | | | | | | | | | | | | | | | | | | | | | | | | | | | | | | | | | | | | | | | | | |
Year ended 10/31/15 | | | 10.67 | | | | 0.20 | | | | (1.12 | ) | | | (0.92 | ) | | | (0.24 | ) | | | (0.01 | ) | | | (0.25 | ) | | | 9.50 | | | | (8.70 | ) | | | 4,223 | | | | 1.15 | (d) | | | 6.11 | (d) | | | 1.93 | (d) | | | 84 | |
Year ended 10/31/14(f) | | | 10.00 | | | | 0.09 | | | | 0.64 | | | | 0.73 | | | | (0.06 | ) | | | — | | | | (0.06 | ) | | | 10.67 | | | | 7.29 | | | | 2,287 | | | | 1.14 | (e) | | | 8.35 | (e) | | | 1.76 | (e) | | | 19 | |
Class R5 | | | | | | | | | | | | | | | | | | | | | | | | | | | | | | | | | | | | | | | | | | | | | | | | | | | | | | | | |
Year ended 10/31/15 | | | 10.67 | | | | 0.20 | | | | (1.12 | ) | | | (0.92 | ) | | | (0.24 | ) | | | (0.01 | ) | | | (0.25 | ) | | | 9.50 | | | | (8.70 | ) | | | 10 | | | | 1.15 | (d) | | | 6.00 | (d) | | | 1.93 | (d) | | | 84 | |
Year ended 10/31/14(f) | | | 10.00 | | | | 0.09 | | | | 0.64 | | | | 0.73 | | | | (0.06 | ) | | | — | | | | (0.06 | ) | | | 10.67 | | | | 7.29 | | | | 11 | | | | 1.14 | (e) | | | 8.34 | (e) | | | 1.76 | (e) | | | 19 | |
Class R6 | | | | | | | | | | | | | | | | | | | | | | | | | | | | | | | | | | | | | | | | | | | | | | | | | | | | | | | | |
Year ended 10/31/15 | | | 10.67 | | | | 0.20 | | | | (1.12 | ) | | | (0.92 | ) | | | (0.24 | ) | | | (0.01 | ) | | | (0.25 | ) | | | 9.50 | | | | (8.70 | ) | | | 69 | | | | 1.15 | (d) | | | 6.00 | (d) | | | 1.93 | (d) | | | 84 | |
Year ended 10/31/14(f) | | | 10.00 | | | | 0.09 | | | | 0.64 | | | | 0.73 | | | | (0.06 | ) | | | — | | | | (0.06 | ) | | | 10.67 | | | | 7.29 | | | | 38 | | | | 1.14 | (e) | | | 8.34 | (e) | | | 1.76 | (e) | | | 19 | |
| (a) | Calculated using average shares outstanding. |
| (b) | Includes adjustments in accordance with accounting principles generally accepted in the United States of America and as such, the net asset value for financial reporting purposes and the returns based upon those net asset values may differ from the net asset value and returns for shareholder transactions. Does not include sales charges and is not annualized for periods less than one year, if applicable. |
| (c) | Portfolio turnover is calculated at the fund level and is not annualized for periods less than one year, if applicable. |
| (d) | Ratios are based on average daily net assets (000’s omitted) of $3,051, $307, $18, $3,120, $10 and $54 for Class A, Class C, Class R, Class Y, Class R5 and Class R6 shares, respectively. |
| (f) | Commencement date of May 2, 2014. |
21 Invesco Global Infrastructure Fund
Report of Independent Registered Public Accounting Firm
To the Board of Trustees of AIM Investment Funds (Invesco Investment Funds)
and Shareholders of Invesco Global Infrastructure Fund:
In our opinion, the accompanying statement of assets and liabilities, including the schedule of investments, and the related statements of operations and of changes in net assets and the financial highlights present fairly, in all material respects, the financial position of Invesco Global Infrastructure Fund (one of the funds constituting AIM Investment Funds (Invesco Investment Funds), hereafter referred to as the “Fund”) at October 31, 2015, the results of its operations for the year then ended, the changes in its net assets and the financial highlights for the year then ended and for the period May 2, 2014 (commencement of operations) through October 31, 2014, in conformity with accounting principles generally accepted in the United States of America. These financial statements and financial highlights (hereafter referred to as “financial statements”) are the responsibility of the Fund’s management. Our responsibility is to express an opinion on these financial statements based on our audits. We conducted our audits of these financial statements in accordance with the standards of the Public Company Accounting Oversight Board (United States). Those standards require that we plan and perform the audit to obtain reasonable assurance about whether the financial statements are free of material misstatement. An audit includes examining, on a test basis, evidence supporting the amounts and disclosures in the financial statements, assessing the accounting principles used and significant estimates made by management, and evaluating the overall financial statement presentation. We believe that our audits, which included confirmation of securities at October 31, 2015 by correspondence with the custodian and brokers, and the application of alternative auditing procedures where confirmations of security purchases have not been received, provide a reasonable basis for our opinion.
PRICEWATERHOUSECOOPERS LLP
December 23, 2015
Houston, Texas
22 Invesco Global Infrastructure Fund
Calculating your ongoing Fund expenses
Example
As a shareholder of the Fund, you incur two types of costs: (1) transaction costs, which may include sales charges (loads) on purchase payments or contingent deferred sales charges on redemptions, if any; and (2) ongoing costs, including management fees, distribution and/or service (12b-1) fees, and other Fund expenses. This example is intended to help you understand your ongoing costs (in dollars) of investing in the Fund and to compare these costs with ongoing costs of investing in other mutual funds. The example is based on an investment of $1,000 invested at the beginning of the period and held for the entire period May 1, 2015 through October 31, 2015.
Actual expenses
The table below provides information about actual account values and actual expenses. You may use the information in this table, together with the amount you invested, to estimate the expenses that you paid over the period. Simply divide your account value by $1,000 (for example, an $8,600 account value divided by $1,000 = 8.6), then multiply the result by the number in the table under the heading entitled “Actual Expenses Paid During Period” to estimate the expenses you paid on your account during this period.
Hypothetical example for comparison purposes
The table below also provides information about hypothetical account values and hypothetical expenses based on the Fund’s actual expense ratio and an assumed rate of return of 5% per year before expenses, which is not the Fund’s actual return.
The hypothetical account values and expenses may not be used to estimate the actual ending account balance or expenses you paid for the period. You may use this information to compare the ongoing costs of investing in the Fund and other funds. To do so, compare this 5% hypothetical example with the 5% hypothetical examples that appear in the shareholder reports of the other funds.
Please note that the expenses shown in the table are meant to highlight your ongoing costs only and do not reflect any transaction costs, such as sales charges (loads) on purchase payments or contingent deferred sales charges on redemptions, if any. Therefore, the hypothetical information is useful in comparing ongoing costs only, and will not help you determine the relative total costs of owning different funds. In addition, if these transaction costs were included, your costs would have been higher.
| | | | | | | | | | | | | | | | | | | | | | | | |
| Class | | Beginning
Account Value
(05/01/15) | | | ACTUAL | | | HYPOTHETICAL
(5% annual return before
expenses) | | | Annualized
Expense
Ratio | |
| | | Ending
Account Value
(10/31/15)1 | | | Expenses
Paid During
Period2 | | | Ending
Account Value
(10/31/15) | | | Expenses
Paid During
Period2 | | |
| A | | $ | 1,000.00 | | | $ | 897.60 | | | $ | 6.70 | | | $ | 1,018.15 | | | $ | 7.12 | | | | 1.40 | % |
| C | | | 1,000.00 | | | | 894.00 | | | | 10.26 | | | | 1,014.37 | | | | 10.92 | | | | 2.15 | |
| R | | | 1,000.00 | | | | 896.30 | | | | 7.89 | | | | 1,016.89 | | | | 8.39 | | | | 1.65 | |
| Y | | | 1,000.00 | | | | 897.90 | | | | 5.50 | | | | 1,019.41 | | | | 5.85 | | | | 1.15 | |
| R5 | | | 1,000.00 | | | | 897.90 | | | | 5.50 | | | | 1,019.41 | | | | 5.85 | | | | 1.15 | |
| R6 | | | 1,000.00 | | | | 898.70 | | | | 5.50 | | | | 1,019.41 | | | | 5.85 | | | | 1.15 | |
| 1 | The actual ending account value is based on the actual total return of the Fund for the period May 1, 2015 through October 31, 2015, after actual expenses and will differ from the hypothetical ending account value which is based on the Fund’s expense ratio and a hypothetical annual return of 5% before expenses. |
| 2 | Expenses are equal to the Fund’s annualized expense ratio as indicated above multiplied by the average account value over the period, multiplied by 184/365 to reflect the most recent fiscal half year. |
23 Invesco Global Infrastructure Fund
Approval of Investment Advisory and Sub-Advisory Contracts
The Board of Trustees (the Board) of AIM Investment Funds (Invesco Investment Funds) is required under the Investment Company Act of 1940, as amended, to approve annually the renewal of Invesco Global Infrastructure Fund’s (the Fund) investment advisory agreements. During contract renewal meetings held on June 9-10, 2015, the Board as a whole, and the disinterested or “independent” Trustees, who comprise over 75% of the Board, voting separately, approved the continuance for the Fund of the Master Investment Advisory Agreement with Invesco Advisers, Inc. (Invesco Advisers and the investment advisory agreement) and the Master Intergroup Sub-Advisory Contract for Mutual Funds with Invesco Asset Management Deutschland GmbH, Invesco Asset Management Limited, Invesco Asset Management (Japan) Limited, Invesco Hong Kong Limited, Invesco Senior Secured Management, Inc., Invesco Canada Ltd. and Invesco PowerShares Capital Management LLC (collectively, the Affiliated Sub-Advisers and the sub-advisory contracts) for another year, effective July 1, 2015.
In evaluating the fairness and reasonableness of compensation under the Fund’s investment advisory agreement and sub-advisory contracts, the Board considered, among other things, the factors discussed below. The Board determined that continuation of the Fund’s investment advisory agreement and the sub-advisory contracts is in the best interest of the Fund and its shareholders and that the compensation payable to Invesco Advisers and the Affiliated Sub-Advisers under the agreements is fair and reasonable.
The Board’s Fund Evaluation Process
The Board’s Investments Committee has established three Sub-Committees, each of which is primarily responsible for overseeing the performance and investment management services provided by Invesco Advisers and the Affiliated Sub-Advisers to a number of the funds advised by Invesco Advisers (the Invesco Funds). The Sub-Committees meet throughout the year to review the performance of their assigned Invesco Funds, including reviewing materials prepared under the direction of the independent Senior Officer, an officer of the Invesco Funds who reports directly to the independent Trustees. Over the course of each year, the Sub-Committees meet with portfolio managers for their assigned Invesco Funds and other members of management to review the performance, investment objective(s), policies, strategies, limitations and investment risks of these funds. The Board had the benefit of reports from the Sub-Committees and Investments Committee throughout the year in considering approval of the continuance of each Invesco Fund’s investment advisory agreement and sub-advisory contracts for another year.
During the contract renewal process, the Board receives comparative performance and fee data regarding the Invesco Funds prepared by Invesco Advisers and Lipper Inc. (Lipper), an independent provider of investment company data. The Board also receives a report and this independent written evaluation from the Senior Officer. The Senior Officer’s evaluation is prepared as part of his responsibility to manage the process by which the Invesco Funds’ proposed management fees are negotiated during the annual contract renewal process to ensure they are negotiated in a manner that is at arms’ length and reasonable. In addition to meetings with Invesco Advisers and fund counsel, the independent Trustees also discuss the continuance of the investment advisory agreement and sub-advisory contracts in separate sessions with the Senior Officer and with independent legal counsel.
The Trustees recognized that the advisory fee rates for the Invesco Funds are, in many cases, the result of years of review and negotiation. The Trustees’ deliberations and conclusions in a particular year may be based in part on their deliberations and conclusions regarding these arrangements throughout the year and in prior years. The Trustees’ review and conclusions are based on the comprehensive consideration of all information presented to them and are not the result of any single determinative factor. Moreover, one Trustee may have weighed a particular piece of information or factor differently than another Trustee.
The discussion below is a summary of the Senior Officer’s independent written evaluation with respect to the Fund’s investment advisory agreement as well as a discussion of the material factors and related conclusions that formed the basis for the Board’s approval of the Fund’s investment advisory agreement and sub-advisory contracts. Unless otherwise stated, this information is current as of June 10, 2015, and does not reflect consideration of factors that became known to the Board after that date.
Factors and Conclusions and Summary of Evaluation of Investment Advisory and Sub-Advisory Agreements
| A. | Nature, Extent and Quality of Services Provided by Invesco Advisers and the Affiliated Sub-Advisers |
The Board reviewed the advisory services provided to the Fund by Invesco Advisers under the Fund’s investment advisory agreement, the performance of Invesco Advisers in providing these services, and the credentials and experience of the officers and employees of Invesco Advisers who provide these services, including the Fund’s portfolio manager or managers. The Board’s review of the qualifications of Invesco Advisers to provide advisory services included the Board’s
consideration of Invesco Advisers’ investment process oversight, independent credit analysis and investment risk management. The Board also considered non-advisory services that Invesco Advisers and its affiliates provide to the Invesco Funds such as various back office support functions, equity and fixed income trading operations, internal audit, distribution, valuation and legal and compliance.
In determining whether to continue the Fund’s investment advisory agreement, the Board considered the benefits of reapproving an existing relationship and the greater uncertainty that may be associated with entering into a new relationship. The Board concluded that the nature, extent and quality of the services provided to the Fund by Invesco Advisers are appropriate and satisfactory and consistent with the terms of the Fund’s investment advisory agreement.
The Board reviewed the services that may be provided by the Affiliated Sub-Advisers under the sub-advisory contracts and the credentials and experience of the officers and employees of the Affiliated Sub-Advisers who provide these services. The Board noted that the Affiliated Sub-Advisers have offices and personnel that are located in financial centers around the world. As a result, the Affiliated Sub-Advisers can provide research and investment analysis on the markets and economies of various countries in which the Fund may invest, make recommendations regarding securities and assist with security trades. The Board concluded that the sub-advisory contracts benefit the Fund and its shareholders by permitting Invesco Advisers to use the resources and talents of the Affiliated Sub-Advisers in managing the Fund. The Board concluded that the nature, extent and quality of the services that may be provided by the Affiliated Sub-Advisers are appropriate and satisfactory and consistent with the terms of the Fund’s sub-advisory contracts.
The Board noted that the Fund recently began operations and that no comparative performance data was available.
| C. | Advisory and Sub-Advisory Fees |
The Board noted that the Fund had not been in operation long enough to become profitable and that Invesco Advisers was continuing to take entrepreneurial risk in operating the Fund.
The Board noted that Invesco Advisers has contractually agreed to waive fees and/or limit expenses of the Fund through at least February 2016 in an amount necessary to limit total annual operating expenses to a specified percentage of average daily net assets for each class of the Fund.
The Board noted that Invesco Advisers and the Affiliated Sub-Advisers do not manage other mutual funds or client accounts with investment strategies comparable to those of the Fund.
24 Invesco Global Infrastructure Fund
The Board also considered the services that may be provided by the Affiliated Sub-Advisers pursuant to the sub-advisory contracts, as well as the fees payable by Invesco Advisers to the Affiliated Sub-Advisers pursuant to the sub-advisory contracts. The Board also noted that the sub-advisory fees are not paid directly by the Fund, but rather, are payable by Invesco Advisers to the Affiliated Sub-Advisers.
| D. | Economies of Scale and Breakpoints |
The Board considered the extent to which there are economies of scale in the provision of advisory services to the Fund. The Board also considered whether the Fund benefits from economies of scale through contractual breakpoints in the Fund’s advisory fee schedule. The Board also noted that the Fund shares directly in economies of scale through lower fees charged by third party service providers based on the combined size of the Invesco Funds and other clients advised by Invesco Advisers.
| E. | Profitability and Financial Resources |
The Board reviewed information from Invesco Advisers concerning the costs of the advisory and other services that Invesco Advisers and its affiliates provide to the Fund and the Invesco Funds and the profitability of Invesco Advisers and its affiliates in providing these services. The Board received information from Invesco Advisers about the methodology used to prepare the profitability information. The Board noted that Invesco Advisers continues to operate at a net profit from services Invesco Advisers and its affiliates provide to the Invesco Funds. The Board noted that although Invesco Advisers received a minimal amount of revenues from advising the Fund, Invesco Advisers and its subsidiaries did not make a profit from managing the Fund. The Board received and accepted information from Invesco Advisers demonstrating that Invesco Advisers and each Affiliated Sub-Adviser are financially sound and have the resources necessary to perform their obligations under the investment advisory agreement and sub-advisory contracts.
| F. | Collateral Benefits to Invesco Advisers and its Affiliates |
The Board considered various other benefits received by Invesco Advisers and its affiliates from the relationship with the Fund, including the fees received for providing transfer agency and distribution services to the Fund. The Board considered the performance of Invesco Advisers and its affiliates in providing these services and the organizational structure employed to provide these services. The Board also considered that these services are provided to the Fund pursuant to written contracts that are reviewed and approved on an annual basis by the Board; and that the services are required for the operation of the Fund.
The Board considered the benefits realized by Invesco Advisers and the Affiliated Sub-Advisers as a result of portfolio brokerage transactions executed through “soft dollar” arrangements. The Board noted that soft dollar arrangements shift the payment obligation for research
services from Invesco Advisers and the Affiliated Sub-Advisers to the Invesco Funds and that the research received may be used with other clients of Invesco Advisers and may reduce Invesco Advisers’ and the Affiliated Sub-Advisers’ expenses. The Board also considered that it receives periodic reports from the Chief Compliance Officer of the Invesco Funds demonstrating that these arrangements are consistent with regulatory requirements. The Board did not deem the soft dollar arrangements to be inappropriate.
The Board considered that the Fund’s uninvested cash and cash collateral from any securities lending arrangements may be invested in money market funds advised by Invesco Advisers pursuant to procedures approved by the Board. The Board noted that Invesco Advisers receives advisory fees from these affiliated money market funds attributable to such investments, although Invesco Advisers has contractually agreed to waive through varying periods the advisory fees payable by the Invesco Funds with respect to investments in the affiliated money market funds. The waiver is in an amount equal to 100% of the net advisory fee Invesco Advisers receives from the affiliated money market funds with respect to the Fund’s investment in the affiliated money market funds of uninvested cash, but not cash collateral. The Board concluded that the amount of advisory fees received by Invesco Advisors from the Fund’s investment of cash collateral from any securities lending arrangements in the affiliated money market funds is fair and reasonable.
The Board also considered the Fund may use an affiliated broker to execute certain trades for the Fund to, among other things, control information leakage, and were advised that such trades would be executed in compliance with rules under the Investment Company Act of 1940, as amended, and consistent with best execution obligations.
25 Invesco Global Infrastructure Fund
Tax Information
Form 1099-DIV, Form 1042-S and other year-end tax information provide shareholders with actual calendar year amounts that should be included in their tax returns. Shareholders should consult their tax advisors.
The following distribution information is being provided as required by the Internal Revenue Code or to meet a specific state’s requirement.
The Fund designates the following amounts or, if subsequently determined to be different, the maximum amount allowable for its fiscal year ended October 31, 2015:
| | | | |
Federal and State Income Tax | |
Long-Term Capital Gain Distributions | | $ | 0.00 | |
Qualified Dividend Income* | | | 96.06 | % |
Corporate Dividends Received Deduction* | | | 55.25 | % |
U.S. Treasury Obligations* | | | 0.00 | % |
| | * | The above percentages are based on ordinary income dividends paid to shareholders during the Fund’s fiscal year. |
| | | | |
Non-Resident Alien Shareholders | |
Qualified Short-Term Gains | | $ | 5,050 | |
26 Invesco Global Infrastructure Fund
Trustees and Officers
The address of each trustee and officer is AIM Investment Funds (Invesco Investment Funds) (the “Trust”), 11 Greenway Plaza, Suite 1000, Houston, Texas 77046-1173. The trustees serve for the life of the Trust, subject to their earlier death, incapacitation, resignation, retirement or removal as more specifically provided in the Trust’s organizational documents. Each officer serves for a one year term or until their successors are elected and qualified. Column two below includes length of time served with predecessor entities, if any.
| | | | | | | | |
Name, Year of Birth and
Position(s) Held with the Trust | | Trustee and/
or Officer Since | | Principal Occupation(s)
During Past 5 Years | | Number of Funds in Fund Complex Overseen by Trustee | | Other Directorship(s) Held by Trustee During Past 5 Years |
| Interested Persons | | | | | | | | |
| Martin L. Flanagan1 — 1960 Trustee | | 2007 | | Executive Director, Chief Executive Officer and President, Invesco Ltd. (ultimate parent of Invesco and a global investment management firm); Advisor to the Board, Invesco Advisers, Inc. (formerly known as Invesco Institutional (N.A.), Inc.); Trustee, The Invesco Funds; Vice Chair, Investment Company Institute; and Member of Executive Board, SMU Cox School of Business Formerly: Chairman and Chief Executive Officer, Invesco Advisers, Inc. (registered investment adviser); Director, Chairman, Chief Executive Officer and President, IVZ Inc. (holding company), INVESCO Group Services, Inc. (service provider) and Invesco North American Holdings, Inc. (holding company); Director, Chief Executive Officer and President, Invesco Holding Company Limited (parent of Invesco and a global investment management firm); Director, Invesco Ltd.; Chairman, Investment Company Institute and President, Co-Chief Executive Officer, Co-President, Chief Operating Officer and Chief Financial Officer, Franklin Resources, Inc. (global investment management organization). | | 145 | | None |
Philip A. Taylor2 — 1954
Trustee, President and Principal Executive Officer | | 2006 | | Head of North American Retail and Senior Managing Director, Invesco Ltd.; Director, Co-Chairman, Co-President and Co-Chief Executive Officer, Invesco Advisers, Inc. (formerly known as Invesco Institutional (N.A.), Inc.) (registered investment adviser); Director, Chairman, Chief Executive Officer and President, Invesco Management Group, Inc. (formerly known as Invesco Aim Management Group, Inc.) (financial services holding company); Director and President, INVESCO Funds Group, Inc. (registered investment adviser and registered transfer agent); Director and Chairman, Invesco Investment Services, Inc. (formerly known as Invesco Aim Investment Services, Inc.) (registered transfer agent) and IVZ Distributors, Inc. (formerly known as INVESCO Distributors, Inc.) (registered broker dealer); Chief Executive Officer, Invesco Corporate Class Inc. (corporate mutual fund company) Director, Chairman and Chief Executive Officer, Invesco Canada Ltd. (formerly known as Invesco Trimark Ltd./Invesco Trimark Ltèe) (registered investment adviser and registered transfer agent); Trustee, President and Principal Executive Officer, The Invesco Funds (other than AIM Treasurer’s Series Trust (Invesco Treasurer’s Series Trust), Short-Term Investments Trust and Invesco Management Trust); Trustee and Executive Vice President, The Invesco Funds (AIM Treasurer’s Series Trust (Invesco Treasurer’s Series Trust), Short-Term Investments Trust and Invesco Management Trust only); Director, Invesco Investment Advisers LLC (formerly known as Van Kampen Asset Management); Director, Chief Executive Officer and President, Van Kampen Exchange Corp. Formerly: Director, President and Chairman, Invesco Inc. (holding company), Invesco Canada Holdings Inc. (holding company), Trimark Investments Ltd./Placements Trimark Ltèe and Invesco Financial Services Ltd/Services Financiers Invesco Ltèe; Chief Executive Officer, Invesco Canada Fund Inc (corporate mutual fund company); Director and Chairman, Van Kampen Investor Services Inc.; Director, Chief Executive Officer and President, 1371 Preferred Inc. (holding company) and Van Kampen Investments Inc.; Director and President, AIM GP Canada Inc. (general partner for limited partnerships) and Van Kampen Advisors, Inc.; Director and Chief Executive Officer, Invesco Trimark Dealer Inc. (registered broker dealer); Director, Invesco Distributors, Inc. (formerly known as Invesco Aim Distributors, Inc.) (registered broker dealer); Manager, Invesco PowerShares Capital Management LLC; Director, Chief Executive Officer and President, Invesco Advisers, Inc.; Director, Chairman, Chief Executive Officer and President, Invesco Aim Capital Management, Inc.; President, Invesco Trimark Dealer Inc. and Invesco Trimark Ltd./Invesco Trimark Ltèe; Director and President, AIM Trimark Corporate Class Inc. and AIM Trimark Canada Fund Inc.; Senior Managing Director, Invesco Holding Company Limited; Director and Chairman, Fund Management Company (former registered broker dealer); President and Principal Executive Officer, The Invesco Funds (AIM Treasurer’s Series Trust (Invesco Treasurer’s Series Trust), and Short-Term Investments Trust only); President, AIM Trimark Global Fund Inc. and AIM Trimark Canada Fund Inc.. | | 145 | | None |
| 1 | Mr. Flanagan is considered an interested person (within the meaning of Section 2(a)(19) of the 1940 Act) of the Trust because he is an officer of the Adviser to the Trust, and an officer and a director of Invesco Ltd., ultimate parent of the Adviser. |
| 2 | Mr. Taylor is considered an interested person (within the meaning of Section 2(a)(19) of the 1940 Act) of the Trust because he is an officer and a director of the Adviser. |
T-1 Invesco Global Infrastructure Fund
Trustees and Officers—(continued)
| | | | | | | | |
Name, Year of Birth and Position(s) Held with the Trust | | Trustee and/ or Officer Since | | Principal Occupation(s) During Past 5 Years | | Number of Funds in Fund Complex Overseen by Trustee | | Other Directorship(s) Held by Trustee During Past 5 Years |
| Independent Trustees | | | | | | | | |
Bruce L. Crockett — 1944 Trustee and Chair | | 2003 | | Chairman, Crockett Technologies Associates (technology consulting company) Formerly: Director, Captaris (unified messaging provider); Director, President and Chief Executive Officer, COMSAT Corporation; Chairman, Board of Governors of INTELSAT (international communications company); ACE Limited (insurance company); Independent Directors Council and Investment Company Institute | | 145 | | ALPS (Attorneys Liability Protection Society) (insurance company) and Globe Specialty Metals, Inc. (metallurgical company) |
David C. Arch — 1945 Trustee | | 2010 | | Chairman of Blistex Inc., a consumer health care products manufacturer | | 145 | | Board member of the Illinois Manufacturers’ Association; Member of the Board of Visitors, Institute for the Humanities, University of Michigan; Member of the Audit Committee of the Edward-Elmhurst Hospital |
James T. Bunch — 1942 Trustee | | 2000 | | Managing Member, Grumman Hill Group LLC (family office/private equity investments) Formerly: Founder, Green Manning & Bunch Ltd. (investment banking firm) (1988-2010); Executive Committee, United States Golf Association; and Chairman, Board of Governors, Western Golf Association | | 145 | | Chairman of the Board of Trustees, Evans Scholars Foundation; and Chairman of the Board, Denver Film Society |
Rodney F. Dammeyer — 1940 Trustee | | 2010 | | Chairman of CAC, LLC, (private company offering capital investment and management advisory services) Formerly: Prior to 2001, Managing Partner at Equity Group Corporate Investments; Prior to 1995, Chief Executive Officer of Itel Corporation (formerly Anixter International); Prior to 1985, experience includes Senior Vice President and Chief Financial Officer of Household International, Inc., Executive Vice President and Chief Financial Officer of Northwest Industries, Inc. and Partner of Arthur Andersen & Co.; From 1987 to 2010, Director/Trustee of investment companies in the Van Kampen Funds complex | | 145 | | Director of Quidel Corporation and Stericycle, Inc. |
Albert R. Dowden — 1941 Trustee | | 2003 | | Director of a number of public and private business corporations, including the Boss Group, Ltd. (private investment and management); Nature’s Sunshine Products, Inc. and Reich & Tang Funds (5 portfolios) (registered investment company) Formerly: Director, Homeowners of America Holding Corporation/Homeowners of America Insurance Company (property casualty company); Director, Continental Energy Services, LLC (oil and gas pipeline service); Director, CompuDyne Corporation (provider of product and services to the public security market) and Director, Annuity and Life Re (Holdings), Ltd. (reinsurance company); Director, President and Chief Executive Officer, Volvo Group North America, Inc.; Senior Vice President, AB Volvo; Director of various public and private corporations; Chairman, DHJ Media, Inc.; Director, Magellan Insurance Company; and Director, The Hertz Corporation, Genmar Corporation (boat manufacturer), National Media Corporation; Advisory Board of Rotary Power International (designer, manufacturer, and seller of rotary power engines); and Chairman, Cortland Trust, Inc. (registered investment company) | | 145 | | Director of: Nature’s Sunshine Products, Inc., Reich & Tang Funds, Homeowners of America Holding Corporation/ Homeowners of America Insurance Company, the Boss Group |
Jack M. Fields — 1952 Trustee | | 2003 | | Chief Executive Officer, Twenty First Century Group, Inc. (government affairs company); Owner and Chief Executive Officer, Dos Angeles Ranch, L.P. (cattle, hunting, corporate entertainment); and Discovery Global Education Fund (non-profit) Formerly: Chief Executive Officer, Texana Timber LP (sustainable forestry company); Director of Cross Timbers Quail Research Ranch (non-profit); and member of the U.S. House of Representatives | | 145 | | Insperity, Inc. (formerly known as Administaff) |
Prema Mathai-Davis — 1950 Trustee | | 2003 | | Retired. Formerly: Chief Executive Officer, YWCA of the U.S.A. | | 145 | | None |
Larry Soll — 1942 Trustee | | 1997 | | Retired. Formerly: Chairman, Chief Executive Officer and President, Synergen Corp. (a biotechnology company) | | 145 | | None |
Hugo F. Sonnenschein — 1940 Trustee | | 2010 | | President Emeritus and Honorary Trustee of the University of Chicago and the Adam Smith Distinguished Service Professor in the Department of Economics at the University of Chicago. Prior to 2000, President of the University of Chicago | | 145 | | Trustee of the University of Rochester and a member of its investment committee; Member of the National Academy of Sciences and the American Philosophical Society; Fellow of the American Academy of Arts and Sciences |
Raymond Stickel, Jr. — 1944 Trustee | | 2005 | | Retired. Formerly: Director, Mainstay VP Series Funds, Inc. (25 portfolios) and Partner, Deloitte & Touche | | 145 | | None |
T-2 Invesco Global Infrastructure Fund
Trustees and Officers—(continued)
| | | | | | | | |
Name, Year of Birth and Position(s) Held with the Trust | | Trustee and/ or Officer Since | | Principal Occupation(s) During Past 5 Years | | Number of Funds in Fund Complex Overseen by Trustee | | Other Directorship(s) Held by Trustee During Past 5 Years |
| Independent Trustees—(continued) |
Suzanne H. Woolsey — 1941 Trustee | | 2014 | | Chief Executive Officer of Woolsey Partners LLC | | 145 | | Emeritus Chair of the Board of Trustees of the Institute for Defense Analyses; Trustee of Colorado College; Trustee of California Institute of Technology; Prior to 2014, Director of Fluor Corp.; Prior to 2010, Trustee of the German Marshall Fund of the United States; Prior to 2010 Trustee of the Rocky Mountain Institute |
| Other Officers | | | | | | | | |
Russell C. Burk — 1958
Senior Vice President and Senior Officer | | 2005 | | Senior Vice President and Senior Officer, The Invesco Funds | | N/A | | N/A |
John M. Zerr — 1962
Senior Vice President, Chief Legal Officer and Secretary | | 2006 | | Director, Senior Vice President, Secretary and General Counsel, Invesco Management Group, Inc. (formerly known as Invesco Aim Management Group, Inc.) and Van Kampen Exchange Corp.; Senior Vice President, Invesco Advisers, Inc. (formerly known as Invesco Institutional (N.A.), Inc.) (registered investment adviser); Senior Vice President and Secretary, Invesco Distributors, Inc. (formerly known as Invesco Aim Distributors, Inc.); Director, Vice President and Secretary, Invesco Investment Services, Inc. (formerly known as Invesco Aim Investment Services, Inc.) and IVZ Distributors, Inc. (formerly known as INVESCO Distributors, Inc.); Director and Vice President, INVESCO Funds Group, Inc.; Senior Vice President, Chief Legal Officer and Secretary, The Invesco Funds; Managing Director, Invesco PowerShares Capital Management LLC; Director, Secretary and General Counsel, Invesco Investment Advisers LLC (formerly known as Van Kampen Asset Management); Secretary and General Counsel, Invesco Capital Markets, Inc. (formerly known as Van Kampen Funds Inc.) and Chief Legal Officer, PowerShares Exchange-Traded Fund Trust, PowerShares Exchange-Traded Fund Trust II, PowerShares India Exchange-Traded Fund Trust, PowerShares Actively Managed Exchange-Traded Fund Trust, and PowerShares Actively Managed Exchange-Traded Commodity Fund Trust Formerly: Director and Vice President, Van Kampen Advisors Inc.; Director, Vice President, Secretary and General Counsel, Van Kampen Investor Services Inc.; Director, Invesco Distributors, Inc. (formerly known as Invesco Aim Distributors, Inc.); Director, Senior Vice President, General Counsel and Secretary, Invesco Aim Advisers, Inc. and Van Kampen Investments Inc.; Director, Vice President and Secretary, Fund Management Company; Director, Senior Vice President, Secretary, General Counsel and Vice President, Invesco Aim Capital Management, Inc.; Chief Operating Officer and General Counsel, Liberty Ridge Capital, Inc. (an investment adviser); Vice President and Secretary, PBHG Funds (an investment company) and PBHG Insurance Series Fund (an investment company); Chief Operating Officer, General Counsel and Secretary, Old Mutual Investment Partners (a broker-dealer); General Counsel and Secretary, Old Mutual Fund Services (an administrator) and Old Mutual Shareholder Services (a shareholder servicing center); Executive Vice President, General Counsel and Secretary, Old Mutual Capital, Inc. (an investment adviser); and Vice President and Secretary, Old Mutual Advisors Funds (an investment company) | | N/A | | N/A |
Sheri Morris — 1964
Vice President, Treasurer and Principal Financial Officer | | 2003 | | Vice President, Treasurer and Principal Financial Officer, The Invesco Funds; Vice President, Invesco Advisers, Inc. (formerly known as Invesco Institutional (N.A.), Inc.) (registered investment adviser); and Vice President, PowerShares Exchange-Traded Fund Trust, PowerShares Exchange-Traded Fund Trust II, PowerShares India Exchange-Traded Fund Trust, PowerShares Actively Managed Exchange-Traded Fund Trust, and PowerShares Actively Managed Exchange-Traded Commodity Fund Trust Formerly: Vice President, Invesco Aim Advisers, Inc., Invesco Aim Capital Management, Inc. and Invesco Aim Private Asset Management, Inc.; Assistant Vice President and Assistant Treasurer, The Invesco Funds and Assistant Vice President, Invesco Advisers, Inc., Invesco Aim Capital Management, Inc. and Invesco Aim Private Asset Management, Inc.; and Treasurer, PowerShares Exchange-Traded Fund Trust, PowerShares Exchange-Traded Fund Trust II, PowerShares India Exchange-Traded Fund Trust and PowerShares Actively Managed Exchange-Traded Fund Trust | | N/A | | N/A |
T-3 Invesco Global Infrastructure Fund
Trustees and Officers—(continued)
| | | | | | | | |
Name, Year of Birth and
Position(s) Held with the Trust | | Trustee and/
or Officer Since | | Principal Occupation(s)
During Past 5 Years | | Number of Funds in Fund Complex Overseen by Trustee | | Other Directorship(s) Held by Trustee During Past 5 Years |
| Other Officers—(continued) | | | | | | | | |
Karen Dunn Kelley — 1960
Vice President | | 2003 | | Senior Managing Director, Investments, Invesco Ltd.; Director, Co-President, Co-Chief Executive Officer, and Co-Chairman, Invesco Advisers, Inc. (formerly known as Invesco Institutional (N.A.), Inc.) (registered investment adviser); Chairman, Invesco Senior Secured Management, Inc.; Senior Vice President, Invesco Management Group, Inc. (formerly known as Invesco Aim Management Group, Inc.); Executive Vice President, Invesco Distributors, Inc. (formerly known as Invesco Aim Distributors, Inc.); Director, Invesco Mortgage Capital Inc. and Invesco Management Company Limited; Vice President, The Invesco Funds (other than AIM Treasurer’s Series Trust (Invesco Treasurer’s Series Trust), Short-Term Investments Trust and Invesco Management Trust); and President and Principal Executive Officer, The Invesco Funds (AIM Treasurer’s Series Trust (Invesco Treasurer’s Series Trust), Short-Term Investments Trust and Invesco Management Trust only) Formerly: Director and President, INVESCO Asset Management (Bermuda) Ltd., Director, INVESCO Global Asset Management Limited and INVESCO Management S.A.; Senior Vice President, Van Kampen Investments Inc. and Invesco Advisers, Inc. (formerly known as Invesco Institutional (N.A.), Inc.) (registered investment adviser); Vice President, Invesco Advisers, Inc. (formerly known as Invesco Institutional (N.A.), Inc.); Director of Cash Management and Senior Vice President, Invesco Advisers, Inc. and Invesco Aim Capital Management, Inc.; Director and President, Fund Management Company; Chief Cash Management Officer, Director of Cash Management, Senior Vice President, and Managing Director, Invesco Aim Capital Management, Inc.; Director of Cash Management, Senior Vice President, and Vice President, Invesco Advisers, Inc. and The Invesco Funds (AIM Treasurer’s Series Trust (Invesco Treasurer’s Series Trust), and Short-Term Investments Trust only) | | N/A | | N/A |
Crissie M. Wisdom — 1969 Anti-Money Laundering Compliance Officer | | 2013 | | Anti-Money Laundering Compliance Officer, Invesco Advisers, Inc. (formerly known as Invesco Institutional (N.A.), Inc.) (registered investment adviser), Invesco Capital Markets, Inc. (formerly known as Van Kampen Funds Inc.), Invesco Distributors, Inc., Invesco Investment Services, Inc., Invesco Management Group, Inc., Van Kampen Exchange Corp., The Invesco Funds, and PowerShares Exchange-Traded Fund Trust, PowerShares Exchange-Traded Fund Trust II, PowerShares India Exchange-Traded Fund Trust, PowerShares Actively Managed Exchange-Traded Fund Trust and PowerShares Actively Managed Exchange-Traded Commodity Fund Trust; Anti-Money Laundering Compliance Officer and Bank Secrecy Act Officer, INVESCO National Trust Company and Invesco Trust Company; and Fraud Prevention Manager and Controls and Risk Analysis Manager for Invesco Investment Services, Inc.. | | N/A | | N/A |
Lisa O. Brinkley — 1959 Chief Compliance Officer | | 2015 | | Senior Vice President and Chief Compliance Officer, Invesco Advisers, Inc. (registered investment adviser) (formerly known as Invesco Institutional (N.A., Inc.); and Chief Compliance Officer, The Invesco Funds Formerly: Global Assurance Officer, Invesco Ltd. and Vice President, The Invesco Funds; Chief Compliance Officer, Invesco Distributors, Inc. (formerly known as Invesco Aim Distributors, Inc.), Invesco Investment Services, Inc.(formerly known as Invesco Aim Investment Services, Inc.) and Van Kampen Investor Services Inc.; Senior Vice President, Invesco Management Group, Inc.; Senior Vice President and Chief Compliance Officer, Invesco Advisers, Inc. and The Invesco Funds; Vice President and Chief Compliance Officer, Invesco Aim Capital Management, Inc. and Invesco Distributors, Inc.; Vice President, Invesco Investment Services, Inc. and Fund Management Company. | | N/A | | N/A |
The Statement of Additional Information of the Trust includes additional information about the Fund’s Trustees and is available upon request, without charge, by calling 1.800.959.4246. Please refer to the Fund’s prospectus for information on the Fund’s sub-advisers.
| | | | | | |
Office of the Fund 11 Greenway Plaza, Suite 1000 Houston, TX 77046-1173 | | Investment Adviser Invesco Advisers, Inc. 1555 Peachtree Street, N.E. Atlanta, GA 30309 | | Distributor
Invesco Distributors, Inc. 11 Greenway Plaza, Suite 1000 Houston, TX 77046-1173 | | Auditors PricewaterhouseCoopers LLP 1000 Louisiana Street, Suite 5800 Houston, TX 77002-5678 |
| | | |
| | | | | | |
Counsel to the Fund Stradley Ronon Stevens & Young, LLP 2005 Market Street, Suite 2600 Philadelphia, PA 19103-7018 | | Counsel to the Independent Trustees Goodwin Procter LLP 901 New York Avenue, N.W. Washington, D.C. 20001 | | Transfer Agent Invesco Investment Services, Inc. 11 Greenway Plaza, Suite 1000 Houston, TX 77046-1173 | | Custodian State Street Bank and Trust Company 225 Franklin Street Boston, MA 02110-2801 |
T-4 Invesco Global Infrastructure Fund

Invesco mailing information
Send general correspondence to Invesco Investment Services, Inc., P.O. Box 219078, Kansas City, MO 64121-9078.
Important notice regarding delivery of security holder documents
To reduce Fund expenses, only one copy of most shareholder documents may be mailed to shareholders with multiple accounts at the same address (Householding). Mailing of your shareholder documents may be householded indefinitely unless you instruct us otherwise. If you do not want the mailing of these documents to be combined with those for other members of your household, please contact Invesco Investment Services, Inc. at 800 959 4246 or contact your financial institution. We will begin sending you individual copies for each account within 30 days after receiving your request.
Fund holdings and proxy voting information
The Fund provides a complete list of its holdings four times in each fiscal year, at the quarter ends. For the second and fourth quarters, the lists appear in the Fund’s semiannual and annual reports to shareholders. For the first and third quarters, the Fund files the lists with the Securities and Exchange Commission (SEC) on Form N-Q. The most recent list of portfolio holdings is available at invesco.com/completeqtrholdings. Shareholders can also look up the Fund’s Forms N-Q on the SEC website at sec.gov. Copies of the Fund’s Forms N-Q may be reviewed and copied at the SEC Public Reference Room in Washington, D.C. You can obtain information on the operation of the Public Reference Room, including information about duplicating fee charges, by calling 202 551 8090 or 800 732 0330, or by electronic request at the following email address: publicinfo@sec.gov. The SEC file numbers for the Fund are shown below.
A description of the policies and procedures that the Fund uses to determine how to vote proxies relating to portfolio securities is available without charge, upon request, from our Client Services department at 800 959 4246 or at invesco.com/proxyguidelines. The information is also available on the SEC website, sec.gov.
| | |
Information regarding how the Fund voted proxies related to its portfolio securities during the most recent 12-month period ended June 30 is available at invesco.com/proxysearch. The information is also available on the SEC website, sec.gov. Invesco Advisers, Inc. is an investment adviser; it provides investment advisory services to individual and institutional clients and does not sell securities. Invesco Distributors, Inc. is the US distributor for Invesco Ltd.’s retail mutual funds, exchange-traded funds and institutional money market funds. Both are wholly owned, indirect subsidiaries of Invesco Ltd. | |  |
SEC file numbers: 811-05426 and 033-19338 GBLI-AR-1 Invesco Distributors, Inc.
| | | | |
| | |
 | | Annual Report to Shareholders | | October 31, 2015 |
| | |
| | Invesco Global Market Neutral Fund |
| | Nasdaq: |
| | A: MKNAX n C: MKNCX n R: MKNRX n Y: MKNYX n R5: MKNFX n R6: MKNSX |

Letters to Shareholders
| | |

Philip Taylor | | Dear Shareholders: This annual report includes information about your Fund, including performance data and a complete list of its investments as of the close of the reporting period. Inside is a discussion of how your Fund was managed and the factors that affected its performance during the reporting period. I hope you find this report of interest. The US economy expanded and unemployment declined throughout the reporting period. Continuing low energy prices benefited consumers, but a strong US dollar crimped corporate profits. The US Federal Reserve signaled that it was increasingly likely to raise interest rates, based on generally positive economic data, but uncertainty remained about when it might act. Overseas, the story was much different. Low energy prices hurt the economies of some oil-producing nations, such as Brazil and Russia. During the reporting period, the European |
Central Bank as well as central banks in China and Japan – among other countries – either instituted or maintained extraordinarily accommodative monetary policies in response to economic weakness.
Investor uncertainty, such as we saw for much of the reporting period – and market volatility, such as we saw at the end of the reporting period – are unfortunate facts of life when it comes to investing. Some investors use these things as excuses to delay saving and investing for their long-term financial goals. That’s why Invesco encourages investors to work with a professional financial adviser who can stress the importance of starting to save and invest early and the importance of adhering to a disciplined investment plan – when times are good and when they’re uncertain. A financial adviser who knows your unique financial situation, investment goals and risk tolerance can be an invaluable partner as you seek to achieve your financial goals. He or she can offer a long-term perspective when markets are volatile and time-tested advice and guidance when your financial situation or investment goals change.
Timely information when and where you want it
Invesco’s efforts to help investors achieve their financial objectives include providing individual investors and financial professionals with timely information about the markets, the economy and investing – whenever and wherever they want it.
Our website, invesco.com/us, offers a wide range of market insights and investment perspectives. On the website, you’ll find detailed information about our funds, including prices, performance, holdings and portfolio manager commentaries. You can access information about your account by completing a simple, secure online registration. Click on the “Need to register” link in the “Account Access” box on our homepage to get started.
Invesco’s mobile apps for iPhone® and iPad® (both available free from the App StoreSM) allow you to obtain the same detailed information, monitor your account and create customizable watch lists. Also, they allow you to access investment insights from our investment leaders, market strategists, economists and retirement experts. You can sign up to be alerted when new commentary is added, and you can watch portfolio manager videos and have instant access to Invesco news and updates wherever you may be.
In addition to the resources accessible on our website and through our mobile app, you can obtain timely updates to help you stay informed about the markets, the economy and investing by connecting with Invesco on Twitter, LinkedIn or Facebook. You can access our blog at blog.invesco.us.com. Our goal is to provide you the information you want, when and where you want it.
Have questions?
For questions about your account, feel free to contact an Invesco client services representative at 800 959 4246. For Invesco-related questions or comments, please email me directly at phil@invesco.com.
All of us at Invesco look forward to serving your investment management needs for many years to come. Thank you for investing with us.
Sincerely,

Philip Taylor
Senior Managing Director, Invesco Ltd.
iPhone and iPad are trademarks of Apple Inc., registered in the US and other countries. App Store is a service mark of Apple Inc. Invesco Distributors, Inc. is not affiliated with Apple Inc.
2 Invesco Global Market Neutral Fund
| | |

Bruce Crockett | | Dear Fellow Shareholders: Among the many important lessons I’ve learned in more than 40 years in a variety of business endeavors is the value of a trusted advocate. As independent chair of the Invesco Funds Board, I can assure you that the members of the Board are strong advocates for the interests of investors in Invesco’s mutual funds. We work hard to represent your interests through oversight of the quality of the investment management services your funds receive and other matters important to your investment, including but not limited to: n Ensuring that Invesco offers a diverse lineup of mutual funds that your financial adviser can use to strive to meet your financial needs as your investment goals change over time. n Monitoring how the portfolio management teams of the Invesco funds are performing in light of changing economic and market conditions. |
| n | | Assessing each portfolio management team’s investment performance within the context of the investment strategy described in the fund’s prospectus. |
| n | | Monitoring for potential conflicts of interests that may impact the nature of the services that your funds receive. |
We believe one of the most important services we provide our fund shareholders is the annual review of the funds’ advisory and sub-advisory contracts with Invesco Advisers and its affiliates. This review is required by the Investment Company Act of 1940 and focuses on the nature and quality of the services Invesco provides as the adviser to the Invesco funds and the reasonableness of the fees that it charges for those services. Each year, we spend months carefully reviewing information received from Invesco and a variety of independent sources, such as performance and fee data prepared by Lipper Inc., an independent, third-party firm widely recognized as a leader in its field. We also meet with our independent legal counsel and other independent advisers to review and help us assess the information that we have received. Our goal is to assure that you receive quality investment management services for a reasonable fee.
I trust the measures outlined above provide assurance that you have a worthy advocate when it comes to choosing the Invesco Funds.
As always, please contact me at bruce@brucecrockett.com with any questions or concerns you may have. On behalf of the Board, we look forward to continuing to represent your interests and serving your needs.
Sincerely,

Bruce L. Crockett
Independent Chair
Invesco Funds Board of Trustees
3 Invesco Global Market Neutral Fund
Management’s Discussion of Fund Performance
| | | | | |
Performance summary For the fiscal year ended October 31, 2015, Class A shares of Invesco Global Market Neutral Fund (the Fund), at net asset value (NAV), outperformed the Citigroup 90-Day Treasury Bill Index, the Fund’s broad market/style-specific benchmark. Your Fund’s long-term performance appears later in this report. |
| | | | | |
Fund vs. Indexes Total returns, 10/31/14 to 10/31/15, at net asset value (NAV). Performance shown does not include applicable contingent deferred sales charges (CDSC) or front-end sales charges, which would have reduced performance. |
| | | | |
| |
Class A Shares | | | 0.16 | % |
Class C Shares | | | -0.35 | |
Class R Shares | | | -0.01 | |
Class Y Shares | | | 0.47 | |
Class R5 Shares | | | 0.47 | |
Class R6 Shares | | | 0.47 | |
Citigroup 90-Day Treasury Bill Indexq (Broad Market/Style-Specific Index) | | | 0.02 | |
Lipper Alternative Equity Market Neutral Indexn (Peer Group Index) | | | -1.72 | |
Source(s): qFactSet Research Systems Inc.; nLipper Inc.
Market conditions and your Fund
World equity markets delivered modestly positive returns for the fiscal year ended October 31, 2015, with positive returns in the first half and negative returns in the second half. Market-moving headlines during the fiscal year included the rapid decline in oil prices, diverging monetary policies between the US and other developing countries, and slowing economic growth in China, which had negative implications for growth globally.
As a result of outlooks for global economic growth differing by region, the performance of individual economic sectors
varied during the fiscal year. The information technology (IT) sector performed well, especially the Internet software and services industry. The consumer discretionary sector also performed well, due in part to lower gas prices and continued low interest rates. The worst-performing sector was energy, due to an increased supply/demand imbalance, followed by materials, which was hurt by concerns of slowing global demand.
The Fund generally follows a market neutral strategy, which is designed to produce a portfolio that experiences minimal
influence from the return patterns of global equity markets. The Fund implements its strategy by purchasing investments (long positions) with equity expo-sure that we believe to be undervalued and selling short investments (short positions) that we believe to be overvalued in the same industry. Stock selection is the primary source of return for the Fund, which uses offsetting long and short positions to generate return and manage risk.
As part of the investment process, the Fund evaluates fundamental and behavioral factors to forecast individual securities’ returns and risks, and ranks these securities based on their attractiveness relative to industry and country peers. In a market neutral construct, a positive spread between the top- and bottom-ranked stocks (long and short candidates for the portfolio) typically leads to outperformance relative to the Citigroup 90-Day Treasury Bill Index. During the fiscal year, the Fund benefited most from a positive long/short spread in six of 10 sectors. The widest positive spreads (long versus short) were in the industrials, consumer discretionary and energy sectors. The long/short spread was most negative in the health care and IT sectors, and this detracted from Fund performance for the fiscal year.
In the industrials sector, both long and short holdings contributed to Fund performance for the fiscal year, with the Fund’s long holdings outperforming its short holdings in the capital goods, commercial
| | | | | | | | | | | | | | | | |
Portfolio Composition | | | | | | | | | | | | | | | | |
By sector, based on total investments | | | | | | | | | | | | | | | | |
| | | Equity Securities | | | Gross | | | Net | |
| | | Long1 | | | Short2 | | | Exposure3 | | | Exposure4 | |
Consumer Discretionary | | | 18.6 | % | | | 18.6 | % | | | 37.2 | % | | | 0.0 | % |
Industrials | | | 18.2 | | | | 13.8 | | | | 32.0 | | | | 4.4 | |
Information Technology | | | 17.1 | | | | 16.6 | | | | 33.7 | | | | 0.5 | |
Energy | | | 11.5 | | | | 10.8 | | | | 22.3 | | | | 0.7 | |
Health Care | | | 8.6 | | | | 8.1 | | | | 16.7 | | | | 0.5 | |
Consumer Staples | | | 6.8 | | | | 7.0 | | | | 13.8 | | | | -0.2 | |
Materials | | | 3.9 | | | | 4.2 | | | | 8.1 | | | | -0.3 | |
Financials | | | 3.6 | | | | 8.5 | | | | 12.1 | | | | -4.9 | |
Telecommunication Services | | | 2.6 | | | | 2.2 | | | | 4.8 | | | | 0.4 | |
Utilities | | | 2.1 | | | | 2.9 | | | | 5.0 | | | | -0.8 | |
Money Market Funds | | | | | | | | | | | | | | | | |
Plus Other Assets Less Liabilities | | | 7.0 | | | | – | | | | 7.0 | | | | 7.0 | |
Total | | | 100.0 | | | | 92.7 | | | | 192.7 | | | | 7.3 | |
| 1 | Represents the value of the equity securities in the portfolio. |
| 2 | Represents the value of the equity securities underlying the Fund’s equity short portfolio swap. |
| 3 | Represents the cumulative exposure of the Fund’s long and short positions. |
| 4 | Represents the net exposure of the Fund’s long and short positions. |
| | | | |
Total Net Assets | | $ | 19.8 million | |
Data presented here are as of October 31, 2015.
4 Invesco Global Market Neutral Fund
and professional services, and non-airline transportation industries. Within the consumer discretionary sector, the Fund’s long holdings in the auto and media industries, and its short holdings in consumer services industries (such as entertainment, restaurants and leisure) were the strongest contributors to Fund performance for the reporting period.
Conversely, in the health care sector, several short biotechnology holdings increased in price and detracted from Fund performance for the fiscal year. In the IT sector, the Fund’s long holdings in the computer and electronics industry detracted from Fund performance while its short holdings in Internet software and services and IT services and software industries outpaced its long holdings, hindering Fund returns for the reporting period.
At the end of the reporting period, the Fund’s largest gross sector exposures were in the IT, consumer discretionary and industrials sectors.
Please note that the Fund may utilize derivative instruments that include equity total return swaps and futures contracts. During the reporting period, the Fund utilized equity total return swaps to efficiently implement its strategy, but did not use future contracts. The implementation impact of using equity total return swaps is a component of transaction costs. Derivatives may amplify traditional investment risks through the creation of leverage and may be less liquid than traditional securities.
Thank you for your investment in Invesco Global Market Neutral Fund.
The views and opinions expressed in management’s discussion of Fund performance are those of Invesco Advisers, Inc. These views and opinions are subject to change at any time based on factors such as market and economic conditions. These views and opinions may not be relied upon as investment advice or recommendations, or as an offer for a particular security. The information is not a complete analysis of every aspect of any market, country, industry, security or the Fund. Statements of fact are from sources considered reliable, but Invesco Advisers, Inc. makes no representation or warranty as to their completeness or accuracy. Although historical performance is no guarantee of future results, these insights may help you understand our investment management philosophy.
See important Fund and, if applicable, index disclosures later in this report.
| | |
 | | Michael Abata Chartered Financial Analyst, Portfolio Manager, is manager of Invesco Global Market Neutral Fund. |
| |
| He joined Invesco in 2011. Mr. Abata earned a BA in economics from Binghamton University. |
| |
 | | Uwe Draeger Portfolio Manager, is manager of Invesco Global Market Neutral Fund. He joined Invesco in 2005. Mr. Draeger earned a |
| |
| Diplom Ökonom degree from Hochschule für Ökonomie Berlin, an MA from City of London Polytechnic and an MBA from Anglia Business School (Cambridge). |
| |
 | | Nils Huter Chartered Financial Analyst, Portfolio Manager, is manager of Invesco Global Market Neutral Fund. |
| |
| He joined Invesco in 2007. Mr. Huter earned a business administration degree “Diplom Kaufmann (FH)” from the University of Applied Sciences and Arts in Hildesheim. |
| |
 | | Charles Ko Chartered Financial Analyst, Portfolio Manager, is manager of Invesco Global Market Neutral Fund. |
| |
| He joined Invesco in 2012. Mr. Ko earned a BS from MIT and an MBA from Yale University. |
| |
 | | Jens Langewand Portfolio Manager, is manager of Invesco Global Market Neutral Fund. He joined Invesco in 2007. |
| |
| Mr. Langewand earned a Diplom Kaufmann degree from the University of Münster and a PhD from the University of Augsburg. |
| |
 | | Andrew Waisburd Portfolio Manager, is manager of Invesco Global Market Neutral Fund. He joined Invesco in 2008. |
| |
| Mr. Waisburd earned a BS in statistics from Cornell University and an MS and a PhD in finance from Indiana University. |
5 Invesco Global Market Neutral Fund
Your Fund’s Long-Term Performance
Results of a $10,000 Investment – Oldest Share Class(es) since Inception
Fund and index data from 12/19/13
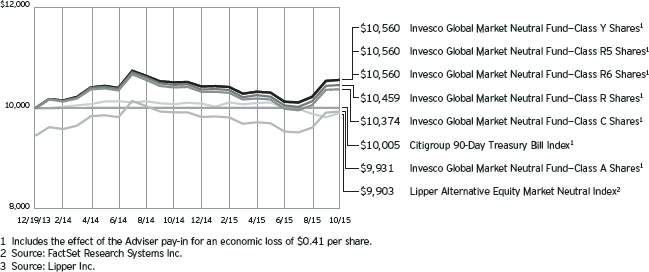
Past performance cannot guarantee comparable future results.
The data shown in the chart include reinvested distributions, applicable sales charges and Fund expenses including
management fees. Index results include reinvested dividends, but they do not reflect sales charges. Performance of the peer group, if applicable, reflects fund expenses and management fees;
performance of a market index does not. Performance shown in the chart and table(s) does not reflect deduction of taxes a shareholder would pay on Fund distributions or sale of Fund shares.
sources. The securities of small- and mid-sized companies may be more volatile due to less market interest and less publicly available information about the issuer. They also may be illiquid or restricted as to resale, or may trade less frequently and in smaller volumes, all of which may cause difficulty when establishing or closing a position at a desirable price.
About indexes used in this report
| n | | The Citigroup 90-Day Treasury Bill Index is an unmanaged index representative of three-month Treasury bills. |
| n | | The Lipper Alternative Equity Market Neutral Index is an unmanaged index considered representative of funds that employ portfolio strategies generating consistent returns in both up and down markets by selecting positions with a total net market exposure of zero. |
| n | | The Fund is not managed to track the performance of any particular index, including the index(es) described here, and consequently, the performance of the Fund may deviate significantly from the performance of the index(es). |
| n | | A direct investment cannot be made in an index. Unless otherwise indicated, index results include reinvested dividends, and they do not reflect sales charges. Performance of the peer group, if applicable, reflects fund expenses; performance of a market index does not. |
Other information
| n | | The returns shown in management’s discussion of Fund performance are based on net asset values (NAVs) calculated for shareholder transactions. Generally accepted accounting principles require adjustments to be made to the net assets of the Fund at period end for financial re-porting purposes, and as such, the NAVs for shareholder transactions and the re-turns based on those NAVs may differ from the NAVs and returns reported in the Financial Highlights. |
| n | | Industry classifications used in this report are generally according to the Global Industry Classification Standard, which was developed by and is the exclusive property and a service mark of MSCI Inc. and Standard & Poor’s. |
6 Invesco Global Market Neutral Fund
| | | | |
Average Annual Total Returns | |
As of 10/31/15, including maximum applicable sales charges | |
| |
Class A Shares | | | | |
Inception (12/19/13) | | | -0.37 | %* |
1 Year | | | -5.34 | |
| |
Class C Shares | | | | |
Inception (12/19/13) | | | 1.99 | %* |
1 Year | | | -1.33 | |
| |
Class R Shares | | | | |
Inception (12/19/13) | | | 2.43 | %* |
1 Year | | | -0.01 | |
| |
Class Y Shares | | | | |
Inception (12/19/13) | | | 2.96 | %* |
1 Year | | | 0.47 | |
| |
Class R5 Shares | | | | |
Inception (12/19/13) | | | 2.96 | %* |
1 Year | | | 0.47 | |
| |
Class R6 Shares | | | | |
Inception (12/19/13) | | | 2.96 | %* |
1 Year | | | 0.47 | |
| * | Amount includes the effect of the Adviser pay-in for an economic loss of $0.41 per share. Had the pay-in not been made, average annual total returns were estimated at -2.51%, -0.23%, 0.22%, 0.75%, 0.75% and 0.75% for Class A, Class C, Class R, Class Y, Class R5 and Class R6 shares, respectively. |
| | | | |
Average Annual Total Returns | |
As of 9/30/15, the most recent calendar quarter end, including maximum applicable sales charges | |
| |
Class A Shares | | | | |
Inception (12/19/13) | | | -0.50 | %** |
1 Year | | | -5.70 | |
| |
Class C Shares | | | | |
Inception (12/19/13) | | | 2.03 | %** |
1 Year | | | -1.71 | |
| |
Class R Shares | | | | |
Inception (12/19/13) | | | 2.44 | %** |
1 Year | | | -0.49 | |
| |
Class Y Shares | | | | |
Inception (12/19/13) | | | 2.94 | %** |
1 Year | | | -0.01 | |
| |
Class R5 Shares | | | | |
Inception (12/19/13) | | | 2.99 | %** |
1 Year | | | 0.09 | |
| |
Class R6 Shares | | | | |
Inception (12/19/13) | | | 2.99 | %** |
1 Year | | | 0.09 | |
| ** | Amount includes the effect of the Adviser pay-in for an economic loss of $0.41 per share. Had the pay-in not been made, average annual total returns were estimated at -2.74%, -0.30%, 0.12%, 0.62%, 0.68% and 0.68% for Class A, Class C, Class R, Class Y, Class R5 and Class R6 shares, respectively. |
The performance data quoted represent past performance and cannot guarantee comparable future results; current performance may be lower or higher. Please visit invesco.com/performance for the most recent month-end performance. Performance figures reflect reinvested distributions, changes in net asset value and the effect of the maximum sales charge unless otherwise stated. Investment return and principal value will fluctuate so that you may have a gain or loss when you sell shares.
The net annual Fund operating expense ratio set forth in the most recent Fund prospectus as of the date of this report for Class A, Class C, Class R, Class Y, Class R5 and Class R6 shares was 1.62%, 2.37%, 1.87%, 1.37%, 1.37% and 1.37%, respectively.1,2 The total annual Fund operating expense ratio set forth in the most recent Fund prospectus as of the date of this report for Class A, Class C, Class R, Class Y, Class R5 and Class R6 shares was 4.62%, 5.37%, 4.87%, 4.37%, 4.34% and 4.34%, respectively. The expense ratios presented
above may vary from the expense ratios presented in other sections of this report that are based on expenses incurred during the period covered by this report.
Class A share performance reflects the maximum 5.50% sales charge, and Class C share performance reflects the applicable contingent deferred sales charge (CDSC) for the period involved. The CDSC on Class C shares is 1% for the first year after purchase. Class R, Class Y, Class R5 and Class R6 class shares do not have a front-end sales charge or a CDSC; therefore, performance is at net asset value.
The performance of the Fund’s share classes will differ primarily due to different sales charge structures and class expenses.
Fund performance reflects any applicable fee waivers and/or expense reimbursements. Had the adviser not waived fees and/or reimbursed expenses currently or in the past, returns would have been lower. See current prospectus for more information.
| 1 | Total annual Fund operating expenses after any contractual fee waivers and/or expense reimbursements by the adviser in effect through at least February 28, 2017. See current prospectus for more information. |
| 2 | Total annual Fund operating expenses after any contractual fee waivers and/or expense reimbursements by the adviser in effect through at least June 30, 2017. See current prospectus for more information. |
7 Invesco Global Market Neutral Fund
Invesco Global Market Neutral Fund’s investment objective is to seek to provide a positive return over a full market cycle from a broadly diversified portfolio of stocks while seeking to limit exposure to the general risks associated with stock market investing.
| n | | Unless otherwise stated, information presented in this report is as of October 31, 2015, and is based on total net assets. |
| n | | Unless otherwise noted, all data provided by Invesco. |
| n | | To access your Fund’s reports/prospectus, visit invesco.com/fundreports. |
About share classes
| n | | Class R shares are generally available only to employer sponsored retirement and benefit plans. Please see the prospectus for more information. |
| n | | Class Y shares are available only to certain investors. Please see the prospectus for more information. |
| n | | Class R5 shares and Class R6 shares are primarily intended for employer sponsored retirement and benefit plans that meet certain standards and for institutional investors. Please see the prospectus for more information. |
Principal risks of investing in the Fund
| n | | Currency/exchange rate risk. The dollar value of the Fund’s foreign investments will be affected by changes in the exchange rates between the dollar and the currencies in which those investments are traded. |
| n | | Derivatives risk. The value of a derivative instrument depends largely on (and is derived from) the value of an underlying security, currency, commodity, interest rate, index or other asset (each referred to as an underlying asset). In addition to risks relating to the underlying assets, the use of derivatives may include other, possibly greater, risks, including counterparty, leverage and liquidity risks. Counterparty risk is the risk that the counterparty to the derivative contract will default on its obligation to pay the Fund the amount owed or otherwise perform under the derivative contract. Derivatives create leverage risk because they do not require payment up front equal to the economic exposure created by owning the derivative. As a result, an adverse change in the value of the underlying asset could result in the Fund sustaining a loss that is substantially greater than the amount invested in the derivative, which may make the Fund’s returns more volatile and increase the risk of loss. Derivative instruments may also |
| | be less liquid than more traditional investments and the Fund may be unable to sell or close out its derivative positions at a desirable time or price. This risk may be more acute under adverse market conditions, during which the Fund may be most in need of liquidating its derivative positions. Derivatives may also be harder to value, less tax efficient and subject to changing government regulation that could impact the Fund’s ability to use certain derivatives or their cost. Also, derivatives used for hedging or to gain or limit exposure to a particular market segment may not provide the expected benefits, particularly during adverse market conditions. These risks are greater for the Fund than most other mutual funds because the Fund will implement its investment strategy primarily through derivative instruments rather than direct investments in stocks and bonds. |
| n | | Foreign securities risk. The Fund’s foreign investments may be affected by changes in a foreign country’s exchange rates, political and social instability, changes in economic or taxation policies, difficulties when enforcing obligations, decreased liquidity, and increased volatility. Foreign companies may be subject to less regulation resulting in less publicly available information about the companies. |
| n | | Management risk. The investment techniques and risk analysis used by the Fund’s portfolio managers may not produce the desired results. In particular, there is no guarantee that the portfolio manager’s stock selection process will produce a market neutral portfolio that reduces or eliminates the Fund’s exposure to general stock market risk in the jurisdictions in which the Fund invests, sector or industry-specific risk or market capitalization risk. In addition, the Fund’s market neutral investment strategy will likely cause the Fund to underperform the broader equity markets in which the Fund invests during |
| | market rallies. Such underperformance could be significant during sudden or significant market rallies. Although the Fund seeks to provide a positive return, investors may lose money by investing in the Fund. |
| n | | Market risk. The prices of and the income generated by the Fund’s securities may decline in response to, among other things, investor sentiment, general economic and market conditions, regional or global instability, and currency and interest rate fluctuations. |
| n | | Preferred securities risk. Preferred securities may include provisions that permit the issuer, in its discretion, to defer or omit distributions for a certain period of time. If the Fund owns a security that is deferring or omitting its distributions, the Fund may be required to report the distribution on its tax returns, even though it may not have received this income. Further, preferred securities may lose substantial value due to the omission or deferment of dividend payments. |
| n | | Short sales risk. Short sales may cause the Fund to repurchase a security at a higher price, thereby causing the Fund to incur a loss. A short position in a security poses more risk than holding the same security long. As there is no limit on how much the price of the security can increase, the Fund’s exposure is unlimited. In order to establish a short position in a security, the Fund must borrow the security from a broker. The Fund may not always be able to borrow a security the Fund seeks to sell short at a particular time or at an acceptable price. The Fund also may not always be able to close out the short position by replacing the borrowed securities at a particular time or at an acceptable price. The Fund will incur increased transaction costs associated with selling securities short. In addition, taking short positions in securities results in a form of leverage which may cause the Fund to be volatile. |
| n | | Small- and mid-capitalization risks. Stocks of small- and mid-sized companies tend to be more vulnerable to adverse developments and may have little or no operating history or track record of success, and limited product lines, markets, management and financial re- |
continued on page 6
|
This report must be accompanied or preceded by a currently effective Fund prospectus, which contains more complete information, including sales charges and expenses. Investors should read it carefully before investing. |
NOT FDIC INSURED | MAY LOSE VALUE | NO BANK GUARANTEE
8 Invesco Global Market Neutral Fund
Schedule of Investments
October 31, 2015
| | | | | | | | |
| | | Shares | | | Value | |
Common Stocks & Other Equity Interests–93.02% | |
| Australia–3.26% | |
Blackmores Ltd. | | | 854 | | | $ | 102,109 | |
Caltex Australia Ltd. | | | 9,687 | | | | 216,205 | |
Echo Entertainment Group Ltd. | | | 68,574 | | | | 249,880 | |
Ramsay Health Care Ltd. | | | 1,775 | | | | 77,930 | |
| | | | | | | | 646,124 | |
|
| Canada–3.23% | |
Barrick Gold Corp. | | | 7,000 | | | | 53,797 | |
Canadian Tire Corp., Ltd.–Class A | | | 1,000 | | | | 87,956 | |
Dollarama Inc. | | | 2,700 | | | | 182,374 | |
Dominion Diamond Corp. | | | 10,200 | | | | 107,873 | |
Enerplus Corp. | | | 13,100 | | | | 61,809 | |
Metro Inc. | | | 1,800 | | | | 51,466 | |
Stantec Inc. | | | 1,200 | | | | 30,117 | |
Suncor Energy, Inc. | | | 1,500 | | | | 44,632 | |
Teck Resources Ltd.–Class B | | | 3,600 | | | | 21,087 | |
| | | | | | | | 641,111 | |
|
| China–1.76% | |
Yangzijiang Shipbuilding Holdings Ltd. | | | 392,900 | | | | 349,094 | |
|
| Denmark–3.44% | |
Pandora A/S | | | 2,883 | | | | 331,899 | |
Vestas Wind Systems A/S | | | 6,032 | | | | 350,541 | |
| | | | | | | | 682,440 | |
|
| Finland–0.76% | |
Neste Oyj | | | 6,210 | | | | 151,239 | |
|
| France–2.80% | |
Peugeot S.A.(a) | | | 20,554 | | | | 362,217 | |
Technicolor S.A. | | | 7,992 | | | | 54,209 | |
Valeo S.A. | | | 902 | | | | 139,284 | |
| | | | | | | | 555,710 | |
|
| Germany–4.48% | |
Aurubis AG | | | 2,106 | | | | 140,811 | |
Continental AG | | | 320 | | | | 76,961 | |
Duerr AG | | | 350 | | | | 29,163 | |
Gerresheimer AG | | | 670 | | | | 52,291 | |
KUKA AG | | | 1,237 | | | | 104,596 | |
ProSiebenSat.1 Media SE | | | 7,311 | | | | 395,483 | |
Salzgitter AG | | | 3,049 | | | | 88,033 | |
| | | | | | | | 887,338 | |
|
| Israel–0.46% | |
Bezeq The Israeli Telecommunication Corp. Ltd. | | | 27,543 | | | | 59,211 | |
Delek Group Ltd. | | | 133 | | | | 32,136 | |
| | | | | | | | 91,347 | |
| | | | | | | | |
| | | Shares | | | Value | |
| Japan–19.49% | |
Asahi Glass Co., Ltd. | | | 5,000 | | | $ | 28,489 | |
Brother Industries, Ltd. | | | 2,500 | | | | 31,828 | |
Dai Nippon Printing Co., Ltd. | | | 32,000 | | | | 329,779 | |
Daihatsu Motor Co., Ltd. | | | 8,400 | | | | 102,458 | |
Daiichi Sankyo Co., Ltd. | | | 9,800 | | | | 191,024 | |
Daiichikosho Co., Ltd. | | | 2,400 | | | | 79,663 | |
Daito Trust Construction Co., Ltd. | | | 1,000 | | | | 108,172 | |
DeNA Co., Ltd. | | | 9,700 | | | | 155,515 | |
Denka Co. Ltd. | | | 54,000 | | | | 249,564 | |
FamilyMart Co., Ltd. | | | 3,900 | | | | 159,190 | |
Ibiden Co., Ltd. | | | 4,500 | | | | 61,875 | |
Iida Group Holdings Co., Ltd. | | | 14,400 | | | | 268,948 | |
Kaken Pharmaceutical Co., Ltd. | | | 1,400 | | | | 96,362 | |
Konica Minolta Inc. | | | 11,000 | | | | 112,966 | |
Marubeni Corp. | | | 17,400 | | | | 100,211 | |
Miraca Holdings Inc. | | | 2,000 | | | | 88,862 | |
Nippon Electric Glass Co., Ltd. | | | 14,000 | | | | 68,564 | |
Nippon Paper Industries Co., Ltd. | | | 2,500 | | | | 46,202 | |
Nippon Telegraph & Telephone Corp. | | | 9,400 | | | | 345,198 | |
Nomura Real Estate Holdings, Inc. | | | 3,900 | | | | 82,871 | |
Osaka Gas Co., Ltd. | | | 23,000 | | | | 90,351 | |
Sekisui Chemical Co., Ltd. | | | 3,000 | | | | 35,255 | |
TDK Corp. | | | 1,800 | | | | 114,183 | |
Tokyo Gas Co., Ltd. | | | 66,000 | | | | 325,880 | |
Toppan Printing Co. Ltd. | | | 26,000 | | | | 232,399 | |
West Japan Railway Co. | | | 5,100 | | | | 356,796 | |
| | | | | | | | 3,862,605 | |
|
| Jordan–0.56% | |
Hikma Pharmaceuticals PLC | | | 3,323 | | | | 110,870 | |
|
| Macau–0.32% | |
MGM China Holdings Ltd. | | | 43,600 | | | | 63,492 | |
|
| Netherlands–0.96% | |
Heineken N.V. | | | 718 | | | | 65,469 | |
NXP Semiconductors N.V.(a) | | | 1,600 | | | | 125,360 | |
| | | | | | | | 190,829 | |
|
| New Zealand–0.55% | |
SKYCITY Entertainment Group Ltd. | | | 29,153 | | | | 78,925 | |
Spark New Zealand Ltd. | | | 13,027 | | | | 29,642 | |
| | | | | | | | 108,567 | |
|
| Norway–0.24% | |
DNB ASA | | | 3,810 | | | | 48,341 | |
|
| Singapore–0.26% | |
SATS Ltd. | | | 18,800 | | | | 50,862 | |
|
| Sweden–1.38% | |
Hennes & Mauritz AB–Class B | | | 1,659 | | | | 64,363 | |
See accompanying Notes to Financial Statements which are an integral part of the financial statements.
9 Invesco Global Market Neutral Fund
| | | | | | | | |
| | | Shares | | | Value | |
| Sweden–(continued) | |
Intrum Justitia AB | | | 3,627 | | | $ | 129,689 | |
Loomis AB–Class B | | | 3,027 | | | | 78,491 | |
| | | | | | | | 272,543 | |
|
| Switzerland–1.57% | |
Forbo Holding AG | | | 78 | | | | 88,789 | |
Georg Fischer AG | | | 232 | | | | 142,460 | |
Lonza Group AG | | | 545 | | | | 79,895 | |
| | | | | | | | 311,144 | |
|
| United Kingdom–5.75% | |
AstraZeneca PLC | | | 673 | | | | 42,963 | |
Fiat Chrysler Automobiles N.V.(a) | | | 10,270 | | | | 151,007 | |
ITV PLC | | | 90,704 | | | | 352,049 | |
Moneysupermarket.com Group PLC | | | 60,017 | | | | 309,249 | |
Next PLC | | | 650 | | | | 80,010 | |
Royal Dutch Shell PLC–Class B | | | 1,828 | | | | 47,754 | |
Subsea 7 S.A. | | | 5,792 | | | | 45,433 | |
WH Smith PLC | | | 4,232 | | | | 111,076 | |
| | | | | | | | 1,139,541 | |
|
| United States–41.75% | |
AbbVie Inc. | | | 2,200 | | | | 131,010 | |
AECOM(a) | | | 2,000 | | | | 58,940 | |
Amgen Inc. | | | 800 | | | | 126,544 | |
Annaly Capital Management Inc. | | | 6,200 | | | | 61,690 | |
Apple Inc. | | | 3,100 | | | | 370,450 | |
Archer-Daniels-Midland Co. | | | 7,800 | | | | 356,148 | |
Best Buy Co., Inc. | | | 4,500 | | | | 157,635 | |
Brocade Communications Systems, Inc. | | | 9,800 | | | | 102,116 | |
Bunge Ltd. | | | 3,500 | | | | 255,360 | |
Cardinal Health, Inc. | | | 800 | | | | 65,760 | |
Cepheid, Inc.(a) | | | 2,200 | | | | 73,480 | |
Chesapeake Energy Corp. | | | 20,100 | | | | 143,313 | |
Cisco Systems, Inc. | | | 5,500 | | | | 158,675 | |
Citigroup Inc. | | | 6,900 | | | | 366,873 | |
Community Health Systems Inc.(a) | | | 2,200 | | | | 61,688 | |
Computer Sciences Corp. | | | 1,200 | | | | 79,908 | |
Dean Foods Co. | | | 7,900 | | | | 143,069 | |
Denbury Resources Inc. | | | 9,300 | | | | 32,922 | |
Devon Energy Corp. | | | 800 | | | | 33,544 | |
Frontier Communications Corp. | | | 15,800 | | | | 81,212 | |
GameStop Corp.–Class A | | | 2,700 | | | | 124,389 | |
General Dynamics Corp. | | | 2,400 | | | | 356,592 | |
General Electric Co. | | | 6,000 | | | | 173,520 | |
Gilead Sciences, Inc. | | | 2,800 | | | | 302,764 | |
Hess Corp. | | | 6,000 | | | | 337,260 | |
| | | | | | | | |
| | | Shares | | | Value | |
| United States–(continued) | |
HollyFrontier Corp. | | | 600 | | | $ | 29,382 | |
Huntington Ingalls Industries, Inc. | | | 1,000 | | | | 119,940 | |
Intel Corp. | | | 9,500 | | | | 321,670 | |
InterDigital, Inc. | | | 3,000 | | | | 152,220 | |
JetBlue Airways Corp.(a) | | | 3,300 | | | | 81,972 | |
Leidos Holdings, Inc. | | | 6,700 | | | | 352,219 | |
Lexmark International, Inc.–Class A | | | 1,800 | | | | 58,482 | |
LyondellBasell Industries N.V.–Class A | | | 800 | | | | 74,328 | |
ManpowerGroup Inc. | | | 300 | | | | 27,534 | |
Marathon Petroleum Corp. | | | 1,200 | | | | 62,160 | |
Murphy Oil Corp. | | | 1,200 | | | | 34,116 | |
NetApp, Inc. | | | 2,700 | | | | 91,800 | |
NeuStar, Inc.–Class A(a) | | | 1,700 | | | | 46,223 | |
Newfield Exploration Co.(a) | | | 2,500 | | | | 100,475 | |
Northrop Grumman Corp. | | | 2,100 | | | | 394,275 | |
NVIDIA Corp. | | | 6,300 | | | | 178,731 | |
Oracle Corp. | | | 1,800 | | | | 69,912 | |
Pfizer Inc. | | | 2,100 | | | | 71,022 | |
Pilgrim’s Pride Corp. | | | 11,700 | | | | 222,183 | |
Pitney Bowes Inc. | | | 3,700 | | | | 76,405 | |
Polycom, Inc.(a) | | | 3,100 | | | | 42,718 | |
Superior Energy Services, Inc. | | | 5,400 | | | | 76,464 | |
Target Corp. | | | 700 | | | | 54,026 | |
Tech Data Corp.(a) | | | 1,300 | | | | 94,627 | |
Tesoro Corp. | | | 800 | | | | 85,544 | |
Transocean Ltd. | | | 21,400 | | | | 338,762 | |
United Therapeutics Corp.(a) | | | 900 | | | | 131,967 | |
Valero Energy Corp. | | | 6,200 | | | | 408,704 | |
VeriSign, Inc.(a) | | | 1,900 | | | | 153,140 | |
Voya Financial, Inc. | | | 1,000 | | | | 40,570 | |
Western Union Co. (The) | | | 6,700 | | | | 128,975 | |
| | | | | | | | 8,275,408 | |
Total Common Stocks & Other Equity Interests (Cost $17,971,798) | | | | 18,438,605 | |
|
Money Market Funds–10.32% | |
Liquid Assets Portfolio–Institutional Class, 0.16%(b) | | | 1,022,522 | | | | 1,022,522 | |
Premier Portfolio–Institutional Class, 0.12%(b) | | | 1,022,521 | | | | 1,022,521 | |
Total Money Market Funds
(Cost $2,045,043) | | | | 2,045,043 | |
TOTAL INVESTMENTS–103.34%
(Cost $20,016,841) | | | | 20,483,648 | |
OTHER ASSETS LESS LIABILITIES–(3.34)% | | | | (661,820 | ) |
NET ASSETS–100.00% | | | $ | 19,821,828 | |
Notes to Schedule of Investments:
| (a) | Non-income producing security. |
| (b) | The money market fund and the Fund are affiliated by having the same investment adviser. The rate shown is the 7-day SEC standardized yield as of October 31, 2015. |
See accompanying Notes to Financial Statements which are an integral part of the financial statements.
10 Invesco Global Market Neutral Fund
| | | | | | | | | | | | | | | | | | | | | | |
| Open Total Return Swap Agreements | |
| Reference Entity | | Counterparty | | | Expiration Date | | | Floating Rate(1) | | Notional
Value | | | Unrealized Appreciation
(Depreciation) | | | Net Value of
Reference
Entities | |
Australia Equity Securities-Short | | | Morgan Stanley & Co. LLC | | | | 01/23/17 | | | Federal Funds Floating Rate | | $ | (419,720 | ) | | $ | 9,196 | | | $ | (410,482 | ) |
Canada Equity Securities-Short | | | Morgan Stanley & Co. LLC | | | | 01/23/17 | | | Federal Funds Floating Rate | | | (604,094 | ) | | | 18,028 | | | | (585,143 | ) |
Denmark Equity Securities-Short | | | Morgan Stanley & Co. LLC | | | | 01/23/17 | | | Federal Funds Floating Rate | | | (450,418 | ) | | | (9,529 | ) | | | (459,904 | ) |
Hong Kong Equity Securities-Short | | | Morgan Stanley & Co. LLC | | | | 01/23/17 | | | Federal Funds Floating Rate | | | (174,692 | ) | | | (25,757 | ) | | | (200,434 | ) |
Japan Equity Securities-Short | | | Morgan Stanley & Co. LLC | | | | 01/23/17 | | | Federal Funds Floating Rate | | | (4,093,109 | ) | | | (75,924 | ) | | | (4,162,703 | ) |
New Zealand Equity Securities-Short | | | Morgan Stanley & Co. LLC | | | | 01/23/17 | | | Federal Funds Floating Rate | | | (66,094 | ) | | | (156 | ) | | | (66,244 | ) |
Norway Equity Securities-Short | | | Morgan Stanley & Co. LLC | | | | 01/23/17 | | | Federal Funds Floating Rate | | | (290,256 | ) | | | 18,757 | | | | (271,476 | ) |
Singapore Equity Securities-Short | | | Morgan Stanley & Co. LLC | | | | 01/23/17 | | | Federal Funds Floating Rate | | | (403,960 | ) | | | 24,689 | | | | (379,236 | ) |
Spain Equity Securities-Short | | | Morgan Stanley & Co. LLC | | | | 02/13/17 | | | Federal Funds Floating Rate | | | (129,190 | ) | | | 7,640 | | | | (121,539 | ) |
Supranational Equity Securities-Short | | | Morgan Stanley & Co. LLC | | | | 01/23/17 | | | Federal Funds Floating Rate | | | (1,933,131 | ) | | | (8,951 | ) | | | (1,941,905 | ) |
Sweden Equity Securities-Short | | | Morgan Stanley & Co. LLC | | | | 01/23/17 | | | Federal Funds Floating Rate | | | (276,002 | ) | | | 1,356 | | | | (274,623 | ) |
Switzerland Equity Securities-Short | | | Morgan Stanley & Co. LLC | | | | 01/23/17 | | | Federal Funds Floating Rate | | | (553,374 | ) | | | 14,326 | | | | (539,000 | ) |
United Kingdom Equity Securities-Short | | | Morgan Stanley & Co. LLC | | | | 01/23/17 | | | Federal Funds Floating Rate | | | (837,050 | ) | | | (15,372 | ) | | | (852,373 | ) |
United States Equity Securities-Short | | | Morgan Stanley & Co. LLC | | | | 12/21/15 | | | Federal Funds Floating Rate | | | (7,995,111 | ) | | | (168,486 | ) | | | (8,159,734 | ) |
Total Return Swap Agreements — Equity Risk | | | | | | | | | | | | | $ | (210,183 | )(2)(3) | | $ | (18,424,796 | ) |
| (1) | The Fund receives or pays the total return on the short positions underlying the total return swap, and receives a specific Federal Funds Floating Rate. The total return swaps are settled in U.S. Dollar. |
| (2) | Amount includes $(8,823) of dividends and financing fees. |
| (3) | Swaps are collateralized by $60,477 cash held with the Counterparty. |
The following table represents the individual short positions and related values of equity securities underlying the total return swaps with Morgan Stanley & Co. LLC, as of October 31, 2015.
| | | | | | | | |
| | | Shares | | | Value | |
Equity Securities — Short | |
| Australia | |
ALS Ltd. | | | (14,295 | ) | | $ | (52,498 | ) |
Crown Resorts Ltd. | | | (31,375 | ) | | | (256,400 | ) |
Insurance Australia Group Ltd. | | | (25,393 | ) | | | (101,584 | ) |
| | | | | | | | (410,482 | ) |
|
| Canada | |
AltaGas Ltd. | | | (4,300 | ) | | | (111,010 | ) |
Enbridge Inc. | | | (3,100 | ) | | | (132,491 | ) |
Gildan Activewear Inc. | | | (2,600 | ) | | | (74,737 | ) |
Northland Power Inc. | | | (3,500 | ) | | | (45,232 | ) |
Rogers Communications, Inc.–Class B | | | (2,200 | ) | | | (87,532 | ) |
Tahoe Resources Inc. | | | (5,100 | ) | | | (42,588 | ) |
Tourmaline Oil Corp. | | | (4,400 | ) | | | (91,553 | ) |
| | | | | | | | (585,143 | ) |
|
| Denmark | |
Carlsberg AS–Class B | | | (605 | ) | | | (49,600 | ) |
Genmab AS | | | (3,706 | ) | | | (365,583 | ) |
Jyske Bank AS | | | (916 | ) | | | (44,721 | ) |
| | | | | | | | (459,904 | ) |
|
| Hong Kong | |
Esprit Holdings Ltd. | | | (88,700 | ) | | | (99,909 | ) |
Hong Kong & China Gas Co. Ltd. | | | (49,500 | ) | | | (100,525 | ) |
| | | | | | | | (200,434 | ) |
| | | | | | | | |
| | | Shares | | | Value | |
| Japan | |
Asics Corp. | | | (8,700 | ) | | $ | (242,608 | ) |
Dentsu Inc. | | | (1,100 | ) | | | (62,443 | ) |
Fast Retailing Co., Ltd. | | | (500 | ) | | | (183,890 | ) |
Hamamatsu Photonics K.K. | | | (1,400 | ) | | | (35,966 | ) |
Hulic Co. Ltd. | | | (13,000 | ) | | | (122,383 | ) |
Isetan Mitsukoshi Holdings Ltd. | | | (7,500 | ) | | | (121,509 | ) |
JGC Corp. | | | (21,000 | ) | | | (334,831 | ) |
Kagome Co., Ltd. | | | (21,500 | ) | | | (366,856 | ) |
Keyence Corp. | | | (700 | ) | | | (368,824 | ) |
Kikkoman Corp. | | | (2,000 | ) | | | (63,230 | ) |
Kintetsu Group Holdings Co., Ltd. | | | (8,000 | ) | | | (31,093 | ) |
Kyushu Electric Power Co. Inc. | | | (11,100 | ) | | | (135,036 | ) |
M3 Inc. | | | (4,200 | ) | | | (82,037 | ) |
Mazda Motor Corp. | | | (4,000 | ) | | | (79,705 | ) |
MISUMI Group Inc. | | | (14,400 | ) | | | (189,621 | ) |
MonotaRO Co., Ltd. | | | (4,600 | ) | | | (119,508 | ) |
NGK Spark Plug Co., Ltd. | | | (2,000 | ) | | | (49,242 | ) |
Nintendo Co., Ltd. | | | (1,900 | ) | | | (306,721 | ) |
Nippon Paint Holdings Co., Ltd. | | | (7,800 | ) | | | (166,575 | ) |
Ono Pharmaceutical Co., Ltd. | | | (1,200 | ) | | | (165,874 | ) |
Shimadzu Corp. | | | (5,000 | ) | | | (78,520 | ) |
Shimano Inc. | | | (400 | ) | | | (63,578 | ) |
SoftBank Group Corp. | | | (600 | ) | | | (33,796 | ) |
Sumco Corp. | | | (8,400 | ) | | | (85,483 | ) |
Sumitomo Realty & Development Co., Ltd. | | | (1,000 | ) | | | (33,181 | ) |
Topcon Corp. | | | (12,600 | ) | | | (183,774 | ) |
See accompanying Notes to Financial Statements which are an integral part of the financial statements.
11 Invesco Global Market Neutral Fund
| | | | | | | | |
| | | Shares | | | Value | |
| Japan-(continued) | |
Tsuruha Holdings Inc. | | | (4,300 | ) | | $ | (342,803 | ) |
Yamaha Motor Co., Ltd. | | | (5,000 | ) | | | (113,616 | ) |
| | | | | | | | (4,162,703 | ) |
|
| New Zealand | |
Auckland International Airport Ltd. | | | (18,597 | ) | | | (66,244 | ) |
| | |
| Norway | | | | | | | | |
Schibsted ASA–Class A | | | (5,829 | ) | | | (195,528 | ) |
Schibsted ASA–Class B | | | (2,435 | ) | | | (75,948 | ) |
| | | | | | | | (271,476 | ) |
|
| Singapore | |
Sembcorp Industries Ltd. | | | (148,400 | ) | | | (379,236 | ) |
| | |
| Spain | | | | | | | | |
Banco Popular Espanol S.A. | | | (31,887 | ) | | | (121,539 | ) |
|
| Supranational | |
adidas AG | | | (1,258 | ) | | | (112,818 | ) |
Alstom S.A. | | | (8,720 | ) | | | (284,421 | ) |
Altice NV–A | | | (1,882 | ) | | | (32,597 | ) |
ASML Holding N.V. | | | (1,498 | ) | | | (139,382 | ) |
Bayerische Motoren Werke AG | | | (1,992 | ) | | | (204,515 | ) |
Celesio AG | | | (4,189 | ) | | | (116,548 | ) |
CNH Industrial N.V. | | | (8,000 | ) | | | (54,105 | ) |
Enel Green Power SpA | | | (31,280 | ) | | | (66,217 | ) |
Galp Energia, SGPS, S.A. | | | (8,754 | ) | | | (94,699 | ) |
MorphoSys AG | | | (4,770 | ) | | | (295,168 | ) |
Remy Cointreau S.A. | | | (2,269 | ) | | | (158,172 | ) |
SBM Offshore N.V. | | | (13,691 | ) | | | (187,673 | ) |
Technip S.A. | | | (893 | ) | | | (46,651 | ) |
ThyssenKrupp AG | | | (1,555 | ) | | | (31,371 | ) |
UCB S.A. | | | (756 | ) | | | (65,446 | ) |
United Internet AG | | | (1,003 | ) | | | (52,122 | ) |
| | | | | | | | (1,941,905 | ) |
| | |
| Sweden | | | | | | | | |
Lundin Petroleum AB | | | (7,585 | ) | | | (109,661 | ) |
Saab AB–Class B | | | (1,714 | ) | | | (48,297 | ) |
Volvo AB–Class B | | | (11,229 | ) | | | (116,665 | ) |
| | | | | | | | (274,623 | ) |
|
| Switzerland | |
Aryzta AG | | | (2,579 | ) | | | (116,385 | ) |
Barry Callebaut AG | | | (49 | ) | | | (58,852 | ) |
Basilea Pharmaceutica Ltd. | | | (783 | ) | | | (81,366 | ) |
Chocoladefabriken Lindt & Spruengli AG | | | (8 | ) | | | (48,852 | ) |
Panalpina Welttransport Holding AG | | | (249 | ) | | | (28,470 | ) |
Syngenta AG | | | (609 | ) | | | (205,075 | ) |
| | | | | | | | (539,000 | ) |
|
| United Kingdom | |
Amec Foster Wheeler PLC | | | (3,836 | ) | | | (42,051 | ) |
Diageo PLC | | | (3,142 | ) | | | (91,001 | ) |
| | | | | | | | |
| | | Shares | | | Value | |
| United Kingdom–(continued) | |
Dixons Carphone PLC | | | (28,932 | ) | | $ | (205,774 | ) |
Fresnillo PLC | | | (8,996 | ) | | | (101,251 | ) |
Glencore PLC | | | (26,782 | ) | | | (46,454 | ) |
Intertek Group PLC | | | (2,233 | ) | | | (90,375 | ) |
Johnson Matthey PLC | | | (2,234 | ) | | | (89,037 | ) |
Ophir Energy PLC | | | (58,311 | ) | | | (86,263 | ) |
UBM PLC | | | (12,689 | ) | | | (100,167 | ) |
| | | | | | | | (852,373 | ) |
|
| United States | |
ACI Worldwide Inc. | | | (2,100 | ) | | | (50,295 | ) |
Alexander & Baldwin Inc. | | | (3,900 | ) | | | (147,186 | ) |
Allergan PLC | | | (300 | ) | | | (92,541 | ) |
Alphabet Inc.–Class C | | | (500 | ) | | | (355,405 | ) |
Amazon.com Inc. | | | (600 | ) | | | (375,540 | ) |
Anixter International Inc. | | | (1,200 | ) | | | (82,296 | ) |
Ascena Retail Group, Inc. | | | (3,400 | ) | | | (45,288 | ) |
athenahealth, Inc. | | | (800 | ) | | | (121,960 | ) |
Bank of the Ozarks Inc. | | | (1,100 | ) | | | (55,022 | ) |
BioMarin Pharmaceutical Inc. | | | (300 | ) | | | (35,112 | ) |
Bristow Group Inc. | | | (1,100 | ) | | | (38,203 | ) |
Carpenter Technology Corp. | | | (2,300 | ) | | | (76,613 | ) |
Cheniere Energy Inc. | | | (4,000 | ) | | | (198,080 | ) |
Chevron Corp. | | | (4,100 | ) | | | (372,608 | ) |
Colfax Corp. | | | (5,400 | ) | | | (145,584 | ) |
Cooper Cos. Inc. (The) | | | (500 | ) | | | (76,180 | ) |
Cree Inc. | | | (2,400 | ) | | | (60,456 | ) |
Cypress Semiconductor Corp. | | | (19,400 | ) | | | (204,476 | ) |
Diamondback Energy Inc. | | | (500 | ) | | | (36,920 | ) |
Dollar Tree Inc. | | | (3,100 | ) | | | (203,019 | ) |
Duke Energy Corp. | | | (700 | ) | | | (50,029 | ) |
Eagle Materials Inc. | | | (1,200 | ) | | | (79,236 | ) |
Eversource Energy | | | (2,700 | ) | | | (137,538 | ) |
Exxon Mobil Corp. | | | (2,300 | ) | | | (190,302 | ) |
Fastenal Co. | | | (6,800 | ) | | | (266,288 | ) |
Financial Engines Inc. | | | (2,000 | ) | | | (64,320 | ) |
Finisar Corp. | | | (4,000 | ) | | | (45,480 | ) |
Five Below Inc. | | | (800 | ) | | | (27,472 | ) |
Fortune Brands Home & Security Inc. | | | (7,000 | ) | | | (366,310 | ) |
Genesee & Wyoming Inc.–Class A | | | (1,100 | ) | | | (73,810 | ) |
Golar LNG Ltd. | | | (9,800 | ) | | | (284,298 | ) |
Gulfport Energy Corp. | | | (2,200 | ) | | | (67,034 | ) |
Hexcel Corp. | | | (2,100 | ) | | | (97,272 | ) |
Howard Hughes Corp. (The) | | | (2,800 | ) | | | (346,024 | ) |
Intercept Pharmaceuticals Inc. | | | (200 | ) | | | (31,440 | ) |
Kennedy-Wilson Holdings Inc. | | | (15,000 | ) | | | (367,800 | ) |
Liberty Global PLC–Class A | | | (1,000 | ) | | | (44,520 | ) |
Lions Gate Entertainment Corp. | | | (2,500 | ) | | | (97,425 | ) |
Madison Square Garden Co. (The)–Class A | | | (133 | ) | | | (23,800 | ) |
Men’s Wearhouse Inc. (The) | | | (2,000 | ) | | | (79,960 | ) |
National Instruments Corp. | | | (7,500 | ) | | | (228,525 | ) |
NetSuite Inc. | | | (1,700 | ) | | | (144,619 | ) |
See accompanying Notes to Financial Statements which are an integral part of the financial statements.
12 Invesco Global Market Neutral Fund
| | | | | | | | |
| | | Shares | | | Value | |
| United States–(continued) | |
NorthStar Realty Finance Corp. | | | (12,000 | ) | | $ | (144,120 | ) |
Panera Bread Co.–Class A | | | (200 | ) | | | (35,474 | ) |
Puma Bioechnology Inc. | | | (900 | ) | | | (74,178 | ) |
Reynolds American Inc. | | | (2,100 | ) | | | (101,472 | ) |
salesforce.com, inc. | | | (400 | ) | | | (31,084 | ) |
SBA Communications Corp.–Class A | | | (1,900 | ) | | | (226,138 | ) |
SemGroup Corp.–Class A | | | (1,300 | ) | | | (59,215 | ) |
Spirit Realty Capital Inc. | | | (8,100 | ) | | | (82,458 | ) |
Sprint Corp. | | | (9,400 | ) | | | (44,462 | ) |
SunEdison Inc. | | | (12,900 | ) | | | (94,170 | ) |
SYNNEX Corp. | | | (1,100 | ) | | | (97,284 | ) |
T-Mobile US, Inc. | | | (1,000 | ) | | | (37,890 | ) |
Tesla Motors Inc. | | | (1,400 | ) | | | (289,702 | ) |
Tractor Supply Co. | | | (600 | ) | | | (55,434 | ) |
Trimble Navigation Ltd | | | (6,200 | ) | | | (141,050 | ) |
Ulta Salon Cosmetics & Fragrance, Inc. | | | (200 | ) | | | (34,792 | ) |
Ultimate Software Group, Inc. (The) | | | (700 | ) | | | (143,045 | ) |
ViaSat, Inc. | | | (5,600 | ) | | | (369,376 | ) |
WEC Energy Group Inc. | | | (900 | ) | | | (46,404 | ) |
Western Alliance Bancorp | | | (1,700 | ) | | | (60,775 | ) |
Wynn Resorts Ltd. | | | (1,500 | ) | | | (104,925 | ) |
| | | | | | | | (8,159,734 | ) |
Total Equity Securities — Short | | | $ | (18,424,796 | ) |
See accompanying Notes to Financial Statements which are an integral part of the financial statements.
13 Invesco Global Market Neutral Fund
Statement of Assets and Liabilities
October 31, 2015
| | | | |
Assets: | |
Investments, at value (Cost $17,971,798) | | $ | 18,438,605 | |
Investments in affiliated money market funds, at value and cost | | | 2,045,043 | |
Total investments, at value (Cost $20,016,841) | | | 20,483,648 | |
Foreign currencies, at value (Cost $31,599) | | | 30,962 | |
Receivable for: | | | | |
Deposits with brokers for swap agreements | | | 60,477 | |
Investments sold | | | 163,381 | |
Fund shares sold | | | 28 | |
Dividends | | | 48,410 | |
Fund expenses absorbed | | | 4,767 | |
Investment for trustee deferred compensation and retirement plans | | | 4,287 | |
Unrealized appreciation on swap agreements — OTC | | | 93,992 | |
Other assets | | | 3,129 | |
Total assets | | | 20,893,081 | |
|
Liabilities: | |
Payable for: | | | | |
Investments purchased | | | 258,032 | |
Amount due custodian | | | 414,466 | |
Swaps payable | | | 2,314 | |
Accrued fees to affiliates | | | 4,225 | |
Accrued trustees’ and officers’ fees and benefits | | | 1,559 | |
Accrued other operating expenses | | | 82,195 | |
Trustee deferred compensation and retirement plans | | | 4,287 | |
Unrealized depreciation on swap agreements — OTC | | | 304,175 | |
Total liabilities | | | 1,071,253 | |
Net assets applicable to shares outstanding | | $ | 19,821,828 | |
|
Net assets consist of: | |
Shares of beneficial interest | | $ | 19,331,488 | |
Undistributed net investment income | | | 206,181 | |
Undistributed net realized gain (loss) | | | 28,246 | |
Net unrealized appreciation | | | 255,913 | |
| | | $ | 19,821,828 | |
| | | | |
Net Assets: | |
Class A | | $ | 5,716,040 | |
Class C | | $ | 602,841 | |
Class R | | $ | 16,779 | |
Class Y | | $ | 12,304,744 | |
Class R5 | | $ | 516,927 | |
Class R6 | | $ | 664,497 | |
|
Shares outstanding, $0.01 par value per share,
with an unlimited number of shares authorized: | |
Class A | | | 554,374 | |
Class C | | | 59,083 | |
Class R | | | 1,634 | |
Class Y | | | 1,190,563 | |
Class R5 | | | 50,001 | |
Class R6 | | | 64,265 | |
Class A: | | | | |
Net asset value per share | | $ | 10.31 | |
Maximum offering price per share | | | | |
(Net asset value of $10.31 ¸ 94.50%) | | $ | 10.91 | |
Class C: | | | | |
Net asset value and offering price per share | | $ | 10.20 | |
Class R: | | | | |
Net asset value and offering price per share | | $ | 10.27 | |
Class Y: | | | | |
Net asset value and offering price per share | | $ | 10.34 | |
Class R5: | | | | |
Net asset value and offering price per share | | $ | 10.34 | |
Class R6: | | | | |
Net asset value and offering price per share | | $ | 10.34 | |
See accompanying Notes to Financial Statements which are an integral part of the financial statements.
14 Invesco Global Market Neutral Fund
Statement of Operations
For the year ended October 31, 2015
| | | | |
Investment income: | |
Dividends (net of foreign withholding taxes of $26,764) | | $ | 384,832 | |
Dividends from affiliated money market funds | | | 1,143 | |
Total investment income | | | 385,975 | |
| |
Expenses: | | | | |
Advisory fees | | | 209,990 | |
Administrative services fees | | | 50,000 | |
Custodian fees | | | 10,468 | |
Distribution fees: | | | | |
Class A | | | 13,880 | |
Class C | | | 4,150 | |
Class R | | | 76 | |
Transfer agent fees — A, C, R and Y | | | 11,644 | |
Transfer agent fees — R5 | | | 57 | |
Transfer agent fees — R6 | | | 64 | |
Trustees’ and officers’ fees and benefits | | | 19,163 | |
Registration and filing fees | | | 79,446 | |
Professional services fees | | | 87,569 | |
Other | | | 40,533 | |
Total expenses | | | 527,040 | |
Less: Fees waived and expenses reimbursed | | | (280,755 | ) |
Net expenses | | | 246,285 | |
Net investment income | | | 139,690 | |
| |
Realized and unrealized gain (loss) from: | | | | |
Net realized gain (loss) from: | | | | |
Investment securities | | | (389,922 | ) |
Payments by affiliates — See Note 2 | | | 210,163 | |
Foreign currencies | | | 22,868 | |
Forward foreign currency contracts | | | 218,650 | |
Swap agreements | | | (922,448 | ) |
| | | | (860,689 | ) |
Change in net unrealized appreciation of: | | | | |
Investment securities | | | 243,346 | |
Foreign currencies | | | 3,570 | |
Swap agreements | | | 612,428 | |
| | | | 859,344 | |
Net realized and unrealized gain (loss) | | | (1,345 | ) |
Net increase in net assets resulting from operations | | $ | 138,345 | |
See accompanying Notes to Financial Statements which are an integral part of the financial statements.
15 Invesco Global Market Neutral Fund
Statement of Changes in Net Assets
For the year ended October 31, 2015 and the period December 19, 2013 (commencement date) through October 31, 2014
| | | | | | | | |
| | | 2015 | | | December 19, 2013
(commencement date) through
October 31,
2014 | |
Operations: | | | | | | | | |
Net investment income | | $ | 139,690 | | | $ | 59,226 | |
Net realized gain (loss) | | | (860,689 | ) | | | 929,230 | |
Change in net unrealized appreciation (depreciation) | | | 859,344 | | | | (603,431 | ) |
Net increase in net assets resulting from operations | | | 138,345 | | | | 385,025 | |
| | |
Distributions to shareholders from net investment income: | | | | | | | | |
Class A | | | (92,956 | ) | | | — | |
Class C | | | (1,945 | ) | | | — | |
Class R | | | (243 | ) | | | — | |
Class Y | | | (139,674 | ) | | | — | |
Class R5 | | | (13,133 | ) | | | — | |
Class R6 | | | (11,890 | ) | | | — | |
Total distributions from net investment income | | | (259,841 | ) | | | — | |
| | |
Distributions to shareholders from net realized gains: | | | | | | | | |
Class A | | | (5,778 | ) | | | — | |
Class C | | | (137 | ) | | | — | |
Class R | | | (16 | ) | | | — | |
Class Y | | | (7,752 | ) | | | — | |
Class R5 | | | (729 | ) | | | — | |
Class R6 | | | (660 | ) | | | — | |
Total distributions from net realized gains | | | (15,072 | ) | | | — | |
| | |
Share transactions–net: | | | | | | | | |
Class A | | | 569,256 | | | | 5,052,983 | |
Class C | | | 485,504 | | | | 119,366 | |
Class R | | | 2,696 | | | | 13,770 | |
Class Y | | | 5,054,439 | | | | 7,129,394 | |
Class R5 | | | (143,311 | ) | | | 642,586 | |
Class R6 | | | 100,158 | | | | 546,530 | |
Net increase in net assets resulting from share transactions | | | 6,068,742 | | | | 13,504,629 | |
Net increase in net assets | | | 5,932,174 | | | | 13,889,654 | |
| | |
Net assets: | | | | | | | | |
Beginning of year | | | 13,889,654 | | | | — | |
End of year (includes undistributed net investment income of $206,181 and $1,072,517, respectively) | | $ | 19,821,828 | | | $ | 13,889,654 | |
See accompanying Notes to Financial Statements which are an integral part of the financial statements.
16 Invesco Global Market Neutral Fund
Statement of Cash Flows
For the year ended October 31, 2015
| | | | |
Cash provided by (used in) operating activities: | |
Net increase in net assets resulting from operations | | $ | 138,345 | |
|
Adjustments to reconcile the change in net assets applicable from operations to net cash provided by (used in) operating activities: | |
Purchases of investments | | | (15,696,998 | ) |
Proceeds from disposition of investments | | | 11,610,585 | |
Net change in unrealized appreciation from swap agreements | | | (612,428 | ) |
Increase in swap agreement payable, net | | | 2,314 | |
Decrease in deposits with broker for swaps | | | 12,683 | |
Decrease in receivables and other assets | | | 615,310 | |
Increase in accrued expenses and other payables | | | 10,496 | |
Net unrealized appreciation on investment securities | | | (243,346 | ) |
Net realized loss from investment securities | | | 389,922 | |
Net increase from payments by affiliates — see Note 2 | | | (210,163 | ) |
Net cash provided by (used in) operating activities | | | (3,983,280 | ) |
| |
Cash provided by financing activities: | | | | |
Distributions paid to shareholders | | | (206,982 | ) |
Increase in payable for amount due custodian | | | 414,466 | |
Proceeds from shares of beneficial interest sold | | | 10,246,485 | |
Disbursements from shares of beneficial interest reacquired | | | (4,450,153 | ) |
Net cash provided by financing activities | | | 6,003,816 | |
Net increase in cash and cash equivalents | | | 2,020,536 | |
Cash at beginning of period | | | 55,469 | |
Cash at end of period | | $ | 2,076,005 | |
| |
Non-cash financing activities: | | | | |
Value of shares of beneficial interest issued in reinvestment of dividends paid to shareholders | | $ | 67,931 | |
Notes to Financial Statements
October 31, 2015
NOTE 1—Significant Accounting Policies
Invesco Global Market Neutral Fund (the “Fund”) is a series portfolio of AIM Investment Funds (Invesco Investment Funds) (the “Trust”). The Trust is organized as a Delaware statutory trust and is registered under the Investment Company Act of 1940, as amended (the “1940 Act”), as an open-end series management investment company consisting of twenty-four separate series portfolios, each authorized to issue an unlimited number of shares of beneficial interest. The assets, liabilities and operations of each portfolio are accounted for separately. Information presented in these financial statements pertains only to the Fund. Matters affecting each portfolio or class will be voted on exclusively by the shareholders of such portfolio or class.
The Fund’s investment objective is to seek to provide a positive return over a full market cycle from a broadly diversified portfolio of stocks while seeking to limit exposure to the general risks associated with stock market investing.
The Fund currently consists of six different classes of shares: Class A, Class C, Class R, Class Y, Class R5 and Class R6. Class A shares are sold with a front-end sales charge unless certain waiver criteria are met and under certain circumstances load waived shares may be subject to contingent deferred sales charges (“CDSC”). Class C shares are sold with a CDSC. Class R, Class Y, Class R5 and Class R6 shares are sold at net asset value.
The following is a summary of the significant accounting policies followed by the Fund in the preparation of its financial statements.
| A. | Security Valuations — Securities, including restricted securities, are valued according to the following policy. |
A security listed or traded on an exchange (except convertible securities) is valued at its last sales price or official closing price as of the close of the customary trading session on the exchange where the security is principally traded, or lacking any sales or official closing price on a particular day, the security may be valued at the closing bid price on that day. Securities traded in the over-the-counter market are valued based on prices furnished by independent pricing services or market makers. When such securities are valued by an independent pricing service they may be considered fair valued. Futures contracts are valued at the final settlement price set by an exchange on which they are principally traded. Listed options are valued at the mean between the last bid and asked prices from the exchange on which they are principally traded. Options not listed on an exchange are valued by an independent source at the mean between the last bid and asked prices. For purposes of determining net asset value (“NAV”) per share, futures and option contracts generally are valued 15 minutes after the close of the customary trading session of the New York Stock Exchange (“NYSE”).
17 Invesco Global Market Neutral Fund
Investments in open-end and closed-end registered investment companies that do not trade on an exchange are valued at the end-of-day net asset value per share. Investments in open-end and closed-end registered investment companies that trade on an exchange are valued at the last sales price or official closing price as of the close of the customary trading session on the exchange where the security is principally traded.
Swap agreements are fair valued using an evaluated quote, if available, provided by an independent pricing service. Evaluated quotes provided by the pricing service are valued based on a model which may include end-of-day net present values, spreads, ratings, industry, company performance and returns of referenced assets.
Debt obligations (including convertible securities) and unlisted equities are fair valued using an evaluated quote provided by an independent pricing service. Evaluated quotes provided by the pricing service may be determined without exclusive reliance on quoted prices, and may reflect appropriate factors such as institution-size trading in similar groups of securities, developments related to specific securities, dividend rate (for unlisted equities), yield (for debt obligations), quality, type of issue, coupon rate (for debt obligations), maturity (for debt obligations), individual trading characteristics and other market data. Debt obligations are subject to interest rate and credit risks. In addition, all debt obligations involve some risk of default with respect to interest and/or principal payments.
Foreign securities’ (including foreign exchange contracts) prices are converted into U.S. dollar amounts using the applicable exchange rates as of the close of the NYSE. If market quotations are available and reliable for foreign exchange-traded equity securities, the securities will be valued at the market quotations. Because trading hours for certain foreign securities end before the close of the NYSE, closing market quotations may become unreliable. If between the time trading ends on a particular security and the close of the customary trading session on the NYSE, events occur that the Adviser determines are significant and make the closing price unreliable, the Fund may fair value the security. If the event is likely to have affected the closing price of the security, the security will be valued at fair value in good faith using procedures approved by the Board of Trustees. Adjustments to closing prices to reflect fair value may also be based on a screening process of an independent pricing service to indicate the degree of certainty, based on historical data, that the closing price in the principal market where a foreign security trades is not the current value as of the close of the NYSE. Foreign securities’ prices meeting the approved degree of certainty that the price is not reflective of current value will be priced at the indication of fair value from the independent pricing service. Multiple factors may be considered by the independent pricing service in determining adjustments to reflect fair value and may include information relating to sector indices, American Depositary Receipts and domestic and foreign index futures. Foreign securities may have additional risks including exchange rate changes, potential for sharply devalued currencies and high inflation, political and economic upheaval, the relative lack of issuer information, relatively low market liquidity and the potential lack of strict financial and accounting controls and standards.
Securities for which market prices are not provided by any of the above methods may be valued based upon quotes furnished by independent sources. The last bid price may be used to value equity securities. The mean between the last bid and asked prices is used to value debt obligations, including corporate loans.
Securities for which market quotations are not readily available or became unreliable are valued at fair value as determined in good faith by or under the supervision of the Trust’s officers following procedures approved by the Board of Trustees. Issuer specific events, market trends, bid/asked quotes of brokers and information providers and other market data may be reviewed in the course of making a good faith determination of a security’s fair value.
The Fund may invest in securities that are subject to interest rate risk, meaning the risk that the prices will generally fall as interest rates rise and, conversely, the prices will generally rise as interest rates fall. Specific securities differ in their sensitivity to changes in interest rates depending on their individual characteristics. Changes in interest rates may result in increased market volatility, which may affect the value and/or liquidity of certain Fund investments.
Valuations change in response to many factors including the historical and prospective earnings of the issuer, the value of the issuer’s assets, general economic conditions, interest rates, investor perceptions and market liquidity. Because of the inherent uncertainties of valuation, the values reflected in the financial statements may materially differ from the value received upon actual sale of those investments.
| B. | Securities Transactions and Investment Income — Securities transactions are accounted for on a trade date basis. Realized gains or losses on sales are computed on the basis of specific identification of the securities sold. Interest income (net of withholding tax, if any) is recorded on the accrual basis from settlement date. Dividend income (net of withholding tax, if any) is recorded on the ex-dividend date. |
The Fund may periodically participate in litigation related to Fund investments. As such, the Fund may receive proceeds from litigation settlements. Any proceeds received are included in the Statement of Operations as realized gain (loss) for investments no longer held and as unrealized gain (loss) for investments still held.
Brokerage commissions and mark ups are considered transaction costs and are recorded as an increase to the cost basis of securities purchased and/or a reduction of proceeds on a sale of securities. Such transaction costs are included in the determination of net realized and unrealized gain (loss) from investment securities reported in the Statement of Operations and the Statement of Changes in Net Assets and the net realized and unrealized gains (losses) on securities per share in the Financial Highlights. Transaction costs are included in the calculation of the Fund’s net asset value and, accordingly, they reduce the Fund’s total returns. These transaction costs are not considered operating expenses and are not reflected in net investment income reported in the Statement of Operations and the Statement of Changes in Net Assets, or the net investment income per share and the ratios of expenses and net investment income reported in the Financial Highlights, nor are they limited by any expense limitation arrangements between the Fund and the investment adviser.
The Fund allocates income and realized and unrealized capital gains and losses to a class based on the relative net assets of each class.
| C. | Country Determination — For the purposes of making investment selection decisions and presentation in the Schedule of Investments, the investment adviser may determine the country in which an issuer is located and/or credit risk exposure based on various factors. These factors include the laws of the country under which the issuer is organized, where the issuer maintains a principal office, the country in which the issuer derives 50% or more of its total revenues and the country that has the primary market for the issuer’s securities, as well as other criteria. Among the other criteria that may be evaluated for making this determination are the country in which the issuer maintains 50% or more of its assets, the type of security, financial guarantees and enhancements, the nature of the collateral and the sponsor organization. Country of issuer and/or credit risk exposure has been determined to be the United States of America, unless otherwise noted. |
18 Invesco Global Market Neutral Fund
| D. | Distributions — Distributions from net investment income and net realized capital gain, if any, are generally declared and paid annually and recorded on the ex-dividend date. The Fund may elect to treat a portion of the proceeds from redemptions as distributions for federal income tax purposes. |
| E. | Federal Income Taxes — The Fund intends to comply with the requirements of Subchapter M of the Internal Revenue Code of 1986, as amended (the “Internal Revenue Code”), necessary to qualify as a regulated investment company and to distribute substantially all of the Fund’s taxable earnings to shareholders. As such, the Fund will not be subject to federal income taxes on otherwise taxable income (including net realized capital gain) that is distributed to shareholders. Therefore, no provision for federal income taxes is recorded in the financial statements. |
The Fund recognizes the tax benefits of uncertain tax positions only when the position is more likely than not to be sustained. Management has analyzed the Fund’s uncertain tax positions and concluded that no liability for unrecognized tax benefits should be recorded related to uncertain tax positions. Management is not aware of any tax positions for which it is reasonably possible that the total amounts of unrecognized tax benefits will change materially in the next 12 months.
The Fund files tax returns in the U.S. Federal jurisdiction and certain other jurisdictions. Generally, the Fund is subject to examinations by such taxing authorities for up to three years after the filing of the return for the tax period.
| F. | Expenses — Fees provided for under the Rule 12b-1 plan of a particular class of the Fund are charged to the operations of such class. Transfer agency fees and expenses and other shareholder recordkeeping fees and expenses attributable to Class R5 and Class R6 are allocated to each share class based on relative net assets. Sub-accounting fees attributable to Class R5 are charged to the operations of the class. Transfer agency fees and expenses and other shareholder recordkeeping fees and expenses relating to all other classes are allocated among those classes based on relative net assets. All other expenses are allocated among the classes based on relative net assets. |
| G. | Accounting Estimates — The preparation of financial statements in conformity with accounting principles generally accepted in the United States of America (“GAAP”) requires management to make estimates and assumptions that affect the reported amounts of assets and liabilities at the date of the financial statements and the reported amounts of revenues and expenses during the reporting period including estimates and assumptions related to taxation. Actual results could differ from those estimates by a significant amount. In addition, the Fund monitors for material events or transactions that may occur or become known after the period-end date and before the date the financial statements are released to print. |
| H. | Indemnifications — Under the Trust’s organizational documents, each Trustee, officer, employee or other agent of the Trust is indemnified against certain liabilities that may arise out of the performance of their duties to the Fund. Additionally, in the normal course of business, the Fund enters into contracts, including the Fund’s servicing agreements, that contain a variety of indemnification clauses. The Fund’s maximum exposure under these arrangements is unknown as this would involve future claims that may be made against the Fund that have not yet occurred. The risk of material loss as a result of such indemnification claims is considered remote. |
| I. | Cash and Cash Equivalents — For the purposes of the Statement of Cash Flows, the Fund defines Cash and Cash Equivalents as cash (including foreign currency), money market funds and other investments held in lieu of cash and excludes investments made with cash collateral received. |
| J. | Foreign Currency Translations — Foreign currency is valued at the close of the NYSE based on quotations posted by banks and major currency dealers. Portfolio securities and other assets and liabilities denominated in foreign currencies are translated into U.S. dollar amounts at date of valuation. Purchases and sales of portfolio securities (net of foreign taxes withheld on disposition) and income items denominated in foreign currencies are translated into U.S. dollar amounts on the respective dates of such transactions. The Fund does not separately account for the portion of the results of operations resulting from changes in foreign exchange rates on investments and the fluctuations arising from changes in market prices of securities held. The combined results of changes in foreign exchange rates and the fluctuation of market prices on investments (net of estimated foreign tax withholding) are included with the net realized and unrealized gain or loss from investments in the Statement of Operations. Reported net realized foreign currency gains or losses arise from (1) sales of foreign currencies, (2) currency gains or losses realized between the trade and settlement dates on securities transactions, and (3) the difference between the amounts of dividends, interest, and foreign withholding taxes recorded on the Fund’s books and the U.S. dollar equivalent of the amounts actually received or paid. Net unrealized foreign currency gains and losses arise from changes in the fair values of assets and liabilities, other than investments in securities at fiscal period end, resulting from changes in exchange rates. |
The Fund may invest in foreign securities, which may be subject to foreign taxes on income, gains on investments or currency repatriation, a portion of which may be recoverable. Foreign taxes, if any, are recorded based on the tax regulations and rates that exist in the foreign markets in which the Fund invests and are shown in the Statement of Operations.
| K. | Forward Foreign Currency Contracts — The Fund may engage in foreign currency transactions either on a spot (i.e. for prompt delivery and settlement) basis, or through forward foreign currency contracts, to manage or minimize currency or exchange rate risk. |
The Fund may also enter into forward foreign currency contracts for the purchase or sale of a security denominated in a foreign currency in order to “lock in” the U.S. dollar price of that security, or the Fund may also enter into forward foreign currency contracts that do not provide for physical settlement of the two currencies, but instead are settled by a single cash payment calculated as the difference between the agreed upon exchange rate and the spot rate at settlement based upon an agreed upon notional amount (non-deliverable forwards). The Fund will set aside liquid assets in an amount equal to daily mark-to-market obligation for forward foreign currency contracts.
A forward foreign currency contract is an obligation between two parties (“Counterparties”) to purchase or sell a specific currency for an agreed-upon price at a future date. The use of forward foreign currency contracts does not eliminate fluctuations in the price of the underlying securities the Fund owns or intends to acquire but establishes a rate of exchange in advance. Fluctuations in the value of these contracts are measured by the difference in the contract date and reporting date exchange rates and are recorded as unrealized appreciation (depreciation) until the contracts are closed. When the contracts are closed, realized gains (losses) are recorded. Realized and unrealized gains (losses) on the contracts are included in the Statement of Operations. The primary risks associated with forward foreign currency contracts include failure of the Counterparty to meet the terms of the contract and the value of the foreign currency changing unfavorably. These risks may be in excess of the amounts reflected in the Statement of Assets and Liabilities.
| L. | Swap Agreements — The Fund may enter into various swap transactions, including interest rate, total return, volatility, variance, index, currency and credit default swap contracts (“CDS”) for investment purposes or to manage interest rate, equity, currency or credit risk. Such |
19 Invesco Global Market Neutral Fund
| | transactions are agreements between two parties (“Counterparties”). These agreements may contain among other conditions, events of default and termination events, and various covenants and representations such as provisions that require the Fund to maintain a pre-determined level of net assets, and/or provide limits regarding the decline of the Fund’s NAV over specific periods of time. If the Fund were to trigger such provisions and have open derivative positions at that time, the Counterparty may be able to terminate such agreement and request immediate payment in an amount equal to the net liability positions, if any. |
Interest rate, total return, volatility, variance, index, and currency swap agreements are two-party contracts entered into primarily to exchange the returns (or differentials in rates of returns) earned or realized on particular predetermined investments or instruments. The gross returns to be exchanged or “swapped” between the parties are calculated with respect to a notional amount, i.e., the return on or increase in value of a particular dollar amount invested at a particular interest rate or return of an underlying asset, in a particular foreign currency, or in a “basket” of securities representing a particular index.
A total return swap is an agreement in which one party makes payments based on a set rate, either fixed or variable, while the other party makes payments based on the return of an underlying asset, which includes both the income generated and capital gains, if any. The unrealized appreciation (depreciation) on total return swaps includes dividends on the underlying equity securities and financing rate payable from the Counterparty. At the maturity date, a net cash flow is exchanged where the total return is equivalent to the return of the underlying reference less a financing rate, if any. As a receiver, the Fund would receive payments based on any positive total return and would owe payments in the event of a negative total return. As the payer, the Fund would owe payments on any net positive total return, and would receive payment in the event of a negative total return.
Changes in the value of swap agreements are recognized as unrealized gains (losses) in the Statement of Operations by “marking to market” on a daily basis to reflect the value of the swap agreement at the end of each trading day. Payments received or paid at the beginning of the agreement are reflected as such on the Statement of Assets and Liabilities and may be referred to as upfront payments. The Fund accrues for the fixed payment stream and amortizes upfront payments, if any, on swap agreements on a daily basis with the net amount, recorded as a component of realized gain (loss) on the Statement of Operations. A liquidation payment received or made at the termination of a swap agreement is recorded as realized gain (loss) on the Statement of Operations. The Fund segregates liquid securities having a value at least equal to the amount of the potential obligation of a Fund under any swap transaction. Entering into these agreements involves, to varying degrees, lack of liquidity and elements of credit, market, and Counterparty risk in excess of amounts recognized on the Statement of Assets and Liabilities. Such risks involve the possibility that a swap is difficult to sell or liquidate; the Counterparty does not honor its obligations under the agreement and unfavorable interest rates and market fluctuations. It is possible that developments in the swaps market, including potential government regulation, could adversely affect the Fund’s ability to terminate existing swap agreements or to realize amounts to be received under such agreements. A short position in a security poses more risk than holding the same security long. As there is no limit on how much the price of the security can increase, the Fund’s exposure is unlimited.
| M. | Leverage Risk — Leverage exists when the Fund can lose more than it originally invests because it purchases or sells an instrument or enters into a transaction without investing an amount equal to the full economic exposure of the instrument or transaction. |
| N. | Collateral — To the extent the Fund has designated or segregated a security as collateral and that security is subsequently sold, it is the Fund’s practice to replace such collateral no later than the next business day. |
NOTE 2—Advisory Fees and Other Fees Paid to Affiliates
The Trust has entered into a master investment advisory agreement with Invesco Advisers, Inc. (the “Adviser” or “Invesco”). Under the terms of the investment advisory agreement, the Fund pays an advisory fee to the Adviser based on the annual rate of the Fund’s average daily net assets as follows:
| | | | |
| Average Daily Net Assets | | Rate | |
First $10 billion | | | 1.25% | |
Over $10 billion | | | 1.15% | |
For the year ended October 31, 2015, the effective advisory fees incurred by the Fund was 1.25%.
Under the terms of a master sub-advisory agreement between the Adviser and each of Invesco Asset Management Deutschland GmbH, Invesco Asset Management Limited, Invesco Asset Management (Japan) Limited, Invesco Hong Kong Limited, Invesco Senior Secured Management, Inc., Invesco Canada Ltd. and Invesco PowerShares Capital Management LLC (collectively, the “Affiliated Sub-Advisers”) the Adviser, not the Fund, may pay 40% of the fees paid to the Adviser to any such Affiliated Sub-Adviser(s) that provide(s) discretionary investment management services to the Fund based on the percentage of assets allocated to such Affiliated Sub-Adviser(s).
The Adviser has contractually agreed, through at least February 28, 2017, to waive advisory fees and/or reimburse expenses to the extent necessary to limit total annual fund operating expenses after fee waiver and/or expense reimbursement (excluding certain items discussed below) of Class A, Class C, Class R, Class Y, Class R5 and Class R6 shares to 1.62%, 2.37%, 1.87%, 1.37%, 1.37% and 1.37% of average daily net assets, respectively. In determining the Adviser’s obligation to waive advisory fees and/or reimburse expenses, the following expenses are not taken into account, and could cause total annual fund operating expenses after fee waiver and/or expense reimbursement to exceed the numbers reflected above: (1) interest; (2) taxes; (3) dividend expense on short sales; (4) extraordinary or non-routine items, including litigation expenses; and (5) expenses that the Fund has incurred but did not actually pay because of an expense offset arrangement. Unless Invesco continues the fee waiver agreement, it will terminate on February 28, 2017. The fee waiver agreement cannot be terminated during its term.
Further, the Adviser has contractually agreed, through at least June 30, 2017, to waive the advisory fee payable by the Fund in an amount equal to 100% of the net advisory fees the Adviser receives from the affiliated money market funds on investments by the Fund of uninvested cash in such affiliated money market funds.
For the year ended October 31, 2015, the Adviser waived advisory fees of $268,989 and reimbursed class level expenses of $4,126, $309, $11, $7,199, $57 and $64, of Class A, Class C, Class R, Class Y, Class R5 and Class R6 shares, respectively.
For the year ended October 31, 2015 the Adviser reimbursed the Fund for an economic loss of $210,163.
20 Invesco Global Market Neutral Fund
The Trust has entered into a master administrative services agreement with Invesco pursuant to which the Fund has agreed to pay Invesco for certain administrative costs incurred in providing accounting services to the Fund. For the year ended October 31, 2015, expenses incurred under the agreement are shown in the Statement of Operations as Administrative services fees.
The Trust has entered into a transfer agency and service agreement with Invesco Investment Services, Inc. (“IIS”) pursuant to which the Fund has agreed to pay IIS a fee for providing transfer agency and shareholder services to the Fund and reimburse IIS for certain expenses incurred by IIS in the course of providing such services. IIS may make payments to intermediaries that provide omnibus account services, sub-accounting services and/or networking services. All fees payable by IIS to intermediaries that provide omnibus account services or sub-accounting are charged back to the Fund, subject to certain limitations approved by the Trust’s Board of Trustees. For the year ended October 31, 2015, expenses incurred under the agreement are shown in the Statement of Operations as Transfer agent fees.
The Trust has entered into master distribution agreements with Invesco Distributors, Inc. (“IDI”) to serve as the distributor for the Class A, Class C, Class R, Class Y, Class R5 and Class R6 shares of the Fund. The Trust has adopted plans pursuant to Rule 12b-1 under the 1940 Act with respect to the Fund’s Class A, Class C and Class R shares (collectively the “Plans”). The Fund, pursuant to the Plans, pays IDI compensation at the annual rate of 0.25% of the Fund’s average daily net assets of Class A shares, 1.00% of the average daily net assets of Class C shares and 0.50% of the average daily net assets of Class R shares. Of the Plan payments, up to 0.25% of the average daily net assets of each class of shares may be paid to furnish continuing personal shareholder services to customers who purchase and own shares of such classes. Any amounts not paid as a service fee under the Plans would constitute an asset-based sales charge. Rules of the Financial Industry Regulatory Authority (“FINRA”) impose a cap on the total sales charges, including asset-based sales charges, that may be paid by any class of shares of the Fund. For the year ended October 31, 2015, expenses incurred under the Plans are shown in the Statement of Operations as Distribution fees.
Front-end sales commissions and CDSC (collectively, the “sales charges”) are not recorded as expenses of the Fund. Front-end sales commissions are deducted from proceeds from the sales of Fund shares prior to investment in Class A shares of the Fund. CDSC are deducted from redemption proceeds prior to remittance to the shareholder. During the year ended October 31, 2015, IDI advised the Fund that IDI retained $803 in front-end sales commissions from the sale of Class A shares and $292 from Class C shares, for CDSC imposed upon redemptions by shareholders.
Certain officers and trustees of the Trust are officers and directors of the Adviser, IIS and/or IDI.
NOTE 3—Additional Valuation Information
GAAP defines fair value as the price that would be received to sell an asset or paid to transfer a liability in an orderly transaction between market participants at the measurement date, under current market conditions. GAAP establishes a hierarchy that prioritizes the inputs to valuation methods, giving the highest priority to readily available unadjusted quoted prices in an active market for identical assets (Level 1) and the lowest priority to significant unobservable inputs (Level 3), generally when market prices are not readily available or are unreliable. Based on the valuation inputs, the securities or other investments are tiered into one of three levels. Changes in valuation methods may result in transfers in or out of an investment’s assigned level:
| | Level 1 — | Prices are determined using quoted prices in an active market for identical assets. |
| | Level 2 — | Prices are determined using other significant observable inputs. Observable inputs are inputs that other market participants may use in pricing a security. These may include quoted prices for similar securities, interest rates, prepayment speeds, credit risk, yield curves, loss severities, default rates, discount rates, volatilities and others. |
| | Level 3 — | Prices are determined using significant unobservable inputs. In situations where quoted prices or observable inputs are unavailable (for example, when there is little or no market activity for an investment at the end of the period), unobservable inputs may be used. Unobservable inputs reflect the Fund’s own assumptions about the factors market participants would use in determining fair value of the securities or instruments and would be based on the best available information. |
The following is a summary of the tiered valuation input levels, as of October 31, 2015. The level assigned to the securities valuations may not be an indication of the risk or liquidity associated with investing in those securities. Because of the inherent uncertainties of valuation, the values reflected in the financial statements may materially differ from the value received upon actual sale of those investments.
During the year ended October 31, 2015, there were transfers from Level 1 to Level 2 of $1,380,446 and from Level 2 to Level 1 of $1,036,027, due to foreign fair value adjustments.
| | | | | | | | | | | | | | | | |
| | | Level 1 | | | Level 2 | | | Level 3 | | | Total | |
Australia | | $ | 351,989 | | | $ | 294,135 | | | $ | — | | | $ | 646,124 | |
Canada | | | 641,111 | | | | — | | | | — | | | | 641,111 | |
China | | | — | | | | 349,094 | | | | — | | | | 349,094 | |
Denmark | | | — | | | | 682,440 | | | | — | | | | 682,440 | |
Finland | | | — | | | | 151,239 | | | | — | | | | 151,239 | |
France | | | 416,426 | | | | 139,284 | | | | — | | | | 555,710 | |
Germany | | | 887,338 | | | | — | | | | — | | | | 887,338 | |
Israel | | | 91,347 | | | | — | | | | — | | | | 91,347 | |
Japan | | | — | | | | 3,862,605 | | | | — | | | | 3,862,605 | |
Jordan | | | 110,870 | | | | — | | | | — | | | | 110,870 | |
Macau | | | — | | | | 63,492 | | | | — | | | | 63,492 | |
Netherlands | | | 125,360 | | | | 65,469 | | | | — | | | | 190,829 | |
New Zealand | | | 29,642 | | | | 78,925 | | | | — | | | | 108,567 | |
Norway | | | — | | | | 48,341 | | | | — | | | | 48,341 | |
Singapore | | | 50,862 | | | | — | | | | — | | | | 50,862 | |
21 Invesco Global Market Neutral Fund
| | | | | | | | | | | | | | | | |
| | | Level 1 | | | Level 2 | | | Level 3 | | | Total | |
Sweden | | $ | 78,491 | | | $ | 194,052 | | | $ | — | | | $ | 272,543 | |
Switzerland | | | 88,789 | | | | 222,355 | | | | — | | | | 311,144 | |
United Kingdom | | | 309,249 | | | | 830,292 | | | | — | | | | 1,139,541 | |
United States | | | 10,320,451 | | | | — | | | | — | | | | 10,320,451 | |
| | | | 13,501,925 | | | | 6,981,723 | | | | — | | | | 20,483,648 | |
Swap Agreements* | | | — | | | | (210,183 | ) | | | — | | | | (210,183 | ) |
Total Investments | | $ | 13,501,925 | | | $ | 6,771,540 | | | $ | — | | | $ | 20,273,465 | |
| * | Unrealized appreciation (depreciation). |
NOTE 4—Derivative Investments
Value of Derivative Investments at Period-End
The table below summarizes the value of the Fund’s derivative investments, detailed by primary risk exposure, held as of October 31, 2015:
| | | | | | | | |
| | | Value | |
| Risk Exposure/Derivative Type | | Assets | | | Liabilities | |
Equity risk: | | | | | | | | |
Swap agreements(a) | | $ | 93,992 | | | $ | (304,175 | ) |
| (a) | Values are disclosed on the Statement of Assets and Liabilities under the captions Unrealized appreciation on swap agreements — OTC and Unrealized depreciation on swap agreements — OTC. |
Effect of Derivative Investments for the year ended October 31, 2015
The table below summarizes the gains (losses) on derivative investments, detailed by primary risk exposure, recognized in earnings during the period:
| | | | | | | | |
| | | Location of Gain (Loss) on
Statement of Operations | |
| | | Forward
Foreign Currency
Contracts | | | Swap
Agreements | |
Realized Gain (Loss): | | | | | | | | |
Currency risk | | $ | 218,650 | | | $ | — | |
Equity risk | | | — | | | | (922,448 | ) |
Change in Net Unrealized Appreciation: | | | | | | | | |
Currency risk | | | — | | | | — | |
Equity risk | | | — | | | | 612,428 | |
Total | | $ | 218,650 | | | $ | (310,020 | ) |
The table below summarizes the two month average notional value of forward foreign currency contracts and the twelve month average notional value of swap agreements outstanding during the period.
| | | | | | | | |
| | | Forward
Foreign Currency
Contracts | | | Swap
Agreements | |
Average notional value | | $ | 6,067,291 | | | $ | 15,868,795 | |
Offsetting Assets and Liabilities
Accounting Standards Update (“ASU”) No. 2011-11, Disclosures about Offsetting Assets and Liabilities, which was subsequently clarified in Financial Accounting Standards Board ASU 2013-01 “Clarifying the Scope of Disclosures about Offsetting Assets and Liabilities” is intended to enhance disclosures about financial instruments and derivative instruments that are subject to offsetting arrangements on the Statement of Assets and Liabilities and to enable investors to better understand the effect of those arrangements on the Fund’s financial position. In order for an arrangement to be eligible for netting, the Fund must have a basis to conclude that such netting arrangements are legally enforceable. The Fund enters into netting agreements and collateral agreements in an attempt to reduce the Fund’s Counterparty credit risk by providing for a single net settlement with a Counterparty of all financial transactions covered by the agreement in an event of default as defined under such agreement.
The following tables present derivative instruments that are either subject to an enforceable netting agreement or offset by collateral arrangements as of October 31, 2015.
| | | | | | | | | | | | | | | | | | | | |
Counterparty | | Gross amounts
of Recognized
Assets | | | Gross Amounts Not Offset in the
Statement of Assets and Liabilities | | | Net
Amount | |
| | | Financial
Instruments | | | Collateral Received | | |
| | | | Non-Cash | | | Cash | | |
Morgan Stanley & Co. LLC | | $ | 93,992 | | | $ | (93,992 | ) | | $ | — | | | $ | — | | | $ | — | |
22 Invesco Global Market Neutral Fund
| | | | | | | | | | | | | | | | | | | | |
Counterparty | | Gross amounts
of Recognized
Liabilities | | | Gross Amounts Not Offset in the
Statement of Assets and Liabilities | | | Net
Amount | |
| | | Financial
Instruments | | | Collateral Pledged | | |
| | | | Non-Cash | | | Cash | | |
Morgan Stanley & Co. LLC | | $ | 306,489 | | | $ | (93,992 | ) | | $ | — | | | $ | (60,477 | ) | | $ | 152,020 | |
NOTE 5—Trustees’ and Officers’ Fees and Benefits
Trustees’ and Officers’ Fees and Benefits include amounts accrued by the Fund to pay remuneration to certain Trustees and Officers of the Fund. Trustees have the option to defer compensation payable by the Fund, and Trustees’ and Officers’ Fees and Benefits also include amounts accrued by the Fund to fund such deferred compensation amounts. Those Trustees who defer compensation have the option to select various Invesco Funds in which their deferral accounts shall be deemed to be invested. Obligations under the deferred compensation plan represent unsecured claims against the general assets of the Fund.
NOTE 6—Cash Balances
The Fund is permitted to temporarily carry a negative or overdrawn balance in its account with State Street Bank and Trust Company, the custodian bank. Such balances, if any at period end, are shown in the Statement of Assets and Liabilities under the payable caption Amount due custodian. To compensate the custodian bank for such overdrafts, the overdrawn Fund may either (1) leave funds as a compensating balance in the account so the custodian bank can be compensated by earning the additional interest; or (2) compensate by paying the custodian bank at a rate agreed upon by the custodian bank and Invesco, not to exceed the contractually agreed upon rate.
NOTE 7—Distributions to Shareholders and Tax Components of Net Assets
Tax Character of Distributions to Shareholders Paid During the Fiscal Years Ended October 31, 2015 and the period December 19, 2013 (commencement date) through October 31, 2014:
| | | | | | | | |
| | | 2015 | | | 2014 | |
Ordinary income | | $ | 264,268 | | | $ | — | |
Long-term capital gain | | | 10,645 | | | | — | |
Total distributions | | $ | 274,913 | | | $ | — | |
Tax Components of Net Assets at Period-End:
| | | | |
| | | 2015 | |
Undistributed long-term gain | | $ | 90,722 | |
Net unrealized appreciation — investments | | | 404,331 | |
Net unrealized appreciation (depreciation) — other investments | | | (710 | ) |
Temporary book/tax differences | | | (4,003 | ) |
Shares of beneficial interest | | | 19,331,488 | |
Total net assets | | $ | 19,821,828 | |
The difference between book-basis and tax-basis unrealized appreciation (depreciation) is due to differences in the timing of recognition of gains and losses on investments for tax and book purposes. The Fund’s net unrealized appreciation difference is attributable primarily to wash sales.
The temporary book/tax differences are a result of timing differences between book and tax recognition of income and/or expenses. The Fund’s temporary book/tax differences are the result of the trustee deferral of compensation and retirement plan benefits.
The Fund does not have a capital loss carryforward as of October 31, 2015.
23 Invesco Global Market Neutral Fund
NOTE 8—Investment Securities
The aggregate amount of investment securities (other than short-term securities, U.S. Treasury obligations and money market funds, if any) purchased and sold by the Fund during the year ended October 31, 2015 was $15,955,030 and $11,773,966, respectively. Cost of investments on a tax basis includes the adjustments for financial reporting purposes as of the most recently completed federal income tax reporting period-end.
| | | | |
| Unrealized Appreciation (Depreciation) of Investment Securities on a Tax Basis | |
Aggregate unrealized appreciation of investment securities | | $ | 1,778,296 | |
Aggregate unrealized (depreciation) of investment securities | | | (1,373,965 | ) |
Net unrealized appreciation of investment securities | | $ | 404,331 | |
Cost of investments for tax purposes is $20,079,317.
NOTE 9—Reclassification of Permanent Differences
Primarily as a result of differing book/tax treatment of foreign currency gains, net operating loss and swap agreements, on October 31, 2015, undistributed net investment income was decreased by $746,185, undistributed net realized gain (loss) was increased by $891,192 and shares of beneficial interest was decreased by $145,007. This reclassification had no effect on the net assets of the Fund.
NOTE 10—Share Information
| | | | | | | | | | | | | | | | |
| | | Summary of Share Activity | |
| | | Year ended
October 31, 2015(a) | | | December 19, 2013
(commencement date) through
October 31, 2014 | |
| | | Shares | | | Amount | | | Shares | | | Amount | |
Sold: | | | | | | | | | | | | | | | | |
Class A | | | 148,554 | | | $ | 1,522,177 | | | | 655,765 | | | $ | 6,691,675 | |
Class C | | | 63,575 | | | | 648,728 | | | | 18,382 | | | | 188,179 | |
Class R | | | 261 | | | | 2,625 | | | | 1,366 | | | | 13,770 | |
Class Y | | | 773,886 | | | | 7,905,867 | | | | 716,863 | | | | 7,349,692 | |
Class R5 | | | — | | | | — | | | | 66,552 | | | | 670,518 | |
Class R6 | | | 13,855 | | | | 142,959 | | | | 54,557 | | | | 546,530 | |
| | | | |
Issued as reinvestment of dividends: | | | | | | | | | | | | | | | | |
Class A | | | 1,092 | | | | 11,137 | | | | — | | | | — | |
Class C | | | 188 | | | | 1,908 | | | | — | | | | — | |
Class R | | | 7 | | | | 71 | | | | — | | | | — | |
Class Y | | | 4,910 | | | | 50,083 | | | | — | | | | — | |
Class R5 | | | 296 | | | | 3,022 | | | | — | | | | — | |
Class R6 | | | 168 | | | | 1,710 | | | | — | | | | — | |
| | | | |
Reacquired: | | | | | | | | | | | | | | | | |
Class A | | | (90,600 | ) | | | (964,058 | ) | | | (160,437 | ) | | | (1,638,692 | ) |
Class C | | | (16,485 | ) | | | (165,132 | ) | | | (6,577 | ) | | | (68,813 | ) |
Class Y | | | (283,495 | ) | | | (2,901,511 | ) | | | (21,601 | ) | | | (220,298 | ) |
Class R5 | | | (14,192 | ) | | | (146,333 | ) | | | (2,655 | ) | | | (27,932 | ) |
Class R6 | | | (4,315 | ) | | | (44,511 | ) | | | — | | | | — | |
Net increase in share activity | | | 597,705 | | | $ | 6,068,742 | | | | 1,322,215 | | | $ | 13,504,629 | |
| (a) | There are entities that are record owners of more than 5% of the outstanding shares of the Fund and in the aggregate own 41% of the outstanding shares of the Fund. IDI has an agreement with these entities to sell Fund shares. The Fund, Invesco and/or Invesco affiliates may make payments to these entities, which are considered to be related to the Fund, for providing services to the Fund, Invesco and/or Invesco affiliates including but not limited to services such as securities brokerage, distribution, third party record keeping and account servicing. The Fund has no knowledge as to whether all or any portion of the shares owned of record by these entities are also owned beneficially. |
| | In addition, 52% of the outstanding shares of the Fund are owned by the Adviser. |
24 Invesco Global Market Neutral Fund
NOTE 11—Financial Highlights
The following schedule presents financial highlights for a share of the Fund outstanding throughout the periods indicated.
| | | | | | | | | | | | | | | | | | | | | | | | | | | | | | | | | | | | | | | | | | | | | | | | | | | | | | | | |
| | | Net asset
value,
beginning
of period | | | Net
investment
income
(loss)(a) | | | Net gains
(losses)
on securities
(both
realized and
unrealized) | | | Total from
investment
operations | | | Dividends
from net
investment
income | | | Distributions
from net
realized
gains | | | Total
distributions | | | Net asset
value, end
of period | | | Total
return(b) | | | Net assets,
end of period
(000’s omitted) | | | Ratio of
expenses
to average
net assets
with fee waivers
and/or expenses
absorbed | | | Ratio of
expenses
to average net
assets without
fee waivers
and/or expenses
absorbed | | | Ratio of net
investment
income
(loss)
to average
net assets | | | Portfolio
turnover(c) | |
Class A | | | | | | | | | | | | | | | | | | | | | | | | | | | | | | | | | | | | | | | | | | | | | | | | | | | | | | | | |
Year ended 10/31/15 | | $ | 10.49 | | | $ | 0.07 | | | $ | (0.06 | ) | | $ | 0.01 | | | $ | (0.18 | ) | | $ | (0.01 | ) | | $ | (0.19 | ) | | $ | 10.31 | | | | 0.16 | %(d) | | $ | 5,716 | | | | 1.61 | %(e) | | | 3.28 | %(e) | | | 0.69 | %(e) | | | 77 | % |
Year ended 10/31/14(f) | | | 10.00 | | | | 0.04 | | | | 0.45 | | | | 0.49 | | | | — | | | | — | | | | — | | | | 10.49 | | | | 4.90 | (g) | | | 5,197 | | | | 1.61 | (h) | | | 4.61 | (h) | | | 0.43 | (h) | | | 46 | |
Class C | | | | | | | | | | | | | | | | | | | | | | | | | | | | | | | | | | | | | | | | | | | | | | | | | | | | | | | | |
Year ended 10/31/15 | | | 10.41 | | | | (0.01 | ) | | | (0.03 | ) | | | (0.04 | ) | | | (0.16 | ) | | | (0.01 | ) | | | (0.17 | ) | | | 10.20 | | | | (0.35 | )(d) | | | 603 | | | | 2.36 | (e) | | | 4.03 | (e) | | | (0.06 | )(e) | | | 77 | |
Year ended 10/31/14(f) | | | 10.00 | | | | (0.03 | ) | | | 0.44 | | | | 0.41 | | | | — | | | | — | | | | — | | | | 10.41 | | | | 4.10 | (g) | | | 123 | | | | 2.36 | (h) | | | 5.36 | (h) | | | (0.32 | )(h) | | | 46 | |
Class R | | | | | | | | | | | | | | | | | | | | | | | | | | | | | | | | | | | | | | | | | | | | | | | | | | | | | | | | |
Year ended 10/31/15 | | | 10.46 | | | | 0.05 | | | | (0.05 | ) | | | (0.00 | ) | | | (0.18 | ) | | | (0.01 | ) | | | (0.19 | ) | | | 10.27 | | | | (0.01 | )(d) | | | 17 | | | | 1.86 | (e) | | | 3.53 | (e) | | | 0.44 | (e) | | | 77 | |
Year ended 10/31/14(f) | | | 10.00 | | | | 0.02 | | | | 0.44 | | | | 0.46 | | | | — | | | | — | | | | — | | | | 10.46 | | | | 4.60 | (g) | | | 14 | | | | 1.86 | (h) | | | 4.86 | (h) | | | 0.18 | (h) | | | 46 | |
Class Y | | | | | | | | | | | | | | | | | | | | | | | | | | | | | | | | | | | | | | | | | | | | | | | | | | | | | | | | |
Year ended 10/31/15 | | | 10.52 | | | | 0.10 | | | | (0.06 | ) | | | 0.04 | | | | (0.21 | ) | | | (0.01 | ) | | | (0.22 | ) | | | 10.34 | | | | 0.38 | (d) | | | 12,305 | | | | 1.36 | (e) | | | 3.03 | (e) | | | 0.94 | (e) | | | 77 | |
Year ended 10/31/14(f) | | | 10.00 | | | | 0.06 | | | | 0.46 | | | | 0.52 | | | | — | | | | — | | | | — | | | | 10.52 | | | | 5.20 | (g) | | | 7,311 | | | | 1.36 | (h) | | | 4.36 | (h) | | | 0.68 | (h) | | | 46 | |
Class R5 | | | | | | | | | | | | | | | | | | | | | | | | | | | | | | | | | | | | | | | | | | | | | | | | | | | | | | | | |
Year ended 10/31/15 | | | 10.51 | | | | 0.10 | | | | (0.05 | ) | | | 0.05 | | | | (0.21 | ) | | | (0.01 | ) | | | (0.22 | ) | | | 10.34 | | | | 0.47 | (d) | | | 517 | | | | 1.36 | (e) | | | 2.97 | (e) | | | 0.94 | (e) | | | 77 | |
Year ended 10/31/14(f) | | | 10.00 | | | | 0.06 | | | | 0.45 | | | | 0.51 | | | | — | | | | — | | | | — | | | | 10.51 | | | | 5.10 | (g) | | | 671 | | | | 1.36 | (h) | | | 4.33 | (h) | | | 0.68 | (h) | | | 46 | |
Class R6 | | | | | | | | | | | | | | | | | | | | | | | | | | | | | | | | | | | | | | | | | | | | | | | | | | | | | | | | |
Year ended 10/31/15 | | | 10.51 | | | | 0.10 | | | | (0.05 | ) | | | 0.05 | | | | (0.21 | ) | | | (0.01 | ) | | | (0.22 | ) | | | 10.34 | | | | 0.47 | (d) | | | 664 | | | | 1.36 | (e) | | | 2.97 | (e) | | | 0.94 | (e) | | | 77 | |
Year ended 10/31/14(f) | | | 10.00 | | | | 0.06 | | | | 0.45 | | | | 0.51 | | | | — | | | | — | | | | — | | | | 10.51 | | | | 5.10 | (g) | | | 573 | | | | 1.36 | (h) | | | 4.33 | (h) | | | 0.68 | (h) | | | 46 | |
| (a) | Calculated using average shares outstanding. |
| (b) | Includes adjustments in accordance with accounting principles generally accepted in the United States of America and as such, the net asset value for financial reporting purposes and the returns based upon those net asset values may differ from the net asset value and returns for shareholder transactions. Does not include sales charges and is not annualized for periods less than one year, if applicable. |
| (c) | Portfolio turnover is calculated at the fund level and is not annualized for periods less than one year, if applicable. |
| (d) | Amount includes the effect of the Adviser pay-in for an economic loss of $0.11 per share. Had the pay-in not been made, the total return would have been (0.91)%, (1.42)%, (1.09)%, (0.69)%, (0.60)%, and (0.60)% for Class A, Class C, Class R, Class Y, Class R5 and Class R6 shares, respectively. |
| (e) | Ratios are based on average daily net assets (000’s omitted) of $5,552, $415, $15, $9,689, $529 and $599 for Class A, Class C, Class R, Class Y, Class R5 and Class R6 shares, respectively. |
| (f) | Commencement date of December 19, 2013 for Class A, Class C, Class R, Class Y, Class R5 and Class R6 shares, respectively. |
| (g) | Amount includes the effect of the Adviser pay-in for an economic loss of $0.41 per share. Had the pay-in not been made, the total return would have been 0.80%, 0.10%, 0.60%, 1.00%, 1.00% and 1.00% for Class A, Class C, Class R, Class Y, Class R5 and Class R6 shares, respectively. |
25 Invesco Global Market Neutral Fund
Report of Independent Registered Public Accounting Firm
To the Board of Trustees of AIM Investment Funds (Invesco Investment Funds)
and Shareholders of Invesco Global Market Neutral Fund:
In our opinion, the accompanying statement of assets and liabilities, including the schedule of investments, and the related statements of operations, of changes in net assets and of cash flows and the financial highlights present fairly, in all material respects, the financial position of Invesco Global Market Neutral Fund (one of the funds constituting AIM Investment Funds (Invesco Investment Funds), hereafter referred to as the “Fund”) at October 31, 2015, the results of its operations and its cash flows for the year then ended, the changes in its net assets and the financial highlights for the year then ended and for the period December 19, 2013 (commencement of operations) through October 31, 2014, in conformity with accounting principles generally accepted in the United States of America. These financial statements and financial highlights (hereafter referred to as “financial statements”) are the responsibility of the Fund’s management. Our responsibility is to express an opinion on these financial statements based on our audits. We conducted our audits of these financial statements in accordance with the standards of the Public Company Accounting Oversight Board (United States). Those standards require that we plan and perform the audit to obtain reasonable assurance about whether the financial statements are free of material misstatement. An audit includes examining, on a test basis, evidence supporting the amounts and disclosures in the financial statements, assessing the accounting principles used and significant estimates made by management, and evaluating the overall financial statement presentation. We believe that our audits, which included confirmation of securities at October 31, 2015 by correspondence with the custodian and brokers, and the application of alternative auditing procedures where confirmations of security purchases have not been received, provide a reasonable basis for our opinion.
PRICEWATERHOUSECOOPERS LLP
December 23, 2015
Houston, Texas
26 Invesco Global Market Neutral Fund
Calculating your ongoing Fund expenses
Example
As a shareholder of the Fund, you incur two types of costs: (1) transaction costs, which may include sales charges (loads) on purchase payments or contingent deferred sales charges on redemptions, if any; and (2) ongoing costs, including management fees, distribution and/or service (12b-1) fees, and other Fund expenses. This example is intended to help you understand your ongoing costs (in dollars) of investing in the Fund and to compare these costs with ongoing costs of investing in other mutual funds. The example is based on an investment of $1,000 invested at the beginning of the period and held for the entire period May 1, 2015 through October 31, 2015.
Actual expenses
The table below provides information about actual account values and actual expenses. You may use the information in this table, together with the amount you invested, to estimate the expenses that you paid over the period. Simply divide your account value by $1,000 (for example, an $8,600 account value divided by $1,000 = 8.6), then multiply the result by the number in the table under the heading entitled “Actual Expenses Paid During Period” to estimate the expenses you paid on your account during this period.
Hypothetical example for comparison purposes
The table below also provides information about hypothetical account values and hypothetical expenses based on the Fund’s actual expense ratio and an assumed rate of return of 5% per year before expenses, which is not the Fund’s actual return.
The hypothetical account values and expenses may not be used to estimate the actual ending account balance or expenses you paid for the period. You may use this information to compare the ongoing costs of investing in the Fund and other funds. To do so, compare this 5% hypothetical example with the 5% hypothetical examples that appear in the shareholder reports of the other funds.
Please note that the expenses shown in the table are meant to highlight your ongoing costs only and do not reflect any transaction costs, such as sales charges (loads) on purchase payments or contingent deferred sales charges on redemptions, if any. Therefore, the hypothetical information is useful in comparing ongoing costs only, and will not help you determine the relative total costs of owning different funds. In addition, if these transaction costs were included, your costs would have been higher.
| | | | | | | | | | | | | | | | | | | | | | | | |
| Class | | Beginning
Account Value
(05/01/15) | | | ACTUAL | | | HYPOTHETICAL
(5% annual return before
expenses) | | | Annualized
Expense
Ratio | |
| | | Ending
Account Value
(10/31/15)1 | | | Expenses
Paid During
Period2 | | | Ending
Account Value
(10/31/15) | | | Expenses
Paid During
Period2 | | |
| A | | $ | 1,000.00 | | | $ | 1,021.80 | | | $ | 8.19 | | | $ | 1,017.10 | | | $ | 8.17 | | | | 1.61 | % |
| C | | | 1,000.00 | | | | 1,018.00 | | | | 11.99 | | | | 1,013.32 | | | | 11.96 | | | | 2.36 | |
| R | | | 1,000.00 | | | | 1,019.90 | | | | 9.46 | | | | 1,015.84 | | | | 9.44 | | | | 1.86 | |
| Y | | | 1,000.00 | | | | 1,023.80 | | | | 6.93 | | | | 1,018.36 | | | | 6.91 | | | | 1.36 | |
| R5 | | | 1,000.00 | | | | 1,022.80 | | | | 6.92 | | | | 1,018.36 | | | | 6.91 | | | | 1.36 | |
| R6 | | | 1,000.00 | | | | 1,022.80 | | | | 6.92 | | | | 1,018.36 | | | | 6.91 | | | | 1.36 | |
| 1 | The actual ending account value is based on the actual total return of the Fund for the period May 1, 2015 through October 31, 2015, after actual expenses and will differ from the hypothetical ending account value which is based on the Fund’s expense ratio and a hypothetical annual return of 5% before expenses. |
| 2 | Expenses are equal to the Fund’s annualized expense ratio as indicated above multiplied by the average account value over the period, multiplied by 184/365 to reflect the most recent fiscal half year. |
27 Invesco Global Market Neutral Fund
Approval of Investment Advisory and Sub-Advisory Contracts
The Board of Trustees (the Board) of AIM Investment Funds (Invesco Investment Funds) is required under the Investment Company Act of 1940, as amended, to approve annually the renewal of Invesco Global Market Neutral Fund’s (the Fund) investment advisory agreements. During contract renewal meetings held on June 9-10, 2015, the Board as a whole, and the disinterested or “independent” Trustees, who comprise over 75% of the Board, voting separately, approved the continuance for the Fund of the Master Investment Advisory Agreement with Invesco Advisers, Inc. (Invesco Advisers and the investment advisory agreement) and the Master Intergroup Sub-Advisory Contract for Mutual Funds with Invesco Asset Management Deutschland GmbH, Invesco Asset Management Limited, Invesco Asset Management (Japan) Limited, Invesco Hong Kong Limited, Invesco Senior Secured Management, Inc., Invesco Canada Ltd. and Invesco PowerShares Capital Management LLC (collectively, the Affiliated Sub-Advisers and the sub-advisory contracts) for another year, effective July 1, 2015.
In evaluating the fairness and reasonableness of compensation under the Fund’s investment advisory agreement and sub-advisory contracts, the Board considered, among other things, the factors discussed below. The Board determined that continuation of the Fund’s investment advisory agreement and the sub-advisory contracts is in the best interest of the Fund and its shareholders and that the compensation payable to Invesco Advisers and the Affiliated Sub-Advisers under the agreements is fair and reasonable.
The Board’s Fund Evaluation Process
The Board’s Investments Committee has established three Sub-Committees, each of which is primarily responsible for overseeing the performance and investment management services provided by Invesco Advisers and the Affiliated Sub-Advisers to a number of the funds advised by Invesco Advisers (the Invesco Funds). The Sub-Committees meet throughout the year to review the performance of their assigned Invesco Funds, including reviewing materials prepared under the direction of the independent Senior Officer, an officer of the Invesco Funds who reports directly to the independent Trustees. Over the course of each year, the Sub-Committees meet with portfolio managers for their assigned Invesco Funds and other members of management to review the performance, investment objective(s), policies, strategies, limitations and investment risks of these funds. The Board had the benefit of reports from the Sub-Committees and Investments Committee throughout the year in considering approval of the continuance of each Invesco Fund’s investment advisory agreement and sub-advisory contracts for another year.
During the contract renewal process, the Board receives comparative performance and fee data regarding the Invesco Funds prepared by Invesco Advisers and Lipper Inc. (Lipper), an independent provider of investment company data. The Board also receives a report and this independent written evaluation from the Senior Officer. The Senior Officer’s evaluation is prepared as part of his responsibility to manage the process by which the Invesco Funds’ proposed management fees are negotiated during the annual contract renewal process to ensure they are negotiated in a manner that is at arms’ length and reasonable. In addition to meetings with Invesco Advisers and fund counsel, the independent Trustees also discuss the continuance of the investment advisory agreement and sub-advisory contracts in separate sessions with the Senior Officer and with independent legal counsel.
The Trustees recognized that the advisory fee rates for the Invesco Funds are, in many cases, the result of years of review and negotiation. The Trustees’ deliberations and conclusions in a particular year may be based in part on their deliberations and conclusions regarding these arrangements throughout the year and in prior years. The Trustees’ review and conclusions are based on the comprehensive consideration of all information presented to them and are not the result of any single determinative factor. Moreover, one Trustee may have weighed a particular piece of information or factor differently than another Trustee.
The discussion below is a summary of the Senior Officer’s independent written evaluation with respect to the Fund’s investment advisory agreement as well as a discussion of the material factors and related conclusions that formed the basis for the Board’s approval of the Fund’s investment advisory agreement and sub-advisory contracts. Unless otherwise stated, this information is current as of June 10, 2015, and does not reflect consideration of factors that became known to the Board after that date.
Factors and Conclusions and Summary of Independent Written Fee Evaluation
| A. | Nature, Extent and Quality of Services Provided by Invesco Advisers and the Affiliated Sub-Advisers |
The Board reviewed the advisory services provided to the Fund by Invesco Advisers under the Fund’s investment advisory agreement, the performance of Invesco Advisers in providing these services, and the credentials and experience of the officers and employees of Invesco Advisers who provide these services, including the Fund’s portfolio manager or managers. The Board’s review of the qualifications of Invesco Advisers to provide advisory services included the Board’s consideration of Invesco Advisers’ investment
process oversight, independent credit analysis and investment risk management. The Board also considered non-advisory services that Invesco Advisers and its affiliates provide to the Invesco Funds such as various back office support functions, equity and fixed income trading operations, internal audit, distribution, valuation and legal and compliance.
In determining whether to continue the Fund’s investment advisory agreement, the Board considered the benefits of reapproving an existing relationship and the greater uncertainty that may be associated with entering into a new relationship. The Board concluded that the nature, extent and quality of the services provided to the Fund by Invesco Advisers are appropriate and satisfactory and consistent with the terms of the Fund’s investment advisory agreement.
The Board reviewed the services that may be provided by the Affiliated Sub-Advisers under the sub-advisory contracts and the credentials and experience of the officers and employees of the Affiliated Sub-Advisers who provide these services. The Board noted that the Affiliated Sub-Advisers have offices and personnel that are located in financial centers around the world. As a result, the Affiliated Sub-Advisers can provide research and investment analysis on the markets and economies of various countries in which the Fund may invest, make recommendations regarding securities and assist with security trades. The Board concluded that the sub-advisory contracts benefit the Fund and its shareholders by permitting Invesco Advisers to use the resources and talents of the Affiliated Sub-Advisers in managing the Fund. The Board concluded that the nature, extent and quality of the services that may be provided by the Affiliated Sub-Advisers are appropriate and satisfactory and consistent with the terms of the Fund’s sub-advisory contracts.
The Board noted that the Fund recently began operations and that no comparative performance data was available.
| C. | Advisory and Sub-Advisory Fees |
The Board noted that the Fund had not been in operation long enough to become profitable and that Invesco Advisers was continuing to take entrepreneurial risk in operating the Fund.
The Board noted that Invesco Advisers has contractually agreed to waive fees and/or limit expenses of the Fund through at least February 29, 2016 in an amount necessary to limit total annual operating expenses to a specified percentage of average daily net assets for each class of the Fund.
The Board noted that Invesco Advisers and the Affiliated Sub-Advisers do not manage other mutual funds or client accounts with investment strategies comparable to those of the Fund.
The Board also considered the services that may be provided by the Affiliated Sub-Advisers
28 Invesco Global Market Neutral Fund
pursuant to the sub-advisory contracts, as well as the fees payable by Invesco Advisers to the Affiliated Sub-Advisers pursuant to the sub-advisory contracts. The Board noted that Invesco Advisers retains overall responsibility for, and provides services to, sub-advised Invesco Funds, including oversight of the Affiliated Sub-Advisers as well as the additional services described herein other than day-to-day portfolio management. The Board also noted that the sub-advisory fees are not paid directly by the Fund, but rather, are payable by Invesco Advisers to the Affiliated Sub-Advisers.
| D. | Economies of Scale and Breakpoints |
The Board considered the extent to which there are economies of scale in the provision of advisory services to the Fund. The Board also considered whether the Fund benefits from economies of scale through contractual breakpoints in the Fund’s advisory fee schedule. The Board also noted that the Fund shares directly in economies of scale through lower fees charged by third party service providers based on the combined size of the Invesco Funds and other clients advised by Invesco Advisers.
| E. | Profitability and Financial Resources |
The Board reviewed information from Invesco Advisers concerning the costs of the advisory and other services that Invesco Advisers and its affiliates provide to the Fund and the Invesco Funds and the profitability of Invesco Advisers and its affiliates in providing these services. The Board received information from Invesco Advisers about the methodology used to prepare the profitability information. The Board noted that Invesco Advisers continues to operate at a net profit from services Invesco Advisers and its affiliates provide to the Invesco Funds. The Board noted that although Invesco Advisers received a minimal amount of revenues from advising the Fund, Invesco Advisers and its subsidiaries did not make a profit from managing the Fund. The Board received and accepted information from Invesco Advisers demonstrating that Invesco Advisers and each Affiliated Sub-Adviser are financially sound and have the resources necessary to perform their obligations under the investment advisory agreement and sub-advisory contracts.
| F. | Collateral Benefits to Invesco Advisers and its Affiliates |
The Board considered various other benefits received by Invesco Advisers and its affiliates from the relationship with the Fund, including the fees received for providing transfer agency and distribution services to the Fund. The Board considered the performance of Invesco Advisers and its affiliates in providing these services and the organizational structure employed to provide these services. The Board also considered that these services are provided to the Fund pursuant to written contracts that are reviewed and approved on an annual basis by the Board; and that the services are required for the operation of the Fund.
The Board considered the benefits realized by Invesco Advisers and the Affiliated Sub-Advisers
as a result of portfolio brokerage transactions executed through “soft dollar” arrangements. The Board noted that soft dollar arrangements shift the payment obligation for research services from Invesco Advisers and the Affiliated Sub-Advisers to the Invesco Funds and that the research received may be used with other clients of Invesco Advisers and may reduce Invesco Advisers’ and the Affiliated Sub-Advisers’ expenses. The Board also considered that it receives periodic reports from the Chief Compliance Officer of the Invesco Funds demonstrating that these arrangements are consistent with regulatory requirements. The Board did not deem the soft dollar arrangements to be inappropriate.
The Board considered that the Fund’s uninvested cash and cash collateral from any securities lending arrangements may be invested in money market funds advised by Invesco Advisers pursuant to procedures approved by the Board. The Board noted that Invesco Advisers receives advisory fees from these affiliated money market funds attributable to such investments, although Invesco Advisers has contractually agreed to waive through varying periods the advisory fees payable by the Invesco Funds with respect to investments in the affiliated money market funds. The waiver is in an amount equal to 100% of the net advisory fee Invesco Advisers receives from the affiliated money market funds with respect to the Fund’s investment in the affiliated money market funds of uninvested cash, but not cash collateral. The Board concluded that the amount of advisory fees received by Invesco Advisors from the Fund’s investment of cash collateral from any securities lending arrangements in the affiliated money market funds is fair and reasonable.
The Board also considered the Fund may use an affiliated broker to execute certain trades for the Fund to, among other things, control information leakage, and were advised that such trades would be executed in compliance with rules under the Investment Company Act of 1940, as amended, and consistent with best execution obligations.
29 Invesco Global Market Neutral Fund
Tax Information
Form 1099-DIV, Form 1042-S and other year–end tax information provide shareholders with actual calendar year amounts that should be included in their tax returns. Shareholders should consult their tax advisors.
The following distribution information is being provided as required by the Internal Revenue Code or to meet a specific state’s requirement.
The Fund designates the following amounts or, if subsequently determined to be different, the maximum amount allowable for its fiscal year ended October 31, 2015:
| | | | |
Federal and State Income Tax | |
Long-Term Capital Gain Distributions | | $ | 10,645 | |
Qualified Dividend Income* | | | 81.43 | % |
Corporate Dividends Received Deduction* | | | 26.60 | % |
U.S. Treasury Obligations* | | | 0 | % |
| | * | The above percentages are based on ordinary income dividends paid to shareholders during the Fund’s fiscal year. |
| | | | |
Non-Resident Alien Shareholders | |
Qualified Short-Term Gains | | $ | 12,814 | |
Qualified Interest Income** | | | 0 | % |
| | ** | The above percentage is based on income dividends paid to shareholders during the Fund’s fiscal year. |
30 Invesco Global Market Neutral Fund
Trustees and Officers
The address of each trustee and officer is AIM Investment Funds (Invesco Investment Funds) (the “Trust”), 11 Greenway Plaza, Suite 1000, Houston, Texas 77046-1173. The trustees serve for the life of the Trust, subject to their earlier death, incapacitation, resignation, retirement or removal as more specifically provided in the Trust’s organizational documents. Each officer serves for a one year term or until their successors are elected and qualified. Column two below includes length of time served with predecessor entities, if any.
| | | | | | | | |
Name, Year of Birth and
Position(s) Held with the Trust | | Trustee and/
or Officer Since | | Principal Occupation(s)
During Past 5 Years | | Number of Funds in Fund Complex Overseen by Trustee | | Other Directorship(s) Held by Trustee During Past 5 Years |
| Interested Persons | | | | | | | | |
| Martin L. Flanagan1 — 1960 Trustee | | 2007 | | Executive Director, Chief Executive Officer and President, Invesco Ltd. (ultimate parent of Invesco and a global investment management firm); Advisor to the Board, Invesco Advisers, Inc. (formerly known as Invesco Institutional (N.A.), Inc.); Trustee, The Invesco Funds; Vice Chair, Investment Company Institute; and Member of Executive Board, SMU Cox School of Business Formerly: Chairman and Chief Executive Officer, Invesco Advisers, Inc. (registered investment adviser); Director, Chairman, Chief Executive Officer and President, IVZ Inc. (holding company), INVESCO Group Services, Inc. (service provider) and Invesco North American Holdings, Inc. (holding company); Director, Chief Executive Officer and President, Invesco Holding Company Limited (parent of Invesco and a global investment management firm); Director, Invesco Ltd.; Chairman, Investment Company Institute and President, Co-Chief Executive Officer, Co-President, Chief Operating Officer and Chief Financial Officer, Franklin Resources, Inc. (global investment management organization). | | 145 | | None |
Philip A. Taylor2 — 1954
Trustee, President and Principal Executive Officer | | 2006 | | Head of North American Retail and Senior Managing Director, Invesco Ltd.; Director, Co-Chairman, Co-President and Co-Chief Executive Officer, Invesco Advisers, Inc. (formerly known as Invesco Institutional (N.A.), Inc.) (registered investment adviser); Director, Chairman, Chief Executive Officer and President, Invesco Management Group, Inc. (formerly known as Invesco Aim Management Group, Inc.) (financial services holding company); Director and President, INVESCO Funds Group, Inc. (registered investment adviser and registered transfer agent); Director and Chairman, Invesco Investment Services, Inc. (formerly known as Invesco Aim Investment Services, Inc.) (registered transfer agent) and IVZ Distributors, Inc. (formerly known as INVESCO Distributors, Inc.) (registered broker dealer); Chief Executive Officer, Invesco Corporate Class Inc. (corporate mutual fund company) Director, Chairman and Chief Executive Officer, Invesco Canada Ltd. (formerly known as Invesco Trimark Ltd./Invesco Trimark Ltèe) (registered investment adviser and registered transfer agent); Trustee, President and Principal Executive Officer, The Invesco Funds (other than AIM Treasurer’s Series Trust (Invesco Treasurer’s Series Trust), Short-Term Investments Trust and Invesco Management Trust); Trustee and Executive Vice President, The Invesco Funds (AIM Treasurer’s Series Trust (Invesco Treasurer’s Series Trust), Short-Term Investments Trust and Invesco Management Trust only); Director, Invesco Investment Advisers LLC (formerly known as Van Kampen Asset Management); Director, Chief Executive Officer and President, Van Kampen Exchange Corp. Formerly: Director, President and Chairman, Invesco Inc. (holding company), Invesco Canada Holdings Inc. (holding company), Trimark Investments Ltd./Placements Trimark Ltèe and Invesco Financial Services Ltd/Services Financiers Invesco Ltèe; Chief Executive Officer, Invesco Canada Fund Inc (corporate mutual fund company); Director and Chairman, Van Kampen Investor Services Inc.; Director, Chief Executive Officer and President, 1371 Preferred Inc. (holding company) and Van Kampen Investments Inc.; Director and President, AIM GP Canada Inc. (general partner for limited partnerships) and Van Kampen Advisors, Inc.; Director and Chief Executive Officer, Invesco Trimark Dealer Inc. (registered broker dealer); Director, Invesco Distributors, Inc. (formerly known as Invesco Aim Distributors, Inc.) (registered broker dealer); Manager, Invesco PowerShares Capital Management LLC; Director, Chief Executive Officer and President, Invesco Advisers, Inc.; Director, Chairman, Chief Executive Officer and President, Invesco Aim Capital Management, Inc.; President, Invesco Trimark Dealer Inc. and Invesco Trimark Ltd./Invesco Trimark Ltèe; Director and President, AIM Trimark Corporate Class Inc. and AIM Trimark Canada Fund Inc.; Senior Managing Director, Invesco Holding Company Limited; Director and Chairman, Fund Management Company (former registered broker dealer); President and Principal Executive Officer, The Invesco Funds (AIM Treasurer’s Series Trust (Invesco Treasurer’s Series Trust), and Short-Term Investments Trust only); President, AIM Trimark Global Fund Inc. and AIM Trimark Canada Fund Inc.. | | 145 | | None |
| 1 | Mr. Flanagan is considered an interested person (within the meaning of Section 2(a)(19) of the 1940 Act) of the Trust because he is an officer of the Adviser to the Trust, and an officer and a director of Invesco Ltd., ultimate parent of the Adviser. |
| 2 | Mr. Taylor is considered an interested person (within the meaning of Section 2(a)(19) of the 1940 Act) of the Trust because he is an officer and a director of the Adviser. |
T-1 Invesco Global Market Neutral Fund
Trustees and Officers—(continued)
| | | | | | | | |
Name, Year of Birth and Position(s) Held with the Trust | | Trustee and/ or Officer Since | | Principal Occupation(s) During Past 5 Years | | Number of Funds in Fund Complex Overseen by Trustee | | Other Directorship(s) Held by Trustee During Past 5 Years |
| Independent Trustees | | | | | | | | |
Bruce L. Crockett — 1944 Trustee and Chair | | 2003 | | Chairman, Crockett Technologies Associates (technology consulting company) Formerly: Director, Captaris (unified messaging provider); Director, President and Chief Executive Officer, COMSAT Corporation; Chairman, Board of Governors of INTELSAT (international communications company); ACE Limited (insurance company); Independent Directors Council and Investment Company Institute | | 145 | | ALPS (Attorneys Liability Protection Society) (insurance company) and Globe Specialty Metals, Inc. (metallurgical company) |
David C. Arch — 1945 Trustee | | 2010 | | Chairman of Blistex Inc., a consumer health care products manufacturer | | 145 | | Board member of the Illinois Manufacturers’ Association; Member of the Board of Visitors, Institute for the Humanities, University of Michigan; Member of the Audit Committee of the Edward-Elmhurst Hospital |
James T. Bunch — 1942 Trustee | | 2000 | | Managing Member, Grumman Hill Group LLC (family office/private equity investments) Formerly: Founder, Green Manning & Bunch Ltd. (investment banking firm) (1988-2010); Executive Committee, United States Golf Association; and Chairman, Board of Governors, Western Golf Association | | 145 | | Chairman of the Board of Trustees, Evans Scholars Foundation; and Chairman of the Board, Denver Film Society |
Rodney F. Dammeyer — 1940 Trustee | | 2010 | | Chairman of CAC, LLC, (private company offering capital investment and management advisory services) Formerly: Prior to 2001, Managing Partner at Equity Group Corporate Investments; Prior to 1995, Chief Executive Officer of Itel Corporation (formerly Anixter International); Prior to 1985, experience includes Senior Vice President and Chief Financial Officer of Household International, Inc., Executive Vice President and Chief Financial Officer of Northwest Industries, Inc. and Partner of Arthur Andersen & Co.; From 1987 to 2010, Director/Trustee of investment companies in the Van Kampen Funds complex | | 145 | | Director of Quidel Corporation and Stericycle, Inc. |
Albert R. Dowden — 1941 Trustee | | 2003 | | Director of a number of public and private business corporations, including the Boss Group, Ltd. (private investment and management); Nature’s Sunshine Products, Inc. and Reich & Tang Funds (5 portfolios) (registered investment company) Formerly: Director, Homeowners of America Holding Corporation/Homeowners of America Insurance Company (property casualty company); Director, Continental Energy Services, LLC (oil and gas pipeline service); Director, CompuDyne Corporation (provider of product and services to the public security market) and Director, Annuity and Life Re (Holdings), Ltd. (reinsurance company); Director, President and Chief Executive Officer, Volvo Group North America, Inc.; Senior Vice President, AB Volvo; Director of various public and private corporations; Chairman, DHJ Media, Inc.; Director, Magellan Insurance Company; and Director, The Hertz Corporation, Genmar Corporation (boat manufacturer), National Media Corporation; Advisory Board of Rotary Power International (designer, manufacturer, and seller of rotary power engines); and Chairman, Cortland Trust, Inc. (registered investment company) | | 145 | | Director of: Nature’s Sunshine Products, Inc., Reich & Tang Funds, Homeowners of America Holding Corporation/ Homeowners of America Insurance Company, the Boss Group |
Jack M. Fields — 1952 Trustee | | 2003 | | Chief Executive Officer, Twenty First Century Group, Inc. (government affairs company); Owner and Chief Executive Officer, Dos Angeles Ranch, L.P. (cattle, hunting, corporate entertainment); and Discovery Global Education Fund (non-profit) Formerly: Chief Executive Officer, Texana Timber LP (sustainable forestry company); Director of Cross Timbers Quail Research Ranch (non-profit); and member of the U.S. House of Representatives | | 145 | | Insperity, Inc. (formerly known as Administaff) |
Prema Mathai-Davis — 1950 Trustee | | 2003 | | Retired. Formerly: Chief Executive Officer, YWCA of the U.S.A. | | 145 | | None |
Larry Soll — 1942 Trustee | | 1997 | | Retired. Formerly: Chairman, Chief Executive Officer and President, Synergen Corp. (a biotechnology company) | | 145 | | None |
Hugo F. Sonnenschein — 1940 Trustee | | 2010 | | President Emeritus and Honorary Trustee of the University of Chicago and the Adam Smith Distinguished Service Professor in the Department of Economics at the University of Chicago. Prior to 2000, President of the University of Chicago | | 145 | | Trustee of the University of Rochester and a member of its investment committee; Member of the National Academy of Sciences and the American Philosophical Society; Fellow of the American Academy of Arts and Sciences |
Raymond Stickel, Jr. — 1944 Trustee | | 2005 | | Retired. Formerly: Director, Mainstay VP Series Funds, Inc. (25 portfolios) and Partner, Deloitte & Touche | | 145 | | None |
T-2 Invesco Global Market Neutral Fund
Trustees and Officers—(continued)
| | | | | | | | |
Name, Year of Birth and Position(s) Held with the Trust | | Trustee and/ or Officer Since | | Principal Occupation(s) During Past 5 Years | | Number of Funds in Fund Complex Overseen by Trustee | | Other Directorship(s) Held by Trustee During Past 5 Years |
| Independent Trustees—(continued) |
Suzanne H. Woolsey — 1941 Trustee | | 2014 | | Chief Executive Officer of Woolsey Partners LLC | | 145 | | Emeritus Chair of the Board of Trustees of the Institute for Defense Analyses; Trustee of Colorado College; Trustee of California Institute of Technology; Prior to 2014, Director of Fluor Corp.; Prior to 2010, Trustee of the German Marshall Fund of the United States; Prior to 2010 Trustee of the Rocky Mountain Institute |
| Other Officers | | | | | | | | |
Russell C. Burk — 1958
Senior Vice President and Senior Officer | | 2005 | | Senior Vice President and Senior Officer, The Invesco Funds | | N/A | | N/A |
John M. Zerr — 1962
Senior Vice President, Chief Legal Officer and Secretary | | 2006 | | Director, Senior Vice President, Secretary and General Counsel, Invesco Management Group, Inc. (formerly known as Invesco Aim Management Group, Inc.) and Van Kampen Exchange Corp.; Senior Vice President, Invesco Advisers, Inc. (formerly known as Invesco Institutional (N.A.), Inc.) (registered investment adviser); Senior Vice President and Secretary, Invesco Distributors, Inc. (formerly known as Invesco Aim Distributors, Inc.); Director, Vice President and Secretary, Invesco Investment Services, Inc. (formerly known as Invesco Aim Investment Services, Inc.) and IVZ Distributors, Inc. (formerly known as INVESCO Distributors, Inc.); Director and Vice President, INVESCO Funds Group, Inc.; Senior Vice President, Chief Legal Officer and Secretary, The Invesco Funds; Managing Director, Invesco PowerShares Capital Management LLC; Director, Secretary and General Counsel, Invesco Investment Advisers LLC (formerly known as Van Kampen Asset Management); Secretary and General Counsel, Invesco Capital Markets, Inc. (formerly known as Van Kampen Funds Inc.) and Chief Legal Officer, PowerShares Exchange-Traded Fund Trust, PowerShares Exchange-Traded Fund Trust II, PowerShares India Exchange-Traded Fund Trust, PowerShares Actively Managed Exchange-Traded Fund Trust, and PowerShares Actively Managed Exchange-Traded Commodity Fund Trust Formerly: Director and Vice President, Van Kampen Advisors Inc.; Director, Vice President, Secretary and General Counsel, Van Kampen Investor Services Inc.; Director, Invesco Distributors, Inc. (formerly known as Invesco Aim Distributors, Inc.); Director, Senior Vice President, General Counsel and Secretary, Invesco Aim Advisers, Inc. and Van Kampen Investments Inc.; Director, Vice President and Secretary, Fund Management Company; Director, Senior Vice President, Secretary, General Counsel and Vice President, Invesco Aim Capital Management, Inc.; Chief Operating Officer and General Counsel, Liberty Ridge Capital, Inc. (an investment adviser); Vice President and Secretary, PBHG Funds (an investment company) and PBHG Insurance Series Fund (an investment company); Chief Operating Officer, General Counsel and Secretary, Old Mutual Investment Partners (a broker-dealer); General Counsel and Secretary, Old Mutual Fund Services (an administrator) and Old Mutual Shareholder Services (a shareholder servicing center); Executive Vice President, General Counsel and Secretary, Old Mutual Capital, Inc. (an investment adviser); and Vice President and Secretary, Old Mutual Advisors Funds (an investment company) | | N/A | | N/A |
Sheri Morris — 1964
Vice President, Treasurer and Principal Financial Officer | | 2003 | | Vice President, Treasurer and Principal Financial Officer, The Invesco Funds; Vice President, Invesco Advisers, Inc. (formerly known as Invesco Institutional (N.A.), Inc.) (registered investment adviser); and Vice President, PowerShares Exchange-Traded Fund Trust, PowerShares Exchange-Traded Fund Trust II, PowerShares India Exchange-Traded Fund Trust, PowerShares Actively Managed Exchange-Traded Fund Trust, and PowerShares Actively Managed Exchange-Traded Commodity Fund Trust Formerly: Vice President, Invesco Aim Advisers, Inc., Invesco Aim Capital Management, Inc. and Invesco Aim Private Asset Management, Inc.; Assistant Vice President and Assistant Treasurer, The Invesco Funds and Assistant Vice President, Invesco Advisers, Inc., Invesco Aim Capital Management, Inc. and Invesco Aim Private Asset Management, Inc.; and Treasurer, PowerShares Exchange-Traded Fund Trust, PowerShares Exchange-Traded Fund Trust II, PowerShares India Exchange-Traded Fund Trust and PowerShares Actively Managed Exchange-Traded Fund Trust | | N/A | | N/A |
T-3 Invesco Global Market Neutral Fund
Trustees and Officers—(continued)
| | | | | | | | |
Name, Year of Birth and
Position(s) Held with the Trust | | Trustee and/
or Officer Since | | Principal Occupation(s)
During Past 5 Years | | Number of Funds in Fund Complex Overseen by Trustee | | Other Directorship(s) Held by Trustee During Past 5 Years |
| Other Officers—(continued) | | | | | | | | |
Karen Dunn Kelley — 1960
Vice President | | 2003 | | Senior Managing Director, Investments, Invesco Ltd.; Director, Co-President, Co-Chief Executive Officer, and Co-Chairman, Invesco Advisers, Inc. (formerly known as Invesco Institutional (N.A.), Inc.) (registered investment adviser); Chairman, Invesco Senior Secured Management, Inc.; Senior Vice President, Invesco Management Group, Inc. (formerly known as Invesco Aim Management Group, Inc.); Executive Vice President, Invesco Distributors, Inc. (formerly known as Invesco Aim Distributors, Inc.); Director, Invesco Mortgage Capital Inc. and Invesco Management Company Limited; Vice President, The Invesco Funds (other than AIM Treasurer’s Series Trust (Invesco Treasurer’s Series Trust), Short-Term Investments Trust and Invesco Management Trust); and President and Principal Executive Officer, The Invesco Funds (AIM Treasurer’s Series Trust (Invesco Treasurer’s Series Trust), Short-Term Investments Trust and Invesco Management Trust only) Formerly: Director and President, INVESCO Asset Management (Bermuda) Ltd., Director, INVESCO Global Asset Management Limited and INVESCO Management S.A.; Senior Vice President, Van Kampen Investments Inc. and Invesco Advisers, Inc. (formerly known as Invesco Institutional (N.A.), Inc.) (registered investment adviser); Vice President, Invesco Advisers, Inc. (formerly known as Invesco Institutional (N.A.), Inc.); Director of Cash Management and Senior Vice President, Invesco Advisers, Inc. and Invesco Aim Capital Management, Inc.; Director and President, Fund Management Company; Chief Cash Management Officer, Director of Cash Management, Senior Vice President, and Managing Director, Invesco Aim Capital Management, Inc.; Director of Cash Management, Senior Vice President, and Vice President, Invesco Advisers, Inc. and The Invesco Funds (AIM Treasurer’s Series Trust (Invesco Treasurer’s Series Trust), and Short-Term Investments Trust only) | | N/A | | N/A |
Crissie M. Wisdom — 1969 Anti-Money Laundering Compliance Officer | | 2013 | | Anti-Money Laundering Compliance Officer, Invesco Advisers, Inc. (formerly known as Invesco Institutional (N.A.), Inc.) (registered investment adviser), Invesco Capital Markets, Inc. (formerly known as Van Kampen Funds Inc.), Invesco Distributors, Inc., Invesco Investment Services, Inc., Invesco Management Group, Inc., Van Kampen Exchange Corp., The Invesco Funds, and PowerShares Exchange-Traded Fund Trust, PowerShares Exchange-Traded Fund Trust II, PowerShares India Exchange-Traded Fund Trust, PowerShares Actively Managed Exchange-Traded Fund Trust and PowerShares Actively Managed Exchange-Traded Commodity Fund Trust; Anti-Money Laundering Compliance Officer and Bank Secrecy Act Officer, INVESCO National Trust Company and Invesco Trust Company; and Fraud Prevention Manager and Controls and Risk Analysis Manager for Invesco Investment Services, Inc.. | | N/A | | N/A |
Lisa O. Brinkley — 1959 Chief Compliance Officer | | 2015 | | Senior Vice President and Chief Compliance Officer, Invesco Advisers, Inc. (registered investment adviser) (formerly known as Invesco Institutional (N.A., Inc.); and Chief Compliance Officer, The Invesco Funds Formerly: Global Assurance Officer, Invesco Ltd. and Vice President, The Invesco Funds; Chief Compliance Officer, Invesco Distributors, Inc. (formerly known as Invesco Aim Distributors, Inc.), Invesco Investment Services, Inc. (formerly known as Invesco Aim Investment Services, Inc.) and Van Kampen Investor Services Inc.; Senior Vice President, Invesco Management Group, Inc.; Senior Vice President and Chief Compliance Officer, Invesco Advisers, Inc. and The Invesco Funds; Vice President and Chief Compliance Officer, Invesco Aim Capital Management, Inc. and Invesco Distributors, Inc.; Vice President, Invesco Investment Services, Inc. and Fund Management Company. | | N/A | | N/A |
The Statement of Additional Information of the Trust includes additional information about the Fund’s Trustees and is available upon request, without charge, by calling 1.800.959.4246. Please refer to the Fund’s prospectus for information on the Fund’s sub-advisers.
| | | | | | |
Office of the Fund 11 Greenway Plaza, Suite 1000 Houston, TX 77046-1173 | | Investment Adviser Invesco Advisers, Inc. 1555 Peachtree Street, N.E. Atlanta, GA 30309 | | Distributor
Invesco Distributors, Inc. 11 Greenway Plaza, Suite 1000 Houston, TX 77046-1173 | | Auditors PricewaterhouseCoopers LLP 1000 Louisiana Street, Suite 5800 Houston, TX 77002-5678 |
| | | |
| | | | | | |
Counsel to the Fund Stradley Ronon Stevens & Young, LLP 2005 Market Street, Suite 2600 Philadelphia, PA 19103-7018 | | Counsel to the Independent Trustees Goodwin Procter LLP 901 New York Avenue, N.W. Washington, D.C. 20001 | | Transfer Agent Invesco Investment Services, Inc. 11 Greenway Plaza, Suite 1000 Houston, TX 77046-1173 | | Custodian State Street Bank and Trust Company 225 Franklin Street Boston, MA 02110-2801 |
T-4 Invesco Global Market Neutral Fund

Invesco mailing information
Send general correspondence to Invesco Investment Services, Inc., P.O. Box 219078, Kansas City, MO 64121-9078.
Important notice regarding delivery of security holder documents
To reduce Fund expenses, only one copy of most shareholder documents may be mailed to shareholders with multiple accounts at the same address (Householding). Mailing of your shareholder documents may be householded indefinitely unless you instruct us otherwise. If you do not want the mailing of these documents to be combined with those for other members of your household, please contact Invesco Investment Services, Inc. at 800 959 4246 or contact your financial institution. We will begin sending you individual copies for each account within 30 days after receiving your request.
Fund holdings and proxy voting information
The Fund provides a complete list of its holdings four times in each fiscal year, at the quarter ends. For the second and fourth quarters, the lists appear in the Fund’s semiannual and annual reports to shareholders. For the first and third quarters, the Fund files the lists with the Securities and Exchange Commission (SEC) on Form N-Q. The most recent list of portfolio holdings is available at invesco.com/completeqtrholdings. Shareholders can also look up the Fund’s Forms N-Q on the SEC website at sec.gov. Copies of the Fund’s Forms N-Q may be reviewed and copied at the SEC Public Reference Room in Washington, D.C. You can obtain information on the operation of the Public Reference Room, including information about duplicating fee charges, by calling 202 551 8090 or 800 732 0330, or by electronic request at the following email address: publicinfo@sec.gov. The SEC file numbers for the Fund are shown below.
A description of the policies and procedures that the Fund uses to determine how to vote proxies relating to portfolio securities is available without charge, upon request, from our Client Services department at 800 959 4246 or at invesco.com/proxyguidelines. The information is also available on the SEC website, sec.gov.
| | |
Information regarding how the Fund voted proxies related to its portfolio securities during the most recent 12-month period ended June 30 is available at invesco.com/proxysearch. The information is also available on the SEC website, sec.gov. Invesco Advisers, Inc. is an investment adviser; it provides investment advisory services to individual and institutional clients and does not sell securities. Invesco Distributors, Inc. is the US distributor for Invesco Ltd.’s retail mutual funds, exchange-traded funds and institutional money market funds. Both are wholly owned, indirect subsidiaries of Invesco Ltd. | |  |
| | | | |
| SEC file numbers: 811-05426 and 033-19338 | | GMN-AR-1 | | Invesco Distributors, Inc. |
| | | | |
| | |
 | | Annual Report to Shareholders | | October 31, 2015 |
| | |
| | Invesco Global Markets Strategy Fund |
| | Nasdaq: |
| | A: GMSDX n C: GMSEX n R: GMSJX n Y: GMSHX n R5: GMSKX n R6: GMSLX |

Letters to Shareholders
| | |

Philip Taylor | | Dear Shareholders: This annual report includes information about your Fund, including performance data and a complete list of its investments as of the close of the reporting period. Inside is a discussion of how your Fund was managed and the factors that affected its performance during the reporting period. I hope you find this report of interest. The US economy expanded and unemployment declined throughout the reporting period. Continuing low energy prices benefited consumers, but a strong US dollar crimped corporate profits. The US Federal Reserve signaled that it was increasingly likely to raise interest rates, based on generally positive economic data, but uncertainty remained about when it might act. Overseas, the story was much different. Low energy prices hurt the economies of some oil-producing nations, such as Brazil and Russia. During the reporting period, the European Central |
Bank as well as central banks in China and Japan – among other countries – either instituted or maintained extraordinarily accommodative monetary policies in response to economic weakness. Investor uncertainty, such as we saw for much of the reporting period – and market volatility, such as we saw at the end of the reporting period – are unfortunate facts of life when it comes to investing. Some investors use these things as excuses to delay saving and investing for their long-term financial goals. That’s why Invesco encourages investors to work with a professional financial adviser who can stress the importance of starting to save and invest early and the importance of adhering to a disciplined investment plan – when times are good and when they’re uncertain. A financial adviser who knows your unique financial situation, investment goals and risk tolerance can be an invaluable partner as you seek to achieve your financial goals. He or she can offer a long-term perspective when markets are volatile and time-tested advice and guidance when your financial situation or investment goals change. |
Timely information when and where you want it
Invesco’s efforts to help investors achieve their financial objectives include providing individual investors and financial professionals with timely information about the markets, the economy and investing – whenever and wherever they want it.
Our website, invesco.com/us, offers a wide range of market insights and investment perspectives. On the website, you’ll find detailed information about our funds, including prices, performance, holdings and portfolio manager commentaries. You can access information about your account by completing a simple, secure online registration. Click on the “Need to register” link in the “Account Access” box on our homepage to get started.
Invesco’s mobile apps for iPhone® and iPad® (both available free from the App StoreSM) allow you to obtain the same detailed information, monitor your account and create customizable watch lists. Also, they allow you to access investment insights from our investment leaders, market strategists, economists and retirement experts. You can sign up to be alerted when new commentary is added, and you can watch portfolio manager videos and have instant access to Invesco news and updates wherever you may be.
In addition to the resources accessible on our website and through our mobile app, you can obtain timely updates to help you stay informed about the markets, the economy and investing by connecting with Invesco on Twitter, LinkedIn or Facebook. You can access our blog at blog.invesco.us.com. Our goal is to provide you the information you want, when and where you want it.
Have questions?
For questions about your account, feel free to contact an Invesco client services representative at 800 959 4246. For Invesco-related questions or comments, please email me directly at phil@invesco.com.
All of us at Invesco look forward to serving your investment management needs for many years to come. Thank you for investing with us.
Sincerely,

Philip Taylor
Senior Managing Director, Invesco Ltd.
iPhone and iPad are trademarks of Apple Inc., registered in the US and other countries. App Store is a service mark of Apple Inc. Invesco Distributors, Inc. is not affiliated with Apple Inc.
2 Invesco Global Markets Strategy Fund
| | |

Bruce Crockett | | Dear Fellow Shareholders: Among the many important lessons I’ve learned in more than 40 years in a variety of business endeavors is the value of a trusted advocate. As independent chair of the Invesco Funds Board, I can assure you that the members of the Board are strong advocates for the interests of investors in Invesco’s mutual funds. We work hard to represent your interests through oversight of the quality of the investment management services your funds receive and other matters important to your investment, including but not limited to: n Ensuring that Invesco offers a diverse lineup of mutual funds that your financial adviser can use to strive to meet your financial needs as your investment goals change over time. n Monitoring how the portfolio management teams of the Invesco funds are performing in light of changing economic and market conditions. |
| n | | Assessing each portfolio management team’s investment performance within the context of the investment strategy described in the fund’s prospectus. |
| n | | Monitoring for potential conflicts of interests that may impact the nature of the services that your funds receive. |
We believe one of the most important services we provide our fund shareholders is the annual review of the funds’ advisory and sub-advisory contracts with Invesco Advisers and its affiliates. This review is required by the Investment Company Act of 1940 and focuses on the nature and quality of the services Invesco provides as the adviser to the Invesco funds and the reasonableness of the fees that it charges for those services. Each year, we spend months carefully reviewing information received from Invesco and a variety of independent sources, such as performance and fee data prepared by Lipper Inc., an independent, third-party firm widely recognized as a leader in its field. We also meet with our independent legal counsel and other independent advisers to review and help us assess the information that we have received. Our goal is to assure that you receive quality investment management services for a reasonable fee.
I trust the measures outlined above provide assurance that you have a worthy advocate when it comes to choosing the Invesco Funds.
As always, please contact me at bruce@brucecrockett.com with any questions or concerns you may have. On behalf of the Board, we look forward to continuing to represent your interests and serving your needs.
Sincerely,

Bruce L. Crockett
Independent Chair
Invesco Funds Board of Trustees
3 Invesco Global Markets Strategy Fund
Management’s Discussion of Fund Performance
Performance summary
For the fiscal year ended October 31, 2015, Class A shares of Invesco Global Markets Strategy Fund (the Fund), at net asset value (NAV), underperformed the Barclays 3-Month Treasury Bellwether Index, the Fund’s broad market/style-specific benchmark.
Your Fund’s long-term performance appears later in this report.
Fund vs. Indexes
Total returns, 10/31/14 to 10/31/15, at net asset value (NAV). Performance shown does not include applicable contingent deferred sales charges (CDSC) or front-end sales charges, which would have reduced performance.
| | | | | |
Class A Shares | | | | -0.03 | % |
Class C Shares | | | | -0.73 | |
Class R Shares | | | | -0.20 | |
Class Y Shares | | | | 0.33 | |
Class R5 Shares | | | | 0.34 | |
Class R6 Shares | | | | 0.33 | |
Barclays 3-Month Treasury Bellwether Index▼ (Broad Market/Style-Specific Index) | | | | 0.04 | |
| Lipper Absolute Return Funds Index¢ (Peer Group Index) | | | | -1.33 | |
| |
| Source(s): ▼FactSet Research Systems Inc.; ¢Lipper Inc. | | | | | |
Market conditions and your Fund
The fiscal year ended October 31, 2015 began with government bonds performing well as investors sought refuge in high quality government bonds as volatility returned to equities and cyclical commodity prices softened substantially. The Fund’s tactical overweight exposure to bonds and its short positions in commodities, each obtained through the use of derivatives including swaps and futures, contributed to Fund performance through the end of 2014. The ending of a third round of quantitative easing, similar to previous wind-downs of asset purchase programs, reintroduced volatility into equity markets, resulting in price weakness. The decision by OPEC not to curtail production rates of crude oil led to renewed equity market weakness in December, particularly within the energy space, resulting in equities ending 2014 with a whimper rather than a bang. The Fund’s tactical equity overweight exposures, achieved through the use of futures, helped Fund performance in November but hurt Fund performance in December 2014.
Equity markets experienced robust gains for the first quarter of 2015 and the Fund’s tactical overweight equity exposures obtained through futures produced positive results, especially in those markets where central banks were still actively involved in quantitative easing. Tactical overweight positions in bonds, obtained through the use of futures, benefited Fund results as most yields declined over the first quarter, continuing the strong price gains from 2014. Factors supporting lower yields included the continued rout in commodity prices, which also tempered fears of an increase in inflationary pressures, renewed geopolitical tensions in the Middle East, and negotiations regarding Greece’s efforts to secure fresh funding from its international creditors. Commodities continued their decline over the first quarter of 2015 in large part due to the ongoing collapse in energy and agricultural prices. Precious metals experienced a strong price increase in January but the Fund’s tactical underweight exposure to gold and silver through the use of derivatives, including swaps and futures, ended up being a drag on Fund performance.
In the second quarter of 2015, positive equity prices from the beginning of the quarter were largely erased in June as the resurgence of Greek financial troubles and a meaningful correction in Chinese equities triggered a substantial increase in volatility. Tactical overweight exposure to Asian equity markets obtained through the use of futures provided slight gains to the Fund for the quarter. At the same time, European share prices fell and US equities ended the second quarter largely flat. Commodity markets generated mixed results for the second quarter of 2015 with agricultural and energy commodities posting gains, while metals were uniformly weak. Tactical underweight exposure across all commodity complexes through the use of derivatives, including swaps and futures, detracted from overall Fund returns. Government bonds posted large losses for the second quarter of 2015 as threats of an increase in US interest rates, improving economic data out of Europe and rising inflationary readings led to a substantial repricing of the highest quality fixed income markets.
Bonds rebounded in the third quarter of 2015. Nervous investors sought a perceived safe haven from the continuing decline in commodity prices and renewed volatility in equity prices. During the quarter, economic activity and inflation were weak globally, which enhanced the appeal for bonds and allayed concerns of sustained interest rate hikes across major markets. All of the bond markets in which the Fund invested posted gains for the quarter, with overweight exposure to bond markets obtained through the use of futures contributing to Fund performance. Several factors caused weakness in equities during the third quarter of 2015, including the surprise Chinese renminbi devaluation, disappointing gross domestic product data from Europe and Canada, weak manufacturing data from a host of countries and uncertainty regarding the US Federal Reserve’s policy direction. Tactical shifts to equities in the
| | | | | | | | | | |
Target Risk Allocation and Notional Asset Weights as of 10/31/15 | | | | |
| | | | | | | | | | |
By asset class | | | | |
Asset Class | | Target Risk
Allocation* | | Notional Asset
Weights** |
| Equities | | 1.27% | | 22.32% |
| Fixed Income | | 67.91 | | 81.76 |
| Commodities | | 30.82 | | -23.76 |
| Total | | 100.00 | | 80.32 |
| * | Reflects the risk that each asset class is expected to contribute to the overall risk of the Fund as measured by standard deviation and estimates of risk based on historical data. Standard deviation measures the annualized fluctuations (volatility) of monthly returns. |
| ** | Proprietary models determine the Notional Asset Weights necessary to achieve the Target Risk Allocations. Total Notional Asset Weight greater than 100% is achieved through derivatives and other instruments that create leverage. |
| | | | | |
Total Net Assets | | | | $164.1 million | |
|
| 4 Invesco Global Markets Strategy Fund |
Fund’s portfolio detracted from Fund performance due primarily to the Fund’s overweight exposure to all equity markets during August 2015 when volatility returned to equities, outweighing otherwise positive results from equity positioning through the use of futures in July and September 2015. Commodity markets continued to decline during the third quarter of 2015 with energy suffering the steepest price declines, as US stockpiles remained well above the five-year seasonal average and a weakening Chinese economy and an increase in Iranian oil production added to fear of a global oil glut. Given the poor performance of commodities during the quarter, the Fund’s defensive posture toward commodities contributed to Fund performance for the third quarter of 2015.
The fiscal year ended with a strong rebound in equity prices, dampened enthusiasm for perceived safe haven assets like developed government bond markets, and modest declines in broad commodity benchmarks as they continued to be weighed down by US dollar strength, excess supplies and concerns over the Chinese economy. The Fund’s overweight exposure to equities and its strategic long allocations to commodities and equities provided positive performance while tactical exposure to commodities and fixed income detracted from Fund returns for the fiscal year.
Over the reporting period, we believe the Fund’s strategy of allocating long and short exposures through the use of derivatives helped us to navigate global markets. The Fund’s systematic monthly rebalance that involves evaluating stocks, bonds and commodities using near-term valuations, economic environment, and investor positioning resulted in the Fund slightly underperforming its style-specific benchmark for the fiscal year.
Please note that our strategy is principally implemented using derivative instruments, including futures, commodity-linked notes and total return swaps. Therefore, all or most of the performance of the Fund, both positive and negative, can be attributed to these instruments. Derivatives can be a cost-effective way to gain exposure to asset classes. However, derivatives may amplify traditional investment risks through the creation of leverage and may be less liquid than traditional securities.
Thank you for your commitment to Invesco Global Markets Strategy Fund.
The views and opinions expressed in management’s discussion of Fund performance are those of Invesco Advisers, Inc. These views and opinions are subject to change at any time based on factors such as market and economic conditions. These views and opinions may not be relied upon as investment advice or recommendations, or as an offer for a particular security. The information is not a complete analysis of every aspect of any market, country, industry, security or the Fund. Statements of fact are from sources considered reliable, but Invesco Advisers, Inc. makes no representation or warranty as to their completeness or accuracy. Although historical performance is no guarantee of future results, these insights may help you understand our investment management philosophy.
See important Fund and, if applicable, index disclosures later in this report.
| | |
 | | Scott Wolle Chartered Financial Analyst, Portfolio Manager, is lead manager of Invesco Global Markets Strategy Fund. He |
| joined Invesco in 1999. Mr. Wolle earned a BS in finance from Virginia Polytechnic Institute and State University and an MBA from Duke University Fuqua School of Business. |
| |
 | | Mark Ahnrud Chartered Financial Analyst, Portfolio Manager, is lead manager of Invesco Global Markets Strategy Fund. He |
| joined Invesco in 2000. Mr. Ahnrud earned a BS in finance and investments from Babson College and an MBA from Duke University Fuqua School of Business. |
| |
 | | Chris Devine Chartered Financial Analyst, Portfolio Manager, is manager of Invesco Global Markets Strategy Fund. He joined |
| Invesco in 1998. Mr. Devine earned a BA in economics from Wake Forest University and an MBA from the University of Georgia. |
| |
 | | Scott Hixon Chartered Financial Analyst, Portfolio Manager, is manager of Invesco Global Markets Strategy Fund. He joined |
| Invesco in 1994. Mr. Hixon earned a BBA in finance from Georgia Southern University and an MBA from Georgia State University. |
| |
 | | Christian Ulrich Chartered Financial Analyst, Portfolio Manager, is manager of Invesco Global Markets Strategy Fund. He joined |
| Invesco in 2000. Mr. Ulrich earned the equivalent of a BBA from the KV Zurich Business School in Zurich, Switzerland. |
Assisted by the Invesco Global Asset Allocation Team
|
| 5 Invesco Global Markets Strategy Fund |
Your Fund’s Long-Term Performance
Results of a $10,000 Investment – Oldest Share Class(es) Since Inception
Fund and index data from 9/26/12
Past performance cannot guarantee comparable future results.
The data shown in the chart include reinvested distributions, applicable sales charges and Fund expenses including management fees. Index results include reinvested dividends, but they do not reflect sales charges. Performance of the peer group, if applicable, reflects fund expenses and management fees; performance of a market index does not. Performance shown in the chart and table(s) does not reflect deduction of taxes a shareholder would pay on Fund distributions or sale of Fund shares.
|
| 6 Invesco Global Markets Strategy Fund |
| | | | | |
| Average Annual Total Returns |
| As of 10/31/15, including maximum applicable sales charges | |
| |
Class A Shares | | | | | |
Inception | | | | 0.32 | % |
1 Year | | | | -5.50 | |
| |
Class C Shares | | | | | |
Inception | | | | 1.44 | % |
1 Year | | | | -1.70 | |
| |
Class R Shares | | | | | |
Inception | | | | 1.96 | % |
1 Year | | | | -0.20 | |
| |
Class Y Shares | | | | | |
Inception (9/26/12) | | | | 2.45 | % |
1 Year | | | | 0.33 | |
| |
Class R5 Shares | | | | | |
Inception | | | | 2.49 | % |
1 Year | | | | 0.34 | |
| |
Class R6 Shares | | | | | |
Inception | | | | 2.45 | % |
1 Year | | | | 0.33 | |
On August 28, 2013, Class H1 shares converted to Class Y shares.
Class A shares incepted on August 28, 2013. Performance shown prior to that date is that of Class H1 shares and includes the 12b-1 fees applicable to Class H1 shares.
Class C shares incepted on August 28, 2013. Performance shown prior to that date is that of Class H1 shares and includes the 12b-1 fees applicable to Class H1 shares.
Class R shares incepted on August 28, 2013. Performance shown prior to that date is that of Class H1 shares and includes the 12b-1 fees applicable to Class H1 shares.
Class R5 shares incepted on August 28, 2013. Performance shown prior to that date is that of Class H1 shares and includes the 12b-1 fees applicable to Class H1 shares.
Class R6 shares incepted on August 28, 2013. Performance shown prior to that date is that of Class H1 shares and includes the 12b-1 fees applicable to Class H1 shares.
The performance data quoted represent past performance and cannot guarantee comparable future results; current performance may be lower or higher. Please visit invesco.com/performance for the most recent month-end performance.
| | | | | |
| Average Annual Total Returns |
| As of 9/30/15, the most recent calendar quarter end, including maximum applicable sales charges | |
| |
Class A Shares | | | | | |
Inception | | | | -0.02 | % |
1 Year | | | | -6.03 | |
| |
Class C Shares | | | | | |
Inception | | | | 1.16 | % |
1 Year | | | | -2.23 | |
| |
Class R Shares | | | | | |
Inception | | | | 1.70 | % |
1 Year | | | | -0.83 | |
| |
Class Y Shares | | | | | |
Inception (9/26/12) | | | | 2.17 | % |
1 Year | | | | -0.30 | |
| |
Class R5 Shares | | | | | |
Inception | | | | 2.17 | % |
1 Year | | | | -0.40 | |
| |
Class R6 Shares | | | | | |
Inception | | | | 2.17 | % |
1 Year | | | | -0.30 | |
Performance figures reflect reinvested distributions, changes in net asset value and the effect of the maximum sales charge unless otherwise stated. Investment return and principal value will fluctuate so that you may have a gain or loss when you sell shares.
The net annual Fund operating expense ratio set forth in the most recent Fund prospectus as of the date of this report for Class A, Class C, Class R, Class Y, Class R5 and Class R6 shares was 1.80%, 2.55%, 2.05%, 1.55%, 1.55% and 1.55%, respectively.1,2 The total annual Fund operating expense ratio set forth in the most recent Fund prospectus as of the date of this report for Class A, Class C, Class R, Class Y, Class R5 and Class R6 shares was 2.15%, 2.90%, 2.40%, 1.90%, 1.78% and 1.78%, respectively. The expense ratios presented above may vary from the expense ratios presented in other sections of this report that are based on expenses incurred during the period covered by this report.
Class A share performance reflects the maximum 5.50% sales charge, and Class C share performance reflects the applicable contingent deferred sales charge (CDSC) for the period involved. The CDSC on Class C shares is 1% for the first year after purchase. Class R,
Class Y, Class R5 and Class R6 shares do not have a front-end sales charge or a CDSC; therefore, performance is at net asset value.
The performance of the Fund’s share classes will differ primarily due to different sales charge structures and class expenses.
Fund performance reflects any applicable fee waivers and/or expense reimbursements. Had the adviser not waived fees and/or reimbursed expenses currently or in the past, returns would have been lower. See current prospectus for more information.
| 1 | Total annual Fund operating expenses after any contractual fee waivers and/or expense reimbursements by the adviser in effect through at least February 28, 2017. See current prospectus for more information. |
| 2 | Total annual Fund operating expenses after any contractual fee waivers and/or expense reimbursements by the adviser in effect through at least June 30, 2017. See current prospectus for more information. |
|
| 7 Invesco Global Markets Strategy Fund |
Invesco Global Markets Strategy Fund’s investment objective is to seek a positive absolute return over a complete economic and market cycle.
| n | | Unless otherwise stated, information presented in this report is as of October 31, 2015, and is based on total net assets. |
| n | | Unless otherwise noted, all data provided by Invesco. |
| n | | To access your Fund’s reports/prospectus, visit invesco.com/fundreports. |
About share classes
| n | | Class R shares are generally available only to employer sponsored retirement and benefit plans. Please see the prospectus for more information. |
| n | | Class Y shares are available only to certain investors. Please see the prospectus for more information. |
| n | | Class R5 shares and Class R6 shares are primarily intended for employer sponsored retirement and benefit plans that meet certain standards and for institutional investors. Please see the prospectus for more information. |
Principal risks of investing in the Fund
| n | | Changing fixed income market conditions risk. The current low interest rate environment was created in part by the Federal Reserve Board (FRB) and certain foreign central banks keeping the federal funds and equivalent foreign rates at or near zero. There is a risk that interest rates will rise when the FRB and central banks raise these rates. This risk is heightened due to the FRB’s quantitative easing program and the “tapering” of other similar foreign central bank actions. This eventual increase in the federal funds and equivalent foreign rates may expose fixed income markets to heightened volatility and reduced liquidity for certain fixed income investments, particularly those with longer maturities. In addition, decreases in fixed income dealer market-making capacity may also potentially lead to heightened volatility and reduced liquidity in the fixed income markets. As a result, the value of the Fund’s investments and share price may decline. Changes in central bank policies could also result in higher than normal shareholder redemptions, which could potentially increase portfolio turnover and the Fund’s transaction costs. |
| n | | Commodities tax risk. The tax treatment of commodity-linked derivative instruments may be adversely affected by changes in legislation, regulations or other legally binding authority. If, as a |
| | | result of any such adverse action, the income of the Fund from certain commodity-linked derivatives was treated as non-qualifying income, the Fund might fail to qualify as a regulated investment company and be subject to federal income tax at the Fund level. The Internal Revenue Service has issued a number of private letter rulings to other mutual funds, including to another Invesco fund (upon which only the fund that received the private letter ruling can rely), which indicate that income from a fund’s investment in certain commodity linked notes and a wholly owned foreign subsidiary that invests in commodity-linked derivatives, such as the Subsidiary, constitutes qualifying income. However, the Internal Revenue Service suspended issuance of any further private letter rulings in July 2011 pending a review of its position. Should the Internal Revenue Service issue guidance, or Congress enact legislation, that adversely affects the tax treatment of the Fund’s use of commodity-linked notes or the Subsidiary (which guidance might be applied to the Fund retroactively), it could limit the Fund’s ability to pursue its investment strategy and the Fund might not qualify as a regulated investment company for one or more years. In this event, the Fund’s Board of Trustees may authorize a significant change in investment strategy or Fund liquidation. The Fund also may incur transaction and other costs to comply with any new or additional guidance from the Internal Revenue Service. |
| n | | Commodity-linked notes risk. The Fund’s investments in commodity-linked notes may involve substantial risks, including risk of loss of a significant portion of their principal value. In addition to risks associated with the underlying commodities, they may be subject to additional special risks, such as the lack of a secondary trading market and temporary price distortions due to speculators and/or the continuous rolling over of futures contracts underlying the notes. |
| | | Commodity-linked notes are also subject to counterparty risk, which is the risk that the other party to the contract will not fulfill its contractual obligation to complete the transaction with the Fund. |
| n | | Commodity risk. The Fund’s significant investment exposure to the commodities markets and/or a particular sector of the commodities markets, which may subject the Fund to greater volatility than investments in traditional securities, such as stocks and bonds. The commodities markets may fluctuate widely based on a variety of factors, including changes in overall market movements, domestic and foreign political and economic events and policies, war, acts of terrorism, changes in domestic or foreign interest rates and/ or investor expectations concerning interest rates, domestic and foreign inflation rates and investment and trading activities of mutual funds, hedge funds and commodities funds. Prices of various commodities may also be affected by factors such as drought, floods, weather, livestock disease, embargoes, tariffs and other regulatory developments. The prices of commodities can also fluctuate widely due to supply and demand disruptions in major producing or consuming regions. Because the Fund’s performance is linked to the performance of potentially volatile commodities, investors should be willing to assume the risks of potentially significant fluctuations in the value of the Fund’s shares. |
| n | | Correlation risk. Changes in the value of two investments or asset classes may not track or offset each other in the manner anticipated by the portfolio managers. Because the Fund’s investment strategy seeks to balance risk across three asset classes and, within each asset class, to balance risk across different countries and commodities, to the extent either the three asset classes or the selected countries and commodities are correlated in a way not anticipated by the portfolio managers the Fund’s risk allocation process may not succeed in achieving its investment objective. |
|
This report must be accompanied or preceded by a currently effective Fund prospectus, which contains more complete information, including sales charges and expenses. Investors should read it carefully before investing. |
|
|
| NOT FDIC INSURED | MAY LOSE VALUE | NO BANK GUARANTEE |
|
| 8 Invesco Global Markets Strategy Fund |
| n | | Credit risk. The issuer of instruments in which the Fund invests may be unable to meet interest and/or principal payments, thereby causing its instruments to decrease in value and lowering the issuer’s credit rating. |
| n | | Currency/exchange rate risk. The dollar value of the Fund’s foreign investments will be affected by changes in the exchange rates between the dollar and the currencies in which those investments are traded. |
| n | | Derivatives risk. The value of a derivative instrument depends largely on (and is derived from) the value of an underlying security, currency, commodity, interest rate, index or other asset (each referred to as an underlying asset). In addition to risks relating to the underlying assets, the use of derivatives may include other, possibly greater, risks, including counterparty, leverage and liquidity risks. Counterparty risk is the risk that the counterparty to the derivative contract will default on its obligation to pay the Fund the amount owed or otherwise perform under the derivative contract. Derivatives create leverage risk because they do not require payment up front equal to the economic exposure created by owning the derivative. As a result, an adverse change in the value of the underlying asset could result in the Fund sustaining a loss that is substantially greater than the amount invested in the derivative, which may make the Fund’s returns more volatile and increase the risk of loss. Derivative instruments may also be less liquid than more traditional investments and the Fund may be unable to sell or close out its derivative positions at a desirable time or price. This risk may be more acute under adverse market conditions, during which the Fund may be most in need of liquidating its derivative positions. Derivatives may also be harder to value, less tax efficient and subject to changing government regulation that could impact the Fund’s ability to use certain derivatives or their cost. Also, derivatives used for hedging or to gain or limit exposure to a particular market segment may not provide the expected benefits, particularly during adverse market conditions. These |
| | risks are greater for the Fund than most other mutual funds because the Fund will implement its investment strategy primarily through derivative instruments rather than direct investments in stocks and bonds. |
| n | | Developing/emerging markets securities risk. The prices of securities issued by foreign companies and governments located in developing/emerging markets countries may be affected more negatively by inflation, devaluation of their currencies, higher transaction costs, delays in settlement, adverse political developments, the introduction of capital controls, withholding taxes, nationalization of private assets, expropriation, social unrest, war or lack of timely information than those in developed countries. |
| n | | Exchange-traded funds risk. An investment by the Fund in exchange-traded funds generally presents the same primary risks as an investment in a mutual fund. In addition, an exchange-traded fund may be subject to the following: (1) a discount of the exchange-traded fund’s shares to its net asset value; (2) failure to develop an active trading market for the exchange-traded fund’s shares; (3) the listing exchange halting trading of the exchange-traded fund’s shares; (4) failure of the exchange-traded fund’s shares to track the referenced asset; and (5) holding troubled securities in the referenced index or basket of investments. Investments in exchange-traded funds may involve duplication of management fees and certain other expenses, as the Fund indirectly bears its proportionate share of any expenses paid by the exchange-traded funds in which it invests. Further, certain of the exchange-traded funds in which the Fund may invest are leveraged. The more the Fund invests in such leveraged exchange-traded funds, the more this leverage will magnify any losses on those investments. |
| n | | Exchange-traded notes risk. Exchange-traded notes are subject to credit risk, including the credit risk of the issuer, and the value of the exchange-traded note may drop due to a downgrade in the issuer’s credit rating, despite the underlying market benchmark or strategy remaining unchanged. The value of |
| | an exchange-traded note may also be influenced by time to maturity, level of supply and demand for the exchange-traded note, volatility and lack of liquidity in the underlying market, changes in the applicable interest rates, changes in the issuer’s credit rating, and economic, legal, political, or geographic events that affect the referenced underlying market or strategy. Exchange-traded notes are also subject to the risk that the other party to the contract will not fulfill its contractual obligations, which may cause losses or additional costs to the Fund. |
| n | | Foreign government debt risk. Investments in foreign government debt obligations involve certain risks in addition to those relating to foreign securities or debt securities generally. The issuer of the debt or the governmental authorities that control the repayment of the debt may be unable or unwilling to repay principal or interest when due in accordance with the terms of such debt, and the Fund may have limited recourse in the event of a default against the defaulting government. Without the approval of debt holders, some governmental debtors have in the past been able to reschedule or restructure their debt payments or declare moratoria on payments. |
| n | | Foreign securities risk. The Fund’s foreign investments may be affected by changes in a foreign country’s exchange rates, political and social instability, changes in economic or taxation policies, difficulties when enforcing obligations, decreased liquidity, and increased volatility. Foreign companies may be subject to less regulation resulting in less publicly available information about the companies. |
| n | | Interest rate risk. Interest rate risk refers to the risk that bond prices generally fall as interest rates rise; conversely, bond prices generally rise as interest rates fall. Specific bonds differ in their sensitivity to changes in interest rates depending on their individual characteristics, including duration. |
| n | | Liquidity risk. The Fund may hold illiquid securities that it is unable to sell at the preferred time or price and could lose its entire investment in such securities. The Fund’s significant use of derivative |
|
| 9 Invesco Global Markets Strategy Fund |
| | instruments may cause liquidity risk to be greater than other mutual funds that invest in more traditional assets such as stocks and bonds, which trade on markets with more market participants. |
| n | | Management risk. The investment techniques and risk analysis used by the Fund’s portfolio managers may not produce the desired results. Because the Fund’s investment process relies heavily on its asset allocation process, market movements that are counter to the portfolio managers’ expectations may have a significant adverse effect on the Fund’s net asset value. Further, the portfolio managers’ use of short derivative positions and instruments that provide economic leverage increases the volatility of the Fund’s net asset value, which increases the potential of greater losses that may cause the Fund to liquidate positions when it may not be advantageous to do so. |
| n | | Market risk. The prices of and the income generated by the Fund’s securities may decline in response to, among other things, investor sentiment, general economic and market conditions, regional or global instability, and currency and interest rate fluctuations. |
| n | | Non-diversification risk. The Fund is non-diversified and can invest a greater portion of its assets in a small number of issuers or a single issuer. A change in the value of the issuer could affect the value of the Fund more than if it was a diversified fund. |
| n | | Subsidiary risk. By investing in the Subsidiary, the Fund is indirectly exposed to risks associated with the Subsidiary’s investments. The Subsidiary is not registered under the Investment Company Act of 1940, as amended (1940 Act), and, except as otherwise noted in this prospectus is not subject to the investor protections of the 1940 Act. Changes in the laws of the United States and/or the Cayman Islands, under which the Fund and the Subsidiary, respectively, are organized, could result in the inability of the Fund and/or the Subsidiary to operate as described in this prospectus and could negatively affect the Fund and its shareholders. |
| n | | US government obligations risk. The Fund may invest in obligations issued by US government agencies and instrumentalities that may receive varying levels of support from the government, which could affect the Fund’s ability to recover should they default. |
| n | | Volatility risk. The Fund may have investments that appreciate or decrease significantly in value over short periods of time. This may cause the Fund’s net asset value per share to experience significant increases or declines in value over short periods of time. |
About indexes used in this report
| n | | The Barclays 3-Month Treasury Bellwether Index measures the performance of Treasury bills with maturities of less than three months. |
| n | | The Lipper Absolute Return Funds Index is an unmanaged index considered representative of absolute return funds tracked by Lipper. |
| n | | The Fund is not managed to track the performance of any particular index, including the index(es) described here, and consequently, the performance of the Fund may deviate significantly from the performance of the index(es). |
| n | | A direct investment cannot be made in an index. Unless otherwise indicated, index results include reinvested dividends, and they do not reflect sales charges. Performance of the peer group, if applicable, reflects fund expenses; performance of a market index does not. |
Other information
| n | | The returns shown in management’s discussion of Fund performance are based on net asset values (NAVs) calculated for shareholder transactions. Generally accepted accounting principles require adjustments to be made to the net assets of the Fund at period end for financial reporting purposes, and as such, the NAVs for shareholder transactions and the returns based on those NAVs may differ from the NAVs and returns reported in the Financial Highlights. |
|
| 10 Invesco Global Markets Strategy Fund |
Consolidated Schedule of Investments
October 31, 2015
| | | | | | | | | | | | | | | | |
| | | Interest
Rate | | | Maturity
Date | | | Principal
Amount | | | Value | |
U.S. Treasury Securities–36.82% | | | | | | | | | | | | | | | | |
| U.S. Treasury Bills–19.51%(a) | | | | | | | | | | | | | | | | |
U.S. Treasury Bills | | | 0.08 | % | | | 01/07/16 | | | $ | 5,000,000 | | | $ | 4,999,449 | |
U.S. Treasury Bills(b)(c) | | | 0.08 | % | | | 01/07/16 | | | | 800,000 | | | | 799,912 | |
U.S. Treasury Bills(b) | | | 0.10 | % | | | 01/14/16 | | | | 7,500,000 | | | | 7,498,858 | |
U.S. Treasury Bills(b)(c) | | | 0.10 | % | | | 01/14/16 | | | | 1,200,000 | | | | 1,199,817 | |
U.S. Treasury Bills(b) | | | 0.13 | % | | | 01/21/16 | | | | 7,000,000 | | | | 6,998,988 | |
U.S. Treasury Bills(b)(c) | | | 0.13 | % | | | 01/21/16 | | | | 1,120,000 | | | | 1,119,838 | |
U.S. Treasury Bills | | | 0.14 | % | | | 01/28/16 | | | | 4,640,000 | | | | 4,639,158 | |
U.S. Treasury Bills(b)(c) | | | 0.14 | % | | | 01/28/16 | | | | 770,000 | | | | 769,860 | |
U.S. Treasury Bills | | | 0.24 | % | | | 03/03/16 | | | | 3,440,000 | | | | 3,438,950 | |
U.S. Treasury Bills(c) | | | 0.24 | % | | | 03/03/16 | | | | 560,000 | | | | 559,829 | |
| | | | | 32,024,659 | |
| | | | |
| U.S. Treasury Notes–17.31%(d) | | | | | | | | | | | | | | | | |
U.S. Treasury Notes | | | 0.07 | % | | | 01/31/16 | | | | 5,500,000 | | | | 5,500,358 | |
U.S. Treasury Notes(b) | | | 0.07 | % | | | 01/31/16 | | | | 910,000 | | | | 910,059 | |
U.S. Treasury Notes | | | 0.09 | % | | | 04/30/16 | | | | 16,380,000 | | | | 16,382,029 | |
U.S. Treasury Notes(c)(e) | | | 0.09 | % | | | 04/30/16 | | | | 2,695,000 | | | | 2,695,334 | |
U.S. Treasury Notes | | | 0.09 | % | | | 07/31/16 | | | | 2,500,000 | | | | 2,500,231 | |
U.S. Treasury Notes(c) | | | 0.09 | % | | | 07/31/16 | | | | 410,000 | | | | 410,038 | |
| | | | | 28,398,049 | |
Total U.S. Treasury Securities (Cost $60,415,398) | | | | | | | 60,422,708 | |
| | |
| | | | Shares | | | | |
Money Market Funds–63.40% | | | | | | | | | | | | | | | | |
Liquid Assets Portfolio–Institutional Class, 0.16%(f) | | | | 37,067,541 | | | | 37,067,541 | |
Premier Portfolio–Institutional Class, 0.12%(f) | | | | 37,067,542 | | | | 37,067,542 | |
STIC (Global Series) PLC–U.S. Dollar Liquidity Portfolio (Ireland)–Institutional Class, 0.11%(f) | | | | 29,905,570 | | | | 29,905,570 | |
Total Money Market Funds (Cost $104,040,653) | | | | | | | 104,040,653 | |
TOTAL INVESTMENTS–100.22% (Cost $164,456,051) | | | | 164,463,361 | |
OTHER ASSETS LESS LIABILITIES–(0.22)% | | | | (358,350 | ) |
NET ASSETS–100.00% | | | | | | | | | | | | | | $ | 164,105,011 | |
| | | | | | | | | | | | | | | | | | | | |
| Open Futures Contracts | |
| Futures Contracts | | Type of
Contract | | | | Number of
Contracts | | | Expiration
Month | | | Notional
Value | | | Unrealized
Appreciation
(Depreciation) | |
Brent Crude(c) | | Short | | | | | 61 | | | | March-2016 | | | $ | (3,155,530 | ) | | $ | 65,728 | |
Coffee(c) | | Short | | | | | 81 | | | | December-2015 | | | | (3,673,856 | ) | | | 328,544 | |
Corn(c) | | Short | | | | | 13 | | | | December-2015 | | | | (248,463 | ) | | | (5,323 | ) |
Cotton No.2(c) | | Short | | | | | 19 | | | | December-2015 | | | | (601,540 | ) | | | (8,642 | ) |
Gas Oil(c) | | Short | | | | | 78 | | | | December-2015 | | | | (3,588,000 | ) | | | 621,793 | |
Gasoline Reformulated Blendstock Oxygenate Blending(c) | | Short | | | | | 4 | | | | December-2015 | | | | (230,429 | ) | | | (14,751 | ) |
Globex Reformulated Blendstock Gasoline Physical(c) | | Short | | | | | 30 | | | | December-2015 | | | | (1,728,216 | ) | | | (113,348 | ) |
Heating Oil(c) | | Short | | | | | 57 | | | | April-2016 | | | | (3,766,480 | ) | | | (46,397 | ) |
Natural Gas(c) | | Short | | | | | 108 | | | | December-2015 | | | | (2,506,680 | ) | | | 790,186 | |
Natural Gas(c) | | Short | | | | | 14 | | | | December-2016 | | | | (400,260 | ) | | | 20,357 | |
Silver(c) | | Short | | | | | 3 | | | | December-2015 | | | | (233,505 | ) | | | 125 | |
See accompanying Notes to Consolidated Financial Statements which are an integral part of the financial statements.
11 Invesco Global Markets Strategy Fund
| | | | | | | | | | | | | | | | | | | | |
| Open Futures Contracts–(continued) | |
| Futures Contracts | | Type of
Contract | | | | Number of
Contracts | | | Expiration
Month | | | Notional
Value | | | Unrealized
Appreciation
(Depreciation) | |
Soybean(c) | | Short | | | | | 64 | | | | July-2016 | | | $ | (2,880,800 | ) | | $ | (18,918 | ) |
Soybean Oil(c) | | Short | | | | | 226 | | | | December-2015 | | | | (3,823,920 | ) | | | (237,862 | ) |
Wheat(c) | | Short | | | | | 52 | | | | December-2015 | | | | (1,357,200 | ) | | | (64,030 | ) |
WTI Crude(c) | | Short | | | | | 71 | | | | December-2015 | | | | (3,307,890 | ) | | | (115,461 | ) |
Subtotal — Commodity Risk | | | | | | | | | | | | | | | | | | $ | 1,202,001 | |
| | | | | | |
Australia 10 Year Bonds | | Long | | | | | 211 | | | | December-2015 | | | $ | 19,464,287 | | | $ | 160,257 | |
Canada 10 Year Bonds | | Long | | | | | 229 | | | | December-2015 | | | | 24,603,885 | | | | (462,318 | ) |
Euro Bonds | | Long | | | | | 139 | | | | December-2015 | | | | 24,030,853 | | | | 371,397 | |
Japanese 10 Year Bonds | | Long | | | | | 18 | | | | December-2015 | | | | 22,160,272 | | | | 114,771 | |
Long Gilt | | Long | | | | | 139 | | | | December-2015 | | | | 25,235,026 | | | | (54,524 | ) |
U.S. Treasury 20 Year Bonds | | Long | | | | | 141 | | | | December-2015 | | | | 22,057,688 | | | | 168,910 | |
Subtotal — Interest Rate Risk | | | | | | | | | | | | | | | | | | $ | 298,493 | |
| | | | | | |
Dow Jones EURO STOXX 50 Index | | Long | | | | | 87 | | | | December-2015 | | | $ | 3,255,783 | | | $ | 216,224 | |
E-Mini S&P 500 Index | | Long | | | | | 49 | | | | December-2015 | | | | 5,080,565 | | | | 411,412 | |
FTSE 100 Index | | Long | | | | | 59 | | | | December-2015 | | | | 5,749,064 | | | | 193,637 | |
Hang Seng Index | | Long | | | | | 42 | | | | November-2015 | | | | 6,146,156 | | | | (94,748 | ) |
Russell 2000 Index Mini | | Long | | | | | 90 | | | | December-2015 | | | | 10,424,700 | | | | 452,540 | |
Tokyo Stock Price Index | | Long | | | | | 63 | | | | December-2015 | | | | 8,136,695 | | | | 626,027 | |
Subtotal — Equity Risk | | | | | | | | | | | | | | | | | | $ | 1,805,092 | |
Total Futures Contracts | | | | | | | | | | | | | | | | | | $ | 3,305,586 | |
|
| Open Over-The-Counter Total Return Swap Agreements | |
| Swap Agreements | | Type of
Contract | | Counterparty | | Number of
Contracts | | | Termination
Date | | | Notional
Value | | | Unrealized
Appreciation
(Depreciation) | |
Pay a floating rate equal to the Barclays Commodity Strategy 1452 Excess Return Index (Copper) and pay the product of (i) 0.33% of the Notional Amount multiplied by (ii) days in the period divided by 365(c) | | Short | | Barclays Bank
PLC | | | 1,700 | | | | October-2016 | | | $ | (721,401 | ) | | $ | 7,987 | |
Pay a floating rate equal to the Barclays Capital Soymeal S2 Nearby Excess Return Index and pay the product of (i) 0.30% of the Notional Amount multiplied by (ii) days in the period divided by 365(c) | | Short | | Barclays Bank
PLC | | | 1,160 | | | | January-2016 | | | | (1,208,230 | ) | | | 36,939 | |
Pay a floating rate equal to the CIBC Silver Index and pay the product of (i) 0.11% of the Notional Amount multiplied by (ii) days in the period divided by 365(c) | | Short | | Canadian Imperial
Bank of
Commerce | | | 9,300 | | | | February-2016 | | | | (878,871 | ) | | | 18,785 | |
Receiving a return equal to the S&P GSCI Sugar Excess Return A141 Strategy and pay the product of (i) 0.37% of the Notional Amount multiplied by (ii) days in the period divided by 365(c) | | Long | | Goldman Sachs
International | | | 1,600 | | | | March-2016 | | | | 324,289 | | | | 12,526 | |
Pay a floating rate equal to the S&P GSCI Corn Excess Return AB44 Strategy and pay the product of (i) 0.15% of the Notional Amount multiplied by (ii) days in the period divided by 365(c) | | Short | | Goldman Sachs
International | | | 8,700 | | | | October-2016 | | | | (302,096 | ) | | | 10,305 | |
Pay a floating rate equal to the S&P GSCI Cotton Excess Return AB31 Strategy and pay the product of (i) 0.20% of the Notional Amount multiplied by (ii) days in the period divided by 365(c) | | Short | | Goldman Sachs
International | | | 78,900 | | | | October-2016 | | | | (2,741,256 | ) | | | (46,462 | ) |
See accompanying Notes to Consolidated Financial Statements which are an integral part of the financial statements.
12 Invesco Global Markets Strategy Fund
| | | | | | | | | | | | | | | | | | | | |
| Open Over-The-Counter Total Return Swap Agreements–(continued) | |
| Swap Agreements | | Type of
Contract | | Counterparty | | Number of
Contracts | | | Termination
Date | | | Notional
Value | | | Unrealized
Appreciation
(Depreciation) | |
Receiving a return equal to the S&P GSCI Gold Index Excess Return and pay the product of (i) 0.09% of the Notional Amount multiplied by (ii) days in the period divided by 365(c) | | Long | | JPMorgan Chase
Bank, N.A. | | | 1,600 | | | | October-2016 | | | $ | 155,965 | | | $ | (3,304 | ) |
Receiving a return equal to the S&P GSCI Aluminum Dynamic Roll Excess Return Index and pay the product of (i) 0.38% of the Notional Amount multiplied by (ii) days in the period divided by 365(c) | | Short | | Morgan Stanley
Capital Services
LLC | | | 23,050 | | | | October-2016 | | | | (2,044,693 | ) | | | 127,064 | |
Total Swap Agreements — Commodity Risk | | | | | | | | | | | | | | | | | | $ | 163,840 | |
Notes to Consolidated Schedule of Investments:
| (a) | Security traded on a discount basis. The interest rate shown represents the discount rate at the time of purchase by the Fund. |
| (b) | All or a portion of the value was pledged as collateral to cover margin requirements for open futures contracts. See Note 1K and Note 4. |
| (c) | The investment is owned by the Subsidiary. See Note 5. |
| (d) | Interest or dividend rate is redetermined periodically. Rate shown is the rate in effect on October 31, 2015. |
| (e) | All or a portion of the value was designated as collateral for swap agreements. See Note 1L and Note 4. |
| (f) | The money market fund and the Fund are affiliated by having the same investment adviser. The rate shown is the 7-day SEC standardized yield as of October 31, 2015. |
See accompanying Notes to Consolidated Financial Statements which are an integral part of the financial statements.
13 Invesco Global Markets Strategy Fund
Consolidated Statement of Assets and Liabilities
October 31, 2015
| | | | |
Assets: | |
Investments, at value (Cost $60,415,398) | | $ | 60,422,708 | |
Investments in affiliated money market funds, at value and cost | | | 104,040,653 | |
Total investments, at value (Cost $164,456,051) | | | 164,463,361 | |
Receivable for: | | | | |
Fund shares sold | | | 195,215 | |
Dividends and interest | | | 18,918 | |
Fund expenses absorbed | | | 17,343 | |
Swaps receivables — OTC | | | 1,101 | |
Investment for trustee deferred compensation and retirement plans | | | 12,192 | |
Unrealized appreciation on swap agreements — OTC | | | 213,606 | |
Other assets | | | 30,497 | |
Total assets | | | 164,952,233 | |
|
Liabilities: | |
Payable for: | | | | |
Fund shares reacquired | | | 303,893 | |
Variation margin — futures | | | 370,145 | |
Swaps payables — OTC | | | 414 | |
Accrued fees to affiliates | | | 41,422 | |
Accrued trustees’ and officers’ fees and benefits | | | 1,785 | |
Accrued other operating expenses | | | 67,028 | |
Trustee deferred compensation and retirement plans | | | 12,769 | |
Unrealized depreciation on swap agreements — OTC | | | 49,766 | |
Total liabilities | | | 847,222 | |
Net assets applicable to shares outstanding | | $ | 164,105,011 | |
|
Net assets consist of: | |
Shares of beneficial interest | | $ | 163,585,079 | |
Undistributed net investment income (loss) | | | 3,078,977 | |
Undistributed net realized gain (loss) | | | (6,035,781 | ) |
Net unrealized appreciation | | | 3,476,736 | |
| | | $ | 164,105,011 | |
| | | | |
Net Assets: | |
Class A | | $ | 7,418,169 | |
Class C | | $ | 8,154,957 | |
Class R | | $ | 24,183 | |
Class Y | | $ | 47,739,637 | |
Class R5 | | $ | 9,268 | |
Class R6 | | $ | 100,758,797 | |
|
Shares outstanding, $0.01 par value per share,
with an unlimited number of shares authorized: | |
Class A | | | 764,874 | |
Class C | | | 847,363 | |
Class R | | | 2,496 | |
Class Y | | | 4,905,063 | |
Class R5 | | | 952 | |
Class R6 | | | 10,352,203 | |
Class A: | | | | |
Net asset value per share | | $ | 9.70 | |
Maximum offering price per share | | | | |
(Net asset value of $9.70 ¸ 94.50%) | | $ | 10.26 | |
Class C: | | | | |
Net asset value and offering price per share | | $ | 9.62 | |
Class R: | | | | |
Net asset value and offering price per share | | $ | 9.69 | |
Class Y: | | | | |
Net asset value and offering price per share | | $ | 9.73 | |
Class R5: | | | | |
Net asset value and offering price per share | | $ | 9.74 | |
Class R6: | | | | |
Net asset value and offering price per share | | $ | 9.73 | |
See accompanying Notes to Consolidated Financial Statements which are an integral part of the financial statements.
14 Invesco Global Markets Strategy Fund
Consolidated Statement of Operations
For the year ended October 31, 2015
| | | | |
Investment income: | |
Dividends from affiliated money market funds | | $ | 91,287 | |
Interest | | | 26,443 | |
Total investment income | | | 117,730 | |
| |
Expenses: | | | | |
Advisory fees | | | 2,790,755 | |
Administrative services fees | | | 50,000 | |
Custodian fees | | | 11,233 | |
Distribution fees: | | | | |
Class A | | | 19,109 | |
Class C | | | 101,518 | |
Class R | | | 121 | |
Transfer agent fees | | | 97,994 | |
Trustees’ and officers’ fees and benefits | | | 21,471 | |
Other | | | 188,246 | |
Total expenses | | | 3,280,447 | |
Less: Fees waived and expenses reimbursed | | | (471,039 | ) |
Net expenses | | | 2,809,408 | |
Net investment income (loss) | | | (2,691,678 | ) |
| |
Realized and unrealized gain (loss) from: | | | | |
Net realized gain (loss) from: | | | | |
Investment securities | | | 354 | |
Foreign currencies | | | (358,580 | ) |
Futures contracts | | | 2,868,514 | |
Swap agreements | | | (1,425,221 | ) |
| | | | 1,085,067 | |
Change in net unrealized appreciation (depreciation) of: | | | | |
Investment securities | | | (1,378 | ) |
Futures contracts | | | 632,079 | |
Swap agreements | | | 331,023 | |
| | | | 961,724 | |
Net realized and unrealized gain | | | 2,046,791 | |
Net increase (decrease) in net assets resulting from operations | | $ | (644,887 | ) |
See accompanying Notes to Consolidated Financial Statements which are an integral part of the financial statements.
15 Invesco Global Markets Strategy Fund
Consolidated Statement of Changes in Net Assets
For the years ended October 31, 2015 and 2014
| | | | | | | | |
| | | 2015 | | | 2014 | |
Operations: | | | | | |
Net investment income (loss) | | $ | (2,691,678 | ) | | $ | (2,505,146 | ) |
Net realized gain | | | 1,085,067 | | | | 2,656,273 | |
Change in net unrealized appreciation (depreciation) | | | 961,724 | | | | (775,658 | ) |
Net increase (decrease) in net assets resulting from operations | | | (644,887 | ) | | | (624,531 | ) |
| | |
Distributions to shareholders from net investment income: | | | | | | | | |
Class A | | | (101,201 | ) | | | — | |
Class C | | | (82,010 | ) | | | — | |
Class R | | | (320 | ) | | | — | |
Class Y | | | (696,170 | ) | | | — | |
Class R5 | | | (175 | ) | | | — | |
Class R6 | | | (2,023,415 | ) | | | — | |
Total distributions from net investment income | | | (2,903,291 | ) | | | — | |
| | |
Distributions to shareholders from net realized gains: | | | | | | | | |
Class A | | | (119,584 | ) | | | (94,210 | ) |
Class C | | | (196,803 | ) | | | (141,449 | ) |
Class R | | | (455 | ) | | | (647 | ) |
Class Y | | | (705,619 | ) | | | (692,741 | ) |
Class R5 | | | (178 | ) | | | (647 | ) |
Class R6 | | | (2,050,877 | ) | | | (6,922,506 | ) |
Total distributions from net realized gains | | | (3,073,516 | ) | | | (7,852,200 | ) |
| | |
Share transactions–net: | | | | | | | | |
Class A | | | 698,619 | | | | 6,388,685 | |
Class C | | | (3,677,350 | ) | | | 11,581,205 | |
Class R | | | 854 | | | | 14,508 | |
Class Y | | | 13,895,707 | | | | 30,676,861 | |
Class R6 | | | (8,020,707 | ) | | | 9,379,796 | |
Net increase in net assets resulting from share transactions | | | 2,897,123 | | | | 58,041,055 | |
Net increase (decrease) in net assets | | | (3,724,571 | ) | | | 49,564,324 | |
| | |
Net assets: | | | | | | | | |
Beginning of year | | | 167,829,582 | | | | 118,265,258 | |
End of year (includes undistributed net investment income (loss) of $3,078,977 and $3,315,908, respectively) | | $ | 164,105,011 | | | $ | 167,829,582 | |
Notes to Consolidated Financial Statements
October 31, 2015
NOTE 1—Significant Accounting Policies
Invesco Global Markets Strategy Fund (the “Fund”) is a series portfolio of AIM Investment Funds (Invesco Investment Funds) (the “Trust”). The Trust is organized as a Delaware statutory trust and is registered under the Investment Company Act of 1940, as amended (the “1940 Act”), as an open-end series management investment company consisting of twenty-four separate series portfolios, each authorized to issue an unlimited number of shares of beneficial interest. The assets, liabilities and operations of each portfolio are accounted for separately. Information presented in these consolidated financial statements pertains only to the Fund. Matters affecting each portfolio or class will be voted on exclusively by the shareholders of such portfolio or class.
The Fund will seek to gain exposure to the commodity markets primarily through investments in the Invesco Cayman Commodity Fund V Ltd. (the “Subsidiary”), a wholly-owned subsidiary of the Fund organized under the laws of the Cayman Islands. The Subsidiary was organized by the Fund to invest in commodity-linked derivatives. The Fund may invest up to 25% of its total assets in the Subsidiary.
The Fund’s investment objective is to seek a positive absolute return over a complete economic and market cycle.
The Fund currently consists of six different classes of shares: Class A, Class C, Class R, Class Y, Class R5 and Class R6. On August 28, 2013, the Fund began offering Class A, Class C, Class R, Class Y, Class R5 and Class R6 shares and the Fund’s existing Class H1 shares were converted to Class Y shares. Class A shares are sold with a front-end sales charge unless certain waiver criteria are met and under certain circumstances load waiver
16 Invesco Global Markets Strategy Fund
shares may be subject to contingent deferred sales charges (“CDSC”). Class C shares are sold with a CDSC. Class R, Class Y, Class R5 and Class R6 shares are sold at net asset value.
The following is a summary of the significant accounting policies followed by the Fund in the preparation of its consolidated financial statements.
| A. | Security Valuations — Securities, including restricted securities, are valued according to the following policy. |
Debt obligations (including convertible securities) and unlisted equities are fair valued using an evaluated quote provided by an independent pricing service. Evaluated quotes provided by the pricing service may be determined without exclusive reliance on quoted prices, and may reflect appropriate factors such as institution-size trading in similar groups of securities, developments related to specific securities, dividend rate (for unlisted equities), yield (for debt obligations), quality, type of issue, coupon rate (for debt obligations), maturity (for debt obligations), individual trading characteristics and other market data. Debt obligations are subject to interest rate and credit risks. In addition, all debt obligations involve some risk of default with respect to interest and/or principal payments.
A security listed or traded on an exchange (except convertible securities) is valued at its last sales price or official closing price as of the close of the customary trading session on the exchange where the security is principally traded, or lacking any sales or official closing price on a particular day, the security may be valued at the closing bid price on that day. Securities traded in the over-the-counter market are valued based on prices furnished by independent pricing services or market makers. When such securities are valued by an independent pricing service they may be considered fair valued. Futures contracts are valued at the final settlement price set by an exchange on which they are principally traded. Listed options are valued at the mean between the last bid and asked prices from the exchange on which they are principally traded. Options not listed on an exchange are valued by an independent source at the mean between the last bid and asked prices. For purposes of determining net asset value (“NAV”) per share, futures and option contracts generally are valued 15 minutes after the close of the customary trading session of the New York Stock Exchange (“NYSE”).
Investments in open-end and closed-end registered investment companies that do not trade on an exchange are valued at the end-of-day net asset value per share. Investments in open-end and closed-end registered investment companies that trade on an exchange are valued at the last sales price or official closing price as of the close of the customary trading session on the exchange where the security is principally traded.
Swap agreements are fair valued using an evaluated quote, if available, provided by an independent pricing service. Evaluated quotes provided by the pricing service are valued based on a model which may include end-of-day net present values, spreads, ratings, industry, company performance and returns of referenced assets.
Foreign securities’ (including foreign exchange contracts) prices are converted into U.S. dollar amounts using the applicable exchange rates as of the close of the NYSE. If market quotations are available and reliable for foreign exchange-traded equity securities, the securities will be valued at the market quotations. Because trading hours for certain foreign securities end before the close of the NYSE, closing market quotations may become unreliable. If between the time trading ends on a particular security and the close of the customary trading session on the NYSE, events occur that the Adviser determines are significant and make the closing price unreliable, the Fund may fair value the security. If the event is likely to have affected the closing price of the security, the security will be valued at fair value in good faith using procedures approved by the Board of Trustees. Adjustments to closing prices to reflect fair value may also be based on a screening process of an independent pricing service to indicate the degree of certainty, based on historical data, that the closing price in the principal market where a foreign security trades is not the current value as of the close of the NYSE. Foreign securities’ prices meeting the approved degree of certainty that the price is not reflective of current value will be priced at the indication of fair value from the independent pricing service. Multiple factors may be considered by the independent pricing service in determining adjustments to reflect fair value and may include information relating to sector indices, American Depositary Receipts and domestic and foreign index futures. Foreign securities may have additional risks including exchange rate changes, potential for sharply devalued currencies and high inflation, political and economic upheaval, the relative lack of issuer information, relatively low market liquidity and the potential lack of strict financial and accounting controls and standards.
Securities for which market prices are not provided by any of the above methods may be valued based upon quotes furnished by independent sources. The last bid price may be used to value equity securities. The mean between the last bid and asked prices is used to value debt obligations, including corporate loans.
Securities for which market quotations are not readily available or became unreliable are valued at fair value as determined in good faith by or under the supervision of the Trust’s officers following procedures approved by the Board of Trustees. Issuer specific events, market trends, bid/asked quotes of brokers and information providers and other market data may be reviewed in the course of making a good faith determination of a security’s fair value.
The Fund may invest in securities that are subject to interest rate risk, meaning the risk that the prices will generally fall as interest rates rise and, conversely, the prices will generally rise as interest rates fall. Specific securities differ in their sensitivity to changes in interest rates depending on their individual characteristics. Changes in interest rates may result in increased market volatility, which may affect the value and/or liquidity of certain Fund investments.
Valuations change in response to many factors including the historical and prospective earnings of the issuer, the value of the issuer’s assets, general economic conditions, interest rates, investor perceptions and market liquidity. Because of the inherent uncertainties of valuation, the values reflected in the consolidated financial statements may materially differ from the value received upon actual sale of those investments.
| B. | Securities Transactions and Investment Income — Securities transactions are accounted for on a trade date basis. Realized gains or losses on sales are computed on the basis of specific identification of the securities sold. Interest income (net of withholding tax, if any) is recorded on the accrual basis from settlement date. Dividend income (net of withholding tax, if any) is recorded on the ex-dividend date. Bond premiums and discounts are amortized and/or accreted for financial reporting purposes. |
The Fund may periodically participate in litigation related to Fund investments. As such, the Fund may receive proceeds from litigation settlements. Any proceeds received are included in the Consolidated Statement of Operations as realized gain (loss) for investments no longer held and as unrealized gain (loss) for investments still held.
Brokerage commissions and mark ups are considered transaction costs and are recorded as an increase to the cost basis of securities purchased and/or a reduction of proceeds on a sale of securities. Such transaction costs are included in the determination of net realized and unrealized gain (loss) from investment securities reported in the Consolidated Statement of Operations and the Consolidated Statement of Changes in Net Assets and the net realized and unrealized gains (losses) on securities per share in the Consolidated Financial Highlights.
17 Invesco Global Markets Strategy Fund
Transaction costs are included in the calculation of the Fund’s net asset value and, accordingly, they reduce the Fund’s total returns. These transaction costs are not considered operating expenses and are not reflected in net investment income reported in the Consolidated Statement of Operations and the Consolidated Statement of Changes in Net Assets, or the net investment income per share and the ratios of expenses and net investment income reported in the Consolidated Financial Highlights, nor are they limited by any expense limitation arrangements between the Fund and the investment adviser.
The Fund allocates income and realized and unrealized capital gains and losses to a class based on the relative net assets of each class.
| C. | Country Determination — For the purposes of making investment selection decisions and presentation in the Consolidated Schedule of Investments, the investment adviser may determine the country in which an issuer is located and/or credit risk exposure based on various factors. These factors include the laws of the country under which the issuer is organized, where the issuer maintains a principal office, the country in which the issuer derives 50% or more of its total revenues and the country that has the primary market for the issuer’s securities, as well as other criteria. Among the other criteria that may be evaluated for making this determination are the country in which the issuer maintains 50% or more of its assets, the type of security, financial guarantees and enhancements, the nature of the collateral and the sponsor organization. Country of issuer and/or credit risk exposure has been determined to be the United States of America, unless otherwise noted. |
| D. | Distributions — Distributions from net investment income and net realized capital gain, if any, are generally declared and paid annually and recorded on the ex-dividend date. The Fund may elect to treat a portion of the proceeds from redemptions as distributions for federal income tax purposes. |
| E. | Federal Income Taxes — The Fund intends to comply with the requirements of Subchapter M of the Internal Revenue Code of 1986, as amended (the “Internal Revenue Code”), necessary to qualify as a regulated investment company and to distribute substantially all of the Fund’s taxable earnings to shareholders. As such, the Fund will not be subject to federal income taxes on otherwise taxable income (including net realized capital gain) that is distributed to shareholders. Therefore, no provision for federal income taxes is recorded in the consolidated financial statements. |
The Fund recognizes the tax benefits of uncertain tax positions only when the position is more likely than not to be sustained. Management has analyzed the Fund’s uncertain tax positions and concluded that no liability for unrecognized tax benefits should be recorded related to uncertain tax positions. Management is not aware of any tax positions for which it is reasonably possible that the total amounts of unrecognized tax benefits will change materially in the next 12 months.
The Subsidiary is classified as a controlled foreign corporation under Subchapter N of the Internal Revenue Code. Therefore, the Fund is required to increase its taxable income by its share of the Subsidiary’s income. Net investment losses of the Subsidiary cannot be deducted by the Fund in the current period nor carried forward to offset taxable income in future periods.
The Fund files tax returns in the U.S. Federal jurisdiction and certain other jurisdictions. Generally the Fund is subject to examinations by such taxing authorities for up to three years after the filing of the return for the tax period.
| F. | Expenses — Fees provided for under the Rule 12b-1 plan of a particular class of the Fund are charged to the operations of such class. Transfer agency fees and expenses and other shareholder recordkeeping fees and expenses attributable to Class R5 and Class R6 are allocated to each share class based on relative net assets. Sub-accounting fees attributable to Class R5 are charged to the operations of the class. Transfer agency fees and expenses and other shareholder recordkeeping fees and expenses relating to all other classes are allocated among those classes based on relative net assets. All other expenses are allocated among the classes based on relative net assets. |
| G. | Accounting Estimates — The financial statements are prepared on a consolidated basis in conformity with accounting principles generally accepted in the United States of America (“GAAP”), which requires management to make estimates and assumptions that affect the reported amounts of assets and liabilities at the date of the financial statements and the reported amounts of revenues and expenses during the reporting period including estimates and assumptions related to taxation. Actual results could differ from those estimates by a significant amount. The accompanying financial statements reflect the financial position of the Fund and its Subsidiary and the results of operations on a consolidated basis. All inter-company accounts and transactions have been eliminated in consolidation. |
In addition, the Fund monitors for material events or transactions that may occur or become known after the period-end date and before the date the consolidated financial statements are released to print.
| H. | Indemnifications — Under the Trust’s organizational documents, each Trustee, officer, employee or other agent of the Trust, and under the Subsidiary’s organizational documents, the directors and officers of the Subsidiary, are indemnified against certain liabilities that may arise out of the performance of their duties to the Fund and/or the Subsidiary, respectively. Additionally, in the normal course of business, the Fund enters into contracts, including the Fund’s servicing agreements, that contain a variety of indemnification clauses. The Fund’s maximum exposure under these arrangements is unknown as this would involve future claims that may be made against the Fund that have not yet occurred. The risk of material loss as a result of such indemnification claims is considered remote. |
| I. | Foreign Currency Translations — Foreign currency is valued at the close of the NYSE based on quotations posted by banks and major currency dealers. Portfolio securities and other assets and liabilities denominated in foreign currencies are translated into U.S. dollar amounts at date of valuation. Purchases and sales of portfolio securities (net of foreign taxes withheld on disposition) and income items denominated in foreign currencies are translated into U.S. dollar amounts on the respective dates of such transactions. The Fund does not separately account for the portion of the results of operations resulting from changes in foreign exchange rates on investments and the fluctuations arising from changes in market prices of securities held. The combined results of changes in foreign exchange rates and the fluctuation of market prices on investments (net of estimated foreign tax withholding) are included with the net realized and unrealized gain or loss from investments in the Consolidated Statement of Operations. Reported net realized foreign currency gains or losses arise from (1) sales of foreign currencies, (2) currency gains or losses realized between the trade and settlement dates on securities transactions, and (3) the difference between the amounts of dividends, interest, and foreign withholding taxes recorded on the Fund’s books and the U.S. dollar equivalent of the amounts actually received or paid. Net unrealized foreign currency gains and losses arise from changes in the fair values of assets and liabilities, other than investments in securities at fiscal period end, resulting from changes in exchange rates. |
The Fund may invest in foreign securities, which may be subject to foreign taxes on income, gains on investments or currency repatriation, a portion of which may be recoverable. Foreign taxes, if any, are recorded based on the tax regulations and rates that exist in the foreign markets in which the Fund invests and are shown in the Consolidated Statement of Operations.
18 Invesco Global Markets Strategy Fund
| J. | Forward Foreign Currency Contracts — The Fund may engage in foreign currency transactions either on a spot (i.e. for prompt delivery and settlement) basis, or through forward foreign currency contracts, to manage or minimize currency or exchange rate risk. |
The Fund may also enter into forward foreign currency contracts for the purchase or sale of a security denominated in a foreign currency in order to “lock in” the U.S. dollar price of that security, or the Fund may also enter into forward foreign currency contracts that do not provide for physical settlement of the two currencies, but instead are settled by a single cash payment calculated as the difference between the agreed upon exchange rate and the spot rate at settlement based upon an agreed upon notional amount (non-deliverable forwards). The Fund will set aside liquid assets in an amount equal to daily mark-to-market obligation for forward foreign currency contracts.
A forward foreign currency contract is an obligation between two parties (“Counterparties”) to purchase or sell a specific currency for an agreed-upon price at a future date. The use of forward foreign currency contracts does not eliminate fluctuations in the price of the underlying securities the Fund owns or intends to acquire but establishes a rate of exchange in advance. Fluctuations in the value of these contracts are measured by the difference in the contract date and reporting date exchange rates and are recorded as unrealized appreciation (depreciation) until the contracts are closed. When the contracts are closed, realized gains (losses) are recorded. Realized and unrealized gains (losses) on the contracts are included in the Consolidated Statement of Operations. The primary risks associated with forward foreign currency contracts include failure of the Counterparty to meet the terms of the contract and the value of the foreign currency changing unfavorably. These risks may be in excess of the amounts reflected in the Consolidated Statement of Assets and Liabilities.
| K. | Futures Contracts — The Fund may enter into futures contracts to manage exposure to interest rate, equity and market price movements and/or currency risks. A futures contract is an agreement between Counterparties to purchase or sell a specified underlying security, currency or commodity (or delivery of a cash settlement price, in the case of an index future) for a fixed price at a future date. The Fund currently invests only in exchange-traded futures and they are standardized as to maturity date and underlying financial instrument. Initial margin deposits required upon entering into futures contracts are satisfied by the segregation of specific securities or cash as collateral at the futures commission merchant (broker). During the period the futures contracts are open, changes in the value of the contracts are recognized as unrealized gains or losses by recalculating the value of the contracts on a daily basis. Subsequent or variation margin payments are received or made depending upon whether unrealized gains or losses are incurred. These amounts are reflected as receivables or payables on the Consolidated Statement of Assets and Liabilities. When the contracts are closed or expire, the Fund recognizes a realized gain or loss equal to the difference between the proceeds from, or cost of, the closing transaction and the Fund’s basis in the contract. The net realized gain (loss) and the change in unrealized gain (loss) on futures contracts held during the period is included on the Consolidated Statement of Operations. The primary risks associated with futures contracts are market risk and the absence of a liquid secondary market. If the Fund were unable to liquidate a futures contract and/or enter into an offsetting closing transaction, the Fund would continue to be subject to market risk with respect to the value of the contracts and continue to be required to maintain the margin deposits on the futures contracts. Futures contracts have minimal Counterparty risk since the exchange’s clearinghouse, as Counterparty to all exchange-traded futures, guarantees the futures against default. Risks may exceed amounts recognized in the Consolidated Statement of Assets and Liabilities. |
| L. | Swap Agreements — The Fund may enter into various swap transactions, including interest rate, total return, index, currency and credit default swap contracts (“CDS”) for investment purposes or to manage interest rate, currency or credit risk. Such transactions are agreements between Counterparties. These agreements may contain among other conditions, events of default and termination events, and various covenants and representations such as provisions that require the Fund to maintain a pre-determined level of net assets, and/or provide limits regarding the decline of the Fund’s NAV over specific periods of time. If the Fund were to trigger such provisions and have open derivative positions at that time, the Counterparty may be able to terminate such agreement and request immediate payment in an amount equal to the net liability positions, if any. |
Interest rate, total return, index, and currency swap agreements are two-party contracts entered into primarily to exchange the returns (or differentials in rates of returns) earned or realized on particular predetermined investments or instruments. The gross returns to be exchanged or “swapped” between the parties are calculated with respect to a notional amount, i.e., the return on or increase in value of a particular dollar amount invested at a particular interest rate or return of an underlying asset, in a particular foreign currency, or in a “basket” of securities representing a particular index. At the maturity date, a net cash flow is exchanged where the total return is equivalent to the return of the underlying reference less a financing rate, if any. As a receiver, the Fund would receive payments based on any positive total return and would owe payments in the event of a negative total return. As the payer, the Fund would owe payments on any net positive total return, and would receive payment in the event of a negative total return.
Changes in the value of swap agreements are recognized as unrealized gains (losses) in the Consolidated Statement of Operations by “marking to market” on a daily basis to reflect the value of the swap agreement at the end of each trading day. Payments received or paid at the beginning of the agreement are reflected as such on the Consolidated Statement of Assets and Liabilities and may be referred to as upfront payments. The Fund accrues for the fixed payment stream and amortizes upfront payments, if any, on swap agreements on a daily basis with the net amount, recorded as a component of realized gain (loss) on the Consolidated Statement of Operations. A liquidation payment received or made at the termination of a swap agreement is recorded as realized gain (loss) on the Consolidated Statement of Operations. The Fund segregates liquid securities having a value at least equal to the amount of the potential obligation of a Fund under any swap transaction. Entering into these agreements involves, to varying degrees, lack of liquidity and elements of credit, market, and Counterparty risk in excess of amounts recognized on the Consolidated Statement of Assets and Liabilities. Such risks involve the possibility that a swap is difficult to sell or liquidate; the Counterparty does not honor its obligations under the agreement and unfavorable interest rates and market fluctuations. It is possible that developments in the swaps market, including potential government regulation, could adversely affect the Fund’s ability to terminate existing swap agreements or to realize amounts to be received under such agreements. A short position in a security poses more risk than holding the same security long. As there is no limit on how much the price of the security can increase, the Fund’s exposure is unlimited.
| M. | Other Risks — The Fund will seek to gain exposure to commodity markets primarily through an investment in the Subsidiary and through investments in exchange traded funds and commodity-linked derivatives. The Subsidiary, unlike the Fund, may invest without limitation in commodities, commodity-linked derivatives and other securities, such as exchange traded notes, that may provide leveraged and non-leveraged exposure to commodity markets. The Fund is indirectly exposed to the risks associated with the Subsidiary’s investments. |
19 Invesco Global Markets Strategy Fund
The Fund is non-diversified and may invest in securities of fewer issuers than if it were diversified. Thus, the value of the Fund’s shares may vary more widely and the Fund may be subject to greater market and credit risk than if the Fund invested more broadly.
| N. | Leverage Risk — Leverage exists when the Fund can lose more than it originally invests because it purchases or sells an instrument or enters into a transaction without investing an amount equal to the full economic exposure of the instrument or transaction. |
| O. | Collateral — To the extent the Fund has designated or segregated a security as collateral and that security is subsequently sold, it is the Fund’s practice to replace such collateral no later than the next business day. |
NOTE 2—Advisory Fees and Other Fees Paid to Affiliates
The Trust has entered into a master investment advisory agreement with Invesco Advisers, Inc. (the “Adviser” or “Invesco”). Under the terms of the investment advisory agreement, the Fund pays an advisory fee to the Adviser less the amount paid by the Subsidiary to the Adviser based on the annual rate of the Fund’s average daily net assets as follows:
| | | | |
| Average Daily Net Assets | | Rate | |
First $10 billion | | | 1.50% | |
Over $10 billion | | | 1.25% | |
For the year ended October 31, 2015, the effective advisory fees incurred by the Fund was 1.50%.
The Subsidiary has entered into a separate contract with the Adviser whereby the Adviser provides investment advisory and other services to the Subsidiary. In consideration of these services, the Subsidiary pays an advisory fee to the Adviser based on the annual rate of the Subsidiary’s average daily net assets as set forth in the table above.
Under the terms of a master sub-advisory agreement between the Adviser and each of Invesco Asset Management Deutschland GmbH, Invesco Asset Management Limited, Invesco Asset Management (Japan) Limited, Invesco Hong Kong Limited, Invesco Senior Secured Management, Inc., Invesco Canada Ltd. and Invesco PowerShares Capital Management LLC (collectively, the “Affiliated Sub-Advisers”) the Adviser, not the Fund, may pay 40% of the fees paid to the Adviser to any such Affiliated Sub-Adviser(s) that provide(s) discretionary investment management services to the Fund based on the percentage of assets allocated to such Affiliated Sub-Adviser(s).
The Adviser has contractually agreed, through at least February 28, 2017, to waive advisory fees and/or reimburse expenses to the extent necessary to limit total annual fund operating expenses after fee waiver and/or expense reimbursement (excluding certain items discussed below) of Class A, Class C, Class R, Class Y, Class R5 and Class R6 shares to 1.80%, 2.55%, 2.05%, 1.55%, 1.55% and 1.55%, respectively, of average daily net assets. In determining the Adviser’s obligation to waive advisory fees and/or reimburse expenses, the following expenses are not taken into account, and could cause total annual fund operating expenses after fee waiver and/or expense reimbursement to exceed the numbers reflected above: (1) interest; (2) taxes; (3) dividend expense on short sales; (4) extraordinary or non-routine items, including litigation expenses; and (5) expenses that the Fund has incurred but did not actually pay because of an expense offset arrangement. Acquired Fund Fees and Expenses are not operating expenses of a Fund directly, but are fees and expenses, including management fees, of the investment companies in which a Fund invests. As a result, the total annual fund operating expenses after expense reimbursement may exceed the expense limits above. Unless Invesco continues the fee waiver agreement, it will terminate on February 28, 2017. The fee waiver agreement cannot be terminated during its term.
Further, the Adviser has contractually agreed, through at least June 30, 2017, to waive the advisory fee payable by the Fund in an amount equal to 100% of the net advisory fees the Adviser receives from the affiliated money market funds on investments by the Fund of uninvested cash in such affiliated money market funds.
For the year ended October 31, 2015, the Adviser waived advisory fees of $373,045 and reimbursed class level expenses of $9,869, $13,108, $31 and $74,986 for Class A, Class C, Class R and Class Y shares, respectively.
The Trust has entered into a master administrative services agreement with Invesco pursuant to which the Fund has agreed to pay Invesco for certain administrative costs incurred in providing accounting services to the Fund. For the year ended October 31, 2015, expenses incurred under the agreement are shown in the Consolidated Statement of Operations as Administrative services fees.
The Trust has entered into a transfer agency and service agreement with Invesco Investment Services, Inc. (“IIS”) pursuant to which the Fund has agreed to pay IIS a fee for providing transfer agency and shareholder services to the Fund and reimburse IIS for certain expenses incurred by IIS in the course of providing such services. IIS may make payments to intermediaries that provide omnibus account services, sub-accounting services and/or networking services. All fees payable by IIS to intermediaries that provide omnibus account services or sub-accounting are charged back to the Fund, subject to certain limitations approved by the Trust’s Board of Trustees. For the year ended October 31, 2015, expenses incurred under the agreement are shown in the Consolidated Statement of Operations as Transfer agent fees.
The Trust has entered into master distribution agreements with Invesco Distributors, Inc. (“IDI”) to serve as the distributor for the Class A, Class C, Class R, Class Y, Class R5 and Class R6 shares of the Fund. The Trust has adopted plans pursuant to Rule 12b-1 under the 1940 Act with respect to the Fund’s Class A, Class C and Class R shares (collectively, the “Plans”). The Fund, pursuant to the Plans, pays IDI compensation at the annual rate of 0.25% of the Fund’s average daily net assets of Class A shares, 1.00% of the average daily net assets of Class C shares and 0.50% of the average daily net assets of Class R shares. Of the Plan payments, up to 0.25% of the average daily net assets of each class of shares may be paid to furnish continuing personal shareholder services to customers who purchase and own shares of such classes. Any amounts not paid as a service fee under the Plans would constitute an asset-based sales charge. Rules of the Financial Industry Regulatory Authority (“FINRA”) impose a cap on the total sales charges, including asset-based sales charges, that may be paid by any class of shares of the Fund. For the year ended October 31, 2015, expenses incurred under the Plans are shown in the Consolidated Statement of Operations as Distribution fees.
Front-end sales commissions and CDSC (collectively, the “sales charges”) are not recorded as expenses of the Fund. Front-end sales commissions are deducted from proceeds from the sales of Fund shares prior to investment in Class A shares of the Fund. CDSC are deducted from redemption proceeds prior to remittance to the shareholder. During the year ended October 31, 2015, IDI advised the Fund that IDI retained $1,882 in front-end sales commissions from the sale of Class A shares and $1,782 from Class C shares for CDSC imposed upon redemptions by shareholders.
Certain officers and trustees of the Trust are officers and directors of the Adviser, IIS and/or IDI.
20 Invesco Global Markets Strategy Fund
NOTE 3—Additional Valuation Information
GAAP defines fair value as the price that would be received to sell an asset or paid to transfer a liability in an orderly transaction between market participants at the measurement date, under current market conditions. GAAP establishes a hierarchy that prioritizes the inputs to valuation methods, giving the highest priority to readily available unadjusted quoted prices in an active market for identical assets (Level 1) and the lowest priority to significant unobservable inputs (Level 3), generally when market prices are not readily available or are unreliable. Based on the valuation inputs, the securities or other investments are tiered into one of three levels. Changes in valuation methods may result in transfers in or out of an investment’s assigned level:
| | Level 1 — | Prices are determined using quoted prices in an active market for identical assets. |
| | Level 2 — | Prices are determined using other significant observable inputs. Observable inputs are inputs that other market participants may use in pricing a security. These may include quoted prices for similar securities, interest rates, prepayment speeds, credit risk, yield curves, loss severities, default rates, discount rates, volatilities and others. |
| | Level 3 — | Prices are determined using significant unobservable inputs. In situations where quoted prices or observable inputs are unavailable (for example, when there is little or no market activity for an investment at the end of the period), unobservable inputs may be used. Unobservable inputs reflect the Fund’s own assumptions about the factors market participants would use in determining fair value of the securities or instruments and would be based on the best available information. |
The following is a summary of the tiered valuation input levels, as of October 31, 2015. The level assigned to the securities valuations may not be an indication of the risk or liquidity associated with investing in those securities. Because of the inherent uncertainties of valuation, the values reflected in the consolidated financial statements may materially differ from the value received upon actual sale of those investments.
| | | | | | | | | | | | | | | | |
| | | Level 1 | | | Level 2 | | | Level 3 | | | Total | |
Money Market Funds | | $ | 104,040,653 | | | $ | — | | | $ | — | | | $ | 104,040,653 | |
U.S. Treasury Securities | | | — | | | | 60,422,708 | | | | — | | | | 60,422,708 | |
| | | $ | 104,040,653 | | | $ | 60,422,708 | | | $ | — | | | $ | 164,463,361 | |
Futures Contracts* | | | 3,305,586 | | | | — | | | | — | | | | 3,305,586 | |
Swap Agreements* | | | — | | | | 163,840 | | | | — | | | | 163,840 | |
Total Investments | | $ | 107,346,239 | | | $ | 60,586,548 | | | $ | — | | | $ | 167,932,787 | |
| * | Unrealized appreciation. |
NOTE 4—Derivative Investments
Value of Derivative Investments at Period-End
The table below summarizes the value of the Fund’s derivative investments, detailed by primary risk exposure, held as of October 31, 2015:
| | | | | | | | |
| | | Value | |
| Risk Exposure/Derivative Type | | Assets | | | Liabilities | |
Commodity risk | | | | | | | | |
Futures contracts(a) | | $ | 1,826,733 | | | $ | (624,732 | ) |
Swap agreements(b) | | | 213,606 | | | | (49,766 | ) |
Interest rate risk: | | | | | | | | |
Futures contracts(a) | | | 815,335 | | | | (516,842 | ) |
Market risk: | | | | | | | | |
Futures contracts(a) | | | 1,899,840 | | | | (94,748 | ) |
Total | | $ | 4,755,514 | | | $ | (1,286,088 | ) |
| (a) | Includes cumulative appreciation (depreciation) of futures contracts. Only current day’s variation margin receivable (payable) is reported within the Consolidated Statement of Assets and Liabilities. |
| (b) | Values are disclosed on the Consolidated Statement of Assets and Liabilities under the captions Unrealized appreciation on swap transactions — OTC and Unrealized depreciation on swap transactions — OTC. |
21 Invesco Global Markets Strategy Fund
Effect of Derivative Investments for the year ended October 31, 2015
The table below summarizes the gains (losses) on derivative investments, detailed by primary risk exposure, recognized in earnings during the period:
| | | | | | | | |
| | | Location of Gain (Loss) on
Consolidated Statement of Operations | |
| | | Futures
Contracts | | | Swap
Agreements | |
Realized Gain (Loss): | | | | | | | | |
Commodity risk | | $ | 3,240,630 | | | $ | (2,133,102 | ) |
Interest rate risk | | | 6,700,363 | | | | 707,881 | |
Market risk | | | (7,072,479 | ) | | | — | |
Change in Unrealized Appreciation (Depreciation): | | | | | | | | |
Commodity risk | | | 210,140 | | | | 592,177 | |
Interest rate risk | | | (1,675,868 | ) | | | (261,154 | ) |
Market risk | | | 2,097,807 | | | | — | |
Total | | $ | 3,500,593 | | | $ | (1,094,198 | ) |
The table below summarizes the average notional value of futures contracts and swap agreements outstanding during the period.
| | | | | | | | |
| | | Futures
Contracts | | | Swap
Agreements | |
Average notional value | | $ | 220,548,518 | | | $ | 18,620,465 | |
Offsetting Assets and Liabilities
Accounting Standards Update (“ASU”) No. 2011-11, Disclosures about Offsetting Assets and Liabilities, which was subsequently clarified in Financial Accounting Standards Board ASU 2013-01 “Clarifying the Scope of Disclosures about Offsetting Assets and Liabilities” is intended to enhance disclosures about financial instruments and derivative instruments that are subject to offsetting arrangements on the Consolidated Statement of Assets and Liabilities and to enable investors to better understand the effect of those arrangements on the Fund’s financial position. In order for an arrangement to be eligible for netting, the Fund must have a basis to conclude that such netting arrangements are legally enforceable. The Fund enters into netting agreements and collateral agreements in an attempt to reduce the Fund’s Counterparty credit risk by providing for a single net settlement with a Counterparty of all financial transactions covered by the agreement in an event of default as defined under such agreement.
The following tables present derivative instruments that are either subject to an enforceable netting agreement or offset by collateral arrangements as of October 31, 2015.
| | | | | | | | | | | | | | | | | | | | |
| Counterparty | | Gross amounts
of Recognized
Assets | | | Gross Amounts Not Offset in the
Consolidated Statement of Assets and Liabilities | | | Net
Amount | |
| | | Financial
Instruments | | | Collateral Received | | |
| | | | Non-Cash | | | Cash | | |
Subsidiary | | | | | | | | | | | | | | | | | | | | |
Bank of America Merrill Lynch | | $ | 439 | | | $ | (16 | ) | | $ | — | | | $ | — | | | $ | 423 | |
Barclays Bank PLC | | | 45,150 | | | | — | | | | — | | | | — | | | | 45,150 | |
Canadian Imperial Bank of Commerce | | | 18,833 | | | | — | | | | — | | | | — | | | | 18,833 | |
Goldman Sachs International | | | 23,221 | | | | (23,221 | ) | | | — | | | | — | | | | — | |
Morgan Stanley Capital Services LLC | | | 127,064 | | | | (319 | ) | | | — | | | | — | | | | 126,745 | |
Total | | $ | 214,707 | | | $ | (23,556 | ) | | $ | — | | | $ | — | | | $ | 191,151 | |
| | | | | |
| | | | | | | | | | | | | | | | | | | | |
| Counterparty | | Gross amounts
of Recognized
Liabilities | | | Gross Amounts Not Offset in the
Consolidated Statement of Assets and Liabilities | | | Net
Amount | |
| | | Financial
Instruments | | | Collateral Pledged | | |
| | | | Non-Cash | | | Cash | | |
Subsidiary | | | | | | | | | | | | | | | | | | | | |
Bank of America Merrill Lynch | | $ | 16 | | | $ | (16 | ) | | $ | — | | | $ | — | | | $ | — | |
Goldman Sachs International | | | 46,538 | | | | (23,221 | ) | | | (23,317 | ) | | | — | | | | — | |
JPMorgan Chase Bank, N.A. | | | 3,307 | | | | — | | | | (3,307 | ) | | | — | | | | — | |
Morgan Stanley Capital Services LLC | | | 319 | | | | (319 | ) | | | — | | | | — | | | | — | |
Total | | $ | 50,180 | | | $ | (23,556 | ) | | $ | (26,624 | ) | | $ | — | | | $ | — | |
22 Invesco Global Markets Strategy Fund
NOTE 5—Subsidiary Information
The Fund’s Consolidated Schedule of Investments includes the holdings, including any investments in derivatives, of both the Fund and the Subsidiary. The Fund’s Consolidated Statement of Assets and Liabilities, Consolidated Statement of Operations and Consolidated Statement of Changes in Net Assets include the account balances of both the Fund and the Subsidiary and all interfund transactions have been eliminated.
The table below summarizes the financial information of the Subsidiary recognized in the consolidated financial statements referred to above.
| | | | |
| Selected Financial Information | | Invesco Cayman
Commodity Fund V Ltd.
(the “Subsidiary”) | |
Total assets | | $ | 38,588,918 | |
Total liabilities | | | 415,160 | |
Net assets | | | 38,173,758 | |
Total investment income | | | 14,960 | |
Net investment income (loss) | | | (654,150 | ) |
Net realized gain (loss) from: | | | | |
Investment securities | | | 50 | |
Futures contracts | | | 3,240,630 | |
Swap agreements | | | (2,133,103 | ) |
Change in net unrealized appreciation (depreciation) of: | | | | |
Investment securities | | | (188 | ) |
Futures contracts | | | 210,140 | |
Swap agreements | | | 592,177 | |
Increase in net assets resulting from operations | | $ | 1,255,556 | |
NOTE 6—Trustees’ and Officers’ Fees and Benefits
Trustees’ and Officers’ Fees and Benefits include amounts accrued by the Fund to pay remuneration to certain Trustees and Officers of the Fund. Trustees have the option to defer compensation payable by the Fund, and Trustees’ and Officers’ Fees and Benefits also include amounts accrued by the Fund to fund such deferred compensation amounts. Those Trustees who defer compensation have the option to select various Invesco Funds in which their deferral accounts shall be deemed to be invested. Finally, certain current Trustees were eligible to participate in a retirement plan that provided for benefits to be paid upon retirement to Trustees over a period of time based on the number of years of service. The Fund may have certain former Trustees who also participate in a retirement plan and receive benefits under such plan. Trustees’ and Officers’ Fees and Benefits include amounts accrued by the Fund to fund such retirement benefits. Obligations under the deferred compensation and retirement plans represent unsecured claims against the general assets of the Fund.
NOTE 7—Cash Balances
The Fund is permitted to temporarily carry a negative or overdrawn balance in its account with State Street Bank and Trust Company, the custodian bank. Such balances, if any at period end, are shown in the Consolidated Statement of Assets and Liabilities under the payable caption Amount due custodian. To compensate the custodian bank for such overdrafts, the overdrawn Fund may either (1) leave funds as a compensating balance in the account so the custodian bank can be compensated by earning the additional interest; or (2) compensate by paying the custodian bank at a rate agreed upon by the custodian bank and Invesco, not to exceed the contractually agreed upon rate.
NOTE 8—Distributions to Shareholders and Tax Components of Net Assets
Tax Character of Distributions to Shareholders Paid During the Fiscal Years Ended October 31, 2015 and 2014:
| | | | | | | | |
| | | 2015 | | | 2014 | |
Ordinary income | | $ | 3,868,308 | | | $ | 3,950,918 | |
Long-term capital gain | | | 2,108,499 | | | | 3,901,282 | |
Total distributions | | $ | 5,976,807 | | | $ | 7,852,200 | |
Tax Components of Net Assets at Period-End:
| | | | |
| | | 2015 | |
Undistributed ordinary income | | $ | 3,254,918 | |
Net unrealized appreciation — investments | | | 7,310 | |
Net unrealized appreciation — other investments | | | 343,992 | |
Temporary book/tax differences | | | (12,102 | ) |
Capital loss carryforward | | | (3,074,186 | ) |
Shares of beneficial interest | | | 163,585,079 | |
Total net assets | | $ | 164,105,011 | |
23 Invesco Global Markets Strategy Fund
The temporary book/tax differences are a result of timing differences between book and tax recognition of income and/or expenses. The Fund’s temporary book/tax differences are the result of the trustee deferral of compensation and retirement plan benefits.
Capital loss carryforward is calculated and reported as of a specific date. Results of transactions and other activity after that date may affect the amount of capital loss carryforward actually available for the Fund to utilize. Capital losses generated in years beginning after December 22, 2010 can be carried forward for an unlimited period, whereas previous losses expire in eight tax years. Capital losses with an expiration period may not be used to offset capital gains until all net capital losses without an expiration date have been utilized. Capital loss carryforwards with no expiration date will retain their character as either short-term or long-term capital losses instead of as short-term capital losses as under prior law. The ability to utilize capital loss carryforwards in the future may be limited under the Internal Revenue Code and related regulations based on the results of future transactions.
The Fund has a capital loss carryforward as of October 31, 2015, which expires as follows:
| | | | | | | | | | | | |
| Capital Loss Carryforward* | |
| Expiration | | Short-Term | | | Long-Term | | | Total | |
Not subject to expiration | | $ | 1,954,857 | | | $ | 1,119,329 | | | $ | 3,074,186 | |
| * | Capital loss carryforward as of the date listed above is reduced for limitations, if any, to the extent required by the Internal Revenue Code and may be further limited depending upon a variety of factors, including the realization of net unrealized gains or losses as of the date of any reorganization. |
NOTE 9—Investment Securities
The aggregate amount of long-term U.S. government obligations (other than short-term securities and money market funds, if any) purchased and sold by the Fund during the year ended October 31, 2015 was $3,995,147 and $0, respectively. Cost of investments on a tax basis includes the adjustments for financial reporting purposes as of the most recently completed federal income tax reporting period-end.
| | | | |
| Unrealized Appreciation (Depreciation) of Investment Securities on a Tax Basis | |
Aggregate unrealized appreciation of investment securities | | $ | 7,507,925 | |
Aggregate unrealized (depreciation) of investment securities | | | (7,500,615 | ) |
Net unrealized appreciation of investment securities | | $ | 7,310 | |
Cost of investments is the same for tax and financial reporting purposes.
NOTE 10—Reclassification of Permanent Differences
Primarily as a result of differing book/tax treatment of futures contracts, swap agreement income and distributions paid, on October 31, 2015, undistributed net investment income (loss) was increased by $5,358,038 and undistributed net realized gain (loss) was decreased by $5,358,038. This reclassification had no effect on the net assets of the Fund.
24 Invesco Global Markets Strategy Fund
NOTE 11—Share Information
| | | | | | | | | | | | | | | | |
| | | Summary of Share Activity | |
| | | Years ended October 31, | |
| | | 2015(a) | | | 2014 | |
| | | Shares | | | Amount | | | Shares | | | Amount | |
Sold: | | | | | | | | | | | | | | | | |
Class A | | | 508,205 | | | $ | 5,092,092 | | | | 1,164,747 | | | $ | 11,592,503 | |
Class C | | | 268,392 | | | | 2,710,112 | | | | 1,937,959 | | | | 19,362,646 | |
Class R | | | 698 | | | | 7,143 | | | | 1,458 | | | | 14,508 | |
Class Y | | | 6,132,600 | | | | 61,795,855 | | | | 6,604,938 | | | | 66,179,795 | |
Class R6 | | | 1,322,303 | | | | 13,256,829 | | | | 1,088,964 | | | | 10,710,094 | |
| | | | |
Issued as reinvestment of dividends: | | | | | | | | | | | | | | | | |
Class A | | | 20,165 | | | | 199,635 | | | | 9,489 | | | | 93,564 | |
Class C | | | 26,559 | | | | 262,665 | | | | 14,309 | | | | 140,802 | |
Class R | | | 48 | | | | 472 | | | | — | | | | — | |
Class Y | | | 122,360 | | | | 1,213,811 | | | | 69,846 | | | | 689,379 | |
Class R6 | | | 410,679 | | | | 4,073,939 | | | | 701,303 | | | | 6,921,859 | |
| | | | |
Reacquired: | | | | | | | | | | | | | | | | |
Class A | | | (461,934 | ) | | | (4,593,108 | ) | | | (532,075 | ) | | | (5,297,382 | ) |
Class C | | | (669,090 | ) | | | (6,650,127 | ) | | | (806,676 | ) | | | (7,922,243 | ) |
Class R | | | (660 | ) | | | (6,761 | ) | | | — | | | | — | |
Class Y | | | (4,995,636 | ) | | | (49,113,959 | ) | | | (3,675,067 | ) | | | (36,192,313 | ) |
Class R6 | | | (2,525,433 | ) | | | (25,351,475 | ) | | | (819,568 | ) | | | (8,252,157 | ) |
Net increase in share activity | | | 159,256 | | | $ | 2,897,123 | | | | 5,759,627 | | | $ | 58,041,055 | |
| (a) | There are entities that are record owners of more than 5% of the outstanding shares of the Fund and in aggregate own 30% of the outstanding shares of the Fund. IDI has an agreement with these entities to sell Fund shares. The Fund, Invesco and/or Invesco affiliates may make payments to these entities, which is considered to be related to the Fund, for providing services to the Fund, Invesco and/or Invesco affiliates including but not limited to services such as, securities brokerage, distribution, third party record keeping and account servicing. The Fund has no knowledge as to whether all or any portion of the shares owned of record by these entities is also owned beneficially. |
| | In addition, 61% of the outstanding shares of the Fund are owned by affiliated mutual funds. Affiliated mutual funds are mutual funds that are advised by Invesco. |
25 Invesco Global Markets Strategy Fund
NOTE 12—Financial Highlights
The following schedule presents financial highlights for a share of the Fund outstanding throughout the periods indicated.
| | | | | | | | | | | | | | | | | | | | | | | | | | | | | | | | | | | | | | | | | | | | | | | | | | | | | | | | |
| | | Net asset
value,
beginning
of period | | | Net
investment
income
(loss)(a) | | | Net gains
(losses)
on securities
(both
realized and
unrealized) | | | Total from
investment
operations | | | Dividends
from net
investment
income | | | Distributions
from net
realized
gains | | | Total
distributions | | | Net asset
value, end
of period | | | Total
return(b) | | | Net assets,
end of
period
(000’s
omitted) | | | Ratio of
expenses
to average
net assets
with fee
waivers
and/or
expenses
absorbed | | | Ratio of
expenses
to average
net
assets
without
fee waivers
and/or
expenses
absorbed | | | Ratio
of net
investment
income
(loss)
to average
net assets | | | Portfolio
turnover(c) | |
Class A | |
Year ended 10/31/15 | | $ | 10.02 | | | $ | (0.16 | ) | | $ | 0.18 | | | $ | 0.02 | | | $ | (0.15 | ) | | $ | (0.19 | ) | | $ | (0.34 | ) | | $ | 9.70 | | | | 0.18 | % | | $ | 7,418 | | | | 1.70 | %(d)(e) | | | 2.03 | %(d) | | | (1.64 | )%(d) | | | 0 | % |
Year ended 10/31/14 | | | 10.78 | | | | (0.17 | ) | | | 0.09 | | | | (0.08 | ) | | | — | | | | (0.68 | ) | | | (0.68 | ) | | | 10.02 | | | | (0.64 | ) | | | 6,996 | | | | 1.73 | | | | 2.06 | | | | (1.68 | ) | | | 0 | |
Year ended 10/31/13(f) | | | 10.52 | | | | (0.04 | ) | | | 0.30 | | | | 0.26 | | | | — | | | | — | | | | — | | | | 10.78 | | | | 2.47 | | | | 607 | | | | 1.99 | (g) | | | 2.04 | (g) | | | (1.92 | )(g) | | | 0 | |
Class C | |
Year ended 10/31/15 | | | 9.94 | | | | (0.24 | ) | | | 0.18 | | | | (0.06 | ) | | | (0.07 | ) | | | (0.19 | ) | | | (0.26 | ) | | | 9.62 | | | | (0.63 | ) | | | 8,155 | | | | 2.45 | (d)(e) | | | 2.78 | (d) | | | (2.39 | )(d) | | | 0 | |
Year ended 10/31/14 | | | 10.78 | | | | (0.24 | ) | | | 0.08 | | | | (0.16 | ) | | | — | | | | (0.68 | ) | | | (0.68 | ) | | | 9.94 | | | | (1.42 | ) | | | 12,136 | | | | 2.48 | | | | 2.81 | | | | (2.43 | ) | | | 0 | |
Year ended 10/31/13(f) | | | 10.52 | | | | (0.05 | ) | | | 0.31 | | | | 0.26 | | | | — | | | | — | | | | — | | | | 10.78 | | | | 2.47 | | | | 818 | | | | 2.74 | (g) | | | 2.79 | (g) | | | (2.67 | )(g) | | | 0 | |
Class R | |
Year ended 10/31/15 | | | 10.00 | | | | (0.19 | ) | | | 0.20 | | | | 0.01 | | | | (0.13 | ) | | | (0.19 | ) | | | (0.32 | ) | | | 9.69 | | | | 0.00 | | | | 24 | | | | 1.95 | (d)(e) | | | 2.28 | (d) | | | (1.89 | )(d) | | | 0 | |
Year ended 10/31/14 | | | 10.78 | | | | (0.19 | ) | | | 0.09 | | | | (0.10 | ) | | | — | | | | (0.68 | ) | | | (0.68 | ) | | | 10.00 | | | | (0.83 | ) | | | 24 | | | | 1.98 | | | | 2.31 | | | | (1.93 | ) | | | 0 | |
Year ended 10/31/13(f) | | | 10.52 | | | | (0.04 | ) | | | 0.30 | | | | 0.26 | | | | — | | | | — | | | | — | | | | 10.78 | | | | 2.47 | | | | 10 | | | | 2.24 | (g) | | | 2.29 | (g) | | | (2.17 | )(g) | | | 0 | |
Class Y | |
Year ended 10/31/15 | | | 10.05 | | | | (0.14 | ) | | | 0.19 | | | | 0.05 | | | | (0.18 | ) | | | (0.19 | ) | | | (0.37 | ) | | | 9.73 | | | | 0.44 | | | | 47,740 | | | | 1.45 | (d)(e) | | | 1.78 | (d) | | | (1.39 | )(d) | | | 0 | |
Year ended 10/31/14 | | | 10.79 | | | | (0.14 | ) | | | 0.08 | | | | (0.06 | ) | | | — | | | | (0.68 | ) | | | (0.68 | ) | | | 10.05 | | | | (0.44 | ) | | | 36,645 | | | | 1.48 | | | | 1.81 | | | | (1.43 | ) | | | 0 | |
Year ended 10/31/13 | | | 9.91 | | | | (0.19 | ) | | | 1.07 | | | | 0.88 | | | | — | | | | — | | | | — | | | | 10.79 | | | | 8.88 | | | | 6,972 | | | | 1.82 | | | | 1.87 | | | | (1.75 | ) | | | 0 | |
Year ended 10/31/12(f) | | | 10.00 | | | | (0.02 | ) | | | (0.07 | ) | | | (0.09 | ) | | | — | | | | — | | | | — | | | | 9.91 | | | | (0.90 | ) | | | 10,017 | | | | 2.00 | (g) | | | 6.69 | (g) | | | (1.87 | )(g) | | | 0 | |
Class R5 | |
Year ended 10/31/15 | | | 10.06 | | | | (0.14 | ) | | | 0.19 | | | | 0.05 | | | | (0.18 | ) | | | (0.19 | ) | | | (0.37 | ) | | | 9.74 | | | | 0.44 | | | | 9 | | | | 1.45 | (d)(e) | | | 1.65 | (d) | | | (1.39 | )(d) | | | 0 | |
Year ended 10/31/14 | | | 10.79 | | | | (0.14 | ) | | | 0.09 | | | | (0.05 | ) | | | — | | | | (0.68 | ) | | | (0.68 | ) | | | 10.06 | | | | (0.34 | ) | | | 10 | | | | 1.48 | | | | 1.69 | | | | (1.43 | ) | | | 0 | |
Year ended 10/31/13(f) | | | 10.52 | | | | (0.03 | ) | | | 0.30 | | | | 0.27 | | | | — | | | | — | | | | — | | | | 10.79 | | | | 2.57 | | | | 10 | | | | 1.75 | (g) | | | 1.80 | (g) | | | (1.68 | )(g) | | | 0 | |
Class R6 | |
Year ended 10/31/15 | | | 10.05 | | | | (0.14 | ) | | | 0.19 | | | | 0.05 | | | | (0.18 | ) | | | (0.19 | ) | | | (0.37 | ) | | | 9.73 | | | | 0.44 | | | | 100,759 | | | | 1.45 | (d)(e) | | | 1.65 | (d) | | | (1.39 | )(d) | | | 0 | |
Year ended 10/31/14 | | | 10.80 | | | | (0.14 | ) | | | 0.07 | | | | (0.07 | ) | | | — | | | | (0.68 | ) | | | (0.68 | ) | | | 10.05 | | | | (0.53 | ) | | | 112,019 | | | | 1.48 | | | | 1.69 | | | | (1.43 | ) | | | 0 | |
Year ended 10/31/13(f) | | | 10.52 | | | | (0.03 | ) | | | 0.31 | | | | 0.28 | | | | — | | | | — | | | | — | | | | 10.80 | | | | 2.66 | | | | 109,848 | | | | 1.71 | (g) | | | 1.76 | (g) | | | (1.64 | )(g) | | | 0 | |
| (a) | Calculated using average shares outstanding. |
| (b) | Includes adjustments in accordance with accounting principles generally accepted in the United States of America and as such, the net asset value for financial reporting purposes and the returns based upon those net asset values may differ from the net asset value and returns for shareholder transactions. Does not include sales charges and is not annualized for periods less than one year, if applicable. |
| (c) | Portfolio turnover is calculated at the fund level and is not annualized for periods less than one year, if applicable. |
| (d) | Ratios are based on average daily net assets (000’s omitted) of $7,643, $10,152, $24, $58,075, $10 and $110,147 for Class A, Class C, Class R, Class Y, Class R5 and Class R6 shares, respectively. |
| (e) | In addition to the fees and expenses which the Fund bears directly; the Fund indirectly bears a pro rata share of the fees and expenses of the underlying funds in which the Fund invests. Because the underlying funds have varied expenses and fee levels and the Fund may own different proportions at different times, the amount of fees and expenses incurred indirectly by the Fund will vary. Estimated underlying fund expenses are not expenses that are incurred directly by your Fund. They are expenses that are incurred directly by the underlying funds and are deducted from the value of the funds your Fund invests in. The effect of the estimated underlying fund expenses that you bear indirectly is included in your Fund’s total return. Estimated acquired fund fees from underlying funds were 0.11%. |
| (f) | Commencement date of September 26, 2012 for Class Y shares and August 28, 2013 for Class A, Class C, Class R, Class R5 and Class R6 shares, respectively. |
26 Invesco Global Markets Strategy Fund
Report of Independent Registered Public Accounting Firm
To the Board of Trustees of AIM Investment Funds (Invesco Investment Funds)
and Shareholders of Invesco Global Markets Strategy Fund:
In our opinion, the accompanying consolidated statement of assets and liabilities, including the consolidated schedule of investments, and the related consolidated statements of operations and of changes in net assets and the financial highlights present fairly, in all material respects, the consolidated financial position of Invesco Global Markets Strategy Fund (one of the funds constituting AIM Investment Funds (Invesco Investment Funds), hereafter referred to as the “Fund”) at October 31, 2015, the results of its operations for the year then ended, the changes in its net assets for each of the two years in the period then ended and the financial highlights for each of the three years in the period then ended and for the period September 26, 2012 (commencement of operations) through October 31, 2012, in conformity with accounting principles generally accepted in the United States of America. These consolidated financial statements and financial highlights (hereafter referred to as “financial statements”) are the responsibility of the Fund’s management. Our responsibility is to express an opinion on these financial statements based on our audits. We conducted our audits of these financial statements in accordance with the standards of the Public Company Accounting Oversight Board (United States). Those standards require that we plan and perform the audit to obtain reasonable assurance about whether the financial statements are free of material misstatement. An audit includes examining, on a test basis, evidence supporting the amounts and disclosures in the financial statements, assessing the accounting principles used and significant estimates made by management, and evaluating the overall financial statement presentation. We believe that our audits, which included confirmation of securities at October 31, 2015 by correspondence with the custodian and brokers, provide a reasonable basis for our opinion.
PRICEWATERHOUSECOOPERS LLP
December 23, 2015
Houston, Texas
27 Invesco Global Markets Strategy Fund
Calculating your ongoing Fund expenses
Example
As a shareholder of the Fund, you incur two types of costs: (1) transaction costs, which may include sales charges (loads) on purchase payments or contingent deferred sales charges on redemptions, if any; and (2) ongoing costs, including management fees, distribution and/or service (12b-1) fees, and other Fund expenses. This example is intended to help you understand your ongoing costs (in dollars) of investing in the Fund and to compare these costs with ongoing costs of investing in other mutual funds. The example is based on an investment of $1,000 invested at the beginning of the period and held for the entire period May 1, 2015 through October 31, 2015.
Actual expenses
The table below provides information about actual account values and actual expenses. You may use the information in this table, together with the amount you invested, to estimate the expenses that you paid over the period. Simply divide your account value by $1,000 (for example, an $8,600 account value divided by $1,000 = 8.6), then multiply the result by the number in the table under the heading entitled “Actual Expenses Paid During Period” to estimate the expenses you paid on your account during this period.
Hypothetical example for comparison purposes
The table below also provides information about hypothetical account values and hypothetical expenses based on the Fund’s actual expense ratio and an assumed rate of return of 5% per year before expenses, which is not the Fund’s actual return.
The hypothetical account values and expenses may not be used to estimate the actual ending account balance or expenses you paid for the period. You may use this information to compare the ongoing costs of investing in the Fund and other funds. To do so, compare this 5% hypothetical example with the 5% hypothetical examples that appear in the shareholder reports of the other funds.
Please note that the expenses shown in the table are meant to highlight your ongoing costs only and do not reflect any transaction costs, such as sales charges (loads) on purchase payments or contingent deferred sales charges on redemptions, if any. Therefore, the hypothetical information is useful in comparing ongoing costs only, and will not help you determine the relative total costs of owning different funds. In addition, if these transaction costs were included, your costs would have been higher.
| | | | | | | | | | | | | | | | | | | | | | | | |
| Class | | Beginning
Account Value
(05/01/15) | | | ACTUAL | | | HYPOTHETICAL (5% annual return before
expenses) | | | Annualized
Expense
Ratio | |
| | | Ending
Account Value
(10/31/15)1 | | | Expenses
Paid During
Period2 | | | Ending
Account Value
(10/31/15) | | | Expenses
Paid During
Period2 | | |
| A | | $ | 1,000.00 | | | $ | 967.00 | | | $ | 8.43 | | | $ | 1,016.64 | | | $ | 8.64 | | | | 1.70 | % |
| C | | | 1,000.00 | | | | 963.90 | | | | 12.13 | | | | 1,012.85 | | | | 12.43 | | | | 2.45 | |
| R | | | 1,000.00 | | | | 966.00 | | | | 9.66 | | | | 1,015.38 | | | | 9.91 | | | | 1.95 | |
| Y | | | 1,000.00 | | | | 969.10 | | | | 7.20 | | | | 1,017.90 | | | | 7.38 | | | | 1.45 | |
| R5 | | | 1,000.00 | | | | 969.10 | | | | 7.20 | | | | 1,017.90 | | | | 7.38 | | | | 1.45 | |
| R6 | | | 1,000.00 | | | | 969.10 | | | | 7.20 | | | | 1,017.90 | | | | 7.38 | | | | 1.45 | |
| 1 | The actual ending account value is based on the actual total return of the Fund for the period May 1, 2015 through October 31, 2015, after actual expenses and will differ from the hypothetical ending account value which is based on the Fund’s expense ratio and a hypothetical annual return of 5% before expenses. |
| 2 | Expenses are equal to the Fund’s annualized expense ratio as indicated above multiplied by the average account value over the period, multiplied by 184/365 to reflect the most recent fiscal half year. |
28 Invesco Global Markets Strategy Fund
Approval of Investment Advisory and Sub-Advisory Contracts
The Board of Trustees (the Board) of AIM Investment Funds (Invesco Investment Funds) is required under the Investment Company Act of 1940, as amended, to approve annually the renewal of Invesco Global Markets Strategy Fund’s (the Fund) investment advisory agreements. During contract renewal meetings held on June 9-10, 2015, the Board as a whole, and the disinterested or “independent” Trustees, who comprise over 75% of the Board, voting separately, approved the continuance for the Fund of the Master Investment Advisory Agreement with Invesco Advisers, Inc. (Invesco Advisers and the investment advisory agreement) and the Master Intergroup Sub-Advisory Contract for Mutual Funds with Invesco Asset Management Deutschland GmbH, Invesco Asset Management Limited, Invesco Asset Management (Japan) Limited, Invesco Hong Kong Limited, Invesco Senior Secured Management, Inc., Invesco Canada Ltd. and Invesco PowerShares Capital Management LLC (collectively, the Affiliated Sub-Advisers and the sub-advisory contracts) for another year, effective July 1, 2015.
In evaluating the fairness and reasonableness of compensation under the Fund’s investment advisory agreement and sub-advisory contracts, the Board considered, among other things, the factors discussed below. The Board determined that continuation of the Fund’s investment advisory agreement and the sub-advisory contracts are in the best interest of the Fund and its shareholders and that the compensation payable to Invesco Advisers and the Affiliated Sub-Advisers under the agreements is fair and reasonable.
The Board’s Fund Evaluation Process
The Board’s Investments Committee has established three Sub-Committees, each of which is primarily responsible for overseeing the performance and investment management services provided by Invesco Advisers and the Affiliated Sub-Advisers to a number of the funds advised by Invesco Advisers (the Invesco Funds). The Sub-Committees meet throughout the year to review the performance of their assigned Invesco Funds, including reviewing materials prepared under the direction of the independent Senior Officer, an officer of the Invesco Funds who reports directly to the independent Trustees. Over the course of each year, the Sub-Committees meet with portfolio managers for their assigned Invesco Funds and other members of management to review the performance, investment objective(s), policies, strategies, limitations and investment risks of these funds. The Board had the benefit of reports form the Sub-Committees and Investments Committee throughout the year in considering approval of the continuance of each Invesco Fund’s investment advisory agreement and sub-advisory contracts for another year.
During the contract renewal process, the Board receives comparative performance and fee data regarding the Invesco Funds prepared by Invesco Advisers and Lipper Inc. (Lipper), an independent provider of investment company data. The Board also receives a report and this independent written evaluation from the Senior Officer. The Senior Officer’s evaluation is prepared as part of his responsibility to manage the process by which the Invesco Funds’ proposed management fees are negotiated during the annual contract renewal process to ensure they are negotiated in a manner that is at arms’ length and reasonable. In addition to meetings with Invesco Advisers and fund counsel, the independent Trustees also discuss the continuance of the investment advisory agreement and sub-advisory contracts in separate sessions with the Senior Officer and with independent legal counsel.
The Trustees recognized that the advisory fee rates for the Invesco Funds are, in many cases, the result of years of review and negotiation. The Trustees’ deliberations and conclusions in a particular year may be based in part on their deliberations and conclusions regarding these same arrangements throughout the year and in prior years. The Trustees’ review and conclusions are based on the comprehensive consideration of all information presented to them and are not the result of any single determinative factor. Moreover, one Trustee may have weighed a particular piece of information or factor differently than another Trustee.
The discussion below is a summary of the Senior Officer’s independent written evaluation with respect to the Fund’s investment advisory agreement as well as a discussion of the material factors and related conclusions that formed the basis for the Board’s approval of the Fund’s investment advisory agreement and sub-advisory contracts. Unless otherwise stated, this information is current as of June 10, 2015, and does not reflect consideration of factors that became known to the Board after that date.
Factors and Conclusions and Summary of Independent Written Fee Evaluation
| A. | Nature, Extent and Quality of Services Provided by Invesco Advisers and the Affiliated Sub-Advisers |
The Board reviewed the advisory services provided to the Fund by Invesco Advisers under the Fund’s investment advisory agreement, the performance of Invesco Advisers in providing these services, and the credentials and experience of the officers and employees of Invesco Advisers who provide these services, including the Fund’s portfolio manager or managers. The Board’s review of the qualifications of Invesco Advisers to provide advisory services included the Board’s
consideration of Invesco Advisers’ investment process oversight, independent credit analysis and investment risk management. The Board also considered non-advisory services that Invesco Advisers and its affiliates provide to the Invesco Funds such as various back office support functions, equity and fixed income trading operations, internal audit, distribution, valuation and legal and compliance.
In determining whether to continue the Fund’s investment advisory agreement, the Board considered the benefits of reapproving an existing relationship and the greater uncertainty that may be associated with entering into a new relationship. The Board concluded that the nature, extent and quality of the services provided to the Fund by Invesco Advisers are appropriate and satisfactory and consistent with the terms of the Fund’s investment advisory agreement.
The Board reviewed the services that may be provided by the Affiliated Sub-Advisers under the sub-advisory contracts and the credentials and experience of the officers and employees of the Affiliated Sub-Advisers who provide these services. The Board noted that the Affiliated Sub-Advisers have offices and personnel that are located in financial centers around the world. As a result, the Affiliated Sub-Advisers can provide research and investment analysis on the markets and economies of various countries in which the Fund may invest, make recommendations regarding securities and assist with security trades. The Board concluded that the sub-advisory contracts benefit the Fund and its shareholders by permitting Invesco Advisers to use the resources and talents of the Affiliated Sub-Advisers in managing the Fund. The Board concluded that the nature, extent and quality of the services that may be provided by the Affiliated Sub-Advisers are appropriate and satisfactory and consistent with the terms of the Fund’s sub-advisory contracts.
The Board considered Fund performance as a relevant factor in considering whether to approve the investment advisory agreement. The Board did not view Fund performance as a relevant factor in considering whether to approve the sub-advisory contracts for the Fund, as no Affiliated Sub-Adviser currently manages assets of the Fund.
The Board noted that the Fund recently began operations and that comparative performance data for only the past two calendar years was available. The Board compared the Fund’s performance during the past two calendar years to the performance of funds in the Lipper performance universe and against the Lipper Absolute Return Funds Index. The Board noted that performance of Class Y shares of the Fund was in the first quintile of its performance universe for the one and two year periods (the first quintile being the best
29 Invesco Global Markets Strategy Fund
performing funds and the fifth quintile being the worst performing funds). The Board noted that the Fund’s performance was above the performance of the Index for the one and two year periods. Invesco Advisers noted that performance was largely due to a substantial overweight to developed sovereign debt. The Trustees also reviewed more recent Fund performance and this review did not change their conclusions.
| C. | Advisory and Sub-Advisory Fees |
The Board compared the Fund’s contractual management fee rate to the contractual management fee rates of funds in the Fund’s Lipper expense group at a common asset level. The Board noted that the contractual management fee rate for Class Y shares of the Fund was above the median contractual management fee rate of funds in its expense group. The Board noted that the term “contractual management fee” may include both advisory and certain administrative services fees, but that Lipper does not provide information on a fund by fund basis as to what is included. The Board noted that Invesco Advisers does not charge the Invesco Funds for the administrative services included in the term as defined by Lipper. The Board also reviewed the methodology used by Lipper in providing expense group information, which includes using each fund’s contractual management fee schedule (including any applicable breakpoints) as reported in the most recent prospectus or statement of additional information for each fund in the expense group.
The Board noted that Invesco Advisers has contractually agreed to waive fees and/or limit expenses of the Fund through at least February 29, 2016 in an amount necessary to limit total annual operating expenses to a specified percentage of average daily net assets for each class of the Fund.
The Board noted that Invesco Advisers and the Affiliated Sub-Advisers do not manage other mutual funds or client accounts with investment strategies comparable to those of the Fund.
The Board also considered the services that may be provided by the Affiliated Sub-Advisers pursuant to the sub-advisory contracts, as well as the fees payable by Invesco Advisers to the Affiliated Sub-Advisers pursuant to the sub-advisory contracts. The Board also noted that the sub-advisory fees are not paid directly by the Fund, but rather, are payable by Invesco Advisers to the Affiliated Sub-Advisers.
| D. | Economies of Scale and Breakpoints |
The Board considered the extent to which there are economies of scale in the provision of advisory services to the Fund. The Board also considered whether the Fund benefits from economies of scale through contractual breakpoints in the Fund’s advisory fee schedule. The Board also noted that the Fund shares directly in economies of scale through lower fees charged by third party service providers based on the combined size of the Invesco Funds and other clients advised by Invesco Advisers.
| E. | Profitability and Financial Resources |
The Board reviewed information from Invesco Advisers concerning the costs of the advisory and other services that Invesco Advisers and its affiliates provide to the Fund and the Invesco Funds and the profitability of Invesco Advisers and its affiliates in providing these services. The Board received information from Invesco Advisers about the methodology used to prepare the profitability information. The Board noted that Invesco Advisers continues to operate at a net profit from services Invesco Advisers and its affiliates provide to the Invesco Funds and the Fund. The Board did not deem the level of profits realized by Invesco Advisers and its affiliates from providing services to the Fund to be excessive given the nature, quality and extent of the services provided. The Board received and accepted information from Invesco Advisers demonstrating that Invesco Advisers and each Affiliated Sub-Adviser are financially sound and have the resources necessary to perform their obligations under the investment advisory agreement and sub-advisory contracts.
| F. | Collateral Benefits to Invesco Advisers and its Affiliates |
The Board considered various other benefits received by Invesco Advisers and its affiliates from the relationship with the Fund, including the fees received for providing transfer agency and distribution services to the Fund. The Board considered comparative information regarding fees charged for these services, including information provided by Lipper and other independent sources. The Board considered the performance of Invesco Advisers and its affiliates in providing these services and the organizational structure employed to provide these services. The Board also considered that these services are provided to the Fund pursuant to written contracts that are reviewed and approved on an annual basis by the Board; and that the services are required for the operation of the Fund.
The Board considered the benefits realized by Invesco Advisers and the Affiliated Sub-Advisers as a result of portfolio brokerage transactions executed through “soft dollar” arrangements. The Board noted that soft dollar arrangements shift the payment obligation for research services from Invesco Advisers and the Affiliated Sub-Advisers to the Invesco Funds and that the research received may be used with other clients of Invesco Advisers and may reduce Invesco Advisers’ and the Affiliated Sub-Advisers’ expenses. The Board also considered that it receives periodic reports from the Chief Compliance Officer of the Invesco Funds demonstrating that these arrangements are consistent with regulatory requirements. The Board did not deem the soft dollar arrangements to be inappropriate.
The Board considered that the Fund’s uninvested cash and cash collateral from any securities lending arrangements may be invested in money market funds advised by Invesco Advisers pursuant to procedures approved by the Board. The Board noted that
Invesco Advisers receives advisory fees from these affiliated money market funds attributable to such investments, although Invesco Advisers has contractually agreed to waive through varying periods the advisory fees payable by the Invesco Funds with respect to investments in the affiliated money market funds. The waiver is in an amount equal to 100% of the net advisory fee Invesco Advisers receives from the affiliated money market funds with respect to the Fund’s investment in the affiliated money market funds of uninvested cash, but not cash collateral. The Board concluded that the amount of advisory fees received by Invesco Advisors from the Fund’s investment of cash collateral from any securities lending arrangements in the affiliated money market funds is fair and reasonable.
The Board also considered the Fund may use an affiliated broker to execute certain trades for the Fund to among other things, control information leakage, and were advised that such trades would be executed in compliance with rules under the Investment Company Act of 1940, as amended, and consistent with best execution obligations.
30 Invesco Global Markets Strategy Fund
Tax Information
Form 1099-DIV, Form 1042-S and other year-end tax information provide shareholders with actual calendar year amounts that should be included in their tax returns. Shareholders should consult their tax advisors.
The following distribution information is being provided as required by the Internal Revenue Code or to meet a specific state’s requirement.
The Fund designates the following amounts or, if subsequently determined to be different, the maximum amount allowable for its fiscal year ended October 31, 2015:
| | | | |
Federal and State Income Tax | |
Long-Term Capital Gain Distributions | | $ | 2,108,499 | |
Qualified Dividend Income* | | | 0.00 | % |
Corporate Dividends Received Deduction* | | | 0.00 | % |
U.S. Treasury Obligations* | | | 1.78 | % |
| | * | The above percentages are based on ordinary income dividends paid to shareholders during the Fund’s fiscal year. |
| | | | |
Non-Resident Alien Shareholders | |
Qualified Short-Term Gains | | $ | 929,069 | |
31 Invesco Global Markets Strategy Fund
Trustees and Officers
The address of each trustee and officer is AIM Investment Funds (Invesco Investment Funds) (the “Trust”), 11 Greenway Plaza, Suite 1000, Houston, Texas 77046-1173. The trustees serve for the life of the Trust, subject to their earlier death, incapacitation, resignation, retirement or removal as more specifically provided in the Trust’s organizational documents. Each officer serves for a one year term or until their successors are elected and qualified. Column two below includes length of time served with predecessor entities, if any.
| | | | | | | | |
Name, Year of Birth and
Position(s) Held with the Trust | | Trustee and/
or Officer Since | | Principal Occupation(s)
During Past 5 Years | | Number of Funds in Fund Complex Overseen by Trustee | | Other Directorship(s) Held by Trustee During Past 5 Years |
| Interested Persons | | | | | | | | |
| Martin L. Flanagan1 — 1960 Trustee | | 2007 | | Executive Director, Chief Executive Officer and President, Invesco Ltd. (ultimate parent of Invesco and a global investment management firm); Advisor to the Board, Invesco Advisers, Inc. (formerly known as Invesco Institutional (N.A.), Inc.); Trustee, The Invesco Funds; Vice Chair, Investment Company Institute; and Member of Executive Board, SMU Cox School of Business Formerly: Chairman and Chief Executive Officer, Invesco Advisers, Inc. (registered investment adviser); Director, Chairman, Chief Executive Officer and President, IVZ Inc. (holding company), INVESCO Group Services, Inc. (service provider) and Invesco North American Holdings, Inc. (holding company); Director, Chief Executive Officer and President, Invesco Holding Company Limited (parent of Invesco and a global investment management firm); Director, Invesco Ltd.; Chairman, Investment Company Institute and President, Co-Chief Executive Officer, Co-President, Chief Operating Officer and Chief Financial Officer, Franklin Resources, Inc. (global investment management organization). | | 145 | | None |
Philip A. Taylor2 — 1954
Trustee, President and Principal Executive Officer | | 2006 | | Head of North American Retail and Senior Managing Director, Invesco Ltd.; Director, Co-Chairman, Co-President and Co-Chief Executive Officer, Invesco Advisers, Inc. (formerly known as Invesco Institutional (N.A.), Inc.) (registered investment adviser); Director, Chairman, Chief Executive Officer and President, Invesco Management Group, Inc. (formerly known as Invesco Aim Management Group, Inc.) (financial services holding company); Director and President, INVESCO Funds Group, Inc. (registered investment adviser and registered transfer agent); Director and Chairman, Invesco Investment Services, Inc. (formerly known as Invesco Aim Investment Services, Inc.) (registered transfer agent) and IVZ Distributors, Inc. (formerly known as INVESCO Distributors, Inc.) (registered broker dealer); Chief Executive Officer, Invesco Corporate Class Inc. (corporate mutual fund company) Director, Chairman and Chief Executive Officer, Invesco Canada Ltd. (formerly known as Invesco Trimark Ltd./Invesco Trimark Ltèe) (registered investment adviser and registered transfer agent); Trustee, President and Principal Executive Officer, The Invesco Funds (other than AIM Treasurer’s Series Trust (Invesco Treasurer’s Series Trust), Short-Term Investments Trust and Invesco Management Trust); Trustee and Executive Vice President, The Invesco Funds (AIM Treasurer’s Series Trust (Invesco Treasurer’s Series Trust), Short-Term Investments Trust and Invesco Management Trust only); Director, Invesco Investment Advisers LLC (formerly known as Van Kampen Asset Management); Director, Chief Executive Officer and President, Van Kampen Exchange Corp. Formerly: Director, President and Chairman, Invesco Inc. (holding company), Invesco Canada Holdings Inc. (holding company), Trimark Investments Ltd./Placements Trimark Ltèe and Invesco Financial Services Ltd/Services Financiers Invesco Ltèe; Chief Executive Officer, Invesco Canada Fund Inc (corporate mutual fund company); Director and Chairman, Van Kampen Investor Services Inc.; Director, Chief Executive Officer and President, 1371 Preferred Inc. (holding company) and Van Kampen Investments Inc.; Director and President, AIM GP Canada Inc. (general partner for limited partnerships) and Van Kampen Advisors, Inc.; Director and Chief Executive Officer, Invesco Trimark Dealer Inc. (registered broker dealer); Director, Invesco Distributors, Inc. (formerly known as Invesco Aim Distributors, Inc.) (registered broker dealer); Manager, Invesco PowerShares Capital Management LLC; Director, Chief Executive Officer and President, Invesco Advisers, Inc.; Director, Chairman, Chief Executive Officer and President, Invesco Aim Capital Management, Inc.; President, Invesco Trimark Dealer Inc. and Invesco Trimark Ltd./Invesco Trimark Ltèe; Director and President, AIM Trimark Corporate Class Inc. and AIM Trimark Canada Fund Inc.; Senior Managing Director, Invesco Holding Company Limited; Director and Chairman, Fund Management Company (former registered broker dealer); President and Principal Executive Officer, The Invesco Funds (AIM Treasurer’s Series Trust (Invesco Treasurer’s Series Trust), and Short-Term Investments Trust only); President, AIM Trimark Global Fund Inc. and AIM Trimark Canada Fund Inc.. | | 145 | | None |
| 1 | Mr. Flanagan is considered an interested person (within the meaning of Section 2(a)(19) of the 1940 Act) of the Trust because he is an officer of the Adviser to the Trust, and an officer and a director of Invesco Ltd., ultimate parent of the Adviser. |
| 2 | Mr. Taylor is considered an interested person (within the meaning of Section 2(a)(19) of the 1940 Act) of the Trust because he is an officer and a director of the Adviser. |
T-1 Invesco Global Markets Strategy Fund
Trustees and Officers—(continued)
| | | | | | | | |
Name, Year of Birth and Position(s) Held with the Trust | | Trustee and/ or Officer Since | | Principal Occupation(s) During Past 5 Years | | Number of Funds in Fund Complex Overseen by Trustee | | Other Directorship(s) Held by Trustee During Past 5 Years |
| Independent Trustees | | | | | | | | |
Bruce L. Crockett — 1944 Trustee and Chair | | 2003 | | Chairman, Crockett Technologies Associates (technology consulting company) Formerly: Director, Captaris (unified messaging provider); Director, President and Chief Executive Officer, COMSAT Corporation; Chairman, Board of Governors of INTELSAT (international communications company); ACE Limited (insurance company); Independent Directors Council and Investment Company Institute | | 145 | | ALPS (Attorneys Liability Protection Society) (insurance company) and Globe Specialty Metals, Inc. (metallurgical company) |
David C. Arch — 1945 Trustee | | 2010 | | Chairman of Blistex Inc., a consumer health care products manufacturer | | 145 | | Board member of the Illinois Manufacturers’ Association; Member of the Board of Visitors, Institute for the Humanities, University of Michigan; Member of the Audit Committee of the Edward-Elmhurst Hospital |
James T. Bunch — 1942 Trustee | | 2000 | | Managing Member, Grumman Hill Group LLC (family office/private equity investments) Formerly: Founder, Green Manning & Bunch Ltd. (investment banking firm) (1988-2010); Executive Committee, United States Golf Association; and Chairman, Board of Governors, Western Golf Association | | 145 | | Chairman of the Board of Trustees, Evans Scholars Foundation; and Chairman of the Board, Denver Film Society |
Rodney F. Dammeyer — 1940 Trustee | | 2010 | | Chairman of CAC, LLC, (private company offering capital investment and management advisory services) Formerly: Prior to 2001, Managing Partner at Equity Group Corporate Investments; Prior to 1995, Chief Executive Officer of Itel Corporation (formerly Anixter International); Prior to 1985, experience includes Senior Vice President and Chief Financial Officer of Household International, Inc., Executive Vice President and Chief Financial Officer of Northwest Industries, Inc. and Partner of Arthur Andersen & Co.; From 1987 to 2010, Director/Trustee of investment companies in the Van Kampen Funds complex | | 145 | | Director of Quidel Corporation and Stericycle, Inc. |
Albert R. Dowden — 1941 Trustee | | 2003 | | Director of a number of public and private business corporations, including the Boss Group, Ltd. (private investment and management); Nature’s Sunshine Products, Inc. and Reich & Tang Funds (5 portfolios) (registered investment company) Formerly: Director, Homeowners of America Holding Corporation/Homeowners of America Insurance Company (property casualty company); Director, Continental Energy Services, LLC (oil and gas pipeline service); Director, CompuDyne Corporation (provider of product and services to the public security market) and Director, Annuity and Life Re (Holdings), Ltd. (reinsurance company); Director, President and Chief Executive Officer, Volvo Group North America, Inc.; Senior Vice President, AB Volvo; Director of various public and private corporations; Chairman, DHJ Media, Inc.; Director, Magellan Insurance Company; and Director, The Hertz Corporation, Genmar Corporation (boat manufacturer), National Media Corporation; Advisory Board of Rotary Power International (designer, manufacturer, and seller of rotary power engines); and Chairman, Cortland Trust, Inc. (registered investment company) | | 145 | | Director of: Nature’s Sunshine Products, Inc., Reich & Tang Funds, Homeowners of America Holding Corporation/ Homeowners of America Insurance Company, the Boss Group |
Jack M. Fields — 1952 Trustee | | 2003 | | Chief Executive Officer, Twenty First Century Group, Inc. (government affairs company); Owner and Chief Executive Officer, Dos Angeles Ranch, L.P. (cattle, hunting, corporate entertainment); and Discovery Global Education Fund (non-profit) Formerly: Chief Executive Officer, Texana Timber LP (sustainable forestry company); Director of Cross Timbers Quail Research Ranch (non-profit); and member of the U.S. House of Representatives | | 145 | | Insperity, Inc. (formerly known as Administaff) |
Prema Mathai-Davis — 1950 Trustee | | 2003 | | Retired. Formerly: Chief Executive Officer, YWCA of the U.S.A. | | 145 | | None |
Larry Soll — 1942 Trustee | | 1997 | | Retired. Formerly: Chairman, Chief Executive Officer and President, Synergen Corp. (a biotechnology company) | | 145 | | None |
Hugo F. Sonnenschein — 1940 Trustee | | 2010 | | President Emeritus and Honorary Trustee of the University of Chicago and the Adam Smith Distinguished Service Professor in the Department of Economics at the University of Chicago. Prior to 2000, President of the University of Chicago | | 145 | | Trustee of the University of Rochester and a member of its investment committee; Member of the National Academy of Sciences and the American Philosophical Society; Fellow of the American Academy of Arts and Sciences |
Raymond Stickel, Jr. — 1944 Trustee | | 2005 | | Retired. Formerly: Director, Mainstay VP Series Funds, Inc. (25 portfolios) and Partner, Deloitte & Touche | | 145 | | None |
T-2 Invesco Global Markets Strategy Fund
Trustees and Officers—(continued)
| | | | | | | | |
Name, Year of Birth and Position(s) Held with the Trust | | Trustee and/ or Officer Since | | Principal Occupation(s) During Past 5 Years | | Number of Funds in Fund Complex Overseen by Trustee | | Other Directorship(s) Held by Trustee During Past 5 Years |
| Independent Trustees—(continued) |
Suzanne H. Woolsey — 1941 Trustee | | 2014 | | Chief Executive Officer of Woolsey Partners LLC | | 145 | | Emeritus Chair of the Board of Trustees of the Institute for Defense Analyses; Trustee of Colorado College; Trustee of California Institute of Technology; Prior to 2014, Director of Fluor Corp.; Prior to 2010, Trustee of the German Marshall Fund of the United States; Prior to 2010 Trustee of the Rocky Mountain Institute |
| Other Officers | | | | | | | | |
Russell C. Burk — 1958
Senior Vice President and Senior Officer | | 2005 | | Senior Vice President and Senior Officer, The Invesco Funds | | N/A | | N/A |
John M. Zerr — 1962
Senior Vice President, Chief Legal Officer and Secretary | | 2006 | | Director, Senior Vice President, Secretary and General Counsel, Invesco Management Group, Inc. (formerly known as Invesco Aim Management Group, Inc.) and Van Kampen Exchange Corp.; Senior Vice President, Invesco Advisers, Inc. (formerly known as Invesco Institutional (N.A.), Inc.) (registered investment adviser); Senior Vice President and Secretary, Invesco Distributors, Inc. (formerly known as Invesco Aim Distributors, Inc.); Director, Vice President and Secretary, Invesco Investment Services, Inc. (formerly known as Invesco Aim Investment Services, Inc.) and IVZ Distributors, Inc. (formerly known as INVESCO Distributors, Inc.); Director and Vice President, INVESCO Funds Group, Inc.; Senior Vice President, Chief Legal Officer and Secretary, The Invesco Funds; Managing Director, Invesco PowerShares Capital Management LLC; Director, Secretary and General Counsel, Invesco Investment Advisers LLC (formerly known as Van Kampen Asset Management); Secretary and General Counsel, Invesco Capital Markets, Inc. (formerly known as Van Kampen Funds Inc.) and Chief Legal Officer, PowerShares Exchange-Traded Fund Trust, PowerShares Exchange-Traded Fund Trust II, PowerShares India Exchange-Traded Fund Trust, PowerShares Actively Managed Exchange-Traded Fund Trust, and PowerShares Actively Managed Exchange-Traded Commodity Fund Trust Formerly: Director and Vice President, Van Kampen Advisors Inc.; Director, Vice President, Secretary and General Counsel, Van Kampen Investor Services Inc.; Director, Invesco Distributors, Inc. (formerly known as Invesco Aim Distributors, Inc.); Director, Senior Vice President, General Counsel and Secretary, Invesco Aim Advisers, Inc. and Van Kampen Investments Inc.; Director, Vice President and Secretary, Fund Management Company; Director, Senior Vice President, Secretary, General Counsel and Vice President, Invesco Aim Capital Management, Inc.; Chief Operating Officer and General Counsel, Liberty Ridge Capital, Inc. (an investment adviser); Vice President and Secretary, PBHG Funds (an investment company) and PBHG Insurance Series Fund (an investment company); Chief Operating Officer, General Counsel and Secretary, Old Mutual Investment Partners (a broker-dealer); General Counsel and Secretary, Old Mutual Fund Services (an administrator) and Old Mutual Shareholder Services (a shareholder servicing center); Executive Vice President, General Counsel and Secretary, Old Mutual Capital, Inc. (an investment adviser); and Vice President and Secretary, Old Mutual Advisors Funds (an investment company) | | N/A | | N/A |
Sheri Morris — 1964
Vice President, Treasurer and Principal Financial Officer | | 2003 | | Vice President, Treasurer and Principal Financial Officer, The Invesco Funds; Vice President, Invesco Advisers, Inc. (formerly known as Invesco Institutional (N.A.), Inc.) (registered investment adviser); and Vice President, PowerShares Exchange-Traded Fund Trust, PowerShares Exchange-Traded Fund Trust II, PowerShares India Exchange-Traded Fund Trust, PowerShares Actively Managed Exchange-Traded Fund Trust, and PowerShares Actively Managed Exchange-Traded Commodity Fund Trust Formerly: Vice President, Invesco Aim Advisers, Inc., Invesco Aim Capital Management, Inc. and Invesco Aim Private Asset Management, Inc.; Assistant Vice President and Assistant Treasurer, The Invesco Funds and Assistant Vice President, Invesco Advisers, Inc., Invesco Aim Capital Management, Inc. and Invesco Aim Private Asset Management, Inc.; and Treasurer, PowerShares Exchange-Traded Fund Trust, PowerShares Exchange-Traded Fund Trust II, PowerShares India Exchange-Traded Fund Trust and PowerShares Actively Managed Exchange-Traded Fund Trust | | N/A | | N/A |
T-3 Invesco Global Markets Strategy Fund
Trustees and Officers—(continued)
| | | | | | | | |
Name, Year of Birth and
Position(s) Held with the Trust | | Trustee and/
or Officer Since | | Principal Occupation(s)
During Past 5 Years | | Number of Funds in Fund Complex Overseen by Trustee | | Other Directorship(s) Held by Trustee During Past 5 Years |
| Other Officers—(continued) | | | | | | | | |
Karen Dunn Kelley — 1960
Vice President | | 2003 | | Senior Managing Director, Investments, Invesco Ltd.; Director, Co-President, Co-Chief Executive Officer, and Co-Chairman, Invesco Advisers, Inc. (formerly known as Invesco Institutional (N.A.), Inc.) (registered investment adviser); Chairman, Invesco Senior Secured Management, Inc.; Senior Vice President, Invesco Management Group, Inc. (formerly known as Invesco Aim Management Group, Inc.); Executive Vice President, Invesco Distributors, Inc. (formerly known as Invesco Aim Distributors, Inc.); Director, Invesco Mortgage Capital Inc. and Invesco Management Company Limited; Vice President, The Invesco Funds (other than AIM Treasurer’s Series Trust (Invesco Treasurer’s Series Trust), Short-Term Investments Trust and Invesco Management Trust); and President and Principal Executive Officer, The Invesco Funds (AIM Treasurer’s Series Trust (Invesco Treasurer’s Series Trust), Short-Term Investments Trust and Invesco Management Trust only) Formerly: Director and President, INVESCO Asset Management (Bermuda) Ltd., Director, INVESCO Global Asset Management Limited and INVESCO Management S.A.; Senior Vice President, Van Kampen Investments Inc. and Invesco Advisers, Inc. (formerly known as Invesco Institutional (N.A.), Inc.) (registered investment adviser); Vice President, Invesco Advisers, Inc. (formerly known as Invesco Institutional (N.A.), Inc.); Director of Cash Management and Senior Vice President, Invesco Advisers, Inc. and Invesco Aim Capital Management, Inc.; Director and President, Fund Management Company; Chief Cash Management Officer, Director of Cash Management, Senior Vice President, and Managing Director, Invesco Aim Capital Management, Inc.; Director of Cash Management, Senior Vice President, and Vice President, Invesco Advisers, Inc. and The Invesco Funds (AIM Treasurer’s Series Trust (Invesco Treasurer’s Series Trust), and Short-Term Investments Trust only) | | N/A | | N/A |
Crissie M. Wisdom — 1969 Anti-Money Laundering Compliance Officer | | 2013 | | Anti-Money Laundering Compliance Officer, Invesco Advisers, Inc. (formerly known as Invesco Institutional (N.A.), Inc.) (registered investment adviser), Invesco Capital Markets, Inc. (formerly known as Van Kampen Funds Inc.), Invesco Distributors, Inc., Invesco Investment Services, Inc., Invesco Management Group, Inc., Van Kampen Exchange Corp., The Invesco Funds, and PowerShares Exchange-Traded Fund Trust, PowerShares Exchange-Traded Fund Trust II, PowerShares India Exchange-Traded Fund Trust, PowerShares Actively Managed Exchange-Traded Fund Trust and PowerShares Actively Managed Exchange-Traded Commodity Fund Trust; Anti-Money Laundering Compliance Officer and Bank Secrecy Act Officer, INVESCO National Trust Company and Invesco Trust Company; and Fraud Prevention Manager and Controls and Risk Analysis Manager for Invesco Investment Services, Inc.. | | N/A | | N/A |
Lisa O. Brinkley — 1959 Chief Compliance Officer | | 2015 | | Senior Vice President and Chief Compliance Officer, Invesco Advisers, Inc. (registered investment adviser) (formerly known as Invesco Institutional (N.A., Inc.); and Chief Compliance Officer, The Invesco Funds Formerly: Global Assurance Officer, Invesco Ltd. and Vice President, The Invesco Funds; Chief Compliance Officer, Invesco Distributors, Inc. (formerly known as Invesco Aim Distributors, Inc.), Invesco Investment Services, Inc.(formerly known as Invesco Aim Investment Services, Inc.) and Van Kampen Investor Services Inc.; Senior Vice President, Invesco Management Group, Inc.; Senior Vice President and Chief Compliance Officer, Invesco Advisers, Inc. and The Invesco Funds; Vice President and Chief Compliance Officer, Invesco Aim Capital Management, Inc. and Invesco Distributors, Inc.; Vice President, Invesco Investment Services, Inc. and Fund Management Company. | | N/A | | N/A |
The Statement of Additional Information of the Trust includes additional information about the Fund’s Trustees and is available upon request, without charge, by calling 1.800.959.4246. Please refer to the Fund’s prospectus for information on the Fund’s sub-advisers.
| | | | | | |
Office of the Fund 11 Greenway Plaza, Suite 1000 Houston, TX 77046-1173 | | Investment Adviser Invesco Advisers, Inc. 1555 Peachtree Street, N.E. Atlanta, GA 30309 | | Distributor
Invesco Distributors, Inc. 11 Greenway Plaza, Suite 1000 Houston, TX 77046-1173 | | Auditors PricewaterhouseCoopers LLP 1000 Louisiana Street, Suite 5800 Houston, TX 77002-5678 |
| | | |
| | | | | | |
Counsel to the Fund Stradley Ronon Stevens & Young, LLP 2005 Market Street, Suite 2600 Philadelphia, PA 19103-7018 | | Counsel to the Independent Trustees Goodwin Procter LLP 901 New York Avenue, N.W. Washington, D.C. 20001 | | Transfer Agent Invesco Investment Services, Inc. 11 Greenway Plaza, Suite 1000 Houston, TX 77046-1173 | | Custodian State Street Bank and Trust Company 225 Franklin Street Boston, MA 02110-2801 |
T-4 Invesco Global Markets Strategy Fund

Invesco mailing information
Send general correspondence to Invesco Investment Services, Inc., P.O. Box 219078, Kansas City, MO 64121-9078.
Important notice regarding delivery of security holder documents
To reduce Fund expenses, only one copy of most shareholder documents may be mailed to shareholders with multiple accounts at the same address (Householding). Mailing of your shareholder documents may be householded indefinitely unless you instruct us otherwise. If you do not want the mailing of these documents to be combined with those for other members of your household, please contact Invesco Investment Services, Inc. at 800 959 4246 or contact your financial institution. We will begin sending you individual copies for each account within 30 days after receiving your request.
Fund holdings and proxy voting information
The Fund provides a complete list of its holdings four times in each fiscal year, at the quarter ends. For the second and fourth quarters, the lists appear in the Fund’s semiannual and annual reports to shareholders. For the first and third quarters, the Fund files the lists with the Securities and Exchange Commission (SEC) on Form N-Q. The most recent list of portfolio holdings is available at invesco.com/completeqtrholdings. Shareholders can also look up the Fund’s Forms N-Q on the SEC website at sec.gov. Copies of the Fund’s Forms N-Q may be reviewed and copied at the SEC Public Reference Room in Washington, D.C. You can obtain information on the operation of the Public Reference Room, including information about duplicating fee charges, by calling 202 551 8090 or 800 732 0330, or by electronic request at the following email address: publicinfo@sec.gov. The SEC file numbers for the Fund are shown below.
A description of the policies and procedures that the Fund uses to determine how to vote proxies relating to portfolio securities is available without charge, upon request, from our Client Services department at 800 959 4246 or at invesco.com/proxyguidelines. The information is also available on the SEC website, sec.gov.
| | |
Information regarding how the Fund voted proxies related to its portfolio securities during the most recent 12-month period ended June 30 is available at invesco.com/proxysearch. The information is also available on the SEC website, sec.gov. Invesco Advisers, Inc. is an investment adviser; it provides investment advisory services to individual and institutional clients and does not sell securities. Invesco Distributors, Inc. is the US distributor for Invesco Ltd.’s retail mutual funds, exchange-traded funds and institutional money market funds. Both are wholly owned, indirect subsidiaries of Invesco Ltd. | |  |
SEC file numbers: 811-05426 and 033-19338 GMS-AR-1 Invesco Distributors, Inc.
| | | | |
| | |
 | | Annual Report to Shareholders | | October 31, 2015 |
| | |
| | Invesco Global Targeted Returns Fund |
| | Nasdaq: |
| | A: GLTAX n C: GLTCX n R: GLTRX n Y: GLTYX n R5: GLTFX n R6: GLTSX |

Letters to Shareholders
| | |

Philip Taylor | | Dear Shareholders: This annual report includes information about your Fund, including performance data and a complete list of its investments as of the close of the reporting period. Inside is a discussion of how your Fund was managed and the factors that affected its performance during the reporting period. I hope you find this report of interest. The US economy expanded and unemployment declined throughout the reporting period. Continuing low energy prices benefited consumers, but a strong US dollar crimped corporate profits. The US Federal Reserve signaled that it was increasingly likely to raise interest rates, based on generally positive economic data, but uncertainty remained about when it might act. Overseas, the story was much different. Low energy prices hurt the economies of some oil-producing nations, such as Brazil and Russia. During the reporting period, the European |
| Central Bank as well as central banks in China and Japan – among other countries – either instituted or maintained extraordinarily accommodative monetary policies in response to economic weakness. |
Investor uncertainty, such as we saw for much of the reporting period – and market volatility, such as we saw at the end of the reporting period – are unfortunate facts of life when it comes to investing. Some investors use these things as excuses to delay saving and investing for their long-term financial goals. That’s why Invesco encourages investors to work with a professional financial adviser who can stress the importance of starting to save and invest early and the importance of adhering to a disciplined investment plan – when times are good and when they’re uncertain. A financial adviser who knows your unique financial situation, investment goals and risk tolerance can be an invaluable partner as you seek to achieve your financial goals. He or she can offer a long-term perspective when markets are volatile and time-tested advice and guidance when your financial situation or investment goals change.
Timely information when and where you want it
Invesco’s efforts to help investors achieve their financial objectives include providing individual investors and financial professionals with timely information about the markets, the economy and investing – whenever and wherever they want it.
Our website, invesco.com/us, offers a wide range of market insights and investment perspectives. On the website, you’ll find detailed information about our funds, including prices, performance, holdings and portfolio manager commentaries. You can access information about your account by completing a simple, secure online registration. Click on the “Need to register” link in the “Account Access” box on our homepage to get started.
Invesco’s mobile apps for iPhone® and iPad® (both available free from the App StoreSM) allow you to obtain the same detailed information, monitor your account and create customizable watch lists. Also, they allow you to access investment insights from our investment leaders, market strategists, economists and retirement experts. You can sign up to be alerted when new commentary is added, and you can watch portfolio manager videos and have instant access to Invesco news and updates wherever you may be.
In addition to the resources accessible on our website and through our mobile app, you can obtain timely updates to help you stay informed about the markets, the economy and investing by connecting with Invesco on Twitter, LinkedIn or Facebook. You can access our blog at blog.invesco.us.com. Our goal is to provide you the information you want, when and where you want it.
Have questions?
For questions about your account, feel free to contact an Invesco client services representative at 800 959 4246. For Invesco-related questions or comments, please email me directly at phil@invesco.com.
All of us at Invesco look forward to serving your investment management needs for many years to come. Thank you for investing with us.
Sincerely,

Philip Taylor
Senior Managing Director, Invesco Ltd.
iPhone and iPad are trademarks of Apple Inc., registered in the US and other countries. App Store is a service mark of Apple Inc. Invesco Distributors, Inc. is not affiliated with Apple Inc.
2 Invesco Global Targeted Returns Fund
| | |

Bruce Crockett | | Dear Fellow Shareholders: Among the many important lessons I’ve learned in more than 40 years in a variety of business endeavors is the value of a trusted advocate. As independent chair of the Invesco Funds Board, I can assure you that the members of the Board are strong advocates for the interests of investors in Invesco’s mutual funds. We work hard to represent your interests through oversight of the quality of the investment management services your funds receive and other matters important to your investment, including but not limited to: n Ensuring that Invesco offers a diverse lineup of mutual funds that your financial adviser can use to strive to meet your financial needs as your investment goals change over time. n Monitoring how the portfolio management teams of the Invesco funds are performing in light of changing economic and market conditions. |
| n | | Assessing each portfolio management team’s investment performance within the context of the investment strategy described in the fund’s prospectus. |
| n | | Monitoring for potential conflicts of interests that may impact the nature of the services that your funds receive. |
We believe one of the most important services we provide our fund shareholders is the annual review of the funds’ advisory and sub-advisory contracts with Invesco Advisers and its affiliates. This review is required by the Investment Company Act of 1940 and focuses on the nature and quality of the services Invesco provides as the adviser to the Invesco funds and the reasonableness of the fees that it charges for those services. Each year, we spend months carefully reviewing information received from Invesco and a variety of independent sources, such as performance and fee data prepared by Lipper Inc., an independent, third-party firm widely recognized as a leader in its field. We also meet with our independent legal counsel and other independent advisers to review and help us assess the information that we have received. Our goal is to assure that you receive quality investment management services for a reasonable fee.
I trust the measures outlined above provide assurance that you have a worthy advocate when it comes to choosing the Invesco Funds.
As always, please contact me at bruce@brucecrockett.com with any questions or concerns you may have. On behalf of the Board, we look forward to continuing to represent your interests and serving your needs.
Sincerely,

Bruce L. Crockett
Independent Chair
Invesco Funds Board of Trustees
3 Invesco Global Targeted Returns Fund
Management’s Discussion of Fund Performance
Performance summary
For the fiscal year ended October 31, 2015, Class A shares of Invesco Global Targeted Returns Fund (the Fund), at net asset value (NAV), outperformed the U.S. Three-Month Treasury Bills Index, the Fund’s broad market/style-specific benchmark.
Your Fund’s long-term performance appears later in this report.
Fund vs. Indexes
Total returns, 10/31/14 to 10/31/15, at net asset value (NAV). Performance shown does not include applicable contingent deferred sales charges (CDSC) or front-end sales charges, which would have reduced performance.
| | | | |
Class A Shares | | | 0.49 | % |
Class C Shares | | | -0.27 | |
Class R Shares | | | 0.17 | |
Class Y Shares | | | 0.72 | |
Class R5 Shares | | | 0.82 | |
Class R6 Shares | | | 0.73 | |
| U.S. Three-Month Treasury Bills Indexq (Broad Market/Style-Specific Index) | | | 0.03 | |
Source(s): qLipper Inc. | | | | |
Market conditions and your Fund
The Fund targets an annual gross return of 5% above three-month US Treasury bills and aims to achieve this with less than half the volatility of global equities (as represented by the MSCI World Index), over a rolling three-year period. The Fund seeks to achieve these targets by investing in good long-term investment ideas (typically 20 -30) that are combined through a robust risk-managed process in a single portfolio. There is no guarantee that the Fund will achieve a
positive return or its target return, and an investor may lose money by investing in the Fund. Each idea reflects a fundamental macroeconomic view with regard to asset classes, geographies, currencies or sectors globally that have the potential to deliver a positive return over a two- to three-year time horizon. We then identify what we believe is the best way to implement these ideas. This can include a wide range of asset types including derivative instruments and underlying investment companies.
Global equity markets experienced increased volatility during the fiscal year ended October 31, 2015, driven largely by the continued slowdown in energy markets and the economic downturn in China. Developed markets were generally able to withstand these headwinds, even as more fragile emerging markets began to falter.
As the reporting period began in late 2014, equity markets were processing the fallout from the initial crash in oil prices as OPEC decided to maintain high production despite low prices and slowing global growth. In this environment, commodity-based economies and most currencies underperformed those of the US. The potential positive impact of lower oil prices on consumers and some positive economic data led equity markets higher through the spring of 2015. This strength also helped the markets overcome fears in May and June of 2015 that Greece and the eurozone would fail to reach an agreement on a financial bailout plan.
In the summer of 2015, fears of a potential economic slowdown in China dominated headlines. The combination of a slowing Chinese economy, a sharp sell-off in domestic Chinese equities and the devaluation of China’s currency, the ren-minbi, contributed to a strong correction in global equity markets. Emerging markets, in particular, were hard hit by
Portfolio Composition
By asset type
| | | | | | | | | | | | | | | |
| | | Risk
Allocation1 | | Notional Value
as % of
Total
Net Assets2 | | Value
as % of
Total Net
Assets3 |
Credit | | | | 8.86 | % | | | | 57.87 | % | | | | 0.00 | % |
Equity | | | | 33.46 | | | | | 183.92 | | | | | 49.05 | |
Currency | | | | 22.19 | | | | | 148.34 | | | | | 2.20 | |
Interest Rate | | | | 25.18 | | | | | 229.48 | | | | | 4.99 | |
Volatility4 | | | | 10.31 | | | | | 2.75 | | | | | 1.15 | |
Money Market Funds Plus Other Assets Less Liabilities | | | | - | | | | | - | | | | | 42.61 | |
| | | | |
Total Net Assets | | | $141.1 million | |
The Fund’s holdings are subject to change, and there is no assurance that the Fund will continue to hold any particular security.
Data presented here are as of October 31, 2015.
| 1 | The values in this column represent the Adviser’s proprietary measure of risk that each asset type contributes to the Fund. The risk associated with each asset type is calculated by aggregating the independent risk, as of the end of the fiscal period, of each of the Fund’s investment ideas that are included in that asset type. Independent risk is determined by measuring the historical price volatility of the assets or asset classes that comprise the investment idea using a statistical measurement called standard deviation. Standard deviation measures how much historical prices vary from their average over a certain period of time. The risk of each investment idea takes into account the Adviser’s evaluation of the risk dynamics and expected correlation of the components of the investment idea based on historical price movements. Historical price movements may not be representative of future price movements and, therefore, the actual risk of each asset type may be much greater or lower than the values shown. In addition, there are ways to measure risk other than standard deviation which, if used, may have resulted in a different risk allocation. |
| 2 | The values in this column represent the gross notional amount of the derivative instruments and other investments held by the Fund, including purchased and written options, futures, forwards, swaps and investment companies. The notional amount of a derivative is the nominal or face amount used to calculate payments made on the instrument. The gross notional amount does not reflect any offsetting or netting of long and short positions. The notional amounts of derivatives and other investments denominated in foreign currencies have been adjusted to the U.S. dollar equivalent using spot exchange rates. See the Consolidated Schedule of Investments for a complete list of derivative instruments held by the Fund as of October 31, 2015. |
| 3 | The percentages in this column were calculated by adding the market value of purchased options, the net unrealized appreciation/depreciation of written options, futures, swaps and forwards, and the net asset value of affiliated money market funds held by the Fund. See the Consolidated Schedule of Investments for the complete list of derivative instruments held by the Fund as of October 31, 2015. |
| 4 | Includes the volatility and variance swaps held by the Fund, the gains and losses on which are driven by the volatility (i.e., the positive and negative changes in value over time) of a particular asset, such as stocks or currencies, and not by the asset itself. |
4 Invesco Global Targeted Returns Fund
events in China and by continued weak commodity prices – as well as by the US Federal Reserve’s decision to delay raising interest rates, which increased investor uncertainty and market volatility. In October 2015, however, US markets rallied, recovering from their earlier decline and finishing higher for the fiscal year.
Reflecting some of these macroeconomic developments, the Interest Rates - US Duration idea was the largest contributor to Fund returns during the reporting period. The idea reflected our view that US monetary policy could lead to expectations of higher short-term interest rates while growth and inflation could remain subdued – keeping long-term bond yields low – resulting in a flattening of the yield curve. The idea was implemented through interest rate swaptions. This idea performed well, as long-term interest rates fell, benefiting the Fund’s long duration exposure. We removed the idea during the first quarter of 2015 as we believed it did not have continued return potential (given our economic outlook over the next two to three years) to warrant a place in the Fund.
The Volatility - Asian Equities vs. US Equities idea reflected our belief that the difference between the implied volatility of US equities versus Asian equities, based on options prices, was historically very low. We believed that Asian equity markets could be inherently more volatile, particularly as their indexes were dominated by financial stocks. We implemented this idea using swaps that isolate the volatility of each market. The idea contributed to Fund performance for the reporting period as equity markets, particularly in Asia, experience sharp movements during the third quarter of 2015.
The largest detractor from Fund performance for the reporting period was the Currency - Norwegian Krone vs. UK Pound idea. This idea expressed our view that while positive UK economic data had helped strengthen the British pound versus the euro, the potential for higher growth and inflation in Norway could lead to a turn in relative economic drivers, resulting in a strengthening of the Norwe-gian krone versus the UK pound. We implemented this economic view by buying the Norwegian krone and selling the UK pound through currency forwards. A drastic drop in oil prices during the reporting period had a negative impact on the idea as the Fund’s long position in the Nor-wegian krone was hurt by speculation about the potential effect of lower oil revenues on Norway’s economy and by an interest rate cut in December 2014 by the Norwegian central bank.
Other detractors from Fund performance involved ideas with exposure to emerging markets, which declined significantly during the reporting period. For example, the Interest Rates - Selective Emerging Market (EM) Debt idea reflected our view that there was value in holding selective high yielding EM local currency debt because of their improving economic indicators and fundamentals. To implement this idea, we bought local currency 10-year government bonds in Poland, South Africa, Mexico and Hun-gary. Additionally, we hedged back the local currency exposure to the US dollar and the euro in an attempt to try and protect the idea from additional weakening of local EM currencies. The Equity - EM vs. US idea also created a drag on Fund performance before we removed it in July 2015, due to concerns about the potential impact of a slowdown in China’s economic growth on EM equities.
While the Fund is focused on the return and risk attributes of each idea individually and its impact on the other ideas in the Fund, there were some shifts in positioning during the reporting period that can be identified more broadly. During the first quarter of 2015, amid concern about the direction of monetary policy, we removed ideas with exposure to interest rates (i.e., long duration) and added ideas that could serve the same defensive role in the Fund but that had the potential to deliver value regardless of market direction. Within equities, we took more specific views in seeking out what we believe are better-valued equity markets such as Japan and Germany, and used options to support the performance of these ideas, in case equity markets faltered.
At the close of the reporting period, our general outlook called for low but positive global economic growth, with Europe’s recovery challenged by a slowdown in China. We believed global interest rates will remain low as inflation remains subdued, although we recognized the potential for rate increases in the US and the UK, which could negatively affect emerging markets. We remained cautious about equity valuations, although we believed there were select opportunities in equities. In our view, divergent economic policies globally could spur higher levels of market volatility.
As indicated throughout this report, our investment ideas make significant use of derivative instruments. Therefore, the performance of the Fund can be attributed largely to these instruments. Derivatives can be a cost-effective way to gain exposure to asset classes. However, derivatives may amplify traditional
investment risks through the creation of leverage and may be less liquid than traditional securities.
We thank you for your investment in Invesco Global Targeted Returns Fund.
The views and opinions expressed in management’s discussion of Fund performance are those of Invesco Advisers, Inc. These views and opinions are subject to change at any time based on factors such as market and economic conditions. These views and opinions may not be relied upon as investment advice or recommendations, or as an offer for a particular security. The information is not a complete analysis of every aspect of any market, country, industry, security or the Fund. Statements of fact are from sources considered reliable, but Invesco Advisers, Inc. makes no representation or warranty as to their completeness or accuracy. Although historical performance is no guarantee of future results, these insights may help you understand our investment management philosophy.
See important Fund and, if applicable, index disclosures later in this report.
| | |

| | David Millar Portfolio Manager, is lead manager of Invesco Global Targeted Returns Fund. He joined |
Invesco in 2013. Mr. Millar earned a BSc (Hons) degree in mathematical statistics from the University of Cape Town. He is a Fellow of the Institute and Faculty of Actuaries. |
| | |

| | Richard Batty Portfolio Manager, is manager of Invesco Global Targeted Returns Fund. He joined Invesco |
in 2013. Mr. Batty earned a PhD in financial economics from Brunel University. |
| | |

| | Dave Jubb Portfolio Manager, is manager of Invesco Global Targeted Returns Fund. He joined Invesco |
in 2013. Mr. Jubb earned a Bsc (Hons) in mathematics from St. Andrews University. He is a Fellow of the Institute and Faculty of Actuaries. |
5 Invesco Global Targeted Returns Fund
Your Fund’s Long-Term Performance
Results of a $10,000 Investment – Oldest Share Class(es) Since Inception
Fund and index data from 12/19/13
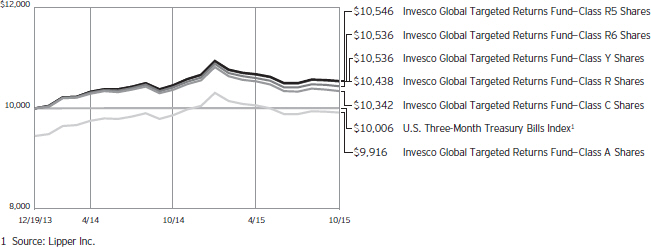
Past performance cannot guarantee comparable future results.
The data shown in the chart include reinvested distributions, applicable sales charges and Fund expenses including
management fees. Index results include reinvested dividends, but they do not reflect sales charges. Performance of the peer group, if applicable, reflects fund expenses and management fees;
performance of a market index does not. Performance shown in the chart and table(s) does not reflect deduction of taxes a shareholder would pay on Fund distributions or sale of Fund shares.
continued from page 10
| n | | A direct investment cannot be made in an index. Unless otherwise indicated, index results include reinvested dividends, and they do not reflect sales charges. Performance of the peer group, if applicable, reflects fund expenses; performance of a market index does not. |
Other information
| n | | The returns shown in management’s discussion of Fund performance are based on net asset values (NAVs) calculated for shareholder transactions. Generally accepted accounting principles require adjustments to be made to the net assets of the Fund at period end for financial reporting purposes, and as such, the NAVs for shareholder transactions and the returns based on those NAVs may differ from the NAVs and returns reported in the Financial Highlights. |
6 Invesco Global Targeted Returns Fund
| | | | |
Average Annual Total Returns | | |
As of 10/31/15, including maximum applicable sales charges | | |
| | |
Class A Shares | | | | |
Inception (12/19/13) | | -0.45% | | |
1 Year | | -5.06 | | |
| | |
Class C Shares | | | | |
Inception (12/19/13) | | 1.82% | | |
1 Year | | -0.27 | | |
| | |
Class R Shares | | | | |
Inception (12/19/13) | | 2.33% | | |
1 Year | | 0.17 | | |
| | |
Class Y Shares | | | | |
Inception (12/19/13) | | 2.84% | | |
1 Year | | 0.72 | | |
| | |
Class R5 Shares | | | | |
Inception (12/19/13) | | 2.89% | | |
1 Year | | 0.82 | | |
| | |
Class R6 Shares | | | | |
Inception (12/19/13) | | 2.84% | | |
1 Year | | 0.73 | | |
The performance data quoted represent past performance and cannot guarantee comparable future results; current performance may be lower or higher. Please visit invesco.com/performance for the most recent month-end performance. Performance figures reflect reinvested distributions, changes in net asset value and the effect of the maximum sales charge unless otherwise stated. Investment return and principal value will fluctuate so that you may have a gain or loss when you sell shares.
The net annual Fund operating expense ratio set forth in the most recent Fund prospectus as of the date of this report for Class A, Class C, Class R, Class Y, Class R5 and Class R6 shares was 1.80%, 2.55%, 2.05%, 1.55%, 1.55% and 1.55%, respectively.1,2 The total annual Fund operating expense ratio set forth in the most recent Fund prospectus as of the date of this report for Class A, Class C, Class R, Class Y, Class R5 and Class R6 shares was 3.66%, 4.41%, 3.91%, 3.41%, 3.37% and 3.37%, respectively. The expense ratios presented above may vary from the expense ratios presented in other sections of this report that are based on expenses incurred during the period covered by this report.
| | | | | |
Average Annual Total Returns | |
As of 9/30/15, the most recent calendar quarter end, including maximum applicable sales charges | |
| |
Class A Shares | | | | | |
Inception (12/19/13) | | | | -0.36 | % |
1 Year | | | | -4.09 | |
| |
Class C Shares | | | | | |
Inception (12/19/13) | | | | 2.07 | % |
1 Year | | | | -0.29 | |
| |
Class R Shares | | | | | |
Inception (12/19/13) | | | | 2.61 | % |
1 Year | | | | 1.25 | |
| |
Class Y Shares | | | | | |
Inception (12/19/13) | | | | 3.09 | % |
1 Year | | | | 1.70 | |
| |
Class R5 Shares | | | | | |
Inception (12/19/13) | | | | 3.14 | % |
1 Year | | | | 1.79 | |
| |
Class R6 Shares | | | | | |
Inception (12/19/13) | | | | 3.09 | % |
1 Year | | | | 1.80 | |
Class A share performance reflects the maximum 5.50% sales charge, and Class C share performance reflects the applicable contingent deferred sales charge (CDSC) for the period involved. The CDSC on Class C shares is 1% for the first year after purchase. Class R, Class Y, Class R5 and Class R6 class shares do not have a front-end sales charge or a CDSC; therefore, performance is at net asset value.
The performance of the Fund’s share classes will differ primarily due to different sales charge structures and class expenses.
Fund performance reflects any applicable fee waivers and/or expense reimbursements. Had the adviser not waived fees and/or reimbursed expenses currently or in the past, returns would have been lower. See current prospectus for more information.
| 1 | Total annual Fund operating expenses after any contractual fee waivers and/or expense reimbursements by the adviser in effect through February 29, 2016. See current prospectus for more information. |
| 2 | Total annual Fund operating expenses after any contractual fee waivers and/or expense reimbursements by the adviser in effect through at least June 30, 2017. See current prospectus for more information. |
7 Invesco Global Targeted Returns Fund
Invesco Global Targeted Returns Fund’s investment objective is to seek a positive total return over the long term in all market environments.
| n | | Unless otherwise stated, information presented in this report is as of October 31, 2015, and is based on total net assets. |
| n | | Unless otherwise noted, all data provided by Invesco. |
| n | | To access your Fund’s reports/prospectus, visit invesco.com/fundreports. |
About share classes
| n | | Class R shares are generally available only to employer sponsored retirement and benefit plans. Please see the prospectus for more information. |
| n | | Class Y shares are available only to certain investors. Please see the prospectus for more information. |
| n | | Class R5 shares and Class R6 shares are primarily intended for employer sponsored retirement and benefit plans that meet certain standards and for institutional investors. Please see the prospectus for more information. |
Principal risks of investing in the Fund
| n | | Changing fixed income market conditions risk. The current low interest rate environment was created in part by the Federal Reserve Board (FRB) and certain foreign central banks keeping the federal funds and equivalent foreign rates at or near zero. There is a risk that interest rates will rise when the FRB and central banks raise these rates. This risk is heightened due to the completion of the FRB’s quantitative easing program and the “tapering” of other similar foreign central bank actions. This eventual increase in the federal funds and equivalent foreign rates may expose fixed income markets to heightened volatility and reduced liquidity for certain fixed income investments, particularly those with longer maturities. In addition, decreases in fixed income dealer market-making capacity may also potentially lead to heightened volatility and reduced liquidity in the fixed income markets. As a result, the value of the Fund’s investments and share price may decline. Changes in central bank policies could also result in higher than normal shareholder redemptions, which could potentially increase portfolio turnover and the Fund’s transaction costs. |
| n | | Commodities tax risk. The tax treatment of commodity-linked derivative instruments may be adversely affected |
| | by changes in legislation, regulations or other legally binding authority. If, as a result of any such adverse action, the income of the Fund from certain commodity-linked derivatives was treated as non-qualifying income, the Fund might fail to qualify as a regulated investment company and be subject to federal income tax at the Fund level. The Internal Revenue Service has issued a number of private letter rulings to other mutual funds, including to another Invesco fund (upon which only the fund that received the private letter ruling can rely), which indicate that income from a fund’s investment in certain commodity linked notes and a wholly owned foreign subsidiary that invests in commodity-linked derivatives, such as the Subsidiary, constitutes qualifying income. However, the Internal Revenue Service suspended issuance of any further private letter rulings in July 2011 pending a review of its position. Should the Internal Revenue Service issue guidance, or Congress enact legislation, that adversely affects the tax treatment of the Fund’s use of commodity-linked notes or the Subsidiary (which guidance might be applied to the Fund retroactively), it could limit the Fund’s ability to pursue its investment strategy and the Fund might not qualify as a regulated investment company for one or more years. In this event, the Fund’s Board of Trustees (the Board) may authorize a significant change in investment strategy or Fund liquidation. The Fund also may incur transaction and other costs to comply with any new or additional guidance from the Internal Revenue Service. |
| n | | Commodity-linked notes risk. The Fund’s investments in commodity-linked notes may involve substantial risks, including risk of loss of a significant portion of their principal value. In addition to risks associated with the underlying commodities, they may be subject to additional special risks, such as the lack of a secondary trading market |
This report must be accompanied or preceded by a currently effective Fund prospectus, which contains more complete information, including sales charges and expenses. Investors should read it carefully before investing.
NOT FDIC INSURED | MAY LOSE VALUE | NO BANK GUARANTEE
| | and temporary price distortions due to speculators and/or the continuous rolling over of futures contracts underlying the notes. Commodity-linked notes are also subject to counterparty risk, which is the risk that the other party to the contract will not fulfill its contractual obligation to complete the transaction with the Fund. |
| n | | Commodity risk. The Fund may from time to time have significant investment exposure to the commodities markets, and/or a particular sector of the commodities markets, which may subject the Fund to greater volatility than investments in traditional securities, such as stocks and bonds. The commodities markets may fluctuate widely based on a variety of factors, including changes in overall market movements, domestic and foreign political and economic events and policies, war, acts of terrorism, changes in domestic or foreign interest rates and/ or investor expectations concerning interest rates, domestic and foreign inflation rates and investment and trading activities of mutual funds, hedge funds and commodities funds. Prices of various commodities may also be affected by factors such as drought, floods, weather, livestock disease, embargoes, tariffs and other regulatory developments. The prices of commodities can also fluctuate widely due to supply and demand disruptions in major producing or consuming regions. Because the Fund’s may be linked to the performance of potentially volatile commodities, investors should be willing to assume the risks of potentially significant fluctuations in the value of the Fund’s shares. |
| n | | Credit risk. The issuer of instruments in which the Fund invests may be unable to meet interest and/or principal payments, thereby causing its instruments to decrease in value and lowering the issuer’s credit rating. |
| n | | Currency/exchange rate risk. The dollar value of the Fund’s foreign investments will be affected by changes in the exchange rates between the dollar and the currencies in which those investments are traded. |
8 Invesco Global Targeted Returns Fund
| n | | Debt securities risk. The Fund may invest in debt securities that are affected by changing interest rates and changes in their effective maturities and credit quality. |
| n | | Derivatives risk. The value of a derivative instrument depends largely on (and is derived from) the value of an underlying security, currency, commodity, interest rate, index or other asset (each referred to as an underlying asset). In addition to risks relating to the underlying assets, the use of derivatives may include other, possibly greater, risks, including counterparty, leverage and liquidity risks. Counter-party risk is the risk that the counter-party to the derivative contract will default on its obligation to pay the Fund the amount owed or otherwise perform under the derivative contract. Derivatives create leverage risk because they do not require payment up front equal to the economic exposure created by owning the derivative. As a result, an adverse change in the value of the underlying asset could result in the Fund sustaining a loss that is substantially greater than the amount invested in the derivative, which may make the Fund’s returns more volatile and increase the risk of loss. Derivative instruments may also be less liquid than more traditional investments and the Fund may be unable to sell or close out its derivative positions at a desirable time or price. This risk may be more acute under adverse market conditions, during which the Fund may be most in need of liquidating its derivative positions. Derivatives may also be harder to value, less tax efficient and subject to changing government regulation that could impact the Fund’s ability to use certain derivatives or their cost. Also, derivatives used for hedging or to gain or limit exposure to a particular market segment may not provide the expected benefits, particularly during adverse market conditions. These risks are greater for the Fund than most other mutual funds because the Fund will implement its investment strategy primarily through derivative instruments rather than direct investments in stocks and bonds. |
| n | | Emerging markets securities risk. The prices of securities issued by foreign companies and governments located in emerging markets countries may be affected more negatively by inflation, devaluation of their currencies, higher transaction costs, delays in settlement, adverse political developments, the introduction of capital controls, withholding taxes, nationalization of private assets, expropriation, social unrest, war or lack of timely information than those in developed countries. |
| n | | Exchange-traded funds risk. An investment by the Fund in exchange-traded funds generally presents the same primary risks as an investment in a mutual fund. In addition, an exchange-traded fund may be subject to the following: (1) a discount of the exchange-traded fund’s shares to its net asset value; (2) failure to develop an active trading market for the exchange-traded fund’s shares; (3) the listing exchange halting trading of the exchange-traded fund’s shares; (4) failure of the exchange-traded fund’s shares to track the referenced asset; and (5) holding troubled securities in the referenced index or basket of investments. Exchange-traded funds may involve duplication of management fees and certain other expenses, as the Fund indirectly bears its proportionate share of any expenses paid by the exchange-traded funds in which it invests. Further, certain of the exchange-traded funds in which the Fund may invest are leveraged. The more the Fund invests in such leveraged exchange-traded funds, the more this leverage will magnify any losses on those investments. |
| n | | Exchange-traded notes risk. Exchange-traded notes are subject to credit risk, including the credit risk of the issuer, and the value of the exchange-traded note may drop due to a downgrade in the issuer’s credit rating, despite the underlying market benchmark or strategy remaining unchanged. The value of an exchange-traded note may also be influenced by time to maturity, level of supply and demand for the exchange-traded note, volatility and lack of liquidity in the underlying market, changes in the applicable interest rates, changes |
| | | in the issuer’s credit rating, and economic, legal, political, or geographic events that affect the referenced underlying market or strategy. Exchange-traded notes are also subject to the risk that the other party to the contract will not fulfill its contractual obligations, which may cause losses or additional costs to the Fund. |
| n | | Foreign government debt risk. Investments in foreign government debt obligations involve certain risks in addition to those relating to foreign securities or debt securities generally. The issuer of the debt or the governmental authorities that control the repayment of the debt may be unable or unwilling to repay principal or interest when due in accordance with the terms of such debt, and the Fund may have limited recourse in the event of a default against the defaulting government. Without the approval of debt holders, some governmental debtors have in the past been able to reschedule or restructure their debt payments or declare moratoria on payments. |
| n | | Foreign securities risk. The Fund’s foreign investments may be affected by changes in a foreign country’s exchange rates, political and social instability, changes in economic or taxation policies, difficulties when enforcing obligations, decreased liquidity, and increased volatility. Foreign companies may be subject to less regulation resulting in less publicly available information about the companies. |
| n | | Fund of funds risk. The Fund’s performance depends on the underlying funds in which it invests, and it is subject to the risks of the underlying funds. Market fluctuations may change the target weightings in the underlying funds. The underlying funds may change their investment objectives, policies or practices and may not achieve their investment objectives, all of which may cause the Fund to withdraw its investments therein at a disadvantageous time. |
| n | | High yield bond (junk bond) risk. Junk bonds involve a greater risk of default or price changes due to changes in the credit quality of the issuer. The values of junk bonds fluctuate more than |
continued on page 10
9 Invesco Global Targeted Returns Fund
continued from page 9
| | those of high- quality bonds in re- sponse to company, political, regulatory or economic developments. Values of junk bonds can decline significantly over short periods of time. |
| n | | Interest rate risk. Interest rate risk refers to the risk that bond prices generally fall as interest rates rise; conversely, bond prices generally rise as interest rates fall. Specific bonds differ in their sensitivity to changes in interest rates depending on their individual characteristics, including duration. |
| n | | Investing in the European Union risk. Many countries in the European Union are susceptible to high economic risks associated with high levels of debt, notably due to investments in sovereign debts of European countries such as Greece, Italy and Spain. One or more member states might exit the European Union, placing its currency and banking system in jeopardy. The European Union faces major issues involving its membership, structure, procedures and policies, including the adoption, abandonment or adjustment of the new con- stitutional treaty, the European Union’s enlargement to the south and east, and resolution of the European Union’s problematic fiscal and democratic ac- countability. Efforts of the member states to further unify their economic and monetary policies may increase the potential for the downward movement of one member state’s market to cause a similar effect on other member states’ markets. European countries that are part of the European Economic and Monetary Union may be significantly af- fected by the tight fiscal and monetary controls that the union seeks to impose on its members. |
| n | | Leverage risk. Leverage exists when the Fund purchases or sells an instrument or enters into a transaction without investing cash in an amount equal to the full economic exposure of the instru- ment or transaction and the Fund could lose more than it invested. Leverage created from borrowing or certain types of transactions or instruments, such as derivatives, may impair the Fund’s liquidity, cause it to liquidate positions at an unfavorable time, increase volatility or otherwise not achieve its intended objective. The Fund’s significant use of derivatives and leverage could, under certain market conditions, cause the Fund’s losses to be more significant than other mutual funds and, in extreme |
| | market conditions, could cause a complete loss of your investment. |
| n | | Liquidity risk. The Fund may hold illiquid securities that it is unable to sell at the preferred time or price and could lose its entire investment in such securities. The Fund’s significant use of derivative instruments may cause liquidity risk to be greater than other mutual funds that invest in more traditional assets such as stocks and bonds, which trade on mar- kets with more market participants. |
| n | | Management risk. The investment techniques and risk analysis used by the Fund’s portfolio managers may not produce the desired results. Because the Fund’s investment process relies heavily on its asset allocation process, market movements that are counter to the portfolio managers’ expectations may have a significant adverse effect on the Fund’s net asset value. Further, the portfolio managers’ use of short derivative positions and instruments that provide economic leverage increases the volatility of the Fund’s net asset value, which increases the potential of greater losses that may cause the Fund to liquidate positions when it may not be advantageous to do so. |
| n | | Market risk. The prices of and the income generated by the Fund’s securities may decline in response to, among other things, investor sentiment, general economic and market conditions, regional or global instability, and currency and interest rate fluctuations. |
| n | | Non-diversification risk. The Fund is non- diversified and can invest a greater portion of its assets in a small number of issuers or a single issuer. A change in the value of the issuer could affect the value of the Fund more than if it was a diversified fund. Non-diversification may also permit the Fund to invest a greater per- centage of its assets in one particular investment strategy than would be permitted if the Fund was diversified, thereby increasing the risk of losses in the Fund due to a single strategy. |
| n | | Short sales risk. Short sales may cause the Fund to repurchase a security at a higher price, thereby causing a loss. As there is no limit on how much the price of the security can increase, the Fund’s exposure is unlimited. |
| n | | Small- and mid-capitalization risks. Stocks of small- and mid-sized companies tend to be more vulnerable to adverse developments and may have little or no operating history or track record |
| | of success, and limited product lines, markets, management and financial resources. The securities of small- and mid-sized companies may be more volatile due to less market interest and less publicly available information about the issuer. They also may be illiquid or restricted as to resale, or may trade less frequently and in smaller volumes, all of which may cause difficulty when establishing or closing a position at a desirable price. |
| n | | Subsidiary risk. By investing in the Subsidiary, the Fund is indirectly exposed to risks associated with the Subsidiary’s investments. The Subsidiary is not registered under the Investment Company Act of 1940, as amended (1940 Act), and, except as otherwise noted in this prospectus is not subject to the investor protections of the 1940 Act. Changes in the laws of the United States and/or the Cayman Islands, under which the Fund and the Subsidiary, respectively, are organized, could result in the inability of the Fund and/or the Subsidiary to operate as described in this prospectus and could negatively affect the Fund and its shareholders. |
| n | | US government obligations risk. The Fund may invest in obligations issued by US government agencies and instrumentalities that may receive varying levels of support from the government, which could affect the Fund’s ability to recover should they default. |
| n | | Volatility risk. The Fund may have investments that appreciate or decrease significantly in value over short periods of time. This may cause the Fund’s net asset value per share to experience significant increases or declines in value over short periods of time. |
About indexes used in this report
| n | | The U.S. Three-Month Treasury Bills Index is tracked by Lipper to provide performance for the three-month US Treasury bill. |
| n | | The MSCI World IndexSM is an unmanaged index considered representative of stocks of developed countries. The index is computed using the net return, which withholds applicable taxes for non-resident investors. |
| n | | The Fund is not managed to track the performance of any particular index, including the index(es) described here, and consequently, the performance of the Fund may deviate significantly from the performance of the index(es). |
continued on page 6
10 Invesco Global Targeted Returns Fund
Consolidated Schedule of Investments
October 31, 2015
Investments in Affiliated Issuers–82.89%(a)
| | | | | | | | | | | | | | | | | | | | | | | | | | | | | | | | | | | | |
| | | % of
Net
Assets
10/31/15 | | | Value 10/31/14 | | | Purchases
at Cost | | | Proceeds
from Sales | | | Change in
Unrealized
Appreciation
(Depreciation) | | | Realized
Gain | | | Dividend
Income | | | Shares
10/31/15 | | | Value
10/31/15 | |
Domestic Equity Funds–5.84% | |
Invesco Comstock Fund–Class R6 | | | — | | | $ | 4,320,674 | | | $ | 1,266,276 | | | $ | (5,666,495 | ) | | $ | (219,851 | ) | | $ | 299,396 | | | $ | 36,276 | | | | — | | | $ | — | |
Invesco Diversified Dividend Fund–Class R6 | | | 5.84 | % | | | 2,641,686 | | | | 5,507,869 | | | | (67,780 | ) | | | 162,747 | | | | 51,383 | | | | 89,735 | | | | 438,737 | | | | 8,243,871 | |
Total Domestic Equity Funds | | | | | | | 6,962,360 | | | | 6,774,145 | | | | (5,734,275 | ) | | | (57,104 | ) | | | 350,779 | | | | 126,011 | | | | | | | | 8,243,871 | |
|
Fixed-Income Funds–11.78% | |
Invesco High Yield Fund–Class R6 | | | 11.78 | % | | | 5,038,366 | | | | 12,290,188 | | | | — | | | | (714,446 | ) | | | — | | | | 585,373 | | | | 4,022,786 | | | | 16,614,108 | |
|
Foreign Equity Funds–27.93% | |
Invesco Asia Pacific Growth Fund–Class Y | | | 7.95 | % | | | 5,329,933 | | | | 7,206,347 | | | | (230,847 | ) | | | (1,060,507 | ) | | | 123,419 | | | | 78,956 | | | | 380,735 | | | | 11,216,454 | |
Invesco European Growth Fund–Class Y | | | 9.88 | % | | | 4,319,208 | | | | 9,893,847 | | | | (270,346 | ) | | | 43,546 | | | | 126,894 | | | | 90,793 | | | | 379,042 | | | | 13,933,595 | |
Invesco International Growth Fund–Class R6 | | | 10.10 | % | | | 4,393,322 | | | | 10,325,089 | | | | — | | | | (477,251 | ) | | | 139,665 | | | | 72,591 | | | | 438,460 | | | | 14,241,160 | |
Total Foreign Equity Funds | | | | | | | 14,042,463 | | | | 27,425,283 | | | | (501,193 | ) | | | (1,494,212 | ) | | | 389,978 | | | | 242,340 | | | | | | | | 39,391,209 | |
|
Money Market Funds–37.34% | |
Liquid Assets Portfolio–Institutional Class, 0.16%(b) | | | 16.64 | % | | | 1,983,391 | | | | 66,555,933 | | | | (45,063,362 | ) | | | — | | | | — | | | | 12,466 | | | | 23,475,962 | | | | 23,475,962 | |
Premier Portfolio–Institutional Class, 0.12%(b) | | | 16.64 | % | | | 1,983,392 | | | | 66,555,933 | | | | (45,063,362 | ) | | | — | | | | — | | | | 7,928 | | | | 23,475,963 | | | | 23,475,963 | |
STIC (Global Series) PLC–U.S. Dollar Liquidity Portfolio (Ireland)–Institutional Class, 0.10%(b)(c) | | | 4.06 | % | | | — | | | | 6,674,065 | | | | (949,331 | ) | | | — | | | | — | | | | 3,253 | | | | 5,724,734 | | | | 5,724,734 | |
Total Money Market Funds | | | | | | | 3,966,783 | | | | 139,785,931 | | | | (91,076,055 | ) | | | — | | | | — | | | | 23,647 | | | | | | | | 52,676,659 | |
TOTAL INVESTMENTS IN AFFILIATED ISSUERS (Cost $118,569,903) | | | 82.89 | % | | $ | 30,009,972 | | | $ | 186,275,547 | | | $ | (97,311,523 | ) | | $ | (2,265,762 | ) | | $ | 740,757 | (d) | | $ | 977,371 | | | | | | | $ | 116,925,847 | |
| | | | | | | | | | | | | | | | | | | | | | | | |
| | | | | | | | | |
| | | | | | | | | | | | | | | | | | Principal
Amount | | | | |
Sovereign Debt–4.89(e) | |
Hungary Government Bond (Hungary), Series 23, Class A, Unsec. Bonds, 6.00%, 11/24/2023 | | | HUF | | | | 88,330,000 | | | | 371,521 | |
Hungary Government Bond (Hungary), Series 25, Class B, Unsec. Bonds, 5.50%, 06/24/2025 | | | HUF | | | | 244,410,000 | | | | 1,016,443 | |
Mexico Government Bond (Mexico), Series M 20, Sr. Unsec. Bonds, 10.00%, 12/05/2024 | | | MXN | | | | 17,705,700 | | | | 1,374,492 | |
Poland Government Bond (Poland), Series 0725, Unsec. Bonds, 3.25%, 07/25/2025 | | | PLN | | | | 5,823,000 | | | | 1,583,324 | |
Poland Government Bond (Poland), Series 1023, Unsec. Bonds, 4.00%, 10/25/2023 | | | PLN | | | | 4,124,000 | | | | 1,178,042 | |
South Africa Government Bond (South Africa), Series R186, Unsec. Bonds, 10.50%, 12/21/2026 | | | ZAR | | | | 16,394,000 | | | | 1,368,085 | |
Total Sovereign Debt (Cost $7,467,145) | | | | | | | | | | | | | 6,891,907 | |
OPTIONS PURCHASED–6.07% (Cost $9,042,083) | | | | | | | | | | | | | 8,557,537 | |
TOTAL INVESTMENTS–93.85% (Cost $135,079,131) | | | | | | | | | | | | | 132,375,291 | |
OTHER ASSETS LESS LIABILITIES–6.15% | | | | | | | | | | | | | 8,675,350 | |
NET ASSETS–100.00% | | | | | | | | | | | | $ | 141,050,641 | |
Abbreviations:
| | |
| HUF | | – Hungarian Forint |
| MXN | | – Mexican Peso |
| | |
| PLN | | – Polish Zloty |
| Sr. | | – Senior |
| | |
| Unsec. | | – Unsecured |
| ZAR | | – South African Rand |
Notes to Consolidated Schedule of Investments:
| (a) | Each underlying fund and the Fund are affiliated by either having the same investment adviser or an investment adviser under common control with the Fund’s investment adviser. |
| (b) | The rate shown is the 7-day SEC standardized yield as of October 31, 2015. |
| (c) | The investment is owned by the Subsidiary. See Note 5. |
| (d) | Includes $52,034, $151,891, $179,554 and $139,665 of capital gains distributions from Invesco Diversified Dividend Fund, Invesco Asia Pacific Growth Fund, Invesco European Growth Fund and Invesco International Growth Fund, respectively. |
| (e) | Foreign denominated security. Principal amount is denominated in the currency indicated. |
See accompanying Notes to Consolidated Financial Statements which are an integral part of the financial statements.
11 Invesco Global Targeted Returns Fund
| | | | | | | | | | | | | | | | | | | | | | | | | | | | | | | | | | |
| Open Over-The-Counter Index Options Purchased | |
| Description | | Type of
Contract | | | Broker/Counterparty | | Expiration
Date | | | Number of
Contracts | | | Strike
Price | | | Notional
Value(f) | | | Value | |
HS Index | | | Call | | | Goldman Sachs International | | | 12/30/15 | | | | 6 | | | | HKD | | | | 24,400 | | | | HKD | | | | 7,320,000 | | | $ | 5,969 | |
HS Index | | | Call | | | HSBC New York | | | 12/30/15 | | | | 6 | | | | HKD | | | | 24,800 | | | | HKD | | | | 7,440,000 | | | | 3,973 | |
HS Index | | | Call | | | Societe Generale | | | 12/30/15 | | | | 82 | | | | HKD | | | | 23,800 | | | | HKD | | | | 97,580,000 | | | | 146,350 | |
HSCE Index | | | Call | | | Goldman Sachs International | | | 12/30/15 | | | | 180 | | | | HKD | | | | 11,000 | | | | HKD | | | | 99,000,000 | | | | 231,924 | |
HSCE Index | | | Call | | | Goldman Sachs International | | | 12/30/15 | | | | 12 | | | | HKD | | | | 11,400 | | | | HKD | | | | 6,840,000 | | | | 8,585 | |
HSCE Index | | | Call | | | HSBC New York | | | 12/30/15 | | | | 12 | | | | HKD | | | | 11,800 | | | | HKD | | | | 7,080,000 | | | | 4,655 | |
Subtotal — Over-The-Counter Index Call Options Purchased | | | | 298 | | | | | | | | | | | | | | | | | | | $ | 401,456 | |
M1EF Index | | | Put | | | UBS | | | 03/18/16 | | | | 14 | | | | USD | | | | 310 | | | | USD | | | | 434,000 | | | $ | 9,001 | |
M1EF Index | | | Put | | | UBS | | | 03/18/16 | | | | 204 | | | | USD | | | | 310 | | | | USD | | | | 6,324,000 | | | | 131,162 | |
M1EF Index | | | Put | | | UBS | | | 03/18/16 | | | | 16 | | | | USD | | | | 300 | | | | USD | | | | 480,000 | | | | 8,204 | |
Subtotal — Over-The-Counter Index Put Options Purchased | | | | 234 | | | | | | | | | | | | | | | | | | | $ | 148,367 | |
Total Over-The-Counter Index Options Purchased | | | | 532 | | | | | | | | | | | | | | | | | | | $ | 549,823 | |
|
| Open Exchange-Traded Index Options Purchased | |
FTSE MIB Index | | | Put | | | Bank of America Merrill Lynch | | | 03/18/15 | | | | 356 | | | | EUR | | | | 20,500 | | | | EUR | | | | 18,245,000 | | | $ | 529,494 | |
FTSE MIB Index | | | Put | | | Bank of America Merrill Lynch | | | 12/09/15 | | | | 8 | | | | EUR | | | | 20,500 | | | | EUR | | | | 410,000 | | | | 3,739 | |
Nikkei 225 Index | | | Put | | | Bank of America Merrill Lynch | | | 12/09/16 | | | | 4 | | | | JPY | | | | 17,750 | | | | JPY | | | | 71,000,000 | | | | 39,115 | |
Nikkei 225 Index | | | Put | | | Bank of America Merrill Lynch | | | 12/09/16 | | | | 6 | | | | JPY | | | | 17,500 | | | | JPY | | | | 105,000,000 | �� | | | 54,197 | |
Nikkei 225 Index | | | Put | | | Bank of America Merrill Lynch | | | 12/09/16 | | | | 4 | | | | JPY | | | | 17,000 | | | | JPY | | | | 68,000,000 | | | | 30,496 | |
Nikkei 225 Index | | | Put | | | Bank of America Merrill Lynch | | | 12/09/16 | | | | 4 | | | | JPY | | | | 16,750 | | | | JPY | | | | 67,000,000 | | | | 28,176 | |
Nikkei 225 Index | | | Put | | | Bank of America Merrill Lynch | | | 12/09/16 | | | | 6 | | | | JPY | | | | 16,250 | | | | JPY | | | | 97,500,000 | | | | 35,552 | |
Nikkei 225 Index | | | Put | | | Bank of America Merrill Lynch | | | 12/09/16 | | | | 24 | | | | JPY | | | | 14,500 | | | | JPY | | | | 348,000,000 | | | | 77,567 | |
Nikkei 225 Index | | | Put | | | Goldman Sachs International | | | 12/09/16 | | | | 54 | | | | JPY | | | | 17,000 | | | | JPY | | | | 918,000,000 | | | | 411,701 | |
Nikkei 225 Index | | | Put | | | Goldman Sachs International | | | 12/09/16 | | | | 2 | | | | JPY | | | | 15,500 | | | | JPY | | | | 31,000,000 | | | | 9,199 | |
Nikkei 225 Index | | | Put | | | Goldman Sachs International | | | 12/09/16 | | | | 18 | | | | JPY | | | | 15,250 | | | | JPY | | | | 274,500,000 | | | | 75,329 | |
Nikkei 225 Index | | | Put | | | UBS | | | 12/09/16 | | | | 6 | | | | JPY | | | | 17,750 | | | | JPY | | | | 106,500,000 | | | | 58,672 | |
SX5E Index | | | Put | | | Goldman Sachs International | | | 03/18/16 | | | | 892 | | | | EUR | | | | 3,150 | | | | EUR | | | | 2,809,800 | | | | 838,697 | |
SX7E Index | | | Put | | | Bank of America Merrill Lynch | | | 12/16/16 | | | | 359 | | | | EUR | | | | 140 | | | | EUR | | | | 2,513,000 | | | | 342,482 | |
SX7E Index | | | Put | | | Bank of America Merrill Lynch | | | 12/16/15 | | | | 100 | | | | EUR | | | | 120 | | | | EUR | | | | 600,000 | | | | 47,012 | |
SX7E Index | | | Put | | | Bank of America Merrill Lynch | | | 12/16/16 | | | | 48 | | | | EUR | | | | 130 | | | | EUR | | | | 312,000 | | | | 32,727 | |
SX7E Index | | | Put | | | Bank of America Merrill Lynch | | | 12/18/15 | | | | 505 | | | | EUR | | | | 140 | | | | EUR | | | | 3,535,000 | | | | 177,711 | |
SX7E Index | | | Put | | | Bank of America Merrill Lynch | | | 12/18/15 | | | | 180 | | | | EUR | | | | 120 | | | | EUR | | | | 1,080,000 | | | | 9,402 | |
SX7E Index | | | Put | | | Bank of America Merrill Lynch | | | 12/18/15 | | | | 148 | | | | EUR | | | | 135 | | | | EUR | | | | 999,000 | | | | 32,551 | |
SX7E Index | | | Put | | | Bank of America Merrill Lynch | | | 12/18/15 | | | | 46 | | | | EUR | | | | 110 | | | | EUR | | | | 253,000 | | | | 1,012 | |
SX7E Index | | | Put | | | Citigroup Global Markets Inc. | | | 12/16/16 | | | | 82 | | | | EUR | | | | 140 | | | | EUR | | | | 574,000 | | | | 78,227 | |
SX7E Index | | | Put | | | Deutsche Bank Securities Inc. | | | 12/18/15 | | | | 42 | | | | EUR | | | | 130 | | | | EUR | | | | 273,000 | | | | 5,773 | |
SX7E Index | | | Put | | | Goldman Sachs International | | | 12/18/15 | | | | 24 | | | | EUR | | | | 140 | | | | EUR | | | | 168,000 | | | | 8,446 | |
SX7E Index | | | Put | | | Goldman Sachs International | | | 12/16/15 | | | | 106 | | | | EUR | | | | 120 | | | | EUR | | | | 636,000 | | | | 49,833 | |
SX7E Index | | | Put | | | Goldman Sachs International | | | 12/16/16 | | | | 90 | | | | EUR | | | | 140 | | | | EUR | | | | 630,000 | | | | 85,860 | |
SX7E Index | | | Put | | | Morgan Stanley Capital Services LLC | | | 12/16/15 | | | | 136 | | | | EUR | | | | 120 | | | | EUR | | | | 816,000 | | | | 63,937 | |
SX7E Index | | | Put | | | Morgan Stanley Capital Services LLC | | | 12/18/15 | | | | 7 | | | | EUR | | | | 130 | | | | EUR | | | | 45,500 | | | | 962 | |
SX7E Index | | | Put | | | Nomura Securities International Inc. | | | 12/18/15 | | | | 141 | | | | EUR | | | | 130 | | | | EUR | | | | 916,500 | | | | 96,136 | |
SX7E Index | | | Put | | | UBS | | | 12/16/16 | | | | 166 | | | | EUR | | | | 140 | | | | EUR | | | | 1,162,000 | | | | 158,362 | |
SX7E Index | | | Put | | | UBS | | | 12/18/15 | | | | 105 | | | | EUR | | | | 140 | | | | EUR | | | | 735,000 | | | | 36,950 | |
SX7E Index | | | Put | | | UBS | | | 12/18/15 | | | | 70 | | | | EUR | | | | 130 | | | | EUR | | | | 455,000 | | | | 9,622 | |
UKX Index | | | Put | | | Bank of America Merrill Lynch | | | 12/18/15 | | | | 42 | | | | GBP | | | | 6,750 | | | | GBP | | | | 2,835,000 | | | | 281,363 | |
UKX Index | | | Put | | | Bank of America Merrill Lynch | | | 12/18/15 | | | | 19 | | | | GBP | | | | 6,900 | | | | GBP | | | | 1,311,000 | | | | 170,199 | |
UKX Index | | | Put | | | Bank of America Merrill Lynch | | | 12/18/15 | | | | 15 | | | | GBP | | | | 6,400 | | | | GBP | | | | 960,000 | | | | 38,622 | |
UKX Index | | | Put | | | Bank of America Merrill Lynch | | | 12/18/15 | | | | 14 | | | | GBP | | | | 6,500 | | | | GBP | | | | 910,000 | | | | 48,891 | |
UKX Index | | | Put | | | Bank of America Merrill Lynch | | | 12/18/15 | | | | 5 | | | | GBP | | | | 6,450 | | | | GBP | | | | 322,500 | | | | 15,033 | |
UKX Index | | | Put | | | Bank of America Merrill Lynch | | | 12/18/15 | | | | 2 | | | | GBP | | | | 6,600 | | | | GBP | | | | 132,000 | | | | 9,266 | |
See accompanying Notes to Consolidated Financial Statements which are an integral part of the financial statements.
12 Invesco Global Targeted Returns Fund
| | | | | | | | | | | | | | | | | | | | | | | | | | | | | | | | | | |
| Open Exchange-Traded Index Options Purchased��(continued) | |
| Description | | Type of
Contract | | | Broker/Counterparty | | Expiration
Date | | | Number of
Contracts | | | Strike
Price | | | Notional
Value(f) | | | Value | |
UKX Index | | | Put | | | Goldman Sachs International | | | 12/16/15 | | | | 52 | | | | GBP | | | | 5,700 | | | | GBP | | | | 2,964,000 | | | $ | 219,676 | |
UKX Index | | | Put | | | Morgan Stanley Capital Services LLC | | | 12/16/15 | | | | 22 | | | | GBP | | | | 6,100 | | | | GBP | | | | 1,342,000 | | | | 137,714 | |
UKX Index | | | Put | | | Morgan Stanley Capital Services LLC | | | 12/18/15 | | | | 20 | | | | GBP | | | | 6,900 | | | | GBP | | | | 1,380,000 | | | | 179,157 | |
UKX Index | | | Put | | | Nomura Securities International Inc. | | | 12/16/15 | | | | 3 | | | | GBP | | | | 6,200 | | | | GBP | | | | 186,000 | | | | 20,676 | |
UKX Index | | | Put | | | UBS | | | 12/18/15 | | | | 7 | | | | GBP | | | | 6,600 | | | | GBP | | | | 462,000 | | | | 32,432 | |
Subtotal — Exchange-Traded Index Put Options Purchased | | | | 3,940 | | | | | | | $ | 4,581,968 | |
Total Index Options Purchased — Equity Risk | | | | 4,472 | | | | | | | $ | 5,131,791 | |
Abbreviations:
| | |
| EUR | | – Euro |
| GBP | | – British Pound Sterling |
| JPY | | – Japanese Yen |
| (f) | Notional Value is calculated by multiplying the Number of Contracts by the Strike Price by the multiplier. |
| | | | | | | | | | | | | | | | | | | | | | | | | | | | | | |
| Open Over-The-Counter Foreign Currency Options Purchased | |
| Description | | Type of
Contract | | | Counterparty | | Expiration
Date | | | Strike
Price | | | Notional
Value | | | Value | |
EUR versus USD | | | Call | | | Citigroup Global Markets Inc. | | | 01/19/16 | | | | USD | | | | 1.216 | | | | EUR | | | | 363,370 | | | $ | 199 | |
EUR versus USD | | | Call | | | Citigroup Global Markets Inc. | | | 01/19/16 | | | | USD | | | | 1.261 | | | | EUR | | | | 455,000 | | | | 46 | |
EUR versus USD | | | Call | | | Deutsche Bank Securities Inc. | | | 01/19/16 | | | | USD | | | | 1.234 | | | | EUR | | | | 320,544 | | | | 88 | |
EUR versus USD | | | Call | | | Deutsche Bank Securities Inc. | | | 01/19/16 | | | | USD | | | | 1.247 | | | | EUR | | | | 8,479,000 | | | | 1,414 | |
EUR versus USD | | | Call | | | Goldman Sachs International | | | 01/19/16 | | | | USD | | | | 1.231 | | | | EUR | | | | 422,926 | | | | 130 | |
USD versus CAD | | | Call | | | Barclays Bank PLC | | | 07/15/20 | | | | CAD | | | | 1.245 | | | | USD | | | | 4,309,000 | | | | 416,188 | |
USD versus CAD | | | Call | | | Deutsche Bank Securities Inc. | | | 07/15/20 | | | | CAD | | | | 1.245 | | | | USD | | | | 4,309,000 | | | | 416,189 | |
USD versus CAD | | | Call | | | Goldman Sachs International | | | 08/25/20 | | | | CAD | | | | 1.282 | | | | USD | | | | 648,000 | | | | 55,105 | |
USD versus CAD | | | Call | | | Goldman Sachs International | | | 08/25/20 | | | | CAD | | | | 1.306 | | | | USD | | | | 1,020,000 | | | | 79,412 | |
Subtotal — Over-The-Counter Foreign Currency Call Options Purchased | | | | | | | | | | | | | | | | | | | | | | $ | 968,771 | |
EUR versus USD | | | Put | | | Barclays Bank PLC | | | 01/13/20 | | | | USD | | | | 1.270 | | | | EUR | | | | 338,440 | | | $ | 49,263 | |
EUR versus USD | | | Put | | | Barclays Bank PLC | | | 01/27/20 | | | | USD | | | | 1.222 | | | | EUR | | | | 640,440 | | | | 75,022 | |
EUR versus USD | | | Put | | | Barclays Bank PLC | | | 03/12/20 | | | | USD | | | | 1.170 | | | | EUR | | | | 132,118 | | | | 11,998 | |
EUR versus USD | | | Put | | | Barclays Bank PLC | | | 04/03/20 | | | | USD | | | | 1.172 | | | | EUR | | | | 431,984 | | | | 39,712 | |
EUR versus USD | | | Put | | | Barclays Bank PLC | | | 04/22/20 | | | | USD | | | | 1.172 | | | | EUR | | | | 351,372 | | | | 32,301 | |
EUR versus USD | | | Put | | | Barclays Bank PLC | | | 05/12/20 | | | | USD | | | | 1.225 | | | | EUR | | | | 119,640 | | | | 14,213 | |
EUR versus USD | | | Put | | | Barclays Bank PLC | | | 06/03/20 | | | | USD | | | | 1.218 | | | | EUR | | | | 509,824 | | | | 58,615 | |
EUR versus USD | | | Put | | | Barclays Bank PLC | | | 06/26/20 | | | | USD | | | | 1.220 | | | | EUR | | | | 578,405 | | | | 67,039 | |
EUR versus USD | | | Put | | | Barclays Bank PLC | | | 07/10/20 | | | | USD | | | | 1.213 | | | | EUR | | | | 477,259 | | | | 53,544 | |
EUR versus USD | | | Put | | | Barclays Bank PLC | | | 07/16/20 | | | | USD | | | | 1.188 | | | | EUR | | | | 437,856 | | | | 43,645 | |
EUR versus USD | | | Put | | | Citigroup Global Markets Inc. | | | 08/25/20 | | | | USD | | | | 1.228 | | | | EUR | | | | 353,889 | | | | 42,489 | |
EUR versus USD | | | Put | | | Citigroup Global Markets Inc. | | | 08/25/20 | | | | USD | | | | 1.194 | | | | EUR | | | | 363,370 | | | | 37,214 | |
EUR versus USD | | | Put | | | Deutsche Bank Securities Inc. | | | 07/01/20 | | | | USD | | | | 1.210 | | | | EUR | | | | 358,640 | | | | 39,710 | |
EUR versus USD | | | Put | | | Deutsche Bank Securities Inc. | | | 08/25/20 | | | | USD | | | | 1.205 | | | | EUR | | | | 320,544 | | | | 34,650 | |
EUR versus USD | | | Put | | | Goldman Sachs International | | | 01/21/20 | | | | USD | | | | 1.253 | | | | EUR | | | | 310,284 | | | | 41,904 | |
EUR versus USD | | | Put | | | Goldman Sachs International | | | 02/06/20 | | | | USD | | | | 1.234 | | | | EUR | | | | 238,027 | | | | 29,468 | |
EUR versus USD | | | Put | | | Goldman Sachs International | | | 04/15/20 | | | | USD | | | | 1.159 | | | | EUR | | | | 618,354 | | | | 53,227 | |
EUR versus USD | | | Put | | | Goldman Sachs International | | | 07/29/20 | | | | USD | | | | 1.204 | | | | EUR | | | | 200,000 | | | | 21,525 | |
EUR versus USD | | | Put | | | Goldman Sachs International | | | 08/25/20 | | | | USD | | | | 1.210 | | | | EUR | | | | 422,926 | | | | 46,682 | |
EUR versus USD | | | Put | | | Goldman Sachs International | | | 12/12/19 | | | | USD | | | | 1.350 | | | | EUR | | | | 2,792,791 | | | | 560,941 | |
GBP versus NOK | | | Put | | | Barclays Bank PLC | | | 06/14/16 | | | | NOK | | | | 11.504 | | | | GBP | | | | 385,823 | | | | 1,588 | |
GBP versus NOK | | | Put | | | Barclays Bank PLC | | | 06/14/16 | | | | NOK | | | | 11.560 | | | | GBP | | | | 321,453 | | | | 1,467 | |
GBP versus NOK | | | Put | | | Barclays Bank PLC | | | 06/14/16 | | | | NOK | | | | 11.813 | | | | GBP | | | | 188,495 | | | | 1,361 | |
GBP versus NOK | | | Put | | | Barclays Bank PLC | | | 06/14/16 | | | | NOK | | | | 11.858 | | | | GBP | | | | 150,000 | | | | 1,173 | |
GBP versus NOK | | | Put | | | Barclays Bank PLC | | | 06/14/16 | | | | NOK | | | | 12.052 | | | | GBP | | | | 311,141 | | | | 3,423 | |
See accompanying Notes to Consolidated Financial Statements which are an integral part of the financial statements.
13 Invesco Global Targeted Returns Fund
| | | | | | | | | | | | | | | | | | | | | | | | | | | | | | |
| Open Over-The-Counter Foreign Currency Options Purchased—(continued) | |
| Description | | Type of
Contract | | | Counterparty | | Expiration
Date | | | Strike
Price | | | Notional
Value | | | Value | |
GBP versus NOK | | | Put | | | Citigroup Global Markets Inc. | | | 06/14/16 | | | | NOK | | | | 11.643 | | | | GBP | | | | 301,747 | | | $ | 1,602 | |
GBP versus NOK | | | Put | | | Deutsche Bank Securities Inc. | | | 06/14/16 | | | | NOK | | | | 11.510 | | | | GBP | | | | 238,538 | | | | 993 | |
GBP versus NOK | | | Put | | | Deutsche Bank Securities Inc. | | | 06/14/16 | | | | NOK | | | | 11.866 | | | | GBP | | | | 410,550 | | | | 3,259 | |
GBP versus NOK | | | Put | | | Goldman Sachs International | | | 06/14/16 | | | | NOK | | | | 11.205 | | | | GBP | | | | 4,400,000 | | | | 10,416 | |
USD versus JPY | | | Put | | | Barclays Bank PLC | | | 09/09/16 | | | | JPY | | | | 119.300 | | | | USD | | | | 7,020,000 | | | | 220,603 | |
USD versus JPY | | | Put | | | Barclays Bank PLC | | | 09/09/16 | | | | JPY | | | | 119.630 | | | | USD | | | | 3,017,000 | | | | 98,943 | |
USD versus JPY | | | Put | | | Barclays Bank PLC | | | 09/09/16 | | | | JPY | | | | 119.650 | | | | USD | | | | 2,251,800 | | | | 74,041 | |
USD versus JPY | | | Put | | | Citigroup Global Markets Inc. | | | 09/09/16 | | | | JPY | | | | 119.300 | | | | USD | | | | 743,000 | | | | 23,349 | |
USD versus JPY | | | Put | | | Deutsche Bank Securities Inc. | | | 09/09/16 | | | | JPY | | | | 118.050 | | | | USD | | | | 3,723,000 | | | | 99,182 | |
USD versus JPY | | | Put | | | Goldman Sachs International | | | 09/09/16 | | | | JPY | | | | 118.050 | | | | USD | | | | 5,789,000 | | | | 154,221 | |
USD versus KRW | | | Put | | | Deutsche Bank Securities Inc. | | | 09/09/16 | | | | KRW | | | | 1,170.490 | | | | USD | | | | 1,727,000 | | | | 97,961 | |
USD versus KRW | | | Put | | | Goldman Sachs International | | | 09/09/16 | | | | KRW | | | | 1,156.000 | | | | USD | | | | 4,141,692 | | | | 201,460 | |
Subtotal — Over-The-Counter Foreign Currency Put Options Purchased | | | | | | | $ | 2,348,204 | |
Total Over-The-Counter Foreign Currency Options Purchased — Currency Risk | | | | | | | $ | 3,316,975 | |
Abbreviations:
| | |
| CAD | | – Canadian Dollar |
| EUR | | – Euro |
| GBP | | – British Pound Sterling |
| | |
| JPY | | – Japanese Yen |
| KRW | | – South Korean Won |
| | |
| NOK | | – Norwegian Krone |
| USD | | – U.S. Dollar |
| | | | | | | | | | | | | | | | | | | | | | | | | | | | | | |
| Open Over-The-Counter Swaptions Purchased | |
| Description | | Type of
Contract | | | Counterparty | | Exercise
Rate | | | Pay/Receive
Exercise Rate | | | Floating Rate Index | | | Expiration
Date | | | Notional
Value | | | Value | |
5 Year Interest Rate Swap | | | Put | | | Deutsche Bank Securities Inc. | | | 3.06 | % | | | Pay | | | | 3 Month USD LIBOR | | | | 10/16/17 | | | $ | 396,000 | | | $ | 8,580 | |
5 Year Interest Rate Swap | | | Put | | | Deutsche Bank Securities Inc. | | | 3.26 | | | | Pay | | | | 3 Month USD LIBOR | | | | 09/18/17 | | | | 2,320,000 | | | | 36,721 | |
5 Year Interest Rate Swap | | | Put | | | Deutsche Bank Securities Inc. | | | 3.36 | | | | Pay | | | | 3 Month USD LIBOR | | | | 09/15/17 | | | | 3,000,000 | | | | 41,285 | |
5 Year Interest Rate Swap | | | Put | | | Goldman Sachs International | | | 3.01 | | | | Pay | | | | 3 Month USD LIBOR | | | | 10/27/17 | | | | 83,000 | | | | 1,947 | |
5 Year Interest Rate Swap | | | Put | | | Goldman Sachs International | | | 3.06 | | | | Pay | | | | 3 Month USD LIBOR | | | | 09/29/17 | | | | 450,000 | | | | 9,475 | |
5 Year Interest Rate Swap | | | Put | | | Morgan Stanley
Capital Services LLC | | | 3.26 | | | | Pay | | | | 3 Month USD LIBOR | | | | 09/18/17 | | | | 680,000 | | | | 10,763 | |
Total Swaptions Purchased — Interest Rate Risk | | | | | | | | | | | | | | | $ | 108,771 | |
Total Options Purchased (Cost $9,042,083) | | | | | | | | | | | | | | | $ | 8,557,537 | |
Abbreviations:
| | |
| LIBOR | | – London Interbank Offered Rate |
| USD | | – U.S. Dollar |
| | | | | | | | | | | | | | | | | | | | | | | | | | | | | | | | | | | | | | | | | | |
| Open Over-The-Counter Index Options Written | |
| Description | | Type of
Contract | | | Counterparty | | Expiration
Date | | | Number of
Contracts | | | Strike
Price | | | Premiums
Received | | | Notional
Value(f) | | | Value | | | Unrealized
Appreciation
(Depreciation) | |
HS Index | | | Call | | | Goldman Sachs International | | | 12/30/15 | | | | 3 | | | | HKD | | | | 23,000 | | | $ | 12,276 | | | | HKD | | | | 3,450,000 | | | $ | 10,773 | | | $ | 1,503 | |
HS Index | | | Call | | | HSBC New York | | | 12/30/15 | | | | 3 | | | | HKD | | | | 23,600 | | | | 7,452 | | | | HKD | | | | 3,540,000 | | | | 6,438 | | | | 1,014 | |
HS Index | | | Call | | | Societe Generale | | | 12/30/15 | | | | 41 | | | | HKD | | | | 22,600 | | | | 190,451 | | | | HKD | | | | 46,330,000 | | | | 199,723 | | | | (9,272 | ) |
HSCE Index | | | Call | | | Goldman Sachs International | | | 12/30/15 | | | | 6 | | | | HKD | | | | 10,600 | | | | 12,942 | | | | HKD | | | | 3,180,000 | | | | 13,288 | | | | (346 | ) |
HSCE Index | | | Call | | | Goldman Sachs International | | | 12/30/15 | | | | 90 | | | | HKD | | | | 10,200 | | | | 271,216 | | | | HKD | | | | 45,900,000 | | | | 320,551 | | | | (49,335 | ) |
HSCE Index | | | Call | | | HSBC New York | | | 12/30/15 | | | | 6 | | | | HKD | | | | 11,000 | | | | 10,258 | | | | HKD | | | | 3,300,000 | | | | 7,731 | | | | 2,527 | |
Subtotal — Over-The-Counter Index Call Options Written | | | | 149 | | | | | | | | | | | $ | 504,595 | | | | | | | | | | | $ | 558,504 | | | $ | (53,909 | ) |
DAX Index | | | Put | | | Goldman Sachs International | | | 11/20/15 | | | | 24 | | | | EUR | | | | 9,800 | | | $ | 38,583 | | | | EUR | | | | 1,176,000 | | | $ | 1,803 | | | $ | 36,780 | |
DAX Index | | | Put | | | Goldman Sachs International | | | 11/20/15 | | | | 24 | | | | EUR | | | | 9,900 | | | | 43,008 | | | | EUR | | | | 1,188,000 | | | | 2,216 | | | | 40,792 | |
DAX Index | | | Put | | | Goldman Sachs International | | | 11/20/15 | | | | 24 | | | | EUR | | | | 10,000 | | | | 47,833 | | | | EUR | | | | 1,200,000 | | | | 2,752 | | | | 45,081 | |
DAX Index | | | Put | | | Goldman Sachs International | | | 01/15/16 | | | | 3 | | | | EUR | | | | 9,500 | | | | 4,430 | | | | EUR | | | | 142,500 | | | | 1,227 | | | | 3,203 | |
DAX Index | | | Put | | | Goldman Sachs International | | | 01/15/16 | | | | 33 | | | | EUR | | | | 9,550 | | | | 41,531 | | | | EUR | | | | 1,575,750 | | | | 14,351 | | | | 27,180 | |
DAX Index | | | Put | | | Goldman Sachs International | | | 01/15/16 | | | | 33 | | | | EUR | | | | 9,650 | | | | 46,495 | | | | EUR | | | | 1,592,250 | | | | 16,230 | | | | 30,265 | |
See accompanying Notes to Consolidated Financial Statements which are an integral part of the financial statements.
14 Invesco Global Targeted Returns Fund
| | | | | | | | | | | | | | | | | | | | | | | | | | | | | | | | | | | | | | | | | | |
| Open Over-The-Counter Index Options Written—(continued) | |
| Description | | Type of
Contract | | | Counterparty | | Expiration
Date | | | Number of
Contracts | | | Strike
Price | | | Premiums
Received | | | Notional
Value(f) | | | Value | | | Unrealized
Appreciation
(Depreciation) | |
DAX Index | | | Put | | | Goldman Sachs International | | | 01/15/16 | | | | 32 | | | | EUR | | | | 9,750 | | | $ | 50,421 | | | | EUR | | | | 1,560,000 | | | $ | 17,814 | | | $ | 32,607 | |
M1EF Index | | | Put | | | UBS | | | 03/21/16 | | | | 8 | | | | USD | | | | 340 | | | | 20,600 | | | | USD | | | | 272,000 | | | | 10,025 | | | | 10,575 | |
M1EF Index | | | Put | | | UBS | | | 03/21/16 | | | | 7 | | | | USD | | | | 350 | | | | 19,320 | | | | USD | | | | 245,000 | | | | 10,901 | | | | 8,419 | |
M1EF Index | | | Put | | | UBS | | | 03/21/16 | | | | 102 | | | | USD | | | | 350 | | | | 318,584 | | | | USD | | | | 3,570,000 | | | | 158,845 | | | | 159,739 | |
Subtotal — Over-The-Counter Index Put Options Written | | | | 290 | | | | | | | | | | | $ | 630,805 | | | | | | | | | | | $ | 236,164 | | | $ | 394,641 | |
Total Over-The-Counter Index Options Written | | | | 439 | | | | | | | | | | | $ | 1,135,400 | | | | | | | | | | | $ | 794,668 | | | $ | 340,732 | |
| | | | | | | | | | | | | | | | | | | | | | | | | | | | | | | | | | | | | | | | | | |
| Open Exchange-Traded Index Options Written(g) | |
| Description | | Type of
Contract | | | Counterparty | | Expiration
Date | | | Number of
Contracts | | | Strike
Price | | | Premiums
Received | | | Notional
Value(f) | | | Value | | | Unrealized
Appreciation
(Depreciation) | |
DAX Index | | | Put | | | Bank of America Merrill Lynch | | | 11/20/15 | | | | 7 | | | | EUR | | | | 9,150 | | | $ | 8,392 | | | | EUR | | | | 320,250 | | | $ | 200 | | | $ | 8,192 | |
DAX Index | | | Put | | | Bank of America Merrill Lynch | | | 11/20/15 | | | | 12 | | | | EUR | | | | 9,400 | | | | 21,516 | | | | EUR | | | | 564,000 | | | | 508 | | | | 21,008 | |
DAX Index | | | Put | | | Bank of America Merrill Lynch | | | 11/20/15 | | | | 6 | | | | EUR | | | | 10,300 | | | | 2,533 | | | | EUR | | | | 309,000 | | | | 1,613 | | | | 920 | |
DAX Index | | | Put | | | Bank of America Merrill Lynch | | | 12/18/15 | | | | 7 | | | | EUR | | | | 9,150 | | | | 10,730 | | | | EUR | | | | 320,250 | | | | 997 | | | | 9,733 | |
DAX Index | | | Put | | | Bank of America Merrill Lynch | | | 12/18/15 | | | | 12 | | | | EUR | | | | 9,400 | | | | 26,025 | | | | EUR | | | | 564,000 | | | | 2,389 | | | | 23,636 | |
DAX Index | | | Put | | | Bank of America Merrill Lynch | | | 12/18/15 | | | | 25 | | | | EUR | | | | 9,500 | | | | 40,839 | | | | EUR | | | | 1,187,500 | | | | 5,732 | | | | 35,107 | |
DAX Index | | | Put | | | Bank of America Merrill Lynch | | | 12/18/15 | | | | 25 | | | | EUR | | | | 9,600 | | | | 45,644 | | | | EUR | | | | 1,200,000 | | | | 6,626 | | | | 39,018 | |
DAX Index | | | Put | | | Bank of America Merrill Lynch | | | 12/18/15 | | | | 25 | | | | EUR | | | | 9,700 | | | | 50,427 | | | | EUR | | | | 1,212,500 | | | | 7,670 | | | | 42,757 | |
DAX Index | | | Put | | | Bank of America Merrill Lynch | | | 12/18/15 | | | | 6 | | | | EUR | | | | 10,300 | | | | 5,669 | | | | EUR | | | | 309,000 | | | | 4,658 | | | | 1,011 | |
DAX Index | | | Put | | | Bank of America Merrill Lynch | | | 01/15/16 | | | | 6 | | | | EUR | | | | 10,300 | | | | 7,806 | | | | EUR | | | | 309,000 | | | | 6,691 | | | | 1,115 | |
DAX Index | | | Put | | | Goldman Sachs International | | | 11/20/15 | | | | 3 | | | | EUR | | | | 9,500 | | | | 2,096 | | | | EUR | | | | 142,500 | | | | 152 | | | | 1,944 | |
DAX Index | | | Put | | | Goldman Sachs International | | | 12/18/15 | | | | 3 | | | | EUR | | | | 9,500 | | | | 3,483 | | | | EUR | | | | 142,500 | | | | 688 | | | | 2,795 | |
FTSE MIB Index | | | Put | | | Bank of America Merrill Lynch | | | 12/18/15 | | | | 8 | | | | EUR | | | | 20,500 | | | | 17,373 | | | | EUR | | | | 410,000 | | | | 3,739 | | | | 13,634 | |
FTSE MIB Index | | | Put | | | Bank of America Merrill Lynch | | | 03/18/16 | | | | 178 | | | | EUR | | | | 22,500 | | | | 537,906 | | | | EUR | | | | 10,012,500 | | | | 598,495 | | | | (60,589 | ) |
Nikkei 225 Index | | | Put | | | Bank of America Merrill Lynch | | | 11/13/15 | | | | 1 | | | | JPY | | | | 16,000 | | | | 2,492 | | | | JPY | | | | 16,000,000 | | | | 50 | | | | 2,442 | |
Nikkei 225 Index | | | Put | | | Bank of America Merrill Lynch | | | 11/13/15 | | | | 3 | | | | JPY | | | | 18,000 | | | | 3,837 | | | | JPY | | | | 54,000,000 | | | | 1,492 | | | | 2,345 | |
Nikkei 225 Index | | | Put | | | Bank of America Merrill Lynch | | | 11/13/15 | | | | 4 | | | | JPY | | | | 19,250 | | | | 11,216 | | | | JPY | | | | 77,000,000 | | | | 12,928 | | | | (1,712 | ) |
Nikkei 225 Index | | | Put | | | Bank of America Merrill Lynch | | | 11/13/15 | | | | 4 | | | | JPY | | | | 19,500 | | | | 12,667 | | | | JPY | | | | 78,000,000 | | | | 19,226 | | | | (6,559 | ) |
Nikkei 225 Index | | | Put | | | Bank of America Merrill Lynch | | | 11/13/15 | | | | 4 | | | | JPY | | | | 19,750 | | | | 14,274 | | | | JPY | | | | 79,000,000 | | | | 24,364 | | | | (10,090 | ) |
Nikkei 225 Index | | | Put | | | Bank of America Merrill Lynch | | | 12/11/15 | | | | 1 | | | | JPY | | | | 16,000 | | | | 3,326 | | | | JPY | | | | 16,000,000 | | | | 323 | | | | 3,003 | |
Nikkei 225 Index | | | Put | | | Bank of America Merrill Lynch | | | 12/11/15 | | | | 4 | | | | JPY | | | | 17,000 | | | | 20,695 | | | | JPY | | | | 68,000,000 | | | | 2,818 | | | | 17,877 | |
Nikkei 225 Index | | | Put | | | Bank of America Merrill Lynch | | | 12/11/15 | | | | 4 | | | | JPY | | | | 17,250 | | | | 23,182 | | | | JPY | | | | 69,000,000 | | | | 3,315 | | | | 19,867 | |
Nikkei 225 Index | | | Put | | | Bank of America Merrill Lynch | | | 12/11/15 | | | | 4 | | | | JPY | | | | 17,500 | | | | 25,835 | | | | JPY | | | | 70,000,000 | | | | 4,309 | | | | 21,526 | |
Nikkei 225 Index | | | Put | | | Bank of America Merrill Lynch | | | 01/08/16 | | | | 1 | | | | JPY | | | | 18,000 | | | | 3,895 | | | | JPY | | | | 18,000,000 | | | | 2,693 | | | | 1,202 | |
Nikkei 225 Index | | | Put | | | Bank of America Merrill Lynch | | | 12/09/16 | | | | 12 | | | | JPY | | | | 16,500 | | | | 144,936 | | | | JPY | | | | 198,000,000 | | | | 77,567 | | | | 67,369 | |
Nikkei 225 Index | | | Put | | | Bank of America Merrill Lynch | | | 12/09/16 | | | | 3 | | | | JPY | | | | 18,750 | | | | 47,870 | | | | JPY | | | | 56,250,000 | | | | 40,027 | | | | 7,843 | |
Nikkei 225 Index | | | Put | | | Bank of America Merrill Lynch | | | 12/09/16 | | | | 2 | | | | JPY | | | | 19,250 | | | | 31,489 | | | | JPY | | | | 38,500,000 | | | | 30,993 | | | | 496 | |
Nikkei 225 Index | | | Put | | | Bank of America Merrill Lynch | | | 12/09/16 | | | | 2 | | | | JPY | | | | 19,500 | | | | 31,874 | | | | JPY | | | | 39,000,000 | | | | 33,314 | | | | (1,440 | ) |
Nikkei 225 Index | | | Put | | | Bank of America Merrill Lynch | | | 12/09/16 | | | | 5 | | | | JPY | | | | 20,250 | | | | 79,426 | | | | JPY | | | | 101,250,000 | | | | 101,931 | | | | (22,505 | ) |
Nikkei 225 Index | | | Put | | | Goldman Sachs International | | | 11/13/15 | | | | 1 | | | | JPY | | | | 16,750 | | | | 3,391 | | | | JPY | | | | 16,750,000 | | | | 99 | | | | 3,292 | |
Nikkei 225 Index | | | Put | | | Goldman Sachs International | | | 11/13/15 | | | | 2 | | | | JPY | | | | 17,250 | | | | 4,162 | | | | JPY | | | | 34,500,000 | | | | 348 | | | | 3,814 | |
Nikkei 225 Index | | | Put | | | Goldman Sachs International | | | 12/11/15 | | | | 1 | | | | JPY | | | | 16,750 | | | | 4,225 | | | | JPY | | | | 16,750,000 | | | | 580 | | | | 3,645 | |
Nikkei 225 Index | | | Put | | | Goldman Sachs International | | | 12/11/15 | | | | 4 | | | | JPY | | | | 17,000 | | | | 18,114 | | | | JPY | | | | 68,000,000 | | | | 2,817 | | | | 15,297 | |
Nikkei 225 Index | | | Put | | | Goldman Sachs International | | | 12/11/15 | | | | 4 | | | | JPY | | | | 17,250 | | | | 20,436 | | | | JPY | | | | 69,000,000 | | | | 3,315 | | | | 17,121 | |
Nikkei 225 Index | | | Put | | | Goldman Sachs International | | | 12/11/15 | | | | 4 | | | | JPY | | | | 17,500 | | | | 23,051 | | | | JPY | | | | 70,000,000 | | | | 4,309 | | | | 18,742 | |
Nikkei 225 Index | | | Put | | | Goldman Sachs International | | | 01/08/16 | | | | 5 | | | | JPY | | | | 17,000 | | | | 19,329 | | | | JPY | | | | 85,000,000 | | | | 6,630 | | | | 12,699 | |
Nikkei 225 Index | | | Put | | | Goldman Sachs International | | | 01/08/16 | | | | 5 | | | | JPY | | | | 17,250 | | | | 22,310 | | | | JPY | | | | 86,250,000 | | | | 7,872 | | | | 14,438 | |
Nikkei 225 Index | | | Put | | | Goldman Sachs International | | | 01/08/16 | | | | 5 | | | | JPY | | | | 17,500 | | | | 25,647 | | | | JPY | | | | 87,500,000 | | | | 9,323 | | | | 16,324 | |
Nikkei 225 Index | | | Put | | | Goldman Sachs International | | | 12/09/16 | | | | 9 | | | | JPY | | | | 17,750 | | | | 147,663 | | | | JPY | | | | 159,750,000 | | | | 88,009 | | | | 59,654 | |
Nikkei 225 Index | | | Put | | | Goldman Sachs International | | | 12/09/16 | | | | 1 | | | | JPY | | | | 18,000 | | | | 15,663 | | | | JPY | | | | 18,000,000 | | | | 10,608 | | | | 5,055 | |
See accompanying Notes to Consolidated Financial Statements which are an integral part of the financial statements.
15 Invesco Global Targeted Returns Fund
| | | | | | | | | | | | | | | | | | | | | | | | | | | | | | | | | | | | | | | | | | |
| Open Exchange-Traded Index Options Written(g)—(continued) | |
| Description | | Type of
Contract | | | Counterparty | | Expiration
Date | | | Number of
Contracts | | | Strike
Price | | | Premiums
Received | | | Notional
Value(f) | | | Value | | | Unrealized
Appreciation
(Depreciation) | |
Nikkei 225 Index | | | Put | | | Goldman Sachs International | | | 12/09/16 | | | | 27 | | | | JPY | | | | 19,500 | | | $ | 395,223 | | | | JPY | | | | 526,500,000 | | | $ | 449,739 | | | $ | (54,516 | ) |
Nikkei 225 Index | | | Put | | | Societe Generale | | | 11/13/15 | | | | 3 | | | | JPY | | | | 19,250 | | | | 7,459 | | | | JPY | | | | 57,750,000 | | | | 9,696 | | | | (2,237 | ) |
Nikkei 225 Index | | | Put | | | Societe Generale | | | 11/13/15 | | | | 4 | | | | JPY | | | | 19,500 | | | | 11,908 | | | | JPY | | | | 78,000,000 | | | | 19,226 | | | | (7,318 | ) |
Nikkei 225 Index | | | Put | | | Societe Generale | | | 11/13/15 | | | | 4 | | | | JPY | | | | 19,750 | | | | 14,291 | | | | JPY | | | | 79,000,000 | | | | 24,364 | | | | (10,073 | ) |
Nikkei 225 Index | | | Put | | | Societe Generale | | | 01/08/16 | | | | 5 | | | | JPY | | | | 17,000 | | | | 15,553 | | | | JPY | | | | 85,000,000 | | | | 6,630 | | | | 8,923 | |
Nikkei 225 Index | | | Put | | | Societe Generale | | | 01/08/16 | | | | 5 | | | | JPY | | | | 17,250 | | | | 17,924 | | | | JPY | | | | 86,250,000 | | | | 7,873 | | | | 10,051 | |
Nikkei 225 Index | | | Put | | | Societe Generale | | | 01/08/16 | | | | 5 | | | | JPY | | | | 17,500 | | | | 20,502 | | | | JPY | | | | 87,500,000 | | | | 9,323 | | | | 11,179 | |
Nikkei 225 Index | | | Put | | | UBS | | | 12/09/16 | | | | 3 | | | | JPY | | | | 20,500 | | | | 45,048 | | | | JPY | | | | 61,500,000 | | | | 65,136 | | | | (20,088 | ) |
SX5E Index | | | Put | | | Goldman Sachs International | | | 03/18/16 | | | | 446 | | | | EUR | | | | 3,350 | | | | 702,176 | | | | EUR | | | | 14,941,000 | | | | 736,190 | | | | (34,014 | ) |
Subtotal — Exchange-Traded Index Put Options Written | | | | 920 | | | | | | | | | | | $ | 2,771,528 | | | | | | | | | | | $ | 2,457,595 | | | $ | 313,933 | |
Total Index Options Written — Equity Risk | | | | 1,359 | | | | | | | | | | | $ | 3,906,928 | | | | | | | | | | | $ | 3,252,263 | | | $ | 654,665 | |
Currency Abbreviations:
| | |
| EUR | | – Euro |
| HKD | | – Hong Kong Dollar |
| JPY | | – Japanese Yen |
| USD | | – U.S. Dollar |
| (f) | Notional Value is calculated by multiplying the Number of Contracts by the Strike Price by the multiplier. |
| (g) | Index options written collateralized by $5,375,443 cash held with Bank of America Merrill Lynch. |
| | | | | | | | | | | | | | | | | | | | | | | | | | | | | | | | | | | | | | |
| Open Over-The-Counter Foreign Currency Options Written | |
| Description | | Type of
Contract | | | Counterparty | | Expiration
Date | | | Strike
Price | | | Premiums
Received | | | Notional
Value | | | Value | | | Unrealized
Appreciation
(Depreciation) | |
CAD versus USD | | | Call | | | Barclays Bank PLC | | | 12/08/15 | | | | CAD | | | | 1.325 | | | $ | 55,111 | | | | USD | | | | 2,855,500 | | | $ | 15,862 | | | $ | 39,249 | |
CAD versus USD | | | Call | | | Deutsche Bank Securities Inc. | | | 11/10/15 | | | | CAD | | | | 1.316 | | | | 55,351 | | | | USD | | | | 2,938,000 | | | | 10,486 | | | | 44,865 | |
CAD versus USD | | | Call | | | Deutsche Bank Securities Inc. | | | 01/08/16 | | | | CAD | | | | 1.307 | | | | 54,377 | | | | USD | | | | 3,230,000 | | | | 49,612 | | | | 4,765 | |
CAD versus USD | | | Call | | | Goldman Sachs International | | | 11/10/15 | | | | CAD | | | | 1.292 | | | | 1,936 | | | | USD | | | | 198,000 | | | | 2,804 | | | | (868 | ) |
CAD versus USD | | | Call | | | Goldman Sachs International | | | 11/10/15 | | | | CAD | | | | 1.325 | | | | 4,000 | | | | USD | | | | 297,500 | | | | 510 | | | | 3,490 | |
CAD versus USD | | | Call | | | Goldman Sachs International | | | 12/08/15 | | | | CAD | | | | 1.292 | | | | 3,864 | | | | USD | | | | 288,000 | | | | 5,138 | | | | (1,274 | ) |
CAD versus USD | | | Call | | | Goldman Sachs International | | | 12/08/15 | | | | CAD | | | | 1.326 | | | | 5,000 | | | | USD | | | | 297,500 | | | | 1,646 | | | | 3,354 | |
CAD versus USD | | | Call | | | Goldman Sachs International | | | 01/08/16 | | | | CAD | | | | 1.292 | | | | 3,331 | | | | USD | | | | 198,000 | | | | 4,305 | | | | (974 | ) |
NOK versus GBP | | | Call | | | Barclays Bank PLC | | | 06/14/16 | | | | NOK | | | | 13.236 | | | | 12,651 | | | | GBP | | | | 385,823 | | | | 18,269 | | | | (5,618 | ) |
NOK versus GBP | | | Call | | | Barclays Bank PLC | | | 06/14/16 | | | | NOK | | | | 13.300 | | | | 9,619 | | | | GBP | | | | 321,453 | | | | 14,258 | | | | (4,639 | ) |
NOK versus GBP | | | Call | | | Barclays Bank PLC | | | 06/14/16 | | | | NOK | | | | 13.590 | | | | 5,678 | | | | GBP | | | | 188,495 | | | | 6,193 | | | | (515 | ) |
NOK versus GBP | | | Call | | | Barclays Bank PLC | | | 06/14/16 | | | | NOK | | | | 13.643 | | | | 4,059 | | | | GBP | | | | 150,000 | | | | 4,666 | | | | (607 | ) |
NOK versus GBP | | | Call | | | Barclays Bank PLC | | | 06/14/16 | | | | NOK | | | | 13.866 | | | | 6,368 | | | | GBP | | | | 311,141 | | | | 7,667 | | | | (1,299 | ) |
NOK versus GBP | | | Call | | | Citigroup Global Markets Inc. | | | 06/14/16 | | | | NOK | | | | 13.396 | | | | 6,417 | | | | GBP | | | | 301,747 | | | | 12,127 | | | | (5,710 | ) |
NOK versus GBP | | | Call | | | Deutsche Bank Securities Inc. | | | 06/14/16 | | | | NOK | | | | 13.653 | | | | 10,868 | | | | GBP | | | | 410,550 | | | | 12,632 | | | | (1,764 | ) |
NOK versus GBP | | | Call | | | Deutsche Bank Securities Inc. | | | 06/14/16 | | | | NOK | | | | 13.240 | | | | 7,862 | | | | GBP | | | | 238,538 | | | | 11,250 | | | | (3,388 | ) |
NOK versus GBP | | | Call | | | Goldman Sachs International | | | 06/14/16 | | | | NOK | | | | 12.895 | | | | 159,963 | | | | GBP | | | | 4,400,000 | | | | 292,178 | | | | (132,215 | ) |
USD versus EUR | | | Call | | | Barclays Bank PLC | | | 01/13/20 | | | | USD | | | | 1.270 | | | | 33,953 | | | | EUR | | | | 338,440 | | | | 20,400 | | | | 13,553 | |
USD versus EUR | | | Call | | | Barclays Bank PLC | | | 01/27/20 | | | | USD | | | | 1.222 | | | | 66,630 | | | | EUR | | | | 640,440 | | | | 50,237 | | | | 16,393 | |
USD versus EUR | | | Call | | | Barclays Bank PLC | | | 03/12/20 | | | | USD | | | | 1.170 | | | | 13,404 | | | | EUR | | | | 132,118 | | | | 13,789 | | | | (385 | ) |
USD versus EUR | | | Call | | | Barclays Bank PLC | | | 04/03/20 | | | | USD | | | | 1.172 | | | | 44,779 | | | | EUR | | | | 431,984 | | | | 45,496 | | | | (717 | ) |
USD versus EUR | | | Call | | | Barclays Bank PLC | | | 04/22/20 | | | | USD | | | | 1.172 | | | | 36,888 | | | | EUR | | | | 351,372 | | | | 37,006 | | | | (118 | ) |
USD versus EUR | | | Call | | | Barclays Bank PLC | | | 05/12/20 | | | | USD | | | | 1.225 | | | | 12,182 | | | | EUR | | | | 119,640 | | | | 10,024 | | | | 2,158 | |
USD versus EUR | | | Call | | | Barclays Bank PLC | | | 06/03/20 | | | | USD | | | | 1.218 | | | | 52,930 | | | | EUR | | | | 509,824 | | | | 44,879 | | | | 8,051 | |
USD versus EUR | | | Call | | | Barclays Bank PLC | | | 06/26/20 | | | | USD | | | | 1.220 | | | | 57,422 | | | | EUR | | | | 578,405 | | | | 51,319 | | | | 6,103 | |
USD versus EUR | | | Call | | | Barclays Bank PLC | | | 07/10/20 | | | | USD | | | | 1.213 | | | | 48,840 | | | | EUR | | | | 477,259 | | | | 44,167 | | | | 4,673 | |
USD versus EUR | | | Call | | | Barclays Bank PLC | | | 07/16/20 | | | | USD | | | | 1.188 | | | | 42,457 | | | | EUR | | | | 437,856 | | | | 45,533 | | | | (3,076 | ) |
USD versus EUR | | | Call | | | Citigroup Global Markets Inc. | | | 08/25/20 | | | | USD | | | | 1.194 | | | | 36,552 | | | | EUR | | | | 363,370 | | | | 37,788 | | | | (1,236 | ) |
See accompanying Notes to Consolidated Financial Statements which are an integral part of the financial statements.
16 Invesco Global Targeted Returns Fund
| | | | | | | | | | | | | | | | | | | | | | | | | | | | | | | | | | | | | | |
| Open Over-The-Counter Foreign Currency Options Written—(continued) | |
| Description | | Type of
Contract | | | Counterparty | | Expiration
Date | | | Strike
Price | | | Premiums
Received | | | Notional
Value | | | Value | | | Unrealized
Appreciation
(Depreciation) | |
USD versus EUR | | | Call | | | Citigroup Global Markets Inc. | | | 08/25/20 | | | | USD | | | | 1.228 | | | $ | 36,638 | | | | EUR | | | | 353,889 | | | $ | 31,565 | | | $ | 5,073 | |
USD versus EUR | | | Call | | | Deutsche Bank Securities Inc. | | | 07/01/20 | | | | USD | | | | 1.210 | | | | 36,515 | | | | EUR | | | | 358,640 | | | | 33,419 | | | | 3,096 | |
USD versus EUR | | | Call | | | Deutsche Bank Securities Inc. | | | 08/25/20 | | | | USD | | | | 1.205 | | | | 32,515 | | | | EUR | | | | 320,544 | | | | 31,690 | | | | 825 | |
USD versus EUR | | | Call | | | Goldman Sachs International | | | 12/12/19 | | | | USD | | | | 1.350 | | | | 283,731 | | | | EUR | | | | 2,792,791 | | | | 104,223 | | | | 179,508 | |
USD versus EUR | | | Call | | | Goldman Sachs International | | | 01/21/20 | | | | USD | | | | 1.253 | | | | 30,213 | | | | EUR | | | | 310,284 | | | | 20,624 | | | | 9,589 | |
USD versus EUR | | | Call | | | Goldman Sachs International | | | 02/06/20 | | | | USD | | | | 1.234 | | | | 22,003 | | | | EUR | | | | 238,027 | | | | 17,715 | | | | 4,288 | |
USD versus EUR | | | Call | | | Goldman Sachs International | | | 04/15/20 | | | | USD | | | | 1.159 | | | | 63,718 | | | | EUR | | | | 618,354 | | | | 69,211 | | | | (5,493 | ) |
USD versus EUR | | | Call | | | Goldman Sachs International | | | 07/29/20 | | | | USD | | | | 1.204 | | | | 19,856 | | | | EUR | | | | 200,000 | | | | 19,514 | | | | 342 | |
USD versus EUR | | | Call | | | Goldman Sachs International | | | 08/25/20 | | | | USD | | | | 1.210 | | | | 42,970 | | | | EUR | | | | 422,926 | | | | 40,986 | | | | 1,984 | |
Subtotal — Over-The-Counter Foreign Currency Call Options Written | | | | | | | $ | 1,420,651 | | | | | | | | | | | $ | 1,239,188 | | | $ | 181,463 | |
EUR versus USD | | | Put | | | Citigroup Global Markets Inc. | | | 11/17/15 | | | | USD | | | | 1.122 | | | $ | 604 | | | | EUR | | | | 126,389 | | | $ | 3,043 | | | $ | (2,439 | ) |
EUR versus USD | | | Put | | | Citigroup Global Markets Inc. | | | 12/17/15 | | | | USD | | | | 1.082 | | | | 339 | | | | EUR | | | | 113,553 | | | | 354 | | | | (15 | ) |
EUR versus USD | | | Put | | | Citigroup Global Markets Inc. | | | 12/17/15 | | | | USD | | | | 1.082 | | | | 1,066 | | | | EUR | | | | 113,553 | | | | 1,014 | | | | 52 | |
EUR versus USD | | | Put | | | Citigroup Global Markets Inc. | | | 12/17/15 | | | | USD | | | | 1.123 | | | | 789 | | | | EUR | | | | 78,993 | | | | 2,301 | | | | (1,512 | ) |
EUR versus USD | | | Put | | | Citigroup Global Markets Inc. | | | 01/15/16 | | | | USD | | | | 1.123 | | | | 1,634 | | | | EUR | | | | 126,389 | | | | 4,301 | | | | (2,667 | ) |
EUR versus USD | | | Put | | | Deutsche Bank Securities Inc. | | | 11/17/15 | | | | USD | | | | 1.098 | | | | 1,007 | | | | EUR | | | | 100,170 | | | | 838 | | | | 169 | |
EUR versus USD | | | Put | | | Deutsche Bank Securities Inc. | | | 12/17/15 | | | | USD | | | | 1.099 | | | | 1,679 | | | | EUR | | | | 100,170 | | | | 1,516 | | | | 163 | |
EUR versus USD | | | Put | | | Deutsche Bank Securities Inc. | | | 12/17/15 | | | | USD | | | | 1.100 | | | | 11,179 | | | | EUR | | | | 900,000 | | | | 14,035 | | | | (2,856 | ) |
EUR versus USD | | | Put | | | Deutsche Bank Securities Inc. | | | 12/17/15 | | | | USD | | | | 1.111 | | | | 14,288 | | | | EUR | | | | 900,000 | | | | 19,386 | | | | (5,098 | ) |
EUR versus USD | | | Put | | | Deutsche Bank Securities Inc. | | | 12/17/15 | | | | USD | | | | 1.122 | | | | 18,179 | | | | EUR | | | | 900,000 | | | | 25,960 | | | | (7,781 | ) |
EUR versus USD | | | Put | | | Goldman Sachs International | | | 11/17/15 | | | | USD | | | | 1.078 | | | | 8,482 | | | | EUR | | | | 860,000 | | | | 2,055 | | | | 6,427 | |
EUR versus USD | | | Put | | | Goldman Sachs International | | | 11/17/15 | | | | USD | | | | 1.084 | | | | 1,136 | | | | EUR | | | | 70,000 | | | | 259 | | | | 877 | |
EUR versus USD | | | Put | | | Goldman Sachs International | | | 11/17/15 | | | | USD | | | | 1.089 | | | | 11,166 | | | | EUR | | | | 860,000 | | | | 4,255 | | | | 6,911 | |
EUR versus USD | | | Put | | | Goldman Sachs International | | | 11/17/15 | | | | USD | | | | 1.095 | | | | 1,447 | | | | EUR | | | | 132,164 | | | | 948 | | | | 499 | |
EUR versus USD | | | Put | | | Goldman Sachs International | | | 11/17/15 | | | | USD | | | | 1.100 | | | | 14,539 | | | | EUR | | | | 860,000 | | | | 8,003 | | | | 6,536 | |
EUR versus USD | | | Put | | | Goldman Sachs International | | | 12/17/15 | | | | USD | | | | 1.096 | | | | 2,115 | | | | EUR | | | | 132,164 | | | | 1,830 | | | | 285 | |
EUR versus USD | | | Put | | | Goldman Sachs International | | | 01/15/16 | | | | USD | | | | 1.105 | | | | 9,585 | | | | EUR | | | | 1,001,592 | | | | 23,592 | | | | (14,007 | ) |
EUR versus USD | | | Put | | | Goldman Sachs International | | | 01/15/16 | | | | USD | | | | 1.116 | | | | 12,734 | | | | EUR | | | | 1,001,593 | | | | 29,790 | | | | (17,056 | ) |
EUR versus USD | | | Put | | | Goldman Sachs International | | | 01/15/16 | | | | USD | | | | 1.128 | | | | 16,540 | | | | EUR | | | | 1,001,593 | | | | 36,978 | | | | (20,438 | ) |
USD versus CAD | | | Put | | | Barclays Bank PLC | | | 07/15/20 | | | | CAD | | | | 1.245 | | | | 361,346 | | | | USD | | | | 4,309,000 | | | | 272,301 | | | | 89,045 | |
USD versus CAD | | | Put | | | Deutsche Bank Securities Inc. | | | 07/15/20 | | | | CAD | | | | 1.245 | | | | 369,791 | | | | USD | | | | 4,309,000 | | | | 272,300 | | | | 97,491 | |
USD versus CAD | | | Put | | | Goldman Sachs International | | | 08/25/20 | | | | CAD | | | | 1.282 | | | | 55,009 | | | | USD | | | | 648,000 | | | | 51,255 | | | | 3,754 | |
USD versus CAD | | | Put | | | Goldman Sachs International | | | 08/25/20 | | | | CAD | | | | 1.306 | | | | 88,000 | | | | USD | | | | 1,020,000 | | | | 91,217 | | | | (3,217 | ) |
USD versus KRW | | | Put | | | Barclays Bank PLC | | | 09/09/16 | | | | KRW | | | | 1,200.050 | | | | 160,194 | | | | USD | | | | 3,305,000 | | | | 247,181 | | | | (86,987 | ) |
USD versus KRW | | | Put | | | Citigroup Global Markets Inc. | | | 09/09/16 | | | | KRW | | | | 1,195.250 | | | | 10,158 | | | | USD | | | | 205,000 | | | | 14,704 | | | | (4,546 | ) |
USD versus KRW | | | Put | | | Deutsche Bank Securities Inc. | | | 09/09/16 | | | | KRW | | | | 1,205.800 | | | | 472,006 | | | | USD | | | | 9,410,000 | | | | 738,871 | | | | (266,865 | ) |
USD versus KRW | | | Put | | | Goldman Sachs International | | | 09/09/16 | | | | KRW | | | | 1,205.800 | | | | 306,123 | | | | USD | | | | 6,222,000 | | | | 488,550 | | | | (182,427 | ) |
Subtotal – Over-The-Counter Foreign Currency Put Options Written | | | | | | | | | | | $ | 1,951,135 | | | | | | | | | | | $ | 2,356,837 | | | $ | (405,702 | ) |
Total Foreign Currency Options Written — Currency Risk | | | | | | | $ | 3,371,786 | | | | | | | | | | | $ | 3,596,025 | | | $ | (224,239 | ) |
Currency Abbreviations:
| | |
| CAD | | – Canadian Dollar |
| EUR | | – Euro |
| GBP | | – British Pound Sterling |
| NOK | | – Norwegian Krone |
| KRW | | – South Korean Won |
| USD | | – United States Dollar |
See accompanying Notes to Consolidated Financial Statements which are an integral part of the financial statements.
17 Invesco Global Targeted Returns Fund
| | | | | | | | | | | | | | | | | | | | | | | | | | | | | | | | | | | | | | | | |
| Open Over-The-Counter Swaptions Written | |
| Description | | Type of
Contract | | | Counterparty | | Exercise
Rate | | | Pay/Receive
Exercise Rate | | | Floating Rate Index | | Expiration
Date | | | Premiums
Received | | | Notional
Value | | | Value | | | Unrealized
Appreciation
(Depreciation) | |
5 Year Interest Rate Swap | | | Call | | | Barclays Bank PLC | | | 1.72 | % | | | Receive | | | 3 Month
USD LIBOR | | | 11/18/15 | | | $ | 758 | | | | USD | | | | 950,000 | | | $ | 103 | | | $ | 655 | |
5 Year Interest Rate Swap | | | Call | | | Barclays Bank PLC | | | 1.84 | | | | Receive | | | 3 Month USD LIBOR | | | 11/16/15 | | | | 1,200 | | | | USD | | | | 950,000 | | | | 410 | | | | 790 | |
5 Year Interest Rate Swap | | | Call | | | Barclays Bank PLC | | | 1.55 | | | | Receive | | | 3 Month USD LIBOR | | | 12/14/15 | | | | 150 | | | | USD | | | | 150,000 | | | | 38 | | | | 112 | |
5 Year Interest Rate Swap | | | Call | | | Barclays Bank PLC | | | 1.86 | | | | Receive | | | 3 Month USD LIBOR | | | 12/15/15 | | | | 2,527 | | | | USD | | | | 950,000 | | | | 2,367 | | | | 160 | |
5 Year Interest Rate Swap | | | Call | | | Barclays Bank PLC | | | 1.74 | | | | Receive | | | 3 Month USD LIBOR | | | 12/18/15 | | | | 2,274 | | | | USD | | | | 950,000 | | | | 1,181 | | | | 1,093 | |
5 Year Interest Rate Swap | | | Call | | | Barclays Bank PLC | | | 1.88 | | | | Receive | | | 3 Month USD LIBOR | | | 01/15/16 | | | | 3,790 | | | | USD | | | | 950,000 | | | | 4,595 | | | | (805 | ) |
5 Year Interest Rate Swap | | | Call | | | Barclays Bank PLC | | | 1.76 | | | | Receive | | | 3 Month USD LIBOR | | | 01/19/16 | | | | 3,221 | | | | USD | | | | 950,000 | | | | 2,848 | | | | 373 | |
5 Year Interest Rate Swap | | | Call | | | Barclays Bank PLC | | | 1.57 | | | | Receive | | | 3 Month USD LIBOR | | | 01/14/16 | | | | 345 | | | | USD | | | | 150,000 | | | | 160 | | | | 185 | |
5 Year Interest Rate Swap | | | Call | | | Barclays Bank PLC | | | 1.59 | | | | Receive | | | 3 Month USD LIBOR | | | 02/16/16 | | | | 525 | | | | USD | | | | 150,000 | | | | 334 | | | | 191 | |
5 Year Interest Rate Swap | | | Call | | | Deutsche Bank Securities Inc. | | | 1.55 | | | | Receive | | | 3 Month USD LIBOR | | | 11/30/15 | | | | 155 | | | | USD | | | | 144,000 | | | | 11 | | | | 144 | |
5 Year Interest Rate Swap | | | Call | | | Deutsche Bank Securities Inc. | | | 1.57 | | | | Receive | | | 3 Month USD LIBOR | | | 12/31/15 | | | | 346 | | | | USD | | | | 144,000 | | | | 99 | | | | 247 | |
5 Year Interest Rate Swap | | | Call | | | Deutsche Bank Securities Inc. | | | 1.59 | | | | Receive | | | 3 Month USD LIBOR | | | 01/29/16 | | | | 536 | | | | USD | | | | 144,000 | | | | 237 | | | | 299 | |
5 Year Interest Rate Swap | | | Call | | | Goldman Sachs International | | | 1.49 | | | | Receive | | | 3 Month USD LIBOR | | | 12/29/15 | | | | 25 | | | | USD | | | | 22,000 | | | | 9 | | | | 16 | |
5 Year Interest Rate Swap | | | Call | | | Goldman Sachs International | | | 1.51 | | | | Receive | | | 3 Month USD LIBOR | | | 01/27/16 | | | | 40 | | | | USD | | | | 22,000 | | | | 24 | | | | 16 | |
5 Year Interest Rate Swap | | | Call | | | Goldman Sachs International | | | 1.53 | | | | Receive | | | 3 Month USD LIBOR | | | 02/29/16 | | | | 70 | | | | USD | | | | 22,000 | | | | 46 | | | | 24 | |
Subtotal — Over-The-Counter Call Swaptions Written | | | | | | | | | | | | | $ | 15,962 | | | | | | | | | | | $ | 12,462 | | | $ | 3,500 | |
5 Year Interest Rate Swap | | | Put | | | Morgan Stanley Capital Services LLC | | | 2.32 | | | | Pay | | | 6 Month GBP LIBOR | | | 08/25/20 | | | $ | 119,068 | | | | GBP | | | | 2,329,187 | | | $ | 123,316 | | | $ | (4,248 | ) |
5 Year Interest Rate Swap | | | Put | | | Morgan Stanley Capital Services LLC | | | 2.28 | | | | Pay | | | 6 Month GBP LIBOR | | | 10/16/20 | | | | 884,511 | | | | GBP | | | | 17,350,000 | | | | 955,835 | | | | (71,324 | ) |
5 Year Interest Rate Swap | | | Put | | | Morgan Stanley Capital Services LLC | | | 2.73 | | | | Pay | | | 6 Month GBP LIBOR | | | 07/16/20 | | | | 76,795 | | | | GBP | | | | 1,500,000 | | | | 59,053 | | | | 17,742 | |
5 Year Interest Rate Swap | | | Put | | | Royal Bank
of Scotland Securities Inc. | | | 2.75 | % | | | Pay | | | 6 Month GBP LIBOR | | | 07/10/20 | | | | 87,817 | | | | GBP | | | | 1,700,000 | | | | 65,817 | | | | 22,000 | |
Subtotal — Over-The-Counter Put Swaptions Written | | | | | | $ | 1,168,191 | | | | | | | $ | 1,204,021 | | | $ | (35,830 | ) |
Total Swaptions Written — Interest Rate Risk | | | | | | $ | 1,184,153 | | | | | | | $ | 1,216,483 | | | $ | (32,330 | ) |
Total — Options Written | | | | | | $ | 8,462,867 | | | | | | | $ | 8,064,771 | | | $ | 398,096 | |
Abbreviations:
| | |
| GBP | | – British Pound Sterling |
| LIBOR | | – London Interbank Offered Rate |
| USD | | – U.S. Dollar |
See accompanying Notes to Consolidated Financial Statements which are an integral part of the financial statements.
18 Invesco Global Targeted Returns Fund
| | | | | | | | | | | | | | | | | | | | | | | | | | | | | | | | | | | | | | | | | | | | | | | | |
| Options Written Transactions | |
| | | Call Options | |
| | | Number of
Contracts* | | | | | | Notional
Value | | | | | | Notional
Value | | | | | | Notional
Value | | | | | | Notional
Value | | | | | | Notional
Value | | | Premiums
Received | |
Beginning of period | | | 127 | | | | CHF | | | | 4,212,000 | | | | EUR | | | | 3,431,000 | | | | GBP | | | | 22,441,000 | | | | HKD | | | | — | | | | USD | | | | 2,130,000 | | | $ | 1,638,111 | |
Written | | | 313 | | | | CHF | | | | 78,000 | | | | EUR | | | | 18,237,163 | | | | GBP | | | | 101,547,747 | | | | HKD | | | | 105,700,000 | | | | USD | | | | 48,559,902 | | | | 6,207,763 | |
Closed | | | (291 | ) | | | CHF | | | | (4,290,000 | ) | | | EUR | | | | (11,672,000 | ) | | | GBP | | | | (117,281,000 | ) | | | HKD | | | | — | | | | USD | | | | (23,273,016 | ) | | | (5,794,191 | ) |
Exercised | | | — | | | | | | | | — | | | | | | | | — | | | | | | | | — | | | | | | | | — | | | | | | | | — | | | | — | |
Expired | | | — | | | | | | | | — | | | | | | | | — | | | | | | | | — | | | | | | | | — | | | | USD | | | | (10,466,386 | ) | | | (110,475 | ) |
End of period | | | 149 | | | | CHF | | | | — | | | | EUR | | | | 9,996,163 | | | | GBP | | | | 6,707,747 | | | | HKD | | | | 105,700,000 | | | | USD | | | | 16,950,500 | | | $ | 1,941,208 | |
| | | | | | | | | | | | | | | | | | | | | | | | | | | | | | | | | | | | | | | | |
| |
| | | Put Options | |
| | | Number of
Contracts* | | | | | | Notional
Value | | | Notional
Value | | | Notional
Value | | | Notional
Value | | | Premiums
Received | |
Beginning of period | | | 582 | | | | EUR | | | | 10,154,250 | | | | GBP | | | | — | | | | JPY | | | | — | | | | USD | | | | 5,527,000 | | | $ | 706,900 | |
Written | | | 3,888 | | | | EUR | | | | 168,103,898 | | | | GBP | | | | 22,879,187 | | | | JPY | | | | 5,712,500,000 | | | | USD | | | | 86,666,103 | | | | 13,678,985 | |
Closed | | | (2,376 | ) | | | EUR | | | | (83,943,547 | ) | | | | | | | — | | | | JPY | | | | (1,351,250,000 | ) | | | USD | | | | (51,602,103 | ) | | | (6,629,018 | ) |
Exercised | | | — | | | | | | | | — | | | | | | | | — | | | | | | | | — | | | | | | | | — | | | | — | |
Expired | | | (884 | ) | | | EUR | | | | (44,557,778 | ) | | | | | | | — | | | | JPY | | | | (1,610,250,000 | ) | | | USD | | | | (7,076,000 | ) | | | (1,235,208 | ) |
End of period | | | 1,210 | | | | EUR | | | | 49,756,823 | | | | GBP | | | | 22,879,187 | | | | JPY | | | | 2,751,000,000 | | | | USD | | | | 33,515,000 | | | $ | 6,521,659 | |
| * | Does not include swaptions written and foreign currency options written. |
| | | | | | | | | | | | | | | | | | | | |
| Open Futures Contracts(h) | |
| Futures Contracts | | Type of
Contract | | | Number of
Contracts | | | Expiration
Month | | | Notional
Value | | | Unrealized
Appreciation
(Depreciation) | |
CAA Index | | | Long | | | | 914 | | | | December-2015 | | | $ | 6,895,163 | | | $ | 194,423 | |
E-Mini Consumer Staples Sector | | | Long | | | | 140 | | | | December-2015 | | | | 6,995,800 | | | | 458,330 | |
FTSE 100 Index | | | Long | | | | 136 | | | | December-2015 | | | | 13,252,080 | | | | 486,753 | |
E-Mini Consumer Discretionary Sector | | | Short | | | | 90 | | | | December-2015 | | | | (7,315,200 | ) | | | (574,042 | ) |
E-Mini S&P 500 Index | | | Short | | | | 11 | | | | December-2015 | | | | (1,140,535 | ) | | | (73,042 | ) |
MSCI AC Asia Index | | | Short | | | | 169 | | | | December-2015 | | | | (5,922,757 | ) | | | (315,839 | ) |
Nikkei 225 | | | Short | | | | 18 | | | | December-2015 | | | | (1,422,309 | ) | | | (113,516 | ) |
Russell 2000 Index Mini | | | Short | | | | 71 | | | | December-2015 | | | | (8,223,930 | ) | | | (117,999 | ) |
SPI 200 Index | | | Short | | | | 35 | | | | December-2015 | | | | (3,267,068 | ) | | | (112,706 | ) |
STOXX Europe 600 Index | | | Short | | | | 633 | | | | December-2015 | | | | (13,024,220 | ) | | | (680,453 | ) |
Total — Futures Contracts — Equity Risk | | | | | | | | | | | | | | | | | | $ | (848,091 | ) |
| (h) | Futures contracts collateralized by $2,363,148 cash held with Bank of America Merrill Lynch, the futures commission merchant. |
| | | | | | | | | | | | | | | | | | | | | | | | | | | | | | | | | | |
| Open Centrally Cleared Credit Default Swap Agreements(i)(j) | |
| Counterparty/Clearinghouse | | Reference Entity | | Buy/Sell
Protection | | | (Pay)/
Receive
Fixed
Rate | | | Implied
Credit
Spread(g) | | | Expiration Date | | | | | | Notional
Value | | | Upfront
Payments
Paid
(Received) | | | Unrealized
Appreciation
(Depreciation) | |
Credit Suisse First Boston/CME | | Markit CDX NA IG Index | | | Sell | | | | 1.00 | % | | | 0.79 | % | | | December-2020 | | | | USD | | | | 6,953,000 | | | $ | 43,575 | | | $ | 28,298 | |
Credit Suisse First Boston/ICE | | Markit iTraxx Europe Index | | | Sell | | | | 1.00 | | | | 1.08 | | | | December-2025 | | | | EUR | | | | 31,393,485 | | | | (535,116 | ) | | | 300,531 | |
Credit Suisse First Boston/ICE | | Markit iTraxx Europe Index | | | Buy | | | | (1.00 | ) | | | 0.71 | | | | December-2020 | | | | EUR | | | | 31,393,485 | | | | (365,533 | ) | | | (145,517 | ) |
Credit Suisse First Boston/CME | | Markit CDX NA HY Index | | | Buy | | | | (5.00 | ) | | | 4.27 | | | | December-2020 | | | | USD | | | | 5,628,000 | | | | 2,275 | | | | (183,626 | ) |
Total — Credit Default Swap Agreements — Credit Risk | | | | | | | | | | | | | | | $ | (854,799 | ) | | $ | (314 | ) |
Abbreviations:
| | |
| CME | | – Chicago Mercantile Exchange |
| EUR | | – Euro |
| | |
| ICE | | – Intercontinental Exchange |
| USD | | – U.S. Dollar |
| (i) | Implied credit spreads represent the current level as of October 31, 2015 at which protection could be bought or sold given the terms of the existing credit default swap contract and serve as an indicator of the current status of the payment/performance risk of the credit default swap contract. An implied credit spread that has widened or increased since entry into the initial contract may indicate a deteriorating credit profile and increased risk of default for the reference entity. A declining or narrowing spread may indicate an improving credit profile or decreased risk of default for the reference entity. Alternatively, credit spreads may increase or decrease reflecting the general tolerance for risk in the credit spread markets generally. |
See accompanying Notes to Consolidated Financial Statements which are an integral part of the financial statements.
19 Invesco Global Targeted Returns Fund
| | | | | | | | | | | | | | | | | | | | | | | | | | |
| Open Centrally Cleared Interest Rate Swap Agreements(j) | |
| Counterparty/Clearinghouse | | Pay/Receive
Floating Rate | | Floating Rate Index | | | Fixed
Rate | | | Termination
Date | | | Notional
Value | | | Unrealized
Appreciation
(Depreciation) | |
Credit Suisse First Boston/CME | | Receive | | | 6 Month EUR LIBOR | | | | 0.724 | % | | | February-2025 | | | | EUR | | | | 4,051,000 | | | $ | 53,107 | |
Credit Suisse First Boston/CME | | Receive | | | 6 Month EUR LIBOR | | | | 0.728 | | | | February-2025 | | | | EUR | | | | 384,000 | | | | 5,338 | |
Credit Suisse First Boston/CME | | Receive | | | 6 Month EUR LIBOR | | | | 0.704 | | | | February-2025 | | | | EUR | | | | 536,000 | | | | 8,761 | |
Credit Suisse First Boston/CME | | Receive | | | 6 Month EUR LIBOR | | | | 0.687 | | | | February-2025 | | | | EUR | | | | 121,000 | | | | 2,235 | |
Credit Suisse First Boston/CME | | Receive | | | 6 Month EUR LIBOR | | | | 0.623 | | | | March-2025 | | | | EUR | | | | 470,000 | | | | 11,988 | |
Credit Suisse First Boston/CME | | Receive | | | 6 Month EUR LIBOR | | | | 0.552 | | | | April-2025 | | | | EUR | | | | 557,000 | | | | 18,605 | |
Credit Suisse First Boston/CME | | Receive | | | 6 Month EUR LIBOR | | | | 0.487 | | | | April-2025 | | | | EUR | | | | 773,000 | | | | 31,083 | |
Credit Suisse First Boston/CME | | Receive | | | 6 Month EUR LIBOR | | | | 0.466 | | | | April-2025 | | | | EUR | | | | 439,000 | | | | 18,723 | |
Credit Suisse First Boston/CME | | Receive | | | 6 Month EUR LIBOR | | | | 0.860 | | | | May-2025 | | | | EUR | | | | 3,722,000 | | | | 7,448 | |
Credit Suisse First Boston/CME | | Receive | | | 6 Month EUR LIBOR | | | | 0.943 | | | | May-2025 | | | | EUR | | | | 167,000 | | | | (1,096 | ) |
Credit Suisse First Boston/CME | | Receive | | | 6 Month EUR LIBOR | | | | 0.971 | | | | May-2025 | | | | EUR | | | | 213,000 | | | | (2,034 | ) |
Credit Suisse First Boston/CME | | Receive | | | 6 Month EUR LIBOR | | | | 1.042 | | | | June-2025 | | | | EUR | | | | 637,000 | | | | (10,567 | ) |
Credit Suisse First Boston/CME | | Receive | | | 6 Month EUR LIBOR | | | | 1.176 | | | | June-2025 | | | | EUR | | | | 330,000 | | | | (10,155 | ) |
Credit Suisse First Boston/CME | | Receive | | | 6 Month EUR LIBOR | | | | 1.267 | | | | June-2025 | | | | EUR | | | | 723,000 | | | | (28,916 | ) |
Credit Suisse First Boston/CME | | Receive | | | 6 Month EUR LIBOR | | | | 1.270 | | | | June-2025 | | | | EUR | | | | 380,000 | | | | (15,320 | ) |
Credit Suisse First Boston/CME | | Receive | | | 6 Month EUR LIBOR | | | | 1.201 | | | | July-2025 | | | | EUR | | | | 276,000 | | | | (9,039 | ) |
Credit Suisse First Boston/CME | | Receive | | | 6 Month EUR LIBOR | | | | 1.208 | | | | July-2025 | | | | EUR | | | | 448,000 | | | | (15,026 | ) |
Credit Suisse First Boston/CME | | Receive | | | 6 Month EUR LIBOR | | | | 1.717 | | | | July-2025 | | | | EUR | | | | 4,275,000 | | | | (45,649 | ) |
Credit Suisse First Boston/CME | | Receive | | | 6 Month EUR LIBOR | | | | 1.727 | | | | July-2025 | | | | EUR | | | | 1,414,000 | | | | (15,671 | ) |
Credit Suisse First Boston/CME | | Receive | | | 6 Month EUR LIBOR | | | | 1.221 | | | | July-2025 | | | | EUR | | | | 597,000 | | | | (20,766 | ) |
Credit Suisse First Boston/CME | | Receive | | | 6 Month EUR LIBOR | | | | 1.259 | | | | July-2025 | | | | EUR | | | | 310,000 | | | | (12,027 | ) |
Credit Suisse First Boston/CME | | Receive | | | 6 Month EUR LIBOR | | | | 2.057 | | | | July-2025 | | | | EUR | | | | 4,464,432 | | | | (128,398 | ) |
Credit Suisse First Boston/CME | | Receive | | | 6 Month EUR LIBOR | | | | 1.970 | | | | July-2025 | | | | EUR | | | | 5,135,000 | | | | (123,579 | ) |
Credit Suisse First Boston/CME | | Receive | | | 6 Month EUR LIBOR | | | | 1.894 | | | | July-2025 | | | | EUR | | | | 2,232,000 | | | | (44,697 | ) |
Credit Suisse First Boston/CME | | Receive | | | 6 Month EUR LIBOR | | | | 1.156 | | | | July-2025 | | | | EUR | | | | 220,000 | | | | (6,119 | ) |
Credit Suisse First Boston/CME | | Receive | | | 6 Month EUR LIBOR | | | | 1.192 | | | | July-2025 | | | | EUR | | | | 547,000 | | | | (17,287 | ) |
Credit Suisse First Boston/CME | | Receive | | | 6 Month EUR LIBOR | | | | 1.804 | | | | July-2025 | | | | EUR | | | | 2,213,568 | | | | (33,578 | ) |
Credit Suisse First Boston/CME | | Receive | | | 6 Month EUR LIBOR | | | | 1.051 | | | | July-2025 | | | | EUR | | | | 140,000 | | | | (2,338 | ) |
Credit Suisse First Boston/CME | | Receive | | | 6 Month EUR LIBOR | | | | 1.052 | | | | July-2025 | | | | EUR | | | | 150,000 | | | | (2,528 | ) |
Credit Suisse First Boston/CME | | Receive | | | 6 Month EUR LIBOR | | | | 1.700 | | | | July-2025 | | | | EUR | | | | 1,500,000 | | | | (14,152 | ) |
Credit Suisse First Boston/CME | | Receive | | | 6 Month EUR LIBOR | | | | 0.963 | | | | September-2025 | | | | EUR | | | | 275,000 | | | | (1,658 | ) |
Credit Suisse First Boston/CME | | Receive | | | 6 Month EUR LIBOR | | | | 1.004 | | | | September-2025 | | | | EUR | | | | 453,000 | | | | (4,778 | ) |
Credit Suisse First Boston/CME | | Receive | | | 6 Month EUR LIBOR | | | | 1.635 | | | | September-2025 | | | | EUR | | | | 1,208,000 | | | | (5,276 | ) |
Credit Suisse First Boston/CME | | Receive | | | 6 Month EUR LIBOR | | | | 0.965 | | | | October-2025 | | | | EUR | | | | 208,000 | | | | (1,248 | ) |
Credit Suisse First Boston/CME | | Receive | | | 6 Month EUR LIBOR | | | | 0.966 | | | | October-2025 | | | | EUR | | | | 401,000 | | | | (2,450 | ) |
Credit Suisse First Boston/CME | | Receive | | | 6 Month EUR LIBOR | | | | 1.600 | | | | October-2025 | | | | EUR | | | | 801,000 | | | | (1,760 | ) |
Credit Suisse First Boston/CME | | Receive | | | 6 Month EUR LIBOR | | | | 0.931 | | | | October-2025 | | | | EUR | | | | 202,000 | | | | (364 | ) |
Credit Suisse First Boston/CME | | Receive | | | 6 Month EUR LIBOR | | | | 0.944 | | | | October-2025 | | | | EUR | | | | 632,000 | | | | (2,019 | ) |
Credit Suisse First Boston/CME | | Receive | | | 6 Month EUR LIBOR | | | | 1.558 | | | | October-2025 | | | | EUR | | | | 506,000 | | | | 302 | |
Credit Suisse First Boston/CME | | Receive | | | 6 Month EUR LIBOR | | | | 0.825 | | | | October-2025 | | | | EUR | | | | 161,000 | | | | 1,601 | |
Credit Suisse First Boston/CME | | Receive | | | 6 Month EUR LIBOR | | | | 0.838 | | | | October-2025 | | | | EUR | | | | 353,000 | | | | 3,037 | |
Credit Suisse First Boston/CME | | Receive | | | 6 Month EUR LIBOR | | | | 1.484 | | | | October-2025 | | | | EUR | | | | 1,211,000 | | | | 5,930 | |
Credit Suisse First Boston/CME | | Receive | | | 6 Month EUR LIBOR | | | | 1.825 | | | | July-2049 | | | | EUR | | | | 3,971,379 | | | | (79,695 | ) |
Credit Suisse First Boston/CME | | Receive | | | 6 Month EUR LIBOR | | | | 1.880 | | | | July-2049 | | | | EUR | | | | 5,895,621 | | | | (202,347 | ) |
Credit Suisse First Boston/CME | | Receive | | | 6 Month EUR LIBOR | | | | 2.014 | | | | July-2049 | | | | EUR | | | | 547,000 | | | | (38,071 | ) |
Credit Suisse First Boston/CME | | Receive | | | 6 Month EUR LIBOR | | | | 1.819 | | | | July-2049 | | | | EUR | | | | 270,000 | | | | (5,149 | ) |
Credit Suisse First Boston/CME | | Receive | | | 6 Month EUR LIBOR | | | | 1.800 | | | | September-2049 | | | | EUR | | | | 446,000 | | | | (5,792 | ) |
Credit Suisse First Boston/CME | | Receive | | | 6 Month EUR LIBOR | | | | 1.740 | | | | October-2049 | | | | EUR | | | | 401,000 | | | | 1,379 | |
Credit Suisse First Boston/CME | | Receive | | | 6 Month EUR LIBOR | | | | 1.738 | | | | October-2049 | | | | EUR | | | | 506,000 | | | | 2,243 | |
Credit Suisse First Boston/CME | | Receive | | | 6 Month EUR LIBOR | | | | 1.702 | | | | October-2049 | | | | EUR | | | | 505,000 | | | | 7,115 | |
See accompanying Notes to Consolidated Financial Statements which are an integral part of the financial statements.
20 Invesco Global Targeted Returns Fund
| | | | | | | | | | | | | | | | | | | | | | | | | | |
| Open Centrally Cleared Interest Rate Swap Agreements(j)—(continued) | |
| Counterparty/Clearinghouse | | Pay/Receive
Floating Rate | | Floating Rate Index | | | Fixed
Rate | | | Termination
Date | | | Notional
Value | | | Unrealized
Appreciation
(Depreciation) | |
Credit Suisse First Boston/CME | | Receive | | | 6 Month GBP LIBOR | | | | 2.463 | % | | | May-2025 | | | | GBP | | | | 8,364,000 | | | $ | (37,617 | ) |
Credit Suisse First Boston/CME | | Receive | | | 6 Month GBP LIBOR | | | | 2.680 | | | | June-2025 | | | | GBP | | | | 350,000 | | | | (6,769 | ) |
Credit Suisse First Boston/CME | | Receive | | | 6 Month GBP LIBOR | | | | 2.807 | | | | June-2025 | | | | GBP | | | | 772,000 | | | | (21,555 | ) |
Credit Suisse First Boston/CME | | Receive | | | 6 Month GBP LIBOR | | | | 2.795 | | | | July-2025 | | | | GBP | | | | 477,000 | | | | (12,840 | ) |
Credit Suisse First Boston/CME | | Receive | | | 6 Month GBP LIBOR | | | | 2.750 | | | | July-2025 | | | | GBP | | | | 850,000 | | | | (20,026 | ) |
Credit Suisse First Boston/CME | | Receive | | | 6 Month GBP LIBOR | | | | 2.761 | | | | July-2025 | | | | GBP | | | | 643,000 | | | | (15,648 | ) |
Credit Suisse First Boston/CME | | Receive | | | 6 Month GBP LIBOR | | | | 2.710 | | | | July-2025 | | | | GBP | | | | 427,000 | | | | (8,812 | ) |
Credit Suisse First Boston/CME | | Receive | | | 6 Month GBP LIBOR | | | | 2.730 | | | | July-2025 | | | | GBP | | | | 750,000 | | | | (16,527 | ) |
Credit Suisse First Boston/CME | | Receive | | | 6 Month GBP LIBOR | | | | 2.550 | | | | July-2025 | | | | GBP | | | | 280,000 | | | | (2,602 | ) |
Credit Suisse First Boston/CME | | Receive | | | 6 Month GBP LIBOR | | | | 2.320 | | | | August-2025 | | | | GBP | | | | 1,164,594 | | | | 8,263 | |
Credit Suisse First Boston/CME | | Receive | | | 6 Month GBP LIBOR | | | | 2.358 | | | | September-2025 | | | | GBP | | | | 821,000 | | | | 3,897 | |
Credit Suisse First Boston/CME | | Receive | | | 6 Month GBP LIBOR | | | | 2.300 | | | | September-2025 | | | | GBP | | | | 622,000 | | | | 5,448 | |
Credit Suisse First Boston/CME | | Receive | | | 6 Month GBP LIBOR | | | | 2.293 | | | | October-2025 | | | | GBP | | | | 639,000 | | | | 6,086 | |
Credit Suisse First Boston/CME | | Receive | | | 6 Month GBP LIBOR | | | | 2.280 | | | | October-2025 | | | | GBP | | | | 7,634,000 | | | | 79,522 | |
Credit Suisse First Boston/CME | | Receive | | | 6 Month GBP LIBOR | | | | 2.283 | | | | October-2025 | | | | GBP | | | | 136,000 | | | | 1,406 | |
Credit Suisse First Boston/CME | | Pay | | | 6 Month AUD LIBOR | | | | 2.723 | | | | February-2025 | | | | AUD | | | | 6,058,400 | | | | (52,867 | ) |
Credit Suisse First Boston/CME | | Pay | | | 6 Month AUD LIBOR | | | | 2.752 | | | | February-2025 | | | | AUD | | | | 683,600 | | | | (4,701 | ) |
Credit Suisse First Boston/CME | | Pay | | | 6 Month AUD LIBOR | | | | 2.773 | | | | February-2025 | | | | AUD | | | | 783,000 | | | | (4,852 | ) |
Credit Suisse First Boston/CME | | Pay | | | 6 Month AUD LIBOR | | | | 2.872 | | | | March-2025 | | | | AUD | | | | 296,000 | | | | 30 | |
Credit Suisse First Boston/CME | | Pay | | | 6 Month AUD LIBOR | | | | 2.672 | | | | April-2025 | | | | AUD | | | | 815,000 | | | | (10,753 | ) |
Credit Suisse First Boston/CME | | Pay | | | 6 Month AUD LIBOR | | | | 2.670 | | | | April-2025 | | | | AUD | | | | 1,082,000 | | | | (14,651 | ) |
Credit Suisse First Boston/CME | | Pay | | | 6 Month AUD LIBOR | | | | 2.795 | | | | April-2025 | | | | AUD | | | | 607,000 | | | | (3,286 | ) |
Credit Suisse First Boston/CME | | Pay | | | 6 Month AUD LIBOR | | | | 3.365 | | | | May-2025 | | | | AUD | | | | 301,000 | | | | 10,045 | |
Credit Suisse First Boston/CME | | Pay | | | 6 Month AUD LIBOR | | | | 3.225 | | | | June-2025 | | | | AUD | | | | 912,000 | | | | 21,494 | |
Credit Suisse First Boston/CME | | Pay | | | 6 Month AUD LIBOR | | | | 3.373 | | | | June-2025 | | | | AUD | | | | 550,000 | | | | 18,330 | |
Credit Suisse First Boston/CME | | Pay | | | 6 Month AUD LIBOR | | | | 3.465 | | | | June-2025 | | | | AUD | | | | 1,052,000 | | | | 41,428 | |
Credit Suisse First Boston/CME | | Pay | | | 6 Month AUD LIBOR | | | | 3.413 | | | | July-2025 | | | | AUD | | | | 550,000 | | | | 19,688 | |
Credit Suisse First Boston/CME | | Pay | | | 6 Month AUD LIBOR | | | | 3.353 | | | | July-2025 | | | | AUD | | | | 885,000 | | | | 28,177 | |
Credit Suisse First Boston/CME | | Pay | | | 6 Month AUD LIBOR | | | | 3.345 | | | | July-2025 | | | | AUD | | | | 807,000 | | | | 25,304 | |
Credit Suisse First Boston/CME | | Pay | | | 6 Month AUD LIBOR | | | | 3.170 | | | | July-2025 | | | | AUD | | | | 821,000 | | | | 16,410 | |
Credit Suisse First Boston/CME | | Pay | | | 6 Month AUD LIBOR | | | | 3.666 | | | | September-2025 | | | | AUD | | | | 4,096,000 | | | | 26,562 | |
Credit Suisse First Boston/CME | | Pay | | | 6 Month AUD LIBOR | | | | 3.683 | | | | September-2025 | | | | AUD | | | | 8,185,000 | | | | 57,063 | |
Credit Suisse First Boston/CME | | Pay | | | 6 Month AUD LIBOR | | | | 3.666 | | | | September-2025 | | | | AUD | | | | 5,513,000 | | | | 35,747 | |
Credit Suisse First Boston/CME | | Pay | | | 6 Month AUD LIBOR | | | | 3.019 | | | | September-2025 | | | | AUD | | | | 1,188,000 | | | | 11,158 | |
Credit Suisse First Boston/CME | | Pay | | | 6 Month AUD LIBOR | | | | 2.898 | | | | October-2025 | | | | AUD | | | | 1,289,000 | | | | 2,358 | |
Credit Suisse First Boston/CME | | Pay | | | 6 Month AUD LIBOR | | | | 3.474 | | | | October-2025 | | | | AUD | | | | 644,000 | | | | 346 | |
Credit Suisse First Boston/CME | | Pay | | | 6 Month AUD LIBOR | | | | 2.870 | | | | October-2025 | | | | AUD | | | | 383,000 | | | | (103 | ) |
Credit Suisse First Boston/CME | | Pay | | | 6 Month AUD LIBOR | | | | 3.445 | | | | October-2025 | | | | AUD | | | | 690,000 | | | | (444 | ) |
Credit Suisse First Boston/CME | | Pay | | | 6 Month EUR LIBOR | | | | 0.974 | | | | October-2025 | | | | EUR | | | | 2,372,000 | | | | 16,338 | |
Credit Suisse First Boston/CME | | Pay | | | 6 Month EUR LIBOR | | | | 1.831 | | | | July-2029 | | | | EUR | | | | 9,928,446 | | | | 176,120 | |
Credit Suisse First Boston/CME | | Pay | | | 6 Month EUR LIBOR | | | | 1.881 | | | | July-2029 | | | | EUR | | | | 14,738,554 | | | | 326,402 | |
Credit Suisse First Boston/CME | | Pay | | | 6 Month EUR LIBOR | | | | 1.998 | | | | July-2029 | | | | EUR | | | | 1,368,000 | | | | 47,501 | |
Credit Suisse First Boston/CME | | Pay | | | 6 Month EUR LIBOR | | | | 1.805 | | | | July-2029 | | | | EUR | | | | 700,000 | | | | 10,241 | |
Credit Suisse First Boston/CME | | Pay | | | 6 Month EUR LIBOR | | | | 1.770 | | | | September-2029 | | | | EUR | | | | 1,114,000 | | | | 9,944 | |
Credit Suisse First Boston/CME | | Pay | | | 6 Month EUR LIBOR | | | | 1.721 | | | | October-2029 | | | | EUR | | | | 1,002,000 | | | | 3,385 | |
Credit Suisse First Boston/CME | | Pay | | | 6 Month EUR LIBOR | | | | 1.693 | | | | October-2029 | | | | EUR | | | | 1,264,000 | | | | (387 | ) |
Credit Suisse First Boston/CME | | Pay | | | 6 Month EUR LIBOR | | | | 1.622 | | | | October-2029 | | | | EUR | | | | 1,262,000 | | | | (10,332 | ) |
Credit Suisse First Boston/CME | | Pay | | | 3 Month SEK LIBOR | | | | 2.290 | | | | July-2025 | | | | SEK | | | | 45,000,000 | | | | 8,786 | |
Credit Suisse First Boston/CME | | Pay | | | 3 Month SEK LIBOR | | | | 2.260 | | | | July-2025 | | | | SEK | | | | 14,892,000 | | | | 275 | |
Credit Suisse First Boston/CME | | Pay | | | 3 Month SEK LIBOR | | | | 2.578 | | | | July-2025 | | | | SEK | | | | 44,676,719 | | | | 78,007 | |
See accompanying Notes to Consolidated Financial Statements which are an integral part of the financial statements.
21 Invesco Global Targeted Returns Fund
| | | | | | | | | | | | | | | | | | | | | | | | | | |
| Open Centrally Cleared Interest Rate Swap Agreements(j)—(continued) | |
| Counterparty/Clearinghouse | | Pay/Receive
Floating Rate | | Floating Rate Index | | | Fixed
Rate | | | Termination
Date | | | Notional
Value | | | Unrealized
Appreciation
(Depreciation) | |
Credit Suisse First Boston/CME | | Pay | | | 3 Month SEK LIBOR | | | | 2.476 | % | | | July-2025 | | | | SEK | | | | 44,677,000 | | | $ | 53,149 | |
Credit Suisse First Boston/CME | | Pay | | | 3 Month SEK LIBOR | | | | 2.395 | | | | July-2025 | | | | SEK | | | | 16,680,000 | | | | 12,504 | |
Credit Suisse First Boston/CME | | Pay | | | 3 Month SEK LIBOR | | | | 2.305 | | | | July-2025 | | | | SEK | | | | 18,514,281 | | | | 4,770 | |
Credit Suisse First Boston/CME | | Pay | | | 3 Month SEK LIBOR | | | | 2.260 | | | | July-2025 | | | | SEK | | | | 17,000,000 | | | | (194 | ) |
Credit Suisse First Boston/CME | | Pay | | | 3 Month SEK LIBOR | | | | 2.236 | | | | September-2025 | | | | SEK | | | | 7,042,000 | | | | (2,171 | ) |
Credit Suisse First Boston/CME | | Pay | | | 3 Month SEK LIBOR | | | | 2.275 | | | | October-2025 | | | | SEK | | | | 10,606,000 | | | | (1,258 | ) |
Credit Suisse First Boston/CME | | Pay | | | 3 Month SEK LIBOR | | | | 2.265 | | | | October-2025 | | | | SEK | | | | 8,198,000 | | | | (1,782 | ) |
Credit Suisse First Boston/CME | | Pay | | | 3 Month SEK LIBOR | | | | 2.205 | | | | October-2025 | | | | SEK | | | | 8,526,000 | | | | (4,832 | ) |
Subtotal — Centrally Cleared Interest Rate Swap Agreements | | | $ | 180,521 | |
Abbreviations:
| | |
| AUD | | – Australian Dollar |
| EUR | | – Euro |
| | |
| LIBOR | | – London Interbank Offered Rate |
| CME | | – Chicago Mercantile Exchange |
| | |
| GBP | | – British Pound Sterling |
| SEK | | – Swedish Krona |
| (j) | Centrally cleared swap agreements collateralized by $2,197,251 cash held with Credit Suisse First Boston. |
| | | | | | | | | | | | | | | | | | | | | | | | | | |
| Open Over-The-Counter Inflation Swap Agreements(k) | |
| Counterparty | | Pay/Receive
Floating Rate | | Floating Rate Index | | | Fixed
Rate | | | Termination
Date | | | Notional
Value | | | Unrealized
Appreciation
(Depreciation) | |
Citigroup Global Markets Inc.(c) | | Receive | | | United Kingdom RPI | | | | 2.988 | % | | | May-2020 | | | | GBP | | | | 319,719 | | | $ | (11,070 | ) |
Citigroup Global Markets Inc.(c) | | Receive | | | United Kingdom RPI | | | | 2.880 | | | | July-2020 | | | | GBP | | | | 550,000 | | | | (9,723 | ) |
Citigroup Global Markets Inc.(c) | | Receive | | | United Kingdom RPI | | | | 2.955 | | | | July-2020 | | | | GBP | | | | 854,000 | | | | (20,363 | ) |
Citigroup Global Markets Inc.(c) | | Receive | | | United Kingdom RPI | | | | 3.065 | | | | July-2020 | | | | GBP | | | | 954,000 | | | | (31,417 | ) |
Citigroup Global Markets Inc.(c) | | Receive | | | United Kingdom RPI | | | | 2.658 | | | | September-2020 | | | | GBP | | | | 1,245,000 | | | | 549 | |
Deutsche Bank Securities Inc.(c) | | Receive | | | United Kingdom RPI | | | | 2.720 | | | | January-2020 | | | | GBP | | | | 1,155,175 | | | | (32,081 | ) |
Deutsche Bank Securities Inc.(c) | | Receive | | | United Kingdom RPI | | | | 2.675 | | | | April-2020 | | | | GBP | | | | 1,817,000 | | | | (24,047 | ) |
Deutsche Bank Securities Inc.(c) | | Receive | | | United Kingdom RPI | | | | 2.740 | | | | April-2020 | | | | GBP | | | | 1,954,000 | | | | (36,216 | ) |
Deutsche Bank Securities Inc.(c) | | Receive | | | United Kingdom RPI | | | | 2.778 | | | | April-2020 | | | | GBP | | | | 1,105,000 | | | | (23,863 | ) |
Deutsche Bank Securities Inc.(c) | | Receive | | | United Kingdom RPI | | | | 2.612 | | | | October-2020 | | | | GBP | | | | 1,278,000 | | | | 3,115 | |
Morgan Stanley Capital Services LLC(c) | | Receive | | | United Kingdom RPI | | | | 2.690 | | | | February-2020 | | | | GBP | | | | 11,857,170 | | | | (263,496 | ) |
Morgan Stanley Capital Services LLC(c) | | Receive | | | United Kingdom RPI | | | | 2.650 | | | | March-2020 | | | | GBP | | | | 814,000 | | | | (9,623 | ) |
Morgan Stanley Capital Services LLC(c) | | Receive | | | United Kingdom RPI | | | | 3.015 | | | | July-2020 | | | | GBP | | | | 1,286,000 | | | | (37,026 | ) |
Morgan Stanley Capital Services LLC(c) | | Receive | | | United Kingdom RPI | | | | 2.720 | | | | September-2020 | | | | GBP | | | | 1,642,000 | | | | (7,587 | ) |
Morgan Stanley Capital Services LLC(c) | | Receive | | | United Kingdom RPI | | | | 2.605 | | | | October-2020 | | | | GBP | | | | 272,000 | | | | 817 | |
Citigroup Global Markets Inc.(c) | | Pay | | | United Kingdom RPI | | | | 3.178 | | | | May-2025 | | | | GBP | | | | 319,719 | | | | 14,195 | |
Citigroup Global Markets Inc.(c) | | Pay | | | United Kingdom RPI | | | | 3.130 | | | | July-2025 | | | | GBP | | | | 550,000 | | | | 14,486 | |
Citigroup Global Markets Inc.(c) | | Pay | | | United Kingdom RPI | | | | 3.190 | | | | July-2025 | | | | GBP | | | | 854,000 | | | | 31,449 | |
Citigroup Global Markets Inc.(c) | | Pay | | | United Kingdom RPI | | | | 3.248 | | | | July-2025 | | | | GBP | | | | 954,000 | | | | 44,796 | |
Citigroup Global Markets Inc.(c) | | Pay | | | United Kingdom RPI | | | | 2.949 | | | | September-2025 | | | | GBP | | | | 1,245,000 | | | | (7,557 | ) |
Deutsche Bank Securities Inc.(c) | | Pay | | | United Kingdom RPI | | | | 2.932 | | | | January-2025 | | | | GBP | | | | 1,155,175 | | | | 23,073 | |
Deutsche Bank Securities Inc.(c) | | Pay | | | United Kingdom RPI | | | | 2.900 | | | | April-2025 | | | | GBP | | | | 1,817,000 | | | | 2,295 | |
Deutsche Bank Securities Inc.(c) | | Pay | | | United Kingdom RPI | | | | 2.965 | | | | April-2025 | | | | GBP | | | | 1,954,000 | | | | 24,315 | |
Deutsche Bank Securities Inc.(c) | | Pay | | | United Kingdom RPI | | | | 3.000 | | | | April-2025 | | | | GBP | | | | 1,105,000 | | | | 20,424 | |
Deutsche Bank Securities Inc.(c) | | Pay | | | United Kingdom RPI | | | | 2.926 | | | | October-2025 | | | | GBP | | | | 1,278,000 | | | | (11,215 | ) |
Morgan Stanley Capital Services LLC(c) | | Pay | | | United Kingdom RPI | | | | 2.923 | | | | February-2025 | | | | GBP | | | | 11,857,170 | | | | 172,955 | |
Morgan Stanley Capital Services LLC(c) | | Pay | | | United Kingdom RPI | | | | 2.865 | | | | March-2025 | | | | GBP | | | | 814,000 | | | | (2,878 | ) |
Morgan Stanley Capital Services LLC(c) | | Pay | | | United Kingdom RPI | | | | 3.250 | | | | July-2025 | | | | GBP | | | | 1,286,000 | | | | 60,917 | |
Morgan Stanley Capital Services LLC(c) | | Pay | | | United Kingdom RPI | | | | 3.010 | | | | September-2025 | | | | GBP | | | | 1,642,000 | | | | 7,239 | |
Morgan Stanley Capital Services LLC(c) | | Pay | | | United Kingdom RPI | | | | 2.943 | | | | October-2025 | | | | GBP | | | | 272,000 | | | | (1,622 | ) |
Subtotal — Over-The-Counter Inflation Swap Agreements | | | $ | (109,159 | ) |
Total Interest Rate and Inflation Swap Agreements — Interest Rate Risk | | | | | | | | | | | | | | | $ | 71,362 | |
See accompanying Notes to Consolidated Financial Statements which are an integral part of the financial statements.
22 Invesco Global Targeted Returns Fund
Abbreviations:
| | |
| GBP | | – British Pound Sterling |
| RPI | | – Retail Price Index |
| (c) | The investment is owned by the Subsidiary. See Note 5. |
| (k) | Inflation swap agreements collateralized by $75,000 cash held with Deutsche Bank Securities Inc. and Morgan Stanley Capital Services, LLC. |
| | | | | | | | | | | | | | | | | | | | | | | | | | |
| Open Over-The-Counter Variance Swap Agreements | |
| Counterparty | | Reference Entity | | Pay/Receive
Variance | | | Volatility
Strike Rate | | | Expiration
Date | | | Notional
Value | | | Unrealized
Appreciation
(Depreciation) | |
Goldman Sachs International | | Hang Seng China Enterprise Index | | | Pay | | | | 28.45 | % | | | December-2015 | | | | HKD | | | | 61,489 | | | $ | (22,256 | ) |
Goldman Sachs International | | Hang Seng China Enterprise Index | | | Pay | | | | 45.00 | | | | December-2016 | | | | HKD | | | | 146,000 | | | | 213,066 | |
Goldman Sachs International | | Hang Seng China Enterprise Index | | | Pay | | | | 37.00 | | | | December-2016 | | | | HKD | | | | 133,500 | | | | 74,628 | |
HSBC New York | | Hang Seng China Enterprise Index | | | Pay | | | | 43.00 | | | | December-2016 | | | | HKD | | | | 109,500 | | | | 131,159 | |
HSBC New York | | Hang Seng China Enterprise Index | | | Pay | | | | 42.75 | | | | December-2016 | | | | HKD | | | | 54,382 | | | | 63,769 | |
Societe Generale | | Hang Seng China Enterprise Index | | | Pay | | | | 41.40 | | | | December-2016 | | | | HKD | | | | 54,000 | | | | 59,732 | |
Societe Generale | | Hang Seng China Enterprise Index | | | Pay | | | | 35.50 | | | | December-2016 | | | | HKD | | | | 92,000 | | | | 44,089 | |
Societe Generale | | Hang Seng China Enterprise Index | | | Pay | | | | 35.60 | | | | December-2016 | | | | HKD | | | | 133,500 | | | | 53,088 | |
Goldman Sachs International | | Hang Seng Index | | | Pay | | | | 21.33 | | | | December-2015 | | | | HKD | | | | 58,299 | | | | (35,919 | ) |
Goldman Sachs International | | Hang Seng Index | | | Pay | | | | 33.00 | | | | December-2016 | | | | HKD | | | | 146,000 | | | | 116,494 | |
Societe Generale | | Hang Seng Index | | | Pay | | | | 28.50 | | | | December-2016 | | | | HKD | | | | 83,000 | | | | 25,886 | |
Societe Generale | | Hang Seng Index | | | Pay | | | | 32.50 | | | | December-2016 | | | | HKD | | | | 64,000 | | | | 47,953 | |
Barclays Bank PLC | | S&P 500 Index | | | Pay | | | | 21.00 | | | | December-2015 | | | | USD | | | | 1,870 | | | | 8,896 | |
Barclays Bank PLC | | S&P 500 Index | | | Pay | | | | 21.40 | | | | December-2015 | | | | USD | | | | 1,375 | | | | 6,876 | |
Goldman Sachs International | | S&P 500 Index | | | Pay | | | | 19.90 | | | | December-2016 | | | | USD | | | | 13,845 | | | | (3,181 | ) |
Goldman Sachs International | | S&P 500 Index | | | Pay | | | | 20.10 | | | | December-2016 | | | | USD | | | | 43,000 | | | | (191 | ) |
HSBC New York | | S&P 500 Index | | | Pay | | | | 18.75 | | | | December-2016 | | | | USD | | | | 28,000 | | | | (64,429 | ) |
HSBC New York | | S&P 500 Index | | | Pay | | | | 20.15 | | | | December-2016 | | | | USD | | | | 15,400 | | | | (2,623 | ) |
HSBC New York | | S&P 500 Index | | | Pay | | | | 20.25 | | | | December-2016 | | | | USD | | | | 27,630 | | | | 387 | |
Morgan Stanley Capital Services LLC | | S&P 500 Index | | | Pay | | | | 18.30 | | | | December-2015 | | | | USD | | | | 6,720 | | | | 20,576 | |
Morgan Stanley Capital Services LLC | | S&P 500 Index | | | Pay | | | | 18.35 | | | | December-2015 | | | | USD | | | | 11,620 | | | | 34,272 | |
Morgan Stanley Capital Services LLC | | S&P 500 Index | | | Pay | | | | 18.40 | | | | December-2015 | | | | USD | | | | 5,790 | | | | 17,614 | |
Societe Generale | | S&P 500 Index | | | Pay | | | | 17.80 | | | | December-2015 | | | | USD | | | | 15,516 | | | | (6,348 | ) |
Societe Generale | | S&P 500 Index | | | Pay | | | | 19.85 | | | | December-2016 | | | | USD | | | | 8,910 | | | | (7,518 | ) |
Societe Generale | | S&P 500 Index | | | Pay | | | | 20.60 | | | | December-2016 | | | | USD | | | | 13,052 | | | | (4,609 | ) |
Societe Generale | | S&P 500 Index | | | Pay | | | | 21.80 | | | | December-2016 | | | | USD | | | | 28,853 | | | | 29,012 | |
UBS | | S&P 500 Index | | | Pay | | | | 18.10 | | | | December-2015 | | | | USD | | | | 2,500 | | | | 8,199 | |
Barclays Bank PLC | | Hang Seng China Enterprise Index | | | Receive | | | | 29.25 | | | | December-2015 | | | | HKD | | | | 10,660 | | | | (980 | ) |
Deutsche Bank Securities Inc. | | Hang Seng China Enterprise Index | | | Receive | | | | 30.90 | | | | December-2015 | | | | HKD | | | | 158,920 | | | | (46,152 | ) |
Goldman Sachs International | | Hang Seng China Enterprise Index | | | Receive | | | | 27.20 | | | | December-2015 | | | | HKD | | | | 15,252 | | | | 2,744 | |
Goldman Sachs International | | Hang Seng China Enterprise Index | | | Receive | | | | 28.00 | | | | December-2015 | | | | HKD | | | | 33,372 | | | | 2,437 | |
Goldman Sachs International | | Hang Seng China Enterprise Index | | | Receive | | | | 31.35 | | | | December-2015 | | | | HKD | | | | 15,918 | | | | (5,474 | ) |
Goldman Sachs International | | Hang Seng China Enterprise Index | | | Receive | | | | 28.85 | | | | December-2016 | | | | HKD | | | | 38,135 | | | | 18,213 | |
Goldman Sachs International | | Hang Seng China Enterprise Index | | | Receive | | | | 29.65 | | | | December-2016 | | | | HKD | | | | 64,185 | | | | 23,321 | |
Goldman Sachs International | | Hang Seng China Enterprise Index | | | Receive | | | | 30.05 | | | | December-2016 | | | | HKD | | | | 9,837 | | | | 2,168 | |
Goldman Sachs International | | Hang Seng China Enterprise Index | | | Receive | | | | 30.20 | | | | December-2016 | | | | HKD | | | | 167,000 | | | | 32,551 | |
Goldman Sachs International | | Hang Seng China Enterprise Index | | | Receive | | | | 30.45 | | | | December-2016 | | | | HKD | | | | 87,000 | | | | 21,959 | |
Goldman Sachs International | | Hang Seng China Enterprise Index | | | Receive | | | | 30.70 | | | | December-2016 | | | | HKD | | | | 29,869 | | | | 6,523 | |
Goldman Sachs International | | Hang Seng China Enterprise Index | | | Receive | | | | 30.97 | | | | December-2016 | | | | HKD | | | | 65,100 | | | | 11,845 | |
Goldman Sachs International | | Hang Seng China Enterprise Index | | | Receive | | | | 30.98 | | | | December-2016 | | | | HKD | | | | 72,579 | | | | 13,108 | |
Goldman Sachs International | | Hang Seng China Enterprise Index | | | Receive | | | | 31.70 | | | | December-2016 | | | | HKD | | | | 21,615 | | | | 1,839 | |
Goldman Sachs International | | Hang Seng China Enterprise Index | | | Receive | | | | 32.40 | | | | December-2016 | | | | HKD | | | | 28,607 | | | | (162 | ) |
HSBC New York | | Hang Seng China Enterprise Index | | | Receive | | | | 27.00 | | | | December-2015 | | | | HKD | | | | 52,749 | | | | 10,926 | |
HSBC New York | | Hang Seng China Enterprise Index | | | Receive | | | | 27.75 | | | | December-2015 | | | | HKD | | | | 19,066 | | | | 2,022 | |
See accompanying Notes to Consolidated Financial Statements which are an integral part of the financial statements.
23 Invesco Global Targeted Returns Fund
| | | | | | | | | | | | | | | | | | | | | | | | | | |
| Open Over-The-Counter Variance Swap Agreements—(continued) | |
| Counterparty | | Reference Entity | | Pay/Receive
Variance | | | Volatility
Strike Rate | | | Expiration
Date | | | Notional
Value | | | Unrealized
Appreciation
(Depreciation) | |
HSBC New York | | Hang Seng China Enterprise Index | | | Receive | | | | 28.33 | % | | | December-2016 | | | | HKD | | | | 89,000 | | | $ | 38,896 | |
HSBC New York | | Hang Seng China Enterprise Index | | | Receive | | | | 29.00 | | | | December-2016 | | | | HKD | | | | 38,135 | | | | 17,386 | |
HSBC New York | | Hang Seng China Enterprise Index | | | Receive | | | | 30.25 | | | | December-2016 | | | | HKD | | | | 134,000 | | | | 26,534 | |
HSBC New York | | Hang Seng China Enterprise Index | | | Receive | | | | 30.40 | | | | December-2016 | | | | HKD | | | | 59,722 | | | | 11,008 | |
HSBC New York | | Hang Seng China Enterprise Index | | | Receive | | | | 30.50 | | | | December-2016 | | | | HKD | | | | 44,512 | | | | 10,931 | |
HSBC New York | | Hang Seng China Enterprise Index | | | Receive | | | | 42.60 | | | | December-2017 | | | | HKD | | | | 54,382 | | | | (49,074 | ) |
Morgan Stanley Capital Services LLC | | Hang Seng China Enterprise Index | | | Receive | | | | 25.25 | | | | December-2015 | | | | HKD | | | | 20,569 | | | | 6,023 | |
Morgan Stanley Capital Services LLC | | Hang Seng China Enterprise Index | | | Receive | | | | 25.70 | | | | December-2015 | | | | HKD | | | | 45,029 | | | | 10,260 | |
Morgan Stanley Capital Services LLC | | Hang Seng China Enterprise Index | | | Receive | | | | 25.80 | | | | December-2015 | | | | HKD | | | | 26,040 | | | | 4,718 | |
Societe Generale | | Hang Seng China Enterprise Index | | | Receive | | | | 26.45 | | | | December-2015 | | | | HKD | | | | 680 | | | | 193 | |
Societe Generale | | Hang Seng China Enterprise Index | | | Receive | | | | 27.50 | | | | December-2015 | | | | HKD | | | | 11,472 | | | | 1,600 | |
Societe Generale | | Hang Seng China Enterprise Index | | | Receive | | | | 28.30 | | | | December-2015 | | | | HKD | | | | 68,408 | | | | 24,764 | |
Societe Generale | | Hang Seng China Enterprise Index | | | Receive | | | | 28.50 | | | | December-2016 | | | | HKD | | | | 10,000 | | | | 4,175 | |
Societe Generale | | Hang Seng China Enterprise Index | | | Receive | | | | 29.15 | | | | December-2016 | | | | HKD | | | | 31,784 | | | | 13,805 | |
Societe Generale | | Hang Seng China Enterprise Index | | | Receive | | | | 29.30 | | | | December-2016 | | | | HKD | | | | 76,488 | | | | 29,918 | |
Societe Generale | | Hang Seng China Enterprise Index | | | Receive | | | | 29.50 | | | | December-2016 | | | | HKD | | | | 51,489 | | | | 19,798 | |
Societe Generale | | Hang Seng China Enterprise Index | | | Receive | | | | 30.20 | | | | December-2016 | | | | HKD | | | | 28,139 | | | | 4,131 | |
Societe Generale | | Hang Seng China Enterprise Index | | | Receive | | | | 31.45 | | | | December-2016 | | | | HKD | | | | 44,521 | | | | 5,253 | |
Societe Generale | | Hang Seng China Enterprise Index | | | Receive | | | | 32.50 | | | | December-2016 | | | | HKD | | | | 158,353 | | | | (20,799 | ) |
Societe Generale | | Hang Seng China Enterprise Index | | | Receive | | | | 32.60 | | | | December-2016 | | | | HKD | | | | 19,573 | | | | (1,764 | ) |
Societe Generale | | Hang Seng China Enterprise Index | | | Receive | | | | 33.10 | | | | December-2016 | | | | HKD | | | | 76,725 | | | | (7,251 | ) |
Societe Generale | | Hang Seng China Enterprise Index | | | Receive | | | | 34.75 | | | | December-2016 | | | | HKD | | | | 43,478 | | | | (12,908 | ) |
Societe Generale | | Hang Seng China Enterprise Index | | | Receive | | | | 37.50 | | | | December-2016 | | | | HKD | | | | 9,959 | | | | (7,028 | ) |
Societe Generale | | Hang Seng China Enterprise Index | | | Receive | | | | 35.35 | | | | December-2017 | | | | HKD | | | | 33,179 | | | | (2,347 | ) |
Barclays Bank PLC | | Hang Seng Index | | | Receive | | | | 23.20 | | | | December-2015 | | | | HKD | | | | 14,498 | | | | (1,528 | ) |
Goldman Sachs International | | Hang Seng Index | | | Receive | | | | 22.85 | | | | December-2016 | | | | HKD | | | | 20,000 | | | | 8,802 | |
Goldman Sachs International | | Hang Seng Index | | | Receive | | | | 24.35 | | | | December-2016 | | | | HKD | | | | 167,000 | | | | 33,963 | |
Goldman Sachs International | | Hang Seng Index | | | Receive | | | | 25.20 | | | | December-2016 | | | | HKD | | | | 34,138 | | | | 3,182 | |
HSBC New York | | Hang Seng Index | | | Receive | | | | 22.33 | | | | December-2016 | | | | HKD | | | | 84,000 | | | | 42,999 | |
HSBC New York | | Hang Seng Index | | | Receive | | | | 24.00 | | | | December-2016 | | | | HKD | | | | 133,139 | | | | 34,081 | |
HSBC New York | | Hang Seng Index | | | Receive | | | | 24.15 | | | | December-2016 | | | | HKD | | | | 59,722 | | | | 15,437 | |
Morgan Stanley Capital Services LLC | | Hang Seng Index | | | Receive | | | | 21.35 | | | | December-2015 | | | | HKD | | | | 20,569 | | | | (2,705 | ) |
Morgan Stanley Capital Services LLC | | Hang Seng Index | | | Receive | | | | 21.60 | | | | December-2015 | | | | HKD | | | | 45,029 | | | | (7,331 | ) |
Morgan Stanley Capital Services LLC | | Hang Seng Index | | | Receive | | | | 22.40 | | | | December-2015 | | | | HKD | | | | 26,040 | | | | (7,296 | ) |
Societe Generale | | Hang Seng Index | | | Receive | | | | 21.80 | | | | December-2015 | | | | HKD | | | | 67,661 | | | | 32,660 | |
Societe Generale | | Hang Seng Index | | | Receive | | | | 24.00 | | | | December-2016 | | | | HKD | | | | 34,535 | | | | 11,432 | |
Societe Generale | | Hang Seng Index | | | Receive | | | | 26.60 | | | | December-2016 | | | | HKD | | | | 20,981 | | | | (1,229 | ) |
Societe Generale | | Hang Seng Index | | | Receive | | | | 26.80 | | | | December-2016 | | | | HKD | | | | 81,316 | | | | (10,304 | ) |
Societe Generale | | Hang Seng Index | | | Receive | | | | 30.75 | | | | December-2016 | | | | HKD | | | | 99,588 | | | | (57,461 | ) |
UBS | | Hang Seng Index | | | Receive | | | | 21.00 | | | | December-2015 | | | | HKD | | | | 31,007 | | | | (6,509 | ) |
Goldman Sachs International | | KOSPI 200 Index | | | Receive | | | | 29.00 | | | | December-2016 | | | | KRW | | | | 44,475,000 | | | | (272,142 | ) |
Societe Generale | | KOSPI 200 Index | | | Receive | | | | 22.70 | | | | December-2016 | | | | KRW | | | | 4,285,384 | | | | (6,105 | ) |
Societe Generale | | KOSPI 200 Index | | | Receive | | | | 24.75 | | | | December-2016 | | | | KRW | | | | 15,304,350 | | | | (49,501 | ) |
Goldman Sachs International | | S&P 500 Index | | | Receive | | | | 18.05 | | | | December-2015 | | | | USD | | | | 20,257 | | | | 14,265 | |
Societe Generale | | S&P 500 Index | | | Receive | | | | 25.30 | | | | December-2016 | | | | USD | | | | 3,500 | | | | (15,023 | ) |
Total — Variance Swap Agreements — Equity Risk | | | $ | 793,419 | |
Currency Abbreviations:
| | |
| HKD | | – Hong Kong Dollar |
| KRW | | – South Korean Won |
| USD | | – United States Dollar |
See accompanying Notes to Consolidated Financial Statements which are an integral part of the financial statements.
24 Invesco Global Targeted Returns Fund
| | | | | | | | | | | | | | | | | | | | | | | | | | |
| Open Over-The-Counter Volatility Swap Agreements | |
| Counterparty | | Reference Entity | | Pay/Receive
Volatility | | | Volatility
Strike Rate | | | Expiration
Date | | | Notional
Value | | | Unrealized
Appreciation
(Depreciation) | |
Morgan Stanley Capital Services LLC | | Hang Seng China Enterprise Index | | | Pay | | | | 34.50 | % | | | December-2015 | | | | HKD | | | | 50,750 | | | $ | 31,622 | |
Societe Generale | | Hang Seng China Enterprise Index | | | Pay | | | | 33.00 | | | | December-2015 | | | | HKD | | | | 35,917 | | | | 19,663 | |
Societe Generale | | Hang Seng China Enterprise Index | | | Pay | | | | 35.00 | | | | December-2015 | | | | HKD | | | | 50,750 | | | | 34,896 | |
Societe Generale | | Hang Seng China Enterprise Index | | | Pay | | | | 35.50 | | | | December-2015 | | | | HKD | | | | 24,595 | | | | 26,602 | |
Societe Generale | | Hang Seng China Enterprise Index | | | Pay | | | | 36.50 | | | | December-2015 | | | | HKD | | | | 50,900 | | | | 46,643 | |
Societe Generale | | Hang Seng China Enterprise Index | | | Pay | | | | 36.75 | | | | December-2015 | | | | HKD | | | | 86,517 | | | | 80,576 | |
Subtotal — Equity Risk | | | | | | | | | | | | | | | | | | | | | | | | $ | 240,002 | |
Barclays Bank PLC | | AUD/JPY | | | Pay | | | | 14.20 | | | | April-2017 | | | | AUD | | | | 19,000 | | | $ | 3,622 | |
Deutsche Bank Securities Inc. | | AUD/JPY | | | Pay | | | | 14.90 | | | | March-2017 | | | | AUD | | | | 33,728 | | | | 21,768 | |
Deutsche Bank Securities Inc. | | AUD/JPY | | | Pay | | | | 15.275 | | | | March-2017 | | | | AUD | | | | 15,000 | | | | 11,365 | |
Goldman Sachs International | | AUD/JPY | | | Pay | | | | 15.275 | | | | March-2017 | | | | AUD | | | | 6,400 | | | | 4,849 | |
Goldman Sachs International | | AUD/JPY | | | Pay | | | | 15.40 | | | | March-2017 | | | | AUD | | | | 29,772 | | | | 30,125 | |
Goldman Sachs International | | AUD/JPY | | | Pay | | | | 15.55 | | | | March-2017 | | | | AUD | | | | 31,500 | | | | 33,250 | |
Citigroup Global Markets Inc. | | USD/JPY | | | Pay | | | | 9.60 | | | | October-2016 | | | | USD | | | | 6,457 | | | | 770 | |
Deutsche Bank Securities Inc. | | USD/JPY | | | Pay | | | | 9.05 | | | | June-2016 | | | | USD | | | | 2,625 | | | | 553 | |
Deutsche Bank Securities Inc. | | USD/JPY | | | Pay | | | | 9.00 | | | | June-2016 | | | | USD | | | | 1,578 | | | | 150 | |
Deutsche Bank Securities Inc. | | USD/JPY | | | Pay | | | | 8.75 | | | | July-2016 | | | | USD | | | | 4,500 | | | | (1,677 | ) |
Deutsche Bank Securities Inc. | | USD/JPY | | | Pay | | | | 9.60 | | | | August-2016 | | | | USD | | | | 3,600 | | | | 1,062 | |
Deutsche Bank Securities Inc. | | USD/JPY | | | Pay | | | | 9.45 | | | | September-2016 | | | | USD | | | | 12,450 | | | | 874 | |
Deutsche Bank Securities Inc. | | USD/JPY | | | Pay | | | | 10.525 | | | | November-2016 | | | | USD | | | | 12,800 | | | | 15,745 | |
Deutsche Bank Securities Inc. | | USD/JPY | | | Pay | | | | 12.15 | | | | December-2016 | | | | USD | | | | 3,564 | | | | 9,903 | |
Deutsche Bank Securities Inc. | | USD/JPY | | | Pay | | | | 11.35 | | | | January-2017 | | | | USD | | | | 4,500 | | | | 9,112 | |
Deutsche Bank Securities Inc. | | USD/JPY | | | Pay | | | | 11.55 | | | | January-2017 | | | | USD | | | | 9,000 | | | | 19,751 | |
Deutsche Bank Securities Inc. | | USD/JPY | | | Pay | | | | 11.50 | | | | February-2017 | | | | USD | | | | 6,120 | | | | 12,955 | |
Deutsche Bank Securities Inc. | | USD/JPY | | | Pay | | | | 10.80 | | | | February-2017 | | | | USD | | | | 2,571 | | | | 3,534 | |
Deutsche Bank Securities Inc. | | USD/JPY | | | Pay | | | | 11.00 | | | | March-2017 | | | | USD | | | | 15,000 | | | | 20,715 | |
Deutsche Bank Securities Inc. | | USD/JPY | | | Pay | | | | 10.10 | | | | May-2017 | | | | USD | | | | 13,500 | | | | 4,109 | |
Deutsche Bank Securities Inc. | | USD/JPY | | | Pay | | | | 11.15 | | | | June-2017 | | | | USD | | | | 12,600 | | | | 16,281 | |
Deutsche Bank Securities Inc. | | USD/JPY | | | Pay | | | | 10.10 | | | | June-2017 | | | | USD | | | | 14,580 | | | | 3,408 | |
Deutsche Bank Securities Inc. | | USD/JPY | | | Pay | | | | 10.075 | | | | July-2017 | | | | USD | | | | 11,880 | | | | 2,417 | |
Deutsche Bank Securities Inc. | | USD/JPY | | | Pay | | | | 9.75 | | | | July-2017 | | | | USD | | | | 15,000 | | | | (2,209 | ) |
Deutsche Bank Securities Inc. | | USD/JPY | | | Pay | | | | 10.40 | | | | July-2017 | | | | USD | | | | 5,500 | | | | 2,325 | |
Goldman Sachs International | | USD/JPY | | | Pay | | | | 9.05 | | | | June-2016 | | | | USD | | | | 36,000 | | | | 5,217 | |
Goldman Sachs International | | USD/JPY | | | Pay | | | | 11.3248 | | | | January-2017 | | | | USD | | | | 13,500 | | | | 26,717 | |
Goldman Sachs International | | USD/JPY | | | Pay | | | | 11.9357 | | | | March-2017 | | | | USD | | | | 6,300 | | | | 15,155 | |
Goldman Sachs International | | USD/JPY | | | Pay | | | | 10.1086 | | | | April-2017 | | | | USD | | | | 14,850 | | | | 6,971 | |
Goldman Sachs International | | USD/JPY | | | Pay | | | | 10.1549 | | | | April-2017 | | | | USD | | | | 8,460 | | | | 3,975 | |
Goldman Sachs International | | USD/JPY | | | Pay | | | | 10.34 | | | | June-2017 | | | | USD | | | | 15,000 | | | | 7,504 | |
Royal Bank of Scotland Securities Inc. | | USD/JPY | | | Pay | | | | 8.90 | | | | June-2016 | | | | USD | | | | 4,000 | | | | 9 | |
Royal Bank of Scotland Securities Inc. | | USD/JPY | | | Pay | | | | 9.20 | | | | September-2016 | | | | USD | | | | 2,585 | | | | (410 | ) |
Royal Bank of Scotland Securities Inc. | | USD/JPY | | | Pay | | | | 9.75 | | | | June-2017 | | | | USD | | | | 9,000 | | | | (1,029 | ) |
Citigroup Global Markets Inc. | | AUD/JPY | | | Receive | | | | 10.675 | | | | October-2016 | | | | AUD | | | | 2,984 | | | | 6,094 | |
Deutsche Bank Securities Inc. | | AUD/JPY | | | Receive | | | | 10.90 | | | | June-2016 | | | | AUD | | | | 2,794 | | | | 2,860 | |
Deutsche Bank Securities Inc. | | AUD/JPY | | | Receive | | | | 10.70 | | | | June-2016 | | | | AUD | | | | 4,000 | | | | 4,935 | |
Deutsche Bank Securities Inc. | | AUD/JPY | | | Receive | | | | 10.70 | | | | June-2016 | | | | AUD | | | | 4,107 | | | | 5,067 | |
Deutsche Bank Securities Inc. | | AUD/JPY | | | Receive | | | | 10.25 | | | | July-2016 | | | | AUD | | | | 4,763 | | | | 8,628 | |
Deutsche Bank Securities Inc. | | AUD/JPY | | | Receive | | | | 10.70 | | | | September-2016 | | | | AUD | | | | 13,339 | | | | 24,011 | |
Deutsche Bank Securities Inc. | | AUD/JPY | | | Receive | | | | 11.40 | | | | November-2016 | | | | AUD | | | | 14,700 | | | | 23,789 | |
Deutsche Bank Securities Inc. | | AUD/JPY | | | Receive | | | | 12.70 | | | | December-2016 | | | | AUD | | | | 13,968 | | | | 11,353 | |
Deutsche Bank Securities Inc. | | AUD/JPY | | | Receive | | | | 11.90 | | | | January-2017 | | | | AUD | | | | 3,735 | | | | 5,855 | |
See accompanying Notes to Consolidated Financial Statements which are an integral part of the financial statements.
25 Invesco Global Targeted Returns Fund
| | | | | | | | | | | | | | | | | | | | | | | | | | |
| Open Over-The-Counter Volatility Swap Agreements—(continued) | |
| Counterparty | | Reference Entity | | Pay/Receive
Volatility | | | Volatility
Strike Rate | | | Expiration
Date | | | Notional
Value | | | Unrealized
Appreciation
(Depreciation) | |
Deutsche Bank Securities Inc. | | AUD/JPY | | | Receive | | | | 12.65 | % | | | January-2017 | | | | AUD | | | | 11,360 | | | $ | 11,698 | |
Deutsche Bank Securities Inc. | | AUD/JPY | | | Receive | | | | 13.45 | | | | February-2017 | | | | AUD | | | | 7,827 | | | | 3,377 | |
Deutsche Bank Securities Inc. | | AUD/JPY | | | Receive | | | | 12.10 | | | | February-2017 | | | | AUD | | | | 13,393 | | | | 19,606 | |
Deutsche Bank Securities Inc. | | AUD/JPY | | | Receive | | | | 12.95 | | | | April-2017 | | | | AUD | | | | 19,718 | | | | 19,418 | |
Deutsche Bank Securities Inc. | | AUD/JPY | | | Receive | | | | 12.30 | | | | May-2017 | | | | AUD | | | | 20,863 | | | | 30,683 | |
Deutsche Bank Securities Inc. | | AUD/JPY | | | Receive | | | | 12.50 | | | | June-2017 | | | | AUD | | | | 16,412 | | | | 23,449 | |
Deutsche Bank Securities Inc. | | AUD/JPY | | | Receive | | | | 12.525 | | | | June-2017 | | | | AUD | | | | 18,942 | | | | 28,331 | |
Deutsche Bank Securities Inc. | | AUD/JPY | | | Receive | | | | 13.70 | | | | July-2017 | | | | AUD | | | | 15,933 | | | | 10,731 | |
Deutsche Bank Securities Inc. | | AUD/JPY | | | Receive | | | | 12.75 | | | | July-2017 | | | | AUD | | | | 20,000 | | | | 27,048 | |
Deutsche Bank Securities Inc. | | AUD/JPY | | | Receive | | | | 13.50 | | | | July-2017 | | | | AUD | | | | 18,000 | | | | 15,784 | |
Goldman Sachs International | | AUD/JPY | | | Receive | | | | 11.00 | | | | June-2016 | | | | AUD | | | | 36,000 | | | | 36,811 | |
Goldman Sachs International | | AUD/JPY | | | Receive | | | | 12.0758 | | | | January-2017 | | | | AUD | | | | 16,580 | | | | 23,739 | |
Goldman Sachs International | | AUD/JPY | | | Receive | | | | 13.3976 | | | | March-2017 | | | | AUD | | | | 12,612 | | | | 7,813 | |
Goldman Sachs International | | AUD/JPY | | | Receive | | | | 12.6407 | | | | April-2017 | | | | AUD | | | | 19,468 | | | | 24,214 | |
Goldman Sachs International | | AUD/JPY | | | Receive | | | | 12.512 | | | | April-2017 | | | | AUD | | | | 10,933 | | | | 14,372 | |
Goldman Sachs International | | AUD/JPY | | | Receive | | | | 12.73 | | | | June-2017 | | | | AUD | | | | 20,000 | | | | 26,655 | |
Royal Bank of Scotland Securities Inc. | | AUD/JPY | | | Receive | | | | 10.90 | | | | August-2016 | | | | AUD | | | | 3,881 | | | | 6,096 | |
Royal Bank of Scotland Securities Inc. | | AUD/JPY | | | Receive | | | | 10.80 | | | | September-2016 | | | | AUD | | | | 2,767 | | | | 4,764 | |
Royal Bank of Scotland Securities Inc. | | AUD/JPY | | | Receive | | | | 12.55 | | | | June-2017 | | | | AUD | | | | 11,719 | | | | 17,536 | |
Barclays Bank PLC | | USD/JPY | | | Receive | | | | 10.30 | | | | April-2017 | | | | USD | | | | 13,000 | | | | (8,769 | ) |
Deutsche Bank Securities Inc. | | USD/JPY | | | Receive | | | | 10.85 | | | | March-2017 | | | | USD | | | | 17,075 | | | | (22,023 | ) |
Deutsche Bank Securities Inc. | | USD/JPY | | | Receive | | | | 10.90 | | | | March-2017 | | | | USD | | | | 7,000 | | | | (9,519 | ) |
Deutsche Bank Securities Inc. | | USD/JPY | | | Receive | | | | 11.00 | | | | March-2017 | | | | USD | | | | 12,000 | | | | (17,317 | ) |
Goldman Sachs International | | USD/JPY | | | Receive | | | | 11.00 | | | | March-2017 | | | | USD | | | | 7,600 | | | | (10,967 | ) |
Goldman Sachs International | | USD/JPY | | | Receive | | | | 11.20 | | | | March-2017 | | | | USD | | | | 20,925 | | | | (34,264 | ) |
Goldman Sachs International | | USD/JPY | | | Receive | | | | 11.5102 | | | | March-2017 | | | | USD | | | | 21,000 | | | | (41,289 | ) |
Subtotal — Currency Risk | | | | | | | | | | | | | | | | | | | $ | 589,435 | |
Total — Volatility Swap Agreements | | | | | | | | | | | | | | | | | | | $ | 829,437 | |
Currency Abbreviations:
| | |
| AUD | | – Australian Dollar |
| HKD | | – Hong Kong Dollar |
| | |
| JPY | | – Japanese Yen |
| USD | | – United States Dollar |
| | | | | | | | | | | | | | | | | | | | | | | | | | |
| Open Forward Foreign Currency Contracts | |
Settlement Date | | Counterparty | | Contract to | | | Notional
Value | | | Unrealized
Appreciation
(Depreciation) | |
| | | Deliver | | | Receive | | | |
11/16/2015 | | State Street Bank & Trust Co. | | | AUD | | | | 2,410,646 | | | | USD | | | | 1,753,500 | | | $ | 1,717,594 | | | $ | 35,906 | |
11/16/2015 | | State Street Bank & Trust Co. | | | EUR | | | | 6,002,069 | | | | USD | | | | 6,813,030 | | | | 6,602,040 | | | | 210,990 | |
11/16/2015 | | State Street Bank & Trust Co. | | | GBP | | | | 1,152,259 | | | | USD | | | | 1,756,528 | | | | 1,776,341 | | | | (19,813 | ) |
11/16/2015 | | State Street Bank & Trust Co. | | | HKD | | | | 11,373,000 | | | | USD | | | | 1,467,548 | | | | 1,467,445 | | | | 103 | |
11/16/2015 | | State Street Bank & Trust Co. | | | JPY | | | | 288,779,000 | | | | USD | | | | 2,413,544 | | | | 2,393,539 | | | | 20,005 | |
11/16/2015 | | State Street Bank & Trust Co. | | | KRW | | | | 54,565,000 | | | | USD | | | | 48,441 | | | | 47,787 | | | | 654 | |
11/16/2015 | | State Street Bank & Trust Co. | | | USD | | | | 203,688 | | | | AUD | | | | 281,000 | | | | 200,214 | | | | (3,474 | ) |
11/16/2015 | | State Street Bank & Trust Co. | | | USD | | | | 378,135 | | | | EUR | | | | 336,000 | | | | 369,586 | | | | (8,549 | ) |
11/16/2015 | | State Street Bank & Trust Co. | | | USD | | | | 377,557 | | | | GBP | | | | 245,000 | | | | 377,696 | | | | 139 | |
11/16/2015 | | State Street Bank & Trust Co. | | | USD | | | | 328,794 | | | | HKD | | | | 2,548,000 | | | | 328,766 | | | | (28 | ) |
11/16/2015 | | State Street Bank & Trust Co. | | | USD | | | | 359,900 | | | | KRW | | | | 412,135,000 | | | | 360,939 | | | | 1,039 | |
01/08/2016 | | Deutsche Bank Securities Inc. | | | CNY | | | | 1,136,606 | | | | USD | | | | 176,876 | | | | 178,335 | | | | (1,459 | ) |
01/08/2016 | | Deutsche Bank Securities Inc. | | | THB | | | | 30,370,380 | | | | USD | | | | 823,939 | | | | 847,508 | | | | (23,569 | ) |
01/08/2016 | | Deutsche Bank Securities Inc. | | | USD | | | | 814,506 | | | | INR | | | | 53,724,802 | | | | 812,534 | | | | (1,972 | ) |
01/08/2016 | | Goldman Sachs International | | | CNY | | | | 4,381,171 | | | | USD | | | | 685,093 | | | | 687,411 | | | | (2,318 | ) |
See accompanying Notes to Consolidated Financial Statements which are an integral part of the financial statements.
26 Invesco Global Targeted Returns Fund
| | | | | | | | | | | | | | | | | | | | | | | | | | |
| Open Forward Foreign Currency Contracts—(continued) | |
Settlement Date | | Counterparty | | Contract to | | | Notional
Value | | | Unrealized
Appreciation
(Depreciation) | |
| | | Deliver | | | Receive | | | |
01/08/2016 | | State Street Bank & Trust Co. | | | AUD | | | | 2,504,952 | | | | USD | | | | 1,758,569 | | | $ | 1,780,052 | | | $ | (21,483 | ) |
01/08/2016 | | State Street Bank & Trust Co. | | | CAD | | | | 1,209,894 | | | | USD | | | | 913,717 | | | | 924,829 | | | | (11,112 | ) |
01/08/2016 | | State Street Bank & Trust Co. | | | CHF | | | | 2,803,247 | | | | USD | | | | 2,886,369 | | | | 2,843,717 | | | | 42,652 | |
01/08/2016 | | State Street Bank & Trust Co. | | | CNY | | | | 66,250,667 | | | | USD | | | | 10,280,187 | | | | 10,394,814 | | | | (114,627 | ) |
01/08/2016 | | State Street Bank & Trust Co. | | | EUR | | | | 8,091,525 | | | | USD | | | | 9,060,969 | | | | 8,910,638 | | | | 150,331 | |
01/08/2016 | | State Street Bank & Trust Co. | | | GBP | | | | 5,249,830 | | | | USD | | | | 7,949,833 | | | | 8,091,899 | | | | (142,066 | ) |
01/08/2016 | | State Street Bank & Trust Co. | | | IDR | | | | 10,716,438,096 | | | | USD | | | | 698,549 | | | | 761,084 | | | | (62,535 | ) |
01/08/2016 | | State Street Bank & Trust Co. | | | JPY | | | | 109,427,518 | | | | USD | | | | 916,382 | | | | 908,181 | | | | 8,201 | |
01/08/2016 | | State Street Bank & Trust Co. | | | KRW | | | | 367,755,242 | | | | USD | | | | 310,507 | | | | 321,351 | | | | (10,844 | ) |
01/08/2016 | | State Street Bank & Trust Co. | | | MYR | | | | 1,836,854 | | | | USD | | | | 414,986 | | | | 426,370 | | | | (11,384 | ) |
01/08/2016 | | State Street Bank & Trust Co. | | | PHP | | | | 48,712,030 | | | | USD | | | | 1,041,322 | | | | 1,037,088 | | | | 4,234 | |
01/08/2016 | | State Street Bank & Trust Co. | | | SEK | | | | 10,938,844 | | | | USD | | | | 1,311,874 | | | | 1,282,932 | | | | 28,942 | |
01/08/2016 | | State Street Bank & Trust Co. | | | SGD | | | | 743,524 | | | | USD | | | | 518,473 | | | | 529,530 | | | | (11,057 | ) |
01/08/2016 | | State Street Bank & Trust Co. | | | TWD | | | | 10,283,141 | | | | USD | | | | 311,393 | | | | 315,492 | | | | (4,099 | ) |
01/08/2016 | | State Street Bank & Trust Co. | | | USD | | | | 10,129,093 | | | | INR | | | | 666,393,066 | | | | 10,078,527 | | | | (50,566 | ) |
Total Forward Foreign Currency Contracts — Currency Risk | | | | | | | | | | | | | | | | | | | $ | 2,241 | |
Currency Abbreviations:
| | |
| AUD | | – Australian Dollar |
| CAD | | – Canadian Dollar |
| CHF | | – Swiss Franc |
| CNY | | – Chinese Yuan |
| EUR | | – Euro |
| GBP | | – British Pound Sterling |
| HKD | | – Hong Kong Dollar |
| IDR | | – Indonesian Rupiah |
| INR | | – Indian Rupee |
| JPY | | – Japanese Yen |
| KRW | | – South Korean Won |
| MYR | | – Malaysian Ringgit |
| PHP | | – Philippine Peso |
| SEK | | – Swedish Krona |
| SGD | | – Singapore Dollar |
| THB | | – Thai Baht |
| TWD | | – New Taiwan Dollar |
| USD | | – United States Dollar |
See accompanying Notes to Consolidated Financial Statements which are an integral part of the financial statements.
27 Invesco Global Targeted Returns Fund
Consolidated Statement of Assets and Liabilities
October 31, 2015
| | | | |
Assets: | | | | |
Investments, at value (Cost $16,509,228) | | $ | 15,449,444 | |
Investments in affiliated funds, at value (Cost $118,569,903) | | | 116,925,847 | |
Total investments, at value (Cost $135,079,131) | | | 132,375,291 | |
Foreign currencies, at value (Cost $2,772,521) | | | 2,649,737 | |
Receivable for: | | | | |
Deposits with brokers | | | 12,340,843 | |
Variation margin — centrally cleared swap agreements | | | 384,413 | |
Variation margin — futures | | | 4,446 | |
Fund shares sold | | | 334,922 | |
Dividends and interest | | | 228,770 | |
Fund expenses absorbed | | | 50,654 | |
Swaps receivables | | | 10 | |
Investment for trustee deferred compensation and retirement plans | | | 4,349 | |
Unrealized appreciation on forward foreign currency contracts outstanding | | | 503,196 | |
Unrealized appreciation on swap agreements — OTC | | | 2,931,101 | |
Other assets | | | 23,390 | |
Total assets | | | 151,831,122 | |
| |
Liabilities: | | | | |
Payable for: | | | | |
Investments purchased — affiliated funds | | | 83,439 | |
Fund shares reacquired | | | 151,432 | |
Options written, at value (premiums received $8,462,867) | | | 8,064,771 | |
Forward foreign currency contracts closed | | | 3,159 | |
Swaps payable | | | 12 | |
Accrued fees to affiliates | | | 28,212 | |
Accrued trustees’ and officers’ fees and benefits | | | 1,646 | |
Collateral due to broker | | | 260,000 | |
Amount due custodian | | | 161,930 | |
Accrued other operating expenses | | | 103,172 | |
Trustee deferred compensation and retirement plans | | | 4,349 | |
Unrealized depreciation on forward foreign currency contracts outstanding | | | 500,955 | |
Unrealized depreciation on swap agreements — OTC | | | 1,417,404 | |
Total liabilities | | | 10,780,481 | |
Net assets applicable to shares outstanding | | $ | 141,050,641 | |
|
Net assets consist of: | |
Shares of beneficial interest | | $ | 140,905,166 | |
Undistributed net investment income | | | (75,216 | ) |
Undistributed net realized gain | | | 1,817,533 | |
Net unrealized appreciation (depreciation) | | | (1,596,842 | ) |
| | | $ | 141,050,641 | |
| | | | |
Net Assets: | |
Class A | | $ | 23,688,196 | |
Class C | | $ | 11,524,292 | |
Class R | | $ | 10,296 | |
Class Y | | $ | 97,702,962 | |
Class R5 | | $ | 62,164 | |
Class R6 | | $ | 8,062,731 | |
|
Shares outstanding, $0.01 par value per share,
with an unlimited number of shares authorized: | |
Class A | | | 2,292,921 | |
Class C | | | 1,130,389 | |
Class R | | | 1,001 | |
Class Y | | | 9,417,235 | |
Class R5 | | | 5,989 | |
Class R6 | | | 777,313 | |
Class A: | | | | |
Net asset value per share | | $ | 10.33 | |
Maximum offering price per share | | | | |
(Net asset value of $10.33 ¸ 94.50%) | | $ | 10.93 | |
Class C: | | | | |
Net asset value and offering price per share | | $ | 10.19 | |
Class R: | | | | |
Net asset value and offering price per share | | $ | 10.29 | |
Class Y: | | | | |
Net asset value and offering price per share | | $ | 10.37 | |
Class R5: | | | | |
Net asset value and offering price per share | | $ | 10.38 | |
Class R6: | | | | |
Net asset value and offering price per share | | $ | 10.37 | |
See accompanying Notes to Consolidated Financial Statements which are an integral part of the financial statements.
28 Invesco Global Targeted Returns Fund
Consolidated Statement of Operations
For the year ended October 31, 2015
| | | | |
Investment income: | |
Dividends from affiliated funds | | $ | 977,371 | |
Interest | | | 184,399 | |
Total investment income | | | 1,161,770 | |
| |
Expenses: | | | | |
Advisory fees | | | 1,265,450 | |
Administrative services fees | | | 50,000 | |
Custodian fees | | | 37,232 | |
Distribution fees: | | | | |
Class A | | | 57,827 | |
Class C | | | 50,350 | |
Class R | | | 52 | |
Transfer agent fees — A, C, R and Y | | | 48,372 | |
Transfer agent fees — R5 | | | 47 | |
Transfer agent fees — R6 | | | 49 | |
Trustees’ and officers’ fees and benefits | | | 19,690 | |
Professional services fees | | | 98,009 | |
Other | | | 271,552 | |
Total expenses | | | 1,898,630 | |
Less: Fees waived and expenses reimbursed | | | (878,202 | ) |
Net expenses | | | 1,020,428 | |
Net investment income | | | 141,342 | |
| |
Realized and unrealized gain (loss) from: | | | | |
Net realized gain (loss) from: | | | | |
Investment securities | | | (2,859,769 | ) |
Sales of affiliated funds | | | 217,613 | |
Distributions of affiliated funds | | | 523,144 | |
Foreign currencies | | | (394,679 | ) |
Forward foreign currency contracts | | | 1,635,001 | |
Futures contracts | | | 315,879 | |
Option contracts written | | | 770,135 | |
Swap agreements | | | 1,629,866 | |
| | | | 1,837,190 | |
Change in net unrealized appreciation (depreciation) of: | | | | |
Investment securities | | | (815,142 | ) |
Investment securities — affiliated funds | | | (2,265,762 | ) |
Foreign currencies | | | (25,813 | ) |
Forward foreign currency contracts | | | (469,528 | ) |
Futures contracts | | | (702,788 | ) |
Option contracts written | | | 596,405 | |
Swap agreements | | | 943,715 | |
| | | | (2,738,913 | ) |
Net realized and unrealized gain (loss) | | | (901,723 | ) |
Net increase (decrease) in net assets resulting from operations | | $ | (760,381 | ) |
See accompanying Notes to Consolidated Financial Statements which are an integral part of the financial statements.
29 Invesco Global Targeted Returns Fund
Consolidated Statement of Changes in Net Assets
For the year ended October 31, 2015 and the period December 19, 2013 (commencement date) through October 31, 2014
| | | | | | | | |
| | | October 31,
2015 | | | December 19, 2013
(commencement date) through
October 31,
2014 | |
Operations: | | | | | |
Net investment income (loss) | | $ | 141,342 | | | $ | (9,276 | ) |
Net realized gain | | | 1,837,190 | | | | 50,163 | |
Change in net unrealized appreciation (depreciation) | | | (2,738,913 | ) | | | 1,142,071 | |
Net increase (decrease) in net assets resulting from operations | | | (760,381 | ) | | | 1,182,958 | |
| | |
Distributions to shareholders from net investment income: | | | | | | | | |
Class A | | | (77,701 | ) | | | — | |
Class C | | | (3,526 | ) | | | — | |
Class R | | | (54 | ) | | | — | |
Class Y | | | (99,329 | ) | | | — | |
Class R5 | | | (15,936 | ) | | | — | |
Class R6 | | | (54,412 | ) | | | — | |
Total distributions from net investment income | | | (250,958 | ) | | | — | |
| | |
Distributions to shareholders from net realized gains: | | | | | | | | |
Class A | | | (141,226 | ) | | | — | |
Class C | | | (7,470 | ) | | | — | |
Class R | | | (104 | ) | | | — | |
Class Y | | | (168,145 | ) | | | — | |
Class R5 | | | (26,976 | ) | | | — | |
Class R6 | | | (92,109 | ) | | | — | |
Total distributions from net realized gains | | | (436,030 | ) | | | — | |
| | |
Share transactions–net: | | | | | | | | |
Class A | | | 10,666,445 | | | | 13,012,317 | |
Class C | | | 11,241,310 | | | | 443,040 | |
Class R | | | — | | | | 10,014 | |
Class Y | | | 82,057,343 | | | | 15,803,099 | |
Class R5 | | | (2,648,324 | ) | | | 2,627,776 | |
Class R6 | | | (1,151,548 | ) | | | 9,253,580 | |
Net increase in net assets resulting from share transactions | | | 100,165,226 | | | | 41,149,826 | |
Net increase in net assets | | | 98,717,857 | | | | 42,332,784 | |
| | |
Net assets: | | | | | | | | |
Beginning of period | | | 42,332,784 | | | | — | |
End of period (includes undistributed net investment income (loss) of $(75,216) and $(1,560), respectively) | | $ | 141,050,641 | | | $ | 42,332,784 | |
Notes to Consolidated Financial Statements
October 31, 2015
NOTE 1—Significant Accounting Policies
Invesco Global Targeted Returns Fund (the “Fund”) is a series portfolio of AIM Investment Funds (Invesco Investment Funds) (the “Trust”). The Trust is organized as a Delaware statutory trust and is registered under the Investment Company Act of 1940, as amended (the “1940 Act”), as an open-end series management investment company consisting of twenty-four separate series portfolios, each authorized to issue an unlimited number of shares of beneficial interest. The assets, liabilities and operations of each portfolio are accounted for separately. Information presented in these financial statements pertains only to the Fund. Matters affecting each portfolio or class will be voted on exclusively by the shareholders of such portfolio or class.
The Fund will seek to gain exposure to the commodity markets primarily through investments in the Invesco Cayman Commodity Fund VII Ltd. (the “Subsidiary”), a wholly-owned subsidiary of the Fund organized under the laws of the Cayman Islands. The Subsidiary was organized by the Fund to invest in commodity-linked derivatives. The Fund may invest up to 25% of its total assets in the Subsidiary.
30 Invesco Global Targeted Returns Fund
The Fund’s investment objective is to seek a positive total return over the long term in all market environments.
The Fund currently consists of six different classes of shares: Class A, Class C, Class R, Class Y, Class R5 and Class R6. Class A shares are sold with a front-end sales charge unless certain waiver criteria are met and under certain circumstances load waived shares may be subject to contingent deferred sales charges (“CDSC”). Class C shares are sold with a CDSC. Class R, Class Y, Class R5 and Class R6 shares are sold at net asset value.
The following is a summary of the significant accounting policies followed by the Fund in the preparation of its financial statements.
| A. | Security Valuations — Securities, including restricted securities, are valued according to the following policy. |
A security listed or traded on an exchange (except convertible securities) is valued at its last sales price or official closing price as of the close of the customary trading session on the exchange where the security is principally traded, or lacking any sales or official closing price on a particular day, the security may be valued at the closing bid price on that day. Securities traded in the over-the-counter market are valued based on prices furnished by independent pricing services or market makers. When such securities are valued by an independent pricing service they may be considered fair valued. Futures contracts are valued at the final settlement price set by an exchange on which they are principally traded. Listed options are valued at the mean between the last bid and asked prices from the exchange on which they are principally traded. Options not listed on an exchange are valued by an independent source at the mean between the last bid and asked prices. For purposes of determining net asset value (“NAV”) per share, futures and option contracts generally are valued 15 minutes after the close of the customary trading session of the New York Stock Exchange (“NYSE”).
Investments in open-end and closed-end registered investment companies that do not trade on an exchange are valued at the end-of-day net asset value per share. Investments in open-end and closed-end registered investment companies that trade on an exchange are valued at the last sales price or official closing price as of the close of the customary trading session on the exchange where the security is principally traded.
Swap agreements are fair valued using an evaluated quote, if available, provided by an independent pricing service. Evaluated quotes provided by the pricing service are valued based on a model which may include end-of-day net present values, spreads, ratings, industry, company performance and returns of referenced assets.
Debt obligations (including convertible securities) and unlisted equities are fair valued using an evaluated quote provided by an independent pricing service. Evaluated quotes provided by the pricing service may be determined without exclusive reliance on quoted prices, and may reflect appropriate factors such as institution-size trading in similar groups of securities, developments related to specific securities, dividend rate (for unlisted equities), yield (for debt obligations), quality, type of issue, coupon rate (for debt obligations), maturity (for debt obligations), individual trading characteristics and other market data. Debt obligations are subject to interest rate and credit risks. In addition, all debt obligations involve some risk of default with respect to interest and/or principal payments.
Foreign securities’ (including foreign exchange contracts) prices are converted into U.S. dollar amounts using the applicable exchange rates as of the close of the NYSE. If market quotations are available and reliable for foreign exchange-traded equity securities, the securities will be valued at the market quotations. Because trading hours for certain foreign securities end before the close of the NYSE, closing market quotations may become unreliable. If between the time trading ends on a particular security and the close of the customary trading session on the NYSE, events occur that the Adviser determines are significant and make the closing price unreliable, the Fund may fair value the security. If the event is likely to have affected the closing price of the security, the security will be valued at fair value in good faith using procedures approved by the Board of Trustees. Adjustments to closing prices to reflect fair value may also be based on a screening process of an independent pricing service to indicate the degree of certainty, based on historical data, that the closing price in the principal market where a foreign security trades is not the current value as of the close of the NYSE. Foreign securities’ prices meeting the approved degree of certainty that the price is not reflective of current value will be priced at the indication of fair value from the independent pricing service. Multiple factors may be considered by the independent pricing service in determining adjustments to reflect fair value and may include information relating to sector indices, American Depositary Receipts and domestic and foreign index futures. Foreign securities may have additional risks including exchange rate changes, potential for sharply devalued currencies and high inflation, political and economic upheaval, the relative lack of issuer information, relatively low market liquidity and the potential lack of strict financial and accounting controls and standards.
Securities for which market prices are not provided by any of the above methods may be valued based upon quotes furnished by independent sources. The last bid price may be used to value equity securities. The mean between the last bid and asked prices is used to value debt obligations, including corporate loans.
Securities for which market quotations are not readily available or became unreliable are valued at fair value as determined in good faith by or under the supervision of the Trust’s officers following procedures approved by the Board of Trustees. Issuer specific events, market trends, bid/asked quotes of brokers and information providers and other market data may be reviewed in the course of making a good faith determination of a security’s fair value.
The Fund may invest in securities that are subject to interest rate risk, meaning the risk that the prices will generally fall as interest rates rise and, conversely, the prices will generally rise as interest rates fall. Specific securities differ in their sensitivity to changes in interest rates depending on their individual characteristics. Changes in interest rates may result in increased market volatility, which may affect the value and/or liquidity of certain Fund investments.
Valuations change in response to many factors including the historical and prospective earnings of the issuer, the value of the issuer’s assets, general economic conditions, interest rates, investor perceptions and market liquidity. Because of the inherent uncertainties of valuation, the values reflected in the financial statements may materially differ from the value received upon actual sale of those investments.
| B. | Securities Transactions and Investment Income — Securities transactions are accounted for on a trade date basis. Realized gains or losses on sales are computed on the basis of specific identification of the securities sold. Interest income (net of withholding tax, if any) is recorded on the accrual basis from settlement date. Dividend income (net of withholding tax, if any) is recorded on the ex-dividend date. Bond premiums and discounts are amortized and/or accreted for financial reporting purposes. |
The Fund may periodically participate in litigation related to Fund investments. As such, the Fund may receive proceeds from litigation settlements. Any proceeds received are included in the Consolidated Statement of Operations as realized gain (loss) for investments no longer held and as unrealized gain (loss) for investments still held.
Brokerage commissions and mark ups are considered transaction costs and are recorded as an increase to the cost basis of securities purchased and/or a reduction of proceeds on a sale of securities. Such transaction costs are included in the determination of net realized and
31 Invesco Global Targeted Returns Fund
unrealized gain (loss) from investment securities reported in the Consolidated Statement of Operations and the Consolidated Statement of Changes in Net Assets and the net realized and unrealized gains (losses) on securities per share in the Consolidated Financial Highlights. Transaction costs are included in the calculation of the Fund’s net asset value and, accordingly, they reduce the Fund’s total returns. These transaction costs are not considered operating expenses and are not reflected in net investment income reported in the Consolidated Statement of Operations and the Consolidated Statement of Changes in Net Assets, or the net investment income per share and the ratios of expenses and net investment income reported in the Consolidated Financial Highlights, nor are they limited by any expense limitation arrangements between the Fund and the investment adviser.
The Fund allocates income and realized and unrealized capital gains and losses to a class based on the relative net assets of each class.
| C. | Country Determination — For the purposes of making investment selection decisions and presentation in the Consolidated Schedule of Investments, the investment adviser may determine the country in which an issuer is located and/or credit risk exposure based on various factors. These factors include the laws of the country under which the issuer is organized, where the issuer maintains a principal office, the country in which the issuer derives 50% or more of its total revenues and the country that has the primary market for the issuer’s securities, as well as other criteria. Among the other criteria that may be evaluated for making this determination are the country in which the issuer maintains 50% or more of its assets, the type of security, financial guarantees and enhancements, the nature of the collateral and the sponsor organization. Country of issuer and/or credit risk exposure has been determined to be the United States of America, unless otherwise noted. |
| D. | Distributions — Distributions from net investment income and net realized capital gain, if any, are generally declared and paid annually and recorded on the ex-dividend date. The Fund may elect to treat a portion of the proceeds from redemptions as distributions for federal income tax purposes. |
| E. | Federal Income Taxes — The Fund intends to comply with the requirements of Subchapter M of the Internal Revenue Code of 1986, as amended (the “Internal Revenue Code”), necessary to qualify as a regulated investment company and to distribute substantially all of the Fund’s taxable earnings to shareholders. As such, the Fund will not be subject to federal income taxes on otherwise taxable income (including net realized capital gain) that is distributed to shareholders. Therefore, no provision for federal income taxes is recorded in the consolidated financial statements. |
The Fund recognizes the tax benefits of uncertain tax positions only when the position is more likely than not to be sustained. Management has analyzed the Fund’s uncertain tax positions and concluded that no liability for unrecognized tax benefits should be recorded related to uncertain tax positions. Management is not aware of any tax positions for which it is reasonably possible that the total amounts of unrecognized tax benefits will change materially in the next 12 months.
The Subsidiary is classified as a controlled foreign corporation under Subchapter N of the Internal Revenue Code. Therefore, the Fund is required to increase its taxable income by its share of the Subsidiary’s income. Net investment losses of the Subsidiary cannot be deducted by the Fund in the current period nor carried forward to offset taxable income in future periods.
The Fund files tax returns in the U.S. Federal jurisdiction and certain other jurisdictions. Generally the Fund is subject to examinations by such taxing authorities for up to three years after the filing of the return for the tax period.
| F. | Expenses — Fees provided for under the Rule 12b-1 plan of a particular class of the Fund are charged to the operations of such class. Transfer agency fees and expenses and other shareholder recordkeeping fees and expenses attributable to Class R5 and Class R6 are allocated to each share class based on relative net assets. Sub-accounting fees attributable to Class R5 are charged to the operations of the class. Transfer agency fees and expenses and other shareholder recordkeeping fees and expenses relating to all other classes are allocated among those classes based on relative net assets. All other expenses are allocated among the classes based on relative net assets. |
| G. | Accounting Estimates — The financial statements are prepared on a consolidated basis in conformity with accounting principles generally accepted in the United States of America (“GAAP”), which requires management to make estimates and assumptions that affect the reported amounts of assets and liabilities at the date of the financial statements and the reported amounts of revenues and expenses during the reporting period including estimates and assumptions related to taxation. Actual results could differ from those estimates by a significant amount. The accompanying financial statements reflect the financial position of the Fund and its Subsidiary and the results of operations on a consolidated basis. All inter-company accounts and transactions have been eliminated in consolidation. |
In addition, the Fund monitors for material events or transactions that may occur or become known after the period-end date and before the date the consolidated financial statements are released to print.
| H. | Indemnifications — Under the Trust’s organizational documents, each Trustee, officer, employee or other agent of the Trust, and under the Subsidiary’s organizational documents, the directors and officers of the Subsidiary, are indemnified against certain liabilities that may arise out of the performance of their duties to the Fund and/or the Subsidiary, respectively. Additionally, in the normal course of business, the Fund enters into contracts, including the Fund’s servicing agreements, that contain a variety of indemnification clauses. The Fund’s maximum exposure under these arrangements is unknown as this would involve future claims that may be made against the Fund that have not yet occurred. The risk of material loss as a result of such indemnification claims is considered remote. |
| I. | Foreign Currency Translations — Foreign currency is valued at the close of the NYSE based on quotations posted by banks and major currency dealers. Portfolio securities and other assets and liabilities denominated in foreign currencies are translated into U.S. dollar amounts at date of valuation. Purchases and sales of portfolio securities (net of foreign taxes withheld on disposition) and income items denominated in foreign currencies are translated into U.S. dollar amounts on the respective dates of such transactions. The Fund does not separately account for the portion of the results of operations resulting from changes in foreign exchange rates on investments and the fluctuations arising from changes in market prices of securities held. The combined results of changes in foreign exchange rates and the fluctuation of market prices on investments (net of estimated foreign tax withholding) are included with the net realized and unrealized gain or loss from investments in the Consolidated Statement of Operations. Reported net realized foreign currency gains or losses arise from (1) sales of foreign currencies, (2) currency gains or losses realized between the trade and settlement dates on securities transactions, and (3) the difference between the amounts of dividends, interest, and foreign withholding taxes recorded on the Fund’s books and the U.S. dollar equivalent of the amounts actually received or paid. Net unrealized foreign currency gains and losses arise from changes in the fair values of assets and liabilities, other than investments in securities at fiscal period end, resulting from changes in exchange rates. |
32 Invesco Global Targeted Returns Fund
The Fund may invest in foreign securities, which may be subject to foreign taxes on income, gains on investments or currency repatriation, a portion of which may be recoverable. Foreign taxes, if any, are recorded based on the tax regulations and rates that exist in the foreign markets in which the Fund invests and are shown in the Consolidated Statement of Operations.
| J. | Forward Foreign Currency Contracts — The Fund may engage in foreign currency transactions either on a spot (i.e. for prompt delivery and settlement) basis, or through forward foreign currency contracts, to manage or minimize currency or exchange rate risk. |
The Fund may also enter into forward foreign currency contracts for the purchase or sale of a security denominated in a foreign currency in order to “lock in” the U.S. dollar price of that security, or the Fund may also enter into forward foreign currency contracts that do not provide for physical settlement of the two currencies, but instead are settled by a single cash payment calculated as the difference between the agreed upon exchange rate and the spot rate at settlement based upon an agreed upon notional amount (non-deliverable forwards). The Fund will set aside liquid assets in an amount equal to daily mark-to-market obligation for forward foreign currency contracts.
A forward foreign currency contract is an obligation between two parties (“Counterparties”) to purchase or sell a specific currency for an agreed-upon price at a future date. The use of forward foreign currency contracts does not eliminate fluctuations in the price of the underlying securities the Fund owns or intends to acquire but establishes a rate of exchange in advance. Fluctuations in the value of these contracts are measured by the difference in the contract date and reporting date exchange rates and are recorded as unrealized appreciation (depreciation) until the contracts are closed. When the contracts are closed, realized gains (losses) are recorded. Realized and unrealized gains (losses) on the contracts are included in the Consolidated Statement of Operations. The primary risks associated with forward foreign currency contracts include failure of the Counterparty to meet the terms of the contract and the value of the foreign currency changing unfavorably. These risks may be in excess of the amounts reflected in the Consolidated Statement of Assets and Liabilities.
| K. | Futures Contracts — The Fund may enter into futures contracts to manage exposure to interest rate, equity and market price movements and/or currency risks. A futures contract is an agreement between Counterparties to purchase or sell a specified underlying security, currency or commodity (or delivery of a cash settlement price, in the case of an index future) for a fixed price at a future date. The Fund currently invests only in exchange-traded futures and they are standardized as to maturity date and underlying financial instrument. Initial margin deposits required upon entering into futures contracts are satisfied by the segregation of specific securities or cash as collateral at the futures commission merchant (broker). During the period the futures contracts are open, changes in the value of the contracts are recognized as unrealized gains or losses by recalculating the value of the contracts on a daily basis. Subsequent or variation margin payments are received or made depending upon whether unrealized gains or losses are incurred. These amounts are reflected as receivables or payables on the Consolidated Statement of Assets and Liabilities. When the contracts are closed or expire, the Fund recognizes a realized gain or loss equal to the difference between the proceeds from, or cost of, the closing transaction and the Fund’s basis in the contract. The net realized gain (loss) and the change in unrealized gain (loss) on futures contracts held during the period is included on the Consolidated Statement of Operations. The primary risks associated with futures contracts are market risk and the absence of a liquid secondary market. If the Fund were unable to liquidate a futures contract and/or enter into an offsetting closing transaction, the Fund would continue to be subject to market risk with respect to the value of the contracts and continue to be required to maintain the margin deposits on the futures contracts. Futures contracts have minimal Counterparty risk since the exchange’s clearinghouse, as Counterparty to all exchange-traded futures, guarantees the futures against default. Risks may exceed amounts recognized in the Consolidated Statement of Assets and Liabilities. |
| L. | Call Options Written and Purchased — The Fund may write covered call options and/or buy call options. A covered call option gives the purchaser of such option the right to buy, and the writer the obligation to sell, the underlying security or foreign currency at the stated exercise price during the option period. Options written by the Fund normally will have expiration dates between three and nine months from the date written. The exercise price of a call option may be below, equal to, or above the current market value of the underlying security at the time the option is written. |
Additionally, the Fund may enter into an option on a swap agreement, also called a “swaption”. A swaption is an option that gives the buyer the right, but not the obligation, to enter into a swap on a future date in exchange for paying a market-based premium. A receiver swaption gives the owner the right to receive the total return of a specified asset, reference rate or index. Swaptions also include options that allow an existing swap to be terminated or extended by one of the Counterparties.
When the Fund writes a covered call option, an amount equal to the premium received by the Fund is recorded as an asset and an equivalent liability in the Consolidated Statement of Assets and Liabilities. The amount of the liability is subsequently “marked-to-market” to reflect the current market value of the option written. If a written covered call option expires on the stipulated expiration date, or if the Fund enters into a closing purchase transaction, the Fund realizes a gain (or a loss if the closing purchase transaction exceeds the premium received when the option was written) without regard to any unrealized gain or loss on the underlying security, and the liability related to such option is extinguished. If a written covered call option is exercised, the Fund realizes a gain or a loss from the sale of the underlying security and the proceeds of the sale are increased by the premium originally received. Realized and unrealized gains and losses on these contracts are included in the Consolidated Statement of Operations. A risk in writing a covered call option is that the Fund gives up the opportunity for profit if the market price of the security increases and the option is exercised.
When the Fund buys a call option, an amount equal to the premium paid by the Fund is recorded as an investment on the Consolidated Statement of Assets and Liabilities. The amount of the investment is subsequently “marked-to-market” to reflect the current value of the option purchased. Realized and unrealized gains and losses on these contracts are included in the Consolidated Statement of Operations. A risk in buying an option is that the Fund pays a premium whether or not the option is exercised. In addition, there can be no assurance that a liquid secondary market will exist for any option purchased.
| M. | Put Options Purchased and Written — The Fund may purchase and write put options including options on securities indexes, or foreign currency and/or futures contracts. By purchasing a put option, the Fund obtains the right (but not the obligation) to sell the option’s underlying instrument at a fixed strike price. In return for this right, the Fund pays an option premium. The option’s underlying instrument may be a security, securities index, or a futures contract. |
Additionally, the Fund may enter into an option on a swap agreement, also called a “swaption”. A swaption is an option that gives the buyer the right, but not the obligation, to enter into a swap on a future date in exchange for paying a market-based premium. A receiver swaption gives the
33 Invesco Global Targeted Returns Fund
owner the right to receive the total return of a specified asset, reference rate or index. Swaptions also include options that allow an existing swap to be terminated or extended by one of the Counterparties.
Put options may be used by the Fund to hedge securities it owns by locking in a minimum price at which the Fund can sell. If security prices fall, the put option could be exercised to offset all or a portion of the Fund’s resulting losses. At the same time, because the maximum the Fund has at risk is the cost of the option, purchasing put options does not eliminate the potential for the Fund to profit from an increase in the value of the underlying portfolio securities. The Fund may write put options to earn additional income in the form of option premiums if it expects the price of the underlying instrument to remain stable or rise during the option period so that the option will not be exercised. The risk in this strategy is that the price of the underlying securities may decline by an amount greater than the premium received. Put options written are reported as a liability in the Consolidated Statement of Assets and Liabilities. Realized and unrealized gains and losses on these contracts are included in the Consolidated Statement of Operations as Net realized gain from Investment securities. A risk in buying an option is that the Fund pays a premium whether or not the option is exercised. In addition, there can be no assurance that a liquid secondary market will exist for any option purchased.
| N. | Swap Agreements — The Fund may enter into various swap transactions, including interest rate, total return, volatility, variance, index, currency and credit default swap contracts (“CDS”) for investment purposes or to manage interest rate, equity, currency or credit risk. Such transactions are agreements between Counterparties. A swap agreement may be negotiated bilaterally and traded over-the-counter (“OTC”) between two parties (“uncleared/OTC”) or, in some instances, must be transacted through a future commission merchant (“FCM”) and cleared through a clearinghouse that serves as a central Counterparty (“centrally cleared swap”). These agreements may contain among other conditions, events of default and termination events, and various covenants and representations such as provisions that require the Fund to maintain a pre-determined level of net assets, and/or provide limits regarding the decline of the Fund’s NAV over specific periods of time. If the Fund were to trigger such provisions and have open derivative positions at that time, the Counterparty may be able to terminate such agreement and request immediate payment in an amount equal to the net liability positions, if any. |
Interest rate, total return, volatility, variance, index and currency swap agreements are two-party contracts entered into primarily to exchange the returns (or differentials in rates of returns) earned or realized on particular predetermined investments or instruments. The gross returns to be exchanged or “swapped” between the parties are calculated with respect to a notional amount, i.e., the return on or increase in value of a particular dollar amount invested at a particular interest rate or return of an underlying asset, in a particular foreign currency, or in a “basket” of securities representing a particular index.
Inflation swap agreements are contracts in which one party agrees to pay the cumulative percentage increase in a price index, such as the Consumer Price Index, over the term of the swap, and the other party pays a compounded fixed rate.
In a centrally cleared swap, the Fund’s ultimate Counterparty is a central clearinghouse. The Fund will initially enter into centrally cleared swaps through an executing broker. When a fund enters into a centrally cleared swap, it must deliver to the central Counterparty (via the FCM) an amount referred to as “initial margin.” Initial margin requirements are determined by the central Counterparty, but an FCM may require additional initial margin above the amount required by the central Counterparty. Initial margin deposits required upon entering into centrally cleared swaps are satisfied by cash or securities as collateral at the FCM. Securities deposited as initial margin are designated on the Consolidated Schedule of Investments and cash deposited is recorded on the Consolidated Statement of Assets and Liabilities. During the term of a cleared swap agreement, a “variation margin” amount may be required to be paid by the Fund or may be received by the Fund, based on the daily change in price of the underlying reference instrument subject to the swap agreement and is recorded as a receivable or payable for variation margin in the Consolidated Statement of Assets and Liabilities until the centrally cleared swap is terminated, at which time a realized gain or loss is recorded.
A CDS is an agreement between Counterparties to exchange the credit risk of an issuer. A buyer of a CDS is said to buy protection by paying a fixed payment over the life of the agreement and in some situations an upfront payment to the seller of the CDS. If a defined credit event occurs (such as payment default or bankruptcy), the Fund as a protection buyer would cease paying its fixed payment, the Fund would deliver eligible bonds issued by the reference entity to the seller, and the seller would pay the full notional value, or the “par value”, of the referenced obligation to the Fund. A seller of a CDS is said to sell protection and thus would receive a fixed payment over the life of the agreement and an upfront payment, if applicable. If a credit event occurs, the Fund as a protection seller would cease to receive the fixed payment stream, the Fund would pay the buyer “par value” or the full notional value of the referenced obligation, and the Fund would receive the eligible bonds issued by the reference entity. In turn, these bonds may be sold in order to realize a recovery value. Alternatively, the seller of the CDS and its Counterparty may agree to net the notional amount and the market value of the bonds and make a cash payment equal to the difference to the buyer of protection. If no credit event occurs, the Fund receives the fixed payment over the life of the agreement. As the seller, the Fund would effectively add leverage to its portfolio because, in addition to its total net assets, the Fund would be subject to investment exposure on the notional amount of the CDS. In connection with these agreements, cash and securities may be identified as collateral in accordance with the terms of the respective swap agreements to provide assets of value and recourse in the event of default under the swap agreement or bankruptcy/insolvency of a party to the swap agreement. If a Counterparty becomes bankrupt or otherwise fails to perform its obligations due to financial difficulties, the Fund may experience significant delays in obtaining any recovery in a bankruptcy or other reorganization proceeding. The Fund may obtain only limited recovery or may obtain no recovery in such circumstances. The Fund’s maximum risk of loss from Counterparty risk, either as the protection seller or as the protection buyer, is the value of the contract. The risk may be mitigated by having a master netting arrangement between the Fund and the Counterparty and by the designation of collateral by the Counterparty to cover the Fund’s exposure to the Counterparty.
Implied credit spreads represent the current level at which protection could be bought or sold given the terms of the existing CDS contract and serve as an indicator of the current status of the payment/performance risk of the CDS. An implied spread that has widened or increased since entry into the initial contract may indicate a deteriorating credit profile and increased risk of default for the reference entity. A declining or narrowing spread may indicate an improving credit profile or decreased risk of default for the reference entity. Alternatively, credit spreads may increase or decrease reflecting the general tolerance for risk in the credit markets.
A volatility swap involves an exchange between the Fund and a Counterparty of periodic payments based on the measured volatility of an underlying security, currency, commodity, interest rate, index or other reference asset over a specified time frame. Depending on the structure of the swap, either the Fund’s or the Counterparty’s payment obligation will typically be based on the realized volatility of the reference asset as measured by changes in its price or level over a specified time period, while the other party’s payment obligation will be based on a specified rate
34 Invesco Global Targeted Returns Fund
representing expected volatility for the reference asset at the time the swap is executed, or the measured volatility of a different reference asset over a specified time period. The Fund will typically make or lose money on a volatility swap depending on the magnitude of the reference asset’s volatility, or size of the movements in its price, over a specified time period, rather than general increases or decreases in the price of the reference asset. Volatility swaps are often used to speculate on future volatility levels, to trade the spread between realized and expected volatility, or to decrease the volatility exposure of other investments held by the Fund. Variance swaps are similar to volatility swaps, except payments are based on the difference between the implied and measured volatility mathematically squared.
An interest rate swap is an agreement between Counterparties pursuant to which the parties exchange a floating rate payment for a fixed rate payment based on a specified notional amount.
Changes in the value of centrally cleared and OTC swap agreements are recognized as unrealized gains (losses) in the Consolidated Statement of Operations by “marking to market” on a daily basis to reflect the value of the swap agreement at the end of each trading day. Payments received or paid at the beginning of the agreement are reflected as such on the Consolidated Statement of Assets and Liabilities and may be referred to as upfront payments. The Fund accrues for the fixed payment stream and amortizes upfront payments, if any, on swap agreements on a daily basis with the net amount, recorded as a component of realized gain (loss) on the Consolidated Statement of Operations. A liquidation payment received or made at the termination of a swap agreement is recorded as realized gain (loss) on the Consolidated Statement of Operations. The Fund segregates liquid securities having a value at least equal to the amount of the potential obligation of the Fund under any swap transaction. Entering into these agreements involves, to varying degrees, lack of liquidity and elements of credit, market, and Counterparty risk in excess of amounts recognized on the Consolidated Statement of Assets and Liabilities. Such risks involve the possibility that a swap is difficult to sell or liquidate, the Counterparty does not honor its obligations under the agreement and unfavorable interest rates and market fluctuations. It is possible that developments in the swaps market, including potential government regulation, could adversely affect the Fund’s ability to terminate existing swap agreements or to realize amounts to be received under such agreements. A short position in a security poses more risk than holding the same security long. As there is no limit on how much the price of the security can increase, the Fund’s exposure is unlimited.
Notional amounts of each individual credit default swap agreement outstanding as of October 31, 2015 for which the Fund is the seller of protection are disclosed in the open swap agreements table. These potential amounts would be partially offset by any recovery values of the respective referenced obligations, upfront payments received upon entering into the agreement, or net amounts received from the settlement of buy protection credit default swap agreements entered into by the Fund for the same referenced entity or entities.
| O. | Other Risks — The Fund is non-diversified and may invest in securities of fewer issuers than if it were diversified. Thus, the value of the Fund’s shares may vary more widely and the Fund may be subject to greater market and credit risk than if the Fund invested more broadly. |
| P. | Leverage Risk — Leverage exists when the Fund can lose more than it originally invests because it purchases or sells an instrument or enters into a transaction without investing an amount equal to the full economic exposure of the instrument or transaction. |
| Q. | Collateral — To the extent the Fund has designated or segregated a security as collateral and that security is subsequently sold, it is the Fund’s practice to replace such collateral no later than the next business day. |
NOTE 2—Advisory Fees and Other Fees Paid to Affiliates
The Trust has entered into a master investment advisory agreement with Invesco Advisers, Inc. (the “Adviser” or “Invesco”). Under the terms of the investment advisory agreement, the Fund pays an advisory fee to the Adviser less the amount paid by the Subsidiary to the Adviser based on the annual rate of the Fund’s average daily net assets as follows:
| | | | |
| Average Daily Net Assets | | Rate | |
First $10 billion | | | 1.50% | |
Over $10 billion | | | 1.25% | |
For the year ended October 31, 2015, the effective advisory fees incurred by the Fund was 1.50%.
The Subsidiary has entered into a separate contract with the Adviser whereby the Adviser provides investment advisory and other services to the Subsidiary. In consideration of these services, the Subsidiary pays an advisory fee to the Adviser based on the annual rate of the Subsidiary’s average daily net assets as set forth in the table above.
Under the terms of a master sub-advisory agreement between the Adviser and each of Invesco Asset Management Deutschland GmbH, Invesco Asset Management Limited, Invesco Asset Management (Japan) Limited, Invesco Hong Kong Limited, Invesco Senior Secured Management, Inc., Invesco Canada Ltd. and Invesco PowerShares Capital Management LLC (collectively, the “Affiliated Sub-Advisers”) the Adviser, not the Fund, may pay 40% of the fees paid to the Adviser to any such Affiliated Sub-Adviser(s) that provide(s) discretionary investment management services to the Fund based on the percentage of assets allocated to such Affiliated Sub-Adviser(s).
The Adviser has contractually agreed, through February 29, 2016, to waive advisory fees and/or reimburse expenses to the extent necessary to limit total annual fund operating expenses after fee waiver and/or expense reimbursement (excluding certain items discussed below) of Class A, Class C, Class R, Class Y, Class R5 and Class R6 shares to 1.71%, 2.46%, 1.96%, 1.46%, 1.46% and 1.46%, respectively, of average daily net assets. In determining the Adviser’s obligation to waive advisory fees and/or reimburse expenses, the following expenses are not taken into account, and could cause total annual fund operating expenses after fee waiver and/or expense reimbursement to exceed the numbers reflected above: (1) interest; (2) taxes; (3) dividend expense on short sales; (4) extraordinary or non-routine items, including litigation expenses; and (5) expenses that the Fund has incurred but did not actually pay because of an expense offset arrangement. Acquired Fund Fees and Expenses are not operating expenses of the Fund directly, but are fees and expenses, including management fees of the investment companies in which the Fund invests. As a result, the total annual fund operating expenses after expense reimbursement may exceed the expense limits above. The fee waiver agreement cannot be terminated during its term.
Further, the Adviser has contractually agreed, through at least June 30, 2017, to waive the advisory fee payable by the Fund in an amount equal to 100% of the net advisory fees the Adviser receives on the Fund’s investments in certain affiliated funds.
35 Invesco Global Targeted Returns Fund
For the year ended October 31, 2015, the Adviser waived advisory fees of $829,733 and reimbursed class level expenses of $15,190, $3,307, $7, $29,869, $47 and $49 of Class A, Class C, Class R, Class Y, Class R5 and Class R6 shares, respectively.
The Trust has entered into a master administrative services agreement with Invesco pursuant to which the Fund has agreed to pay Invesco for certain administrative costs incurred in providing accounting services to the Fund. For the year ended October 31, 2015, expenses incurred under the agreement are shown in the Consolidated Statement of Operations as Administrative services fees.
The Trust has entered into a transfer agency and service agreement with Invesco Investment Services, Inc. (“IIS”) pursuant to which the Fund has agreed to pay IIS a fee for providing transfer agency and shareholder services to the Fund and reimburse IIS for certain expenses incurred by IIS in the course of providing such services. IIS may make payments to intermediaries that provide omnibus account services, sub-accounting services and/or networking services. All fees payable by IIS to intermediaries that provide omnibus account services or sub-accounting are charged back to the Fund, subject to certain limitations approved by the Trust’s Board of Trustees. For the year ended October 31, 2015, expenses incurred under the agreement are shown in the Consolidated Statement of Operations as Transfer agent fees.
The Trust has entered into master distribution agreements with Invesco Distributors, Inc. (“IDI”) to serve as the distributor for the Class A, Class C, Class R, Class Y, Class R5 and Class R6 shares of the Fund. The Trust has adopted plans pursuant to Rule 12b-1 under the 1940 Act with respect to the Fund’s Class A, Class C and Class R shares (collectively, the “Plans”). The Fund, pursuant to the Plans, pays IDI compensation at the annual rate of 0.25% of the Fund’s average daily net assets of Class A shares, 1.00% of the average daily net assets of Class C shares and 0.50% of the average daily net assets of Class R shares. Of the Plan payments, up to 0.25% of the average daily net assets of each class of shares may be paid to furnish continuing personal shareholder services to customers who purchase and own shares of such classes. Any amounts not paid as a service fee under the Plans would constitute an asset-based sales charge. Rules of the Financial Industry Regulatory Authority (“FINRA”) impose a cap on the total sales charges, including asset-based sales charges, that may be paid by any class of shares of the Fund. For the year ended October 31, 2015, expenses incurred under the Plans are shown in the Consolidated Statement of Operations as Distribution fees.
Front-end sales commissions and CDSC (collectively, the “sales charges”) are not recorded as expenses of the Fund. Front-end sales commissions are deducted from proceeds from the sales of Fund shares prior to investment in Class A shares of the Fund. CDSC are deducted from redemption proceeds prior to remittance to the shareholder. During the year ended October 31, 2015, IDI advised the Fund that IDI retained $4,769 in front-end sales commissions from the sale of Class A shares and $2,284 from Class C shares, for CDSC imposed upon redemptions by shareholders.
Certain officers and trustees of the Trust are officers and directors of the Adviser, IIS and/or IDI.
NOTE 3—Additional Valuation Information
GAAP defines fair value as the price that would be received to sell an asset or paid to transfer a liability in an orderly transaction between market participants at the measurement date, under current market conditions. GAAP establishes a hierarchy that prioritizes the inputs to valuation methods, giving the highest priority to readily available unadjusted quoted prices in an active market for identical assets (Level 1) and the lowest priority to significant unobservable inputs (Level 3), generally when market prices are not readily available or are unreliable. Based on the valuation inputs, the securities or other investments are tiered into one of three levels. Changes in valuation methods may result in transfers in or out of an investment’s assigned level:
| | Level 1 — | Prices are determined using quoted prices in an active market for identical assets. |
| | Level 2 — | Prices are determined using other significant observable inputs. Observable inputs are inputs that other market participants may use in pricing a security. These may include quoted prices for similar securities, interest rates, prepayment speeds, credit risk, yield curves, loss severities, default rates, discount rates, volatilities and others. |
| | Level 3 — | Prices are determined using significant unobservable inputs. In situations where quoted prices or observable inputs are unavailable (for example, when there is little or no market activity for an investment at the end of the period), unobservable inputs may be used. Unobservable inputs reflect the Fund’s own assumptions about the factors market participants would use in determining fair value of the securities or instruments and would be based on the best available information. |
The following is a summary of the tiered valuation input levels, as of October 31, 2015. The level assigned to the securities valuations may not be an indication of the risk or liquidity associated with investing in those securities. Because of the inherent uncertainties of valuation, the values reflected in the financial statements may materially differ from the value received upon actual sale of those investments.
| | | | | | | | | | | | | | | | |
| | | Level 1 | | | Level 2 | | | Level 3 | | | Total | |
Equity Securities | | $ | 116,925,847 | | | $ | — | | | $ | — | | | $ | 116,925,847 | |
Foreign Sovereign Debt Securities | | | — | | | | 6,891,907 | | | | — | | | | 6,891,907 | |
Options Purchased | | | 4,581,968 | | | | 3,975,569 | | | | — | | | | 8,557,537 | |
| | | | 121,507,815 | | | | 10,867,476 | | | | — | | | | 132,375,291 | |
Forward Foreign Currency Contracts* | | | — | | | | 2,241 | | | | — | | | | 2,241 | |
Futures Contracts* | | | (848,091 | ) | | | — | | | | — | | | | (848,091 | ) |
Options Written* | | | (2,457,595 | ) | | | (5,607,176 | ) | | | — | | | | (8,064,771 | ) |
Swap Agreements* | | | — | | | | 1,693,904 | | | | — | | | | 1,693,904 | |
Total Investments | | $ | 118,202,129 | | | $ | 6,956,445 | | | $ | — | | | $ | 125,158,574 | |
| * | Forward Foreign Currency Contracts, Futures Contracts and Swap Agreements are valued at unrealized appreciation (depreciation). Options Written are shown at value. |
36 Invesco Global Targeted Returns Fund
NOTE 4—Derivative Investments
Value of Derivative Investments at Period-End
The table below summarizes the value of the Fund’s derivative investments, detailed by primary risk exposure, held as of October 31, 2015:
| | | | | | | | |
| | | Value | |
| Risk Exposure/Derivative Type | | Assets | | | Liabilities | |
Credit risk: | | | | | | | | |
Swap agreements(a) | | $ | 328,829 | | | $ | (329,143 | ) |
Currency risk: | | | | | | | | |
Forward foreign currency contracts(b) | | | 503,196 | | | | (500,955 | ) |
Options purchased(c) | | | 3,316,975 | | | | — | |
Options written(d) | | | — | | | | (3,596,025 | ) |
Swap agreements(e) | | | 738,908 | | | | (149,473 | ) |
Equity risk: | | | | | | | | |
Futures contracts(f) | | | 1,139,506 | | | | (1,987,597 | ) |
Options purchased(c) | | | 5,131,791 | | | | — | |
Options written(d) | | | — | | | | (3,252,263 | ) |
Swap agreements(e) | | | 1,771,568 | | | | (738,147 | ) |
Interest rate risk: | | | | | | | | |
Options purchased(c) | | | 108,771 | | | | — | |
Options written(d) | | | — | | | | (1,216,483 | ) |
Swap agreements(a)(e) | | | 1,765,704 | | | | (1,694,342 | ) |
Total | | $ | 14,805,248 | | | $ | (13,464,428 | ) |
| (a) | Includes cumulative appreciation (depreciation) of centrally cleared swap agreements. Only current day’s variation margin receivable (payable) is reported within the Consolidated Statement of Assets and Liabilities. |
| (b) | Values are disclosed on the Consolidated Statement of Assets and Liabilities under the captions Unrealized appreciation on forward foreign currency contracts outstanding and Unrealized depreciation on forward foreign currency contracts outstanding. |
| (c) | Options purchased at value as reported in the Consolidated Schedule of Investments. |
| (d) | Values are disclosed on the Consolidated Statement of Assets and Liabilities under the caption Options written, at value. |
| (e) | Values are disclosed on the Consolidated Statement of Assets and Liabilities under the captions Unrealized appreciation on swap agreements — OTC and Unrealized depreciation on swap agreements — OTC. |
| (f) | Includes cumulative appreciation (depreciation) of futures contracts. Only current day’s variation margin receivable (payable) is reported within the Consolidated Statement of Assets and Liabilities. |
Effect of Derivative Investments for the year ended October 31, 2015
The table below summarizes the gains (losses) on derivative investments, detailed by primary risk exposure, recognized in earnings during the period:
| | | | | | | | | | | | | | | | | | | | |
| | | Location of Gain (Loss) on Consolidated Statement of Operations | |
| | | Forward
Foreign Currency
Contracts | | | Futures
Contracts | | | Options
Purchased(a) | | | Options
Written | | | Swap
Agreements | |
Realized Gain (Loss): | | | | | | | | | | | | | | | | | | | | |
Credit risk | | $ | — | | | $ | — | | | $ | — | | | $ | — | | | $ | (184,075 | ) |
Currency risk | | | 1,635,001 | | | | — | | | | 112,881 | | | | 166,452 | | | | — | |
Equity risk | | | — | | | | 406,388 | | | | (3,610,755 | ) | | | 1,689,318 | | | | 111,220 | |
Interest rate risk | | | — | | | | (90,509 | ) | | | 721,266 | | | | (1,085,635 | ) | | | 1,702,721 | |
Change in Net Unrealized Appreciation (Depreciation): | | | | | | | | | | | | | | | | | | | | |
Credit risk | | | — | | | | — | | | | — | | | | — | | | | 10,097 | |
Currency risk | | | (469,528 | ) | | | — | | | | 8,829 | | | | (224,239 | ) | | | 651,000 | |
Equity risk | | | — | | | | (673,405 | ) | | | (136,920 | ) | | | 397,693 | | | | 1,321,583 | |
Interest rate risk | | | — | | | | (29,383 | ) | | | (162,968 | ) | | | 422,951 | | | | (1,038,965 | ) |
Total | | $ | 1,165,473 | | | $ | (386,909 | ) | | $ | (3,067,667 | ) | | $ | 1,366,540 | | | $ | 2,573,581 | |
| (a) | Options purchased are included in the net realized gain (loss) from investment securities and the change in net unrealized appreciation (depreciation) of investment securities. |
37 Invesco Global Targeted Returns Fund
The table below summarizes the average notional value of forward foreign currency contracts, futures contracts, options purchased, options written and swap agreements outstanding during the period.
| | | | | | | | | | | | | | | | | | | | | | | | | | | | |
| | | Forward
Foreign Currency
Contracts | | | Futures
Contracts | | | Foreign
Currency
Options | | | Index
Options
Written | | | Index
Options
Purchased | | | Swaptions | | | Swap
Agreements | |
Average notional value | | $ | 74,949,046 | | | $ | 42,997,799 | | | $ | 64,159,928 | | | $ | 49,441,281 | | | $ | 74,269,967 | | | $ | 80,675,715 | | | $ | 263,874,909 | |
Average contracts | | | — | | | | — | | | | — | | | | 939 | | | | 2,382 | | | | — | | | | — | |
Offsetting Assets and Liabilities
Accounting Standards Update (“ASU”) No. 2011-11, Disclosures about Offsetting Assets and Liabilities, which was subsequently clarified in Financial Accounting Standards Board ASU 2013-01 “Clarifying the Scope of Disclosures about Offsetting Assets and Liabilities” is intended to enhance disclosures about financial instruments and derivative instruments that are subject to offsetting arrangements on the Consolidated Statement of Assets and Liabilities and to enable investors to better understand the effect of those arrangements on the Fund’s financial position. In order for an arrangement to be eligible for netting, the Fund must have a basis to conclude that such netting arrangements are legally enforceable. The Fund enters into netting agreements and collateral agreements in an attempt to reduce the Fund’s Counterparty credit risk by providing for a single net settlement with a Counterparty of all financial transactions covered by the agreement in an event of default as defined under such agreement.
The following tables present derivative instruments that are either subject to an enforceable netting agreement or offset by collateral arrangements as of October 31, 2015.
| | | | | | | | | | | | | | | | | | | | |
Counterparty | | Gross amounts
of Recognized
Assets | | | Gross Amounts Not Offset in the
Consolidated Statement of Assets and Liabilities | | | Net
Amount(a) | |
| | | Financial
Instruments | | | Collateral Received | | |
| | | | Non-Cash | | | Cash | | |
Fund | | | | | | | | | | | | | | | | | | | | |
Barclays Bank PLC(b) | | $ | 1,264,139 | | | $ | — | | | $ | — | | | $ | — | | | $ | 1,264,139 | |
Barclays Bank PLC(c) | | | 19,394 | | | | (11,277 | ) | | | — | | | | — | | | | 8,117 | |
Citigroup Global Markets Inc.(b) | | | 104,899 | | | | — | | | | — | | | | — | | | | 104,899 | |
Citigroup Global Markets Inc.(c) | | | 6,864 | | | | — | | | | — | | | | — | | | | 6,864 | |
Credit Suisse First Boston(d) | | | 1,673,918 | | | | (1,493,713 | ) | | | — | | | | — | | | | 180,205 | |
Deutsche Bank Securities Inc.(b) | | | 780,032 | | | | — | | | | — | | | | — | | | | 780,032 | |
Deutsche Bank Securities Inc.(c) | | | 432,650 | | | | (98,897 | ) | | | — | | | | — | | | | 333,753 | |
Goldman Sachs International(b) | | | 1,512,391 | | | | — | | | | — | | | | — | | | | 1,512,391 | |
Goldman Sachs International(c) | | | 868,475 | | | | (425,845 | ) | | | — | | | | — | | | | 442,630 | |
HSBC New York(b) | | | 8,628 | | | | — | | | | — | | | | — | | | | 8,628 | |
HSBC New York(c) | | | 405,535 | | | | (116,126 | ) | | | — | | | | — | | | | 289,409 | |
Morgan Stanley Capital Services LLC(b) | | | 10,763 | | | | — | | | | — | | | | — | | | | 10,763 | |
Morgan Stanley Capital Services LLC(c) | | | 125,085 | | | | (17,332 | ) | | | — | | | | — | | | | 107,753 | |
Royal Bank of Scotland Securities Inc.(c) | | | 28,405 | | | | (1,439 | ) | | | — | | | | — | | | | 26,966 | |
Societe Generale(b) | | | 146,350 | | | | — | | | | — | | | | — | | | | 146,350 | |
Societe Generale(c) | | | 615,869 | | | | (210,195 | ) | | | — | | | | — | | | | 405,674 | |
State Street Bank & Trust Co.(e) | | | 503,196 | | | | (471,637 | ) | | | — | | | | — | | | | 31,559 | |
UBS(b) | | | 148,367 | | | | — | | | | — | | | | — | | | | 148,367 | |
UBS(c) | | | 8,199 | | | | (6,509 | ) | | | — | | | | — | | | | 1,690 | |
Subtotal-Fund | | $ | 8,663,159 | | | $ | (2,852,970 | ) | | $ | — | | | $ | — | | | $ | 5,810,189 | |
| | | | | |
Subsidiary | | | | | | | | | | | | | | | | | | | | |
Citigroup Global Markets Inc.(c) | | $ | 105,475 | | | $ | (80,130 | ) | | $ | — | | | $ | — | | | $ | 25,345 | |
Deutsche Bank Securities Inc.(c) | | | 73,222 | | | | (73,222 | ) | | | — | | | | — | | | | — | |
Morgan Stanley Capital Services LLC(c) | | | 241,928 | | | | (241,928 | ) | | | — | | | | — | | | | — | |
Subtotal-Subsidiary | | $ | 420,625 | | | $ | (395,280 | ) | | $ | — | | | $ | — | | | $ | 25,345 | |
Total | | $ | 9,083,784 | | | $ | (3,248,250 | ) | | $ | — | | | $ | — | | | $ | 5,835,534 | |
| | | | | |
| | | | | | | | | | | | | | | | | | | | |
38 Invesco Global Targeted Returns Fund
| | | | | | | | | | | | | | | | | | | | |
Counterparty | | Gross amounts
of Recognized
Liabilities | | | Gross Amounts Not Offset in the
Consolidated Statement of Assets and Liabilities | | | Net
Amount(a) | |
| | | Financial
Instruments | | | Collateral Pledged | | |
| | | | Non-Cash | | | Cash | | |
Fund | | | | | | | | | | | | | | | | | | | | |
Barclays Bank PLC(c) | | $ | 11,277 | | | $ | (11,277 | ) | | $ | — | | | $ | — | | | $ | — | |
Barclays Bank PLC(f) | | | 961,283 | | | | — | | | | — | | | | — | | | | 961,283 | |
Citigroup Global Markets Inc.(f) | | | 107,197 | | | | — | | | | — | | | | — | | | | 107,197 | |
Credit Suisse First Boston(d) | | | 1,493,713 | | | | (1,493,713 | ) | | | — | | | | — | | | | — | |
Deutsche Bank Securities Inc.(c) | | | 98,897 | | | | (98,897 | ) | | | — | | | | — | | | | — | |
Deutsche Bank Securities Inc.(e) | | | 27,000 | | | | — | | | | — | | | | — | | | | 27,000 | |
Deutsche Bank Securities Inc.(f) | | | 1,222,342 | | | | — | | | | — | | | | (140,000 | ) | | | 1,082,342 | |
Goldman Sachs International(c) | | | 425,845 | | | | (425,845 | ) | | | — | | | | — | | | | — | |
Goldman Sachs International(e) | | | 2,318 | | | | — | | | | — | | | | — | | | | 2,318 | |
Goldman Sachs International(f) | | | 1,718,670 | | | | — | | | | — | | | | — | | | | 1,718,670 | |
HSBC New York(c) | | | 116,126 | | | | (116,126 | ) | | | — | | | | — | | | | — | |
HSBC New York(f) | | | 14,169 | | | | — | | | | — | | | | — | | | | 14,169 | |
Morgan Stanley Capital Services LLC(c) | | | 17,332 | | | | (17,332 | ) | | | — | | | | — | | | | — | |
Morgan Stanley Capital Services LLC(f) | | | 1,138,204 | | | | — | | | | — | | | | (1,010,000 | ) | | | 128,204 | |
Royal Bank of Scotland Securities Inc.(c) | | | 1,439 | | | | (1,439 | ) | | | — | | | | — | | | | — | |
Royal Bank of Scotland Securities Inc.(f) | | | 65,817 | | | | — | | | | — | | | | (65,817 | ) | | | — | |
Societe Generale(c) | | | 210,195 | | | | (210,195 | ) | | | — | | | | — | | | | — | |
Societe Generale(f) | | | 199,723 | | | | — | | | | — | | | | — | | | | 199,723 | |
State Street Bank & Trust Co.(e) | | | 471,637 | | | | (471,637 | ) | | | — | | | | — | | | | — | |
UBS(c) | | | 6,509 | | | | (6,509 | ) | | | — | | | | — | | | | — | |
UBS(f) | | | 179,771 | | | | — | | | | — | | | | — | | | | 179,771 | |
Subtotal-Fund | | $ | 8,489,464 | | | $ | (2,852,970 | ) | | $ | — | | | $ | (1,215,817 | ) | | $ | 4,420,677 | |
| | | | | |
Subsidiary | | | | | | | | | | | | | | | | | | | | |
Citigroup Global Markets Inc.(c) | | $ | 80,130 | | | $ | (80,130 | ) | | $ | — | | | $ | — | | | $ | — | |
Deutsche Bank Securities Inc.(c) | | | 127,422 | | | | (73,222 | ) | | | — | | | | (25,000 | ) | | | 29,200 | |
Morgan Stanley Capital Services LLC(c) | | | 322,232 | | | | (241,928 | ) | | | — | | | | (50,000 | ) | | | 30,304 | |
Subtotal-Subsidiary | | $ | 529,784 | | | $ | (395,280 | ) | | $ | — | | | $ | (75,000 | ) | | $ | 59,504 | |
Total | | $ | 9,019,248 | | | $ | (3,248,250 | ) | | $ | — | | | $ | (1,290,817 | ) | | $ | 4,480,181 | |
| (a) | The Fund and the Subsidiary are recognized as separate legal entities and as such are subject to separate netting arrangements with the Counterparty. |
| (b) | Options purchased — OTC Counterparty. |
| (c) | Swap agreements — OTC Counterparty. |
| (d) | Swap agreements — centrally cleared Counterparty. Includes cumulative appreciation (depreciation). |
| (e) | Forward foreign currency contracts Counterparty. |
| (f) | Options written — OTC Counterparty. |
NOTE 5—Subsidiary Information
The Fund’s Consolidated Schedule of Investments includes the holdings, including any investments in derivatives, of both the Fund and the Subsidiary. The Fund’s Consolidated Statement of Assets and Liabilities, Consolidated Statement of Operations and Consolidated Statement of Changes in Net Assets include the account balances of both the Fund and the Subsidiary and all interfund transactions have been eliminated.
The table below summarizes the financial information of the Subsidiary recognized in the consolidated financial statements referred to above.
| | | | |
| Selected Financial Information | | Invesco Cayman
Commodity Fund VII Ltd.
(the “Subsidiary”) | |
Total assets | | $ | 6,220,894 | |
Total liabilities | | | 531,208 | |
Net assets | | | 5,689,686 | |
Total investment income | | | 3,237 | |
Net investment income (loss) | | | (90,817 | ) |
Net realized gain (loss) from: | | | | |
Foreign currencies | | | 1,343 | |
Swap agreements | | | (111,681 | ) |
Change in net unrealized appreciation (depreciation) of: | | | | |
Swap agreements | | | (109,159 | ) |
Increase (decrease) in net assets resulting from operations | | $ | (310,314 | ) |
39 Invesco Global Targeted Returns Fund
NOTE 6—Trustees’ and Officers’ Fees and Benefits
Trustees’ and Officers’ Fees and Benefits include amounts accrued by the Fund to pay remuneration to certain Trustees and Officers of the Fund. Trustees have the option to defer compensation payable by the Fund, and Trustees’ and Officers’ Fees and Benefits also include amounts accrued by the Fund to fund such deferred compensation amounts. Those Trustees who defer compensation have the option to select various Invesco Funds in which their deferral accounts shall be deemed to be invested. Obligations under the deferred compensation plan represent unsecured claims against the general assets of the Fund.
NOTE 7—Cash Balances
The Fund is permitted to temporarily carry a negative or overdrawn balance in its account with State Street Bank and Trust Company, the custodian bank. Such balances, if any at period end, are shown in the Consolidated Statement of Assets and Liabilities under the payable caption Amount due custodian. To compensate the custodian bank for such overdrafts, the overdrawn Fund may either (1) leave funds as a compensating balance in the account so the custodian bank can be compensated by earning the additional interest; or (2) compensate by paying the custodian bank at a rate agreed upon by the custodian bank and Invesco, not to exceed the contractually agreed upon rate.
NOTE 8—Distributions to Shareholders and Tax Components of Net Assets
Tax Character of Distributions to Shareholders Paid During the Fiscal Year Ended October 31, 2015 and the Period December 19, 2013 (commencement date) through October 31, 2014:
| | | | | | | | |
| | | 2015 | | | 2014 | |
Ordinary income | | $ | 306,514 | | | $ | — | |
Long-term capital gain | | | 380,474 | | | | — | |
Total distributions | | $ | 686,988 | | | $ | — | |
Tax Components of Net Assets at Period-End:
| | | | |
| | | 2015 | |
Undistributed ordinary income | | $ | 1,306,288 | |
Undistributed long-term gain | | | 443,413 | |
Net unrealized appreciation (depreciation) — investments | | | (2,847,851 | ) |
Net unrealized appreciation — other investments | | | 1,576,783 | |
Temporary book/tax differences | | | (333,158 | ) |
Shares of beneficial interest | | | 140,905,166 | |
Total net assets | | $ | 141,050,641 | |
The difference between book-basis and tax-basis unrealized appreciation (depreciation) is due to differences in the timing of recognition of gains and losses on investments for tax and book purposes. The Fund’s net unrealized appreciation (depreciation) difference is attributable primarily to wash sales.
The temporary book/tax differences are a result of timing differences between book and tax recognition of income and/or expenses. The Fund’s temporary book/tax differences are the result of the trustee deferral of compensation and retirement plan benefits.
Capital loss carryforward is calculated and reported as of a specific date. Results of transactions and other activity after that date may affect the amount of capital loss carryforward actually available for the Fund to utilize. The ability to utilize capital loss carryforward in the future may be limited under the Internal Revenue Code and related regulations based on the results of future transactions.
The Fund does not have a capital loss carryforward as of October 31, 2015.
NOTE 9—Investment Securities
The aggregate amount of investment securities (other than short-term securities, U.S. Treasury obligations and money market funds, if any) purchased and sold by the Fund during the year ended October 31, 2015 was $72,840,102 and $35,009,610, respectively. Cost of investments on a tax basis includes the adjustments for financial reporting purposes as of the most recently completed federal income tax reporting period-end.
| | | | |
| Unrealized Appreciation (Depreciation) of Investment Securities on a Tax Basis | |
Aggregate unrealized appreciation of investment securities | | $ | 1,364,832 | |
Aggregate unrealized (depreciation) of investment securities | | | (4,212,683 | ) |
Net unrealized appreciation (depreciation) of investment securities | | $ | (2,847,851 | ) |
Cost of investments for tax purposes is $135,223,142.
NOTE 10—Reclassification of Permanent Differences
Primarily as a result of differing book/tax treatment of income from derivative investments, foreign currency transactions and net operating losses, on October 31, 2015, undistributed net investment income was increased by $35,960, undistributed net realized gain was increased by $284,942 and shares of beneficial interest was decreased by $320,902. This reclassification had no effect on the net assets of the Fund.
40 Invesco Global Targeted Returns Fund
NOTE 11—Share Information
| | | | | | | | | | | | | | | | |
| | | Summary of Share Activity | |
| | | Year ended
October 31, 2015(a) | | | December 19, 2013
(commencement date) through
October 31, 2014 | |
| | | Shares | | | Amount | | | Shares | | | Amount | |
Sold: | | | | | | | | | | | | | | | | |
Class A | | | 2,718,836 | | | $ | 28,480,858 | | | | 1,491,403 | | | $ | 15,070,925 | |
Class C | | | 1,193,463 | | | | 12,327,007 | | | | 42,851 | | | | 443,040 | |
Class R | | | — | | | | — | | | | 1,001 | | | | 10,014 | |
Class Y | | | 9,905,242 | | | | 103,429,009 | | | | 1,586,102 | | | | 16,042,737 | |
Class R5 | | | 3,477 | | | | 39,085 | | | | 261,687 | | | | 2,641,159 | |
Class R6 | | | — | | | | — | | | | 889,089 | | | | 9,253,580 | |
| | | | |
Issued as reinvestment of dividends: | | | | | | | | | | | | | | | | |
Class A | | | 3,477 | | | | 35,775 | | | | — | | | | — | |
Class C | | | 965 | | | | 9,861 | | | | — | | | | — | |
Class Y | | | 7,638 | | | | 78,750 | | | | — | | | | — | |
Class R5 | | | 2,164 | | | | 22,311 | | | | — | | | | — | |
Class R6 | | | 12,225 | | | | 125,922 | | | | — | | | | — | |
| | | | |
Reacquired: | | | | | | | | | | | | | | | | |
Class A | | | (1,723,051 | ) | | | (17,850,188 | ) | | | (197,744 | ) | | | (2,058,608 | ) |
Class C | | | (106,890 | ) | | | (1,095,558 | ) | | | — | | | | — | |
Class Y | | | (2,058,678 | ) | | | (21,450,416 | ) | | | (23,069 | ) | | | (239,638 | ) |
Class R5 | | | (260,038 | ) | | | (2,709,720 | ) | | | (1,301 | ) | | | (13,383 | ) |
Class R6 | | | (124,001 | ) | | | (1,277,470 | ) | | | — | | | | — | |
Net increase in share activity | | | 9,574,829 | | | $ | 100,165,226 | | | | 4,050,019 | | | $ | 41,149,826 | |
| (a) | There are entities that are record owners of more than 5% of the outstanding shares of the Fund and in the aggregate own 71% of the outstanding shares of the Fund. IDI has an agreement with these entities to sell Fund shares. The Fund, Invesco and/or Invesco affiliates may make payments to these entities, which are considered to be related to the Fund, for providing services to the Fund, Invesco and/or Invesco affiliates including but not limited to services such as securities brokerage, distribution, third party record keeping and account servicing. The Fund has no knowledge as to whether all or any portion of the shares owned of record by these entities are also owned beneficially. |
41 Invesco Global Targeted Returns Fund
NOTE 12—Financial Highlights
The following schedule presents financial highlights for a share of the Fund outstanding throughout the periods indicated.
| | | | | | | | | | | | | | | | | | | | | | | | | | | | | | | | | | | | | | | | | | | | | | | | | | | | | | | | |
| | | Net asset
value,
beginning
of period | | | Net
Investment
income
(loss)(a) | | | Net gains
on securities
(both
realized and
unrealized) | | | Total from
investment
operations | | | Dividends
from net
investment
income | | | Distributions
from net
realized
gains | | | Total
distributions | | | Net asset
value, end
of period | | | Total
return(b) | | | Net assets,
end of period
(000’s omitted) | | | Ratio of
expenses
to average
net assets
with fee waivers
and/or expenses
absorbed(c) | | | Ratio of
expenses
to average net
assets without
fee waivers
and/or expenses
absorbed | | | Ratio of net
investment
income (loss)
to average
net assets | | | Portfolio
turnover(d) | |
Class A | |
Year ended 10/31/15 | | $ | 10.44 | | | $ | 0.01 | | | $ | 0.04 | | | $ | 0.05 | | | $ | (0.06 | ) | | $ | (0.10 | ) | | $ | (0.16 | ) | | $ | 10.33 | | | | 0.49 | % | | $ | 23,688 | | | | 1.33 | %(f) | | | 2.38 | %(f) | | | 0.05 | %(f) | | | 79 | % |
Year ended 10/31/14(e) | | | 10.00 | | | | (0.02 | ) | | | 0.46 | | | | 0.44 | | | | — | | | | — | | | | — | | | | 10.44 | | | | 4.40 | | | | 13,504 | | | | 1.29 | (g) | | | 3.16 | (g) | | | (0.18 | )(g) | | | 20 | |
Class C | | | | | | | | | | | | | | | | | | | | | | | | | | | | | | | | | | | | | | | | | | | | | | | | | | | | | | | | |
Year ended 10/31/15 | | | 10.37 | | | | (0.07 | ) | | | 0.04 | | | | (0.03 | ) | | | (0.05 | ) | | | (0.10 | ) | | | (0.15 | ) | | | 10.19 | | | | (0.27 | ) | | | 11,524 | | | | 2.08 | (f) | | | 3.13 | (f) | | | (0.70 | )(f) | | | 79 | |
Year ended 10/31/14(e) | | | 10.00 | | | | (0.08 | ) | | | 0.45 | | | | 0.37 | | | | — | | | | — | | | | — | | | | 10.37 | | | | 3.70 | | | | 444 | | | | 2.04 | (g) | | | 3.91 | (g) | | | (0.93 | )(g) | | | 20 | |
Class R | |
Year ended 10/31/15 | | | 10.42 | | | | (0.02 | ) | | | 0.04 | | | | 0.02 | | | | (0.05 | ) | | | (0.10 | ) | | | (0.15 | ) | | | 10.29 | | | | 0.27 | | | | 10 | | | | 1.58 | (f) | | | 2.63 | (f) | | | (0.20 | )(f) | | | 79 | |
Year ended 10/31/14(e) | | | 10.00 | | | | (0.04 | ) | | | 0.46 | | | | 0.42 | | | | — | | | | — | | | | — | | | | 10.42 | | | | 4.20 | | | | 10 | | | | 1.54 | (g) | | | 3.41 | (g) | | | (0.43 | )(g) | | | 20 | |
Class Y | |
Year ended 10/31/15 | | | 10.46 | | | | 0.03 | | | | 0.04 | | | | 0.07 | | | | (0.06 | ) | | | (0.10 | ) | | | (0.16 | ) | | | 10.37 | | | | 0.72 | | | | 97,703 | | | | 1.08 | (f) | | | 2.13 | (f) | | | 0.30 | (f) | | | 79 | |
Year ended 10/31/14(e) | | | 10.00 | | | | 0.01 | | | | 0.45 | | | | 0.46 | | | | — | | | | — | | | | — | | | | 10.46 | | | | 4.60 | | | | 16,352 | | | | 1.04 | (g) | | | 2.91 | (g) | | | 0.07 | (g) | | | 20 | |
Class R5 | |
Year ended 10/31/15 | | | 10.46 | | | | 0.03 | | | | 0.05 | | | | 0.08 | | | | (0.06 | ) | | | (0.10 | ) | | | (0.16 | ) | | | 10.38 | | | | 0.82 | | | | 62 | | | | 1.08 | (f) | | | 2.07 | (f) | | | 0.30 | (f) | | | 79 | |
Year ended 10/31/14(e) | | | 10.00 | | | | 0.01 | | | | 0.45 | | | | 0.46 | | | | — | | | | — | | | | — | | | | 10.46 | | | | 4.60 | | | | 2,724 | | | | 1.04 | (g) | | | 2.87 | (g) | | | 0.07 | (g) | | | 20 | |
Class R6 | |
Year ended 10/31/15 | | | 10.46 | | | | 0.03 | | | | 0.04 | | | | 0.07 | | | | (0.06 | ) | | | (0.10 | ) | | | (0.16 | ) | | | 10.37 | | | | 0.73 | | | | 8,063 | | | | 1.08 | (f) | | | 2.07 | (f) | | | 0.30 | (f) | | | 79 | |
Year ended 10/31/14(e) | | | 10.00 | | | | 0.01 | | | | 0.45 | | | | 0.46 | | | | — | | | | — | | | | — | | | | 10.46 | | | | 4.60 | | | | 9,298 | | | | 1.04 | (g) | | | 2.87 | (g) | | | 0.07 | (g) | | | 20 | |
| (a) | Calculated using average shares outstanding. |
| (b) | Includes adjustments in accordance with accounting principles generally accepted in the United States of America and as such, the net asset value for financial reporting purposes and the returns based upon those net asset values may differ from the net asset value and returns for shareholder transactions. Does not include sales charges and is not annualized for periods less than one year, if applicable. |
| (c) | In addition to the fees and expenses which the Fund bears directly; the Fund indirectly bears a pro rata share of the fees and expenses of the underlying funds in which the Fund invests. Because the underlying funds have varied expenses and fee levels and the Fund may own different proportions at different times, the amount of fees and expenses incurred indirectly by the Fund will vary. Estimated underlying fund expenses are not expenses that are incurred directly by your Fund. They are expenses that are incurred directly by the underlying funds and are deducted from the value of the funds your Fund invests in. The effect of the estimated underlying fund expenses that you bear indirectly is included in your Fund’s total return. Estimated acquired fund fees from underlying funds were 0.44% and 0.50% for the year ended October 31, 2015 and the period ended October 31, 2014. |
| (d) | Portfolio turnover is calculated at the fund level and is not annualized for periods less than one year, if applicable. |
| (e) | Commencement date of December 19, 2013. |
| (f) | Ratios are based on average daily net assets (000’s omitted) of $23,131, $5,035, $10, $45,482, $1,410 and $9,295 for Class A, Class C, Class R, Class Y, Class R5 and Class R6 shares, respectively. |
42 Invesco Global Targeted Returns Fund
Report of Independent Registered Public Accounting Firm
To the Board of Trustees of AIM Investment Funds (Invesco Investment Funds)
and Shareholders of Invesco Global Targeted Returns Fund:
In our opinion, the accompanying consolidated statement of assets and liabilities, including the consolidated schedule of investments, and the related consolidated statements of operations and of changes in net assets and the financial highlights present fairly, in all material respects, the consolidated financial position of Invesco Global Targeted Returns Fund (one of the funds constituting AIM Investment Funds (Invesco Investment Funds), hereafter referred to as the “Fund”) at October 31, 2015, the results of its operations for the year then ended, the changes in its net assets and the financial highlights for the year then ended and for the period December 19, 2013 (commencement of operations) through October 31, 2014, in conformity with accounting principles generally accepted in the United States of America. These consolidated financial statements and financial highlights (hereafter referred to as “financial statements”) are the responsibility of the Fund’s management. Our responsibility is to express an opinion on these financial statements based on our audits. We conducted our audits of these financial statements in accordance with the standards of the Public Company Accounting Oversight Board (United States). Those standards require that we plan and perform the audit to obtain reasonable assurance about whether the financial statements are free of material misstatement. An audit includes examining, on a test basis, evidence supporting the amounts and disclosures in the financial statements, assessing the accounting principles used and significant estimates made by management, and evaluating the overall financial statement presentation. We believe that our audits, which included confirmation of securities at October 31, 2015 by correspondence with the custodian and brokers, and the application of alternative auditing procedures where confirmations of security purchases have not been received, provide a reasonable basis for our opinion.
PRICEWATERHOUSECOOPERS LLP
December 30, 2015
Houston, Texas
43 Invesco Global Targeted Returns Fund
Calculating your ongoing Fund expenses
Example
As a shareholder of the Fund, you incur two types of costs: (1) transaction costs, which may include sales charges (loads) on purchase payments or contingent deferred sales charges on redemptions, if any; and (2) ongoing costs, including management fees, distribution and/or service (12b-1) fees, and other Fund expenses. This example is intended to help you understand your ongoing costs (in dollars) of investing in the Fund and to compare these costs with ongoing costs of investing in other mutual funds. The example is based on an investment of $1,000 invested at the beginning of the period and held for the entire period May 1, 2015 through October 31, 2015.
Actual expenses
The table below provides information about actual account values and actual expenses. You may use the information in this table, together with the amount you invested, to estimate the expenses that you paid over the period. Simply divide your account value by $1,000 (for example, an $8,600 account value divided by $1,000 = 8.6), then multiply the result by the number in the table under the heading entitled “Actual Expenses Paid During Period” to estimate the expenses you paid on your account during this period.
Hypothetical example for comparison purposes
The table below also provides information about hypothetical account values and hypothetical expenses based on the Fund’s actual expense ratio and an assumed rate of return of 5% per year before expenses, which is not the Fund’s actual return.
The hypothetical account values and expenses may not be used to estimate the actual ending account balance or expenses you paid for the period. You may use this information to compare the ongoing costs of investing in the Fund and other funds. To do so, compare this 5% hypothetical example with the 5% hypothetical examples that appear in the shareholder reports of the other funds.
Please note that the expenses shown in the table are meant to highlight your ongoing costs only and do not reflect any transaction costs, such as sales charges (loads) on purchase payments or contingent deferred sales charges on redemptions, if any. Therefore, the hypothetical information is useful in comparing ongoing costs only, and will not help you determine the relative total costs of owning different funds. In addition, if these transaction costs were included, your costs would have been higher.
| | | | | | | | | | | | | | | | | | | | | | | | |
Class | | Beginning
Account Value
(05/01/15) | | | ACTUAL | | | HYPOTHETICAL (5% annual return before
expenses) | | | Annualized
Expense
Ratio | |
| | | Ending
Account Value
(10/31/15)1 | | | Expenses
Paid During
Period2 | | | Ending
Account Value
(10/31/15) | | | Expenses
Paid During
Period2 | | |
A | | $ | 1,000.00 | | | $ | 985.70 | | | $ | 6.68 | | | $ | 1,018.48 | | | $ | 6.79 | | | | 1.34 | % |
C | | | 1,000.00 | | | | 981.70 | | | | 10.43 | | | | 1,014.68 | | | | 10.60 | | | | 2.09 | |
R | | | 1,000.00 | | | | 984.70 | | | | 7.94 | | | | 1,017.20 | | | | 8.07 | | | | 1.59 | |
Y | | | 1,000.00 | | | | 986.70 | | | | 5.45 | | | | 1,019.72 | | | | 5.54 | | | | 1.09 | |
R5 | | | 1,000.00 | | | | 987.60 | | | | 5.44 | | | | 1,019.74 | | | | 5.52 | | | | 1.09 | |
R6 | | | 1,000.00 | | | | 987.60 | | | | 5.44 | | | | 1,019.74 | | | | 5.52 | | | | 1.09 | |
| 1 | The actual ending account value is based on the actual total return of the Fund for the period May 1, 2015 through October 31, 2015, after actual expenses and will differ from the hypothetical ending account value which is based on the Fund’s expense ratio and a hypothetical annual return of 5% before expenses. |
| 2 | Expenses are equal to the Fund’s annualized expense ratio as indicated above multiplied by the average account value over the period, multiplied by 184/365 to reflect the most recent fiscal half year. |
44 Invesco Global Targeted Returns Fund
Approval of Investment Advisory and Sub-Advisory Contracts
The Board of Trustees (the Board) of AIM Investment Funds (Invesco Investment Funds) is required under the Investment Company Act of 1940, as amended, to approve annually the renewal of Invesco Global Targeted Returns Fund’s (the Fund) investment advisory agreements. During contract renewal meetings held on June 9-10, 2015, the Board as a whole, and the disinterested or “independent” Trustees, who comprise over 75% of the Board, voting separately, approved the continuance for the Fund of the Master Investment Advisory Agreement with Invesco Advisers, Inc. (Invesco Advisers and the investment advisory agreement) and the Master Intergroup Sub-Advisory Contract for Mutual Funds with Invesco Asset Management Deutschland GmbH, Invesco Asset Management Limited, Invesco Asset Management (Japan) Limited, Invesco Hong Kong Limited, Invesco Senior Secured Management, Inc., Invesco Canada Ltd. and Invesco PowerShares Capital Management LLC (collectively, the Affiliated Sub-Advisers and the sub-advisory contracts) for another year, effective July 1, 2015.
In evaluating the fairness and reasonableness of compensation under the Fund’s investment advisory agreement and sub-advisory contracts, the Board considered, among other things, the factors discussed below. The Board determined that continuation of the Fund’s investment advisory agreement and the sub-advisory contracts is in the best interest of the Fund and its shareholders and that the compensation payable to Invesco Advisers and the Affiliated Sub-Advisers under the agreements is fair and reasonable.
The Board’s Fund Evaluation Process
The Board’s Investments Committee has established three Sub-Committees, each of which is primarily responsible for overseeing the performance and investment management services provided by Invesco Advisers and the Affiliated Sub-Advisers to a number of the funds advised by Invesco Advisers (the Invesco Funds). The Sub-Committees meet throughout the year to review the performance of their assigned Invesco Funds, including reviewing materials prepared under the direction of the independent Senior Officer, an officer of the Invesco Funds who reports directly to the independent Trustees. Over the course of each year, the Sub-Committees meet with portfolio managers for their assigned Invesco Funds and other members of management to review the performance, investment objective(s), policies, strategies, limitations and investment risks of these funds. The Board had the benefit of reports from the Sub-Committees and Investments Committee throughout the year in considering approval of the continuance of each Invesco Fund’s investment advisory agreement and sub-advisory contracts for another year.
During the contract renewal process, the Board receives comparative performance and fee data regarding the Invesco Funds prepared by Invesco Advisers and Lipper Inc. (Lipper), an independent provider of investment company data. The Board also receives a report and this independent written evaluation from the Senior Officer. The Senior Officer’s evaluation is prepared as part of his responsibility to manage the process by which the Invesco Funds’ proposed management fees are negotiated during the annual contract renewal process to ensure they are negotiated in a manner that is at arms’ length and reasonable. In addition to meetings with Invesco Advisers and fund counsel, the independent Trustees also discuss the continuance of the investment advisory agreement and sub-advisory contracts in separate sessions with the Senior Officer and with independent legal counsel.
The Trustees recognized that the advisory fee rates for the Invesco Funds are, in many cases, the result of years of review and negotiation. The Trustees’ deliberations and conclusions in a particular year may be based in part on their deliberations and conclusions regarding these arrangements throughout the year and in prior years. The Trustees’ review and conclusions are based on the comprehensive consideration of all information presented to them and are not the result of any single determinative factor. Moreover, one Trustee may have weighed a particular piece of information or factor differently than another Trustee.
The discussion below is a summary of the Senior Officer’s independent written evaluation with respect to the Fund’s investment advisory agreement as well as a discussion of the material factors and related conclusions that formed the basis for the Board’s approval of the Fund’s investment advisory agreement and sub-advisory contracts. Unless otherwise stated, this information is current as of June 10, 2015, and does not reflect consideration of factors that became known to the Board after that date.
Factors and Conclusions and Summary of Independent Written Fee Evaluation
| A. | Nature, Extent and Quality of Services Provided by Invesco Advisers and the Affiliated Sub-Advisers |
The Board reviewed the advisory services provided to the Fund by Invesco Advisers under the Fund’s investment advisory agreement, the performance of Invesco Advisers in providing these services, and the credentials and experience of the officers and employees of Invesco Advisers who provide these services, including the Fund’s portfolio manager or managers. The Board’s review of the qualifications of Invesco Advisers to provide advisory services included the Board’s consideration of Invesco Advisers’ investment
process oversight, independent credit analysis and investment risk management. The Board also considered non-advisory services that Invesco Advisers and its affiliates provide to the Invesco Funds such as various back office support functions, equity and fixed income trading operations, internal audit, distribution, valuation and legal and compliance.
In determining whether to continue the Fund’s investment advisory agreement, the Board considered the benefits of reapproving an existing relationship and the greater uncertainty that may be associated with entering into a new relationship. The Board concluded that the nature, extent and quality of the services provided to the Fund by Invesco Advisers are appropriate and satisfactory and consistent with the terms of the Fund’s investment advisory agreement.
The Board reviewed the services that may be provided by the Affiliated Sub-Advisers under the sub-advisory contracts and the credentials and experience of the officers and employees of the Affiliated Sub-Advisers who provide these services. The Board noted that the Affiliated Sub-Advisers have offices and personnel that are located in financial centers around the world. As a result, the Affiliated Sub-Advisers can provide research and investment analysis on the markets and economies of various countries in which the Fund may invest, make recommendations regarding securities and assist with security trades. The Board concluded that the sub-advisory contracts benefit the Fund and its shareholders by permitting Invesco Advisers to use the resources and talents of the Affiliated Sub-Advisers in managing the Fund. The Board concluded that the nature, extent and quality of the services that may be provided by the Affiliated Sub-Advisers are appropriate and satisfactory and consistent with the terms of the Fund’s sub-advisory contracts.
The Board noted that Invesco Asset Management Limited currently manages assets of the Fund. The Board did not consider Fund performance as a relevant factor in considering whether to approve the investment advisory agreement as the Fund had only one year of performance history and no comparative data was available.
| C. | Advisory and Sub-Advisory Fees |
The Board considered the advisory fee schedule of the Fund and the contractual fee waivers and/or expense limitations that will be in place for the Fund through February 29, 2016. The Board had no comparative Lipper fee data because the Fund was launched in December 2013.
The Board also compared the Fund’s effective advisory fee rate (the advisory fee rate after advisory fee waivers and before other expense limitations/waivers) to the effective advisory fee rates of other funds advised by Invesco Advisers
45 Invesco Global Targeted Returns Fund
and its affiliates with investment strategies comparable to those of the Fund. The Board noted that the Fund’s rate was above the rate of two such funds.
The Board noted that Invesco Advisers and the Affiliated Sub-Advisers do not manage other client accounts with investment strategies comparable to those of the Fund.
The Board also considered the services that may be provided by the Affiliated Sub-Advisers pursuant to the sub-advisory contracts, as well as the fees payable by Invesco Advisers to Affiliated Sub-Advisers pursuant to the sub-advisory contracts. The Board noted that Invesco Asset Management Limited manages assets of the Fund, although Invesco Advisers retains overall responsibility for, and provides services to, sub-advised Invesco Funds, including oversight of the Affiliated Sub-Advisers as well as the additional services described herein other than day-to-day portfolio management. The Board also noted that the sub-advisory fees are not paid directly by the Fund, but rather, are payable by Invesco Advisers to the Affiliated Sub-Advisers.
| D. | Economies of Scale and Breakpoints |
The Board considered the extent to which there are economies of scale in the provision of advisory services to the Fund. The Board also considered whether the Fund benefits from economies of scale through contractual breakpoints in the Fund’s advisory fee schedule. The Board also noted that the Fund shares directly in economies of scale through lower fees charged by third party service providers based on the combined size of the Invesco Funds and other clients advised by Invesco Advisers.
| E. | Profitability and Financial Resources |
The Board reviewed information from Invesco Advisers concerning the costs of the advisory and other services that Invesco Advisers and its affiliates provide to the Fund and the Invesco Funds and the profitability of Invesco Advisers and its affiliates in providing these services. The Board received information from Invesco Advisers about the methodology used to prepare the profitability information. The Board noted that Invesco Advisers continues to operate at a net profit from services Invesco Advisers and its affiliates provide to the Invesco Funds. The Board noted that although Invesco Advisers received a minimal amount of revenues from advising the Fund, Invesco Advisers and its subsidiaries did not make a profit from managing the Fund. The Board received and accepted information from Invesco Advisers demonstrating that Invesco Advisers and each Affiliated Sub-Adviser are financially sound and have the resources necessary to perform their obligations under the investment advisory agreement and sub-advisory contracts.
| F. | Collateral Benefits to Invesco Advisers and its Affiliates |
The Board considered various other benefits received by Invesco Advisers and its affiliates from the relationship with the Fund, including the fees received for providing transfer agency
and distribution services to the Fund. The Board considered comparative information regarding fees charged for these services, including information provided by Lipper and other independent sources. The Board considered the performance of Invesco Advisers and its affiliates in providing these services and the organizational structure employed to provide these services. The Board also considered that these services are provided to the Fund pursuant to written contracts that are reviewed and approved on an annual basis by the Board; and that the services are required for the operation of the Fund.
The Board considered the benefits realized by Invesco Advisers and the Affiliated Sub-Advisers as a result of portfolio brokerage transactions executed through “soft dollar” arrangements. Invesco Advisers noted that the Fund does not execute brokerage transactions through “soft dollar” arrangements to any significant degree.
The Board considered that the Fund’s uninvested cash and cash collateral from any securities lending arrangements may be invested in money market funds advised by Invesco Advisers pursuant to procedures approved by the Board. The Board noted that Invesco Advisers receives advisory fees from these affiliated money market funds attributable to such investments, although Invesco Advisers has contractually agreed to waive through varying periods the advisory fees payable by the Invesco Funds with respect to investments in the affiliated money market funds. The waiver is in an amount equal to 100% of the net advisory fee Invesco Advisers receives from the affiliated money market funds with respect to the Fund’s investment in the affiliated money market funds of uninvested cash, but not cash collateral. The Board concluded that the amount of advisory fees received by Invesco Advisors from the Fund’s investment of cash collateral from any securities lending arrangements in the affiliated money market funds is fair and reasonable.
46 Invesco Global Targeted Returns Fund
Tax Information
Form 1099-DIV, Form 1042-S and other year-end tax information provide shareholders with actual calendar year amounts that should be included in their tax returns. Shareholders should consult their tax advisors.
The following distribution information is being provided as required by the Internal Revenue Code or to meet a specific state’s requirement.
The Fund designates the following amounts or, if subsequently determined to be different, the maximum amount allowable for its fiscal year ended October 31, 2015:
| | | | |
Federal and State Income Tax | |
Long-Term Capital Gain Distributions | | $ | 380,474 | |
Qualified Dividend Income* | | | 33.69 | % |
Corporate Dividends Received Deduction* | | | 6.88 | % |
U.S. Treasury Obligations* | | | 0.00 | % |
| | * | The above percentages are based on ordinary income dividends paid to shareholders during the Fund’s fiscal year. |
| | | | |
Non-Resident Alien Shareholders | |
Qualified Short-Term Gains | | $ | 254,782 | |
47 Invesco Global Targeted Returns Fund
Trustees and Officers
The address of each trustee and officer is AIM Investment Funds (Invesco Investment Funds) (the “Trust”), 11 Greenway Plaza, Suite 1000, Houston, Texas 77046-1173. The trustees serve for the life of the Trust, subject to their earlier death, incapacitation, resignation, retirement or removal as more specifically provided in the Trust’s organizational documents. Each officer serves for a one year term or until their successors are elected and qualified. Column two below includes length of time served with predecessor entities, if any.
| | | | | | | | |
Name, Year of Birth and
Position(s) Held with the Trust | | Trustee and/
or Officer Since | | Principal Occupation(s)
During Past 5 Years | | Number of Funds in Fund Complex Overseen by Trustee | | Other Directorship(s) Held by Trustee During Past 5 Years |
| Interested Persons | | | | | | | | |
| Martin L. Flanagan1 — 1960 Trustee | | 2007 | | Executive Director, Chief Executive Officer and President, Invesco Ltd. (ultimate parent of Invesco and a global investment management firm); Advisor to the Board, Invesco Advisers, Inc. (formerly known as Invesco Institutional (N.A.), Inc.); Trustee, The Invesco Funds; Vice Chair, Investment Company Institute; and Member of Executive Board, SMU Cox School of Business Formerly: Chairman and Chief Executive Officer, Invesco Advisers, Inc. (registered investment adviser); Director, Chairman, Chief Executive Officer and President, IVZ Inc. (holding company), INVESCO Group Services, Inc. (service provider) and Invesco North American Holdings, Inc. (holding company); Director, Chief Executive Officer and President, Invesco Holding Company Limited (parent of Invesco and a global investment management firm); Director, Invesco Ltd.; Chairman, Investment Company Institute and President, Co-Chief Executive Officer, Co-President, Chief Operating Officer and Chief Financial Officer, Franklin Resources, Inc. (global investment management organization). | | 145 | | None |
Philip A. Taylor2 — 1954
Trustee, President and Principal Executive Officer | | 2006 | | Head of North American Retail and Senior Managing Director, Invesco Ltd.; Director, Co-Chairman, Co-President and Co-Chief Executive Officer, Invesco Advisers, Inc. (formerly known as Invesco Institutional (N.A.), Inc.) (registered investment adviser); Director, Chairman, Chief Executive Officer and President, Invesco Management Group, Inc. (formerly known as Invesco Aim Management Group, Inc.) (financial services holding company); Director and President, INVESCO Funds Group, Inc. (registered investment adviser and registered transfer agent); Director and Chairman, Invesco Investment Services, Inc. (formerly known as Invesco Aim Investment Services, Inc.) (registered transfer agent) and IVZ Distributors, Inc. (formerly known as INVESCO Distributors, Inc.) (registered broker dealer); Chief Executive Officer, Invesco Corporate Class Inc. (corporate mutual fund company) Director, Chairman and Chief Executive Officer, Invesco Canada Ltd. (formerly known as Invesco Trimark Ltd./Invesco Trimark Ltèe) (registered investment adviser and registered transfer agent); Trustee, President and Principal Executive Officer, The Invesco Funds (other than AIM Treasurer’s Series Trust (Invesco Treasurer’s Series Trust), Short-Term Investments Trust and Invesco Management Trust); Trustee and Executive Vice President, The Invesco Funds (AIM Treasurer’s Series Trust (Invesco Treasurer’s Series Trust), Short-Term Investments Trust and Invesco Management Trust only); Director, Invesco Investment Advisers LLC (formerly known as Van Kampen Asset Management); Director, Chief Executive Officer and President, Van Kampen Exchange Corp. Formerly: Director, President and Chairman, Invesco Inc. (holding company), Invesco Canada Holdings Inc. (holding company), Trimark Investments Ltd./Placements Trimark Ltèe and Invesco Financial Services Ltd/Services Financiers Invesco Ltèe; Chief Executive Officer, Invesco Canada Fund Inc (corporate mutual fund company); Director and Chairman, Van Kampen Investor Services Inc.; Director, Chief Executive Officer and President, 1371 Preferred Inc. (holding company) and Van Kampen Investments Inc.; Director and President, AIM GP Canada Inc. (general partner for limited partnerships) and Van Kampen Advisors, Inc.; Director and Chief Executive Officer, Invesco Trimark Dealer Inc. (registered broker dealer); Director, Invesco Distributors, Inc. (formerly known as Invesco Aim Distributors, Inc.) (registered broker dealer); Manager, Invesco PowerShares Capital Management LLC; Director, Chief Executive Officer and President, Invesco Advisers, Inc.; Director, Chairman, Chief Executive Officer and President, Invesco Aim Capital Management, Inc.; President, Invesco Trimark Dealer Inc. and Invesco Trimark Ltd./Invesco Trimark Ltèe; Director and President, AIM Trimark Corporate Class Inc. and AIM Trimark Canada Fund Inc.; Senior Managing Director, Invesco Holding Company Limited; Director and Chairman, Fund Management Company (former registered broker dealer); President and Principal Executive Officer, The Invesco Funds (AIM Treasurer’s Series Trust (Invesco Treasurer’s Series Trust), and Short-Term Investments Trust only); President, AIM Trimark Global Fund Inc. and AIM Trimark Canada Fund Inc.. | | 145 | | None |
| 1 | Mr. Flanagan is considered an interested person (within the meaning of Section 2(a)(19) of the 1940 Act) of the Trust because he is an officer of the Adviser to the Trust, and an officer and a director of Invesco Ltd., ultimate parent of the Adviser. |
| 2 | Mr. Taylor is considered an interested person (within the meaning of Section 2(a)(19) of the 1940 Act) of the Trust because he is an officer and a director of the Adviser. |
T-1 Invesco Global Targeted Returns Fund
Trustees and Officers—(continued)
| | | | | | | | |
Name, Year of Birth and Position(s) Held with the Trust | | Trustee and/ or Officer Since | | Principal Occupation(s) During Past 5 Years | | Number of Funds in Fund Complex Overseen by Trustee | | Other Directorship(s) Held by Trustee During Past 5 Years |
| Independent Trustees | | | | | | | | |
Bruce L. Crockett — 1944 Trustee and Chair | | 2003 | | Chairman, Crockett Technologies Associates (technology consulting company) Formerly: Director, Captaris (unified messaging provider); Director, President and Chief Executive Officer, COMSAT Corporation; Chairman, Board of Governors of INTELSAT (international communications company); ACE Limited (insurance company); Independent Directors Council and Investment Company Institute | | 145 | | ALPS (Attorneys Liability Protection Society) (insurance company) and Globe Specialty Metals, Inc. (metallurgical company) |
David C. Arch — 1945 Trustee | | 2010 | | Chairman of Blistex Inc., a consumer health care products manufacturer | | 145 | | Board member of the Illinois Manufacturers’ Association; Member of the Board of Visitors, Institute for the Humanities, University of Michigan; Member of the Audit Committee of the Edward-Elmhurst Hospital |
James T. Bunch — 1942 Trustee | | 2000 | | Managing Member, Grumman Hill Group LLC (family office/private equity investments) Formerly: Founder, Green Manning & Bunch Ltd. (investment banking firm) (1988-2010); Executive Committee, United States Golf Association; and Chairman, Board of Governors, Western Golf Association | | 145 | | Chairman of the Board of Trustees, Evans Scholars Foundation; and Chairman of the Board, Denver Film Society |
Rodney F. Dammeyer — 1940 Trustee | | 2010 | | Chairman of CAC, LLC, (private company offering capital investment and management advisory services) Formerly: Prior to 2001, Managing Partner at Equity Group Corporate Investments; Prior to 1995, Chief Executive Officer of Itel Corporation (formerly Anixter International); Prior to 1985, experience includes Senior Vice President and Chief Financial Officer of Household International, Inc., Executive Vice President and Chief Financial Officer of Northwest Industries, Inc. and Partner of Arthur Andersen & Co.; From 1987 to 2010, Director/Trustee of investment companies in the Van Kampen Funds complex | | 145 | | Director of Quidel Corporation and Stericycle, Inc. |
Albert R. Dowden — 1941 Trustee | | 2003 | | Director of a number of public and private business corporations, including the Boss Group, Ltd. (private investment and management); Nature’s Sunshine Products, Inc. and Reich & Tang Funds (5 portfolios) (registered investment company) Formerly: Director, Homeowners of America Holding Corporation/Homeowners of America Insurance Company (property casualty company); Director, Continental Energy Services, LLC (oil and gas pipeline service); Director, CompuDyne Corporation (provider of product and services to the public security market) and Director, Annuity and Life Re (Holdings), Ltd. (reinsurance company); Director, President and Chief Executive Officer, Volvo Group North America, Inc.; Senior Vice President, AB Volvo; Director of various public and private corporations; Chairman, DHJ Media, Inc.; Director, Magellan Insurance Company; and Director, The Hertz Corporation, Genmar Corporation (boat manufacturer), National Media Corporation; Advisory Board of Rotary Power International (designer, manufacturer, and seller of rotary power engines); and Chairman, Cortland Trust, Inc. (registered investment company) | | 145 | | Director of: Nature’s Sunshine Products, Inc., Reich & Tang Funds, Homeowners of America Holding Corporation/ Homeowners of America Insurance Company, the Boss Group |
Jack M. Fields — 1952 Trustee | | 2003 | | Chief Executive Officer, Twenty First Century Group, Inc. (government affairs company); Owner and Chief Executive Officer, Dos Angeles Ranch, L.P. (cattle, hunting, corporate entertainment); and Discovery Global Education Fund (non-profit) Formerly: Chief Executive Officer, Texana Timber LP (sustainable forestry company); Director of Cross Timbers Quail Research Ranch (non-profit); and member of the U.S. House of Representatives | | 145 | | Insperity, Inc. (formerly known as Administaff) |
Prema Mathai-Davis — 1950 Trustee | | 2003 | | Retired. Formerly: Chief Executive Officer, YWCA of the U.S.A. | | 145 | | None |
Larry Soll — 1942 Trustee | | 1997 | | Retired. Formerly: Chairman, Chief Executive Officer and President, Synergen Corp. (a biotechnology company) | | 145 | | None |
Hugo F. Sonnenschein — 1940 Trustee | | 2010 | | President Emeritus and Honorary Trustee of the University of Chicago and the Adam Smith Distinguished Service Professor in the Department of Economics at the University of Chicago. Prior to 2000, President of the University of Chicago | | 145 | | Trustee of the University of Rochester and a member of its investment committee; Member of the National Academy of Sciences and the American Philosophical Society; Fellow of the American Academy of Arts and Sciences |
Raymond Stickel, Jr. — 1944 Trustee | | 2005 | | Retired. Formerly: Director, Mainstay VP Series Funds, Inc. (25 portfolios) and Partner, Deloitte & Touche | | 145 | | None |
T-2 Invesco Global Targeted Returns Fund
Trustees and Officers—(continued)
| | | | | | | | |
Name, Year of Birth and Position(s) Held with the Trust | | Trustee and/ or Officer Since | | Principal Occupation(s) During Past 5 Years | | Number of Funds in Fund Complex Overseen by Trustee | | Other Directorship(s) Held by Trustee During Past 5 Years |
| Independent Trustees—(continued) |
Suzanne H. Woolsey — 1941 Trustee | | 2014 | | Chief Executive Officer of Woolsey Partners LLC | | 145 | | Emeritus Chair of the Board of Trustees of the Institute for Defense Analyses; Trustee of Colorado College; Trustee of California Institute of Technology; Prior to 2014, Director of Fluor Corp.; Prior to 2010, Trustee of the German Marshall Fund of the United States; Prior to 2010 Trustee of the Rocky Mountain Institute |
| Other Officers | | | | | | | | |
Russell C. Burk — 1958
Senior Vice President and Senior Officer | | 2005 | | Senior Vice President and Senior Officer, The Invesco Funds | | N/A | | N/A |
John M. Zerr — 1962
Senior Vice President, Chief Legal Officer and Secretary | | 2006 | | Director, Senior Vice President, Secretary and General Counsel, Invesco Management Group, Inc. (formerly known as Invesco Aim Management Group, Inc.) and Van Kampen Exchange Corp.; Senior Vice President, Invesco Advisers, Inc. (formerly known as Invesco Institutional (N.A.), Inc.) (registered investment adviser); Senior Vice President and Secretary, Invesco Distributors, Inc. (formerly known as Invesco Aim Distributors, Inc.); Director, Vice President and Secretary, Invesco Investment Services, Inc. (formerly known as Invesco Aim Investment Services, Inc.) and IVZ Distributors, Inc. (formerly known as INVESCO Distributors, Inc.); Director and Vice President, INVESCO Funds Group, Inc.; Senior Vice President, Chief Legal Officer and Secretary, The Invesco Funds; Managing Director, Invesco PowerShares Capital Management LLC; Director, Secretary and General Counsel, Invesco Investment Advisers LLC (formerly known as Van Kampen Asset Management); Secretary and General Counsel, Invesco Capital Markets, Inc. (formerly known as Van Kampen Funds Inc.) and Chief Legal Officer, PowerShares Exchange-Traded Fund Trust, PowerShares Exchange-Traded Fund Trust II, PowerShares India Exchange-Traded Fund Trust, PowerShares Actively Managed Exchange-Traded Fund Trust, and PowerShares Actively Managed Exchange-Traded Commodity Fund Trust Formerly: Director and Vice President, Van Kampen Advisors Inc.; Director, Vice President, Secretary and General Counsel, Van Kampen Investor Services Inc.; Director, Invesco Distributors, Inc. (formerly known as Invesco Aim Distributors, Inc.); Director, Senior Vice President, General Counsel and Secretary, Invesco Aim Advisers, Inc. and Van Kampen Investments Inc.; Director, Vice President and Secretary, Fund Management Company; Director, Senior Vice President, Secretary, General Counsel and Vice President, Invesco Aim Capital Management, Inc.; Chief Operating Officer and General Counsel, Liberty Ridge Capital, Inc. (an investment adviser); Vice President and Secretary, PBHG Funds (an investment company) and PBHG Insurance Series Fund (an investment company); Chief Operating Officer, General Counsel and Secretary, Old Mutual Investment Partners (a broker-dealer); General Counsel and Secretary, Old Mutual Fund Services (an administrator) and Old Mutual Shareholder Services (a shareholder servicing center); Executive Vice President, General Counsel and Secretary, Old Mutual Capital, Inc. (an investment adviser); and Vice President and Secretary, Old Mutual Advisors Funds (an investment company) | | N/A | | N/A |
Sheri Morris — 1964
Vice President, Treasurer and Principal Financial Officer | | 2003 | | Vice President, Treasurer and Principal Financial Officer, The Invesco Funds; Vice President, Invesco Advisers, Inc. (formerly known as Invesco Institutional (N.A.), Inc.) (registered investment adviser); and Vice President, PowerShares Exchange-Traded Fund Trust, PowerShares Exchange-Traded Fund Trust II, PowerShares India Exchange-Traded Fund Trust, PowerShares Actively Managed Exchange-Traded Fund Trust, and PowerShares Actively Managed Exchange-Traded Commodity Fund Trust Formerly: Vice President, Invesco Aim Advisers, Inc., Invesco Aim Capital Management, Inc. and Invesco Aim Private Asset Management, Inc.; Assistant Vice President and Assistant Treasurer, The Invesco Funds and Assistant Vice President, Invesco Advisers, Inc., Invesco Aim Capital Management, Inc. and Invesco Aim Private Asset Management, Inc.; and Treasurer, PowerShares Exchange-Traded Fund Trust, PowerShares Exchange-Traded Fund Trust II, PowerShares India Exchange-Traded Fund Trust and PowerShares Actively Managed Exchange-Traded Fund Trust | | N/A | | N/A |
T-3 Invesco Global Targeted Returns Fund
Trustees and Officers—(continued)
| | | | | | | | |
Name, Year of Birth and
Position(s) Held with the Trust | | Trustee and/
or Officer Since | | Principal Occupation(s)
During Past 5 Years | | Number of Funds in Fund Complex Overseen by Trustee | | Other Directorship(s) Held by Trustee During Past 5 Years |
| Other Officers—(continued) | | | | | | | | |
Karen Dunn Kelley — 1960
Vice President | | 2003 | | Senior Managing Director, Investments, Invesco Ltd.; Director, Co-President, Co-Chief Executive Officer, and Co-Chairman, Invesco Advisers, Inc. (formerly known as Invesco Institutional (N.A.), Inc.) (registered investment adviser); Chairman, Invesco Senior Secured Management, Inc.; Senior Vice President, Invesco Management Group, Inc. (formerly known as Invesco Aim Management Group, Inc.); Executive Vice President, Invesco Distributors, Inc. (formerly known as Invesco Aim Distributors, Inc.); Director, Invesco Mortgage Capital Inc. and Invesco Management Company Limited; Vice President, The Invesco Funds (other than AIM Treasurer’s Series Trust (Invesco Treasurer’s Series Trust), Short-Term Investments Trust and Invesco Management Trust); and President and Principal Executive Officer, The Invesco Funds (AIM Treasurer’s Series Trust (Invesco Treasurer’s Series Trust), Short-Term Investments Trust and Invesco Management Trust only) Formerly: Director and President, INVESCO Asset Management (Bermuda) Ltd., Director, INVESCO Global Asset Management Limited and INVESCO Management S.A.; Senior Vice President, Van Kampen Investments Inc. and Invesco Advisers, Inc. (formerly known as Invesco Institutional (N.A.), Inc.) (registered investment adviser); Vice President, Invesco Advisers, Inc. (formerly known as Invesco Institutional (N.A.), Inc.); Director of Cash Management and Senior Vice President, Invesco Advisers, Inc. and Invesco Aim Capital Management, Inc.; Director and President, Fund Management Company; Chief Cash Management Officer, Director of Cash Management, Senior Vice President, and Managing Director, Invesco Aim Capital Management, Inc.; Director of Cash Management, Senior Vice President, and Vice President, Invesco Advisers, Inc. and The Invesco Funds (AIM Treasurer’s Series Trust (Invesco Treasurer’s Series Trust), and Short-Term Investments Trust only) | | N/A | | N/A |
Crissie M. Wisdom — 1969 Anti-Money Laundering Compliance Officer | | 2013 | | Anti-Money Laundering Compliance Officer, Invesco Advisers, Inc. (formerly known as Invesco Institutional (N.A.), Inc.) (registered investment adviser), Invesco Capital Markets, Inc. (formerly known as Van Kampen Funds Inc.), Invesco Distributors, Inc., Invesco Investment Services, Inc., Invesco Management Group, Inc., Van Kampen Exchange Corp., The Invesco Funds, and PowerShares Exchange-Traded Fund Trust, PowerShares Exchange-Traded Fund Trust II, PowerShares India Exchange-Traded Fund Trust, PowerShares Actively Managed Exchange-Traded Fund Trust and PowerShares Actively Managed Exchange-Traded Commodity Fund Trust; Anti-Money Laundering Compliance Officer and Bank Secrecy Act Officer, INVESCO National Trust Company and Invesco Trust Company; and Fraud Prevention Manager and Controls and Risk Analysis Manager for Invesco Investment Services, Inc.. | | N/A | | N/A |
Lisa O. Brinkley — 1959 Chief Compliance Officer | | 2015 | | Senior Vice President and Chief Compliance Officer, Invesco Advisers, Inc. (registered investment adviser) (formerly known as Invesco Institutional (N.A., Inc.); and Chief Compliance Officer, The Invesco Funds Formerly: Global Assurance Officer, Invesco Ltd. and Vice President, The Invesco Funds; Chief Compliance Officer, Invesco Distributors, Inc. (formerly known as Invesco Aim Distributors, Inc.), Invesco Investment Services, Inc.(formerly known as Invesco Aim Investment Services, Inc.) and Van Kampen Investor Services Inc.; Senior Vice President, Invesco Management Group, Inc.; Senior Vice President and Chief Compliance Officer, Invesco Advisers, Inc. and The Invesco Funds; Vice President and Chief Compliance Officer, Invesco Aim Capital Management, Inc. and Invesco Distributors, Inc.; Vice President, Invesco Investment Services, Inc. and Fund Management Company. | | N/A | | N/A |
The Statement of Additional Information of the Trust includes additional information about the Fund’s Trustees and is available upon request, without charge, by calling 1.800.959.4246. Please refer to the Fund’s prospectus for information on the Fund’s sub-advisers.
| | | | | | |
Office of the Fund 11 Greenway Plaza, Suite 1000 Houston, TX 77046-1173 | | Investment Adviser Invesco Advisers, Inc. 1555 Peachtree Street, N.E. Atlanta, GA 30309 | | Distributor
Invesco Distributors, Inc. 11 Greenway Plaza, Suite 1000 Houston, TX 77046-1173 | | Auditors PricewaterhouseCoopers LLP 1000 Louisiana Street, Suite 5800 Houston, TX 77002-5678 |
| | | |
| | | | | | |
Counsel to the Fund Stradley Ronon Stevens & Young, LLP 2005 Market Street, Suite 2600 Philadelphia, PA 19103-7018 | | Counsel to the Independent Trustees Goodwin Procter LLP 901 New York Avenue, N.W. Washington, D.C. 20001 | | Transfer Agent Invesco Investment Services, Inc. 11 Greenway Plaza, Suite 1000 Houston, TX 77046-1173 | | Custodian State Street Bank and Trust Company 225 Franklin Street Boston, MA 02110-2801 |
T-4 Invesco Global Targeted Returns Fund

Invesco mailing information
Send general correspondence to Invesco Investment Services, Inc., P.O. Box 219078, Kansas City, MO 64121-9078.
Important notice regarding delivery of security holder documents
To reduce Fund expenses, only one copy of most shareholder documents may be mailed to shareholders with multiple accounts at the same address (Householding). Mailing of your shareholder documents may be householded indefinitely unless you instruct us otherwise. If you do not want the mailing of these documents to be combined with those for other members of your household, please contact Invesco Investment Services, Inc. at 800 959 4246 or contact your financial institution. We will begin sending you individual copies for each account within 30 days after receiving your request.
Fund holdings and proxy voting information
The Fund provides a complete list of its holdings four times in each fiscal year, at the quarter ends. For the second and fourth quarters, the lists appear in the Fund’s semiannual and annual reports to shareholders. For the first and third quarters, the Fund files the lists with the Securities and Exchange Commission (SEC) on Form N-Q. The most recent list of portfolio holdings is available at invesco.com/completeqtrholdings. Shareholders can also look up the Fund’s Forms N-Q on the SEC website at sec.gov. Copies of the Fund’s Forms N-Q may be reviewed and copied at the SEC Public Reference Room in Washington, D.C. You can obtain information on the operation of the Public Reference Room, including information about duplicating fee charges, by calling 202 551 8090 or 800 732 0330, or by electronic request at the following email address: publicinfo@sec.gov. The SEC file numbers for the Fund are shown below.
A description of the policies and procedures that the Fund uses to determine how to vote proxies relating to portfolio securities is available without charge, upon request, from our Client Services department at 800 959 4246 or at invesco.com/proxyguidelines. The information is also available on the SEC website, sec.gov.
| | |
Information regarding how the Fund voted proxies related to its portfolio securities during the most recent 12-month period ended June 30 is available at invesco.com/proxysearch. The information is also available on the SEC website, sec.gov. Invesco Advisers, Inc. is an investment adviser; it provides investment advisory services to individual and institutional clients and does not sell securities. Invesco Distributors, Inc. is the US distributor for Invesco Ltd.’s retail mutual funds, exchange-traded funds and institutional money market funds. Both are wholly owned, indirect subsidiaries of Invesco Ltd. | |  |
| | | | |
| SEC file numbers: 811-05426 and 033-19338 | | GTR-AR-1 | | Invesco Distributors, Inc. |
| | | | |
| | |
 | | Annual Report to Shareholders | | October 31, 2015 |
| | |
| | Invesco International Total Return Fund |
| | Nasdaq: |
| | A: AUBAX n B: AUBBX n C: AUBCX n Y: AUBYX n R5: AUBIX n R6: AUBFX |

Letters to Shareholders
| | |

Philip Taylor | | Dear Shareholders: This annual report includes information about your Fund, including performance data and a complete list of its investments as of the close of the reporting period. Inside is a discussion of how your Fund was managed and the factors that affected its performance during the reporting period. I hope you find this report of interest. The US economy expanded and unemployment declined throughout the reporting period. Continuing low energy prices benefited consumers, but a strong US dollar crimped corporate profits. The US Federal Reserve signaled that it was increasingly likely to raise interest rates, based on generally positive economic data, but uncertainty remained about when it might act. Overseas, the story was much different. Low energy prices hurt the economies of some oil-producing nations, such as Brazil and Russia. During the reporting period, the European Central |
Bank as well as central banks in China and Japan – among other countries – either instituted or maintained extraordinarily accommodative monetary policies in response to economic weakness. Investor uncertainty, such as we saw for much of the reporting period – and market volatility, such as we saw at the end of the reporting period – are unfortunate facts of life when it comes to investing. Some investors use these things as excuses to delay saving and investing for their long-term financial goals. That’s why Invesco encourages investors to work with a professional financial adviser who can stress the importance of starting to save and invest early and the importance of adhering to a disciplined investment plan – when times are good and when they’re uncertain. A financial adviser who knows your unique financial situation, investment goals and risk tolerance can be an invaluable partner as you seek to achieve your financial goals. He or she can offer a long-term perspective when markets are volatile and time-tested advice and guidance when your financial situation or investment goals change. |
Timely information when and where you want it
Invesco’s efforts to help investors achieve their financial objectives include providing individual investors and financial professionals with timely information about the markets, the economy and investing – whenever and wherever they want it.
Our website, invesco.com/us, offers a wide range of market insights and investment perspectives. On the website, you’ll find detailed information about our funds, including prices, performance, holdings and portfolio manager commentaries. You can access information about your account by completing a simple, secure online registration. Click on the “Need to register” link in the “Account Access” box on our homepage to get started.
Invesco’s mobile apps for iPhone® and iPad® (both available free from the App StoreSM) allow you to obtain the same detailed information, monitor your account and create customizable watch lists. Also, they allow you to access investment insights from our investment leaders, market strategists, economists and retirement experts. You can sign up to be alerted when new commentary is added, and you can watch portfolio manager videos and have instant access to Invesco news and updates wherever you may be.
In addition to the resources accessible on our website and through our mobile app, you can obtain timely updates to help you stay informed about the markets, the economy and investing by connecting with Invesco on Twitter, LinkedIn or Facebook. You can access our blog at blog.invesco.us.com. Our goal is to provide you the information you want, when and where you want it.
Have questions?
For questions about your account, feel free to contact an Invesco client services representative at 800 959 4246. For Invesco-related questions or comments, please email me directly at phil@invesco.com.
All of us at Invesco look forward to serving your investment management needs for many years to come. Thank you for investing with us.
Sincerely,

Philip Taylor
Senior Managing Director, Invesco Ltd.
iPhone and iPad are trademarks of Apple Inc., registered in the US and other countries. App Store is a service mark of Apple Inc. Invesco Distributors, Inc. is not affiliated with Apple Inc.
2 Invesco International Total Return Fund
| | |

Bruce Crockett | | Dear Fellow Shareholders: Among the many important lessons I’ve learned in more than 40 years in a variety of business endeavors is the value of a trusted advocate. As independent chair of the Invesco Funds Board, I can assure you that the members of the Board are strong advocates for the interests of investors in Invesco’s mutual funds. We work hard to represent your interests through oversight of the quality of the investment management services your funds receive and other matters important to your investment, including but not limited to: n Ensuring that Invesco offers a diverse lineup of mutual funds that your financial adviser can use to strive to meet your financial needs as your investment goals change over time. n Monitoring how the portfolio management teams of the Invesco funds are performing in light of changing economic and market conditions. |
| | n | | Assessing each portfolio management team’s investment performance within the context of the investment strategy described in the fund’s prospectus. |
| | n | | Monitoring for potential conflicts of interests that may impact the nature of the services that your funds receive. |
We believe one of the most important services we provide our fund shareholders is the annual review of the funds’ advisory and sub-advisory contracts with Invesco Advisers and its affiliates. This review is required by the Investment Company Act of 1940 and focuses on the nature and quality of the services Invesco provides as the adviser to the Invesco funds and the reasonableness of the fees that it charges for those services. Each year, we spend months carefully reviewing information received from Invesco and a variety of independent sources, such as performance and fee data prepared by Lipper Inc., an independent, third-party firm widely recognized as a leader in its field. We also meet with our independent legal counsel and other independent advisers to review and help us assess the information that we have received. Our goal is to assure that you receive quality investment management services for a reasonable fee.
I trust the measures outlined above provide assurance that you have a worthy advocate when it comes to choosing the Invesco Funds.
As always, please contact me at bruce@brucecrockett.com with any questions or concerns you may have. On behalf of the Board, we look forward to continuing to represent your interests and serving your needs.
Sincerely,

Bruce L. Crockett
Independent Chair
Invesco Funds Board of Trustees
3 Invesco International Total Return Fund
Management’s Discussion of Fund Performance
Performance summary
For the fiscal year ended October 31, 2015, Class A shares of Invesco International Total Return Fund (the Fund), at net asset value (NAV), outperformed the Barclays Global Aggregate ex-U.S. Index, the Fund’s broad market/style-specific benchmark.
Your Fund’s long-term performance appears later in this report.
Fund vs. Indexes
Total returns, 10/31/14 to 10/31/15, at net asset value (NAV). Performance shown does not include applicable contingent deferred sales charges (CDSC) or front-end sales charges, which would have reduced performance.
| | | | | |
Class A Shares | | | | -5.38 | % |
Class B Shares | | | | -6.19 | |
Class C Shares | | | | -6.10 | |
Class Y Shares | | | | -5.23 | |
Class R5 Shares | | | | -5.23 | |
Class R6 Shares | | | | -5.14 | |
| Barclays Global Aggregate ex-U.S. Index▼ (Broad Market/Style-Specific Index) | | | | -6.74 | |
| Lipper International Income Funds Index¢ (Peer Group Index) | | | | -4.88 | |
| |
| Source(s): ▼FactSet Research Systems Inc.; ¢Lipper Inc. | | | | | |
Market conditions and your Fund
Global divergence with respect to growth, inflation and economic policy dominated global bond markets during the fiscal year ended October 31, 2015. Moderate growth in the US and UK led to the beginnings of tighter monetary policy, starting with the end of the US Federal Reserve’s (the Fed) quantitative easing (QE) program in addition to speculation on whether both regions’ central banks would lift short-term interest rates for the first time since before the onset of the 2007-2011 financial crisis. In the rest of the world, particularly in the eurozone and Asia, slowing growth and deflationary trends kept economic policies accommodative in an effort to foster growth. Tepid global growth, together with deflationary concerns, weighed on long-term interest rates and supported government bond prices. Even in the US and UK, a bias toward central bank tightening had the effect of only flattening yield curves,
with short-term government yields rising, while long-dated yields declined, weighed down by slower growth and strong investor demand for high quality yields that both countries offered.
Though developed market yields broadly declined, the fiscal year was marked by considerable interest rate volatility. The fiscal year began on the back of a US bond market rally as slowing global growth and lower inflation helped to push US Treasury yields lower and subsequently, bond prices higher. The downward-trend accelerated through the end of 2014 as oil prices hit lows not seen since the height of the financial crisis and as global deflationary fears began to set in. As quickly as US Treasury yields declined in 2014, they snapped back even faster during the first half of 2015. Helping to drive developed market interest rates higher following the implementation of the European Central Bank’s (ECB) version of the Fed’s QE program (commitment by the ECB to purchase longer-
dated euro-area fixed income instruments in an effort to lower long-term interest rates to help spur economic growth) was stronger-than-expected economic data and market players’ notions that the rally was overdone. Also supporting higher US interest rates was the end of the Fed’s QE program purchasing long-dated Treasury bonds, coupled with supportive US economic data in the form of stronger economic growth and employment. The volatility within global interest rate markets ensued as the reporting period drew to a close with concerns over Chinese economic growth, in addition to broader market volatility helping drive global interest rates back down. Ten-year US Treasury yields ended 20 basis points lower at 2.14%, having begun the fiscal year at 2.34%.1 A basis point is one one-hundredth of a percentage point.
Within global credit markets, the investment-grade corporate credit, high yield and emerging market debt sectors were weighed down by slower global growth, increased risk aversion stemming from broader financial market volatility, and credit markets’ fundamental relationship to oil – the price of which declined significantly during the reporting period. Credit spreads across these sectors widened relative to their respective government counterparts, while valuations weakened. Falling oil prices brought into question the credit quality and even the long-term solvency of many high yield issuers, while bonds of oil-producing emerging market countries also experienced market stress. As the reporting period drew to a close, global equity market volatility stemming from concerns over China’s economic slowdown sent credit market spreads and yields to their highest levels since 2012, creating investing opportunities in some segments of the credit markets.
| | | | | | |
| Portfolio Composition | |
By sector | | | % of total net assets | |
| | | | |
Sovereign Debt | | | 50.4 | % |
| Financials | | | 18.1 | |
| Collateralized Mortgage Obligations | | | 5.2 | |
| Materials | | | 5.0 | |
| Energy | | | 3.4 | |
| Industrials | | | 3.2 | |
| Utilities | | | 2.0 | |
| Consumer Staples | | | 1.5 | |
Other Sectors, Each Less
than 2% | | | 3.8 | |
Money Market Funds
Plus Other Assets Less Liabilities | | | 7.4 | |
| | | | |
| Top 10 Debt Issuers* |
| | % of total net assets |
| | | | | | |
1. | | Italy Buoni Poliennali Del Tesoro | | | 10.5 | % |
2. | | Poland Government International Bond | | | 6.3 | |
3. | | Government of Japan Forty Year Bond | | | 5.1 | |
4. | | Spain Government Bond | | | 4.7 | |
5. | | Province of Ontario Canada | | | 4.4 | |
6. | | Australia Government Bond | | | 4.3 | |
7. | | Mexican Bonos | | | 2.9 | |
8. | | Asian Development Bank | | | 2.5 | |
9. | | Korea Treasury Bond | | | 2.2 | |
10. | | United Kingdom Gilt | | | 2.2 | |
| | | | | |
Total Net Assets | | | | $53.5 million | |
| |
| Total Number of Holdings* | | | | 93 | |
The Fund’s holdings are subject to change, and there is no assurance that the Fund will continue to hold any particular security.
*Excluding money market fund holdings.
Data presented here are as of October 31, 2015.
|
| 4 Invesco International Total Return Fund |
The Fund’s total return was negative for the reporting period in absolute terms, but it outperformed its broad market/style-specific benchmark. The Fund maintained a lower-than-market exposure in order to minimize losses. The Fund maximized its exposure to the US dollar, in line with our top-down view that the dollar would strengthen and US assets would outperform. A relative value assessment of global bond markets led to overweight exposure in European bond markets, which was a significant contributor to performance as the ECB embarked on a policy of QE thereby supporting the values of European debt. Specifically, the allocation to European corporate debt also benefited from the ECB’s monetary policy shift, as did security selection in below-investment grade issues.
The Fund used active duration and yield curve positioning for risk management and for generating alpha versus its broad market/style-specific index. Alpha is a measure of performance on a risk-adjusted basis. Duration measures a portfolio’s price sensitivity to interest rate changes. Yield curve positioning refers to actively emphasizing points (maturities) along the yield curve with favorable risk/return expectations. Duration and yield curve positioning across the various global yield curves contributed to relative Fund performance versus the Fund’s broad market/style-specific index. Country allocations to Italy, Spain, Ireland and Portugal also contributed to relative Fund performance. The Fund had an overweight allocation in US Treasuries and German bunds relative to its broad market/style-specific index. Duration was managed with cash bonds and futures positions. Buying and selling interest rate futures contracts across multiple global yield curves was an important tool we used to manage interest rate risk and maintain our targeted portfolio duration. Volatility in the summer hurt relative Fund returns somewhat as our off-benchmark exposure to sub-investment grade debt detracted from Fund returns.
An increased allocation to US dollar corporate debt was a positive contributor towards the end of the reporting period. Volatility in emerging market assets, in particular, provided an opportunity to increase risk in credit markets, benefiting relative Fund returns by the end of the reporting period.
Our allocation to the US dollar was the most significant driver of Fund outperformance. Our selection was broadly diversified, but focused on underweight positions in commodity currencies, Asian bloc currencies such as the Singapore dollar and the euro. Towards the end of the reporting period, we increased our exposure in emerging market currencies, which slightly detracted from Fund performance.
Please note we implemented our strategy using derivative instruments, including futures, forwards, swaps and options. Therefore, a portion of the performance of the strategy, both positive and negative, can be attributed to these instruments. Derivatives can be a cost-effective way to gain or hedge exposure to certain risks. However, derivatives may amplify traditional investment risks through the creation of leverage and may be less liquid than traditional securities.
Thank you for your commitment to Invesco International Total Return Fund.
The views and opinions expressed in management’s discussion of Fund performance are those of Invesco Advisers, Inc. These views and opinions are subject to change at any time based on factors such as market and economic conditions. These views and opinions may not be relied upon as investment advice or recommendations, or as an offer for a particular security. The information is not a complete analysis of every aspect of any market, country, industry, security or the Fund. Statements of fact are from sources considered reliable, but Invesco Advisers, Inc. makes no representation or warranty as to their completeness or accuracy. Although historical performance is no guarantee of future results, these insights may help you understand our investment management philosophy.
See important Fund and, if applicable, index disclosures later in this report.
| | |
 | | Avi Hooper Chartered Financial Analyst, Portfolio Manager, is lead manager of Invesco International Total |
| Return Fund. He joined Invesco in 2010. Mr. Hooper earned a BAS with a focus in accounting and finance from York University. |
| | |
 | | Mark Nash Chartered Financial Analyst, Portfolio Manager, is manager of Invesco International Total |
| Return Fund. He joined Invesco in 2001. Mr. Nash earned a BS in chemistry and an MPhi in materials engineering from The University of Nottingham. |
| | |
 | | Raymond Uy Chartered Financial Analyst, Portfolio Manager and Head of Currencies for Invesco Fixed Income, is |
| manager of Invesco International Total Return Fund. He joined Invesco in 2012. Mr. Uy earned a BBA from Hofstra University. |
| | |
 | | Robert Waldner Chartered Financial Analyst, Portfolio Manager, is manager of Invesco International Total |
| Return Fund. He joined Invesco in 2013. Mr. Waldner earned a BSE degree in civil engineering from Princeton University. |
|
| 5 Invesco International Total Return Fund |
Your Fund’s Long-Term Performance
Results of a $10,000 Investment – Oldest Share Class(es) since Inception
Fund and index data from 3/31/06
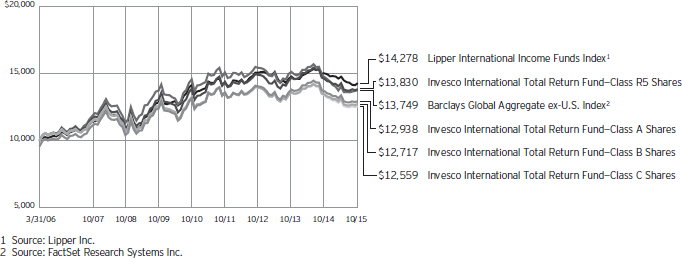
Past performance cannot guarantee comparable future results.
The data shown in the chart include reinvested distributions, applicable sales charges and Fund expenses including management fees. Results for Class B shares are calculated as if a hypothetical shareholder had liquidated his entire investment in the Fund at the close of the reporting period and paid the contingent deferred sales charges, if applicable. Index results include reinvested dividends, but they do not reflect sales charges. Performance of the peer group, if applicable, reflects fund expenses and management fees; performance of a market index does not. Performance shown in the chart and table(s) does not reflect deduction of taxes a shareholder would pay on Fund distributions or sale of Fund shares.
|
| 6 Invesco International Total Return Fund |
| | | | | |
Average Annual Total Returns As of 10/31/15, including maximum applicable
sales charges |
| |
| Class A Shares | | | | | |
| Inception (3/31/06) | | | | 2.72 | % |
| 5 Years | | | | -1.16 | |
| 1 Year | | | | -9.38 | |
| |
| Class B Shares | | | | | |
| Inception (3/31/06) | | | | 2.54 | % |
| 5 Years | | | | -1.38 | |
| 1 Year | | | | -10.80 | |
| |
| Class C Shares | | | | | |
| Inception (3/31/06) | | | | 2.41 | % |
| 5 Years | | | | -1.05 | |
| 1 Year | | | | -7.02 | |
| |
| Class Y Shares | | | | | |
| Inception | | | | 3.36 | % |
| 5 Years | | | | -0.06 | |
| 1 Year | | | | -5.23 | |
| |
| Class R5 Shares | | | | | |
| Inception (3/31/06) | | | | 3.44 | % |
| 5 Years | | | | -0.05 | |
| 1 Year | | | | -5.23 | |
| |
| Class R6 Shares | | | | | |
| Inception | | | | 3.27 | % |
| 5 Years | | | | -0.15 | |
| 1 Year | | | | -5.14 | |
Class Y shares incepted on October 3, 2008. Performance shown prior to that date is that of Class A shares and includes the 12b-1 fees applicable to Class A shares.
Class R6 shares incepted on September 24, 2012. Performance shown prior to that date is that of Class A shares and includes the 12b-1 fees applicable to Class A shares.
The performance data quoted represent past performance and cannot guarantee comparable future results; current performance may be lower or higher. Please visit invesco.com/performance for the most recent month-end performance. Performance figures reflect reinvested distributions, changes in net asset value and the effect of the maximum sales charge unless otherwise stated. Investment return and principal value will fluctuate so that you may have a gain or loss when you sell shares.
The net annual Fund operating expense ratio set forth in the most recent Fund prospectus as of the date of this report for Class A, Class B, Class C, Class Y, Class R5 and Class R6 shares was 1.10%, 1.85%, 1.85%,
| | | | | |
| Average Annual Total Returns As of 9/30/15, the most recent calendar quarter
end, including maximum applicable sales charges |
| |
| Class A Shares | | | | | |
| Inception (3/31/06) | | | | 2.69 | % |
| 5 Years | | | | -0.87 | |
| 1 Year | | | | -10.41 | |
| |
| Class B Shares | | | | | |
| Inception (3/31/06) | | | | 2.51 | % |
| 5 Years | | | | -1.09 | |
| 1 Year | | | | -11.82 | |
| |
| Class C Shares | | | | | |
| Inception (3/31/06) | | | | 2.38 | % |
| 5 Years | | | | -0.75 | |
| 1 Year | | | | -8.09 | |
| |
| Class Y Shares | | | | | |
| Inception | | | | 3.34 | % |
| 5 Years | | | | 0.24 | |
| 1 Year | | | | -6.33 | |
| |
| Class R5 Shares | | | | | |
| Inception (3/31/06) | | | | 3.42 | % |
| 5 Years | | | | 0.24 | |
| 1 Year | | | | -6.33 | |
| |
| Class R6 Shares | | | | | |
| Inception | | | | 3.24 | % |
| 5 Years | | | | 0.14 | |
| 1 Year | | | | -6.24 | |
0.85%, 0.85% and 0.85%, respectively.1 The total annual Fund operating expense ratio set forth in the most recent Fund prospectus as of the date of this report for Class A, Class B, Class C, Class Y, Class R5 and Class R6 shares was 1.68%, 2.43%, 2.43%, 1.43%, 1.15% and 1.14%, respectively. The expense ratios presented above may vary from the expense ratios presented in other sections of this report that are based on expenses incurred during the period covered by this report.
Class A share performance reflects the maximum 4.25% sales charge, and Class B and Class C share performance reflects the applicable contingent deferred sales charge (CDSC) for the period involved. The CDSC on Class B shares declines from 5% beginning at the time of purchase to 0% at the beginning of the seventh year. The CDSC on Class C shares is 1% for the first year after purchase. Class Y, Class R5 and Class R6 shares do not have a front-end sales charge or a CDSC; therefore, performance is at net asset value.
The performance of the Fund’s share classes will differ primarily due to different sales charge structures and class expenses.
Fund performance reflects any applicable fee waivers and/or expense reimbursements. Had the adviser not waived fees and/or reimbursed expenses currently or in the past, returns would have been lower. See current prospectus for more information.
| 1 | Total annual Fund operating expenses after any contractual fee waivers and/or expense reimbursements by the adviser in effect through at least February 28, 2017. See current prospectus for more information. |
|
| 7 Invesco International Total Return Fund |
Invesco International Total Return Fund’s investment objective is total return, comprised of current income and capital appreciation.
| n | | Unless otherwise stated, information presented in this report is as of October 31, 2015, and is based on total net assets. |
| n | | Unless otherwise noted, all data provided by Invesco. |
| n | | To access your Fund’s reports/prospectus, visit invesco.com/fundreports. |
About share classes
| n | | Class B shares may not be purchased for new or additional investments. Please see the prospectus for more information. |
| n | | Class Y shares are available to only certain investors. Please see the prospectus for more information. |
| n | | Class R5 shares and Class R6 shares are primarily intended for employer sponsored retirement and benefit plans that meet certain standards and for institutional investors. Please see the prospectus for more information. |
Principal risks of investing
in the Fund
| n | | Active trading risk. The Fund engages in frequent trading of portfolio securities. Active trading results in added expenses and may result in a lower return and increased tax liability. |
| n | | Call risk. If interest rates fall, it is possible that issuers of debt securities with high interest rates will prepay or call their securities before their maturity dates. In this event, the proceeds from the called securities would likely be reinvested by the Fund in securities bearing the new, lower interest rates, resulting in a possible decline in the Fund’s income and distributions to shareholders. |
| n | | Changing fixed income market conditions risk. The current low interest rate environment was created in part by the Federal Reserve Board (FRB) and certain foreign central banks keeping the federal funds and equivalent foreign rates at or near zero. There is a risk that interest rates will rise when the FRB and central banks raise these rates. This risk is heightened due to the FRB’s quantitative easing program and the “tapering” of other similar foreign central bank actions. This eventual increase in the federal funds and equivalent foreign rates may expose fixed income markets to heightened volatility and reduced liquidity for certain fixed income investments, particularly those with longer maturities. In addition, decreases in fixed income dealer market-making capacity may also potentially lead to heightened |
volatility and reduced liquidity in the fixed income markets. As a result, the value of the Fund’s investments and share price may decline. Changes in central bank policies could also result in higher than normal shareholder redemptions,
which could potentially increase
portfolio turnover and the Fund’s transaction costs.
| n | | Collateralized loan obligations risk. In addition to the normal interest rate, default and other risks of fixed income securities, collateralized loan obligations carry additional risks, including the possibility that distributions from collateral securities will not be adequate to make interest or other payments, the quality of the collateral may decline in value or default, the Fund may invest in collateralized loan obligations that are subordinate to other classes, values may be volatile, and disputes with the issuer may produce unexpected investment results. |
| n | | Credit risk. The issuer of instruments in which the Fund invests may be unable to meet interest and/or principal payments, thereby causing its instruments to decrease in value and lowering the issuer’s credit rating. |
| n | | Currency/exchange rate risk. The dollar value of the Fund’s foreign investments will be affected by changes in the exchange rates between the dollar and the currencies in which those investments are traded. |
| n | | Derivatives risk. The value of a derivative instrument depends largely on (and is derived from) the value of an underlying security, currency, commodity, interest rate, index or other asset (each referred to as an underlying asset). In addition to risks relating to the underlying assets, the use of derivatives may include other, possibly greater, risks, including counterparty, leverage and liquidity risks. Counterparty risk is the risk that the counterparty to the derivative contract will default on its obligation to pay the Fund the amount owed or otherwise perform under the derivative contract. Derivatives create leverage risk |
because they do not require payment up front equal to the economic exposure created by owning the derivative. As a result, an adverse change in the value of the underlying asset could result in the Fund sustaining a loss that is substantially greater than the amount invested in the derivative, which may make the Fund’s returns more volatile and increase the risk of loss. Derivative instruments may also be less liquid than more traditional investments and the Fund may be unable to sell or close out its derivative positions at a desirable time or price. This risk may be more acute under adverse market conditions, during which the Fund may be most in need of liquidating its derivative positions. Derivatives may also be harder to value, less tax efficient and subject to changing government regulation that could impact the Fund’s ability to use certain derivatives or their cost. Also, derivatives used for hedging or to gain or limit exposure to a particular market segment may not provide the expected benefits, particularly during adverse market conditions.
| n | | Developing/emerging markets securities risk. The prices of securities issued by foreign companies and governments located in developing/emerging markets countries may be affected more negatively by inflation, devaluation of their currencies, higher transaction costs, delays in settlement, adverse political developments, the introduction of capital controls, withholding taxes, nationalization of private assets, expropriation, social unrest, war or lack of timely information than those in developed countries. |
| n | | Foreign currency tax risk. If the U.S. Treasury Department were to exercise its authority to issue regulations that exclude from the definition of “qualifying income” foreign currency gains not directly related to the Fund’s business of investing in securities (which it has not done since such authority was granted to it in 1986, but has the right to do at any time), the Fund may be unable to qualify as a regulated investment company for one or more years. |
|
This report must be accompanied or preceded by a currently effective Fund prospectus, which contains more complete information, including sales charges and expenses. Investors should read it carefully before investing. |
|
|
| NOT FDIC INSURED | MAY LOSE VALUE | NO BANK GUARANTEE |
|
| 8 Invesco International Total Return Fund |
In this event, the Fund’s Board of Trustees may authorize a significant change in investment strategy or other action.
| n | | Foreign securities risk. The Fund’s foreign investments may be affected by changes in a foreign country’s exchange rates, political and social instability, changes in economic or taxation policies, difficulties when enforcing obligations, decreased liquidity, and increased volatility. Foreign companies may be subject to less regulation resulting in less publicly available information about the companies. |
| n | | High yield bond (junk bond) risk. High yield bonds (commonly referred to as junk bonds) involve a greater risk of default or price changes due to changes in the credit quality of the issuer. The values of junk bonds fluctuate more than those of high- quality bonds in response to company, political, regulatory or economic developments. Values of junk bonds can decline significantly over short periods of time. |
| n | | Interest rate risk. Interest rate risk refers to the risk that bond prices generally fall as interest rates rise; conversely, bond prices generally rise as interest rates fall. Specific bonds differ in their sensitivity to changes in interest rates depending on their individual characteristics, including duration. |
| n | | Liquidity risk. The Fund may hold illiquid securities that it is unable to sell at the preferred time or price and could lose its entire investment in such securities. |
| n | | Management risk. The investment techniques and risk analysis used by the Fund’s portfolio managers may not produce the desired results. |
| n | | Market risk. The prices of and the income generated by the Fund’s securities may decline in response to, among other things, investor sentiment, general economic and market conditions, regional or global instability, and currency and interest rate fluctuations. |
| n | | Mortgage- and asset-backed securities risk. The Fund may invest in mortgage- and asset-backed securities that are subject to prepayment or call risk, which is the risk that the borrower’s payments may be received earlier or later than expected due to changes in prepayment rates on underlying loans. Faster prepayments often happen when interest |
rates are falling. As a result, the Fund may reinvest these early payments at lower interest rates, thereby reducing the Fund’s income. Conversely, when interest rates rise, prepayments may happen more slowly, causing the security to lengthen in duration. Longer duration securities tend to be more volatile. Securities may be prepaid at a price less than the original purchase value. An unexpectedly high rate of defaults on the mortgages held by a mortgage pool may adversely affect the value of mortgage-backed securities and could result in losses to the Fund. The risk of such defaults is generally higher in the case of mortgage pools that include subprime mortgages. Subprime mortgages refer to loans made to borrowers with weakened credit histories or with lower capacity to make timely payments on their mortgages.
| n | | Sovereign debt risk. Investments in foreign sovereign debt obligations involve certain risks in addition to those relating to foreign securities or debt securities generally. The issuer of the debt or the governmental authorities that control the repayment of the debt may be unable or unwilling to repay principal or interest when due in accordance with the terms of such debt, and the Fund may have limited recourse in the event of a default against the defaulting government. Without the approval of debt holders, some governmental debtors have in the past been able to reschedule or restructure their debt payments or declare moratoria on payments. |
| n | | When-issued and delayed delivery risks. When-issued and delayed delivery transactions are subject to market risk as the value or yield of a security at delivery may be more or less than the purchase price or the yield generally available on securities when delivery occurs. In addition, the Fund is subject to counterparty risk because it relies on the buyer or seller, as the case may be, to consummate the transaction, and failure by the other party to complete the transaction may result in the Fund missing the opportunity of obtaining a price or yield considered to be advantageous. |
| n | | Zero coupon or pay-in-kind securities risk. The value, interest rates, and liquidity of non-cash paying instruments, such as zero coupon and pay-in-kind securities, |
are subject to greater fluctuation than other types of securities. The higher yields and interest rates on pay-in-kind securities reflect the payment deferral and increased credit risk associated with such instruments and that such investments may represent a higher credit risk than coupon loans. Pay-in-kind securities may have a potential variability in valuations because their continuing accruals require continuing judgments about the collectability of the deferred payments and the value of any associated collateral.
About indexes used in this report
| n | | The Barclays Global Aggregate ex-U.S. Index is an unmanaged index considered representative of bonds of foreign countries. |
| n | | The Lipper Emerging Markets Debt Funds Index is an unmanaged index considered representative of international income funds tracked by Lipper. |
| n | | The Fund is not managed to track the performance of any particular index, including the index(es) described here, and consequently, the performance of the Fund may deviate significantly from the performance of the index(es). |
| n | | A direct investment cannot be made in an index. Unless otherwise indicated, index results include reinvested dividends, and they do not reflect sales charges. Performance of the peer group, if applicable, reflects fund expenses; performance of a market index does not. |
Other information
| n | | The returns shown in management’s discussion of Fund performance are based on net asset values (NAVs) calculated for shareholder transactions. Generally accepted accounting principles require adjustments to be made to the net assets of the Fund at period end for financial reporting purposes, and as such, the NAVs for shareholder transactions and the returns based on those NAVs may differ from the NAVs and returns reported in the Financial Highlights. |
| n | | Industry classifications used in this report are generally according to the Global Industry Classification Standard, which was developed by and is the exclusive property and a service mark of MSCI Inc. and Standard & Poor’s. |
9 Invesco International Total Return Fund
Schedule of Investments
October 31, 2015
| | | | | | | | |
| | | Principal
Amount | | | Value | |
Non U.S. Dollar Denominated Bonds & Notes–66.19%(a) | |
| Australia–4.31% | | | | | | | | |
Australia Government Bond, Sr. Unsec. Bonds, 3.75%, 04/21/37(b) | | AUD | 3,000,000 | | | $ | 2,303,832 | |
| |
| Austria–0.88% | | | | | |
OMV AG, Jr. Unsec. Sub. Euro Bonds, 6.75%(c) | | EUR | 400,000 | | | | 469,220 | |
| |
| Belgium–0.59% | | | | | |
Anheuser-Busch InBev SA/NV, Sr. Unsec. Gtd. Medium-Term Euro Notes, 4.00%, 09/24/25 | | GBP | 200,000 | | | | 315,486 | |
| |
| Canada–4.38% | | | | | |
Province of Ontario Canada, Unsec. Bonds, 3.45%, 06/02/45 | | CAD | 3,000,000 | | | | 2,339,080 | |
| |
| Cyprus–0.64% | | | | | |
Cyprus Government International Bond, REGS, Unsec. Medium-Term Euro Notes, 3.88%, 05/06/22(b) | | EUR | 300,000 | | | | 340,955 | |
| |
| Denmark–0.50% | | | | | |
Danske Bank A/S, Jr. Unsec. Sub. Medium-Term Euro Notes, 5.68%(c) | | GBP | 170,000 | | | | 266,693 | |
| |
| France–0.42% | | | | | |
Electricite de France S.A., Jr. Unsec. Sub. Medium-Term Euro Notes, 4.13%(c) | | EUR | 200,000 | | | | 222,856 | |
| |
| Germany–2.91% | | | | | |
EnBW Energie Baden-Wuerttemberg AG, Jr. Unsec. Sub. Medium-Term Euro Notes, 7.38%, 04/02/72 | | EUR | 120,000 | | | | 141,022 | |
HeidelbergCement Finance Luxembourg S.A., Sr. Unsec. Gtd. Medium-Term Euro Notes, 3.25%, 10/21/21 | | EUR | 100,000 | | | | 116,325 | |
Kreditanstalt fur Wiederaufbau, Sr. Unsec. Gtd. Global Notes, 2.05%, 02/16/26 | | JPY | 100,000,000 | | | | 988,647 | |
RWE AG, Jr. Unsec. Sub. Euro Notes, 7.00%(c) | | GBP | 200,000 | | | | 310,389 | |
| | | | | | | | 1,556,383 | |
| | |
| Ireland–1.61% | | | | | | | | |
Ireland Government Bond, Unsec. Euro Bonds, 2.00%, 02/18/45 | | EUR | 800,000 | | | | 859,917 | |
| | | | | | | | |
| | | Principal
Amount | | | Value | |
| Italy–10.53% | | | | | |
Italy Buoni Poliennali Del Tesoro, | | | | | | | | |
Sr. Unsec. Euro Bonds, | | | | | | | | |
5.00%, 03/01/25(b) | | EUR | 3,045,000 | | | $ | 4,372,601 | |
REGS, Sr. Unsec. Euro Bonds, | | | | | | | | |
3.25%, 09/01/46(b) | | EUR | 1,000,000 | | | | 1,258,305 | |
| | | | | | | | 5,630,906 | |
| |
| Japan–5.07% | | | | | |
Government of Japan Forty Year Bond, | | | | | | | | |
Series 7, Sr. Unsec. Bonds, | | | | | | | | |
1.70%, 03/20/54 | | JPY | 50,000,000 | | | | 443,435 | |
Series 8, Sr. Unsec. Bonds, | | | | | | | | |
1.40%, 03/20/55 | | JPY | 280,000,000 | | | | 2,268,954 | |
| | | | | | | | 2,712,389 | |
| |
| Mexico–2.93% | | | | | |
Mexican Bonos, Series M, Sr. Unsec. Bonds, 7.75%, 11/13/42 | | MXN | 23,000,000 | | | | 1,565,954 | |
| | |
| Netherlands–4.35% | | | | | | | | |
Achmea B.V., Jr. Unsec. Sub. Medium-Term Euro Notes, 6.00%(c) | | EUR | 500,000 | | | | 561,720 | |
Cooperatieve Centrale Raiffeisen-
Boerenleenbank BA, Unsec. Sub. Euro Bonds, 3.88%, 07/25/23 | | EUR | 600,000 | | | | 732,123 | |
Netherlands Government Bond, Unsec. Euro Bonds, 2.75%, 01/15/47(b) | | EUR | 700,000 | | | | 1,029,334 | |
| | | | | | | | 2,323,177 | |
| | |
| Norway–2.51% | | | | | | | | |
DNB Bank ASA, Unsec. Sub. Medium-Term Euro Notes, 4.75%, 03/08/22 | | EUR | 250,000 | | | | 289,068 | |
Norway Government Bond, Series 476, Unsec. Bonds, 3.00%, 03/14/24(b) | | NOK | 8,000,000 | | | | 1,053,320 | |
| | | | | | | | 1,342,388 | |
| | |
| Poland–6.30% | | | | | | | | |
Poland Government International Bond, Series 12, Sr. Unsec. Bonds, 1.05%, 11/08/17 | | JPY | 400,000,000 | | | | 3,366,918 | |
| | |
| South Korea–2.19% | | | | | | | | |
Korea Treasury Bond, Series 2403, Sr. Unsec. Bonds, 3.50%, 03/10/24 | | KRW | 1,200,000,000 | | | | 1,169,853 | |
| |
| Spain–4.73% | | | | | |
Spain Government Bond, Sr. Unsec. Euro Bonds, 4.20%, 01/31/37(b) | | EUR | 1,820,000 | | | | 2,529,822 | |
See accompanying Notes to Financial Statements which are an integral part of the financial statements.
10 Invesco International Total Return Fund
| | | | | | | | |
| | | Principal
Amount | | | Value | |
| Supranational–2.49% | | | | | |
Asian Development Bank, Series 339-00-1, Sr. Unsec. Medium-Term Global Notes, 2.35%, 06/21/27 | | JPY | 130,000,000 | | | $ | 1,333,587 | |
| |
| United Arab Emirates–0.51% | | | | | |
IPIC GMTN Ltd., REGS, Sr. Unsec. Gtd. Medium-Term Euro Notes, 5.88%, 03/14/21(b) | | EUR | 200,000 | | | | 270,774 | |
| | |
| United Kingdom–6.74% | | | | | | | | |
Abbey National Treasury Services PLC, Sr. Sec. Gtd. Mortgage-Backed Medium-Term Euro Notes, 5.25%, 02/16/29 | | GBP | 200,000 | | | | 385,980 | |
Cabot Financial Luxembourg S.A., REGS, Sr. Sec. Gtd. First Lien Euro Notes, 10.38%, 10/01/19(b) | | GBP | 100,000 | | | | 166,588 | |
Direct Line Insurance Group PLC, Unsec. Sub. Gtd. Euro Notes, 9.25%, 04/27/42 | | GBP | 150,000 | | | | 283,243 | |
Lloyds Bank PLC, Unsec. Sub. Medium-Term Euro Notes, 10.75%, 12/16/21 | | GBP | 200,000 | | | | 338,554 | |
Moy Park Bondco PLC, REGS, Sr. Unsec. Gtd. Euro Notes, 6.25%, 05/29/21(b) | | GBP | 100,000 | | | | 158,129 | |
Nationwide Building Society, Jr. Unsec. Sub. Euro Bonds, 6.00%(c) | | GBP | 200,000 | | | | 314,527 | |
NGG Finance PLC, Unsec. Sub. Gtd. Euro Notes, 5.63%, 06/18/73 | | GBP | 250,000 | | | | 409,541 | |
Odeon & UCI Finco PLC,
REGS, Sr. Sec. Gtd. First
Lien Medium-Term Euro
Notes, 9.00%, 08/01/18(b) | | GBP | 100,000 | | | | 161,115 | |
Scottish Widows PLC, Unsec. Sub. Euro Notes, 5.50%, 06/16/23 | | GBP | 150,000 | | | | 239,570 | |
United Kingdom Gilt,
Series 2045, REGS, Unsec.
Bonds, 3.50%, 01/22/45(b) | | GBP | 630,000 | | | | 1,146,731 | |
| | | | | | | | 3,603,978 | |
|
| United States–1.60% | |
Bank of America Corp., Series 8, Sr. Unsec. Bonds, 2.31%, 06/26/17 | | JPY | 100,000,000 | | | | 855,049 | |
Total Non U.S. Dollar Denominated Bonds & Notes
(Cost $37,729,008) | | | | 35,379,217 | |
|
U.S. Dollar Denominated Bonds & Notes–21.17% | |
| Australia–0.94% | | | | | | | | |
BHP Billiton Finance USA
Ltd., Unsec. Sub. Gtd.
Notes, 6.75%, 10/19/75(b) | | $ | 323,000 | | | | 331,883 | |
FMG Resources (August 2006) Pty. Ltd., REGS, Sr. Unsec. Gtd. Euro Notes, 8.25%, 11/01/19(b) | | | 200,000 | | | | 170,750 | |
| | | | | 502,633 | |
| | | | | | | | |
| | | Principal
Amount | | | Value | |
| Brazil–0.78% | | | | | | | | |
Minerva Luxembourg S.A., REGS, Sr. Unsec. Gtd. Euro Notes, 7.75%, 01/31/23(b) | | $ | 300,000 | | | $ | 297,750 | |
Odebrecht Finance Ltd., REGS, Sr. Unsec. Gtd. Euro Notes, 5.25%, 06/27/29(b) | | | 200,000 | | | | 117,250 | |
| | | | | | | | 415,000 | |
| | |
| Canada–0.80% | | | | | | | | |
Air Canada Pass Through Trust, Series 2015-1, Class B, Sec. Second Lien Pass Through Ctfs., 3.88%, 03/15/23(b) | | | 237,000 | | | | 229,786 | |
Lundin Mining Corp., Sr. Sec. Gtd. First Lien Notes, 7.88%, 11/01/22(b) | | | 200,000 | | | | 200,500 | |
| | | | | | | | 430,286 | |
| |
| Chile–0.56% | | | | | |
Corp. Nacional del Cobre de Chile, Sr. Unsec. Notes, 4.50%, 09/16/25(b) | | | 300,000 | | | | 297,493 | |
| | |
| China–0.74% | | | | | | | | |
Alibaba Group Holding Ltd., Sr. Unsec. Gtd. Notes, 4.50%, 11/28/34(b) | | | 200,000 | | | | 191,543 | |
Bank of China Ltd., Unsec. Sub. Notes, 5.00%, 11/13/24(b) | | | 200,000 | | | | 207,187 | |
| | | | | | | | 398,730 | |
| | |
| Colombia–0.67% | | | | | | | | |
Ecopetrol S.A., Sr. Unsec. Global Notes, 5.38%, 06/26/26 | | | 300,000 | | | | 280,125 | |
Pacific Exploration & Production Corp., REGS, Sr. Unsec. Gtd. Euro Notes, 5.63%, 01/19/25(b) | | | 200,000 | | | | 76,000 | |
| | | | | | | | 356,125 | |
| | |
| Dominican Repubic–0.60% | | | | | | | | |
Dominican Republic International Bond, Sr. Unsec. Bonds, 5.50%, 01/27/25(b) | | | 322,000 | | | | 319,585 | |
| | |
| Gabon–0.33% | | | | | | | | |
Gabon Government International Bond, Sr. Unsec. Bonds, 6.95%, 06/16/25(b) | | | 200,000 | | | | 175,790 | |
| | |
| Ghana–0.40% | | | | | | | | |
Republic of Ghana, Unsec. Gtd. Bonds, 10.75%, 10/14/30(b) | | | 200,000 | | | | 212,450 | |
| | |
| Kazakhstan–0.37% | | | | | | | | |
Kazakhstan Government International Bond, Sr. Unsec. Notes, 6.50%, 07/21/45(b) | | | 200,000 | | | | 195,941 | |
See accompanying Notes to Financial Statements which are an integral part of the financial statements.
11 Invesco International Total Return Fund
| | | | | | | | |
| | | Principal
Amount | | | Value | |
| Morocco–1.08% | | | | | | | | |
OCP S.A., Sr. Unsec. Notes, 4.50%, 10/22/25(b) | | $ | 600,000 | | | $ | 580,500 | |
| | |
| Netherlands–0.68% | | | | | | | | |
AerCap Ireland Capital Ltd./AerCap Global Aviation Trust, Sr. Unsec. Gtd. Global Notes, 4.63%, 10/30/20 | | | 350,000 | | | | 364,437 | |
| | |
| Peru–1.48% | | | | | | | | |
Lima Metro Line 2 Finance Ltd., Sr. Sec. First Lien Bonds, 5.88%, 07/05/34(b) | | | 500,000 | | | | 505,000 | |
Southern Copper Corp., Sr. Unsec. Global Notes, 3.88%, 04/23/25 | | | 300,000 | | | | 285,750 | |
| | | | | | | | 790,750 | |
| | |
| Russia–0.37% | | | | | | | | |
Gazprom OAO Via Gaz Capital S.A., Sr. Unsec. Notes, 4.30%, 11/12/15(b) | | | 200,000 | | | | 199,750 | |
| | |
| Singapore–0.60% | | | | | | | | |
BOC Aviation Pte. Ltd., Sr. Unsec. Notes, 3.00%, 03/30/20(b) | | | 323,000 | | | | 319,835 | |
| | |
| Switzerland–1.33% | | | | | | | | |
Credit Suisse Group AG, Jr. Unsec. Sub. Notes, 6.25%(b)(c) | | | 500,000 | | | | 498,750 | |
UBS AG, Unsec. Sub. Medium-Term Euro Notes, 7.25%, 02/22/22 | | | 200,000 | | | | 211,375 | |
| | | | | | | | 710,125 | |
| | |
| United Kingdom–1.19% | | | | | | | | |
Anglo American Capital PLC, Sr. Unsec. Gtd. Notes, 4.88%, 05/14/25(b) | | | 231,000 | | | | 185,955 | |
HSBC Holdings PLC, Jr. Unsec. Sub. Global Bonds,
5.63%(c) | | | 250,000 | | | | 250,486 | |
6.38%(c) | | | 202,000 | | | | 200,485 | |
| | | | | | | | 636,926 | |
| |
| United States–8.25% | | | | | |
AbbVie Inc., Sr. Unsec. Global Notes, 3.60%, 05/14/25 | | | 195,000 | | | | 191,741 | |
Avaya Inc., Sr. Sec. Gtd. First Lien Notes, 9.00%, 04/01/19(b) | | | 300,000 | | | | 246,000 | |
Berry Plastics Corp., Sec. Gtd. Second Lien Notes, 5.50%, 05/15/22 | | | 200,000 | | | | 205,750 | |
6.00%, 10/15/22(b) | | | 301,000 | | | | 316,426 | |
Cantor Fitzgerald, L.P., Unsec. Notes, 6.50%, 06/17/22(b) | | | 246,000 | | | | 254,949 | |
Cimarex Energy Co., Sr. Unsec. Gtd. Notes, 4.38%, 06/01/24 | | | 100,000 | | | | 99,813 | |
Concho Resources Inc., Sr. Unsec. Gtd. Global Notes, 5.50%, 04/01/23 | | | 100,000 | | | | 101,125 | |
| | | | | | | | |
| | | Principal
Amount | | | Value | |
| United States–(continued) | | | | | |
Denbury Resources Inc., Sr. Unsec. Gtd. Sub. Notes, 5.50%, 05/01/22 | | $ | 200,000 | | | $ | 143,000 | |
EarthLink Holdings Corp., Sr. Unsec. Gtd. Global Notes, 8.88%, 05/15/19 | | | 149,000 | | | | 154,587 | |
EPR Properties, Sr. Unsec. Gtd. Global Notes, 4.50%, 04/01/25 | | | 196,000 | | | | 188,414 | |
FedEx Corp., Sr. Unsec. Gtd. Notes, 4.75%, 11/15/45 | | | 294,000 | | | | 292,745 | |
Ford Motor Credit Co. LLC, Sr. Unsec. Global Notes, 4.13%, 08/04/25 | | | 387,000 | | | | 397,571 | |
Frontier Communications Corp., Sr. Unsec. Notes, 11.00%, 09/15/25(b) | | | 300,000 | | | | 315,375 | |
JPMorgan Chase & Co., Series Z, Jr. Unsec. Sub. Global Notes, 5.30%(c) | | | 300,000 | | | | 301,875 | |
Navios Maritime Acquisition Corp./Navios Acquisition Finance U.S. Inc., Sr. Sec. Gtd. First Lien Mortgage Notes, 8.13%, 11/15/21 (Acquired 08/21/15; Cost $192,500)(b) | | | 200,000 | | | | 192,500 | |
Sprint Capital Corp., Sr. Unsec. Gtd. Global Notes, 6.88%, 11/15/28 | | | 400,000 | | | | 335,000 | |
Valeant Pharmaceuticals International, Inc., Sr. Unsec. Gtd. Notes, 6.13%, 04/15/25(b) | | | 200,000 | | | | 168,500 | |
Wells Fargo & Co., Series U, Jr. Unsec. Sub. Global Notes, 5.88%(c) | | | 300,000 | | | | 317,250 | |
Whiting Petroleum Corp., Sr. Unsec. Gtd. Notes, 5.75%, 03/15/21 | | | 200,000 | | | | 188,000 | |
| | | | | | | | 4,410,621 | |
Total U.S. Dollar Denominated Bonds & Notes
(Cost $11,417,432) | | | | 11,316,977 | |
|
Collateralized Mortgage Obligations–5.24% | |
| United States–5.24% | | | | | | | | |
Bear Stearns Adjustable Rate Mortgage Trust, Series 2005-2, Class A1, Floating Rate Pass Through Ctfs., 2.68%, 03/25/35(d) | | | 184,462 | | | | 185,617 | |
BLCP Hotel Trust, Series 2014-CLRN, Class C, Floating Rate Pass Through Ctfs., 2.15%, 08/15/29(b)(d) | | | 450,000 | | | | 444,872 | |
COMM Mortgage Trust, Series 2013-LC6, Class B, Pass Through Ctfs., 3.74%, 01/10/46 | | | 300,000 | | | | 307,427 | |
See accompanying Notes to Financial Statements which are an integral part of the financial statements.
12 Invesco International Total Return Fund
| | | | | | | | |
| | | Principal
Amount | | | Value | |
| United States–(continued) | | | | | |
GMACM Mortgage Loan Trust, Series 2006-AR1, Class 1A1, Floating Rate Pass Through Ctfs., 3.05%, 04/19/36(d) | | $ | 251,419 | | | $ | 227,377 | |
JP Morgan Mortgage Trust, | | | | | | | | |
Series 2007-A1, Class 2A2, | | | | | | | | |
Floating Rate Pass Through Ctfs., | | | | | | | | |
2.64%, 07/25/35(d) | | | 280,242 | | | | 275,392 | |
Series 2007-A4, Class 3A1, | | | | | | | | |
Floating Rate Pass Through Ctfs., | | | | | | | | |
5.34%, 06/25/37(d) | | | 262,888 | | | | 239,344 | |
Merrill Lynch Mortgage Investors Trust, Series 2005-3, Class 3A, Floating Rate Pass Through Ctfs., 2.29%, 11/25/35(d) | | | 169,458 | | | | 166,478 | |
WaMu Mortgage Pass-Through Trust, Series 2005-AR12, Class 1A8, Floating Rate Pass Through Ctfs., 2.43%, 10/25/35(d) | | | 257,828 | | | | 248,916 | |
Wells Fargo Mortgage Backed Securities Trust, Series 2005-AR14, Class A1, Floating Rate Pass Through Ctfs., 2.74%, 08/25/35(d) | | | 155,290 | | | | 153,832 | |
| | | | | | | | |
| | | Principal
Amount | | | Value | |
| United States–(continued) | | | | | |
WFRBS Commercial Mortgage Trust, Series 2013-C16, Class A5, Pass Through Ctfs., 4.42%, 09/15/46 | | $ | 500,000 | | | $ | 552,025 | |
Total Collateralized Mortgage Obligations (Cost $2,764,243) | | | | 2,801,280 | |
| | |
| | | Shares | | | | |
Money Market Funds–2.03% | | | | | |
Liquid Assets Portfolio–Institutional Class, 0.16%(e) | | | 541,819 | | | | 541,819 | |
Premier Portfolio–Institutional Class, 0.12%(e) | | | 541,818 | | | | 541,818 | |
Total Money Market Funds
(Cost $1,083,637) | | | | 1,083,637 | |
|
Options Purchased–0.01% | |
(Cost $10,789)(f) | | | | 5,940 | |
TOTAL INVESTMENTS–94.64%
(Cost $53,005,109) | | | | | | | 50,587,051 | |
OTHER ASSETS LESS LIABILITIES–5.36% | | | | 2,864,797 | |
NET ASSETS–100.00% | | | $ | 53,451,848 | |
Investment Abbreviations:
| | |
| AUD | | – Australian Dollar |
| CAD | | – Canadian Dollar |
| Ctfs. | | – Certificates |
| EUR | | – Euro |
| GBP | | – British Pound Sterling |
| Gtd. | | – Guaranteed |
| JPY | | – Japanese Yen |
| Jr. | | – Junior |
| | |
| KRW | | – South Korean Won |
| MXN | | – Mexican Peso |
| NOK | | – Norwegian Krona |
| REGS | | – Regulation S |
| Sec. | | – Secured |
| Sr. | | – Senior |
| Sub. | | – Subordinated |
| Unsec. | | – Unsecured |
Notes to Schedule of Investments:
| (a) | Foreign denominated security. Principal amount is denominated in the currency indicated. |
| (b) | Security purchased or received in a transaction exempt from registration under the Securities Act of 1933, as amended (the “1933 Act”). The security may be resold pursuant to an exemption from registration under the 1933 Act, typically to qualified institutional buyers. The aggregate value of these securities at October 31, 2015 was $22,043,826, which represented 41.24% of the Fund’s Net Assets. |
| (c) | Perpetual bond with no specified maturity date. |
| (d) | Interest or dividend rate is redetermined periodically. Rate shown is the rate in effect on October 31, 2015. |
| (e) | The money market fund and the Fund are affiliated by having the same investment adviser. The rate shown is the 7-day SEC standardized yield as of October 31, 2015. |
| (f) | The table below details options purchased. |
| | | | | | | | | | | | | | | | | | | | | | | | | | | | | | | | |
| Open Over-The-Counter Foreign Currency Options Purchased | |
| Description | | Type of
Contract | | | Counterparty | | | Expiration
Date | | | Strike
Price | | | Notional
Value | | | Value | |
EUR versus USD | | | Put | | | | Morgan Stanley & Co. LLC | | | | 11/20/15 | | | | USD | | | | 1.09 | | | | EUR | | | | 1,000,000 | | | $ | 5,860 | |
USD versus CNY | | | Put | | | | Deutsche Bank Securities Inc. | | | | 11/11/15 | | | | CNY | | | | 6.80 | | | | USD | | | | 500,000 | | | | 36 | |
USD versus CNY | | | Put | | | | Deutsche Bank Securities Inc. | | | | 11/13/15 | | | | CNY | | | | 6.80 | | | | USD | | | | 500,000 | | | | 44 | |
Total Over-The-Counter Foreign Currency Options Purchased — Currency Risk (Cost $10,789) | | | $ | 5,940 | |
Abbreviations:
| | |
| CNY | | – Chinese Yuan |
| EUR | | – Euro |
| USD | | – U.S. Dollar |
See accompanying Notes to Financial Statements which are an integral part of the financial statements.
13 Invesco International Total Return Fund
Statement of Assets and Liabilities
October 31, 2015
| | | | |
Assets: | | | | |
Investments, at value (Cost $51,921,472) | | $ | 49,503,414 | |
Investments in affiliated money market funds, at value and cost | | | 1,083,637 | |
Total investments, at value (Cost $53,005,109) | | | 50,587,051 | |
Foreign currencies, at value (Cost $572,344) | | | 579,419 | |
Receivable for: | | | | |
Deposits with brokers for open futures contracts | | | 144,876 | |
Investments sold | | | 5,300,901 | |
Variation margin — futures | | | 55,062 | |
Fund shares sold | | | 86,614 | |
Dividends and interest | | | 624,369 | |
Investment for trustee deferred compensation and retirement plans | | | 34,289 | |
Unrealized appreciation on forward foreign currency contracts outstanding | | | 95,468 | |
Other assets | | | 19,087 | |
Total assets | | | 57,527,136 | |
| |
Liabilities: | | | | |
Payable for: | | | | |
Investments purchased | | | 3,704,907 | |
Fund shares reacquired | | | 35,145 | |
Options written, at value (premiums received $16,223) | | | 6,525 | |
Amount due custodian | | | 71,625 | |
Accrued fees to affiliates | | | 29,459 | |
Accrued trustees’ and officers’ fees and benefits | | | 1,586 | |
Accrued other operating expenses | | | 62,390 | |
Trustee deferred compensation and retirement plans | | | 36,247 | |
Unrealized depreciation on forward foreign currency contracts outstanding | | | 127,404 | |
Total liabilities | | | 4,075,288 | |
Net assets applicable to shares outstanding | | $ | 53,451,848 | |
| |
Net assets consist of: | | | | |
Shares of beneficial interest | | $ | 56,627,962 | |
Undistributed net investment income | | | (171,343 | ) |
Undistributed net realized gain (loss) | | | (591,352 | ) |
Net unrealized appreciation (depreciation) | | | (2,413,419 | ) |
| | | $ | 53,451,848 | |
| | | | |
Net Assets: | | | | |
Class A | | $ | 26,426,070 | |
Class B | | $ | 898,048 | |
Class C | | $ | 4,997,849 | |
Class Y | | $ | 1,716,373 | |
Class R5 | | $ | 795 | |
Class R6 | | $ | 19,412,713 | |
|
Shares outstanding, $0.01 par value per share,
with an unlimited number of shares authorized: | |
Class A | | | 2,694,180 | |
Class B | | | 91,690 | |
Class C | | | 510,658 | |
Class Y | | | 175,115 | |
Class R5 | | | 81 | |
Class R6 | | | 1,979,058 | |
Class A: | | | | |
Net asset value per share | | $ | 9.81 | |
Maximum offering price per share | | | | |
(Net asset value of $9.81 ¸ 95.75%) | | $ | 10.25 | |
Class B: | | | | |
Net asset value and offering price per share | | $ | 9.79 | |
Class C: | | | | |
Net asset value and offering price per share | | $ | 9.79 | |
Class Y: | | | | |
Net asset value and offering price per share | | $ | 9.80 | |
Class R5: | | | | |
Net asset value and offering price per share | | $ | 9.81 | |
Class R6: | | | | |
Net asset value and offering price per share | | $ | 9.81 | |
See accompanying Notes to Financial Statements which are an integral part of the financial statements.
14 Invesco International Total Return Fund
Statement of Operations
For the year ended October 31, 2015
| | | | |
Investment income: | |
Interest (net of foreign withholding taxes of $5,772) | | $ | 1,580,479 | |
Dividends from affiliated money market funds | | | 592 | |
Total investment income | | | 1,581,071 | |
| |
Expenses: | | | | |
Advisory fees | | | 355,390 | |
Administrative services fees | | | 50,000 | |
Custodian fees | | | 28,367 | |
Distribution fees: | | | | |
Class A | | | 72,220 | |
Class B | | | 12,904 | |
Class C | | | 54,972 | |
Transfer agent fees A, B, C and Y | | | 116,807 | |
Transfer agent fees — R6 | | | 157 | |
Trustees’ and officers’ fees and benefits | | | 19,842 | |
Registration and filing fees | | | 74,708 | |
Professional services fees | | | 58,336 | |
Other | | | 47,156 | |
Total expenses | | | 890,859 | |
Less: Fees waived, expenses reimbursed and expense offset arrangement(s) | | | (287,545 | ) |
Net expenses | | | 603,314 | |
Net investment income | | | 977,757 | |
| |
Realized and unrealized gain (loss) from: | | | | |
Net realized gain (loss) from: | | | | |
Investment securities | | | (2,636,653 | ) |
Foreign currencies | | | (202,134 | ) |
Forward foreign currency contracts | | | 167,776 | |
Futures contracts | | | (916,220 | ) |
Option contracts written | | | 49,997 | |
Swap agreements | | | (1,246 | ) |
| | | | (3,538,480 | ) |
Change in net unrealized appreciation (depreciation) of: | | | | |
Investment securities | | | (752,371 | ) |
Foreign currencies | | | 57,113 | |
Forward foreign currency contracts | | | 47,932 | |
Futures contracts | | | 72,949 | |
Option contracts written | | | 9,698 | |
| | | | (564,679 | ) |
Net realized and unrealized gain (loss) | | | (4,103,159 | ) |
Net increase (decrease) in net assets resulting from operations | | $ | (3,125,402 | ) |
See accompanying Notes to Financial Statements which are an integral part of the financial statements.
15 Invesco International Total Return Fund
Statement of Changes in Net Assets
For the years ended October 31, 2015 and October 31, 2014
| | | | | | | | |
| | | 2015 | | | 2014 | |
Operations: | | | | | | | | |
Net investment income | | $ | 977,757 | | | $ | 980,847 | |
Net realized gain (loss) | | | (3,538,480 | ) | | | 499,572 | |
Change in net unrealized appreciation (depreciation) | | | (564,679 | ) | | | (2,359,518 | ) |
Net increase (decrease) in net assets resulting from operations | | | (3,125,402 | ) | | | (879,099 | ) |
|
Distributions to shareholders from net investment income: | |
Class A | | | — | | | | (342,384 | ) |
Class B | | | — | | | | (6,778 | ) |
Class C | | | — | | | | (17,273 | ) |
Class Y | | | — | | | | (43,342 | ) |
Class R5 | | | — | | | | (2,735 | ) |
Class R6 | | | — | | | | (136,738 | ) |
Total distributions from net investment income | | | — | | | | (549,250 | ) |
| | |
Return of Capital: | | | | | | | | |
Class A | | | (334,679 | ) | | | — | |
Class B | | | (5,037 | ) | | | — | |
Class C | | | (22,195 | ) | | | — | |
Class Y | | | (34,332 | ) | | | — | |
Class R5 | | | (404 | ) | | | — | |
Class R6 | | | (234,598 | ) | | | — | |
Total return of capital | | | (631,245 | ) | | | — | |
| | |
Distributions to shareholders from net realized gains: | | | | | | | | |
Class A | | | (424,234 | ) | | | (627,066 | ) |
Class B | | | (23,164 | ) | | | (54,188 | ) |
Class C | | | (82,956 | ) | | | (109,020 | ) |
Class Y | | | (58,822 | ) | | | (20,619 | ) |
Class R5 | | | (1,571 | ) | | | (5,529 | ) |
Class R6 | | | (190,546 | ) | | | (179,473 | ) |
Total distributions from net realized gains | | | (781,293 | ) | | | (995,895 | ) |
| | |
Share transactions–net: | | | | | | | | |
Class A | | | (3,774,867 | ) | | | 1,008,873 | |
Class B | | | (848,162 | ) | | | (900,676 | ) |
Class C | | | (969,761 | ) | | | 1,140,625 | |
Class Y | | | (3,026,142 | ) | | | 4,234,543 | |
Class R5 | | | (113,619 | ) | | | (160,180 | ) |
Class R6 | | | 8,002,329 | | | | 4,374,306 | |
Net increase (decrease) in net assets resulting from share transactions | | | (730,222 | ) | | | 9,697,491 | |
Net increase (decrease) in net assets | | | (5,268,162 | ) | | | 7,273,247 | |
| | |
Net assets: | | | | | | | | |
Beginning of year | | | 58,720,010 | | | | 51,446,763 | |
End of year (includes undistributed net investment income of $(171,343) and $99,678, respectively) | | $ | 53,451,848 | | | $ | 58,720,010 | |
Notes to Financial Statements
October 31, 2015
NOTE 1—Significant Accounting Policies
Invesco International Total Return Fund (the “Fund”) is a series portfolio of AIM Investment Funds (Invesco Investment Funds) (the “Trust”). The Trust is organized as a Delaware statutory trust and is registered under the Investment Company Act of 1940, as amended (the “1940 Act”), as an
16 Invesco International Total Return Fund
open-end series management investment company consisting of twenty-four separate series portfolios, each authorized to issue an unlimited number of shares of beneficial interest. The assets, liabilities and operations of each portfolio are accounted for separately. Information presented in these financial statements pertains only to the Fund. Matters affecting each portfolio or class will be voted on exclusively by the shareholders of such portfolio or class.
The Fund’s investment objective is total return, comprised of current income and capital appreciation.
The Fund currently consists of six different classes of shares: Class A, Class B, Class C, Class Y, Class R5 and Class R6. Class A shares are sold with a front-end sales charge unless certain waiver criteria are met and under certain circumstances load waived shares may be subject to contingent deferred sales charges (“CDSC”). Class C shares are sold with a CDSC. Class Y, Class R5 and Class R6 shares are sold at net asset value. Effective November 30, 2010, new or additional investments in Class B shares are no longer permitted. Existing shareholders of Class B shares may continue to reinvest dividends and capital gains distributions in Class B shares until they convert to Class A shares. Also, shareholders in Class B shares will be able to exchange those shares for Class B shares of other Invesco Funds offering such shares until they convert to Class A shares. Generally, Class B shares will automatically convert to Class A shares on or about the month-end, which is at least eight years after the date of purchase. Redemption of Class B shares prior to the conversion date will be subject to a CDSC.
The following is a summary of the significant accounting policies followed by the Fund in the preparation of its financial statements.
| A. | Security Valuations — Securities, including restricted securities, are valued according to the following policy. |
Debt obligations (including convertible securities) and unlisted equities are fair valued using an evaluated quote provided by an independent pricing service. Evaluated quotes provided by the pricing service may be determined without exclusive reliance on quoted prices, and may reflect appropriate factors such as institution-size trading in similar groups of securities, developments related to specific securities, dividend rate (for unlisted equities), yield (for debt obligations), quality, type of issue, coupon rate (for debt obligations), maturity (for debt obligations), individual trading characteristics and other market data. Debt obligations are subject to interest rate and credit risks. In addition, all debt obligations involve some risk of default with respect to interest and/or principal payments.
A security listed or traded on an exchange (except convertible securities) is valued at its last sales price or official closing price as of the close of the customary trading session on the exchange where the security is principally traded, or lacking any sales or official closing price on a particular day, the security may be valued at the closing bid price on that day. Securities traded in the over-the-counter market are valued based on prices furnished by independent pricing services or market makers. When such securities are valued by an independent pricing service they may be considered fair valued. Futures contracts are valued at the final settlement price set by an exchange on which they are principally traded. Listed options are valued at the mean between the last bid and asked prices from the exchange on which they are principally traded. Options not listed on an exchange are valued by an independent source at the mean between the last bid and asked prices. For purposes of determining net asset value (“NAV”) per share, futures and option contracts generally are valued 15 minutes after the close of the customary trading session of the New York Stock Exchange (“NYSE”).
Investments in open-end and closed-end registered investment companies that do not trade on an exchange are valued at the end-of-day net asset value per share. Investments in open-end and closed-end registered investment companies that trade on an exchange are valued at the last sales price or official closing price as of the close of the customary trading session on the exchange where the security is principally traded.
Foreign securities’ (including foreign exchange contracts) prices are converted into U.S. dollar amounts using the applicable exchange rates as of the close of the NYSE. If market quotations are available and reliable for foreign exchange-traded equity securities, the securities will be valued at the market quotations. Because trading hours for certain foreign securities end before the close of the NYSE, closing market quotations may become unreliable. If between the time trading ends on a particular security and the close of the customary trading session on the NYSE, events occur that the Adviser determines are significant and make the closing price unreliable, the Fund may fair value the security. If the event is likely to have affected the closing price of the security, the security will be valued at fair value in good faith using procedures approved by the Board of Trustees. Adjustments to closing prices to reflect fair value may also be based on a screening process of an independent pricing service to indicate the degree of certainty, based on historical data, that the closing price in the principal market where a foreign security trades is not the current value as of the close of the NYSE. Foreign securities’ prices meeting the approved degree of certainty that the price is not reflective of current value will be priced at the indication of fair value from the independent pricing service. Multiple factors may be considered by the independent pricing service in determining adjustments to reflect fair value and may include information relating to sector indices, American Depositary Receipts and domestic and foreign index futures. Foreign securities may have additional risks including exchange rate changes, potential for sharply devalued currencies and high inflation, political and economic upheaval, the relative lack of issuer information, relatively low market liquidity and the potential lack of strict financial and accounting controls and standards.
Securities for which market prices are not provided by any of the above methods may be valued based upon quotes furnished by independent sources. The last bid price may be used to value equity securities. The mean between the last bid and asked prices is used to value debt obligations, including corporate loans.
Securities for which market quotations are not readily available or became unreliable are valued at fair value as determined in good faith by or under the supervision of the Trust’s officers following procedures approved by the Board of Trustees. Issuer specific events, market trends, bid/asked quotes of brokers and information providers and other market data may be reviewed in the course of making a good faith determination of a security’s fair value.
The Fund may invest in securities that are subject to interest rate risk, meaning the risk that the prices will generally fall as interest rates rise and, conversely, the prices will generally rise as interest rates fall. Specific securities differ in their sensitivity to changes in interest rates depending on their individual characteristics. Changes in interest rates may result in increased market volatility, which may affect the value and/or liquidity of certain Fund investments.
Valuations change in response to many factors including the historical and prospective earnings of the issuer, the value of the issuer’s assets, general economic conditions, interest rates, investor perceptions and market liquidity. Because of the inherent uncertainties of valuation, the values reflected in the financial statements may materially differ from the value received upon actual sale of those investments.
| B. | Securities Transactions and Investment Income — Securities transactions are accounted for on a trade date basis. Realized gains or losses on sales are computed on the basis of specific identification of the securities sold. Interest income (net of withholding tax, if any) is recorded on the accrual basis from settlement date. Dividend income (net of withholding tax, if any) is recorded on the ex-dividend date. Bond premiums and discounts are amortized and/or accreted for financial reporting purposes. |
17 Invesco International Total Return Fund
The Fund may periodically participate in litigation related to Fund investments. As such, the Fund may receive proceeds from litigation settlements. Any proceeds received are included in the Statement of Operations as realized gain (loss) for investments no longer held and as unrealized gain (loss) for investments still held.
Brokerage commissions and mark ups are considered transaction costs and are recorded as an increase to the cost basis of securities purchased and/or a reduction of proceeds on a sale of securities. Such transaction costs are included in the determination of net realized and unrealized gain (loss) from investment securities reported in the Statement of Operations and the Statement of Changes in Net Assets and the net realized and unrealized gains (losses) on securities per share in the Financial Highlights. Transaction costs are included in the calculation of the Fund’s net asset value and, accordingly, they reduce the Fund’s total returns. These transaction costs are not considered operating expenses and are not reflected in net investment income reported in the Statement of Operations and the Statement of Changes in Net Assets, or the net investment income per share and the ratios of expenses and net investment income reported in the Financial Highlights, nor are they limited by any expense limitation arrangements between the Fund and the investment adviser.
The Fund allocates income and realized and unrealized capital gains and losses to a class based on the relative net assets of each class.
| C. | Country Determination — For the purposes of making investment selection decisions and presentation in the Schedule of Investments, the investment adviser may determine the country in which an issuer is located and/or credit risk exposure based on various factors. These factors include the laws of the country under which the issuer is organized, where the issuer maintains a principal office, the country in which the issuer derives 50% or more of its total revenues and the country that has the primary market for the issuer’s securities, as well as other criteria. Among the other criteria that may be evaluated for making this determination are the country in which the issuer maintains 50% or more of its assets, the type of security, financial guarantees and enhancements, the nature of the collateral and the sponsor organization. Country of issuer and/or credit risk exposure has been determined to be the United States of America, unless otherwise noted. |
| D. | Distributions — Distributions from net investment income, if any, are declared and paid quarterly and are recorded on the ex-dividend date. Distributions from net realized capital gain, if any, are generally declared and paid annually and recorded on the ex-dividend date. The Fund may elect to treat a portion of the proceeds from redemptions as distributions for federal income tax purposes. |
| E. | Federal Income Taxes — The Fund intends to comply with the requirements of Subchapter M of the Internal Revenue Code of 1986, as amended (the “Internal Revenue Code”), necessary to qualify as a regulated investment company and to distribute substantially all of the Fund’s taxable earnings to shareholders. As such, the Fund will not be subject to federal income taxes on otherwise taxable income (including net realized capital gain) that is distributed to shareholders. Therefore, no provision for federal income taxes is recorded in the financial statements. |
The Fund recognizes the tax benefits of uncertain tax positions only when the position is more likely than not to be sustained. Management has analyzed the Fund’s uncertain tax positions and concluded that no liability for unrecognized tax benefits should be recorded related to uncertain tax positions. Management is not aware of any tax positions for which it is reasonably possible that the total amounts of unrecognized tax benefits will change materially in the next 12 months.
The Fund files tax returns in the U.S. Federal jurisdiction and certain other jurisdictions. Generally, the Fund is subject to examinations by such taxing authorities for up to three years after the filing of the return for the tax period.
| F. | Expenses — Fees provided for under the Rule 12b-1 plan of a particular class of the Fund are charged to the operations of such class. Transfer agency fees and expenses and other shareholder recordkeeping fees and expenses attributable to Class R5 and Class R6 are allocated to each share class based on relative net assets. Sub-accounting fees attributable to Class R5 are charged to the operations of the class. Transfer agency fees and expenses and other shareholder recordkeeping fees and expenses relating to all other classes are allocated among those classes based on relative net assets. All other expenses are allocated among the classes based on relative net assets. |
| G. | Accounting Estimates — The preparation of financial statements in conformity with accounting principles generally accepted in the United States of America (“GAAP”) requires management to make estimates and assumptions that affect the reported amounts of assets and liabilities at the date of the financial statements and the reported amounts of revenues and expenses during the reporting period including estimates and assumptions related to taxation. Actual results could differ from those estimates by a significant amount. In addition, the Fund monitors for material events or transactions that may occur or become known after the period-end date and before the date the financial statements are released to print. |
| H. | Indemnifications — Under the Trust’s organizational documents, each Trustee, officer, employee or other agent of the Trust is indemnified against certain liabilities that may arise out of the performance of their duties to the Fund. Additionally, in the normal course of business, the Fund enters into contracts, including the Fund’s servicing agreements, that contain a variety of indemnification clauses. The Fund’s maximum exposure under these arrangements is unknown as this would involve future claims that may be made against the Fund that have not yet occurred. The risk of material loss as a result of such indemnification claims is considered remote. |
| I. | Foreign Currency Translations — Foreign currency is valued at the close of the NYSE based on quotations posted by banks and major currency dealers. Portfolio securities and other assets and liabilities denominated in foreign currencies are translated into U.S. dollar amounts at date of valuation. Purchases and sales of portfolio securities (net of foreign taxes withheld on disposition) and income items denominated in foreign currencies are translated into U.S. dollar amounts on the respective dates of such transactions. The Fund does not separately account for the portion of the results of operations resulting from changes in foreign exchange rates on investments and the fluctuations arising from changes in market prices of securities held. The combined results of changes in foreign exchange rates and the fluctuation of market prices on investments (net of estimated foreign tax withholding) are included with the net realized and unrealized gain or loss from investments in the Statement of Operations. Reported net realized foreign currency gains or losses arise from (1) sales of foreign currencies, (2) currency gains or losses realized between the trade and settlement dates on securities transactions, and (3) the difference between the amounts of dividends, interest, and foreign withholding taxes recorded on the Fund’s books and the U.S. dollar equivalent of the amounts actually received or paid. Net unrealized foreign currency gains and losses arise from changes in the fair values of assets and liabilities, other than investments in securities at fiscal period end, resulting from changes in exchange rates. |
The Fund may invest in foreign securities, which may be subject to foreign taxes on income, gains on investments or currency repatriation, a portion of which may be recoverable. Foreign taxes, if any, are recorded based on the tax regulations and rates that exist in the foreign markets in which the Fund invests and are shown in the Statement of Operations.
| J. | Forward Foreign Currency Contracts — The Fund may engage in foreign currency transactions either on a spot (i.e. for prompt delivery and settlement) basis, or through forward foreign currency contracts, to manage or minimize currency or exchange rate risk. |
18 Invesco International Total Return Fund
The Fund may also enter into forward foreign currency contracts for the purchase or sale of a security denominated in a foreign currency in order to “lock in” the U.S. dollar price of that security, or the Fund may also enter into forward foreign currency contracts that do not provide for physical settlement of the two currencies, but instead are settled by a single cash payment calculated as the difference between the agreed upon exchange rate and the spot rate at settlement based upon an agreed upon notional amount (non-deliverable forwards). The Fund will set aside liquid assets in an amount equal to daily mark-to-market obligation for forward foreign currency contracts.
A forward foreign currency contract is an obligation between two parties (“Counterparties”) to purchase or sell a specific currency for an agreed-upon price at a future date. The use of forward foreign currency contracts does not eliminate fluctuations in the price of the underlying securities the Fund owns or intends to acquire but establishes a rate of exchange in advance. Fluctuations in the value of these contracts are measured by the difference in the contract date and reporting date exchange rates and are recorded as unrealized appreciation (depreciation) until the contracts are closed. When the contracts are closed, realized gains (losses) are recorded. Realized and unrealized gains (losses) on the contracts are included in the Statement of Operations. The primary risks associated with forward foreign currency contracts include failure of the Counterparty to meet the terms of the contract and the value of the foreign currency changing unfavorably. These risks may be in excess of the amounts reflected in the Statement of Assets and Liabilities.
| K. | Futures Contracts — The Fund may enter into futures contracts to manage exposure to interest rate, equity and market price movements and/or currency risks. A futures contract is an agreement between Counterparties to purchase or sell a specified underlying security, currency or commodity (or delivery of a cash settlement price, in the case of an index future) for a fixed price at a future date. The Fund currently invests only in exchange-traded futures and they are standardized as to maturity date and underlying financial instrument. Initial margin deposits required upon entering into futures contracts are satisfied by the segregation of specific securities or cash as collateral at the futures commission merchant (broker). During the period the futures contracts are open, changes in the value of the contracts are recognized as unrealized gains or losses by recalculating the value of the contracts on a daily basis. Subsequent or variation margin payments are received or made depending upon whether unrealized gains or losses are incurred. These amounts are reflected as receivables or payables on the Statement of Assets and Liabilities. When the contracts are closed or expire, the Fund recognizes a realized gain or loss equal to the difference between the proceeds from, or cost of, the closing transaction and the Fund’s basis in the contract. The net realized gain (loss) and the change in unrealized gain (loss) on futures contracts held during the period is included on the Statement of Operations. The primary risks associated with futures contracts are market risk and the absence of a liquid secondary market. If the Fund were unable to liquidate a futures contract and/or enter into an offsetting closing transaction, the Fund would continue to be subject to market risk with respect to the value of the contracts and continue to be required to maintain the margin deposits on the futures contracts. Futures contracts have minimal Counterparty risk since the exchange’s clearinghouse, as Counterparty to all exchange-traded futures, guarantees the futures against default. Risks may exceed amounts recognized in the Statement of Assets and Liabilities. |
| L. | Call Options Written and Purchased — The Fund may write call options and/or buy call options. A covered call option gives the purchaser of such option the right to buy, and the writer the obligation to sell, the underlying security or foreign currency at the stated exercise price during the option period. An uncovered call option exists without the ownership of the underlying security. Options written by the Fund normally will have expiration dates between three and nine months from the date written. The exercise price of a call option may be below, equal to, or above the current market value of the underlying security at the time the option is written. |
Additionally, the Fund may enter into an option on a swap agreement, also called a “swaption”. A swaption is an option that gives the buyer the right, but not the obligation, to enter into a swap on a future date in exchange for paying a market-based premium. A receiver swaption gives the owner the right to receive the total return of a specified asset, reference rate or index. Swaptions also include options that allow an existing swap to be terminated or extended by one of the Counterparties.
When the Fund writes a covered call option, an amount equal to the premium received by the Fund is recorded as an asset and an equivalent liability in the Statement of Assets and Liabilities. The amount of the liability is subsequently “marked-to-market” to reflect the current market value of the option written. If a written covered call option expires on the stipulated expiration date, or if the Fund enters into a closing purchase transaction, the Fund realizes a gain (or a loss if the closing purchase transaction exceeds the premium received when the option was written) without regard to any unrealized gain or loss on the underlying security, and the liability related to such option is extinguished. If a written covered call option is exercised, the Fund realizes a gain or a loss from the sale of the underlying security and the proceeds of the sale are increased by the premium originally received. Realized and unrealized gains and losses on these contracts are included in the Statement of Operations. A risk in writing a covered call option is that the Fund gives up the opportunity for profit if the market price of the security increases and the option is exercised. The risk in writing an uncovered call option is that the Fund may incur significant losses if the value of the written security exceeds the exercise price of the option.
When the Fund buys a call option, an amount equal to the premium paid by the Fund is recorded as an investment on the Statement of Assets and Liabilities. The amount of the investment is subsequently “marked-to-market” to reflect the current value of the option purchased. Realized and unrealized gains and losses on these contracts are included in the Statement of Operations. A risk in buying an option is that the Fund pays a premium whether or not the option is exercised. In addition, there can be no assurance that a liquid secondary market will exist for any option purchased.
| M. | Put Options Purchased and Written — The Fund may purchase and write put options including options on securities indexes, or foreign currency and/or futures contracts. By purchasing a put option, the Fund obtains the right (but not the obligation) to sell the option’s underlying instrument at a fixed strike price. In return for this right, the Fund pays an option premium. The option’s underlying instrument may be a security, securities index, or a futures contract. |
Additionally, the Fund may enter into an option on a swap agreement, also called a “swaption”. A swaption is an option that gives the buyer the right, but not the obligation, to enter into a swap on a future date in exchange for paying a market-based premium. A receiver swaption gives the owner the right to receive the total return of a specified asset, reference rate or index. Swaptions also include options that allow an existing swap to be terminated or extended by one of the Counterparties.
Put options may be used by the Fund to hedge securities it owns by locking in a minimum price at which the Fund can sell. If security prices fall, the put option could be exercised to offset all or a portion of the Fund’s resulting losses. At the same time, because the maximum the Fund has at risk is the cost of the option, purchasing put options does not eliminate the potential for the Fund to profit from an increase in the value of the underlying portfolio securities. The Fund may write put options to earn additional income in the form of option premiums if it expects the price of
19 Invesco International Total Return Fund
the underlying instrument to remain stable or rise during the option period so that the option will not be exercised. The risk in this strategy is that the price of the underlying securities may decline by an amount greater than the premium received. Put options written are reported as a liability in the Statement of Assets and Liabilities. Realized and unrealized gains and losses on these contracts are included in the Statement of Operations as Net realized gain from Investment securities. A risk in buying an option is that the Fund pays a premium whether or not the option is exercised. In addition, there can be no assurance that a liquid secondary market will exist for any option purchased.
| N. | Swap Agreements — The Fund may enter into various swap transactions, including interest rate, total return, index, currency and credit default swap contracts (“CDS”) for investment purposes or to manage interest rate, currency or credit risk. Such transactions are agreements between two parties (“Counterparties”). These agreements may contain among other conditions, events of default and termination events, and various covenants and representations such as provisions that require the Fund to maintain a pre-determined level of net assets, and/or provide limits regarding the decline of the Fund’s NAV over specific periods of time. If the Fund were to trigger such provisions and have open derivative positions at that time, the Counterparty may be able to terminate such agreement and request immediate payment in an amount equal to the net liability positions, if any. |
Interest rate, total return, index, and currency swap agreements are two-party contracts entered into primarily to exchange the returns (or differentials in rates of returns) earned or realized on particular predetermined investments or instruments. The gross returns to be exchanged or “swapped” between the parties are calculated with respect to a notional amount, i.e., the return on or increase in value of a particular dollar amount invested at a particular interest rate or return of an underlying asset, in a particular foreign currency, or in a “basket” of securities representing a particular index.
A CDS is an agreement between Counterparties to exchange the credit risk of an issuer. A buyer of a CDS is said to buy protection by paying a fixed payment over the life of the agreement and in some situations an upfront payment to the seller of the CDS. If a defined credit event occurs (such as payment default or bankruptcy), the Fund as a protection buyer would cease paying its fixed payment, the Fund would deliver eligible bonds issued by the reference entity to the seller, and the seller would pay the full notional value, or the “par value”, of the referenced obligation to the Fund. A seller of a CDS is said to sell protection and thus would receive a fixed payment over the life of the agreement and an upfront payment, if applicable. If a credit event occurs, the Fund as a protection seller would cease to receive the fixed payment stream, the Fund would pay the buyer “par value” or the full notional value of the referenced obligation, and the Fund would receive the eligible bonds issued by the reference entity. In turn, these bonds may be sold in order to realize a recovery value. Alternatively, the seller of the CDS and its Counterparty may agree to net the notional amount and the market value of the bonds and make a cash payment equal to the difference to the buyer of protection. If no credit event occurs, the Fund receives the fixed payment over the life of the agreement. As the seller, the Fund would effectively add leverage to its portfolio because, in addition to its total net assets, the Fund would be subject to investment exposure on the notional amount of the CDS. In connection with these agreements, cash and securities may be identified as collateral in accordance with the terms of the respective swap agreements to provide assets of value and recourse in the event of default under the swap agreement or bankruptcy/insolvency of a party to the swap agreement. If a Counterparty becomes bankrupt or otherwise fails to perform its obligations due to financial difficulties, the Fund may experience significant delays in obtaining any recovery in a bankruptcy or other reorganization proceeding. The Fund may obtain only limited recovery or may obtain no recovery in such circumstances. The Fund’s maximum risk of loss from Counterparty risk, either as the protection seller or as the protection buyer, is the value of the contract. The risk may be mitigated by having a master netting arrangement between the Fund and the Counterparty and by the designation of collateral by the Counterparty to cover the Fund’s exposure to the Counterparty.
Implied credit spreads represent the current level at which protection could be bought or sold given the terms of the existing CDS contract and serve as an indicator of the current status of the payment/performance risk of the CDS. An implied spread that has widened or increased since entry into the initial contract may indicate a deteriorating credit profile and increased risk of default for the reference entity. A declining or narrowing spread may indicate an improving credit profile or decreased risk of default for the reference entity. Alternatively, credit spreads may increase or decrease reflecting the general tolerance for risk in the credit markets.
An interest rate swap is an agreement between Counterparties pursuant to which the parties exchange a floating rate payment for a fixed rate payment based on a specified notional amount.
Changes in the value of swap agreements are recognized as unrealized gains (losses) in the Statement of Operations by “marking to market” on a daily basis to reflect the value of the swap agreement at the end of each trading day. Payments received or paid at the beginning of the agreement are reflected as such on the Statement of Assets and Liabilities and may be referred to as upfront payments. The Fund accrues for the fixed payment stream and amortizes upfront payments, if any, on swap agreements on a daily basis with the net amount, recorded as a component of realized gain (loss) on the Statement of Operations. A liquidation payment received or made at the termination of a swap agreement is recorded as realized gain (loss) on the Statement of Operations. The Fund segregates liquid securities having a value at least equal to the amount of the potential obligation of a Fund under any swap transaction. Entering into these agreements involves, to varying degrees, lack of liquidity and elements of credit, market, and Counterparty risk in excess of amounts recognized on the Statement of Assets and Liabilities. Such risks involve the possibility that a swap is difficult to sell or liquidate; the Counterparty does not honor its obligations under the agreement and unfavorable interest rates and market fluctuations. It is possible that developments in the swaps market, including potential government regulation, could adversely affect the Fund’s ability to terminate existing swap agreements or to realize amounts to be received under such agreements. A short position in a security poses more risk than holding the same security long. As there is no limit on how much the price of the security can increase, the Fund’s exposure is unlimited.
| O. | Collateral — To the extent the Fund has designated or segregated a security as collateral and that security is subsequently sold, it is the Fund’s practice to replace such collateral no later than the next business day. |
20 Invesco International Total Return Fund
NOTE 2—Advisory Fees and Other Fees Paid to Affiliates
The Trust has entered into a master investment advisory agreement with Invesco Advisers, Inc. (the “Adviser” or “Invesco”). Under the terms of the investment advisory agreement, the Fund pays an advisory fee to the Adviser based on the annual rate of the Fund’s average daily net assets as follows:
| | | | | | |
| Average Daily Net Assets | | Rate |
First $250 million | | | 0 | .65% | | |
Next $250 million | | | 0 | .59% | | |
Next $500 million | | | 0 | .565% | | |
Next $1.5 billion | | | 0 | .54% | | |
Next $2.5 billion | | | 0 | .515% | | |
Next $5 billion | | | 0 | .49% | | |
Over $10 billion | | | 0 | .465% | | |
For the year ended October 31, 2015, the effective advisory fees incurred by the Fund was 0.65%.
Under the terms of a master sub-advisory agreement between the Adviser and each of Invesco Asset Management Deutschland GmbH, Invesco Asset Management Limited, Invesco Asset Management (Japan) Limited, Invesco Hong Kong Limited, Invesco Senior Secured Management, Inc. and Invesco Canada Ltd. (collectively, the “Affiliated Sub-Advisers”) the Adviser, not the Fund, may pay 40% of the fees paid to the Adviser to any such Affiliated Sub-Adviser(s) that provide(s) discretionary investment management services to the Fund based on the percentage of assets allocated to such Affiliated Sub-Adviser(s).
The Adviser has contractually agreed, through at least February 28, 2017, to waive advisory fees and/or reimburse expenses to the extent necessary to limit total annual fund operating expenses after fee waiver and/or expense reimbursement (excluding certain items discussed below) of Class A, Class B, Class C, Class Y, Class R5 and Class R6 shares to 1.10%, 1.85%, 1.85%, 0.85%, 0.85% and 0.85% of average daily net assets, respectively. In determining the Adviser’s obligation to waive advisory fees and/or reimburse expenses, the following expenses are not taken into account, and could cause total annual fund operating expenses after fee waiver and/or expense reimbursement to exceed the numbers reflected above: (1) interest; (2) taxes; (3) dividend expense on short sales; (4) extraordinary or non-routine items, including litigation expenses; and (5) expenses that the Fund has incurred but did not actually pay because of an expense offset arrangement. Unless Invesco continues the fee waiver agreement, it will terminate on February 28, 2017. The fee waiver agreement cannot be terminated during its term.
Further, the Adviser has contractually agreed, through at least June 30, 2017, to waive the advisory fee payable by the Fund in an amount equal to 100% of the net advisory fees the Adviser receives from the affiliated money market funds on investments by the Fund of uninvested cash in such affiliated money market funds.
For the year ended October 31, 2015, the Adviser waived advisory fees of $170,581 and reimbursed class level expenses of $88,391, $3,948, $16,820, $7,236, and $157 of Class A, Class B, Class C, Class Y and Class R6 shares, respectively.
The Trust has entered into a master administrative services agreement with Invesco pursuant to which the Fund has agreed to pay Invesco for certain administrative costs incurred in providing accounting services to the Fund. For the year ended October 31, 2015, expenses incurred under the agreement are shown in the Statement of Operations as Administrative services fees.
The Trust has entered into a transfer agency and service agreement with Invesco Investment Services, Inc. (“IIS”) pursuant to which the Fund has agreed to pay IIS a fee for providing transfer agency and shareholder services to the Fund and reimburse IIS for certain expenses incurred by IIS in the course of providing such services. IIS may make payments to intermediaries that provide omnibus account services, sub-accounting services and/or networking services. All fees payable by IIS to intermediaries that provide omnibus account services or sub-accounting are charged back to the Fund, subject to certain limitations approved by the Trust’s Board of Trustees. For the year ended October 31, 2015, expenses incurred under the agreement are shown in the Statement of Operations as Transfer agent fees.
The Trust has entered into master distribution agreements with Invesco Distributors, Inc. (“IDI”) to serve as the distributor for the Class A, Class B, Class C, Class Y, Class R5 and Class R6 shares of the Fund. The Trust has adopted plans pursuant to Rule 12b-1 under the 1940 Act with respect to the Fund’s Class A, Class B and Class C shares (collectively, the “Plans”). The Fund, pursuant to the Plans, pays IDI compensation at the annual rate of 0.25% of the Fund’s average daily net assets of Class A shares and 1.00% of the average daily net assets of Class B and Class C shares. Of the Plan payments, up to 0.25% of the average daily net assets of each class of shares may be paid to furnish continuing personal shareholder services to customers who purchase and own shares of such classes. Any amounts not paid as a service fee under the Plans would constitute an asset-based sales charge. Rules of the Financial Industry Regulatory Authority (“FINRA”) impose a cap on the total sales charges, including asset-based sales charges, that may be paid by any class of shares of the Fund. For the year ended October 31, 2015, expenses incurred under the Plans are shown in the Statement of Operations as Distribution fees.
Front-end sales commissions and CDSC (collectively, the “sales charges”) are not recorded as expenses of the Fund. Front-end sales commissions are deducted from proceeds from the sales of Fund shares prior to investment in Class A shares of the Fund. CDSC are deducted from redemption proceeds prior to remittance to the shareholder. During the year ended October 31, 2015, IDI advised the Fund that IDI retained $4,506 in front-end sales commissions from the sale of Class A shares and $256, $2,159 and $327 from Class A, Class B and Class C shares, respectively, for CDSC imposed on redemptions by shareholders.
Certain officers and trustees of the Trust are officers and directors of the Adviser, IIS and/or IDI.
21 Invesco International Total Return Fund
NOTE 3—Additional Valuation Information
GAAP defines fair value as the price that would be received to sell an asset or paid to transfer a liability in an orderly transaction between market participants at the measurement date, under current market conditions. GAAP establishes a hierarchy that prioritizes the inputs to valuation methods, giving the highest priority to readily available unadjusted quoted prices in an active market for identical assets (Level 1) and the lowest priority to significant unobservable inputs (Level 3), generally when market prices are not readily available or are unreliable. Based on the valuation inputs, the securities or other investments are tiered into one of three levels. Changes in valuation methods may result in transfers in or out of an investment’s assigned level:
| | Level 1 — | Prices are determined using quoted prices in an active market for identical assets. |
| | Level 2 — | Prices are determined using other significant observable inputs. Observable inputs are inputs that other market participants may use in pricing a security. These may include quoted prices for similar securities, interest rates, prepayment speeds, credit risk, yield curves, loss severities, default rates, discount rates, volatilities and others. |
| | Level 3 — | Prices are determined using significant unobservable inputs. In situations where quoted prices or observable inputs are unavailable (for example, when there is little or no market activity for an investment at the end of the period), unobservable inputs may be used. Unobservable inputs reflect the Fund’s own assumptions about the factors market participants would use in determining fair value of the securities or instruments and would be based on the best available information. |
The following is a summary of the tiered valuation input levels, as of October 31, 2015. The level assigned to the securities valuations may not be an indication of the risk or liquidity associated with investing in those securities. Because of the inherent uncertainties of valuation, the values reflected in the financial statements may materially differ from the value received upon actual sale of those investments.
| | | | | | | | | | | | | | | | |
| | | Level 1 | | | Level 2 | | | Level 3 | | | Total | |
Equity Securities | | $ | 1,083,637 | | | $ | — | | | $ | — | | | $ | 1,083,637 | |
Collateralized Mortgage Obligations | | | — | | | | 2,801,280 | | | | — | | | | 2,801,280 | |
Corporate Debt Securities | | | — | | | | 19,919,207 | | | | — | | | | 19,919,207 | |
Foreign Sovereign Debt Securities | | | — | | | | 26,776,987 | | | | — | | | | 26,776,987 | |
Options Purchased | | | — | | | | 5,940 | | | | — | | | | 5,940 | |
| | | | 1,083,637 | | | | 49,503,414 | | | | — | | | | 50,587,051 | |
Forward Foreign Currency Contracts* | | | — | | | | (31,936 | ) | | | — | | | | (31,936 | ) |
Futures Contracts* | | | 19,926 | | | | — | | | | — | | | | 19,926 | |
Options Written* | | | — | | | | (6,525 | ) | | | — | | | | (6,525 | ) |
Total Investments | | $ | 1,103,563 | | | $ | 49,464,953 | | | $ | — | | | $ | 50,568,516 | |
| * | Forward foreign currency contracts and futures contracts are valued at unrealized appreciation (depreciation). Options written are shown at value. |
NOTE 4—Derivative Investments
Value of Derivative Investments at Period-End
The table below summarizes the value of the Fund’s derivative investments, detailed by primary risk exposure, held as of October 31, 2015:
| | | | | | | | |
| | | Value | |
| Risk Exposure/Derivative Type | | Assets | | | Liabilities | |
Currency risk: | | | | | | | | |
Forward foreign currency contracts(a) | | $ | 95,468 | | | $ | (127,404 | ) |
Options purchased(b) | | | 5,940 | | | | — | |
Options written(c) | | | — | | | | (6,525 | ) |
Interest rate risk: | | | | | | | | |
Futures contracts(d) | | | 31,698 | | | | (11,772 | ) |
Total | | $ | 133,106 | | | $ | (145,701 | ) |
| (a) | Values are disclosed on the Statement of Assets and Liabilities under the captions Unrealized appreciation on forward foreign currency contracts outstanding and Unrealized depreciation on forward foreign currency contracts outstanding. |
| (b) | Options purchased at value as reported in the Schedule of Investments. |
| (c) | Values are disclosed on the Statement of Assets and Liabilities under the caption Options written, at value. |
| (d) | Includes cumulative appreciation (depreciation) of futures contracts. Only current day’s variation margin receivable is reported within the Statement of Assets and Liabilities. |
22 Invesco International Total Return Fund
Effect of Derivative Investments for the year ended October 31, 2015
The table below summarizes the gains (losses) on derivative investments, detailed by primary risk exposure, recognized in earnings during the period:
| | | | | | | | | | | | | | | | | | | | |
| | | Location of Gain (Loss) on
Statement of Operations | |
| | Forward
Foreign Currency
Contracts | | | Futures
Contracts | | | Options
Purchased(a) | | | Options
Written | | | Swap
Agreements | |
Realized Gain (Loss): | | | | | | | | | | | | | | | | | | | | |
Currency risk | | $ | 167,776 | | | $ | — | | | $ | 80,396 | | | $ | 49,997 | | | $ | — | |
Interest rate risk | | | — | | | | (916,220 | ) | | | — | | | | — | | | | — | |
Market risk | | | — | | | | — | | | | — | | | | — | | | | (1,246 | ) |
Change in Net Unrealized Appreciation (Depreciation): | | | | | | | | | | | | | | | | | | | | |
Currency risk | | | 47,932 | | | | — | | | | (15,826 | ) | | | 9,698 | | | | — | |
Interest rate risk | | | — | | | | 72,949 | | | | — | | | | — | | | | — | |
Total | | $ | 215,708 | | | $ | (843,271 | ) | | $ | 64,570 | | | $ | 59,695 | | | $ | (1,246 | ) |
| (a) | Options purchased are included in the net realized gain (loss) from investment securities and the change in net unrealized appreciation (depreciation) of investment securities. |
The table below summarizes the twelve month average notional value of forward foreign currency contracts, futures contracts, options purchased, the eleven month average notional value of options written and the one month average notional value of swap agreements outstanding during the period.
| | | | | | | | | | | | | | | | | | | | |
| | | Forward
Foreign Currency
Contracts | | | Futures
Contracts | | | Options
Purchased | | | Options
Written | | | Swap
Agreements | |
Average notional value | | $ | 46,527,083 | | | $ | 20,969,807 | | | $ | 5,228,576 | | | $ | 2,338,021 | | | $ | 1,666,000 | |
| | | | | | | | | | | | | | | | | | | | | | | | | | |
| Open Forward Foreign Currency Contracts | |
Settlement
Date | | | | Contract to | | | Notional
Value | | | Unrealized
Appreciation
(Depreciation) | |
| | Counterparty | | Deliver | | | Receive | | | |
01/29/16 | | Citigroup Global Markets Inc. | | | CAD | | | | 500,000 | | | | USD | | | | 380,128 | | | $ | 382,165 | | | $ | (2,037 | ) |
01/29/16 | | Citigroup Global Markets Inc. | | | CAD | | | | 200,000 | | | | USD | | | | 152,823 | | | | 152,866 | | | | (43 | ) |
01/29/16 | | Citigroup Global Markets Inc. | | | MYR | | | | 2,000,000 | | | | USD | | | | 470,588 | | | | 463,709 | | | | 6,879 | |
01/29/16 | | Citigroup Global Markets Inc. | | | MYR | | | | 1,500,000 | | | | USD | | | | 344,827 | | | | 347,782 | | | | (2,955 | ) |
01/29/16 | | Citigroup Global Markets Inc. | | | NOK | | | | 8,310,018 | | | | USD | | | | 996,405 | | | | 976,775 | | | | 19,630 | |
01/29/16 | | Citigroup Global Markets Inc. | | | USD | | | | 193,704 | | | | GBP | | | | 126,181 | | | | 194,478 | | | | 774 | |
01/29/16 | | Deutsche Bank Securities Inc. | | | USD | | | | 409,979 | | | | SEK | | | | 3,476,872 | | | | 408,016 | | | | (1,963 | ) |
06/13/16 | | Deutsche Bank Securities Inc. | | | CNY | | | | 2,157,810 | | | | USD | | | | 338,003 | | | | 334,733 | | | | 3,270 | |
06/13/16 | | Deutsche Bank Securities Inc. | | | CNY | | | | 6,533,500 | | | | USD | | | | 1,000,000 | | | | 1,013,518 | | | | (13,518 | ) |
06/13/16 | | Deutsche Bank Securities Inc. | | | USD | | | | 340,000 | | | | CNY | | | | 2,157,810 | | | | 334,733 | | | | (5,267 | ) |
01/29/16 | | Goldman Sachs International | | | AUD | | | | 1,549,000 | | | | USD | | | | 1,118,967 | | | | 1,099,666 | | | | 19,301 | |
01/29/16 | | Goldman Sachs International | | | AUD | | | | 750,000 | | | | JPY | | | | 63,956,250 | | | | 531,154 | | | | (1,452 | ) |
01/29/16 | | Goldman Sachs International | | | AUD | | | | 750,000 | | | | USD | | | | 529,924 | | | | 532,440 | | | | (2,516 | ) |
01/29/16 | | Goldman Sachs International | | | CAD | | | | 978,087 | | | | USD | | | | 743,687 | | | | 747,581 | | | | (3,894 | ) |
01/29/16 | | Goldman Sachs International | | | JPY | | | | 64,446,831 | | | | USD | | | | 533,446 | | | | 535,061 | | | | (1,615 | ) |
01/29/16 | | Goldman Sachs International | | | JPY | | | | 130,000,000 | | | | USD | | | | 1,075,874 | | | | 1,079,307 | | | | (3,433 | ) |
01/29/16 | | Goldman Sachs International | | | PLN | | | | 2,000,000 | | | | USD | | | | 531,973 | | | | 516,319 | | | | 15,654 | |
01/29/16 | | Goldman Sachs International | | | PLN | | | | 1,500,000 | | | | USD | | | | 382,868 | | | | 387,239 | | | | (4,371 | ) |
01/29/16 | | Goldman Sachs International | | | SGD | | | | 2,080,500 | | | | USD | | | | 1,489,161 | | | | 1,480,749 | | | | 8,412 | |
01/29/16 | | Goldman Sachs International | | | TRY | | | | 1,000,000 | | | | USD | | | | 331,444 | | | | 334,004 | | | | (2,560 | ) |
01/29/16 | | Goldman Sachs International | | | USD | | | | 5,969,989 | | | | EUR | | | | 5,393,617 | | | | 5,942,307 | | | | (27,682 | ) |
01/29/16 | | Goldman Sachs International | | | USD | | | | 6,335,803 | | | | JPY | | | | 764,763,739 | | | | 6,349,346 | | | | 13,543 | |
01/29/16 | | Goldman Sachs International | | | USD | | | | 936,990 | | | | MXN | | | | 15,560,888 | | | | 935,718 | | | | (1,272 | ) |
01/29/16 | | Goldman Sachs International | | | USD | | | | 674,190 | | | | NZD | | | | 1,000,000 | | | | 672,681 | | | | (1,509 | ) |
01/29/16 | | Goldman Sachs International | | | USD | | | | 618,238 | | | | RUB | | | | 40,000,000 | | | | 609,858 | | | | (8,380 | ) |
01/29/16 | | Goldman Sachs International | | | USD | | | | 852,818 | | | | SGD | | | | 1,200,000 | | | | 854,073 | | | | 1,255 | |
01/29/16 | | Goldman Sachs International | | | USD | | | | 722,403 | | | | ZAR | | | | 10,000,000 | | | | 710,604 | | | | (11,799 | ) |
23 Invesco International Total Return Fund
| | | | | | | | | | | | | | | | | | | | | | | | | | |
| Open Forward Foreign Currency Contracts — (continued) | |
Settlement
Date | | | | Contract to | | | Notional
Value | | | Unrealized
Appreciation
(Depreciation) | |
| | Counterparty | | Deliver | | | Receive | | | |
10/24/16 | | Goldman Sachs International | | | CNY | | | | 3,212,750 | | | | USD | | | | 491,886 | | | $ | 494,825 | | | $ | (2,939 | ) |
11/13/15 | | Goldman Sachs International | | | CNY | | | | 3,259,500 | | | | USD | | | | 500,000 | | | | 514,735 | | | | (14,735 | ) |
12/11/15 | | Goldman Sachs International | | | CNY | | | | 3,242,500 | | | | USD | | | | 496,631 | | | | 510,095 | | | | (13,464 | ) |
01/29/16 | | JPMorgan Chase Bank, N.A. | | | KRW | | | | 700,000,000 | | | | USD | | | | 616,740 | | | | 611,245 | | | | 5,495 | |
01/29/16 | | JPMorgan Chase Bank, N.A. | | | KRW | | | | 500,000,000 | | | | USD | | | | 437,859 | | | | 436,604 | | | | 1,255 | |
Total Open Forward Foreign Currency Contracts — Currency Risk | | | $ | (31,936 | ) |
Currency Abbreviations:
| | |
| AUD | | – Australian Dollar |
| CAD | | – Canadian Dollar |
| CNY | | – Chinese Yuan |
| EUR | | – Euro |
| GBP | | – British Pound Sterling |
| | |
| JPY | | – Japanese Yen |
| KRW | | – South Korean Won |
| MXN | | – Mexican Peso |
| MYR | | – Malaysian Ringgit |
| NOK | | – Norwegian Krone |
| | |
| NZD | | – New Zealand Dollar |
| PLN | | – Polish Zloty |
| RUB | | – Russian Rouble |
| SEK | | – Swedish Krona |
| SGD | | – Singapore Dollar |
| | |
| TRY | | – New Turkish Lira |
| USD | | – U.S. Dollar |
| ZAR | | – South African Rand |
| | | | | | | | | | | | | | | | | | | | |
| Open Futures Contracts(a) | |
| Futures Contracts | | Type of
Contract | | | Number of
Contracts | | | Expiration
Month | | | Notional
Value | | | Unrealized
Appreciation
(Depreciation) | |
U.S. Treasury 10 Year Notes | | | Short | | | | 26 | | | | December-2015 | | | $ | (3,319,875 | ) | | $ | 30,412 | |
U.S. Ultra Bond | | | Short | | | | 12 | | | | December-2015 | | | | (1,917,000 | ) | | | 1,286 | |
Euro Bonds | | | Short | | | | 9 | | | | December-2015 | | | | (1,561,002 | ) | | | (11,772 | ) |
Total futures contracts — Interest Rate Risk | | | | | | | | | | | | | | | | | | $ | 19,926 | |
| (a) | Futures contracts collateralized by $144,876 cash held with Bank of America Merrill Lynch, the futures commission merchant. |
| | | | | | | | | | | | | | | | | | | | | | | | | | | | | | | | | | | | | | |
| Open Over-The-Counter Foreign Currency Options Written | |
| Description | | Type of
Contract | | | Counterparty | | Expiration
Date | | | Strike
Price | | | Premiums
Received | | | Notional Value | | | Value | | | Unrealized Appreciation | |
USD versus CNY | | | Call | | | Goldman Sachs International | | | 11/11/15 | | | | CNY | | | | 6.80 | | | $ | 2,744 | | | | USD | | | | 500,000 | | | $ | 36 | | | $ | 2,708 | |
USD versus CNY | | | Call | | | Goldman Sachs International | | | 02/05/16 | | | | CNY | | | | 6.80 | | | | 4,919 | | | | USD | | | | 500,000 | | | | 1,437 | | | | 3,482 | |
USD versus CNY | | | Call | | | Goldman Sachs International | | | 11/13/15 | | | | CNY | | | | 6.80 | | | | 2,500 | | | | USD | | | | 500,000 | | | | 45 | | | | 2,455 | |
USD versus CNY | | | Call | | | Deutsche Bank Securities Inc. | | | 01/21/16 | | | | CNY | | | | 6.55 | | | | 6,060 | | | | USD | | | | 1,000,000 | | | | 5,007 | | | | 1,053 | |
Total Foreign Currency Options Written — Currency Risk | | | $ | 16,223 | | | | | | | $ | 6,525 | | | $ | 9,698 | |
| | | | | | | | | | | | | | | | | | | | | | | | | | | | | | | | | | | | | | | | |
| Options Written Transactions | |
| | | Call Options | | | Put Options | |
| | | Notional
Value | | | Notional
Value | | | Premiums
Received | | | Notional
Value | | | Notional
Value | | | Premiums
Received | |
Beginning of period | | | | | | | — | | | | | | | | — | | | | — | | | | | | | | — | | | | | | | | — | | | | — | |
Written | | | USD | | | | 9,800,000 | | | | CHF | | | | 1,100,000 | | | $ | 54,728 | | | | CHF | | | | 1,100,000 | | | | EUR | | | | 2,000,000 | | | $ | 68,582 | |
Closed | | | USD | | | | (5,300,000 | ) | | | CHF | | | | (1,100,000 | ) | | | (34,425 | ) | | | CHF | | | | — | | | | EUR | | | | (2,000,000 | ) | | | (6,440 | ) |
Exercised | | | USD | | | | — | | | | CHF | | | | — | | | | — | | | | CHF | | | | — | | | | EUR | | | | — | | | | — | |
Expired | | | USD | | | | (2,000,000 | ) | | | CHF | | | | — | | | | (4,080 | ) | | | CHF | | | | (1,100,000 | ) | | | EUR | | | | — | | | | (62,142 | ) |
End of period | | | USD | | | | 2,500,000 | | | | CHF | | | | — | | | $ | 16,223 | | | | CHF | | | | — | | | | EUR | | | | — | | | $ | — | |
Currency abbreviations:
| | |
| CHF | | – Swiss Franc |
| CNY | | – Chinese Yuan |
| EUR | | – Euro |
| USD | | – U.S. Dollar |
24 Invesco International Total Return Fund
Offsetting Assets and Liabilities
Accounting Standards Update (“ASU”) No. 2011-11, Disclosures about Offsetting Assets and Liabilities, which was subsequently clarified in Financial Accounting Standards Board ASU 2013-01 “Clarifying the Scope of Disclosures about Offsetting Assets and Liabilities” is intended to enhance disclosures about financial instruments and derivative instruments that are subject to offsetting arrangements on the Statement of Assets and Liabilities and to enable investors to better understand the effect of those arrangements on the Fund’s financial position. In order for an arrangement to be eligible for netting, the Fund must have a basis to conclude that such netting arrangements are legally enforceable. The Fund enters into netting agreements and collateral agreements in an attempt to reduce the Fund’s Counterparty credit risk by providing for a single net settlement with a Counterparty of all financial transactions covered by the agreement in an event of default as defined under such agreement.
The following tables present derivative instruments that are either subject to an enforceable netting agreement or offset by collateral arrangements as of October 31, 2015.
| | | | | | | | | | | | | | | | | | | | |
Counterparty | | Gross
amounts of
Recognized
Assets | | | Gross Amounts Not Offset in the
Statement of Assets and Liabilities | | | Net
Amount | |
| | | Financial
Instruments | | | Collateral Received | | |
| | | | Non-Cash | | | Cash | | |
Citigroup Global Markets Inc.(a) | | $ | 27,283 | | | $ | (5,035 | ) | | $ | — | | | $ | — | | | $ | 22,248 | |
Deutsche Bank Securities Inc.(a) | | | 3,270 | | | | (3,270 | ) | | | — | | | | — | | | | — | |
Goldman Sachs International(a) | | | 58,165 | | | | (58,165 | ) | | | — | | | | — | | | | — | |
JPMorgan Chase Bank, N.A.(a) | | | 6,750 | | | | — | | | | — | | | | — | | �� | | 6,750 | |
Deutsche Bank Securities Inc.(b) | | | 80 | | | | — | | | | — | | | | — | | | | 80 | |
Morgan Stanley & Co. LLC(b) | | | 5,860 | | | | — | | | | — | | | | — | | | | 5,860 | |
Total | | $ | 101,408 | | | $ | (66,470 | ) | | $ | — | | | $ | — | | | $ | 34,938 | |
| | | | | | | | | | | | | | | | | | | | |
Counterparty | | Gross
amounts of
Recognized
Liabilities | | | Gross Amounts Not Offset in the
Statement of Assets and Liabilities | | | Net
Amount | |
| | | Financial
Instruments | | | Collateral Pledged | | |
| | | | Non-Cash | | | Cash | | |
Citigroup Global Markets Inc.(a) | | $ | 5,035 | | | $ | (5,035 | ) | | $ | — | | | $ | — | | | $ | — | |
Deutsche Bank Securities Inc.(a) | | | 20,748 | | | | (3,270 | ) | | | — | | | | — | | | | 17,478 | |
Goldman Sachs International(a) | | | 101,621 | | | | (58,165 | ) | | | — | | | | — | | | | 43,456 | |
Goldman Sachs International(c) | | | 1,518 | | | | — | | | | — | | | | — | | | | 1,518 | |
Deutsche Bank Securities Inc.(c) | | | 5,007 | | | | — | | | | — | | | | — | | | | 5,007 | |
Total | | $ | 133,929 | | | $ | (66,470 | ) | | $ | — | | | $ | — | | | $ | 67,459 | |
| (a) | Forward foreign currency contracts Counterparty. |
| (b) | Options purchased — OTC Counterparty. |
| (c) | Options written — OTC Counterparty. |
NOTE 5—Expense Offset Arrangement(s)
The expense offset arrangement is comprised of transfer agency credits which result from balances in demand deposit accounts used by the transfer agent for clearing shareholder transactions. For the year ended October 31, 2015, the Fund received credits from this arrangement, which resulted in the reduction of the Fund’s total expenses of $412.
NOTE 6—Trustees’ and Officers’ Fees and Benefits
Trustees’ and Officers’ Fees and Benefits include amounts accrued by the Fund to pay remuneration to certain Trustees and Officers of the Fund. Trustees have the option to defer compensation payable by the Fund, and Trustees’ and Officers’ Fees and Benefits also include amounts accrued by the Fund to fund such deferred compensation amounts. Those Trustees who defer compensation have the option to select various Invesco Funds in which their deferral accounts shall be deemed to be invested. Finally, certain current Trustees were eligible to participate in a retirement plan that provided for benefits to be paid upon retirement to Trustees over a period of time based on the number of years of service. The Fund may have certain former Trustees who also participate in a retirement plan and receive benefits under such plan. Trustees’ and Officers’ Fees and Benefits include amounts accrued by the Fund to fund such retirement benefits. Obligations under the deferred compensation and retirement plans represent unsecured claims against the general assets of the Fund.
NOTE 7—Cash Balances
The Fund may borrow for leveraging in an amount up to 5% of the Fund’s total assets (excluding the amount borrowed) at the time the borrowing is made. In doing so, the Fund is permitted to temporarily carry a negative or overdrawn balance in its account with State Street Bank and Trust Company, the custodian bank. Such balances, if any at period end, are shown in the Statement of Assets and Liabilities under the payable caption Amount due custodian. To compensate the custodian bank for such overdrafts, the overdrawn Fund may either (1) leave funds as a compensating balance in the account so the custodian bank can be compensated by earning the additional interest; or (2) compensate by paying the custodian bank at a rate agreed upon by the custodian bank and Invesco, not to exceed the contractually agreed upon rate. The Fund may not purchase additional securities when any borrowings from banks exceed 5% of the Fund’s total assets.
25 Invesco International Total Return Fund
NOTE 8—Distributions to Shareholders and Tax Components of Net Assets
Tax Character of Distributions to Shareholders Paid During the Fiscal Years Ended October 31, 2015 and 2014:
| | | | | | | | |
| | | 2015 | | | 2014 | |
Ordinary income | | $ | 767,377 | | | $ | 751,443 | |
Long-term capital gain | | | — | | | | 793,702 | |
Return of capital | | | 645,161 | | | | — | |
Total distributions | | $ | 1,412,538 | | | $ | 1,545,145 | |
Tax Components of Net Assets at Period-End:
| | | | |
| | | 2015 | |
Net unrealized appreciation (depreciation) — investments | | $ | (2,566,056 | ) |
Net unrealized appreciation — other investments | | | 27,564 | |
Temporary book/tax differences | | | (34,693 | ) |
Capital loss carryforward | | | (602,929 | ) |
Shares of beneficial interest | | | 56,627,962 | |
Total net assets | | $ | 53,451,848 | |
The difference between book-basis and tax-basis unrealized appreciation (depreciation) is due to differences in the timing of recognition of gains and losses on investments for tax and book purposes. The Fund’s net unrealized appreciation (depreciation) difference is attributable primarily to wash sales.
The temporary book/tax differences are a result of timing differences between book and tax recognition of income and/or expenses. The Fund’s temporary book/tax differences are the result of the trustee deferral of compensation and retirement plan benefits.
Capital loss carryforward is calculated and reported as of a specific date. Results of transactions and other activity after that date may affect the amount of capital loss carryforward actually available for the Fund to utilize. Capital losses generated in years beginning after December 22, 2010 can be carried forward for an unlimited period, whereas previous losses expire in eight tax years. Capital losses with an expiration period may not be used to offset capital gains until all net capital losses without an expiration date have been utilized. Capital loss carryforwards with no expiration date will retain their character as either short-term or long-term capital losses instead of as short-term capital losses as under prior law. The ability to utilize capital loss carryforwards in the future may be limited under the Internal Revenue Code and related regulations based on the results of future transactions.
The Fund has a capital loss carryforward as of October 31, 2015, which expires as follows:
| | | | | | | | | | | | |
| Capital Loss Carryforward* | |
| Expiration | | Short-Term | | | Long-Term | | | Total | |
Not subject to expiration | | $ | — | | | $ | 602,929 | | | $ | 602,929 | |
| * | Capital loss carryforward as of the date listed above is reduced for limitations, if any, to the extent required by the Internal Revenue Code and may be further limited depending upon a variety of factors, including the realization of net unrealized gains or losses as of the date of any reorganization. |
NOTE 9—Investment Securities
The aggregate amount of investment securities (other than short-term securities, U.S. Treasury obligations and money market funds, if any) purchased and sold by the Fund during the year ended October 31, 2015 was $70,442,729 and $72,740,132, respectively. Cost of investments on a tax basis includes the adjustments for financial reporting purposes as of the most recently completed federal income tax reporting period-end.
| | | | |
| Unrealized Appreciation (Depreciation) of Investment Securities on a Tax Basis | |
Aggregate unrealized appreciation of investment securities | | $ | 687,903 | |
Aggregate unrealized (depreciation) of investment securities | | | (3,253,959 | ) |
Net unrealized appreciation (depreciation) of investment securities | | $ | (2,566,056 | ) |
Cost of investments for tax purposes is $53,153,107.
NOTE 10—Reclassification of Permanent Differences
Primarily as a result of differing book/tax treatment of foreign currency transactions, options, return of capital and net operating loss, on October 31, 2015, undistributed net investment income was decreased by $617,533, undistributed net realized gain (loss) was increased by $2,866,618 and shares of beneficial interest was decreased by $2,249,085. This reclassification had no effect on the net assets of the Fund.
26 Invesco International Total Return Fund
NOTE 11—Share Information
| | | | | | | | | | | | | | | | |
| | | Summary of Share Activity | |
| | | Years ended October 31, | |
| | | 2015(a) | | | 2014 | |
| | | Shares | | | Amount | | | Shares | | | Amount | |
Sold: | | | | | | | | | | | | | | | | |
Class A | | | 559,131 | | | $ | 5,613,328 | | | | 873,924 | | | $ | 9,646,186 | |
Class B | | | 2,353 | | | | 23,757 | | | | 12,209 | | | | 135,159 | |
Class C | | | 140,867 | | | | 1,399,589 | | | | 226,250 | | | | 2,495,660 | |
Class Y | | | 50,488 | | | | 513,631 | | | | 445,420 | | | | 4,940,833 | |
Class R5 | | | 540 | | | | 5,481 | | | | 6,347 | | | | 70,569 | |
Class R6 | | | 757,993 | | | | 7,670,289 | | | | 381,785 | | | | 4,207,536 | |
| | | | |
Issued as reinvestment of dividends: | | | | | | | | | | | | | | | | |
Class A | | | 69,310 | | | | 709,542 | | | | 82,518 | | | | 894,078 | |
Class B | | | 2,631 | | | | 27,181 | | | | 5,314 | | | | 57,314 | |
Class C | | | 9,824 | | | | 101,226 | | | | 11,145 | | | | 120,169 | |
Class Y | | | 6,150 | | | | 63,098 | | | | 4,004 | | | | 43,516 | |
Class R5 | | | 188 | | | | 1,953 | | | | 717 | | | | 7,759 | |
Class R6 | | | 41,767 | | | | 425,144 | | | | 29,168 | | | | 316,211 | |
| | | | |
Automatic conversion of Class B shares to Class A shares: | | | | | | | | | | | | | | | | |
Class A | | | 34,527 | | | | 347,816 | | | | 43,428 | | | | 478,998 | |
Class B | | | (34,569 | ) | | | (347,816 | ) | | | (43,477 | ) | | | (478,998 | ) |
| | | | |
Reacquired: | | | | | | | | | | | | | | | | |
Class A | | | (1,040,878 | ) | | | (10,445,553 | ) | | | (911,714 | ) | | | (10,010,389 | ) |
Class B | | | (54,554 | ) | | | (551,284 | ) | | | (56,118 | ) | | | (614,151 | ) |
Class C | | | (247,025 | ) | | | (2,470,576 | ) | | | (134,146 | ) | | | (1,475,204 | ) |
Class Y | | | (350,943 | ) | | | (3,602,871 | ) | | | (68,813 | ) | | | (749,806 | ) |
Class R5 | | | (11,766 | ) | | | (121,053 | ) | | | (21,419 | ) | | | (238,508 | ) |
Class R6 | | | (9,013 | ) | | | (93,104 | ) | | | (13,494 | ) | | | (149,441 | ) |
Net increase (decrease) in share activity | | | (72,979 | ) | | $ | (730,222 | ) | | | 873,048 | | | $ | 9,697,491 | |
| (a) | There is an entity that is a record owner of more than 5% of the outstanding shares of the Fund and owns 15% of the outstanding shares of the Fund. IDI has an agreement with this entity to sell Fund shares. The Fund, Invesco and/or Invesco affiliates may make payments to this entity, which is considered to be related to the Fund, for providing services to the Fund, Invesco and/or Invesco affiliates including but not limited to services such as securities brokerage, distribution, third party record keeping and account servicing. The Fund has no knowledge as to whether all or any portion of the shares owned of record by this entity are also owned beneficially. |
| | In addition, 36% of the outstanding shares of the Fund are owned by an affiliated mutual fund. Affiliated mutual funds are mutual funds that are advised by Invesco. |
27 Invesco International Total Return Fund
NOTE 12—Financial Highlights
The following schedule presents financial highlights for a share of the Fund outstanding throughout the periods indicated.
| | | | | | | | | | | | | | | | | | | | | | | | | | | | | | | | | | | | | | | | | | | | | | | | | | | | | | | | | | | | |
| | | Net asset
value,
beginning
of period | | | Net
investment
income(a) | | | Net gains
(losses)
on securities
(both
realized and
unrealized) | | | Total from
investment
operations | | | Dividends
from net
investment
income | | | Distributions
from net
realized
gains | | | Return of
Capital | | | Total
distributions | | | Net asset
value, end
of period(b) | | | Total
return(c) | | | Net assets,
end of period
(000’s omitted) | | | Ratio of
expenses
to average
net assets
with fee waivers
and/or expenses
absorbed | | | Ratio of
expenses
to average net
assets without
fee waivers
and/or expenses
absorbed | | | Ratio of net
investment
income
to average
net assets | | | Portfolio
turnover(d) | |
Class A | | | | | | | | | | | | | | | | | | | | | | | | | | | | | | | | | | | | | | | | | | | | | | | | | | | | | | | | | | | | |
Year ended 10/31/15 | | $ | 10.63 | | | $ | 0.18 | | | $ | (0.74 | ) | | $ | (0.56 | ) | | $ | — | | | $ | (0.14 | ) | | $ | (0.12 | ) | | $ | (0.26 | ) | | $ | 9.81 | | | | (5.38 | )% | | $ | 26,426 | | | | 1.10 | %(e) | | | 1.72 | %(e) | | | 1.79 | %(e) | | | 135 | % |
Year ended 10/31/14 | | | 11.07 | | | | 0.20 | | | | (0.30 | ) | | | (0.10 | ) | | | (0.12 | ) | | | (0.22 | ) | | | — | | | | (0.34 | ) | | | 10.63 | | | | (0.97 | ) | | | 32,668 | | | | 1.10 | | | | 1.68 | | | | 1.83 | | | | 237 | |
Year ended 10/31/13 | | | 11.37 | | | | 0.18 | | | | (0.37 | ) | | | (0.19 | ) | | | (0.11 | ) | | | — | | | | — | | | | (0.11 | ) | | | 11.07 | | | | (1.68 | ) | | | 33,019 | | | | 1.10 | | | | 1.68 | | | | 1.65 | | | | 233 | |
Year ended 10/31/12 | | | 11.63 | | | | 0.16 | | | | 0.20 | | | | 0.36 | | | | (0.39 | ) | | | (0.12 | ) | | | (0.11 | ) | | | (0.62 | ) | | | 11.37 | | | | 3.42 | | | | 40,771 | | | | 1.10 | | | | 1.57 | | | | 1.46 | | | | 119 | |
Year ended 10/31/11 | | | 12.22 | | | | 0.19 | | | | 0.16 | | | | 0.35 | | | | (0.58 | ) | | | (0.36 | ) | | | — | | | | (0.94 | ) | | | 11.63 | | | | 3.37 | | | | 47,162 | | | | 1.10 | | | | 1.58 | | | | 1.64 | | | | 226 | |
Class B | | | | | | | | | | | | | | | | | | | | | | | | | | | | | | | | | | | | | | | | | | | | | | | | | | | | | | | | | | | | |
Year ended 10/31/15 | | | 10.62 | | | | 0.10 | | | | (0.75 | ) | | | (0.65 | ) | | | — | | | | (0.14 | ) | | | (0.04 | ) | | | (0.18 | ) | | | 9.79 | | | | (6.19 | ) | | | 898 | | | | 1.85 | (e) | | | 2.47 | (e) | | | 1.04 | (e) | | | 135 | |
Year ended 10/31/14 | | | 11.05 | | | | 0.12 | | | | (0.30 | ) | | | (0.18 | ) | | | (0.03 | ) | | | (0.22 | ) | | | — | | | | (0.25 | ) | | | 10.62 | | | | (1.63 | ) | | | 1,867 | | | | 1.85 | | | | 2.43 | | | | 1.08 | | | | 237 | |
Year ended 10/31/13 | | | 11.36 | | | | 0.10 | | | | (0.38 | ) | | | (0.28 | ) | | | (0.03 | ) | | | — | | | | — | | | | (0.03 | ) | | | 11.05 | | | | (2.50 | ) | | | 2,850 | | | | 1.85 | | | | 2.43 | | | | 0.90 | | | | 233 | |
Year ended 10/31/12 | | | 11.61 | | | | 0.08 | | | | 0.20 | | | | 0.28 | | | | (0.30 | ) | | | (0.12 | ) | | | (0.11 | ) | | | (0.53 | ) | | | 11.36 | | | | 2.72 | | | | 4,430 | | | | 1.85 | | | | 2.32 | | | | 0.71 | | | | 119 | |
Year ended 10/31/11 | | | 12.19 | | | | 0.10 | | | | 0.17 | | | | 0.27 | | | | (0.49 | ) | | | (0.36 | ) | | | — | | | | (0.85 | ) | | | 11.61 | | | | 2.66 | | | | 5,934 | | | | 1.85 | | | | 2.33 | | | | 0.89 | | | | 226 | |
Class C | | | | | | | | | | | | | | | | | | | | | | | | | | | | | | | | | | | | | | | | | | | | | | | | | | | | | | | | | | | | |
Year ended 10/31/15 | | | 10.61 | | | | 0.10 | | | | (0.74 | ) | | | (0.64 | ) | | | — | | | | (0.14 | ) | | | (0.04 | ) | | | (0.18 | ) | | | 9.79 | | | | (6.10 | ) | | | 4,998 | | | | 1.85 | (e) | | | 2.47 | (e) | | | 1.04 | (e) | | | 135 | |
Year ended 10/31/14 | | | 11.04 | | | | 0.12 | | | | (0.30 | ) | | | (0.18 | ) | | | (0.03 | ) | | | (0.22 | ) | | | — | | | | (0.25 | ) | | | 10.61 | | | | (1.63 | ) | | | 6,441 | | | | 1.85 | | | | 2.43 | | | | 1.08 | | | | 237 | |
Year ended 10/31/13 | | | 11.35 | | | | 0.10 | | | | (0.38 | ) | | | (0.28 | ) | | | (0.03 | ) | | | — | | | | — | | | | (0.03 | ) | | | 11.04 | | | | (2.50 | ) | | | 5,562 | | | | 1.85 | | | | 2.43 | | | | 0.90 | | | | 233 | |
Year ended 10/31/12 | | | 11.61 | | | | 0.07 | | | | 0.20 | | | | 0.27 | | | | (0.30 | ) | | | (0.12 | ) | | | (0.11 | ) | | | (0.53 | ) | | | 11.35 | | | | 2.63 | | | | 8,016 | | | | 1.85 | | | | 2.32 | | | | 0.71 | | | | 119 | |
Year ended 10/31/11 | | | 12.19 | | | | 0.10 | | | | 0.17 | | | | 0.27 | | | | (0.49 | ) | | | (0.36 | ) | | | — | | | | (0.85 | ) | | | 11.61 | | | | 2.65 | | | | 10,782 | | | | 1.85 | | | | 2.33 | | | | 0.89 | | | | 226 | |
Class Y | | | | | | | | | | | | | | | | | | | | | | | | | | | | | | | | | | | | | | | | | | | | | | | | | | | | | | | | | | | | |
Year ended 10/31/15 | | | 10.63 | | | | 0.21 | | | | (0.76 | ) | | | (0.55 | ) | | | — | | | | (0.14 | ) | | | (0.14 | ) | | | (0.28 | ) | | | 9.80 | | | | (5.23 | ) | | | 1,716 | | | | 0.85 | (e) | | | 1.47 | (e) | | | 2.04 | (e) | | | 135 | |
Year ended 10/31/14 | | | 11.06 | | | | 0.23 | | | | (0.30 | ) | | | (0.07 | ) | | | (0.14 | ) | | | (0.22 | ) | | | — | | | | (0.36 | ) | | | 10.63 | | | | (0.63 | ) | | | 4,989 | | | | 0.85 | | | | 1.43 | | | | 2.08 | | | | 237 | |
Year ended 10/31/13 | | | 11.37 | | | | 0.21 | | | | (0.39 | ) | | | (0.18 | ) | | | (0.13 | ) | | | — | | | | — | | | | (0.13 | ) | | | 11.06 | | | | (1.52 | ) | | | 982 | | | | 0.85 | | | | 1.43 | | | | 1.90 | | | | 233 | |
Year ended 10/31/12 | | | 11.63 | | | | 0.19 | | | | 0.20 | | | | 0.39 | | | | (0.42 | ) | | | (0.12 | ) | | | (0.11 | ) | | | (0.65 | ) | | | 11.37 | | | | 3.68 | | | | 1,105 | | | | 0.85 | | | | 1.32 | | | | 1.71 | | | | 119 | |
Year ended 10/31/11 | | | 12.22 | | | | 0.22 | | | | 0.16 | | | | 0.38 | | | | (0.61 | ) | | | (0.36 | ) | | | — | | | | (0.97 | ) | | | 11.63 | | | | 3.63 | | | | 1,322 | | | | 0.85 | | | | 1.33 | | | | 1.89 | | | | 226 | |
Class R5 | | | | | | | | | | | | | | | | | | | | | | | | | | | | | | | | | | | | | | | | | | | | | | | | | | | | | | | | | | | | |
Year ended 10/31/15 | | | 10.64 | | | | 0.21 | | | | (0.76 | ) | | | (0.55 | ) | | | — | | | | (0.14 | ) | | | (0.14 | ) | | | (0.28 | ) | | | 9.81 | | | | (5.23 | ) | | | 1 | | | | 0.85 | (e) | | | 1.16 | (e) | | | 2.04 | (e) | | | 135 | |
Year ended 10/31/14 | | | 11.07 | | | | 0.23 | | �� | | (0.30 | ) | | | (0.07 | ) | | | (0.14 | ) | | | (0.22 | ) | | | — | | | | (0.36 | ) | | | 10.64 | | | | (0.63 | ) | | | 118 | | | | 0.85 | | | | 1.15 | | | | 2.08 | | | | 237 | |
Year ended 10/31/13 | | | 11.37 | | | | 0.21 | | | | (0.38 | ) | | | (0.17 | ) | | | (0.13 | ) | | | — | | | | — | | | | (0.13 | ) | | | 11.07 | | | | (1.43 | ) | | | 282 | | | | 0.85 | | | | 1.16 | | | | 1.90 | | | | 233 | |
Year ended 10/31/12 | | | 11.63 | | | | 0.19 | | | | 0.20 | | | | 0.39 | | | | (0.42 | ) | | | (0.12 | ) | | | (0.11 | ) | | | (0.65 | ) | | | 11.37 | | | | 3.68 | | | | 221 | | | | 0.85 | | | | 1.07 | | | | 1.71 | | | | 119 | |
Year ended 10/31/11 | | | 12.22 | | | | 0.22 | | | | 0.16 | | | | 0.38 | | | | (0.61 | ) | | | (0.36 | ) | | | — | | | | (0.97 | ) | | | 11.63 | | | | 3.63 | | | | 4,696 | | | | 0.85 | | | | 1.08 | | | | 1.89 | | | | 226 | |
Class R6 | | | | | | | | | | | | | | | | | | | | | | | | | | | | | | | | | | | | | | | | | | | | | | | | | | | | | | | | | | | | |
Year ended 10/31/15 | | | 10.63 | | | | 0.20 | | | | (0.74 | ) | | | (0.54 | ) | | | — | | | | (0.14 | ) | | | (0.14 | ) | | | (0.28 | ) | | | 9.81 | | | | (5.14 | ) | | | 19,413 | | | | 0.85 | (e) | | | 1.16 | (e) | | | 2.04 | (e) | | | 135 | |
Year ended 10/31/14 | | | 11.07 | | | | 0.23 | | | | (0.31 | ) | | | (0.08 | ) | | | (0.14 | ) | | | (0.22 | ) | | | — | | | | (0.36 | ) | | | 10.63 | | | | (0.72 | ) | | | 12,637 | | | | 0.85 | | | | 1.14 | | | | 2.08 | | | | 237 | |
Year ended 10/31/13 | | | 11.37 | | | | 0.21 | | | | (0.38 | ) | | | (0.17 | ) | | | (0.13 | ) | | | — | | | | — | | | | (0.13 | ) | | | 11.07 | | | | (1.43 | ) | | | 8,752 | | | | 0.85 | | | | 1.16 | | | | 1.90 | | | | 233 | |
Year ended 10/31/12(f) | | | 11.40 | | | | 0.02 | | | | (0.05 | ) | | | (0.03 | ) | | | — | | | | — | | | | — | | | | — | | | | 11.37 | | | | (0.26 | ) | | | 5,493 | | | | 0.85 | (g) | | | 1.10 | (g) | | | 1.71 | (g) | | | 119 | |
| (a) | Calculated using average shares outstanding. |
| (b) | Includes redemption fees added to shares of beneficial interest for Class A, Class B, Class C, Class Y and Class R5 shares which were less than $0.005 per share for fiscal years ended October 31, 2012 and prior. |
| (c) | Includes adjustments in accordance with accounting principles generally accepted in the United States of America and as such, the net asset value for financial reporting purposes and the returns based upon those net asset values may differ from the net asset value and returns for shareholder transactions. Does not include sales charges and is not annualized for periods less than one year, if applicable. |
| (d) | Portfolio turnover is calculated at the fund level and is not annualized for periods less than one year, if applicable. |
| (e) | Ratios are based on average daily net assets (000’s omitted) of $28,888, $1,290, $5,497, $2,365, $17 and $16,618 for Class A, Class B, Class C, Class Y, Class R5 and Class R6 shares, respectively. |
| (f) | Commencement date of September 24, 2012. |
28 Invesco International Total Return Fund
Report of Independent Registered Public Accounting Firm
To the Board of Trustees of AIM Investment Funds (Invesco Investment Funds)
and Shareholders of Invesco International Total Return Fund:
In our opinion, the accompanying statement of assets and liabilities, including the schedule of investments, and the related statements of operations and of changes in net assets and the financial highlights present fairly, in all material respects, the financial position of Invesco International Total Return Fund (one of the funds constituting AIM Investment Funds (Invesco Investment Funds), hereafter referred to as the “Fund”) at October 31, 2015, the results of its operations for the year then ended, the changes in its net assets for each of the two years in the period then ended and the financial highlights for each of the five years in the period then ended, in conformity with accounting principles generally accepted in the United States of America. These financial statements and financial highlights (hereafter referred to as “financial statements”) are the responsibility of the Fund’s management. Our responsibility is to express an opinion on these financial statements based on our audits. We conducted our audits of these financial statements in accordance with the standards of the Public Company Accounting Oversight Board (United States). Those standards require that we plan and perform the audit to obtain reasonable assurance about whether the financial statements are free of material misstatement. An audit includes examining, on a test basis, evidence supporting the amounts and disclosures in the financial statements, assessing the accounting principles used and significant estimates made by management, and evaluating the overall financial statement presentation. We believe that our audits, which included confirmation of securities at October 31, 2015 by correspondence with the custodian and brokers, and the application of alternative auditing procedures where confirmation of security purchases have not been received, provide a reasonable basis for our opinion.
PRICEWATERHOUSECOOPERS LLP
December 23, 2015
Houston, Texas
29 Invesco International Total Return Fund
Calculating your ongoing Fund expenses
Example
As a shareholder of the Fund, you incur two types of costs: (1) transaction costs, which may include sales charges (loads) on purchase payments or contingent deferred sales charges on redemptions, if any; and (2) ongoing costs, including management fees, distribution and/or service (12b-1) fees, and other Fund expenses. This example is intended to help you understand your ongoing costs (in dollars) of investing in the Fund and to compare these costs with ongoing costs of investing in other mutual funds. The example is based on an investment of $1,000 invested at the beginning of the period and held for the entire period May 1, 2015 through October 31, 2015.
Actual expenses
The table below provides information about actual account values and actual expenses. You may use the information in this table, together with the amount you invested, to estimate the expenses that you paid over the period. Simply divide your account value by $1,000 (for example, an $8,600 account value divided by $1,000 = 8.6), then multiply the result by the number in the table under the heading entitled “Actual Expenses Paid During Period” to estimate the expenses you paid on your account during this period.
Hypothetical example for comparison purposes
The table below also provides information about hypothetical account values and hypothetical expenses based on the Fund’s actual expense ratio and an assumed rate of return of 5% per year before expenses, which is not the Fund’s actual return.
The hypothetical account values and expenses may not be used to estimate the actual ending account balance or expenses you paid for the period. You may use this information to compare the ongoing costs of investing in the Fund and other funds. To do so, compare this 5% hypothetical example with the 5% hypothetical examples that appear in the shareholder reports of the other funds.
Please note that the expenses shown in the table are meant to highlight your ongoing costs only and do not reflect any transaction costs, such as sales charges (loads) on purchase payments or contingent deferred sales charges on redemptions, if any. Therefore, the hypothetical information is useful in comparing ongoing costs only, and will not help you determine the relative total costs of owning different funds. In addition, if these transaction costs were included, your costs would have been higher.
| | | | | | | | | | | | | | | | | | | | | | | | |
| Class | | Beginning
Account Value
(05/01/15) | | | ACTUAL | | | HYPOTHETICAL
(5% annual return before
expenses) | | | Annualized
Expense
Ratio | |
| | | Ending
Account Value
(10/31/15)1 | | | Expenses
Paid During
Period2 | | | Ending
Account Value
(10/31/15) | | | Expenses
Paid During
Period2 | | |
| A | | $ | 1,000.00 | | | $ | 967.40 | | | $ | 5.45 | | | $ | 1,019.66 | | | $ | 5.60 | | | | 1.10 | % |
| B | | | 1,000.00 | | | | 963.70 | | | | 9.16 | | | | 1,015.88 | | | | 9.40 | | | | 1.85 | |
| C | | | 1,000.00 | | | | 964.70 | | | | 9.16 | | | | 1,015.88 | | | | 9.40 | | | | 1.85 | |
| Y | | | 1,000.00 | | | | 968.60 | | | | 4.22 | | | | 1,020.92 | | | | 4.33 | | | | 0.85 | |
| R5 | | | 1,000.00 | | | | 968.60 | | | | 4.22 | | | | 1,020.92 | | | | 4.33 | | | | 0.85 | |
| R6 | | | 1,000.00 | | | | 968.60 | | | | 4.22 | | | | 1,020.92 | | | | 4.33 | | | | 0.85 | |
| 1 | The actual ending account value is based on the actual total return of the Fund for the period May 1, 2015 through October 31, 2015, after actual expenses and will differ from the hypothetical ending account value which is based on the Fund’s expense ratio and a hypothetical annual return of 5% before expenses. |
| 2 | Expenses are equal to the Fund’s annualized expense ratio as indicated above multiplied by the average account value over the period, multiplied by 184/365 to reflect the most recent fiscal half year. |
30 Invesco International Total Return Fund
Approval of Investment Advisory and Sub-Advisory Contracts
The Board of Trustees (the Board) of AIM Investment Funds (Invesco Investment Funds) is required under the Investment Company Act of 1940, as amended, to approve annually the renewal of Invesco International Total Return Fund’s (the Fund) investment advisory agreements. During contract renewal meetings held on June 9-10, 2015, the Board as a whole, and the disinterested or “independent” Trustees, who comprise over 75% of the Board, voting separately, approved the continuance for the Fund of the Master Investment Advisory Agreement with Invesco Advisers, Inc. (Invesco Advisers and the investment advisory agreement) and the Master Intergroup Sub-Advisory Contract for Mutual Funds with Invesco Asset Management Deutschland GmbH, Invesco Asset Management Limited, Invesco Asset Management (Japan) Limited, Invesco Hong Kong Limited, Invesco Senior Secured Management, Inc. and Invesco Canada Ltd. (collectively, the Affiliated Sub-Advisers and the sub-advisory contracts) for another year, effective July 1, 2015.
In evaluating the fairness and reasonableness of compensation under the Fund’s investment advisory agreement and sub-advisory contracts, the Board considered, among other things, the factors discussed below. The Board determined that continuation of the Fund’s investment advisory agreement and the sub-advisory contracts is in the best interest of the Fund and its shareholders and that the compensation payable to Invesco Advisers and the Affiliated Sub-Advisers under the agreements is fair and reasonable.
The Board’s Fund Evaluation Process
The Board’s Investments Committee has established three Sub-Committees, each of which is primarily responsible for overseeing the performance and investment management services provided by Invesco Advisers and the Affiliated Sub-Advisers to a number of the funds advised by Invesco Advisers (the Invesco Funds). The Sub-Committees meet throughout the year to review the performance of their assigned Invesco Funds, including reviewing materials prepared under the direction of the independent Senior Officer, an officer of the Invesco Funds who reports directly to the independent Trustees. Over the course of each year, the Sub-Committees meet with portfolio managers for their assigned Invesco Funds and other members of management to review the performance, investment objective(s), policies, strategies, limitations and investment risks of these funds. The Board had the benefit of reports from the Sub-Committees and Investments Committee throughout the year in considering approval of the continuance of each Invesco Fund’s investment advisory agreement and sub-advisory contracts for another year.
During the contract renewal process, the Board receives comparative performance and fee data regarding the Invesco Funds prepared by Invesco Advisers and Lipper Inc. (Lipper), an independent provider of investment company data. The Board also receives a report and this independent written evaluation from the Senior Officer. The Senior Officer’s evaluation is prepared as part of his responsibility to manage the process by which the Invesco Funds’ proposed management fees are negotiated during the annual contract renewal process to ensure they are negotiated in a manner that is at arms’ length and reasonable. In addition to meetings with Invesco Advisers and fund counsel, the independent Trustees also discuss the continuance of the investment advisory agreement and sub-advisory contracts in separate sessions with the Senior Officer and with independent legal counsel.
The Trustees recognized that the advisory fee rates for the Invesco Funds are, in many cases, the result of years of review and negotiation. The Trustees’ deliberations and conclusions in a particular year may be based in part on their deliberations and conclusions regarding these arrangements throughout the year and in prior years. The Trustees’ review and conclusions are based on the comprehensive consideration of all information presented to them and are not the result of any single determinative factor. Moreover, one Trustee may have weighed a particular piece of information or factor differently than another Trustee.
The discussion below is a summary of the Senior Officer’s independent written evaluation with respect to the Fund’s investment advisory agreement as well as a discussion of the material factors and related conclusions that formed the basis for the Board’s approval of the Fund’s investment advisory agreement and sub-advisory contracts. Unless otherwise stated, this information is current as of June 10, 2015, and does not reflect consideration of factors that became known to the Board after that date.
Factors and Conclusions and Summary of Independent Written Fee Evaluation
| A. | Nature, Extent and Quality of Services Provided by Invesco Advisers and the Affiliated Sub-Advisers |
The Board reviewed the advisory services provided to the Fund by Invesco Advisers under the Fund’s investment advisory agreement, the performance of Invesco Advisers in providing these services, and the credentials and experience of the officers and employees of Invesco Advisers who provide these services, including the Fund’s portfolio manager or managers. The Board’s review of the qualifications of Invesco Advisers to provide advisory services included the Board’s consideration of Invesco Advisers’ investment
process oversight, independent credit analysis and investment risk management. The Board also considered non-advisory services that Invesco Advisers and its affiliates provide to the Invesco Funds such as various back office support functions, equity and fixed income trading operations, internal audit, distribution, valuation and legal and compliance.
In determining whether to continue the Fund’s investment advisory agreement, the Board considered the benefits of reapproving an existing relationship and the greater uncertainty that may be associated with entering into a new relationship. The Board concluded that the nature, extent and quality of the services provided to the Fund by Invesco Advisers are appropriate and satisfactory and consistent with the terms of the Fund’s investment advisory agreement.
The Board reviewed the services that may be provided by the Affiliated Sub-Advisers under the sub-advisory contracts and the credentials and experience of the officers and employees of the Affiliated Sub-Advisers who provide these services. The Board noted that the Affiliated Sub-Advisers have offices and personnel that are located in financial centers around the world. As a result, the Affiliated Sub-Advisers can provide research and investment analysis on the markets and economies of various countries in which the Fund may invest, make recommendations regarding securities and assist with security trades. The Board concluded that the sub-advisory contracts benefit the Fund and its shareholders by permitting Invesco Advisers to use the resources and talents of the Affiliated Sub-Advisers in managing the Fund. The Board concluded that the nature, extent and quality of the services that may be provided by the Affiliated Sub-Advisers are appropriate and satisfactory and consistent with the terms of the Fund’s sub-advisory contracts.
The Board considered Fund performance as a relevant factor in considering whether to approve the investment advisory agreement as well as the sub-advisory contracts for the Fund, as Invesco Asset Management Limited currently manages assets of the Fund.
The Board compared the Fund’s performance during the past one, three and five calendar years to the performance of funds in the Lipper performance universe and against the Lipper International Income Funds Index. The Board noted that performance of Class A shares of the Fund was in the fourth quintile of its performance universe for the one and five year periods and the third quintile for the three year period (the first quintile being the best performing funds and the fifth quintile being the worst performing funds). The Board noted that performance of Class A shares of the Fund was below the performance of the Index for the one,
31 Invesco International Total Return Fund
three and five year periods. Invesco Advisers noted that the Fund is limited in the amount of U.S. dollar assets it can hold, which negatively impacted performance. The Trustees also reviewed more recent Fund performance and this review did not change their conclusions.
| C. | Advisory and Sub-Advisory Fees |
The Board compared the Fund’s contractual management fee rate to the contractual management fee rates of funds in the Fund’s Lipper expense group at a common asset level. The Board noted that the contractual management fee rate for Class A shares of the Fund was below the median contractual management fee rate of funds in its expense group. The Board noted that the term “contractual management fee” may include both advisory and certain administrative services fees, but that Lipper does not provide information on a fund by fund basis as to what is included. The Board noted that Invesco Advisers does not charge the Invesco Funds for the administrative services included in the term as defined by Lipper. The Board also reviewed the methodology used by Lipper in providing expense group information, which includes using each fund’s contractual management fee schedule (including any applicable breakpoints) as reported in the most recent prospectus or statement of additional information for each fund in the expense group.
The Board noted that Invesco Advisers has contractually agreed to waive fees and/or limit expenses of the Fund through at least February 29, 2016 in an amount necessary to limit total annual operating expenses to a specified percentage of average daily net assets for each class of the Fund.
The Board noted that Invesco Advisers and the Affiliated Sub-Advisers do not manage other mutual funds or client accounts with investment strategies comparable to those of the Fund.
The Board also considered the services that may be provided by the Affiliated Sub-Advisers pursuant to the sub-advisory contracts, as well as the fees payable by Invesco Advisers to the Affiliated Sub-Advisers pursuant to the sub-advisory contracts. The Board noted that Invesco Advisers retains overall responsibility for, and provides services to, sub-advised Invesco Funds, including oversight of the Affiliated Sub-Advisers as well as the additional services described herein other than day-to-day portfolio management. The Board also noted that the sub-advisory fees are not paid directly by the Fund, but rather, are payable by Invesco Advisers to the Affiliated Sub-Advisers.
| D. | Economies of Scale and Breakpoints |
The Board considered the extent to which there are economies of scale in the provision of advisory services to the Fund. The Board also considered whether the Fund benefits from economies of scale through contractual breakpoints in the Fund’s advisory fee schedule. The Board also noted that the Fund shares directly in economies of scale through lower fees charged by third party service providers based on the combined size of the Invesco
Funds and other clients advised by Invesco Advisers.
| E. | Profitability and Financial Resources |
The Board reviewed information from Invesco Advisers concerning the costs of the advisory and other services that Invesco Advisers and its affiliates provide to the Fund and the Invesco Funds and the profitability of Invesco Advisers and its affiliates in providing these services. The Board received information from Invesco Advisers about the methodology used to prepare the profitability information. The Board noted that Invesco Advisers continues to operate at a net profit from services Invesco Advisers and its affiliates provide to the Invesco Fund. The Board noted that although Invesco Advisers received a minimal amount of revenues from advising the Fund, Invesco Advisers and its subsidiaries did not make a profit from managing the Fund. The Board received and accepted information from Invesco Advisers demonstrating that Invesco Advisers and each Affiliated Sub-Adviser are financially sound and have the resources necessary to perform their obligations under the investment advisory agreement and sub-advisory contracts.
| F. | Collateral Benefits to Invesco Advisers and its Affiliates |
The Board considered various other benefits received by Invesco Advisers and its affiliates from the relationship with the Fund, including the fees received for providing transfer agency and distribution services to the Fund. The Board considered comparative information regarding fees charged for these services, including information provided by Lipper and other independent sources. The Board considered the performance of Invesco Advisers and its affiliates in providing these services and the organizational structure employed to provide these services. The Board also considered that these services are provided to the Fund pursuant to written contracts that are reviewed and approved on an annual basis by the Board; and that the services are required for the operation of the Fund.
The Board considered the benefits realized by Invesco Advisers and the Affiliated Sub-Advisers as a result of portfolio brokerage transactions executed through “soft dollar” arrangements. Invesco Advisers noted that the Fund does not execute brokerage transactions through “soft dollar” arrangements to any significant degree.
The Board considered that the Fund’s uninvested cash and cash collateral from any securities lending arrangements may be invested in money market funds advised by Invesco Advisers pursuant to procedures approved by the Board. The Board noted that Invesco Advisers receives advisory fees from these affiliated money market funds attributable to such investments, although Invesco Advisers has contractually agreed to waive through varying periods the advisory fees payable by the Invesco Funds with respect to investments in the affiliated money market funds. The waiver is in an amount equal to 100% of the net advisory fee Invesco Advisers
receives from the affiliated money market funds with respect to the Fund’s investment in the affiliated money market funds of uninvested cash, but not cash collateral. The Board concluded that the amount of advisory fees received by Invesco Advisors from the Fund’s investment of cash collateral from any securities lending arrangements in the affiliated money market funds is fair and reasonable.
32 Invesco International Total Return Fund
Tax Information
Form 1099-DIV, Form 1042-S and other year–end tax information provide shareholders with actual calendar year amounts that should be included in their tax returns. Shareholders should consult their tax advisors.
The following distribution information is being provided as required by the Internal Revenue Code or to meet a specific state’s requirement.
The Fund designates the following amounts or, if subsequently determined to be different, the maximum amount allowable for its fiscal year ended October 31, 2015:
| | | | |
Federal and State Income Tax | |
Qualified Dividend Income* | | | 0 | % |
Corporate Dividends Received Deduction* | | | 0 | % |
U.S. Treasury Obligations* | | | 0 | % |
| | * | The above percentages are based on ordinary income dividends paid to shareholders during the Fund’s fiscal year. |
| | | | |
Non-Resident Alien Shareholders | |
Qualified Short-Term Gains | | $ | 767,377 | |
33 Invesco International Total Return Fund
Trustees and Officers
The address of each trustee and officer is AIM Investment Funds (Invesco Investment Funds) (the “Trust”), 11 Greenway Plaza, Suite 1000, Houston, Texas 77046-1173. The trustees serve for the life of the Trust, subject to their earlier death, incapacitation, resignation, retirement or removal as more specifically provided in the Trust’s organizational documents. Each officer serves for a one year term or until their successors are elected and qualified. Column two below includes length of time served with predecessor entities, if any.
| | | | | | | | |
Name, Year of Birth and
Position(s) Held with the Trust | | Trustee and/
or Officer Since | | Principal Occupation(s)
During Past 5 Years | | Number of Funds in Fund Complex Overseen by Trustee | | Other Directorship(s) Held by Trustee During Past 5 Years |
| Interested Persons | | | | | | | | |
| Martin L. Flanagan1 — 1960 Trustee | | 2007 | | Executive Director, Chief Executive Officer and President, Invesco Ltd. (ultimate parent of Invesco and a global investment management firm); Advisor to the Board, Invesco Advisers, Inc. (formerly known as Invesco Institutional (N.A.), Inc.); Trustee, The Invesco Funds; Vice Chair, Investment Company Institute; and Member of Executive Board, SMU Cox School of Business Formerly: Chairman and Chief Executive Officer, Invesco Advisers, Inc. (registered investment adviser); Director, Chairman, Chief Executive Officer and President, IVZ Inc. (holding company), INVESCO Group Services, Inc. (service provider) and Invesco North American Holdings, Inc. (holding company); Director, Chief Executive Officer and President, Invesco Holding Company Limited (parent of Invesco and a global investment management firm); Director, Invesco Ltd.; Chairman, Investment Company Institute and President, Co-Chief Executive Officer, Co-President, Chief Operating Officer and Chief Financial Officer, Franklin Resources, Inc. (global investment management organization). | | 145 | | None |
Philip A. Taylor2 — 1954
Trustee, President and Principal Executive Officer | | 2006 | | Head of North American Retail and Senior Managing Director, Invesco Ltd.; Director, Co-Chairman, Co-President and Co-Chief Executive Officer, Invesco Advisers, Inc. (formerly known as Invesco Institutional (N.A.), Inc.) (registered investment adviser); Director, Chairman, Chief Executive Officer and President, Invesco Management Group, Inc. (formerly known as Invesco Aim Management Group, Inc.) (financial services holding company); Director and President, INVESCO Funds Group, Inc. (registered investment adviser and registered transfer agent); Director and Chairman, Invesco Investment Services, Inc. (formerly known as Invesco Aim Investment Services, Inc.) (registered transfer agent) and IVZ Distributors, Inc. (formerly known as INVESCO Distributors, Inc.) (registered broker dealer); Chief Executive Officer, Invesco Corporate Class Inc. (corporate mutual fund company) Director, Chairman and Chief Executive Officer, Invesco Canada Ltd. (formerly known as Invesco Trimark Ltd./Invesco Trimark Ltèe) (registered investment adviser and registered transfer agent); Trustee, President and Principal Executive Officer, The Invesco Funds (other than AIM Treasurer’s Series Trust (Invesco Treasurer’s Series Trust), Short-Term Investments Trust and Invesco Management Trust); Trustee and Executive Vice President, The Invesco Funds (AIM Treasurer’s Series Trust (Invesco Treasurer’s Series Trust), Short-Term Investments Trust and Invesco Management Trust only); Director, Invesco Investment Advisers LLC (formerly known as Van Kampen Asset Management); Director, Chief Executive Officer and President, Van Kampen Exchange Corp. Formerly: Director, President and Chairman, Invesco Inc. (holding company), Invesco Canada Holdings Inc. (holding company), Trimark Investments Ltd./Placements Trimark Ltèe and Invesco Financial Services Ltd/Services Financiers Invesco Ltèe; Chief Executive Officer, Invesco Canada Fund Inc (corporate mutual fund company); Director and Chairman, Van Kampen Investor Services Inc.; Director, Chief Executive Officer and President, 1371 Preferred Inc. (holding company) and Van Kampen Investments Inc.; Director and President, AIM GP Canada Inc. (general partner for limited partnerships) and Van Kampen Advisors, Inc.; Director and Chief Executive Officer, Invesco Trimark Dealer Inc. (registered broker dealer); Director, Invesco Distributors, Inc. (formerly known as Invesco Aim Distributors, Inc.) (registered broker dealer); Manager, Invesco PowerShares Capital Management LLC; Director, Chief Executive Officer and President, Invesco Advisers, Inc.; Director, Chairman, Chief Executive Officer and President, Invesco Aim Capital Management, Inc.; President, Invesco Trimark Dealer Inc. and Invesco Trimark Ltd./Invesco Trimark Ltèe; Director and President, AIM Trimark Corporate Class Inc. and AIM Trimark Canada Fund Inc.; Senior Managing Director, Invesco Holding Company Limited; Director and Chairman, Fund Management Company (former registered broker dealer); President and Principal Executive Officer, The Invesco Funds (AIM Treasurer’s Series Trust (Invesco Treasurer’s Series Trust), and Short-Term Investments Trust only); President, AIM Trimark Global Fund Inc. and AIM Trimark Canada Fund Inc.. | | 145 | | None |
| 1 | Mr. Flanagan is considered an interested person (within the meaning of Section 2(a)(19) of the 1940 Act) of the Trust because he is an officer of the Adviser to the Trust, and an officer and a director of Invesco Ltd., ultimate parent of the Adviser. |
| 2 | Mr. Taylor is considered an interested person (within the meaning of Section 2(a)(19) of the 1940 Act) of the Trust because he is an officer and a director of the Adviser. |
T-1 Invesco International Total Return Fund
Trustees and Officers—(continued)
| | | | | | | | |
Name, Year of Birth and Position(s) Held with the Trust | | Trustee and/ or Officer Since | | Principal Occupation(s) During Past 5 Years | | Number of Funds in Fund Complex Overseen by Trustee | | Other Directorship(s) Held by Trustee During Past 5 Years |
| Independent Trustees | | | | | | | | |
Bruce L. Crockett — 1944 Trustee and Chair | | 2003 | | Chairman, Crockett Technologies Associates (technology consulting company) Formerly: Director, Captaris (unified messaging provider); Director, President and Chief Executive Officer, COMSAT Corporation; Chairman, Board of Governors of INTELSAT (international communications company); ACE Limited (insurance company); Independent Directors Council and Investment Company Institute | | 145 | | ALPS (Attorneys Liability Protection Society) (insurance company) and Globe Specialty Metals, Inc. (metallurgical company) |
David C. Arch — 1945 Trustee | | 2010 | | Chairman of Blistex Inc., a consumer health care products manufacturer | | 145 | | Board member of the Illinois Manufacturers’ Association; Member of the Board of Visitors, Institute for the Humanities, University of Michigan; Member of the Audit Committee of the Edward-Elmhurst Hospital |
James T. Bunch — 1942 Trustee | | 2000 | | Managing Member, Grumman Hill Group LLC (family office/private equity investments) Formerly: Founder, Green Manning & Bunch Ltd. (investment banking firm) (1988-2010); Executive Committee, United States Golf Association; and Chairman, Board of Governors, Western Golf Association | | 145 | | Chairman of the Board of Trustees, Evans Scholars Foundation; and Chairman of the Board, Denver Film Society |
Rodney F. Dammeyer — 1940 Trustee | | 2010 | | Chairman of CAC, LLC, (private company offering capital investment and management advisory services) Formerly: Prior to 2001, Managing Partner at Equity Group Corporate Investments; Prior to 1995, Chief Executive Officer of Itel Corporation (formerly Anixter International); Prior to 1985, experience includes Senior Vice President and Chief Financial Officer of Household International, Inc., Executive Vice President and Chief Financial Officer of Northwest Industries, Inc. and Partner of Arthur Andersen & Co.; From 1987 to 2010, Director/Trustee of investment companies in the Van Kampen Funds complex | | 145 | | Director of Quidel Corporation and Stericycle, Inc. |
Albert R. Dowden — 1941 Trustee | | 2003 | | Director of a number of public and private business corporations, including the Boss Group, Ltd. (private investment and management); Nature’s Sunshine Products, Inc. and Reich & Tang Funds (5 portfolios) (registered investment company) Formerly: Director, Homeowners of America Holding Corporation/Homeowners of America Insurance Company (property casualty company); Director, Continental Energy Services, LLC (oil and gas pipeline service); Director, CompuDyne Corporation (provider of product and services to the public security market) and Director, Annuity and Life Re (Holdings), Ltd. (reinsurance company); Director, President and Chief Executive Officer, Volvo Group North America, Inc.; Senior Vice President, AB Volvo; Director of various public and private corporations; Chairman, DHJ Media, Inc.; Director, Magellan Insurance Company; and Director, The Hertz Corporation, Genmar Corporation (boat manufacturer), National Media Corporation; Advisory Board of Rotary Power International (designer, manufacturer, and seller of rotary power engines); and Chairman, Cortland Trust, Inc. (registered investment company) | | 145 | | Director of: Nature’s Sunshine Products, Inc., Reich & Tang Funds, Homeowners of America Holding Corporation/ Homeowners of America Insurance Company, the Boss Group |
Jack M. Fields — 1952 Trustee | | 2003 | | Chief Executive Officer, Twenty First Century Group, Inc. (government affairs company); Owner and Chief Executive Officer, Dos Angeles Ranch, L.P. (cattle, hunting, corporate entertainment); and Discovery Global Education Fund (non-profit) Formerly: Chief Executive Officer, Texana Timber LP (sustainable forestry company); Director of Cross Timbers Quail Research Ranch (non-profit); and member of the U.S. House of Representatives | | 145 | | Insperity, Inc. (formerly known as Administaff) |
Prema Mathai-Davis — 1950 Trustee | | 2003 | | Retired. Formerly: Chief Executive Officer, YWCA of the U.S.A. | | 145 | | None |
Larry Soll — 1942 Trustee | | 1997 | | Retired. Formerly: Chairman, Chief Executive Officer and President, Synergen Corp. (a biotechnology company) | | 145 | | None |
Hugo F. Sonnenschein — 1940 Trustee | | 2010 | | President Emeritus and Honorary Trustee of the University of Chicago and the Adam Smith Distinguished Service Professor in the Department of Economics at the University of Chicago. Prior to 2000, President of the University of Chicago | | 145 | | Trustee of the University of Rochester and a member of its investment committee; Member of the National Academy of Sciences and the American Philosophical Society; Fellow of the American Academy of Arts and Sciences |
Raymond Stickel, Jr. — 1944 Trustee | | 2005 | | Retired. Formerly: Director, Mainstay VP Series Funds, Inc. (25 portfolios) and Partner, Deloitte & Touche | | 145 | | None |
T-2 Invesco International Total Return Fund
Trustees and Officers—(continued)
| | | | | | | | |
Name, Year of Birth and Position(s) Held with the Trust | | Trustee and/ or Officer Since | | Principal Occupation(s) During Past 5 Years | | Number of Funds in Fund Complex Overseen by Trustee | | Other Directorship(s) Held by Trustee During Past 5 Years |
| Independent Trustees—(continued) |
Suzanne H. Woolsey — 1941 Trustee | | 2014 | | Chief Executive Officer of Woolsey Partners LLC | | 145 | | Emeritus Chair of the Board of Trustees of the Institute for Defense Analyses; Trustee of Colorado College; Trustee of California Institute of Technology; Prior to 2014, Director of Fluor Corp.; Prior to 2010, Trustee of the German Marshall Fund of the United States; Prior to 2010 Trustee of the Rocky Mountain Institute |
| Other Officers | | | | | | | | |
Russell C. Burk — 1958
Senior Vice President and Senior Officer | | 2005 | | Senior Vice President and Senior Officer, The Invesco Funds | | N/A | | N/A |
John M. Zerr — 1962
Senior Vice President, Chief Legal Officer and Secretary | | 2006 | | Director, Senior Vice President, Secretary and General Counsel, Invesco Management Group, Inc. (formerly known as Invesco Aim Management Group, Inc.) and Van Kampen Exchange Corp.; Senior Vice President, Invesco Advisers, Inc. (formerly known as Invesco Institutional (N.A.), Inc.) (registered investment adviser); Senior Vice President and Secretary, Invesco Distributors, Inc. (formerly known as Invesco Aim Distributors, Inc.); Director, Vice President and Secretary, Invesco Investment Services, Inc. (formerly known as Invesco Aim Investment Services, Inc.) and IVZ Distributors, Inc. (formerly known as INVESCO Distributors, Inc.); Director and Vice President, INVESCO Funds Group, Inc.; Senior Vice President, Chief Legal Officer and Secretary, The Invesco Funds; Managing Director, Invesco PowerShares Capital Management LLC; Director, Secretary and General Counsel, Invesco Investment Advisers LLC (formerly known as Van Kampen Asset Management); Secretary and General Counsel, Invesco Capital Markets, Inc. (formerly known as Van Kampen Funds Inc.) and Chief Legal Officer, PowerShares Exchange-Traded Fund Trust, PowerShares Exchange-Traded Fund Trust II, PowerShares India Exchange-Traded Fund Trust, PowerShares Actively Managed Exchange-Traded Fund Trust, and PowerShares Actively Managed Exchange-Traded Commodity Fund Trust Formerly: Director and Vice President, Van Kampen Advisors Inc.; Director, Vice President, Secretary and General Counsel, Van Kampen Investor Services Inc.; Director, Invesco Distributors, Inc. (formerly known as Invesco Aim Distributors, Inc.); Director, Senior Vice President, General Counsel and Secretary, Invesco Aim Advisers, Inc. and Van Kampen Investments Inc.; Director, Vice President and Secretary, Fund Management Company; Director, Senior Vice President, Secretary, General Counsel and Vice President, Invesco Aim Capital Management, Inc.; Chief Operating Officer and General Counsel, Liberty Ridge Capital, Inc. (an investment adviser); Vice President and Secretary, PBHG Funds (an investment company) and PBHG Insurance Series Fund (an investment company); Chief Operating Officer, General Counsel and Secretary, Old Mutual Investment Partners (a broker-dealer); General Counsel and Secretary, Old Mutual Fund Services (an administrator) and Old Mutual Shareholder Services (a shareholder servicing center); Executive Vice President, General Counsel and Secretary, Old Mutual Capital, Inc. (an investment adviser); and Vice President and Secretary, Old Mutual Advisors Funds (an investment company) | | N/A | | N/A |
Sheri Morris — 1964
Vice President, Treasurer and Principal Financial Officer | | 2003 | | Vice President, Treasurer and Principal Financial Officer, The Invesco Funds; Vice President, Invesco Advisers, Inc. (formerly known as Invesco Institutional (N.A.), Inc.) (registered investment adviser); and Vice President, PowerShares Exchange-Traded Fund Trust, PowerShares Exchange-Traded Fund Trust II, PowerShares India Exchange-Traded Fund Trust, PowerShares Actively Managed Exchange-Traded Fund Trust, and PowerShares Actively Managed Exchange-Traded Commodity Fund Trust Formerly: Vice President, Invesco Aim Advisers, Inc., Invesco Aim Capital Management, Inc. and Invesco Aim Private Asset Management, Inc.; Assistant Vice President and Assistant Treasurer, The Invesco Funds and Assistant Vice President, Invesco Advisers, Inc., Invesco Aim Capital Management, Inc. and Invesco Aim Private Asset Management, Inc.; and Treasurer, PowerShares Exchange-Traded Fund Trust, PowerShares Exchange-Traded Fund Trust II, PowerShares India Exchange-Traded Fund Trust and PowerShares Actively Managed Exchange-Traded Fund Trust | | N/A | | N/A |
T-3 Invesco International Total Return Fund
Trustees and Officers—(continued)
| | | | | | | | |
Name, Year of Birth and
Position(s) Held with the Trust | | Trustee and/
or Officer Since | | Principal Occupation(s)
During Past 5 Years | | Number of Funds in Fund Complex Overseen by Trustee | | Other Directorship(s) Held by Trustee During Past 5 Years |
| Other Officers—(continued) | | | | | | | | |
Karen Dunn Kelley — 1960
Vice President | | 2003 | | Senior Managing Director, Investments, Invesco Ltd.; Director, Co-President, Co-Chief Executive Officer, and Co-Chairman, Invesco Advisers, Inc. (formerly known as Invesco Institutional (N.A.), Inc.) (registered investment adviser); Chairman, Invesco Senior Secured Management, Inc.; Senior Vice President, Invesco Management Group, Inc. (formerly known as Invesco Aim Management Group, Inc.); Executive Vice President, Invesco Distributors, Inc. (formerly known as Invesco Aim Distributors, Inc.); Director, Invesco Mortgage Capital Inc. and Invesco Management Company Limited; Vice President, The Invesco Funds (other than AIM Treasurer’s Series Trust (Invesco Treasurer’s Series Trust), Short-Term Investments Trust and Invesco Management Trust); and President and Principal Executive Officer, The Invesco Funds (AIM Treasurer’s Series Trust (Invesco Treasurer’s Series Trust), Short-Term Investments Trust and Invesco Management Trust only) Formerly: Director and President, INVESCO Asset Management (Bermuda) Ltd., Director, INVESCO Global Asset Management Limited and INVESCO Management S.A.; Senior Vice President, Van Kampen Investments Inc. and Invesco Advisers, Inc. (formerly known as Invesco Institutional (N.A.), Inc.) (registered investment adviser); Vice President, Invesco Advisers, Inc. (formerly known as Invesco Institutional (N.A.), Inc.); Director of Cash Management and Senior Vice President, Invesco Advisers, Inc. and Invesco Aim Capital Management, Inc.; Director and President, Fund Management Company; Chief Cash Management Officer, Director of Cash Management, Senior Vice President, and Managing Director, Invesco Aim Capital Management, Inc.; Director of Cash Management, Senior Vice President, and Vice President, Invesco Advisers, Inc. and The Invesco Funds (AIM Treasurer’s Series Trust (Invesco Treasurer’s Series Trust), and Short-Term Investments Trust only) | | N/A | | N/A |
Crissie M. Wisdom — 1969 Anti-Money Laundering Compliance Officer | | 2013 | | Anti-Money Laundering Compliance Officer, Invesco Advisers, Inc. (formerly known as Invesco Institutional (N.A.), Inc.) (registered investment adviser), Invesco Capital Markets, Inc. (formerly known as Van Kampen Funds Inc.), Invesco Distributors, Inc., Invesco Investment Services, Inc., Invesco Management Group, Inc., Van Kampen Exchange Corp., The Invesco Funds, and PowerShares Exchange-Traded Fund Trust, PowerShares Exchange-Traded Fund Trust II, PowerShares India Exchange-Traded Fund Trust, PowerShares Actively Managed Exchange-Traded Fund Trust and PowerShares Actively Managed Exchange-Traded Commodity Fund Trust; Anti-Money Laundering Compliance Officer and Bank Secrecy Act Officer, INVESCO National Trust Company and Invesco Trust Company; and Fraud Prevention Manager and Controls and Risk Analysis Manager for Invesco Investment Services, Inc.. | | N/A | | N/A |
Lisa O. Brinkley — 1959 Chief Compliance Officer | | 2015 | | Senior Vice President and Chief Compliance Officer, Invesco Advisers, Inc. (registered investment adviser) (formerly known as Invesco Institutional (N.A., Inc.); and Chief Compliance Officer, The Invesco Funds Formerly: Global Assurance Officer, Invesco Ltd. and Vice President, The Invesco Funds; Chief Compliance Officer, Invesco Distributors, Inc. (formerly known as Invesco Aim Distributors, Inc.), Invesco Investment Services, Inc. (formerly known as Invesco Aim Investment Services, Inc.) and Van Kampen Investor Services Inc.; Senior Vice President, Invesco Management Group, Inc.; Senior Vice President and Chief Compliance Officer, Invesco Advisers, Inc. and The Invesco Funds; Vice President and Chief Compliance Officer, Invesco Aim Capital Management, Inc. and Invesco Distributors, Inc.; Vice President, Invesco Investment Services, Inc. and Fund Management Company. | | N/A | | N/A |
The Statement of Additional Information of the Trust includes additional information about the Fund’s Trustees and is available upon request, without charge, by calling 1.800.959.4246. Please refer to the Fund’s prospectus for information on the Fund’s sub-advisers.
| | | | | | |
Office of the Fund 11 Greenway Plaza, Suite 1000 Houston, TX 77046-1173 | | Investment Adviser Invesco Advisers, Inc. 1555 Peachtree Street, N.E. Atlanta, GA 30309 | | Distributor
Invesco Distributors, Inc. 11 Greenway Plaza, Suite 1000 Houston, TX 77046-1173 | | Auditors PricewaterhouseCoopers LLP 1000 Louisiana Street, Suite 5800 Houston, TX 77002-5678 |
| | | |
| | | | | | |
Counsel to the Fund Stradley Ronon Stevens & Young, LLP 2005 Market Street, Suite 2600 Philadelphia, PA 19103-7018 | | Counsel to the Independent Trustees Goodwin Procter LLP 901 New York Avenue, N.W. Washington, D.C. 20001 | | Transfer Agent Invesco Investment Services, Inc. 11 Greenway Plaza, Suite 1000 Houston, TX 77046-1173 | | Custodian State Street Bank and Trust Company 225 Franklin Street Boston, MA 02110-2801 |
T-4 Invesco International Total Return Fund

Invesco mailing information
Send general correspondence to Invesco Investment Services, Inc., P.O. Box 219078, Kansas City, MO 64121-9078.
Important notice regarding delivery of security holder documents
To reduce Fund expenses, only one copy of most shareholder documents may be mailed to shareholders with multiple accounts at the same address (Householding). Mailing of your shareholder documents may be householded indefinitely unless you instruct us otherwise. If you do not want the mailing of these documents to be combined with those for other members of your household, please contact Invesco Investment Services, Inc. at 800 959 4246 or contact your financial institution. We will begin sending you individual copies for each account within 30 days after receiving your request.
Fund holdings and proxy voting information
The Fund provides a complete list of its holdings four times in each fiscal year, at the quarter ends. For the second and fourth quarters, the lists appear in the Fund’s semiannual and annual reports to shareholders. For the first and third quarters, the Fund files the lists with the Securities and Exchange Commission (SEC) on Form N-Q. The most recent list of portfolio holdings is available at invesco.com/completeqtrholdings. Shareholders can also look up the Fund’s Forms N-Q on the SEC website at sec.gov. Copies of the Fund’s Forms N-Q may be reviewed and copied at the SEC Public Reference Room in Washington, D.C. You can obtain information on the operation of the Public Reference Room, including information about duplicating fee charges, by calling 202 551 8090 or 800 732 0330, or by electronic request at the following email address: publicinfo@sec.gov. The SEC file numbers for the Fund are shown below.
A description of the policies and procedures that the Fund uses to determine how to vote proxies relating to portfolio securities is available without charge, upon request, from our Client Services department at 800 959 4246 or at invesco.com/proxyguidelines. The information is also available on the SEC website, sec.gov.
| | |
Information regarding how the Fund voted proxies related to its portfolio securities during the most recent 12-month period ended June 30 is available at invesco.com/proxysearch. The information is also available on the SEC website, sec.gov. Invesco Advisers, Inc. is an investment adviser; it provides investment advisory services to individual and institutional clients and does not sell securities. Invesco Distributors, Inc. is the US distributor for Invesco Ltd.’s retail mutual funds, exchange-traded funds and institutional money market funds. Both are wholly owned, indirect subsidiaries of Invesco Ltd. | |  |
SEC file numbers: 811-05426 and 033-19338 ITR-AR-1 Invesco Distributors, Inc.
| | | | |
| | |
 | | Annual Report to Shareholders | | October 31, 2015 |
| | |
| | Invesco Long/Short Equity Fund |
| | Nasdaq: |
| | A: LSQAX n C: LSQCX n R: LSQRX n Y: LSQYX n R5: LSQFX n R6: LSQSX |

Letters to Shareholders
| | |

Philip Taylor | | Dear Shareholders: This annual report includes information about your Fund, including performance data and a complete list of its investments as of the close of the reporting period. Inside is a discussion of how your Fund was managed and the factors that affected its performance during the reporting period. I hope you find this report of interest. The US economy expanded and unemployment declined throughout the reporting period. Continuing low energy prices benefited consumers, but a strong US dollar crimped corporate profits. The US Federal Reserve signaled that it was increasingly likely to raise interest rates, based on generally positive economic data, but uncertainty remained about when it might act. Overseas, the story was much different. Low energy prices hurt the economies of some oil-producing nations, such as Brazil and Russia. During the reporting period, the European |
| Central Bank as well as central banks in China and Japan – among other countries – either instituted or maintained extraordinarily accommodative monetary policies in response to economic weakness. |
Investor uncertainty, such as we saw for much of the reporting period – and market volatility, such as we saw at the end of the reporting period – are unfortunate facts of life when it comes to investing. Some investors use these things as excuses to delay saving and investing for their long-term financial goals. That’s why Invesco encourages investors to work with a professional financial adviser who can stress the importance of starting to save and invest early and the importance of adhering to a disciplined investment plan – when times are good and when they’re uncertain. A financial adviser who knows your unique financial situation, investment goals and risk tolerance can be an invaluable partner as you seek to achieve your financial goals. He or she can offer a long-term perspective when markets are volatile and time-tested advice and guidance when your financial situation or investment goals change.
Timely information when and where you want it
Invesco’s efforts to help investors achieve their financial objectives include providing individual investors and financial professionals with timely information about the markets, the economy and investing – whenever and wherever they want it.
Our website, invesco.com/us, offers a wide range of market insights and investment perspectives. On the website, you’ll find detailed information about our funds, including prices, performance, holdings and portfolio manager commentaries. You can access information about your account by completing a simple, secure online registration. Click on the “Need to register” link in the “Account Access” box on our homepage to get started.
Invesco’s mobile apps for iPhone® and iPad® (both available free from the App StoreSM) allow you to obtain the same detailed information, monitor your account and create customizable watch lists. Also, they allow you to access investment insights from our investment leaders, market strategists, economists and retirement experts. You can sign up to be alerted when new commentary is added, and you can watch portfolio manager videos and have instant access to Invesco news and updates wherever you may be.
In addition to the resources accessible on our website and through our mobile app, you can obtain timely updates to help you stay informed about the markets, the economy and investing by connecting with Invesco on Twitter, LinkedIn or Facebook. You can access our blog at blog.invesco.us.com. Our goal is to provide you the information you want, when and where you want it.
Have questions?
For questions about your account, feel free to contact an Invesco client services representative at 800 959 4246. For Invesco-related questions or comments, please email me directly at phil@invesco.com.
All of us at Invesco look forward to serving your investment management needs for many years to come. Thank you for investing with us.
Sincerely,

Philip Taylor
Senior Managing Director, Invesco Ltd.
iPhone and iPad are trademarks of Apple Inc., registered in the US and other countries. App Store is a service mark of Apple Inc. Invesco Distributors, Inc. is not affiliated with Apple Inc.
2 Invesco Long/Short Equity Fund
| | |

Bruce Crockett | | Dear Fellow Shareholders: Among the many important lessons I’ve learned in more than 40 years in a variety of business endeavors is the value of a trusted advocate. As independent chair of the Invesco Funds Board, I can assure you that the members of the Board are strong advocates for the interests of investors in Invesco’s mutual funds. We work hard to represent your interests through oversight of the quality of the investment management services your funds receive and other matters important to your investment, including but not limited to: n Ensuring that Invesco offers a diverse lineup of mutual funds that your financial adviser can use to strive to meet your financial needs as your investment goals change over time. n Monitoring how the portfolio management teams of the Invesco funds are performing in light of changing economic and market conditions. |
| n | | Assessing each portfolio management team’s investment performance within the context of the investment strategy described in the fund’s prospectus. |
| n | | Monitoring for potential conflicts of interests that may impact the nature of the services that your funds receive. |
We believe one of the most important services we provide our fund shareholders is the annual review of the funds’ advisory and sub-advisory contracts with Invesco Advisers and its affiliates. This review is required by the Investment Company Act of 1940 and focuses on the nature and quality of the services Invesco provides as the adviser to the Invesco funds and the reasonableness of the fees that it charges for those services. Each year, we spend months carefully reviewing information received from Invesco and a variety of independent sources, such as performance and fee data prepared by Lipper Inc., an independent, third-party firm widely recognized as a leader in its field. We also meet with our independent legal counsel and other independent advisers to review and help us assess the information that we have received. Our goal is to assure that you receive quality investment management services for a reasonable fee.
I trust the measures outlined above provide assurance that you have a worthy advocate when it comes to choosing the Invesco Funds.
As always, please contact me at bruce@brucecrockett.com with any questions or concerns you may have. On behalf of the Board, we look forward to continuing to represent your interests and serving your needs.
Sincerely,

Bruce L. Crockett
Independent Chair
Invesco Funds Board of Trustees
3 Invesco Long/Short Equity Fund
Management’s Discussion of Fund Performance
Performance summary
For the fiscal year ended October 31, 2015, Class A shares of Invesco Long/Short Equity Fund (the Fund), at net asset value (NAV), underperformed the S&P 500 Index, the Fund’s broad market benchmark, but outperformed the Citigroup 90-Day Treasury Bill Index, the Fund’s style-specific benchmark.
Your Fund’s long-term performance appears later in this report.
Fund vs. Indexes
Total returns, 10/31/14 to 10/31/15, at net asset value (NAV). Performance shown does not include applicable contingent deferred sales charges (CDSC) or front-end sales charges, which would have reduced performance.
| | | | |
Class A Shares | | | 4.66 | % |
Class C Shares | | | 3.78 | |
Class R Shares | | | 4.31 | |
Class Y Shares | | | 4.83 | |
Class R5 Shares | | | 4.83 | |
Class R6 Shares | | | 4.83 | |
| S&P 500 Indexq (Broad Market Index) | | | 5.20 | |
| Citigroup 90-Day Treasury Bill Indexq (Style-Specific Index) | | | 0.02 | |
Lipper Alternative Long/Short Equity Indexn (Peer Group Index) | | | -0.39 | |
Source(s): qFactSet Research Systems Inc.; nLipper Inc.
Market conditions and your Fund
For the first half of the fiscal year ended October 31, 2015, US equity markets delivered positive returns as a strong domestic economy and successful exit from the US Federal Reserve’s (the Fed) quantitative easing made for an attractive investment backdrop. During the second half of the reporting period, equity markets cooled, given macroeconomic distractions. Market-moving headlines during the fiscal year included the rapid decline in oil prices, the strengthening US
dollar given the potential for higher interest rates in the US, and slowing economic growth in China, which had negative implications for growth globally. Toward the end of the fiscal year, the Fed’s continued delay on raising interest rates increased investor uncertainty and market volatility.
Despite solid economic growth in the US, the performance of individual economic sectors varied dramatically during the fiscal year. The information technology (IT) sector performed well, especially the Internet software and services
industry. The consumer discretionary sector also performed well, led by retail and consumer services industries (such as entertainment, restaurants and leisure). This was due to lower gas prices, continued low interest rates and the increasing availability of credit, which boosted consumer confidence. The worst-performing sector was energy, due to an increased supply/demand imbalance, followed by materials, which was hurt by concerns of slowing global demand.
The Fund generally maintains a net long bias and implements its strategy by purchasing investments (long positions) with equity exposure that we believe to be undervalued and selling short investments (short positions) with equity exposure that we believe to be overvalued in the same industry. The Fund seeks to add value primarily from stock selection and secondarily by dynamically changing the level of its beta, or market exposure.
As part of the investment process, the Fund evaluates fundamental and behavioral factors to forecast individual securities’ returns and risks, and ranks these securities based on their attractiveness relative to industry peers. In a long/short construct, a positive spread between the top- and bottom-ranked stocks (long and short candidates for the portfolio), plus a positive return from market exposure, typically leads to the Fund outperforming its broad market benchmark, the S&P 500 Index.
| | | | | | | | | | | | | | | | |
| Portfolio Composition | | | | | | | | | | | | | | | | |
| By sector, based on total net assets | | | | | | | | | | | | | | | | |
| | | Equity Securities | | | Gross | | | Net | |
| | | Long1 | | | Short2 | | | Exposure3 | | | Exposure4 | |
Financials | | | 36.2 | % | | | 4.4 | % | | | 40.6 | % | | | 31.8 | % |
Information Technology | | | 32.1 | | | | 12.9 | | | | 45.0 | | | | 19.2 | |
Health Care | | | 24.6 | | | | 14.0 | | | | 38.6 | | | | 10.6 | |
Consumer Discretionary | | | 22.0 | | | | 21.2 | | | | 43.2 | | | | 0.8 | |
Energy | | | 18.2 | | | | 20.8 | | | | 39.0 | | | | -2.6 | |
Industrials | | | 14.6 | | | | 6.0 | | | | 20.6 | | | | 8.6 | |
Consumer Staples | | | 12.4 | | | | 1.3 | | | | 13.7 | | | | 11.1 | |
Materials | | | 9.0 | | | | 14.5 | | | | 23.5 | | | | -5.5 | |
Utilities | | | 8.5 | | | | – | | | | 8.5 | | | | 8.5 | |
Telecommunication Services | | | 0.3 | | | | 4.0 | | | | 4.3 | | | | -3.7 | |
Money Market Funds Plus Other Assets Less Liabilities | | | 21.2 | | | | – | | | | 21.2 | | | | 21.2 | |
Total | | | 199.1 | | | | 99.1 | | | | 298.2 | | | | 100.0 | |
| 1 | Represents the value of equity securities in the portfolio and the equity securities underlying the Fund’s equity long portfolio swap. |
| 2 | Represents the value of the equity securities underlying the Fund’s equity short portfolio swap. |
| 3 | Represents the cumulative exposure of the Fund’s long and short positions. |
| 4 | Represents the net exposure of the Fund’s long and short positions. |
| | | | |
Total Net Assets | | $ | 24.1 million | |
Data presented here are as of October 31, 2015.
4 Invesco Long/Short Equity Fund
During the fiscal year, the Fund benefited most from a positive long/short spread in six of 10 sectors led by the health care, IT, financials and consumer staples sectors. However, the spread was negative in the utilities, telecommunication services, materials and consumer discretionary sectors; this detracted from Fund performance for the fiscal year.
Within the health care sector, both long and short holdings in the biotechnology industry, as well as long holdings in the health care equipment and services industry, were the strongest contributors to Fund performance for the fiscal year. In the IT sector, both long and short holdings within the semiconductor industry contributed to Fund performance. Strong Fund results for the fiscal year from the financials sector were mostly due to the Fund’s being long real estate income trusts. Within the consumer staples sector, long and short holdings in the food, beverage and tobacco industry benefited Fund returns during the reporting period.
During the reporting period, the Fund’s long holdings in the utilities sector as well as the long and short holdings in the telecommunication services sector adversely impacted Fund performance. In addition, within the consumer discretionary sector, long and short holdings in the consumer durables industry as well as short holdings in the retailing industry detracted from Fund returns.
Despite weaker market returns in the second half of the fiscal year, in aggregate, the Fund’s net long exposure added to Fund returns, given its net long positioning in the health care, IT and consumer staples sectors; these sectors outperformed the market during the reporting period. Partially offsetting these results was the Fund’s net long allocation in the utilities and telecommunication services sectors as these sectors underperformed the market during the fiscal year. The Fund’s net short exposure to the consumer discretionary sector hindered returns as it was one the best-performing sectors during the fiscal year.
At the end of the reporting period, the Fund’s largest net long sector exposures were in the financials, health care, IT and utilities sectors. The Fund’s largest net short position was in the consumer discretionary sector.
Please note that the Fund may utilize derivative instruments that include equity total return swaps and futures contracts. During the reporting period, the
Fund utilized equity total return swaps to efficiently implement its strategy, but did not use future contracts. The implementation impact of using equity total return swaps is a component of transaction costs. Derivatives may amplify traditional investment risks through the creation of leverage and may be less liquid than traditional securities.
Thank you for your investment in Invesco Long/Short Equity Fund.
The views and opinions expressed in management’s discussion of Fund performance are those of Invesco Advisers, Inc. These views and opinions are subject to change at any time based on factors such as market and economic conditions. These views and opinions may not be relied upon as investment advice or recommendations, or as an offer for a particular security. The information is not a complete analysis of every aspect of any market, country, industry, security or the Fund. Statements of fact are from sources considered reliable, but Invesco Advisers, Inc. makes no representation or warranty as to their completeness or accuracy. Although historical performance is no guarantee of future results, these insights may help you understand our investment management philosophy.
See important Fund and, if applicable, index disclosures later in this report.
| | |
 | | Michael Abata Chartered Financial Analyst, Portfolio Manager, is manager of Invesco Long/Short |
Equity Fund. He joined Invesco in 2011. Mr. Abata earned a BA in economics from Binghamton University. |
 | | Charles Ko Chartered Financial Analyst, Portfolio Manager, is manager of Invesco Long/Short |
Equity Fund. He joined Invesco in 2012. Mr. Ko earned a BS from MIT and an MBA from Yale University. |
 | | Anthony Munchak Chartered Financial Analyst, Portfolio Manager, is manager of Invesco Long/Short |
Equity Fund. He joined Invesco in 2000. Mr. Munchak earned a BS and an MS in finance from Boston College and an MBA from Bentley College. |
 | | Glen Murphy Chartered Financial Analyst, Portfolio Manager, is manager of Invesco Long/Short |
Equity Fund. He joined Invesco in 1995. Mr. Murphy earned a BA in business administration from the University of Massachusetts Amherst and an MS in finance from Boston College. |
 | | Francis Orlando Chartered Financial Analyst, Portfolio Manager, is manager of Invesco Long/Short |
Equity Fund. He joined Invesco in 1987. Mr. Orlando earned a BA in business administration from Merrimack College and an MBA from Boston University. |
 | | Andrew Waisburd Portfolio Manager, is manager of Invesco Long/ Short Equity Fund. He joined |
| Invesco in 2008. Mr. Waisburd earned a BS in statistics from Cornell University and an MS and a PhD in finance from Indiana University. |
5 Invesco Long/Short Equity Fund
Your Fund’s Long-Term Performance
Results of a $10,000 Investment – Oldest Share Class(es) Since Inception
Fund and index data from 12/19/13
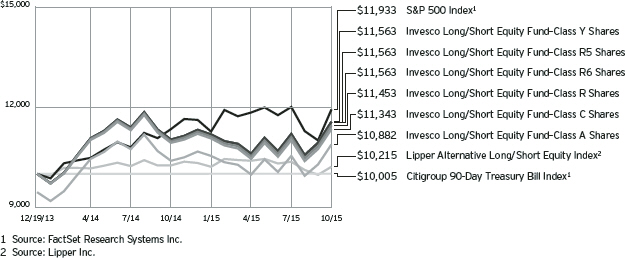
Past performance cannot guarantee comparable future results.
The data shown in the chart include reinvested distributions, applicable sales charges and Fund expenses including
management fees. Index results include reinvested dividends, but they do not reflect sales charges. Performance of the peer group, if applicable, reflects fund expenses and management fees;
performance of a market index does not. Performance shown in the chart and table(s) does not reflect deduction of taxes a shareholder would pay on Fund distributions or sale of Fund shares.
group, if applicable, reflects fund expenses; performance of a market index does not.
Other information
| n | | The returns shown in management’s discussion of Fund performance are based on net asset values (NAVs) calculated for shareholder transactions. Generally accepted accounting principles require adjustments to be made to the net assets of the Fund at period end for financial reporting purposes, and as such, the NAVs for shareholder transactions and the returns based on those NAVs may differ from the NAVs and returns reported in the Financial Highlights. |
| n | | Industry classifications used in this report are generally according to the Global Industry Classification Standard, which was developed by and is the exclusive property and a service mark of MSCI Inc. and Standard & Poor’s. |
6 Invesco Long/Short Equity Fund
| | | | |
| Average Annual Total Returns | |
As of 10/31/15, including maximum applicable sales charges | |
| |
Class A Shares | | | | |
Inception (12/19/13) | | | 4.63 | % |
1 Year | | | -1.09 | |
| |
Class C Shares | | | | |
Inception (12/19/13) | | | 6.99 | % |
1 Year | | | 2.78 | |
| |
Class R Shares | | | | |
Inception (12/19/13) | | | 7.54 | % |
1 Year | | | 4.31 | |
| |
Class Y Shares | | | | |
Inception (12/19/13) | | | 8.09 | % |
1 Year | | | 4.83 | |
| |
Class R5 Shares | | | | |
Inception (12/19/13) | | | 8.09 | % |
1 Year | | | 4.83 | |
| |
Class R6 Shares | | | | |
Inception (12/19/13) | | | 8.09 | % |
1 Year | | | 4.83 | |
The performance data quoted represent past performance and cannot guarantee comparable future results; current performance may be lower or higher. Please visit invesco.com/performance for the most recent month-end performance. Performance figures reflect reinvested distributions, changes in net asset value and the effect of the maximum sales charge unless otherwise stated. Investment return and principal value will fluctuate so that you may have a gain or loss when you sell shares.
The net annual Fund operating expense ratio set forth in the most recent Fund prospectus as of the date of this report for Class A, Class C, Class R, Class Y, Class R5 and Class R6 shares was 1.87%, 2.62%, 2.12%, 1.62%, 1.62% and 1.62%, respectively.1,2 The total annual Fund operating expense ratio set forth in the most recent Fund prospectus as of the date of this report for Class A, Class C, Class R, Class Y, Class R5 and Class R6 shares was 3.06%, 3.81%, 3.31%, 2.81%, 2.71% and 2.71%, respectively. The expense ratios presented above may vary from the expense ratios presented in other sections of this report that are based on expenses incurred during the period covered by this report.
Class A share performance reflects the maximum 5.50% sales charge, and Class C share performance reflects the
| | | | |
| Average Annual Total Returns | |
| As of 9/30/15, the most recent calendar quarter end, including maximum applicable sales charges | |
| |
Class A Shares | | | | |
Inception (12/19/13) | | | 1.60 | % |
1 Year | | | -9.08 | |
| |
Class C Shares | | | | |
Inception (12/19/13) | | | 4.11 | % |
1 Year | | | -5.38 | |
| |
Class R Shares | | | | |
Inception (12/19/13) | | | 4.59 | % |
1 Year | | | -4.05 | |
| |
Class Y Shares | | | | |
Inception (12/19/13) | | | 5.14 | % |
1 Year | | | -3.51 | |
| |
Class R5 Shares | | | | |
Inception (12/19/13) | | | 5.14 | % |
1 Year | | | -3.51 | |
| |
Class R6 Shares | | | | |
Inception (12/19/13) | | | 5.14 | % |
1 Year | | | -3.51 | |
applicable contingent deferred sales charge (CDSC) for the period involved. The CDSC on Class C shares is 1% for the first year after purchase. Class R, Class Y, Class R5 and Class R6 class shares do not have a front-end sales charge or a CDSC; therefore, performance is at net asset value.
The performance of the Fund’s share classes will differ primarily due to different sales charge structures and class expenses.
Fund performance reflects any applicable fee waivers and/or expense reimbursements. Had the adviser not waived fees and/or reimbursed expenses currently or in the past, returns would have been lower. See current prospectus for more information.
| 1 | Total annual Fund operating expenses after any contractual fee waivers and/or expense reimbursements by the adviser in effect through at least February 28, 2017. See current prospectus for more information. |
| 2 | Total annual Fund operating expenses after any contractual fee waivers and/or expense reimbursements by the adviser in effect through at least June 30, 2017. See current prospectus for more information. |
7 Invesco Long/Short Equity Fund
Invesco Long/Short Equity Fund’s investment objective is to seek long-term capital appreciation.
| n | | Unless otherwise stated, information presented in this report is as of October 31, 2015, and is based on total net assets. |
| n | | Unless otherwise noted, all data provided by Invesco. |
| n | | To access your Fund’s reports/prospectus, visit invesco.com/fundreports. |
About share classes
| n | | Class R shares are generally available only to employer sponsored retirement and benefit plans. Please see the prospectus for more information. |
| n | | Class Y shares are available only to certain investors. Please see the prospectus for more information. |
| n | | Class R5 shares and Class R6 shares are primarily intended for employer sponsored retirement and benefit plans that meet certain standards and for institutional investors. Please see the prospectus for more information. |
Principal in the Fund risks of investing
| n | | Derivatives risk. The value of a derivative instrument depends largely on (and is derived from) the value of an underlying security, currency, commodity, interest rate, index or other asset (each referred to as an underlying asset). In addition to risks relating to the underlying assets, the use of derivatives may include other, possibly greater, risks, including counterparty, leverage and liquidity risks. Counterparty risk is the risk that the counterparty to the derivative contract will default on its obligation to pay the Fund the amount owed or otherwise perform under the derivative contract. Derivatives create leverage risk because they do not require payment up front equal to the economic exposure created by owning the derivative. As a result, an adverse change in the value of the underlying asset could result in the Fund sustaining a loss that is substantially greater than the amount invested in the derivative, which may make the Fund’s returns more volatile and increase the risk of loss. Derivative instruments may also be less liquid than more traditional investments and the Fund may be unable to sell or close out its derivative positions at a desirable time or price. This risk may be more acute under adverse market conditions, during which the Fund may be most in need of liquidating its derivative positions. Derivatives may also be harder to value, |
less tax efficient and subject to changing government regulation that could impact the Fund’s ability to use certain derivatives or their cost. Also, derivatives used for hedging or to gain or limit exposure to a particular market segment may not provide the expected benefits, particularly during adverse market conditions. These risks are greater for the Fund than mutual funds that do not use derivative instruments or that use derivative instruments to a lesser extent than the Fund to implement their investment strategy.
| n | | Management risk. The investment techniques and risk analysis used by the Fund’s portfolio managers may not produce the desired results. In particular, there is no guarantee that the Fund’s mixture of long and short positions or the portfolio manager’s stock selection process will produce a portfolio with reduced exposure to stock market risk. In addition, the Fund’s long/ short investment strategy may cause the Fund to underperform the broader equity markets in which the Fund invests during market rallies. Such underperformance could be significant during sudden or significant market rallies. |
| n | | Market risk. The prices of and the income generated by the Fund’s securities may decline in response to, among other things, investor sentiment, general economic and market conditions, regional or global instability, and currency and interest rate fluctuations. |
| n | | Short sales risk. Short sales may cause the Fund to repurchase a security at a higher price, thereby causing the Fund to incur a loss. A short position in a security poses more risk than holding the same security long. As there is no limit on how much the price of the security can increase, the Fund’s exposure is unlimited. In order to establish a short position in a security, the Fund must borrow the security from a broker. The Fund may not always be able to borrow a security the Fund seeks to sell short at a particular time or at an acceptable price. The Fund also may not always be able to close out the short position by replacing |
the borrowed securities at a particular time or at an acceptable price. The Fund will incur increased transaction costs associated with selling securities short. In addition, taking short positions in securities results in a form of leverage which may cause the Fund to be volatile.
| n | | Small- and mid-capitalization risks. Stocks of small- and mid-sized companies tend to be more vulnerable to adverse developments and may have little or no operating history or track record of success, and limited product lines, markets, management and financial resources. The securities of small- and mid-sized companies may be more volatile due to less market interest and less publicly available information about the issuer. They also may be illiquid or restricted as to resale, or may trade less frequently and in smaller volumes, all of which may cause difficulty when establishing or closing a position at a desirable price. |
About indexes used in this report
| n | | The S&P 500® Index is an unmanaged index considered representative of the US stock market. |
| n | | The Citigroup 90-Day Treasury Bill Index is an unmanaged index representative of three-month Treasury bills. |
| n | | The Lipper Alternative Long/Short Equity Index is composed of domestic or foreign funds that employ portfolio strategies combining long holdings of equities with short sales of equity, equity options or equity index options. The funds may be either net long or net short, depending on the portfolio manager’s view of the market. |
| n | | The Fund is not managed to track the performance of any particular index, including the index(es) described here, and consequently, the performance of the Fund may deviate significantly from the performance of the index(es). |
| n | | A direct investment cannot be made in an index. Unless otherwise indicated, index results include reinvested dividends, and they do not reflect sales charges. Performance of the peer |
continued on page 6
|
| This report must be accompanied or preceded by a currently effective Fund prospectus, which contains more complete information, including sales charges and expenses. Investors should read it carefully before investing. |
NOT FDIC INSURED | MAY LOSE VALUE | NO BANK GUARANTEE
8 Invesco Long/Short Equity Fund
Schedule of Investments(a)
October 31, 2015
| | | | | | | | |
| | | Shares | | | Value | |
Common Stocks & Other Equity Interests–79.20% | |
| Aerospace & Defense–1.44% | |
L-3 Communications Holdings, Inc. | | | 2,000 | | | $ | 252,800 | |
Spirit AeroSystems Holdings Inc.–Class A(b) | | | 1,800 | | | | 94,932 | |
| | | | | | | | 347,732 | |
|
| Agricultural & Farm Machinery–1.41% | |
AGCO Corp. | | | 7,050 | | | | 341,150 | |
|
| Agricultural Products–2.44% | |
Bunge Ltd. | | | 2,600 | | | | 189,696 | |
Ingredion Inc. | | | 4,200 | | | | 399,252 | |
| | | | | | | | 588,948 | |
|
| Apparel, Accessories & Luxury Goods–1.09% | |
PVH Corp. | | | 2,900 | | | | 263,755 | |
|
| Application Software–0.16% | |
Nuance Communications, Inc.(b) | | | 2,250 | | | | 38,183 | |
|
| Biotechnology–1.43% | |
United Therapeutics Corp.(b) | | | 2,350 | | | | 344,580 | |
|
| Coal & Consumable Fuels–1.65% | |
Cameco Corp. (Canada) | | | 26,000 | | | | 368,420 | |
Peabody Energy Corp.(b) | | | 2,293 | | | | 29,327 | |
| | | | | | | | 397,747 | |
|
| Communications Equipment–2.25% | |
F5 Networks, Inc.(b) | | | 1,300 | | | | 143,260 | |
Juniper Networks, Inc. | | | 12,750 | | | | 400,222 | |
| | | | | | | | 543,482 | |
|
| Computer & Electronics Retail–3.04% | |
Best Buy Co., Inc. | | | 10,450 | | | | 366,063 | |
GameStop Corp.–Class A | | | 8,000 | | | | 368,560 | |
| | | | | | | | 734,623 | |
|
| Construction & Engineering–1.46% | |
Jacobs Engineering Group, Inc.(b) | | | 8,800 | | | | 353,232 | |
|
| Construction Machinery & Heavy Trucks–1.47% | |
Allison Transmission Holdings, Inc. | | | 12,350 | | | | 354,445 | |
|
| Consumer Finance–2.51% | |
Navient Corp. | | | 26,600 | | | | 350,854 | |
Santander Consumer USA Holdings Inc. | | | 14,200 | | | | 255,742 | |
| | | | | | | | 606,596 | |
|
| Data Processing & Outsourced Services–3.98% | |
Computer Sciences Corp. | | | 5,650 | | | | 376,234 | |
Western Union Co. (The) | | | 20,500 | | | | 394,625 | |
Xerox Corp. | | | 20,170 | | | | 189,396 | |
| | | | | | | | 960,255 | |
|
| Diversified Chemicals–0.10% | |
Chemours Co. (The) | | | 3,650 | | | | 25,295 | |
| | | | | | | | |
| | | Shares | | | Value | |
| Electric Utilities–1.08% | |
Entergy Corp. | | | 3,820 | | | $ | 260,371 | |
|
| Electronic Manufacturing Services–1.55% | |
Flextronics International Ltd.(b) | | | 32,900 | | | | 374,731 | |
|
| Fertilizers & Agricultural Chemicals–0.15% | |
Mosaic Co. (The) | | | 1,100 | | | | 37,169 | |
|
| Gas Utilities–1.52% | |
National Fuel Gas Co. | | | 6,550 | | | | 344,071 | |
UGI Corp. | | | 600 | | | | 22,002 | |
| | | | | | | | 366,073 | |
|
| Gold–1.09% | |
Newmont Mining Corp. | | | 13,550 | | | | 263,683 | |
|
| Health Care Equipment–1.71% | |
Hologic, Inc.(b) | | | 10,650 | | | | 413,859 | |
|
| Health Care Facilities–1.50% | |
Community Health Systems, Inc.(b) | | | 1,850 | | | | 51,874 | |
Universal Health Services, Inc.–Class B | | | 2,550 | | | | 311,329 | |
| | | | | | | | 363,203 | |
|
| Health Care REIT’s–0.14% | |
Care Capital Properties, Inc. | | | 1,000 | | | | 32,950 | |
|
| Health Care Services–1.30% | |
Quest Diagnostics Inc. | | | 4,600 | | | | 312,570 | |
|
| Home Furnishings–1.26% | |
Leggett & Platt, Inc. | | | 6,750 | | | | 303,953 | |
|
| Independent Power Producers & Energy Traders–0.08% | |
Talen Energy Corp.(b) | | | 2,200 | | | | 19,096 | |
|
| Integrated Oil & Gas–0.28% | |
Cenovus Energy Inc. (Canada) | | | 4,600 | | | | 68,586 | |
|
| Integrated Telecommunication Services–0.12% | |
Windstream Holdings Inc. | | | 4,500 | | | | 29,295 | |
|
| Internet Retail–2.03% | |
Expedia, Inc. | | | 3,600 | | | | 490,680 | |
|
| Internet Software & Services–3.29% | |
IAC/InterActiveCorp | | | 450 | | | | 30,155 | |
Rackspace Hosting, Inc.(b) | | | 12,250 | | | | 316,662 | |
VeriSign, Inc.(b) | | | 5,550 | | | | 447,330 | |
| | | | | | | | 794,147 | |
|
| IT Consulting & Other Services–2.00% | |
CGI Group Inc.–Class A (Canada)(b) | | | 1,250 | | | | 46,425 | |
Leidos Holdings, Inc. | | | 8,300 | | | | 436,331 | |
| | | | | | | | 482,756 | |
|
| Leisure Products–1.35% | |
Hasbro, Inc. | | | 4,250 | | | | 326,528 | |
See accompanying Notes to Financial Statements which are an integral part of the financial statements.
9 Invesco Long/Short Equity Fund
| | | | | | | | |
| | | Shares | | | Value | |
| Life & Health Insurance–1.43% | |
Lincoln National Corp. | | | 4,580 | | | $ | 245,076 | |
Unum Group | | | 2,900 | | | | 100,485 | |
| | | | | | | | 345,561 | |
|
| Mortgage REIT’s–1.19% | |
Annaly Capital Management, Inc. | | | 28,750 | | | | 286,063 | |
|
| Office REIT’s–0.91% | |
Alexandria Real Estate Equities, Inc. | | | 2,450 | | | | 219,863 | |
|
| Oil & Gas Drilling–4.24% | |
Ensco PLC–Class A | | | 12,050 | | | | 200,392 | |
Noble Corp. PLC | | | 29,500 | | | | 397,365 | |
Transocean Ltd. | | | 26,950 | | | | 426,618 | |
| | | | | | | | 1,024,375 | |
|
| Oil & Gas Equipment & Services–1.22% | |
Oceaneering International, Inc. | | | 800 | | | | 33,616 | |
Superior Energy Services, Inc. | | | 18,400 | | | | 260,544 | |
| | | | | | | | 294,160 | |
|
| Oil & Gas Exploration & Production–1.00% | |
Denbury Resources Inc. | | | 40,600 | | | | 143,724 | |
Newfield Exploration Co.(b) | | | 2,400 | | | | 96,456 | |
| | | | | | | | 240,180 | |
|
| Oil & Gas Refining & Marketing–3.37% | |
HollyFrontier Corp. | | | 7,100 | | | | 347,687 | |
Tesoro Corp. | | | 4,350 | | | | 465,145 | |
| | | | | | | | 812,832 | |
|
| Packaged Foods & Meats–1.13% | |
Pilgrim’s Pride Corp. | | | 14,350 | | | | 272,507 | |
|
| Paper Packaging–1.44% | |
Avery Dennison Corp. | | | 5,350 | | | | 347,589 | |
|
| Regional Banks–1.44% | |
CIT Group, Inc. | | | 8,100 | | | | 348,300 | |
|
| Reinsurance–2.30% | |
Everest Re Group, Ltd. | | | 1,850 | | | | 329,244 | |
Reinsurance Group of America, Inc. | | | 2,500 | | | | 225,600 | |
| | | | | | | | 554,844 | |
|
| Residential REIT’s–0.99% | |
UDR, Inc. | | | 6,950 | | | | 239,497 | |
| | | | | | | | |
| | | Shares | | | Value | |
| Restaurants–1.49% | |
Darden Restaurants, Inc. | | | 5,800 | | | $ | 358,962 | |
|
| Retail REIT’s–1.70% | |
Regency Centers Corp. | | | 5,450 | | | | 370,382 | |
Urban Edge Properties | | | 1,725 | | | | 40,951 | |
| | | | | | | | 411,333 | |
|
| Security & Alarm Services–1.19% | |
ADT Corp. (The) | | | 8,700 | | | | 287,448 | |
|
| Semiconductors–1.96% | |
NVIDIA Corp. | | | 16,700 | | | | 473,779 | |
|
| Soft Drinks–1.02% | |
Dr Pepper Snapple Group, Inc. | | | 2,750 | | | | 245,768 | |
|
| Specialized Finance–0.83% | |
Nasdaq, Inc. | | | 3,450 | | | | 199,721 | |
|
| Specialized REIT’s–1.84% | |
Extra Space Storage Inc. | | | 5,600 | | | | 443,744 | |
|
| Systems Software–0.64% | |
CA, Inc. | | | 5,550 | | | | 153,791 | |
|
| Technology Hardware, Storage & Peripherals–1.55% | |
Lexmark International, Inc.–Class A | | | 1,900 | | | | 61,731 | |
NetApp, Inc. | | | 9,200 | | | | 312,800 | |
| | | | | | | | 374,531 | |
|
| Tires & Rubber–1.44% | |
Goodyear Tire & Rubber Co. (The) | | | 10,550 | | | | 346,462 | |
Total Common Stocks & Other Equity Interests
(Cost $19,019,375) | | | | 19,120,983 | |
|
Money Market Funds–15.98% | |
Liquid Assets Portfolio–Institutional
Class, 0.16%(c) | | | 1,928,496 | | | | 1,928,496 | |
Premier Portfolio–Institutional
Class, 0.12%(c) | | | 1,928,496 | | | | 1,928,496 | |
Total Money Market Funds
(Cost $3,856,992) | | | | 3,856,992 | |
TOTAL INVESTMENTS–95.18%
(Cost $22,876,367) | | | | 22,977,975 | |
OTHER ASSETS LESS LIABILITIES–4.82% | | | | 1,162,672 | |
NET ASSETS–100.00% | | | $ | 24,140,647 | |
Investment Abbreviations:
| | |
| REIT | | – Real Estate Investment Trust |
Notes to Schedule of Investments:
| (a) | Industry and/or sector classifications used in this report are generally according to the Global Industry Classification Standard, which was developed by and is the exclusive property and a service mark of MSCI Inc. and Standard & Poor’s. |
| (b) | Non-income producing security. |
| (c) | The money market fund and the Fund are affiliated by having the same investment adviser. The rate shown is the 7-day SEC standardized yield as of October 31, 2015. |
See accompanying Notes to Financial Statements which are an integral part of the financial statements.
10 Invesco Long/Short Equity Fund
| | | | | | | | | | | | | | | | | | | | |
| Open Total Return Swap Agreements | |
| Reference Entity | | Counterparty | | Expiration
Dates | | | Floating Rate Index(1) | | Notional
Amount | | | Unrealized
Appreciation | | | Net Value of
Reference
Entities | |
Equity Securities — Long | | Morgan Stanley & Co. LLC | | | 12/21/2015 | | | Federal Funds floating rate | | $ | 23,691,524 | | | $ | 142,816 | (2) | | $ | 23,818,216 | |
Equity Securities — Short | | Morgan Stanley & Co. LLC | | | 12/21/2015 | | | Federal Funds floating rate | | | (24,063,986 | ) | | | 123,306 | (3) | | | (23,929,795 | ) |
Total Return Swap Agreements — Equity Risk | | | | | | | | | | | | $ | 266,122 | | | | | |
| (1) | The Fund receives or pays the total return on the long and short positions underlying the total return swap and pays or receives a specific Federal Funds floating rate. |
| (2) | Amount includes $16,124 of dividends receivable and fees. |
| (3) | Amount includes $(10,885) of dividends payable and fees. |
The following table represents the individual long and short positions and related values of equity securities underlying the total return swap with Morgan Stanley & Co. LLC as of October 31, 2015.
| | | | | | | | |
| | | Shares | | | Value | |
Equity Securities — Long | |
| Aerospace & Defense | |
Boeing Co. (The) | | | 2,450 | | | $ | 362,771 | |
L-3 Communications Holdings, Inc. | | | 800 | | | | 101,120 | |
Spirit AeroSystems Holdings Inc.–Class A | | | 4,900 | | | | 258,426 | |
| | | | | | | | 722,317 | |
|
| Agricultural & Farm Machinery | |
AGCO Corp. | | | 350 | | | | 16,936 | |
|
| Agricultural Products | |
Archer-Daniels-Midland Co. | | | 7,700 | | | | 351,582 | |
Bunge Ltd. | | | 2,050 | | | | 149,568 | |
| | | | | | | | 501,150 | |
|
| Air Freight & Logistics | |
Expeditors International of Washington, Inc. | | | 7,300 | | | | 363,467 | |
|
| Apparel, Accessories & Luxury Goods | |
PVH Corp. | | | 1,050 | | | | 95,498 | |
|
| Application Software | |
Citrix Systems, Inc. | | | 4,300 | | | | 353,030 | |
Nuance Communications, Inc. | | | 18,800 | | | | 319,036 | |
| | | | | | | | 672,066 | |
|
| Auto Parts & Equipment | |
Lear Corp. | | | 3,200 | | | | 400,192 | |
|
| Biotechnology | |
Gilead Sciences, Inc. | | | 3,400 | | | | 367,642 | |
Incyte Corp. | | | 3,000 | | | | 352,590 | |
United Therapeutics Corp. | | | 250 | | | | 36,658 | |
| | | | | | | | 756,890 | |
|
| Broadcasting | |
TEGNA Inc. | | | 1,350 | | | | 36,504 | |
|
| Cable & Satellite | |
Comcast Corp. | | | 5,750 | | | | 360,065 | |
|
| Coal & Consumable Fuels | |
Cameco Corp. (Canada) | | | 1,600 | | | | 22,672 | |
| | | | | | | | |
| | | Shares | | | Value | |
| Commodity Chemicals | |
LyondellBasell Industries N.V.–Class A | | | 4,250 | | | $ | 394,868 | |
|
| Communications Equipment | |
Cisco Systems, Inc. | | | 12,850 | | | | 370,722 | |
F5 Networks, Inc. | | | 1,400 | | | | 154,280 | |
| | | | | | | | 525,002 | |
|
| Consumer Finance | |
Santander Consumer USA Holdings Inc. | | | 1,800 | | | | 32,418 | |
|
| Data Processing & Outsourced Services | |
Global Payments Inc. | | | 2,600 | | | | 354,666 | |
Xerox Corp. | | | 6,130 | | | | 57,561 | |
| | | | | | | | 412,227 | |
|
| Diversified Banks | |
Bank of America Corp. | | | 20,900 | | | | 350,702 | |
Citigroup Inc. | | | 6,600 | | | | 350,922 | |
JPMorgan Chase & Co. | | | 4,750 | | | | 305,187 | |
| | | | | | | | 1,006,811 | |
|
| Drug Retail | |
CVS Health Corp. | | | 3,350 | | | | 330,913 | |
|
| Electric Utilities | |
Edison International | | | 5,500 | | | | 332,860 | |
Entergy Corp. | | | 480 | | | | 32,717 | |
Exelon Corp. | | | 12,650 | | | | 353,188 | |
| | | | | | | | 718,765 | |
|
| Environmental & Facilities Services | |
Waste Management, Inc. | | | 6,500 | | | | 349,440 | |
|
| Fertilizers & Agricultural Chemicals | |
Mosaic Co. (The) | | | 9,350 | | | | 315,937 | |
|
| General Merchandise Stores | |
Target Corp. | | | 4,700 | | | | 362,746 | |
|
| Gold | |
Barrick Gold Corp. (Canada) | | | 51,650 | | | | 397,188 | |
Newmont Mining Corp. | | | 6,650 | | | | 129,409 | |
| | | | | | | | 526,597 | |
See accompanying Notes to Financial Statements which are an integral part of the financial statements.
11 Invesco Long/Short Equity Fund
| | | | | | | | |
| | | Shares | | | Value | |
| Health Care Distributors | |
AmerisourceBergen Corp. | | | 3,700 | | | $ | 357,087 | |
Cardinal Health, Inc. | | | 4,050 | | | | 332,910 | |
| | | | | | | | 689,997 | |
|
| Health Care Equipment | |
C. R. Bard, Inc. | | | 1,600 | | | | 298,160 | |
|
| Health Care Facilities | |
Community Health Systems, Inc. | | | 5,900 | | | | 165,436 | |
HCA Holdings, Inc. | | | 4,650 | | | | 319,873 | |
Universal Health Services, Inc. | | | 50 | | | | 6,105 | |
| | | | | | | | 491,414 | |
|
| Health Care Services | |
Express Scripts Holding Co. | | | 4,750 | | | | 410,305 | |
|
| Home Furnishings | |
Leggett & Platt, Inc. | | | 1,150 | | | | 51,785 | |
|
| Home Improvement Retail | |
Lowe’s Cos., Inc. | | | 4,850 | | | | 358,076 | |
|
| Hotels, Resorts & Cruise Lines | |
Starwood Hotels & Resorts Worldwide, Inc. | | | 4,950 | | | | 395,356 | |
|
| Industrial Conglomerates | |
General Electric Co. | | | 13,050 | | | | 377,406 | |
|
| Integrated Oil & Gas | |
Cenovus Energy Inc. (Canada) | | | 18,350 | | | | 273,598 | |
Suncor Energy, Inc. (Canada) | | | 12,450 | | | | 370,139 | |
| | | | | | | | 643,737 | |
|
| Integrated Telecommunication Services | |
CenturyLink Inc. | | | 1,500 | | | | 42,315 | |
|
| Internet Retail | |
TripAdvisor, Inc. | | | 4,600 | | | | 385,388 | |
|
| Internet Software & Services | |
IAC/InterActiveCorp | | | 5,000 | | | | 335,050 | |
|
| IT Consulting & Other Services | |
Teradata Corp. | | | 12,600 | | | | 354,186 | |
|
| Leisure Products | |
Hasbro, Inc. | | | 200 | | | | 15,366 | |
|
| Life & Health Insurance | |
Lincoln National Corp. | | | 2,320 | | | | 124,143 | |
MetLife, Inc. | | | 7,000 | | | | 352,660 | |
Prudential Financial, Inc. | | | 4,350 | | | | 358,875 | |
Sun Life Financial, Inc. (Canada) | | | 10,300 | | | | 347,213 | |
| | | | | | | | 1,182,891 | |
|
| Life Sciences Tools & Services | |
Agilent Technologies Inc. | | | 9,650 | | | | 364,384 | |
Waters Corp. | | | 1,350 | | | | 172,530 | |
| | | | | | | | 536,914 | |
| | | | | | | | |
| | | Shares | | | Value | |
| Managed Health Care | |
UnitedHealth Group Inc. | | | 2,700 | | | $ | 318,006 | |
|
| Mortgage REIT’s | |
Annaly Capital Management, Inc. | | | 7,300 | | | | 72,635 | |
|
| Multi-Line Insurance | |
American International Group, Inc. | | | 3,650 | | | | 230,169 | |
Hartford Financial Services Group, Inc. (The) | | | 7,250 | | | | 335,385 | |
| | | | | | | | 565,554 | |
|
| Multi-Utilities | |
PG&E Corp. | | | 6,700 | | | | 357,780 | |
Public Service Enterprise Group Inc. | | | 7,750 | | | | 319,998 | |
| | | | | | | | 677,778 | |
|
| Oil & Gas Drilling | |
Ensco PLC–Class A | | | 6,300 | | | | 104,769 | |
|
| Oil & Gas Exploration & Production | |
Canadian Natural Resources Ltd. (Canada) | | | 13,900 | | | | 322,758 | |
|
| Oil & Gas Refining & Marketing | |
HollyFrontier Corp. | | | 350 | | | | 17,139 | |
Valero Energy Corp. | | | 6,650 | | | | 438,368 | |
| | | | | | | | 455,507 | |
|
| Packaged Foods & Meats | |
ConAgra Foods, Inc. | | | 8,950 | | | | 362,922 | |
Pilgrim’s Pride Corp. | | | 4,300 | | | | 81,657 | |
| | | | | | | | 444,579 | |
|
| Paper Packaging | |
Sealed Air Corp. | | | 5,350 | | | | 262,792 | |
|
| Pharmaceuticals | |
Merck & Co., Inc. | | | 6,650 | | | | 363,489 | |
Pfizer, Inc. | | | 10,650 | | | | 360,183 | |
Zoetis, Inc. | | | 6,900 | | | | 296,769 | |
| | | | | | | | 1,020,441 | |
|
| Property & Casualty Insurance | |
Travelers Cos., Inc. (The) | | | 3,400 | | | | 383,826 | |
|
| Regional Banks | |
SunTrust Banks, Inc. | | | 8,650 | | | | 359,148 | |
|
| Residential REIT’s | |
Equity Residential | | | 4,500 | | | | 347,940 | |
|
| Retail REIT’s | |
General Growth Properties, Inc. | | | 13,300 | | | | 385,035 | |
Kimco Realty Corp. | | | 13,350 | | | | 357,380 | |
| | | | | | | | 742,415 | |
|
| Semiconductors | |
Intel Corp. | | | 11,450 | | | | 387,697 | |
Maxim Integrated Products, Inc. | | | 10,100 | | | | 413,898 | |
| | | | | | | | 801,595 | |
See accompanying Notes to Financial Statements which are an integral part of the financial statements.
12 Invesco Long/Short Equity Fund
| | | | | | | | |
| | | Shares | | | Value | |
| Soft Drinks | |
Coca-Cola Enterprises, Inc. | | | 7,400 | | | $ | 379,916 | |
Dr Pepper Snapple Group, Inc. | | | 2,400 | | | | 214,488 | |
| | | | | | | | 594,404 | |
|
| Specialty Properties | |
Public Storage | | | 1,550 | | | | 355,663 | |
|
| Technology Hardware, Storage & Peripherals | |
Apple Inc. | | | 3,450 | | | | 412,275 | |
NetApp, Inc. | | | 1,900 | | | | 64,600 | |
| | | | | | | | 476,875 | |
|
| Tires & Rubber | |
Goodyear Tire & Rubber Co. (The) | | | 600 | | | | 19,704 | |
Total Equity Securities — Long | | | | | | | 23,818,216 | |
|
Equity Securities — Short | |
| Apparel, Accessories & Luxury Goods | |
Gildan Activewear Inc. (Canada) | | | (13,000 | ) | | | (373,490 | ) |
Hanesbrands, Inc. | | | (4,750 | ) | | | (151,715 | ) |
Lululemon Athletica Inc. | | | (7,300 | ) | | | (358,941 | ) |
Michael Kors Holdings Ltd. | | | (8,100 | ) | | | (312,984 | ) |
Under Armour, Inc.–Class A | | | (3,700 | ) | | | (351,796 | ) |
| | | | | | | | (1,548,926 | ) |
|
| Application Software | |
Autodesk, Inc. | | | (4,700 | ) | | | (259,393 | ) |
Workday, Inc. | | | (4,000 | ) | | | (315,880 | ) |
| | | | | | | | (575,273 | ) |
|
| Auto Parts & Equipment | |
BorgWarner Inc. | | | (6,300 | ) | | | (269,766 | ) |
|
| Automobile Manufacturers | |
General Motors Co. | | | (10,100 | ) | | | (352,591 | ) |
Tesla Motors, Inc. | | | (1,250 | ) | | | (258,663 | ) |
| | | | | | | | (611,254 | ) |
|
| Automotive Retail | |
CarMax, Inc. | | | (5,550 | ) | | | (327,506 | ) |
|
| Biotechnology | |
Alnylam Pharmaceuticals Inc. | | | (3,900 | ) | | | (335,205 | ) |
Celgene Corp. | | | (2,550 | ) | | | (312,910 | ) |
Puma Biotechnology, Inc. | | | (3,900 | ) | | | (321,438 | ) |
| | | | | | | | (969,553 | ) |
|
| Building Products | |
Fortune Brands Home & Security Inc. | | | (4,350 | ) | | | (227,635 | ) |
|
| Casinos & Gaming | |
Wynn Resorts Ltd. | | | (5,300 | ) | | | (370,735 | ) |
|
| Coal & Consumable Fuels | |
CONSOL Energy Inc. | | | (28,200 | ) | | | (187,812 | ) |
|
| Commodity Chemicals | |
Methanex Corp. (Canada) | | | (9,350 | ) | | | (373,346 | ) |
| | | | | | | | |
| | | Shares | | | Value | |
| Construction Materials | |
Martin Marietta Materials, Inc. | | | (2,350 | ) | | $ | (364,603 | ) |
|
| Consumer Electronics | |
Garmin Ltd. | | | (7,850 | ) | | | (278,439 | ) |
|
| Data Processing & Outsourced Services | |
MasterCard, Inc. | | | (3,500 | ) | | | (346,465 | ) |
|
| Diversified Metals & Mining | |
Freeport-McMoRan Inc. | | | (30,550 | ) | | | (359,573 | ) |
|
| Diversified REIT’s | |
VEREIT, Inc. | | | (41,850 | ) | | | (345,681 | ) |
W. P. Carey Inc. | | | (250 | ) | | | (15,843 | ) |
| | | | | | | | (361,524 | ) |
|
| Electrical Components & Equipment | |
Sensata Technologies Holding N.V. | | | (7,250 | ) | | | (348,653 | ) |
|
| Fertilizers & Agricultural Chemicals | |
Agrium Inc. (Canada) | | | (550 | ) | | | (51,188 | ) |
CF Industries Holdings, Inc. | | | (5,350 | ) | | | (271,619 | ) |
FMC Corp. | | | (9,550 | ) | | | (388,780 | ) |
| | | | | | | | (711,587 | ) |
|
| Gold | |
Franco-Nevada Corp. (Canada) | | | (6,700 | ) | | | (339,623 | ) |
|
| Health Care Equipment | |
IDEXX Laboratories, Inc. | | | (4,350 | ) | | | (298,497 | ) |
|
| Health Care Facilities | |
Brookdale Senior Living Inc. | | | (17,300 | ) | | | (361,743 | ) |
Tenet Healthcare Corp. | | | (11,300 | ) | | | (354,481 | ) |
| | | | | | | | (716,224 | ) |
|
| Health Care Supplies | |
Cooper Cos., Inc. (The) | | | (2,400 | ) | | | (365,664 | ) |
|
| Health Care Technology | |
Cerner Corp. | | | (5,300 | ) | | | (351,337 | ) |
|
| Homebuilding | |
Lennar Corp. | | | (7,000 | ) | | | (350,490 | ) |
PulteGroup Inc. | | | (19,500 | ) | | | (357,435 | ) |
| | | | | | | | (707,925 | ) |
|
| Industrial Machinery | |
Colfax Corp. | | | (8,300 | ) | | | (223,768 | ) |
|
| Integrated Oil & Gas | |
Chevron Corp. | | | (4,000 | ) | | | (363,520 | ) |
Exxon Mobil Corp. | | | (4,300 | ) | | | (355,782 | ) |
| | | | | | | | (719,302 | ) |
|
| Internet Retail | |
Amazon.com, Inc. | | | (580 | ) | | | (363,022 | ) |
See accompanying Notes to Financial Statements which are an integral part of the financial statements.
13 Invesco Long/Short Equity Fund
| | | | | | | | |
| | | Shares | | | Value | |
| Internet Software & Services | |
Alphabet Inc.–Class A | | | (440 | ) | | $ | (324,452 | ) |
Alphabet Inc.–Class C | | | (60 | ) | | | (42,649 | ) |
| | | | | | | | (367,101 | ) |
|
| Investment Banking & Brokerage | |
Charles Schwab Corp. (The) | | | (11,600 | ) | | | (354,032 | ) |
|
| Life Sciences Tools & Services | |
Illumina, Inc. | | | (2,400 | ) | | | (343,872 | ) |
|
| Oil & Gas Drilling | |
Diamond Offshore Drilling, Inc. | | | (11,400 | ) | | | (226,632 | ) |
|
| Oil & Gas Exploration & Production | |
Antero Resources Corp. | | | (14,050 | ) | | | (331,158 | ) |
Cobalt International Energy, Inc. | | | (48,900 | ) | | | (375,063 | ) |
Continental Resources, Inc. | | | (10,750 | ) | | | (364,532 | ) |
Encana Corp. (Canada) | | | (6,650 | ) | | | (50,739 | ) |
Noble Energy, Inc. | | | (10,300 | ) | | | (369,152 | ) |
Pioneer Natural Resources Co. | | | (2,600 | ) | | | (356,564 | ) |
Range Resources Corp. | | | (10,100 | ) | | | (307,444 | ) |
Southwestern Energy Co. | | | (33,450 | ) | | | (369,288 | ) |
Whiting Petroleum Corp. | | | (21,100 | ) | | | (363,553 | ) |
| | | | | | | | (2,887,493 | ) |
|
| Oil & Gas Storage & Transportation | |
Cheniere Energy, Inc. | | | (7,550 | ) | | | (373,876 | ) |
Enbridge Inc. (Canada) | | | (6,450 | ) | | | (275,350 | ) |
Pembina Pipeline Corp. (Canada) | | | (14,250 | ) | | | (357,960 | ) |
| | | | | | | | (1,007,186 | ) |
|
| Packaged Foods & Meats | |
Keurig Green Mountain Inc. | | | (6,050 | ) | | | (307,037 | ) |
|
| Paper Packaging | |
Packaging Corp. of America | | | (3,950 | ) | | | (270,378 | ) |
|
| Pharmaceuticals | |
Mallinckrodt PLC | | | (5,100 | ) | | | (334,917 | ) |
|
| Railroads | |
Kansas City Southern | | | (4,300 | ) | | | (355,868 | ) |
|
| Real Estate Development | |
Howard Hughes Corp. | | | (2,850 | ) | | | (352,203 | ) |
| | | | | | | | |
| | | Shares | | | Value | |
| Restaurants | |
Chipotle Mexican Grill, Inc. | | | (455 | ) | | $ | (291,305 | ) |
|
| Semiconductor Equipment | |
SunEdison, Inc. | | | (38,750 | ) | | | (282,875 | ) |
| Semiconductors | |
Micron Technology, Inc. | | | (21,250 | ) | | | (351,900 | ) |
Qorvo, Inc. | | | (7,950 | ) | | | (349,244 | ) |
| | | | | | | | (701,144 | ) |
|
| Silver | |
Silver Wheaton Corp. (Canada) | | | (24,600 | ) | | | (334,314 | ) |
|
| Specialty Chemicals | |
Albemarle Corp. | | | (6,700 | ) | | | (358,584 | ) |
|
| Specialty Stores | |
Signet Jewelers Ltd. | | | (2,400 | ) | | | (362,256 | ) |
|
| Steel | |
Allegheny Technologies, Inc. | | | (12,500 | ) | | | (183,750 | ) |
United States Steel Corp. | | | (16,900 | ) | | | (197,392 | ) |
| | | | | | | | (381,142 | ) |
|
| Systems Software | |
NetSuite Inc. | | | (4,150 | ) | | | (353,041 | ) |
Tableau Software, Inc. | | | (4,250 | ) | | | (356,830 | ) |
| | | | | | | | (709,871 | ) |
|
| Technology Hardware, Storage & Peripherals | |
3D Systems Corp. | | | (12,250 | ) | | | (123,235 | ) |
|
| Trading Companies & Distributors | |
United Rentals, Inc. | | | (3,900 | ) | | | (291,954 | ) |
|
| Wireless Telecommunication Services | |
SBA Communications Corp. | | | (2,750 | ) | | | (327,305 | ) |
Sprint Corp. | | | (71,850 | ) | | | (339,851 | ) |
T-Mobile US, Inc. | | | (7,950 | ) | | | (301,228 | ) |
| | | | | | | | (968,384 | ) |
Total Equity Securities — Short | | | | | | | (23,929,795 | ) |
See accompanying Notes to Financial Statements which are an integral part of the financial statements.
14 Invesco Long/Short Equity Fund
Statement of Assets and Liabilities
October 31, 2015
| | | | |
Assets: | |
Investments, at value (Cost $19,019,375) | | $ | 19,120,983 | |
Investments in affiliated money market funds, at value and cost | | | 3,856,992 | |
Total investments, at value (Cost $22,876,367) | | | 22,977,975 | |
Receivable for: | | | | |
Deposits with brokers for swap agreements | | | 53,925 | |
Investments sold | | | 971,912 | |
Fund shares sold | | | 52,590 | |
Dividends | | | 17,803 | |
Investment for trustee deferred compensation and retirement plans | | | 4,316 | |
Unrealized appreciation on swap agreements — OTC | | | 266,122 | |
Other assets | | | 4,037 | |
Total assets | | | 24,348,680 | |
| |
Liabilities: | | | | |
Payable for: | | | | |
Fund shares reacquired | | | 75,952 | |
Swaps payable | | | 34,608 | |
Accrued fees to affiliates | | | 8,397 | |
Accrued trustees’ and officers’ fees and benefits | | | 1,413 | |
Accrued other operating expenses | | | 83,347 | |
Trustee deferred compensation and retirement plans | | | 4,316 | |
Total liabilities | | | 208,033 | |
Net assets applicable to shares outstanding | | $ | 24,140,647 | |
|
Net assets consist of: | |
Shares of beneficial interest | | $ | 23,065,837 | |
Undistributed net investment income | | | 873,445 | |
Undistributed net realized gain | | | (166,365 | ) |
Net unrealized appreciation | | | 367,730 | |
| | | $ | 24,140,647 | |
| | | | |
Net Assets: | |
Class A | | $ | 12,854,193 | |
Class C | | $ | 2,350,293 | |
Class R | | $ | 40,401 | |
Class Y | | $ | 7,709,097 | |
Class R5 | | $ | 577,953 | |
Class R6 | | $ | 608,710 | |
|
Shares outstanding, $0.01 par value per share,
with an unlimited number of shares authorized: | |
Class A | | | 1,117,309 | |
Class C | | | 207,191 | |
Class R | | | 3,528 | |
Class Y | | | 666,803 | |
Class R5 | | | 50,001 | |
Class R6 | | | 52,656 | |
Class A: | | | | |
Net asset value per share | | $ | 11.50 | |
Maximum offering price per share | | | | |
(Net asset value of $11.50 ¸ 94.50%) | | $ | 12.17 | |
Class C: | | | | |
Net asset value and offering price per share | | $ | 11.34 | |
Class R: | | | | |
Net asset value and offering price per share | | $ | 11.45 | |
Class Y: | | | | |
Net asset value and offering price per share | | $ | 11.56 | |
Class R5: | | | | |
Net asset value and offering price per share | | $ | 11.56 | |
Class R6: | | | | |
Net asset value and offering price per share | | $ | 11.56 | |
See accompanying Notes to Financial Statements which are an integral part of the financial statements.
15 Invesco Long/Short Equity Fund
Statement of Operations
For the year ended October 31, 2015
| | | | |
Investment income: | |
Dividends (net of foreign withholding taxes of $2,027) | | $ | 527,526 | |
Dividends from affiliated money market funds | | | 2,201 | |
Total investment income | | | 529,727 | |
| |
Expenses: | | | | |
Advisory fees | | | 337,097 | |
Administrative services fees | | | 50,000 | |
Custodian fees | | | 6,948 | |
Distribution fees: | | | | |
Class A | | | 34,681 | |
Class C | | | 26,875 | |
Class R | | | 171 | |
Transfer agent fees — A, C, R and Y | | | 34,690 | |
Transfer agent fees — R5 | | | 41 | |
Transfer agent fees — R6 | | | 41 | |
Trustees’ and officers’ fees and benefits | | | 19,165 | |
Registration and filing fees | | | 80,219 | |
Professional services fees | | | 117,773 | |
Other | | | 28,645 | |
Total expenses | | | 736,346 | |
Less: Fees waived and expenses reimbursed | | | (242,655 | ) |
Net expenses | | | 493,691 | |
Net investment income | | | 36,036 | |
| |
Realized and unrealized gain (loss) from: | | | | |
Net realized gain from: | | | | |
Investment securities | | | 336,262 | |
Swap agreements | | �� | 467,520 | |
| | | | 803,782 | |
Change in net unrealized appreciation (depreciation) of: | | | | |
Investment securities | | | (593,664 | ) |
Swap agreements | | | 637,560 | |
| | | | 43,896 | |
Net realized and unrealized gain | | | 847,678 | |
Net increase in net assets resulting from operations | | $ | 883,714 | |
See accompanying Notes to Financial Statements which are an integral part of the financial statements.
16 Invesco Long/Short Equity Fund
Statement of Changes in Net Assets
For the year ended October 31, 2015 and the period December 19, 2013 (commencement date) through October 31, 2014
| | | | | | | | |
| | | October 31,
2015 | | | December 19, 2013
(commencement date) through
October 31,
2014 | |
Operations: | | | | | |
Net investment income (loss) | | $ | 36,036 | | | $ | (36,302 | ) |
Net realized gain (loss) | | | 803,782 | | | | (444,221 | ) |
Change in net unrealized appreciation | | | 43,896 | | | | 323,834 | |
Net increase (decrease) in net assets resulting from operations | | | 883,714 | | | | (156,689 | ) |
| | |
Distributions to shareholders from net realized gains: | | | | | | | | |
Class A | | | (4,528 | ) | | | — | |
Class C | | | (854 | ) | | | — | |
Class R | | | (7 | ) | | | — | |
Class Y | | | (2,596 | ) | | | — | |
Class R5 | | | (189 | ) | | | — | |
Class R6 | | | (150 | ) | | | — | |
Total distributions from net realized gains | | | (8,324 | ) | | | — | |
| | |
Share transactions–net: | | | | | | | | |
Class A | | | (4,378,517 | ) | | | 17,061,810 | |
Class C | | | (330,484 | ) | | | 2,778,453 | |
Class R | | | 11,715 | | | | 25,838 | |
Class Y | | | (4,992,049 | ) | | | 12,233,158 | |
Class R5 | | | (173,215 | ) | | | 656,660 | |
Class R6 | | | 18,107 | | | | 510,470 | |
Net increase (decrease) in net assets resulting from share transactions | | | (9,844,443 | ) | | | 33,266,389 | |
Net increase (decrease) in net assets | | | (8,969,053 | ) | | | 33,109,700 | |
| | |
Net assets: | | | | | | | | |
Beginning of year | | | 33,109,700 | | | | — | |
End of year (includes undistributed net investment income of $873,445 and $369,889, respectively) | | $ | 24,140,647 | | | $ | 33,109,700 | |
See accompanying Notes to Financial Statements which are an integral part of the financial statements.
17 Invesco Long/Short Equity Fund
Statement of Cash Flows
For the year ended October 31, 2015
| | | | |
Cash provided by operating activities: | | | | |
Net increase in net assets resulting from operations | | $ | 883,714 | |
|
Adjustments to reconcile the change in net assets applicable from operations to net cash provided by operating activities: | |
Purchases of investments | | | (21,142,110 | ) |
Net change in unrealized appreciation on swap agreements | | | (637,560 | ) |
Increase in swap agreement payable, net | | | (54,124 | ) |
Proceeds from sales of investments | | | 33,902,692 | |
Decrease in receivables and other assets | | | 12,550 | |
Increase in accrued expenses and other payables | | | 15,315 | |
Net realized gain from investment securities | | | (336,262 | ) |
Net change in unrealized depreciation on investment securities | | | 593,664 | |
Net cash provided by operating activities | | | 13,237,879 | |
| |
Cash provided (used in) by financing activities: | | | | |
Distributions paid to shareholders | | | (3,989 | ) |
Proceeds from shares of beneficial interest sold | | | 12,342,011 | |
Disbursements from shares of beneficial interest reacquired | | | (22,610,738 | ) |
Net cash provided by (used in) financing activities | | | (10,272,716 | ) |
Net increase in cash and cash equivalents | | | 2,965,163 | |
Cash and cash equivalents at beginning of period | | | 891,829 | |
Cash and cash equivalents at end of period | | $ | 3,856,992 | |
| |
Non-cash financing activities: | | | | |
Value of shares of beneficial interest issued in reinvestment of dividends paid to shareholders | | $ | 4,335 | |
Notes to Financial Statements
October 31, 2015
NOTE 1—Significant Accounting Policies
Invesco Long/Short Equity Fund (the “Fund”) is a series portfolio of AIM Investment Funds (Invesco Investment Funds) (the “Trust”). The Trust is organized as a Delaware statutory trust and is registered under the Investment Company Act of 1940, as amended (the “1940 Act”), as an open-end series management investment company consisting of twenty-four separate series portfolios, each authorized to issue an unlimited number of shares of beneficial interest. The assets, liabilities and operations of each portfolio are accounted for separately. Information presented in these financial statements pertains only to the Fund. Matters affecting each portfolio or class will be voted on exclusively by the shareholders of such portfolio or class.
The Fund’s investment objective is to seek long-term capital appreciation.
The Fund currently consists of six different classes of shares: Class A, Class C, Class R, Class Y, Class R5 and Class R6. Class A shares are sold with a front-end sales charge unless certain waiver criteria are met and under certain circumstances load waived shares may be subject to contingent deferred sales charges (“CDSC”). Class C shares are sold with a CDSC. Class R, Class Y, Class R5 and Class R6 shares are sold at net asset value.
The following is a summary of the significant accounting policies followed by the Fund in the preparation of its financial statements.
| A. | Security Valuations — Securities, including restricted securities, are valued according to the following policy. |
A security listed or traded on an exchange (except convertible securities) is valued at its last sales price or official closing price as of the close of the customary trading session on the exchange where the security is principally traded, or lacking any sales or official closing price on a particular day, the security may be valued at the closing bid price on that day. Securities traded in the over-the-counter market are valued based on prices furnished by independent pricing services or market makers. When such securities are valued by an independent pricing service they may be considered fair valued. Futures contracts are valued at the final settlement price set by an exchange on which they are principally traded. Listed options are valued at the mean between the last bid and asked prices from the exchange on which they are principally traded. Options not listed on an exchange are valued by an independent source at the mean between the last bid and asked prices. For purposes of determining net asset value (“NAV”) per share, futures and option contracts generally are valued 15 minutes after the close of the customary trading session of the New York Stock Exchange (“NYSE”).
Investments in open-end and closed-end registered investment companies that do not trade on an exchange are valued at the end-of-day net asset value per share. Investments in open-end and closed-end registered investment companies that trade on an exchange are valued at the last sales price or official closing price as of the close of the customary trading session on the exchange where the security is principally traded.
Swap agreements are fair valued using an evaluated quote, if available, provided by an independent pricing service. Evaluated quotes provided by the pricing service are valued based on a model which may include end-of-day net present values, spreads, ratings, industry, company performance and returns of referenced assets.
18 Invesco Long/Short Equity Fund
Debt obligations (including convertible securities) and unlisted equities are fair valued using an evaluated quote provided by an independent pricing service. Evaluated quotes provided by the pricing service may be determined without exclusive reliance on quoted prices, and may reflect appropriate factors such as institution-size trading in similar groups of securities, developments related to specific securities, dividend rate (for unlisted equities), yield (for debt obligations), quality, type of issue, coupon rate (for debt obligations), maturity (for debt obligations), individual trading characteristics and other market data. Debt obligations are subject to interest rate and credit risks. In addition, all debt obligations involve some risk of default with respect to interest and/or principal payments.
Foreign securities’ (including foreign exchange contracts) prices are converted into U.S. dollar amounts using the applicable exchange rates as of the close of the NYSE. If market quotations are available and reliable for foreign exchange-traded equity securities, the securities will be valued at the market quotations. Because trading hours for certain foreign securities end before the close of the NYSE, closing market quotations may become unreliable. If between the time trading ends on a particular security and the close of the customary trading session on the NYSE, events occur that the Adviser determines are significant and make the closing price unreliable, the Fund may fair value the security. If the event is likely to have affected the closing price of the security, the security will be valued at fair value in good faith using procedures approved by the Board of Trustees. Adjustments to closing prices to reflect fair value may also be based on a screening process of an independent pricing service to indicate the degree of certainty, based on historical data, that the closing price in the principal market where a foreign security trades is not the current value as of the close of the NYSE. Foreign securities’ prices meeting the approved degree of certainty that the price is not reflective of current value will be priced at the indication of fair value from the independent pricing service. Multiple factors may be considered by the independent pricing service in determining adjustments to reflect fair value and may include information relating to sector indices, American Depositary Receipts and domestic and foreign index futures. Foreign securities may have additional risks including exchange rate changes, potential for sharply devalued currencies and high inflation, political and economic upheaval, the relative lack of issuer information, relatively low market liquidity and the potential lack of strict financial and accounting controls and standards.
Securities for which market prices are not provided by any of the above methods may be valued based upon quotes furnished by independent sources. The last bid price may be used to value equity securities. The mean between the last bid and asked prices is used to value debt obligations, including corporate loans.
Securities for which market quotations are not readily available or became unreliable are valued at fair value as determined in good faith by or under the supervision of the Trust’s officers following procedures approved by the Board of Trustees. Issuer specific events, market trends, bid/asked quotes of brokers and information providers and other market data may be reviewed in the course of making a good faith determination of a security’s fair value.
The Fund may invest in securities that are subject to interest rate risk, meaning the risk that the prices will generally fall as interest rates rise and, conversely, the prices will generally rise as interest rates fall. Specific securities differ in their sensitivity to changes in interest rates depending on their individual characteristics. Changes in interest rates may result in increased market volatility, which may affect the value and/or liquidity of certain Fund investments.
Valuations change in response to many factors including the historical and prospective earnings of the issuer, the value of the issuer’s assets, general economic conditions, interest rates, investor perceptions and market liquidity. Because of the inherent uncertainties of valuation, the values reflected in the financial statements may materially differ from the value received upon actual sale of those investments.
| B. | Securities Transactions and Investment Income — Securities transactions are accounted for on a trade date basis. Realized gains or losses on sales are computed on the basis of specific identification of the securities sold. Interest income (net of withholding tax, if any) is recorded on the accrual basis from settlement date. Dividend income (net of withholding tax, if any) is recorded on the ex-dividend date. |
The Fund may periodically participate in litigation related to Fund investments. As such, the Fund may receive proceeds from litigation settlements. Any proceeds received are included in the Statement of Operations as realized gain (loss) for investments no longer held and as unrealized gain (loss) for investments still held.
Brokerage commissions and mark ups are considered transaction costs and are recorded as an increase to the cost basis of securities purchased and/or a reduction of proceeds on a sale of securities. Such transaction costs are included in the determination of net realized and unrealized gain (loss) from investment securities reported in the Statement of Operations and the Statement of Changes in Net Assets and the net realized and unrealized gains (losses) on securities per share in the Financial Highlights. Transaction costs are included in the calculation of the Fund’s net asset value and, accordingly, they reduce the Fund’s total returns. These transaction costs are not considered operating expenses and are not reflected in net investment income reported in the Statement of Operations and the Statement of Changes in Net Assets, or the net investment income per share and the ratios of expenses and net investment income reported in the Financial Highlights, nor are they limited by any expense limitation arrangements between the Fund and the investment adviser.
The Fund allocates income and realized and unrealized capital gains and losses to a class based on the relative net assets of each class.
| C. | Country Determination — For the purposes of making investment selection decisions and presentation in the Schedule of Investments, the investment adviser may determine the country in which an issuer is located and/or credit risk exposure based on various factors. These factors include the laws of the country under which the issuer is organized, where the issuer maintains a principal office, the country in which the issuer derives 50% or more of its total revenues and the country that has the primary market for the issuer’s securities, as well as other criteria. Among the other criteria that may be evaluated for making this determination are the country in which the issuer maintains 50% or more of its assets, the type of security, financial guarantees and enhancements, the nature of the collateral and the sponsor organization. Country of issuer and/or credit risk exposure has been determined to be the United States of America, unless otherwise noted. |
| D. | Distributions — Distributions from net investment income and net realized capital gain, if any, are generally declared and paid annually and recorded on the ex-dividend date. The Fund may elect to treat a portion of the proceeds from redemptions as distributions for federal income tax purposes. |
| E. | Federal Income Taxes — The Fund intends to comply with the requirements of Subchapter M of the Internal Revenue Code of 1986, as amended (the “Internal Revenue Code”), necessary to qualify as a regulated investment company and to distribute substantially all of the Fund’s taxable earnings to shareholders. As such, the Fund will not be subject to federal income taxes on otherwise taxable income (including net realized capital gain) that is distributed to shareholders. Therefore, no provision for federal income taxes is recorded in the financial statements. |
19 Invesco Long/Short Equity Fund
The Fund recognizes the tax benefits of uncertain tax positions only when the position is more likely than not to be sustained. Management has analyzed the Fund’s uncertain tax positions and concluded that no liability for unrecognized tax benefits should be recorded related to uncertain tax positions. Management is not aware of any tax positions for which it is reasonably possible that the total amounts of unrecognized tax benefits will change materially in the next 12 months.
The Fund files tax returns in the U.S. Federal jurisdiction and certain other jurisdictions. Generally, the Fund is subject to examinations by such taxing authorities for up to three years after the filing of the return for the tax period.
| F. | Expenses — Fees provided for under the Rule 12b-1 plan of a particular class of the Fund are charged to the operations of such class. Transfer agency fees and expenses and other shareholder recordkeeping fees and expenses attributable to Class R5 and Class R6 are allocated to each share class based on relative net assets. Sub-accounting fees attributable to Class R5 are charged to the operations of the class. Transfer agency fees and expenses and other shareholder recordkeeping fees and expenses relating to all other classes are allocated among those classes based on relative net assets. All other expenses are allocated among the classes based on relative net assets. |
| G. | Accounting Estimates — The preparation of financial statements in conformity with accounting principles generally accepted in the United States of America (“GAAP”) requires management to make estimates and assumptions that affect the reported amounts of assets and liabilities at the date of the financial statements and the reported amounts of revenues and expenses during the reporting period including estimates and assumptions related to taxation. Actual results could differ from those estimates by a significant amount. In addition, the Fund monitors for material events or transactions that may occur or become known after the period-end date and before the date the financial statements are released to print. |
| H. | Indemnifications — Under the Trust’s organizational documents, each Trustee, officer, employee or other agent of the Trust is indemnified against certain liabilities that may arise out of the performance of their duties to the Fund. Additionally, in the normal course of business, the Fund enters into contracts, including the Fund’s servicing agreements, that contain a variety of indemnification clauses. The Fund’s maximum exposure under these arrangements is unknown as this would involve future claims that may be made against the Fund that have not yet occurred. The risk of material loss as a result of such indemnification claims is considered remote. |
| I. | Cash and Cash Equivalents — For the purposes of the Statement of Cash Flows, the Fund defines Cash and Cash Equivalents as cash (including foreign currency), money market funds and other investments held in lieu of cash and excludes investments made with cash collateral received. |
| J. | Swap Agreements — The Fund may enter into various swap transactions, including interest rate, total return, volatility, variance, index, currency and credit default swap contracts (“CDS”) for investment purposes or to manage interest rate, equity, currency or credit risk. Such transactions are agreements between two parties (“Counterparties”). These agreements may contain among other conditions, events of default and termination events, and various covenants and representations such as provisions that require the Fund to maintain a pre-determined level of net assets, and/or provide limits regarding the decline of the Fund’s NAV over specific periods of time. If the Fund were to trigger such provisions and have open derivative positions at that time, the Counterparty may be able to terminate such agreement and request immediate payment in an amount equal to the net liability positions, if any. |
Interest rate, total return, volatility, variance, index, and currency swap agreements are two-party contracts entered into primarily to exchange the returns (or differentials in rates of returns) earned or realized on particular predetermined investments or instruments. The gross returns to be exchanged or “swapped” between the parties are calculated with respect to a notional amount, i.e., the return on or increase in value of a particular dollar amount invested at a particular interest rate or return of an underlying asset, in a particular foreign currency, or in a “basket” of securities representing a particular index.
A total return swap is an agreement in which one party makes payments based on a set rate, either fixed or variable, while the other party makes payments based on the return of an underlying asset, which includes both the income generated and capital gains, if any. The unrealized appreciation (depreciation) on total return swaps includes dividends on the underlying equity securities and financing rate payable from the Counterparty. At the maturity date, a net cash flow is exchanged where the total return is equivalent to the return of the underlying reference less a financing rate, if any. As a receiver, the Fund would receive payments based on any positive total return and would owe payments in the event of a negative total return. As the payer, the Fund would owe payments on any net positive total return, and would receive payment in the event of a negative total return.
Changes in the value of swap agreements are recognized as unrealized gains (losses) in the Statement of Operations by “marking to market” on a daily basis to reflect the value of the swap agreement at the end of each trading day. Payments received or paid at the beginning of the agreement are reflected as such on the Statement of Assets and Liabilities and may be referred to as upfront payments. The Fund accrues for the fixed payment stream and amortizes upfront payments, if any, on swap agreements on a daily basis with the net amount, recorded as a component of realized gain (loss) on the Statement of Operations. A liquidation payment received or made at the termination of a swap agreement is recorded as realized gain (loss) on the Statement of Operations. The Fund segregates liquid securities having a value at least equal to the amount of the potential obligation of a Fund under any swap transaction. Entering into these agreements involves, to varying degrees, lack of liquidity and elements of credit, market, and Counterparty risk in excess of amounts recognized on the Statement of Assets and Liabilities. Such risks involve the possibility that a swap is difficult to sell or liquidate; the Counterparty does not honor its obligations under the agreement and unfavorable interest rates and market fluctuations. It is possible that developments in the swaps market, including potential government regulation, could adversely affect the Fund’s ability to terminate existing swap agreements or to realize amounts to be received under such agreements. A short position in a security poses more risk than holding the same security long. As there is no limit on how much the price of the security can increase, the Fund’s exposure is unlimited.
| K. | Leverage Risk — Leverage exists when the Fund can lose more than it originally invests because it purchases or sells an instrument or enters into a transaction without investing an amount equal to the full economic exposure of the instrument or transaction. |
| L. | Collateral — To the extent the Fund has designated or segregated a security as collateral and that security is subsequently sold, it is the Fund’s practice to replace such collateral no later than the next business day. |
20 Invesco Long/Short Equity Fund
NOTE 2—Advisory Fees and Other Fees Paid to Affiliates
The Trust has entered into a master investment advisory agreement with Invesco Advisers, Inc. (the “Adviser” or “Invesco”). Under the terms of the investment advisory agreement, the Fund pays an advisory fee to the Adviser based on the annual rate of the Fund’s average daily net assets as follows:
| | | | |
| Average Daily Net Assets | | Rate | |
First $10 billion | | | 1.25% | |
Over $10 billion | | | 1.15% | |
For the year ended October 31, 2015, the effective advisory fees incurred by the Fund was 1.25%.
Under the terms of a master sub-advisory agreement between the Adviser and each of Invesco Asset Management Deutschland GmbH, Invesco Asset Management Limited, Invesco Asset Management (Japan) Limited, Invesco Hong Kong Limited, Invesco Senior Secured Management, Inc., Invesco Canada Ltd. and Invesco PowerShares Capital Management LLC (collectively, the “Affiliated Sub-Advisers”) the Adviser, not the Fund, may pay 40% of the fees paid to the Adviser to any such Affiliated Sub-Adviser(s) that provide(s) discretionary investment management services to the Fund based on the percentage of assets allocated to such Affiliated Sub-Adviser(s).
The Adviser has contractually agreed, through at least February 28, 2017, to waive advisory fees and/or reimburse expenses to the extent necessary to limit total annual fund operating expenses after fee waiver and/or expense reimbursement (excluding certain items discussed below) of Class A, Class C, Class R, Class Y, Class R5 and Class R6 shares to 1.87%, 2.62%, 2.12%, 1.62%, 1.62% and 1.62% of average daily net assets, respectively. In determining the Adviser’s obligation to waive advisory fees and/or reimburse expenses, the following expenses are not taken into account, and could cause total annual fund operating expenses after fee waiver and/or expense reimbursement to exceed the numbers reflected above: (1) interest; (2) taxes; (3) dividend expense on short sales; (4) extraordinary or non-routine items, including litigation expenses; and (5) expenses that the Fund has incurred but did not actually pay because of an expense offset arrangement. Unless Invesco continues the fee waiver agreement, it will terminate on February 28, 2017. The fee waiver agreement cannot be terminated during its term.
Further, the Adviser has contractually agreed, through at least June 30, 2017, to waive the advisory fee payable by the Fund in an amount equal to 100% of the net advisory fees the Adviser receives from the affiliated money market funds on investments by the Fund of uninvested cash in such affiliated money market funds.
For the year ended October 31, 2015, the Adviser waived advisory fees of $207,883 and reimbursed class level expenses of $18,636, $3,610, $46, $12,398, $41 and $41 of Class A, Class C, Class R, Class Y, Class R5 and Class R6 shares, respectively.
The Trust has entered into a master administrative services agreement with Invesco pursuant to which the Fund has agreed to pay Invesco for certain administrative costs incurred in providing accounting services to the Fund. For the year ended October 31, 2015, expenses incurred under the agreement are shown in the Statement of Operations as Administrative services fees.
The Trust has entered into a transfer agency and service agreement with Invesco Investment Services, Inc. (“IIS”) pursuant to which the Fund has agreed to pay IIS a fee for providing transfer agency and shareholder services to the Fund and reimburse IIS for certain expenses incurred by IIS in the course of providing such services. IIS may make payments to intermediaries that provide omnibus account services, sub-accounting services and/or networking services. All fees payable by IIS to intermediaries that provide omnibus account services or sub-accounting are charged back to the Fund, subject to certain limitations approved by the Trust’s Board of Trustees. For the year ended October 31, 2015, expenses incurred under the agreement are shown in the Statement of Operations as Transfer agent fees.
The Trust has entered into master distribution agreements with Invesco Distributors, Inc. (“IDI”) to serve as the distributor for the Class A, Class C, Class R, Class Y, Class R5 and Class R6 shares of the Fund. The Trust has adopted plans pursuant to Rule 12b-1 under the 1940 Act with respect to the Fund’s Class A, Class C and Class R shares (collectively the “Plans”). The Fund, pursuant to the Plans, pays IDI compensation at the annual rate of 0.25% of the Fund’s average daily net assets of Class A shares, 1.00% of the average daily net assets of Class C shares and 0.50% of the average daily net assets of Class R shares. Of the Plan payments, up to 0.25% of the average daily net assets of each class of shares may be paid to furnish continuing personal shareholder services to customers who purchase and own shares of such classes. Any amounts not paid as a service fee under the Plans would constitute an asset-based sales charge. Rules of the Financial Industry Regulatory Authority (“FINRA”) impose a cap on the total sales charges, including asset-based sales charges, that may be paid by any class of shares of the Fund. For the year ended October 31, 2015, expenses incurred under the Plans are shown in the Statement of Operations as Distribution fees.
Front-end sales commissions and CDSC (collectively, the “sales charges”) are not recorded as expenses of the Fund. Front-end sales commissions are deducted from proceeds from the sales of Fund shares prior to investment in Class A shares of the Fund. CDSC are deducted from redemption proceeds prior to remittance to the shareholder. During the year ended October 31, 2015, IDI advised the Fund that IDI retained $11,404 in front-end sales commissions from the sale of Class A shares and $994 from Class C shares for CDSC imposed upon redemptions by shareholders.
Certain officers and trustees of the Trust are officers and directors of the Adviser, IIS and/or IDI.
NOTE 3—Additional Valuation Information
GAAP defines fair value as the price that would be received to sell an asset or paid to transfer a liability in an orderly transaction between market participants at the measurement date, under current market conditions. GAAP establishes a hierarchy that prioritizes the inputs to valuation methods, giving the highest priority to readily available unadjusted quoted prices in an active market for identical assets (Level 1) and the lowest priority to significant unobservable inputs (Level 3), generally when market prices are not readily available or are unreliable. Based on the valuation inputs, the securities or other investments are tiered into one of three levels. Changes in valuation methods may result in transfers in or out of an investment’s assigned level:
| | Level 1 — | Prices are determined using quoted prices in an active market for identical assets. |
| | Level 2 — | Prices are determined using other significant observable inputs. Observable inputs are inputs that other market participants may use in pricing a security. These may include quoted prices for similar securities, interest rates, prepayment speeds, credit risk, yield curves, loss severities, default rates, discount rates, volatilities and others. |
21 Invesco Long/Short Equity Fund
| | Level 3 — | Prices are determined using significant unobservable inputs. In situations where quoted prices or observable inputs are unavailable (for example, when there is little or no market activity for an investment at the end of the period), unobservable inputs may be used. Unobservable inputs reflect the Fund’s own assumptions about the factors market participants would use in determining fair value of the securities or instruments and would be based on the best available information. |
The following is a summary of the tiered valuation input levels, as of October 31, 2015. The level assigned to the securities valuations may not be an indication of the risk or liquidity associated with investing in those securities. Because of the inherent uncertainties of valuation, the values reflected in the financial statements may materially differ from the value received upon actual sale of those investments.
| | | | | | | | | | | | | | | | |
| | | Level 1 | | | Level 2 | | | Level 3 | | | Total | |
Equity Securities | | $ | 22,977,975 | | | $ | — | | | $ | — | | | $ | 22,977,975 | |
Swap Agreements* | | | — | | | | 266,122 | | | | — | | | | 266,122 | |
Total Investments | | $ | 22,977,975 | | | $ | 266,122 | | | $ | — | | | $ | 23,244,097 | |
| * | Unrealized appreciation. |
NOTE 4—Derivative Investments
Value of Derivative Investments at Period-End
The table below summarizes the value of the Fund’s derivative investments, detailed by primary risk exposure, held as of October 31, 2015:
| | | | | | | | |
| | | Value | |
| Risk Exposure/Derivative Type | | Assets | | | Liabilities | |
Equity risk: | | | | | | | | |
Swap agreements(a) | | $ | 266,122 | | | $ | — | |
| (a) | Values are disclosed on the Statement of Assets and Liabilities under the caption Unrealized appreciation on swap agreements — OTC. |
Effect of Derivative Investments for the year ended October 31, 2015
The table below summarizes the gains on derivative investments, detailed by primary risk exposure, recognized in earnings during the period:
| | | | |
| | | Location of Gain on
Statement of Operations | |
| | Swap
Agreements | |
Realized Gain: | | | | |
Equity risk | | $ | 467,520 | |
Change in Unrealized Appreciation: | | | | |
Equity risk | | | 637,560 | |
Total | | $ | 1,105,080 | |
The table below summarizes the average notional value of swap agreements outstanding during the period.
| | | | |
| | | Swap
Agreements | |
Average notional value | | $ | 53,213,898 | |
Offsetting Assets and Liabilities
Accounting Standards Update (“ASU”) No. 2011-11, Disclosures about Offsetting Assets and Liabilities, which was subsequently clarified in Financial Accounting Standards Board ASU 2013-01 “Clarifying the Scope of Disclosures about Offsetting Assets and Liabilities” is intended to enhance disclosures about financial instruments and derivative instruments that are subject to offsetting arrangements on the Statement of Assets and Liabilities and to enable investors to better understand the effect of those arrangements on the Fund’s financial position. In order for an arrangement to be eligible for netting, the Fund must have a basis to conclude that such netting arrangements are legally enforceable. The Fund enters into netting agreements and collateral agreements in an attempt to reduce the Fund’s Counterparty credit risk by providing for a single net settlement with a Counterparty of all financial transactions covered by the agreement in an event of default as defined under such agreement.
22 Invesco Long/Short Equity Fund
The following tables present derivative instruments that are either subject to an enforceable netting agreement or offset by collateral arrangements as of October 31, 2015.
| | | | | | | | | | | | | | | | | | | | |
| | | | | | Gross Amounts Not Offset in the
Statement of Assets and Liabilities | | | | |
| Counterparty | | Gross amounts
of Recognized
Assets | | | Financial
Instruments | | | Collateral Received | | | Net
Amount | |
| | | | Non-Cash | | | Cash | | |
Morgan Stanley & Co. LLC | | $ | 266,122 | | | $ | (34,608 | ) | | $ | — | | | $ | — | | | $ | 231,514 | |
| | | |
| | | | | | Gross Amounts Not Offset in the
Statement of Assets and Liabilities | | | | |
| Counterparty | | Gross amounts
of Recognized
Liabilities | | | Financial
Instruments | | | Collateral Pledged | | | Net
Amount | |
| | | | Non-Cash | | | Cash | | |
Morgan Stanley & Co. LLC | | $ | 34,608 | | | $ | (34,608 | ) | | $ | — | | | $ | — | | | $ | — | |
NOTE 5—Trustees’ and Officers’ Fees and Benefits
Trustees’ and Officers’ Fees and Benefits include amounts accrued by the Fund to pay remuneration to certain Trustees and Officers of the Fund. Trustees have the option to defer compensation payable by the Fund, and Trustees’ and Officers’ Fees and Benefits also include amounts accrued by the Fund to fund such deferred compensation amounts. Those Trustees who defer compensation have the option to select various Invesco Funds in which their deferral accounts shall be deemed to be invested. Obligations under the deferred compensation plan represent unsecured claims against the general assets of the Fund.
NOTE 6—Cash Balances
The Fund is permitted to temporarily carry a negative or overdrawn balance in its account with State Street Bank and Trust Company, the custodian bank. Such balances, if any at period end, are shown in the Statement of Assets and Liabilities under the payable caption Amount due custodian. To compensate the custodian bank for such overdrafts, the overdrawn Fund may either (1) leave funds as a compensating balance in the account so the custodian bank can be compensated by earning the additional interest; or (2) compensate by paying the custodian bank at a rate agreed upon by the custodian bank and Invesco, not to exceed the contractually agreed upon rate.
NOTE 7—Distributions to Shareholders and Tax Components of Net Assets
Tax Character of Distributions to Shareholders Paid During the Fiscal Year Ended October 31, 2015 and the period December 19, 2013 (commencement date) through October 31, 2014:
| | | | | | | | |
| | | 2015 | | | 2014 | |
Long-term capital gain | | $ | 8,324 | | | $ | — | |
Tax Components of Net Assets at Period-End:
| | | | |
| | | 2015 | |
Undistributed ordinary income | | $ | 1,143,597 | |
Undistributed long-term gain | | | 111,371 | |
Net unrealized appreciation (depreciation) — investments | | | (176,128 | ) |
Temporary book/tax differences | | | (4,030 | ) |
Shares of beneficial interest | | | 23,065,837 | |
Total net assets | | $ | 24,140,647 | |
The difference between book-basis and tax-basis unrealized appreciation (depreciation) is due to differences in the timing of recognition of gains and losses on investments for tax and book purposes. The Fund’s net unrealized appreciation difference is attributable primarily to wash sales.
The temporary book/tax differences are a result of timing differences between book and tax recognition of income and/or expenses. The Fund’s temporary book/tax differences are the result of the trustee deferral of compensation and retirement plan benefits.
Capital loss carryforward is calculated and reported as of a specific date. Results of transactions and other activity after that date may affect the amount of capital loss carryforward actually available for the Fund to utilize. Capital losses generated in years beginning after December 22, 2010 can be carried forward for an unlimited period, whereas previous losses expire in eight tax years. Capital losses with an expiration period may not be used to offset capital gains until all net capital losses without an expiration date have been utilized. Capital loss carryforwards with no expiration date will retain their character as either short-term or long-term capital losses instead of as short-term capital losses as under prior law. The ability to utilize capital loss carryforwards in the future may be limited under the Internal Revenue Code and related regulations based on the results of future transactions.
The Fund does not have a capital loss carryforward as of October 31, 2015.
23 Invesco Long/Short Equity Fund
NOTE 8—Investment Securities
The aggregate amount of investment securities (other than short-term securities, U.S. Treasury obligations and money market funds, if any) purchased and sold by the Fund during the year ended October 31, 2015 was $21,142,110 and $29,852,696, respectively. In a fund’s initial year of operations, the cost of investments for tax purposes will not reflect any tax adjustments until its fiscal year end reporting period.
| | | | |
| Unrealized Appreciation (Depreciation) of Investment Securities on a Tax Basis | |
Aggregate unrealized appreciation of investment securities | | $ | 1,703,735 | |
Aggregate unrealized (depreciation) of investment securities | | | (1,879,863 | ) |
Net unrealized appreciation (depreciation) of investment securities | | $ | (176,128 | ) |
Cost of investments for tax purposes is $23,154,103.
NOTE 9—Reclassification of Permanent Differences
Primarily as a result of differing book/tax treatment of swap agreements, on October 31, 2015, undistributed net investment income was increased by $467,520 and undistributed net realized gain was decreased by $467,520. This reclassification had no effect on the net assets of the Fund.
NOTE 10—Share Information
| | | | | | | | | | | | | | | | |
| | | Summary of Share Activity | |
| | | Year ended
October 31, 2015(a) | | | December 19, 2013
(commencement date) through
October 31, 2014 | |
| | | Shares | | | Amount | | | Shares | | | Amount | |
Sold: | | | | | | | | | | | | | | | | |
Class A | | | 556,814 | | | $ | 6,231,353 | | | | 2,709,563 | | | $ | 30,100,662 | |
Class C | | | 185,522 | | | | 2,040,295 | | | | 358,125 | | | | 4,081,564 | |
Class R | | | 1,785 | | | | 19,704 | | | | 2,468 | | | | 25,838 | |
Class Y | | | 353,711 | | | | 3,918,479 | | | | 1,361,368 | | | | 14,864,488 | |
Class R5 | | | — | | | | — | | | | 69,434 | | | | 702,762 | |
Class R6 | | | 2,429 | | | | 26,925 | | | | 51,004 | | | | 510,470 | |
| | | | |
Issued as reinvestment of dividends: | | | | | | | | | | | | | | | | |
Class A | | | 238 | | | | 2,611 | | | | — | | | | — | |
Class C | | | 77 | | | | 839 | | | | — | | | | — | |
Class Y | | | 76 | | | | 841 | | | | — | | | | — | |
Class R5 | | | 4 | | | | 44 | | | | — | | | | — | |
| | | | |
Reacquired: | | | | | | | | | | | | | | | | |
Class A | | | (966,899 | ) | | | (10,612,481 | ) | | | (1,182,407 | ) | | | (13,038,852 | ) |
Class C | | | (218,028 | ) | | | (2,371,618 | ) | | | (118,505 | ) | | | (1,303,111 | ) |
Class R | | | (725 | ) | | | (7,989 | ) | | | — | | | | — | |
Class Y | | | (810,753 | ) | | | (8,911,369 | ) | | | (237,599 | ) | | | (2,631,330 | ) |
Class R5 | | | (15,106 | ) | | | (173,259 | ) | | | (4,331 | ) | | | (46,102 | ) |
Class R6 | | | (777 | ) | | | (8,818 | ) | | | — | | | | — | |
Net increase (decrease) in share activity | | | (911,632 | ) | | $ | (9,844,443 | ) | | | 3,009,120 | | | $ | 33,266,389 | |
| (a) | There are entities that are record owners of more than 5% of the outstanding shares of the Fund and in the aggregate own 35% of the outstanding shares of the Fund. IDI has an agreement with these entities to sell Fund shares. The Fund, Invesco and/or Invesco affiliates may make payments to these entities, which are considered to be related to the Fund, for providing services to the Fund, Invesco and/or Invesco affiliates including but not limited to services such as securities brokerage, distribution, third party record keeping and account servicing. The Fund has no knowledge as to whether all or any portion of the shares owned of record by these entities are also owned beneficially. |
| | In addition, 48% of the outstanding shares of the Fund are owned by the Adviser. |
24 Invesco Long/Short Equity Fund
NOTE 11—Financial Highlights
The following schedule presents financial highlights for a share of the Fund outstanding throughout the periods indicated.
| | | | | | | | | | | | | | | | | | | | | | | | | | | | | | | | | | | | | | | | | | | | | | | | |
| | | Net asset
value,
beginning
of period | | | Net
investment
income
(loss)(a) | | | Net gains
on securities
(both
realized and
unrealized) | | | Total from
investment
operations | | | Distributions
from net
realized
gains | | | Net asset
value, end
of period | | | Total
return(b) | | | Net assets,
end of period
(000’s omitted) | | | Ratio of
expenses
to average
net assets
with fee waivers
and/or expenses
absorbed | | | Ratio of
expenses
to average net
assets without
fee waivers
and/or expenses
absorbed | | | Ratio of net
investment
income (loss)
to average
net assets | | | Portfolio
turnover(c) | |
Class A | | | | | | | | | | | | | | | | | | | | | | | | | | | | | | | | | | | | | | | | | | | | | | | | |
Year ended 10/31/15 | | $ | 11.00 | | | $ | 0.01 | | | $ | 0.49 | | | $ | 0.50 | | | $ | (0.00 | ) | | $ | 11.50 | | | | 4.57 | % | | $ | 12,854 | | | | 1.85 | %(d) | | | 2.76 | %(d) | | | 0.11 | %(d) | | | 89 | % |
Year ended 10/31/14(e) | | | 10.00 | | | | (0.02 | ) | | | 1.02 | | | | 1.00 | | | | — | | | | 11.00 | | | | 10.00 | | | | 16,796 | | | | 1.85 | (f) | | | 3.04 | (f) | | | (0.25 | )(f) | | | 102 | |
Class C | | | | | | | | | | | | | | | | | | | | | | | | | | | | | | | | | | | | | | | | | | | | | | | | |
Year ended 10/31/15 | | | 10.92 | | | | (0.07 | ) | | | 0.49 | | | | 0.42 | | | | (0.00 | ) | | | 11.34 | | | | 3.87 | | | | 2,350 | | | | 2.60 | (d) | | | 3.51 | (d) | | | (0.64 | )(d) | | | 89 | |
Year ended 10/31/14(e) | | | 10.00 | | | | (0.10 | ) | | | 1.02 | | | | 0.92 | | | | — | | | | 10.92 | | | | 9.20 | | | | 2,618 | | | | 2.60 | (f) | | | 3.79 | (f) | | | (1.00 | )(f) | | | 102 | |
Class R | | | | | | | | | | | | | | | | | | | | | | | | | | | | | | | | | | | | | | | | | | | | | | | | |
Year ended 10/31/15 | | | 10.98 | | | | (0.02 | ) | | | 0.49 | | | | 0.47 | | | | (0.00 | ) | | | 11.45 | | | | 4.31 | | | | 40 | | | | 2.10 | (d) | | | 3.01 | (d) | | | (0.14 | )(d) | | | 89 | |
Year ended 10/31/14(e) | | | 10.00 | | | | (0.04 | ) | | | 1.02 | | | | 0.98 | | | | — | | | | 10.98 | | | | 9.80 | | | | 27 | | | | 2.10 | (f) | | | 3.29 | (f) | | | (0.50 | )(f) | | | 102 | |
Class Y | | | | | | | | | | | | | | | | | | | | | | | | | | | | | | | | | | | | | | | | | | | | | | | | |
Year ended 10/31/15 | | | 11.02 | | | | 0.04 | | | | 0.50 | | | | 0.54 | | | | (0.00 | ) | | | 11.56 | | | | 4.93 | | | | 7,709 | | | | 1.60 | (d) | | | 2.51 | (d) | | | 0.36 | (d) | | | 89 | |
Year ended 10/31/14(e) | | | 10.00 | | | | 0.00 | | | | 1.02 | | | | 1.02 | | | | — | | | | 11.02 | | | | 10.20 | | | | 12,389 | | | | 1.60 | (f) | | | 2.79 | (f) | | | 0.00 | (f) | | | 102 | |
Class R5 | | | | | | | | | | | | | | | | | | | | | | | | | | | | | | | | | | | | | | | | | | | | | | | | |
Year ended 10/31/15 | | | 11.02 | | | | 0.04 | | | | 0.50 | | | | 0.54 | | | | (0.00 | ) | | | 11.56 | | | | 4.93 | | | | 578 | | | | 1.60 | (d) | | | 2.38 | (d) | | | 0.36 | (d) | | | 89 | |
Year ended 10/31/14(e) | | | 10.00 | | | | 0.00 | | | | 1.02 | | | | 1.02 | | | | — | | | | 11.02 | | | | 10.20 | | | | 718 | | | | 1.60 | (f) | | | 2.69 | (f) | | | 0.00 | (f) | | | 102 | |
Class R6 | | | | | | | | | | | | | | | | | | | | | | | | | | | | | | | | | | | | | | | | | | | | | | | | |
Year ended 10/31/15 | | | 11.02 | | | | 0.04 | | | | 0.50 | | | | 0.54 | | | | (0.00 | ) | | | 11.56 | | | | 4.93 | | | | 609 | | | | 1.60 | (d) | | | 2.38 | (d) | | | 0.36 | (d) | | | 89 | |
Year ended 10/31/14(e) | | | 10.00 | | | | 0.00 | | | | 1.02 | | | | 1.02 | | | | — | | | | 11.02 | | | | 10.20 | | | | 562 | | | | 1.60 | (f) | | | 2.69 | (f) | | | 0.00 | (f) | | | 102 | |
| (a) | Calculated using average shares outstanding. |
| (b) | Includes adjustments in accordance with accounting principles generally accepted in the United States of America and as such, the net asset value for financial reporting purposes and the returns based upon those net asset values may differ from the net asset value and returns for shareholder transactions. Does not include sales charges and is not annualized for periods less than one year, if applicable. |
| (c) | Portfolio turnover is calculated at the fund level and is not annualized for periods less than one year, if applicable. |
| (d) | Ratios are based on average daily net assets (000’s omitted) of $13,872, $2,688, $34, $9,228, $574 and $571 for Class A, Class C, Class R, Class Y, Class R5 and Class R6 shares, respectively. |
| (e) | Commencement date of December 19, 2013. |
25 Invesco Long/Short Equity Fund
Report of Independent Registered Public Accounting Firm
To the Board of Trustees of AIM Investment Funds (Invesco Investment Funds)
and Shareholders of Invesco Long/Short Equity Fund:
In our opinion, the accompanying statement of assets and liabilities, including the schedule of investments, and the related statements of operations, of changes in net assets and of cash flows and the financial highlights present fairly, in all material respects, the financial position of Invesco Long/Short Equity Fund (one of the funds constituting AIM Investment Funds (Invesco Investment Funds), hereafter referred to as the “Fund”) at October 31, 2015, the results of its operations and its cash flows for the year then ended, the changes in its net assets and the financial highlights for the year then ended and for the period December 19, 2013 (commencement of operations) through October 31, 2014, in conformity with accounting principles generally accepted in the United States of America. These financial statements and financial highlights (hereafter referred to as “financial statements”) are the responsibility of the Fund’s management. Our responsibility is to express an opinion on these financial statements based on our audits. We conducted our audits of these financial statements in accordance with the standards of the Public Company Accounting Oversight Board (United States). Those standards require that we plan and perform the audit to obtain reasonable assurance about whether the financial statements are free of material misstatement. An audit includes examining, on a test basis, evidence supporting the amounts and disclosures in the financial statements, assessing the accounting principles used and significant estimates made by management, and evaluating the overall financial statement presentation. We believe that our audits, which included confirmation of securities at October 31, 2015 by correspondence with the custodian and brokers, provide a reasonable basis for our opinion.
PRICEWATERHOUSECOOPERS LLP
December 23, 2015
Houston, Texas
26 Invesco Long/Short Equity Fund
Calculating your ongoing Fund expenses
Example
As a shareholder of the Fund, you incur two types of costs: (1) transaction costs, which may include sales charges (loads) on purchase payments or contingent deferred sales charges on redemptions, if any; and (2) ongoing costs, including management fees, distribution and/or service (12b-1) fees, and other Fund expenses. This example is intended to help you understand your ongoing costs (in dollars) of investing in the Fund and to compare these costs with ongoing costs of investing in other mutual funds. The example is based on an investment of $1,000 invested at the beginning of the period and held for the entire period May 1, 2015 through October 31, 2015.
Actual expenses
The table below provides information about actual account values and actual expenses. You may use the information in this table, together with the amount you invested, to estimate the expenses that you paid over the period. Simply divide your account value by $1,000 (for example, an $8,600 account value divided by $1,000 = 8.6), then multiply the result by the number in the table under the heading entitled “Actual Expenses Paid During Period” to estimate the expenses you paid on your account during this period.
Hypothetical example for comparison purposes
The table below also provides information about hypothetical account values and hypothetical expenses based on the Fund’s actual expense ratio and an assumed rate of return of 5% per year before expenses, which is not the Fund’s actual return.
The hypothetical account values and expenses may not be used to estimate the actual ending account balance or expenses you paid for the period. You may use this information to compare the ongoing costs of investing in the Fund and other funds. To do so, compare this 5% hypothetical example with the 5% hypothetical examples that appear in the shareholder reports of the other funds.
Please note that the expenses shown in the table are meant to highlight your ongoing costs only and do not reflect any transaction costs, such as sales charges (loads) on purchase payments or contingent deferred sales charges on redemptions, if any. Therefore, the hypothetical information is useful in comparing ongoing costs only, and will not help you determine the relative total costs of owning different funds. In addition, if these transaction costs were included, your costs would have been higher.
| | | | | | | | | | | | | | | | | | | | | | | | |
| Class | | Beginning
Account Value
(05/01/15) | | | ACTUAL | | | HYPOTHETICAL (5% annual return before
expenses) | | | Annualized
Expense
Ratio | |
| | | Ending
Account Value
(10/31/15)1 | | | Expenses
Paid During
Period2 | | | Ending
Account Value
(10/31/15) | | | Expenses
Paid During
Period2 | | |
| A | | $ | 1,000.00 | | | $ | 1,090.00 | | | $ | 9.80 | | | $ | 1,015.83 | | | $ | 9.45 | | | | 1.86 | % |
| C | | | 1,000.00 | | | | 1,085.20 | | | | 13.72 | | | | 1,012.05 | | | | 13.24 | | | | 2.61 | |
| R | | | 1,000.00 | | | | 1,088.40 | | | | 11.11 | | | | 1,014.57 | | | | 10.71 | | | | 2.11 | |
| Y | | | 1,000.00 | | | | 1,090.60 | | | | 8.48 | | | | 1,017.09 | | | | 8.19 | | | | 1.61 | |
| R5 | | | 1,000.00 | | | | 1,090.60 | | | | 8.48 | | | | 1,017.09 | | | | 8.19 | | | | 1.61 | |
| R6 | | | 1,000.00 | | | | 1,090.60 | | | | 8.48 | | | | 1,017.09 | | | | 8.19 | | | | 1.61 | |
| 1 | The actual ending account value is based on the actual total return of the Fund for the period May 1, 2015 through October 31, 2015, after actual expenses and will differ from the hypothetical ending account value which is based on the Fund’s expense ratio and a hypothetical annual return of 5% before expenses. |
| 2 | Expenses are equal to the Fund’s annualized expense ratio as indicated above multiplied by the average account value over the period, multiplied by 184/365 to reflect the most recent fiscal half year. |
27 Invesco Long/Short Equity Fund
Approval of Investment Advisory and Sub-Advisory Contracts
The Board of Trustees (the Board) of AIM Investment Funds (Invesco Investment Funds) is required under the Investment Company Act of 1940, as amended, to approve annually the renewal of Invesco Long/Short Equity Fund’s (the Fund) investment advisory agreements. During contract renewal meetings held on June 9-10, 2015, the Board as a whole, and the disinterested or “independent” Trustees, who comprise over 75% of the Board, voting separately, approved the continuance for the Fund of the Master Investment Advisory Agreement with Invesco Advisers, Inc. (Invesco Advisers and the investment advisory agreement) and the Master Intergroup Sub-Advisory Contract for Mutual Funds with Invesco Asset Management Deutschland GmbH, Invesco Asset Management Limited, Invesco Asset Management (Japan) Limited, Invesco Hong Kong Limited, Invesco Senior Secured Management, Inc., Invesco Canada Ltd. and Invesco PowerShares Capital Management LLC (collectively, the Affiliated Sub-Advisers and the sub-advisory contracts) for another year, effective July 1, 2015.
In evaluating the fairness and reasonableness of compensation under the Fund’s investment advisory agreement and sub-advisory contracts, the Board considered, among other things, the factors discussed below. The Board determined that continuation of the Fund’s investment advisory agreement and the sub-advisory contracts is in the best interest of the Fund and its shareholders and that the compensation payable to Invesco Advisers and the Affiliated Sub-Advisers under the agreements is fair and reasonable.
The Board’s Fund Evaluation Process
The Board’s Investments Committee has established three Sub-Committees, each of which is primarily responsible for overseeing the performance and investment management services provided by Invesco Advisers and the Affiliated Sub-Advisers to a number of the funds advised by Invesco Advisers (the Invesco Funds). The Sub-Committees meet throughout the year to review the performance of their assigned Invesco Funds, including reviewing materials prepared under the direction of the independent Senior Officer, an officer of the Invesco Funds who reports directly to the independent Trustees. Over the course of each year, the Sub-Committees meet with portfolio managers for their assigned Invesco Funds and other members of management to review the performance, investment objective(s), policies, strategies, limitations and investment risks of these funds. The Board had the benefit of reports from the Sub-Committees and Investments Committee throughout the year in considering approval of the continuance of each Invesco Fund’s investment advisory agreement and sub-advisory contracts for another year.
During the contract renewal process, the Board receives comparative performance and fee data regarding the Invesco Funds prepared by Invesco Advisers and Lipper Inc. (Lipper), an independent provider of investment company data. The Board also receives a report and this independent written evaluation from the Senior Officer. The Senior Officer’s evaluation is prepared as part of his responsibility to manage the process by which the Invesco Funds’ proposed management fees are negotiated during the annual contract renewal process to ensure they are negotiated in a manner that is at arms’ length and reasonable. In addition to meetings with Invesco Advisers and fund counsel, the independent Trustees also discuss the continuance of the investment advisory agreement and sub-advisory contracts in separate sessions with the Senior Officer and with independent legal counsel.
The Trustees recognized that the advisory fee rates for the Invesco Funds are, in many cases, the result of years of review and negotiation. The Trustees’ deliberations and conclusions in a particular year may be based in part on their deliberations and conclusions regarding these arrangements throughout the year and in prior years. The Trustees’ review and conclusions are based on the comprehensive consideration of all information presented to them and are not the result of any single determinative factor. Moreover, one Trustee may have weighed a particular piece of information or factor differently than another Trustee.
The discussion below is a summary of the Senior Officer’s independent written evaluation with respect to the Fund’s investment advisory agreement as well as a discussion of the material factors and related conclusions that formed the basis for the Board’s approval of the Fund’s investment advisory agreement and sub-advisory contracts. Unless otherwise stated, this information is current as of June 10, 2015, and does not reflect consideration of factors that became known to the Board after that date.
Factors and Conclusions and Summary of Independent Written Fee Evaluation
| A. | Nature, Extent and Quality of Services Provided by Invesco Advisers and the Affiliated Sub-Advisers |
The Board reviewed the advisory services provided to the Fund by Invesco Advisers under the Fund’s investment advisory agreement, the performance of Invesco Advisers in providing these services, and the credentials and experience of the officers and employees of Invesco Advisers who provide these services, including the Fund’s portfolio manager or managers. The Board’s review of the qualifications of Invesco Advisers to provide advisory services included the Board’s consideration of Invesco Advisers’ investment process oversight, independent credit analysis
and investment risk management. The Board also considered non-advisory services that Invesco Advisers and its affiliates provide to the Invesco Funds such as various back office support functions, equity and fixed income trading operations, internal audit, distribution, valuation and legal and compliance.
In determining whether to continue the Fund’s investment advisory agreement, the Board considered the benefits of reapproving an existing relationship and the greater uncertainty that may be associated with entering into a new relationship. The Board concluded that the nature, extent and quality of the services provided to the Fund by Invesco Advisers are appropriate and satisfactory and consistent with the terms of the Fund’s investment advisory agreement.
The Board reviewed the services that may be provided by the Affiliated Sub-Advisers under the sub-advisory contracts and the credentials and experience of the officers and employees of the Affiliated Sub-Advisers who provide these services. The Board noted that the Affiliated Sub-Advisers have offices and personnel that are located in financial centers around the world. As a result, the Affiliated Sub-Advisers can provide research and investment analysis on the markets and economies of various countries in which the Fund may invest, make recommendations regarding securities and assist with security trades. The Board concluded that the sub-advisory contracts benefit the Fund and its shareholders by permitting Invesco Advisers to use the resources and talents of the Affiliated Sub-Advisers in managing the Fund. The Board concluded that the nature, extent and quality of the services that may be provided by the Affiliated Sub-Advisers are appropriate and satisfactory and consistent with the terms of the Fund’s sub-advisory contracts.
The Board noted that the Fund recently began operations and that no comparative performance data was available.
| C. | Advisory and Sub-Advisory Fees |
The Board noted that the Fund had not been in operation long enough to become profitable and that Invesco Advisers was continuing to take entrepreneurial risk in operating the Fund.
The Board noted that Invesco Advisers has contractually agreed to waive fees and/or limit expenses of the Fund through at least February 29, 2016 in an amount necessary to limit total annual operating expenses to a specified percentage of average daily net assets for each class of the Fund.
The Board also compared the Fund’s effective advisory fee rate (the advisory fee rate after advisory fee waivers and before other expense
limitations/waivers) to the effective advisory fee rates of other mutual funds advised by Invesco Advisers and its affiliates with investment strategies comparable to those of the Fund. The
28 Invesco Long/Short Equity Fund
Board noted that the Fund’s rate was the same as the rate of one such mutual fund.
The Board noted that Invesco Advisers and the Affiliated Sub-Advisers do not manage other client accounts with investment strategies comparable to those of the Fund.
The Board also considered the services that may be provided by the Affiliated Sub-Advisers pursuant to the sub-advisory contracts, as well as the fees payable by Invesco Advisers to the Affiliated Sub-Advisers pursuant to the sub-advisory contracts. The Board also noted that the sub-advisory fees are not paid directly by the Fund, but rather, are payable by Invesco Advisers to the Affiliated Sub-Advisers.
| D. | Economies of Scale and Breakpoints |
The Board considered the extent to which there are economies of scale in the provision of advisory services to the Fund. The Board also considered whether the Fund benefits from economies of scale through contractual breakpoints in the Fund’s advisory fee schedule. The Board also noted that the Fund shares directly in economies of scale through lower fees charged by third party service providers based on the combined size of the Invesco Funds and other clients advised by Invesco Advisers.
| E. | Profitability and Financial Resources |
The Board reviewed information from Invesco Advisers concerning the costs of the advisory and other services that Invesco Advisers and its affiliates provide to the Fund and the Invesco Funds and the profitability of Invesco Advisers and its affiliates in providing these services. The Board received information from Invesco Advisers about the methodology used to prepare the profitability information. The Board noted that Invesco Advisers continues to operate at a net profit from services Invesco Advisers and its affiliates provide to the Invesco Funds and the Fund. The Board did not deem the level of profits realized by Invesco Advisers and its affiliates from providing services to the Fund to be excessive given the nature, quality and extent of the services provided. The Board received and accepted information from Invesco Advisers demonstrating that Invesco Advisers and each Affiliated Sub-Adviser are financially sound and have the resources necessary to perform their obligations under the investment advisory agreement and sub-advisory contracts.
| F. | Collateral Benefits to Invesco Advisers and its Affiliates |
The Board considered various other benefits received by Invesco Advisers and its affiliates from the relationship with the Fund, including the fees received for providing transfer agency and distribution services to the Fund. The Board considered the performance of Invesco Advisers and its affiliates in providing these services and the organizational structure employed to provide these services. The Board also considered that these services are provided to the Fund pursuant to written contracts that are reviewed and approved on an annual basis by the Board; and that the services are required for the operation of the Fund.
The Board considered the benefits realized by Invesco Advisers and the Affiliated Sub-Advisers as a result of portfolio brokerage transactions executed through “soft dollar” arrangements. The Board noted that soft dollar arrangements shift the payment obligation for research services from Invesco Advisers and the Affiliated Sub-Advisers to the Invesco Funds and that the research received may be used with other clients of Invesco Advisers and may reduce Invesco Advisers’ and the Affiliated Sub-Advisers’ expenses. The Board also considered that it receives periodic reports from the Chief Compliance Officer of the Invesco Funds demonstrating that these arrangements are consistent with regulatory requirements. The Board did not deem the soft dollar arrangements to be inappropriate.
The Board considered that the Fund’s uninvested cash and cash collateral from any securities lending arrangements may be invested in money market funds advised by Invesco Advisers pursuant to procedures approved by the Board. The Board noted that Invesco Advisers receives advisory fees from these affiliated money market funds attributable to such investments, although Invesco Advisers has contractually agreed to waive through varying periods the advisory fees payable by the Invesco Funds with respect to investments in the affiliated money market funds. The waiver is in an amount equal to 100% of the net advisory fee Invesco Advisers receives from the affiliated money market funds with respect to the Fund’s investment in the affiliated money market funds of uninvested cash, but not cash collateral. The Board concluded that the amount of advisory fees received by Invesco Advisors from the Fund’s investment of cash collateral from any securities lending arrangements in the affiliated money market funds is fair and reasonable.
The Board also considered the Fund may use an affiliated broker to execute certain trades for the Fund to, among other things, control information leakage, and were advised that such trades would be executed in compliance with rules under the Investment Company Act of 1940, as amended, and consistent with best execution obligations.
29 Invesco Long/Short Equity Fund
Tax Information
Form 1099-DIV, Form 1042-S and other year–end tax information provide shareholders with actual calendar year amounts that should be included in their tax returns. Shareholders should consult their tax advisors.
The following distribution information is being provided as required by the Internal Revenue Code or to meet a specific state’s requirement.
The Fund designates the following amounts or, if subsequently determined to be different, the maximum amount allowable for its fiscal year ended October 31, 2015:
| | | | |
Federal and State Income Tax | |
Long-Term Capital Gain Distributions | | $ | 8,324 | |
Qualified Dividend Income* | | | 0 | % |
Corporate Dividends Received Deduction* | | | 0 | % |
U.S. Treasury Obligations* | | | 0 | % |
| | * | The above percentages are based on ordinary income dividends paid to shareholders during the Fund’s fiscal year. |
30 Invesco Long/Short Equity Fund
Trustees and Officers
The address of each trustee and officer is AIM Investment Funds (Invesco Investment Funds) (the “Trust”), 11 Greenway Plaza, Suite 1000, Houston, Texas 77046-1173. The trustees serve for the life of the Trust, subject to their earlier death, incapacitation, resignation, retirement or removal as more specifically provided in the Trust’s organizational documents. Each officer serves for a one year term or until their successors are elected and qualified. Column two below includes length of time served with predecessor entities, if any.
| | | | | | | | |
Name, Year of Birth and
Position(s) Held with the Trust | | Trustee and/
or Officer Since | | Principal Occupation(s)
During Past 5 Years | | Number of Funds in Fund Complex Overseen by Trustee | | Other Directorship(s) Held by Trustee During Past 5 Years |
| Interested Persons | | | | | | | | |
| Martin L. Flanagan1 — 1960 Trustee | | 2007 | | Executive Director, Chief Executive Officer and President, Invesco Ltd. (ultimate parent of Invesco and a global investment management firm); Advisor to the Board, Invesco Advisers, Inc. (formerly known as Invesco Institutional (N.A.), Inc.); Trustee, The Invesco Funds; Vice Chair, Investment Company Institute; and Member of Executive Board, SMU Cox School of Business Formerly: Chairman and Chief Executive Officer, Invesco Advisers, Inc. (registered investment adviser); Director, Chairman, Chief Executive Officer and President, IVZ Inc. (holding company), INVESCO Group Services, Inc. (service provider) and Invesco North American Holdings, Inc. (holding company); Director, Chief Executive Officer and President, Invesco Holding Company Limited (parent of Invesco and a global investment management firm); Director, Invesco Ltd.; Chairman, Investment Company Institute and President, Co-Chief Executive Officer, Co-President, Chief Operating Officer and Chief Financial Officer, Franklin Resources, Inc. (global investment management organization). | | 145 | | None |
Philip A. Taylor2 — 1954
Trustee, President and Principal Executive Officer | | 2006 | | Head of North American Retail and Senior Managing Director, Invesco Ltd.; Director, Co-Chairman, Co-President and Co-Chief Executive Officer, Invesco Advisers, Inc. (formerly known as Invesco Institutional (N.A.), Inc.) (registered investment adviser); Director, Chairman, Chief Executive Officer and President, Invesco Management Group, Inc. (formerly known as Invesco Aim Management Group, Inc.) (financial services holding company); Director and President, INVESCO Funds Group, Inc. (registered investment adviser and registered transfer agent); Director and Chairman, Invesco Investment Services, Inc. (formerly known as Invesco Aim Investment Services, Inc.) (registered transfer agent) and IVZ Distributors, Inc. (formerly known as INVESCO Distributors, Inc.) (registered broker dealer); Chief Executive Officer, Invesco Corporate Class Inc. (corporate mutual fund company) Director, Chairman and Chief Executive Officer, Invesco Canada Ltd. (formerly known as Invesco Trimark Ltd./Invesco Trimark Ltèe) (registered investment adviser and registered transfer agent); Trustee, President and Principal Executive Officer, The Invesco Funds (other than AIM Treasurer’s Series Trust (Invesco Treasurer’s Series Trust), Short-Term Investments Trust and Invesco Management Trust); Trustee and Executive Vice President, The Invesco Funds (AIM Treasurer’s Series Trust (Invesco Treasurer’s Series Trust), Short-Term Investments Trust and Invesco Management Trust only); Director, Invesco Investment Advisers LLC (formerly known as Van Kampen Asset Management); Director, Chief Executive Officer and President, Van Kampen Exchange Corp. Formerly: Director, President and Chairman, Invesco Inc. (holding company), Invesco Canada Holdings Inc. (holding company), Trimark Investments Ltd./Placements Trimark Ltèe and Invesco Financial Services Ltd/Services Financiers Invesco Ltèe; Chief Executive Officer, Invesco Canada Fund Inc (corporate mutual fund company); Director and Chairman, Van Kampen Investor Services Inc.; Director, Chief Executive Officer and President, 1371 Preferred Inc. (holding company) and Van Kampen Investments Inc.; Director and President, AIM GP Canada Inc. (general partner for limited partnerships) and Van Kampen Advisors, Inc.; Director and Chief Executive Officer, Invesco Trimark Dealer Inc. (registered broker dealer); Director, Invesco Distributors, Inc. (formerly known as Invesco Aim Distributors, Inc.) (registered broker dealer); Manager, Invesco PowerShares Capital Management LLC; Director, Chief Executive Officer and President, Invesco Advisers, Inc.; Director, Chairman, Chief Executive Officer and President, Invesco Aim Capital Management, Inc.; President, Invesco Trimark Dealer Inc. and Invesco Trimark Ltd./Invesco Trimark Ltèe; Director and President, AIM Trimark Corporate Class Inc. and AIM Trimark Canada Fund Inc.; Senior Managing Director, Invesco Holding Company Limited; Director and Chairman, Fund Management Company (former registered broker dealer); President and Principal Executive Officer, The Invesco Funds (AIM Treasurer’s Series Trust (Invesco Treasurer’s Series Trust), and Short-Term Investments Trust only); President, AIM Trimark Global Fund Inc. and AIM Trimark Canada Fund Inc.. | | 145 | | None |
| 1 | Mr. Flanagan is considered an interested person (within the meaning of Section 2(a)(19) of the 1940 Act) of the Trust because he is an officer of the Adviser to the Trust, and an officer and a director of Invesco Ltd., ultimate parent of the Adviser. |
| 2 | Mr. Taylor is considered an interested person (within the meaning of Section 2(a)(19) of the 1940 Act) of the Trust because he is an officer and a director of the Adviser. |
T-1 Invesco Long/Short Equity Fund
Trustees and Officers—(continued)
| | | | | | | | |
Name, Year of Birth and Position(s) Held with the Trust | | Trustee and/ or Officer Since | | Principal Occupation(s) During Past 5 Years | | Number of Funds in Fund Complex Overseen by Trustee | | Other Directorship(s) Held by Trustee During Past 5 Years |
| Independent Trustees | | | | | | | | |
Bruce L. Crockett — 1944 Trustee and Chair | | 2003 | | Chairman, Crockett Technologies Associates (technology consulting company) Formerly: Director, Captaris (unified messaging provider); Director, President and Chief Executive Officer, COMSAT Corporation; Chairman, Board of Governors of INTELSAT (international communications company); ACE Limited (insurance company); Independent Directors Council and Investment Company Institute | | 145 | | ALPS (Attorneys Liability Protection Society) (insurance company) and Globe Specialty Metals, Inc. (metallurgical company) |
David C. Arch — 1945 Trustee | | 2010 | | Chairman of Blistex Inc., a consumer health care products manufacturer | | 145 | | Board member of the Illinois Manufacturers’ Association; Member of the Board of Visitors, Institute for the Humanities, University of Michigan; Member of the Audit Committee of the Edward-Elmhurst Hospital |
James T. Bunch — 1942 Trustee | | 2000 | | Managing Member, Grumman Hill Group LLC (family office/private equity investments) Formerly: Founder, Green Manning & Bunch Ltd. (investment banking firm) (1988-2010); Executive Committee, United States Golf Association; and Chairman, Board of Governors, Western Golf Association | | 145 | | Chairman of the Board of Trustees, Evans Scholars Foundation; and Chairman of the Board, Denver Film Society |
Rodney F. Dammeyer — 1940 Trustee | | 2010 | | Chairman of CAC, LLC, (private company offering capital investment and management advisory services) Formerly: Prior to 2001, Managing Partner at Equity Group Corporate Investments; Prior to 1995, Chief Executive Officer of Itel Corporation (formerly Anixter International); Prior to 1985, experience includes Senior Vice President and Chief Financial Officer of Household International, Inc., Executive Vice President and Chief Financial Officer of Northwest Industries, Inc. and Partner of Arthur Andersen & Co.; From 1987 to 2010, Director/Trustee of investment companies in the Van Kampen Funds complex | | 145 | | Director of Quidel Corporation and Stericycle, Inc. |
Albert R. Dowden — 1941 Trustee | | 2003 | | Director of a number of public and private business corporations, including the Boss Group, Ltd. (private investment and management); Nature’s Sunshine Products, Inc. and Reich & Tang Funds (5 portfolios) (registered investment company) Formerly: Director, Homeowners of America Holding Corporation/Homeowners of America Insurance Company (property casualty company); Director, Continental Energy Services, LLC (oil and gas pipeline service); Director, CompuDyne Corporation (provider of product and services to the public security market) and Director, Annuity and Life Re (Holdings), Ltd. (reinsurance company); Director, President and Chief Executive Officer, Volvo Group North America, Inc.; Senior Vice President, AB Volvo; Director of various public and private corporations; Chairman, DHJ Media, Inc.; Director, Magellan Insurance Company; and Director, The Hertz Corporation, Genmar Corporation (boat manufacturer), National Media Corporation; Advisory Board of Rotary Power International (designer, manufacturer, and seller of rotary power engines); and Chairman, Cortland Trust, Inc. (registered investment company) | | 145 | | Director of: Nature’s Sunshine Products, Inc., Reich & Tang Funds, Homeowners of America Holding Corporation/ Homeowners of America Insurance Company, the Boss Group |
Jack M. Fields — 1952 Trustee | | 2003 | | Chief Executive Officer, Twenty First Century Group, Inc. (government affairs company); Owner and Chief Executive Officer, Dos Angeles Ranch, L.P. (cattle, hunting, corporate entertainment); and Discovery Global Education Fund (non-profit) Formerly: Chief Executive Officer, Texana Timber LP (sustainable forestry company); Director of Cross Timbers Quail Research Ranch (non-profit); and member of the U.S. House of Representatives | | 145 | | Insperity, Inc. (formerly known as Administaff) |
Prema Mathai-Davis — 1950 Trustee | | 2003 | | Retired. Formerly: Chief Executive Officer, YWCA of the U.S.A. | | 145 | | None |
Larry Soll — 1942 Trustee | | 1997 | | Retired. Formerly: Chairman, Chief Executive Officer and President, Synergen Corp. (a biotechnology company) | | 145 | | None |
Hugo F. Sonnenschein — 1940 Trustee | | 2010 | | President Emeritus and Honorary Trustee of the University of Chicago and the Adam Smith Distinguished Service Professor in the Department of Economics at the University of Chicago. Prior to 2000, President of the University of Chicago | | 145 | | Trustee of the University of Rochester and a member of its investment committee; Member of the National Academy of Sciences and the American Philosophical Society; Fellow of the American Academy of Arts and Sciences |
Raymond Stickel, Jr. — 1944 Trustee | | 2005 | | Retired. Formerly: Director, Mainstay VP Series Funds, Inc. (25 portfolios) and Partner, Deloitte & Touche | | 145 | | None |
T-2 Invesco Long/Short Equity Fund
Trustees and Officers—(continued)
| | | | | | | | |
Name, Year of Birth and Position(s) Held with the Trust | | Trustee and/ or Officer Since | | Principal Occupation(s) During Past 5 Years | | Number of Funds in Fund Complex Overseen by Trustee | | Other Directorship(s) Held by Trustee During Past 5 Years |
| Independent Trustees—(continued) |
Suzanne H. Woolsey — 1941 Trustee | | 2014 | | Chief Executive Officer of Woolsey Partners LLC | | 145 | | Emeritus Chair of the Board of Trustees of the Institute for Defense Analyses; Trustee of Colorado College; Trustee of California Institute of Technology; Prior to 2014, Director of Fluor Corp.; Prior to 2010, Trustee of the German Marshall Fund of the United States; Prior to 2010 Trustee of the Rocky Mountain Institute |
| Other Officers | | | | | | | | |
Russell C. Burk — 1958
Senior Vice President and Senior Officer | | 2005 | | Senior Vice President and Senior Officer, The Invesco Funds | | N/A | | N/A |
John M. Zerr — 1962
Senior Vice President, Chief Legal Officer and Secretary | | 2006 | | Director, Senior Vice President, Secretary and General Counsel, Invesco Management Group, Inc. (formerly known as Invesco Aim Management Group, Inc.) and Van Kampen Exchange Corp.; Senior Vice President, Invesco Advisers, Inc. (formerly known as Invesco Institutional (N.A.), Inc.) (registered investment adviser); Senior Vice President and Secretary, Invesco Distributors, Inc. (formerly known as Invesco Aim Distributors, Inc.); Director, Vice President and Secretary, Invesco Investment Services, Inc. (formerly known as Invesco Aim Investment Services, Inc.) and IVZ Distributors, Inc. (formerly known as INVESCO Distributors, Inc.); Director and Vice President, INVESCO Funds Group, Inc.; Senior Vice President, Chief Legal Officer and Secretary, The Invesco Funds; Managing Director, Invesco PowerShares Capital Management LLC; Director, Secretary and General Counsel, Invesco Investment Advisers LLC (formerly known as Van Kampen Asset Management); Secretary and General Counsel, Invesco Capital Markets, Inc. (formerly known as Van Kampen Funds Inc.) and Chief Legal Officer, PowerShares Exchange-Traded Fund Trust, PowerShares Exchange-Traded Fund Trust II, PowerShares India Exchange-Traded Fund Trust, PowerShares Actively Managed Exchange-Traded Fund Trust, and PowerShares Actively Managed Exchange-Traded Commodity Fund Trust Formerly: Director and Vice President, Van Kampen Advisors Inc.; Director, Vice President, Secretary and General Counsel, Van Kampen Investor Services Inc.; Director, Invesco Distributors, Inc. (formerly known as Invesco Aim Distributors, Inc.); Director, Senior Vice President, General Counsel and Secretary, Invesco Aim Advisers, Inc. and Van Kampen Investments Inc.; Director, Vice President and Secretary, Fund Management Company; Director, Senior Vice President, Secretary, General Counsel and Vice President, Invesco Aim Capital Management, Inc.; Chief Operating Officer and General Counsel, Liberty Ridge Capital, Inc. (an investment adviser); Vice President and Secretary, PBHG Funds (an investment company) and PBHG Insurance Series Fund (an investment company); Chief Operating Officer, General Counsel and Secretary, Old Mutual Investment Partners (a broker-dealer); General Counsel and Secretary, Old Mutual Fund Services (an administrator) and Old Mutual Shareholder Services (a shareholder servicing center); Executive Vice President, General Counsel and Secretary, Old Mutual Capital, Inc. (an investment adviser); and Vice President and Secretary, Old Mutual Advisors Funds (an investment company) | | N/A | | N/A |
Sheri Morris — 1964
Vice President, Treasurer and Principal Financial Officer | | 2003 | | Vice President, Treasurer and Principal Financial Officer, The Invesco Funds; Vice President, Invesco Advisers, Inc. (formerly known as Invesco Institutional (N.A.), Inc.) (registered investment adviser); and Vice President, PowerShares Exchange-Traded Fund Trust, PowerShares Exchange-Traded Fund Trust II, PowerShares India Exchange-Traded Fund Trust, PowerShares Actively Managed Exchange-Traded Fund Trust, and PowerShares Actively Managed Exchange-Traded Commodity Fund Trust Formerly: Vice President, Invesco Aim Advisers, Inc., Invesco Aim Capital Management, Inc. and Invesco Aim Private Asset Management, Inc.; Assistant Vice President and Assistant Treasurer, The Invesco Funds and Assistant Vice President, Invesco Advisers, Inc., Invesco Aim Capital Management, Inc. and Invesco Aim Private Asset Management, Inc.; and Treasurer, PowerShares Exchange-Traded Fund Trust, PowerShares Exchange-Traded Fund Trust II, PowerShares India Exchange-Traded Fund Trust and PowerShares Actively Managed Exchange-Traded Fund Trust | | N/A | | N/A |
T-3 Invesco Long/Short Equity Fund
Trustees and Officers—(continued)
| | | | | | | | |
Name, Year of Birth and
Position(s) Held with the Trust | | Trustee and/
or Officer Since | | Principal Occupation(s)
During Past 5 Years | | Number of Funds in Fund Complex Overseen by Trustee | | Other Directorship(s) Held by Trustee During Past 5 Years |
| Other Officers—(continued) | | | | | | | | |
Karen Dunn Kelley — 1960
Vice President | | 2003 | | Senior Managing Director, Investments, Invesco Ltd.; Director, Co-President, Co-Chief Executive Officer, and Co-Chairman, Invesco Advisers, Inc. (formerly known as Invesco Institutional (N.A.), Inc.) (registered investment adviser); Chairman, Invesco Senior Secured Management, Inc.; Senior Vice President, Invesco Management Group, Inc. (formerly known as Invesco Aim Management Group, Inc.); Executive Vice President, Invesco Distributors, Inc. (formerly known as Invesco Aim Distributors, Inc.); Director, Invesco Mortgage Capital Inc. and Invesco Management Company Limited; Vice President, The Invesco Funds (other than AIM Treasurer’s Series Trust (Invesco Treasurer’s Series Trust), Short-Term Investments Trust and Invesco Management Trust); and President and Principal Executive Officer, The Invesco Funds (AIM Treasurer’s Series Trust (Invesco Treasurer’s Series Trust), Short-Term Investments Trust and Invesco Management Trust only) Formerly: Director and President, INVESCO Asset Management (Bermuda) Ltd., Director, INVESCO Global Asset Management Limited and INVESCO Management S.A.; Senior Vice President, Van Kampen Investments Inc. and Invesco Advisers, Inc. (formerly known as Invesco Institutional (N.A.), Inc.) (registered investment adviser); Vice President, Invesco Advisers, Inc. (formerly known as Invesco Institutional (N.A.), Inc.); Director of Cash Management and Senior Vice President, Invesco Advisers, Inc. and Invesco Aim Capital Management, Inc.; Director and President, Fund Management Company; Chief Cash Management Officer, Director of Cash Management, Senior Vice President, and Managing Director, Invesco Aim Capital Management, Inc.; Director of Cash Management, Senior Vice President, and Vice President, Invesco Advisers, Inc. and The Invesco Funds (AIM Treasurer’s Series Trust (Invesco Treasurer’s Series Trust), and Short-Term Investments Trust only) | | N/A | | N/A |
Crissie M. Wisdom — 1969 Anti-Money Laundering Compliance Officer | | 2013 | | Anti-Money Laundering Compliance Officer, Invesco Advisers, Inc. (formerly known as Invesco Institutional (N.A.), Inc.) (registered investment adviser), Invesco Capital Markets, Inc. (formerly known as Van Kampen Funds Inc.), Invesco Distributors, Inc., Invesco Investment Services, Inc., Invesco Management Group, Inc., Van Kampen Exchange Corp., The Invesco Funds, and PowerShares Exchange-Traded Fund Trust, PowerShares Exchange-Traded Fund Trust II, PowerShares India Exchange-Traded Fund Trust, PowerShares Actively Managed Exchange-Traded Fund Trust and PowerShares Actively Managed Exchange-Traded Commodity Fund Trust; Anti-Money Laundering Compliance Officer and Bank Secrecy Act Officer, INVESCO National Trust Company and Invesco Trust Company; and Fraud Prevention Manager and Controls and Risk Analysis Manager for Invesco Investment Services, Inc.. | | N/A | | N/A |
Lisa O. Brinkley — 1959 Chief Compliance Officer | | 2015 | | Senior Vice President and Chief Compliance Officer, Invesco Advisers, Inc. (registered investment adviser) (formerly known as Invesco Institutional (N.A., Inc.); and Chief Compliance Officer, The Invesco Funds Formerly: Global Assurance Officer, Invesco Ltd. and Vice President, The Invesco Funds; Chief Compliance Officer, Invesco Distributors, Inc. (formerly known as Invesco Aim Distributors, Inc.), Invesco Investment Services, Inc.(formerly known as Invesco Aim Investment Services, Inc.) and Van Kampen Investor Services Inc.; Senior Vice President, Invesco Management Group, Inc.; Senior Vice President and Chief Compliance Officer, Invesco Advisers, Inc. and The Invesco Funds; Vice President and Chief Compliance Officer, Invesco Aim Capital Management, Inc. and Invesco Distributors, Inc.; Vice President, Invesco Investment Services, Inc. and Fund Management Company. | | N/A | | N/A |
The Statement of Additional Information of the Trust includes additional information about the Fund’s Trustees and is available upon request, without charge, by calling 1.800.959.4246. Please refer to the Fund’s prospectus for information on the Fund’s sub-advisers.
| | | | | | |
Office of the Fund 11 Greenway Plaza, Suite 1000 Houston, TX 77046-1173 | | Investment Adviser Invesco Advisers, Inc. 1555 Peachtree Street, N.E. Atlanta, GA 30309 | | Distributor
Invesco Distributors, Inc. 11 Greenway Plaza, Suite 1000 Houston, TX 77046-1173 | | Auditors PricewaterhouseCoopers LLP 1000 Louisiana Street, Suite 5800 Houston, TX 77002-5678 |
| | | |
| | | | | | |
Counsel to the Fund Stradley Ronon Stevens & Young, LLP 2005 Market Street, Suite 2600 Philadelphia, PA 19103-7018 | | Counsel to the Independent Trustees Goodwin Procter LLP 901 New York Avenue, N.W. Washington, D.C. 20001 | | Transfer Agent Invesco Investment Services, Inc. 11 Greenway Plaza, Suite 1000 Houston, TX 77046-1173 | | Custodian State Street Bank and Trust Company 225 Franklin Street Boston, MA 02110-2801 |
T-4 Invesco Long/Short Equity Fund

Invesco mailing information
Send general correspondence to Invesco Investment Services, Inc., P.O. Box 219078, Kansas City, MO 64121-9078.
Important notice regarding delivery of security holder documents
To reduce Fund expenses, only one copy of most shareholder documents may be mailed to shareholders with multiple accounts at the same address (Householding). Mailing of your shareholder documents may be householded indefinitely unless you instruct us otherwise. If you do not want the mailing of these documents to be combined with those for other members of your household, please contact Invesco Investment Services, Inc. at 800 959 4246 or contact your financial institution. We will begin sending you individual copies for each account within 30 days after receiving your request.
Fund holdings and proxy voting information
The Fund provides a complete list of its holdings four times in each fiscal year, at the quarter ends. For the second and fourth quarters, the lists appear in the Fund’s semiannual and annual reports to shareholders. For the first and third quarters, the Fund files the lists with the Securities and Exchange Commission (SEC) on Form N-Q. The most recent list of portfolio holdings is available at invesco.com/completeqtrholdings. Shareholders can also look up the Fund’s Forms N-Q on the SEC website at sec.gov. Copies of the Fund’s Forms N-Q may be reviewed and copied at the SEC Public Reference Room in Washington, D.C. You can obtain information on the operation of the Public Reference Room, including information about duplicating fee charges, by calling 202 551 8090 or 800 732 0330, or by electronic request at the following email address: publicinfo@sec.gov. The SEC file numbers for the Fund are shown below.
A description of the policies and procedures that the Fund uses to determine how to vote proxies relating to portfolio securities is available without charge, upon request, from our Client Services department at 800 959 4246 or at invesco.com/proxyguidelines. The information is also available on the SEC website, sec.gov.
| | |
Information regarding how the Fund voted proxies related to its portfolio securities during the most recent 12-month period ended June 30 is available at invesco.com/proxysearch. The information is also available on the SEC website, sec.gov. Invesco Advisers, Inc. is an investment adviser; it provides investment advisory services to individual and institutional clients and does not sell securities. Invesco Distributors, Inc. is the US distributor for Invesco Ltd.’s retail mutual funds, exchange-traded funds and institutional money market funds. Both are wholly owned, indirect subsidiaries of Invesco Ltd. | |  |
| | | | |
| SEC file numbers: 811-05426 and 033-19338 | | LSE-AR-1 | | Invesco Distributors, Inc. |
| | | | | | |
| | | | |
 | | Annual Report to Shareholders | | October 31, 2015 | | |
| | | | |
| | Invesco Low Volatility Emerging Markets Fund | | |
| | Nasdaq: | | |
| | A: LVLAX n C: LVLCX n R: LVLRX n Y: LVLYX n R5: LVLFX n R6: LVLSX | | |

Letters to Shareholders
| | |

Philip Taylor | | Dear Shareholders: This annual report includes information about your Fund, including performance data and a complete list of its investments as of the close of the reporting period. Inside is a discussion of how your Fund was managed and the factors that affected its performance during the reporting period. I hope you find this report of interest. The US economy expanded and unemployment declined throughout the reporting period. Continuing low energy prices benefited consumers, but a strong US dollar crimped corporate profits. The US Federal Reserve signaled that it was increasingly likely to raise interest rates, based on generally positive economic data, but uncertainty remained about when it might act. Overseas, the story was much different. Low energy prices hurt the economies of some oil-producing nations, such as Brazil and Russia. During the reporting period, the European Central |
Bank as well as central banks in China and Japan – among other countries – either instituted or maintained extraordinarily accommodative monetary policies in response to economic weakness. Investor uncertainty, such as we saw for much of the reporting period – and market volatility, such as we saw at the end of the reporting period – are unfortunate facts of life when it comes to investing. Some investors use these things as excuses to delay saving and investing for their long-term financial goals. That’s why Invesco encourages investors to work with a professional financial adviser who can stress the importance of starting to save and invest early and the importance of adhering to a disciplined investment plan – when times are good and when they’re uncertain. A financial adviser who knows your unique financial situation, investment goals and risk tolerance can be an invaluable partner as you seek to achieve your financial goals. He or she can offer a long-term perspective when markets are volatile and time-tested advice and guidance when your financial situation or investment goals change. |
Timely information when and where you want it
Invesco’s efforts to help investors achieve their financial objectives include providing individual investors and financial professionals with timely information about the markets, the economy and investing – whenever and wherever they want it.
Our website, invesco.com/us, offers a wide range of market insights and investment perspectives. On the website, you’ll find detailed information about our funds, including prices, performance, holdings and portfolio manager commentaries. You can access information about your account by completing a simple, secure online registration. Click on the “Need to register” link in the “Account Access” box on our homepage to get started.
Invesco’s mobile apps for iPhone® and iPad® (both available free from the App StoreSM) allow you to obtain the same detailed information, monitor your account and create customizable watch lists. Also, they allow you to access investment insights from our investment leaders, market strategists, economists and retirement experts. You can sign up to be alerted when new commentary is added, and you can watch portfolio manager videos and have instant access to Invesco news and updates wherever you may be.
In addition to the resources accessible on our website and through our mobile app, you can obtain timely updates to help you stay informed about the markets, the economy and investing by connecting with Invesco on Twitter, LinkedIn or Facebook. You can access our blog at blog.invesco.us.com. Our goal is to provide you the information you want, when and where you want it.
Have questions?
For questions about your account, feel free to contact an Invesco client services representative at 800 959 4246. For Invesco-related questions or comments, please email me directly at phil@invesco.com.
All of us at Invesco look forward to serving your investment management needs for many years to come. Thank you for investing with us.
Sincerely,

Philip Taylor
Senior Managing Director, Invesco Ltd.
iPhone and iPad are trademarks of Apple Inc., registered in the US and other countries. App Store is a service mark of Apple Inc. Invesco Distributors, Inc. is not affiliated with Apple Inc.
|
| 2 Invesco Low Volatility Emerging Markets Fund |
| | |

Bruce Crockett | | Dear Fellow Shareholders: Among the many important lessons I’ve learned in more than 40 years in a variety of business endeavors is the value of a trusted advocate. As independent chair of the Invesco Funds Board, I can assure you that the members of the Board are strong advocates for the interests of investors in Invesco’s mutual funds. We work hard to represent your interests through oversight of the quality of the investment management services your funds receive and other matters important to your investment, including but not limited to: n Ensuring that Invesco offers a diverse lineup of mutual funds that your financial adviser can use to strive to meet your financial needs as your investment goals change over time. n Monitoring how the portfolio management teams of the Invesco funds are performing in light of changing economic and market conditions. |
| | n | | Assessing each portfolio management team’s investment performance within the context of the investment strategy described in the fund’s prospectus. |
| | n | | Monitoring for potential conflicts of interests that may impact the nature of the services that your funds receive. |
We believe one of the most important services we provide our fund shareholders is the annual review of the funds’ advisory and sub-advisory contracts with Invesco Advisers and its affiliates. This review is required by the Investment Company Act of 1940 and focuses on the nature and quality of the services Invesco provides as the adviser to the Invesco funds and the reasonableness of the fees that it charges for those services. Each year, we spend months carefully reviewing information received from Invesco and a variety of independent sources, such as performance and fee data prepared by Lipper Inc., an independent, third-party firm widely recognized as a leader in its field. We also meet with our independent legal counsel and other independent advisers to review and help us assess the information that we have received. Our goal is to assure that you receive quality investment management services for a reasonable fee.
I trust the measures outlined above provide assurance that you have a worthy advocate when it comes to choosing the Invesco Funds.
As always, please contact me at bruce@brucecrockett.com with any questions or concerns you may have. On behalf of the Board, we look forward to continuing to represent your interests and serving your needs.
Sincerely,

Bruce L. Crockett
Independent Chair
Invesco Funds Board of Trustees
|
| 3 Invesco Low Volatility Emerging Markets Fund |
Management’s Discussion of Fund Performance
Performance summary
For the fiscal year ended October 31, 2015, Class A shares of Invesco Low Volatility Emerging Markets Fund (the Fund), at net asset value (NAV), underperformed the Fund’s style-specific benchmark, the MSCI Emerging Markets Index.
Your Fund’s long-term performance appears later in this report.
Fund vs. Indexes
Total returns, 10/31/14 to 10/31/15, at net asset value (NAV). Performance shown does not include applicable contingent deferred sales charges (CDSC) or front-end sales charges, which would have reduced performance.
| | | | | |
| |
Class A Shares | | | | -17.67 | % |
Class C Shares | | | | -18.29 | |
Class R Shares | | | | -17.81 | |
Class Y Shares | | | | -17.50 | |
Class R5 Shares | | | | -17.50 | |
Class R6 Shares | | | | -17.50 | |
MSCI All Country World Index▼ (Broad Market Index) | | | | -0.03 | |
MSCI Emerging Markets Index▼ (Style-Specific Index) | | | | -14.53 | |
Lipper Emerging Markets Funds Index¢ (Peer Group Index) | | | | -15.26 | |
| |
Source(s): ▼FactSet Research Systems Inc.; ¢Lipper Inc. | | | | | |
Market conditions and your Fund
International markets experienced increased volatility during the fiscal year ended October 31, 2015, driven largely by the continued slowdown in energy markets and the economic downturn in China. Developed markets were generally able to withstand these headwinds, even as more fragile emerging markets began to falter.
As the reporting period began in late 2014, international equity markets moved higher, although economic growth appeared to be somewhat stronger in the US than in the rest of the world. Equity markets globally were recovering from the initial crash of oil prices when OPEC added additional uncertainty by deciding to maintain high production despite low prices and slowing global growth. In this environment, commodity-based economies and most currencies underperformed those of the US.
Global markets were rattled again amid growing concerns that Greece and the eurozone would fail to reach an agreement on a financial bailout plan. However, those fears subsided when a bailout was ultimately approved. The eurozone also benefited from generally positive economic data, which helped markets weather subsequent economic volatility.
In the summer of 2015, fears of a potential economic slowdown in China dominated headlines. The combination of a slowing Chinese economy, a sharp sell-off in domestic Chinese equities and the devaluation of China’s currency, the renminbi, contributed to a strong correction in global equity markets. Emerging markets, in particular, were hard hit by events in China and by continued weak commodity prices – as well as by the US Federal Reserve’s decision to delay raising interest rates, which increased investor uncertainty and market volatility.
The Fund seeks to provide long-term growth of capital while achieving lower volatility than its style-specific benchmark. The Fund seeks to accomplish this through a security selection process that uses a proprietary multi-factor model to evaluate fundamental and behavioral factors of potential holdings. This process includes evaluating each potential security based on Earnings Expectations, Market Sentiment, Management and Quality, and Value.1
For the reporting period, stock selection in the consumer staples, energy, materials and health care sectors contributed to the Fund’s performance relative to its style-specific benchmark. Stock selection in the financials, information technology (IT), industrials, consumer discretionary, utilities and telecommunication services sectors detracted from the Fund’s absolute and relative performance. The energy and materials sectors contributed the most to the Fund’s relative performance. From a geographical perspective, stock selection in China and Mexico was strong, while it was weak in the Asia/Pacific region, specifically in Hong Kong, Taiwan and Thailand. The Fund’s overweight position in Brazil hindered the Fund’s relative performance.
In the Asia/Pacific region, Huadian Power International, a Chinese power generation company, posted strong results for the fiscal year, primarily as a result of its announcement in mid-2015 that it would acquire a majority stake in a Hebei-based power company from China Huadian (not a Fund holding). Additionally, our overweight exposure to the Korean cosmetic company AMOREPACIFIC Group also contributed to Fund performance.
Stock selection in the materials sector detracted from Fund performance versus the MSCI Emerging Markets Index. LG Hausys, a South Korean construction
| | | | |
| Portfolio Composition |
By sector | | % of total net assets |
| | | | | |
Financials | | | | 17.6 | % |
Consumer Staples | | | | 15.2 | |
Materials | | | | 13.5 | |
Industrials | | | | 12.2 | |
Consumer Discretionary | | | | 10.2 | |
Utilities | | | | 8.6 | |
Information Technology | | | | 8.5 | |
Energy | | | | 4.3 | |
Telecommunication Services | | | | 3.7 | |
Health Care | | | | 1.4 | |
Money Market Funds
Plus Other Assets Less Liabilities | | | | 4.8 | |
| | | | | |
| Top 10 Equity Holdings* |
% of total net assets |
| | | | | | | |
1. | | Tatneft-ADR | | | | 1.6 | % |
2. | | Zhejiang Expressway Co., Ltd.-Class H | | | | 1.6 | |
3. | | Moscow Exchange OAO | | | | 1.5 | |
4. | | Arca Continental S.A.B. de C.V. | | | | 1.5 | |
5. | | NHPC Ltd. | | | | 1.5 | |
6. | | Gruma, S.A.B. de C.V. -Class B | | | | 1.5 | |
7. | | TAV Havalimanlari A.S. | | | | 1.5 | |
8. | | Truworths International Ltd. | | | | 1.5 | |
9. | | Samsung Electronics Co., Ltd. | | | | 1.5 | |
10. | | Alpek S.A.B. de C.V. | | | | 1.5 | |
| | | | | |
Total Net Assets | | | | $3.2 million | |
| |
| Total Number of Holdings* | | | | 98 | |
The Fund’s holdings are subject to change, and there is no assurance that the Fund will continue to hold any particular security.
*Excluding money market fund holdings.
Data presented here are as of October 31, 2015.
|
| 4 Invesco Low Volatility Emerging Markets Fund |
materials company, performed poorly throughout the reporting period, and we eliminated it from the Fund before the close of the fiscal year.
In addition, the Fund’s overweight exposure to Brazil detracted from Fund performance. In the middle of the reporting period, Brazilian private educational company Kroton Educacionial suffered from the declining Brazilian economy. We eliminated the stock from the Fund before the close of the reporting period.
At the close of the reporting period, and relative to the style-specific index, the Fund held overweight positions in the consumer discretionary, consumer staples, industrials, materials and utilities sectors. The Fund was underweight in the energy, financials, IT and telecommunication services sectors. Geographically, the Fund was overweight in Brazil, South Korea, Malaysia, Mexico, South Africa and Taiwan. The Fund was underweight in China and Hong Kong.
Please note, the Fund’s strategy is principally implemented through equity investments, but we may also use futures contracts, a derivative instrument, to gain exposure to the equity market. During the reporting period, the Fund invested in MSCI Emerging Market Index futures contracts, which generated a negative return and were a slight detractor from Fund performance. Derivatives can be a cost-effective way to gain exposure to asset classes. However, derivatives may amplify traditional investment risks through the creation of leverage and may be less liquid than traditional securities.
Thank you for your investment in Invesco Low Volatility Emerging Markets Fund.
| 1 | The Earnings Expectations, Market Sentiment, Management and Quality, and Value concepts are part of the Fund’s stock selection process. The Earnings Expectations concept evaluates earnings momentum and earnings revisions. The Market Sentiment concept evaluates the price momentum of the stock. The Management and Quality concept evaluates how management’s actions are benefiting shareholders. And the Value concept evaluates how attractive valuations are in terms of cash flow yield and gross profit yield. |
The views and opinions expressed in management’s discussion of Fund performance are those of Invesco Advisers, Inc. These views and opinions are subject to change at any time based on factors such as market and economic conditions. These views and opinions may not be relied upon as investment advice or recommendations, or as an offer for a particular security. The information is not a complete analysis of every aspect of any market, country, industry, security or the Fund. Statements of fact are from sources considered reliable, but Invesco Advisers, Inc. makes no representation or warranty as to their completeness or accuracy. Although historical performance is no guarantee of future results, these insights may help you understand our investment management philosophy.
See important Fund and, if applicable, index disclosures later in this report.
| | |
 | | Michael Abata Chartered Financial Analyst, Portfolio Manager, is manager of Invesco Low Volatility Emerging Markets Fund. |
He joined Invesco in 2011. Mr. Abata earned a BA in economics from Binghamton University.
| | |
 | | Uwe Draeger Portfolio Manager, is manager of Invesco Low Volatility Emerging Markets Fund. He joined Invesco in 2005. |
Mr. Draeger earned a Diplom-Ökonom degree from Hochschule für Ökonomie Berlin, an MA from City of London Polytechnic and an MBA from Anglia Business School (Cambridge).
| | |
 | | Nils Huter Chartered Financial Analyst, Portfolio Manager, is manager of Invesco Low Volatility Emerging Markets Fund. |
He joined Invesco in 2007. Mr. Huter earned a business administration degree “Diplom Kaufmann (FH)” from the University of Applied Sciences and Arts in Hildesheim.
| | |
 | | Charles Ko Chartered Financial Analyst, Portfolio Manager, is manager of Invesco Low Volatility Emerging Markets Fund. |
He joined Invesco in 2012. Mr. Ko earned a BS from MIT and an MBA from Yale University.
| | |
 | | Jens Langewand Portfolio Manager, is manager of Invesco Low Volatility Emerging Markets Fund. He joined Invesco in 2007. |
Mr. Langewand earned a Diplom Kaufmann degree from the University of Münster and a PhD from the University of Augsburg.
| | |
 | | Andrew Waisburd Portfolio Manager, is manager of Invesco Low Volatility Emerging Markets Fund. He joined Invesco in 2008. |
Mr. Waisburd earned a BS in statistics from Cornell University and an MS and a PhD in finance from Indiana University.
|
| 5 Invesco Low Volatility Emerging Markets Fund |
Your Fund’s Long-Term Performance
Results of a $10,000 Investment – Oldest Share Class(es) since Inception
Fund and index data from 12/17/13
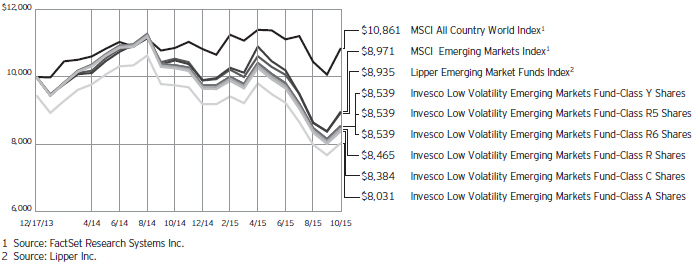
Past performance cannot guarantee comparable future results.
The data shown in the chart include reinvested distributions, applicable sales charges and Fund expenses including
management fees. Index results include reinvested dividends, but they do not reflect sales charges. Performance of the peer group, if applicable, reflects fund expenses and management fees;
performance of a market index does not. Performance shown in the chart and table(s) does not reflect deduction of taxes a shareholder would pay on Fund distributions or sale of Fund shares.
continued from page 8
| n | | Small- and mid-capitalization risks. Stocks of small- and mid-sized companies tend to be more vulnerable to adverse developments and may have little or no operating history or track record of success, and limited product lines, markets, management and financial resources. The securities of small- and mid-sized companies may be more volatile due to less market interest and less publicly available information about the issuer. They also may be illiquid or restricted as to resale, or may trade less frequently and in smaller volumes, all of which may cause difficulty when establishing or closing a position at a desirable price. |
About indexes used in this report
| n | | The MSCI All Country World Index is a free float-adjusted market capitalization index that is designed to measure equity market performance of developed and emerging markets. The index is computed using the net return, which withholds applicable taxes for nonresident investors. |
| n | | The MSCI Emerging Markets Index is an unmanaged index considered representative of stocks of developing countries. The index is computed using the net return, which withholds applicable taxes for non-resident investors. |
| n | | The Lipper Emerging Market Funds Index is an unmanaged index considered representative of emerging market funds tracked by Lipper. |
| n | | The Fund is not managed to track the performance of any particular index, including the index(es) described here, and consequently, the performance of the Fund may deviate significantly from the performance of the index(es). |
| n | | A direct investment cannot be made in an index. Unless otherwise indicated, index results include reinvested dividends, and they do not reflect sales charges. Performance of the peer group, if applicable, reflects fund expenses; performance of a market index does not. |
Other information
| n | | The returns shown in management’s discussion of Fund performance are based on net asset values (NAVs) calculated for shareholder transactions. Generally accepted accounting principles require adjustments to be made to the net assets of the Fund at period end for financial reporting purposes, and as such, the NAVs for shareholder transactions and the returns based on those NAVs may differ from the NAVs and returns reported in the Financial Highlights. |
| n | | Industry classifications used in this report are generally according to the Global Industry Classification Standard, which was developed by and is the exclusive property and a service mark of MSCI Inc. and Standard & Poor’s. |
|
| 6 Invesco Low Volatility Emerging Markets Fund |
| | | | | |
Average Annual Total Returns As of 10/31/15, including maximum applicable
sales charges |
| |
| Class A Shares | | | | | |
| Inception (12/17/13) | | | | -11.06 | % |
| 1 Year | | | | -22.19 | |
| |
| Class C Shares | | | | | |
| Inception (12/17/13) | | | | -8.99 | % |
| 1 Year | | | | -19.07 | |
| |
| Class R Shares | | | | | |
| Inception (12/17/13) | | | | -8.52 | % |
| 1 Year | | | | -17.81 | |
| |
| Class Y Shares | | | | | |
| Inception (12/17/13) | | | | -8.09 | % |
| 1 Year | | | | -17.50 | |
| |
| Class R5 Shares | | | | | |
| Inception (12/17/13) | | | | -8.09 | % |
| 1 Year | | | | -17.50 | |
| |
| Class R6 Shares | | | | | |
| Inception (12/17/13) | | | | -8.09 | % |
| 1 Year | | | | -17.50 | |
The performance data quoted represent past performance and cannot guarantee comparable future results; current performance may be lower or higher. Please visit invesco.com/performance for the most recent month-end performance. Performance figures reflect reinvested distributions, changes in net asset value and the effect of the maximum sales charge unless otherwise stated. Investment return and principal value will fluctuate so that you may have a gain or loss when you sell shares.
The net annual Fund operating expense ratio set forth in the most recent Fund prospectus as of the date of this report for Class A, Class C, Class R, Class Y, Class R5 and Class R6 shares was 1.72%, 2.47%, 1.97%, 1.47%, 1.47% and 1.47%, respectively.1,2 The total annual Fund operating expense ratio set forth in the most recent Fund prospectus as of the date of this report for Class A, Class C, Class R, Class Y, Class R5 and Class R6 shares was 10.37%, 11.12%, 10.62%, 10.12%, 10.07% and 10.07%, respectively. The expense ratios presented above may vary from the expense ratios presented in other sections of this report that are based on expenses incurred during the period covered by this report.
| | | | | |
| Average Annual Total Returns As of 9/30/15, the most recent calendar quarter
end, including maximum applicable sales charges |
| |
| Class A Shares | | | | | |
| Inception (12/17/13) | | | | -13.78 | % |
| 1 Year | | | | -25.93 | |
| |
| Class C Shares | | | | | |
| Inception (12/17/13) | | | | -11.70 | % |
| 1 Year | | | | -23.01 | |
| |
| Class R Shares | | | | | |
| Inception (12/17/13) | | | | -11.27 | % |
| 1 Year | | | | -21.89 | |
| |
| Class Y Shares | | | | | |
| Inception (12/17/13) | | | | -10.83 | % |
| 1 Year | | | | -21.49 | |
| |
| Class R5 Shares | | | | | |
| Inception (12/17/13) | | | | -10.83 | % |
| 1 Year | | | | -21.49 | |
| |
| Class R6 Shares | | | | | |
| Inception (12/17/13) | | | | -10.83 | % |
| 1 Year | | | | -21.49 | |
Class A share performance reflects the maximum 5.50% sales charge, and Class C share performance reflects the applicable contingent deferred sales charge (CDSC) for the period involved. The CDSC on Class C shares is 1% for the first year after purchase. Class R, Class Y, Class R5 and Class R6 shares do not have a front-end sales charge or a CDSC; therefore, performance is at net asset value.
The performance of the Fund’s share classes will differ primarily due to different sales charge structures and class expenses.
Fund performance reflects any applicable fee waivers and/or expense reimbursements. Had the adviser not waived fees and/or reimbursed expenses currently or in the past, returns would have been lower. See current prospectus for more information.
| 1 | Total annual Fund operating expenses after any contractual fee waivers and/or expense reimbursements by the adviser in effect through at least February 28, 2017. See current prospectus for more information. |
| 2 | Total annual Fund operating expenses after any contractual fee waivers and/or expense reimbursements by the adviser in effect through at least June 30, 2017. See current prospectus for more information. |
|
| 7 Invesco Low Volatility Emerging Markets Fund |
Invesco Low Volatility Emerging Markets Fund’s investment objective is long-term growth of capital.
| n | | Unless otherwise stated, information presented in this report is as of October 31, 2015, and is based on total net assets. |
| n | | Unless otherwise noted, all data provided by Invesco. |
| n | | To access your Fund’s reports/prospectus, visit invesco.com/fundreports. |
About share classes
| n | | Class R shares are generally available only to employer sponsored retirement and benefit plans. Please see the prospectus for more information. |
| n | | Class Y shares are available only to certain investors. Please see the prospectus for more information. |
| n | | Class R5 shares and Class R6 shares are primarily intended for employer sponsored retirement and benefit plans that meet certain standards and for institutional investors. Please see the prospectus for more information. |
Principal risks of investing in the Fund
| n | | Currency/exchange rate risk. The dollar value of the Fund’s foreign investments will be affected by changes in the exchange rates between the dollar and the currencies in which those investments are traded. |
| n | | Depositary receipts risk. Depositary receipts involve many of the same risks as those associated with direct investment in foreign securities. In addition, the underlying issuers of certain depositary receipts, particularly unsponsored or unregistered depositary receipts, are under no obligation to distribute shareholder communications to the holders of such receipts or to pass through to them any voting rights with respect to the deposited securities. |
| n | | Derivatives risk. The value of a derivative instrument depends largely on (and is derived from) the value of an underlying security, currency, commodity, interest rate, index or other asset (each referred to as an underlying asset). In addition to risks relating to the underlying assets, the use of derivatives may include other, possibly greater, risks, including counterparty, leverage and liquidity risks. Counterparty risk is the risk that the counterparty to the derivative contract will default on its obligation to pay the Fund the amount owed or otherwise perform |
| | under the derivative contract. Derivatives create leverage risk because they do not require payment up front equal to the economic exposure created by owning the derivative. As a result, an adverse change in the value of the underlying asset could result in the Fund sustaining a loss that is substantially greater than the amount invested in the derivative, which may make the Fund’s returns more volatile and increase the risk of loss. Derivative instruments may also be less liquid than more traditional investments and the Fund may be unable to sell or close out its derivative positions at a desirable time or price. This risk may be more acute under adverse market conditions, during which the Fund may be most in need of liquidating its derivative positions. Derivatives may also be harder to value, less tax efficient and subject to changing government regulation that could impact the Fund’s ability to use certain derivatives or their cost. Also, derivatives used for hedging or to gain or limit exposure to a particular market segment may not provide the expected benefits, particularly during adverse market conditions. |
| n | | Emerging markets securities risk. The prices of securities issued by foreign companies and governments located in emerging markets countries may be affected more negatively by inflation, devaluation of their currencies, higher transaction costs, delays in settlement, adverse political developments, the introduction of capital controls, withholding taxes, nationalization of private assets, expropriation, social unrest, war or lack of timely information than those in developed countries. |
| n | | Foreign securities risk. The Fund’s foreign investments may be affected by changes in a foreign country’s exchange rates, political and social instability, changes in economic or taxation policies, difficulties when enforcing obligations, decreased liquidity, and increased |
| | volatility. Foreign companies may be subject to less regulation resulting in less publicly available information about the companies. |
| n | | Geographic focus risk. From time to time the Fund may invest a substantial amount of its assets in securities of issuers located in a single country or a limited number of countries. If the Fund focuses its investments in this manner, it assumes the risk that economic, political and social conditions in those countries will have a significant impact on its investment performance. |
| n | | Management risk. The investment techniques and risk analysis used by the Fund’s portfolio managers may not produce the desired results. In particular, there is no guarantee that the portfolio manager’s stock selection process will produce lower volatility than the broader markets in which the Fund invests. In addition, the Fund’s investment strategy to seek lower volatility may cause the Fund to underperform the broader markets in which the Fund invests during market rallies. Such underperformance could be significant during sudden or significant market rallies. |
| n | | Market risk. The prices of and the income generated by the Fund’s securities may decline in response to, among other things, investor sentiment, general economic and market conditions, regional or global instability, and currency and interest rate fluctuations. |
| n | | Preferred securities risk. Preferred securities may include provisions that permit the issuer, in its discretion, to defer or omit distributions for a certain period of time. If the Fund owns a security that is deferring or omitting its distributions, the Fund may be required to report the distribution on its tax returns, even though it may not have received this income. Further, preferred securities may lose substantial value due to the omission or deferment of dividend payments. |
continued on page 6
|
This report must be accompanied or preceded by a currently effective Fund prospectus, which contains more complete information, including sales charges and expenses. Investors should read it carefully before investing. |
|
|
| NOT FDIC INSURED | MAY LOSE VALUE | NO BANK GUARANTEE |
|
| 8 Invesco Low Volatility Emerging Markets Fund |
Schedule of Investments
October 31, 2015
| | | | | | | | |
| | | Shares | | | Value | |
Common Stocks & Other Equity Interests–95.22% | |
| Brazil–8.98% | |
Banco do Brasil S.A. | | | 1,300 | | | $ | 5,386 | |
BRF S.A. | | | 2,300 | | | | 35,861 | |
CESP–Companhia Energetica de Sao Paulo–Class B–Preference Shares | | | 4,500 | | | | 18,912 | |
Companhia de Transmissao de Energia Eletrica Paulista–Preference Shares | | | 2,000 | | | | 23,037 | |
Companhia Energetica de Minas Gerais–ADR | | | 5,400 | | | | 10,530 | |
Fibria Celulose S.A.–ADR | | | 2,800 | | | | 37,856 | |
JBS S.A. | | | 9,500 | | | | 35,120 | |
Lojas Renner S.A. | | | 6,500 | | | | 31,196 | |
Multiplus S.A. | | | 3,000 | | | | 26,727 | |
Porto Seguro S.A. | | | 1,800 | | | | 15,097 | |
Telefonica Brasil S.A.–ADR | | | 1,800 | | | | 18,648 | |
Transmissora Alianca de Energia Eletrica
S.A.(a) | | | 3,900 | | | | 20,134 | |
WEG S.A. | | | 1,820 | | | | 6,799 | |
| | | | | | | | 285,303 | |
|
| Chile–3.92% | |
Aguas Andinas S.A.–Class A | | | 19,842 | | | | 10,382 | |
Banco de Chile | | | 322,105 | | | | 34,060 | |
Compania Cervecerias Unidas S.A.–ADR | | | 800 | | | | 19,176 | |
Empresa Nacional de Electricidad S.A. | | | 19,048 | | | | 23,775 | |
Enersis S.A. | | | 140,709 | | | | 37,242 | |
| | | | | | | | 124,635 | |
|
| China–5.17% | |
Chongqing Rural Commercial Bank Co., Ltd.–Class H | | | 60,000 | | | | 37,566 | |
Guangdong Electric Power Development Co., Ltd.–Class B | | | 18,500 | | | | 12,068 | |
Huadian Power International Corp. Ltd.–
Class H | | | 42,000 | | | | 30,685 | |
Shanghai Bailian Group Co. Ltd.–Class B | | | 9,416 | | | | 17,918 | |
Shenzhen Expressway Co. Ltd.–Class H | | | 22,000 | | | | 16,877 | |
Zhejiang Expressway Co., Ltd.–Class H | | | 40,000 | | | | 49,078 | |
| | | | | | | | 164,192 | |
|
| Colombia–0.82% | |
Banco Davivienda S.A.–Preference Shares | | | 1,063 | | | | 8,742 | |
Bancolombia S.A.–ADR | | | 500 | | | | 17,310 | |
| | | | | | | | 26,052 | |
|
| India–7.55% | |
Bharat Electronics Ltd. | | | 2,238 | | | | 42,651 | |
Britannia Industries Ltd. | | | 838 | | | | 41,414 | |
Hindustan Petroleum Corp. Ltd. | | | 3,716 | | | | 43,664 | |
NHPC Ltd. | | | 172,281 | | | | 47,844 | |
Rural Electrification Corp. Ltd. | | | 11,873 | | | | 45,263 | |
Sun TV Network Ltd. | | | 3,101 | | | | 18,856 | |
| | | | | | | | 239,692 | |
| | | | | | | | |
| | | Shares | | | Value | |
| Indonesia–3.11% | |
PT Astra Agro Lestari Tbk | | | 10,300 | | | $ | 14,885 | |
PT Indofood Sukses Makmur Tbk | | | 61,100 | | | | 24,537 | |
PT Telekomunikasi Indonesia Persero Tbk | | | 228,700 | | | | 45,251 | |
PT United Tractors Tbk | | | 10,700 | | | | 14,120 | |
| | | | | | | | 98,793 | |
|
| Malaysia–3.36% | |
British American Tobacco Malaysia Berhad | | | 1,300 | | | | 18,660 | |
DiGi.Com Berhad | | | 6,600 | | | | 8,071 | |
MISC Berhad | | | 19,700 | | | | 41,358 | |
Tenaga Nasional Berhad | | | 13,100 | | | | 38,476 | |
| | | | | | | | 106,565 | |
|
| Mexico–9.53% | |
Alpek S.A.B. de C.V. | | | 32,300 | | | | 46,629 | |
Arca Continental S.A.B. de C.V. | | | 7,600 | | | | 48,537 | |
Gentera S.A.B. de C.V. | | | 17,700 | | | | 32,505 | |
Gruma, S.A.B. de C.V.–Class B | | | 3,100 | | | | 47,567 | |
Grupo Aeroportuario del Pacifico S.A.B. de C.V.–ADR | | | 500 | | | | 45,535 | |
Grupo Mexico S.A.B. de C.V.–Series B | | | 15,900 | | | | 38,747 | |
Industrias Bachoco, S.A.B. de C.V.–Series B | | | 5,300 | | | | 24,118 | |
Industrias Peñoles, S.A.B. de C.V. | | | 1,435 | | | | 19,006 | |
| | | | | | | | 302,644 | |
|
| Poland–3.03% | |
KGHM Polska Miedz S.A. | | | 1,441 | | | | 33,422 | |
Powszechna Kasa Oszczednosci Bank Polski S.A.(b) | | | 3,286 | | | | 24,318 | |
Powszechny Zaklad Ubezpieczen S.A. | | | 396 | | | | 38,436 | |
| | | | | | | | 96,176 | |
|
| Russia–6.34% | |
Gazprom PAO–ADR | | | 9,970 | | | | 41,974 | |
MMC Norilsk Nickel PJSC–ADR | | | 2,553 | | | | 37,838 | |
Mobile TeleSystems PJSC–ADR | | | 3,100 | | | | 21,793 | |
Moscow Exchange (The) | | | 34,653 | | | | 48,757 | |
Tatneft–ADR | | | 1,647 | | | | 51,109 | |
| | | | | | | | 201,471 | |
|
| South Africa–10.61% | |
AVI Ltd. | | | 5,110 | | | | 32,523 | |
FirstRand Ltd. | | | 11,470 | | | | 42,022 | |
Imperial Holdings Ltd. | | | 2,437 | | | | 31,736 | |
Liberty Holdings Ltd. | | | 1,476 | | | | 14,417 | |
Mondi Ltd. | | | 1,447 | | | | 33,653 | |
Nedbank Group Ltd. | | | 2,434 | | | | 40,404 | |
Netcare Ltd. | | | 15,802 | | | | 44,923 | |
Sibanye Gold Ltd. | | | 14,441 | | | | 23,971 | |
SPAR Group Ltd. (The) | | | 1,840 | | | | 26,431 | |
Truworths International Ltd. | | | 6,957 | | | | 46,992 | |
| | | | | | | | 337,072 | |
See accompanying Notes to Financial Statements which are an integral part of the financial statements.
9 Invesco Low Volatility Emerging Markets Fund
| | | | | | | | |
| | | Shares | | | Value | |
| South Korea–15.68% | |
AMOREPACIFIC Group | | | 55 | | | $ | 7,700 | |
Coway Co., Ltd. | | | 621 | | | | 46,145 | |
Hanwha Corp. | | | 1,326 | | | | 43,294 | |
Hyosung Corp. | | | 420 | | | | 42,768 | |
Hyundai Development Co. | | | 770 | | | | 30,844 | |
Hyundai Marine & Fire Insurance Co., Ltd. | | | 1,016 | | | | 30,243 | |
Kangwon Land Inc. | | | 1,081 | | | | 40,092 | |
Kia Motors Corp. | | | 925 | | | | 45,123 | |
Korean Air Lines Co., Ltd.(b) | | | 922 | | | | 24,831 | |
KT&G Corp. | | | 436 | | | | 43,579 | |
LG Display Co., Ltd. | | | 1,837 | | | | 34,992 | |
LS Corp. | | | 561 | | | | 18,963 | |
LS Industrial Systems Co., Ltd. | | | 251 | | | | 10,893 | |
Samsung Electronics Co., Ltd. | | | 39 | | | | 46,698 | |
SK Hynix Inc. | | | 1,193 | | | | 31,856 | |
| | | | | | | | 498,021 | |
|
| Taiwan–11.41% | |
AU Optronics Corp. | | | 137,000 | | | | 39,854 | |
Chunghwa Telecom Co., Ltd. | | | 8,000 | | | | 24,416 | |
Feng Hsin Iron & Steel Co., Ltd. | | | 8,000 | | | | 9,188 | |
Fubon Financial Holding Co., Ltd. | | | 28,000 | | | | 44,906 | |
Highwealth Construction Corp. | | | 20,800 | | | | 30,441 | |
Hon Hai Precision Industry Co., Ltd. | | | 11,550 | | | | 30,502 | |
Innolux Corp. | | | 123,000 | | | | 40,990 | |
Pegatron Corp. | | | 18,000 | | | | 43,618 | |
Pou Chen Corp. | | | 26,000 | | | | 36,418 | |
Taiwan Cement Corp. | | | 37,000 | | | | 40,866 | |
| | | | | | | | |
| | | Shares | | | Value | |
| Taiwan–(continued) | |
Wan Hai Lines Ltd. | | | 32,000 | | | $ | 21,001 | |
| | | | | | | | 362,200 | |
|
| Thailand–0.70% | |
PTT Global Chemical PCL | | | 14,200 | | | | 22,117 | |
|
| Turkey–4.09% | |
TAV Havalimanlari Holding A.S. | | | 6,002 | | | | 47,142 | |
Turkiye Is Bankasi–Class C | | | 21,724 | | | | 37,106 | |
Ulker Biskuvi Sanayi A.S. | | | 6,739 | | | | 45,534 | |
| | | | | | | | 129,782 | |
|
| United Arab Emirates–0.92% | |
Air Arabia PJSC | | | 48,728 | | | | 17,910 | |
Emaar Properties PJSC | | | 6,417 | | | | 11,161 | |
| | | | | | | | 29,071 | |
Total Common Stocks & Other Equity Interests
(Cost $3,418,267) | | | | 3,023,786 | |
| |
Money Market Funds–1.48% | | | | | |
Liquid Assets Portfolio–Institutional Class, 0.16%(c) | | | 23,521 | | | | 23,521 | |
Premier Portfolio–Institutional Class,
0.12%(c) | | | 23,520 | | | | 23,520 | |
Total Money Market Funds
(Cost $47,041) | | | | 47,041 | |
TOTAL INVESTMENTS–96.70%
(Cost $3,465,308) | | | | 3,070,827 | |
OTHER ASSETS LESS LIABILITIES–3.30% | | | | | | | 104,670 | |
NET ASSETS–100.00% | | | | | | $ | 3,175,497 | |
Investment Abbreviations:
| | |
| ADR | | – American Depositary Receipt |
Notes to Schedule of Investments:
| (a) | Each unit represents two preferred shares and one common share. |
| (b) | Non-income producing security. |
| (c) | The money market fund and the Fund are affiliated by having the same investment adviser. The rate shown is the 7-day SEC standardized yield as of October 31, 2015. |
See accompanying Notes to Financial Statements which are an integral part of the financial statements.
10 Invesco Low Volatility Emerging Markets Fund
Statement of Assets and Liabilities
October 31, 2015
| | | | |
Assets: | |
Investments, at value (Cost $3,418,267) | | $ | 3,023,786 | |
Investments in affiliated money market funds, at value and cost | | | 47,041 | |
Total investments, at value (Cost $3,465,308) | | | 3,070,827 | |
Foreign currencies, at value (Cost $98,755) | | | 96,968 | |
Receivable for: | | | | |
Deposits with brokers for open futures contacts | | | 6,300 | |
Variation margin — futures | | | 360 | |
Fund shares sold | | | 50 | |
Dividends | | | 4,495 | |
Investment for trustee deferred compensation and retirement plans | | | 4,265 | |
Fund expenses absorbed | | | 54,553 | |
Other assets | | | 4,419 | |
Total assets | | | 3,242,237 | |
|
Liabilities: | |
Payable for: | | | | |
Accrued fees to affiliates | | | 804 | |
Accrued trustees’ and officers’ fees and benefits | | | 1,546 | |
Accrued other operating expenses | | | 60,125 | |
Trustee deferred compensation and retirement plans | | | 4,265 | |
Total liabilities | | | 66,740 | |
Net assets applicable to shares outstanding | | $ | 3,175,497 | |
|
Net assets consist of: | |
Shares of beneficial interest | | $ | 3,905,161 | |
Undistributed net investment income | | | 14,573 | |
Undistributed net realized gain (loss) | | | (354,008 | ) |
Net unrealized appreciation (depreciation) | | | (390,229 | ) |
| | | $ | 3,175,497 | |
| | | | |
Net Assets: | |
Class A | | $ | 1,531,305 | |
Class C | | $ | 41,245 | |
Class R | | $ | 22,713 | |
Class Y | | $ | 1,337,182 | |
Class R5 | | $ | 121,536 | |
Class R6 | | $ | 121,516 | |
|
Shares outstanding, $0.01 par value per share,
with an unlimited number of shares authorized: | |
Class A | | | 189,469 | |
Class C | | | 5,156 | |
Class R | | | 2,819 | |
Class Y | | | 165,049 | |
Class R5 | | | 15,001 | |
Class R6 | | | 15,001 | |
Class A: | | | | |
Net asset value per share | | $ | 8.08 | |
Maximum offering price per share | | | | |
(Net asset value of $8.08 ¸ 94.50%) | | $ | 8.55 | |
Class C: | | | | |
Net asset value and offering price per share | | $ | 8.00 | |
Class R: | | | | |
Net asset value and offering price per share | | $ | 8.06 | |
Class Y: | | | | |
Net asset value and offering price per share | | $ | 8.10 | |
Class R5: | | | | |
Net asset value and offering price per share | | $ | 8.10 | |
Class R6: | | | | |
Net asset value and offering price per share | | $ | 8.10 | |
See accompanying Notes to Financial Statements which are an integral part of the financial statements.
11 Invesco Low Volatility Emerging Markets Fund
Statement of Operations
For the year ended October 31, 2015
| | | | |
Investment income: | |
Dividends (net of foreign withholding taxes of $20,322) | | $ | 118,255 | |
Dividends from affiliated money market funds | | | 73 | |
Total investment income | | | 118,328 | |
| |
Expenses: | | | | |
Advisory fees | | | 34,178 | |
Administrative services fees | | | 50,000 | |
Custodian fees | | | 28,890 | |
Distribution fees: | | | | |
Class A | | | 4,204 | |
Class C | | | 725 | |
Class R | | | 121 | |
Transfer agent fees — A, B, C, R and Y | | | 3,485 | |
Transfer agent fees — R5 | | | 10 | |
Transfer agent fees — R6 | | | 7 | |
Trustees’ and officers’ fees and benefits | | | 18,869 | |
Registration and filing fees | | | 39,292 | |
Professional services fees | | | 59,059 | |
Other | | | 48,745 | |
Total expenses | | | 287,585 | |
Less: Fees waived and expenses reimbursed | | | (228,846 | ) |
Net expenses | | | 58,739 | |
Net investment income | | | 59,589 | |
| |
Realized and unrealized gain (loss) from: | | | | |
Net realized gain (loss) from: | | | | |
Investment securities (net of foreign taxes on holdings of $119) | | | (323,215 | ) |
Foreign currencies | | | (25,215 | ) |
Futures contracts | | | (26,651 | ) |
| | | | (375,081 | ) |
Change in net unrealized appreciation (depreciation) of: | | | | |
Investment securities (net of foreign taxes on holdings of $95) | | | (388,600 | ) |
Foreign currencies | | | (514 | ) |
Futures contracts | | | 6,560 | |
| | | | (382,554 | ) |
Net realized and unrealized gain (loss) | | | (757,635 | ) |
Net increase (decrease) in net assets resulting from operations | | $ | (698,046 | ) |
See accompanying Notes to Financial Statements which are an integral part of the financial statements.
12 Invesco Low Volatility Emerging Markets Fund
Statement of Changes in Net Assets
For the year ended October 31, 2015 and the period December 17, 2013 (commencement date) through October 31, 2014
| | | | | | | | |
| | | 2015 | | | December 17, 2013
(commencement date) through
October 31,
2014 | |
Operations: | | | | | |
Net investment income | | $ | 59,589 | | | $ | 56,770 | |
Net realized gain (loss) | | | (375,081 | ) | | | 48,924 | |
Change in net unrealized appreciation (depreciation) | | | (382,554 | ) | | | (7,675 | ) |
Net increase (decrease) in net assets resulting from operations | | | (698,046 | ) | | | 98,019 | |
| | |
Distributions to shareholders from net investment income: | | | | | | | | |
Class A | | | (57,658 | ) | | | — | |
Class C | | | (2,197 | ) | | | — | |
Class R | | | (796 | ) | | | — | |
Class Y | | | (50,753 | ) | | | — | |
Class R5 | | | (17,161 | ) | | | — | |
Class R6 | | | (5,585 | ) | | | — | |
Total distributions from net investment income | | | (134,150 | ) | | | — | |
| | |
Distributions to shareholders from net realized gains: | | | | | | | | |
Class A | | | (20,025 | ) | | | — | |
Class C | | | (848 | ) | | | — | |
Class R | | | (287 | ) | | | — | |
Class Y | | | (16,495 | ) | | | — | |
Class R5 | | | (5,577 | ) | | | — | |
Class R6 | | | (1,815 | ) | | | — | |
Total distributions from net realized gains | | | (45,047 | ) | | | — | |
| | |
Share transactions–net: | | | | | | | | |
Class A | | | 286,843 | | | | 1,683,585 | |
Class C | | | 5,332 | | | | 59,815 | |
Class R | | | 14,205 | | | | 13,730 | |
Class Y | | | 212,647 | | | | 1,362,792 | |
Class R5 | | | (285,563 | ) | | | 451,325 | |
Class R6 | | | — | | | | 150,010 | |
Net increase in net assets resulting from share transactions | | | 233,464 | | | | 3,721,257 | |
Net increase (decrease) in net assets | | | (643,779 | ) | | | 3,819,276 | |
| | |
Net assets: | | | | | | | | |
Beginning of year | | | 3,819,276 | | | | — | |
End of year (includes undistributed net investment income of $14,573 and $111,161, respectively) | | $ | 3,175,497 | | | $ | 3,819,276 | |
Notes to Financial Statements
October 31, 2015
NOTE 1—Significant Accounting Policies
Invesco Low Volatility Emerging Markets Fund (the “Fund”) is a series portfolio of AIM Investment Funds (Invesco Investment Funds) (the “Trust”). The Trust is organized as a Delaware statutory trust and is registered under the Investment Company Act of 1940, as amended (the “1940 Act”), as an open-end series management investment company consisting of twenty-four separate series portfolios, each authorized to issue an unlimited number of shares of beneficial interest. The assets, liabilities and operations of each portfolio are accounted for separately. Information presented in these financial statements pertains only to the Fund. Matters affecting each portfolio or class will be voted on exclusively by the shareholders of such portfolio or class.
The Fund’s investment objective is long-term growth of capital.
The Fund currently consists of six different classes of shares: Class A, Class C, Class R, Class Y, Class R5 and Class R6. Class A shares are sold with a front-end sales charge unless certain waiver criteria are met and under certain circumstances load waived shares may be subject to contingent deferred sales charges (“CDSC”). Class C shares are sold with a CDSC. Class R, Class Y, Class R5 and Class R6 shares are sold at net asset value.
13 Invesco Low Volatility Emerging Markets Fund
The following is a summary of the significant accounting policies followed by the Fund in the preparation of its financial statements.
| A. | Security Valuations — Securities, including restricted securities, are valued according to the following policy. |
A security listed or traded on an exchange (except convertible securities) is valued at its last sales price or official closing price as of the close of the customary trading session on the exchange where the security is principally traded, or lacking any sales or official closing price on a particular day, the security may be valued at the closing bid price on that day. Securities traded in the over-the-counter market are valued based on prices furnished by independent pricing services or market makers. When such securities are valued by an independent pricing service they may be considered fair valued. Futures contracts are valued at the final settlement price set by an exchange on which they are principally traded. Listed options are valued at the mean between the last bid and asked prices from the exchange on which they are principally traded. Options not listed on an exchange are valued by an independent source at the mean between the last bid and asked prices. For purposes of determining net asset value (“NAV”) per share, futures and option contracts generally are valued 15 minutes after the close of the customary trading session of the New York Stock Exchange (“NYSE”).
Investments in open-end and closed-end registered investment companies that do not trade on an exchange are valued at the end-of-day net asset value per share. Investments in open-end and closed-end registered investment companies that trade on an exchange are valued at the last sales price or official closing price as of the close of the customary trading session on the exchange where the security is principally traded.
Debt obligations (including convertible securities) and unlisted equities are fair valued using an evaluated quote provided by an independent pricing service. Evaluated quotes provided by the pricing service may be determined without exclusive reliance on quoted prices, and may reflect appropriate factors such as institution-size trading in similar groups of securities, developments related to specific securities, dividend rate (for unlisted equities), yield (for debt obligations), quality, type of issue, coupon rate (for debt obligations), maturity (for debt obligations), individual trading characteristics and other market data. Debt obligations are subject to interest rate and credit risks. In addition, all debt obligations involve some risk of default with respect to interest and/or principal payments.
Foreign securities’ (including foreign exchange contracts) prices are converted into U.S. dollar amounts using the applicable exchange rates as of the close of the NYSE. If market quotations are available and reliable for foreign exchange-traded equity securities, the securities will be valued at the market quotations. Because trading hours for certain foreign securities end before the close of the NYSE, closing market quotations may become unreliable. If between the time trading ends on a particular security and the close of the customary trading session on the NYSE, events occur that the Adviser determines are significant and make the closing price unreliable, the Fund may fair value the security. If the event is likely to have affected the closing price of the security, the security will be valued at fair value in good faith using procedures approved by the Board of Trustees. Adjustments to closing prices to reflect fair value may also be based on a screening process of an independent pricing service to indicate the degree of certainty, based on historical data, that the closing price in the principal market where a foreign security trades is not the current value as of the close of the NYSE. Foreign securities’ prices meeting the approved degree of certainty that the price is not reflective of current value will be priced at the indication of fair value from the independent pricing service. Multiple factors may be considered by the independent pricing service in determining adjustments to reflect fair value and may include information relating to sector indices, American Depositary Receipts and domestic and foreign index futures. Foreign securities may have additional risks including exchange rate changes, potential for sharply devalued currencies and high inflation, political and economic upheaval, the relative lack of issuer information, relatively low market liquidity and the potential lack of strict financial and accounting controls and standards.
Securities for which market prices are not provided by any of the above methods may be valued based upon quotes furnished by independent sources. The last bid price may be used to value equity securities. The mean between the last bid and asked prices is used to value debt obligations, including corporate loans.
Securities for which market quotations are not readily available or became unreliable are valued at fair value as determined in good faith by or under the supervision of the Trust’s officers following procedures approved by the Board of Trustees. Issuer specific events, market trends, bid/asked quotes of brokers and information providers and other market data may be reviewed in the course of making a good faith determination of a security’s fair value.
The Fund may invest in securities that are subject to interest rate risk, meaning the risk that the prices will generally fall as interest rates rise and, conversely, the prices will generally rise as interest rates fall. Specific securities differ in their sensitivity to changes in interest rates depending on their individual characteristics. Changes in interest rates may result in increased market volatility, which may affect the value and/or liquidity of certain Fund investments.
Valuations change in response to many factors including the historical and prospective earnings of the issuer, the value of the issuer’s assets, general economic conditions, interest rates, investor perceptions and market liquidity. Because of the inherent uncertainties of valuation, the values reflected in the financial statements may materially differ from the value received upon actual sale of those investments.
| B. | Securities Transactions and Investment Income — Securities transactions are accounted for on a trade date basis. Realized gains or losses on sales are computed on the basis of specific identification of the securities sold. Interest income (net of withholding tax, if any) is recorded on the accrual basis from settlement date. Dividend income (net of withholding tax, if any) is recorded on the ex-dividend date. |
The Fund may periodically participate in litigation related to Fund investments. As such, the Fund may receive proceeds from litigation settlements. Any proceeds received are included in the Statement of Operations as realized gain (loss) for investments no longer held and as unrealized gain (loss) for investments still held.
Brokerage commissions and mark ups are considered transaction costs and are recorded as an increase to the cost basis of securities purchased and/or a reduction of proceeds on a sale of securities. Such transaction costs are included in the determination of net realized and unrealized gain (loss) from investment securities reported in the Statement of Operations and the Statement of Changes in Net Assets and the net realized and unrealized gains (losses) on securities per share in the Financial Highlights. Transaction costs are included in the calculation of the Fund’s net asset value and, accordingly, they reduce the Fund’s total returns. These transaction costs are not considered operating expenses and are not reflected in net investment income reported in the Statement of Operations and the Statement of Changes in Net Assets, or the net investment income per share and the ratios of expenses and net investment income reported in the Financial Highlights, nor are they limited by any expense limitation arrangements between the Fund and the investment adviser.
The Fund allocates income and realized and unrealized capital gains and losses to a class based on the relative net assets of each class.
14 Invesco Low Volatility Emerging Markets Fund
| C. | Country Determination — For the purposes of making investment selection decisions and presentation in the Schedule of Investments, the investment adviser may determine the country in which an issuer is located and/or credit risk exposure based on various factors. These factors include the laws of the country under which the issuer is organized, where the issuer maintains a principal office, the country in which the issuer derives 50% or more of its total revenues and the country that has the primary market for the issuer’s securities, as well as other criteria. Among the other criteria that may be evaluated for making this determination are the country in which the issuer maintains 50% or more of its assets, the type of security, financial guarantees and enhancements, the nature of the collateral and the sponsor organization. Country of issuer and/or credit risk exposure has been determined to be the United States of America, unless otherwise noted. |
| D. | Distributions — Distributions from net investment income and net realized capital gain, if any, are generally declared and paid annually and recorded on the ex-dividend date. The Fund may elect to treat a portion of the proceeds from redemptions as distributions for federal income tax purposes. |
| E. | Federal Income Taxes — The Fund intends to comply with the requirements of Subchapter M of the Internal Revenue Code of 1986, as amended (the “Internal Revenue Code”), necessary to qualify as a regulated investment company and to distribute substantially all of the Fund’s taxable earnings to shareholders. As such, the Fund will not be subject to federal income taxes on otherwise taxable income (including net realized capital gain) that is distributed to shareholders. Therefore, no provision for federal income taxes is recorded in the financial statements. |
The Fund recognizes the tax benefits of uncertain tax positions only when the position is more likely than not to be sustained. Management has analyzed the Fund’s uncertain tax positions and concluded that no liability for unrecognized tax benefits should be recorded related to uncertain tax positions. Management is not aware of any tax positions for which it is reasonably possible that the total amounts of unrecognized tax benefits will change materially in the next 12 months.
The Fund files tax returns in the U.S. Federal jurisdiction and certain other jurisdictions. Generally, the Fund is subject to examinations by such taxing authorities for up to three years after the filing of the return for the tax period.
| F. | Expenses — Fees provided for under the Rule 12b-1 plan of a particular class of the Fund are charged to the operations of such class. Transfer agency fees and expenses and other shareholder recordkeeping fees and expenses attributable to Class R5 and Class R6 are allocated to each share class based on relative net assets. Sub-accounting fees attributable to Class R5 are charged to the operations of the class. Transfer agency fees and expenses and other shareholder recordkeeping fees and expenses relating to all other classes are allocated among those classes based on relative net assets. All other expenses are allocated among the classes based on relative net assets. |
| G. | Accounting Estimates — The preparation of financial statements in conformity with accounting principles generally accepted in the United States of America (“GAAP”) requires management to make estimates and assumptions that affect the reported amounts of assets and liabilities at the date of the financial statements and the reported amounts of revenues and expenses during the reporting period including estimates and assumptions related to taxation. Actual results could differ from those estimates by a significant amount. In addition, the Fund monitors for material events or transactions that may occur or become known after the period-end date and before the date the financial statements are released to print. |
| H. | Indemnifications — Under the Trust’s organizational documents, each Trustee, officer, employee or other agent of the Trust is indemnified against certain liabilities that may arise out of the performance of their duties to the Fund. Additionally, in the normal course of business, the Fund enters into contracts, including the Fund’s servicing agreements, that contain a variety of indemnification clauses. The Fund’s maximum exposure under these arrangements is unknown as this would involve future claims that may be made against the Fund that have not yet occurred. The risk of material loss as a result of such indemnification claims is considered remote. |
| I. | Foreign Currency Translations — Foreign currency is valued at the close of the NYSE based on quotations posted by banks and major currency dealers. Portfolio securities and other assets and liabilities denominated in foreign currencies are translated into U.S. dollar amounts at date of valuation. Purchases and sales of portfolio securities (net of foreign taxes withheld on disposition) and income items denominated in foreign currencies are translated into U.S. dollar amounts on the respective dates of such transactions. The Fund does not separately account for the portion of the results of operations resulting from changes in foreign exchange rates on investments and the fluctuations arising from changes in market prices of securities held. The combined results of changes in foreign exchange rates and the fluctuation of market prices on investments (net of estimated foreign tax withholding) are included with the net realized and unrealized gain or loss from investments in the Statement of Operations. Reported net realized foreign currency gains or losses arise from (1) sales of foreign currencies, (2) currency gains or losses realized between the trade and settlement dates on securities transactions, and (3) the difference between the amounts of dividends, interest, and foreign withholding taxes recorded on the Fund’s books and the U.S. dollar equivalent of the amounts actually received or paid. Net unrealized foreign currency gains and losses arise from changes in the fair values of assets and liabilities, other than investments in securities at fiscal period end, resulting from changes in exchange rates. |
The Fund may invest in foreign securities, which may be subject to foreign taxes on income, gains on investments or currency repatriation, a portion of which may be recoverable. Foreign taxes, if any, are recorded based on the tax regulations and rates that exist in the foreign markets in which the Fund invests and are shown in the Statement of Operations.
| J. | Forward Foreign Currency Contracts — The Fund may engage in foreign currency transactions either on a spot (i.e. for prompt delivery and settlement) basis, or through forward foreign currency contracts, to manage or minimize currency or exchange rate risk. |
The Fund may also enter into forward foreign currency contracts for the purchase or sale of a security denominated in a foreign currency in order to “lock in” the U.S. dollar price of that security, or the Fund may also enter into forward foreign currency contracts that do not provide for physical settlement of the two currencies, but instead are settled by a single cash payment calculated as the difference between the agreed upon exchange rate and the spot rate at settlement based upon an agreed upon notional amount (non-deliverable forwards). The Fund will set aside liquid assets in an amount equal to daily mark-to-market obligation for forward foreign currency contracts.
A forward foreign currency contract is an obligation between two parties (“Counterparties”) to purchase or sell a specific currency for an agreed-upon price at a future date. The use of forward foreign currency contracts does not eliminate fluctuations in the price of the underlying securities the Fund owns or intends to acquire but establishes a rate of exchange in advance. Fluctuations in the value of these contracts are measured by the difference in the contract date and reporting date exchange rates and are recorded as unrealized appreciation (depreciation) until the contracts are closed. When the contracts are closed, realized gains (losses) are recorded. Realized and unrealized gains (losses) on the contracts are included in the Statement of Operations. The primary risks associated with forward foreign currency contracts include failure of the
15 Invesco Low Volatility Emerging Markets Fund
Counterparty to meet the terms of the contract and the value of the foreign currency changing unfavorably. These risks may be in excess of the amounts reflected in the Statement of Assets and Liabilities.
| K. | Futures Contracts — The Fund may enter into futures contracts to manage exposure to interest rate, equity and market price movements and/or currency risks. A futures contract is an agreement between two parties (“Counterparties”) to purchase or sell a specified underlying security, currency or commodity (or delivery of a cash settlement price, in the case of an index future) for a fixed price at a future date. The Fund currently invests only in exchange-traded futures and they are standardized as to maturity date and underlying financial instrument. Initial margin deposits required upon entering into futures contracts are satisfied by the segregation of specific securities or cash as collateral at the futures commission merchant (broker). During the period the futures contracts are open, changes in the value of the contracts are recognized as unrealized gains or losses by recalculating the value of the contracts on a daily basis. Subsequent or variation margin payments are received or made depending upon whether unrealized gains or losses are incurred. These amounts are reflected as receivables or payables on the Statement of Assets and Liabilities. When the contracts are closed or expire, the Fund recognizes a realized gain or loss equal to the difference between the proceeds from, or cost of, the closing transaction and the Fund’s basis in the contract. The net realized gain (loss) and the change in unrealized gain (loss) on futures contracts held during the period is included on the Statement of Operations. The primary risks associated with futures contracts are market risk and the absence of a liquid secondary market. If the Fund were unable to liquidate a futures contract and/or enter into an offsetting closing transaction, the Fund would continue to be subject to market risk with respect to the value of the contracts and continue to be required to maintain the margin deposits on the futures contracts. Futures contracts have minimal Counterparty risk since the exchange’s clearinghouse, as Counterparty to all exchange-traded futures, guarantees the futures against default. Risks may exceed amounts recognized in the Statement of Assets and Liabilities. |
| L. | Collateral — To the extent the Fund has designated or segregated a security as collateral and that security is subsequently sold, it is the Fund’s practice to replace such collateral no later than the next business day. |
NOTE 2—Advisory Fees and Other Fees Paid to Affiliates
The Trust has entered into a master investment advisory agreement with Invesco Advisers, Inc. (the “Adviser” or “Invesco”). Under the terms of the investment advisory agreement, the Fund pays an advisory fee to the Adviser based on the annual rate of the Fund’s average daily net assets as follows:
| | | | |
| Average Daily Net Assets | | Rate | |
First $250 million | | | 0.935% | |
Next $250 million | | | 0.910% | |
Next $500 million | | | 0.885% | |
Next $1.5 billion | | | 0.860% | |
Next $2.5 billion | | | 0.835% | |
Next $2.5 billion | | | 0.810% | |
Next $2.5 billion | | | 0.785% | |
Over $10 billion | | | 0.760% | |
For the year ended October 31, 2015, the effective advisory fees incurred by the Fund was 0.94%.
Under the terms of a master sub-advisory agreement between the Adviser and each of Invesco Asset Management Deutschland GmbH, Invesco Asset Management Limited, Invesco Asset Management (Japan) Limited, Invesco Hong Kong Limited, Invesco Senior Secured Management, Inc., Invesco Canada Ltd. and Invesco PowerShares Capital Management LLC (collectively, the “Affiliated Sub-Advisers”) the Adviser, not the Fund, may pay 40% of the fees paid to the Adviser to any such Affiliated Sub-Adviser(s) that provide(s) discretionary investment management services to the Fund based on the percentage of assets allocated to such Affiliated Sub-Adviser(s).
The Adviser has contractually agreed, through at least February 28, 2017, to waive advisory fees and/or reimburse expenses to the extent necessary to limit total annual fund operating expenses after fee waiver and/or expense reimbursement (excluding certain items discussed below) of Class A, Class C, Class R, Class Y, Class R5 and Class R6 shares to 1.72%, 2.47%, 1.97%, 1.47%, 1.47% and 1.47% of average daily net assets, respectively. In determining the Adviser’s obligation to waive advisory fees and/or reimburse expenses, the following expenses are not taken into account, and could cause total annual fund operating expenses after fee waiver and/or expense reimbursement to exceed the numbers reflected above: (1) interest; (2) taxes; (3) dividend expense on short sales; (4) extraordinary or non-routine items, including litigation expenses; and (5) expenses that the Fund has incurred but did not actually pay because of an expense offset arrangement. Unless Invesco continues the fee waiver agreement, it will terminate on February 28, 2017. The fee waiver agreement cannot be terminated during its term.
Further, the Adviser has contractually agreed, through at least June 30, 2017, to waive the advisory fee payable by the Fund in an amount equal to 100% of the net advisory fees the Adviser receives from the affiliated money market funds on investments by the Fund of uninvested cash (excluding investments of cash collateral from securities lending) in such affiliated money market funds.
For the year ended October 31, 2015, the Adviser waived advisory fees and reimbursed fund level expenses of $225,344 and reimbursed class level expenses of $1,756, $76, $25, $1,628, $10 and $7 of Class A, Class C, Class R, Class Y, Class R5 and Class R6 shares, respectively.
The Trust has entered into a master administrative services agreement with Invesco pursuant to which the Fund has agreed to pay Invesco for certain administrative costs incurred in providing accounting services to the Fund. For the year ended October 31, 2015, expenses incurred under the agreement are shown in the Statement of Operations as Administrative services fees.
The Trust has entered into a transfer agency and service agreement with Invesco Investment Services, Inc. (“IIS”) pursuant to which the Fund has agreed to pay IIS a fee for providing transfer agency and shareholder services to the Fund and reimburse IIS for certain expenses incurred by IIS in the course of providing such services. IIS may make payments to intermediaries that provide omnibus account services, sub-accounting services and/or networking services. All fees payable by IIS to intermediaries that provide omnibus account services or sub-accounting are charged back to the Fund, subject to certain limitations approved by the Trust’s Board of Trustees. For the year ended October 31, 2015, expenses incurred under the agreement are shown in the Statement of Operations as Transfer agent fees.
16 Invesco Low Volatility Emerging Markets Fund
The Trust has entered into master distribution agreements with Invesco Distributors, Inc. (“IDI”) to serve as the distributor for the Class A, Class C, Class R, Class Y, Class R5 and Class R6 shares of the Fund. The Trust has adopted plans pursuant to Rule 12b-1 under the 1940 Act with respect to the Fund’s Class A, Class C and Class R shares (collectively the “Plans”). The Fund, pursuant to the Plans, pays IDI compensation at the annual rate of 0.25% of the Fund’s average daily net assets of Class A shares, 1.00% of the average daily net assets of Class C shares and 0.50% of the average daily net assets of Class R shares. Of the Plan payments, up to 0.25% of the average daily net assets of each class of shares may be paid to furnish continuing personal shareholder services to customers who purchase and own shares of such classes. Any amounts not paid as a service fee under the Plans would constitute an asset-based sales charge. Rules of the Financial Industry Regulatory Authority (“FINRA”) impose a cap on the total sales charges, including asset-based sales charges, that may be paid by any class of shares of the Fund. For the year ended October 31, 2015, expenses incurred under the Plans are shown in the Statement of Operations as Distribution fees.
Front-end sales commissions and CDSC (collectively, the “sales charges”) are not recorded as expenses of the Fund. Front-end sales commissions are deducted from proceeds from the sales of Fund shares prior to investment in Class A shares of the Fund. CDSC are deducted from redemption proceeds prior to remittance to the shareholder. During the year ended October 31, 2015, IDI advised the Fund that IDI retained $1,202 in front-end sales commissions from the sale of Class A shares.
Certain officers and trustees of the Trust are officers and directors of the Adviser, IIS and/or IDI.
NOTE 3—Additional Valuation Information
GAAP defines fair value as the price that would be received to sell an asset or paid to transfer a liability in an orderly transaction between market participants at the measurement date, under current market conditions. GAAP establishes a hierarchy that prioritizes the inputs to valuation methods, giving the highest priority to readily available unadjusted quoted prices in an active market for identical assets (Level 1) and the lowest priority to significant unobservable inputs (Level 3), generally when market prices are not readily available or are unreliable. Based on the valuation inputs, the securities or other investments are tiered into one of three levels. Changes in valuation methods may result in transfers in or out of an investment’s assigned level:
| | Level 1 — | Prices are determined using quoted prices in an active market for identical assets. |
| | Level 2 — | Prices are determined using other significant observable inputs. Observable inputs are inputs that other market participants may use in pricing a security. These may include quoted prices for similar securities, interest rates, prepayment speeds, credit risk, yield curves, loss severities, default rates, discount rates, volatilities and others. |
| | Level 3 — | Prices are determined using significant unobservable inputs. In situations where quoted prices or observable inputs are unavailable (for example, when there is little or no market activity for an investment at the end of the period), unobservable inputs may be used. Unobservable inputs reflect the Fund’s own assumptions about the factors market participants would use in determining fair value of the securities or instruments and would be based on the best available information. |
The following is a summary of the tiered valuation input levels, as of October 31, 2015. The level assigned to the securities valuations may not be an indication of the risk or liquidity associated with investing in those securities. Because of the inherent uncertainties of valuation, the values reflected in the financial statements may materially differ from the value received upon actual sale of those investments.
During the year ended October 31, 2015, there were transfers from Level 1 to Level 2 of $445,730 and from Level 2 to Level 1 of $136,897, due to foreign fair value adjustments.
| | | | | | | | | | | | | | | | |
| | | Level 1 | | | Level 2 | | | Level 3 | | | Total | |
Brazil | | $ | 285,303 | | | $ | — | | | $ | — | | | $ | 285,303 | |
Chile | | | 124,635 | | | | — | | | | — | | | | 124,635 | |
China | | | — | | | | 164,192 | | | | — | | | | 164,192 | |
Colombia | | | 26,052 | | | | — | | | | — | | | | 26,052 | |
India | | | 61,507 | | | | 178,185 | | | | — | | | | 239,692 | |
Indonesia | | | — | | | | 98,793 | | | | — | | | | 98,793 | |
Malaysia | | | 49,429 | | | | 57,136 | | | | — | | | | 106,565 | |
Mexico | | | 302,644 | | | | — | | | | — | | | | 302,644 | |
Poland | | | — | | | | 96,176 | | | | — | | | | 96,176 | |
Russia | | | 63,767 | | | | 137,704 | | | | — | | | | 201,471 | |
South Africa | | | 124,343 | | | | 212,729 | | | | — | | | | 337,072 | |
South Korea | | | 113,914 | | | | 384,107 | | | | — | | | | 498,021 | |
Taiwan | | | — | | | | 362,200 | | | | — | | | | 362,200 | |
Thailand | | | — | | | | 22,117 | | | | — | | | | 22,117 | |
Turkey | | | 129,782 | | | | — | | | | — | | | | 129,782 | |
United Arab Emirates | | | 17,910 | | | | 11,161 | | | | — | | | | 29,071 | |
United States | | | 47,041 | | | | — | | | | — | | | | 47,041 | |
| | | | 1,346,327 | | | | 1,724,500 | | | | — | | | | 3,070,827 | |
Futures Contracts* | | | 6,070 | | | | — | | | | — | | | | 6,070 | |
Total Investments | | $ | 1,352,397 | | | $ | 1,724,500 | | | $ | — | | | $ | 3,076,897 | |
| * | Unrealized appreciation. |
17 Invesco Low Volatility Emerging Markets Fund
NOTE 4—Derivative Investments
Value of Derivative Investments at Period-End
The table below summarizes the value of the Fund’s derivative investments, detailed by primary risk exposure, held as of October 31, 2015:
| | | | | | | | |
| | | Value | |
| Risk Exposure/Derivative Type | | Assets | | | Liabilities | |
Equity risk: | | | | | | | | |
Futures contracts(a) | | $ | 6,070 | | | $ | — | |
| (a) | Includes cumulative appreciation of futures contracts. Only current day’s variation margin receivable is reported within the Statement of Assets and Liabilities. |
The table below summarizes the gains (losses) on derivative investments, detailed by primary risk exposure, recognized in earnings during the period:
| | | | |
| | | Location of Gain (Loss) on
Statement of Operations | |
| | | Futures
Contracts | |
Realized Gain (Loss): | | | | |
Equity risk | | $ | (26,651 | ) |
Change in Net Unrealized Appreciation: | | | | |
Equity risk | | | 6,560 | |
Total | | $ | (20,091 | ) |
The table below summarizes the average notional value of futures contracts outstanding during the period.
| | | | |
| | | Futures
Contracts | |
Average notional value | | $ | 135,803 | |
| | | | | | | | | | | | | | | | | | | | |
| Open Futures Contracts(a) | |
| Futures Contracts | | Type of
Contract | | | Number of
Contracts | | | Expiration
Month | | | Notional
Value | | | Unrealized
Appreciation | |
MSCI Emerging Markets Mini Index | | | Long | | | | 3 | | | | December-2015 | | | $ | 126,555 | | | $ | 6,070 | |
| (a) | Futures contracts collateralized by $6,300 cash held with Merrill Lynch, the futures commission merchant. |
NOTE 5—Trustees’ and Officers’ Fees and Benefits
Trustees’ and Officers’ Fees and Benefits include amounts accrued by the Fund to pay remuneration to certain Trustees and Officers of the Fund. Trustees have the option to defer compensation payable by the Fund, and Trustees’ and Officers’ Fees and Benefits also include amounts accrued by the Fund to fund such deferred compensation amounts. Those Trustees who defer compensation have the option to select various Invesco Funds in which their deferral accounts shall be deemed to be invested. Obligations under the deferred compensation plan represent unsecured claims against the general assets of the Fund.
NOTE 6—Cash Balances
The Fund is permitted to temporarily carry a negative or overdrawn balance in its account with State Street Bank and Trust Company, the custodian bank. Such balances, if any at period end, are shown in the Statement of Assets and Liabilities under the payable caption Amount due custodian. To compensate the custodian bank for such overdrafts, the overdrawn Fund may either (1) leave funds as a compensating balance in the account so the custodian bank can be compensated by earning the additional interest; or (2) compensate by paying the custodian bank at a rate agreed upon by the custodian bank and Invesco, not to exceed the contractually agreed upon rate.
18 Invesco Low Volatility Emerging Markets Fund
NOTE 7—Distributions to Shareholders and Tax Components of Net Assets
Tax Character of Distributions to Shareholders Paid During the Fiscal Year Ended October 31, 2015 and the period December 17, 2013 (commencement date) though October 31, 2014:
| | | | | | | | |
| | | 2015 | | | December 17, 2013
(commencement date) through
October 31,
2014 | |
Ordinary income | | $ | 174,171 | | | $ | — | |
Long-term capital gain | | | 5,026 | | | | — | |
Total distributions | | $ | 179,197 | | | $ | — | |
Tax Components of Net Assets at Period-End:
| | | | |
| | | 2015 | |
Undistributed ordinary income | | $ | 18,554 | |
Net unrealized appreciation (depreciation) — investments | | | (423,476 | ) |
Net unrealized appreciation (depreciation) — other investments | | | (1,818 | ) |
Temporary book/tax differences | | | (3,981 | ) |
Capital loss carryforward | | | (318,943 | ) |
Shares of beneficial interest | | | 3,905,161 | |
Total net assets | | $ | 3,175,497 | |
The difference between book-basis and tax-basis unrealized appreciation (depreciation) is due to differences in the timing of recognition of gains and losses on investments for tax and book purposes. The Fund’s net unrealized appreciation (depreciation) difference is attributable primarily to wash sales.
The temporary book/tax differences are a result of timing differences between book and tax recognition of income and/or expenses. The Fund’s temporary book/tax differences are the result of the trustee deferral of compensation and retirement plan benefits.
Capital loss carryforward is calculated and reported as of a specific date. Results of transactions and other activity after that date may affect the amount of capital loss carryforward actually available for the Fund to utilize. The ability to utilize capital loss carryforward in the future may be limited under the Internal Revenue Code and related regulations based on the results of future transactions.
The Fund has a capital loss carryforward as of October 31, 2015, which expires as follows:
| | | | | | | | | | | | |
| Capital Loss Carryforward* | |
| Expiration | | Short-Term | | | Long-Term | | | Total | |
Not subject to expiration | | $ | 195,111 | | | $ | 123,832 | | | $ | 318,943 | |
| * | Capital loss carryforward as of the date listed above is reduced for limitations, if any, to the extent required by the Internal Revenue Code and may be further limited depending upon a variety of factors, including the realization of net unrealized gains or losses as of the date of any reorganization. |
NOTE 8—Investment Securities
The aggregate amount of investment securities (other than short-term securities, U.S. Treasury obligations and money market funds, if any) purchased and sold by the Fund during the year ended October 31, 2015 was $3,740,165 and $3,631,469, respectively. In a fund’s initial year of operations, the cost of investments for tax purposes will not reflect any tax adjustments until its fiscal year end reporting period.
| | | | |
| Unrealized Appreciation (Depreciation) of Investment Securities on a Tax Basis | |
Aggregate unrealized appreciation of investment securities | | $ | 185,514 | |
Aggregate unrealized (depreciation) of investment securities | | | (608,990 | ) |
Net unrealized appreciation (depreciation) of investment securities | | $ | (423,476 | ) |
Cost of investments for tax purposes is $3,494,303.
NOTE 9—Reclassification of Permanent Differences
Primarily as a result of differing book/tax treatment of passive foreign investment company reclasses and foreign currency transactions, on October 31, 2015, undistributed net investment income was decreased by $22,027, undistributed net realized gain (loss) was increased by $22,803 and shares of beneficial interest was decreased by $776. This reclassification had no effect on the net assets of the Fund.
19 Invesco Low Volatility Emerging Markets Fund
NOTE 10—Share Information
| | | | | | | | | | | | | | | | |
| | | Summary of Share Activity | |
| | | Year ended
October 31, 2015(a) | | | December 17, 2013
(commencement date) through
October 31, 2014 | |
| | | Shares | | | Amount | | | Shares | | | Amount | |
Sold: | | | | | | | | | | | | | | | | |
Class A | | | 145,238 | | | $ | 1,412,907 | | | | 206,424 | | | $ | 2,131,506 | |
Class C | | | 6,179 | | | | 59,078 | | | | 5,851 | | | | 62,593 | |
Class R | | | 1,391 | | | | 13,595 | | | | 1,361 | | | | 13,730 | |
Class Y | | | 113,987 | | | | 1,037,476 | | | | 143,538 | | | | 1,436,470 | |
Class R5 | | | — | | | | — | | | | 46,638 | | | | 456,961 | |
Class R6 | | | — | | | | — | | | | 15,001 | | | | 150,010 | |
| | | | |
Issued as reinvestment of dividends: | | | | | | | | | | | | | | | | |
Class A | | | 1,508 | | | | 13,720 | | | | — | | | | — | |
Class C | | | 288 | | | | 2,611 | | | | — | | | | — | |
Class R | | | 67 | | | | 610 | | | | — | | | | — | |
Class Y | | | 126 | | | | 1,146 | | | | — | | | | — | |
Class R5 | | | 1,686 | | | | 15,338 | | | | — | | | | — | |
| | | | |
Reacquired: | | | | | | | | | | | | | | | | |
Class A | | | (122,441 | ) | | | (1,139,784 | ) | | | (41,260 | ) | | | (447,921 | ) |
Class C | | | (6,888 | ) | | | (56,357 | ) | | | (274 | ) | | | (2,778 | ) |
Class Y | | | (85,388 | ) | | | (825,975 | ) | | | (7,214 | ) | | | (73,678 | ) |
Class R5 | | | (32,778 | ) | | | (300,901 | ) | | | (545 | ) | | | (5,636 | ) |
Net increase in share activity | | | 22,975 | | | $ | 233,464 | | | | 369,520 | | | $ | 3,721,257 | |
| (a) | 84% of the outstanding shares of the Fund are owned by the Adviser. |
NOTE 11—Financial Highlights
The following schedule presents financial highlights for a share of the Fund outstanding throughout the periods indicated.
| | | | | | | | | | | | | | | | | | | | | | | | | | | | | | | | | | | | | | | | | | | | | | | | | | | | | | | | |
| | | Net asset
value,
beginning
of period | | | Net
investment
income(a) | | | Net gains
(losses)
on securities
(both
realized and
unrealized) | | | Total from
investment
operations | | | Dividends
from net
investment
income | | | Distributions
from net
realized
gains | | | Total
distributions | | | Net asset
value, end
of period | | | Total
return(b) | | | Net assets,
end of period
(000’s omitted) | | | Ratio of
expenses
to average
net assets
with fee waivers
and/or expenses
absorbed | | | Ratio of
expenses
to average net
assets without
fee waivers
and/or expenses
absorbed | | | Ratio of net
investment
income
to average
net assets | | | Portfolio
turnover(c) | |
Class A | |
Year ended 10/31/15 | | $ | 10.32 | | | $ | 0.14 | | | $ | (1.91 | ) | | $ | (1.77 | ) | | $ | (0.35 | ) | | $ | (0.12 | ) | | $ | (0.47 | ) | | $ | 8.08 | | | | (17.67 | )% | | $ | 1,531 | | | | 1.72 | %(e) | | | 7.99 | %(e) | | | 1.52 | %(e) | | | 105 | % |
Year ended 10/31/14(d) | | | 10.00 | | | | 0.15 | | | | 0.17 | | | | 0.32 | | | | — | | | | — | | | | — | | | | 10.32 | | | | 3.20 | | | | 1,705 | | | | 1.71 | (f) | | | 10.36 | (f) | | | 1.69 | (f) | | | 38 | |
Class C | | | | | | | | | | | | | | | | | | | | | | | | | | | | | | | | | | | | | | | | | | | | | | | | | | | | | | | | |
Year ended 10/31/15 | | | 10.26 | | | | 0.07 | | | | (1.90 | ) | | | (1.83 | ) | | | (0.31 | ) | | | (0.12 | ) | | | (0.43 | ) | | | 8.00 | | | | (18.29 | ) | | | 41 | | | | 2.47 | (e) | | | 8.74 | (e) | | | 0.77 | (e) | | | 105 | |
Year ended 10/31/14(d) | | | 10.00 | | | | 0.09 | | | | 0.17 | | | | 0.26 | | | | — | | | | — | | | | — | | | | 10.26 | | | | 2.60 | | | | 57 | | | | 2.46 | (f) | | | 11.11 | (f) | | | 0.94 | (f) | | | 38 | |
Class R | |
Year ended 10/31/15 | | | 10.30 | | | | 0.12 | | | | (1.90 | ) | | | (1.78 | ) | | | (0.34 | ) | | | (0.12 | ) | | | (0.46 | ) | | | 8.06 | | | | (17.81 | ) | | | 23 | | | | 1.97 | (e) | | | 8.24 | (e) | | | 1.27 | (e) | | | 105 | |
Year ended 10/31/14(d) | | | 10.00 | | | | 0.13 | | | | 0.17 | | | | 0.30 | | | | — | | | | — | | | | — | | | | 10.30 | | | | 3.00 | | | | 14 | | | | 1.96 | (f) | | | 10.61 | (f) | | | 1.44 | (f) | | | 38 | |
Class Y | |
Year ended 10/31/15 | | | 10.35 | | | | 0.16 | | | | (1.92 | ) | | | (1.76 | ) | | | (0.37 | ) | | | (0.12 | ) | | | (0.49 | ) | | | 8.10 | | | | (17.50 | ) | | | 1,337 | | | | 1.47 | (e) | | | 7.74 | (e) | | | 1.77 | (e) | | | 105 | |
Year ended 10/31/14(d) | | | 10.00 | | | | 0.18 | | | | 0.17 | | | | 0.35 | | | | — | | | | — | | | | — | | | | 10.35 | | | | 3.50 | | | | 1,411 | | | | 1.46 | (f) | | | 10.11 | (f) | | | 1.94 | (f) | | | 38 | |
Class R5 | |
Year ended 10/31/15 | | | 10.35 | | | | 0.16 | | | | (1.92 | ) | | | (1.76 | ) | | | (0.37 | ) | | | (0.12 | ) | | | (0.49 | ) | | | 8.10 | | | | (17.50 | ) | | | 122 | | | | 1.47 | (e) | | | 7.64 | (e) | | | 1.77 | (e) | | | 105 | |
Year ended 10/31/14(d) | | | 10.00 | | | | 0.18 | | | | 0.17 | | | | 0.35 | | | | — | | | | — | | | | — | | | | 10.35 | | | | 3.50 | | | | 477 | | | | 1.46 | (f) | | | 10.06 | (f) | | | 1.94 | (f) | | | 38 | |
Class R6 | |
Year ended 10/31/15 | | | 10.35 | | | | 0.16 | | | | (1.92 | ) | | | (1.76 | ) | | | (0.37 | ) | | | (0.12 | ) | | | (0.49 | ) | | | 8.10 | | | | (17.50 | ) | | | 122 | | | | 1.47 | (e) | | | 7.64 | (e) | | | 1.77 | (e) | | | 105 | |
Year ended 10/31/14(d) | | | 10.00 | | | | 0.18 | | | | 0.17 | | | | 0.35 | | | | — | | | | — | | | | — | | | | 10.35 | | | | 3.50 | | | | 155 | | | | 1.46 | (f) | | | 10.06 | (f) | | | 1.94 | (f) | | | 38 | |
| (a) | Calculated using average shares outstanding. |
| (b) | Includes adjustments in accordance with accounting principles generally accepted in the United States of America and as such, the net asset value for financial reporting purposes and the returns based upon those net asset values may differ from the net asset value and returns for shareholder transactions. Does not include sales charges and is not annualized for periods less than one year, if applicable. |
| (c) | Portfolio turnover is calculated at the fund level and is not annualized for periods less than one year, if applicable. |
| (d) | Commencement date of December 17, 2013. |
| (e) | Ratios are based on average daily net assets (000’s omitted) of $1,681, $73, $24, $1,559, $181 and $137 for Class A, Class C, Class R, Class Y, Class R5 and Class R6 shares, respectively. |
20 Invesco Low Volatility Emerging Markets Fund
Report of Independent Registered Public Accounting Firm
To the Board of Trustees of AIM Investment Funds (Invesco Investment Funds)
and Shareholders of Invesco Low Volatility Emerging Markets Fund:
In our opinion, the accompanying statement of assets and liabilities, including the schedule of investments, and the related statements of operations and of changes in net assets and the financial highlights present fairly, in all material respects, the financial position of Invesco Low Volatility Emerging Markets Fund (one of the funds constituting AIM Investment Funds (Invesco Investment Funds), hereafter referred to as the “Fund”) at October 31, 2015, the results of its operations for the year then ended, the changes in its net assets and the financial highlights for the year then ended and for the period December 17, 2013 (commencement of operations) through October 31, 2014, in conformity with accounting principles generally accepted in the United States of America. These financial statements and financial highlights (hereafter referred to as “financial statements”) are the responsibility of the Fund’s management. Our responsibility is to express an opinion on these financial statements based on our audits. We conducted our audits of these financial statements in accordance with the standards of the Public Company Accounting Oversight Board (United States). Those standards require that we plan and perform the audit to obtain reasonable assurance about whether the financial statements are free of material misstatement. An audit includes examining, on a test basis, evidence supporting the amounts and disclosures in the financial statements, assessing the accounting principles used and significant estimates made by management, and evaluating the overall financial statement presentation. We believe that our audits, which included confirmation of securities at October 31, 2015 by correspondence with the custodian and brokers, provide a reasonable basis for our opinion.
PRICEWATERHOUSECOOPERS LLP
December 23, 2015
Houston, Texas
21 Invesco Low Volatility Emerging Markets Fund
Calculating your ongoing Fund expenses
Example
As a shareholder of the Fund, you incur two types of costs: (1) transaction costs, which may include sales charges (loads) on purchase payments or contingent deferred sales charges on redemptions, if any; and (2) ongoing costs, including management fees, distribution and/or service (12b-1) fees, and other Fund expenses. This example is intended to help you understand your ongoing costs (in dollars) of investing in the Fund and to compare these costs with ongoing costs of investing in other mutual funds. The example is based on an investment of $1,000 invested at the beginning of the period and held for the entire period May 1, 2015 through October 31, 2015.
Actual expenses
The table below provides information about actual account values and actual expenses. You may use the information in this table, together with the amount you invested, to estimate the expenses that you paid over the period. Simply divide your account value by $1,000 (for example, an $8,600 account value divided by $1,000 = 8.6), then multiply the result by the number in the table under the heading entitled “Actual Expenses Paid During Period” to estimate the expenses you paid on your account during this period.
Hypothetical example for comparison purposes
The table below also provides information about hypothetical account values and hypothetical expenses based on the Fund’s actual expense ratio and an assumed rate of return of 5% per year before expenses, which is not the Fund’s actual return.
The hypothetical account values and expenses may not be used to estimate the actual ending account balance or expenses you paid for the period. You may use this information to compare the ongoing costs of investing in the Fund and other funds. To do so, compare this 5% hypothetical example with the 5% hypothetical examples that appear in the shareholder reports of the other funds.
Please note that the expenses shown in the table are meant to highlight your ongoing costs only and do not reflect any transaction costs, such as sales charges (loads) on purchase payments or contingent deferred sales charges on redemptions, if any. Therefore, the hypothetical information is useful in comparing ongoing costs only, and will not help you determine the relative total costs of owning different funds. In addition, if these transaction costs were included, your costs would have been higher.
| | | | | | | | | | | | | | | | | | | | | | | | |
| Class | | Beginning
Account Value
(05/01/15) | | | ACTUAL | | | HYPOTHETICAL
(5% annual return before
expenses) | | | Annualized
Expense
Ratio | |
| | | Ending
Account Value
(10/31/15)1 | | | Expenses
Paid During
Period2 | | | Ending
Account Value
(10/31/15) | | | Expenses
Paid During
Period2 | | |
| A | | $ | 1,000.00 | | | $ | 818.60 | | | $ | 7.88 | | | $ | 1,016.53 | | | $ | 8.74 | | | | 1.72 | % |
| C | | | 1,000.00 | | | | 816.30 | | | | 11.31 | | | | 1,012.75 | | | | 12.53 | | | | 2.47 | |
| R | | | 1,000.00 | | | | 818.30 | | | | 9.03 | | | | 1,015.27 | | | | 10.01 | | | | 1.97 | |
| Y | | | 1,000.00 | | | | 819.80 | | | | 6.74 | | | | 1,017.80 | | | | 7.48 | | | | 1.47 | |
| R5 | | | 1,000.00 | | | | 819.80 | | | | 6.75 | | | | 1,017.79 | | | | 7.49 | | | | 1.47 | |
| R6 | | | 1,000.00 | | | | 819.80 | | | | 6.75 | | | | 1,017.79 | | | | 7.49 | | | | 1.47 | |
| 1 | The actual ending account value is based on the actual total return of the Fund for the period May 1, 2015 through October 31, 2015, after actual expenses and will differ from the hypothetical ending account value which is based on the Fund’s expense ratio and a hypothetical annual return of 5% before expenses. |
| 2 | Expenses are equal to the Fund’s annualized expense ratio as indicated above multiplied by the average account value over the period, multiplied by 184/365 to reflect the most recent fiscal half year. |
22 Invesco Low Volatility Emerging Markets Fund
Approval of Investment Advisory and Sub-Advisory Contracts
The Board of Trustees (the Board) of AIM Investment Funds (Invesco Investment Funds) is required under the Investment Company Act of 1940, as amended, to approve annually the renewal of Invesco Low Volatility Emerging Markets Fund’s (the Fund) investment advisory agreements. During contract renewal meetings held on June 9-10, 2015, the Board as a whole, and the disinterested or “independent” Trustees, who comprise over 75% of the Board, voting separately, approved the continuance for the Fund of the Master Investment Advisory Agreement with Invesco Advisers, Inc. (Invesco Advisers and the investment advisory agreement) and the Master Intergroup Sub-Advisory Contract for Mutual Funds with Invesco Asset Management Deutschland GmbH, Invesco Asset Management Limited, Invesco Asset Management (Japan) Limited, Invesco Hong Kong Limited, Invesco Senior Secured Management, Inc., Invesco Canada Ltd. and Invesco PowerShares Capital Management LLC (collectively, the Affiliated Sub-Advisers and the sub-advisory contracts) for another year, effective July 1, 2015.
In evaluating the fairness and reasonableness of compensation under the Fund’s investment advisory agreement and sub-advisory contracts, the Board considered, among other things, the factors discussed below. The Board determined that continuation of the Fund’s investment advisory agreement and the sub-advisory contracts is in the best interest of the Fund and its shareholders and that the compensation payable to Invesco Advisers and the Affiliated Sub-Advisers under the agreements is fair and reasonable.
The Board’s Fund Evaluation Process
The Board’s Investments Committee has established three Sub-Committees, each of which is primarily responsible for overseeing the performance and investment management services provided by Invesco Advisers and the Affiliated Sub-Advisers to a number of the funds advised by Invesco Advisers (the Invesco Funds). The Sub-Committees meet throughout the year to review the performance of their assigned Invesco Funds, including reviewing materials prepared under the direction of the independent Senior Officer, an officer of the Invesco Funds who reports directly to the independent Trustees. Over the course of each year, the Sub-Committees meet with portfolio managers for their assigned Invesco Funds and other members of management to review the performance, investment objective(s), policies, strategies, limitations and investment risks of these funds. The Board had the benefit of reports from the Sub-Committees and Investments Committee throughout the year in considering approval of the continuance of each Invesco Fund’s investment advisory agreement and sub-advisory contracts for another year.
During the contract renewal process, the Board receives comparative performance and fee data regarding the Invesco Funds prepared by Invesco Advisers and Lipper Inc. (Lipper), an independent provider of investment company data. The Board also receives a report and this independent written evaluation from the Senior Officer. The Senior Officer’s evaluation is prepared as part of his responsibility to manage the process by which the Invesco Funds’ proposed management fees are negotiated during the annual contract renewal process to ensure they are negotiated in a manner that is at arms’ length and reasonable. In addition to meetings with Invesco Advisers and fund counsel, the independent Trustees also discuss the continuance of the investment advisory agreement and sub-advisory contracts in separate sessions with the Senior Officer and with independent legal counsel.
The Trustees recognized that the advisory fee rates for the Invesco Funds are, in many cases, the result of years of review and negotiation. The Trustees’ deliberations and conclusions in a particular year may be based in part on their deliberations and conclusions regarding these arrangements throughout the year and in prior years. The Trustees’ review and conclusions are based on the comprehensive consideration of all information presented to them and are not the result of any single determinative factor. Moreover, one Trustee may have weighed a particular piece of information or factor differently than another Trustee.
The discussion below is a summary of the Senior Officer’s independent written evaluation with respect to the Fund’s investment advisory agreement as well as a discussion of the material factors and related conclusions that formed the basis for the Board’s approval of the Fund’s investment advisory agreement and sub-advisory contracts. Unless otherwise stated, this information is current as of June 10, 2015, and does not reflect consideration of factors that became known to the Board after that date.
Factors and Conclusions and Summary of Independent Written Fee Evaluation
| A. | Nature, Extent and Quality of Services Provided by Invesco Advisers and the Affiliated Sub-Advisers |
The Board reviewed the advisory services provided to the Fund by Invesco Advisers under the Fund’s investment advisory agreement, the performance of Invesco Advisers in providing these services, and the credentials and experience of the officers and employees of Invesco Advisers who provide these services, including the Fund’s portfolio manager or managers. The Board’s review of the qualifications of Invesco Advisers to provide advisory services included the Board’s consideration of Invesco Advisers’ investment process oversight, independent credit analysis
and investment risk management. The Board also considered non-advisory services that Invesco Advisers and its affiliates provide to the Invesco Funds such as various back office support functions, equity and fixed income trading operations, internal audit, distribution, valuation and legal and compliance.
In determining whether to continue the Fund’s investment advisory agreement, the Board considered the benefits of reapproving an existing relationship and the greater uncertainty that may be associated with entering into a new relationship. The Board concluded that the nature, extent and quality of the services provided to the Fund by Invesco Advisers are appropriate and satisfactory and consistent with the terms of the Fund’s investment advisory agreement.
The Board reviewed the services that may be provided by the Affiliated Sub-Advisers under the sub-advisory contracts and the credentials and experience of the officers and employees of the Affiliated Sub-Advisers who provide these services. The Board noted that the Affiliated Sub-Advisers have offices and personnel that are located in financial centers around the world. As a result, the Affiliated Sub-Advisers can provide research and investment analysis on the markets and economies of various countries in which the Fund may invest, make recommendations regarding securities and assist with security trades. The Board concluded that the sub-advisory contracts benefit the Fund and its shareholders by permitting Invesco Advisers to use the resources and talents of the Affiliated Sub-Advisers in managing the Fund. The Board concluded that the nature, extent and quality of the services that may be provided by the Affiliated Sub-Advisers are appropriate and satisfactory and consistent with the terms of the Fund’s sub-advisory contracts.
The Board noted that Invesco Asset Management Deutschland GmbH currently manages assets of the Fund. The Board also noted that the Fund recently began operations and that no comparative performance data was available.
| C. | Advisory and Sub-Advisory Fees |
The Board noted that the Fund had not been in operation long enough to become profitable and that Invesco Advisers was continuing to take entrepreneurial risk in operating the Fund.
The Board noted that Invesco Advisers has contractually agreed to waive fees and/or limit expenses of the Fund through at least February 29, 2016 in an amount necessary to limit total annual operating expenses to a specified percentage of average daily net assets for each class of the Fund.
The Board noted that Invesco Advisers and the Affiliated Sub-Advisers do not manage other mutual funds or client accounts with investment strategies comparable to those of the Fund.
23 Invesco Low Volatility Emerging Markets Fund
The Board also considered the services that may be provided by the Affiliated Sub-Advisers pursuant to the sub-advisory contracts, as well as the fees payable by Invesco Advisers to the Affiliated Sub-Advisers pursuant to the sub-advisory contracts. The Board noted that Invesco Advisers retains overall responsibility for, and provides services to, sub-advised Invesco Funds, including oversight of the Affiliated Sub-Advisers as well as the additional services described herein other than day-to-day portfolio management. The Board also noted that the sub-advisory fees are not paid directly by the Fund, but rather, are payable by Invesco Advisers to the Affiliated Sub-Advisers.
| D. | Economies of Scale and Breakpoints |
The Board considered the extent to which there are economies of scale in the provision of advisory services to the Fund. The Board also considered whether the Fund benefits from economies of scale through contractual breakpoints in the Fund’s advisory fee schedule. The Board also noted that the Fund shares directly in economies of scale through lower fees charged by third party service providers based on the combined size of the Invesco Funds and other clients advised by Invesco Advisers.
| E. | Profitability and Financial Resources |
The Board reviewed information from Invesco Advisers concerning the costs of the advisory and other services that Invesco Advisers and its affiliates provide to the Fund and the Invesco Funds and the profitability of Invesco Advisers and its affiliates in providing these services. The Board received information from Invesco Advisers about the methodology used to prepare the profitability information. The Board noted that Invesco Advisers continues to operate at a net profit from services Invesco Advisers and its affiliates provide to the Invesco Funds. The Board noted that although Invesco Advisers received a minimal amount of revenues from advising the Fund, Invesco Advisers and its subsidiaries did not make a profit from managing the Fund. The Board received and accepted information from Invesco Advisers demonstrating that Invesco Advisers and each Affiliated Sub-Adviser are financially sound and have the resources necessary to perform their obligations under the investment advisory agreement and sub-advisory contracts.
| F. | Collateral Benefits to Invesco Advisers and its Affiliates |
The Board considered various other benefits received by Invesco Advisers and its affiliates from the relationship with the Fund, including the fees received for providing transfer agency and distribution services to the Fund. The Board considered the performance of Invesco Advisers and its affiliates in providing these services and the organizational structure employed to provide these services. The Board also considered that these services are provided to the Fund pursuant to written contracts that are reviewed and approved on an annual basis by the Board; and that the services are required for the operation of the Fund.
The Board considered the benefits realized by Invesco Advisers and the Affiliated Sub-Advisers as a result of portfolio brokerage transactions executed through “soft dollar” arrangements. The Board noted that soft dollar arrangements shift the payment obligation for research services from Invesco Advisers and the Affiliated Sub-Advisers to the Invesco Funds and that the research received may be used with other clients of Invesco Advisers and may reduce Invesco Advisers’ and the Affiliated Sub-Advisers’ expenses. The Board also considered that it receives periodic reports from the Chief Compliance Officer of the Invesco Funds demonstrating that these arrangements are consistent with regulatory requirements. The Board did not deem the soft dollar arrangements to be inappropriate.
The Board considered that the Fund’s uninvested cash and cash collateral from any securities lending arrangements may be invested in money market funds advised by Invesco Advisers pursuant to procedures approved by the Board. The Board noted that Invesco Advisers receives advisory fees from these affiliated money market funds attributable to such investments, although Invesco Advisers has contractually agreed to waive through varying periods the advisory fees payable by the Invesco Funds with respect to investments in the affiliated money market funds. The waiver is in an amount equal to 100% of the net advisory fee Invesco Advisers receives from the affiliated money market funds with respect to the Fund’s investment in the affiliated money market funds of uninvested cash, but not cash collateral. The Board concluded that the amount of advisory fees received by Invesco Advisors from the Fund’s investment of cash collateral from any securities lending arrangements in the affiliated money market funds is fair and reasonable.
The Board also considered the Fund may use an affiliated broker to execute certain trades for the Fund to, among other things, control information leakage, and were advised that such trades would be executed in compliance with rules under the Investment Company Act of 1940, as amended, and consistent with best execution obligations.
24 Invesco Low Volatility Emerging Markets Fund
Tax Information
Form 1099-DIV, Form 1042-S and other year-end tax information provide shareholders with actual calendar year amounts that should be included in their tax returns. Shareholders should consult their tax advisors.
The following distribution information is being provided as required by the Internal Revenue Code or to meet a specific state’s requirement.
The Fund designates the following amounts or, if subsequently determined to be different, the maximum amount allowable for its fiscal year ended October 31, 2015:
| | | | |
Federal and State Income Tax | |
Long-Term Capital Gain Distributions | | $ | 5,026 | |
Qualified Dividend Income* | | | 40.40 | % |
Corporate Dividends Received Deduction* | | | 0 | % |
U.S. Treasury Obligations* | | | 0 | % |
Foreign Taxes | | $ | 0.0389 | |
Foreign Income | | $ | 0.3298 | |
| | * | The above percentages are based on ordinary income dividends paid to shareholders during the Fund’s fiscal year. |
| | | | |
Non-Resident Alien Shareholders | |
Qualified Short-Term Gains | | $ | 39,685 | |
25 Invesco Low Volatility Emerging Markets Fund
Trustees and Officers
The address of each trustee and officer is AIM Investment Funds (Invesco Investment Funds) (the “Trust”), 11 Greenway Plaza, Suite 1000, Houston, Texas 77046-1173. The trustees serve for the life of the Trust, subject to their earlier death, incapacitation, resignation, retirement or removal as more specifically provided in the Trust’s organizational documents. Each officer serves for a one year term or until their successors are elected and qualified. Column two below includes length of time served with predecessor entities, if any.
| | | | | | | | |
Name, Year of Birth and
Position(s) Held with the Trust | | Trustee and/
or Officer Since | | Principal Occupation(s)
During Past 5 Years | | Number of Funds in Fund Complex Overseen by Trustee | | Other Directorship(s) Held by Trustee During Past 5 Years |
| Interested Persons | | | | | | | | |
| Martin L. Flanagan1 — 1960 Trustee | | 2007 | | Executive Director, Chief Executive Officer and President, Invesco Ltd. (ultimate parent of Invesco and a global investment management firm); Advisor to the Board, Invesco Advisers, Inc. (formerly known as Invesco Institutional (N.A.), Inc.); Trustee, The Invesco Funds; Vice Chair, Investment Company Institute; and Member of Executive Board, SMU Cox School of Business Formerly: Chairman and Chief Executive Officer, Invesco Advisers, Inc. (registered investment adviser); Director, Chairman, Chief Executive Officer and President, IVZ Inc. (holding company), INVESCO Group Services, Inc. (service provider) and Invesco North American Holdings, Inc. (holding company); Director, Chief Executive Officer and President, Invesco Holding Company Limited (parent of Invesco and a global investment management firm); Director, Invesco Ltd.; Chairman, Investment Company Institute and President, Co-Chief Executive Officer, Co-President, Chief Operating Officer and Chief Financial Officer, Franklin Resources, Inc. (global investment management organization). | | 145 | | None |
Philip A. Taylor2 — 1954
Trustee, President and Principal Executive Officer | | 2006 | | Head of North American Retail and Senior Managing Director, Invesco Ltd.; Director, Co-Chairman, Co-President and Co-Chief Executive Officer, Invesco Advisers, Inc. (formerly known as Invesco Institutional (N.A.), Inc.) (registered investment adviser); Director, Chairman, Chief Executive Officer and President, Invesco Management Group, Inc. (formerly known as Invesco Aim Management Group, Inc.) (financial services holding company); Director and President, INVESCO Funds Group, Inc. (registered investment adviser and registered transfer agent); Director and Chairman, Invesco Investment Services, Inc. (formerly known as Invesco Aim Investment Services, Inc.) (registered transfer agent) and IVZ Distributors, Inc. (formerly known as INVESCO Distributors, Inc.) (registered broker dealer); Chief Executive Officer, Invesco Corporate Class Inc. (corporate mutual fund company) Director, Chairman and Chief Executive Officer, Invesco Canada Ltd. (formerly known as Invesco Trimark Ltd./Invesco Trimark Ltèe) (registered investment adviser and registered transfer agent); Trustee, President and Principal Executive Officer, The Invesco Funds (other than AIM Treasurer’s Series Trust (Invesco Treasurer’s Series Trust), Short-Term Investments Trust and Invesco Management Trust); Trustee and Executive Vice President, The Invesco Funds (AIM Treasurer’s Series Trust (Invesco Treasurer’s Series Trust), Short-Term Investments Trust and Invesco Management Trust only); Director, Invesco Investment Advisers LLC (formerly known as Van Kampen Asset Management); Director, Chief Executive Officer and President, Van Kampen Exchange Corp. Formerly: Director, President and Chairman, Invesco Inc. (holding company), Invesco Canada Holdings Inc. (holding company), Trimark Investments Ltd./Placements Trimark Ltèe and Invesco Financial Services Ltd/Services Financiers Invesco Ltèe; Chief Executive Officer, Invesco Canada Fund Inc (corporate mutual fund company); Director and Chairman, Van Kampen Investor Services Inc.; Director, Chief Executive Officer and President, 1371 Preferred Inc. (holding company) and Van Kampen Investments Inc.; Director and President, AIM GP Canada Inc. (general partner for limited partnerships) and Van Kampen Advisors, Inc.; Director and Chief Executive Officer, Invesco Trimark Dealer Inc. (registered broker dealer); Director, Invesco Distributors, Inc. (formerly known as Invesco Aim Distributors, Inc.) (registered broker dealer); Manager, Invesco PowerShares Capital Management LLC; Director, Chief Executive Officer and President, Invesco Advisers, Inc.; Director, Chairman, Chief Executive Officer and President, Invesco Aim Capital Management, Inc.; President, Invesco Trimark Dealer Inc. and Invesco Trimark Ltd./Invesco Trimark Ltèe; Director and President, AIM Trimark Corporate Class Inc. and AIM Trimark Canada Fund Inc.; Senior Managing Director, Invesco Holding Company Limited; Director and Chairman, Fund Management Company (former registered broker dealer); President and Principal Executive Officer, The Invesco Funds (AIM Treasurer’s Series Trust (Invesco Treasurer’s Series Trust), and Short-Term Investments Trust only); President, AIM Trimark Global Fund Inc. and AIM Trimark Canada Fund Inc.. | | 145 | | None |
| 1 | Mr. Flanagan is considered an interested person (within the meaning of Section 2(a)(19) of the 1940 Act) of the Trust because he is an officer of the Adviser to the Trust, and an officer and a director of Invesco Ltd., ultimate parent of the Adviser. |
| 2 | Mr. Taylor is considered an interested person (within the meaning of Section 2(a)(19) of the 1940 Act) of the Trust because he is an officer and a director of the Adviser. |
T-1 Invesco Low Volatility Emerging Markets Fund
Trustees and Officers—(continued)
| | | | | | | | |
Name, Year of Birth and Position(s) Held with the Trust | | Trustee and/ or Officer Since | | Principal Occupation(s) During Past 5 Years | | Number of Funds in Fund Complex Overseen by Trustee | | Other Directorship(s) Held by Trustee During Past 5 Years |
| Independent Trustees | | | | | | | | |
Bruce L. Crockett — 1944 Trustee and Chair | | 2003 | | Chairman, Crockett Technologies Associates (technology consulting company) Formerly: Director, Captaris (unified messaging provider); Director, President and Chief Executive Officer, COMSAT Corporation; Chairman, Board of Governors of INTELSAT (international communications company); ACE Limited (insurance company); Independent Directors Council and Investment Company Institute | | 145 | | ALPS (Attorneys Liability Protection Society) (insurance company) and Globe Specialty Metals, Inc. (metallurgical company) |
David C. Arch — 1945 Trustee | | 2010 | | Chairman of Blistex Inc., a consumer health care products manufacturer | | 145 | | Board member of the Illinois Manufacturers’ Association; Member of the Board of Visitors, Institute for the Humanities, University of Michigan; Member of the Audit Committee of the Edward-Elmhurst Hospital |
James T. Bunch — 1942 Trustee | | 2000 | | Managing Member, Grumman Hill Group LLC (family office/private equity investments) Formerly: Founder, Green Manning & Bunch Ltd. (investment banking firm) (1988-2010); Executive Committee, United States Golf Association; and Chairman, Board of Governors, Western Golf Association | | 145 | | Chairman of the Board of Trustees, Evans Scholars Foundation; and Chairman of the Board, Denver Film Society |
Rodney F. Dammeyer — 1940 Trustee | | 2010 | | Chairman of CAC, LLC, (private company offering capital investment and management advisory services) Formerly: Prior to 2001, Managing Partner at Equity Group Corporate Investments; Prior to 1995, Chief Executive Officer of Itel Corporation (formerly Anixter International); Prior to 1985, experience includes Senior Vice President and Chief Financial Officer of Household International, Inc., Executive Vice President and Chief Financial Officer of Northwest Industries, Inc. and Partner of Arthur Andersen & Co.; From 1987 to 2010, Director/Trustee of investment companies in the Van Kampen Funds complex | | 145 | | Director of Quidel Corporation and Stericycle, Inc. |
Albert R. Dowden — 1941 Trustee | | 2003 | | Director of a number of public and private business corporations, including the Boss Group, Ltd. (private investment and management); Nature’s Sunshine Products, Inc. and Reich & Tang Funds (5 portfolios) (registered investment company) Formerly: Director, Homeowners of America Holding Corporation/Homeowners of America Insurance Company (property casualty company); Director, Continental Energy Services, LLC (oil and gas pipeline service); Director, CompuDyne Corporation (provider of product and services to the public security market) and Director, Annuity and Life Re (Holdings), Ltd. (reinsurance company); Director, President and Chief Executive Officer, Volvo Group North America, Inc.; Senior Vice President, AB Volvo; Director of various public and private corporations; Chairman, DHJ Media, Inc.; Director, Magellan Insurance Company; and Director, The Hertz Corporation, Genmar Corporation (boat manufacturer), National Media Corporation; Advisory Board of Rotary Power International (designer, manufacturer, and seller of rotary power engines); and Chairman, Cortland Trust, Inc. (registered investment company) | | 145 | | Director of: Nature’s Sunshine Products, Inc., Reich & Tang Funds, Homeowners of America Holding Corporation/ Homeowners of America Insurance Company, the Boss Group |
Jack M. Fields — 1952 Trustee | | 2003 | | Chief Executive Officer, Twenty First Century Group, Inc. (government affairs company); Owner and Chief Executive Officer, Dos Angeles Ranch, L.P. (cattle, hunting, corporate entertainment); and Discovery Global Education Fund (non-profit) Formerly: Chief Executive Officer, Texana Timber LP (sustainable forestry company); Director of Cross Timbers Quail Research Ranch (non-profit); and member of the U.S. House of Representatives | | 145 | | Insperity, Inc. (formerly known as Administaff) |
Prema Mathai-Davis — 1950 Trustee | | 2003 | | Retired. Formerly: Chief Executive Officer, YWCA of the U.S.A. | | 145 | | None |
Larry Soll — 1942 Trustee | | 1997 | | Retired. Formerly: Chairman, Chief Executive Officer and President, Synergen Corp. (a biotechnology company) | | 145 | | None |
Hugo F. Sonnenschein — 1940 Trustee | | 2010 | | President Emeritus and Honorary Trustee of the University of Chicago and the Adam Smith Distinguished Service Professor in the Department of Economics at the University of Chicago. Prior to 2000, President of the University of Chicago | | 145 | | Trustee of the University of Rochester and a member of its investment committee; Member of the National Academy of Sciences and the American Philosophical Society; Fellow of the American Academy of Arts and Sciences |
Raymond Stickel, Jr. — 1944 Trustee | | 2005 | | Retired. Formerly: Director, Mainstay VP Series Funds, Inc. (25 portfolios) and Partner, Deloitte & Touche | | 145 | | None |
T-2 Invesco Low Volatility Emerging Markets Fund
Trustees and Officers—(continued)
| | | | | | | | |
Name, Year of Birth and Position(s) Held with the Trust | | Trustee and/ or Officer Since | | Principal Occupation(s) During Past 5 Years | | Number of Funds in Fund Complex Overseen by Trustee | | Other Directorship(s) Held by Trustee During Past 5 Years |
| Independent Trustees—(continued) |
Suzanne H. Woolsey — 1941 Trustee | | 2014 | | Chief Executive Officer of Woolsey Partners LLC | | 145 | | Emeritus Chair of the Board of Trustees of the Institute for Defense Analyses; Trustee of Colorado College; Trustee of California Institute of Technology; Prior to 2014, Director of Fluor Corp.; Prior to 2010, Trustee of the German Marshall Fund of the United States; Prior to 2010 Trustee of the Rocky Mountain Institute |
| Other Officers | | | | | | | | |
Russell C. Burk — 1958
Senior Vice President and Senior Officer | | 2005 | | Senior Vice President and Senior Officer, The Invesco Funds | | N/A | | N/A |
John M. Zerr — 1962
Senior Vice President, Chief Legal Officer and Secretary | | 2006 | | Director, Senior Vice President, Secretary and General Counsel, Invesco Management Group, Inc. (formerly known as Invesco Aim Management Group, Inc.) and Van Kampen Exchange Corp.; Senior Vice President, Invesco Advisers, Inc. (formerly known as Invesco Institutional (N.A.), Inc.) (registered investment adviser); Senior Vice President and Secretary, Invesco Distributors, Inc. (formerly known as Invesco Aim Distributors, Inc.); Director, Vice President and Secretary, Invesco Investment Services, Inc. (formerly known as Invesco Aim Investment Services, Inc.) and IVZ Distributors, Inc. (formerly known as INVESCO Distributors, Inc.); Director and Vice President, INVESCO Funds Group, Inc.; Senior Vice President, Chief Legal Officer and Secretary, The Invesco Funds; Managing Director, Invesco PowerShares Capital Management LLC; Director, Secretary and General Counsel, Invesco Investment Advisers LLC (formerly known as Van Kampen Asset Management); Secretary and General Counsel, Invesco Capital Markets, Inc. (formerly known as Van Kampen Funds Inc.) and Chief Legal Officer, PowerShares Exchange-Traded Fund Trust, PowerShares Exchange-Traded Fund Trust II, PowerShares India Exchange-Traded Fund Trust, PowerShares Actively Managed Exchange-Traded Fund Trust, and PowerShares Actively Managed Exchange-Traded Commodity Fund Trust Formerly: Director and Vice President, Van Kampen Advisors Inc.; Director, Vice President, Secretary and General Counsel, Van Kampen Investor Services Inc.; Director, Invesco Distributors, Inc. (formerly known as Invesco Aim Distributors, Inc.); Director, Senior Vice President, General Counsel and Secretary, Invesco Aim Advisers, Inc. and Van Kampen Investments Inc.; Director, Vice President and Secretary, Fund Management Company; Director, Senior Vice President, Secretary, General Counsel and Vice President, Invesco Aim Capital Management, Inc.; Chief Operating Officer and General Counsel, Liberty Ridge Capital, Inc. (an investment adviser); Vice President and Secretary, PBHG Funds (an investment company) and PBHG Insurance Series Fund (an investment company); Chief Operating Officer, General Counsel and Secretary, Old Mutual Investment Partners (a broker-dealer); General Counsel and Secretary, Old Mutual Fund Services (an administrator) and Old Mutual Shareholder Services (a shareholder servicing center); Executive Vice President, General Counsel and Secretary, Old Mutual Capital, Inc. (an investment adviser); and Vice President and Secretary, Old Mutual Advisors Funds (an investment company) | | N/A | | N/A |
Sheri Morris — 1964
Vice President, Treasurer and Principal Financial Officer | | 2003 | | Vice President, Treasurer and Principal Financial Officer, The Invesco Funds; Vice President, Invesco Advisers, Inc. (formerly known as Invesco Institutional (N.A.), Inc.) (registered investment adviser); and Vice President, PowerShares Exchange-Traded Fund Trust, PowerShares Exchange-Traded Fund Trust II, PowerShares India Exchange-Traded Fund Trust, PowerShares Actively Managed Exchange-Traded Fund Trust, and PowerShares Actively Managed Exchange-Traded Commodity Fund Trust Formerly: Vice President, Invesco Aim Advisers, Inc., Invesco Aim Capital Management, Inc. and Invesco Aim Private Asset Management, Inc.; Assistant Vice President and Assistant Treasurer, The Invesco Funds and Assistant Vice President, Invesco Advisers, Inc., Invesco Aim Capital Management, Inc. and Invesco Aim Private Asset Management, Inc.; and Treasurer, PowerShares Exchange-Traded Fund Trust, PowerShares Exchange-Traded Fund Trust II, PowerShares India Exchange-Traded Fund Trust and PowerShares Actively Managed Exchange-Traded Fund Trust | | N/A | | N/A |
T-3 Invesco Low Volatility Emerging Markets Fund
Trustees and Officers—(continued)
| | | | | | | | |
Name, Year of Birth and
Position(s) Held with the Trust | | Trustee and/
or Officer Since | | Principal Occupation(s)
During Past 5 Years | | Number of Funds in Fund Complex Overseen by Trustee | | Other Directorship(s) Held by Trustee During Past 5 Years |
| Other Officers—(continued) | | | | | | | | |
Karen Dunn Kelley — 1960
Vice President | | 2003 | | Senior Managing Director, Investments, Invesco Ltd.; Director, Co-President, Co-Chief Executive Officer, and Co-Chairman, Invesco Advisers, Inc. (formerly known as Invesco Institutional (N.A.), Inc.) (registered investment adviser); Chairman, Invesco Senior Secured Management, Inc.; Senior Vice President, Invesco Management Group, Inc. (formerly known as Invesco Aim Management Group, Inc.); Executive Vice President, Invesco Distributors, Inc. (formerly known as Invesco Aim Distributors, Inc.); Director, Invesco Mortgage Capital Inc. and Invesco Management Company Limited; Vice President, The Invesco Funds (other than AIM Treasurer’s Series Trust (Invesco Treasurer’s Series Trust), Short-Term Investments Trust and Invesco Management Trust); and President and Principal Executive Officer, The Invesco Funds (AIM Treasurer’s Series Trust (Invesco Treasurer’s Series Trust), Short-Term Investments Trust and Invesco Management Trust only) Formerly: Director and President, INVESCO Asset Management (Bermuda) Ltd., Director, INVESCO Global Asset Management Limited and INVESCO Management S.A.; Senior Vice President, Van Kampen Investments Inc. and Invesco Advisers, Inc. (formerly known as Invesco Institutional (N.A.), Inc.) (registered investment adviser); Vice President, Invesco Advisers, Inc. (formerly known as Invesco Institutional (N.A.), Inc.); Director of Cash Management and Senior Vice President, Invesco Advisers, Inc. and Invesco Aim Capital Management, Inc.; Director and President, Fund Management Company; Chief Cash Management Officer, Director of Cash Management, Senior Vice President, and Managing Director, Invesco Aim Capital Management, Inc.; Director of Cash Management, Senior Vice President, and Vice President, Invesco Advisers, Inc. and The Invesco Funds (AIM Treasurer’s Series Trust (Invesco Treasurer’s Series Trust), and Short-Term Investments Trust only) | | N/A | | N/A |
Crissie M. Wisdom — 1969 Anti-Money Laundering Compliance Officer | | 2013 | | Anti-Money Laundering Compliance Officer, Invesco Advisers, Inc. (formerly known as Invesco Institutional (N.A.), Inc.) (registered investment adviser), Invesco Capital Markets, Inc. (formerly known as Van Kampen Funds Inc.), Invesco Distributors, Inc., Invesco Investment Services, Inc., Invesco Management Group, Inc., Van Kampen Exchange Corp., The Invesco Funds, and PowerShares Exchange-Traded Fund Trust, PowerShares Exchange-Traded Fund Trust II, PowerShares India Exchange-Traded Fund Trust, PowerShares Actively Managed Exchange-Traded Fund Trust and PowerShares Actively Managed Exchange-Traded Commodity Fund Trust; Anti-Money Laundering Compliance Officer and Bank Secrecy Act Officer, INVESCO National Trust Company and Invesco Trust Company; and Fraud Prevention Manager and Controls and Risk Analysis Manager for Invesco Investment Services, Inc.. | | N/A | | N/A |
Lisa O. Brinkley — 1959 Chief Compliance Officer | | 2015 | | Senior Vice President and Chief Compliance Officer, Invesco Advisers, Inc. (registered investment adviser) (formerly known as Invesco Institutional (N.A., Inc.); and Chief Compliance Officer, The Invesco Funds Formerly: Global Assurance Officer, Invesco Ltd. and Vice President, The Invesco Funds; Chief Compliance Officer, Invesco Distributors, Inc. (formerly known as Invesco Aim Distributors, Inc.), Invesco Investment Services, Inc.(formerly known as Invesco Aim Investment Services, Inc.) and Van Kampen Investor Services Inc.; Senior Vice President, Invesco Management Group, Inc.; Senior Vice President and Chief Compliance Officer, Invesco Advisers, Inc. and The Invesco Funds; Vice President and Chief Compliance Officer, Invesco Aim Capital Management, Inc. and Invesco Distributors, Inc.; Vice President, Invesco Investment Services, Inc. and Fund Management Company. | | N/A | | N/A |
The Statement of Additional Information of the Trust includes additional information about the Fund’s Trustees and is available upon request, without charge, by calling 1.800.959.4246. Please refer to the Fund’s prospectus for information on the Fund’s sub-advisers.
| | | | | | |
Office of the Fund 11 Greenway Plaza, Suite 1000 Houston, TX 77046-1173 | | Investment Adviser Invesco Advisers, Inc. 1555 Peachtree Street, N.E. Atlanta, GA 30309 | | Distributor
Invesco Distributors, Inc. 11 Greenway Plaza, Suite 1000 Houston, TX 77046-1173 | | Auditors PricewaterhouseCoopers LLP 1000 Louisiana Street, Suite 5800 Houston, TX 77002-5678 |
| | | |
| | | | | | |
Counsel to the Fund Stradley Ronon Stevens & Young, LLP 2005 Market Street, Suite 2600 Philadelphia, PA 19103-7018 | | Counsel to the Independent Trustees Goodwin Procter LLP 901 New York Avenue, N.W. Washington, D.C. 20001 | | Transfer Agent Invesco Investment Services, Inc. 11 Greenway Plaza, Suite 1000 Houston, TX 77046-1173 | | Custodian State Street Bank and Trust Company 225 Franklin Street Boston, MA 02110-2801 |
T-4 Invesco Low Volatility Emerging Markets Fund

Invesco mailing information
Send general correspondence to Invesco Investment Services, Inc., P.O. Box 219078, Kansas City, MO 64121-9078.
Important notice regarding delivery of security holder documents
To reduce Fund expenses, only one copy of most shareholder documents may be mailed to shareholders with multiple accounts at the same address (Householding). Mailing of your shareholder documents may be householded indefinitely unless you instruct us otherwise. If you do not want the mailing of these documents to be combined with those for other members of your household, please contact Invesco Investment Services, Inc. at 800 959 4246 or contact your financial institution. We will begin sending you individual copies for each account within 30 days after receiving your request.
Fund holdings and proxy voting information
The Fund provides a complete list of its holdings four times in each fiscal year, at the quarter ends. For the second and fourth quarters, the lists appear in the Fund’s semiannual and annual reports to shareholders. For the first and third quarters, the Fund files the lists with the Securities and Exchange Commission (SEC) on Form N-Q. The most recent list of portfolio holdings is available at invesco.com/completeqtrholdings. Shareholders can also look up the Fund’s Forms N-Q on the SEC website at sec.gov. Copies of the Fund’s Forms N-Q may be reviewed and copied at the SEC Public Reference Room in Washington, D.C. You can obtain information on the operation of the Public Reference Room, including information about duplicating fee charges, by calling 202 551 8090 or 800 732 0330, or by electronic request at the following email address: publicinfo@sec.gov. The SEC file numbers for the Fund are shown below.
A description of the policies and procedures that the Fund uses to determine how to vote proxies relating to portfolio securities is available without charge, upon request, from our Client Services department at 800 959 4246 or at invesco.com/proxyguidelines. The information is also available on the SEC website, sec.gov.
| | |
Information regarding how the Fund voted proxies related to its portfolio securities during the most recent 12-month period ended June 30 is available at invesco.com/proxysearch. The information is also available on the SEC website, sec.gov. Invesco Advisers, Inc. is an investment adviser; it provides investment advisory services to individual and institutional clients and does not sell securities. Invesco Distributors, Inc. is the US distributor for Invesco Ltd.’s retail mutual funds, exchange-traded funds and institutional money market funds. Both are wholly owned, indirect subsidiaries of Invesco Ltd. | |  |
SEC file numbers: 811-05426 and 033-19338 LVEM-AR-1 Invesco Distributors, Inc.
| | | | |
| | |
 | | Annual Report to Shareholders | | October 31, 2015 |
| | |
| | Invesco Macro International Equity Fund |
| | Nasdaq: |
| | A: VZMAX n C: VZMCX n R: VZMRX n Y: VZMYX n R5: VZMFX n R6: VZMSX |

Letters to Shareholders
| | | | |

Philip Taylor | | | | Dear Shareholders: This annual report includes information about your Fund, including performance data and a complete list of its investments as of the close of the reporting period. Inside is a discussion of how your Fund was managed and the factors that affected its performance during the reporting period. I hope you find this report of interest. The US economy expanded and unemployment declined throughout the reporting period. Continuing low energy prices benefited consumers, but a strong US dollar crimped corporate profits. The US Federal Reserve signaled that it was increasingly likely to raise interest rates, based on generally positive economic data, but uncertainty remained about when it might act. Overseas, the story was much different. Low energy prices hurt the economies of some oil-producing nations, such as Brazil and Russia. During the reporting period, the European Central |
Bank as well as central banks in China and Japan – among other countries – either instituted or maintained extraordinarily accommodative monetary policies in response to economic weakness.
Investor uncertainty, such as we saw for much of the reporting period – and market volatility, such as we saw at the end of the reporting period – are unfortunate facts of life when it comes to investing. Some investors use these things as excuses to delay saving and investing for their long-term financial goals. That’s why Invesco encourages investors to work with a professional financial adviser who can stress the importance of starting to save and invest early and the importance of adhering to a disciplined investment plan – when times are good and when they’re uncertain. A financial adviser who knows your unique financial situation, investment goals and risk tolerance can be an invaluable partner as you seek to achieve your financial goals. He or she can offer a long-term perspective when markets are volatile and time-tested advice and guidance when your financial situation or investment goals change.
Timely information when and where you want it
Invesco’s efforts to help investors achieve their financial objectives include providing individual investors and financial professionals with timely information about the markets, the economy and investing – whenever and wherever they want it.
Our website, invesco.com/us, offers a wide range of market insights and investment perspectives. On the website, you’ll find detailed information about our funds, including prices, performance, holdings and portfolio manager commentaries. You can access information about your account by completing a simple, secure online registration. Click on the “Need to register” link in the “Account Access” box on our homepage to get started.
Invesco’s mobile apps for iPhone® and iPad® (both available free from the App StoreSM) allow you to obtain the same detailed information, monitor your account and create customizable watch lists. Also, they allow you to access investment insights from our investment leaders, market strategists, economists and retirement experts. You can sign up to be alerted when new commentary is added, and you can watch portfolio manager videos and have instant access to Invesco news and updates wherever you may be.
In addition to the resources accessible on our website and through our mobile app, you can obtain timely updates to help you stay informed about the markets, the economy and investing by connecting with Invesco on Twitter, LinkedIn or Facebook. You can access our blog at blog.invesco.us.com. Our goal is to provide you the information you want, when and where you want it.
Have questions?
For questions about your account, feel free to contact an Invesco client services representative at 800 959 4246. For Invesco-related questions or comments, please email me directly at phil@invesco.com.
All of us at Invesco look forward to serving your investment management needs for many years to come. Thank you for investing with us.
Sincerely,

Philip Taylor
Senior Managing Director, Invesco Ltd.
iPhone and iPad are trademarks of Apple Inc., registered in the US and other countries. App Store is a service mark of Apple Inc. Invesco Distributors, Inc. is not affiliated with Apple Inc.
2 Invesco Macro International Equity Fund
| | | | | | |

Bruce Crockett | | | | Dear Fellow Shareholders: Among the many important lessons I’ve learned in more than 40 years in a variety of business endeavors is the value of a trusted advocate. As independent chair of the Invesco Funds Board, I can assure you that the members of the Board are strong advocates for the interests of investors in Invesco’s mutual funds. We work hard to represent your interests through oversight of the quality of the investment management services your funds receive and other matters important to your investment, including but not limited to: |
| | | | n | | Ensuring that Invesco offers a diverse lineup of mutual funds that your financial adviser can use to strive to meet your financial needs as your investment goals change over time. |
| | | | n | | Monitoring how the portfolio management teams of the Invesco funds are performing in light of changing economic and market conditions. |
| n | | Assessing each portfolio management team’s investment performance within the context of the investment strategy described in the fund’s prospectus. |
| n | | Monitoring for potential conflicts of interests that may impact the nature of the services that your funds receive. |
We believe one of the most important services we provide our fund shareholders is the annual review of the funds’ advisory and sub-advisory contracts with Invesco Advisers and its affiliates. This review is required by the Investment Company Act of 1940 and focuses on the nature and quality of the services Invesco provides as the adviser to the Invesco funds and the reasonableness of the fees that it charges for those services. Each year, we spend months carefully reviewing information received from Invesco and a variety of independent sources, such as performance and fee data prepared by Lipper Inc., an independent, third-party firm widely recognized as a leader in its field. We also meet with our independent legal counsel and other independent advisers to review and help us assess the information that we have received. Our goal is to assure that you receive quality investment management services for a reasonable fee.
I trust the measures outlined above provide assurance that you have a worthy advocate when it comes to choosing the Invesco Funds.
As always, please contact me at bruce@brucecrockett.com with any questions or concerns you may have. On behalf of the Board, we look forward to continuing to represent your interests and serving your needs.
Sincerely,

Bruce L. Crockett
Independent Chair
Invesco Funds Board of Trustees
3 Invesco Macro International Equity Fund
Management’s Discussion of Fund Performance
Performance summary
For the fiscal year ended October 31, 2015, Class A shares of Invesco Macro International Equity Fund (the Fund), at net asset value (NAV), underperformed the Fund’s broad market/style specific benchmark, the MSCI All Country World ex-U.S. Index.
Your Fund’s long-term performance appears later in this report.
Fund vs. Indexes
Total returns, 10/31/14 to 10/31/15, at net asset value (NAV). Performance shown does not include applicable contingent deferred sales charges (CDSC) or front-end sales charges, which would have reduced performance.
| | | | | |
| Class A Shares | | | | -8.80 | % |
| Class C Shares | | | | -9.48 | |
| Class R Shares | | | | -9.08 | |
| Class Y Shares | | | | -8.57 | |
| Class R5 Shares | | | | -8.66 | |
| Class R6 Shares | | | | -8.57 | |
| MSCI All Country World ex-U.S. Index▼ (Broad Market/Style-Specific Index) | | | | -4.68 | |
| Lipper International Large-Cap Core Funds Index¡ (Peer Group Index) | | | | -2.71 | |
Source(s): ▼FactSet Research Systems Inc.; ¡Lipper Inc.
Market conditions and your Fund
The fiscal year started with challenges to the equity markets as October 2014 witnessed the end of asset purchases by the US Federal Reserve (the Fed). This was later countered by the announcement of massive quantitative easing efforts in Europe and Japan. Energy-related commodities suffered from a supply glut, which added volatility toward the end of 2014.
We started 2015 with gains in equity prices fueled by the expansionary monetary policies put in place by a number of main central banks. However, it became apparent that the liquidity-driven environment could potentially lay down the
foundation for significant volatility going forward. The second quarter of 2015 began with a continuation of the same theme witnessed during the first quarter with markets exhibiting mixed results but generally performing well on the back of accommodative monetary policies. However, June 2015 was detrimental for equities as headwinds became apparent, particularly with the reemergence of uncertainty surrounding the Greek financial crisis. The third quarter of 2015 was marred by heightened volatility as a result of disappointing economic data in many developed countries and China, suggesting a more difficult environment ahead for equities. In August 2015,
equities suffered a major and broad-based correction. September followed suit, but to a lesser degree, due in part to the postponement of a monetary policy shift by the Fed.
The Fund uses “smart beta” indexes to build up core equity exposure. Beta is a measure of risk representing how a security is expected to respond to general market movements. Smart beta represents an alternative and selection index based methodology that seeks to outperform a benchmark or reduce portfolio risk, or both. Smart beta funds may underperform cap-weighted benchmarks and increase portfolio risk. For this strategy, we invest in companies in approximately the same proportion as they are represented in the smart beta indexes, which utilize equal weighting, low volatility or other methodologies to determine stock investments and appropriate weightings. For the reporting period, the main detractor from Fund performance was the smart beta component, specifically as it related to the Fund’s exposure to Hong Kong and Japan through direct investment and the use of futures. This result is consistent with stretched valuations in equity markets as the result of expansionary monetary policies put in place by many global central banks. One of the features of the smart beta indexes is to equally allocate to the stock universe rather than utilizing market capitalization as a gauge. In an environment of stretched valuations, high-beta stocks will tend to perform better and to the detriment of smart beta indexes.
| | |
Portfolio Composition |
| By country | | % of total net assets |
| | | | | |
| |
| Japan | | | | 18.0 | % |
| United Kingdom | | | | 16.8 | |
| Australia | | | | 9.0 | |
| Hong Kong | | | | 4.8 | |
| France | | | | 4.1 | |
| Taiwan | | | | 4.1 | |
| Switzerland | | | | 3.2 | |
| Germany | | | | 3.0 | |
| Singapore | | | | 2.5 | |
| Malaysia | | | | 2.3 | |
| Countries each less than 2.0% of portfolio | | | | 22.5 | |
| Money Market Funds Plus Other Assets Less Liabilities† | | | | 9.7 | |
| † | The unrealized appreciation/depreciation of futures, forwards and swaps are included in “Money Market Funds Plus Other Assets Less Liabilities.” |
| | |
Target Regional Breakdown |
| |
| | | Target Net Assets1 |
| | | | | |
| Emerging Market | | | | 24.70 | % |
| Japan | | | | 19.41 | |
| United Kingdom | | | | 19.38 | |
| Asia ex-Japan | | | | 17.72 | |
| Europe ex-United Kingdom | | | | 16.14 | |
| Money Market Funds Plus Other Assets Less Liabilities | | | | 10.00 | |
| Total | | | | 107.35 | |
| 1 | Proprietary models determine the target net asset weights necessary to achieve the desired regional breakdown. Target net assets greater than 100% is achieved through derivatives and other instruments that create leverage. Regional breakdown percentages represent the net of the Fund’s long and short positions. |
| | | | | |
Total Net Assets | | | | $7.6 million | |
| |
| Total Number of Holdings* | | | | 877 | |
The Fund’s holdings are subject to change, and there is no assurance that the Fund will continue to hold any particular security.
*Excluding money market fund holdings.
Data presented here are as of October 31, 2015.
4 Invesco Macro International Equity Fund
The Fund’s tactical overlay portion actively adjusts portfolio positions through the use of futures to reflect the near-term environment. The tactical element followed suit with the Fund’s average yearly overweight exposure to Hong Kong and its average yearly underweight exposure to emerging markets detracting from Fund performance. On the other hand, the Fund’s average overweight exposure to Japan – obtained through direct investment and the use of futures – proved to have a positive impact on Fund performance, but not enough to compensate for the detracting markets.
As part of the Fund’s investment process, valuations are considered on an absolute basis first to determine if a market is “rich” or “cheap” relative to its own history and then evaluated on a cross-sectional basis to account for relative attractiveness across these markets. This approach reflects the intuitive appeal of having a larger weight to “cheap” markets and a smaller weight to “expensive” markets within the Fund’s strategic allocation. This valuation-based adjustment was, to a lesser extent, a detractor from Fund performance. The Fund’s regional equal-weight element was the only component of the Fund’s investment process that produced positive results for the reporting period. However, this was not sufficient to compensate for the underperformance produced by the other elements of the Fund’s investment process during the fiscal year.
Please note that our strategy utilizes derivative instruments that include futures and total return swaps. Therefore, some of the performance of the strategy, both positive and negative, can be attributed to these instruments. Derivatives can be a more liquid and cost-effective way to gain exposure to asset classes. However, derivatives may amplify traditional investment risks through the creation of leverage and may be less liquid than traditional securities.
Thank you for your continued commitment to Invesco Macro International Equity Fund.
The views and opinions expressed in management’s discussion of Fund performance are those of Invesco Advisers, Inc. These views and opinions are subject to change at any time based on factors such as market and economic conditions. These views and opinions may not be relied upon as investment advice or recommendations, or as an offer for a particular security. The information is not a complete analysis of every aspect of any market, country, industry, security or the Fund. Statements of fact are from sources considered reliable, but Invesco Advisers, Inc. makes no representation or warranty as to their completeness or accuracy. Although historical performance is no guarantee of future results, these insights may help you understand our investment management philosophy.
See important Fund and, if applicable, index disclosures later in this report.
| | |
 | | Mark Ahnrud Chartered Financial Analyst, Portfolio Manager, is manager of Invesco Macro International Equity |
| Fund. He joined Invesco in 2000. Mr. Ahnrud earned a BS in finance and investments from Babson College and an MBA from Duke University Fuqua School of Business. |
| |
 | | Chris Devine Chartered Financial Analyst, Portfolio Manager, is manager of Invesco Macro International Equity |
| Fund. He joined Invesco in 1998. Mr. Devine earned a BA in economics from Wake Forest University and an MBA from the University of Georgia. |
| |
 | | Scott Hixon Chartered Financial Analyst, Portfolio Manager, is manager of Invesco Macro International Equity |
| Fund. He joined Invesco in 1994. Mr. Hixon earned a BBA in finance from Georgia Southern University and an MBA in finance from Georgia State University. |
| |
 | | Christian Ulrich Chartered Financial Analyst, Portfolio Manager, is manager of Invesco Macro International Equity |
| Fund. He joined Invesco in 2000. Mr. Ulrich earned the equivalent of a BBA from the KV Zurich Business School in Zurich, Switzerland. |
| |
 | | Scott Wolle Chartered Financial Analyst, Portfolio Manager, is manager of Invesco Macro International Equity |
| Fund. He joined Invesco in 1999. Mr. Wolle earned a BS in finance from Virginia Polytechnic Institute and State University and an MBA from Duke University Fuqua School of Business. |
Assisted by Invesco’s Global Asset Allocation Team
5 Invesco Macro International Equity Fund
Your Fund’s Long-Term Performance
Results of a $10,000 Investment – Oldest Share Class(es) since Inception
Fund and index data from 12/17/13
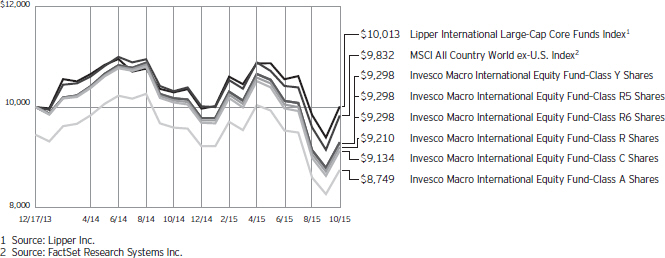
Past performance cannot guarantee comparable future results.
The data shown in the chart include reinvested distributions, applicable sales charges and Fund expenses including management fees. Index results include reinvested dividends, but they do not reflect sales charges. Performance of the
peer group, if applicable, reflects fund expenses and management fees; performance of a market index does not. Performance shown in the chart and table(s) does not reflect deduction of taxes a shareholder would pay on Fund distributions or sale of Fund shares.
continued from page 8
| n | | The Lipper International Large-Cap Core Funds Index is an unmanaged index considered representative of international large-cap core funds tracked by Lipper. |
| n | | The Fund is not managed to track the performance of any particular index, including the index(es) described here, and consequently, the performance of the Fund may deviate significantly from the performance of the index(es). |
| n | | A direct investment cannot be made in an index. Unless otherwise indicated, index results include reinvested dividends, and they do not reflect sales charges. Performance of the peer group, if applicable, reflects fund expenses; performance of a market index does not. |
Other information
| n | | The returns shown in management’s discussion of Fund performance are based on net asset values (NAVs) calculated for shareholder transactions. Generally accepted accounting principles require adjustments to be made to the net assets of the Fund at period end for financial reporting purposes, and as such, the NAVs for shareholder transactions and the returns based on those NAVs may differ from the NAVs and returns reported in the Financial Highlights. |
| n | | Industry classifications used in this report are generally according to the Global Industry Classification Standard, which was developed by and is the exclusive property and a service mark of MSCI Inc. and Standard & Poor’s. |
6 Invesco Macro International Equity Fund
| | | | | |
Average Annual Total Returns |
As of 10/31/15, including maximum applicable sales charges |
| | | | | |
| |
| Class A Shares | | | | | |
Inception (12/17/13) | | | | -6.89 | % |
1 Year | | | | -13.81 | |
| |
| Class C Shares | | | | | |
Inception (12/17/13) | | | | -4.73 | % |
1 Year | | | | -10.36 | |
| |
| Class R Shares | | | | | |
Inception (12/17/13) | | | | -4.30 | % |
1 Year | | | | -9.08 | |
| |
| Class Y Shares | | | | | |
Inception (12/17/13) | | | | -3.81 | % |
1 Year | | | | -8.57 | |
| |
| Class R5 Shares | | | | | |
Inception (12/17/13) | | | | -3.81 | % |
1 Year | | | | -8.66 | |
| |
| Class R6 Shares | | | | | |
| Inception (12/17/13) | | | | -3.81 | % |
| 1 Year | | | | -8.57 | |
The performance data quoted represent past performance and cannot guarantee comparable future results; current performance may be lower or higher. Please visit invesco.com/performance for the most recent month-end performance. Performance figures reflect reinvested distributions, changes in net asset value and the effect of the maximum sales charge unless otherwise stated. Investment return and principal value will fluctuate so that you may have a gain or loss when you sell shares.
The net annual Fund operating expense ratio set forth in the most recent Fund prospectus as of the date of this report for Class A, Class C, Class R, Class Y, Class R5 and Class R6 shares was 1.44%, 2.19%, 1.69%, 1.19%, 1.19% and 1.19%, respectively.1,2 The total annual Fund operating expense ratio set forth in the most recent Fund prospectus as of the date of this report for Class A, Class C, Class R, Class Y, Class R5 and Class R6 shares was 8.22%, 8.97%, 8.47%, 7.97%, 7.94% and 7.94%, respectively. The expense ratios presented above may vary from the expense ratios presented in other sections of this report that are based on expenses incurred during the period covered by this report.
| | | | | |
Average Annual Total Returns |
| As of 9/30/15, the most recent calendar quarter end, including maximum applicable sales charges |
| | | | | |
| |
| Class A Shares | | | | | |
Inception (12/17/13) | | | | -10.07 | % |
1 Year | | | | -19.25 | |
| |
| Class C Shares | | | | | |
Inception (12/17/13) | | | | -7.90 | % |
1 Year | | | | -16.03 | |
| |
| Class R Shares | | | | | |
Inception (12/17/13) | | | | -7.39 | % |
1 Year | | | | -14.70 | |
| |
| Class Y Shares | | | | | |
Inception (12/17/13) | | | | -6.94 | % |
1 Year | | | | -14.29 | |
| |
| Class R5 Shares | | | | | |
Inception (12/17/13) | | | | -7.00 | % |
1 Year | | | | -14.39 | |
| |
| Class R6 Shares | | | | | |
| Inception (12/17/13) | | | | -6.94 | % |
1 Year | | | | -14.29 | |
Class A share performance reflects the maximum 5.50% sales charge, and Class C share performance reflects the applicable contingent deferred sales charge (CDSC) for the period involved. The CDSC on Class C shares is 1% for the first year after purchase. Class R, Class Y, Class R5 and Class R6 class shares do not have a front-end sales charge or a CDSC; therefore, performance is at net asset value.
The performance of the Fund’s share classes will differ primarily due to different sales charge structures and class expenses.
Fund performance reflects any applicable fee waivers and/or expense reimbursements. Had the adviser not waived fees and/or reimbursed expenses currently or in the past, returns would have been lower. See current prospectus for more information.
| 1 | Total annual Fund operating expenses after any contractual fee waivers and/or expense reimbursements by the adviser in effect through at least February 28, 2017. See current prospectus for more information. |
| 2 | Total annual Fund operating expenses after any contractual fee waivers and/or expense reimbursements by the adviser in effect through at least June 30, 2017. See current prospectus for more information. |
7 Invesco Macro International Equity Fund
Invesco Macro International Equity Fund’s investment objective is to provide total return.
Unless otherwise stated, information presented in this report is as of October 31, 2015, and is based on total net assets.
Unless otherwise noted, all data provided by Invesco.
To access your Fund’s reports/prospectus, visit invesco.com/fundreports.
About share classes
| n | | Class R shares are generally available only to employer sponsored retirement and benefit plans. Please see the prospectus for more information. |
| n | | Class Y shares are available only to certain investors. Please see the prospectus for more information. |
| n | | Class R5 shares and Class R6 shares are primarily intended for employer sponsored retirement and benefit plans that meet certain standards and for institutional investors. Please see the prospectus for more information. |
Principal risks of investing in the Fund
| n | | Cash/cash equivalents risk. Holding cash or cash equivalents may negatively affect performance. |
| n | | Currency/exchange rate risk. The dollar value of the Fund’s foreign investments will be affected by changes in the exchange rates between the dollar and the currencies in which those investments are traded. |
| n | | Derivatives risk. The value of a derivative instrument depends largely on (and is derived from) the value of an underlying security, currency, commodity, interest rate, index or other asset (each referred to as an underlying asset). In addition to risks relating to the underlying assets, the use of derivatives may include other, possibly greater, risks, including counterparty, leverage and liquidity risks. Counterparty risk is the risk that the counterparty to the derivative contract will default on its obligation to pay the Fund the amount owed or otherwise perform under the derivative contract. Derivatives create leverage risk because they do not require payment up front equal to the economic exposure created by owning the derivative. As a result, an adverse change in the value of the underlying asset could result in the Fund sustaining a loss that is substantially greater than the amount invested in the derivative, which may make the Fund’s returns more volatile and increase the risk of loss. Derivative instruments may also be less liquid than more |
traditional investments and the Fund may be unable to sell or close out its derivative positions at a desirable time or price. This risk may be more acute under adverse market conditions, during which the Fund may be most in need of liquidating its derivative positions. Derivatives may also be harder to value, less tax efficient and subject to changing government regulation that could impact the Fund’s ability to use certain derivatives or their cost. Also, derivatives used for hedging or to gain or limit exposure to a particular market segment may not provide the expected benefits, particularly during adverse market conditions. These risks are greater for the Fund than mutual funds that do not use derivative instruments or that use derivative instruments to a lesser extent than the Fund to implement their investment strategy.
| n | | Emerging markets securities risk. The prices of securities issued by foreign companies and governments located in emerging markets countries may be affected more negatively by inflation, devaluation of their currencies, higher transaction costs, delays in settlement, adverse political developments, the introduction of capital controls, withholding taxes, nationalization of private assets, expropriation, social unrest, war or lack of timely information than those in developed countries. |
| n | | Foreign securities risk. The Fund’s foreign investments may be affected by changes in a foreign country’s exchange rates, political and social instability, changes in economic or taxation policies, difficulties when enforcing obligations, decreased liquidity, and increased volatility. Foreign companies may be subject to less regulation resulting in less publicly available information about the companies. |
| n | | Management risk. The investment techniques and risk analysis used by the Fund’s portfolio managers may not produce the desired results. The portfolio managers’ use of derivative instruments that provide |
economic leverage may increase the volatility of the Fund’s net asset value, which may increase the potential of greater losses that may cause the Fund to liquidate positions when it may not be advantageous to do so. In addition, the Fund will likely underperform the broader equity markets in which the Fund invests during market rallies when the Fund’s equity exposure is less than 100% of the Fund’s assets. Such underperformance could be significant during sudden or significant market rallies.
| n | | Market risk. The prices of and the income generated by the Fund’s securities may decline in response to, among other things, investor sentiment, general economic and market conditions, regional or global instability, and currency and interest rate fluctuations. |
| n | | Small- and mid-capitalization risks. Stocks of small- and mid-sized companies tend to be more vulnerable to adverse developments and may have little or no operating history or track record of success, and limited product lines, markets, management and financial resources. The securities of small- and mid-sized companies may be more volatile due to less market interest and less publicly available information about the issuer. They also may be illiquid or restricted as to resale, or may trade less frequently and in smaller volumes, all of which may cause difficulty when establishing or closing a position at a desirable price. |
| n | | Volatility risk. The Fund may have investments that appreciate or decrease significantly in value over short periods of time. This may cause the Fund’s net asset value per share to experience significant increases or declines in value over short periods of time. |
About indexes used in this report
| n | | The MSCI All Country World ex-U.S. Index is an index considered representative of developed and emerging market stock markets, excluding the US. The index is computed using the net return, which withholds applicable taxes for non-resident investors. |
continued on page 6
|
| This report must be accompanied or preceded by a currently effective Fund prospectus, which contains more complete information, including sales charges and expenses. Investors should read it carefully before investing. |
NOT FDIC INSURED | MAY LOSE VALUE | NO BANK GUARANTEE
8 Invesco Macro International Equity Fund
Schedule of Investments
October 31, 2015
| | | | | | | | |
| | | Shares | | | Value | |
Common Stocks & Other Equity Interests–90.34% | |
| Australia–9.02% | |
Adelaide Brighton Ltd. | | | 2,167 | | | $ | 6,475 | |
AGL Energy Ltd. | | | 574 | | | | 6,848 | |
ALS Ltd. | | | 1,788 | | | | 6,566 | |
Alumina Ltd. | | | 7,579 | | | | 5,864 | |
Amcor Ltd. | | | 686 | | | | 6,638 | |
AMP Ltd. | | | 1,599 | | | | 6,534 | |
Ansell Ltd. | | | 422 | | | | 6,000 | |
APA Group | | | 1,117 | | | | 7,328 | |
Aristocrat Leisure Ltd. | | | 1,144 | | | | 7,603 | |
Asciano Ltd. | | | 1,099 | | | | 6,410 | |
ASX Ltd. | | | 246 | | | | 7,231 | |
Aurizon Holdings Ltd. | | | 1,877 | | | | 6,920 | |
AusNet Services | | | 7,158 | | | | 7,376 | |
Australia and New Zealand Banking Group Ltd. | | | 343 | | | | 6,599 | |
Bank of Queensland Ltd. | | | 765 | | | | 7,130 | |
Bendigo and Adelaide Bank Ltd. | | | 898 | | | | 6,852 | |
BHP Billiton Ltd. | | | 373 | | | | 6,123 | |
BHP Billiton PLC | | | 1,620 | | | | 25,912 | |
BlueScope Steel Ltd. | | | 2,167 | | | | 6,815 | |
Boral Ltd. | | | 1,706 | | | | 6,557 | |
Brambles Ltd. | | | 906 | | | | 6,706 | |
Caltex Australia Ltd. | | | 299 | | | | 6,673 | |
carsales.com Ltd. | | | 970 | | | | 6,779 | |
Challenger Ltd. | | | 1,337 | | | | 7,847 | |
Charter Hall Group | | | 2,153 | | | | 6,894 | |
CIMIC Group Ltd. | | | 388 | | | | 7,670 | |
Coca-Cola Amatil Ltd. | | | 1,052 | | | | 6,834 | |
Cochlear Ltd. | | | 110 | | | | 6,977 | |
Commonwealth Bank of Australia | | | 122 | | | | 6,675 | |
Computershare Ltd. | | | 926 | | | | 7,138 | |
Crown Resorts Ltd. | | | 853 | | | | 6,971 | |
CSL Ltd. | | | 102 | | | | 6,774 | |
CSR Ltd. | | | 3,030 | | | | 5,934 | |
DEXUS Property Group | | | 1,304 | | | | 7,197 | |
Domino’s Pizza Enterprises Ltd. | | | 239 | | | | 7,968 | |
Downer EDI Ltd. | | | 2,478 | | | | 6,273 | |
DUET Group | | | 4,337 | | | | 7,299 | |
DuluxGroup Ltd. | | | 1,693 | | | | 7,123 | |
Echo Entertainment Group Ltd. | | | 1,943 | | | | 7,080 | |
Fairfax Media Ltd. | | | 11,156 | | | | 7,518 | |
Federation Centres(a) | | | 3,328 | | | | 6,906 | |
Flight Centre Travel Group Ltd. | | | 252 | | | | 6,820 | |
Fortescue Metals Group Ltd. | | | 4,756 | | | | 6,982 | |
Goodman Group | | | 1,508 | | | | 6,527 | |
GPT Group (The) | | | 2,231 | | | | 7,550 | |
Harvey Norman Holdings Ltd. | | | 2,314 | | | | 6,568 | |
Healthscope Ltd. | | | 3,436 | | | | 6,616 | |
Iluka Resources Ltd. | | | 1,260 | | | | 5,768 | |
| | | | | | | | |
| | | Shares | | | Value | |
| Australia–(continued) | |
Incitec Pivot Ltd. | | | 2,677 | | | $ | 7,540 | |
Insurance Australia Group Ltd. | | | 1,842 | | | | 7,315 | |
Investa Office Fund | | | 2,517 | | | | 7,251 | |
IOOF Holdings Ltd. | | | 1,066 | | | | 7,044 | |
JB Hi-Fi Ltd. | | | 482 | | | | 6,173 | |
Lend Lease Group | | | 692 | | | | 6,415 | |
Macquarie Group Ltd. | | | 121 | | | | 7,315 | |
Magellan Financial Group Ltd. | | | 513 | | | | 8,242 | |
Mirvac Group | | | 5,180 | | | | 6,667 | |
National Australia Bank Ltd. | | | 292 | | | | 6,222 | |
Newcrest Mining Ltd.(a) | | | 837 | | | | 7,271 | |
Nufarm Ltd. | | | 1,352 | | | | 8,070 | |
Oil Search Ltd. | | | 1,307 | | | | 7,295 | |
Orica Ltd. | | | 608 | | | | 7,145 | |
Origin Energy Ltd. | | | 1,199 | | | | 4,703 | |
Orora Ltd. | | | 4,111 | | | | 6,860 | |
OZ Minerals Ltd. | | | 2,507 | | | | 7,795 | |
Perpetual Ltd. | | | 235 | | | | 7,526 | |
Primary Health Care Ltd. | | | 2,268 | | | | 6,000 | |
Qantas Airways Ltd.(a) | | | 2,492 | | | | 7,020 | |
QBE Insurance Group Ltd. | | | 717 | | | | 6,668 | |
Ramsay Health Care Ltd. | | | 152 | | | | 6,674 | |
REA Group Ltd. | | | 222 | | | | 7,492 | |
Recall Holdings Ltd. | | | 1,358 | | | | 7,418 | |
Santos Ltd. | | | 2,102 | | | | 8,754 | |
Scentre Group | | | 2,524 | | | | 7,452 | |
SEEK Ltd. | | | 759 | | | | 6,889 | |
Shopping Centres Australasia Property Group | | | 4,566 | | | | 6,707 | |
Slater & Gordon Ltd. | | | 1,914 | | | | 3,739 | |
Sonic Healthcare Ltd. | | | 454 | | | | 6,242 | |
Spark Infrastructure Group | | | 5,126 | | | | 7,603 | |
Spotless Group Holdings Ltd. | | | 5,074 | | | | 7,712 | |
Stockland | | | 2,294 | | | | 6,625 | |
Suncorp Group Ltd. | | | 728 | | | | 6,752 | |
Sydney Airport | | | 1,630 | | | | 7,497 | |
Tabcorp Holdings Ltd. | | | 2,125 | | | | 7,152 | |
Tatts Group Ltd. | | | 2,583 | | | | 7,294 | |
Telstra Corp. Ltd. | | | 1,601 | | | | 6,165 | |
TPG Telecom Ltd. | | | 1,052 | | | | 8,297 | |
Transurban Group | | | 974 | | | | 7,251 | |
Treasury Wine Estates Ltd. | | | 1,540 | | | | 7,775 | |
Washington H. Soul Pattinson & Co. Ltd. | | | 676 | | | | 7,761 | |
Wesfarmers Ltd. | | | 234 | | | | 6,540 | |
Westfield Corp. | | | 961 | | | | 7,024 | |
Westpac Banking Corp. | | | 299 | | | | 6,691 | |
Woodside Petroleum Ltd. | | | 301 | | | | 6,327 | |
Woolworths Ltd. | | | 360 | | | | 6,189 | |
WorleyParsons Ltd. | | | 1,144 | | | | 5,319 | |
| | | | | | | | 681,726 | |
See accompanying Notes to Financial Statements which are an integral part of the financial statements.
9 Invesco Macro International Equity Fund
| | | | | | | | |
| | | Shares | | | Value | |
| Austria–0.16% | |
Erste Group Bank AG(a) | | | 211 | | | $ | 6,179 | |
Voestalpine AG | | | 158 | | | | 5,722 | |
| | | | | | | | 11,901 | |
|
| Belgium–0.51% | |
Ageas | | | 153 | | | | 6,750 | |
Anheuser-Busch InBev SA/NV | | | 57 | | | | 6,798 | |
Delhaize Group | | | 69 | | | | 6,394 | |
KBC Groep N.V. | | | 94 | | | | 5,713 | |
Solvay S.A. | | | 53 | | | | 5,982 | |
UCB S.A. | | | 76 | | | | 6,565 | |
| | | | | | | | 38,202 | |
|
| Brazil–0.67% | |
Ambev S.A. | | | 1,300 | | | | 6,438 | |
BRF S.A. | | | 300 | | | | 4,678 | |
Cia Brasileira de Distribuicao–Preference Shares | | | 300 | | | | 3,949 | |
Hypermarcas S.A.(a) | | | 1,400 | | | | 6,356 | |
Klabin S.A.(b) | | | 1,100 | | | | 6,258 | |
M Dias Branco S.A. | | | 300 | | | | 5,440 | |
Transmissora Alianca de Energia Eletrica S.A.(c) | | | 1,200 | | | | 6,195 | |
Ultrapar Participacoes S.A. | | | 300 | | | | 5,215 | |
WEG S.A. | | | 1,600 | | | | 5,977 | |
| | | | | | | | 50,506 | |
|
| Chile–0.92% | |
Banco de Chile | | | 108,716 | | | | 11,496 | |
Banco Santander Chile | | | 164,615 | | | | 7,821 | |
Cencosud S.A. | | | 2,586 | | | | 5,667 | |
Corpbanca S.A. | | | 740,605 | | | | 6,796 | |
Empresa Nacional de Electricidad S.A. | | | 6,721 | | | | 8,389 | |
Empresas CMPC S.A. | | | 2,542 | | | | 6,265 | |
Empresas COPEC S.A. | | | 1,011 | | | | 9,433 | |
Enersis S.A. | | | 26,681 | | | | 7,062 | |
S.A.C.I. Falabella | | | 1,039 | | | | 6,988 | |
| | | | | | | | 69,917 | |
|
| China–1.20% | |
AAC Technologies Holdings Inc. | | | 1,000 | | | | 6,330 | |
Agricultural Bank of China Ltd.–Class H | | | 16,000 | | | | 6,528 | |
China Construction Bank Corp.–Class H | | | 8,000 | | | | 5,768 | |
China Petroleum & Chemical Corp.–Class H | | | 8,000 | | | | 5,770 | |
China Traditional Chinese Medicine Co. Ltd.(a) | | | 8,000 | | | | 6,029 | |
CITIC Ltd. | | | 3,000 | | | | 5,580 | |
COSCO Pacific Ltd. | | | 6,000 | | | | 7,762 | |
FIH Mobile Ltd. | | | 14,000 | | | | 6,658 | |
Global Logistic Properties Ltd. | | | 4,500 | | | | 7,165 | |
Hengan International Group Co. Ltd. | | | 500 | | | | 5,390 | |
Industrial & Commercial Bank of China Ltd.–Class H | | | 9,000 | | | | 5,711 | |
Shenzhou International Group Holdings Ltd. | | | 1,000 | | | | 4,914 | |
Tsingtao Brewery Co. Ltd.–Class H | | | 2,000 | | | | 9,538 | |
Yangzijiang Shipbuilding Holdings Ltd. | | | 8,400 | | | | 7,463 | |
| | | | | | | | 90,606 | |
| | | | | | | | |
| | | Shares | | | Value | |
| Colombia–0.17% | |
Bancolombia S.A.–Preference Shares | | | 758 | | | $ | 6,574 | |
Grupo de Inversiones Suramericana S.A. | | | 518 | | | | 6,577 | |
| | | | | | | | 13,151 | |
|
| Czech Republic–0.15% | |
CEZ A.S. | | | 295 | | | | 5,896 | |
Komercni Banka A.S. | | | 28 | | | | 5,789 | |
| | | | | | | | 11,685 | |
|
| Denmark–0.78% | |
A.P. Moeller-Maersk A/S–Class B | | | 5 | | | | 7,373 | |
Carlsberg A/S–Class B | | | 112 | | | | 9,164 | |
Coloplast A/S–Class B | | | 124 | | | | 8,897 | |
Danske Bank A/S | | | 272 | | | | 7,463 | |
Novo Nordisk A/S–Class B | | | 154 | | | | 8,159 | |
Pandora A/S | | | 74 | | | | 8,519 | |
Vestas Wind Systems A/S | | | 160 | | | | 9,298 | |
| | | | | | | | 58,873 | |
|
| Egypt–0.08% | |
Commercial International Bank Egypt S.A.E. | | | 981 | | | | 6,455 | |
|
| Finland–0.52% | |
Fortum Oyj | | | 377 | | | | 5,647 | |
Kone Oyj–Class B | | | 161 | | | | 6,860 | |
Nokia Oyj | | | 956 | | | | 7,095 | |
Sampo Oyj–Class A | | | 125 | | | | 6,099 | |
UPM-Kymmene Oyj | | | 375 | | | | 7,010 | |
Wartsila OYJ Abp | | | 151 | | | | 6,436 | |
| | | | | | | | 39,147 | |
|
| France–4.06% | |
Accor S.A. | | | 130 | | | | 6,455 | |
Air Liquide S.A. | | | 53 | | | | 6,857 | |
Airbus Group SE | | | 99 | | | | 6,879 | |
Alcatel-Lucent(a) | | | 1,816 | | | | 7,369 | |
Alstom S.A.(a) | | | 195 | | | | 6,360 | |
Arkema S.A. | | | 89 | | | | 6,502 | |
AXA S.A. | | | 261 | | | | 6,969 | |
BNP Paribas S.A. | | | 99 | | | | 6,016 | |
Bouygues S.A. | | | 160 | | | | 6,053 | |
Bureau Veritas S.A. | | | 280 | | | | 6,326 | |
Cap Gemini S.A. | | | 70 | | | | 6,226 | |
Carrefour S.A. | | | 194 | | | | 6,318 | |
Christian Dior SE | | | 32 | | | | 6,290 | |
Cie Generale des Etablissements Michelin | | | 63 | | | | 6,277 | |
Compagnie de Saint-Gobain | | | 135 | | | | 5,657 | |
Credit Agricole S.A. | | | 445 | | | | 5,638 | |
Danone | | | 103 | | | | 7,171 | |
Dassault Systemes S.A. | | | 87 | | | | 6,873 | |
Edenred | | | 312 | | | | 5,718 | |
Electricite de France S.A. | | | 283 | | | | 5,264 | |
Engie S.A. | | | 343 | | | | 6,008 | |
Essilor International S.A. | | | 50 | | | | 6,562 | |
See accompanying Notes to Financial Statements which are an integral part of the financial statements.
10 Invesco Macro International Equity Fund
| | | | | | | | |
| | | Shares | | | Value | |
| France–(continued) | |
Hermes International | | | 17 | | | $ | 6,540 | |
Kering | | | 40 | | | | 7,391 | |
L’Oreal S.A. | | | 36 | | | | 6,559 | |
Legrand S.A. | | | 108 | | | | 5,921 | |
LVMH Moet Hennessy Louis Vuitton S.E. | | | 38 | | | | 7,070 | |
Numericable–SFR(a) | | | 126 | | | | 5,709 | |
Orange S.A. | | | 390 | | | | 6,861 | |
Pernod Ricard S.A. | | | 59 | | | | 6,945 | |
Peugeot S.A.(a) | | | 344 | | | | 6,062 | |
Publicis Groupe S.A. | | | 89 | | | | 5,780 | |
Renault S.A. | | | 76 | | | | 7,165 | |
Safran S.A. | | | 81 | | | | 6,156 | |
Sanofi | | | 62 | | | | 6,251 | |
Schneider Electric S.E. | | | 96 | | | | 5,805 | |
SCOR S.E. | | | 177 | | | | 6,583 | |
Societe Generale S.A. | | | 130 | | | | 6,036 | |
Sodexo S.A. | | | 71 | | | | 6,311 | |
Suez Environnement Co. | | | 342 | | | | 6,499 | |
Technip S.A. | | | 115 | | | | 6,008 | |
TOTAL S.A. | | | 136 | | | | 6,591 | |
Unibail-Rodamco S.E. | | | 24 | | | | 6,688 | |
Valeo S.A. | | | 49 | | | | 7,566 | |
Veolia Environnement S.A. | | | 281 | | | | 6,533 | |
Vinci S.A. | | | 95 | | | | 6,413 | |
Vivendi S.A. | | | 255 | | | | 6,137 | |
Zodiac Aerospace | | | 205 | | | | 5,185 | |
| | | | | | | | 306,553 | |
|
| Germany–3.01% | |
adidas AG | | | 85 | | | | 7,623 | |
Allianz S.E. | | | 39 | | | | 6,834 | |
BASF S.E. | | | 78 | | | | 6,393 | |
Bayer AG | | | 46 | | | | 6,139 | |
Bayerische Motoren Werke AG | | | 63 | | | | 6,468 | |
Beiersdorf AG | | | 74 | | | | 7,034 | |
Brenntag AG | | | 115 | | | | 6,949 | |
Commerzbank AG(a) | | | 559 | | | | 6,153 | |
Continental AG | | | 29 | | | | 6,975 | |
Daimler AG | | | 71 | | | | 6,166 | |
Deutsche Bank AG | | | 219 | | | | 6,134 | |
Deutsche Boerse AG | | | 69 | | | | 6,355 | |
Deutsche Lufthansa AG(a) | | | 471 | | | | 6,956 | |
Deutsche Post AG | | | 219 | | | | 6,519 | |
Deutsche Telekom AG | | | 349 | | | | 6,526 | |
E.ON S.E. | | | 572 | | | | 6,037 | |
Fresenius Medical Care AG & Co. KGaA | | | 78 | | | | 7,024 | |
Fresenius S.E. & Co. KGaA | | | 86 | | | | 6,313 | |
GEA Group AG | | | 159 | | | | 6,366 | |
HeidelbergCement AG | | | 82 | | | | 6,112 | |
Henkel AG & Co. KGaA–Preference Shares | | | 59 | | | | 6,404 | |
Infineon Technologies AG | | | 540 | | | | 6,648 | |
K+S AG | | | 167 | | | | 4,216 | |
| | | | | | | | |
| | | Shares | | | Value | |
| Germany–(continued) | |
Linde AG | | | 35 | | | $ | 6,072 | |
Merck KGaA | | | 66 | | | | 6,438 | |
Metro AG | | | 204 | | | | 6,288 | |
Muenchener Rueckversicherungs-Gesellschaft AG | | | 33 | | | | 6,587 | |
Porsche Automobil Holding S.E.–Preference Shares | | | 80 | | | | 3,748 | |
ProSiebenSat.1 Media SE | | | 125 | | | | 6,762 | |
RWE AG | | | 428 | | | | 5,956 | |
SAP S.E. | | | 96 | | | | 7,588 | |
Siemens AG | | | 64 | | | | 6,440 | |
Symrise AG | | | 106 | | | | 6,982 | |
ThyssenKrupp AG | | | 296 | | | | 5,972 | |
Volkswagen AG–Preference Shares | | | 33 | | | | 3,967 | |
Vonovia S.E. | | | 182 | | | | 6,063 | |
| | | | | | | | 227,207 | |
|
| Hong Kong–4.83% | |
AIA Group Ltd. | | | 1,200 | | | | 7,007 | |
ASM Pacific Technology Ltd. | | | 800 | | | | 5,664 | |
Bank of East Asia, Ltd. (The) | | | 2,000 | | | | 7,455 | |
Brightoil Petroleum (Holdings) Ltd.(a) | | | 17,000 | | | | 6,025 | |
Cathay Pacific Airways Ltd. | | | 4,000 | | | | 7,936 | |
Cheung Kong Infrastructure Holdings Ltd. | | | 1,000 | | | | 9,286 | |
China Innovative Finance Group Ltd.(a) | | | 60,000 | | | | 5,848 | |
Chinese Estates Holdings Ltd. | | | 3,000 | | | | 6,967 | |
CK Hutchison Holdings Ltd. | | | 500 | | | | 6,830 | |
CLP Holdings Ltd. | | | 1,000 | | | | 8,697 | |
Dairy Farm International Holdings Ltd. | | | 1,000 | | | | 6,575 | |
Esprit Holdings Ltd. | | | 7,800 | | | | 8,738 | |
First Pacific Co. Ltd. | | | 10,000 | | | | 6,825 | |
Galaxy Entertainment Group Ltd. | | | 2,000 | | | | 6,806 | |
Global Brands Group Holding Ltd.(a) | | | 36,000 | | | | 7,427 | |
Goldin Properties Holdings Ltd.(a) | | | 6,000 | | | | 5,138 | |
Haitong International Securities Group Ltd. | | | 10,000 | | | | 5,513 | |
Hang Lung Group Ltd. | | | 2,000 | | | | 7,240 | |
Hang Lung Properties Ltd. | | | 3,000 | | | | 7,328 | |
Hang Seng Bank Ltd. | | | 400 | | | | 7,324 | |
Henderson Land Development Co. Ltd. | | | 1,310 | | | | 8,338 | |
HK Electric Investments and HK Electric Investments Ltd.(d) | | | 9,500 | | | | 7,293 | |
Hong Kong & China Gas Co. Ltd. | | | 3,730 | | | | 7,559 | |
Hong Kong Exchanges & Clearing Ltd. | | | 300 | | | | 7,832 | |
Hongkong Land Holdings Ltd. | | | 1,000 | | | | 7,487 | |
Hopewell Holdings Ltd. | | | 2,000 | | | | 7,212 | |
Hysan Development Co. Ltd. | | | 2,000 | | | | 8,853 | |
Jardine Matheson Holdings Ltd. | | | 100 | | | | 5,424 | |
Jardine Strategic Holdings Ltd. | | | 200 | | | | 6,034 | |
Kerry Properties Ltd. | | | 2,000 | | | | 5,914 | |
Li & Fung Ltd. | | | 10,000 | | | | 8,073 | |
Link REIT | | | 1,000 | | | | 5,940 | |
MTR Corp. Ltd. | | | 1,500 | | | | 6,787 | |
New World Development Co. Ltd. | | | 7,000 | | | | 7,462 | |
See accompanying Notes to Financial Statements which are an integral part of the financial statements.
11 Invesco Macro International Equity Fund
| | | | | | | | |
| | | Shares | | | Value | |
| Hong Kong–(continued) | |
Noble Group Ltd. | | | 17,300 | | | $ | 6,216 | |
NWS Holdings Ltd. | | | 5,000 | | | | 7,510 | |
PCCW Ltd. | | | 12,000 | | | | 6,479 | |
Power Assets Holdings Ltd. | | | 500 | | | | 4,972 | |
Sands China Ltd. | | | 2,000 | | | | 7,179 | |
Shangri-La Asia Ltd. | | | 6,000 | | | | 5,490 | |
Sino Land Co. Ltd. | | | 4,000 | | | | 6,164 | |
SJM Holdings Ltd. | | | 7,000 | | | | 5,802 | |
Sun Hung Kai Properties Ltd. | | | 1,000 | | | | 13,345 | |
Suncorp Technologies Ltd.(a) | | | 110,000 | | | | 3,021 | |
Swire Pacific Ltd.–Class A | | | 500 | | | | 5,775 | |
Swire Properties Ltd. | | | 2,200 | | | | 6,590 | |
Techtronic Industries Co. Ltd. | | | 1,500 | | | | 5,475 | |
Television Broadcasts Ltd. | | | 1,600 | | | | 5,819 | |
Value Partners Group Ltd. | | | 5,000 | | | | 5,280 | |
VTech Holdings Ltd. | | | 500 | | | | 6,060 | |
WH Group Ltd.(a)(d) | | | 12,500 | | | | 6,895 | |
Wharf Holdings Ltd. (The) | | | 1,000 | | | | 5,937 | |
Wheelock and Co. Ltd. | | | 1,000 | | | | 4,648 | |
Yue Yuen Industrial (Holdings) Ltd. | | | 1,500 | | | | 5,468 | |
| | | | | | | | 364,962 | |
|
| Hungary–0.16% | |
MOL Hungarian Oil and Gas PLC | | | 118 | | | | 5,336 | |
Richter Gedeon Nyrt | | | 386 | | | | 6,444 | |
| | | | | | | | 11,780 | |
|
| India–0.32% | |
HDFC Bank Ltd.–ADR | | | 103 | | | | 6,297 | |
Infosys Ltd.–ADR | | | 342 | | | | 6,211 | |
Reliance Industries Ltd.–GDR(d) | | | 214 | | | | 6,142 | |
Wipro Ltd.–ADR | | | 478 | | | | 5,918 | |
| | | | | | | | 24,568 | |
|
| Indonesia–0.44% | |
Golden Agri-Resources Ltd. | | | 30,300 | | | | 8,415 | |
PT Bank Central Asia Tbk | | | 7,500 | | | | 7,043 | |
PT Bank Mandiri Persero Tbk | | | 9,400 | | | | 5,946 | |
PT Kalbe Farma Tbk | | | 50,900 | | | | 5,293 | |
PT Telekomunikasi Indonesia Persero Tbk | | | 32,600 | | | | 6,450 | |
| | | | | | | | 33,147 | |
|
| Ireland–0.89% | |
CRH PLC | | | 224 | | | | 6,124 | |
Experian PLC | | | 1,620 | | | | 27,628 | |
Kerry Group PLC–Class A | | | 87 | | | | 7,075 | |
Shire PLC | | | 351 | | | | 26,582 | |
| | | | | | | | 67,409 | |
|
| Italy–1.01% | |
Assicurazioni Generali S.p.A. | | | 352 | | | | 6,674 | |
Atlantia S.p.A. | | | 225 | | | | 6,235 | |
Enel S.p.A. | | | 1,373 | | | | 6,336 | |
Eni S.p.A. | | | 365 | | | | 5,955 | |
| | | | | | | | |
| | | Shares | | | Value | |
| Italy–(continued) | |
Intesa Sanpaolo S.p.A. | | | 1,718 | | | $ | 5,985 | |
Luxottica Group S.p.A. | | | 90 | | | | 6,297 | |
Prada S.p.A. | | | 1,700 | | | | 6,909 | |
Snam S.p.A. | | | 1,251 | | | | 6,471 | |
Telecom Italia S.p.A.(a) | | | 5,047 | | | | 7,030 | |
Terna–Rete Elettrica Nazionale S.p.A. | | | 1,310 | | | | 6,659 | |
UniCredit S.p.A. | | | 953 | | | | 6,162 | |
Unione di Banche Italiane S.p.A. | | | 789 | | | | 5,890 | |
| | | | | | | | 76,603 | |
|
| Japan–17.99% | |
Aeon Co., Ltd. | | | 400 | | | | 5,910 | |
Aisin Seiki Co., Ltd. | | | 200 | | | | 7,915 | |
Alps Electric Co., Ltd. | | | 200 | | | | 6,159 | |
Amada Holdings Co., Ltd. | | | 700 | | | | 6,204 | |
ANA Holdings Inc. | | | 2,000 | | | | 5,954 | |
Aozora Bank, Ltd. | | | 1,000 | | | | 3,642 | |
Asahi Glass Co., Ltd. | | | 1,000 | | | | 5,698 | |
Asahi Group Holdings, Ltd. | | | 200 | | | | 6,155 | |
Asahi Kasei Corp. | | | 1,000 | | | | 6,117 | |
ASICS Corp. | | | 200 | | | | 5,507 | |
Astellas Pharma Inc. | | | 400 | | | | 5,783 | |
Bandai Namco Holdings Inc. | | | 200 | | | | 4,899 | |
Bank of Kyoto, Ltd. (The) | | | 1,000 | | | | 10,050 | |
Bank of Yokohama, Ltd. (The) | | | 1,000 | | | | 6,213 | |
Bridgestone Corp. | | | 200 | | | | 7,333 | |
Brother Industries, Ltd. | | | 400 | | | | 5,093 | |
Canon Inc. | | | 200 | | | | 5,974 | |
Casio Computer Co., Ltd. | | | 300 | | | | 5,631 | |
Chiba Bank, Ltd. (The) | | | 1,000 | | | | 7,267 | |
Chubu Electric Power Co., Inc. | | | 300 | | | | 4,600 | |
Chugai Pharmaceutical Co., Ltd. | | | 100 | | | | 3,207 | |
Chugoku Bank, Ltd. (The) | | | 400 | | | | 5,640 | |
Chugoku Electric Power Co., Inc. (The) | | | 400 | | | | 6,031 | |
Credit Saison Co., Ltd. | | | 300 | | | | 6,141 | |
Dai Nippon Printing Co., Ltd. | | | 1,000 | | | | 10,306 | |
Dai-ichi Life Insurance Co. Ltd. (The) | | | 300 | | | | 5,187 | |
Daicel Corp. | | | 400 | | | | 5,263 | |
Daihatsu Motor Co., Ltd. | | | 400 | | | | 4,879 | |
Daiichi Sankyo Co., Ltd. | | | 300 | | | | 5,848 | |
Daikin Industries, Ltd. | | | 100 | | | | 6,402 | |
Daito Trust Construction Co., Ltd. | | | 100 | | | | 10,817 | |
Daiwa House Industry Co., Ltd. | | | 200 | | | | 5,222 | |
Daiwa Securities Group Inc. | | | 1,000 | | | | 6,820 | |
Denso Corp. | | | 100 | | | | 4,630 | |
Dentsu Inc. | | | 100 | | | | 5,602 | |
Don Quijote Holdings Co., Ltd. | | | 100 | | | | 3,667 | |
East Japan Railway Co. | | | 100 | | | | 9,493 | |
Eisai Co., Ltd. | | | 100 | | | | 6,221 | |
Electric Power Development Co., Ltd. | | | 200 | | | | 6,569 | |
Fuji Heavy Industries Ltd. | | | 200 | | | | 7,722 | |
FUJIFILM Holdings Corp. | | | 100 | | | | 3,975 | |
See accompanying Notes to Financial Statements which are an integral part of the financial statements.
12 Invesco Macro International Equity Fund
| | | | | | | | |
| | | Shares | | | Value | |
| Japan–(continued) | |
Fujitsu Ltd. | | | 1,000 | | | $ | 4,705 | |
Fukuoka Financial Group, Inc. | | | 1,000 | | | | 5,241 | |
Gunma Bank, Ltd. (The) | | | 1,000 | | | | 6,265 | |
Hachijuni Bank, Ltd. (The) | | | 1,000 | | | | 6,776 | |
Hamamatsu Photonics K.K. | | | 200 | | | | 5,113 | |
Hankyu Hanshin Holdings, Inc. | | | 1,000 | | | | 6,515 | |
Hino Motors, Ltd. | | | 600 | | | | 6,826 | |
Hirose Electric Co., Ltd. | | | 100 | | | | 12,064 | |
Hiroshima Bank, Ltd. (The) | | | 1,000 | | | | 5,532 | |
Hisamitsu Pharmaceutical Co., Inc. | | | 100 | | | | 3,867 | |
Hitachi, Ltd. | | | 1,000 | | | | 5,744 | |
Hokuhoku Financial Group, Inc. | | | 2,000 | | | | 4,423 | |
Hokuriku Electric Power Co. | | | 400 | | | | 5,950 | |
Honda Motor Co., Ltd. | | | 200 | | | | 6,640 | |
Hoya Corp. | | | 100 | | | | 4,110 | |
Hulic Co., Ltd. | | | 700 | | | | 6,517 | |
IHI Corp. | | | 2,000 | | | | 5,636 | |
INPEX Corp. | | | 500 | | | | 4,766 | |
Isetan Mitsukoshi Holdings Ltd. | | | 300 | | | | 4,794 | |
Isuzu Motors Ltd. | | | 600 | | | | 6,973 | |
ITOCHU Corp. | | | 600 | | | | 7,474 | |
Iyo Bank, Ltd. (The) | | | 600 | | | | 6,419 | |
J. Front Retailing Co., Ltd. | | | 400 | | | | 6,544 | |
Japan Airlines Co. Ltd. | | | 200 | | | | 7,521 | |
Japan Airport Terminal Co., Ltd. | | | 100 | | | | 5,424 | |
Japan Exchange Group Inc. | | | 400 | | | | 6,415 | |
Japan Real Estate Investment Corp. | | | 1 | | | | 4,618 | |
Japan Retail Fund Investment Corp. | | | 3 | | | | 5,801 | |
Japan Tobacco, Inc. | | | 100 | | | | 3,455 | |
JFE Holdings, Inc. | | | 400 | | | | 6,255 | |
Joyo Bank, Ltd. (The) | | | 1,000 | | | | 5,172 | |
JSR Corp. | | | 300 | | | | 4,727 | |
JTEKT Corp. | | | 400 | | | | 6,857 | |
JX Holdings, Inc. | | | 1,500 | | | | 5,861 | |
Kajima Corp. | | | 1,000 | | | | 5,722 | |
Kansai Electric Power Co., Inc. (The)(a) | | | 400 | | | | 5,096 | |
Kansai Paint Co., Ltd. | | | 400 | | | | 6,067 | |
Kao Corp. | | | 100 | | | | 5,108 | |
Kawasaki Heavy Industries, Ltd. | | | 1,000 | | | | 3,991 | |
KDDI Corp. | | | 200 | | | | 4,831 | |
Keikyu Corp. | | | 1,000 | | | | 8,198 | |
Keio Corp. | | | 1,000 | | | | 8,115 | |
Keisei Electric Railway Co., Ltd. | | | 1,000 | | | | 12,278 | |
Kintetsu Group Holdings Co., Ltd. | | | 1,000 | | | | 3,859 | |
Kirin Holdings Co., Ltd. | | | 400 | | | | 5,645 | |
Kobe Steel, Ltd. | | | 4,000 | | | | 5,026 | |
Koito Manufacturing Co., Ltd. | | | 200 | | | | 7,551 | |
Komatsu Ltd. | | | 300 | | | | 4,953 | |
Konica Minolta Inc. | | | 600 | | | | 6,162 | |
Kuraray Co., Ltd. | | | 600 | | | | 7,374 | |
Kyocera Corp. | | | 100 | | | | 4,508 | |
| | | | | | | | |
| | | Shares | | | Value | |
| Japan–(continued) | |
Kyushu Electric Power Co., Inc.(a) | | | 600 | | | $ | 7,235 | |
Lawson, Inc. | | | 100 | | | | 7,378 | |
LIXIL Group Corp. | | | 200 | | | | 4,271 | |
Mabuchi Motor Co., Ltd. | | | 100 | | | | 4,904 | |
Makita Corp. | | | 100 | | | | 5,454 | |
Marubeni Corp. | | | 1,100 | | | | 6,335 | |
Mazda Motor Corp. | | | 300 | | | | 5,891 | |
Medipal Holdings Corp. | | | 300 | | | | 5,220 | |
MEIJI Holdings Co., Ltd. | | | 100 | | | | 7,837 | |
Mitsubishi Chemical Holdings Corp. | | | 1,100 | | | | 6,835 | |
Mitsubishi Corp. | | | 300 | | | | 5,435 | |
Mitsubishi Electric Corp. | | | 1,000 | | | | 10,371 | |
Mitsubishi Heavy Industries, Ltd. | | | 1,000 | | | | 5,033 | |
Mitsubishi Materials Corp. | | | 2,000 | | | | 6,940 | |
Mitsubishi Motors Corp. | | | 800 | | | | 7,080 | |
Mitsubishi Tanabe Pharma Corp. | | | 300 | | | | 5,061 | |
Mitsubishi UFJ Financial Group, Inc. | | | 900 | | | | 5,820 | |
Mitsui & Co., Ltd. | | | 400 | | | | 5,053 | |
Mitsui Chemicals, Inc. | | | 2,000 | | | | 7,536 | |
Mitsui O.S.K. Lines, Ltd. | | | 2,000 | | | | 5,318 | |
Mizuho Financial Group, Inc. | | | 2,800 | | | | 5,726 | |
MS&AD Insurance Group Holdings, Inc. | | | 200 | | | | 5,869 | |
Nagoya Railroad Co., Ltd. | | | 1,000 | | | | 4,128 | |
NEC Corp. | | | 2,000 | | | | 6,166 | |
NGK Spark Plug Co., Ltd. | | | 200 | | | | 4,867 | |
Nidec Corp. | | | 100 | | | | 7,514 | |
Nikon Corp. | | | 400 | | | | 5,158 | |
Nippon Building Fund Inc. | | | 1 | | | | 4,739 | |
Nippon Express Co., Ltd. | | | 1,000 | | | | 5,129 | |
Nippon Paint Holdings Co., Ltd. | | | 300 | | | | 6,309 | |
Nippon Steel & Sumitomo Metal Corp. | | | 300 | | | | 6,068 | |
Nippon Telegraph & Telephone Corp. | | | 100 | | | | 3,672 | |
Nippon Television Holdings, Inc. | | | 300 | | | | 5,185 | |
Nippon Yusen Kabushiki Kaisha | | | 2,000 | | | | 5,208 | |
Nissan Motor Co., Ltd. | | | 700 | | | | 7,262 | |
Nisshin Seifun Group Inc. | | | 400 | | | | 6,087 | |
Nissin Foods Holdings Co., Ltd. | | | 100 | | | | 4,613 | |
Nitori Holdings Co., Ltd. | | | 100 | | | | 7,781 | |
Nitto Denko Corp. | | | 100 | | | | 6,379 | |
NOK Corp. | | | 200 | | | | 4,692 | |
Nomura Holdings, Inc. | | | 1,000 | | | | 6,265 | |
Nomura Research Institute, Ltd. | | | 100 | | | | 4,076 | |
NSK Ltd. | | | 600 | | | | 7,068 | |
NTT Data Corp. | | | 100 | | | | 4,956 | |
NTT DOCOMO, Inc. | | | 300 | | | | 5,889 | |
Obayashi Corp. | | | 1,000 | | | | 8,758 | |
Odakyu Electric Railway Co., Ltd. | | | 1,000 | | | | 9,746 | |
Oji Holdings Corp. | | | 1,000 | | | | 5,167 | |
Olympus Corp. | | | 200 | | | | 6,719 | |
OMRON Corp. | | | 200 | | | | 6,597 | |
Oriental Land Co., Ltd. | | | 100 | | | | 6,052 | |
See accompanying Notes to Financial Statements which are an integral part of the financial statements.
13 Invesco Macro International Equity Fund
| | | | | | | | |
| | | Shares | | | Value | |
| Japan–(continued) | |
ORIX Corp. | | | 400 | | | $ | 5,848 | |
Osaka Gas Co., Ltd. | | | 1,000 | | | | 3,928 | |
Otsuka Holdings Co., Ltd. | | | 200 | | | | 6,616 | |
Panasonic Corp. | | | 600 | | | | 7,041 | |
Rakuten Inc. | | | 400 | | | | 5,536 | |
Recruit Holdings Co., Ltd. | | | 200 | | | | 6,415 | |
Resona Holdings, Inc. | | | 1,200 | | | | 6,328 | |
Ricoh Co., Ltd. | | | 600 | | | | 6,451 | |
Rinnai Corp. | | | 100 | | | | 7,895 | |
Rohm Co. Ltd. | | | 100 | | | | 4,914 | |
Santen Pharmaceutical Co., Ltd. | | | 300 | | | | 4,057 | |
SECOM Co., Ltd. | | | 100 | | | | 6,651 | |
Sega Sammy Holdings Inc. | | | 600 | | | | 6,293 | |
Seibu Holdings Inc. | | | 200 | | | | 4,043 | |
Seiko Epson Corp. | | | 300 | | | | 4,568 | |
Sekisui Chemical Co., Ltd. | | | 600 | | | | 7,051 | |
Sekisui House, Ltd. | | | 400 | | | | 6,636 | |
Seven & i Holdings Co., Ltd. | | | 100 | | | | 4,519 | |
Shikoku Electric Power Co. Inc. | | | 300 | | | | 5,070 | |
Shimizu Corp. | | | 1,000 | | | | 8,733 | |
Shin-Etsu Chemical Co., Ltd. | | | 100 | | | | 5,921 | |
Shinsei Bank, Ltd. | | | 3,000 | | | | 6,264 | |
Shionogi & Co., Ltd. | | | 100 | | | | 4,088 | |
Shiseido Co., Ltd. | | | 300 | | | | 7,076 | |
Shizuoka Bank, Ltd. (The) | | | 1,000 | | | | 9,971 | |
SoftBank Group Corp. | | | 100 | | | | 5,566 | |
Sompo Japan Nipponkoa Holdings Inc. | | | 200 | | | | 6,235 | |
Sony Corp. | | | 200 | | | | 5,672 | |
Sony Financial Holdings Inc. | | | 300 | | | | 5,361 | |
Stanley Electric Co., Ltd. | | | 300 | | | | 5,699 | |
Sumitomo Chemical Co., Ltd. | | | 1,000 | | | | 5,708 | |
Sumitomo Corp. | | | 500 | | | | 5,479 | |
Sumitomo Electric Industries, Ltd. | | | 400 | | | | 5,442 | |
Sumitomo Heavy Industries, Ltd. | | | 1,000 | | | | 4,486 | |
Sumitomo Mitsui Financial Group, Inc. | | | 100 | | | | 3,976 | |
Sumitomo Mitsui Trust Holdings, Inc. | | | 1,000 | | | | 3,827 | |
Suntory Beverage & Food Ltd. | | | 100 | | | | 4,039 | |
Suruga Bank Ltd. | | | 300 | | | | 5,889 | |
Suzuken Co., Ltd./Aichi Japan | | | 100 | | | | 3,821 | |
Suzuki Motor Corp. | | | 200 | | | | 6,529 | |
Sysmex Corp. | | | 100 | | | | 5,715 | |
T&D Holdings, Inc. | | | 400 | | | | 5,226 | |
Taiheiyo Cement Corp. | | | 2,000 | | | | 6,573 | |
Taisei Corp. | | | 1,000 | | | | 6,491 | |
Taisho Pharmaceutical Holdings Co. Ltd. | | | 100 | | | | 6,221 | |
Takashimaya Co., Ltd. | | | 1,000 | | | | 8,908 | |
Takeda Pharmaceutical Co. Ltd. | | | 100 | | | | 4,861 | |
TDK Corp. | | | 100 | | | | 6,343 | |
Teijin Ltd. | | | 2,000 | | | | 7,037 | |
Terumo Corp. | | | 200 | | | | 5,905 | |
THK Co., Ltd. | | | 300 | | | | 5,643 | |
| | | | | | | | |
| | | Shares | | | Value | |
| Japan–(continued) | |
Tobu Railway Co., Ltd. | | | 1,000 | | | $ | 4,824 | |
Toho Co., Ltd. | | | 200 | | | | 5,197 | |
Toho Gas Co., Ltd. | | | 1,000 | | | | 6,111 | |
Tohoku Electric Power Co., Inc. | | | 400 | | | | 5,596 | |
Tokio Marine Holdings, Inc. | | | 100 | | | | 3,831 | |
Tokyo Electric Power Co. Inc.(a) | | | 900 | | | | 6,120 | |
Tokyo Electron Ltd. | | | 100 | | | | 5,971 | |
Tokyo Gas Co., Ltd. | | | 1,000 | | | | 4,938 | |
Tokyo Tatemono Co., Ltd. | | | 400 | | | | 4,948 | |
Tokyu Corp. | | | 1,000 | | | | 8,083 | |
Tokyu Fudosan Holdings, Corp. | | | 900 | | | | 6,306 | |
TonenGeneral Sekiyu K.K. | | | 1,000 | | | | 10,390 | |
Toppan Printing Co., Ltd. | | | 1,000 | | | | 8,938 | |
Toray Industries, Inc. | | | 1,000 | | | | 8,706 | |
Toshiba Corp. | | | 2,000 | | | | 5,625 | |
TOTO Ltd. | | | 200 | | | | 6,742 | |
Toyo Suisan Kaisha, Ltd. | | | 100 | | | | 3,682 | |
Toyota Industries Corp. | | | 100 | | | | 5,235 | |
Toyota Motor Corp. | | | 100 | | | | 6,123 | |
Toyota Tsusho Corp. | | | 200 | | | | 4,559 | |
Trend Micro Inc. | | | 100 | | | | 3,884 | |
Unicharm Corp. | | | 300 | | | | 6,394 | |
United Urban Investment Corp. | | | 4 | | | | 5,538 | |
USS Co., Ltd. | | | 300 | | | | 5,287 | |
West Japan Railway Co. | | | 100 | | | | 6,996 | |
Yahoo Japan Corp. | | | 1,400 | | | | 5,921 | |
Yakult Honsha Co., Ltd. | | | 100 | | | | 5,269 | |
Yamada Denki Co., Ltd. | | | 1,500 | | | | 6,759 | |
Yamaha Motor Co., Ltd. | | | 300 | | | | 6,722 | |
Yamato Holdings Co., Ltd. | | | 300 | | | | 5,883 | |
Yaskawa Electric Corp. | | | 600 | | | | 7,102 | |
Yokogawa Electric Corp. | | | 600 | | | | 6,678 | |
| | | | | | | | 1,359,005 | |
|
| Luxembourg–0.14% | |
ArcelorMittal S.A. | | | 830 | | | | 4,614 | |
Tenaris S.A. | | | 470 | | | | 5,926 | |
| | | | | | | | 10,540 | |
|
| Macau–0.16% | |
MGM China Holdings Ltd. | | | 4,000 | | | | 5,825 | |
Wynn Macau, Ltd. | | | 4,400 | | | | 6,030 | |
| | | | | | | | 11,855 | |
|
| Malaysia–2.29% | |
AMMB Holdings Berhad | | | 7,400 | | | | 8,202 | |
Axiata Group Berhad | | | 6,200 | | | | 8,894 | |
British American Tobacco Malaysia Berhad | | | 488 | | | | 7,004 | |
DiGi.Com Berhad | | | 7,100 | | | | 8,683 | |
Gamuda Berhad | | | 7,100 | | | | 7,413 | |
Genting Berhad | | | 3,600 | | | | 6,195 | |
Genting Malaysia Berhad | | | 6,200 | | | | 6,190 | |
Hong Leong Bank Berhad | | | 3,600 | | | | 11,651 | |
See accompanying Notes to Financial Statements which are an integral part of the financial statements.
14 Invesco Macro International Equity Fund
| | | | | | | | |
| | | Shares | | | Value | |
| Malaysia–(continued) | |
IHH Healthcare Berhad | | | 5,800 | | | $ | 8,509 | |
IJM Corp. Berhad | | | 11,600 | | | | 8,954 | |
IOI Corp. Berhad | | | 8,700 | | | | 8,592 | |
Kuala Lumpur Kepong Berhad | | | 1,200 | | | | 6,355 | |
Malayan Banking Berhad | | | 4,500 | | | | 8,620 | |
Maxis Berhad | | | 4,700 | | | | 7,201 | |
MISC Berhad | | | 3,200 | | | | 6,718 | |
Petronas Gas Berhad | | | 1,500 | | | | 7,977 | |
Public Bank Berhad | | | 3,100 | | | | 13,013 | |
Sime Darby Berhad | | | 4,700 | | | | 9,120 | |
Telekom Malaysia Berhad | | | 5,200 | | | | 8,052 | |
Tenaga Nasional Berhad | | | 2,800 | | | | 8,224 | |
UMW Holdings Berhad | | | 4,000 | | | | 7,644 | |
| | | | | | | | 173,211 | |
|
| Mexico–1.55% | |
America Movil S.A.B. de C.V.–Series L | | | 7,700 | | | | 6,851 | |
Arca Continental S.A.B. de C.V. | | | 1,300 | | | | 8,302 | |
Coca-Cola Femsa, S.A.B. de C.V.–Series L | | | 1,000 | | | | 7,670 | |
El Puerto de Liverpool, S.A.B. de C.V.–Series C1 | | | 500 | | | | 6,964 | |
Fibra Uno Administracion S.A. de C.V. | | | 3,700 | | | | 8,112 | |
Fomento Economico Mexicano, S.A.B. de C.V.–Series BD(e) | | | 800 | | | | 7,894 | |
Grupo Bimbo, S.A.B. de C.V.–Series A(a) | | | 2,400 | | | | 6,786 | |
Grupo Financiero Banorte S.A.B. de C.V.–Class O | | | 1,300 | | | | 6,958 | |
Grupo Financiero Inbursa, S.A.B. de C.V.–Class O | | | 2,800 | | | | 5,610 | |
Grupo Financiero Santander Mexico, S.A.B. de C.V.–Class B | | | 3,600 | | | | 6,613 | |
Grupo Lala, S.A.B. de C.V. | | | 2,600 | | | | 6,640 | |
Grupo Mexico S.A.B. de C.V.–Series B | | | 2,300 | | | | 5,605 | |
Grupo Televisa S.A.B.–Series CPO(f) | | | 1,100 | | | | 6,401 | |
Infraestructura Enérgetica Nova, S.A.B. de C.V. | | | 1,400 | | | | 6,728 | |
Kimberly-Clark de Mexico, S.A.B. de C.V.–Class A | | | 2,500 | | | | 5,982 | |
Promotora y Operadora de Infraestructura, S.A.B. de C.V.(a) | | | 600 | | | | 7,542 | |
Wal-Mart de México, S.A.B. de C.V.–Class V | | | 2,400 | | | | 6,356 | |
| | | | | | | | 117,014 | |
|
| Netherlands–1.08% | |
Aegon N.V. | | | 1,028 | | | | 6,314 | |
Akzo Nobel N.V. | | | 87 | | | | 6,147 | |
ASML Holding N.V. | | | 64 | | | | 5,933 | |
Gemalto N.V. | | | 89 | | | | 5,584 | |
Heineken Holding N.V. | | | 89 | | | | 7,120 | |
Heineken N.V. | | | 79 | | | | 7,204 | |
ING Groep N.V. | | | 402 | | | | 5,830 | |
Koninklijke Ahold N.V. | | | 323 | | | | 6,562 | |
Koninklijke DSM N.V. | | | 118 | | | | 6,283 | |
Koninklijke KPN N.V. | | | 1,543 | | | | 5,651 | |
Koninklijke Philips N.V. | | | 238 | | | | 6,420 | |
Randstad Holding N.V. | | | 99 | | | | 5,896 | |
Wolters Kluwer N.V. | | | 189 | | | | 6,384 | |
| | | | | | | | 81,328 | |
| | | | | | | | |
| | | Shares | | | Value | |
| New Zealand–1.06% | |
Auckland International Airport Ltd. | | | 2,113 | | | $ | 7,503 | |
Contact Energy Ltd. | | | 1,962 | | | | 6,885 | |
Fisher & Paykel Healthcare Corp. Ltd. | | | 1,412 | | | | 7,430 | |
Fletcher Building Ltd. | | | 1,459 | | | | 7,371 | |
Kiwi Property Group Ltd. | | | 7,801 | | | | 7,176 | |
Meridian Energy Ltd. | | | 4,801 | | | | 7,197 | |
Ryman Healthcare Ltd. | | | 1,380 | | | | 7,366 | |
SKY Network Television Ltd. | | | 2,214 | | | | 6,796 | |
SKYCITY Entertainment Group Ltd. | | | 2,635 | | | | 7,134 | |
Spark New Zealand Ltd. | | | 3,199 | | | | 7,279 | |
Z Energy Ltd. | | | 1,734 | | | | 7,868 | |
| | | | | | | | 80,005 | |
|
| Norway–0.58% | |
DNB ASA | | | 605 | | | | 7,676 | |
Orkla ASA | | | 1,150 | | | | 9,779 | |
Statoil ASA | | | 577 | | | | 9,313 | |
Telenor ASA | | | 410 | | | | 7,718 | |
Yara International ASA | | | 199 | | | | 9,034 | |
| | | | | | | | 43,520 | |
|
| Philippines–0.93% | |
Ayala Corp. | | | 450 | | | | 7,474 | |
Ayala Land, Inc. | | | 7,300 | | | | 5,567 | |
Bank of the Philippine Islands | | | 4,170 | | | | 7,530 | |
BDO Unibank, Inc. | | | 3,260 | | | | 7,025 | |
Energy Development Corp. | | | 47,100 | | | | 6,645 | |
Jollibee Foods Corp. | | | 1,410 | | | | 6,190 | |
Manila Electric Co. | | | 1,390 | | | | 9,631 | |
Metropolitan Bank & Trust Co. | | | 4,000 | | | | 7,250 | |
Philippine Long Distance Telephone Co. | | | 125 | | | | 5,892 | |
SM Investments Corp. | | | 380 | | | | 7,075 | |
| | | | | | | | 70,279 | |
|
| Poland–0.40% | |
Alior Bank S.A.(a) | | | 232 | | | | 4,878 | |
Bank Pekao S.A. | | | 139 | | | | 5,397 | |
PGE Polska Grupa Energetyczna S.A. | | | 1,321 | | | | 4,905 | |
Powszechna Kasa Oszczednosci Bank Polski S.A.(a) | | | 704 | | | | 5,210 | |
Powszechny Zaklad Ubezpieczen S.A. | | | 57 | | | | 5,532 | |
Tauron Polska Energia S.A. | | | 5,195 | | | | 4,074 | |
| | | | | | | | 29,996 | |
|
| Portugal–0.09% | |
Energias de Portugal, S.A. | | | 1,822 | | | | 6,732 | |
|
| Qatar–0.17% | |
Commercial Bank of Qatar Q.S.C. (The) | | | 446 | | | | 6,518 | |
Qatar National Bank | | | 121 | | | | 6,067 | |
| | | | | | | | 12,585 | |
|
| Singapore–2.53% | |
Ascendas REIT | | | 4,200 | | | | 7,141 | |
CapitaLand Commercial Trust Ltd. | | | 6,600 | | | | 6,623 | |
CapitaLand Ltd. | | | 3,200 | | | | 7,040 | |
See accompanying Notes to Financial Statements which are an integral part of the financial statements.
15 Invesco Macro International Equity Fund
| | | | | | | | |
| | | Shares | | | Value | |
| Singapore–(continued) | |
CapitaLand Mall Trust | | | 4,900 | | | $ | 6,926 | |
City Developments Ltd. | | | 1,100 | | | | 6,223 | |
ComfortDelGro Corp. Ltd. | | | 3,200 | | | | 6,911 | |
DBS Group Holdings Ltd. | | | 500 | | | | 6,164 | |
Genting Singapore PLC | | | 12,500 | | | | 7,272 | |
Great Eastern Holdings Ltd. | | | 500 | | | | 7,620 | |
Jardine Cycle & Carriage Ltd. | | | 300 | | | | 6,944 | |
Keppel Corp. Ltd. | | | 1,300 | | | | 6,526 | |
Keppel REIT | | | 9,600 | | | | 6,600 | |
Oversea-Chinese Banking Corp. Ltd. | | | 1,000 | | | | 6,420 | |
SATS Ltd. | | | 2,500 | | | | 6,764 | |
Sembcorp Industries Ltd. | | | 2,600 | | | | 6,606 | |
Sembcorp Marine Ltd. | | | 3,800 | | | | 6,347 | |
Singapore Airlines Ltd. | | | 900 | | | | 6,918 | |
Singapore Exchange Ltd. | | | 1,300 | | | | 6,828 | |
Singapore Post Ltd. | | | 5,200 | | | | 7,034 | |
Singapore Press Holdings Ltd. | | | 2,500 | | | | 7,102 | |
Singapore Technologies Engineering Ltd. | | | 3,100 | | | | 7,297 | |
Singapore Telecommunications Ltd. | | | 2,400 | | | | 6,793 | |
StarHub Ltd. | | | 2,500 | | | | 6,405 | |
Suntec REIT | | | 5,900 | | | | 6,949 | |
United Overseas Bank Ltd. | | | 500 | | | | 7,256 | |
UOL Group Ltd. | | | 1,500 | | | | 7,024 | |
Venture Corp. Ltd. | | | 1,100 | | | | 6,488 | |
Wilmar International Ltd. | | | 3,100 | | | | 6,894 | |
| | | | | | | | 191,115 | |
|
| South Africa–1.89% | |
Aspen Pharmacare Holdings Ltd. | | | 230 | | | | 5,157 | |
Barclays Africa Group Ltd. | | | 464 | | | | 5,946 | |
Barloworld Ltd. | | | 927 | | | | 5,236 | |
Bidvest Group Ltd. (The) | | | 285 | | | | 7,289 | |
Discovery Ltd. | | | 560 | | | | 5,979 | |
FirstRand Ltd. | | | 1,584 | | | | 5,803 | |
Growthpoint Properties Ltd. | | | 3,940 | | | | 7,221 | |
Investec Ltd. | | | 776 | | | | 6,403 | |
Liberty Holdings Ltd. | | | 720 | | | | 7,033 | |
MMI Holdings Ltd. | | | 3,151 | | | | 5,714 | |
Mondi Ltd. | | | 249 | | | | 5,791 | |
Nedbank Group Ltd. | | | 340 | | | | 5,644 | |
Pick n Pay Stores Ltd. | | | 1,322 | | | | 6,379 | |
Rand Merchant Insurance Holdings Ltd. | | | 1,930 | | | | 5,980 | |
Redefine Properties Ltd. | | | 8,245 | | | | 6,872 | |
Remgro Ltd. | | | 337 | | | | 6,734 | |
RMB Holdings Ltd. | | | 1,130 | | | | 5,502 | |
SPAR Group Ltd. (The) | | | 462 | | | | 6,636 | |
Standard Bank Group Ltd. | | | 582 | | | | 6,042 | |
Steinhoff International Holdings Ltd. | | | 1,087 | | | | 6,652 | |
Tiger Brands Ltd. | | | 268 | | | | 6,130 | |
Vodacom Group Ltd. | | | 662 | | | | 7,164 | |
Woolworths Holdings Ltd. | | | 761 | | | | 5,629 | |
| | | | | | | | 142,936 | |
| | | | | | | | |
| | | Shares | | | Value | |
| South Korea–0.84% | |
GS Holdings Corp. | | | 159 | | | $ | 6,962 | |
Hana Financial Group Inc. | | | 226 | | | | 5,484 | |
Hyundai Marine & Fire Insurance Co., Ltd. | | | 249 | | | | 7,412 | |
KB Financial Group Inc. | | | 178 | | | | 5,642 | |
Korea Zinc Co., Ltd. | | | 13 | | | | 5,403 | |
KT Corp.(a) | | | 295 | | | | 7,632 | |
LG Electronics Inc. | | | 138 | | | | 5,924 | |
Lotte Confectionery Co., Ltd. | | | 3 | | | | 5,232 | |
LS Corp. | | | 191 | | | | 6,456 | |
Samsung Electronics Co., Ltd. | | | 6 | | | | 7,184 | |
| | | | | | | | 63,331 | |
|
| Spain–1.51% | |
Abertis Infraestructuras S.A. | | | 388 | | | | 6,447 | |
Aena S.A.(a)(d) | | | 54 | | | | 6,027 | |
Amadeus IT Holding S.A.–Class A | | | 153 | | | | 6,511 | |
Banco Bilbao Vizcaya Argentaria, S.A. | | | 649 | | | | 5,580 | |
Banco de Sabadell S.A. | | | 3,181 | | | | 6,153 | |
Banco Popular Espanol S.A. | | | 1,522 | | | | 5,785 | |
Banco Santander S.A. | | | 1,042 | | | | 5,844 | |
Bankia S.A. | | | 5,118 | | | | 6,596 | |
CaixaBank S.A. | | | 1,477 | | | | 5,658 | |
Enagas S.A. | | | 224 | | | | 6,788 | |
Ferrovial S.A. | | | 255 | | | | 6,439 | |
Gas Natural SDG, S.A. | | | 310 | | | | 6,719 | |
Grifols S.A. | | | 146 | | | | 6,772 | |
Iberdrola S.A. | | | 918 | | | | 6,559 | |
Industria de Diseno Textil, S.A. | | | 189 | | | | 7,088 | |
Red Electrica Corp. S.A. | | | 80 | | | | 7,056 | |
Repsol S.A. | | | 458 | | | | 5,780 | |
Telefónica, S.A. | | | 458 | | | | 6,059 | |
| | | | | | | | 113,861 | |
|
| Sweden–1.80% | |
Assa Abloy AB–Class B | | | 449 | | | | 8,906 | |
Atlas Copco AB–Class A | | | 347 | | | | 9,026 | |
Hennes & Mauritz AB–Class B | | | 232 | | | | 9,001 | |
Hexagon AB–Class B | | | 265 | | | | 9,175 | |
Investor AB–Class B | | | 246 | | | | 9,108 | |
Nordea Bank AB | | | 737 | | | | 8,129 | |
Sandvik AB | | | 928 | | | | 8,680 | |
Skandinaviska Enskilda Banken AB–Class A | | | 717 | | | | 7,499 | |
Skanska AB–Class B | | | 436 | | | | 8,470 | |
SKF AB–Class B | | | 453 | | | | 7,948 | |
Svenska Cellulosa AB–Class B | | | 298 | | | | 8,791 | |
Svenska Handelsbanken AB–Class A | | | 571 | | | | 7,745 | |
Swedbank AB–Class A | | | 389 | | | | 8,930 | |
Telefonaktiebolaget LM Ericsson–Class B | | | 880 | | | | 8,558 | |
TeliaSonera AB | | | 1,544 | | | | 7,884 | |
Volvo AB–Class B | | | 807 | | | | 8,355 | |
| | | | | | | | 136,205 | |
See accompanying Notes to Financial Statements which are an integral part of the financial statements.
16 Invesco Macro International Equity Fund
| | | | | | | | |
| | | Shares | | | Value | |
| Switzerland–3.18% | |
ABB Ltd. | | | 456 | | | $ | 8,590 | |
Actelion Ltd. | | | 60 | | | | 8,324 | |
Adecco S.A | | | 109 | | | | 8,096 | |
Cie Financiere Richemont S.A. | | | 116 | | | | 9,923 | |
Credit Suisse Group AG | | | 332 | | | | 8,269 | |
Geberit AG | | | 26 | | | | 8,381 | |
Givaudan S.A. | | | 5 | | | | 8,938 | |
Glencore PLC | | | 13,626 | | | | 23,471 | |
Julius Baer Group Ltd. | | | 181 | | | | 8,970 | |
Kuehne + Nagel International AG | | | 64 | | | | 8,865 | |
LafargeHolcim Ltd. | | | 149 | | | | 8,381 | |
Nestle S.A. | | | 116 | | | | 8,857 | |
Novartis AG | | | 91 | | | | 8,252 | |
Roche Holding AG | | | 33 | | | | 8,940 | |
Schindler Holding AG–Participation Ctfs. | | | 56 | | | | 9,081 | |
SGS S.A. | | | 5 | | | | 9,511 | |
Sika AG | | | 3 | | | | 9,829 | |
Swatch Group AG (The) | | | 22 | | | | 8,590 | |
Swiss Re AG | | | 101 | | | | 9,372 | |
Swisscom AG | | | 16 | | | | 8,240 | |
Syngenta AG | | | 25 | | | | 8,400 | |
UBS Group AG | | | 425 | | | | 8,483 | |
Wolseley PLC | | | 409 | | | | 24,007 | |
Zurich Insurance Group AG | | | 32 | | | | 8,442 | |
| | | | | | | | 240,212 | |
|
| Taiwan–4.11% | |
Asia Cement Corp. | | | 9,140 | | | | 9,422 | |
Cathay Financial Holding Co., Ltd. | | | 4,250 | | | | 6,014 | |
Chailease Holding Co. Ltd. | | | 3,120 | | | | 5,916 | |
Chang Hwa Commercial Bank, Ltd. | | | 16,645 | | | | 8,587 | |
Cheng Shin Rubber Industry Co., Ltd. | | | 5,000 | | | | 9,005 | |
China Development Financial Holding Corp. | | | 17,000 | | | | 4,539 | |
China Steel Chemical Corp. | | | 2,000 | | | | 7,528 | |
China Steel Corp. | | | 15,240 | | | | 9,161 | |
Chunghwa Telecom Co., Ltd. | | | 5,000 | | | | 15,260 | |
CTBC Financial Holding Co. Ltd. | | | 10,288 | | | | 5,605 | |
E.Sun Financial Holding Co. Ltd. | | | 12,303 | | | | 7,354 | |
Far Eastern Department Stores Ltd. | | | 11,000 | | | | 6,590 | |
Far Eastern New Century Corp. | | | 7,323 | | | | 6,621 | |
Far EasTone Telecommunications Co., Ltd. | | | 3,000 | | | | 6,480 | |
First Financial Holding Co., Ltd. | | | 22,820 | | | | 11,001 | |
Formosa Chemicals & Fibre Corp. | | | 3,000 | | | | 6,834 | |
Formosa Petrochemical Corp. | | | 2,000 | | | | 4,830 | |
Formosa Plastics Corp. | | | 3,000 | | | | 6,918 | |
Fubon Financial Holding Co., Ltd. | | | 3,000 | | | | 4,811 | |
Hon Hai Precision Industry Co., Ltd. | | | 2,478 | | | | 6,544 | |
Hua Nan Financial Holdings Co., Ltd. | | | 19,178 | | | | 9,177 | |
Kenda Rubber Industrial Co., Ltd. | | | 5,300 | | | | 8,474 | |
Lite-On Technology Corp. | | | 6,030 | | | | 6,226 | |
Makalot Industrial Co., Ltd. | | | 1 | | | | 7 | |
Mega Financial Holding Co., Ltd. | | | 10,000 | | | | 7,223 | |
| | | | | | | | |
| | | Shares | | | Value | |
| Taiwan–(continued) | |
Nan Ya Plastics Corp. | | | 3,000 | | | $ | 5,924 | |
President Chain Store Corp. | | | 1,000 | | | | 6,596 | |
Quanta Computer Inc. | | | 3,000 | | | | 5,090 | |
Ruentex Industries Ltd. | | | 3,000 | | | | 5,475 | |
Shin Kong Financial Holding Co., Ltd. | | | 32,338 | | | | 7,689 | |
Simplo Technology Co., Ltd. | | | 2,000 | | | | 7,029 | |
SinoPac Financial Holdings Co., Ltd. | | | 22,501 | | | | 7,371 | |
Standard Foods Corp. | | | 2,000 | | | | 4,783 | |
Synnex Technology International Corp. | | | 6,000 | | | | 6,275 | |
Ta Chong Bank Ltd.(a) | | | 14,000 | | | | 5,907 | |
Taishin Financial Holding Co., Ltd. | | | 19,086 | | | | 7,418 | |
Taiwan Cement Corp. | | | 6,000 | | | | 6,627 | |
Taiwan Cooperative Financial Holding Co. Ltd. | | | 29,025 | | | | 12,915 | |
Taiwan Fertilizer Co., Ltd. | | | 5,000 | | | | 6,341 | |
Taiwan Mobile Co., Ltd. | | | 2,000 | | | | 6,267 | |
Taiwan Semiconductor Manufacturing Co. Ltd. | | | 1,000 | | | | 4,210 | |
Uni-President Enterprises Corp. | | | 3,410 | | | | 5,727 | |
United Microelectronics Corp. | | | 16,000 | | | | 5,802 | |
WPG Holdings Ltd. | | | 7,000 | | | | 7,257 | |
Yuanta Financial Holding Co., Ltd. | | | 13,726 | | | | 5,352 | |
| | | | | | | | 310,182 | |
|
| Thailand–1.46% | |
Advanced Info Service PCL | | | 1,100 | | | | 7,155 | |
Bangkok Bank PCL | | | 1,800 | | | | 8,440 | |
Bangkok Dusit Medical Services PCL–Class F | | | 11,400 | | | | 6,063 | |
BTS Group Holdings PCL | | | 27,900 | | | | 7,544 | |
Central Pattana PCL | | | 4,700 | | | | 6,065 | |
CP ALL PCL | | | 4,500 | | | | 6,296 | |
Home Product Center PCL | | | 32,200 | | | | 6,309 | |
Intouch Holdings PCL | | | 1,700 | | | | 3,572 | |
Intouch Holdings PCL–Class F | | | 2,600 | | | | 5,471 | |
Kasikornbank PCL | | | 1,100 | | | | 5,323 | |
Krung Thai Bank PCL | | | 12,200 | | | | 5,843 | |
Land and Houses PCL | | | 25,700 | | | | 6,155 | |
Siam Cement PCL (The) | | | 500 | | | | 6,324 | |
Siam Commercial Bank PCL (The) | | | 1,700 | | | | 6,343 | |
Thai Beverage PCL | | | 24,700 | | | | 11,861 | |
TMB Bank PCL | | | 81,500 | | | | 6,062 | |
Total Access Communication PCL–NVDR | | | 2,900 | | | | 5,516 | |
| | | | | | | | 110,342 | |
|
| Turkey–0.80% | |
Arcelik A.S. | | | 1,323 | | | | 7,215 | |
BIM Birlesik Magazalar A.S. | | | 383 | | | | 7,790 | |
Coca-Cola Içecek A.S. | | | 484 | | | | 6,134 | |
Enka Insaat ve Sanayi A.S. | | | 3,763 | | | | 6,666 | |
Haci Omer Sabanci Holding A.S. | | | 1,969 | | | | 6,243 | |
Koc Holding A.S. | | | 1,697 | | | | 7,683 | |
Migros Ticaret A.S.(a) | | | 1,028 | | | | 6,064 | |
Petkim PetroKimya Holding A.S.(a) | | | 4,403 | | | | 6,494 | |
Turk Telekomunikasyon A.S. | | | 2,762 | | | | 5,959 | |
| | | | | | | | 60,248 | |
See accompanying Notes to Financial Statements which are an integral part of the financial statements.
17 Invesco Macro International Equity Fund
| | | | | | | | |
| | | Shares | | | Value | |
| United Kingdom–16.80% | |
Anglo American PLC | | | 2,550 | | | $ | 21,370 | |
ARM Holdings PLC | | | 1,807 | | | | 28,557 | |
Associated British Foods PLC | | | 543 | | | | 28,880 | |
AstraZeneca PLC | | | 408 | | | | 26,046 | |
Aviva PLC | | | 3,742 | | | | 27,990 | |
BAE Systems PLC | | | 3,849 | | | | 26,069 | |
Barclays PLC | | | 6,794 | | | | 24,183 | |
BG Group PLC | | | 1,755 | | | | 27,648 | |
BP PLC | | | 5,045 | | | | 29,950 | |
British American Tobacco PLC | | | 504 | | | | 29,919 | |
BT Group PLC | | | 4,035 | | | | 28,851 | |
Burberry Group PLC | | | 1,269 | | | | 25,983 | |
Centrica PLC | | | 7,303 | | | | 25,422 | |
CNH Industrial N.V. | | | 813 | | | | 5,489 | |
Compass Group PLC | | | 1,683 | | | | 28,995 | |
Diageo PLC | | | 1,006 | | | | 29,075 | |
Fiat Chrysler Automobiles N.V.(a) | | | 426 | | | | 6,264 | |
GlaxoSmithKline PLC | | | 1,308 | | | | 28,175 | |
HSBC Holdings PLC | | | 3,454 | | | | 26,982 | |
Imperial Tobacco Group PLC | | | 544 | | | | 29,307 | |
ITV PLC | | | 7,006 | | | | 27,192 | |
Kingfisher PLC | | | 4,876 | | | | 26,504 | |
Land Securities Group PLC | | | 1,396 | | | | 28,777 | |
Legal & General Group PLC | | | 6,896 | | | | 27,735 | |
Lloyds Banking Group PLC | | | 22,571 | | | | 25,614 | |
Marks & Spencer Group PLC | | | 3,392 | | | | 26,783 | |
National Grid PLC | | | 2,020 | | | | 28,754 | |
Next PLC | | | 224 | | | | 27,573 | |
Old Mutual PLC | | | 9,242 | | | | 30,189 | |
Pearson PLC | | | 1,562 | | | | 20,686 | |
Prudential PLC | | | 1,265 | | | | 29,530 | |
Reckitt Benckiser Group PLC | | | 299 | | | | 29,177 | |
RELX N.V. | | | 396 | | | | 6,755 | |
| | | | | | | | |
| | | Shares | | | Value | |
| United Kingdom–(continued) | |
RELX PLC | | | 1,634 | | | $ | 29,212 | |
Rio Tinto Ltd. | | | 179 | | | | 6,404 | |
Rio Tinto PLC | | | 763 | | | | 27,675 | |
Rolls-Royce Holdings PLC–Preference Shares(a) | | | 219,142 | | | | 338 | |
Rolls-Royce Holdings PLC | | | 2,364 | | | | 25,013 | |
Royal Bank of Scotland Group PLC(a) | | | 5,286 | | | | 25,839 | |
Royal Dutch Shell PLC–Class A | | | 1,062 | | | | 27,582 | |
SABMiller PLC | | | 579 | | | | 35,663 | |
Sky PLC | | | 1,671 | | | | 28,180 | |
Smith & Nephew PLC | | | 1,482 | | | | 25,296 | |
SSE PLC | | | 1,176 | | | | 27,431 | |
Standard Chartered PLC | | | 2,390 | | | | 26,529 | |
Standard Life PLC | | | 4,239 | | | | 27,416 | |
Tesco PLC(a) | | | 9,167 | | | | 25,831 | |
Unilever N.V. | | | 156 | | | | 7,032 | |
Unilever PLC | | | 663 | | | | 29,447 | |
Vodafone Group PLC | | | 7,642 | | | | 25,196 | |
WPP PLC | | | 1,292 | | | | 28,961 | |
| | | | | | | | 1,269,469 | |
|
| United States–0.08% | |
Samsonite International S.A. | | | 2,100 | | | | 6,181 | |
Total Common Stocks & Other Equity Interests
(Cost $7,233,640) | | | | 6,824,550 | |
| | |
Money Market Funds–7.81% | | | | | | | | |
Liquid Assets Portfolio–Institutional Class, 0.16%(g) | | | 295,024 | | | | 295,024 | |
Premier Portfolio–Institutional Class, 0.12%(g) | | | 295,023 | | | | 295,023 | |
Total Money Market Funds
(Cost $590,047) | | | | 590,047 | |
TOTAL INVESTMENTS–98.15%
(Cost $7,823,687) | | | | 7,414,597 | |
OTHER ASSETS LESS LIABILITIES–1.85% | | | | 139,723 | |
NET ASSETS–100.00% | | | $ | 7,554,320 | |
Investment Abbreviations:
| | |
| ADR | | – American Depositary Receipt |
| CPO | | – Certificates of Ordinary Participation |
| Ctfs. | | – Certificates |
| GDR | | – Global Depositary Receipt |
| NVDR | | – Non-Voting Depositary Receipt |
| REIT | | – Real Estate Investment Trust |
Notes to Schedule of Investments:
| (a) | Non-income producing security. |
| (b) | Each unit represents one common share and four preferred shares. |
| (c) | Each unit represents two preferred shares and one common share. |
| (d) | Security purchased or received in a transaction exempt from registration under the Securities Act of 1933, as amended (the “1933 Act”). The security may be resold pursuant to an exemption from registration under the 1933 Act, typically to qualified institutional buyers. The aggregate value of these securities at October 31, 2015 was $26,357, which represented less than 1% of the Fund’s Net Assets. |
| (e) | Each unit represents one Series B share, two Series D-B shares and two Series D-L shares. |
| (f) | Each CPO represents twenty-five Series A shares, twenty-two Series B shares, thirty-five Series D shares and thirty-five Series L shares. |
| (g) | The money market fund and the Fund are affiliated by having the same investment adviser. The rate shown is the 7-day SEC standardized yield as of October 31, 2015. |
See accompanying Notes to Financial Statements which are an integral part of the financial statements.
18 Invesco Macro International Equity Fund
Statement of Assets and Liabilities
October 31, 2015
| | | | |
Assets: | |
Investments, at value (Cost $7,233,640) | | $ | 6,824,550 | |
Investments in affiliated money market funds, at value and cost | | | 590,047 | |
Total investments, at value (Cost $7,823,687) | | | 7,414,597 | |
Foreign currencies, at value (Cost $45,992) | | | 45,892 | |
Receivable for: | | | | |
Deposits with brokers for open futures contracts | | | 84,000 | |
Investments sold | | | 37 | |
Variation margin — futures | | | 1,627 | |
Dividends | | | 15,299 | |
Fund expenses absorbed | | | 81,446 | |
Investment for trustee deferred compensation and retirement plans | | | 4,275 | |
Other assets | | | 3,887 | |
Total assets | | | 7,651,060 | |
|
Liabilities: | |
Payable for: | | | | |
Accrued fees to affiliates | | | 1,054 | |
Accrued trustees’ and officers’ fees and benefits | | | 1,505 | |
Accrued other operating expenses | | | 89,906 | |
Trustee deferred compensation and retirement plans | | | 4,275 | |
Total liabilities | | | 96,740 | |
Net assets applicable to shares outstanding | | $ | 7,554,320 | |
|
Net assets consist of: | |
Shares of beneficial interest | | $ | 8,363,549 | |
Undistributed net investment income | | | 79,300 | |
Undistributed net realized gain (loss) | | | (514,659 | ) |
Net unrealized appreciation (depreciation) | | | (373,870 | ) |
| | | $ | 7,554,320 | |
| | | | |
Net Assets: | |
Class A | | $ | 3,123,114 | |
Class C | | $ | 76,347 | |
Class R | | $ | 8,993 | |
Class Y | | $ | 3,713,713 | |
Class R5 | | $ | 316,008 | |
Class R6 | | $ | 316,145 | |
|
Shares outstanding, $0.01 par value per share,
with an unlimited number of shares authorized: | |
Class A | | | 346,603 | |
Class C | | | 8,555 | |
Class R | | | 1,001 | |
Class Y | | | 411,127 | |
Class R5 | | | 35,001 | |
Class R6 | | | 35,001 | |
Class A: | | | | |
Net asset value per share | | $ | 9.01 | |
Maximum offering price per share | | | | |
(Net asset value of $9.01 ¸ 94.50%) | | $ | 9.53 | |
Class C: | | | | |
Net asset value and offering price per share | | $ | 8.92 | |
Class R: | | | | |
Net asset value and offering price per share | | $ | 8.98 | |
Class Y: | | | | |
Net asset value and offering price per share | | $ | 9.03 | |
Class R5: | | | | |
Net asset value and offering price per share | | $ | 9.03 | |
Class R6: | | | | |
Net asset value and offering price per share | | $ | 9.03 | |
See accompanying Notes to Financial Statements which are an integral part of the financial statements.
19 Invesco Macro International Equity Fund
Statement of Operations
For the year ended October 31, 2015
| | | | |
Investment income: | |
Dividends (net of foreign withholding taxes of $21,635) | | $ | 204,522 | |
Dividends from affiliated money market funds | | | 409 | |
Total investment income | | | 204,931 | |
| |
Expenses: | | | | |
Advisory fees | | | 73,614 | |
Administrative services fees | | | 50,000 | |
Custodian fees | | | 184,350 | |
Distribution fees: | | | | |
Class A | | | 8,275 | |
Class C | | | 547 | |
Class R | | | 48 | |
Transfer agent fees — A, C, R and Y | | | 2,806 | |
Transfer agent fees — R5 | | | 9 | |
Transfer agent fees — R6 | | | 7 | |
Trustees’ and officers’ fees and benefits | | | 18,763 | |
Registration and filing fees | | | 74,411 | |
Licensing fees | | | 74,202 | |
Professional services fees | | | 68,879 | |
Other | | | 141,455 | |
Total expenses | | | 697,366 | |
Less: Fees waived and expenses reimbursed | | | (596,401 | ) |
Net expenses | | | 100,965 | |
Net investment income | | | 103,966 | |
| |
Realized and unrealized gain (loss) from: | | | | |
Net realized gain (loss) from: | | | | |
Investment securities (net of foreign taxes of $731) | | | (184,492 | ) |
Foreign currencies | | | (12,300 | ) |
Futures contracts | | | (363,612 | ) |
| | | | (560,404 | ) |
Change in net unrealized appreciation (depreciation) of: | | | | |
Investment securities (net of foreign taxes on holdings of $335) | | | (404,688 | ) |
Foreign currencies | | | 792 | |
Futures contracts | | | 98,604 | |
| | | | (305,292 | ) |
Net realized and unrealized gain (loss) | | | (865,696 | ) |
Net increase (decrease) in net assets resulting from operations | | $ | (761,730 | ) |
See accompanying Notes to Financial Statements which are an integral part of the financial statements.
20 Invesco Macro International Equity Fund
Statement of Changes in Net Assets
For the year ended October 31, 2015 and the period December 17, 2013 (commencement date) through October 31, 2014
| | | | | | | | |
| | | October 31,
2015 | | | December 17, 2013
(commencement date) through
October 31,
2014 | |
Operations: | | | | | |
Net investment income | | $ | 103,966 | | | $ | 97,231 | |
Net realized gain (loss) | | | (560,404 | ) | | | 92,682 | |
Change in net unrealized appreciation (depreciation) | | | (305,292 | ) | | | (68,578 | ) |
Net increase (decrease) in net assets resulting from operations | | | (761,730 | ) | | | 121,335 | |
| | |
Distributions to shareholders from net investment income: | | | | | | | | |
Class A | | | (63,932 | ) | | | — | |
Class C | | | (323 | ) | | | — | |
Class R | | | (179 | ) | | | — | |
Class Y | | | (68,456 | ) | | | — | |
Class R5 | | | (19,684 | ) | | | — | |
Class R6 | | | (7,613 | ) | | | — | |
Total distributions from net investment income | | | (160,187 | ) | | | — | |
| | |
Distributions to shareholders from net realized gains: | | | | | | | | |
Class A | | | (19,588 | ) | | | — | |
Class C | | | (127 | ) | | | — | |
Class R | | | (60 | ) | | | — | |
Class Y | | | (18,853 | ) | | | — | |
Class R5 | | | (5,421 | ) | | | — | |
Class R6 | | | (2,096 | ) | | | — | |
Total distributions from net realized gains | | | (46,145 | ) | | | — | |
| | |
Share transactions–net: | | | | | | | | |
Class A | | | 287,744 | | | | 3,198,397 | |
Class C | | | 64,318 | | | | 20,866 | |
Class R | | | — | | | | 10,010 | |
Class Y | | | 941,777 | | | | 3,146,281 | |
Class R5 | | | (529,245 | ) | | | 910,889 | |
Class R6 | | | — | | | | 350,010 | |
Net increase in net assets resulting from share transactions | | | 764,594 | | | | 7,636,453 | |
Net increase (decrease) in net assets | | | (203,468 | ) | | | 7,757,788 | |
| | |
Net assets: | | | | | | | | |
Beginning of year | | | 7,757,788 | | | | — | |
End of year (includes undistributed net investment income of $79,300 and $147,701, respectively) | | $ | 7,554,320 | | | $ | 7,757,788 | |
Notes to Financial Statements
October 31, 2015
NOTE 1—Significant Accounting Policies
Invesco Macro International Equity Fund (the “Fund”) is a series portfolio of AIM Investment Funds (Invesco Investment Funds) (the “Trust”). The Trust is organized as a Delaware statutory trust and is registered under the Investment Company Act of 1940, as amended (the “1940 Act”), as an open-end series management investment company consisting of twenty-four separate series portfolios, each authorized to issue an unlimited number of shares of beneficial interest. The assets, liabilities and operations of each portfolio are accounted for separately. Information presented in these financial statements pertains only to the Fund. Matters affecting each portfolio or class will be voted on exclusively by the shareholders of such portfolio or class.
The Fund’s investment objective is to provide total return.
21 Invesco Macro International Equity Fund
The Fund currently consists of six different classes of shares: Class A, Class C, Class R, Class Y, Class R5 and Class R6. Class A shares are sold with a front-end sales charge unless certain waiver criteria are met and under certain circumstances load waived shares may be subject to contingent deferred sales charges (“CDSC”). Class C shares are sold with a CDSC. Class R, Class Y, Class R5 and Class R6 shares are sold at net asset value.
The following is a summary of the significant accounting policies followed by the Fund in the preparation of its financial statements.
| A. | Security Valuations — Securities, including restricted securities, are valued according to the following policy. |
A security listed or traded on an exchange (except convertible securities) is valued at its last sales price or official closing price as of the close of the customary trading session on the exchange where the security is principally traded, or lacking any sales or official closing price on a particular day, the security may be valued at the closing bid price on that day. Securities traded in the over-the-counter market are valued based on prices furnished by independent pricing services or market makers. When such securities are valued by an independent pricing service they may be considered fair valued. Futures contracts are valued at the final settlement price set by an exchange on which they are principally traded. Listed options are valued at the mean between the last bid and asked prices from the exchange on which they are principally traded. Options not listed on an exchange are valued by an independent source at the mean between the last bid and asked prices. For purposes of determining net asset value (“NAV”) per share, futures and option contracts generally are valued 15 minutes after the close of the customary trading session of the New York Stock Exchange (“NYSE”).
Investments in open-end and closed-end registered investment companies that do not trade on an exchange are valued at the end-of-day net asset value per share. Investments in open-end and closed-end registered investment companies that trade on an exchange are valued at the last sales price or official closing price as of the close of the customary trading session on the exchange where the security is principally traded.
Debt obligations (including convertible securities) and unlisted equities are fair valued using an evaluated quote provided by an independent pricing service. Evaluated quotes provided by the pricing service may be determined without exclusive reliance on quoted prices, and may reflect appropriate factors such as institution-size trading in similar groups of securities, developments related to specific securities, dividend rate (for unlisted equities), yield (for debt obligations), quality, type of issue, coupon rate (for debt obligations), maturity (for debt obligations), individual trading characteristics and other market data. Debt obligations are subject to interest rate and credit risks. In addition, all debt obligations involve some risk of default with respect to interest and/or principal payments.
Foreign securities’ (including foreign exchange contracts) prices are converted into U.S. dollar amounts using the applicable exchange rates as of the close of the NYSE. If market quotations are available and reliable for foreign exchange-traded equity securities, the securities will be valued at the market quotations. Because trading hours for certain foreign securities end before the close of the NYSE, closing market quotations may become unreliable. If between the time trading ends on a particular security and the close of the customary trading session on the NYSE, events occur that the Adviser determines are significant and make the closing price unreliable, the Fund may fair value the security. If the event is likely to have affected the closing price of the security, the security will be valued at fair value in good faith using procedures approved by the Board of Trustees. Adjustments to closing prices to reflect fair value may also be based on a screening process of an independent pricing service to indicate the degree of certainty, based on historical data, that the closing price in the principal market where a foreign security trades is not the current value as of the close of the NYSE. Foreign securities’ prices meeting the approved degree of certainty that the price is not reflective of current value will be priced at the indication of fair value from the independent pricing service. Multiple factors may be considered by the independent pricing service in determining adjustments to reflect fair value and may include information relating to sector indices, American Depositary Receipts and domestic and foreign index futures. Foreign securities may have additional risks including exchange rate changes, potential for sharply devalued currencies and high inflation, political and economic upheaval, the relative lack of issuer information, relatively low market liquidity and the potential lack of strict financial and accounting controls and standards.
Securities for which market prices are not provided by any of the above methods may be valued based upon quotes furnished by independent sources. The last bid price may be used to value equity securities. The mean between the last bid and asked prices is used to value debt obligations, including corporate loans.
Securities for which market quotations are not readily available or became unreliable are valued at fair value as determined in good faith by or under the supervision of the Trust’s officers following procedures approved by the Board of Trustees. Issuer specific events, market trends, bid/asked quotes of brokers and information providers and other market data may be reviewed in the course of making a good faith determination of a security’s fair value.
The Fund may invest in securities that are subject to interest rate risk, meaning the risk that the prices will generally fall as interest rates rise and, conversely, the prices will generally rise as interest rates fall. Specific securities differ in their sensitivity to changes in interest rates depending on their individual characteristics. Changes in interest rates may result in increased market volatility, which may affect the value and/or liquidity of certain Fund investments.
Valuations change in response to many factors including the historical and prospective earnings of the issuer, the value of the issuer’s assets, general economic conditions, interest rates, investor perceptions and market liquidity. Because of the inherent uncertainties of valuation, the values reflected in the financial statements may materially differ from the value received upon actual sale of those investments.
| B. | Securities Transactions and Investment Income — Securities transactions are accounted for on a trade date basis. Realized gains or losses on sales are computed on the basis of specific identification of the securities sold. Interest income (net of withholding tax, if any) is recorded on the accrual basis from settlement date. Dividend income (net of withholding tax, if any) is recorded on the ex-dividend date. |
The Fund may periodically participate in litigation related to Fund investments. As such, the Fund may receive proceeds from litigation settlements. Any proceeds received are included in the Statement of Operations as realized gain (loss) for investments no longer held and as unrealized gain (loss) for investments still held.
Brokerage commissions and mark ups are considered transaction costs and are recorded as an increase to the cost basis of securities purchased and/or a reduction of proceeds on a sale of securities. Such transaction costs are included in the determination of net realized and unrealized gain (loss) from investment securities reported in the Statement of Operations and the Statement of Changes in Net Assets and the net realized and unrealized gains (losses) on securities per share in the Financial Highlights. Transaction costs are included in the calculation of the Fund’s net asset value and, accordingly, they reduce the Fund’s total returns. These transaction costs are not considered operating expenses and are not reflected in net investment income reported in the Statement of Operations and the Statement of Changes in Net Assets, or the net
22 Invesco Macro International Equity Fund
investment income per share and the ratios of expenses and net investment income reported in the Financial Highlights, nor are they limited by any expense limitation arrangements between the Fund and the investment adviser.
The Fund allocates income and realized and unrealized capital gains and losses to a class based on the relative net assets of each class.
| C. | Country Determination — For the purposes of making investment selection decisions and presentation in the Schedule of Investments, the investment adviser may determine the country in which an issuer is located and/or credit risk exposure based on various factors. These factors include the laws of the country under which the issuer is organized, where the issuer maintains a principal office, the country in which the issuer derives 50% or more of its total revenues and the country that has the primary market for the issuer’s securities, as well as other criteria. Among the other criteria that may be evaluated for making this determination are the country in which the issuer maintains 50% or more of its assets, the type of security, financial guarantees and enhancements, the nature of the collateral and the sponsor organization. Country of issuer and/or credit risk exposure has been determined to be the United States of America, unless otherwise noted. |
| D. | Distributions — Distributions from net investment income and net realized capital gain, if any, are generally declared and paid annually and recorded on the ex-dividend date. The Fund may elect to treat a portion of the proceeds from redemptions as distributions for federal income tax purposes. |
| E. | Federal Income Taxes — The Fund intends to comply with the requirements of Subchapter M of the Internal Revenue Code of 1986, as amended (the “Internal Revenue Code”), necessary to qualify as a regulated investment company and to distribute substantially all of the Fund’s taxable earnings to shareholders. As such, the Fund will not be subject to federal income taxes on otherwise taxable income (including net realized capital gain) that is distributed to shareholders. Therefore, no provision for federal income taxes is recorded in the financial statements. |
The Fund recognizes the tax benefits of uncertain tax positions only when the position is more likely than not to be sustained. Management has analyzed the Fund’s uncertain tax positions and concluded that no liability for unrecognized tax benefits should be recorded related to uncertain tax positions. Management is not aware of any tax positions for which it is reasonably possible that the total amounts of unrecognized tax benefits will change materially in the next 12 months.
The Fund files tax returns in the U.S. Federal jurisdiction and certain other jurisdictions. Generally, the Fund is subject to examinations by such taxing authorities for up to three years after the filing of the return for the tax period.
| F. | Expenses — Fees provided for under the Rule 12b-1 plan of a particular class of the Fund are charged to the operations of such class. Transfer agency fees and expenses and other shareholder recordkeeping fees and expenses attributable to Class R5 and Class R6 are allocated to each share class based on relative net assets. Sub-accounting fees attributable to Class R5 are charged to the operations of the class. Transfer agency fees and expenses and other shareholder recordkeeping fees and expenses relating to all other classes are allocated among those classes based on relative net assets. All other expenses are allocated among the classes based on relative net assets. |
| G. | Accounting Estimates — The preparation of financial statements in conformity with accounting principles generally accepted in the United States of America (“GAAP”) requires management to make estimates and assumptions that affect the reported amounts of assets and liabilities at the date of the financial statements and the reported amounts of revenues and expenses during the reporting period including estimates and assumptions related to taxation. Actual results could differ from those estimates by a significant amount. In addition, the Fund monitors for material events or transactions that may occur or become known after the period-end date and before the date the financial statements are released to print. |
| H. | Indemnifications ��� Under the Trust’s organizational documents, each Trustee, officer, employee or other agent of the Trust is indemnified against certain liabilities that may arise out of the performance of their duties to the Fund. Additionally, in the normal course of business, the Fund enters into contracts, including the Fund’s servicing agreements, that contain a variety of indemnification clauses. The Fund’s maximum exposure under these arrangements is unknown as this would involve future claims that may be made against the Fund that have not yet occurred. The risk of material loss as a result of such indemnification claims is considered remote. |
| I. | Foreign Currency Translations — Foreign currency is valued at the close of the NYSE based on quotations posted by banks and major currency dealers. Portfolio securities and other assets and liabilities denominated in foreign currencies are translated into U.S. dollar amounts at date of valuation. Purchases and sales of portfolio securities (net of foreign taxes withheld on disposition) and income items denominated in foreign currencies are translated into U.S. dollar amounts on the respective dates of such transactions. The Fund does not separately account for the portion of the results of operations resulting from changes in foreign exchange rates on investments and the fluctuations arising from changes in market prices of securities held. The combined results of changes in foreign exchange rates and the fluctuation of market prices on investments (net of estimated foreign tax withholding) are included with the net realized and unrealized gain or loss from investments in the Statement of Operations. Reported net realized foreign currency gains or losses arise from (1) sales of foreign currencies, (2) currency gains or losses realized between the trade and settlement dates on securities transactions, and (3) the difference between the amounts of dividends, interest, and foreign withholding taxes recorded on the Fund’s books and the U.S. dollar equivalent of the amounts actually received or paid. Net unrealized foreign currency gains and losses arise from changes in the fair values of assets and liabilities, other than investments in securities at fiscal period end, resulting from changes in exchange rates. |
The Fund may invest in foreign securities, which may be subject to foreign taxes on income, gains on investments or currency repatriation, a portion of which may be recoverable. Foreign taxes, if any, are recorded based on the tax regulations and rates that exist in the foreign markets in which the Fund invests and are shown in the Statement of Operations.
| J. | Forward Foreign Currency Contracts — The Fund may engage in foreign currency transactions either on a spot (i.e. for prompt delivery and settlement) basis, or through forward foreign currency contracts, to manage or minimize currency or exchange rate risk. |
The Fund may also enter into forward foreign currency contracts for the purchase or sale of a security denominated in a foreign currency in order to “lock in” the U.S. dollar price of that security, or the Fund may also enter into forward foreign currency contracts that do not provide for physical settlement of the two currencies, but instead are settled by a single cash payment calculated as the difference between the agreed upon exchange rate and the spot rate at settlement based upon an agreed upon notional amount (non-deliverable forwards). The Fund will set aside liquid assets in an amount equal to daily mark-to-market obligation for forward foreign currency contracts.
A forward foreign currency contract is an obligation between two parties (“Counterparties”) to purchase or sell a specific currency for an agreed-upon price at a future date. The use of forward foreign currency contracts does not eliminate fluctuations in the price of the underlying securities the Fund owns or intends to acquire but establishes a rate of exchange in advance. Fluctuations in the value of these contracts are
23 Invesco Macro International Equity Fund
measured by the difference in the contract date and reporting date exchange rates and are recorded as unrealized appreciation (depreciation) until the contracts are closed. When the contracts are closed, realized gains (losses) are recorded. Realized and unrealized gains (losses) on the contracts are included in the Statement of Operations. The primary risks associated with forward foreign currency contracts include failure of the Counterparty to meet the terms of the contract and the value of the foreign currency changing unfavorably. These risks may be in excess of the amounts reflected in the Statement of Assets and Liabilities.
| K. | Futures Contracts — The Fund may enter into futures contracts to manage exposure to interest rate, equity and market price movements and/or currency risks. A futures contract is an agreement between Counterparties to purchase or sell a specified underlying security, currency or commodity (or delivery of a cash settlement price, in the case of an index future) for a fixed price at a future date. The Fund currently invests only in exchange-traded futures and they are standardized as to maturity date and underlying financial instrument. Initial margin deposits required upon entering into futures contracts are satisfied by the segregation of specific securities or cash as collateral at the futures commission merchant (broker). During the period the futures contracts are open, changes in the value of the contracts are recognized as unrealized gains or losses by recalculating the value of the contracts on a daily basis. Subsequent or variation margin payments are received or made depending upon whether unrealized gains or losses are incurred. These amounts are reflected as receivables or payables on the Statement of Assets and Liabilities. When the contracts are closed or expire, the Fund recognizes a realized gain or loss equal to the difference between the proceeds from, or cost of, the closing transaction and the Fund’s basis in the contract. The net realized gain (loss) and the change in unrealized gain (loss) on futures contracts held during the period is included on the Statement of Operations. The primary risks associated with futures contracts are market risk and the absence of a liquid secondary market. If the Fund were unable to liquidate a futures contract and/or enter into an offsetting closing transaction, the Fund would continue to be subject to market risk with respect to the value of the contracts and continue to be required to maintain the margin deposits on the futures contracts. Futures contracts have minimal Counterparty risk since the exchange’s clearinghouse, as Counterparty to all exchange-traded futures, guarantees the futures against default. Risks may exceed amounts recognized in the Statement of Assets and Liabilities. |
| L. | Collateral — To the extent the Fund has designated or segregated a security as collateral and that security is subsequently sold, it is the Fund’s practice to replace such collateral no later than the next business day. |
NOTE 2—Advisory Fees and Other Fees Paid to Affiliates
The Trust has entered into a master investment advisory agreement with Invesco Advisers, Inc. (the “Adviser” or “Invesco”). Under the terms of the investment advisory agreement, the Fund pays an advisory fee to the Adviser based on the annual rate of the Fund’s average daily net assets as follows:
| | | | |
| Average Daily Net Assets | | Rate | |
First $250 million | | | 0.935% | |
Next $250 million | | | 0.910% | |
Next $500 million | | | 0.885% | |
Next $1.5 billion | | | 0.860% | |
Next $2.5 billion | | | 0.835% | |
Next $2.5 billion | | | 0.810% | |
Next $2.5 billion | | | 0.785% | |
Over $10 billion | | | 0.760% | |
For the year ended October 31, 2015, the effective advisory fees incurred by the Fund was 0.94%.
Under the terms of a master sub-advisory agreement between the Adviser and each of Invesco Asset Management Deutschland GmbH, Invesco Asset Management Limited, Invesco Asset Management (Japan) Limited, Invesco Hong Kong Limited, Invesco Senior Secured Management, Inc., Invesco Canada Ltd. and Invesco PowerShares Capital Management LLC (collectively, the “Affiliated Sub-Advisers”) the Adviser, not the Fund, may pay 40% of the fees paid to the Adviser to any such Affiliated Sub-Adviser(s) that provide(s) discretionary investment management services to the Fund based on the percentage of assets allocated to such Affiliated Sub-Adviser(s).
The Adviser has contractually agreed, through at least February 28, 2017, to waive advisory fees and/or reimburse expenses to the extent necessary to limit total annual fund operating expenses after fee waiver and/or expense reimbursement (excluding certain items discussed below) of Class A, Class C, Class R, Class Y, Class R5 and Class R6 shares to 1.43%, 2.18%, 1.68%, 1.18%, 1.18% and 1.18% of average daily net assets, respectively. In determining the Adviser’s obligation to waive advisory fees and/or reimburse expenses, the following expenses are not taken into account, and could cause total annual fund operating expenses after fee waiver and/or expense reimbursement to exceed the numbers reflected above: (1) interest; (2) taxes; (3) dividend expense on short sales; (4) extraordinary or non-routine items, including litigation expenses; and (5) expenses that the Fund has incurred but did not actually pay because of an expense offset arrangement. Unless Invesco continues the fee waiver agreement, it will terminate on February 28, 2017. The fee waiver agreement cannot be terminated during its term.
Further, the Adviser has contractually agreed, through at least June 30, 2017, to waive the advisory fee payable by the Fund in an amount equal to 100% of the net advisory fees the Adviser receives from the affiliated money market funds on investments by the Fund of uninvested cash in such affiliated money market funds.
For the year ended October 31, 2015, the Adviser waived advisory fees and reimbursed fund level expenses of $593,579 and reimbursed class level expenses of $1,305, $22, $4, $1,476, $8 and $7 of Class A, Class C, Class R, Class Y, Class R5 and Class R6 shares, respectively.
The Trust has entered into a master administrative services agreement with Invesco pursuant to which the Fund has agreed to pay Invesco for certain administrative costs incurred in providing accounting services to the Fund. For the year ended October 31, 2015, expenses incurred under the agreement are shown in the Statement of Operations as Administrative services fees.
The Trust has entered into a transfer agency and service agreement with Invesco Investment Services, Inc. (“IIS”) pursuant to which the Fund has agreed to pay IIS a fee for providing transfer agency and shareholder services to the Fund and reimburse IIS for certain expenses incurred by IIS in the
24 Invesco Macro International Equity Fund
course of providing such services. IIS may make payments to intermediaries that provide omnibus account services, sub-accounting services and/or networking services. All fees payable by IIS to intermediaries that provide omnibus account services or sub-accounting are charged back to the Fund, subject to certain limitations approved by the Trust’s Board of Trustees. For the year ended October 31, 2015, expenses incurred under the agreement are shown in the Statement of Operations as Transfer agent fees.
The Trust has entered into master distribution agreements with Invesco Distributors, Inc. (“IDI”) to serve as the distributor for the Class A, Class C, Class R, Class Y, Class R5 and Class R6 shares of the Fund. The Trust has adopted plans pursuant to Rule 12b-1 under the 1940 Act with respect to the Fund’s Class A, Class C and Class R shares (collectively the “Plans”). The Fund, pursuant to the Plans, pays IDI compensation at the annual rate of 0.25% of the Fund’s average daily net assets of Class A shares, 1.00% of the average daily net assets of Class C shares and 0.50% of the average daily net assets of Class R shares. Of the Plan payments, up to 0.25% of the average daily net assets of each class of shares may be paid to furnish continuing personal shareholder services to customers who purchase and own shares of such classes. Any amounts not paid as a service fee under the Plans would constitute an asset-based sales charge. Rules of the Financial Industry Regulatory Authority (“FINRA”) impose a cap on the total sales charges, including asset-based sales charges, that may be paid by any class of shares of the Fund. For the year ended October 31, 2015, expenses incurred under the Plans are shown in the Statement of Operations as Distribution fees.
Front-end sales commissions and CDSC (collectively, the “sales charges”) are not recorded as expenses of the Fund. Front-end sales commissions are deducted from proceeds from the sales of Fund shares prior to investment in Class A shares of the Fund. CDSC are deducted from redemption proceeds prior to remittance to the shareholder. During the year ended October 31, 2015, IDI advised the Fund that IDI retained $404 in front-end sales commissions from the sale of Class A shares.
Certain officers and trustees of the Trust are officers and directors of the Adviser, IIS and/or IDI.
NOTE 3—Additional Valuation Information
GAAP defines fair value as the price that would be received to sell an asset or paid to transfer a liability in an orderly transaction between market participants at the measurement date, under current market conditions. GAAP establishes a hierarchy that prioritizes the inputs to valuation methods, giving the highest priority to readily available unadjusted quoted prices in an active market for identical assets (Level 1) and the lowest priority to significant unobservable inputs (Level 3), generally when market prices are not readily available or are unreliable. Based on the valuation inputs, the securities or other investments are tiered into one of three levels. Changes in valuation methods may result in transfers in or out of an investment’s assigned level:
| | Level 1 — | Prices are determined using quoted prices in an active market for identical assets. |
| | Level 2 — | Prices are determined using other significant observable inputs. Observable inputs are inputs that other market participants may use in pricing a security. These may include quoted prices for similar securities, interest rates, prepayment speeds, credit risk, yield curves, loss severities, default rates, discount rates, volatilities and others. |
| | Level 3 — | Prices are determined using significant unobservable inputs. In situations where quoted prices or observable inputs are unavailable (for example, when there is little or no market activity for an investment at the end of the period), unobservable inputs may be used. Unobservable inputs reflect the Fund’s own assumptions about the factors market participants would use in determining fair value of the securities or instruments and would be based on the best available information. |
The following is a summary of the tiered valuation input levels, as of October 31, 2015. The level assigned to the securities valuations may not be an indication of the risk or liquidity associated with investing in those securities. Because of the inherent uncertainties of valuation, the values reflected in the financial statements may materially differ from the value received upon actual sale of those investments.
During the year ended October 31, 2015, there were transfers from Level 1 to Level 2 of $800,344 and from Level 2 to Level 1 of $702,345, due to foreign fair value adjustments.
| | | | | | | | | | | | | | | | |
| | | Level 1 | | | Level 2 | | | Level 3 | | | Total | |
Australia | | $ | 488,184 | | | $ | 193,542 | | | $ | — | | | $ | 681,726 | |
Austria | | | 5,722 | | | | 6,179 | | | | — | | | | 11,901 | |
Belgium | | | — | | | | 38,202 | | | | — | | | | 38,202 | |
Brazil | | | 50,506 | | | | — | | | | — | | | | 50,506 | |
Chile | | | 69,917 | | | | — | | | | — | | | | 69,917 | |
China | | | 7,762 | | | | 82,844 | | | | — | | | | 90,606 | |
Colombia | | | 13,151 | | | | — | | | | — | | | | 13,151 | |
Czech Republic | | | — | | | | 11,685 | | | | — | | | | 11,685 | |
Denmark | | | 16,270 | | | | 42,603 | | | | — | | | | 58,873 | |
Egypt | | | 6,455 | | | | — | | | | — | | | | 6,455 | |
Finland | | | — | | | | 39,147 | | | | — | | | | 39,147 | |
France | | | 79,642 | | | | 226,911 | | | | — | | | | 306,553 | |
Germany | | | 208,340 | | | | 18,867 | | | | — | | | | 227,207 | |
Hong Kong | | | 13,327 | | | | 351,635 | | | | — | | | | 364,962 | |
Hungary | | | 11,780 | | | | — | | | | — | | | | 11,780 | |
India | | | 24,568 | | | | — | | | | — | | | | 24,568 | |
Indonesia | | | — | | | | 33,147 | | | | — | | | | 33,147 | |
Ireland | | | 13,199 | | | | 54,210 | | | | — | | | | 67,409 | |
Italy | | | 38,301 | | | | 38,302 | | | | — | | | | 76,603 | |
25 Invesco Macro International Equity Fund
| | | | | | | | | | | | | | | | |
| | | Level 1 | | | Level 2 | | | Level 3 | | | Total | |
Japan | | $ | — | | | $ | 1,359,005 | | | $ | — | | | $ | 1,359,005 | |
Luxembourg | | | — | | | | 10,540 | | | | — | | | | 10,540 | |
Macau | | | — | | | | 11,855 | | | | — | | | | 11,855 | |
Malaysia | | | 71,010 | | | | 102,201 | | | | — | | | | 173,211 | |
Mexico | | | 117,014 | | | | — | | | | — | | | | 117,014 | |
Netherlands | | | 5,584 | | | | 75,744 | | | | — | | | | 81,328 | |
New Zealand | | | 22,518 | | | | 57,487 | | | | — | | | | 80,005 | |
Norway | | | 18,813 | | | | 24,707 | | | | — | | | | 43,520 | |
Philippines | | | 7,530 | | | | 62,749 | | | | — | | | | 70,279 | |
Poland | | | 8,952 | | | | 21,044 | | | | — | | | | 29,996 | |
Portugal | | | — | | | | 6,732 | | | | — | | | | 6,732 | |
Qatar | | | 12,585 | | | | — | | | | — | | | | 12,585 | |
Singapore | | | 69,356 | | | | 121,759 | | | | — | | | | 191,115 | |
South Africa | | | 63,813 | | | | 79,123 | | | | — | | | | 142,936 | |
South Korea | | | 23,689 | | | | 39,642 | | | | — | | | | 63,331 | |
Spain | | | 90,327 | | | | 23,534 | | | | — | | | | 113,861 | |
Sweden | | | 26,401 | | | | 109,804 | | | | — | | | | 136,205 | |
Switzerland | | | — | | | | 240,212 | | | | — | | | | 240,212 | |
Taiwan | | | 6,480 | | | | 303,702 | | | | — | | | | 310,182 | |
Thailand | | | 24,014 | | | | 86,328 | | | | — | | | | 110,342 | |
Turkey | | | 47,339 | | | | 12,909 | | | | — | | | | 60,248 | |
United Kingdom | | | 90,541 | | | | 1,178,928 | | | | — | | | | 1,269,469 | |
United States | | | 590,047 | | | | 6,181 | | | | — | | | | 596,228 | |
| | | $ | 2,343,137 | | | $ | 5,071,460 | | | $ | — | | | $ | 7,414,597 | |
Futures Contracts* | | | 35,320 | | | | — | | | | — | | | | 35,320 | |
Total Investments | | $ | 2,378,457 | | | $ | 5,071,460 | | | $ | — | | | $ | 7,449,917 | |
| * | Unrealized appreciation (depreciation). |
NOTE 4—Derivative Investments
Value of Derivative Investments at Period-End
The table below summarizes the value of the Fund’s derivative investments, detailed by primary risk exposure, held as of October 31, 2015:
| | | | | | | | |
| | | Value | |
| Risk Exposure/Derivative Type | | Assets | | | Liabilities | |
Equity risk: | | | | | | | | |
Futures contracts(a) | | $ | 42,633 | | | $ | (7,313 | ) |
| (a) | Includes cumulative appreciation (depreciation) of futures contracts. Only current day’s variation margin receivable is reported within the Statement of Assets and Liabilities. |
Effect of Derivative Investments for the year ended October 31, 2015
The table below summarizes the gains (losses) on derivative investments, detailed by primary risk exposure, recognized in earnings during the period:
| | | | |
| | | Location of Gain (Loss) on
Statement of Operations | |
| | | Futures
Contracts | |
Realized Gain (Loss): | | | | |
Equity risk | | $ | (363,612 | ) |
Change in Net Unrealized Appreciation: | | | | |
Equity risk | | | 98,604 | |
Total | | $ | (265,008 | ) |
The table below summarizes the average notional value of futures contracts outstanding during the period.
| | | | |
| | | Futures
Contracts | |
Average notional value | | $ | 1,880,715 | |
26 Invesco Macro International Equity Fund
| | | | | | | | | | | | | | | | | | | | |
| Open Futures Contracts(a) | |
| Futures Contracts | | Type of
Contract | | | Number of
Contracts | | | Expiration
Month | | | Notional
Value | | | Unrealized Appreciation (Depreciation) | |
Dow Jones EURO STOXX 50 Index | | | Short | | | | 4 | | | | December-2015 | | | $ | (149,691 | ) | | $ | (7,313 | ) |
FTSE 100 Index | | | Long | | | | 1 | | | | December-2015 | | | | 97,442 | | | | 3,809 | |
Mini MSCI Emerging Markets Index | | | Long | | | | 12 | | | | December-2015 | | | | 506,220 | | | | 27,979 | |
Tokyo Stock Price Index | | | Long | | | | 1 | | | | December-2015 | | | | 129,154 | | | | 10,845 | |
Total Futures Contracts — Equity Risk | | | | | | | | | | | $ | 35,320 | |
| (a) | Futures contracts collateralized by $84,000 cash held with Goldman Sachs & Co., the futures commission merchant. |
NOTE 5—Trustees’ and Officers’ Fees and Benefits
Trustees’ and Officers’ Fees and Benefits include amounts accrued by the Fund to pay remuneration to certain Trustees and Officers of the Fund. Trustees have the option to defer compensation payable by the Fund, and Trustees’ and Officers’ Fees and Benefits also include amounts accrued by the Fund to fund such deferred compensation amounts. Those Trustees who defer compensation have the option to select various Invesco Funds in which their deferral accounts shall be deemed to be invested. Obligations under the deferred compensation plan represent unsecured claims against the general assets of the Fund.
NOTE 6—Cash Balances
The Fund is permitted to temporarily carry a negative or overdrawn balance in its account with State Street Bank and Trust Company, the custodian bank. Such balances, if any at period end, are shown in the Statement of Assets and Liabilities under the payable caption Amount due custodian. To compensate the custodian bank for such overdrafts, the overdrawn Fund may either (1) leave funds as a compensating balance in the account so the custodian bank can be compensated by earning the additional interest; or (2) compensate by paying the custodian bank at a rate agreed upon by the custodian bank and Invesco, not to exceed the contractually agreed upon rate.
NOTE 7—Distributions to Shareholders and Tax Components of Net Assets
Tax Character of Distributions to Shareholders Paid During the Fiscal Year Ended October 31, 2015 and the period December 17, 2013 (commencement date) through October 31, 2014:
| | | | | | | | |
| | | October 31,
2015 | | | December 17, 2013 (commencement date) through
October 31, 2014 | |
Ordinary income | | $ | 200,246 | | | $ | — | |
Long-term capital gain | | | 6,086 | | | | — | |
Total distributions | | $ | 206,332 | | | $ | — | |
Tax Components of Net Assets at Period-End:
| | | | |
| | | 2015 | |
Undistributed ordinary income | | $ | 89,098 | |
Net unrealized appreciation (depreciation) — investments | | | (461,938 | ) |
Net unrealized appreciation — other investments | | | 10,606 | |
Temporary book/tax differences | | | (17,781 | ) |
Capital loss carryforward | | | (429,214 | ) |
Shares of beneficial interest | | | 8,363,549 | |
Total net assets | | $ | 7,554,320 | |
The difference between book-basis and tax-basis unrealized appreciation (depreciation) is due to differences in the timing of recognition of gains and losses on investments for tax and book purposes. The Fund’s net unrealized appreciation (depreciation) difference is attributable primarily to wash sales and passive foreign investment companies.
The temporary book/tax differences are a result of timing differences between book and tax recognition of income and/or expenses. The Fund’s temporary book/tax differences are the result of the trustee deferral of compensation and retirement plan benefits.
Capital loss carryforward is calculated and reported as of a specific date. Results of transactions and other activity after that date may affect the amount of capital loss carryforward actually available for the Fund to utilize. The ability to utilize capital loss carryforward in the future may be limited under the Internal Revenue Code and related regulations based on the results of future transactions.
The Fund has a capital loss carryforward as of October 31, 2015, which expires as follows:
| | | | | | | | | | | | |
| Capital Loss Carryforward* | |
| Expiration | | Short-Term | | | Long-Term | | | Total | |
Not subject to expiration | | $ | 334,343 | | | $ | 94,871 | | | $ | 429,214 | |
| * | Capital loss carryforward as of the date listed above is reduced for limitations, if any, to the extent required by the Internal Revenue Code and may be further limited depending upon a variety of factors, including the realization of net unrealized gains or losses as of the date of any reorganization. |
27 Invesco Macro International Equity Fund
NOTE 8—Investment Securities
The aggregate amount of investment securities (other than short-term securities, U.S. Treasury obligations and money market funds, if any) purchased and sold by the Fund during the year ended October 31, 2015 was $4,104,386 and $3,776,442, respectively. Cost of investments on a tax basis includes the adjustments for financial reporting purposes as of the most recently completed federal income tax reporting period-end.
| | | | |
| Unrealized Appreciation (Depreciation) of Investment Securities on a Tax Basis | |
Aggregate unrealized appreciation of investment securities | | $ | 424,724 | |
Aggregate unrealized (depreciation) of investment securities | | | (886,662 | ) |
Net unrealized appreciation (depreciation) of investment securities | | $ | (461,938 | ) |
Cost of investments for tax purposes is $7,876,535.
NOTE 9—Reclassification of Permanent Differences
Primarily as a result of differing book/tax treatment of foreign currency transactions, passive foreign investment companies and nondeductible stock issuance costs on October 31, 2015, undistributed net investment income was decreased by $12,180, undistributed net realized gain (loss) was increased by $12,421 and shares of beneficial interest was decreased by $241. This reclassification had no effect on the net assets of the Fund.
NOTE 10—Share Information
| | | | | | | | | | | | | | | | |
| | | Summary of Share Activity | |
| | | Year ended
October 31, 2015(a) | | | December 17, 2013
(commencement date) to
October 31, 2014 | |
| | | Shares | | | Amount | | | Shares | | | Amount | |
Sold: | | | | | | | | | | | | | | | | |
Class A | | | 76,956 | | | $ | 787,039 | | | | 332,714 | | | $ | 3,329,683 | |
Class C | | | 6,508 | | | | 64,463 | | | | 2,059 | | | | 20,866 | |
Class R | | | — | | | | — | | | | 1,001 | | | | 10,010 | |
Class Y | | | 114,771 | | | | 1,130,479 | | | | 322,560 | | | | 3,225,939 | |
Class R5 | | | — | | | | — | | | | 91,465 | | | | 921,027 | |
Class R6 | | | — | | | | — | | | | 35,001 | | | | 350,010 | |
| | | | |
Issued as reinvestment of dividends: | | | | | | | | | | | | | | | | |
Class A | | | 351 | | | | 3,272 | | | | — | | | | — | |
Class C | | | 25 | | | | 237 | | | | — | | | | — | |
Class Y | | | 22 | | | | 205 | | | | — | | | | — | |
Class R5 | | | 1,650 | | | | 15,396 | | | | — | | | | — | |
| | | | |
Reacquired: | | | | | | | | | | | | | | | | |
Class A | | | (50,570 | ) | | | (502,567 | ) | | | (12,848 | ) | | | (131,286 | ) |
Class C | | | (37 | ) | | | (382 | ) | | | — | | | | — | |
Class Y | | | (18,408 | ) | | | (188,907 | ) | | | (7,818 | ) | | | (79,658 | ) |
Class R5 | | | (57,150 | ) | | | (544,641 | ) | | | (964 | ) | | | (10,138 | ) |
Net increase in share activity | | | 74,118 | | | $ | 764,594 | | | | 763,170 | | | $ | 7,636,453 | |
| (a) | There is an entity that is a record owner of more than 5% of the outstanding shares of the Fund and owns 6% of the outstanding shares of the Fund. IDI has an agreement with this entity to sell Fund shares. The Fund, Invesco and/or Invesco affiliates may make payments to this entity, which is considered to be related to the Fund, for providing services to the Fund, Invesco and/or Invesco affiliates including but not limited to services such as securities brokerage, distribution, third party record keeping and account servicing. The Fund has no knowledge as to whether all or any portion of the shares owned of record by this entity are also owned beneficially. |
| | In addition, 89% of the outstanding shares of the Fund are owned by the Adviser. |
28 Invesco Macro International Equity Fund
NOTE 11—Financial Highlights
The following schedule presents financial highlights for a share of the Fund outstanding throughout the periods indicated.
| | | | | | | | | | | | | | | | | | | | | | | | | | | | | | | | | | | | | | | | | | | | | | | | | | | | | | | | |
| | | Net asset
value,
beginning
of period | | | Net
investment
income(a) | | | Net gains
(losses)
on securities
(both
realized and
unrealized) | | | Total from
investment
operations | | | Dividends
from net
investment
income | | | Distributions
from net
realized
gains | | | Total
distributions | | | Net asset
value, end
of period | | | Total
return(b) | | | Net assets,
end of period
(000’s omitted) | | | Ratio of
expenses
to average
net assets
with fee waivers
and/or expenses
absorbed | | | Ratio of
expenses
to average net
assets without
fee waivers
and/or expenses
absorbed | | | Ratio of net
investment
income
to average
net assets | | | Portfolio
turnover(c) | |
Class A | |
Year ended 10/31/15 | | $ | 10.15 | | | $ | 0.12 | | | $ | (1.00 | ) | | $ | (0.88 | ) | | $ | (0.20 | ) | | $ | (0.06 | ) | | $ | (0.26 | ) | | $ | 9.01 | | | | (8.80 | )% | | $ | 3,123 | | | | 1.42 | %(d) | | | 9.00 | %(d) | | | 1.18 | %(d) | | | 53 | % |
Year ended 10/31/14(e) | | | 10.00 | | | | 0.12 | | | | 0.03 | | | | 0.15 | | | | — | | | | — | | | | — | | | | 10.15 | | | | 1.50 | | | | 3,247 | | | | 1.42 | (f) | | | 8.20 | (f) | | | 1.29 | (f) | | | 45 | |
Class C | | | | | | | | | | | | | | | | | | | | | | | | | | | | | | | | | | | | | | | | | | | | | | | | | | | | | | | | |
Year ended 10/31/15 | | | 10.09 | | | | 0.04 | | | | (1.00 | ) | | | (0.96 | ) | | | (0.15 | ) | | | (0.06 | ) | | | (0.21 | ) | | | 8.92 | | | | (9.58 | ) | | | 76 | | | | 2.17 | (d) | | | 9.75 | (d) | | | 0.43 | (d) | | | 53 | |
Year ended 10/31/14(e) | | | 10.00 | | | | 0.05 | | | | 0.04 | | | | 0.09 | | | | — | | | | — | | | | — | | | | 10.09 | | | | 0.90 | | | | 21 | | | | 2.17 | (f) | | | 8.95 | (f) | | | 0.54 | (f) | | | 45 | |
Class R | |
Year ended 10/31/15 | | | 10.13 | | | | 0.09 | | | | (1.00 | ) | | | (0.91 | ) | | | (0.18 | ) | | | (0.06 | ) | | | (0.24 | ) | | | 8.98 | | | | (9.08 | ) | | | 9 | | | | 1.67 | (d) | | | 9.25 | (d) | | | 0.93 | (d) | | | 53 | |
Year ended 10/31/14(e) | | | 10.00 | | | | 0.09 | | | | 0.04 | | | | 0.13 | | | | — | | | | — | | | | — | | | | 10.13 | | | | 1.30 | | | | 10 | | | | 1.67 | (f) | | | 8.45 | (f) | | | 1.04 | (f) | | | 45 | |
Class Y | |
Year ended 10/31/15 | | | 10.17 | | | | 0.14 | | | | (1.00 | ) | | | (0.86 | ) | | | (0.22 | ) | | | (0.06 | ) | | | (0.28 | ) | | | 9.03 | | | | (8.57 | ) | | | 3,714 | | | | 1.17 | (d) | | | 8.75 | (d) | | | 1.43 | (d) | | | 53 | |
Year ended 10/31/14(e) | | | 10.00 | | | | 0.14 | | | | 0.03 | | | | 0.17 | | | | — | | | | — | | | | — | | | | 10.17 | | | | 1.70 | | | | 3,202 | | | | 1.17 | (f) | | | 7.95 | (f) | | | 1.54 | (f) | | | 45 | |
Class R5 | |
Year ended 10/31/15 | | | 10.18 | | | | 0.14 | | | | (1.01 | ) | | | (0.87 | ) | | | (0.22 | ) | | | (0.06 | ) | | | (0.28 | ) | | | 9.03 | | | | (8.66 | ) | | | 316 | | | | 1.17 | (d) | | | 8.71 | (d) | | | 1.43 | (d) | | | 53 | |
Year ended 10/31/14(e) | | | 10.00 | | | | 0.14 | | | | 0.04 | | | | 0.18 | | | | — | | | | — | | | | — | | | | 10.18 | | | | 1.80 | | | | 921 | | | | 1.17 | (f) | | | 7.92 | (f) | | | 1.54 | (f) | | | 45 | |
Class R6 | |
Year ended 10/31/15 | | | 10.17 | | | | 0.14 | | | | (1.00 | ) | | | (0.86 | ) | | | (0.22 | ) | | | (0.06 | ) | | | (0.28 | ) | | | 9.03 | | | | (8.57 | ) | | | 316 | | | | 1.17 | (d) | | | 8.71 | (d) | | | 1.43 | (d) | | | 53 | |
Year ended 10/31/14(e) | | | 10.00 | | | | 0.14 | | | | 0.03 | | | | 0.17 | | | | — | | | | — | | | | — | | | | 10.17 | | | | 1.70 | | | | 356 | | | | 1.17 | (f) | | | 7.92 | (f) | | | 1.54 | (f) | | | 45 | |
| (a) | Calculated using average shares outstanding. |
| (b) | Includes adjustments in accordance with accounting principles generally accepted in the United States of America and as such, the net asset value for financial reporting purposes and the returns based upon those net asset values may differ from the net asset value and returns for shareholder transactions. Does not include sales charges and is not annualized for periods less than one year, if applicable. |
| (c) | Portfolio turnover is calculated at the fund level and is not annualized for periods less than one year, if applicable. |
| (d) | Ratios are based on average daily net assets (000’s omitted) of $3,310, $55, $10, $3,743, $417 and $339 for Class A, Class C, Class R, Class Y, Class R5 and Class R6 shares, respectively. |
| (e) | Commencement date of December 17, 2013. |
29 Invesco Macro International Equity Fund
Report of Independent Registered Public Accounting Firm
To the Board of Trustees of AIM Investment Funds (Invesco Investment Funds)
and Shareholders of Invesco Macro International Equity Fund:
In our opinion, the accompanying statement of assets and liabilities, including the schedule of investments, and the related statements of operations and of changes in net assets and the financial highlights present fairly, in all material respects, the financial position of Invesco Macro International Equity Fund (one of the funds constituting AIM Investment Funds (Invesco Investment Funds), hereafter referred to as the “Fund”) at October 31, 2015, the results of its operations for the year then ended, the changes in its net assets and the financial highlights for the year then ended and for the period December 17, 2013 (commencement of operations) through October 31, 2014, in conformity with accounting principles generally accepted in the United States of America. These financial statements and financial highlights (hereafter referred to as “financial statements”) are the responsibility of the Fund’s management. Our responsibility is to express an opinion on these financial statements based on our audits. We conducted our audits of these financial statements in accordance with the standards of the Public Company Accounting Oversight Board (United States). Those standards require that we plan and perform the audit to obtain reasonable assurance about whether the financial statements are free of material misstatement. An audit includes examining, on a test basis, evidence supporting the amounts and disclosures in the financial statements, assessing the accounting principles used and significant estimates made by management, and evaluating the overall financial statement presentation. We believe that our audits, which included confirmation of securities at October 31, 2015 by correspondence with the custodian and brokers, provide a reasonable basis for our opinion.
PRICEWATERHOUSECOOPERS LLP
December 23, 2015
Houston, Texas
30 Invesco Macro International Equity Fund
Calculating your ongoing Fund expenses
Example
As a shareholder of the Fund, you incur two types of costs: (1) transaction costs, which may include sales charges (loads) on purchase payments or contingent deferred sales charges on redemptions, if any; and (2) ongoing costs, including management fees, distribution and/or service (12b-1) fees, and other Fund expenses. This example is intended to help you understand your ongoing costs (in dollars) of investing in the Fund and to compare these costs with ongoing costs of investing in other mutual funds. The example is based on an investment of $1,000 invested at the beginning of the period and held for the entire period May 1, 2015 through October 31, 2015.
Actual expenses
The table below provides information about actual account values and actual expenses. You may use the information in this table, together with the amount you invested, to estimate the expenses that you paid over the period. Simply divide your account value by $1,000 (for example, an $8,600 account value divided by $1,000 = 8.6), then multiply the result by the number in the table under the heading entitled “Actual Expenses Paid During Period” to estimate the expenses you paid on your account during this period.
Hypothetical example for comparison purposes
The table below also provides information about hypothetical account values and hypothetical expenses based on the Fund’s actual expense ratio and an assumed rate of return of 5% per year before expenses, which is not the Fund’s actual return.
The hypothetical account values and expenses may not be used to estimate the actual ending account balance or expenses you paid for the period. You may use this information to compare the ongoing costs of investing in the Fund and other funds. To do so, compare this 5% hypothetical example with the 5% hypothetical examples that appear in the shareholder reports of the other funds.
Please note that the expenses shown in the table are meant to highlight your ongoing costs only and do not reflect any transaction costs, such as sales charges (loads) on purchase payments or contingent deferred sales charges on redemptions, if any. Therefore, the hypothetical information is useful in comparing ongoing costs only, and will not help you determine the relative total costs of owning different funds. In addition, if these transaction costs were included, your costs would have been higher.
| | | | | | | | | | | | | | | | | | | | | | | | |
| | | | | | ACTUAL | | | HYPOTHETICAL (5% annual return before expenses) | | | | |
| Class | | Beginning
Account Value
(05/01/15) | | | Ending
Account Value
(10/31/15)1 | | | Expenses
Paid During
Period2 | | | Ending
Account Value
(10/31/15) | | | Expenses
Paid During
Period2 | | | Annualized
Expense
Ratio | |
| A | | $ | 1,000.00 | | | $ | 871.40 | | | $ | 6.70 | | | $ | 1,018.05 | | | $ | 7.22 | | | | 1.42 | % |
| C | | | 1,000.00 | | | | 868.70 | | | | 10.22 | | | | 1,014.27 | | | | 11.02 | | | | 2.17 | |
| R | | | 1,000.00 | | | | 870.20 | | | | 7.87 | | | | 1,016.79 | | | | 8.49 | | | | 1.67 | |
| Y | | | 1,000.00 | | | | 872.50 | | | | 5.52 | | | | 1,019.31 | | | | 5.96 | | | | 1.17 | |
| R5 | | | 1,000.00 | | | | 872.50 | | | | 5.52 | | | | 1,019.31 | | | | 5.96 | | | | 1.17 | |
| R6 | | | 1,000.00 | | | | 872.50 | | | | 5.52 | | | | 1,019.31 | | | | 5.96 | | | | 1.17 | |
| 1 | The actual ending account value is based on the actual total return of the Fund for the period May 1, 2015 through October 31, 2015, after actual expenses and will differ from the hypothetical ending account value which is based on the Fund’s expense ratio and a hypothetical annual return of 5% before expenses. |
| 2 | Expenses are equal to the Fund’s annualized expense ratio as indicated above multiplied by the average account value over the period, multiplied by 184/365 to reflect the most recent fiscal half year. |
31 Invesco Macro International Equity Fund
Approval of Investment Advisory and Sub-Advisory Contracts
The Board of Trustees (the Board) of AIM Investment Funds (Invesco Investment Funds) is required under the Investment Company Act of 1940, as amended, to approve annually the renewal of Invesco Macro International Equity Fund’s (the Fund) investment advisory agreements. During contract renewal meetings held on
June 9-10, 2015, the Board as a whole, and the disinterested or “independent” Trustees, who comprise over 75% of the Board, voting separately, approved the continuance for the Fund of the Master Investment Advisory Agreement with Invesco Advisers, Inc. (Invesco Advisers and the investment advisory agreement) and the Master Intergroup Sub-Advisory Contract for Mutual Funds with Invesco Asset Management Deutschland GmbH, Invesco Asset Management Limited, Invesco Asset Management (Japan) Limited, Invesco Hong Kong Limited, Invesco Senior Secured Management, Inc., Invesco Canada Ltd. and Invesco PowerShares Capital Management LLC (collectively, the Affiliated Sub-Advisers and the sub-advisory contracts) for another year, effective July 1, 2015.
In evaluating the fairness and reasonableness of compensation under the Fund’s investment advisory agreement and sub-advisory contracts, the Board considered, among other things, the factors discussed below. The Board determined that continuation of the Fund’s investment advisory agreement and the sub-advisory contracts are in the best interest of the Fund and its shareholders and that the compensation payable to Invesco Advisers and the Affiliated Sub-Advisers under the agreements is fair and reasonable.
The Board’s Fund Evaluation Process
The Board’s Investments Committee has established three Sub-Committees, each of which is primarily responsible for overseeing the performance and investment management services provided by Invesco Advisers and the Affiliated Sub-Advisers to a number of the funds advised by Invesco Advisers (the Invesco Funds). The Sub-Committees meet throughout the year to review the performance of their assigned Invesco Funds, including reviewing materials prepared under the direction of the independent Senior Officer, an officer of the Invesco Funds who reports directly to the independent Trustees. Over the course of each year, the Sub-Committees meet with portfolio managers for their assigned Invesco Funds and other members of management to review the performance, investment objective(s), policies, strategies, limitations and investment risks of these funds. The Board had the benefit of reports from the Sub-Committees and Investments Committee throughout the year in considering approval of the continuance of each Invesco Fund’s investment advisory agreement and sub-advisory contracts for another year.
During the contract renewal process, the Board receives comparative performance and fee data regarding the Invesco Funds prepared by Invesco Advisers and Lipper Inc. (Lipper), an independent provider of investment company data. The Board also receives a report and this independent written evaluation from the Senior Officer. The Senior Officer’s evaluation is prepared as part of his responsibility to manage the process by which the Invesco Funds’ proposed management fees are negotiated during the annual contract renewal process to ensure they are negotiated in a manner that is at arms’ length and reasonable. In addition to meetings with Invesco Advisers and fund counsel, the independent Trustees also discuss the continuance of the investment advisory agreement and sub-advisory contracts in separate sessions with the Senior Officer and with independent legal counsel.
The Trustees recognized that the advisory fee rates for the Invesco Funds are, in many cases, the result of years of review and negotiation. The Trustees’ deliberations and conclusions in a particular year may be based in part on their deliberations and conclusions regarding these same arrangements throughout the year and in prior years. The Trustees’ review and conclusions are based on the comprehensive consideration of all information presented to them and are not the result of any single determinative factor. Moreover, one Trustee may have weighed a particular piece of information or factor differently than another Trustee.
The discussion below is a summary of the Senior Officer’s independent written evaluation with respect to the Fund’s investment advisory agreement as well as a discussion of the material factors and related conclusions that formed the basis for the Board’s approval of the Fund’s investment advisory agreement and sub-advisory contracts. Unless otherwise stated, this information is current as of June 10, 2015, and does not reflect consideration of factors that became known to the Board after that date.
Factors and Conclusions and Summary of Independent Written Fee Evaluation
| A. | Nature, Extent and Quality of Services Provided by Invesco Advisers and the Affiliated Sub-Advisers |
The Board reviewed the advisory services provided to the Fund by Invesco Advisers under the Fund’s investment advisory agreement, the performance of Invesco Advisers in providing these services, and the credentials and experience of the officers and employees of Invesco Advisers who provide these services, including the Fund’s portfolio manager or managers. The Board’s review of the qualifications of Invesco Advisers to provide advisory services included the Board’s
consideration of Invesco Advisers’ investment process oversight, independent credit analysis and investment risk management. The Board also considered non-advisory services that Invesco Advisers and its affiliates provide to the Invesco Funds such as various back office support functions, equity and fixed income trading operations, internal audit, distribution, valuation and legal and compliance.
In determining whether to continue the Fund’s investment advisory agreement, the Board considered the benefits of reapproving an existing relationship and the greater uncertainty that may be associated with entering into a new relationship. The Board concluded that the nature, extent and quality of the services provided to the Fund by Invesco Advisers are appropriate and satisfactory and consistent with the terms of the Fund’s investment advisory agreement.
The Board reviewed the services that may be provided by the Affiliated Sub-Advisers under the sub-advisory contracts and the credentials and experience of the officers and employees of the Affiliated Sub-Advisers who provide these services. The Board noted that the Affiliated Sub-Advisers have offices and personnel that are located in financial centers around the world. As a result, the Affiliated Sub-Advisers can provide research and investment analysis on the markets and economies of various countries in which the Fund may invest, make recommendations regarding securities and assist with security trades. The Board concluded that the sub-advisory contracts benefit the Fund and its shareholders by permitting Invesco Advisers to use the resources and talents of the Affiliated Sub-Advisers in managing the Fund. The Board concluded that the nature, extent and quality of the services that may be provided by the Affiliated Sub-Advisers are appropriate and satisfactory and consistent with the terms of the Fund’s sub-advisory contracts.
The Board did not consider Fund performance as a relevant factor in considering whether to approve the investment advisory agreement as the Fund had only one year of performance history and no comparative data was available.
| C. | Advisory and Sub-Advisory Fees |
The Board considered the advisory fee schedule of the Fund and the contractual fee waivers and/or expense limitations that will be in place for the Fund through February 29, 2016. The Board had no comparative Lipper fee data because the Fund was launched in December 2013.
The Board noted that Invesco Advisers and the Affiliated Sub-Advisers do not manage other mutual funds or client accounts with investment strategies comparable to those of the Fund.
The Board also considered the services that may be provided by the Affiliated Sub-Advisers pursuant to the sub-advisory contracts, as well
32 Invesco Macro International Equity Fund
as the fees payable by Invesco Advisers to the Affiliated Sub-Advisers pursuant to the sub-advisory contracts. The Board also noted that the sub-advisory fees are not paid directly by the Fund, but rather, are payable to the Affiliated Sub-Advisers.
| D. | Economies of Scale and Breakpoints |
The Board considered the extent to which there are economies of scale in the provision of advisory services to the Fund. The Board also considered whether the Fund benefits from economies of scale through contractual breakpoints in the Fund’s advisory fee schedule. The Board also noted that the Fund shares directly in economies of scale through lower fees charged by third party service providers based on the combined size of the Invesco Funds and other clients advised by Invesco Advisers.
| E. | Profitability and Financial Resources |
The Board reviewed information from Invesco Advisers concerning the costs of the advisory and other services that Invesco Advisers and its affiliates provide to the Fund and the Invesco Funds and the profitability of Invesco Advisers and its affiliates in providing these services. The Board received information from Invesco Advisers about the methodology used to prepare the profitability information. The Board noted that Invesco Advisers continues to operate at a net profit from services Invesco Advisers and its affiliates provide to the Invesco Funds. The Board noted that Invesco Advisers and its affiliates did not make a profit from managing the Fund as a result of fee and expense waivers. The Board received and accepted information from Invesco Advisers demonstrating that Invesco Advisers and each Affiliated Sub-Adviser are financially sound and have the resources necessary to perform their obligations under the investment advisory agreement and sub-advisory contracts.
| F. | Collateral Benefits to Invesco Advisers and its Affiliates |
The Board considered various other benefits received by Invesco Advisers and its affiliates from the relationship with the Fund, including the fees received for providing transfer agency and distribution services to the Fund. The Board considered the performance of Invesco Advisers and its affiliates in providing these services and the organizational structure employed to provide these services. The Board also considered that these services are provided to the Fund pursuant to written contracts that are reviewed and approved on an annual basis by the Board; and that the services are required for the operation of the Fund.
The Board considered the benefits realized by Invesco Advisers and the Affiliated Sub-Advisers as a result of portfolio brokerage transactions executed through “soft dollar” arrangements. The Board noted that soft dollar arrangements shift the payment obligation for research services from Invesco Advisers and the Affiliated Sub-Advisers to the Invesco Funds and that the research received may be used with other clients of Invesco Advisers and may
reduce Invesco Advisers’ and the Affiliated Sub-Advisers’ expenses. The Board also considered that it receives periodic reports from the Chief Compliance Officer of the Invesco Funds demonstrating that these arrangements are consistent with regulatory requirements. The Board did not deem the soft dollar arrangements to be inappropriate.
The Board considered that the Fund’s uninvested cash and cash collateral from any securities lending arrangements may be invested in money market funds advised by Invesco Advisers pursuant to procedures approved by the Board. The Board noted that Invesco Advisers receives advisory fees from these affiliated money market funds attributable to such investments, although Invesco Advisers has contractually agreed to waive through varying periods the advisory fees payable by the Invesco Funds with respect to investments in the affiliated money market funds. The waiver is in an amount equal to 100% of the net advisory fee Invesco Advisers receives from the affiliated money market funds with respect to the Fund’s investment in the affiliated money market funds of uninvested cash, but not cash collateral. The Board concluded that the amount of advisory fees received by Invesco Advisors from the Fund’s investment of cash collateral from any securities lending arrangements in the affiliated money market funds is fair and reasonable.
The Board also considered the Fund may use an affiliated broker to execute certain trades for the Fund to among other things, control information leakage, and were advised that such trades would be executed in compliance with rules under the Investment Company Act of 1940, as amended, and consistent with best execution obligations.
33 Invesco Macro International Equity Fund
Tax Information
Form 1099-DIV, Form 1042-S and other year-end tax information provide shareholders with actual calendar year amounts that should be included in their tax returns. Shareholders should consult their tax advisors.
The following distribution information is being provided as required by the Internal Revenue Code or to meet a specific state’s requirement.
The Fund designates the following amounts or, if subsequently determined to be different, the maximum amount allowable for its fiscal year ended October 31, 2015:
| | | | |
Federal and State Income Tax | |
Long-Term Capital Gain Distributions | | $ | 6,086 | |
Qualified Dividend Income* | | | 78.53 | % |
Corporate Dividends Received Deduction* | | | 0 | % |
U.S. Treasury Obligations* | | | 0 | % |
| | * | The above percentages are based on ordinary income dividends paid to shareholders during the Fund’s fiscal year. |
| | | | |
Non-Resident Alien Shareholders | |
Qualified Short-Term Gains | | $ | 39,005 | |
34 Invesco Macro International Equity Fund
Trustees and Officers
The address of each trustee and officer is AIM Investment Funds (Invesco Investment Funds) (the “Trust”), 11 Greenway Plaza, Suite 1000, Houston, Texas 77046-1173. The trustees serve for the life of the Trust, subject to their earlier death, incapacitation, resignation, retirement or removal as more specifically provided in the Trust’s organizational documents. Each officer serves for a one year term or until their successors are elected and qualified. Column two below includes length of time served with predecessor entities, if any.
| | | | | | | | |
Name, Year of Birth and
Position(s) Held with the Trust | | Trustee and/
or Officer Since | | Principal Occupation(s)
During Past 5 Years | | Number of Funds in Fund Complex Overseen by Trustee | | Other Directorship(s) Held by Trustee During Past 5 Years |
| Interested Persons | | | | | | | | |
| Martin L. Flanagan1 — 1960 Trustee | | 2007 | | Executive Director, Chief Executive Officer and President, Invesco Ltd. (ultimate parent of Invesco and a global investment management firm); Advisor to the Board, Invesco Advisers, Inc. (formerly known as Invesco Institutional (N.A.), Inc.); Trustee, The Invesco Funds; Vice Chair, Investment Company Institute; and Member of Executive Board, SMU Cox School of Business Formerly: Chairman and Chief Executive Officer, Invesco Advisers, Inc. (registered investment adviser); Director, Chairman, Chief Executive Officer and President, IVZ Inc. (holding company), INVESCO Group Services, Inc. (service provider) and Invesco North American Holdings, Inc. (holding company); Director, Chief Executive Officer and President, Invesco Holding Company Limited (parent of Invesco and a global investment management firm); Director, Invesco Ltd.; Chairman, Investment Company Institute and President, Co-Chief Executive Officer, Co-President, Chief Operating Officer and Chief Financial Officer, Franklin Resources, Inc. (global investment management organization). | | 145 | | None |
Philip A. Taylor2 — 1954
Trustee, President and Principal Executive Officer | | 2006 | | Head of North American Retail and Senior Managing Director, Invesco Ltd.; Director, Co-Chairman, Co-President and Co-Chief Executive Officer, Invesco Advisers, Inc. (formerly known as Invesco Institutional (N.A.), Inc.) (registered investment adviser); Director, Chairman, Chief Executive Officer and President, Invesco Management Group, Inc. (formerly known as Invesco Aim Management Group, Inc.) (financial services holding company); Director and President, INVESCO Funds Group, Inc. (registered investment adviser and registered transfer agent); Director and Chairman, Invesco Investment Services, Inc. (formerly known as Invesco Aim Investment Services, Inc.) (registered transfer agent) and IVZ Distributors, Inc. (formerly known as INVESCO Distributors, Inc.) (registered broker dealer); Chief Executive Officer, Invesco Corporate Class Inc. (corporate mutual fund company) Director, Chairman and Chief Executive Officer, Invesco Canada Ltd. (formerly known as Invesco Trimark Ltd./Invesco Trimark Ltèe) (registered investment adviser and registered transfer agent); Trustee, President and Principal Executive Officer, The Invesco Funds (other than AIM Treasurer’s Series Trust (Invesco Treasurer’s Series Trust), Short-Term Investments Trust and Invesco Management Trust); Trustee and Executive Vice President, The Invesco Funds (AIM Treasurer’s Series Trust (Invesco Treasurer’s Series Trust), Short-Term Investments Trust and Invesco Management Trust only); Director, Invesco Investment Advisers LLC (formerly known as Van Kampen Asset Management); Director, Chief Executive Officer and President, Van Kampen Exchange Corp. Formerly: Director, President and Chairman, Invesco Inc. (holding company), Invesco Canada Holdings Inc. (holding company), Trimark Investments Ltd./Placements Trimark Ltèe and Invesco Financial Services Ltd/Services Financiers Invesco Ltèe; Chief Executive Officer, Invesco Canada Fund Inc (corporate mutual fund company); Director and Chairman, Van Kampen Investor Services Inc.; Director, Chief Executive Officer and President, 1371 Preferred Inc. (holding company) and Van Kampen Investments Inc.; Director and President, AIM GP Canada Inc. (general partner for limited partnerships) and Van Kampen Advisors, Inc.; Director and Chief Executive Officer, Invesco Trimark Dealer Inc. (registered broker dealer); Director, Invesco Distributors, Inc. (formerly known as Invesco Aim Distributors, Inc.) (registered broker dealer); Manager, Invesco PowerShares Capital Management LLC; Director, Chief Executive Officer and President, Invesco Advisers, Inc.; Director, Chairman, Chief Executive Officer and President, Invesco Aim Capital Management, Inc.; President, Invesco Trimark Dealer Inc. and Invesco Trimark Ltd./Invesco Trimark Ltèe; Director and President, AIM Trimark Corporate Class Inc. and AIM Trimark Canada Fund Inc.; Senior Managing Director, Invesco Holding Company Limited; Director and Chairman, Fund Management Company (former registered broker dealer); President and Principal Executive Officer, The Invesco Funds (AIM Treasurer’s Series Trust (Invesco Treasurer’s Series Trust), and Short-Term Investments Trust only); President, AIM Trimark Global Fund Inc. and AIM Trimark Canada Fund Inc.. | | 145 | | None |
| 1 | Mr. Flanagan is considered an interested person (within the meaning of Section 2(a)(19) of the 1940 Act) of the Trust because he is an officer of the Adviser to the Trust, and an officer and a director of Invesco Ltd., ultimate parent of the Adviser. |
| 2 | Mr. Taylor is considered an interested person (within the meaning of Section 2(a)(19) of the 1940 Act) of the Trust because he is an officer and a director of the Adviser. |
T-1 Invesco Macro International Equity Fund
Trustees and Officers—(continued)
| | | | | | | | |
Name, Year of Birth and Position(s) Held with the Trust | | Trustee and/ or Officer Since | | Principal Occupation(s) During Past 5 Years | | Number of Funds in Fund Complex Overseen by Trustee | | Other Directorship(s) Held by Trustee During Past 5 Years |
| Independent Trustees | | | | | | | | |
Bruce L. Crockett — 1944 Trustee and Chair | | 2003 | | Chairman, Crockett Technologies Associates (technology consulting company) Formerly: Director, Captaris (unified messaging provider); Director, President and Chief Executive Officer, COMSAT Corporation; Chairman, Board of Governors of INTELSAT (international communications company); ACE Limited (insurance company); Independent Directors Council and Investment Company Institute | | 145 | | ALPS (Attorneys Liability Protection Society) (insurance company) and Globe Specialty Metals, Inc. (metallurgical company) |
David C. Arch — 1945 Trustee | | 2010 | | Chairman of Blistex Inc., a consumer health care products manufacturer | | 145 | | Board member of the Illinois Manufacturers’ Association; Member of the Board of Visitors, Institute for the Humanities, University of Michigan; Member of the Audit Committee of the Edward-Elmhurst Hospital |
James T. Bunch — 1942 Trustee | | 2000 | | Managing Member, Grumman Hill Group LLC (family office/private equity investments) Formerly: Founder, Green Manning & Bunch Ltd. (investment banking firm) (1988-2010); Executive Committee, United States Golf Association; and Chairman, Board of Governors, Western Golf Association | | 145 | | Chairman of the Board of Trustees, Evans Scholars Foundation; and Chairman of the Board, Denver Film Society |
Rodney F. Dammeyer — 1940 Trustee | | 2010 | | Chairman of CAC, LLC, (private company offering capital investment and management advisory services) Formerly: Prior to 2001, Managing Partner at Equity Group Corporate Investments; Prior to 1995, Chief Executive Officer of Itel Corporation (formerly Anixter International); Prior to 1985, experience includes Senior Vice President and Chief Financial Officer of Household International, Inc., Executive Vice President and Chief Financial Officer of Northwest Industries, Inc. and Partner of Arthur Andersen & Co.; From 1987 to 2010, Director/Trustee of investment companies in the Van Kampen Funds complex | | 145 | | Director of Quidel Corporation and Stericycle, Inc. |
Albert R. Dowden — 1941 Trustee | | 2003 | | Director of a number of public and private business corporations, including the Boss Group, Ltd. (private investment and management); Nature’s Sunshine Products, Inc. and Reich & Tang Funds (5 portfolios) (registered investment company) Formerly: Director, Homeowners of America Holding Corporation/Homeowners of America Insurance Company (property casualty company); Director, Continental Energy Services, LLC (oil and gas pipeline service); Director, CompuDyne Corporation (provider of product and services to the public security market) and Director, Annuity and Life Re (Holdings), Ltd. (reinsurance company); Director, President and Chief Executive Officer, Volvo Group North America, Inc.; Senior Vice President, AB Volvo; Director of various public and private corporations; Chairman, DHJ Media, Inc.; Director, Magellan Insurance Company; and Director, The Hertz Corporation, Genmar Corporation (boat manufacturer), National Media Corporation; Advisory Board of Rotary Power International (designer, manufacturer, and seller of rotary power engines); and Chairman, Cortland Trust, Inc. (registered investment company) | | 145 | | Director of: Nature’s Sunshine Products, Inc., Reich & Tang Funds, Homeowners of America Holding Corporation/ Homeowners of America Insurance Company, the Boss Group |
Jack M. Fields — 1952 Trustee | | 2003 | | Chief Executive Officer, Twenty First Century Group, Inc. (government affairs company); Owner and Chief Executive Officer, Dos Angeles Ranch, L.P. (cattle, hunting, corporate entertainment); and Discovery Global Education Fund (non-profit) Formerly: Chief Executive Officer, Texana Timber LP (sustainable forestry company); Director of Cross Timbers Quail Research Ranch (non-profit); and member of the U.S. House of Representatives | | 145 | | Insperity, Inc. (formerly known as Administaff) |
Prema Mathai-Davis — 1950 Trustee | | 2003 | | Retired. Formerly: Chief Executive Officer, YWCA of the U.S.A. | | 145 | | None |
Larry Soll — 1942 Trustee | | 1997 | | Retired. Formerly: Chairman, Chief Executive Officer and President, Synergen Corp. (a biotechnology company) | | 145 | | None |
Hugo F. Sonnenschein — 1940 Trustee | | 2010 | | President Emeritus and Honorary Trustee of the University of Chicago and the Adam Smith Distinguished Service Professor in the Department of Economics at the University of Chicago. Prior to 2000, President of the University of Chicago | | 145 | | Trustee of the University of Rochester and a member of its investment committee; Member of the National Academy of Sciences and the American Philosophical Society; Fellow of the American Academy of Arts and Sciences |
Raymond Stickel, Jr. — 1944 Trustee | | 2005 | | Retired. Formerly: Director, Mainstay VP Series Funds, Inc. (25 portfolios) and Partner, Deloitte & Touche | | 145 | | None |
T-2 Invesco Macro International Equity Fund
Trustees and Officers—(continued)
| | | | | | | | |
Name, Year of Birth and Position(s) Held with the Trust | | Trustee and/ or Officer Since | | Principal Occupation(s) During Past 5 Years | | Number of Funds in Fund Complex Overseen by Trustee | | Other Directorship(s) Held by Trustee During Past 5 Years |
| Independent Trustees—(continued) |
Suzanne H. Woolsey — 1941 Trustee | | 2014 | | Chief Executive Officer of Woolsey Partners LLC | | 145 | | Emeritus Chair of the Board of Trustees of the Institute for Defense Analyses; Trustee of Colorado College; Trustee of California Institute of Technology; Prior to 2014, Director of Fluor Corp.; Prior to 2010, Trustee of the German Marshall Fund of the United States; Prior to 2010 Trustee of the Rocky Mountain Institute |
| Other Officers | | | | | | | | |
Russell C. Burk — 1958
Senior Vice President and Senior Officer | | 2005 | | Senior Vice President and Senior Officer, The Invesco Funds | | N/A | | N/A |
John M. Zerr — 1962
Senior Vice President, Chief Legal Officer and Secretary | | 2006 | | Director, Senior Vice President, Secretary and General Counsel, Invesco Management Group, Inc. (formerly known as Invesco Aim Management Group, Inc.) and Van Kampen Exchange Corp.; Senior Vice President, Invesco Advisers, Inc. (formerly known as Invesco Institutional (N.A.), Inc.) (registered investment adviser); Senior Vice President and Secretary, Invesco Distributors, Inc. (formerly known as Invesco Aim Distributors, Inc.); Director, Vice President and Secretary, Invesco Investment Services, Inc. (formerly known as Invesco Aim Investment Services, Inc.) and IVZ Distributors, Inc. (formerly known as INVESCO Distributors, Inc.); Director and Vice President, INVESCO Funds Group, Inc.; Senior Vice President, Chief Legal Officer and Secretary, The Invesco Funds; Managing Director, Invesco PowerShares Capital Management LLC; Director, Secretary and General Counsel, Invesco Investment Advisers LLC (formerly known as Van Kampen Asset Management); Secretary and General Counsel, Invesco Capital Markets, Inc. (formerly known as Van Kampen Funds Inc.) and Chief Legal Officer, PowerShares Exchange-Traded Fund Trust, PowerShares Exchange-Traded Fund Trust II, PowerShares India Exchange-Traded Fund Trust, PowerShares Actively Managed Exchange-Traded Fund Trust, and PowerShares Actively Managed Exchange-Traded Commodity Fund Trust Formerly: Director and Vice President, Van Kampen Advisors Inc.; Director, Vice President, Secretary and General Counsel, Van Kampen Investor Services Inc.; Director, Invesco Distributors, Inc. (formerly known as Invesco Aim Distributors, Inc.); Director, Senior Vice President, General Counsel and Secretary, Invesco Aim Advisers, Inc. and Van Kampen Investments Inc.; Director, Vice President and Secretary, Fund Management Company; Director, Senior Vice President, Secretary, General Counsel and Vice President, Invesco Aim Capital Management, Inc.; Chief Operating Officer and General Counsel, Liberty Ridge Capital, Inc. (an investment adviser); Vice President and Secretary, PBHG Funds (an investment company) and PBHG Insurance Series Fund (an investment company); Chief Operating Officer, General Counsel and Secretary, Old Mutual Investment Partners (a broker-dealer); General Counsel and Secretary, Old Mutual Fund Services (an administrator) and Old Mutual Shareholder Services (a shareholder servicing center); Executive Vice President, General Counsel and Secretary, Old Mutual Capital, Inc. (an investment adviser); and Vice President and Secretary, Old Mutual Advisors Funds (an investment company) | | N/A | | N/A |
Sheri Morris — 1964
Vice President, Treasurer and Principal Financial Officer | | 2003 | | Vice President, Treasurer and Principal Financial Officer, The Invesco Funds; Vice President, Invesco Advisers, Inc. (formerly known as Invesco Institutional (N.A.), Inc.) (registered investment adviser); and Vice President, PowerShares Exchange-Traded Fund Trust, PowerShares Exchange-Traded Fund Trust II, PowerShares India Exchange-Traded Fund Trust, PowerShares Actively Managed Exchange-Traded Fund Trust, and PowerShares Actively Managed Exchange-Traded Commodity Fund Trust Formerly: Vice President, Invesco Aim Advisers, Inc., Invesco Aim Capital Management, Inc. and Invesco Aim Private Asset Management, Inc.; Assistant Vice President and Assistant Treasurer, The Invesco Funds and Assistant Vice President, Invesco Advisers, Inc., Invesco Aim Capital Management, Inc. and Invesco Aim Private Asset Management, Inc.; and Treasurer, PowerShares Exchange-Traded Fund Trust, PowerShares Exchange-Traded Fund Trust II, PowerShares India Exchange-Traded Fund Trust and PowerShares Actively Managed Exchange-Traded Fund Trust | | N/A | | N/A |
T-3 Invesco Macro International Equity Fund
Trustees and Officers—(continued)
| | | | | | | | |
Name, Year of Birth and
Position(s) Held with the Trust | | Trustee and/
or Officer Since | | Principal Occupation(s)
During Past 5 Years | | Number of Funds in Fund Complex Overseen by Trustee | | Other Directorship(s) Held by Trustee During Past 5 Years |
| Other Officers—(continued) | | | | | | | | |
Karen Dunn Kelley — 1960
Vice President | | 2003 | | Senior Managing Director, Investments, Invesco Ltd.; Director, Co-President, Co-Chief Executive Officer, and Co-Chairman, Invesco Advisers, Inc. (formerly known as Invesco Institutional (N.A.), Inc.) (registered investment adviser); Chairman, Invesco Senior Secured Management, Inc.; Senior Vice President, Invesco Management Group, Inc. (formerly known as Invesco Aim Management Group, Inc.); Executive Vice President, Invesco Distributors, Inc. (formerly known as Invesco Aim Distributors, Inc.); Director, Invesco Mortgage Capital Inc. and Invesco Management Company Limited; Vice President, The Invesco Funds (other than AIM Treasurer’s Series Trust (Invesco Treasurer’s Series Trust), Short-Term Investments Trust and Invesco Management Trust); and President and Principal Executive Officer, The Invesco Funds (AIM Treasurer’s Series Trust (Invesco Treasurer’s Series Trust), Short-Term Investments Trust and Invesco Management Trust only) Formerly: Director and President, INVESCO Asset Management (Bermuda) Ltd., Director, INVESCO Global Asset Management Limited and INVESCO Management S.A.; Senior Vice President, Van Kampen Investments Inc. and Invesco Advisers, Inc. (formerly known as Invesco Institutional (N.A.), Inc.) (registered investment adviser); Vice President, Invesco Advisers, Inc. (formerly known as Invesco Institutional (N.A.), Inc.); Director of Cash Management and Senior Vice President, Invesco Advisers, Inc. and Invesco Aim Capital Management, Inc.; Director and President, Fund Management Company; Chief Cash Management Officer, Director of Cash Management, Senior Vice President, and Managing Director, Invesco Aim Capital Management, Inc.; Director of Cash Management, Senior Vice President, and Vice President, Invesco Advisers, Inc. and The Invesco Funds (AIM Treasurer’s Series Trust (Invesco Treasurer’s Series Trust), and Short-Term Investments Trust only) | | N/A | | N/A |
Crissie M. Wisdom — 1969 Anti-Money Laundering Compliance Officer | | 2013 | | Anti-Money Laundering Compliance Officer, Invesco Advisers, Inc. (formerly known as Invesco Institutional (N.A.), Inc.) (registered investment adviser), Invesco Capital Markets, Inc. (formerly known as Van Kampen Funds Inc.), Invesco Distributors, Inc., Invesco Investment Services, Inc., Invesco Management Group, Inc., Van Kampen Exchange Corp., The Invesco Funds, and PowerShares Exchange-Traded Fund Trust, PowerShares Exchange-Traded Fund Trust II, PowerShares India Exchange-Traded Fund Trust, PowerShares Actively Managed Exchange-Traded Fund Trust and PowerShares Actively Managed Exchange-Traded Commodity Fund Trust; Anti-Money Laundering Compliance Officer and Bank Secrecy Act Officer, INVESCO National Trust Company and Invesco Trust Company; and Fraud Prevention Manager and Controls and Risk Analysis Manager for Invesco Investment Services, Inc.. | | N/A | | N/A |
Lisa O. Brinkley — 1959 Chief Compliance Officer | | 2015 | | Senior Vice President and Chief Compliance Officer, Invesco Advisers, Inc. (registered investment adviser) (formerly known as Invesco Institutional (N.A., Inc.); and Chief Compliance Officer, The Invesco Funds Formerly: Global Assurance Officer, Invesco Ltd. and Vice President, The Invesco Funds; Chief Compliance Officer, Invesco Distributors, Inc. (formerly known as Invesco Aim Distributors, Inc.), Invesco Investment Services, Inc.(formerly known as Invesco Aim Investment Services, Inc.) and Van Kampen Investor Services Inc.; Senior Vice President, Invesco Management Group, Inc.; Senior Vice President and Chief Compliance Officer, Invesco Advisers, Inc. and The Invesco Funds; Vice President and Chief Compliance Officer, Invesco Aim Capital Management, Inc. and Invesco Distributors, Inc.; Vice President, Invesco Investment Services, Inc. and Fund Management Company. | | N/A | | N/A |
The Statement of Additional Information of the Trust includes additional information about the Fund’s Trustees and is available upon request, without charge, by calling 1.800.959.4246. Please refer to the Fund’s prospectus for information on the Fund’s sub-advisers.
| | | | | | |
Office of the Fund 11 Greenway Plaza, Suite 1000 Houston, TX 77046-1173 | | Investment Adviser Invesco Advisers, Inc. 1555 Peachtree Street, N.E. Atlanta, GA 30309 | | Distributor
Invesco Distributors, Inc. 11 Greenway Plaza, Suite 1000 Houston, TX 77046-1173 | | Auditors PricewaterhouseCoopers LLP 1000 Louisiana Street, Suite 5800 Houston, TX 77002-5678 |
| | | |
| | | | | | |
Counsel to the Fund Stradley Ronon Stevens & Young, LLP 2005 Market Street, Suite 2600 Philadelphia, PA 19103-7018 | | Counsel to the Independent Trustees Goodwin Procter LLP 901 New York Avenue, N.W. Washington, D.C. 20001 | | Transfer Agent Invesco Investment Services, Inc. 11 Greenway Plaza, Suite 1000 Houston, TX 77046-1173 | | Custodian State Street Bank and Trust Company 225 Franklin Street Boston, MA 02110-2801 |
T-4 Invesco Macro International Equity Fund

Invesco mailing information
Send general correspondence to Invesco Investment Services, Inc., P.O. Box 219078, Kansas City, MO 64121-9078.
Important notice regarding delivery of security holder documents
To reduce Fund expenses, only one copy of most shareholder documents may be mailed to shareholders with multiple accounts at the same address (Householding). Mailing of your shareholder documents may be householded indefinitely unless you instruct us otherwise. If you do not want the mailing of these documents to be combined with those for other members of your household, please contact Invesco Investment Services, Inc. at 800 959 4246 or contact your financial institution. We will begin sending you individual copies for each account within 30 days after receiving your request.
Fund holdings and proxy voting information
The Fund provides a complete list of its holdings four times in each fiscal year, at the quarter ends. For the second and fourth quarters, the lists appear in the Fund’s semiannual and annual reports to shareholders. For the first and third quarters, the Fund files the lists with the Securities and Exchange Commission (SEC) on Form N-Q. The most recent list of portfolio holdings is available at invesco.com/completeqtrholdings. Shareholders can also look up the Fund’s Forms N-Q on the SEC website at sec.gov. Copies of the Fund’s Forms N-Q may be reviewed and copied at the SEC Public Reference Room in Washington, D.C. You can obtain information on the operation of the Public Reference Room, including information about duplicating fee charges, by calling 202 551 8090 or 800 732 0330, or by electronic request at the following email address: publicinfo@sec.gov. The SEC file numbers for the Fund are shown below.
A description of the policies and procedures that the Fund uses to determine how to vote proxies relating to portfolio securities is available without charge, upon request, from our Client Services department at 800 959 4246 or at invesco.com/proxyguidelines. The information is also available on the SEC website, sec.gov.
| | |
Information regarding how the Fund voted proxies related to its portfolio securities during the most recent 12-month period ended June 30 is available at invesco.com/proxysearch. The information is also available on the SEC website, sec.gov. Invesco Advisers, Inc. is an investment adviser; it provides investment advisory services to individual and institutional clients and does not sell securities. Invesco Distributors, Inc. is the US distributor for Invesco Ltd.’s retail mutual funds, exchange-traded funds and institutional money market funds. Both are wholly owned, indirect subsidiaries of Invesco Ltd. | |  |
| | | | |
| SEC file numbers: 811-05426 and 033-19338 | | MIE-AR-1 | | Invesco Distributors, Inc. |
| | | | |
| | |
 | | Annual Report to Shareholders | | October 31, 2015 |
| | |
| | Invesco Macro Long/Short Fund |
| | Nasdaq: |
| | A: LSTAX n C: LSTCX n R: LSTRX n Y: LSTYX n R5: LSTFX n R6: LSTSX |

Letters to Shareholders
| | |

Philip Taylor | | Dear Shareholders: This annual report includes information about your Fund, including performance data and a complete list of its investments as of the close of the reporting period. Inside is a discussion of how your Fund was managed and the factors that affected its performance during the reporting period. I hope you find this report of interest. The US economy expanded and unemployment declined throughout the reporting period. Continuing low energy prices benefited consumers, but a strong US dollar crimped corporate profits. The US Federal Reserve signaled that it was increasingly likely to raise interest rates, based on generally positive economic data, but uncertainty remained about when it might act. Overseas, the story was much different. Low energy prices hurt the economies of some oil-producing nations, such as Brazil and Russia. During the reporting period, the European Central |
Bank as well as central banks in China and Japan – among other countries – either instituted or maintained extraordinarily accommodative monetary policies in response to economic weakness.
Investor uncertainty, such as we saw for much of the reporting period – and market volatility, such as we saw at the end of the reporting period – are unfortunate facts of life when it comes to investing. Some investors use these things as excuses to delay saving and investing for their long-term financial goals. That’s why Invesco encourages investors to work with a professional financial adviser who can stress the importance of starting to save and invest early and the importance of adhering to a disciplined investment plan – when times are good and when they’re uncertain. A financial adviser who knows your unique financial situation, investment goals and risk tolerance can be an invaluable partner as you seek to achieve your financial goals. He or she can offer a long-term perspective when markets are volatile and time-tested advice and guidance when your financial situation or investment goals change.
Timely information when and where you want it
Invesco’s efforts to help investors achieve their financial objectives include providing individual investors and financial professionals with timely information about the markets, the economy and investing – whenever and wherever they want it.
Our website, invesco.com/us, offers a wide range of market insights and investment perspectives. On the website, you’ll find detailed information about our funds, including prices, performance, holdings and portfolio manager commentaries. You can access information about your account by completing a simple, secure online registration. Click on the “Need to register” link in the “Account Access” box on our homepage to get started.
Invesco’s mobile apps for iPhone® and iPad® (both available free from the App StoreSM) allow you to obtain the same detailed information, monitor your account and create customizable watch lists. Also, they allow you to access investment insights from our investment leaders, market strategists, economists and retirement experts. You can sign up to be alerted when new commentary is added, and you can watch portfolio manager videos and have instant access to Invesco news and updates wherever you may be.
In addition to the resources accessible on our website and through our mobile app, you can obtain timely updates to help you stay informed about the markets, the economy and investing by connecting with Invesco on Twitter, LinkedIn or Facebook. You can access our blog at blog.invesco.us.com. Our goal is to provide you the information you want, when and where you want it.
Have questions?
For questions about your account, feel free to contact an Invesco client services representative at 800 959 4246. For Invesco-related questions or comments, please email me directly at phil@invesco.com.
All of us at Invesco look forward to serving your investment management needs for many years to come. Thank you for investing with us.
Sincerely,

Philip Taylor
Senior Managing Director, Invesco Ltd.
iPhone and iPad are trademarks of Apple Inc., registered in the US and other countries. App Store is a service mark of Apple Inc. Invesco Distributors, Inc. is not affiliated with Apple Inc.
|
| 2 Invesco Macro Long/Short Fund |
| | |

Bruce Crockett | | Dear Fellow Shareholders: Among the many important lessons I’ve learned in more than 40 years in a variety of business endeavors is the value of a trusted advocate. As independent chair of the Invesco Funds Board, I can assure you that the members of the Board are strong advocates for the interests of investors in Invesco’s mutual funds. We work hard to represent your interests through oversight of the quality of the investment management services your funds receive and other matters important to your investment, including but not limited to: n Ensuring that Invesco offers a diverse lineup of mutual funds that your financial adviser can use to strive to meet your financial needs as your investment goals change over time. n Monitoring how the portfolio management teams of the Invesco funds are performing in light of changing economic and market conditions. |
| n | | Assessing each portfolio management team’s investment performance within the context of the investment strategy described in the fund’s prospectus. |
| n | | Monitoring for potential conflicts of interests that may impact the nature of the services that your funds receive. |
We believe one of the most important services we provide our fund shareholders is the annual review of the funds’ advisory and sub-advisory contracts with Invesco Advisers and its affiliates. This review is required by the Investment Company Act of 1940 and focuses on the nature and quality of the services Invesco provides as the adviser to the Invesco funds and the reasonableness of the fees that it charges for those services. Each year, we spend months carefully reviewing information received from Invesco and a variety of independent sources, such as performance and fee data prepared by Lipper Inc., an independent, third-party firm widely recognized as a leader in its field. We also meet with our independent legal counsel and other independent advisers to review and help us assess the information that we have received. Our goal is to assure that you receive quality investment management services for a reasonable fee.
I trust the measures outlined above provide assurance that you have a worthy advocate when it comes to choosing the Invesco Funds.
As always, please contact me at bruce@brucecrockett.com with any questions or concerns you may have. On behalf of the Board, we look forward to continuing to represent your interests and serving your needs.
Sincerely,

Bruce L. Crockett
Independent Chair
Invesco Funds Board of Trustees
|
| 3 Invesco Macro Long/Short Fund |
Management’s Discussion of Fund Performance
Performance summary
For the fiscal year ended October 31, 2015, Class A shares of Invesco Macro Long/ Short Fund, at net asset value (NAV), underperformed the Barclays
3-Month Treasury Bellwether Index, the Fund’s style-specific index.
Your Fund’s long-term performance appears later in this report.
Fund vs. Indexes
Total returns, 10/31/14 to 10/31/15, at net asset value (NAV). Performance shown does not include applicable contingent deferred sales charges (CDSC) or front-end sales charges, which would have reduced performance.
| | | | | |
Class A Shares | | | | -2.37 | % |
Class C Shares | | | | -3.13 | |
Class R Shares | | | | -2.59 | |
Class Y Shares | | | | -2.05 | |
Class R5 Shares | | | | -2.14 | |
Class R6 Shares | | | | -2.05 | |
| MSCI All Country World Index▼ (Broad Market Index) | | | | -0.03 | |
| Barclays 3-Month Treasury Bellwether Index▼ (Style-Specific Index) | | | | 0.04 | |
Lipper Alternative Long/Short Equity Index¢ (Peer Group Index) | | | | -0.39 | |
| |
| Source(s): ▼FactSet Research Systems Inc.; ¢Lipper Inc. | | | | | |
Market conditions and your Fund
The reporting period began with equity markets facing increased headwinds as the US Federal Reserve (the Fed) ended its asset purchase program in October 2014. The impact of this would be offset later in the reporting period by announcements of massive quantitative easing (QE) efforts in Europe and Japan. A sharp decline in energy prices during the fourth quarter of 2014 contributed to increased volatility. As the implications of lower oil prices worked their way through financial markets during the first quarter of 2015, equities began to rally, buoyed also by global QE efforts. However, it appeared that this liquidity-driven environment could potentially lay down the
foundation for significant volatility going forward. This volatility began to emerge in the spring of 2015 and negatively impacted equity markets amid growing concerns that Greece and the eurozone would fail to reach an agreement on a financial bailout plan. However, those fears subsided when a bailout was ultimately approved. The third quarter of 2015 was marred by heightened volatility as a result of disappointing economic data across developed economies and China, suggesting a more difficult environment ahead for equities. In August 2015, equities suffered a major and broad-based correction. September followed suit but to a lesser degree, partly due to the postponement of a monetary policy shift by the Fed.
For the reporting period, the Fund’s negative performance was mainly driven by the significant equity market correction in August. The Fund uses multifactor models that look at valuation, economic environments and price trends to adjust its portfolio to complement short-term market dynamics. The Fund’s tactical overlay was implemented through the use of futures and was the main source of Fund underperformance for the reporting period, with the Fund’s exposure to emerging markets, US small-cap companies and the Hang Seng Composite Index having the greatest negative impact on Fund performance (The Hang Seng Composite Index is a Hong Kong stock-market index measuring the performance of major companies listed on the Main Board of the Stock Exchange of Hong Kong.)
The Fund also uses “smart beta” indexes to build up core equity exposure, including regional exposure. Beta is a measure of risk representing how a security is expected to respond to general market movements. Smart beta represents an alternative and selection index based methodology that seeks to outperform a benchmark or reduce portfolio risk, or both. Smart beta funds may underperform cap-weighted benchmarks and increase portfolio risk. For this strategy, we invest in companies in approximately the same proportion as they are represented in the smart beta indexes, which utilize equal weighting, low volatility or other methodologies to determine stock investments and appropriate weightings. Investments from the smart beta indexes that detracted from performance were the allocations to emerging
| | | | |
| Portfolio Composition | | | | |
By country | |
| % of total net
assets |
|
| | | | |
United States | | | 23.5 | % |
Japan | | | 11.7 | |
United Kingdom | | | 11.0 | |
Australia | | | 5.9 | |
Hong Kong | | | 3.2 | |
Taiwan | | | 2.7 | |
France | | | 2.6 | |
Switzerland | | | 2.1 | |
| Countries each less than 2.0% of portfolio | | | 19.7 | |
| Money Market Funds Plus Other Assets Less Liabilities† | | | 17.6 | |
| † | The unrealized appreciation/depreciation of futures, forwards and swaps are included in “Money Market Funds Plus Other Assets Less Liabilities.” |
| | | | | | |
| Target Regional Breakdown | |
| | | | | | Target Net Assets | 1 |
| | | | | | |
United States Small-Cap | | | 13.58 | % |
Emerging Market | | | 12.47 | |
Japan | | | 11.63 | |
United Kingdom | | | 9.09 | |
Asia ex-Japan | | | 8.74 | |
United States Large-Cap | | | 5.09 | |
Europe ex-United Kingdom | | | 4.67 | |
| Money Market Funds Plus Other Assets Less Liabilities | | | 20.00 | |
Total | | | | | 85.27 | |
| 1 | Proprietary models determine the target net asset weights necessary to achieve the desired regional breakdown. Target net assets greater than 100% is achieved through derivatives and other instruments that create leverage. Regional breakdown percentages represent the net of the Fund’s long and short positions. |
| | | | | |
Total Net Assets | | | | $13.8 million | |
| |
| Total Number of Holdings* | | | | 1,248 | |
The Fund’s holdings are subject to change, and there is no assurance that the Fund will continue to hold any particular security.
*Excluding money market fund holdings.
Data presented here are as of October 31, 2015.
|
| 4 Invesco Macro Long/Short Fund |
markets as well as the Fund’s exposure to the Hang Seng Composite Index. These exposures dominated the total performance of the strategy so that on an aggregate basis for the reporting period, emerging markets and the Fund’s exposure to the Hang Seng Composite Index were the main detractors from Fund performance. The Fund’s allocation to Japan, through both futures contracts and direct investments, was the principal contributor to performance for the reporting period, as it was the only region we invested in that produced double-digit returns. This allocation, however, was not enough to offset the even larger losses coming from the Fund’s allocations to emerging markets and its exposure to the Hang Seng Composite Index.
Please note that our strategy utilizes derivative instruments that include futures and total return swaps. Therefore, some of the performance of the strategy, both positive and negative, can be attributed to these instruments. Derivatives can be a cost-effective way to gain exposure to asset classes. However, derivatives may amplify traditional investment risks through the creation of leverage and may be less liquid than traditional securities.
Thank you for your continued commitment to Invesco Macro Long/Short Fund.
The views and opinions expressed in management’s discussion of Fund performance are those of Invesco Advisers, Inc. These views and opinions are subject to change at any time based on factors such as market and economic conditions. These views and opinions may not be relied upon as investment advice or recommendations, or as an offer for a particular security. The information is not a complete analysis of every aspect of any market, country, industry, security or the Fund. Statements of fact are from sources considered reliable, but Invesco Advisers, Inc. makes no representation or warranty as to their completeness or accuracy. Although historical performance is no guarantee of future results, these insights may help you understand our investment management philosophy.
See important Fund and, if applicable, index disclosures later in this report.
| | |
 | | Mark Ahnrud Chartered Financial Analyst, Portfolio Manager, is manager of Invesco Macro Long/Short Fund. He |
| joined Invesco in 2000. Mr. Ahnrud earned a BS in finance and investments from Babson College and an MBA from Duke University Fuqua School of Business. |
| |
 | | Chris Devine Chartered Financial Analyst, Portfolio Manager, is manager of Invesco Macro Long/Short Fund. He |
| joined Invesco in 1998. Mr. Devine earned a BA in economics from Wake Forest University and an MBA from the University of Georgia. |
| |
 | | Scott Hixon Chartered Financial Analyst, Portfolio Manager, is manager of Invesco Macro Long/Short Fund. He |
| joined Invesco in 1994. Mr. Hixon earned a BBA in finance from Georgia Southern University and an MBA in finance from Georgia State University. |
| |
 | | Christian Ulrich Chartered Financial Analyst, Portfolio Manager, is manager of Invesco Macro Long/Short Fund. He |
joined Invesco in 2000. Mr. Ulrich earned the equivalent of a BBA from the KV Zurich Business School in Zurich, Switzerland. |
| |
 | | Scott Wolle Chartered Financial Analyst, Portfolio Manager, is manager of Invesco Macro Long/Short Fund.He |
| joined Invesco in 1999. Mr. Wolle earned a BS in finance from Virginia Polytechnic Institute and State University and an MBA from Duke University Fuqua School of Business. |
Assisted by Invesco’s Global Asset Allocation Team
|
| 5 Invesco Macro Long/Short Fund |
Your Fund’s Long-Term Performance
Results of a $10,000 Investment – Oldest Share Class(es) Since Inception
Fund and index data from 12/17/13
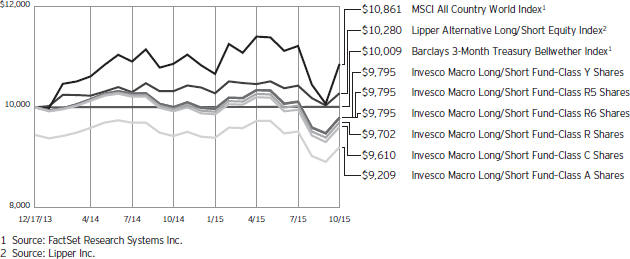
Past performance cannot guarantee comparable future results.
The data shown in the chart include reinvested distributions, applicable sales charges and Fund expenses including
management fees. Index results include reinvested dividends, but they do not reflect sales charges. Performance of the peer group, if applicable, reflects fund expenses and management fees;
performance of a market index does not. Performance shown in the chart and table(s) does not reflect deduction of taxes a shareholder would pay on Fund distributions or sale of Fund shares.
continued from page 8
mid-sized companies may be more volatile due to less market interest and less publicly available information about the issuer. They also may be illiquid or restricted as to resale, or may trade less frequently and in smaller volumes, all of which may cause difficulty when establishing or closing a position at a desirable price.
| | n | | Volatility risk. The Fund may have investments that appreciate or decrease significantly in value over short periods of time. This may cause the Fund’s net asset value per share to experience significant increases or declines in value over short periods of time. |
About indexes used in this report
| | n | | The MSCI All Country World Index is a free float-adjusted market capitalization index that is designed to measure equity market performance of developed and emerging markets. The index is computed using the net return, which withholds applicable taxes for non-resident investors. |
| | n | | The Barclays 3-Month Treasury Bellwether Index measures the performance of Treasury bills with maturities of less than three months. |
| | n | | The Lipper Alternative Long/Short Equity Index is composed of domestic or foreign funds that employ portfolio strategies combining long holdings of equities with short sales of equity, equity options or equity index options. The funds may be either net long or net short, depending on the portfolio managers’ view of the market. |
| | n | | The Fund is not managed to track the performance of any particular index, including the index(es) described here, and consequently, the performance of the Fund may deviate significantly from the performance of the
index(es). |
| | n | | A direct investment cannot be made in an index. Unless otherwise indicated, index results include reinvested dividends, and they do not reflect sales charges. Performance of the peer group, if applicable, reflects fund expenses; performance of a market index does not. |
Other information
| | n | | The returns shown in management’s discussion of Fund performance are based on net asset values (NAVs) calculated for shareholder transactions. Generally accepted accounting principles require adjustments to be made to the net assets of the Fund at period end for financial reporting purposes, and as such, the NAVs for shareholder transactions and the returns based on those NAVs may differ from the NAVs and returns reported in the Financial Highlights. |
| | n | | Industry classifications used in this report are generally according to the Global Industry Classification Standard, which was developed by and is the exclusive property and a service mark of MSCI Inc. and Standard & Poor’s. |
|
| 6 Invesco Macro Long/Short Fund |
| | | | | |
| Average Annual Total Returns |
| As of 10/31/15, including maximum applicable sales charges | | | | | |
| |
Class A Shares | | | | | |
Inception (12/17/13) | | | | -4.31 | % |
1 Year | | | | -7.73 | |
| |
Class C Shares | | | | | |
Inception (12/17/13) | | | | -2.10 | % |
1 Year | | | | -4.09 | |
| |
Class R Shares | | | | | |
Inception (12/17/13) | | | | -1.61 | % |
1 Year | | | | -2.59 | |
| |
Class Y Shares | | | | | |
Inception (12/17/13) | | | | -1.10 | % |
1 Year | | | | -2.05 | |
| |
Class R5 Shares | | | | | |
Inception (12/17/13) | | | | -1.10 | % |
1 Year | | | | -2.14 | |
| |
Class R6 Shares | | | | | |
Inception (12/17/13) | | | | -1.10 | % |
1 Year | | | | -2.05 | |
The performance data quoted represent past performance and cannot guarantee comparable future results; current performance may be lower or higher. Please visit invesco.com/performance for the most recent month-end performance. Performance figures reflect reinvested distributions, changes in net asset value and the effect of the maximum sales charge unless otherwise stated. Investment return and principal value will fluctuate so that you may have a gain or loss when you sell shares.
The net annual Fund operating expense ratio set forth in the most recent Fund prospectus as of the date of this report for Class A, Class C, Class R, Class Y, Class R5 and Class R6 shares was 1.88%, 2.63%, 2.13%, 1.63%, 1.63% and 1.63%, respectively.1,2 The total annual Fund operating expense ratio set forth in the most recent Fund prospectus as of the date of this report for Class A, Class C, Class R, Class Y, Class R5 and Class R6 shares was 5.85%, 6.60%, 6.10%, 5.60%, 5.57% and 5.57%, respectively. The expense ratios presented above may vary from the expense ratios presented in other sections of this report that are based on expenses incurred during the period covered by this report.
Class A share performance reflects the maximum 5.50% sales charge, and Class C share performance reflects the applicable contingent deferred sales
| | | | | |
| Average Annual Total Returns |
| As of 9/30/15, the most recent calendar quarter end, including maximum applicable sales charges | |
| |
Class A Shares | | | | | |
Inception (12/17/13) | | | | -6.18 | % |
1 Year | | | | -11.20 | |
| |
Class C Shares | | | | | |
Inception (12/17/13) | | | | -3.92 | % |
1 Year | | | | -7.74 | |
| |
Class R Shares | | | | | |
Inception (12/17/13) | | | | -3.41 | % |
1 Year | | | | -6.29 | |
| |
Class Y Shares | | | | | |
Inception (12/17/13) | | | | -2.94 | % |
1 Year | | | | -5.84 | |
| |
Class R5 Shares | | | | | |
Inception (12/17/13) | | | | -2.88 | % |
1 Year | | | | -5.74 | |
| |
Class R6 Shares | | | | | |
Inception (12/17/13) | | | | -2.94 | % |
1 Year | | | | -5.84 | |
charge (CDSC) for the period involved. The CDSC on Class C shares is 1% for the first year after purchase. Class R, Class Y, Class R5 and Class R6 class shares do not have a front-end sales charge or a CDSC; therefore, performance is at net asset value.
The performance of the Fund’s share classes will differ primarily due to different sales charge structures and class expenses.
Fund performance reflects any applicable fee waivers and/or expense reimbursements. Had the adviser not waived fees and/or reimbursed expenses currently or in the past, returns would have been lower. See current prospectus for more information.
| 1 | Total annual Fund operating expenses after any contractual fee waivers and/or expense reimbursements by the adviser in effect through at least February 28, 2017. See current prospectus for more information. |
| 2 | Total annual Fund operating expenses after any contractual fee waivers and/or expense reimbursements by the adviser in effect through at least June 30, 2017. See current prospectus for more information. |
|
| 7 Invesco Macro Long/Short Fund |
Invesco Macro Long/Short Fund’s investment objective is to seek a positive absolute return over a complete economic and market cycle.
| n | | Unless otherwise stated, information presented in this report is as of October 31, 2015, and is based on total net assets. |
| n | | Unless otherwise noted, all data provided by Invesco. |
| n | | To access your Fund’s reports/prospectus, visit invesco.com/fundreports. |
About share classes
| n | | Class R shares are generally available only to employer sponsored retirement and benefit plans. Please see the prospectus for more information. |
| n | | Class Y shares are available only to certain investors. Please see the prospectus for more information. |
| n | | Class R5 shares and Class R6 shares are primarily intended for employer sponsored retirement and benefit plans that meet certain standards and for institutional investors. Please see the prospectus for more information. |
Principal risks of investing in the Fund
| n | | Cash/cash equivalents risk. Holding cash or cash equivalents may negatively affect performance. |
| n | | Currency/exchange rate risk. The dollar value of the Fund’s foreign investments will be affected by changes in the exchange rates between the dollar and the currencies in which those investments are traded. |
| n | | Derivatives risk. The value of a derivative instrument depends largely on (and is derived from) the value of an underlying security, currency, commodity, interest rate, index or other asset (each referred to as an underlying asset). In addition to risks relating to the underlying assets, the use of derivatives may include other, possibly greater, risks, including counterparty, leverage and liquidity risks. Counter-party risk is the risk that the counter-party to the derivative contract will default on its obligation to pay the Fund the amount owed or otherwise perform under the derivative contract. Derivatives create leverage risk because they do not require payment up front equal to the economic exposure created by owning the derivative. As a result, an adverse change in the value of the underlying asset could result in the Fund sustaining a loss that is substantially greater than the amount invested in the derivative, which may make the |
| | Fund’s returns more volatile and increase the risk of loss. Derivative instruments may also be less liquid than more traditional investments and the Fund may be unable to sell or close out its derivative positions at a desirable time or price. This risk may be more acute under adverse market conditions, during which the Fund may be most in need of liquidating its derivative positions. Derivatives may also be harder to value, less tax efficient and subject to changing government regulation that could impact the Fund’s ability to use certain derivatives or their cost. Also, derivatives used for hedging or to gain or limit exposure to a particular market segment may not provide the expected benefits, particularly during adverse market conditions. These risks are greater for the Fund than mutual funds that do not use derivative instruments or that use derivative instruments to a lesser extent than the Fund to implement their investment strategy. |
| n | | Developing/emerging markets securities risk. The prices of securities issued by foreign companies and governments located in developing/emerging markets countries may be affected more negatively by inflation, devaluation of their currencies, higher transaction costs, delays in settlement, adverse political developments, the introduction of capital controls, with-holding taxes, nationalization of private assets, expropriation, social unrest, war or lack of timely information than those in developed countries. |
| n | | Foreign securities risk. The Fund’s foreign investments may be affected by changes in a foreign country’s exchange rates, political and social instability, changes in economic or taxation policies, difficulties when enforcing obligations, decreased liquidity, and increased volatility. Foreign companies may be subject to less regulation resulting in less publicly available information about the companies. |
| n | | Management risk. The investment techniques and risk analysis used by the Fund’s portfolio managers may not produce the desired results. The portfolio managers’ use of instruments that provide economic leverage increases the volatility of the Fund’s net asset value, which increases the potential of greater losses that may cause the Fund to liquidate positions when it may not be advantageous to do so. In addition, the Fund will likely underperform the broader equity markets in which the Fund invests during market rallies when the Fund’s equity exposure is less than 100% of the Fund’s assets. Such underperformance could be significant during sudden or significant market rallies. |
| n | | Market risk. The prices of and the income generated by the Fund’s securities may decline in response to, among other things, investor sentiment, general economic and market conditions, regional or global instability, and currency and interest rate fluctuations. |
| n | | Short sales risk. Short sales may cause the Fund to repurchase a security at a higher price, thereby causing the Fund to incur a loss. A short position in a security poses more risk than holding the same security long. As there is no limit on how much the price of the security can increase, the Fund’s exposure is unlimited. In order to establish a short position in a security, the Fund must borrow the security from a broker. The Fund may not always be able to borrow a security the Fund seeks to sell short at a particular time or at an acceptable price. The Fund also may not always be able to close out the short position by replacing the borrowed securities at a particular time or at an acceptable price. The Fund will incur increased transaction costs associated with selling securities short. In addition, taking short positions in securities results in a form of leverage which may cause the Fund to be volatile. |
| n | | Small- and mid-capitalization risks. Stocks of small- and mid-sized companies tend to be more vulnerable to adverse developments and may have little or no operating history or track record of success, and limited product lines, markets, management and financial resources. The securities of small-and |
continued on page 6
|
This report must be accompanied or preceded by a currently effective Fund prospectus, which contains more complete information, including sales charges and expenses. Investors should read it carefully before investing. |
|
|
| NOT FDIC INSURED | MAY LOSE VALUE | NO BANK GUARANTEE |
|
| 8 Invesco Macro Long/Short Fund |
Schedule of Investments
October 31, 2015
| | | | | | | | |
| | | Shares | | | Value | |
Common Stocks & Other Equity Interests–82.44% | |
| Australia–5.91% | |
Adelaide Brighton Ltd. | | | 2,541 | | | $ | 7,592 | |
AGL Energy Ltd. | | | 708 | | | | 8,447 | |
ALS Ltd. | | | 2,146 | | | | 7,881 | |
Alumina Ltd. | | | 9,094 | | | | 7,036 | |
Amcor Ltd. | | | 805 | | | | 7,789 | |
AMP Ltd. | | | 1,875 | | | | 7,661 | |
Ansell Ltd. | | | 506 | | | | 7,195 | |
APA Group | | | 1,310 | | | | 8,594 | |
Aristocrat Leisure Ltd. | | | 1,373 | | | | 9,125 | |
Asciano Ltd. | | | 1,319 | | | | 7,694 | |
ASX Ltd. | | | 289 | | | | 8,495 | |
Aurizon Holdings Ltd. | | | 2,201 | | | | 8,114 | |
AusNet Services | | | 8,500 | | | | 8,759 | |
Australia and New Zealand Banking Group Ltd. | | | 411 | | | | 7,908 | |
Bank of Queensland Ltd. | | | 897 | | | | 8,360 | |
Bendigo and Adelaide Bank Ltd. | | | 1,077 | | | | 8,218 | |
BHP Billiton Ltd. | | | 447 | | | | 7,338 | |
BHP Billiton PLC | | | 1,928 | | | | 30,839 | |
BlueScope Steel Ltd. | | | 3,032 | | | | 9,535 | |
Boral Ltd. | | | 1,912 | | | | 7,349 | |
Brambles Ltd. | | | 1,062 | | | | 7,861 | |
Caltex Australia Ltd. | | | 351 | | | | 7,834 | |
carsales.com Ltd. | | | 1,137 | | | | 7,946 | |
Challenger Ltd. | | | 1,685 | | | | 9,889 | |
Charter Hall Group | | | 2,525 | | | | 8,085 | |
CIMIC Group Ltd. | | | 510 | | | | 10,081 | |
Coca-Cola Amatil Ltd. | | | 1,234 | | | | 8,016 | |
Cochlear Ltd. | | | 132 | | | | 8,373 | |
Commonwealth Bank of Australia | | | 153 | | | | 8,372 | |
Computershare Ltd. | | | 1,112 | | | | 8,572 | |
Crown Resorts Ltd. | | | 1,023 | | | | 8,360 | |
CSL Ltd. | | | 122 | | | | 8,103 | |
CSR Ltd. | | | 3,576 | | | | 7,003 | |
DEXUS Property Group | | | 1,529 | | | | 8,439 | |
Domino’s Pizza Enterprises Ltd. | | | 287 | | | | 9,568 | |
Downer EDI Ltd. | | | 2,925 | | | | 7,405 | |
DUET Group | | | 4,860 | | | | 8,179 | |
DuluxGroup Ltd. | | | 1,985 | | | | 8,351 | |
Echo Entertainment Group Ltd. | | | 2,331 | | | | 8,494 | |
Fairfax Media Ltd. | | | 13,082 | | | | 8,816 | |
Federation Centres(a) | | | 3,902 | | | | 8,097 | |
Flight Centre Travel Group Ltd. | | | 303 | | | | 8,200 | |
Fortescue Metals Group Ltd. | | | 5,941 | | | | 8,721 | |
Goodman Group | | | 1,912 | | | | 8,276 | |
GPT Group (The) | | | 2,616 | | | | 8,853 | |
Harvey Norman Holdings Ltd. | | | 2,776 | | | | 7,879 | |
Healthscope Ltd. | | | 4,344 | | | | 8,364 | |
Iluka Resources Ltd. | | | 1,561 | | | | 7,146 | |
| | | | | | | | |
| | | Shares | | | Value | |
| Australia–(continued) | |
Incitec Pivot Ltd. | | | 3,212 | | | $ | 9,047 | |
Insurance Australia Group Ltd. | | | 2,210 | | | | 8,776 | |
Investa Office Fund | | | 2,952 | | | | 8,505 | |
IOOF Holdings Ltd. | | | 1,279 | | | | 8,452 | |
JB Hi-Fi Ltd. | | | 566 | | | | 7,249 | |
Lend Lease Group | | | 830 | | | | 7,694 | |
Macquarie Group Ltd. | | | 142 | | | | 8,585 | |
Magellan Financial Group Ltd. | | | 637 | | | | 10,234 | |
Mirvac Group | | | 6,075 | | | | 7,819 | |
National Australia Bank Ltd. | | | 371 | | | | 7,905 | |
Newcrest Mining Ltd.(a) | | | 1,005 | | | | 8,730 | |
Nufarm Ltd. | | | 1,623 | | | | 9,687 | |
Oil Search Ltd. | | | 1,533 | | | | 8,556 | |
Orica Ltd. | | | 730 | | | | 8,579 | |
Origin Energy Ltd. | | | 1,439 | | | | 5,644 | |
Orora Ltd. | | | 4,933 | | | | 8,231 | |
OZ Minerals Ltd. | | | 2,957 | | | | 9,194 | |
Perpetual Ltd. | | | 282 | | | | 9,031 | |
Primary Health Care Ltd. | | | 2,543 | | | | 6,728 | |
Qantas Airways Ltd.(a) | | | 2,990 | | | | 8,421 | |
QBE Insurance Group Ltd. | | | 841 | | | | 7,821 | |
Ramsay Health Care Ltd. | | | 188 | | | | 8,254 | |
REA Group Ltd. | | | 266 | | | | 8,977 | |
Recall Holdings Ltd. | | | 1,592 | | | | 8,696 | |
Santos Ltd. | | | 2,523 | | | | 10,507 | |
Scentre Group | | | 2,959 | | | | 8,736 | |
SEEK Ltd. | | | 911 | | | | 8,269 | |
Shopping Centres Australasia Property Group | | | 5,815 | | | | 8,542 | |
Slater & Gordon Ltd. | | | 2,259 | | | | 4,413 | |
Sonic Healthcare Ltd. | | | 532 | | | | 7,314 | |
Spark Infrastructure Group | | | 6,011 | | | | 8,916 | |
Spotless Group Holdings Ltd. | | | 6,088 | | | | 9,253 | |
Stockland | | | 2,908 | | | | 8,398 | |
Suncorp Group Ltd. | | | 861 | | | | 7,986 | |
Sydney Airport | | | 1,956 | | | | 8,997 | |
Tabcorp Holdings Ltd. | | | 2,492 | | | | 8,388 | |
Tatts Group Ltd. | | | 3,029 | | | | 8,554 | |
Telstra Corp. Ltd. | | | 1,878 | | | | 7,232 | |
TPG Telecom Ltd. | | | 1,319 | | | | 10,403 | |
Transurban Group | | | 1,142 | | | | 8,502 | |
Treasury Wine Estates Ltd. | | | 1,848 | | | | 9,330 | |
Washington H. Soul Pattinson & Co. Ltd. | | | 843 | | | | 9,678 | |
Wesfarmers Ltd. | | | 286 | | | | 7,993 | |
Westfield Corp. | | | 1,153 | | | | 8,428 | |
Westpac Banking Corp. | | | 351 | | | | 7,854 | |
Woodside Petroleum Ltd. | | | 361 | | | | 7,588 | |
Woolworths Ltd. | | | 422 | | | | 7,255 | |
WorleyParsons Ltd. | | | 1,502 | | | | 6,983 | |
| | | | | | | | 817,546 | |
See accompanying Notes to Financial Statements which are an integral part of the financial statements.
9 Invesco Macro Long/Short Fund
| | | | | | | | |
| | | Shares | | | Value | |
| Austria–0.11% | |
Erste Group Bank AG(a) | | | 262 | | | $ | 7,672 | |
Voestalpine AG | | | 195 | | | | 7,063 | |
| | | | | | | | 14,735 | |
|
| Belgium–0.32% | |
Ageas | | | 181 | | | | 7,985 | |
Anheuser-Busch InBev SA/NV | | | 67 | | | | 7,991 | |
Delhaize Group | | | 78 | | | | 7,228 | |
KBC Groep N.V. | | | 114 | | | | 6,928 | |
Solvay S.A. | | | 62 | | | | 6,998 | |
UCB S.A. | | | 90 | | | | 7,775 | |
| | | | | | | | 44,905 | |
|
| Brazil–0.44% | |
Ambev S.A. | | | 1,500 | | | | 7,429 | |
BRF S.A. | | | 400 | | | | 6,236 | |
Cia Brasileira de Distribuicao–Preference Shares | | | 363 | | | | 4,778 | |
Hypermarcas S.A.(a) | | | 1,600 | | | | 7,264 | |
Klabin S.A.(b) | | | 1,200 | | | | 6,827 | |
M Dias Branco S.A. | | | 363 | | | | 6,583 | |
Transmissora Alianca de Energia Eletrica S.A.(c) | | | 1,400 | | | | 7,228 | |
Ultrapar Participacoes S.A. | | | 400 | | | | 6,953 | |
WEG S.A. | | | 1,960 | | | | 7,322 | |
| | | | | | | | 60,620 | |
|
| Chile–0.60% | |
Banco de Chile | | | 134,176 | | | | 14,188 | |
Banco Santander Chile | | | 188,490 | | | | 8,955 | |
Cencosud S.A. | | | 3,094 | | | | 6,781 | |
Corpbanca S.A. | | | 886,143 | | | | 8,132 | |
Empresa Nacional de Electricidad S.A. | | | 8,042 | | | | 10,038 | |
Empresas CMPC S.A. | | | 3,022 | | | | 7,448 | |
Empresas COPEC S.A. | | | 1,139 | | | | 10,627 | |
Enersis S.A. | | | 31,780 | | | | 8,411 | |
S.A.C.I. Falabella | | | 1,243 | | | | 8,360 | |
| | | | | | | | 82,940 | |
|
| China–0.82% | |
AAC Technologies Holdings Inc. | | | 1,284 | | | | 8,128 | |
Agricultural Bank of China Ltd.–Class H | | | 19,000 | | | | 7,753 | |
China Construction Bank Corp.–Class H | | | 9,000 | | | | 6,489 | |
China Petroleum & Chemical Corp.–Class H | | | 10,000 | | | | 7,212 | |
China Traditional Chinese Medicine Co.
Ltd.(a) | | | 10,000 | | | | 7,536 | |
CITIC Ltd. | | | 4,000 | | | | 7,440 | |
COSCO Pacific Ltd. | | | 6,000 | | | | 7,762 | |
FIH Mobile Ltd. | | | 17,000 | | | | 8,084 | |
Global Logistic Properties Ltd. | | | 5,300 | | | | 8,438 | |
Hengan International Group Co. Ltd. | | | 817 | | | | 8,807 | |
Industrial & Commercial Bank of China Ltd.–Class H | | | 11,000 | | | | 6,980 | |
Shenzhou International Group Holdings Ltd. | | | 2,000 | | | | 9,827 | |
Tsingtao Brewery Co. Ltd.–Class H | | | 2,000 | | | | 9,539 | |
Yangzijiang Shipbuilding Holdings Ltd. | | | 10,000 | | | | 8,885 | |
| | | | | | | | 112,880 | |
| | | | | | | | |
| | | Shares | | | Value | |
| Colombia–0.11% | |
Bancolombia S.A.–Preference Shares | | | 907 | | | $ | 7,866 | |
Grupo de Inversiones Suramericana S.A. | | | 620 | | | | 7,872 | |
| | | | | | | | 15,738 | |
|
| Czech Republic–0.10% | |
CEZ A.S. | | | 353 | | | | 7,056 | |
Komercni Banka A.S. | | | 34 | | | | 7,029 | |
| | | | | | | | 14,085 | |
|
| Denmark–0.51% | |
A.P. Moeller — Maersk A/S–Class B | | | 6 | | | | 8,847 | |
Carlsberg A/S–Class B | | | 133 | | | | 10,882 | |
Coloplast A/S–Class B | | | 152 | | | | 10,906 | |
Danske Bank A/S | | | 323 | | | | 8,862 | |
Novo Nordisk A/S–Class B | | | 187 | | | | 9,907 | |
Pandora A/S | | | 87 | | | | 10,016 | |
Vestas Wind Systems A/S | | | 190 | | | | 11,042 | |
| | | | | | | | 70,462 | |
|
| Egypt–0.06% | |
Commercial International Bank Egypt S.A.E. | | | 1,174 | | | | 7,724 | |
|
| Finland–0.33% | |
Fortum Oyj | | | 447 | | | | 6,695 | |
Kone Oyj–Class B | | | 183 | | | | 7,798 | |
Nokia Oyj | | | 1,144 | | | | 8,490 | |
Sampo Oyj–Class A | | | 160 | | | | 7,806 | |
UPM-Kymmene Oyj | | | 426 | | | | 7,963 | |
Wartsila OYJ Abp | | | 179 | | | | 7,630 | |
| | | | | | | | 46,382 | |
|
| France–2.61% | |
Accor S.A. | | | 153 | | | | 7,596 | |
Air Liquide S.A. | | | 58 | | | | 7,503 | |
Airbus Group SE | | | 107 | | | | 7,435 | |
Alcatel-Lucent(a) | | | 2,149 | | | | 8,720 | |
Alstom S.A.(a) | | | 232 | | | | 7,567 | |
Arkema S.A. | | | 103 | | | | 7,525 | |
AXA S.A. | | | 293 | | | | 7,823 | |
BNP Paribas S.A. | | | 122 | | | | 7,414 | |
Bouygues S.A. | | | 184 | | | | 6,961 | |
Bureau Veritas S.A. | | | 321 | | | | 7,253 | |
Cap Gemini S.A. | | | 84 | | | | 7,471 | |
Carrefour S.A. | | | 226 | | | | 7,360 | |
Christian Dior SE | | | 40 | | | | 7,863 | |
Cie Generale des Etablissements Michelin | | | 76 | | | | 7,572 | |
Compagnie de Saint-Gobain | | | 155 | | | | 6,496 | |
Credit Agricole S.A. | | | 513 | | | | 6,499 | |
Danone | | | 120 | | | | 8,355 | |
Dassault Systemes S.A. | | | 107 | | | | 8,453 | |
Edenred | | | 370 | | | | 6,781 | |
Electricite de France S.A. | | | 360 | | | | 6,696 | |
Engie SA | | | 391 | | | | 6,849 | |
Essilor International S.A. | | | 64 | | | | 8,399 | |
See accompanying Notes to Financial Statements which are an integral part of the financial statements.
10 Invesco Macro Long/Short Fund
| | | | | | | | |
| | | Shares | | | Value | |
| France–(continued) | |
Hermes International | | | 21 | | | $ | 8,079 | |
Kering | | | 43 | | | | 7,945 | |
L’Oreal S.A. | | | 44 | | | | 8,017 | |
Legrand S.A. | | | 127 | | | | 6,962 | |
LVMH Moet Hennessy Louis Vuitton S.E. | | | 42 | | | | 7,814 | |
Numericable–SFR(a) | | | 136 | | | | 6,162 | |
Orange S.A. | | | 450 | | | | 7,917 | |
Pernod Ricard S.A. | | | 70 | | | | 8,240 | |
Peugeot S.A.(a) | | | 428 | | | | 7,543 | |
Publicis Groupe S.A. | | | 103 | | | | 6,690 | |
Renault S.A. | | | 91 | | | | 8,579 | |
Safran S.A. | | | 101 | | | | 7,676 | |
Sanofi | | | 77 | | | | 7,764 | |
Schneider Electric S.E. | | | 117 | | | | 7,075 | |
SCOR S.E. | | | 210 | | | | 7,811 | |
Societe Generale S.A. | | | 160 | | | | 7,429 | |
Sodexo S.A. | | | 84 | | | | 7,466 | |
Suez Environnement Co. | | | 391 | | | | 7,430 | |
Technip S.A. | | | 137 | | | | 7,157 | |
TOTAL S.A. | | | 151 | | | | 7,318 | |
Unibail-Rodamco S.E. | | | 30 | | | | 8,360 | |
Valeo S.A. | | | 59 | | | | 9,111 | |
Veolia Environnement S.A. | | | 333 | | | | 7,742 | |
Vinci S.A. | | | 113 | | | | 7,627 | |
Vivendi S.A. | | | 298 | | | | 7,171 | |
Zodiac Aerospace | | | 218 | | | | 5,514 | |
| | | | | | | | 361,190 | |
|
| Germany–1.94% | |
adidas AG | | | 94 | | | | 8,430 | |
Allianz S.E. | | | 48 | | | | 8,411 | |
BASF S.E. | | | 92 | | | | 7,540 | |
Bayer AG | | | 55 | | | | 7,340 | |
Bayerische Motoren Werke AG | | | 80 | | | | 8,213 | |
Beiersdorf AG | | | 88 | | | | 8,364 | |
Brenntag AG | | | 132 | | | | 7,977 | |
Commerzbank AG(a) | | | 665 | | | | 7,320 | |
Continental AG | | | 32 | | | | 7,696 | |
Daimler AG | | | 91 | | | | 7,903 | |
Deutsche Bank AG | | | 249 | | | | 6,974 | |
Deutsche Boerse AG | | | 82 | | | | 7,552 | |
Deutsche Lufthansa AG(a) | | | 573 | | | | 8,463 | |
Deutsche Post AG | | | 255 | | | | 7,591 | |
Deutsche Telekom AG | | | 413 | | | | 7,723 | |
E.ON S.E. | | | 679 | | | | 7,166 | |
Fresenius Medical Care AG & Co. KGaA | | | 91 | | | | 8,195 | |
Fresenius S.E. & Co. KGaA | | | 102 | | | | 7,487 | |
GEA Group AG | | | 189 | | | | 7,567 | |
HeidelbergCement AG | | | 95 | | | | 7,081 | |
Henkel AG & Co. KGaA–Preference Shares | | | 70 | | | | 7,598 | |
Infineon Technologies AG | | | 658 | | | | 8,101 | |
K+S AG | | | 198 | | | | 4,998 | |
| | | | | | | | |
| | | Shares | | | Value | |
| Germany–(continued) | |
Linde AG | | | 39 | | | $ | 6,766 | |
Merck KGaA | | | 72 | | | | 7,024 | |
Metro AG | | | 233 | | | | 7,182 | |
Muenchener Rueckversicherungs-Gesellschaft AG | | | 41 | | | | 8,183 | |
Porsche Automobil Holding S.E.–Preference Shares | | | 106 | | | | 4,966 | |
ProSiebenSat.1 Media SE | | | 145 | | | | 7,844 | |
RWE AG | | | 509 | | | | 7,084 | |
SAP S.E. | | | 110 | | | | 8,695 | |
Siemens AG | | | 75 | | | | 7,547 | |
Symrise AG | | | 120 | | | | 7,905 | |
ThyssenKrupp AG | | | 352 | | | | 7,101 | |
Volkswagen AG–Preference Shares | | | 40 | | | | 4,808 | |
Vonovia SE | | | 217 | | | | 7,229 | |
| | | | | | | | 268,024 | |
|
| Hong Kong–3.22% | |
AIA Group Ltd. | | | 1,400 | | | | 8,175 | |
ASM Pacific Technology Ltd. | | | 1,000 | | | | 7,080 | |
Bank of East Asia, Ltd. (The) | | | 2,400 | | | | 8,946 | |
Brightoil Petroleum (Holdings) Ltd.(a) | | | 20,000 | | | | 7,088 | |
Cathay Pacific Airways Ltd. | | | 4,000 | | | | 7,936 | |
Cheung Kong Infrastructure Holdings Ltd. | | | 1,000 | | | | 9,286 | |
China Innovative Finance Group Ltd.(a) | | | 72,000 | | | | 7,017 | |
Chinese Estates Holdings Ltd. | | | 3,500 | | | | 8,128 | |
CK Hutchison Holdings Ltd. | | | 500 | | | | 6,830 | |
CLP Holdings Ltd. | | | 1,000 | | | | 8,697 | |
Dairy Farm International Holdings Ltd. | | | 1,200 | | | | 7,890 | |
Esprit Holdings Ltd. | | | 10,700 | | | | 11,987 | |
First Pacific Co. Ltd. | | | 12,000 | | | | 8,190 | |
Galaxy Entertainment Group Ltd. | | | 3,000 | | | | 10,208 | |
Global Brands Group Holding Ltd.(a) | | | 44,000 | | | | 9,078 | |
Goldin Properties Holdings Ltd.(a) | | | 8,000 | | | | 6,850 | |
Haitong International Securities Group Ltd. | | | 12,000 | | | | 6,615 | |
Hang Lung Group Ltd. | | | 2,000 | | | | 7,240 | |
Hang Lung Properties Ltd. | | | 3,000 | | | | 7,328 | |
Hang Seng Bank Ltd. | | | 400 | | | | 7,324 | |
Henderson Land Development Co. Ltd. | | | 1,310 | | | | 8,338 | |
HK Electric Investments and HK Electric Investments Ltd.(d) | | | 11,000 | | | | 8,445 | |
Hong Kong & China Gas Co. Ltd. | | | 3,840 | | | | 7,782 | |
Hong Kong Exchanges & Clearing Ltd. | | | 300 | | | | 7,832 | |
Hongkong Land Holdings Ltd. | | | 1,200 | | | | 8,984 | |
Hopewell Holdings Ltd. | | | 2,500 | | | | 9,016 | |
Hysan Development Co. Ltd. | | | 2,000 | | | | 8,853 | |
Jardine Matheson Holdings Ltd. | | | 200 | | | | 10,848 | |
Jardine Strategic Holdings Ltd. | | | 300 | | | | 9,051 | |
Kerry Properties Ltd. | | | 2,500 | | | | 7,392 | |
Li & Fung Ltd. | | | 12,000 | | | | 9,687 | |
Link REIT | | | 1,500 | | | | 8,911 | |
MTR Corp. Ltd. | | | 2,000 | | | | 9,049 | |
New World Development Co. Ltd. | | | 8,000 | | | | 8,528 | |
See accompanying Notes to Financial Statements which are an integral part of the financial statements.
11 Invesco Macro Long/Short Fund
| | | | | | | | |
| | | Shares | | | Value | |
| Hong Kong–(continued) | |
Noble Group Ltd. | | | 20,800 | | | $ | 7,474 | |
NWS Holdings Ltd. | | | 6,000 | | | | 9,012 | |
PCCW Ltd. | | | 14,000 | | | | 7,559 | |
Power Assets Holdings Ltd. | | | 1,000 | | | | 9,944 | |
Sands China Ltd. | | | 2,000 | | | | 7,179 | |
Shangri-La Asia Ltd. | | | 8,000 | | | | 7,320 | |
Sino Land Co. Ltd. | | | 6,000 | | | | 9,245 | |
SJM Holdings Ltd. | | | 9,000 | | | | 7,460 | |
Sun Hung Kai Properties Ltd. | | | 1,000 | | | | 13,345 | |
Suncorp Technologies Ltd.(a) | | | 120,000 | | | | 3,296 | |
Swire Pacific Ltd.–Class A | | | 500 | | | | 5,775 | |
Swire Properties Ltd. | | | 2,600 | | | | 7,788 | |
Techtronic Industries Co. Ltd. | | | 2,000 | | | | 7,300 | |
Television Broadcasts Ltd. | | | 1,900 | | | | 6,910 | |
Value Partners Group Ltd. | | | 6,000 | | | | 6,337 | |
VTech Holdings Ltd. | | | 700 | | | | 8,485 | |
WH Group Ltd.(a)(d) | | | 15,000 | | | | 8,274 | |
Wharf Holdings Ltd. (The) | | | 2,000 | | | | 11,874 | |
Wheelock and Co. Ltd. | | | 2,000 | | | | 9,295 | |
Yue Yuen Industrial (Holdings) Ltd. | | | 2,000 | | | | 7,291 | |
| | | | | | | | 445,772 | |
|
| Hungary–0.10% | |
MOL Hungarian Oil and Gas PLC | | | 140 | | | | 6,331 | |
Richter Gedeon Nyrt | | | 456 | | | | 7,612 | |
| | | | | | | | 13,943 | |
|
| India–0.21% | |
HDFC Bank Ltd.–ADR | | | 118 | | | | 7,215 | |
Infosys Ltd.–ADR | | | 409 | | | | 7,427 | |
Reliance Industries Ltd.–GDR(d) | | | 253 | | | | 7,261 | |
Wipro Ltd.–ADR | | | 570 | | | | 7,057 | |
| | | | | | | | 28,960 | |
|
| Indonesia–0.28% | |
Golden Agri-Resources Ltd. | | | 35,500 | | | | 9,859 | |
PT Bank Central Asia Tbk | | | 8,800 | | | | 8,263 | |
PT Bank Mandiri Persero Tbk | | | 11,100 | | | | 7,021 | |
PT Kalbe Farma Tbk | | | 59,200 | | | | 6,157 | |
PT Telekomunikasi Indonesia Persero Tbk | | | 38,500 | | | | 7,618 | |
| | | | | | | | 38,918 | |
|
| Ireland–0.57% | |
CRH PLC | | | 257 | | | | 7,026 | |
Experian PLC | | | 1,928 | | | | 32,880 | |
Kerry Group PLC–Class A | | | 96 | | | | 7,807 | |
Shire PLC | | | 411 | | | | 31,126 | |
| | | | | | | | 78,839 | |
|
| Italy–0.66% | |
Assicurazioni Generali S.p.A. | | | 406 | | | | 7,697 | |
Atlantia S.p.A. | | | 267 | | | | 7,399 | |
Enel S.p.A. | | | 1,607 | | | | 7,415 | |
Eni S.p.A. | | | 444 | | | | 7,244 | |
| | | | | | | | |
| | | Shares | | | Value | |
| Italy–(continued) | |
Intesa Sanpaolo S.p.A. | | | 2,065 | | | $ | 7,194 | |
Luxottica Group S.p.A. | | | 112 | | | | 7,836 | |
Prada S.p.A. | | | 2,000 | | | | 8,128 | |
Snam S.p.A. | | | 1,458 | | | | 7,542 | |
Telecom Italia S.p.A.(a) | | | 5,731 | | | | 7,983 | |
Terna — Rete Elettrica Nazionale S.p.A. | | | 1,613 | | | | 8,200 | |
UniCredit S.p.A. | | | 1,113 | | | | 7,197 | |
Unione di Banche Italiane S.p.A. | | | 924 | | | | 6,898 | |
| | | | | | | | 90,733 | |
|
| Japan–11.71% | |
Aeon Co., Ltd. | | | 400 | | | | 5,910 | |
Aisin Seiki Co., Ltd. | | | 200 | | | | 7,915 | |
Alps Electric Co., Ltd. | | | 200 | | | | 6,159 | |
AMADA Holdings Co., Ltd. | | | 700 | | | | 6,204 | |
ANA Holdings Inc. | | | 2,000 | | | | 5,954 | |
Aozora Bank, Ltd. | | | 2,000 | | | | 7,283 | |
Asahi Glass Co., Ltd. | | | 1,000 | | | | 5,698 | |
Asahi Group Holdings, Ltd. | | | 200 | | | | 6,155 | |
Asahi Kasei Corp. | | | 1,000 | | | | 6,117 | |
ASICS Corp. | | | 200 | | | | 5,507 | |
Astellas Pharma Inc. | | | 500 | | | | 7,228 | |
Bandai Namco Holdings Inc. | | | 300 | | | | 7,349 | |
Bank of Kyoto, Ltd. (The) | | | 1,000 | | | | 10,050 | |
Bank of Yokohama, Ltd. (The) | | | 1,000 | | | | 6,213 | |
Bridgestone Corp. | | | 200 | | | | 7,333 | |
Brother Industries, Ltd. | | | 500 | | | | 6,366 | |
Canon Inc. | | | 200 | | | | 5,974 | |
Casio Computer Co., Ltd. | | | 300 | | | | 5,631 | |
Chiba Bank, Ltd. (The) | | | 1,000 | | | | 7,267 | |
Chubu Electric Power Co., Inc. | | | 400 | | | | 6,133 | |
Chugai Pharmaceutical Co., Ltd. | | | 200 | | | | 6,413 | |
Chugoku Bank, Ltd. (The) | | | 400 | | | | 5,640 | |
Chugoku Electric Power Co., Inc. (The) | | | 500 | | | | 7,538 | |
Credit Saison Co., Ltd. | | | 300 | | | | 6,141 | |
Dai Nippon Printing Co., Ltd. | | | 1,000 | | | | 10,306 | |
Dai-ichi Life Insurance Co. Ltd. (The) | | | 400 | | | | 6,916 | |
Daicel Corp. | | | 500 | | | | 6,578 | |
Daihatsu Motor Co., Ltd. | | | 500 | | | | 6,099 | |
Daiichi Sankyo Co., Ltd. | | | 300 | | | | 5,848 | |
Daikin Industries, Ltd. | | | 100 | | | | 6,402 | |
Daito Trust Construction Co., Ltd. | | | 100 | | | | 10,817 | |
Daiwa House Industry Co., Ltd. | | | 300 | | | | 7,833 | |
Daiwa Securities Group Inc. | | | 1,000 | | | | 6,820 | |
Denso Corp. | | | 200 | | | | 9,259 | |
Dentsu Inc. | | | 100 | | | | 5,602 | |
Don Quijote Holdings Co., Ltd. | | | 200 | | | | 7,333 | |
East Japan Railway Co. | | | 100 | | | | 9,493 | |
Eisai Co., Ltd. | | | 100 | | | | 6,221 | |
Electric Power Development Co., Ltd. | | | 200 | | | | 6,569 | |
Fuji Heavy Industries Ltd. | | | 200 | | | | 7,722 | |
FUJIFILM Holdings Corp. | | | 200 | | | | 7,950 | |
See accompanying Notes to Financial Statements which are an integral part of the financial statements.
12 Invesco Macro Long/Short Fund
| | | | | | | | |
| | | Shares | | | Value | |
| Japan–(continued) | |
Fujitsu Ltd. | | | 1,000 | | | $ | 4,705 | |
Fukuoka Financial Group, Inc. | | | 1,000 | | | | 5,241 | |
Gunma Bank, Ltd. (The) | | | 1,000 | | | | 6,265 | |
Hachijuni Bank, Ltd. (The) | | | 1,000 | | | | 6,776 | |
Hamamatsu Photonics K.K. | | | 300 | | | | 7,669 | |
Hankyu Hanshin Holdings, Inc. | | | 1,000 | | | | 6,515 | |
Hino Motors, Ltd. | | | 600 | | | | 6,826 | |
Hirose Electric Co., Ltd. | | | 100 | | | | 12,065 | |
Hiroshima Bank, Ltd. (The) | | | 1,000 | | | | 5,532 | |
Hisamitsu Pharmaceutical Co., Inc. | | | 200 | | | | 7,734 | |
Hitachi, Ltd. | | | 1,000 | | | | 5,744 | |
Hokuhoku Financial Group, Inc. | | | 3,000 | | | | 6,634 | |
Hokuriku Electric Power Co. | | | 500 | | | | 7,437 | |
Honda Motor Co., Ltd. | | | 200 | | | | 6,640 | |
Hoya Corp. | | | 200 | | | | 8,220 | |
Hulic Co., Ltd. | | | 700 | | | | 6,517 | |
IHI Corp. | | | 2,000 | | | | 5,636 | |
INPEX Corp. | | | 700 | | | | 6,672 | |
Isetan Mitsukoshi Holdings Ltd. | | | 400 | | | | 6,392 | |
Isuzu Motors Ltd. | | | 600 | | | | 6,973 | |
ITOCHU Corp. | | | 600 | | | | 7,474 | |
Iyo Bank, Ltd. (The) | | | 600 | | | | 6,419 | |
J. Front Retailing Co., Ltd. | | | 400 | | | | 6,544 | |
Japan Airlines Co. Ltd. | | | 200 | | | | 7,521 | |
Japan Airport Terminal Co., Ltd. | | | 200 | | | | 10,847 | |
Japan Exchange Group Inc. | | | 400 | | | | 6,415 | |
Japan Real Estate Investment Corp. | | | 2 | | | | 9,236 | |
Japan Retail Fund Investment Corp. | | | 4 | | | | 7,735 | |
Japan Tobacco, Inc. | | | 200 | | | | 6,909 | |
JFE Holdings, Inc. | | | 400 | | | | 6,255 | |
Joyo Bank, Ltd. (The) | | | 1,000 | | | | 5,172 | |
JSR Corp. | | | 400 | | | | 6,302 | |
JTEKT Corp. | | | 500 | | | | 8,572 | |
JX Holdings, Inc. | | | 1,700 | | | | 6,643 | |
Kajima Corp. | | | 1,000 | | | | 5,722 | |
Kansai Electric Power Co., Inc. (The)(a) | | | 500 | | | | 6,370 | |
Kansai Paint Co., Ltd. | | | 400 | | | | 6,067 | |
Kao Corp. | | | 100 | | | | 5,108 | |
Kawasaki Heavy Industries, Ltd. | | | 2,000 | | | | 7,982 | |
KDDI Corp. | | | 300 | | | | 7,247 | |
Keikyu Corp. | | | 1,000 | | | | 8,198 | |
Keio Corp. | | | 1,000 | | | | 8,115 | |
Keisei Electric Railway Co., Ltd. | | | 1,000 | | | | 12,278 | |
Kintetsu Group Holdings Co., Ltd. | | | 2,000 | | | | 7,717 | |
Kirin Holdings Co., Ltd. | | | 400 | | | | 5,645 | |
Kobe Steel, Ltd. | | | 5,000 | | | | 6,283 | |
Koito Manufacturing Co., Ltd. | | | 200 | | | | 7,551 | |
Komatsu Ltd. | | | 400 | | | | 6,604 | |
Konica Minolta Inc. | | | 600 | | | | 6,162 | |
Kuraray Co., Ltd. | | | 600 | | | | 7,374 | |
Kyocera Corp. | | | 100 | | | | 4,508 | |
| | | | | | | | |
| | | Shares | | | Value | |
| Japan–(continued) | |
Kyushu Electric Power Co., Inc.(a) | | | 500 | | | $ | 6,029 | |
Lawson, Inc. | | | 100 | | | | 7,378 | |
LIXIL Group Corp. | | | 300 | | | | 6,406 | |
Mabuchi Motor Co., Ltd. | | | 100 | | | | 4,904 | |
Makita Corp. | | | 100 | | | | 5,454 | |
Marubeni Corp. | | | 1,200 | | | | 6,911 | |
Mazda Motor Corp. | | | 400 | | | | 7,855 | |
Medipal Holdings Corp. | | | 400 | | | | 6,960 | |
MEIJI Holdings Co., Ltd. | | | 100 | | | | 7,838 | |
Minebea Co., Ltd. | | | 1,000 | | | | 10,959 | |
Mitsubishi Chemical Holdings Corp. | | | 1,200 | | | | 7,456 | |
Mitsubishi Corp. | | | 400 | | | | 7,246 | |
Mitsubishi Electric Corp. | | | 1,000 | | | | 10,371 | |
Mitsubishi Heavy Industries, Ltd. | | | 1,000 | | | | 5,033 | |
Mitsubishi Materials Corp. | | | 2,000 | | | | 6,940 | |
Mitsubishi Motors Corp. | | | 800 | | | | 7,080 | |
Mitsubishi Tanabe Pharma Corp. | | | 400 | | | | 6,748 | |
Mitsubishi UFJ Financial Group, Inc. | | | 900 | | | | 5,820 | |
Mitsui & Co., Ltd. | | | 500 | | | | 6,316 | |
Mitsui Chemicals, Inc. | | | 2,000 | | | | 7,536 | |
Mitsui O.S.K. Lines, Ltd. | | | 2,000 | | | | 5,318 | |
Mizuho Financial Group, Inc. | | | 2,800 | | | | 5,726 | |
MS&AD Insurance Group Holdings, Inc. | | | 200 | | | | 5,869 | |
Nagoya Railroad Co., Ltd. | | | 2,000 | | | | 8,256 | |
NEC Corp. | | | 2,000 | | | | 6,166 | |
NGK Spark Plug Co., Ltd. | | | 300 | | | | 7,301 | |
Nidec Corp. | | | 100 | | | | 7,514 | |
Nikon Corp. | | | 500 | | | | 6,447 | |
Nippon Building Fund Inc. | | | 2 | | | | 9,477 | |
Nippon Express Co., Ltd. | | | 1,000 | | | | 5,129 | |
Nippon Paint Holdings Co., Ltd. | | | 300 | | | | 6,309 | |
Nippon Steel & Sumitomo Metal Corp. | | | 300 | | | | 6,068 | |
Nippon Telegraph & Telephone Corp. | | | 200 | | | | 7,345 | |
Nippon Television Holdings, Inc. | | | 400 | | | | 6,914 | |
Nippon Yusen Kabushiki Kaisha | | | 2,000 | | | | 5,208 | |
Nissan Motor Co., Ltd. | | | 700 | | | | 7,262 | |
Nisshin Seifun Group Inc. | | | 500 | | | | 7,608 | |
Nissin Foods Holdings Co., Ltd. | | | 100 | | | | 4,613 | |
Nitori Holdings Co., Ltd. | | | 100 | | | | 7,781 | |
Nitto Denko Corp. | | | 100 | | | | 6,379 | |
NOK Corp. | | | 300 | | | | 7,037 | |
Nomura Holdings, Inc. | | | 900 | | | | 5,639 | |
Nomura Research Institute, Ltd. | | | 200 | | | | 8,152 | |
NSK Ltd. | | | 500 | | | | 5,890 | |
NTT Data Corp. | | | 100 | | | | 4,956 | |
NTT DOCOMO, Inc. | | | 300 | | | | 5,889 | |
Obayashi Corp. | | | 1,000 | | | | 8,759 | |
Odakyu Electric Railway Co., Ltd. | | | 1,000 | | | | 9,746 | |
Oji Holdings Corp. | | | 1,000 | | | | 5,167 | |
Olympus Corp. | | | 200 | | | | 6,719 | |
OMRON Corp. | | | 200 | | | | 6,597 | |
See accompanying Notes to Financial Statements which are an integral part of the financial statements.
13 Invesco Macro Long/Short Fund
| | | | | | | | |
| | | Shares | | | Value | |
| Japan–(continued) | |
Ono Pharmaceutical Co., Ltd. | | | 100 | | | $ | 13,626 | |
Oriental Land Co., Ltd. | | | 100 | | | | 6,052 | |
ORIX Corp. | | | 500 | | | | 7,310 | |
Osaka Gas Co., Ltd. | | | 2,000 | | | | 7,857 | |
Otsuka Holdings Co., Ltd. | | | 200 | | | | 6,616 | |
Panasonic Corp. | | | 600 | | | | 7,041 | |
Rakuten Inc. | | | 500 | | | | 6,919 | |
Recruit Holdings Co., Ltd. | | | 200 | | | | 6,415 | |
Resona Holdings, Inc. | | | 1,200 | | | | 6,328 | |
Ricoh Co., Ltd. | | | 700 | | | | 7,526 | |
Rinnai Corp. | | | 100 | | | | 7,895 | |
Rohm Co. Ltd. | | | 100 | | | | 4,914 | |
Santen Pharmaceutical Co., Ltd. | | | 400 | | | | 5,410 | |
SECOM Co., Ltd. | | | 100 | | | | 6,651 | |
Sega Sammy Holdings Inc. | | | 600 | | | | 6,293 | |
Seibu Holdings Inc. | | | 300 | | | | 6,064 | |
Seiko Epson Corp. | | | 400 | | | | 6,091 | |
Sekisui Chemical Co., Ltd. | | | 600 | | | | 7,051 | |
Sekisui House, Ltd. | | | 500 | | | | 8,295 | |
Seven & i Holdings Co., Ltd. | | | 200 | | | | 9,038 | |
Shikoku Electric Power Co. Inc. | | | 400 | | | | 6,761 | |
Shimano Inc. | | | 100 | | | | 15,716 | |
Shimizu Corp. | | | 1,000 | | | | 8,733 | |
Shin-Etsu Chemical Co., Ltd. | | | 100 | | | | 5,921 | |
Shinsei Bank, Ltd. | | | 3,000 | | | | 6,264 | |
Shionogi & Co., Ltd. | | | 200 | | | | 8,175 | |
Shiseido Co., Ltd. | | | 300 | | | | 7,076 | |
Shizuoka Bank, Ltd. (The) | | | 1,000 | | | | 9,971 | |
SoftBank Group Corp. | | | 100 | | | | 5,566 | |
Sompo Japan Nipponkoa Holdings Inc. | | | 200 | | | | 6,235 | |
Sony Corp. | | | 200 | | | | 5,672 | |
Sony Financial Holdings Inc. | | | 300 | | | | 5,361 | |
Stanley Electric Co., Ltd. | | | 400 | | | | 7,599 | |
Sumitomo Chemical Co., Ltd. | | | 1,000 | | | | 5,708 | |
Sumitomo Corp. | | | 600 | | | | 6,574 | |
Sumitomo Electric Industries, Ltd. | | | 500 | | | | 6,802 | |
Sumitomo Heavy Industries, Ltd. | | | 2,000 | | | | 8,973 | |
Sumitomo Metal Mining Co., Ltd. | | | 1,000 | | | | 12,449 | |
Sumitomo Mitsui Financial Group, Inc. | | | 200 | | | | 7,951 | |
Sumitomo Mitsui Trust Holdings, Inc. | | | 2,000 | | | | 7,654 | |
Suntory Beverage & Food Ltd. | | | 200 | | | | 8,079 | |
Suruga Bank Ltd. | | | 300 | | | | 5,889 | |
Suzuken Co., Ltd./Aichi Japan | | | 200 | | | | 7,642 | |
Suzuki Motor Corp. | | | 200 | | | | 6,529 | |
Sysmex Corp. | | | 100 | | | | 5,715 | |
T&D Holdings, Inc. | | | 500 | | | | 6,533 | |
Taiheiyo Cement Corp. | | | 2,000 | | | | 6,573 | |
Taisei Corp. | | | 1,000 | | | | 6,491 | |
Taisho Pharmaceutical Holdings Co. Ltd. | | | 100 | | | | 6,221 | |
Takashimaya Co., Ltd. | | | 1,000 | | | | 8,908 | |
Takeda Pharmaceutical Co. Ltd. | | | 100 | | | | 4,861 | |
| | | | | | | | |
| | | Shares | | | Value | |
| Japan–(continued) | |
TDK Corp. | | | 100 | | | $ | 6,344 | |
Teijin Ltd. | | | 2,000 | | | | 7,037 | |
Terumo Corp. | | | 200 | | | | 5,905 | |
THK Co., Ltd. | | | 400 | | | | 7,525 | |
Tobu Railway Co., Ltd. | | | 1,000 | | | | 4,825 | |
Toho Co., Ltd. | | | 300 | | | | 7,796 | |
Toho Gas Co., Ltd. | | | 1,000 | | | | 6,111 | |
Tohoku Electric Power Co., Inc. | | | 500 | | | | 6,995 | |
Tokio Marine Holdings, Inc. | | | 200 | | | | 7,662 | |
Tokyo Electric Power Co. Inc.(a) | | | 900 | | | | 6,120 | |
Tokyo Electron Ltd. | | | 100 | | | | 5,971 | |
Tokyo Gas Co., Ltd. | | | 1,000 | | | | 4,938 | |
Tokyo Tatemono Co., Ltd. | | | 500 | | | | 6,184 | |
Tokyu Corp. | | | 1,000 | | | | 8,083 | |
Tokyu Fudosan Holdings, Corp. | | | 900 | | | | 6,306 | |
TonenGeneral Sekiyu K.K. | | | 1,000 | | | | 10,390 | |
Toppan Printing Co., Ltd. | | | 1,000 | | | | 8,938 | |
Toray Industries, Inc. | | | 1,000 | | | | 8,706 | |
Toshiba Corp. | | | 2,000 | | | | 5,625 | |
TOTO Ltd. | | | 200 | | | | 6,743 | |
Toyo Suisan Kaisha, Ltd. | | | 200 | | | | 7,364 | |
Toyota Industries Corp. | | | 100 | | | | 5,235 | |
Toyota Motor Corp. | | | 100 | | | | 6,123 | |
Toyota Tsusho Corp. | | | 300 | | | | 6,839 | |
Trend Micro Inc. | | | 200 | | | | 7,768 | |
Unicharm Corp. | | | 300 | | | | 6,394 | |
United Urban Investment Corp. | | | 5 | | | | 6,923 | |
USS Co., Ltd. | | | 400 | | | | 7,049 | |
West Japan Railway Co. | | | 100 | | | | 6,996 | |
Yahoo Japan Corp. | | | 1,500 | | | | 6,343 | |
Yakult Honsha Co., Ltd. | | | 100 | | | | 5,269 | |
Yamada Denki Co., Ltd. | | | 1,600 | | | | 7,210 | |
Yamaguchi Financial Group, Inc. | | | 1,000 | | | | 12,261 | |
Yamaha Motor Co., Ltd. | | | 300 | | | | 6,722 | |
Yamato Holdings Co., Ltd. | | | 300 | | | | 5,883 | |
Yaskawa Electric Corp. | | | 600 | | | | 7,103 | |
Yokogawa Electric Corp. | | | 600 | | | | 6,678 | |
| | | | | | | | 1,619,953 | |
|
| Luxembourg–0.09% | |
ArcelorMittal S.A. | | | 986 | | | | 5,481 | |
Tenaris S.A. | | | 530 | | | | 6,683 | |
| | | | | | | | 12,164 | |
|
| Macau–0.10% | |
MGM China Holdings Ltd. | | | 4,800 | | | | 6,990 | |
Wynn Macau, Ltd. | | | 5,087 | | | | 6,972 | |
| | | | | | | | 13,962 | |
|
| Malaysia–1.49% | |
AMMB Holdings Berhad | | | 8,823 | | | | 9,780 | |
Axiata Group Berhad | | | 7,468 | | | | 10,713 | |
British American Tobacco Malaysia Berhad | | | 512 | | | | 7,349 | |
See accompanying Notes to Financial Statements which are an integral part of the financial statements.
14 Invesco Macro Long/Short Fund
| | | | | | | | |
| | | Shares | | | Value | |
| Malaysia–(continued) | |
DiGi.Com Berhad | | | 8,000 | | | $ | 9,783 | |
Gamuda Berhad | | | 8,400 | | | | 8,770 | |
Genting Berhad | | | 4,331 | | | | 7,453 | |
Genting Malaysia Berhad | | | 7,400 | | | | 7,388 | |
Hong Leong Bank Berhad | | | 4,500 | | | | 14,564 | |
IHH Healthcare Berhad | | | 7,021 | | | | 10,300 | |
IJM Corp. Berhad | | | 14,158 | | | | 10,928 | |
IOI Corp. Berhad | | | 10,500 | | | | 10,370 | |
Kuala Lumpur Kepong Berhad | | | 1,500 | | | | 7,944 | |
Malayan Banking Berhad | | | 5,119 | | | | 9,806 | |
Maxis Berhad | | | 5,681 | | | | 8,704 | |
MISC Berhad | | | 3,624 | | | | 7,608 | |
Petronas Gas Berhad | | | 1,800 | | | | 9,572 | |
Public Bank Berhad | | | 3,685 | | | | 15,469 | |
Sime Darby Berhad | | | 5,605 | | | | 10,876 | |
Telekom Malaysia Berhad | | | 6,191 | | | | 9,586 | |
Tenaga Nasional Berhad | | | 3,322 | | | | 9,757 | |
UMW Holdings Berhad | | | 4,807 | | | | 9,187 | |
| | | | | | | | 205,907 | |
|
| Mexico–1.01% | |
America Movil S.A.B. de C.V.–Series L | | | 9,240 | | | | 8,222 | |
Arca Continental S.A.B. de C.V. | | | 1,532 | | | | 9,784 | |
Coca-Cola Femsa, S.A.B. de C.V.–Series L | | | 1,200 | | | | 9,204 | |
El Puerto de Liverpool, S.A.B. de C.V.–Series C1 | | | 600 | | | | 8,358 | |
Fibra Uno Administracion S.A. de C.V. | | | 4,400 | | | | 9,647 | |
Fomento Economico Mexicano, S.A.B. de C.V.–Series BD(e) | | | 1,000 | | | | 9,867 | |
Grupo Bimbo, S.A.B. de C.V.–Series A(a) | | | 2,900 | | | | 8,199 | |
Grupo Financiero Banorte S.A.B. de C.V.–Class O | | | 1,600 | | | | 8,564 | |
Grupo Financiero Inbursa, S.A.B. de C.V.–Class O | | | 3,400 | | | | 6,812 | |
Grupo Financiero Santander Mexico, S.A.B. de C.V.–Class B | | | 4,300 | | | | 7,899 | |
Grupo Lala, S.A.B. de C.V. | | | 3,200 | | | | 8,172 | |
Grupo Mexico S.A.B. de C.V.–Series B | | | 2,900 | | | | 7,067 | |
Grupo Televisa S.A.B.–Series CPO(f) | | | 1,300 | | | | 7,565 | |
Infraestructura Enérgetica Nova, S.A.B. de C.V. | | | 1,600 | | | | 7,689 | |
Kimberly-Clark de Mexico, S.A.B. de C.V.–Class A | | | 3,000 | | | | 7,178 | |
Promotora y Operadora de Infraestructura, S.A.B. de C.V.(a) | | | 700 | | | | 8,799 | |
Wal-Mart de México, S.A.B. de C.V.–Class V | | | 2,824 | | | | 7,478 | |
| | | | | | | | 140,504 | |
|
| Netherlands–0.71% | |
Aegon N.V. | | | 1,221 | | | | 7,500 | |
Akzo Nobel N.V. | | | 109 | | | | 7,702 | |
ASML Holding N.V. | | | 78 | | | | 7,231 | |
Gemalto N.V. | | | 106 | | | | 6,650 | |
Heineken Holding N.V. | | | 105 | | | | 8,400 | |
Heineken N.V. | | | 99 | | | | 9,027 | |
ING Groep N.V. | | | 456 | | | | 6,613 | |
Koninklijke Ahold N.V. | | | 382 | | | | 7,760 | |
Koninklijke DSM N.V. | | | 142 | | | | 7,561 | |
| | | | | | | | |
| | | Shares | | | Value | |
| Netherlands–(continued) | |
Koninklijke KPN N.V. | | | 1,833 | | | $ | 6,713 | |
Koninklijke Philips N.V. | | | 286 | | | | 7,715 | |
Randstad Holding N.V. | | | 116 | | | | 6,909 | |
Wolters Kluwer N.V. | | | 238 | | | | 8,039 | |
| | | | | | | | 97,820 | |
|
| New Zealand–0.70% | |
Auckland International Airport Ltd. | | | 2,663 | | | | 9,456 | |
Contact Energy Ltd. | | | 2,490 | | | | 8,738 | |
Fisher & Paykel Healthcare Corp. Ltd. | | | 1,695 | | | | 8,919 | |
Fletcher Building Ltd. | | | 1,751 | | | | 8,846 | |
Kiwi Property Group Ltd. | | | 9,999 | | | | 9,198 | |
Meridian Energy Ltd. | | | 5,761 | | | | 8,636 | |
Ryman Healthcare Ltd. | | | 1,619 | | | | 8,642 | |
SKY Network Television Ltd. | | | 2,654 | | | | 8,147 | |
SKYCITY Entertainment Group Ltd. | | | 3,090 | | | | 8,366 | |
Spark New Zealand Ltd. | | | 3,839 | | | | 8,735 | |
Z Energy Ltd. | | | 2,080 | | | | 9,438 | |
| | | | | | | | 97,121 | |
|
| Norway–0.38% | |
DNB ASA | | | 719 | | | | 9,123 | |
Orkla ASA | | | 1,371 | | | | 11,659 | |
Statoil ASA | | | 686 | | | | 11,073 | |
Telenor ASA | | | 507 | | | | 9,543 | |
Yara International ASA | | | 236 | | | | 10,713 | |
| | | | | | | | 52,111 | |
|
| Philippines–0.60% | |
Ayala Corp. | | | 540 | | | | 8,968 | |
Ayala Land, Inc. | | | 8,800 | | | | 6,712 | |
Bank of the Philippine Islands | | | 4,700 | | | | 8,487 | |
BDO Unibank, Inc. | | | 3,770 | | | | 8,124 | |
Energy Development Corp. | | | 56,400 | | | | 7,957 | |
Jollibee Foods Corp. | | | 1,670 | | | | 7,332 | |
Manila Electric Co. | | | 1,660 | | | | 11,502 | |
Metropolitan Bank & Trust Co. | | | 4,720 | | | | 8,554 | |
Philippine Long Distance Telephone Co. | | | 160 | | | | 7,542 | |
SM Investments Corp. | | | 460 | | | | 8,564 | |
| | | | | | | | 83,742 | |
|
| Poland–0.26% | |
Alior Bank S.A.(a) | | | 278 | | | | 5,845 | |
Bank Pekao S.A. | | | 171 | | | | 6,639 | |
PGE Polska Grupa Energetyczna S.A. | | | 1,581 | | | | 5,871 | |
Powszechna Kasa Oszczednosci Bank Polski S.A.(a) | | | 877 | | | | 6,490 | |
Powszechny Zaklad Ubezpieczen S.A. | | | 69 | | | | 6,697 | |
Tauron Polska Energia S.A. | | | 6,600 | | | | 5,176 | |
| | | | | | | | 36,718 | |
|
| Portugal–0.06% | |
Energias de Portugal, S.A. | | | 2,092 | | | | 7,730 | |
See accompanying Notes to Financial Statements which are an integral part of the financial statements.
15 Invesco Macro Long/Short Fund
| | | | | | | | |
| | | Shares | | | Value | |
| Qatar–0.11% | | | | | | | | |
Commercial Bank of Qatar Q.S.C. (The) | | | 527 | | | $ | 7,702 | |
Qatar National Bank | | | 143 | | | | 7,170 | |
| | | | | | | | 14,872 | |
|
| Singapore–1.68% | |
Ascendas REIT | | | 4,900 | | | | 8,331 | |
Avago Technologies Ltd. | | | 52 | | | | 6,403 | |
CapitaLand Commercial Trust Ltd. | | | 7,800 | | | | 7,827 | |
CapitaLand Ltd. | | | 4,000 | | | | 8,799 | |
CapitaLand Mall Trust | | | 5,200 | | | | 7,350 | |
City Developments Ltd. | | | 1,200 | | | | 6,788 | |
ComfortDelGro Corp. Ltd. | | | 3,800 | | | | 8,206 | |
DBS Group Holdings Ltd. | | | 600 | | | | 7,397 | |
Genting Singapore PLC | | | 15,000 | | | | 8,727 | |
Great Eastern Holdings Ltd. | | | 500 | | | | 7,620 | |
Jardine Cycle & Carriage Ltd. | | | 400 | | | | 9,259 | |
Keppel Corp. Ltd. | | | 1,600 | | | | 8,032 | |
Keppel REIT | | | 11,500 | | | | 7,907 | |
Oversea-Chinese Banking Corp. Ltd. | | | 1,200 | | | | 7,704 | |
SATS Ltd. | | | 2,900 | | | | 7,846 | |
Sembcorp Industries Ltd. | | | 3,100 | | | | 7,876 | |
Sembcorp Marine Ltd. | | | 4,700 | | | | 7,851 | |
Singapore Airlines Ltd. | | | 1,100 | | | | 8,455 | |
Singapore Exchange Ltd. | | | 1,400 | | | | 7,354 | |
Singapore Post Ltd. | | | 6,300 | | | | 8,522 | |
Singapore Press Holdings Ltd. | | | 2,900 | | | | 8,238 | |
Singapore Technologies Engineering Ltd. | | | 3,600 | | | | 8,474 | |
Singapore Telecommunications Ltd. | | | 3,000 | | | | 8,491 | |
StarHub Ltd. | | | 3,100 | | | | 7,942 | |
Suntec REIT | | | 6,900 | | | | 8,127 | |
United Overseas Bank Ltd. | | | 600 | | | | 8,707 | |
UOL Group Ltd. | | | 1,800 | | | | 8,429 | |
Venture Corp. Ltd. | | | 1,300 | | | | 7,668 | |
Wilmar International Ltd. | | | 4,000 | | | | 8,896 | |
| | | | | | | | 233,226 | |
|
| South Africa–1.22% | |
Aspen Pharmacare Holdings Ltd. | | | 275 | | | | 6,166 | |
Barclays Africa Group Ltd. | | | 555 | | | | 7,112 | |
Barloworld Ltd. | | | 1,109 | | | | 6,264 | |
Bidvest Group Ltd. (The) | | | 321 | | | | 8,209 | |
Discovery Ltd. | | | 671 | | | | 7,164 | |
FirstRand Ltd. | | | 1,784 | | | | 6,536 | |
Growthpoint Properties Ltd. | | | 4,438 | | | | 8,134 | |
Investec Ltd. | | | 858 | | | | 7,080 | |
Liberty Holdings Ltd. | | | 862 | | | | 8,420 | |
MMI Holdings Ltd. | | | 3,770 | | | | 6,836 | |
Mondi Ltd. | | | 297 | | | | 6,907 | |
Nedbank Group Ltd. | | | 401 | | | | 6,656 | |
Pick n Pay Stores Ltd. | | | 1,562 | | | | 7,537 | |
Rand Merchant Insurance Holdings Ltd. | | | 2,320 | | | | 7,188 | |
Redefine Properties Ltd. | | | 9,865 | | | | 8,223 | |
| | | | | | | | |
| | | Shares | | | Value | |
| South Africa–(continued) | |
Remgro Ltd. | | | 398 | | | $ | 7,953 | |
RMB Holdings Ltd. | | | 1,335 | | | | 6,500 | |
SPAR Group Ltd. (The) | | | 540 | | | | 7,757 | |
Standard Bank Group Ltd. | | | 696 | | | | 7,225 | |
Steinhoff International Holdings Ltd. | | | 1,346 | | | | 8,237 | |
Tiger Brands Ltd. | | | 317 | | | | 7,251 | |
Vodacom Group Ltd. | | | 771 | | | | 8,343 | |
Woolworths Holdings Ltd. | | | 911 | | | | 6,739 | |
| | | | | | | | 168,437 | |
|
| South Korea–0.55% | |
GS Holdings Corp. | | | 188 | | | | 8,232 | |
Hana Financial Group Inc. | | | 279 | | | | 6,770 | |
Hyundai Marine & Fire Insurance Co., Ltd. | | | 298 | | | | 8,870 | |
KB Financial Group Inc. | | | 213 | | | | 6,751 | |
Korea Zinc Co., Ltd. | | | 15 | | | | 6,234 | |
KT Corp.(a) | | | 353 | | | | 9,132 | |
LG Electronics Inc. | | | 164 | | | | 7,040 | |
Lotte Confectionery Co., Ltd. | | | 4 | | | | 6,976 | |
LS Corp. | | | 228 | | | | 7,707 | |
Samsung Electronics Co., Ltd. | | | 7 | | | | 8,382 | |
| | | | | | | | 76,094 | |
|
| Spain–0.97% | |
Abertis Infraestructuras S.A. | | | 432 | | | | 7,178 | |
Aena S.A.(a)(d) | | | 64 | | | | 7,144 | |
Amadeus IT Holding S.A.–Class A | | | 186 | | | | 7,915 | |
Banco Bilbao Vizcaya Argentaria, S.A. | | | 815 | | | | 7,007 | |
Banco de Sabadell S.A. | | | 3,780 | | | | 7,312 | |
Banco Popular Espanol S.A. | | | 1,809 | | | | 6,876 | |
Banco Santander S.A. | | | 1,238 | | | | 6,943 | |
Bankia S.A. | | | 6,286 | | | | 8,102 | |
CaixaBank S.A. | | | 1,755 | | | | 6,723 | |
Enagas S.A. | | | 253 | | | | 7,666 | |
Ferrovial S.A. | | | 303 | | | | 7,650 | |
Gas Natural SDG, S.A. | | | 369 | | | | 7,998 | |
Grifols S.A. | | | 177 | | | | 8,210 | |
Iberdrola S.A. | | | 1,041 | | | | 7,438 | |
Industria de Diseno Textil, S.A. | | | 233 | | | | 8,739 | |
Red Electrica Corp. S.A. | | | 88 | | | | 7,761 | |
Repsol S.A. | | | 544 | | | | 6,865 | |
Telefónica, S.A. | | | 504 | | | | 6,668 | |
| | | | | | | | 134,195 | |
|
| Sweden–1.15% | |
Assa Abloy AB–Class B | | | 524 | | | | 10,394 | |
Atlas Copco AB–Class A | | | 412 | | | | 10,716 | |
Hennes & Mauritz AB–Class B | | | 267 | | | | 10,359 | |
Hexagon AB–Class B | | | 315 | | | | 10,906 | |
Investor AB–Class B | | | 283 | | | | 10,478 | |
Nordea Bank AB | | | 829 | | | | 9,143 | |
Sandvik AB | | | 1,102 | | | | 10,308 | |
Skandinaviska Enskilda Banken AB–Class A | | | 881 | | | | 9,215 | |
See accompanying Notes to Financial Statements which are an integral part of the financial statements.
16 Invesco Macro Long/Short Fund
| | | | | | | | |
| | | Shares | | | Value | |
| Sweden–(continued) | |
Skanska AB–Class B | | | 495 | | | $ | 9,616 | |
SKF AB–Class B | | | 538 | | | | 9,439 | |
Svenska Cellulosa AB–Class B | | | 354 | | | | 10,443 | |
Svenska Handelsbanken AB–Class A | | | 694 | | | | 9,413 | |
Swedbank AB–Class A | | | 442 | | | | 10,147 | |
Telefonaktiebolaget LM Ericsson–Class B | | | 1,046 | | | | 10,173 | |
TeliaSonera AB | | | 1,721 | | | | 8,788 | |
Volvo AB–Class B | | | 959 | | | | 9,928 | |
| | | | | | | | 159,466 | |
|
| Switzerland–2.08% | |
ABB Ltd. | | | 542 | | | | 10,210 | |
Actelion Ltd. | | | 74 | | | | 10,266 | |
Adecco S.A | | | 128 | | | | 9,507 | |
Cie Financiere Richemont S.A. | | | 138 | | | | 11,805 | |
Credit Suisse Group AG | | | 366 | | | | 9,115 | |
Geberit AG | | | 32 | | | | 10,316 | |
Givaudan S.A. | | | 6 | | | | 10,726 | |
Glencore PLC | | | 16,209 | | | | 27,921 | |
Julius Baer Group Ltd. | | | 215 | | | | 10,655 | |
Kuehne + Nagel International AG | | | 76 | | | | 10,528 | |
LafargeHolcim Ltd. | | | 176 | | | | 9,900 | |
Nestle S.A. | | | 134 | | | | 10,231 | |
Novartis AG | | | 100 | | | | 9,068 | |
Roche Holding AG | | | 37 | | | | 10,023 | |
Schindler Holding AG–Participation Ctfs. | | | 66 | | | | 10,702 | |
SGS S.A. | | | 6 | | | | 11,414 | |
Sika AG | | | 3 | | | | 9,829 | |
Swatch Group AG (The) | | | 26 | | | | 10,152 | |
Swiss Re AG | | | 118 | | | | 10,949 | |
Swisscom AG | | | 18 | | | | 9,270 | |
Syngenta AG | | | 29 | | | | 9,744 | |
TE Connectivity Ltd. | | | 107 | | | | 6,895 | |
UBS Group AG | | | 483 | | | | 9,641 | |
Wolseley PLC | | | 487 | | | | 28,585 | |
Zurich Insurance Group AG | | | 37 | | | | 9,761 | |
| | | | | | | | 287,213 | |
|
| Taiwan–2.74% | |
Asia Cement Corp. | | | 10,450 | | | | 10,772 | |
Cathay Financial Holding Co., Ltd. | | | 4,758 | | | | 6,733 | |
Chailease Holding Co. Ltd. | | | 4,120 | | | | 7,813 | |
Chang Hwa Commercial Bank, Ltd. | | | 19,765 | | | | 10,197 | |
Cheng Shin Rubber Industry Co., Ltd. | | | 6,000 | | | | 10,806 | |
China Development Financial Holding Corp. | | | 22,224 | | | | 5,934 | |
China Steel Chemical Corp. | | | 2,400 | | | | 9,033 | |
China Steel Corp. | | | 18,409 | | | | 11,066 | |
Chunghwa Telecom Co., Ltd. | | | 6,551 | | | | 19,994 | |
CTBC Financial Holding Co. Ltd. | | | 12,264 | | | | 6,682 | |
E.Sun Financial Holding Co. Ltd. | | | 14,390 | | | | 8,601 | |
Far Eastern Department Stores Ltd. | | | 13,000 | | | | 7,788 | |
Far Eastern New Century Corp. | | | 9,691 | | | | 8,762 | |
| | | | | | | | |
| | | Shares | | | Value | |
| Taiwan–(continued) | |
Far EasTone Telecommunications Co., Ltd. | | | 3,267 | | | $ | 7,056 | |
First Financial Holding Co., Ltd. | | | 27,198 | | | | 13,111 | |
Formosa Chemicals & Fibre Corp. | | | 3,267 | | | | 7,442 | |
Formosa Petrochemical Corp. | | | 3,000 | | | | 7,245 | |
Formosa Plastics Corp. | | | 3,734 | | | | 8,610 | |
Fubon Financial Holding Co., Ltd. | | | 4,000 | | | | 6,415 | |
Hon Hai Precision Industry Co., Ltd. | | | 2,930 | | | | 7,736 | |
Hua Nan Financial Holdings Co., Ltd. | | | 22,178 | | | | 10,612 | |
Kenda Rubber Industrial Co., Ltd. | | | 6,300 | | | | 10,073 | |
Lite-On Technology Corp. | | | 7,030 | | | | 7,259 | |
Makalot Industrial Co., Ltd. | | | 1 | | | | 7 | |
Mega Financial Holding Co., Ltd. | | | 12,000 | | | | 8,667 | |
Nan Ya Plastics Corp. | | | 3,384 | | | | 6,682 | |
President Chain Store Corp. | | | 1,000 | | | | 6,597 | |
Quanta Computer Inc. | | | 4,000 | | | | 6,786 | |
Ruentex Industries Ltd. | | | 4,000 | | | | 7,300 | |
Shin Kong Financial Holding Co., Ltd. | | | 39,412 | | | | 9,371 | |
Simplo Technology Co., Ltd. | | | 2,000 | | | | 7,029 | |
SinoPac Financial Holdings Co., Ltd. | | | 26,451 | | | | 8,665 | |
Standard Foods Corp. | | | 3,000 | | | | 7,174 | |
Synnex Technology International Corp. | | | 7,000 | | | | 7,321 | |
Ta Chong Bank Ltd.(a) | | | 17,000 | | | | 7,173 | |
Taishin Financial Holding Co., Ltd. | | | 22,970 | | | | 8,928 | |
Taiwan Cement Corp. | | | 7,668 | | | | 8,469 | |
Taiwan Cooperative Financial Holding Co. Ltd. | | | 33,796 | | | | 15,038 | |
Taiwan Fertilizer Co., Ltd. | | | 6,718 | | | | 8,520 | |
Taiwan Mobile Co., Ltd. | | | 3,217 | | | | 10,081 | |
Taiwan Semiconductor Manufacturing Co. Ltd. | | | 1,750 | | | | 7,367 | |
Uni-President Enterprises Corp. | | | 4,106 | | | | 6,897 | |
United Microelectronics Corp. | | | 19,000 | | | | 6,890 | |
WPG Holdings Ltd. | | | 8,068 | | | | 8,364 | |
Yuanta Financial Holding Co., Ltd. | | | 16,752 | | | | 6,532 | |
| | | | | | | | 379,598 | |
|
| Thailand–0.95% | |
Advanced Info Service PCL | | | 1,300 | | | | 8,456 | |
Bangkok Bank PCL | | | 2,200 | | | | 10,316 | |
Bangkok Dusit Medical Services PCL–Class F | | | 13,400 | | | | 7,127 | |
BTS Group Holdings PCL | | | 34,300 | | | | 9,275 | |
Central Pattana PCL | | | 5,400 | | | | 6,969 | |
CP ALL PCL | | | 5,400 | | | | 7,555 | |
Home Product Center PCL | | | 38,033 | | | | 7,452 | |
Intouch Holdings PCL | | | 1,800 | | | | 3,783 | |
Intouch Holdings PCL–Class F | | | 3,100 | | | | 6,523 | |
Kasikornbank PCL | | | 1,400 | | | | 6,775 | |
Krung Thai Bank PCL | | | 14,400 | | | | 6,896 | |
Land and Houses PCL | | | 30,700 | | | | 7,352 | |
Siam Cement PCL (The) | | | 600 | | | | 7,589 | |
Siam Commercial Bank PCL (The) | | | 1,900 | | | | 7,089 | |
Thai Beverage PCL | | | 29,600 | | | | 14,213 | |
TMB Bank PCL | | | 97,500 | | | | 7,252 | |
Total Access Communication PCL–NVDR | | | 3,400 | | | | 6,467 | |
| | | | | | | | 131,089 | |
See accompanying Notes to Financial Statements which are an integral part of the financial statements.
17 Invesco Macro Long/Short Fund
| | | | | | | | |
| | | Shares | | | Value | |
| Turkey–0.52% | |
Arcelik A.S. | | | 1,583 | | | $ | 8,633 | |
BIM Birlesik Magazalar A.S. | | | 455 | | | | 9,254 | |
Coca-Cola Içecek A.S. | | | 579 | | | | 7,338 | |
Enka Insaat ve Sanayi A.S. | | | 4,502 | | | | 7,976 | |
Haci Omer Sabanci Holding A.S. | | | 2,356 | | | | 7,470 | |
Koc Holding A.S. | | | 2,030 | | | | 9,191 | |
Migros Ticaret A.S.(a) | | | 1,229 | | | | 7,250 | |
Petkim PetroKimya Holding A.S.(a) | | | 5,268 | | | | 7,769 | |
Turk Telekomunikasyon A.S. | | | 3,305 | | | | 7,130 | |
| | | | | | | | 72,011 | |
|
| United Kingdom–10.95% | |
Anglo American PLC | | | 3,033 | | | | 25,418 | |
ARM Holdings PLC | | | 2,149 | | | | 33,962 | |
Associated British Foods PLC | | | 646 | | | | 34,358 | |
AstraZeneca PLC | | | 485 | | | | 30,961 | |
Aviva PLC | | | 4,416 | | | | 33,031 | |
BAE Systems PLC | | | 4,539 | | | | 30,742 | |
Barclays PLC | | | 8,102 | | | | 28,839 | |
BG Group PLC | | | 2,117 | | | | 33,351 | |
BP PLC | | | 6,001 | | | | 35,625 | |
British American Tobacco PLC | | | 607 | | | | 36,033 | |
BT Group PLC | | | 4,740 | | | | 33,892 | |
Burberry Group PLC | | | 1,510 | | | | 30,917 | |
Centrica PLC | | | 8,688 | | | | 30,243 | |
CNH Industrial N.V. | | | 966 | | | | 6,522 | |
Compass Group PLC | | | 2,002 | | | | 34,491 | |
Delphi Automotive PLC | | | 87 | | | | 7,238 | |
Diageo PLC | | | 1,195 | | | | 34,538 | |
Fiat Chrysler Automobiles N.V.(a) | | | 493 | | | | 7,249 | |
GlaxoSmithKline PLC | | | 1,556 | | | | 33,517 | |
HSBC Holdings PLC | | | 4,109 | | | | 32,099 | |
Imperial Tobacco Group PLC | | | 647 | | | | 34,856 | |
ITV PLC | | | 8,334 | | | | 32,347 | |
Kingfisher PLC | | | 5,800 | | | | 31,526 | |
Land Securities Group PLC | | | 1,661 | | | | 34,239 | |
Legal & General Group PLC | | | 8,203 | | | | 32,992 | |
Lloyds Banking Group PLC | | | 26,850 | | | | 30,470 | |
Marks & Spencer Group PLC | | | 3,962 | | | | 31,284 | |
National Grid PLC | | | 2,403 | | | | 34,206 | |
Next PLC | | | 267 | | | | 32,866 | |
Old Mutual PLC | | | 10,914 | | | | 35,651 | |
Pearson PLC | | | 1,859 | | | | 24,619 | |
Prudential PLC | | | 1,504 | | | | 35,109 | |
Reckitt Benckiser Group PLC | | | 356 | | | | 34,739 | |
RELX N.V. | | | 462 | | | | 7,880 | |
RELX PLC | | | 1,944 | | | | 34,754 | |
Rio Tinto Ltd. | | | 207 | | | | 7,406 | |
Rio Tinto PLC | | | 907 | | | | 32,897 | |
Rolls–Royce Holdings PLC | | | 2,812 | | | | 29,753 | |
Rolls–Royce Holdings PLC–Preference
Shares(a) | | | 260,672 | | | | 402 | |
| | | | | | | | |
| | | Shares | | | Value | |
| United Kingdom–(continued) | |
Royal Bank of Scotland Group PLC(a) | | | 6,288 | | | $ | 30,738 | |
Royal Dutch Shell PLC–Class A | | | 1,263 | | | | 32,802 | |
SABMiller PLC | | | 688 | | | | 42,377 | |
Sky PLC | | | 1,988 | | | | 33,526 | |
Smith & Nephew PLC | | | 1,763 | | | | 30,093 | |
SSE PLC | | | 1,407 | | | | 32,820 | |
Standard Chartered PLC | | | 2,843 | | | | 31,557 | |
Standard Life PLC | | | 5,043 | | | | 32,616 | |
Tesco PLC(a) | | | 10,905 | | | | 30,728 | |
Unilever N.V. | | | 177 | | | | 7,979 | |
Unilever PLC | | | 777 | | | | 34,511 | |
Vodafone Group PLC | | | 9,216 | | | | 30,386 | |
WPP PLC | | | 1,531 | | | | 34,318 | |
| | | | | | | | 1,515,473 | |
|
| United States–23.51% | |
3M Co. | | | 42 | | | | 6,603 | |
Abbott Laboratories | | | 135 | | | | 6,048 | |
AbbVie Inc. | | | 95 | | | | 5,657 | |
ABM Industries Inc. | | | 422 | | | | 11,985 | |
Acadia Realty Trust | | | 482 | | | | 15,853 | |
Accenture PLC–Class A | | | 69 | | | | 7,397 | |
ACE Ltd. | | | 62 | | | | 7,039 | |
Adobe Systems Inc.(a) | | | 84 | | | | 7,447 | |
Aetna Inc. | | | 53 | | | | 6,083 | |
Aflac, Inc. | | | 111 | | | | 7,076 | |
Agree Realty Corp. | | | 508 | | | | 16,449 | |
Air Products and Chemicals, Inc. | | | 45 | | | | 6,254 | |
Albany International Corp.–Class A | | | 360 | | | | 13,525 | |
Alexion Pharmaceuticals, Inc.(a) | | | 36 | | | | 6,336 | |
Allergan PLC(a) | | | 22 | | | | 6,786 | |
ALLETE, Inc. | | | 277 | | | | 13,908 | |
Allstate Corp. (The) | | | 110 | | | | 6,807 | |
Alphabet Inc.–Class A(a) | | | 10 | | | | 7,374 | |
Altria Group, Inc. | | | 119 | | | | 7,196 | |
Amazon.com, Inc.(a) | | | 13 | | | | 8,137 | |
American Airlines Group Inc. | | | 159 | | | | 7,349 | |
American Assets Trust Inc. | | | 362 | | | | 15,262 | |
American Electric Power Co., Inc. | | | 116 | | | | 6,571 | |
American Express Co. | | | 78 | | | | 5,714 | |
American International Group, Inc. | | | 111 | | | | 7,000 | |
American Tower Corp. | | | 69 | | | | 7,054 | |
Ameriprise Financial, Inc. | | | 58 | | | | 6,691 | |
AMERISAFE, Inc. | | | 238 | | | | 13,026 | |
AmerisourceBergen Corp. | | | 59 | | | | 5,694 | |
Amgen Inc. | | | 41 | | | | 6,485 | |
AmSurg Corp.(a) | | | 142 | | | | 9,953 | |
Anadarko Petroleum Corp. | | | 92 | | | | 6,153 | |
Analog Devices, Inc. | | | 116 | | | | 6,974 | |
Anthem, Inc. | | | 41 | | | | 5,705 | |
Aon PLC | | | 68 | | | | 6,345 | |
Apache Corp. | | | 147 | | | | 6,928 | |
See accompanying Notes to Financial Statements which are an integral part of the financial statements.
18 Invesco Macro Long/Short Fund
| | | | | | | | |
| | | Shares | | | Value | |
| United States–(continued) | |
Apple Inc. | | | 55 | | | $ | 6,573 | |
Applied Materials, Inc. | | | 407 | | | | 6,825 | |
Archer-Daniels–Midland Co. | | | 137 | | | | 6,255 | |
Astoria Financial Corp. | | | 874 | | | | 13,949 | |
AT&T Inc. | | | 189 | | | | 6,333 | |
Automatic Data Processing, Inc. | | | 77 | | | | 6,698 | |
AutoZone, Inc.(a) | | | 9 | | | | 7,060 | |
Avista Corp. | | | 402 | | | | 13,608 | |
Baker Hughes Inc. | | | 108 | | | | 5,689 | |
Bank Mutual Corp. | | | 1,611 | | | | 11,664 | |
Bank of America Corp. | | | 384 | | | | 6,444 | |
Bank of New York Mellon Corp. (The) | | | 163 | | | | 6,789 | |
Barnes Group Inc. | | | 290 | | | | 10,901 | |
Baxter International Inc. | | | 175 | | | | 6,543 | |
BB&T Corp. | | | 163 | | | | 6,055 | |
Becton, Dickinson and Co. | | | 44 | | | | 6,271 | |
Benchmark Electronics, Inc.(a) | | | 562 | | | | 11,116 | |
Berkshire Hathaway Inc.–Class B(a) | | | 46 | | | | 6,257 | |
Biogen Inc.(a) | | | 21 | | | | 6,101 | |
BlackRock, Inc. | | | 21 | | | | 7,391 | |
Boeing Co. (The) | | | 46 | | | | 6,811 | |
Boston Properties, Inc. | | | 57 | | | | 7,173 | |
Boston Scientific Corp.(a) | | | 370 | | | | 6,764 | |
Bristol-Myers Squibb Co. | | | 101 | | | | 6,661 | |
Broadcom Corp.–Class A | | | 123 | | | | 6,322 | |
Brookline Bancorp, Inc. | | | 1,262 | | | | 14,324 | |
CACI International Inc.–Class A(a) | | | 165 | | | | 16,012 | |
Capital One Financial Corp. | | | 84 | | | | 6,628 | |
Capstead Mortgage Corp. | | | 1,872 | | | | 18,065 | |
Cardinal Financial Corp. | | | 545 | | | | 12,388 | |
Cardinal Health, Inc. | | | 75 | | | | 6,165 | |
Carnival Corp. | | | 138 | | | | 7,463 | |
Caterpillar Inc. | | | 79 | | | | 5,766 | |
CBS Corp.–Class B | | | 146 | | | | 6,792 | |
Cedar Realty Trust Inc. | | | 2,017 | | | | 14,099 | |
Celgene Corp.(a) | | | 53 | | | | 6,504 | |
CenturyLink Inc. | | | 239 | | | | 6,742 | |
Charles Schwab Corp. (The) | | | 202 | | | | 6,165 | |
Chemed Corp. | | | 98 | | | | 15,414 | |
Cheniere Energy, Inc.(a) | | | 112 | | | | 5,546 | |
Chesapeake Lodging Trust | | | 416 | | | | 11,457 | |
Chevron Corp. | | | 82 | | | | 7,452 | |
Chubb Corp. (The) | | | 52 | | | | 6,726 | |
Cigna Corp. | | | 42 | | | | 5,630 | |
Cisco Systems, Inc. | | | 223 | | | | 6,434 | |
Citigroup Inc. | | | 121 | | | | 6,434 | |
City Holding Co. | | | 264 | | | | 12,627 | |
CME Group Inc.–Class A | | | 69 | | | | 6,518 | |
Coca-Cola Co. (The) | | | 164 | | | | 6,945 | |
Cognizant Technology Solutions Corp.–
Class A(a) | | | 101 | | | | 6,879 | |
Colgate-Palmolive Co. | | | 95 | | | | 6,303 | |
| | | | | | | | |
| | | Shares | | | Value | |
| United States–(continued) | |
Columbia Banking System, Inc. | | | 380 | | | $ | 12,662 | |
Comcast Corp.–Class A | | | 116 | | | | 7,264 | |
Community Bank System, Inc. | | | 372 | | | | 15,163 | |
CONMED Corp. | | | 213 | | | | 8,639 | |
ConocoPhillips | | | 133 | | | | 7,096 | |
Consolidated Edison, Inc. | | | 105 | | | | 6,904 | |
CoreSite Realty Corp. | | | 259 | | | | 14,232 | |
Corning Inc. | | | 363 | | | | 6,752 | |
Costco Wholesale Corp. | | | 47 | | | | 7,432 | |
Crown Castle International Corp. | | | 74 | | | | 6,324 | |
CSG Systems International, Inc. | | | 404 | | | | 13,542 | |
CSX Corp. | | | 233 | | | | 6,289 | |
Cubic Corp. | | | 299 | | | | 13,410 | |
Cummins Inc. | | | 48 | | | | 4,968 | |
Curtiss-Wright Corp. | | | 183 | | | | 12,729 | |
CVB Financial Corp. | | | 686 | | | | 11,971 | |
CVS Health Corp. | | | 65 | | | | 6,421 | |
Danaher Corp. | | | 77 | | | | 7,185 | |
Deere & Co. | | | 79 | | | | 6,162 | |
Delta Air Lines, Inc. | | | 138 | | | | 7,016 | |
Deltic Timber Corp. | | | 199 | | | | 12,330 | |
Devon Energy Corp. | | | 155 | | | | 6,499 | |
DiamondRock Hospitality Co. | | | 1,022 | | | | 11,937 | |
Dime Community Bancshares, Inc. | | | 907 | | | | 15,736 | |
DineEquity, Inc. | | | 138 | | | | 11,516 | |
Discover Financial Services | | | 122 | | | | 6,859 | |
Dollar General Corp. | | | 85 | | | | 5,760 | |
Dominion Resources, Inc. | | | 93 | | | | 6,643 | |
Dow Chemical Co. (The) | | | 149 | | | | 7,699 | |
Duke Energy Corp. | | | 84 | | | | 6,003 | |
E. I. du Pont de Nemours and Co. | | | 129 | | | | 8,179 | |
EastGroup Properties, Inc. | | | 267 | | | | 14,995 | |
Eaton Corp. PLC(a) | | | 114 | | | | 6,374 | |
eBay Inc.(a) | | | 257 | | | | 7,170 | |
Ecolab Inc. | | | 60 | | | | 7,221 | |
Edison International | | | 113 | | | | 6,839 | |
Education Realty Trust, Inc. | | | 427 | | | | 15,334 | |
El Paso Electric Co. | | | 364 | | | | 14,076 | |
Eli Lilly and Co. | | | 78 | | | | 6,362 | |
EMC Corp. | | | 242 | | | | 6,345 | |
EMCOR Group, Inc. | | | 265 | | | | 12,794 | |
Emerson Electric Co. | | | 137 | | | | 6,471 | |
Encore Capital Group, Inc.(a) | | | 293 | | | | 11,925 | |
EnPro Industries, Inc. | | | 230 | | | | 11,295 | |
EOG Resources, Inc. | | | 81 | | | | 6,954 | |
EPR Properties | | | 266 | | | | 15,111 | |
Equity Residential | | | 89 | | | | 6,881 | |
ESCO Technologies Inc. | | | 378 | | | | 14,020 | |
Exelon Corp. | | | 194 | | | | 5,416 | |
Exponent, Inc. | | | 268 | | | | 13,778 | |
Express Scripts Holding Co.(a) | | | 73 | | | | 6,306 | |
See accompanying Notes to Financial Statements which are an integral part of the financial statements.
19 Invesco Macro Long/Short Fund
| | | | | | | | |
| | | Shares | | | Value | |
| United States–(continued) | |
Exxon Mobil Corp. | | | 86 | | | $ | 7,116 | |
F.N.B. Corp. | | | 981 | | | | 13,214 | |
Facebook Inc.–Class A(a) | | | 71 | | | | 7,240 | |
FedEx Corp. | | | 39 | | | | 6,086 | |
First Midwest Bancorp, Inc. | | | 682 | | | | 12,153 | |
Ford Motor Co. | | | 425 | | | | 6,294 | |
Forrester Research, Inc. | | | 392 | | | | 12,650 | |
Franklin Resources, Inc. | | | 160 | | | | 6,522 | |
Franklin Street Properties Corp. | | | 1,401 | | | | 14,598 | |
Freeport-McMoRan Inc. | | | 453 | | | | 5,332 | |
G & K Services, Inc.–Class A | | | 175 | | | | 11,519 | |
General Dynamics Corp. | | | 47 | | | | 6,983 | |
General Electric Co. | | | 250 | | | | 7,230 | |
General Mills, Inc. | | | 117 | | | | 6,799 | |
General Motors Co. | | | 217 | | | | 7,575 | |
Geo Group Inc. (The) | | | 379 | | | | 12,230 | |
Getty Realty Corp. | | | 997 | | | | 16,829 | |
Gilead Sciences, Inc. | | | 61 | | | | 6,596 | |
Goldman Sachs Group, Inc. (The) | | | 33 | | | | 6,188 | |
Government Properties Income Trust | | | 971 | | | | 15,808 | |
Greatbatch, Inc.(a) | | | 240 | | | | 12,828 | |
Halliburton Co. | | | 170 | | | | 6,525 | |
HCA Holdings, Inc.(a) | | | 78 | | | | 5,366 | |
HCP, Inc. | | | 175 | | | | 6,510 | |
Healthcare Realty Trust, Inc. | | | 645 | | | | 17,002 | |
Healthcare Services Group, Inc. | | | 398 | | | | 14,829 | |
Hershey Co. (The) | | | 74 | | | | 6,563 | |
Hess Corp. | | | 111 | | | | 6,239 | |
Hewlett-Packard Co.(a) | | | 232 | | | | 6,255 | |
Hilton Worldwide Holdings Inc. | | | 236 | | | | 5,898 | |
Home Depot, Inc. (The) | | | 55 | | | | 6,800 | |
Honeywell International Inc. | | | 61 | | | | 6,300 | |
Horace Mann Educators Corp. | | | 394 | | | | 13,491 | |
Humana Inc. | | | 35 | | | | 6,252 | |
Illinois Tool Works Inc. | | | 77 | | | | 7,079 | |
Illumina, Inc.(a) | | | 32 | | | | 4,585 | |
Independent Bank Corp. | | | 271 | | | | 12,667 | |
Infinity Property & Casualty Corp. | | | 173 | | | | 13,930 | |
Ingersoll-Rand PLC | | | 118 | | | | 6,993 | |
Inland Real Estate Corp. | | | 1,684 | | | | 14,903 | |
Intel Corp. | | | 206 | | | | 6,975 | |
Intercontinental Exchange, Inc. | | | 27 | | | | 6,815 | |
International Business Machines Corp. | | | 44 | | | | 6,164 | |
International Paper Co. | | | 150 | | | | 6,404 | |
Intuit Inc. | | | 74 | | | | 7,210 | |
Intuitive Surgical, Inc.(a) | | | 12 | | | | 5,959 | |
Johnson & Johnson | | | 63 | | | | 6,365 | |
Johnson Controls, Inc. | | | 158 | | | | 7,138 | |
JPMorgan Chase & Co. | | | 97 | | | | 6,232 | |
Kaiser Aluminum Corp. | | | 189 | | | | 15,364 | |
Kaman Corp. | | | 394 | | | | 15,323 | |
| | | | | | | | |
| | | Shares | | | Value | |
| United States–(continued) | |
Kellogg Co. | | | 101 | | | $ | 7,123 | |
Kimberly-Clark Corp. | | | 60 | | | | 7,183 | |
Kinder Morgan Inc. | | | 203 | | | | 5,552 | |
Kite Realty Group Trust | | | 566 | | | | 14,948 | |
Kroger Co. (The) | | | 184 | | | | 6,955 | |
Laclede Group, Inc. (The) | | | 306 | | | | 17,922 | |
Las Vegas Sands Corp. | | | 132 | | | | 6,535 | |
Lexington Realty Trust | | | 1,521 | | | | 13,446 | |
LinkedIn Corp.–Class A(a) | | | 35 | | | | 8,430 | |
Lockheed Martin Corp. | | | 31 | | | | 6,815 | |
Lowe’s Cos., Inc. | | | 92 | | | | 6,792 | |
LTC Properties, Inc. | | | 358 | | | | 15,340 | |
LyondellBasell Industries N.V.–Class A | | | 78 | | | | 7,247 | |
Macy’s, Inc. | | | 99 | | | | 5,047 | |
ManTech International Corp.–Class A | | | 414 | | | | 11,965 | |
Marathon Oil Corp. | | | 342 | | | | 6,286 | |
Marathon Petroleum Corp. | | | 126 | | | | 6,527 | |
Marsh & McLennan Cos., Inc. | | | 120 | | | | 6,689 | |
MasterCard, Inc.–Class A | | | 72 | | | | 7,127 | |
Matthews International Corp.–Class A | | | 260 | | | | 15,010 | |
McDonald’s Corp. | | | 69 | | | | 7,745 | |
McGraw Hill Financial, Inc. | | | 67 | | | | 6,207 | |
McKesson Corp. | | | 29 | | | | 5,185 | |
Mead Johnson Nutrition Co. | | | 83 | | | | 6,806 | |
Medical Properties Trust Inc. | | | 1,145 | | | | 12,938 | |
Medtronic PLC | | | 85 | | | | 6,283 | |
Merck & Co., Inc. | | | 114 | | | | 6,231 | |
MetLife, Inc. | | | 131 | | | | 6,600 | |
Micron Technology, Inc.(a) | | | 372 | | | | 6,160 | |
Microsoft Corp. | | | 150 | | | | 7,896 | |
MKS Instruments, Inc. | | | 351 | | | | 12,369 | |
Mondelez International Inc.–Class A | | | 147 | | | | 6,786 | |
Monro Muffler Brake, Inc. | | | 188 | | | | 13,944 | |
Monsanto Co. | | | 65 | | | | 6,059 | |
Moog Inc.–Class A(a) | | | 193 | | | | 11,920 | |
Morgan Stanley | | | 171 | | | | 5,638 | |
MTS Systems Corp. | | | 183 | | | | 12,083 | |
Mueller Industries, Inc. | | | 398 | | | | 12,545 | |
Mylan N.V.(a) | | | 130 | | | | 5,732 | |
National Oilwell Varco Inc. | | | 155 | | | | 5,834 | |
National Penn Bancshares, Inc. | | | 1,237 | | | | 14,893 | |
National Presto Industries, Inc. | | | 146 | | | | 12,855 | |
Navigators Group, Inc. (The)(a) | | | 193 | | | | 16,473 | |
NBT Bancorp Inc. | | | 481 | | | | 13,521 | |
Neenah Paper, Inc. | | | 197 | | | | 13,280 | |
Netflix Inc.(a) | | | 63 | | | | 6,828 | |
New Jersey Resources Corp. | | | 420 | | | | 13,306 | |
NextEra Energy, Inc. | | | 65 | | | | 6,673 | |
NIKE, Inc.–Class B | | | 57 | | | | 7,469 | |
Noble Energy, Inc. | | | 204 | | | | 7,311 | |
Norfolk Southern Corp. | | | 82 | | | | 6,562 | |
See accompanying Notes to Financial Statements which are an integral part of the financial statements.
20 Invesco Macro Long/Short Fund
| | | | | | | | |
| | | Shares | | | Value | |
| United States–(continued) | |
Northern Trust Corp. | | | 85 | | | $ | 5,983 | |
Northfield Bancorp, Inc. | | | 1,094 | | | | 16,760 | |
Northrop Grumman Corp. | | | 41 | | | | 7,698 | |
Northwest Bancshares, Inc. | | | 1,322 | | | | 17,794 | |
Northwest Natural Gas Co. | | | 314 | | | | 15,000 | |
NorthWestern Corp. | | | 249 | | | | 13,493 | |
Nucor Corp. | | | 142 | | | | 6,007 | |
O’Reilly Automotive, Inc.(a) | | | 29 | | | | 8,012 | |
Occidental Petroleum Corp. | | | 89 | | | | 6,634 | |
Omnicom Group Inc. | | | 92 | | | | 6,893 | |
Oracle Corp. | | | 172 | | | | 6,680 | |
Oritani Financial Corp. | | | 937 | | | | 14,917 | |
OSI Systems, Inc.(a) | | | 179 | | | | 15,426 | |
PACCAR Inc. | | | 101 | | | | 5,318 | |
Parkway Properties, Inc. | | | 791 | | | | 13,233 | |
PepsiCo, Inc. | | | 69 | | | | 7,051 | |
Perrigo Co. PLC | | | 36 | | | | 5,679 | |
Pfizer Inc. | | | 202 | | | | 6,832 | |
PG&E Corp. | | | 129 | | | | 6,889 | |
Philip Morris International Inc. | | | 84 | | | | 7,426 | |
Phillips 66 | | | 81 | | | | 7,213 | |
Piedmont Natural Gas Co., Inc. | | | 358 | | | | 20,517 | |
Pioneer Natural Resources Co. | | | 53 | | | | 7,268 | |
PNC Financial Services Group, Inc. (The) | | | 69 | | | | 6,228 | |
Pool Corp. | | | 184 | | | | 15,003 | |
Post Properties, Inc. | | | 256 | | | | 15,293 | |
PPG Industries, Inc. | | | 67 | | | | 6,985 | |
PPL Corp. | | | 216 | | | | 7,430 | |
Praxair, Inc. | | | 62 | | | | 6,888 | |
Precision Castparts Corp. | | | 27 | | | | 6,232 | |
Priceline Group Inc. (The)(a) | | | 5 | | | | 7,271 | |
ProAssurance Corp. | | | 344 | | | | 18,218 | |
Procter & Gamble Co. (The) | | | 91 | | | | 6,951 | |
Progress Software Corp.(a) | | | 430 | | | | 10,440 | |
Prologis, Inc. | | | 168 | | | | 7,179 | |
Provident Financial Services, Inc. | | | 741 | | | | 15,057 | |
Prudential Financial, Inc. | | | 78 | | | | 6,435 | |
PS Business Parks, Inc. | | | 186 | | | | 15,957 | |
Public Service Enterprise Group Inc. | | | 155 | | | | 6,400 | |
Public Storage | | | 31 | | | | 7,113 | |
QUALCOMM, Inc. | | | 115 | | | | 6,833 | |
Raytheon Co. | | | 61 | | | | 7,161 | |
Regeneron Pharmaceuticals, Inc.(a) | | | 13 | | | | 7,246 | |
Retail Opportunity Investments Corp. | | | 863 | | | | 15,646 | |
Reynolds American Inc. | | | 150 | | | | 7,248 | |
RLI Corp. | | | 218 | | | | 13,265 | |
Sabra Health Care REIT, Inc. | | | 484 | | | | 10,977 | |
Safety Insurance Group, Inc. | | | 260 | | | | 15,067 | |
salesforce.com, inc.(a) | | | 95 | | | | 7,382 | |
Samsonite International S.A. | | | 2,488 | | | | 7,323 | |
Saul Centers, Inc. | | | 251 | | | | 14,074 | |
| | | | | | | | |
| | | Shares | | | Value | |
| United States–(continued) | |
Schlumberger Ltd. | | | 78 | | | $ | 6,096 | |
Selective Insurance Group, Inc. | | | 425 | | | | 15,508 | |
Sempra Energy | | | 68 | | | | 6,964 | |
Sherwin-Williams Co. (The) | | | 23 | | | | 6,137 | |
Simmons First National Corp.–Class A | | | 271 | | | | 13,967 | |
Simon Property Group, Inc. | | | 37 | | | | 7,454 | |
Simpson Manufacturing Co., Inc. | | | 335 | | | | 12,723 | |
Snyder’s-Lance, Inc. | | | 361 | | | | 12,830 | |
South Jersey Industries, Inc. | | | 601 | | | | 15,933 | |
Southern Co. (The) | | | 157 | | | | 7,081 | |
Southwest Airlines Co. | | | 168 | | | | 7,777 | |
Southwest Gas Corp. | | | 242 | | | | 14,873 | |
Spectra Energy Corp. | | | 225 | | | | 6,428 | |
St. Jude Medical, Inc. | | | 87 | | | | 5,551 | |
Standex International Corp. | | | 155 | | | | 13,907 | |
Starbucks Corp. | | | 115 | | | | 7,196 | |
State Street Corp. | | | 82 | | | | 5,658 | |
Sterling Bancorp | | | 884 | | | | 13,605 | |
Stryker Corp. | | | 71 | | | | 6,789 | |
Summit Hotel Properties, Inc. | | | 937 | | | | 12,256 | |
SunTrust Banks, Inc. | | | 158 | | | | 6,560 | |
Superior Industries International, Inc. | | | 605 | | | | 11,906 | |
Sysco Corp. | | | 158 | | | | 6,518 | |
T. Rowe Price Group Inc. | | | 82 | | | | 6,201 | |
Talmer Bancorp, Inc.–Class A | | | 887 | | | | 14,919 | |
Target Corp. | | | 84 | | | | 6,483 | |
Tetra Tech, Inc. | | | 444 | | | | 11,944 | |
Texas Instruments Inc. | | | 135 | | | | 7,657 | |
Texas Roadhouse, Inc. | | | 310 | | | | 10,649 | |
Thermo Fisher Scientific, Inc. | | | 52 | | | | 6,801 | |
Time Warner Cable Inc. | | | 33 | | | | 6,250 | |
Time Warner Inc. | | | 89 | | | | 6,705 | |
TJX Cos., Inc. (The) | | | 93 | | | | 6,807 | |
Tompkins Financial Corp. | | | 235 | | | | 12,756 | |
Travelers Cos., Inc. (The) | | | 66 | | | | 7,451 | |
TrustCo Bank Corp NY | | | 1,903 | | | | 11,856 | |
Twenty-First Century Fox, Inc.–Class A | | | 236 | | | | 7,243 | |
Twitter, Inc.(a) | | | 222 | | | | 6,318 | |
Tyco International PLC | | | 165 | | | | 6,013 | |
U.S. Bancorp | | | 154 | | | | 6,496 | |
UniFirst Corp. | | | 113 | | | | 11,873 | |
Union Pacific Corp. | | | 74 | | | | 6,612 | |
United Bankshares, Inc. | | | 295 | | | | 11,667 | |
United Parcel Service, Inc.–Class B | | | 64 | | | | 6,593 | |
United Technologies Corp. | | | 69 | | | | 6,790 | |
UnitedHealth Group Inc. | | | 54 | | | | 6,360 | |
Universal Health Realty Income Trust | | | 266 | | | | 13,218 | |
Urstadt Biddle Properties Inc.–Class A | | | 776 | | | | 15,598 | |
Valero Energy Corp. | | | 105 | | | | 6,922 | |
Ventas, Inc. | | | 117 | | | | 6,285 | |
Verizon Communications Inc. | | | 136 | | | | 6,376 | |
See accompanying Notes to Financial Statements which are an integral part of the financial statements.
21 Invesco Macro Long/Short Fund
| | | | | | | | |
| | | Shares | | | Value | |
| United States–(continued) | |
Vertex Pharmaceuticals Inc.(a) | | | 52 | | | $ | 6,486 | |
VF Corp. | | | 94 | | | | 6,347 | |
Viacom Inc.–Class B | | | 139 | | | | 6,854 | |
Visa Inc.–Class A | | | 96 | | | | 7,448 | |
Vornado Realty Trust | | | 74 | | | | 7,441 | |
Wal-Mart Stores, Inc. | | | 91 | | | | 5,209 | |
Walgreens Boots Alliance, Inc. | | | 73 | | | | 6,182 | |
Walt Disney Co. (The) | | | 60 | | | | 6,824 | |
Waste Management, Inc. | | | 125 | | | | 6,720 | |
WD-40 Co. | | | 139 | | | | 13,286 | |
Wells Fargo & Co. | | | 116 | | | | 6,280 | |
Welltower Inc. | | | 96 | | | | 6,228 | |
Westamerica Bancorp. | | | 266 | | | | 11,760 | |
Western Digital Corp. | | | 73 | | | | 4,878 | |
Weyerhaeuser Co. | | | 229 | | | | 6,717 | |
Williams Cos., Inc. (The) | | | 135 | | | | 5,324 | |
Wintrust Financial Corp. | | | 251 | | | | 12,673 | |
Xcel Energy, Inc. | | | 192 | | | | 6,841 | |
Yahoo! Inc.(a) | | | 198 | | | | 7,053 | |
Yum! Brands, Inc. | | | 72 | | | | 5,106 | |
Zimmer Biomet Holdings, Inc. | | | 62 | | | | 6,483 | |
Zoetis Inc. | | | 131 | | | | 5,634 | |
| | | | | | | | 3,252,940 | |
Total Common Stocks & Other Equity Interests
(Cost $11,565,319) | | | | 11,406,742 | |
| | | | | | | | |
| | | Shares | | | Value | |
Money Market Funds–12.07% | |
Liquid Assets Portfolio–Institutional Class, 0.16%(g) | | | 834,965 | | | $ | 834,965 | |
Premier Portfolio–Institutional Class, 0.12%(g) | | | 834,964 | | | | 834,964 | |
Total Money Market Funds
(Cost $1,669,929) | | | | 1,669,929 | |
TOTAL INVESTMENTS–94.51%
(Cost $13,235,248) | | | | 13,076,671 | |
OTHER ASSETS LESS LIABILITIES–5.49% | | | | | | | 759,518 | |
NET ASSETS–100.00% | | | | | | $ | 13,836,189 | |
Investment Abbreviations:
| | |
| ADR | | – American Depositary Receipt |
| CPO | | – Certificates of Ordinary Participation |
| Ctfs. | | – Certificates |
| GDR | | – Global Depositary Receipt |
| NVDR | | – Non-Voting Depositary Receipt |
| REIT | | – Real Estate Investment Trust |
Notes to Schedule of Investments:
| (a) | Non-income producing security. |
| (b) | Each unit represents one common share and four preferred shares. |
| (c) | Each unit represents two preferred shares and one common share. |
| (d) | Security purchased or received in a transaction exempt from registration under the Securities Act of 1933, as amended (the “1933 Act”). The security may be resold pursuant to an exemption from registration under the 1933 Act, typically to qualified institutional buyers. The aggregate value of these securities at October 31, 2015 was $31,124, which represented less than 1% of the Fund’s Net Assets. |
| (e) | Each unit represents one Series B share, two Series D-B shares and two Series D-L shares. |
| (f) | Each CPO represents twenty-five Series A shares, twenty-two Series B shares, thirty-five Series D shares and thirty-five Series L shares. |
| (g) | The money market fund and the Fund are affiliated by having the same investment adviser. The rate shown is the 7-day SEC standardized yield as of October 31, 2015. |
See accompanying Notes to Financial Statements which are an integral part of the financial statements.
22 Invesco Macro Long/Short Fund
Statement of Assets and Liabilities
October 31, 2015
| | | | |
Assets: | |
Investments, at value (Cost $11,565,319) | | $ | 11,406,742 | |
Investments in affiliated money market funds, at value and cost | | | 1,669,929 | |
Total investments, at value (Cost $13,235,248) | | | 13,076,671 | |
Foreign currencies, at value (Cost $60,807) | | | 60,690 | |
Receivable for: | | | | |
Deposits with brokers for open futures contracts | | | 735,000 | |
Variation margin — futures | | | 5,735 | |
Dividends | | | 20,893 | |
Fund expenses absorbed | | | 69,906 | |
Investment for trustee deferred compensation and retirement plans | | | 4,289 | |
Unrealized appreciation on forward foreign currency contracts outstanding | | | 35,083 | |
Other assets | | | 4,086 | |
Total assets | | | 14,012,353 | |
|
Liabilities: | |
Payable for: | | | | |
Fund shares reacquired | | | 12,475 | |
Accrued fees to affiliates | | | 1,303 | |
Accrued trustees’ and officers’ fees and benefits | | | 1,589 | |
Accrued other operating expenses | | | 85,438 | |
Trustee deferred compensation and retirement plans | | | 4,289 | |
Unrealized depreciation on forward foreign currency contracts outstanding | | | 68,277 | |
Unrealized depreciation on swap agreements — OTC | | | 2,793 | |
Total liabilities | | | 176,164 | |
Net assets applicable to shares outstanding | | $ | 13,836,189 | |
|
Net assets consist of: | |
Shares of beneficial interest | | $ | 14,265,521 | |
Undistributed net investment income | | | 41,809 | |
Undistributed net realized gain (loss) | | | (197,057 | ) |
Net unrealized appreciation (depreciation) | | | (274,084 | ) |
| | | $ | 13,836,189 | |
| | | | |
Net Assets: | |
Class A | | $ | 6,047,502 | |
Class C | | $ | 20,748 | |
Class R | | $ | 9,630 | |
Class Y | | $ | 6,399,629 | |
Class R5 | | $ | 628,800 | |
Class R6 | | $ | 729,880 | |
|
Shares outstanding, $0.01 par value per share,
with an unlimited number of shares authorized: | |
Class A | | | 627,077 | |
Class C | | | 2,159 | |
Class R | | | 1,001 | |
Class Y | | | 661,997 | |
Class R5 | | | 65,001 | |
Class R6 | | | 75,494 | |
Class A: | | | | |
Net asset value per share | | $ | 9.64 | |
Maximum offering price per share | | | | |
(Net asset value of $9.64 ¸ 94.50%) | | $ | 10.20 | |
Class C: | | | | |
Net asset value and offering price per share | | $ | 9.61 | |
Class R: | | | | |
Net asset value and offering price per share | | $ | 9.62 | |
Class Y: | | | | |
Net asset value and offering price per share | | $ | 9.67 | |
Class R5: | | | | |
Net asset value and offering price per share | | $ | 9.67 | |
Class R6: | | | | |
Net asset value and offering price per share | | $ | 9.67 | |
See accompanying Notes to Financial Statements which are an integral part of the financial statements.
23 Invesco Macro Long/Short Fund
Statement of Operations
For the year ended October 31, 2015
| | | | |
Investment income: | |
Dividends (net of foreign withholding taxes of $23,306) | | $ | 306,735 | |
Dividends from affiliated money market funds | | | 1,658 | |
Total investment income | | | 308,393 | |
| |
Expenses: | | | | |
Advisory fees | | | 173,135 | |
Administrative services fees | | | 50,000 | |
Custodian fees | | | 123,079 | |
Distribution fees: | | | | |
Class A | | | 14,957 | |
Class C | | | 255 | |
Class R | | | 49 | |
Transfer agent fees — A, C, R and Y | | | 3,259 | |
Transfer agent fees — R5 | | | 60 | |
Transfer agent fees — R6 | | | 59 | |
Trustees’ and officers’ fees and benefits | | | 19,214 | |
Registration and filing fees | | | 109,456 | |
Licensing Fees | | | 74,202 | |
Professional services fees | | | 79,271 | |
Other | | | 111,700 | |
Total expenses | | | 758,696 | |
Less: Fees waived and expenses reimbursed | | | (522,342 | ) |
Net expenses | | | 236,354 | |
Net investment income | | | 72,039 | |
| |
Realized and unrealized gain (loss) from: | | | | |
Net realized gain (loss) from: | | | | |
Investment securities (net of foreign taxes of $824) | | | (49,604 | ) |
Foreign currencies | | | (12,960 | ) |
Forward foreign currency contracts | | | 558,302 | |
Futures contracts | | | (486,975 | ) |
Swap agreements | | | (3,317 | ) |
| | | | 5,446 | |
Change in net unrealized appreciation (depreciation) of: | | | | |
Investment securities (net of foreign taxes on holdings of $408) | | | (433,351 | ) |
Foreign currencies | | | 799 | |
Forward foreign currency contracts | | | (58,310 | ) |
Futures contracts | | | 106,333 | |
Swap agreements | | | (1,912 | ) |
| | | | (386,441 | ) |
Net realized and unrealized gain (loss) | | | (380,995 | ) |
Net increase (decrease) in net assets resulting from operations | | $ | (308,956 | ) |
See accompanying Notes to Financial Statements which are an integral part of the financial statements.
24 Invesco Macro Long/Short Fund
Statement of Changes in Net Assets
For the year ended October 31, 2015 and the period December 17, 2013 (commencement date) through October 31, 2014
| | | | | | | | |
| | | October 31,
2015 | | | December 17, 2013
(commencement date) through
October 31, 2014 | |
Operations: | | | | | | | | |
Net investment income | | $ | 72,039 | | | $ | 70,747 | |
Net realized gain (loss) | | | 5,446 | | | | (187,807 | ) |
Change in net unrealized appreciation (depreciation) | | | (386,441 | ) | | | 112,357 | |
Net increase (decrease) in net assets resulting from operations | | | (308,956 | ) | | | (4,703 | ) |
| | |
Distributions to shareholders from net investment income: | | | | | | | | |
Class A | | | (61,803 | ) | | | — | |
Class R | | | (82 | ) | | | — | |
Class Y | | | (73,701 | ) | | | — | |
Class R5 | | | (15,530 | ) | | | — | |
Class R6 | | | (9,070 | ) | | | — | |
Total distributions from net investment income | | | (160,186 | ) | | | — | |
| | |
Share transactions–net: | | | | | | | | |
Class A | | | 323,315 | | | | 5,931,843 | |
Class C | | | (45,450 | ) | | | 67,324 | |
Class R | | | — | | | | 10,010 | |
Class Y | | | 773,498 | | | | 5,837,544 | |
Class R5 | | | (571,965 | ) | | | 1,229,957 | |
Class R6 | | | 65,636 | | | | 688,322 | |
Net increase in net assets resulting from share transactions | | | 545,034 | | | | 13,765,000 | |
Net increase in net assets | | | 75,892 | | | | 13,760,297 | |
| | |
Net assets: | | | | | | | | |
Beginning of year | | | 13,760,297 | | | | — | |
End of year (includes undistributed net investment income of $41,809 and $137,339, respectively) | | $ | 13,836,189 | | | $ | 13,760,297 | |
Notes to Financial Statements
October 31, 2015
NOTE 1—Significant Accounting Policies
Invesco Macro Long/Short Fund (the “Fund”) is a series portfolio of AIM Investment Funds (Invesco Investment Funds) (the “Trust”). The Trust is organized as a Delaware statutory trust and is registered under the Investment Company Act of 1940, as amended (the “1940 Act”), as an open-end series management investment company consisting of twenty-four separate series portfolios, each authorized to issue an unlimited number of shares of beneficial interest. The assets, liabilities and operations of each portfolio are accounted for separately. Information presented in these financial statements pertains only to the Fund. Matters affecting each portfolio or class will be voted on exclusively by the shareholders of such portfolio or class.
The Fund’s investment objective is to seek a positive absolute return over a complete economic and market cycle.
The Fund currently consists of six different classes of shares: Class A, Class C, Class R, Class Y, Class R5 and Class R6. Class A shares are sold with a front-end sales charge unless certain waiver criteria are met and under certain circumstances load waived shares may be subject to contingent deferred sales charges (“CDSC”). Class C shares are sold with a CDSC. Class R, Class Y, Class R5 and Class R6 shares are sold at net asset value.
The following is a summary of the significant accounting policies followed by the Fund in the preparation of its financial statements.
| A. | Security Valuations — Securities, including restricted securities, are valued according to the following policy. |
A security listed or traded on an exchange (except convertible securities) is valued at its last sales price or official closing price as of the close of the customary trading session on the exchange where the security is principally traded, or lacking any sales or official closing price on a particular day, the security may be valued at the closing bid price on that day. Securities traded in the over-the-counter market are valued based on prices furnished by independent pricing services or market makers. When such securities are valued by an independent pricing service they may be considered fair valued. Futures contracts are valued at the final settlement price set by an exchange on which they are principally traded. Listed options are valued at the mean between the last bid and asked prices from the exchange on which they are principally traded. Options not listed on an exchange are valued by an independent source at the mean between the last bid and asked prices. For purposes of determining net asset value (“NAV”) per share, futures and option contracts generally are valued 15 minutes after the close of the customary trading session of the New York Stock Exchange (“NYSE”).
25 Invesco Macro Long/Short Fund
Investments in open-end and closed-end registered investment companies that do not trade on an exchange are valued at the end-of-day net asset value per share. Investments in open-end and closed-end registered investment companies that trade on an exchange are valued at the last sales price or official closing price as of the close of the customary trading session on the exchange where the security is principally traded.
Swap agreements are fair valued using an evaluated quote, if available, provided by an independent pricing service. Evaluated quotes provided by the pricing service are valued based on a model which may include end-of-day net present values, spreads, ratings, industry, company performance and returns of referenced assets.
Debt obligations (including convertible securities) and unlisted equities are fair valued using an evaluated quote provided by an independent pricing service. Evaluated quotes provided by the pricing service may be determined without exclusive reliance on quoted prices, and may reflect appropriate factors such as institution-size trading in similar groups of securities, developments related to specific securities, dividend rate (for unlisted equities), yield (for debt obligations), quality, type of issue, coupon rate (for debt obligations), maturity (for debt obligations), individual trading characteristics and other market data. Debt obligations are subject to interest rate and credit risks. In addition, all debt obligations involve some risk of default with respect to interest and/or principal payments.
Foreign securities’ (including foreign exchange contracts) prices are converted into U.S. dollar amounts using the applicable exchange rates as of the close of the NYSE. If market quotations are available and reliable for foreign exchange-traded equity securities, the securities will be valued at the market quotations. Because trading hours for certain foreign securities end before the close of the NYSE, closing market quotations may become unreliable. If between the time trading ends on a particular security and the close of the customary trading session on the NYSE, events occur that the Adviser determines are significant and make the closing price unreliable, the Fund may fair value the security. If the event is likely to have affected the closing price of the security, the security will be valued at fair value in good faith using procedures approved by the Board of Trustees. Adjustments to closing prices to reflect fair value may also be based on a screening process of an independent pricing service to indicate the degree of certainty, based on historical data, that the closing price in the principal market where a foreign security trades is not the current value as of the close of the NYSE. Foreign securities’ prices meeting the approved degree of certainty that the price is not reflective of current value will be priced at the indication of fair value from the independent pricing service. Multiple factors may be considered by the independent pricing service in determining adjustments to reflect fair value and may include information relating to sector indices, American Depositary Receipts and domestic and foreign index futures. Foreign securities may have additional risks including exchange rate changes, potential for sharply devalued currencies and high inflation, political and economic upheaval, the relative lack of issuer information, relatively low market liquidity and the potential lack of strict financial and accounting controls and standards.
Securities for which market prices are not provided by any of the above methods may be valued based upon quotes furnished by independent sources. The last bid price may be used to value equity securities. The mean between the last bid and asked prices is used to value debt obligations, including corporate loans.
Securities for which market quotations are not readily available or became unreliable are valued at fair value as determined in good faith by or under the supervision of the Trust’s officers following procedures approved by the Board of Trustees. Issuer specific events, market trends, bid/asked quotes of brokers and information providers and other market data may be reviewed in the course of making a good faith determination of a security’s fair value.
The Fund may invest in securities that are subject to interest rate risk, meaning the risk that the prices will generally fall as interest rates rise and, conversely, the prices will generally rise as interest rates fall. Specific securities differ in their sensitivity to changes in interest rates depending on their individual characteristics. Changes in interest rates may result in increased market volatility, which may affect the value and/or liquidity of certain Fund investments.
Valuations change in response to many factors including the historical and prospective earnings of the issuer, the value of the issuer’s assets, general economic conditions, interest rates, investor perceptions and market liquidity. Because of the inherent uncertainties of valuation, the values reflected in the financial statements may materially differ from the value received upon actual sale of those investments.
| B. | Securities Transactions and Investment Income — Securities transactions are accounted for on a trade date basis. Realized gains or losses on sales are computed on the basis of specific identification of the securities sold. Interest income (net of withholding tax, if any) is recorded on the accrual basis from settlement date. Dividend income (net of withholding tax, if any) is recorded on the ex-dividend date. |
The Fund may periodically participate in litigation related to Fund investments. As such, the Fund may receive proceeds from litigation settlements. Any proceeds received are included in the Statement of Operations as realized gain (loss) for investments no longer held and as unrealized gain (loss) for investments still held.
Brokerage commissions and mark ups are considered transaction costs and are recorded as an increase to the cost basis of securities purchased and/or a reduction of proceeds on a sale of securities. Such transaction costs are included in the determination of net realized and unrealized gain (loss) from investment securities reported in the Statement of Operations and the Statement of Changes in Net Assets and the net realized and unrealized gains (losses) on securities per share in the Financial Highlights. Transaction costs are included in the calculation of the Fund’s net asset value and, accordingly, they reduce the Fund’s total returns. These transaction costs are not considered operating expenses and are not reflected in net investment income reported in the Statement of Operations and the Statement of Changes in Net Assets, or the net investment income per share and the ratios of expenses and net investment income reported in the Financial Highlights, nor are they limited by any expense limitation arrangements between the Fund and the investment adviser.
The Fund allocates income and realized and unrealized capital gains and losses to a class based on the relative net assets of each class.
| C. | Country Determination — For the purposes of making investment selection decisions and presentation in the Schedule of Investments, the investment adviser may determine the country in which an issuer is located and/or credit risk exposure based on various factors. These factors include the laws of the country under which the issuer is organized, where the issuer maintains a principal office, the country in which the issuer derives 50% or more of its total revenues and the country that has the primary market for the issuer’s securities, as well as other criteria. Among the other criteria that may be evaluated for making this determination are the country in which the issuer maintains 50% or more of its assets, the type of security, financial guarantees and enhancements, the nature of the collateral and the sponsor organization. Country of issuer and/or credit risk exposure has been determined to be the United States of America, unless otherwise noted. |
26 Invesco Macro Long/Short Fund
| D. | Distributions — Distributions from net investment income and net realized capital gain, if any, are generally declared and paid annually and recorded on the ex-dividend date. The Fund may elect to treat a portion of the proceeds from redemptions as distributions for federal income tax purposes. |
| E. | Federal Income Taxes — The Fund intends to comply with the requirements of Subchapter M of the Internal Revenue Code of 1986, as amended (the “Internal Revenue Code”), necessary to qualify as a regulated investment company and to distribute substantially all of the Fund’s taxable earnings to shareholders. As such, the Fund will not be subject to federal income taxes on otherwise taxable income (including net realized capital gain) that is distributed to shareholders. Therefore, no provision for federal income taxes is recorded in the financial statements. |
The Fund recognizes the tax benefits of uncertain tax positions only when the position is more likely than not to be sustained. Management has analyzed the Fund’s uncertain tax positions and concluded that no liability for unrecognized tax benefits should be recorded related to uncertain tax positions. Management is not aware of any tax positions for which it is reasonably possible that the total amounts of unrecognized tax benefits will change materially in the next 12 months.
The Fund files tax returns in the U.S. Federal jurisdiction and certain other jurisdictions. Generally, the Fund is subject to examinations by such taxing authorities for up to three years after the filing of the return for the tax period.
| F. | Expenses — Fees provided for under the Rule 12b-1 plan of a particular class of the Fund are charged to the operations of such class. Transfer agency fees and expenses and other shareholder recordkeeping fees and expenses attributable to Class R5 and Class R6 are allocated to each share class based on relative net assets. Sub-accounting fees attributable to Class R5 are charged to the operations of the class. Transfer agency fees and expenses and other shareholder recordkeeping fees and expenses relating to all other classes are allocated among those classes based on relative net assets. All other expenses are allocated among the classes based on relative net assets. |
| G. | Accounting Estimates — The preparation of financial statements in conformity with accounting principles generally accepted in the United States of America (“GAAP”) requires management to make estimates and assumptions that affect the reported amounts of assets and liabilities at the date of the financial statements and the reported amounts of revenues and expenses during the reporting period including estimates and assumptions related to taxation. Actual results could differ from those estimates by a significant amount. In addition, the Fund monitors for material events or transactions that may occur or become known after the period-end date and before the date the financial statements are released to print. |
| H. | Indemnifications — Under the Trust’s organizational documents, each Trustee, officer, employee or other agent of the Trust is indemnified against certain liabilities that may arise out of the performance of their duties to the Fund. Additionally, in the normal course of business, the Fund enters into contracts, including the Fund’s servicing agreements, that contain a variety of indemnification clauses. The Fund’s maximum exposure under these arrangements is unknown as this would involve future claims that may be made against the Fund that have not yet occurred. The risk of material loss as a result of such indemnification claims is considered remote. |
| I. | Foreign Currency Translations — Foreign currency is valued at the close of the NYSE based on quotations posted by banks and major currency dealers. Portfolio securities and other assets and liabilities denominated in foreign currencies are translated into U.S. dollar amounts at date of valuation. Purchases and sales of portfolio securities (net of foreign taxes withheld on disposition) and income items denominated in foreign currencies are translated into U.S. dollar amounts on the respective dates of such transactions. The Fund does not separately account for the portion of the results of operations resulting from changes in foreign exchange rates on investments and the fluctuations arising from changes in market prices of securities held. The combined results of changes in foreign exchange rates and the fluctuation of market prices on investments (net of estimated foreign tax withholding) are included with the net realized and unrealized gain or loss from investments in the Statement of Operations. Reported net realized foreign currency gains or losses arise from (1) sales of foreign currencies, (2) currency gains or losses realized between the trade and settlement dates on securities transactions, and (3) the difference between the amounts of dividends, interest, and foreign withholding taxes recorded on the Fund’s books and the U.S. dollar equivalent of the amounts actually received or paid. Net unrealized foreign currency gains and losses arise from changes in the fair values of assets and liabilities, other than investments in securities at fiscal period end, resulting from changes in exchange rates. |
The Fund may invest in foreign securities, which may be subject to foreign taxes on income, gains on investments or currency repatriation, a portion of which may be recoverable. Foreign taxes, if any, are recorded based on the tax regulations and rates that exist in the foreign markets in which the Fund invests and are shown in the Statement of Operations.
| J. | Forward Foreign Currency Contracts — The Fund may engage in foreign currency transactions either on a spot (i.e. for prompt delivery and settlement) basis, or through forward foreign currency contracts, to manage or minimize currency or exchange rate risk. |
The Fund may also enter into forward foreign currency contracts for the purchase or sale of a security denominated in a foreign currency in order to “lock in” the U.S. dollar price of that security, or the Fund may also enter into forward foreign currency contracts that do not provide for physical settlement of the two currencies, but instead are settled by a single cash payment calculated as the difference between the agreed upon exchange rate and the spot rate at settlement based upon an agreed upon notional amount (non-deliverable forwards). The Fund will set aside liquid assets in an amount equal to daily mark-to-market obligation for forward foreign currency contracts.
A forward foreign currency contract is an obligation between two parties (“Counterparties”) to purchase or sell a specific currency for an agreed-upon price at a future date. The use of forward foreign currency contracts does not eliminate fluctuations in the price of the underlying securities the Fund owns or intends to acquire but establishes a rate of exchange in advance. Fluctuations in the value of these contracts are measured by the difference in the contract date and reporting date exchange rates and are recorded as unrealized appreciation (depreciation) until the contracts are closed. When the contracts are closed, realized gains (losses) are recorded. Realized and unrealized gains (losses) on the contracts are included in the Statement of Operations. The primary risks associated with forward foreign currency contracts include failure of the Counterparty to meet the terms of the contract and the value of the foreign currency changing unfavorably. These risks may be in excess of the amounts reflected in the Statement of Assets and Liabilities.
| K. | Futures Contracts — The Fund may enter into futures contracts to manage exposure to interest rate, equity and market price movements and/or currency risks. A futures contract is an agreement between Counterparties to purchase or sell a specified underlying security, currency or commodity (or delivery of a cash settlement price, in the case of an index future) for a fixed price at a future date. The Fund currently invests only in exchange-traded futures and they are standardized as to maturity date and underlying financial instrument. Initial margin deposits required upon entering into futures contracts are satisfied by the segregation of specific securities or cash as collateral at the futures commission |
27 Invesco Macro Long/Short Fund
| | merchant (broker). During the period the futures contracts are open, changes in the value of the contracts are recognized as unrealized gains or losses by recalculating the value of the contracts on a daily basis. Subsequent or variation margin payments are received or made depending upon whether unrealized gains or losses are incurred. These amounts are reflected as receivables or payables on the Statement of Assets and Liabilities. When the contracts are closed or expire, the Fund recognizes a realized gain or loss equal to the difference between the proceeds from, or cost of, the closing transaction and the Fund’s basis in the contract. The net realized gain (loss) and the change in unrealized gain (loss) on futures contracts held during the period is included on the Statement of Operations. The primary risks associated with futures contracts are market risk and the absence of a liquid secondary market. If the Fund were unable to liquidate a futures contract and/or enter into an offsetting closing transaction, the Fund would continue to be subject to market risk with respect to the value of the contracts and continue to be required to maintain the margin deposits on the futures contracts. Futures contracts have minimal Counterparty risk since the exchange’s clearinghouse, as Counterparty to all exchange-traded futures, guarantees the futures against default. Risks may exceed amounts recognized in the Statement of Assets and Liabilities. |
| L. | Swap Agreements — The Fund may enter into various swap transactions, including interest rate, total return, index, currency and credit default swap contracts (“CDS”) for investment purposes or to manage interest rate, currency or credit risk. Such transactions are agreements between Counterparties. These agreements may contain among other conditions, events of default and termination events, and various covenants and representations such as provisions that require the Fund to maintain a pre-determined level of net assets, and/or provide limits regarding the decline of the Fund’s NAV over specific periods of time. If the Fund were to trigger such provisions and have open derivative positions at that time, the Counterparty may be able to terminate such agreement and request immediate payment in an amount equal to the net liability positions, if any. |
Interest rate, total return, index, and currency swap agreements are two-party contracts entered into primarily to exchange the returns (or differentials in rates of returns) earned or realized on particular predetermined investments or instruments. The gross returns to be exchanged or “swapped” between the parties are calculated with respect to a notional amount, i.e., the return on or increase in value of a particular dollar amount invested at a particular interest rate or return of an underlying asset, in a particular foreign currency, or in a “basket” of securities representing a particular index. At the maturity date, a net cash flow is exchanged where the total return is equivalent to the return of the underlying reference less a financing rate, if any. As a receiver, the Fund would receive payments based on any positive total return and would owe payments in the event of a negative total return. As the payer, the Fund would owe payments on any net positive total return, and would receive payment in the event of a negative total return.
Changes in the value of swap agreements are recognized as unrealized gains (losses) in the Statement of Operations by “marking to market” on a daily basis to reflect the value of the swap agreement at the end of each trading day. Payments received or paid at the beginning of the agreement are reflected as such on the Statement of Assets and Liabilities and may be referred to as upfront payments. The Fund accrues for the fixed payment stream and amortizes upfront payments, if any, on swap agreements on a daily basis with the net amount, recorded as a component of realized gain (loss) on the Statement of Operations. A liquidation payment received or made at the termination of a swap agreement is recorded as realized gain (loss) on the Statement of Operations. The Fund segregates liquid securities having a value at least equal to the amount of the potential obligation of a Fund under any swap transaction. Entering into these agreements involves, to varying degrees, lack of liquidity and elements of credit, market, and Counterparty risk in excess of amounts recognized on the Statement of Assets and Liabilities. Such risks involve the possibility that a swap is difficult to sell or liquidate; the Counterparty does not honor its obligations under the agreement and unfavorable interest rates and market fluctuations. It is possible that developments in the swaps market, including potential government regulation, could adversely affect the Fund’s ability to terminate existing swap agreements or to realize amounts to be received under such agreements. A short position in a security poses more risk than holding the same security long. As there is no limit on how much the price of the security can increase, the Fund’s exposure is unlimited.
| M. | Leverage Risk — Leverage exists when the Fund can lose more than it originally invests because it purchases or sells an instrument or enters into a transaction without investing an amount equal to the full economic exposure of the instrument or transaction. |
| N. | Collateral — To the extent the Fund has designated or segregated a security as collateral and that security is subsequently sold, it is the Fund’s practice to replace such collateral no later than the next business day. |
NOTE 2—Advisory Fees and Other Fees Paid to Affiliates
The Trust has entered into a master investment advisory agreement with Invesco Advisers, Inc. (the “Adviser” or “Invesco”). Under the terms of the investment advisory agreement, the Fund pays an advisory fee to the Adviser based on the annual rate of the Fund’s average daily net assets as follows:
| | | | |
| Average Daily Net Assets | | Rate | |
First $10 billion | | | 1.25% | |
Over $10 billion | | | 1.15% | |
For the year ended October 31, 2015, the effective advisory fees incurred by the Fund was 1.25%.
Under the terms of a master sub-advisory agreement between the Adviser and each of Invesco Asset Management Deutschland GmbH, Invesco Asset Management Limited, Invesco Asset Management (Japan) Limited, Invesco Hong Kong Limited, Invesco Senior Secured Management, Inc., Invesco Canada Ltd. and Invesco PowerShares Capital Management LLC (collectively, the “Affiliated Sub-Advisers”) the Adviser, not the Fund, may pay 40% of the fees paid to the Adviser to any such Affiliated Sub-Adviser(s) that provide(s) discretionary investment management services to the Fund based on the percentage of assets allocated to such Affiliated Sub-Adviser(s).
The Adviser has contractually agreed, through at least February 28, 2017, to waive advisory fees and/or reimburse expenses to the extent necessary to limit total annual fund operating expenses after fee waiver and/or expense reimbursement (excluding certain items discussed below) of Class A, Class C, Class R, Class Y, Class R5 and Class R6 shares to 1.87%, 2.62%, 2.12%, 1.62%, 1.62% and 1.62% of average daily net assets, respectively. In determining the Adviser’s obligation to waive advisory fees and/or reimburse expenses, the following expenses are not taken into account, and could cause total annual fund operating expenses after fee waiver and/or expense reimbursement to exceed the numbers reflected
28 Invesco Macro Long/Short Fund
above: (1) interest; (2) taxes; (3) dividend expense on short sales; (4) extraordinary or non-routine items, including litigation expenses; and (5) expenses that the Fund has incurred but did not actually pay because of an expense offset arrangement. Unless Invesco continues the fee waiver agreement, it will terminate on February 28, 2017. The fee waiver agreement cannot be terminated during its term.
Further, the Adviser has contractually agreed, through at least June 30, 2017, to waive the advisory fee payable by the Fund in an amount equal to 100% of the net advisory fees the Adviser receives from the affiliated money market funds on investments by the Fund of uninvested cash in such affiliated money market funds.
For the year ended October 31, 2015, the Adviser waived advisory fees and reimbursed fund level expenses of $518,965 and reimbursed class level expenses of $1,571, $6, $2, $1,679, $60 and $59 of Class A, Class C, Class R, Class Y, Class R5 and Class R6 shares, respectively.
The Trust has entered into a master administrative services agreement with Invesco pursuant to which the Fund has agreed to pay Invesco for certain administrative costs incurred in providing accounting services to the Fund. For the year ended October 31, 2015, expenses incurred under the agreement are shown in the Statement of Operations as Administrative services fees.
The Trust has entered into a transfer agency and service agreement with Invesco Investment Services, Inc. (“IIS”) pursuant to which the Fund has agreed to pay IIS a fee for providing transfer agency and shareholder services to the Fund and reimburse IIS for certain expenses incurred by IIS in the course of providing such services. IIS may make payments to intermediaries that provide omnibus account services, sub-accounting services and/or networking services. All fees payable by IIS to intermediaries that provide omnibus account services or sub-accounting are charged back to the Fund, subject to certain limitations approved by the Trust’s Board of Trustees. For the year ended October 31, 2015, expenses incurred under the agreement are shown in the Statement of Operations as Transfer agent fees.
The Trust has entered into master distribution agreements with Invesco Distributors, Inc. (“IDI”) to serve as the distributor for the Class A, Class C, Class R, Class Y, Class R5 and Class R6 shares of the Fund. The Trust has adopted plans pursuant to Rule 12b-1 under the 1940 Act with respect to the Fund’s Class A, Class C and Class R shares (collectively the “Plans”). The Fund, pursuant to the Plans, pays IDI compensation at the annual rate of 0.25% of the Fund’s average daily net assets of Class A shares, 1.00% of the average daily net assets of Class C shares and 0.50% of the average daily net assets of Class R shares. Of the Plan payments, up to 0.25% of the average daily net assets of each class of shares may be paid to furnish continuing personal shareholder services to customers who purchase and own shares of such classes. Any amounts not paid as a service fee under the Plans would constitute an asset-based sales charge. Rules of the Financial Industry Regulatory Authority (“FINRA”) impose a cap on the total sales charges, including asset-based sales charges that may be paid by any class of shares of the Fund. For the year ended October 31, 2015, expenses incurred under the Plans are shown in the Statement of Operations as Distribution fees.
Front-end sales commissions and CDSC (collectively, the “sales charges”) are not recorded as expenses of the Fund. Front-end sales commissions are deducted from proceeds from the sales of Fund shares prior to investment in Class A shares of the Fund. CDSC are deducted from redemption proceeds prior to remittance to the shareholder. During the year ended October 31, 2015, IDI advised the Fund that IDI retained $158 in front-end sales commissions from the sale of Class A shares and $543 from Class C shares, for CDSC imposed upon redemptions by shareholders.
Certain officers and trustees of the Trust are officers and directors of the Adviser, IIS and/or IDI.
NOTE 3—Additional Valuation Information
GAAP defines fair value as the price that would be received to sell an asset or paid to transfer a liability in an orderly transaction between market participants at the measurement date, under current market conditions. GAAP establishes a hierarchy that prioritizes the inputs to valuation methods, giving the highest priority to readily available unadjusted quoted prices in an active market for identical assets (Level 1) and the lowest priority to significant unobservable inputs (Level 3), generally when market prices are not readily available or are unreliable. Based on the valuation inputs, the securities or other investments are tiered into one of three levels. Changes in valuation methods may result in transfers in or out of an investment’s assigned level:
| | Level 1 — | Prices are determined using quoted prices in an active market for identical assets. |
| | Level 2 — | Prices are determined using other significant observable inputs. Observable inputs are inputs that other market participants may use in pricing a security. These may include quoted prices for similar securities, interest rates, prepayment speeds, credit risk, yield curves, loss severities, default rates, discount rates, volatilities and others. |
| | Level 3 — | Prices are determined using significant unobservable inputs. In situations where quoted prices or observable inputs are unavailable (for example, when there is little or no market activity for an investment at the end of the period), unobservable inputs may be used. Unobservable inputs reflect the Fund’s own assumptions about the factors market participants would use in determining fair value of the securities or instruments and would be based on the best available information. |
The following is a summary of the tiered valuation input levels, as of October 31, 2015. The level assigned to the securities valuations may not be an indication of the risk or liquidity associated with investing in those securities. Because of the inherent uncertainties of valuation, the values reflected in the financial statements may materially differ from the value received upon actual sale of those investments.
29 Invesco Macro Long/Short Fund
During the year ended October 31, 2015, there were transfers from Level 1 to Level 2 of $962,023 and from Level 2 to Level 1 of $833,891, due to foreign fair value adjustments.
| | | | | | | | | | | | | | | | |
| | | Level 1 | | | Level 2 | | | Level 3 | | | Total | |
Australia | | $ | 584,514 | | | $ | 233,032 | | | $ | — | | | $ | 817,546 | |
Austria | | | 7,063 | | | | 7,672 | | | | — | | | | 14,735 | |
Belgium | | | — | | | | 44,905 | | | | — | | | | 44,905 | |
Brazil | | | 60,620 | | | | — | | | | — | | | | 60,620 | |
Chile | | | 82,940 | | | | — | | | | — | | | | 82,940 | |
China | | | 7,762 | | | | 105,118 | | | | — | | | | 112,880 | |
Colombia | | | 15,738 | | | | — | | | | — | | | | 15,738 | |
Czech Republic | | | — | | | | 14,085 | | | | — | | | | 14,085 | |
Denmark | | | 19,753 | | | | 50,709 | | | | — | | | | 70,462 | |
Egypt | | | 7,724 | | | | — | | | | — | | | | 7,724 | |
Finland | | | — | | | | 46,382 | | | | — | | | | 46,382 | |
France | | | 94,453 | | | | 266,737 | | | | — | | | | 361,190 | |
Germany | | | 246,204 | | | | 21,820 | | | | — | | | | 268,024 | |
Hong Kong | | | 17,496 | | | | 428,276 | | | | — | | | | 445,772 | |
Hungary | | | 13,943 | | | | — | | | | — | | | | 13,943 | |
India | | | 28,960 | | | | — | | | | — | | | | 28,960 | |
Indonesia | | | — | | | | 38,918 | | | | — | | | | 38,918 | |
Ireland | | | 14,833 | | | | 64,006 | | | | — | | | | 78,839 | |
Italy | | | 45,030 | | | | 45,703 | | | | — | | | | 90,733 | |
Japan | | | — | | | | 1,619,953 | | | | — | | | | 1,619,953 | |
Luxembourg | | | — | | | | 12,164 | | | | — | | | | 12,164 | |
Macau | | | — | | | | 13,962 | | | | — | | | | 13,962 | |
Malaysia | | | 84,753 | | | | 121,154 | | | | — | | | | 205,907 | |
Mexico | | | 140,504 | | | | — | | | | — | | | | 140,504 | |
Netherlands | | | 6,650 | | | | 91,170 | | | | — | | | | 97,820 | |
New Zealand | | | 27,019 | | | | 70,102 | | | | — | | | | 97,121 | |
Norway | | | 22,372 | | | | 29,739 | | | | — | | | | 52,111 | |
Philippines | | | 8,487 | | | | 75,255 | | | | — | | | | 83,742 | |
Poland | | | 11,021 | | | | 25,697 | | | | — | | | | 36,718 | |
Portugal | | | — | | | | 7,730 | | | | — | | | | 7,730 | |
Qatar | | | 14,872 | | | | — | | | | — | | | | 14,872 | |
Singapore | | | 86,979 | | | | 146,247 | | | | — | | | | 233,226 | |
South Africa | | | 75,126 | | | | 93,311 | | | | — | | | | 168,437 | |
South Korea | | | 28,831 | | | | 47,263 | | | | — | | | | 76,094 | |
Spain | | | 105,674 | | | | 28,521 | | | | — | | | | 134,195 | |
Sweden | | | 30,898 | | | | 128,568 | | | | — | | | | 159,466 | |
Switzerland | | | 6,895 | | | | 280,318 | | | | — | | | | 287,213 | |
Taiwan | | | 7,056 | | | | 372,542 | | | | — | | | | 379,598 | |
Thailand | | | 28,723 | | | | 102,366 | | | | — | | | | 131,089 | |
Turkey | | | 56,565 | | | | 15,446 | | | | — | | | | 72,011 | |
United Kingdom | | | 114,896 | | | | 1,400,577 | | | | — | | | | 1,515,473 | |
United States | | | 4,915,546 | | | | 7,323 | | | | — | | | | 4,922,869 | |
| | | | 7,019,900 | | | | 6,056,771 | | | | — | | | | 13,076,671 | |
Forward Foreign Currency Contracts* | | | — | | | | (33,194 | ) | | | — | | | | (33,194 | ) |
Futures Contracts* | | | (79,391 | ) | | | — | | | | — | | | | (79,391 | ) |
Swap Agreements* | | | — | | | | (2,793 | ) | | | — | | | | (2,793 | ) |
Total Investments | | $ | 6,940,509 | | | $ | 6,020,784 | | | $ | — | | | $ | 12,961,293 | |
| * | Unrealized appreciation (depreciation). |
30 Invesco Macro Long/Short Fund
NOTE 4—Derivative Investments
Value of Derivative Investments at Period-End
The table below summarizes the value of the Fund’s derivative investments, detailed by primary risk exposure, held as of October 31, 2015:
| | | | | | | | |
| | | Value | |
| Risk Exposure/Derivative Type | | Assets | | | Liabilities | |
Currency risk: | | | | | | | | |
Forward foreign currency contracts(a) | | $ | 35,083 | | | $ | (68,277 | ) |
Equity risk: | | | | | | | | |
Futures contracts(b) | | | 215,185 | | | | (294,576 | ) |
Swap contracts(c) | | | | | | | (2,793 | ) |
Total | | $ | 250,268 | | | $ | (365,646 | ) |
| (a) | Values are disclosed on the Statement of Assets and Liabilities under the captions Unrealized appreciation on forward foreign currency contracts outstanding and Unrealized depreciation on forward foreign currency contracts outstanding. |
| (b) | Includes cumulative appreciation (depreciation) of futures contracts. Only current day’s variation margin receivable is reported within the Statement of Assets and Liabilities. |
| (c) | Values are disclosed on the Statement of Assets and Liabilities under the caption Unrealized depreciation on swap transactions — OTC. |
Effect of Derivative Investments for the year ended October 31, 2015
The table below summarizes the gains (losses) on derivative investments, detailed by primary risk exposure, recognized in earnings during the period:
| | | | | | | | | | | | |
| | | Location of Gain (Loss) on
Statement of Operations | |
| | | Futures
Contracts | | | Forward Foreign Currency
Contracts | | | Swap
Agreements | |
Realized Gain (Loss): | | | | | | | | | | | | |
Currency risk | | $ | — | | | $ | 558,302 | | | $ | — | |
Equity risk | | | (486,975 | ) | | | — | | | | (3,317 | ) |
Change in Net Unrealized Appreciation (Depreciation): | | | | | | | | | | | | |
Currency risk | | | — | | | | (58,310 | ) | | | — | |
Equity risk | | | 106,333 | | | | — | | | | (1,912 | ) |
Total | | $ | (380,642 | ) | | $ | 499,992 | | | $ | (5,229 | ) |
The table below summarizes the average notional value of forward foreign currency contracts, futures contracts, and swap agreements outstanding during the period.
| | | | | | | | | | | | |
| | | Futures
Contracts | | | Forward Foreign
Currency
Contracts | | | Swap
Agreements | |
Average notional value | | $ | 10,971,050 | | | $ | 5,877,889 | | | $ | 186,004 | |
31 Invesco Macro Long/Short Fund
| | | | | | | | | | | | | | | | | | | | | | | | | | |
| Open Forward Foreign Currency Contracts | |
Settlement
Date | | Counterparty | | Contract to | | | Notional
Value | | | Unrealized
Appreciation
(Depreciation) | |
| | | Deliver | | | Receive | | | |
11/20/15 | | Canadian Imperial Bank of Commerce | | | AUD | | | | 1,060,000 | | | | USD | | | | 768,372 | | | $ | 755,106 | | | $ | 13,266 | |
11/20/15 | | Canadian Imperial Bank of Commerce | | | CHF | | | | 230,000 | | | | USD | | | | 233,446 | | | | 232,863 | | | | 583 | |
11/20/15 | | Canadian Imperial Bank of Commerce | | | EUR | | | | 1,080,000 | | | | USD | | | | 1,193,054 | | | | 1,188,024 | | | | 5,030 | |
11/20/15 | | Canadian Imperial Bank of Commerce | | | GBP | | | | 1,050,000 | | | | USD | | | | 1,633,049 | | | | 1,618,651 | | | | 14,398 | |
11/20/15 | | Canadian Imperial Bank of Commerce | | | JPY | | | | 200,500,000 | | | | USD | | | | 1,604,768 | | | | 1,661,908 | | | | (57,140 | ) |
11/20/15 | | Canadian Imperial Bank of Commerce | | | NOK | | | | 420,000 | | | | USD | | | | 50,622 | | | | 49,416 | | | | 1,206 | |
11/20/15 | | Canadian Imperial Bank of Commerce | | | NZD | | | | 140,000 | | | | USD | | | | 90,499 | | | | 94,655 | | | | (4,156 | ) |
11/20/15 | | Canadian Imperial Bank of Commerce | | | SEK | | | | 1,360,000 | | | | USD | | | | 157,185 | | | | 159,281 | | | | (2,096 | ) |
11/20/15 | | Canadian Imperial Bank of Commerce | | | SGD | | | | 370,000 | | | | USD | | | | 262,742 | | | | 263,928 | | | | (1,186 | ) |
11/20/15 | | Canadian Imperial Bank of Commerce | | | USD | | | | 7,047 | | | | AUD | | | | 10,000 | | | | 7,123 | | | | 76 | |
11/20/15 | | Canadian Imperial Bank of Commerce | | | USD | | | | 20,814 | | | | CHF | | | | 20,000 | | | | 20,249 | | | | (565 | ) |
11/20/15 | | Canadian Imperial Bank of Commerce | | | USD | | | | 90,067 | | | | EUR | | | | 80,000 | | | | 88,002 | | | | (2,065 | ) |
11/20/15 | | Canadian Imperial Bank of Commerce | | | USD | | | | 61,219 | | | | GBP | | | | 40,000 | | | | 61,663 | | | | 444 | |
11/20/15 | | Canadian Imperial Bank of Commerce | | | USD | | | | 133,468 | | | | JPY | | | | 16,000,000 | | | | 132,621 | | | | (847 | ) |
11/20/15 | | Canadian Imperial Bank of Commerce | | | USD | | | | 6,013 | | | | NOK | | | | 50,000 | | | | 5,883 | | | | (130 | ) |
11/20/15 | | Canadian Imperial Bank of Commerce | | | USD | | | | 8,290 | | | | SEK | | | | 70,000 | | | | 8,198 | | | | (92 | ) |
11/20/15 | | Canadian Imperial Bank of Commerce | | | USD | | | | 7,053 | | | | SGD | | | | 10,000 | | | | 7,133 | | | | 80 | |
Total Forward Foreign Currency Contracts — Currency Risk | | | $ | (33,194 | ) |
Currency Abbreviations:
| | |
| AUD | | – Australian Dollar |
| CHF | | – Swiss Franc |
| EUR | | – Euro |
| GBP | | – British Pound Sterling |
| | |
| JPY | | – Japanese Yen |
| NOK | | – Norwegian Krone |
| NZD | | – New Zealand Dollar |
| | |
| SEK | | – Swedish Krona |
| SGD | | – Singapore Dollar |
| USD | | – U.S. Dollar |
| | | | | | | | | | | | | | | | | | | | |
| Open Futures Contracts(a) | |
| Futures Contracts | | Type of Contract | | | Number of Contracts | | | Expiration Month | | | Notional Value | | | Unrealized Appreciation (Depreciation) | |
Dow Jones EURO STOXX 50 Index | | | Short | | | | 21 | | | | December-2015 | | | $ | (785,879 | ) | | $ | (40,227 | ) |
E-Mini S&P 500 Index | | | Short | | | | 9 | | | | December-2015 | | | | (933,165 | ) | | | (63,333 | ) |
FTSE 100 Index | | | Long | | | | 6 | | | | December-2015 | | | | 584,651 | | | | 22,853 | |
FTSE 100 Index | | | Short | | | | 9 | | | | December-2015 | | | | (876,976 | ) | | | (22,792 | ) |
Hang Seng Index | | | Short | | | | 2 | | | | November-2015 | | | | (292,674 | ) | | | 5,026 | |
Hang Seng Index | | | Long | | | | 4 | | | | November-2015 | | | | 585,348 | | | | (8,170 | ) |
Mini MSCI Emerging Markets Asia Index | | | Long | | | | 25 | | | | December-2015 | | | | 1,054,625 | | | | 58,289 | |
Mini MSCI Emerging Markets Asia Index | | | Short | | | | 22 | | | | December-2015 | | | | (928,070 | ) | | | (50,645 | ) |
MSCI Singapore Index | | | Short | | | | 2 | | | | November-2015 | | | | (95,767 | ) | | | 3,048 | |
Russell 2000 Mini Index | | | Long | | | | 10 | | | | December-2015 | | | | 1,158,300 | | | | 50,052 | |
Russell 2000 Mini Index | | | Short | | | | 8 | | | | December-2015 | | | | (926,640 | ) | | | (10,856 | ) |
SPI 200 Index | | | Short | | | | 6 | | | | December-2015 | | | | (560,069 | ) | | | (20,264 | ) |
Tokyo Stock Price Index | | | Long | | | | 7 | | | | December-2015 | | | | 904,077 | | | | 75,917 | |
Tokyo Stock Price Index | | | Short | | | | 7 | | | | December-2015 | | | | (904,077 | ) | | | (78,289 | ) |
Total Futures Contracts – Equity Risk | | | | | | | | | | | | | | | | | | $ | (79,391 | ) |
| (a) | Futures collateralized by $735,000 cash held with Goldman, Sachs International, the futures commission merchant. |
| | | | | | | | | | | | | | | | | | | | | | | | |
| Open Over-The-Counter Total Return Swap Agreements – Equity Risk | |
| Swap Agreements | | Type of
Contract | | | Counterparty | | | Number of
Contracts | | | Termination
Date | | | Notional
Value | | | Unrealized
Appreciation
(Depreciation) | |
Pay a return equal to Swiss Market Index Futures multiplied by the Notional Value | | | Short | | |
| Goldman Sachs
International |
| | | 2 | | | | December-2015 | | | $ | (180,755 | ) | | $ | (2,793 | ) |
32 Invesco Macro Long/Short Fund
Offsetting Assets and Liabilities
Accounting Standards Update (“ASU”) No. 2011-11, Disclosures about Offsetting Assets and Liabilities, which was subsequently clarified in Financial Accounting Standards Board ASU 2013-01 “Clarifying the Scope of Disclosures about Offsetting Assets and Liabilities” is intended to enhance disclosures about financial instruments and derivative instruments that are subject to offsetting arrangements on the Statement of Assets and Liabilities and to enable investors to better understand the effect of those arrangements on the Fund’s financial position. In order for an arrangement to be eligible for netting, the Fund must have a basis to conclude that such netting arrangements are legally enforceable. The Fund enters into netting agreements and collateral agreements in an attempt to reduce the Fund’s Counterparty credit risk by providing for a single net settlement with a Counterparty of all financial transactions covered by the agreement in an event of default as defined under such agreement.
The following tables present derivative instruments that are either subject to an enforceable netting agreement or offset by collateral arrangements as of October 31, 2015.
| | | | | | | | | | | | | | | | | | | | |
Counterparty | | Gross amounts
of Recognized Assets | | | Gross Amounts Not Offset in the
Statement of Assets and Liabilities | | | Net Amount | |
| | | Financial
Instruments | | | Collateral Received | | |
| | | | Non-Cash | | | Cash | | |
Canadian Imperial Bank of Commerce(a) | | $ | 35,083 | | | $ | (35,083 | ) | | $ | — | | | $ | — | | | $ | — | |
| | | | | |
| | | | | | | | | | | | | | | | | | | | |
Counterparty | | Gross amounts of Recognized Liabilities | | | Gross Amounts Not Offset in the
Statement of Assets and Liabilities | | | Net Amount | |
| | | Financial
Instruments | | | Collateral Pledged | | |
| | | | Non-Cash | | | Cash | | |
Canadian Imperial Bank of Commerce(a) | | $ | 68,277 | | | $ | (35,083 | ) | | $ | — | | | $ | — | | | $ | 33,194 | |
Goldman Sachs International(b) | | | 2,793 | | | | — | | | | — | | | | — | | | | 2,793 | |
Total | | $ | 71,070 | | | $ | (35,083 | ) | | $ | — | | | $ | — | | | $ | 35,987 | |
| (a) | Forward foreign currency contracts Counterparty. |
| (b) | Swap agreements — OTC Counterparty. |
NOTE 5—Trustees’ and Officers’ Fees and Benefits
Trustees’ and Officers’ Fees and Benefits include amounts accrued by the Fund to pay remuneration to certain Trustees and Officers of the Fund. Trustees have the option to defer compensation payable by the Fund, and Trustees’ and Officers’ Fees and Benefits also include amounts accrued by the Fund to fund such deferred compensation amounts. Those Trustees who defer compensation have the option to select various Invesco Funds in which their deferral accounts shall be deemed to be invested. Obligations under the deferred compensation plan represent unsecured claims against the general assets of the Fund.
NOTE 6—Cash Balances
The Fund is permitted to temporarily carry a negative or overdrawn balance in its account with State Street Bank and Trust Company, the custodian bank. Such balances, if any at period end, are shown in the Statement of Assets and Liabilities under the payable caption Amount due custodian. To compensate the custodian bank for such overdrafts, the overdrawn Fund may either (1) leave funds as a compensating balance in the account so the custodian bank can be compensated by earning the additional interest; or (2) compensate by paying the custodian bank at a rate agreed upon by the custodian bank and Invesco, not to exceed the contractually agreed upon rate.
33 Invesco Macro Long/Short Fund
NOTE 7—Distributions to Shareholders and Tax Components of Net Assets
Tax Character of Distributions to Shareholders Paid During the Fiscal Year Ended October 31, 2015 and the period December 17, 2013 (commencement date) through October 31, 2014:
| | | | | | | | |
| | | 2015 | | | 2014 | |
Ordinary income | | $ | 160,186 | | | $ | — | |
Tax Components of Net Assets at Period-End:
| | | | |
| | | 2015 | |
Undistributed ordinary income | | $ | 228,342 | |
Undistributed long-term gain | | | 46,203 | |
Net unrealized appreciation (depreciation) — investments | | | (192,838 | ) |
Net unrealized appreciation (depreciation) — other investments | | | (31,456 | ) |
Temporary book/tax differences | | | (479,583 | ) |
Shares of beneficial interest | | | 14,265,521 | |
Total net assets | | $ | 13,836,189 | |
The difference between book-basis and tax-basis unrealized appreciation (depreciation) is due to differences in the timing of recognition of gains and losses on investments for tax and book purposes. The Fund’s net unrealized appreciation (depreciation) difference is attributable primarily to wash sales and passive foreign investment companies.
The temporary book/tax differences are a result of timing differences between book and tax recognition of income and/or expenses. The Fund’s temporary book/tax differences are the result of the trustee deferral of compensation and retirement plan benefits and passive foreign investment companies.
Capital loss carryforward is calculated and reported as of a specific date. Results of transactions and other activity after that date may affect the amount of capital loss carryforward actually available for the Fund to utilize. The ability to utilize capital loss carryforward in the future may be limited under the Internal Revenue Code and related regulations based on the results of future transactions.
The Fund does not have a capital loss carryforward as of October 31, 2015.
NOTE 8—Investment Securities
The aggregate amount of investment securities (other than short-term securities, U.S. Treasury obligations and money market funds, if any) purchased and sold by the Fund during the year ended October 31, 2015 was $5,534,320 and $4,905,921, respectively. In a fund’s initial year of operations, the cost of investments for tax purposes will not reflect any tax adjustments until its fiscal year end reporting period.
| | | | |
| Unrealized Appreciation (Depreciation) of Investment Securities on a Tax Basis | |
Aggregate unrealized appreciation of investment securities | | $ | 905,255 | |
Aggregate unrealized (depreciation) of investment securities | | | (1,098,093 | ) |
Net unrealized appreciation (depreciation) of investment securities | | $ | (192,838 | ) |
Cost of investments for tax purposes is $13,269,509.
NOTE 9—Reclassification of Permanent Differences
Primarily as a result of differing book/tax treatment of foreign currency transactions and passive foreign investment companies, on October 31, 2015, undistributed net investment income was decreased by $7,383, undistributed net realized gain (loss) was increased by $7,569 and shares of beneficial interest was decreased by $186. This reclassification had no effect on the net assets of the Fund.
34 Invesco Macro Long/Short Fund
NOTE 10—Share Information
| | | | | | | | | | | | | | | | |
| | | Summary of Share Activity | |
| | | Year ended October 31, 2015(a) | | | December 17, 2013 (commencement date) through October 31, 2014 | |
Sold: | | | | | | | | | | | | | | | | |
Class A | | | 43,327 | | | $ | 415,185 | | | | 597,931 | | | $ | 5,981,144 | |
Class C | | | 1,013 | | | | 10,055 | | | | 6,688 | | | | 67,324 | |
Class R | | | — | | | | — | | | | 1,001 | | | | 10,010 | |
Class Y | | | 85,470 | | | | 848,088 | | | | 592,645 | | | | 5,926,023 | |
Class R5 | | | — | | | | — | | | | 123,628 | | | | 1,235,815 | |
Class R6 | | | 10,211 | | | | 100,649 | | | | 68,888 | | | | 688,322 | |
| | | | |
Issued as reinvestment of dividends: | | | | | | | | | | | | | | | | |
Class A | | | 73 | | | | 710 | | | | — | | | | — | |
Class R5 | | | 753 | | | | 7,327 | | | | — | | | | — | |
Class R6 | | | 89 | | | | 866 | | | | — | | | | — | |
| | | | |
Reacquired: | | | | | | | | | | | | | | | | |
Class A | | | (9,415 | ) | | | (92,580 | ) | | | (4,839 | ) | | | (49,301 | ) |
Class C | | | (5,542 | ) | | | (55,505 | ) | | | — | | | | — | |
Class Y | | | (7,474 | ) | | | (74,590 | ) | | | (8,644 | ) | | | (88,479 | ) |
Class R5 | | | (58,811 | ) | | | (579,292 | ) | | | (569 | ) | | | (5,858 | ) |
Class R6 | | | (3,694 | ) | | | (35,879 | ) | | | — | | | | — | |
Net increase in share activity | | | 56,000 | | | $ | 545,034 | | | | 1,376,729 | | | $ | 13,765,000 | |
| (a) | 95% of the outstanding shares of the Fund are owned by the Adviser or an affiliate of the Adviser. |
NOTE 11—Financial Highlights
The following schedule presents financial highlights for a share of the Fund outstanding throughout the periods indicated.
| | | | | | | | | | | | | | | | | | | | | | | | | | | | | | | | | | | | | | | | | | | | | | | | |
| | | Net asset
value,
beginning
of period | | | Net
investment
income (loss)(a) | | | Net gains
(losses) on securities (both
realized and
unrealized) | | | Total from
investment operations | | | Dividends
from net
investment income | | | Net asset
value, end
of period | | | Total
return(b) | | | Net assets,
end of period
(000’s omitted) | | | Ratio of
expenses
to average net assets
with fee waivers
and/or expenses absorbed | | | Ratio of
expenses
to average net assets without
fee waivers and/or expenses
absorbed | | | Ratio of net
investment
income (loss)
to average
net assets | | | Portfolio
turnover(c) | |
Class A | | | | | | | | | | | | | | | | | | | | | | | | | | | | | | | | | | | | | | | | | | | | | | | | |
Year ended 10/31/15 | | $ | 9.98 | | | $ | 0.04 | | | $ | (0.27 | ) | | $ | (0.23 | ) | | $ | (0.11 | ) | | $ | 9.64 | | | | (2.37 | )% | | $ | 6,048 | | | | 1.85 | %(e) | | | 5.62 | %(e) | | | 0.38 | %(e) | | | 45 | % |
Year ended 10/31/14(d) | | | 10.00 | | | | 0.04 | | | | (0.06 | ) | | | (0.02 | ) | | | — | | | | 9.98 | | | | (0.20 | ) | | | 5,921 | | | | 1.85 | (f) | | | 5.82 | (f) | | | 0.45 | (f) | | | 44 | |
Class C | | | | | | | | | | | | | | | | | | | | | | | | | | | | | | | | | | | | | | | | | | | | | | | | |
Year ended 10/31/15 | | | 9.92 | | | | (0.04 | ) | | | (0.27 | ) | | | (0.31 | ) | | | — | | | | 9.61 | | | | (3.13 | ) | | | 21 | | | | 2.60 | (e) | | | 6.37 | (e) | | | (0.37 | )(e) | | | 45 | |
Year ended 10/31/14(d) | | | 10.00 | | | | (0.03 | ) | | | (0.05 | ) | | | (0.08 | ) | | | — | | | | 9.92 | | | | (0.80 | ) | | | 66 | | | | 2.60 | (f) | | | 6.57 | (f) | | | (0.30 | )(f) | | | 44 | |
Class R | | | | | | | | | | | | | | | | | | | | | | | | | | | | | | | | | | | | | | | | | | | | | | | | |
Year ended 10/31/15 | | | 9.96 | | | | 0.01 | | | | (0.27 | ) | | | (0.26 | ) | | | (0.08 | ) | | | 9.62 | | | | (2.59 | ) | | | 10 | | | | 2.10 | (e) | | | 5.87 | (e) | | | 0.13 | (e) | | | 45 | |
Year ended 10/31/14(d) | | | 10.00 | | | | 0.02 | | | | (0.06 | ) | | | (0.04 | ) | | | — | | | | 9.96 | | | | (0.40 | ) | | | 10 | | | | 2.10 | (f) | | | 6.07 | (f) | | | 0.20 | (f) | | | 44 | |
Class Y | | | | | | | | | | | | | | | | | | | | | | | | | | | | | | | | | | | | | | | | | | | | | | | | |
Year ended 10/31/15 | | | 10.00 | | | | 0.06 | | | | (0.26 | ) | | | (0.20 | ) | | | (0.13 | ) | | | 9.67 | | | | (2.05 | ) | | | 6,400 | | | | 1.60 | (e) | | | 5.37 | (e) | | | 0.63 | (e) | | | 45 | |
Year ended 10/31/14(d) | | | 10.00 | | | | 0.06 | | | | (0.06 | ) | | | 0.00 | | | | — | | | | 10.00 | | | | 0.00 | | | | 5,843 | | | | 1.60 | (f) | | | 5.57 | (f) | | | 0.70 | (f) | | | 44 | |
Class R5 | | | | | | | | | | | | | | | | | | | | | | | | | | | | | | | | | | | | | | | | | | | | | | | | |
Year ended 10/31/15 | | | 10.01 | | | | 0.06 | | | | (0.27 | ) | | | (0.21 | ) | | | (0.13 | ) | | | 9.67 | | | | (2.14 | ) | | | 629 | | | | 1.60 | (e) | | | 5.36 | (e) | | | 0.63 | (e) | | | 45 | |
Year ended 10/31/14(d) | | | 10.00 | | | | 0.06 | | | | (0.05 | ) | | | 0.01 | | | | — | | | | 10.01 | | | | 0.10 | | | | 1,231 | | | | 1.60 | (f) | | | 5.54 | (f) | | | 0.70 | (f) | | | 44 | |
Class R6 | | | | | | | | | | | | | | | | | | | | | | | | | | | | | | | | | | | | | | | | | | | | | | | | |
Year ended 10/31/15 | | | 10.00 | | | | 0.06 | | | | (0.26 | ) | | | (0.20 | ) | | | (0.13 | ) | | | 9.67 | | | | (2.05 | ) | | | 730 | | | | 1.60 | (e) | | | 5.36 | (e) | | | 0.63 | (e) | | | 45 | |
Year ended 10/31/14(d) | | | 10.00 | | | | 0.06 | | | | (0.06 | ) | | | 0.00 | | | | — | | | | 10.00 | | | | 0.00 | | | | 689 | | | | 1.60 | (f) | | | 5.54 | (f) | | | 0.70 | (f) | | | 44 | |
| (a) | Calculated using average shares outstanding. |
| (b) | Includes adjustments in accordance with accounting principles generally accepted in the United States of America and as such, the net asset value for financial reporting purposes and the returns based upon those net asset values may differ from the net asset value and returns for shareholder transactions. Does not include sales charges and is not annualized for periods less than one year, if applicable. |
| (c) | Portfolio turnover is calculated at the fund level and is not annualized for periods less than one year, if applicable. |
| (d) | Commencement date of December 17, 2013. |
| (e) | Ratios are based on average daily net assets (000’s omitted) of $5,983, $26, $10, $6,394, $726 and $713 for Class A, Class C, Class R, Class Y, Class R5 and Class R6 shares, respectively. |
35 Invesco Macro Long/Short Fund
Report of Independent Registered Public Accounting Firm
To the Board of Trustees of AIM Investment Funds (Invesco Investment Funds)
and Shareholders of Invesco Macro Long/Short Fund:
In our opinion, the accompanying statement of assets and liabilities, including the schedule of investments, and the related statements of operations and of changes in net assets and the financial highlights present fairly, in all material respects, the financial position of Invesco Macro Long/Short Fund (one of the funds constituting AIM Investment Funds (Invesco Investment Funds), hereafter referred to as the “Fund”) at October 31, 2015, the results of its operations for the year then ended, the changes in its net assets and the financial highlights for the year then ended and for the period December 17, 2013 (commencement of operations) through October 31, 2014, in conformity with accounting principles generally accepted in the United States of America. These financial statements and financial highlights (hereafter referred to as “financial statements”) are the responsibility of the Fund’s management. Our responsibility is to express an opinion on these financial statements based on our audits. We conducted our audits of these financial statements in accordance with the standards of the Public Company Accounting Oversight Board (United States). Those standards require that we plan and perform the audit to obtain reasonable assurance about whether the financial statements are free of material misstatement. An audit includes examining, on a test basis, evidence supporting the amounts and disclosures in the financial statements, assessing the accounting principles used and significant estimates made by management, and evaluating the overall financial statement presentation. We believe that our audits, which included confirmation of securities at October 31, 2015 by correspondence with the custodian and brokers, provide a reasonable basis for our opinion.
PRICEWATERHOUSECOOPERS LLP
December 23, 2015
Houston, Texas
36 Invesco Macro Long/Short Fund
Calculating your ongoing Fund expenses
Example
As a shareholder of the Fund, you incur two types of costs: (1) transaction costs, which may include sales charges (loads) on purchase payments or contingent deferred sales charges on redemptions, if any; and (2) ongoing costs, including management fees, distribution and/or service (12b-1) fees, and other Fund expenses. This example is intended to help you understand your ongoing costs (in dollars) of investing in the Fund and to compare these costs with ongoing costs of investing in other mutual funds. The example is based on an investment of $1,000 invested at the beginning of the period and held for the entire period May 1, 2015 through October 31, 2015.
Actual expenses
The table below provides information about actual account values and actual expenses. You may use the information in this table, together with the amount you invested, to estimate the expenses that you paid over the period. Simply divide your account value by $1,000 (for example, an $8,600 account value divided by $1,000 = 8.6), then multiply the result by the number in the table under the heading entitled “Actual Expenses Paid During Period” to estimate the expenses you paid on your account during this period.
Hypothetical example for comparison purposes
The table below also provides information about hypothetical account values and hypothetical expenses based on the Fund’s actual expense ratio and an assumed rate of return of 5% per year before expenses, which is not the Fund’s actual return.
The hypothetical account values and expenses may not be used to estimate the actual ending account balance or expenses you paid for the period. You may use this information to compare the ongoing costs of investing in the Fund and other funds. To do so, compare this 5% hypothetical example with the 5% hypothetical examples that appear in the shareholder reports of the other funds.
Please note that the expenses shown in the table are meant to highlight your ongoing costs only and do not reflect any transaction costs, such as sales charges (loads) on purchase payments or contingent deferred sales charges on redemptions, if any. Therefore, the hypothetical information is useful in comparing ongoing costs only, and will not help you determine the relative total costs of owning different funds. In addition, if these transaction costs were included, your costs would have been higher.
| | | | | | | | | | | | | | | | | | | | | | | | |
| Class | | Beginning
Account Value (05/01/15) | | | ACTUAL | | | HYPOTHETICAL (5% annual return before
expenses) | | | Annualized
Expense
Ratio | |
| | | Ending
Account Value (10/31/15)1 | | | Expenses
Paid During Period2 | | | Ending
Account Value (10/31/15) | | | Expenses
Paid During Period2 | | |
| A | | $ | 1,000.00 | | | $ | 946.00 | | | $ | 9.07 | | | $ | 1,015.88 | | | $ | 9.40 | | | | 1.85 | % |
| C | | | 1,000.00 | | | | 942.00 | | | | 12.73 | | | | 1,012.10 | | | | 13.19 | | | | 2.60 | |
| R | | | 1,000.00 | | | | 945.00 | | | | 10.30 | | | | 1,014.62 | | | | 10.66 | | | | 2.10 | |
| Y | | | 1,000.00 | | | | 947.10 | | | | 7.85 | | | | 1,017.14 | | | | 8.13 | | | | 1.60 | |
| R5 | | | 1,000.00 | | | | 947.10 | | | | 7.85 | | | | 1,017.14 | | | | 8.13 | | | | 1.60 | |
| R6 | | | 1,000.00 | | | | 947.10 | | | | 7.85 | | | | 1,017.14 | | | | 8.13 | | | | 1.60 | |
| 1 | The actual ending account value is based on the actual total return of the Fund for the period May 1, 2015 through October 31, 2015, after actual expenses and will differ from the hypothetical ending account value which is based on the Fund’s expense ratio and a hypothetical annual return of 5% before expenses. |
| 2 | Expenses are equal to the Fund’s annualized expense ratio as indicated above multiplied by the average account value over the period, multiplied by 184/365 to reflect the most recent fiscal half year. |
37 Invesco Macro Long/Short Fund
Approval of Investment Advisory and Sub-Advisory Contracts
The Board of Trustees (the Board) of AIM Investment Funds (Invesco Investment Funds) is required under the Investment Company Act of 1940, as amended, to approve annually the renewal of Invesco Macro Long/Short Fund’s (the Fund) investment advisory agreements. During contract renewal meetings held on
June 9-10, 2015, the Board as a whole, and the disinterested or “independent” Trustees, who comprise over 75% of the Board, voting separately, approved the continuance for the Fund of the Master Investment Advisory Agreement with Invesco Advisers, Inc. (Invesco Advisers and the investment advisory agreement) and the Master Intergroup Sub-Advisory Contract for Mutual Funds with Invesco Asset Management Deutschland GmbH, Invesco Asset Management Limited, Invesco Asset Management (Japan) Limited, Invesco Hong Kong Limited, Invesco Senior Secured Management, Inc., Invesco Canada Ltd. and Invesco PowerShares Capital Management LLC (collectively, the Affiliated Sub-Advisers and the sub-advisory contracts) for another year, effective July 1, 2015.
In evaluating the fairness and reasonableness of compensation under the Fund’s investment advisory agreement and sub-advisory contracts, the Board considered, among other things, the factors discussed below. The Board determined that continuation of the Fund’s investment advisory agreement and the sub-advisory contracts are in the best interest of the Fund and its shareholders and that the compensation payable to Invesco Advisers and the Affiliated Sub-Advisers under the agreements is fair and reasonable.
The Board’s Fund Evaluation Process
The Board’s Investments Committee has established three Sub-Committees, each of which is primarily responsible for overseeing the performance and investment management services provided by Invesco Advisers and the Affiliated Sub-Advisers to a number of the funds advised by Invesco Advisers (the Invesco Funds). The Sub-Committees meet throughout the year to review the performance of their assigned Invesco Funds, including reviewing materials prepared under the direction of the independent Senior Officer, an officer of the Invesco Funds who reports directly to the independent Trustees. Over the course of each year, the Sub-Committees meet with portfolio managers for their assigned Invesco Funds and other members of management to review the performance, investment objective(s), policies, strategies, limitations and investment risks of these funds. The Board had the benefit of reports form the Sub-Committees and Investments Committee throughout the year in considering approval of the continuance of each Invesco Fund’s investment advisory agreement and sub-advisory contracts for another year.
During the contract renewal process, the Board receives comparative performance and fee data regarding the Invesco Funds prepared by Invesco Advisers and Lipper Inc. (Lipper), an independent provider of investment company data. The Board also receives a report and this independent written evaluation from the Senior Officer. The Senior Officer’s evaluation is prepared as part of his responsibility to manage the process by which the Invesco Funds’ proposed management fees are negotiated during the annual contract renewal process to ensure they are negotiated in a manner that is at arms’ length and reasonable. In addition to meetings with Invesco Advisers and fund counsel, the independent Trustees also discuss the continuance of the investment advisory agreement and sub-advisory contracts in separate sessions with the Senior Officer and with independent legal counsel.
The Trustees recognized that the advisory fee rates for the Invesco Funds are, in many cases, the result of years of review and negotiation. The Trustees’ deliberations and conclusions in a particular year may be based in part on their deliberations and conclusions regarding these same arrangements throughout the year and in prior years. The Trustees’ review and conclusions are based on the comprehensive consideration of all information presented to them and are not the result of any single determinative factor. Moreover, one Trustee may have weighed a particular piece of information or factor differently than another Trustee.
The discussion below is a summary of the Senior Officer’s independent written evaluation with respect to the Fund’s investment advisory agreement as well as a discussion of the material factors and related conclusions that formed the basis for the Board’s approval of the Fund’s investment advisory agreement and sub-advisory contracts. Unless otherwise stated, this information is current as of June 10, 2015, and does not reflect consideration of factors that became known to the Board after that date.
Factors and Conclusions and Summary of Independent Written Fee Evaluation
| A. | Nature, Extent and Quality of Services Provided by Invesco Advisers and the Affiliated Sub-Advisers |
The Board reviewed the advisory services provided to the Fund by Invesco Advisers under the Fund’s investment advisory agreement, the performance of Invesco Advisers in providing these services, and the credentials and experience of the officers and employees of Invesco Advisers who provide these services, including the Fund’s portfolio manager or managers. The Board’s review of the qualifications of Invesco Advisers to provide advisory services included the Board’s
consideration of Invesco Advisers’ investment process oversight, independent credit analysis and investment risk management. The Board also considered non-advisory services that Invesco Advisers and its affiliates provide to the Invesco Funds such as various back office support functions, equity and fixed income trading operations, internal audit, distribution, valuation and legal and compliance.
In determining whether to continue the Fund’s investment advisory agreement, the Board considered the benefits of reapproving an existing relationship and the greater uncertainty that may be associated with entering into a new relationship. The Board concluded that the nature, extent and quality of the services provided to the Fund by Invesco Advisers are appropriate and satisfactory and consistent with the terms of the Fund’s investment advisory agreement.
The Board reviewed the services that may be provided by the Affiliated Sub-Advisers under the sub-advisory contracts and the credentials and experience of the officers and employees of the Affiliated Sub-Advisers who provide these services. The Board noted that the Affiliated Sub-Advisers have offices and personnel that are located in financial centers around the world. As a result, the Affiliated Sub-Advisers can provide research and investment analysis on the markets and economies of various countries in which the Fund may invest, make recommendations regarding securities and assist with security trades. The Board concluded that the sub-advisory contracts benefit the Fund and its shareholders by permitting Invesco Advisers to use the resources and talents of the Affiliated Sub-Advisers in managing the Fund. The Board concluded that the nature, extent and quality of the services that may be provided by the Affiliated Sub-Advisers are appropriate and satisfactory and consistent with the terms of the Fund’s sub-advisory contracts.
The Board did not consider Fund performance as a relevant factor in considering whether to approve the investment advisory agreement as the Fund had only one year of performance history and no comparative data was available.
| C. | Advisory and Sub-Advisory Fees |
The Board considered the advisory fee schedule of the Fund and the contractual fee waivers and/or expense limitations that will be in place for the Fund through February 29, 2016. The Board had no comparative Lipper fee data because the Fund was launched in December 2013.
The Board compared the Fund’s effective advisory fee rate (the advisory fee rate after advisory fee waivers and before other expense limitations/waivers) to the effective advisory fee rates of other mutual funds advised by Invesco Advisers and its affiliates with investment strategies comparable to those of the Fund. The
38 Invesco Macro Long/Short Fund
Board noted that the Fund’s rate was the same as the rate of one such mutual fund. The Board noted that Invesco Advisers and the Affiliated Sub-Advisers do not manage other client accounts with investment strategies comparable to those of the Fund.
The Board also considered the services that may be provided by the Affiliated Sub-Advisers pursuant to the sub-advisory contracts, as well as the fees payable by Invesco Advisers to the Affiliated Sub-Advisers pursuant to the sub-advisory contracts. The Board also noted that the sub-advisory fees are not paid directly by the Fund, but rather, are payable by Invesco Advisers to the Affiliated Sub-Advisers.
| D. | Economies of Scale and Breakpoints |
The Board considered the extent to which there are economies of scale in the provision of advisory services to the Fund. The Board also considered whether the Fund benefits from economies of scale through contractual breakpoints in the Fund’s advisory fee schedule. The Board also noted that the Fund shares directly in economies of scale through lower fees charged by third party service providers based on the combined size of the Invesco Funds and other clients advised by Invesco Advisers.
| E. | Profitability and Financial Resources |
The Board reviewed information from Invesco Advisers concerning the costs of the advisory and other services that Invesco Advisers and its affiliates provide to the Fund and the Invesco Funds and the profitability of Invesco Advisers and its affiliates in providing these services. The Board received information from Invesco Advisers about the methodology used to prepare the profitability information. The Board noted that Invesco Advisers continues to operate at a net profit from services Invesco Advisers and its affiliates provide to the Invesco Funds. The Board noted that Invesco Advisers and its affiliates did not make a profit from managing the Fund as a result of fee and expense waivers. The Board received and accepted information from Invesco Advisers demonstrating that Invesco Advisers and each Affiliated Sub-Adviser are financially sound and have the resources necessary to perform their obligations under the investment advisory agreement and sub-advisory contracts.
| F. | Collateral Benefits to Invesco Advisers and its Affiliates |
The Board considered various other benefits received by Invesco Advisers and its affiliates from the relationship with the Fund, including the fees received for providing transfer agency and distribution services to the Fund. The Board considered the performance of Invesco Advisers and its affiliates in providing these services and the organizational structure employed to provide these services. The Board also considered that these services are provided to the Fund pursuant to written contracts that are reviewed and approved on an annual basis by the Board; and that the services are required for the operation of the Fund.
The Board considered the benefits realized by Invesco Advisers and the Affiliated Sub-Advisers as a result of portfolio brokerage transactions executed through “soft dollar” arrangements. The Board noted that soft dollar arrangements shift the payment obligation for research services from Invesco Advisers and the Affiliated Sub-Advisers to the Invesco Funds and that the research received may be used with other clients of Invesco Advisers and may reduce Invesco Advisers’ and the Affiliated Sub-Advisers’ expenses. The Board also considered that it receives periodic reports from the Chief Compliance Officer of the Invesco Funds demonstrating that these arrangements are consistent with regulatory requirements. The Board did not deem the soft dollar arrangements to be inappropriate.
The Board considered that the Fund’s uninvested cash and cash collateral from any securities lending arrangements may be invested in money market funds advised by Invesco Advisers pursuant to procedures approved by the Board. The Board noted that Invesco Advisers receives advisory fees from these affiliated money market funds attributable to such investments, although Invesco Advisers has contractually agreed to waive through varying periods the advisory fees payable by the Invesco Funds with respect to investments in the affiliated money market funds. The waiver is in an amount equal to 100% of the net advisory fee Invesco Advisers receives from the affiliated money market funds with respect to the Fund’s investment in the affiliated money market funds of uninvested cash, but not cash collateral. The Board concluded that the amount of advisory fees received by Invesco Advisors from the Fund’s investment of cash collateral from any securities lending arrangements in the affiliated money market funds is fair and reasonable.
The Board also considered the Fund may use an affiliated broker to execute certain trades for the Fund to among other things, control information leakage, and were advised that such trades would be executed in compliance with rules under the Investment Company Act of 1940, as amended, and consistent with best execution obligations.
39 Invesco Macro Long/Short Fund
Tax Information
Form 1099-DIV, Form 1042-S and other year–end tax information provide shareholders with actual calendar year amounts that should be included in their tax returns. Shareholders should consult their tax advisors.
The following distribution information is being provided as required by the Internal Revenue Code or to meet a specific state’s requirement.
The Fund designates the following amounts or, if subsequently determined to be different, the maximum amount allowable for its fiscal year ended October 31, 2015:
| | | | |
Federal and State Income Tax | | | |
Qualified Dividend Income* | | | 100.00 | % |
Corporate Dividends Received Deduction* | | | 33.13 | % |
U.S. Treasury Obligations* | | | 0.00 | % |
| | * | The above percentages are based on ordinary income dividends paid to shareholders during the Fund’s fiscal year. |
40 Invesco Macro Long/Short Fund
Trustees and Officers
The address of each trustee and officer is AIM Investment Funds (Invesco Investment Funds) (the “Trust”), 11 Greenway Plaza, Suite 1000, Houston, Texas 77046-1173. The trustees serve for the life of the Trust, subject to their earlier death, incapacitation, resignation, retirement or removal as more specifically provided in the Trust’s organizational documents. Each officer serves for a one year term or until their successors are elected and qualified. Column two below includes length of time served with predecessor entities, if any.
| | | | | | | | |
Name, Year of Birth and
Position(s) Held with the Trust | | Trustee and/
or Officer Since | | Principal Occupation(s)
During Past 5 Years | | Number of Funds in Fund Complex Overseen by Trustee | | Other Directorship(s) Held by Trustee During Past 5 Years |
| Interested Persons | | | | | | | | |
| Martin L. Flanagan1 — 1960 Trustee | | 2007 | | Executive Director, Chief Executive Officer and President, Invesco Ltd. (ultimate parent of Invesco and a global investment management firm); Advisor to the Board, Invesco Advisers, Inc. (formerly known as Invesco Institutional (N.A.), Inc.); Trustee, The Invesco Funds; Vice Chair, Investment Company Institute; and Member of Executive Board, SMU Cox School of Business Formerly: Chairman and Chief Executive Officer, Invesco Advisers, Inc. (registered investment adviser); Director, Chairman, Chief Executive Officer and President, IVZ Inc. (holding company), INVESCO Group Services, Inc. (service provider) and Invesco North American Holdings, Inc. (holding company); Director, Chief Executive Officer and President, Invesco Holding Company Limited (parent of Invesco and a global investment management firm); Director, Invesco Ltd.; Chairman, Investment Company Institute and President, Co-Chief Executive Officer, Co-President, Chief Operating Officer and Chief Financial Officer, Franklin Resources, Inc. (global investment management organization). | | 145 | | None |
Philip A. Taylor2 — 1954
Trustee, President and Principal Executive Officer | | 2006 | | Head of North American Retail and Senior Managing Director, Invesco Ltd.; Director, Co-Chairman, Co-President and Co-Chief Executive Officer, Invesco Advisers, Inc. (formerly known as Invesco Institutional (N.A.), Inc.) (registered investment adviser); Director, Chairman, Chief Executive Officer and President, Invesco Management Group, Inc. (formerly known as Invesco Aim Management Group, Inc.) (financial services holding company); Director and President, INVESCO Funds Group, Inc. (registered investment adviser and registered transfer agent); Director and Chairman, Invesco Investment Services, Inc. (formerly known as Invesco Aim Investment Services, Inc.) (registered transfer agent) and IVZ Distributors, Inc. (formerly known as INVESCO Distributors, Inc.) (registered broker dealer); Chief Executive Officer, Invesco Corporate Class Inc. (corporate mutual fund company) Director, Chairman and Chief Executive Officer, Invesco Canada Ltd. (formerly known as Invesco Trimark Ltd./Invesco Trimark Ltèe) (registered investment adviser and registered transfer agent); Trustee, President and Principal Executive Officer, The Invesco Funds (other than AIM Treasurer’s Series Trust (Invesco Treasurer’s Series Trust), Short-Term Investments Trust and Invesco Management Trust); Trustee and Executive Vice President, The Invesco Funds (AIM Treasurer’s Series Trust (Invesco Treasurer’s Series Trust), Short-Term Investments Trust and Invesco Management Trust only); Director, Invesco Investment Advisers LLC (formerly known as Van Kampen Asset Management); Director, Chief Executive Officer and President, Van Kampen Exchange Corp. Formerly: Director, President and Chairman, Invesco Inc. (holding company), Invesco Canada Holdings Inc. (holding company), Trimark Investments Ltd./Placements Trimark Ltèe and Invesco Financial Services Ltd/Services Financiers Invesco Ltèe; Chief Executive Officer, Invesco Canada Fund Inc (corporate mutual fund company); Director and Chairman, Van Kampen Investor Services Inc.; Director, Chief Executive Officer and President, 1371 Preferred Inc. (holding company) and Van Kampen Investments Inc.; Director and President, AIM GP Canada Inc. (general partner for limited partnerships) and Van Kampen Advisors, Inc.; Director and Chief Executive Officer, Invesco Trimark Dealer Inc. (registered broker dealer); Director, Invesco Distributors, Inc. (formerly known as Invesco Aim Distributors, Inc.) (registered broker dealer); Manager, Invesco PowerShares Capital Management LLC; Director, Chief Executive Officer and President, Invesco Advisers, Inc.; Director, Chairman, Chief Executive Officer and President, Invesco Aim Capital Management, Inc.; President, Invesco Trimark Dealer Inc. and Invesco Trimark Ltd./Invesco Trimark Ltèe; Director and President, AIM Trimark Corporate Class Inc. and AIM Trimark Canada Fund Inc.; Senior Managing Director, Invesco Holding Company Limited; Director and Chairman, Fund Management Company (former registered broker dealer); President and Principal Executive Officer, The Invesco Funds (AIM Treasurer’s Series Trust (Invesco Treasurer’s Series Trust), and Short-Term Investments Trust only); President, AIM Trimark Global Fund Inc. and AIM Trimark Canada Fund Inc.. | | 145 | | None |
| 1 | Mr. Flanagan is considered an interested person (within the meaning of Section 2(a)(19) of the 1940 Act) of the Trust because he is an officer of the Adviser to the Trust, and an officer and a director of Invesco Ltd., ultimate parent of the Adviser. |
| 2 | Mr. Taylor is considered an interested person (within the meaning of Section 2(a)(19) of the 1940 Act) of the Trust because he is an officer and a director of the Adviser. |
T-1 Invesco Macro Long/Short Fund
Trustees and Officers—(continued)
| | | | | | | | |
Name, Year of Birth and Position(s) Held with the Trust | | Trustee and/ or Officer Since | | Principal Occupation(s) During Past 5 Years | | Number of Funds in Fund Complex Overseen by Trustee | | Other Directorship(s) Held by Trustee During Past 5 Years |
| Independent Trustees | | | | | | | | |
Bruce L. Crockett — 1944 Trustee and Chair | | 2003 | | Chairman, Crockett Technologies Associates (technology consulting company) Formerly: Director, Captaris (unified messaging provider); Director, President and Chief Executive Officer, COMSAT Corporation; Chairman, Board of Governors of INTELSAT (international communications company); ACE Limited (insurance company); Independent Directors Council and Investment Company Institute | | 145 | | ALPS (Attorneys Liability Protection Society) (insurance company) and Globe Specialty Metals, Inc. (metallurgical company) |
David C. Arch — 1945 Trustee | | 2010 | | Chairman of Blistex Inc., a consumer health care products manufacturer | | 145 | | Board member of the Illinois Manufacturers’ Association; Member of the Board of Visitors, Institute for the Humanities, University of Michigan; Member of the Audit Committee of the Edward-Elmhurst Hospital |
James T. Bunch — 1942 Trustee | | 2000 | | Managing Member, Grumman Hill Group LLC (family office/private equity investments) Formerly: Founder, Green Manning & Bunch Ltd. (investment banking firm) (1988-2010); Executive Committee, United States Golf Association; and Chairman, Board of Governors, Western Golf Association | | 145 | | Chairman of the Board of Trustees, Evans Scholars Foundation; and Chairman of the Board, Denver Film Society |
Rodney F. Dammeyer — 1940 Trustee | | 2010 | | Chairman of CAC, LLC, (private company offering capital investment and management advisory services) Formerly: Prior to 2001, Managing Partner at Equity Group Corporate Investments; Prior to 1995, Chief Executive Officer of Itel Corporation (formerly Anixter International); Prior to 1985, experience includes Senior Vice President and Chief Financial Officer of Household International, Inc., Executive Vice President and Chief Financial Officer of Northwest Industries, Inc. and Partner of Arthur Andersen & Co.; From 1987 to 2010, Director/Trustee of investment companies in the Van Kampen Funds complex | | 145 | | Director of Quidel Corporation and Stericycle, Inc. |
Albert R. Dowden — 1941 Trustee | | 2003 | | Director of a number of public and private business corporations, including the Boss Group, Ltd. (private investment and management); Nature’s Sunshine Products, Inc. and Reich & Tang Funds (5 portfolios) (registered investment company) Formerly: Director, Homeowners of America Holding Corporation/Homeowners of America Insurance Company (property casualty company); Director, Continental Energy Services, LLC (oil and gas pipeline service); Director, CompuDyne Corporation (provider of product and services to the public security market) and Director, Annuity and Life Re (Holdings), Ltd. (reinsurance company); Director, President and Chief Executive Officer, Volvo Group North America, Inc.; Senior Vice President, AB Volvo; Director of various public and private corporations; Chairman, DHJ Media, Inc.; Director, Magellan Insurance Company; and Director, The Hertz Corporation, Genmar Corporation (boat manufacturer), National Media Corporation; Advisory Board of Rotary Power International (designer, manufacturer, and seller of rotary power engines); and Chairman, Cortland Trust, Inc. (registered investment company) | | 145 | | Director of: Nature’s Sunshine Products, Inc., Reich & Tang Funds, Homeowners of America Holding Corporation/ Homeowners of America Insurance Company, the Boss Group |
Jack M. Fields — 1952 Trustee | | 2003 | | Chief Executive Officer, Twenty First Century Group, Inc. (government affairs company); Owner and Chief Executive Officer, Dos Angeles Ranch, L.P. (cattle, hunting, corporate entertainment); and Discovery Global Education Fund (non-profit) Formerly: Chief Executive Officer, Texana Timber LP (sustainable forestry company); Director of Cross Timbers Quail Research Ranch (non-profit); and member of the U.S. House of Representatives | | 145 | | Insperity, Inc. (formerly known as Administaff) |
Prema Mathai-Davis — 1950 Trustee | | 2003 | | Retired. Formerly: Chief Executive Officer, YWCA of the U.S.A. | | 145 | | None |
Larry Soll — 1942 Trustee | | 1997 | | Retired. Formerly: Chairman, Chief Executive Officer and President, Synergen Corp. (a biotechnology company) | | 145 | | None |
Hugo F. Sonnenschein — 1940 Trustee | | 2010 | | President Emeritus and Honorary Trustee of the University of Chicago and the Adam Smith Distinguished Service Professor in the Department of Economics at the University of Chicago. Prior to 2000, President of the University of Chicago | | 145 | | Trustee of the University of Rochester and a member of its investment committee; Member of the National Academy of Sciences and the American Philosophical Society; Fellow of the American Academy of Arts and Sciences |
Raymond Stickel, Jr. — 1944 Trustee | | 2005 | | Retired. Formerly: Director, Mainstay VP Series Funds, Inc. (25 portfolios) and Partner, Deloitte & Touche | | 145 | | None |
T-2 Invesco Macro Long/Short Fund
Trustees and Officers—(continued)
| | | | | | | | |
Name, Year of Birth and Position(s) Held with the Trust | | Trustee and/ or Officer Since | | Principal Occupation(s) During Past 5 Years | | Number of Funds in Fund Complex Overseen by Trustee | | Other Directorship(s) Held by Trustee During Past 5 Years |
| Independent Trustees—(continued) |
Suzanne H. Woolsey — 1941 Trustee | | 2014 | | Chief Executive Officer of Woolsey Partners LLC | | 145 | | Emeritus Chair of the Board of Trustees of the Institute for Defense Analyses; Trustee of Colorado College; Trustee of California Institute of Technology; Prior to 2014, Director of Fluor Corp.; Prior to 2010, Trustee of the German Marshall Fund of the United States; Prior to 2010 Trustee of the Rocky Mountain Institute |
| Other Officers | | | | | | | | |
Russell C. Burk — 1958
Senior Vice President and Senior Officer | | 2005 | | Senior Vice President and Senior Officer, The Invesco Funds | | N/A | | N/A |
John M. Zerr — 1962
Senior Vice President, Chief Legal Officer and Secretary | | 2006 | | Director, Senior Vice President, Secretary and General Counsel, Invesco Management Group, Inc. (formerly known as Invesco Aim Management Group, Inc.) and Van Kampen Exchange Corp.; Senior Vice President, Invesco Advisers, Inc. (formerly known as Invesco Institutional (N.A.), Inc.) (registered investment adviser); Senior Vice President and Secretary, Invesco Distributors, Inc. (formerly known as Invesco Aim Distributors, Inc.); Director, Vice President and Secretary, Invesco Investment Services, Inc. (formerly known as Invesco Aim Investment Services, Inc.) and IVZ Distributors, Inc. (formerly known as INVESCO Distributors, Inc.); Director and Vice President, INVESCO Funds Group, Inc.; Senior Vice President, Chief Legal Officer and Secretary, The Invesco Funds; Managing Director, Invesco PowerShares Capital Management LLC; Director, Secretary and General Counsel, Invesco Investment Advisers LLC (formerly known as Van Kampen Asset Management); Secretary and General Counsel, Invesco Capital Markets, Inc. (formerly known as Van Kampen Funds Inc.) and Chief Legal Officer, PowerShares Exchange-Traded Fund Trust, PowerShares Exchange-Traded Fund Trust II, PowerShares India Exchange-Traded Fund Trust, PowerShares Actively Managed Exchange-Traded Fund Trust, and PowerShares Actively Managed Exchange-Traded Commodity Fund Trust Formerly: Director and Vice President, Van Kampen Advisors Inc.; Director, Vice President, Secretary and General Counsel, Van Kampen Investor Services Inc.; Director, Invesco Distributors, Inc. (formerly known as Invesco Aim Distributors, Inc.); Director, Senior Vice President, General Counsel and Secretary, Invesco Aim Advisers, Inc. and Van Kampen Investments Inc.; Director, Vice President and Secretary, Fund Management Company; Director, Senior Vice President, Secretary, General Counsel and Vice President, Invesco Aim Capital Management, Inc.; Chief Operating Officer and General Counsel, Liberty Ridge Capital, Inc. (an investment adviser); Vice President and Secretary, PBHG Funds (an investment company) and PBHG Insurance Series Fund (an investment company); Chief Operating Officer, General Counsel and Secretary, Old Mutual Investment Partners (a broker-dealer); General Counsel and Secretary, Old Mutual Fund Services (an administrator) and Old Mutual Shareholder Services (a shareholder servicing center); Executive Vice President, General Counsel and Secretary, Old Mutual Capital, Inc. (an investment adviser); and Vice President and Secretary, Old Mutual Advisors Funds (an investment company) | | N/A | | N/A |
Sheri Morris — 1964
Vice President, Treasurer and Principal Financial Officer | | 2003 | | Vice President, Treasurer and Principal Financial Officer, The Invesco Funds; Vice President, Invesco Advisers, Inc. (formerly known as Invesco Institutional (N.A.), Inc.) (registered investment adviser); and Vice President, PowerShares Exchange-Traded Fund Trust, PowerShares Exchange-Traded Fund Trust II, PowerShares India Exchange-Traded Fund Trust, PowerShares Actively Managed Exchange-Traded Fund Trust, and PowerShares Actively Managed Exchange-Traded Commodity Fund Trust Formerly: Vice President, Invesco Aim Advisers, Inc., Invesco Aim Capital Management, Inc. and Invesco Aim Private Asset Management, Inc.; Assistant Vice President and Assistant Treasurer, The Invesco Funds and Assistant Vice President, Invesco Advisers, Inc., Invesco Aim Capital Management, Inc. and Invesco Aim Private Asset Management, Inc.; and Treasurer, PowerShares Exchange-Traded Fund Trust, PowerShares Exchange-Traded Fund Trust II, PowerShares India Exchange-Traded Fund Trust and PowerShares Actively Managed Exchange-Traded Fund Trust | | N/A | | N/A |
T-3 Invesco Macro Long/Short Fund
Trustees and Officers—(continued)
| | | | | | | | |
Name, Year of Birth and
Position(s) Held with the Trust | | Trustee and/
or Officer Since | | Principal Occupation(s)
During Past 5 Years | | Number of Funds in Fund Complex Overseen by Trustee | | Other Directorship(s) Held by Trustee During Past 5 Years |
| Other Officers—(continued) |
Karen Dunn Kelley — 1960
Vice President | | 2003 | | Senior Managing Director, Investments, Invesco Ltd.; Director, Co-President, Co-Chief Executive Officer, and Co-Chairman, Invesco Advisers, Inc. (formerly known as Invesco Institutional (N.A.), Inc.) (registered investment adviser); Chairman, Invesco Senior Secured Management, Inc.; Senior Vice President, Invesco Management Group, Inc. (formerly known as Invesco Aim Management Group, Inc.); Executive Vice President, Invesco Distributors, Inc. (formerly known as Invesco Aim Distributors, Inc.); Director, Invesco Mortgage Capital Inc. and Invesco Management Company Limited; Vice President, The Invesco Funds (other than AIM Treasurer’s Series Trust (Invesco Treasurer’s Series Trust), Short-Term Investments Trust and Invesco Management Trust); and President and Principal Executive Officer, The Invesco Funds (AIM Treasurer’s Series Trust (Invesco Treasurer’s Series Trust), Short-Term Investments Trust and Invesco Management Trust only) Formerly: Director and President, INVESCO Asset Management (Bermuda) Ltd., Director, INVESCO Global Asset Management Limited and INVESCO Management S.A.; Senior Vice President, Van Kampen Investments Inc. and Invesco Advisers, Inc. (formerly known as Invesco Institutional (N.A.), Inc.) (registered investment adviser); Vice President, Invesco Advisers, Inc. (formerly known as Invesco Institutional (N.A.), Inc.); Director of Cash Management and Senior Vice President, Invesco Advisers, Inc. and Invesco Aim Capital Management, Inc.; Director and President, Fund Management Company; Chief Cash Management Officer, Director of Cash Management, Senior Vice President, and Managing Director, Invesco Aim Capital Management, Inc.; Director of Cash Management, Senior Vice President, and Vice President, Invesco Advisers, Inc. and The Invesco Funds (AIM Treasurer’s Series Trust (Invesco Treasurer’s Series Trust), and Short-Term Investments Trust only) | | N/A | | N/A |
Crissie M. Wisdom — 1969 Anti-Money Laundering Compliance Officer | | 2013 | | Anti-Money Laundering Compliance Officer, Invesco Advisers, Inc. (formerly known as Invesco Institutional (N.A.), Inc.) (registered investment adviser), Invesco Capital Markets, Inc. (formerly known as Van Kampen Funds Inc.), Invesco Distributors, Inc., Invesco Investment Services, Inc., Invesco Management Group, Inc., Van Kampen Exchange Corp., The Invesco Funds, and PowerShares Exchange-Traded Fund Trust, PowerShares Exchange-Traded Fund Trust II, PowerShares India Exchange-Traded Fund Trust, PowerShares Actively Managed Exchange-Traded Fund Trust and PowerShares Actively Managed Exchange-Traded Commodity Fund Trust; Anti-Money Laundering Compliance Officer and Bank Secrecy Act Officer, INVESCO National Trust Company and Invesco Trust Company; and Fraud Prevention Manager and Controls and Risk Analysis Manager for Invesco Investment Services, Inc.. | | N/A | | N/A |
Lisa O. Brinkley — 1959 Chief Compliance Officer | | 2015 | | Senior Vice President and Chief Compliance Officer, Invesco Advisers, Inc. (registered investment adviser) (formerly known as Invesco Institutional (N.A., Inc.); and Chief Compliance Officer, The Invesco Funds Formerly: Global Assurance Officer, Invesco Ltd. and Vice President, The Invesco Funds; Chief Compliance Officer, Invesco Distributors, Inc. (formerly known as Invesco Aim Distributors, Inc.), Invesco Investment Services, Inc.(formerly known as Invesco Aim Investment Services, Inc.) and Van Kampen Investor Services Inc.; Senior Vice President, Invesco Management Group, Inc.; Senior Vice President and Chief Compliance Officer, Invesco Advisers, Inc. and The Invesco Funds; Vice President and Chief Compliance Officer, Invesco Aim Capital Management, Inc. and Invesco Distributors, Inc.; Vice President, Invesco Investment Services, Inc. and Fund Management Company. | | N/A | | N/A |
The Statement of Additional Information of the Trust includes additional information about the Fund’s Trustees and is available upon request, without charge, by calling 1.800.959.4246. Please refer to the Fund’s prospectus for information on the Fund’s sub-advisers.
| | | | | | |
Office of the Fund 11 Greenway Plaza, Suite 1000 Houston, TX 77046-1173 | | Investment Adviser Invesco Advisers, Inc. 1555 Peachtree Street, N.E. Atlanta, GA 30309 | | Distributor
Invesco Distributors, Inc. 11 Greenway Plaza, Suite 1000 Houston, TX 77046-1173 | | Auditors PricewaterhouseCoopers LLP 1000 Louisiana Street, Suite 5800 Houston, TX 77002-5678 |
| | | |
| | | | | | |
Counsel to the Fund Stradley Ronon Stevens & Young, LLP 2005 Market Street, Suite 2600 Philadelphia, PA 19103-7018 | | Counsel to the Independent Trustees Goodwin Procter LLP 901 New York Avenue, N.W. Washington, D.C. 20001 | | Transfer Agent Invesco Investment Services, Inc. 11 Greenway Plaza, Suite 1000 Houston, TX 77046-1173 | | Custodian State Street Bank and Trust Company 225 Franklin Street Boston, MA 02110-2801 |
T-4 Invesco Macro Long/Short Fund

Invesco mailing information
Send general correspondence to Invesco Investment Services, Inc., P.O. Box 219078, Kansas City, MO 64121-9078.
Important notice regarding delivery of security holder documents
To reduce Fund expenses, only one copy of most shareholder documents may be mailed to shareholders with multiple accounts at the same address (Householding). Mailing of your shareholder documents may be householded indefinitely unless you instruct us otherwise. If you do not want the mailing of these documents to be combined with those for other members of your household, please contact Invesco Investment Services, Inc. at 800 959 4246 or contact your financial institution. We will begin sending you individual copies for each account within 30 days after receiving your request.
Fund holdings and proxy voting information
The Fund provides a complete list of its holdings four times in each fiscal year, at the quarter ends. For the second and fourth quarters, the lists appear in the Fund’s semiannual and annual reports to shareholders. For the first and third quarters, the Fund files the lists with the Securities and Exchange Commission (SEC) on Form N-Q. The most recent list of portfolio holdings is available at invesco.com/completeqtrholdings. Shareholders can also look up the Fund’s Forms N-Q on the SEC website at sec.gov. Copies of the Fund’s Forms N-Q may be reviewed and copied at the SEC Public Reference Room in Washington, D.C. You can obtain information on the operation of the Public Reference Room, including information about duplicating fee charges, by calling 202 551 8090 or 800 732 0330, or by electronic request at the following email address: publicinfo@sec.gov. The SEC file numbers for the Fund are shown below.
A description of the policies and procedures that the Fund uses to determine how to vote proxies relating to portfolio securities is available without charge, upon request, from our Client Services department at 800 959 4246 or at invesco.com/proxyguidelines. The information is also available on the SEC website, sec.gov.
| | |
Information regarding how the Fund voted proxies related to its portfolio securities during the most recent 12-month period ended June 30 is available at invesco.com/proxysearch. The information is also available on the SEC website, sec.gov. Invesco Advisers, Inc. is an investment adviser; it provides investment advisory services to individual and institutional clients and does not sell securities. Invesco Distributors, Inc. is the US distributor for Invesco Ltd.’s retail mutual funds, exchange-traded funds and institutional money market funds. Both are wholly owned, indirect subsidiaries of Invesco Ltd. | |  |
SEC file numbers: 811-05426 and 033-19338 MLS-AR-1 Invesco Distributors, Inc.
| | | | |
| | |
 | | Annual Report to Shareholders | | October 31, 2015 |
| | |
| | Invesco MLP Fund |
| | Nasdaq: |
| | A: ILPAX n C: ILPCX n R: ILPRX n Y: ILPYX n R5: ILPFX n R6: ILPQX |

Letters to Shareholders
| | | | |

Philip Taylor | | | | Dear Shareholders: This annual report includes information about your Fund, including performance data and a complete list of its investments as of the close of the reporting period. Inside is a discussion of how your Fund was managed and the factors that affected its performance during the reporting period. I hope you find this report of interest. The US economy expanded and unemployment declined throughout the reporting period. Continuing low energy prices benefited consumers, but a strong US dollar crimped corporate profits. The US Federal Reserve signaled that it was increasingly likely to raise interest rates, based on generally positive economic data, but uncertainty remained about when it might act. Overseas, the story was much different. Low energy prices hurt the economies of some oil-producing nations, such as Brazil and Russia. During the reporting period, the European Central |
Bank as well as central banks in China and Japan – among other countries – either instituted or maintained extraordinarily accommodative monetary policies in response to economic weakness.
Investor uncertainty, such as we saw for much of the reporting period – and market volatility, such as we saw at the end of the reporting period – are unfortunate facts of life when it comes to investing. Some investors use these things as excuses to delay saving and investing for their long-term financial goals. That’s why Invesco encourages investors to work with a professional financial adviser who can stress the importance of starting to save and invest early and the importance of adhering to a disciplined investment plan – when times are good and when they’re uncertain. A financial adviser who knows your unique financial situation, investment goals and risk tolerance can be an invaluable partner as you seek to achieve your financial goals. He or she can offer a long-term perspective when markets are volatile and time-tested advice and guidance when your financial situation or investment goals change.
Timely information when and where you want it
Invesco’s efforts to help investors achieve their financial objectives include providing individual investors and financial professionals with timely information about the markets, the economy and investing – whenever and wherever they want it.
Our website, invesco.com/us, offers a wide range of market insights and investment perspectives. On the website, you’ll find detailed information about our funds, including prices, performance, holdings and portfolio manager commentaries. You can access information about your account by completing a simple, secure online registration. Click on the “Need to register” link in the “Account Access” box on our homepage to get started.
Invesco’s mobile apps for iPhone® and iPad® (both available free from the App StoreSM) allow you to obtain the same detailed information, monitor your account and create customizable watch lists. Also, they allow you to access investment insights from our investment leaders, market strategists, economists and retirement experts. You can sign up to be alerted when new commentary is added, and you can watch portfolio manager videos and have instant access to Invesco news and updates wherever you may be.
In addition to the resources accessible on our website and through our mobile app, you can obtain timely updates to help you stay informed about the markets, the economy and investing by connecting with Invesco on Twitter, LinkedIn or Facebook. You can access our blog at blog.invesco.us.com. Our goal is to provide you the information you want, when and where you want it.
Have questions?
For questions about your account, feel free to contact an Invesco client services representative at 800 959 4246. For Invesco-related questions or comments, please email me directly at phil@invesco.com.
All of us at Invesco look forward to serving your investment management needs for many years to come. Thank you for investing with us.
Sincerely,

Philip Taylor
Senior Managing Director, Invesco Ltd.
iPhone and iPad are trademarks of Apple Inc., registered in the US and other countries. App Store is a service mark of Apple Inc. Invesco Distributors, Inc. is not affiliated with Apple Inc.
2 Invesco MLP Fund
| | | | | | |

Bruce Crockett | | | | Dear Fellow Shareholders: Among the many important lessons I’ve learned in more than 40 years in a variety of business endeavors is the value of a trusted advocate. As independent chair of the Invesco Funds Board, I can assure you that the members of the Board are strong advocates for the interests of investors in Invesco’s mutual funds. We work hard to represent your interests through oversight of the quality of the investment management services your funds receive and other matters important to your investment, including but not limited to: |
| | | | n | | Ensuring that Invesco offers a diverse lineup of mutual funds that your financial adviser can use to strive to meet your financial needs as your investment goals change over time. |
| | | | n | | Monitoring how the portfolio management teams of the Invesco funds are performing in light of changing economic and market conditions. |
| n | | Assessing each portfolio management team’s investment performance within the context of the investment strategy described in the fund’s prospectus. |
| n | | Monitoring for potential conflicts of interests that may impact the nature of the services that your funds receive. |
We believe one of the most important services we provide our fund shareholders is the annual review of the funds’ advisory and sub-advisory contracts with Invesco Advisers and its affiliates. This review is required by the Investment Company Act of 1940 and focuses on the nature and quality of the services Invesco provides as the adviser to the Invesco funds and the reasonableness of the fees that it charges for those services. Each year, we spend months carefully reviewing information received from Invesco and a variety of independent sources, such as performance and fee data prepared by Lipper Inc., an independent, third-party firm widely recognized as a leader in its field. We also meet with our independent legal counsel and other independent advisers to review and help us assess the information that we have received. Our goal is to assure that you receive quality investment management services for a reasonable fee.
I trust the measures outlined above provide assurance that you have a worthy advocate when it comes to choosing the Invesco Funds.
As always, please contact me at bruce@brucecrockett.com with any questions or concerns you may have. On behalf of the Board, we look forward to continuing to represent your interests and serving your needs.
Sincerely,

Bruce L. Crockett
Independent Chair
Invesco Funds Board of Trustees
3 Invesco MLP Fund
Management’s Discussion of Fund Performance
| | | | | |
Performance summary For the fiscal year ended October 31, 2015, Class A shares of Invesco MLP Fund (the Fund), at net asset value (NAV), outperformed the Fund’s style-specific benchmark, the Alerian MLP Index. Your Fund’s long-term performance appears later in this report. |
| | | | | |
Fund vs. Indexes Total returns, 10/31/14 to 10/31/15, at net asset value (NAV). Performance shown does not include applicable contingent deferred sales charges (CDSC) or front-end sales charges, which would have reduced performance. |
| | | | | |
Class A Shares | | | | -28.30 | % |
Class C Shares | | | | -28.78 | |
Class R Shares | | | | -28.48 | |
Class Y Shares | | | | -28.07 | |
Class R5 Shares | | | | -28.07 | |
Class R6 Shares | | | | -28.07 | |
S&P 500 Indexq (Broad Market Index) | | | | 5.20 | |
Alerian MLP Indexq (Style-Specific Index) | | | | -30.08 | |
Lipper Energy MLP Funds Index¢ (Peer Group Index) | | | | -23.80 | |
| |
Source(s): qFactSet Research Systems Inc.; ¢Lipper Inc. | | | | | |
Market conditions and your Fund
While overall global growth remained positive during the fiscal year ended October 31, 2015, there was a material dispersion in growth sustainability across major economies and world regions. The US economy has been trending relatively well, with strong economic growth and lower unemployment despite the pullback in crude oil prices and volatility among equities. China, Japan and the eurozone, however, struggled to deliver a consistent growth pattern and as such, economic stimulus remained necessary. Economic rebalancing and balance sheet repair remained key themes in many world economies and were reflected in below long-term average gross domestic product growth and very modest inflationary pressures.
In response to weak commodity prices, increased signs of vulnerability in several emerging market economies
and deterioration in the high yield fixed income market, the US Federal Reserve decided to wait before raising interest rates. Rates on 10-year US Treasuries ended the reporting period essentially unchanged.
Overall, domestic equities, as measured by the S&P 500 Index, traded in a relatively tight range for most of the fiscal year. However, in August and September of 2015 equity markets across the globe sold off due to weakness in emerging economies, in part due to persistently low commodity prices. Domestic equities recovered in the final month of the fiscal year, ending the reporting period in positive territory.
Master limited partnership (MLP) equities experienced steep losses during the fiscal year as a result of the sharp decline in energy prices. Fracturing technology, which allows for the extraction of hydrocarbons from previously uneconomical
locations, brought new life to the US energy industry and resulted in substantial growth in oil and gas production. Unexpected supply from Libya and Iraq, as well as the unwillingness by OPEC to cut production, further increased existing supply. Simultaneously, energy demand expectations were reduced as a result of the weakened outlook for global economic growth. These factors led to imbalances in supply and demand, causing energy prices to decline over 40% during the fiscal year, with crude oil falling from $81 to $47 per barrel and natural gas falling from $4.50 to $2.33/per thousand cubic feet.1
On an absolute basis, Fund holdings in the pipelines and midstream diversified, gathering and processing MLPs and refined products pipelines and terminals sectors were the largest detractors from performance. Natural gas pipelines and storage was the only MLP sector to contribute to Fund performance during the fiscal year.
At NAV, the Fund outperformed its style-specific benchmark, the Alerian MLP Index, as a result of security selection and market allocation during the fiscal year. In particular, security selection and an underweight position in upstream MLPs, security selection in the pipelines and midstream diversified, and the gathering and processing MLP sectors, as well as a lack of holdings in the coal MLP sector, were the largest contributors to relative Fund performance. Ancillary cash held by the Fund was also beneficial during the reporting period given the declines in MLP equities overall. Security selection in refined products pipelines and terminals and a lack of holdings in the propane MLP sector were the largest relative detractors from Fund performance for the fiscal year.
| | | | | |
By MLP sector | | | | % of total net assets | |
| | | | | |
Pipelines & Midstream Diversified | | | | 47.2 | % |
Refined Products Pipelines & Terminals | | | | 27.8 | |
Gathering & Processing MLP | | | | 15.6 | |
Natural Gas Pipelines & Storage | | | | 4.2 | |
Non-Traditional (MLP) | | | | 1.2 | |
Refinery Logistics | | | | 0.6 | |
Money Market Funds Plus Other Assets Less Liabilities | | | | 3.4 | |
| | |
| Top 10 Equity Holdings* |
| | % of total net assets |
| | | | | | | |
| 1. | | Enterprise Products Partners L.P. | | | | 18.0 | % |
| 2. | | Energy Transfer Partners, L.P. | | | | 11.5 | |
| 3. | | Magellan Midstream Partners, L.P. | | | | 7.2 | |
| 4. | | Plains All American Pipeline, L.P. | | | | 6.0 | |
| 5. | | Buckeye Partners, L.P. | | | | 4.3 | |
| 6. | | MarkWest Energy Partners, L.P. | | | | 4.0 | |
| 7. | | Williams Partners, L.P. | | | | 3.9 | |
| 8. | | Enbridge Energy Partners, L.P. | | | | 3.8 | |
| 9. | | Tesoro Logistics L.P. | | | | 3.6 | |
| 10. | | Sunoco Logistics Partners L.P. | | | | 3.3 | |
| | | | | |
Total Net Assets | | | | $4.8 million | |
Total Number of Holdings* | | | | 34 | |
The Fund’s holdings are subject to change, and there is no assurance that the Fund will continue to hold any particular security.
*Excluding money market fund holdings.
Data presented here are as of October 31, 2015.
4 Invesco MLP Fund
The Fund’s position in Energy Transfer Partners, which was slightly larger than that of the Alerian MLP Index, and the Fund’s position in Enterprise Products Partners, which was slightly smaller than that of the style-specific benchmark, were the leading detractors from absolute Fund performance given their significant weightings in the Fund. Energy Transfer Partners operates as a pipeline and midstream diversified MLP with exposure to natural gas, natural gas liquids (NGL), crude oil and refined products. Its operations include intrastate and interstate transportation and storage, gathering and processing, NGL transportation and storage, as well as retail sale of gasoline and middle distillates and the operation of convenience stores in 25 states, primarily on the East Coast and in the Midwest. Enterprise Products Partners is one of the largest MLPs. The company has grown through both acquisitions and organic growth opportunities resulting in 49,000 miles of pipelines, 24 natural gas processing plants, 22 NGL and propylene fractionators, strategically placed storage domes as well as NGL import/export terminals along the Houston Ship Channel.
Buckeye Partners, an MLP focused on crude oil storage that we believed offered a more stable business model given the current environment, was the largest contributor to absolute performance during the fiscal year. Nustar Energy and TC Pipelines, also top contributors to Fund performance, were new holdings purchased near the end of the fiscal year around their 52-week lows.
During the reporting period, the Fund held an average overweight position in refined products pipelines and terminals, gathering and processing MLPs, and pipelines and midstream diversified MLPs relative to its style-specific benchmark. The Fund held an average underweight position in upstream MLPs, oilfield services, marine MLPs, as well as natural gas pipelines and storage. The Fund lacked exposure to several MLP sectors in which its style-specific benchmark had minor exposure, including non-traditional, propane and coal.
We believe that the Permian and Marcellus basins remain the strongest basins with drilling economics that are relatively attractive based on our research. Despite recent distribution cuts from upstream MLPs, our expectations for distribution growth among midstream companies remain positive given the contractual nature of existing cash flows, combined
with a still-healthy project backlog. In general, the Fund remains focused on companies that exhibit a relatively high fee-based cash flow, have access to a growing asset base through both organic capital expenditures and acquisitions, and operate in what we view to be the most attractive natural resource basins in the US.
We thank you for your investment in Invesco MLP Fund.
| 1 | Source: Bloomberg Financial LP |
The views and opinions expressed in management’s discussion of Fund performance are those of Invesco Advisers, Inc. These views and opinions are subject to change at any time based on factors such as market and economic conditions. These views and opinions may not be relied upon as investment advice or recommendations, or as an offer for a particular security. The information is not a complete analysis of every aspect of any market, country, industry, security or the Fund. Statements of fact are from sources considered reliable, but Invesco Advisers, Inc. makes no representation or warranty as to their completeness or accuracy. Although historical performance is no guarantee of future results, these insights may help you understand our investment management philosophy.
See important Fund and, if applicable, index disclosures later in this report.
| | |
 | | Joe Rodriguez Jr. Portfolio Manager, is lead manager of Invesco MLP Fund. He is Head of Global |
| |
Securities with Invesco Real Estate, where he oversees all phases of the unit, including securities research and administration. Mr. Rodriguez joined Invesco in 1990. He earned a BBA in economics and finance and an MBA in finance from Baylor University.
| | |
 | | Mark Blackburn Chartered Financial Analyst, Portfolio Manager, is manager of Invesco MLP Fund. |
| |
He joined Invesco in 1998. Mr. Blackburn earned a BS in accounting from Louisiana State University and an MBA from Southern Methodist University.
| | |
 | | James Cowen Portfolio Manager, is manager of Invesco MLP Fund. He joined Invesco in 2000. |
| |
Mr. Cowen earned a Master of Town and Country Planning degree from the University of Manchester and a Master of Philosophy degree in land economy from Cambridge University.
| | |
 | | Paul Curbo Chartered Financial Analyst, Portfolio Manager, is manager of Invesco MLP Fund. |
| |
He joined Invesco in 1998. Mr. Curbo earned a BBA in finance from The University of Texas at Austin.
| | |
 | | Darin Turner Portfolio Manager, is manager of Invesco MLP Fund. He joined Invesco in 2005. |
| |
Mr. Turner earned a BBA in finance from Baylor University, an MS in real estate from The University of Texas at Arlington and an MBA specializing in investments from Southern Methodist University.
| | |
 | | Ping-Ying Wang Chartered Financial Analyst, Portfolio Manager, is manager of Invesco MLP Fund. |
| |
She joined Invesco in 1998. Ms. Wang earned a BS in international finance from the People’s University of China and a PhD in finance from the University of Texas at Dallas.
5 Invesco MLP Fund
Your Fund’s Long-Term Performance
Results of a $10,000 Investment – Oldest Share Class(es) Since Inception
Fund and index data from 8/29/14
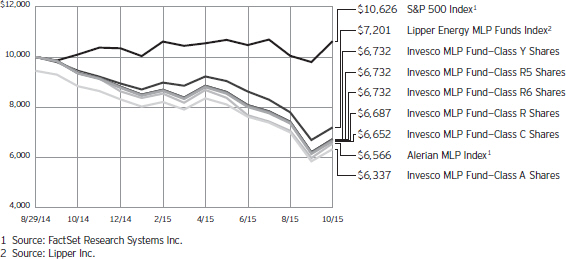
Past performance cannot guarantee comparable future results.
The data shown in the chart include reinvested distributions, applicable sales charges and Fund expenses including management fees. Performance of the peer group, if applicable, reflects fund
expenses and management fees; performance of a market index does not. Performance shown in the chart and table(s) does not reflect deduction of taxes a shareholder would pay on Fund distributions or sale of Fund shares.
continued from page 8
MLP, could result in an MLP being treated as a corporation for US federal income tax purposes, which would result in such MLP being required to pay US federal income tax on its taxable income. The classification of an MLP as a corporation for US federal income tax purposes would have the effect of reducing the amount of cash available for distribution by the MLP. Thus, if any of the MLPs owned by the Fund were treated as a corporation for US federal income tax purposes, it could result in a reduction of the value of the Fund’s investment, and consequently your investment in the Fund and lower income. MLPs taxed as partnerships file a partnership tax return for US federal, state and local income tax purposes and communicate to each investor in such MLP the investor’s allocable share of the MLP’s income, gains, losses, deductions and expenses via a “Schedule K-1.” Each year, the Fund will send you
an annual tax statement (Form 1099) to assist you in completing your federal, state and local tax returns. An MLP might need to amend its partnership tax return and, in turn, send amended Schedules K-1 to investors in the MLP, such as the Fund. When necessary, the Fund will send you a corrected Form 1099 to reflect Schedule K-1 information reclassified by an MLP, which could, in turn, require you to amend your federal, state or local tax returns.
| n | | Non-diversification risk. The Fund is non-diversified and can invest a greater portion of its assets in a small number of issuers or a single issuer. A change in the value of the issuer could affect the value of the Fund more than if it was a diversified fund. |
| n | | Small- and mid-capitalization risk. |
| | Stocks of small- and mid-sized companies tend to be more vulnerable to adverse developments and may have little or no operating history or track record |
| | | of success, and limited product lines, markets, management and financial resources. The securities of small- and mid-sized companies may be more volatile due to less market interest and less publicly available information about the issuer. They also may be illiquid or restricted as to resale, or may trade less frequently and in smaller volumes, all of which may cause difficulty when establishing or closing a position at a desirable price. |
About indexes used in this report
| n | | The S&P 500® Index is an unmanaged index considered representative of the US stock market. |
| n | | The Alerian MLP Index is a market-cap weighted, float-adjusted index created to provide a comprehensive benchmark for investors to track the performance of the energy MLP sector. The index components are selected by Alerian, LLC. |
continued on page 7
6 Invesco MLP Fund
| | | | | |
Average Annual Total Returns As of 10/31/15, including maximum applicable
sales charges |
| |
| Class A Shares | | | | | |
| Inception (8/29/14) | | | | -32.23 | % |
| 1 Year | | | | -32.21 | |
| |
| Class C Shares | | | | | |
Inception (8/29/14) | | | | -29.37 | % |
| 1 Year | | | | -29.47 | |
| |
| Class R Shares | | | | | |
Inception (8/29/14) | | | | -29.05 | % |
| 1 Year | | | | -28.48 | |
| |
| Class Y Shares | | | | | |
Inception (8/29/14) | | | | -28.64 | % |
| 1 Year | | | | -28.07 | |
| |
| Class R5 Shares | | | | | |
Inception (8/29/14) | | | | -28.64 | % |
| 1 Year | | | | -28.07 | |
| |
| Class R6 Shares | | | | | |
Inception (8/29/14) | | | | -28.64 | % |
| 1 Year | | | | -28.07 | |
The performance data quoted represent past performance and cannot guarantee comparable future results; current performance may be lower or higher. Please visit invesco.com/performance for the most recent month-end performance. Performance figures reflect reinvested distributions, changes in net asset value and the effect of the maximum sales charge unless otherwise stated. Investment return and principal value will fluctuate so that you may have a gain or loss when you sell shares.
| | | | | |
| Average Annual Total Returns As of 9/30/15, the most recent calendar quarter
end, including maximum applicable sales charges |
| |
| Class A Shares | | | | | |
Inception (8/29/14) | | | | -38.86 | % |
| 1 Year | | | | -40.49 | |
| |
| Class C Shares | | | | | |
Inception (8/29/14) | | | | -36.08 | % |
| 1 Year | | | | 38.08 | |
| |
| Class R Shares | | | | | |
Inception (8/29/14) | | | | -35.77 | % |
| 1 Year | | | | -37.21 | |
| |
| Class Y Shares | | | | | |
Inception (8/29/14) | | | | -35.46 | % |
| 1 Year | | | | -36.94 | |
| |
| Class R5 Shares | | | | | |
Inception (8/29/14) | | | | -35.46 | % |
| 1 Year | | | | -36.88 | |
| |
| Class R6 Shares | | | | | |
Inception (8/29/14) | | | | -35.46 | % |
| 1 Year | | | | -36.88 | |
The net annual Fund operating expense ratio set forth in the most recent Fund prospectus as of the date of this report for Class A, Class C, Class R, Class Y, Class R5 and Class R6 shares was 4.33%, 5.08%, 4.58%, 4.08%, 4.08% and 4.08%, respectively.1,2 The total annual Fund operating expense ratio set forth in the most recent Fund prospectus as of the date of this report for Class A, Class C, Class R, Class Y, Class R5 and Class R6 shares was 10.06%, 10.81%, 10.31%, 9.81%, 9.70% and 9.65%,
respectively. The expense ratios presented above may vary from the expense ratios presented in other sections of this report that are based on expenses incurred during the period covered by this report.
Class A share performance reflects the maximum 5.50% sales charge, and Class C share performance reflects the applicable contingent deferred sales charge (CDSC) for the period involved. The CDSC on Class C shares is 1% for the first year after purchase. Class R, Class Y, Class R5 and Class R6 class shares do not have a front-end sales charge or a CDSC; therefore, performance is at net asset value.
The performance of the Fund’s share classes will differ primarily due to different sales charge structures and class expenses.
Fund performance reflects any applicable fee waivers and/or expense reimbursements. Had the adviser not waived fees and/or reimbursed expenses currently or in the past, returns would have been lower. See current prospectus for more information.
| 1 | Total annual Fund operating expenses after any contractual fee waivers and/or expense reimbursements by the adviser in effect through at least February 28, 2017. See current prospectus for more information. |
| 2 | Total annual Fund operating expenses after any contractual fee waivers and/or expense reimbursements by the adviser in effect through at least June 30, 2017. See current prospectus for more information. |
continued from page 6
| ¢ | The Lipper Energy MLP Funds Index is an unmanaged index considered representative of energy MLP funds tracked by Lipper. |
| ¢ | The Fund is not managed to track the performance of any particular index, including the index(es) described here, and consequently, the performance of the Fund may deviate significantly from the performance of the index(es). |
| ¢ | A direct investment cannot be made in an index. Unless otherwise indicated, index results include reinvested dividends, and they do not reflect sales charges. Performance of the peer group, if applicable, reflects fund expenses; performance of a market index does not. |
Other information
| ¢ | The returns shown in management’s discussion of Fund performance are based on net asset values (NAVs) calculated for shareholder transactions. Generally accepted accounting principles require adjustments to be made to the net assets of the Fund at period end for financial reporting purposes, and as such, the NAVs for shareholder transactions and the returns based on those NAVs may differ from the NAVs and returns reported in the Financial Highlights. |
7 Invesco MLP Fund
Invesco MLP Fund’s investment objective is capital appreciation and, secondarily, income.
| n | | Unless otherwise stated, information presented in this report is as of October 31, 2015, and is based on total net assets. |
| n | | Unless otherwise noted, all data provided by Invesco. |
| n | | To access your Fund’s reports/prospectus, visit invesco.com/fundreports. |
About share classes
| n | | Class R shares are generally available only to employer sponsored retirement and benefit plans. Please see the prospectus for more information. |
| n | | Class Y shares are available only to certain investors. Please see the prospectus for more information. |
| n | | Class R5 shares and Class R6 shares are primarily intended for employer sponsored retirement and benefit plans that meet certain standards and for institutional investors. Please see the prospectus for more information. |
Principal risks of investing in the Fund
| n | | Active trading risk. The Fund engages in frequent trading of portfolio securities. Active trading results in added expenses and may result in a lower return and increased tax liability. |
| n | | Credit risk. The issuer of instruments in which the Fund invests may be unable to meet interest and/or principal payments, thereby causing its instruments to decrease in value and lowering the issuer’s credit rating. |
| n | | Deferred tax risk. The Fund is classified for federal tax purposes as a taxable regular corporation or so-called Sub-chapter “C” corporation. As a “C” corporation, the Fund is subject to US federal income tax on its taxable income at the graduated rates applicable to corporations (currently at a maximum rate of 35%) as well as state and local income taxes. The Fund will not benefit from the current favorable federal income tax rates on long term capital gains and Fund income, losses and expenses will not be passed through to the Fund’s shareholders. An investment strategy whereby a fund is taxed as a regular corporation, or “C” corporation, rather than as a regulated investment company for US federal income tax purposes, is a relatively recent strategy for open-end registered investment companies such as the |
| | | Fund. This strategy involves complicated accounting, tax, net asset value (NAV) and share valuation aspects that would cause the Fund to differ significantly from most other open-end registered investment companies. |
| n | | Energy infrastructure MLP risk. The Fund will concentrate its investments in the energy sector. Energy infrastructure MLPs are subject to a variety of industry specific risk factors that may adversely affect their business or operations, including a decrease in production or reduced volumes of natural gas or other energy commodities available for transporting, processing, storing or distributing; changes in energy commodity prices; a sustained reduced demand for crude oil, natural gas and refined petroleum products; depletion of the natural gas reserves or other commodities if not replaced; natural disasters, extreme weather and environmental hazards; rising interest rates which could result in a higher cost of capital and drive investors into other investment opportunities; and threats of attack by terrorists on energy assets. Energy infrastructure MLPs are also subject to significant federal, state and local government regulation in various aspects of their operations, including how facilities are constructed, maintained and operated, environmental and safety controls, and the prices they may charge for products and services. In addition, taxes, government regulation, international politics, price and supply fluctuations, volatile interest rates and energy conservation may cause difficulties for energy infrastructure MLPs. |
| n | | High yield bond (junk bond) risk. Junk bonds involve a greater risk of default or price changes due to changes in the credit quality of the issuer. The values of junk bonds fluctuate more than those of high- quality bonds in response to company, political, regulatory or economic developments. Values of junk bonds can decline significantly over short periods of time. |
| n | | Interest rate risk. Interest rate risk refers to the risk that bond prices generally fall as interest rates rise; conversely, bond prices generally rise as interest rates fall. Specific bonds differ in their sensitivity to changes in interest rates depending on their individual characteristics, including duration. |
| n | | Management risk. The investment techniques and risk analysis used by the Fund’s portfolio managers may not produce the desired results. |
| n | | Market risk. The prices of and the income generated by the Fund’s securities may decline in response to, among other things, investor sentiment, general economic and market conditions, regional or global instability, and currency and interest rate fluctuations. |
| n | | MLP risk. An MLP is a public limited partnership or limited liability company. Although the characteristics of MLPs closely resemble a traditional limited partnership, a major difference is that MLPs may trade on a public exchange or in the over-the-counter market. The ability to trade on a public exchange or in the over-the-counter market provides a certain amount of liquidity not found in many limited partnership investments. However, MLP interests may be less liquid and subject to more abrupt or erratic price movements than conventional publicly traded securities. The risks of investing in an MLP are similar to those of investing in a partnership and include more flexible governance structures, which could result in less protection for investors than investments in a corporation. Investors in an MLP would normally not be liable for the debts of the MLP beyond the amount that the investor has contributed but investors may not be shielded to the same extent that a shareholder of a corporation would be. MLPs are generally considered interest-rate sensitive investments. During periods of interest rate volatility, these investments may not provide attractive returns. |
| n | | MLP tax risk. MLPs taxed as partnerships do not pay US federal income tax at the partnership level. Rather, each partner is allocated a share of the partnership’s income, gains, losses, deductions and expenses. A change in current tax law, or a change in the underlying business mix of a given |
continued on page 6
|
This report must be accompanied or preceded by a currently effective Fund prospectus, which contains more complete information, including sales charges and expenses. Investors should read it carefully before investing. |
NOT FDIC INSURED | MAY LOSE VALUE | NO BANK GUARANTEE
8 Invesco MLP Fund
Schedule of Investments
October 31, 2015
| | | | | | | | |
| | | Units | | | Value | |
Master Limited Partnerships–96.12% | |
| Gathering & Processing MLP–15.59% | |
Antero Midstream Partners L.P. | | | 1,113 | | | $ | 26,512 | |
DCP Midstream Partners, L.P. | | | 1,068 | | | | 30,683 | |
Enable Midstream Partners, L.P. | | | 1,000 | | | | 12,030 | |
EnLink Midstream Partners L.P. | | | 3,395 | | | | 58,564 | |
EQT Midstream Partners L.P. | | | 1,876 | | | | 138,899 | |
MarkWest Energy Partners, L.P. | | | 4,382 | | | | 191,406 | |
Rice Midstream Partners L.P. | | | 3,161 | | | | 43,306 | |
Targa Resources Partners L.P. | | | 4,520 | | | | 135,600 | |
Western Gas Partners L.P. | | | 2,285 | | | | 116,809 | |
| | | | | | | | 753,809 | |
|
| Natural Gas Pipelines & Storage–3.68% | |
Boardwalk Pipeline Partners, L.P. | | | 5,402 | | | | 69,254 | |
Spectra Energy Partners, L.P. | | | 808 | | | | 34,857 | |
Tallgrass Energy Partners L.P. | | | 847 | | | | 36,692 | |
TC Pipelines, L.P. | | | 722 | | | | 37,298 | |
| | | | | | | | 178,101 | |
|
| Non-Traditional–1.19% | |
Calumet Specialty Products Partners, L.P. | | | 2,156 | | | | 57,522 | |
|
| Pipelines & Midstream Diversified–47.23% | |
Enbridge Energy Partners, L.P. | | | 6,609 | | | | 184,655 | |
Energy Transfer Equity, L.P. | | | 1,686 | | | | 36,333 | |
Energy Transfer Partners, L.P. | | | 12,595 | | | | 556,195 | |
Enterprise Products Partners L.P. | | | 31,491 | | | | 870,096 | |
ONEOK Partners, L.P. | | | 4,938 | | | | 157,177 | |
Plains All American Pipeline, L.P. | | | 9,184 | | | | 291,317 | |
Williams Partners L.P. | | | 5,576 | | | | 188,469 | |
| | | | | | | | 2,284,242 | |
| | | | | | | | |
| | | Units | | | Value | |
| Refined Products Pipelines & Terminals–27.77% | |
Buckeye Partners, L.P. | | | 3,065 | | | $ | 207,899 | |
Genesis Energy, L.P. | | | 3,415 | | | | 137,659 | |
Magellan Midstream Partners, L.P. | | | 5,487 | | | | 350,125 | |
MPLX L.P. | | | 559 | | | | 21,684 | |
NGL Energy Partners L.P. | | | 4,139 | | | | 76,654 | |
NuStar Energy L.P. | | | 1,133 | | | | 57,386 | |
Phillips 66 Partners L.P. | | | 842 | | | | 51,059 | |
Rose Rock Midstream L.P. | | | 842 | | | | 22,810 | |
Sunoco Logistics Partners L.P. | | | 5,539 | | | | 160,853 | |
Tesoro Logistics L.P. | | | 3,093 | | | | 173,425 | |
Valero Energy Partners L.P. | | | 1,674 | | | | 83,683 | |
| | | | | | | | 1,343,237 | |
|
| Refinery Logistics–0.66% | |
Shell Midstream Partners, L.P. | | | 940 | | | | 32,176 | |
Total Master Limited Partnerships
(Cost $5,434,636) | | | | 4,649,087 | |
| | |
| | | Shares | | | | |
Common Stocks–0.47% | |
| Natural Gas Pipelines & Storage–0.47% | |
Spectra Energy Corp.
(Cost $22,077) | | | 794 | | | | 22,684 | |
| |
Money Market Funds–2.68% | | | | | |
Liquid Assets Portfolio–Institutional Class, 0.16%(a) | | | 64,827 | | | | 64,827 | |
Premier Portfolio–Institutional Class,
0.12%(a) | | | 64,827 | | | | 64,827 | |
Total Money Market Funds
(Cost $129,654) | | | | 129,654 | |
TOTAL INVESTMENTS–99.27%
(Cost $5,586,367) | | | | 4,801,425 | |
OTHER ASSETS LESS LIABILITIES–0.73% | | | | 35,174 | |
NET ASSETS–100.00% | | | $ | 4,836,599 | |
Notes to Schedule of Investments:
| (a) | The money market fund and the Fund are affiliated by having the same investment adviser. The rate shown is the 7-day SEC standardized yield as of October 31, 2015. |
See accompanying Notes to Financial Statements which are an integral part of the financial statements.
9 Invesco MLP Fund
Statement of Assets and Liabilities
October 31, 2015
| | | | |
Assets: | |
Investments, at value (Cost $5,456,713) | | $ | 4,671,771 | |
Investments in affiliated money market funds, at value and cost | | | 129,654 | |
Total investments, at value (Cost $5,586,367) | | | 4,801,425 | |
Receivable for: | | | | |
Investments sold | | | 114,750 | |
Fund shares sold | | | 4,025 | |
Dividends | | | 48,211 | |
Fund expenses absorbed | | | 301,734 | |
Deferred tax asset, net | | | 0 | |
Other assets | | | 28,952 | |
Total assets | | | 5,299,097 | |
|
Liabilities: | |
Payable for: | | | | |
Investments purchased | | | 126,832 | |
Accrued fees to affiliates | | | 1,486 | |
Accrued trustees’ and officers’ fees and benefits | | | 1,538 | |
Accrued other operating expenses | | | 332,642 | |
Total liabilities | | | 462,498 | |
Net assets applicable to shares outstanding | | $ | 4,836,599 | |
|
Net assets consist of: | |
Shares of beneficial interest | | $ | 7,060,228 | |
Undistributed net investment income (loss), net of taxes | | | (259,541 | ) |
Undistributed net realized gain (loss), net of taxes | | | (1,179,146 | ) |
Net unrealized appreciation (depreciation), net of taxes | | | (784,942 | ) |
| | | $ | 4,836,599 | |
| | | | |
Net Assets: | |
Class A | | $ | 2,489,154 | |
Class C | | $ | 205,235 | |
Class R | | $ | 34,907 | |
Class Y | | $ | 2,094,375 | |
Class R5 | | $ | 6,464 | |
Class R6 | | $ | 6,464 | |
|
Shares outstanding, $0.01 par value per share,
with an unlimited number of shares authorized: | |
Class A | | | 385,676 | |
Class C | | | 31,836 | |
Class R | | | 5,409 | |
Class Y | | | 324,356 | |
Class R5 | | | 1,001 | |
Class R6 | | | 1,001 | |
Class A: | | | | |
Net asset value per share | | $ | 6.45 | |
Maximum offering price per share | | | | |
(Net asset value of $6.45 ¸ 94.50%) | | $ | 6.83 | |
Class C: | | | | |
Net asset value and offering price per share | | $ | 6.45 | |
Class R: | | | | |
Net asset value and offering price per share | | $ | 6.45 | |
Class Y: | | | | |
Net asset value and offering price per share | | $ | 6.46 | |
Class R5: | | | | |
Net asset value and offering price per share | | $ | 6.46 | |
Class R6: | | | | |
Net asset value and offering price per share | | $ | 6.46 | |
See accompanying Notes to Financial Statements which are an integral part of the financial statements.
10 Invesco MLP Fund
Statement of Operations
For the year ended October 31, 2015
| | | | |
Investment income: | |
Dividends (net of return of capital distributions of $241,380) | | $ | 16,414 | |
Dividends from affiliated money market funds | | | 106 | |
Total investment income | | | 16,520 | |
| |
Expenses: | | | | |
Advisory fees | | | 49,299 | |
Administrative services fees | | | 50,000 | |
Custodian fees | | | 8,652 | |
Distribution fees: | | | | |
Class A | | | 6,130 | |
Class C | | | 4,373 | |
Class R | | | 131 | |
Transfer agent fees — A, C, R and Y | | | 5,639 | |
Transfer agent fees — R5 | | | 8 | |
Transfer agent fees — R6 | | | 8 | |
Trustees’ and officers’ fees and benefits | | | 19,181 | |
Registration and filing fees | | | 108,233 | |
Professional services fees | | | 35,267 | |
Other | | | 25,184 | |
Total expenses, before waivers and taxes | | | 312,105 | |
Less: Fees waived and expenses reimbursed | | | (240,055 | ) |
Net expenses, before taxes | | | 72,050 | |
Net investment income (loss), before taxes | | | (55,530 | ) |
Net tax expense (benefit) | | | 0 | |
Net investment income (loss), net of taxes | | | (55,530 | ) |
| |
Realized and unrealized gain (loss) from: | | | | |
Net realized gain (loss) from: | | | | |
Investment securities | | | (1,150,488 | ) |
Net tax expense (benefit) | | | 0 | |
Net realized gain (loss), net of taxes | | | (1,150,488 | ) |
Change in net unrealized appreciation (depreciation) of: | | | | |
Investment securities | | | (490,056 | ) |
Net tax expense (benefit) | | | 0 | |
Net change in unrealized appreciation (depreciation), net of taxes | | | (490,056 | ) |
Net realized and unrealized gain (loss), net of taxes | | | (1,640,544 | ) |
Net increase (decrease) in net assets resulting from operations | | $ | (1,696,074 | ) |
See accompanying Notes to Financial Statements which are an integral part of the financial statements.
11 Invesco MLP Fund
Statement of Changes in Net Assets
For the year ended October 31, 2015 and the period August 29, 2014 (commencement date) through October 31, 2014
| | | | | | | | |
| | | October 31,
2015 | | | August 29, 2014
(commencement date) through
October 31,
2014 | |
Operations: | | | | | |
Net investment income (loss), net of taxes | | $ | (55,530 | ) | | $ | (4,599 | ) |
Net realized gain (loss), net of taxes | | | (1,150,488 | ) | | | (28,658 | ) |
Change in net unrealized appreciation (depreciation), net of taxes | | | (490,056 | ) | | | (294,886 | ) |
Net increase (decrease) in net assets resulting from operations | | | (1,696,074 | ) | | | (328,143 | ) |
| | |
Return of capital: | | | | | | | | |
Class A | | | (89,680 | ) | | | — | |
Class C | | | (10,464 | ) | | | — | |
Class R | | | (890 | ) | | | — | |
Class Y | | | (82,612 | ) | | | — | |
Class R5 | | | (320 | ) | | | — | |
Class R6 | | | (320 | ) | | | — | |
Total Return of Capital | | | (184,286 | ) | | | — | |
| | |
Share transactions–net: | | | | | | | | |
Class A | | | 1,427,803 | | | | 2,054,278 | |
Class C | | | (1,256,392 | ) | | | 1,815,276 | |
Class R | | | 22,493 | | | | 22,010 | |
Class Y | | | 1,210,530 | | | | 1,729,084 | |
Class R5 | | | — | | | | 10,010 | |
Class R6 | | | — | | | | 10,010 | |
Net increase in net assets resulting from share transactions | | | 1,404,434 | | | | 5,640,668 | |
Net increase (decrease) in net assets | | | (475,926 | ) | | | 5,312,525 | |
| | |
Net assets: | | | | | | | | |
Beginning of year | | | 5,312,525 | | | | — | |
End of year (includes undistributed net investment income (loss), net of taxes, of $(259,541) and $(9,540), respectively) | | $ | 4,836,599 | | | $ | 5,312,525 | |
Notes to Financial Statements
October 31, 2015
NOTE 1—Significant Accounting Policies
Invesco MLP Fund (the “Fund”) is a series portfolio of AIM Investment Funds (Invesco Investment Funds) (the “Trust”). The Trust is organized as a Delaware statutory trust and is registered under the Investment Company Act of 1940, as amended (the “1940 Act”), as an open-end series management investment company consisting of twenty-four separate series portfolios, each authorized to issue an unlimited number of shares of beneficial interest. The assets, liabilities and operations of each portfolio are accounted for separately. Information presented in these financial statements pertains only to the Fund. Matters affecting each portfolio or class will be voted on exclusively by the shareholders of such portfolio or class.
The Fund’s investment objective is capital appreciation and, secondarily, income.
The Fund currently consists of six different classes of shares: Class A, Class C, Class R, Class Y, Class R5 and Class R6. Class A shares are sold with a front-end sales charge unless certain waiver criteria are met and under certain circumstances load waived shares may be subject to contingent deferred sales charges (“CDSC”). Class C shares are sold with a CDSC. Class R, Class Y, Class R5 and Class R6 shares are sold at net asset value.
The following is a summary of the significant accounting policies followed by the Fund in the preparation of its financial statements.
| A. | Security Valuations — Securities, including restricted securities, are valued according to the following policy. |
A security listed or traded on an exchange (except convertible securities) is valued at its last sales price or official closing price as of the close of the customary trading session on the exchange where the security is principally traded, or lacking any sales or official closing price on a particular day, the security may be valued at the closing bid price on that day. Securities traded in the over-the-counter market are valued based on prices furnished by independent pricing services or market makers. When such securities are valued by an independent pricing service they may be considered fair valued. Futures contracts are valued at the final settlement price set by an exchange on which they are principally traded. Listed options are valued at the mean between the last bid and asked prices from the exchange on which they are principally traded. Options not
12 Invesco MLP Fund
listed on an exchange are valued by an independent source at the mean between the last bid and asked prices. For purposes of determining net asset value (“NAV”) per share, futures and option contracts generally are valued 15 minutes after the close of the customary trading session of the New York Stock Exchange (“NYSE”).
Investments in open-end and closed-end registered investment companies that do not trade on an exchange are valued at the end-of-day net asset value per share. Investments in open-end and closed-end registered investment companies that trade on an exchange are valued at the last sales price or official closing price as of the close of the customary trading session on the exchange where the security is principally traded.
Debt obligations (including convertible securities) and unlisted equities are fair valued using an evaluated quote provided by an independent pricing service. Evaluated quotes provided by the pricing service may be determined without exclusive reliance on quoted prices, and may reflect appropriate factors such as institution-size trading in similar groups of securities, developments related to specific securities, dividend rate (for unlisted equities), yield (for debt obligations), quality, type of issue, coupon rate (for debt obligations), maturity (for debt obligations), individual trading characteristics and other market data. Debt obligations are subject to interest rate and credit risks. In addition, all debt obligations involve some risk of default with respect to interest and/or principal payments.
Foreign securities’ (including foreign exchange contracts) prices are converted into U.S. dollar amounts using the applicable exchange rates as of the close of the NYSE. If market quotations are available and reliable for foreign exchange-traded equity securities, the securities will be valued at the market quotations. Because trading hours for certain foreign securities end before the close of the NYSE, closing market quotations may become unreliable. If between the time trading ends on a particular security and the close of the customary trading session on the NYSE, events occur that the Adviser determines are significant and make the closing price unreliable, the Fund may fair value the security. If the event is likely to have affected the closing price of the security, the security will be valued at fair value in good faith using procedures approved by the Board of Trustees. Adjustments to closing prices to reflect fair value may also be based on a screening process of an independent pricing service to indicate the degree of certainty, based on historical data, that the closing price in the principal market where a foreign security trades is not the current value as of the close of the NYSE. Foreign securities’ prices meeting the approved degree of certainty that the price is not reflective of current value will be priced at the indication of fair value from the independent pricing service. Multiple factors may be considered by the independent pricing service in determining adjustments to reflect fair value and may include information relating to sector indices, American Depositary Receipts and domestic and foreign index futures. Foreign securities may have additional risks including exchange rate changes, potential for sharply devalued currencies and high inflation, political and economic upheaval, the relative lack of issuer information, relatively low market liquidity and the potential lack of strict financial and accounting controls and standards.
Securities for which market prices are not provided by any of the above methods may be valued based upon quotes furnished by independent sources. The last bid price may be used to value equity securities. The mean between the last bid and asked prices is used to value debt obligations, including corporate loans.
Securities for which market quotations are not readily available or became unreliable are valued at fair value as determined in good faith by or under the supervision of the Trust’s officers following procedures approved by the Board of Trustees. Issuer specific events, market trends, bid/asked quotes of brokers and information providers and other market data may be reviewed in the course of making a good faith determination of a security’s fair value.
The Fund may invest in securities that are subject to interest rate risk, meaning the risk that the prices will generally fall as interest rates rise and, conversely, the prices will generally rise as interest rates fall. Specific securities differ in their sensitivity to changes in interest rates depending on their individual characteristics. Changes in interest rates may result in increased market volatility, which may affect the value and/or liquidity of certain Fund investments.
Valuations change in response to many factors including the historical and prospective earnings of the issuer, the value of the issuer’s assets, general economic conditions, interest rates, investor perceptions and market liquidity. Because of the inherent uncertainties of valuation, the values reflected in the financial statements may materially differ from the value received upon actual sale of those investments.
| B. | Securities Transactions and Investment Income — Securities transactions are accounted for on a trade date basis. Realized gains or losses on sales are computed on the basis of specific identification of the securities sold. Interest income (net of withholding tax, if any) is recorded on the accrual basis from settlement date. Dividend income (net of withholding tax, if any) is recorded on the ex-dividend date. |
The Fund may periodically participate in litigation related to Fund investments. As such, the Fund may receive proceeds from litigation settlements. Any proceeds received are included in the Statement of Operations as realized gain (loss) for investments no longer held and as unrealized gain (loss) for investments still held.
Brokerage commissions and mark ups are considered transaction costs and are recorded as an increase to the cost basis of securities purchased and/or a reduction of proceeds on a sale of securities. Such transaction costs are included in the determination of net realized and unrealized gain (loss) from investment securities reported in the Statement of Operations and the Statement of Changes in Net Assets and the net realized and unrealized gains (losses) on securities per share in the Financial Highlights. Transaction costs are included in the calculation of the Fund’s net asset value and, accordingly, they reduce the Fund’s total returns. These transaction costs are not considered operating expenses and are not reflected in net investment income reported in the Statement of Operations and the Statement of Changes in Net Assets, or the net investment income per share and the ratios of expenses and net investment income reported in the Financial Highlights, nor are they limited by any expense limitation arrangements between the Fund and the investment adviser.
The Fund allocates income and realized and unrealized capital gains and losses to a class based on the relative net assets of each class.
| C. | Country Determination — For the purposes of making investment selection decisions and presentation in the Schedule of Investments, the investment adviser may determine the country in which an issuer is located and/or credit risk exposure based on various factors. These factors include the laws of the country under which the issuer is organized, where the issuer maintains a principal office, the country in which the issuer derives 50% or more of its total revenues and the country that has the primary market for the issuer’s securities, as well as other criteria. Among the other criteria that may be evaluated for making this determination are the country in which the issuer maintains 50% or more of its assets, the type of security, financial guarantees and enhancements, the nature of the collateral and the sponsor organization. Country of issuer and/or credit risk exposure has been determined to be the United States of America, unless otherwise noted. |
| D. | Distributions — Distributions from net investment income, if any, are declared and paid quarterly and are recorded on the ex-dividend date. Distributions from net realized capital gain, if any, are generally declared and paid annually and recorded on the ex-dividend date. |
13 Invesco MLP Fund
| E. | Master Limited Partnerships — The Fund primarily invests in Master Limited Partnerships (“MLPs”). MLPs are publicly traded partnerships and limited liability companies taxed as partnerships under the Internal Revenue Code of 1986, as amended (the “Internal Revenue Code”). The Fund principally invests in MLPs that derive their revenue primarily from businesses involved in the gathering, transporting, processing, treating, storing, refining, distributing, mining or marketing of natural gas, natural gas liquids, crude oil, refined products or coal (“energy infrastructure MLPs”). The Fund is a partner in each MLP; accordingly, the Fund is required to take into account the Fund’s allocable share of income, gains, losses, deductions, expenses, and tax credits recognized by each MLP. |
The Fund is non-diversified and will concentrate its investments in the energy sector. Energy infrastructure MLPs are subject to a variety of industry specific risk factors that may adversely affect their business or operations, including a decrease in production or reduced volumes of natural gas or other energy commodities available for transporting, processing, storing or distributing; changes in energy commodity prices; a sustained reduced demand for crude oil, natural gas and refined petroleum products; depletion of natural gas reserves or other commodities if not replaced; natural disasters, extreme weather and environmental hazards; rising interest rates, how facilities are constructed, maintained and operated, environmental and safety controls, and the prices they may charge for products and services. In addition, taxes, government regulation, international politics, price, and supply fluctuations, volatile interest rates and energy conservation may cause difficulties for energy infrastructure MLPs.
MLPs may be less liquid and subject to more abrupt or erratic price movements than conventional publicly traded securities.
| F. | Return of Capital — Distributions received from the Fund’s investments in MLPs generally are comprised of income and return of capital. The Fund records investment income and return of capital based on estimates made at the time such distributions are received. The return of capital portion of the distribution is a reduction to investment income that results in an equivalent reduction in the cost basis of the associated investments and increases net realized gains (losses) and change in unrealized appreciation (depreciation). Such estimates are based on historical information available from each MLP and other industry sources. These estimates will subsequently be revised and may materially differ primarily based on information received from the MLPs after their tax reporting periods are concluded. |
| G. | Federal Income Taxes — The Fund does not intend to qualify as a regulated investment company pursuant to Subchapter M of the Internal Revenue Code. The Fund is treated as a regular corporation, or “C” corporation, for U.S. federal income tax purposes and generally is subject to U.S. federal income tax on its taxable income at the graduated rates applicable to corporations. In addition, as a regular corporation, the Fund may be subject to state and local taxes in jurisdictions in which the MLPs operate. The estimated state tax rate is based on a periodic analysis of the Fund’s holdings. The Fund may also be subject to a federal alternative minimum tax on its alternative minimum taxable income to the extent that the alternative minimum tax exceeds the Fund’s regular federal income tax liability. |
Taxes include current and deferred taxes. Current taxes reflect the estimated tax liability of the Fund as of a measurement date based on taxable income. Deferred taxes reflect estimates of (i) taxes on net unrealized gains (losses), which are attributable to the difference between fair market value and tax basis, (ii) the net tax effects of temporary differences between the carrying amounts of assets and liabilities for financial reporting purposes and the amounts used for tax purposes, and (iii) the net tax benefit of accumulated net operating losses, capital loss carryforwards and other tax attributes.
The Fund’s deferred tax asset (“DTA”) and/or liability balances are estimated using estimates of effective tax rates expected to apply to taxable income in the years such balances are realized. A DTA is recognized for temporary book/tax differences, net of unrealized losses, and carryforwards (net operating losses, capital loss carryforward, or tax credits). To the extent the Fund has a DTA, the Fund assesses whether a valuation allowance is required to offset the value of a portion, or all, of the DTA. Prior year ordinary income or capital gains (carrybacks), unrealized net gains, future reversals of existing taxable timing differences, forecast of future profitability (based on historical evidence), potential tax planning strategies, unsettled circumstances, and other evidence is used in determining the valuation allowance. The valuation allowance is reviewed periodically and the Fund may modify its estimates or assumptions regarding the net deferred tax asset or liability balances and any applicable valuation allowance.
The Fund recognizes interest and penalties associated with underpayment of federal and state income taxes, if any, in tax expense.
The Fund recognizes the tax benefits of uncertain tax positions only when the position is more likely than not to be sustained. Management has analyzed the Fund’s uncertain tax positions and concluded that no liability for unrecognized tax benefits should be recorded related to uncertain tax positions. Management is not aware of any tax positions for which it is reasonably possible that the total amounts of unrecognized tax benefits will change materially in the next 12 months.
The Fund files tax returns in the U.S. Federal jurisdiction and certain other jurisdictions. Generally, the Fund is subject to examinations by such taxing authorities for up to three years after the filing of the return for the tax period.
| H. | Expenses — Fees provided for under the Rule 12b-1 plan of a particular class of the Fund are charged to the operations of such class. Transfer agency fees and expenses and other shareholder recordkeeping fees and expenses attributable to Class R5 and Class R6 are allocated to each share class based on relative net assets. Sub-accounting fees attributable to Class R5 are charged to the operations of the class. Transfer agency fees and expenses and other shareholder recordkeeping fees and expenses relating to all other classes are allocated among those classes based on relative net assets. All other expenses are allocated among the classes based on relative net assets. |
| I. | Accounting Estimates — The preparation of financial statements in conformity with accounting principles generally accepted in the United States of America (“GAAP”) requires management to make estimates and assumptions that affect the reported amounts of assets and liabilities at the date of the financial statements and the reported amounts of revenues and expenses during the reporting period including estimates and assumptions related to taxation. Actual results could differ from those estimates by a significant amount. In addition, the Fund monitors for material events or transactions that may occur or become known after the period-end date and before the date the financial statements are released to print. |
| J. | Indemnifications — Under the Trust’s organizational documents, each Trustee, officer, employee or other agent of the Trust is indemnified against certain liabilities that may arise out of the performance of their duties to the Fund. Additionally, in the normal course of business, the Fund enters into contracts, including the Fund’s servicing agreements, that contain a variety of indemnification clauses. The Fund’s maximum exposure under these arrangements is unknown as this would involve future claims that may be made against the Fund that have not yet occurred. The risk of material loss as a result of such indemnification claims is considered remote. |
14 Invesco MLP Fund
NOTE 2—Advisory Fees and Other Fees Paid to Affiliates
The Trust has entered into a master investment advisory agreement with Invesco Advisers, Inc. (the “Adviser” or “Invesco”). Under the terms of the investment advisory agreement, the Fund pays an advisory fee to the Adviser based on the annual rate of the Fund’s average daily net assets as follows:
| | | | |
| Average Daily Net Assets | | Rate | |
First $1.0 billion | | | 1.00% | |
Next $1.5 billion | | | 0.95% | |
Next $2.0 billion | | | 0.93% | |
Next $3.5 billion | | | 0.91% | |
Over $8 billion | | | 0.90% | |
For the year ended October 31, 2015, the effective advisory fees incurred by the Fund was 1.00%.
Under the terms of a master sub-advisory agreement between the Adviser and each of Invesco Asset Management Deutschland GmbH, Invesco Asset Management Limited, Invesco Asset Management (Japan) Limited, Invesco Hong Kong Limited, Invesco Senior Secured Management, Inc., Invesco Canada Ltd. and Invesco PowerShares Capital Management LLC (collectively, the “Affiliated Sub-Advisers”) the Adviser, not the Fund, may pay 40% of the fees paid to the Adviser to any such Affiliated Sub-Adviser(s) that provide(s) discretionary investment management services to the Fund based on the percentage of assets allocated to such Affiliated Sub-Adviser(s).
The Adviser has contractually agreed, through at least February 28, 2017, to waive advisory fees and/or reimburse expenses of all shares to the extent necessary to limit total annual fund operating expenses after fee waiver and/or expense reimbursement (excluding certain items discussed below) of Class A, Class C, Class R, Class Y, Class R5 and Class R6 shares to 1.50%, 2.25%, 1.75%, 1.25%, 1.25% and 1.25%, respectively, of average daily net assets. In determining the Adviser’s obligation to waive advisory fees and/or reimburse expenses, the following expenses are not taken into account, and could cause the total annual fund operating expenses after fee waiver and/or expense reimbursement to exceed the numbers reflected above: (1) interest; (2) taxes; (3) dividend expense on short sales; (4) extraordinary or non-routine items, including litigation expenses; and (5) expenses that the Fund has incurred but did not actually pay because of an expense offset arrangement. Unless Invesco continues the fee waiver agreement, it will terminate on February 28, 2017. The fee waiver agreement cannot be terminated during its term.
Further, the Adviser has contractually agreed, through at least June 30, 2017, to waive the advisory fee payable by the Fund in an amount equal to 100% of the net advisory fees the Adviser receives from the affiliated money market funds on investments by the Fund of uninvested cash in such affiliated money market funds.
For the year ended October 31, 2015, the Adviser waived advisory fees and reimbursed fund level expenses of $234,400 and reimbursed class level expenses of $2,814, $502, $30, $2,293, $8 and $8 for Class A, Class C, Class R, Class Y, Class R5 and Class R6 shares, respectively.
The Trust has entered into a master administrative services agreement with Invesco pursuant to which the Fund has agreed to pay Invesco for certain administrative costs incurred in providing accounting services to the Fund. For the year ended October 31, 2015, expenses incurred under the agreement are shown in the Statement of Operations as Administrative services fees.
The Trust has entered into a transfer agency and service agreement with Invesco Investment Services, Inc. (“IIS”) pursuant to which the Fund has agreed to pay IIS a fee for providing transfer agency and shareholder services to the Fund and reimburse IIS for certain expenses incurred by IIS in the course of providing such services. IIS may make payments to intermediaries that provide omnibus account services, sub-accounting services and/or networking services. All fees payable by IIS to intermediaries that provide omnibus account services or sub-accounting are charged back to the Fund, subject to certain limitations approved by the Trust’s Board of Trustees. For the year ended October 31, 2015, expenses incurred under the agreement are shown in the Statement of Operations as Transfer agent fees.
The Trust has entered into master distribution agreements with Invesco Distributors, Inc. (“IDI”) to serve as the distributor for the Class A, Class C, Class R, Class Y, Class R5 and Class R6 shares of the Fund. The Trust has adopted plans pursuant to Rule 12b-1 under the 1940 Act with respect to the Fund’s Class A, Class C and Class R shares (collectively the “Plans”). The Fund, pursuant to the Plans, pays IDI compensation at the annual rate of 0.25% of the Fund’s average daily net assets of Class A shares, 1.00% of the average daily net assets of Class C shares and 0.50% of the average daily net assets of Class R shares. Of the Plan payments, up to 0.25% of the average daily net assets of each class of shares may be paid to furnish continuing personal shareholder services to customers who purchase and own shares of such classes. Any amounts not paid as a service fee under the Plans would constitute an asset-based sales charge. Rules of the Financial Industry Regulatory Authority (“FINRA”) impose a cap on the total sales charges, including asset-based sales charges, that may be paid by any class of shares of the Fund. For the year ended October 31, 2015, expenses incurred under the Plans are shown in the Statement of Operations as Distribution fees.
Front-end sales commissions and CDSC (collectively, the “sales charges”) are not recorded as expenses of the Fund. Front-end sales commissions are deducted from proceeds from the sales of Fund shares prior to investment in Class A shares of the Fund. CDSC are deducted from redemption proceeds prior to remittance to the shareholder. During the year ended October 31, 2015, IDI advised the Fund that IDI retained $2,188 in front-end sales commissions from the sale of Class A shares and $155 from Class C shares, for CDSC imposed upon redemptions by shareholders.
Certain officers and trustees of the Trust are officers and directors of the Adviser, IIS and/or IDI.
15 Invesco MLP Fund
NOTE 3—Additional Valuation Information
GAAP defines fair value as the price that would be received to sell an asset or paid to transfer a liability in an orderly transaction between market participants at the measurement date, under current market conditions. GAAP establishes a hierarchy that prioritizes the inputs to valuation methods, giving the highest priority to readily available unadjusted quoted prices in an active market for identical assets (Level 1) and the lowest priority to significant unobservable inputs (Level 3), generally when market prices are not readily available or are unreliable. Based on the valuation inputs, the securities or other investments are tiered into one of three levels. Changes in valuation methods may result in transfers in or out of an investment’s assigned level:
| | Level 1 — | Prices are determined using quoted prices in an active market for identical assets. |
| | Level 2 — | Prices are determined using other significant observable inputs. Observable inputs are inputs that other market participants may use in pricing a security. These may include quoted prices for similar securities, interest rates, prepayment speeds, credit risk, yield curves, loss severities, default rates, discount rates, volatilities and others. |
| | Level 3 — | Prices are determined using significant unobservable inputs. In situations where quoted prices or observable inputs are unavailable (for example, when there is little or no market activity for an investment at the end of the period), unobservable inputs may be used. Unobservable inputs reflect the Fund’s own assumptions about the factors market participants would use in determining fair value of the securities or instruments and would be based on the best available information. |
As of October 31, 2015, all of the securities in this Fund were valued based on Level 1 inputs (see the Schedule of Investments for security categories). The level assigned to the securities valuations may not be an indication of the risk or liquidity associated with investing in those securities. Because of the inherent uncertainties of valuation, the values reflected in the financial statements may materially differ from the value received upon actual sale of those investments.
NOTE 4—Trustees’ and Officers’ Fees and Benefits
Trustees’ and Officers’ Fees and Benefits include amounts accrued by the Fund to pay remuneration to certain Trustees and Officers of the Fund.
NOTE 5—Cash Balances
The Fund is permitted to temporarily carry a negative or overdrawn balance in its account with State Street Bank and Trust Company, the custodian bank. Such balances, if any at period end, are shown in the Statement of Assets and Liabilities under the payable caption Amount due custodian. To compensate the custodian bank for such overdrafts, the overdrawn Fund may either (1) leave funds as a compensating balance in the account so the custodian bank can be compensated by earning the additional interest; or (2) compensate by paying the custodian bank at a rate agreed upon by the custodian bank and Invesco, not to exceed the contractually agreed upon rate.
NOTE 6—Taxes and Distributions to Shareholders
Total taxes have been computed by applying the federal statutory tax rate of 34% plus a blended state and other tax rate of 2.73%. The Fund applied this rate to net investment income (loss) and realized and unrealized gains (losses) on investments before taxes in computing its total tax expense (benefit).
The provision for taxes differs from the amount derived from applying the statutory tax rate to net investment income (loss) and realized and unrealized gains (losses) before taxes at period-end as follows:
| | | | | | | | |
Provision at statutory rates | | $ | (576,665 | ) | | | 34.00 | % |
State and other taxes, net of federal tax benefit | | | (30,502 | ) | | | 1.80 | |
Permanent differences, current period | | | (3,463 | ) | | | 0.20 | |
Valuation allowance | | | 610,630 | | | | (36.00 | ) |
Total | | $ | 0 | | | | 0.00 | % |
16 Invesco MLP Fund
Components of the Fund’s Net Deferred Tax Asset at Period-End:
| | | | |
| |
Deferred Tax Assets: | | | | |
Net operating loss carryforward | | $ | 79,795 | |
Capital loss carryforward | | | 248,793 | |
Unrealized gains/losses on investment securities | | | 401,285 | |
Total Deferred Tax Assets | | | 729,873 | |
Valuation allowance | | | (729,873 | ) |
Deferred Tax Asset, Net | | $ | 0 | |
The Fund has a capital loss carryforward as of October 31, 2015, of $695,267. Capital losses may be carried forward for 5 years and accordingly, would begin to expire as of October 31, 2019.
The Fund has a federal net operating loss carryforward as of October 31, 2015, of $223,154, which begins to expire in 2034. As of October 31, 2015, the Fund has state net operating losses of approximately $217,972. If not utilized, these net operating losses will expire in various years through October 31, 2035.
At October 31, 2015, based on the net unrealized losses on the Fund’s investment securities, the Fund has recorded a valuation allowance to offset the DTA as the Fund has determined at October 31, 2015 based on historical evidence it is unlikely the DTA will be realized.
Tax Character of Distributions to Shareholders Paid During the Fiscal Year Ended October 31, 2015 and the Period August 29, 2014 (commencement date) through October 31, 2014:
| | | | | | | | |
| | | 2015 | | | 2014 | |
Return of capital | | $ | 184,286 | | | $ | — | |
NOTE 7—Investment Securities
The aggregate amount of investment securities (other than short-term securities, U.S. Treasury obligations and money market funds, if any) purchased and sold by the Fund during the year ended October 31, 2015 was $6,559,638 and $5,205,352, respectively. Cost of investments on a tax basis includes the adjustments for financial reporting purposes as of the most recently completed federal income tax reporting period-end.
| | | | |
| Unrealized Appreciation (Depreciation) of Investment Securities on a Tax Basis | |
Aggregate unrealized appreciation of investment securities | | $ | 56,727 | |
Aggregate unrealized (depreciation) of investment securities | | | (1,230,891 | ) |
Net unrealized appreciation (depreciation) of investment securities | | $ | (1,174,164 | ) |
Cost of investments for tax purposes is $5,975,589.
NOTE 8—Reclassification of Permanent Differences
Primarily as a result of differing book/tax treatment of dividends received deduction, on October 31, 2015, undistributed net investment income (loss) was decreased by $10,185 and shares of beneficial interest was increased by $10,185. This reclassification had no effect on the net assets of the Fund.
17 Invesco MLP Fund
NOTE 9—Share Information
| | | | | | | | | | | | | | | | |
| | | Summary of Share Activity | |
| | | Year ended
October 31, 2015(a) | | | August 29, 2014
(commencement date) through
October 31, 2014 | |
| | | Shares | | | Amount | | | Shares | | | Amount | |
Sold: | | | | | | | | | | | | | | | | |
Class A | | | 245,529 | | | $ | 1,973,144 | | | | 211,398 | | | $ | 2,100,737 | |
Class C | | | 39,161 | | | | 326,314 | | | | 191,620 | | | | 1,891,027 | |
Class R | | | 3,039 | | | | 21,882 | | | | 2,289 | | | | 22,010 | |
Class Y | | | 152,367 | | | | 1,224,893 | | | | 174,543 | | | | 1,734,597 | |
Class R5 | | | — | | | | — | | | | 1,001 | | | | 10,010 | |
Class R6 | | | — | | | | — | | | | 1,001 | | | | 10,010 | |
| | | | |
Issued as reinvestment of dividends: | | | | | | | | | | | | | | | | |
Class A | | | 5,681 | | | | 42,918 | | | | — | | | | — | |
Class C | | | 1,176 | | | | 9,203 | | | | — | | | | — | |
Class R | | | 81 | | | | 611 | | | | — | | | | — | |
Class Y | | | 2,700 | | | | 20,473 | | | | — | | | | — | |
| | | | |
Reacquired: | | | | | | | | | | | | | | | | |
Class A | | | (72,038 | ) | | | (588,259 | ) | | | (4,894 | ) | | | (46,459 | ) |
Class C | | | (192,021 | ) | | | (1,591,909 | ) | | | (8,100 | ) | | | (75,751 | ) |
Class Y | | | (4,668 | ) | | | (34,836 | ) | | | (586 | ) | | | (5,513 | ) |
Net increase in share activity | | | 181,007 | | | $ | 1,404,434 | | | | 568,272 | | | $ | 5,640,668 | |
| (a) | There are entities that are record owners of more than 5% of the outstanding shares of the Fund and in the aggregate own 14% of the outstanding shares of the Fund. IDI has an agreement with these entities to sell Fund shares. The Fund, Invesco and/or Invesco affiliates may make payments to these entities, which are considered to be related to the Fund, for providing services to the Fund, Invesco and/or Invesco affiliates including but not limited to services such as securities brokerage, distribution, third party record keeping and account servicing. The Trust has no knowledge as to whether all or any portion of the shares owned of record by these entities are also owned beneficially. |
| | In addition, 47% of the outstanding shares of the Fund are owned by the Adviser. |
18 Invesco MLP Fund
NOTE 10—Financial Highlights
The following schedule presents financial highlights for a share of the Fund outstanding throughout the periods indicated.
| | | | | | | | |
| | | Class A | |
| | | Year ended October 31, | |
| | | 2015 | | | 2014(a) | |
Net asset value, beginning of period | | $ | 9.35 | | | $ | 10.00 | |
Net investment income (loss)(b) | | | (0.09 | ) | | | (0.01 | ) |
Net gains (losses) on securities (both realized and unrealized) | | | (2.51 | ) | | | (0.64 | ) |
Total from investment operations | | | (2.60 | ) | | | (0.65 | ) |
Less: | | | | | | | | |
Return of capital | | | (0.30 | ) | | | — | |
Net asset value, end of period | | $ | 6.45 | | | $ | 9.35 | |
Total return(c) | | | (28.30 | )% | | | (6.50 | )% |
Net assets, end of period (000’s omitted) | | $ | 2,489 | | | $ | 1,931 | |
Portfolio turnover rate(d) | | | 107 | % | | | 5 | % |
| |
Ratios/supplemental data based on average net assets: | | | | | |
Ratio of expenses: | | | | | | | | |
With fee waivers and/or expense reimbursements, before taxes | | | 1.50 | %(e) | | | 1.49 | %(f) |
Tax expense (benefit)(g) | | | 0 | %(e) | | | 0 | %(f) |
With fee waivers and/or expense reimbursements, after taxes(g) | | | 1.50 | %(e) | | | 1.49 | %(f) |
Without fee waivers and/or expense reimbursements, after taxes(g) | | | 6.37 | %(e) | | | 72.56 | %(f) |
Ratio of net investment income (loss), before taxes | | | (1.16 | )%(e) | | | (0.54 | )%(f) |
Ratio of net investment income (loss), after taxes(h) | | | (1.16 | )%(e) | | | (0.54 | )%(f) |
| (a) | Commencement date of August 29, 2014. |
| (b) | Calculated using average shares outstanding. |
| (c) | Includes adjustments in accordance with accounting principles generally accepted in the United States of America and as such, the net asset value for financial reporting purposes and the returns based upon those net asset values may differ from the net asset value and returns for shareholder transactions. Does not include sales charges and is not annualized for periods less than one year, if applicable. |
| (d) | Portfolio turnover is calculated at the fund level and is not annualized for periods less than one year, if applicable. |
| (e) | Ratios are based on average daily net assets (000’s omitted) of $2,452. |
| (g) | Ratio includes tax expense derived from net investment income (loss) and realized and unrealized gains (losses). |
| (h) | Ratio includes tax expense derived from net investment income (loss) only. |
19 Invesco MLP Fund
NOTE 10—Financial Highlights—(continued)
| | | | | | | | |
| | | Class C | |
| | | Year ended October 31, | |
| | | 2015 | | | 2014(a) | |
Net asset value, beginning of period | | $ | 9.34 | | | $ | 10.00 | |
Net investment income (loss)(b) | | | (0.16 | ) | | | (0.02 | ) |
Net gains (losses) on securities (both realized and unrealized) | | | (2.49 | ) | | | (0.64 | ) |
Total from investment operations | | | (2.65 | ) | | | (0.66 | ) |
Less: | | | | | | | | |
Return of capital | | | (0.24 | ) | | | — | |
Net asset value, end of period | | $ | 6.45 | | | $ | 9.34 | |
Total return(c) | | | (28.78 | )% | | | (6.60 | )% |
Net assets, end of period (000’s omitted) | | $ | 205 | | | $ | 1,713 | |
Portfolio turnover rate(d) | | | 107 | % | | | 5 | % |
| |
Ratios/supplemental data based on average net assets: | | | | | |
Ratio of expenses: | | | | | | | | |
With fee waivers and/or expense reimbursements, before taxes | | | 2.25 | %(e) | | | 2.24 | %(f) |
Tax expense (benefit)(g) | | | 0 | %(e) | | | 0 | %(f) |
With fee waivers and/or expense reimbursements, after taxes(g) | | | 2.25 | %(e) | | | 2.24 | %(f) |
Without fee waivers and/or expense reimbursements, after taxes(g) | | | 7.12 | %(e) | | | 73.31 | %(f) |
Ratio of net investment income (loss), before taxes | | | (1.91 | )%(e) | | | (1.29 | )%(f) |
Ratio of net investment income (loss), after taxes(h) | | | (1.91 | )%(e) | | | (1.29 | )%(f) |
| (a) | Commencement date of August 29, 2014. |
| (b) | Calculated using average shares outstanding. |
| (c) | Includes adjustments in accordance with accounting principles generally accepted in the United States of America and as such, the net asset value for financial reporting purposes and the returns based upon those net asset values may differ from the net asset value and returns for shareholder transactions. Does not include sales charges and is not annualized for periods less than one year, if applicable. |
| (d) | Portfolio turnover is calculated at the fund level and is not annualized for periods less than one year, if applicable. |
| (e) | Ratios are based on average daily net assets (000’s omitted) of $437. |
| (g) | Ratio includes tax expense derived from net investment income (loss) and realized and unrealized gains (losses). |
| (h) | Ratio includes tax expense derived from net investment income (loss) only. |
20 Invesco MLP Fund
NOTE 10—Financial Highlights—(continued)
| | | | | | | | |
| | | Class R | |
| | | Year ended October 31, | |
| | | 2015 | | | 2014(a) | |
Net asset value, beginning of period | | $ | 9.35 | | | $ | 10.00 | |
Net investment income (loss)(b) | | | (0.11 | ) | | | (0.01 | ) |
Net gains (losses) on securities (both realized and unrealized) | | | (2.51 | ) | | | (0.64 | ) |
Total from investment operations | | | (2.62 | ) | | | (0.65 | ) |
Less: | | | | | | | | |
Return of capital | | | (0.28 | ) | | | — | |
Net asset value, end of period | | $ | 6.45 | | | $ | 9.35 | |
Total return(c) | | | (28.48 | )% | | | (6.50 | )% |
Net assets, end of period (000’s omitted) | | $ | 35 | | | $ | 21 | |
Portfolio turnover rate(d) | | | 107 | % | | | 5 | % |
| |
Ratios/supplemental data based on average net assets: | | | | | |
Ratio of expenses: | | | | | | | | |
With fee waivers and/or expense reimbursements, before taxes | | | 1.75 | %(e) | | | 1.74 | %(f) |
Tax expense (benefit)(g) | | | 0 | %(e) | | | 0 | %(f) |
With fee waivers and/or expense reimbursements, after taxes(g) | | | 1.75 | %(e) | | | 1.74 | %(f) |
Without fee waivers and/or expense reimbursements, after taxes(g) | | | 6.62 | %(e) | | | 72.80 | %(f) |
Ratio of net investment income (loss), before taxes | | | (1.41 | )%(e) | | | (0.79 | )%(f) |
Ratio of net investment income (loss), after taxes(h) | | | (1.41 | )%(e) | | | (0.79 | )%(f) |
| (a) | Commencement date of August 29, 2014. |
| (b) | Calculated using average shares outstanding. |
| (c) | Includes adjustments in accordance with accounting principles generally accepted in the United States of America and as such, the net asset value for financial reporting purposes and the returns based upon those net asset values may differ from the net asset value and returns for shareholder transactions. Does not include sales charges and is not annualized for periods less than one year, if applicable. |
| (d) | Portfolio turnover is calculated at the fund level and is not annualized for periods less than one year, if applicable. |
| (e) | Ratios are based on average daily net assets (000’s omitted) of $26. |
| (g) | Ratio includes tax expense derived from net investment income (loss) and realized and unrealized gains (losses). |
| (h) | Ratio includes tax expense derived from net investment income (loss) only. |
21 Invesco MLP Fund
NOTE 10—Financial Highlights—(continued)
| | | | | | | | |
| | | Class Y | |
| | | Year ended October 31, | |
| | | 2015 | | | 2014(a) | |
Net asset value, beginning of period | | $ | 9.36 | | | $ | 10.00 | |
Net investment income (loss)(b) | | | (0.07 | ) | | | (0.01 | ) |
Net gains (losses) on securities (both realized and unrealized) | | | (2.51 | ) | | | (0.63 | ) |
Total from investment operations | | | (2.58 | ) | | | (0.64 | ) |
Less: | | | | | | | | |
Return of capital | | | (0.32 | ) | | | — | |
Net asset value, end of period | | $ | 6.46 | | | $ | 9.36 | |
Total return(c) | | | (28.07 | )% | | | (6.40 | )% |
Net assets, end of period (000’s omitted) | | $ | 2,094 | | | $ | 1,628 | |
Portfolio turnover rate(d) | | | 107 | % | | | 5 | % |
| |
Ratios/supplemental data based on average net assets: | | | | | |
Ratio of expenses: | | | | | | | | |
With fee waivers and/or expense reimbursements, before taxes | | | 1.25 | %(e) | | | 1.24 | %(f) |
Tax expense (benefit)(g) | | | 0 | %(e) | | | 0 | %(f) |
With fee waivers and/or expense reimbursements, after taxes(g) | | | 1.25 | %(e) | | | 1.24 | %(f) |
Without fee waivers and/or expense reimbursements, after taxes(g) | | | 6.12 | %(e) | | | 72.31 | %(f) |
Ratio of net investment income (loss), before taxes | | | (0.91 | )%(e) | | | (0.29 | )%(f) |
Ratio of net investment income (loss), after taxes(h) | | | (0.91 | )%(e) | | | (0.29 | )%(f) |
| (a) | Commencement date of August 29, 2014. |
| (b) | Calculated using average shares outstanding. |
| (c) | Includes adjustments in accordance with accounting principles generally accepted in the United States of America and as such, the net asset value for financial reporting purposes and the returns based upon those net asset values may differ from the net asset value and returns for shareholder transactions. Does not include sales charges and is not annualized for periods less than one year, if applicable. |
| (d) | Portfolio turnover is calculated at the fund level and is not annualized for periods less than one year, if applicable. |
| (e) | Ratios are based on average daily net assets (000’s omitted) of $1,998. |
| (g) | Ratio includes tax expense derived from net investment income (loss) and realized and unrealized gains (losses). |
| (h) | Ratio includes tax expense derived from net investment income (loss) only. |
22 Invesco MLP Fund
NOTE 10—Financial Highlights—(continued)
| | | | | | | | |
| | | Class R5 | |
| | | Year ended October 31, | |
| | | 2015 | | | 2014(a) | |
Net asset value, beginning of period | | $ | 9.36 | | | $ | 10.00 | |
Net investment income (loss)(b) | | | (0.07 | ) | | | (0.01 | ) |
Net gains (losses) on securities (both realized and unrealized) | | | (2.51 | ) | | | (0.63 | ) |
Total from investment operations | | | (2.58 | ) | | | (0.64 | ) |
Less: | | | | | | | | |
Return of capital | | | (0.32 | ) | | | — | |
Net asset value, end of period | | $ | 6.46 | | | $ | 9.36 | |
Total return(c) | | | (28.07 | )% | | | (6.40 | )% |
Net assets, end of period (000’s omitted) | | $ | 6 | | | $ | 9 | |
Portfolio turnover rate(d) | | | 107 | % | | | 5 | % |
| |
Ratios/supplemental data based on average net assets: | | | | | |
Ratio of expenses: | | | | | | | | |
With fee waivers and/or expense reimbursements, before taxes | | | 1.25 | %(e) | | | 1.24 | %(f) |
Tax expense (benefit)(g) | | | 0 | %(e) | | | 0 | %(f) |
With fee waivers and/or expense reimbursements, after taxes(g) | | | 1.25 | %(e) | | | 1.24 | %(f) |
Without fee waivers and/or expense reimbursements, after taxes(g) | | | 6.10 | %(e) | | | 72.28 | %(f) |
Ratio of net investment income (loss), before taxes | | | (0.91 | )%(e) | | | (0.29 | )%(f) |
Ratio of net investment income (loss), after taxes(h) | | | (0.91 | )%(e) | | | (0.29 | )%(f) |
| (a) | Commencement date of August 29, 2014. |
| (b) | Calculated using average shares outstanding. |
| (c) | Includes adjustments in accordance with accounting principles generally accepted in the United States of America and as such, the net asset value for financial reporting purposes and the returns based upon those net asset values may differ from the net asset value and returns for shareholder transactions. Does not include sales charges and is not annualized for periods less than one year, if applicable. |
| (d) | Portfolio turnover is calculated at the fund level and is not annualized for periods less than one year, if applicable. |
| (e) | Ratios are based on average daily net assets (000’s omitted) of $8. |
| (g) | Ratio includes tax expense derived from net investment income (loss) and realized and unrealized gains (losses). |
| (h) | Ratio includes tax expense derived from net investment income (loss) only. |
23 Invesco MLP Fund
NOTE 10—Financial Highlights—(continued)
| | | | | | | | |
| | | Class R6 | |
| | | Year ended October 31, | |
| | | 2015 | | | 2014(a) | |
Net asset value, beginning of period | | $ | 9.36 | | | $ | 10.00 | |
Net investment income (loss)(b) | | | (0.07 | ) | | | (0.01 | ) |
Net gains (losses) on securities (both realized and unrealized) | | | (2.51 | ) | | | (0.63 | ) |
Total from investment operations | | | (2.58 | ) | | | (0.64 | ) |
Less: | | | | | | | | |
Return of capital | | | (0.32 | ) | | | — | |
Net asset value, end of period | | $ | 6.46 | | | $ | 9.36 | |
Total return(c) | | | (28.07 | )% | | | (6.40 | )% |
Net assets, end of period (000’s omitted) | | $ | 6 | | | $ | 9 | |
Portfolio turnover rate(d) | | | 107 | % | | | 5 | % |
| |
Ratios/supplemental data based on average net assets: | | | | | |
Ratio of expenses: | | | | | | | | |
With fee waivers and/or expense reimbursements, before taxes | | | 1.25 | %(e) | | | 1.24 | %(f) |
Tax expense (benefit)(g) | | | 0 | %(e) | | | 0 | %(f) |
With fee waivers and/or expense reimbursements, after taxes(g) | | | 1.25 | %(e) | | | 1.24 | %(f) |
Without fee waivers and/or expense reimbursements, after taxes(g) | | | 6.10 | %(e) | | | 72.23 | %(f) |
Ratio of net investment income (loss), before taxes | | | (0.91 | )%(e) | | | (0.29 | )%(f) |
Ratio of net investment income (loss), after taxes(h) | | | (0.91 | )%(e) | | | (0.29 | )%(f) |
| (a) | Commencement date of August 29, 2014. |
| (b) | Calculated using average shares outstanding. |
| (c) | Includes adjustments in accordance with accounting principles generally accepted in the United States of America and as such, the net asset value for financial reporting purposes and the returns based upon those net asset values may differ from the net asset value and returns for shareholder transactions. Does not include sales charges and is not annualized for periods less than one year, if applicable. |
| (d) | Portfolio turnover is calculated at the fund level and is not annualized for periods less than one year, if applicable. |
| (e) | Ratios are based on average daily net assets (000’s omitted) of $8. |
| (g) | Ratio includes tax expense derived from net investment income (loss) and realized and unrealized gains (losses). |
| (h) | Ratio includes tax expense derived from net investment income (loss) only. |
24 Invesco MLP Fund
Report of Independent Registered Public Accounting Firm
To the Board of Trustees of AIM Investment Funds (Invesco Investment Funds)
and Shareholders of Invesco MLP Fund:
In our opinion, the accompanying statement of assets and liabilities, including the schedule of investments, and the related statements of operations and of changes in net assets and the financial highlights present fairly, in all material respects, the financial position of Invesco MLP Fund (one of the funds constituting AIM Investment Funds (Invesco Investment Funds), hereafter referred to as the “Fund”) at October 31, 2015, the results of its operations for the year then ended, the changes in its net assets and the financial highlights for the year then ended and for the period August 29, 2014 (commencement of operations) through October 31, 2014, in conformity with accounting principles generally accepted in the United States of America. These financial statements and financial highlights (hereafter referred to as “financial statements”) are the responsibility of the Fund’s management. Our responsibility is to express an opinion on these financial statements based on our audits. We conducted our audits of these financial statements in accordance with the standards of the Public Company Accounting Oversight Board (United States). Those standards require that we plan and perform the audit to obtain reasonable assurance about whether the financial statements are free of material misstatement. An audit includes examining, on a test basis, evidence supporting the amounts and disclosures in the financial statements, assessing the accounting principles used and significant estimates made by management, and evaluating the overall financial statement presentation. We believe that our audits, which included confirmation of securities at October 31, 2015 by correspondence with the custodian and brokers, and the application of alternative auditing procedures where confirmations of security purchases have not been received, provide a reasonable basis for our opinion.
PRICEWATERHOUSECOOPERS LLP
December 23, 2015
Houston, Texas
25 Invesco MLP Fund
Calculating your ongoing Fund expenses
Example
As a shareholder of the Fund, you incur two types of costs: (1) transaction costs, which may include sales charges (loads) on purchase payments or contingent deferred sales charges on redemptions, if any; and (2) ongoing costs, including management fees, distribution and/or service (12b-1) fees, and other Fund expenses. This example is intended to help you understand your ongoing costs (in dollars) of investing in the Fund and to compare these costs with ongoing costs of investing in other mutual funds. The example is based on an investment of $1,000 invested at the beginning of the period and held for the entire period May 1, 2015 through October 31, 2015.
Actual expenses
The table below provides information about actual account values and actual expenses. You may use the information in this table, together with the amount you invested, to estimate the expenses that you paid over the period. Simply divide your account value by $1,000 (for example, an $8,600 account value divided by $1,000 = 8.6), then multiply the result by the number in the table under the heading entitled “Actual Expenses Paid During Period” to estimate the expenses you paid on your account during this period.
Hypothetical example for comparison purposes
The table below also provides information about hypothetical account values and hypothetical expenses based on the Fund’s actual expense ratio and an assumed rate of return of 5% per year before expenses, which is not the Fund’s actual return.
The hypothetical account values and expenses may not be used to estimate the actual ending account balance or expenses you paid for the period. You may use this information to compare the ongoing costs of investing in the Fund and other funds. To do so, compare this 5% hypothetical example with the 5% hypothetical examples that appear in the shareholder reports of the other funds.
Please note that the expenses shown in the table are meant to highlight your ongoing costs only and do not reflect any transaction costs, such as sales charges (loads) on purchase payments or contingent deferred sales charges on redemptions, if any. Therefore, the hypothetical information is useful in comparing ongoing costs only, and will not help you determine the relative total costs of owning different funds. In addition, if these transaction costs were included, your costs would have been higher.
| | | | | | | | | | | | | | | | | | | | | | | | |
| Class | | Beginning
Account Value
(05/01/15) | | | ACTUAL | | | HYPOTHETICAL
(5% annual return before
expenses) | | | Annualized
Expense
Ratio | |
| | | Ending
Account Value
(10/31/15)1 | | | Expenses
Paid During
Period2 | | | Ending
Account Value
(10/31/15) | | | Expenses
Paid During
Period2 | | |
| A | | $ | 1,000.00 | | | $ | 758.30 | | | $ | 6.65 | | | $ | 1,017.64 | | | $ | 7.63 | | | | 1.50 | % |
| C | | | 1,000.00 | | | | 756.20 | | | | 9.95 | | | | 1,013.88 | | | | 11.41 | | | | 2.25 | |
| R | | | 1,000.00 | | | | 757.30 | | | | 7.74 | | | | 1,016.40 | | | | 8.88 | | | | 1.75 | |
| Y | | | 1,000.00 | | | | 760.50 | | | | 5.53 | | | | 1,018.92 | | | | 6.35 | | | | 1.25 | |
| R5 | | | 1,000.00 | | | | 760.50 | | | | 5.53 | | | | 1,018.92 | | | | 6.35 | | | | 1.25 | |
| R6 | | | 1,000.00 | | | | 760.50 | | | | 5.53 | | | | 1,018.92 | | | | 6.35 | | | | 1.25 | |
| 1 | The actual ending account value is based on the actual total return of the Fund for the period May 1, 2015 through October 31, 2015, after actual expenses and will differ from the hypothetical ending account value which is based on the Fund’s expense ratio and a hypothetical annual return of 5% before expenses. |
| 2 | Expenses are equal to the Fund’s annualized expense ratio as indicated above multiplied by the average account value over the period, multiplied by 184/365 to reflect the most recent fiscal half year. |
26 Invesco MLP Fund
Approval of Investment Advisory and Sub-Advisory Contracts
The Board of Trustees (the Board) of AIM Investment Funds (Invesco Investment Funds) is required under the Investment Company Act of 1940, as amended, to approve annually the renewal of Invesco MLP Fund’s (the Fund) investment advisory agreements. During contract renewal meetings held on June 9-10, 2015, the Board as a whole, and the disinterested or “independent” Trustees, who comprise over 75% of the Board, voting separately, approved the continuance for the Fund of the Master Investment Advisory Agreement with Invesco Advisers, Inc. (Invesco Advisers and the investment advisory agreement) and the Master Intergroup Sub-Advisory Contract for Mutual Funds with Invesco Asset Management Deutschland GmbH, Invesco Asset Management Limited, Invesco Asset Management (Japan) Limited, Invesco Hong Kong Limited, Invesco Senior Secured Management, Inc., Invesco Canada Ltd. and Invesco PowerShares Capital Management LLC (collectively, the Affiliated Sub-Advisers and the sub-advisory contracts) for another year, effective July 1, 2015.
In evaluating the fairness and reasonableness of compensation under the Fund’s investment advisory agreement and sub-advisory contracts, the Board considered, among other things, the factors discussed below. The Board determined that continuation of the Fund’s investment advisory agreement and the sub-advisory contracts is in the best interest of the Fund and its shareholders and that the compensation payable to Invesco Advisers and the Affiliated Sub-Advisers under the agreements is fair and reasonable.
The Board’s Fund Evaluation Process
The Board’s Investments Committee has established three Sub-Committees, each of which is primarily responsible for overseeing the performance and investment management services provided by Invesco Advisers and the Affiliated Sub-Advisers to a number of the funds advised by Invesco Advisers (the Invesco Funds). The Sub-Committees meet throughout the year to review the performance of their assigned Invesco Funds, including reviewing materials prepared under the direction of the independent Senior Officer, an officer of the Invesco Funds who reports directly to the independent Trustees. Over the course of each year, the Sub-Committees meet with portfolio managers for their assigned Invesco Funds and other members of management to review the performance, investment objective(s), policies, strategies, limitations and investment risks of these funds. The Board had the benefit of reports from the Sub-Committees and Investments Committee throughout the year in considering approval of the continuance of each Invesco Fund’s investment advisory agreement and sub-advisory contracts for another year.
During the contract renewal process, the Board receives comparative performance and fee data regarding the Invesco Funds prepared by Invesco Advisers and Lipper Inc. (Lipper), an independent provider of investment company data. The Board also receives a report and this independent written evaluation from the Senior Officer. The Senior Officer’s evaluation is prepared as part of his responsibility to manage the process by which the Invesco Funds’ proposed management fees are negotiated during the annual contract renewal process to ensure they are negotiated in a manner that is at arms’ length and reasonable. In addition to meetings with Invesco Advisers and fund counsel, the independent Trustees also discuss the continuance of the investment advisory agreement and sub-advisory contracts in separate sessions with the Senior Officer and with independent legal counsel.
The Trustees recognized that the advisory fee rates for the Invesco Funds are, in many cases, the result of years of review and negotiation. The Trustees’ deliberations and conclusions in a particular year may be based in part on their deliberations and conclusions regarding these arrangements throughout the year and in prior years. The Trustees’ review and conclusions are based on the comprehensive consideration of all information presented to them and are not the result of any single determinative factor. Moreover, one Trustee may have weighed a particular piece of information or factor differently than another Trustee.
The discussion below is a summary of the Senior Officer’s independent written evaluation with respect to the Fund’s investment advisory agreement as well as a discussion of the material factors and related conclusions that formed the basis for the Board’s approval of the Fund’s investment advisory agreement and sub-advisory contracts. Unless otherwise stated, this information is current as of June 10, 2015, and does not reflect consideration of factors that became known to the Board after that date.
Factors and Conclusions and Summary of Evaluation of Investment Advisory and Sub-Advisory Agreements
| A. | Nature, Extent and Quality of Services Provided by Invesco Advisers and the Affiliated Sub-Advisers |
The Board reviewed the advisory services provided to the Fund by Invesco Advisers under the Fund’s investment advisory agreement, the performance of Invesco Advisers in providing these services, and the credentials and experience of the officers and employees of Invesco Advisers who provide these services, including the Fund’s portfolio manager or managers. The Board’s review of the qualifications of Invesco Advisers to provide advisory services included the Board’s
consideration of Invesco Advisers’ investment
process oversight, independent credit analysis and investment risk management. The Board also considered non-advisory services that Invesco Advisers and its affiliates provide to the Invesco Funds such as various back office support functions, equity and fixed income trading operations, internal audit, distribution, valuation and legal and compliance.
In determining whether to continue the Fund’s investment advisory agreement, the Board considered the benefits of reapproving an existing relationship and the greater uncertainty that may be associated with entering into a new relationship. The Board concluded that the nature, extent and quality of the services provided to the Fund by Invesco Advisers are appropriate and satisfactory and consistent with the terms of the Fund’s investment advisory agreement.
The Board reviewed the services that may be provided by the Affiliated Sub-Advisers under the sub-advisory contracts and the credentials and experience of the officers and employees of the Affiliated Sub-Advisers who provide these services. The Board noted that the Affiliated Sub-Advisers have offices and personnel that are located in financial centers around the world. As a result, the Affiliated Sub-Advisers can provide research and investment analysis on the markets and economies of various countries in which the Fund may invest, make recommendations regarding securities and assist with security trades. The Board concluded that the sub-advisory contracts benefit the Fund and its shareholders by permitting Invesco Advisers to use the resources and talents of the Affiliated Sub-Advisers in managing the Fund. The Board concluded that the nature, extent and quality of the services that may be provided by the Affiliated Sub-Advisers are appropriate and satisfactory and consistent with the terms of the Fund’s sub-advisory contracts.
The Board noted that the Fund recently began operations and that no comparative performance data was available.
| C. | Advisory and Sub-Advisory Fees |
The Board noted that the Fund had not been in operation long enough to become profitable and that Invesco Advisers was continuing to take entrepreneurial risk in operating the Fund.
The Board noted that Invesco Advisers has contractually agreed to waive fees and/or limit expenses of the Fund through at least February 29, 2016 in an amount necessary to limit total annual operating expenses to a specified percentage of average daily net assets for each class of the Fund.
The Board noted that Invesco Advisers and the Affiliated Sub-Advisers do not manage other mutual funds or client accounts with investment strategies comparable to those of the Fund.
27 Invesco MLP Fund
The Board also considered the services that may be provided by the Affiliated Sub-Advisers pursuant to the sub-advisory contracts, as well as the fees payable by Invesco Advisers to the Affiliated Sub-Advisers pursuant to the sub-advisory contracts. The Board also noted that the sub-advisory fees are not paid directly by the Fund, but rather, are payable by Invesco Advisers to the Affiliated Sub-Advisers.
| D. | Economies of Scale and Breakpoints |
The Board considered the extent to which there are economies of scale in the provision of advisory services to the Fund. The Board also considered whether the Fund benefits from economies of scale through contractual breakpoints in the Fund’s advisory fee schedule. The Board also noted that the Fund shares directly in economies of scale through lower fees charged by third party service providers based on the combined size of the Invesco Funds and other clients advised by Invesco Advisers.
| E. | Profitability and Financial Resources |
The Board reviewed information from Invesco Advisers concerning the costs of the advisory and other services that Invesco Advisers and its affiliates provide to the Fund and the Invesco Funds and the profitability of Invesco Advisers and its affiliates in providing these services. The Board received information from Invesco Advisers about the methodology used to prepare the profitability information. The Board noted that Invesco Advisers continues to operate at a net profit from services Invesco Advisers and its affiliates provide to the Invesco Funds. The Board noted that although Invesco Advisers received a minimal amount of revenues from advising the Fund, Invesco Advisers and its subsidiaries did not make a profit from managing the Fund. The Board received and accepted information from Invesco Advisers demonstrating that Invesco Advisers and each Affiliated Sub-Adviser are financially sound and have the resources necessary to perform their obligations under the investment advisory agreement and sub-advisory contracts.
| F. | Collateral Benefits to Invesco Advisers and its Affiliates |
The Board considered various other benefits received by Invesco Advisers and its affiliates from the relationship with the Fund, including the fees received for providing transfer agency and distribution services to the Fund. The Board considered the performance of Invesco Advisers and its affiliates in providing these services and the organizational structure employed to provide these services. The Board also considered that these services are provided to the Fund pursuant to written contracts that are reviewed and approved on an annual basis by the Board; and that the services are required for the operation of the Fund.
The Board considered the benefits realized by Invesco Advisers and the Affiliated Sub-Advisers as a result of portfolio brokerage transactions executed through “soft dollar” arrangements. The Board noted that soft dollar arrangements shift the payment obligation for research
services from Invesco Advisers and the Affiliated Sub-Advisers to the Invesco Funds and that the research received may be used with other clients of Invesco Advisers and may reduce Invesco Advisers’ and the Affiliated Sub-Advisers’ expenses. The Board also considered that it receives periodic reports from the Chief Compliance Officer of the Invesco Funds demonstrating that these arrangements are consistent with regulatory requirements. The Board did not deem the soft dollar arrangements to be inappropriate.
The Board considered that the Fund’s uninvested cash and cash collateral from any securities lending arrangements may be invested in money market funds advised by Invesco Advisers pursuant to procedures approved by the Board. The Board noted that Invesco Advisers receives advisory fees from these affiliated money market funds attributable to such investments, although Invesco Advisers has contractually agreed to waive through varying periods the advisory fees payable by the Invesco Funds with respect to investments in the affiliated money market funds. The waiver is in an amount equal to 100% of the net advisory fee Invesco Advisers receives from the affiliated money market funds with respect to the Fund’s investment in the affiliated money market funds of uninvested cash, but not cash collateral. The Board concluded that the amount of advisory fees received by Invesco Advisors from the Fund’s investment of cash collateral from any securities lending arrangements in the affiliated money market funds is fair and reasonable.
The Board also considered the Fund may use an affiliated broker to execute certain trades for the Fund to, among other things, control information leakage, and were advised that such trades would be executed in compliance with rules under the Investment Company Act of 1940, as amended, and consistent with best execution obligations.
28 Invesco MLP Fund
Trustees and Officers
The address of each trustee and officer is AIM Investment Funds (Invesco Investment Funds) (the “Trust”), 11 Greenway Plaza, Suite 1000, Houston, Texas 77046-1173. The trustees serve for the life of the Trust, subject to their earlier death, incapacitation, resignation, retirement or removal as more specifically provided in the Trust’s organizational documents. Each officer serves for a one year term or until their successors are elected and qualified. Column two below includes length of time served with predecessor entities, if any.
| | | | | | | | |
Name, Year of Birth and
Position(s) Held with the Trust | | Trustee and/
or Officer Since | | Principal Occupation(s)
During Past 5 Years | | Number of Funds in Fund Complex Overseen by Trustee | | Other Directorship(s) Held by Trustee During Past 5 Years |
| Interested Persons | | | | | | | | |
| Martin L. Flanagan1 — 1960 Trustee | | 2007 | | Executive Director, Chief Executive Officer and President, Invesco Ltd. (ultimate parent of Invesco and a global investment management firm); Advisor to the Board, Invesco Advisers, Inc. (formerly known as Invesco Institutional (N.A.), Inc.); Trustee, The Invesco Funds; Vice Chair, Investment Company Institute; and Member of Executive Board, SMU Cox School of Business Formerly: Chairman and Chief Executive Officer, Invesco Advisers, Inc. (registered investment adviser); Director, Chairman, Chief Executive Officer and President, IVZ Inc. (holding company), INVESCO Group Services, Inc. (service provider) and Invesco North American Holdings, Inc. (holding company); Director, Chief Executive Officer and President, Invesco Holding Company Limited (parent of Invesco and a global investment management firm); Director, Invesco Ltd.; Chairman, Investment Company Institute and President, Co-Chief Executive Officer, Co-President, Chief Operating Officer and Chief Financial Officer, Franklin Resources, Inc. (global investment management organization). | | 145 | | None |
Philip A. Taylor2 — 1954
Trustee, President and Principal Executive Officer | | 2006 | | Head of North American Retail and Senior Managing Director, Invesco Ltd.; Director, Co-Chairman, Co-President and Co-Chief Executive Officer, Invesco Advisers, Inc. (formerly known as Invesco Institutional (N.A.), Inc.) (registered investment adviser); Director, Chairman, Chief Executive Officer and President, Invesco Management Group, Inc. (formerly known as Invesco Aim Management Group, Inc.) (financial services holding company); Director and President, INVESCO Funds Group, Inc. (registered investment adviser and registered transfer agent); Director and Chairman, Invesco Investment Services, Inc. (formerly known as Invesco Aim Investment Services, Inc.) (registered transfer agent) and IVZ Distributors, Inc. (formerly known as INVESCO Distributors, Inc.) (registered broker dealer); Chief Executive Officer, Invesco Corporate Class Inc. (corporate mutual fund company) Director, Chairman and Chief Executive Officer, Invesco Canada Ltd. (formerly known as Invesco Trimark Ltd./Invesco Trimark Ltèe) (registered investment adviser and registered transfer agent); Trustee, President and Principal Executive Officer, The Invesco Funds (other than AIM Treasurer’s Series Trust (Invesco Treasurer’s Series Trust), Short-Term Investments Trust and Invesco Management Trust); Trustee and Executive Vice President, The Invesco Funds (AIM Treasurer’s Series Trust (Invesco Treasurer’s Series Trust), Short-Term Investments Trust and Invesco Management Trust only); Director, Invesco Investment Advisers LLC (formerly known as Van Kampen Asset Management); Director, Chief Executive Officer and President, Van Kampen Exchange Corp. Formerly: Director, President and Chairman, Invesco Inc. (holding company), Invesco Canada Holdings Inc. (holding company), Trimark Investments Ltd./Placements Trimark Ltèe and Invesco Financial Services Ltd/Services Financiers Invesco Ltèe; Chief Executive Officer, Invesco Canada Fund Inc (corporate mutual fund company); Director and Chairman, Van Kampen Investor Services Inc.; Director, Chief Executive Officer and President, 1371 Preferred Inc. (holding company) and Van Kampen Investments Inc.; Director and President, AIM GP Canada Inc. (general partner for limited partnerships) and Van Kampen Advisors, Inc.; Director and Chief Executive Officer, Invesco Trimark Dealer Inc. (registered broker dealer); Director, Invesco Distributors, Inc. (formerly known as Invesco Aim Distributors, Inc.) (registered broker dealer); Manager, Invesco PowerShares Capital Management LLC; Director, Chief Executive Officer and President, Invesco Advisers, Inc.; Director, Chairman, Chief Executive Officer and President, Invesco Aim Capital Management, Inc.; President, Invesco Trimark Dealer Inc. and Invesco Trimark Ltd./Invesco Trimark Ltèe; Director and President, AIM Trimark Corporate Class Inc. and AIM Trimark Canada Fund Inc.; Senior Managing Director, Invesco Holding Company Limited; Director and Chairman, Fund Management Company (former registered broker dealer); President and Principal Executive Officer, The Invesco Funds (AIM Treasurer’s Series Trust (Invesco Treasurer’s Series Trust), and Short-Term Investments Trust only); President, AIM Trimark Global Fund Inc. and AIM Trimark Canada Fund Inc.. | | 145 | | None |
| 1 | Mr. Flanagan is considered an interested person (within the meaning of Section 2(a)(19) of the 1940 Act) of the Trust because he is an officer of the Adviser to the Trust, and an officer and a director of Invesco Ltd., ultimate parent of the Adviser. |
| 2 | Mr. Taylor is considered an interested person (within the meaning of Section 2(a)(19) of the 1940 Act) of the Trust because he is an officer and a director of the Adviser. |
T-1 Invesco MLP Fund
Trustees and Officers—(continued)
| | | | | | | | |
Name, Year of Birth and Position(s) Held with the Trust | | Trustee and/ or Officer Since | | Principal Occupation(s) During Past 5 Years | | Number of Funds in Fund Complex Overseen by Trustee | | Other Directorship(s) Held by Trustee During Past 5 Years |
| Independent Trustees | | | | | | | | |
Bruce L. Crockett — 1944 Trustee and Chair | | 2003 | | Chairman, Crockett Technologies Associates (technology consulting company) Formerly: Director, Captaris (unified messaging provider); Director, President and Chief Executive Officer, COMSAT Corporation; Chairman, Board of Governors of INTELSAT (international communications company); ACE Limited (insurance company); Independent Directors Council and Investment Company Institute | | 145 | | ALPS (Attorneys Liability Protection Society) (insurance company) and Globe Specialty Metals, Inc. (metallurgical company) |
David C. Arch — 1945 Trustee | | 2010 | | Chairman of Blistex Inc., a consumer health care products manufacturer | | 145 | | Board member of the Illinois Manufacturers’ Association; Member of the Board of Visitors, Institute for the Humanities, University of Michigan; Member of the Audit Committee of the Edward-Elmhurst Hospital |
James T. Bunch — 1942 Trustee | | 2000 | | Managing Member, Grumman Hill Group LLC (family office/private equity investments) Formerly: Founder, Green Manning & Bunch Ltd. (investment banking firm) (1988-2010); Executive Committee, United States Golf Association; and Chairman, Board of Governors, Western Golf Association | | 145 | | Chairman of the Board of Trustees, Evans Scholars Foundation; and Chairman of the Board, Denver Film Society |
Rodney F. Dammeyer — 1940 Trustee | | 2010 | | Chairman of CAC, LLC, (private company offering capital investment and management advisory services) Formerly: Prior to 2001, Managing Partner at Equity Group Corporate Investments; Prior to 1995, Chief Executive Officer of Itel Corporation (formerly Anixter International); Prior to 1985, experience includes Senior Vice President and Chief Financial Officer of Household International, Inc., Executive Vice President and Chief Financial Officer of Northwest Industries, Inc. and Partner of Arthur Andersen & Co.; From 1987 to 2010, Director/Trustee of investment companies in the Van Kampen Funds complex | | 145 | | Director of Quidel Corporation and Stericycle, Inc. |
Albert R. Dowden — 1941 Trustee | | 2003 | | Director of a number of public and private business corporations, including the Boss Group, Ltd. (private investment and management); Nature’s Sunshine Products, Inc. and Reich & Tang Funds (5 portfolios) (registered investment company) Formerly: Director, Homeowners of America Holding Corporation/Homeowners of America Insurance Company (property casualty company); Director, Continental Energy Services, LLC (oil and gas pipeline service); Director, CompuDyne Corporation (provider of product and services to the public security market) and Director, Annuity and Life Re (Holdings), Ltd. (reinsurance company); Director, President and Chief Executive Officer, Volvo Group North America, Inc.; Senior Vice President, AB Volvo; Director of various public and private corporations; Chairman, DHJ Media, Inc.; Director, Magellan Insurance Company; and Director, The Hertz Corporation, Genmar Corporation (boat manufacturer), National Media Corporation; Advisory Board of Rotary Power International (designer, manufacturer, and seller of rotary power engines); and Chairman, Cortland Trust, Inc. (registered investment company) | | 145 | | Director of: Nature’s Sunshine Products, Inc., Reich & Tang Funds, Homeowners of America Holding Corporation/ Homeowners of America Insurance Company, the Boss Group |
Jack M. Fields — 1952 Trustee | | 2003 | | Chief Executive Officer, Twenty First Century Group, Inc. (government affairs company); Owner and Chief Executive Officer, Dos Angeles Ranch, L.P. (cattle, hunting, corporate entertainment); and Discovery Global Education Fund (non-profit) Formerly: Chief Executive Officer, Texana Timber LP (sustainable forestry company); Director of Cross Timbers Quail Research Ranch (non-profit); and member of the U.S. House of Representatives | | 145 | | Insperity, Inc. (formerly known as Administaff) |
Prema Mathai-Davis — 1950 Trustee | | 2003 | | Retired. Formerly: Chief Executive Officer, YWCA of the U.S.A. | | 145 | | None |
Larry Soll — 1942 Trustee | | 1997 | | Retired. Formerly: Chairman, Chief Executive Officer and President, Synergen Corp. (a biotechnology company) | | 145 | | None |
Hugo F. Sonnenschein — 1940 Trustee | | 2010 | | President Emeritus and Honorary Trustee of the University of Chicago and the Adam Smith Distinguished Service Professor in the Department of Economics at the University of Chicago. Prior to 2000, President of the University of Chicago | | 145 | | Trustee of the University of Rochester and a member of its investment committee; Member of the National Academy of Sciences and the American Philosophical Society; Fellow of the American Academy of Arts and Sciences |
Raymond Stickel, Jr. — 1944 Trustee | | 2005 | | Retired. Formerly: Director, Mainstay VP Series Funds, Inc. (25 portfolios) and Partner, Deloitte & Touche | | 145 | | None |
T-2 Invesco MLP Fund
Trustees and Officers—(continued)
| | | | | | | | |
Name, Year of Birth and Position(s) Held with the Trust | | Trustee and/ or Officer Since | | Principal Occupation(s) During Past 5 Years | | Number of Funds in Fund Complex Overseen by Trustee | | Other Directorship(s) Held by Trustee During Past 5 Years |
| Independent Trustees—(continued) |
Suzanne H. Woolsey — 1941 Trustee | | 2014 | | Chief Executive Officer of Woolsey Partners LLC | | 145 | | Emeritus Chair of the Board of Trustees of the Institute for Defense Analyses; Trustee of Colorado College; Trustee of California Institute of Technology; Prior to 2014, Director of Fluor Corp.; Prior to 2010, Trustee of the German Marshall Fund of the United States; Prior to 2010 Trustee of the Rocky Mountain Institute |
| Other Officers | | | | | | | | |
Russell C. Burk — 1958
Senior Vice President and Senior Officer | | 2005 | | Senior Vice President and Senior Officer, The Invesco Funds | | N/A | | N/A |
John M. Zerr — 1962
Senior Vice President, Chief Legal Officer and Secretary | | 2006 | | Director, Senior Vice President, Secretary and General Counsel, Invesco Management Group, Inc. (formerly known as Invesco Aim Management Group, Inc.) and Van Kampen Exchange Corp.; Senior Vice President, Invesco Advisers, Inc. (formerly known as Invesco Institutional (N.A.), Inc.) (registered investment adviser); Senior Vice President and Secretary, Invesco Distributors, Inc. (formerly known as Invesco Aim Distributors, Inc.); Director, Vice President and Secretary, Invesco Investment Services, Inc. (formerly known as Invesco Aim Investment Services, Inc.) and IVZ Distributors, Inc. (formerly known as INVESCO Distributors, Inc.); Director and Vice President, INVESCO Funds Group, Inc.; Senior Vice President, Chief Legal Officer and Secretary, The Invesco Funds; Managing Director, Invesco PowerShares Capital Management LLC; Director, Secretary and General Counsel, Invesco Investment Advisers LLC (formerly known as Van Kampen Asset Management); Secretary and General Counsel, Invesco Capital Markets, Inc. (formerly known as Van Kampen Funds Inc.) and Chief Legal Officer, PowerShares Exchange-Traded Fund Trust, PowerShares Exchange-Traded Fund Trust II, PowerShares India Exchange-Traded Fund Trust, PowerShares Actively Managed Exchange-Traded Fund Trust, and PowerShares Actively Managed Exchange-Traded Commodity Fund Trust Formerly: Director and Vice President, Van Kampen Advisors Inc.; Director, Vice President, Secretary and General Counsel, Van Kampen Investor Services Inc.; Director, Invesco Distributors, Inc. (formerly known as Invesco Aim Distributors, Inc.); Director, Senior Vice President, General Counsel and Secretary, Invesco Aim Advisers, Inc. and Van Kampen Investments Inc.; Director, Vice President and Secretary, Fund Management Company; Director, Senior Vice President, Secretary, General Counsel and Vice President, Invesco Aim Capital Management, Inc.; Chief Operating Officer and General Counsel, Liberty Ridge Capital, Inc. (an investment adviser); Vice President and Secretary, PBHG Funds (an investment company) and PBHG Insurance Series Fund (an investment company); Chief Operating Officer, General Counsel and Secretary, Old Mutual Investment Partners (a broker-dealer); General Counsel and Secretary, Old Mutual Fund Services (an administrator) and Old Mutual Shareholder Services (a shareholder servicing center); Executive Vice President, General Counsel and Secretary, Old Mutual Capital, Inc. (an investment adviser); and Vice President and Secretary, Old Mutual Advisors Funds (an investment company) | | N/A | | N/A |
Sheri Morris — 1964
Vice President, Treasurer and Principal Financial Officer | | 2003 | | Vice President, Treasurer and Principal Financial Officer, The Invesco Funds; Vice President, Invesco Advisers, Inc. (formerly known as Invesco Institutional (N.A.), Inc.) (registered investment adviser); and Vice President, PowerShares Exchange-Traded Fund Trust, PowerShares Exchange-Traded Fund Trust II, PowerShares India Exchange-Traded Fund Trust, PowerShares Actively Managed Exchange-Traded Fund Trust, and PowerShares Actively Managed Exchange-Traded Commodity Fund Trust Formerly: Vice President, Invesco Aim Advisers, Inc., Invesco Aim Capital Management, Inc. and Invesco Aim Private Asset Management, Inc.; Assistant Vice President and Assistant Treasurer, The Invesco Funds and Assistant Vice President, Invesco Advisers, Inc., Invesco Aim Capital Management, Inc. and Invesco Aim Private Asset Management, Inc.; and Treasurer, PowerShares Exchange-Traded Fund Trust, PowerShares Exchange-Traded Fund Trust II, PowerShares India Exchange-Traded Fund Trust and PowerShares Actively Managed Exchange-Traded Fund Trust | | N/A | | N/A |
T-3 Invesco MLP Fund
Trustees and Officers—(continued)
| | | | | | | | |
Name, Year of Birth and
Position(s) Held with the Trust | | Trustee and/
or Officer Since | | Principal Occupation(s)
During Past 5 Years | | Number of Funds in Fund Complex Overseen by Trustee | | Other Directorship(s) Held by Trustee During Past 5 Years |
| Other Officers—(continued) | | | | | | | | |
Karen Dunn Kelley — 1960
Vice President | | 2003 | | Senior Managing Director, Investments, Invesco Ltd.; Director, Co-President, Co-Chief Executive Officer, and Co-Chairman, Invesco Advisers, Inc. (formerly known as Invesco Institutional (N.A.), Inc.) (registered investment adviser); Chairman, Invesco Senior Secured Management, Inc.; Senior Vice President, Invesco Management Group, Inc. (formerly known as Invesco Aim Management Group, Inc.); Executive Vice President, Invesco Distributors, Inc. (formerly known as Invesco Aim Distributors, Inc.); Director, Invesco Mortgage Capital Inc. and Invesco Management Company Limited; Vice President, The Invesco Funds (other than AIM Treasurer’s Series Trust (Invesco Treasurer’s Series Trust), Short-Term Investments Trust and Invesco Management Trust); and President and Principal Executive Officer, The Invesco Funds (AIM Treasurer’s Series Trust (Invesco Treasurer’s Series Trust), Short-Term Investments Trust and Invesco Management Trust only) Formerly: Director and President, INVESCO Asset Management (Bermuda) Ltd., Director, INVESCO Global Asset Management Limited and INVESCO Management S.A.; Senior Vice President, Van Kampen Investments Inc. and Invesco Advisers, Inc. (formerly known as Invesco Institutional (N.A.), Inc.) (registered investment adviser); Vice President, Invesco Advisers, Inc. (formerly known as Invesco Institutional (N.A.), Inc.); Director of Cash Management and Senior Vice President, Invesco Advisers, Inc. and Invesco Aim Capital Management, Inc.; Director and President, Fund Management Company; Chief Cash Management Officer, Director of Cash Management, Senior Vice President, and Managing Director, Invesco Aim Capital Management, Inc.; Director of Cash Management, Senior Vice President, and Vice President, Invesco Advisers, Inc. and The Invesco Funds (AIM Treasurer’s Series Trust (Invesco Treasurer’s Series Trust), and Short-Term Investments Trust only) | | N/A | | N/A |
Crissie M. Wisdom — 1969 Anti-Money Laundering Compliance Officer | | 2013 | | Anti-Money Laundering Compliance Officer, Invesco Advisers, Inc. (formerly known as Invesco Institutional (N.A.), Inc.) (registered investment adviser), Invesco Capital Markets, Inc. (formerly known as Van Kampen Funds Inc.), Invesco Distributors, Inc., Invesco Investment Services, Inc., Invesco Management Group, Inc., Van Kampen Exchange Corp., The Invesco Funds, and PowerShares Exchange-Traded Fund Trust, PowerShares Exchange-Traded Fund Trust II, PowerShares India Exchange-Traded Fund Trust, PowerShares Actively Managed Exchange-Traded Fund Trust and PowerShares Actively Managed Exchange-Traded Commodity Fund Trust; Anti-Money Laundering Compliance Officer and Bank Secrecy Act Officer, INVESCO National Trust Company and Invesco Trust Company; and Fraud Prevention Manager and Controls and Risk Analysis Manager for Invesco Investment Services, Inc.. | | N/A | | N/A |
Lisa O. Brinkley — 1959 Chief Compliance Officer | | 2015 | | Senior Vice President and Chief Compliance Officer, Invesco Advisers, Inc. (registered investment adviser) (formerly known as Invesco Institutional (N.A., Inc.); and Chief Compliance Officer, The Invesco Funds Formerly: Global Assurance Officer, Invesco Ltd. and Vice President, The Invesco Funds; Chief Compliance Officer, Invesco Distributors, Inc. (formerly known as Invesco Aim Distributors, Inc.), Invesco Investment Services, Inc.(formerly known as Invesco Aim Investment Services, Inc.) and Van Kampen Investor Services Inc.; Senior Vice President, Invesco Management Group, Inc.; Senior Vice President and Chief Compliance Officer, Invesco Advisers, Inc. and The Invesco Funds; Vice President and Chief Compliance Officer, Invesco Aim Capital Management, Inc. and Invesco Distributors, Inc.; Vice President, Invesco Investment Services, Inc. and Fund Management Company. | | N/A | | N/A |
The Statement of Additional Information of the Trust includes additional information about the Fund’s Trustees and is available upon request, without charge, by calling 1.800.959.4246. Please refer to the Fund’s prospectus for information on the Fund’s sub-advisers.
| | | | | | |
Office of the Fund 11 Greenway Plaza, Suite 1000 Houston, TX 77046-1173 | | Investment Adviser Invesco Advisers, Inc. 1555 Peachtree Street, N.E. Atlanta, GA 30309 | | Distributor
Invesco Distributors, Inc. 11 Greenway Plaza, Suite 1000 Houston, TX 77046-1173 | | Auditors PricewaterhouseCoopers LLP 1000 Louisiana Street, Suite 5800 Houston, TX 77002-5678 |
| | | |
| | | | | | |
Counsel to the Fund Stradley Ronon Stevens & Young, LLP 2005 Market Street, Suite 2600 Philadelphia, PA 19103-7018 | | Counsel to the Independent Trustees Goodwin Procter LLP 901 New York Avenue, N.W. Washington, D.C. 20001 | | Transfer Agent Invesco Investment Services, Inc. 11 Greenway Plaza, Suite 1000 Houston, TX 77046-1173 | | Custodian State Street Bank and Trust Company 225 Franklin Street Boston, MA 02110-2801 |
T-4 Invesco MLP Fund

Invesco mailing information
Send general correspondence to Invesco Investment Services, Inc., P.O. Box 219078, Kansas City, MO 64121-9078.
Important notice regarding delivery of security holder documents
To reduce Fund expenses, only one copy of most shareholder documents may be mailed to shareholders with multiple accounts at the same address (Householding). Mailing of your shareholder documents may be householded indefinitely unless you instruct us otherwise. If you do not want the mailing of these documents to be combined with those for other members of your household, please contact Invesco Investment Services, Inc. at 800 959 4246 or contact your financial institution. We will begin sending you individual copies for each account within 30 days after receiving your request.
Fund holdings and proxy voting information
The Fund provides a complete list of its holdings four times in each fiscal year, at the quarter ends. For the second and fourth quarters, the lists appear in the Fund’s semiannual and annual reports to shareholders. For the first and third quarters, the Fund files the lists with the Securities and Exchange Commission (SEC) on Form N-Q. The most recent list of portfolio holdings is available at invesco.com/completeqtrholdings. Shareholders can also look up the Fund’s Forms N-Q on the SEC website at sec.gov. Copies of the Fund’s Forms N-Q may be reviewed and copied at the SEC Public Reference Room in Washington, D.C. You can obtain information on the operation of the Public Reference Room, including information about duplicating fee charges, by calling 202 551 8090 or 800 732 0330, or by electronic request at the following email address: publicinfo@sec.gov. The SEC file numbers for the Fund are shown below.
A description of the policies and procedures that the Fund uses to determine how to vote proxies relating to portfolio securities is available without charge, upon request, from our Client Services department at 800 959 4246 or at invesco.com/proxyguidelines. The information is also available on the SEC website, sec.gov.
| | |
Information regarding how the Fund voted proxies related to its portfolio securities during the most recent 12-month period ended June 30 is available at invesco.com/proxysearch. The information is also available on the SEC website, sec.gov. Invesco Advisers, Inc. is an investment adviser; it provides investment advisory services to individual and institutional clients and does not sell securities. Invesco Distributors, Inc. is the US distributor for Invesco Ltd.’s retail mutual funds, exchange-traded funds and institutional money market funds. Both are wholly owned, indirect subsidiaries of Invesco Ltd. | |  |
| | | | |
| SEC file numbers: 811-05426 and 033-19338 | | MLP-AR-1 | | Invesco Distributors, Inc. |
| | | | |
| | |
 | | Annual Report to Shareholders | | October 31, 2015 |
| | |
| | Invesco Pacific Growth Fund |
| | Nasdaq: |
| | A: TGRAX n B: TGRBX n C: TGRCX n R: TGRRX n Y: TGRDX n R5: TGRSX |

Letters to Shareholders
| | |

Philip Taylor | | Dear Shareholders: This annual report includes information about your Fund, including performance data and a complete list of its investments as of the close of the reporting period. Inside is a discussion of how your Fund was managed and the factors that affected its performance during the reporting period. I hope you find this report of interest. The US economy expanded and unemployment declined throughout the reporting period. Continuing low energy prices benefited consumers, but a strong US dollar crimped corporate profits. The US Federal Reserve signaled that it was increasingly likely to raise interest rates, based on generally positive economic data, but uncertainty remained about when it might act. Overseas, the story was much different. Low energy prices hurt the economies of some oil-producing nations, such as Brazil and Russia. During the reporting period, the European Central |
Bank as well as central banks in China and Japan – among other countries – either instituted or maintained extraordinarily accommodative monetary policies in response to economic weakness. Investor uncertainty, such as we saw for much of the reporting period – and market volatility, such as we saw at the end of the reporting period – are unfortunate facts of life when it comes to investing. Some investors use these things as excuses to delay saving and investing for their long-term financial goals. That’s why Invesco encourages investors to work with a professional financial adviser who can stress the importance of starting to save and invest early and the importance of adhering to a disciplined investment plan – when times are good and when they’re uncertain. A financial adviser who knows your unique financial situation, investment goals and risk tolerance can be an invaluable partner as you seek to achieve your financial goals. He or she can offer a long-term perspective when markets are volatile and time-tested advice and guidance when your financial situation or investment goals change. |
Timely information when and where you want it
Invesco’s efforts to help investors achieve their financial objectives include providing individual investors and financial professionals with timely information about the markets, the economy and investing – whenever and wherever they want it.
Our website, invesco.com/us, offers a wide range of market insights and investment perspectives. On the website, you’ll find detailed information about our funds, including prices, performance, holdings and portfolio manager commentaries. You can access information about your account by completing a simple, secure online registration. Click on the “Need to register” link in the “Account Access” box on our homepage to get started.
Invesco’s mobile apps for iPhone® and iPad® (both available free from the App StoreSM) allow you to obtain the same detailed information, monitor your account and create customizable watch lists. Also, they allow you to access investment insights from our investment leaders, market strategists, economists and retirement experts. You can sign up to be alerted when new commentary is added, and you can watch portfolio manager videos and have instant access to Invesco news and updates wherever you may be.
In addition to the resources accessible on our website and through our mobile app, you can obtain timely updates to help you stay informed about the markets, the economy and investing by connecting with Invesco on Twitter, LinkedIn or Facebook. You can access our blog at blog.invesco.us.com. Our goal is to provide you the information you want, when and where you want it.
Have questions?
For questions about your account, feel free to contact an Invesco client services representative at 800 959 4246. For Invesco-related questions or comments, please email me directly at phil@invesco.com.
All of us at Invesco look forward to serving your investment management needs for many years to come. Thank you for investing with us.
Sincerely,

Philip Taylor
Senior Managing Director, Invesco Ltd.
iPhone and iPad are trademarks of Apple Inc., registered in the US and other countries. App Store is a service mark of Apple Inc. Invesco Distributors, Inc. is not affiliated with Apple Inc.
|
| 2 �� Invesco Pacific Growth Fund |
| | |

Bruce Crockett | | Dear Fellow Shareholders: Among the many important lessons I’ve learned in more than 40 years in a variety of business endeavors is the value of a trusted advocate. As independent chair of the Invesco Funds Board, I can assure you that the members of the Board are strong advocates for the interests of investors in Invesco’s mutual funds. We work hard to represent your interests through oversight of the quality of the investment management services your funds receive and other matters important to your investment, including but not limited to: n Ensuring that Invesco offers a diverse lineup of mutual funds that your financial adviser can use to strive to meet your financial needs as your investment goals change over time. n Monitoring how the portfolio management teams of the Invesco funds are performing in light of changing economic and market conditions. |
| n | | Assessing each portfolio management team’s investment performance within the context of the investment strategy described in the fund’s prospectus. |
| n | | Monitoring for potential conflicts of interests that may impact the nature of the services that your funds receive. |
We believe one of the most important services we provide our fund shareholders is the annual review of the funds’ advisory and sub-advisory contracts with Invesco Advisers and its affiliates. This review is required by the Investment Company Act of 1940 and focuses on the nature and quality of the services Invesco provides as the adviser to the Invesco funds and the reasonableness of the fees that it charges for those services. Each year, we spend months carefully reviewing information received from Invesco and a variety of independent sources, such as performance and fee data prepared by Lipper Inc., an independent, third-party firm widely recognized as a leader in its field. We also meet with our independent legal counsel and other independent advisers to review and help us assess the information that we have received. Our goal is to assure that you receive quality investment management services for a reasonable fee.
I trust the measures outlined above provide assurance that you have a worthy advocate when it comes to choosing the Invesco Funds.
As always, please contact me at bruce@brucecrockett.com with any questions or concerns you may have. On behalf of the Board, we look forward to continuing to represent your interests and serving your needs.
Sincerely,

Bruce L. Crockett
Independent Chair
Invesco Funds Board of Trustees
|
| 3 Invesco Pacific Growth Fund |
Management’s Discussion of Fund Performance
Performance summary
For the fiscal year ended October 31, 2015, Class A shares of Invesco Pacific Growth Fund (the Fund), at net asset value (NAV), outperformed the MSCI All Country Asia Pacific Index, the Fund’s style-specific benchmark.
Your Fund’s long-term performance appears later in this report.
Fund vs. Indexes
Total returns, 10/31/14 to 10/31/15, at net asset value (NAV). Performance shown does not include applicable contingent deferred sales charges (CDSC) or front-end sales charges, which would have reduced performance.
| | | | | |
Class A Shares | | | | -1.92 | % |
Class B Shares | | | | -2.65 | |
Class C Shares | | | | -2.60 | |
Class R Shares | | | | -2.14 | |
Class Y Shares | | | | -1.67 | |
Class R5 Shares | | | | -1.51 | |
MSCI EAFE Index▼ (Broad Market Index) | | | | -0.07 | |
MSCI All Country Asia Pacific Index▼ (Style-Specific Index) | | | | -2.91 | |
Lipper Pacific Region Funds Index¢ (Peer Group Index) | | | | -3.03 | |
| |
Source(s): ▼FactSet Research Systems Inc.; ¢Lipper Inc. | | | | | |
Market conditions and your Fund
International markets experienced increased volatility during the fiscal year ended October 31, 2015, driven largely by the continued slowdown in energy markets and the economic downturn in China. Developed markets were generally able to withstand these headwinds, even as more fragile emerging markets began to falter.
Economic growth continued to decelerate across the Asia Pacific region over the reporting period. Domestic Asian economies were not robust enough to offset weakness in commodities and exports, and both revenue and earnings expectations for many companies in the region were adjusted downward over the reporting period.
Early in the fiscal year, monetary policy easing caused many markets to rise, including China, India, South Korea, the Philippines and Indonesia. Most of these
gains were wiped out in the third quarter of 2015 as falling commodity prices, disappointing earnings and weakening currencies plagued the region.
In the summer of 2015, Asian economies were particularly volatile as fears of a potential economic slowdown in China dominated headlines. The combination of a slowing Chinese economy, a sharp sell-off in domestic Chinese equities and the devaluation of China’s currency, the renminbi, contributed to a strong correction in global equity markets. Emerging markets, in particular, were hard hit by events in China and by continued weak commodity prices – as well as by the US Federal Reserve’s decision to delay raising interest rates, which increased investor uncertainty and market volatility.
Despite a rough start to the reporting period amid poor domestic economic readings and concerns over negative consequences of the end of US quantitative easing, Japanese equities posted a gain
for the fiscal year. While Japan was not immune to the headwinds markets faced during the reporting period, it outperformed its Asia ex-Japan peers as investors rotated from emerging to developed market assets. In the fourth quarter of 2014, markets were boosted when the Bank of Japan initiated a sizeable expansion in its monetary easing measures and decided to delay a scheduled tax hike. Equities were also helped by investors’ expectations that Japanese corporate earnings would grow faster due to significant improvement in corporate governance. The Japanese yen depreciated mildly during the reporting period while many other currencies in the region declined sharply.
On a geographic basis, positive stock selection in South Korea was the leading contributor to both absolute and relative Fund performance. Stock selection in India and Australia contributed to relative outperformance versus the MSCI All Country Asia Pacific Index, as well. Underweight exposure versus the style-specific benchmark in Hong Kong also helped relative performance.
In contrast, negative stock selection and minor underweight exposure to Japan were the leading detractors from relative performance versus the style-specific benchmark. Overweight exposure in the slumping Chinese and Indonesian markets also detracted from relative results.
At the sector level, stock selection and overweight exposure in the consumer discretionary sector led relative outperformance versus the MSCI All Country Asia Pacific Index. South Korean kitchen and interior furniture manufacturer, Hanssem, was the largest contributor to Fund performance during the reporting period. The company’s stock price rose late in the reporting period as
| | |
| Portfolio Composition | | |
By sector | | % of total net assets |
| |
| Industrials | | 20.1% |
| Financials | | 18.2 |
Information Technology | | 15.3 |
| Consumer Discretionary | | 14.9 |
| Consumer Staples | | 9.8 |
| Health Care | | 8.0 |
| Utilities | | 5.6 |
| Telecommunications Services | | 3.3 |
| Materials | | 1.4 |
| Energy | | 1.3 |
Money Market Funds Plus Other Assets Less Liabilities | | 2.1 |
| | | | |
Top 10 Equity Holdings* |
| | | | % of total net assets |
| | | | |
| | |
| 1. | | Tencent Holdings Ltd. | | 4.0% |
| 2. | | AIA Group Ltd. | | 3.8 |
| 3. | | Westpac Banking Corp. | | 3.1 |
| 4. | | Maruti Suzuki India Ltd. | | 2.9 |
| 5. | | APA group | | 2.8 |
| 6. | | Taiwan Semiconductor Manufacturing Co. Ltd. | | 2.7 |
| 7. | | Nongshim Co., Ltd. | | 2.5 |
| 8. | | Bumrungrad Hospital PCL | | 2.5 |
| 9. | | AMOREPACIFIC Group | | 2.5 |
| 10. | | Bank of China ltd. - Class H | | 2.4 |
| | | | | |
| Total Net Assets | | | | $75.6 million | |
| |
| Total Number of Holdings* | | | | 56 | |
The Fund’s holdings are subject to change, and there is no assurance that the Fund will continue to hold any particular security.
*Excluding money market fund holdings.
Data presented here are as of October 31, 2015.
|
| 4 Invesco Pacifc Growth Fund |
the company was chosen as the official sponsor of the furniture sector for the Military World Games. We sold the holding before the reporting period ended. Bharat Forge, an Indian engineering company that manufactures safety components for automotive and non-automotive sectors, was also a leading contributor to Fund performance during the reporting period.
Stock selection and overweight exposure in the consumer staples sector also contributed to relative performance. South Korean food manufacturer, Ottogi was the leading contributor to Fund performance within the sector. Ottogi produces more than 2,000 food and drink products, including instant noodles, cooking oil, tempura flour, canned food, mayonnaise, ketchup, vinegar and others. The company was boosted in the summer of 2015 when it began building a large processing plant in Vietnam.
Despite being a detractor from absolute performance during the reporting period, underweight exposure to the weakened energy sector, the worst-performing sector in the style-specific index during the fiscal year, was also a contributor to relative performance. The Fund benefited from its minimal exposure in the sector as energy prices dropped sharply during the reporting period and several companies within the style-specific index declined significantly.
Conversely, stock selection in the information technology sector was the leading detractor from Fund performance versus the style-specific index. Largan Precision, a technology company based in Tai-wan, was the leading detractor from relative performance in the sector. The company provides optical lenses and lens sets for electronic equipment. Largan Precision is a key supplier for Apple (not a Fund holding) and the company was negatively affected by a report released showing lower-than-expected July sales results and a weaker outlook for Apple. Yaskawa Electric, a manufacturer of servomotors and industrial robots in Japan, was also a detractor from Fund performance during the reporting period. We sold the holding before the reporting period ended.
Stock selection in the telecommunication services sector was also a detractor from relative performance versus the style-specific index. Telstra, one of the leading telecommunication companies in Australia, was the largest detractor from relative performance in the sector. The company’s share price fell during the reporting period as economic concerns in Australia weighed on investors. Stock selection in the financials sector detracted from relative performance, as well.
During the reporting period, the Fund decreased its number of holdings from roughly 150 to 61 companies that were held in high conviction. With a more cautious outlook toward emerging markets amid a stronger US dollar, we have reduced our exposure to Asia ex-Japan and rotated to Japan, where monetary policy easing and enhanced corporate governance is supporting corporate earnings.
We continue to look for stocks that have a competitive edge to successfully expand businesses in the long term, and stocks with positive fundamentals and prospects that have not been priced across a broad range of sectors.
We thank you for your continued investment in Invesco Pacific Growth Fund.
The views and opinions expressed in management’s discussion of Fund performance are those of Invesco Advisers, Inc. These views and opinions are subject to change at any time based on factors such as market and economic conditions. These views and opinions may not be relied upon as investment advice or recommendations, or as an offer for a particular security. The information is not a complete analysis of every aspect of any market, country, industry, security or the Fund. Statements of fact are from sources considered reliable, but Invesco Advisers, Inc. makes no representation or warranty as to their completeness or accuracy. Although historical performance is no guarantee of future results, these insights may help you understand our investment management philosophy.
See important Fund and, if applicable, index disclosures later in this report.
| | |
 | | Paul Chan Chartered Financial Analyst, Portfolio Manager, is manager of Invesco Pacific Growth Fund. He |
joined Invesco in 2001. Mr. Chan earned a BS in economics from the University of Manitoba. |
 | | Daiji Ozawa Chartered Financial Analyst, Portfolio Manager, is manager of Invesco Pacific Growth Fund. He |
| joined Invesco in 2010. Mr. Ozawa earned a BA in political science from Waseda University. |
5 Invesco Pacific Growth Fund
Your Fund’s Long-Term Performance
Results of a $10,000 Investment – Oldest Share Class(es)
Fund and index data from 10/31/05
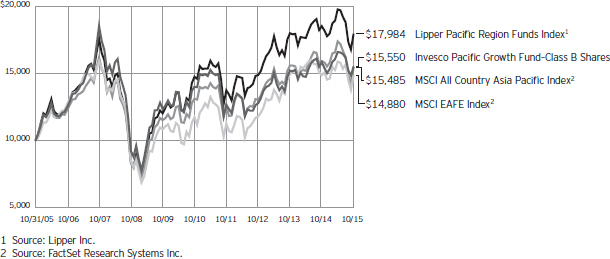
Past performance cannot guarantee comparable future results.
The data shown in the chart include reinvested distributions, applicable sales charges and Fund expenses including management fees. Results for Class B shares are calculated as if a hypothetical
shareholder had liquidated his entire investment in the Fund at the close of the reporting period and paid the contingent deferred sales charges, if applicable. Index results include reinvested dividends, but they do not reflect sales charges. Performance of the peer group,
if applicable, reflects fund expenses and management fees; performance of a market index does not. Performance shown in the chart and table(s) does not reflect deduction of taxes a shareholder would pay on Fund distributions or sale of Fund shares.
continued from page 8
mid-sized companies may be more volatile due to less market interest and less publicly available information about the issuer. They also may be illiquid or restricted as to resale, or may trade less frequently and in smaller volumes, all of which may cause difficulty when establishing or closing a position at a desirable price.
About indexes used in this report
| n | | The MSCI EAFE® Index is an un- managed index considered representative of stocks of Europe, Australasia and the Far East. The index is computed using the net return, which with-holds applicable taxes for non-resident investors. |
| n | | The MSCI All Country Asia Pacific Index is an unmanaged index considered representative of Pacific region stock markets. The index is computed using the net return, which withholds applicable taxes for non-resident investors. |
| n | | The Lipper Pacific Region Funds Index is an unmanaged index considered representative of Pacific region funds tracked by Lipper. |
| n | | The Fund is not managed to track the performance of any particular index, including the index(es) described here, and consequently, the performance of the Fund may deviate significantly from the performance of the index(es). |
| n | | A direct investment cannot be made in an index. Unless otherwise indicated, index results include reinvested dividends, and they do not reflect sales charges. Performance of the peer group, if applicable, reflects fund expenses; performance of a market index does not. |
Other information
| n | | The returns shown in management’s discussion of Fund performance are based on net asset values (NAVs) calculated for shareholder transactions. Generally accepted accounting principles |
| | | require adjustments to be made to the net assets of the Fund at period end for financial reporting purposes, and as such, the NAVs for shareholder transactions and the returns based on those NAVs may differ from the NAVs and returns reported in the Financial Highlights. |
| n | | Industry classifications used in this report are generally according to the Global Industry Classification Standard, which was developed by and is the exclusive property and a service mark of MSCI Inc. and Standard & Poor’s. |
|
| 6 Invesco Pacific Growth Fund |
| | | | | |
Average Annual Total Returns | | |
| | | | | |
As of 10/31/15, including maximum applicable sales charges |
| | | | | |
| |
Class A Shares | | | | | |
Inception (7/28/97) | | | | 1.50 | % |
10 Years | | | | 4.55 | |
5 Years | | | | 1.38 | |
1 Year | | | | -7.33 | |
| |
Class B Shares | | | | | |
Inception (11/30/90) | | | | 4.52 | % |
10 Years | | | | 4.51 | |
5 Years | | | | 1.40 | |
1 Year | | | | -7.51 | |
| |
Class C Shares | | | | | |
Inception (7/28/97) | | | | 1.08 | % |
10 Years | | | | 4.38 | |
5 Years | | | | 1.81 | |
1 Year | | | | -3.57 | |
| |
Class R Shares | | | | | |
Inception (3/31/08) | | | | 0.80 | % |
5 Years | | | | 2.27 | |
1 Year | | | | -2.14 | |
| |
Class Y Shares | | | | | |
Inception (7/28/97) | | | | 2.06 | % |
10 Years | | | | 5.41 | |
5 Years | | | | 2.79 | |
1 Year | | | | -1.67 | |
| |
Class R5 Shares | | | | | |
10 Years | | | | 5.33 | % |
5 Years | | | | 2.90 | |
1 Year | | | | -1.51 | |
Effective June 1, 2010, Class A, Class B, Class C, Class R, Class W and Class I shares of the predecessor fund, Morgan Stanley Pacific Growth Fund Inc., advised by Morgan Stanley Investment Advisors Inc. were reorganized into Class A, Class B, Class C, Class R, Class A and Class Y shares, respectively, of Invesco Pacific Growth Fund. Returns shown above for Class A, Class B, Class C, Class R and Class Y shares are blended returns of the predecessor fund and Invesco Pacific Growth Fund. Share class returns will differ from the predecessor fund because of different expenses.
Class R5 shares incepted on May 23, 2011. Performance shown prior to that date is that of the Fund’s and the predecessor fund’s Class A shares and includes the 12b-1 fees applicable to Class A shares.
The performance data quoted represent past performance and cannot guarantee comparable future results; current performance may
|
Average Annual Total Returns |
As of 9/30/15, the most recent calendar quarter end, including maximum applicable sales charges |
| | | | | |
| |
Class A Shares | | | | | |
Inception (7/28/97) | | | | 1.25 | % |
10 Years | | | | 3.74 | |
5 Years | | | | 0.90 | |
1 Year | | | | -9.50 | |
| |
Class B Shares | | | | | |
Inception (11/30/90) | | | | 4.34 | % |
10 Years | | | | 3.70 | |
5 Years | | | | 0.90 | |
1 Year | | | | -9.71 | |
| |
Class C Shares | | | | | |
Inception (7/28/97) | | | | 0.83 | % |
10 Years | | | | 3.57 | |
5 Years | | | | 1.32 | |
1 Year | | | | -5.94 | |
| |
Class R Shares | | | | | |
Inception (3/31/08) | | | | 0.20 | % |
5 Years | | | | 1.79 | |
1 Year | | | | -4.49 | |
| |
Class Y Shares | | | | | |
Inception (7/28/97) | | | | 1.81 | % |
10 Years | | | | 4.60 | |
5 Years | | | | 2.30 | |
1 Year | | | | -3.98 | |
| |
Class R5 Shares | | | | | |
10 Years | | | | 4.51 | % |
5 Years | | | | 2.40 | |
1 Year | | | | -3.86 | |
be lower or higher. Please visit invesco.com/performance for the most recent month-end performance. Performance figures reflect reinvested distributions, changes in net asset value and the effect of the maximum sales charge unless otherwise stated. Investment return and principal value will fluctuate so that you may have a gain or loss when you sell shares.
The total annual Fund operating expense ratio set forth in the most recent Fund prospectus as of the date of this report for Class A, Class B, Class C, Class R, Class Y and Class R5 shares was 1.78%, 2.54%, 2.54%, 2.04%, 1.54% and 1.38%, respectively. The expense ratios presented above may vary from the expense ratios presented in other sections of this report that are based on expenses incurred during the period covered by this report.
Class A share performance reflects the maximum 5.50% sales charge, and Class B and Class C share performance
reflects the applicable contingent deferred sales charge (CDSC) for the period involved. The CDSC on Class B shares declines from 5% beginning at the time of purchase to 0% at the beginning of the seventh year. The CDSC on Class C shares is 1% for the first year after purchase. Class R, Class Y and Class R5 shares do not have a front-end sales charge or a CDSC; therefore, performance is at net asset value.
The performance of the Fund’s share classes will differ primarily due to different sales charge structures and class expenses.
Fund performance reflects any applicable fee waivers and/or expense reimbursements. Had the adviser not waived fees and/or reimbursed expenses currently or in the past, returns would have been lower. See current prospectus for more information.
|
| 7 Invesco Pacific Growth Fund |
Invesco Pacific Growth Fund’s investment objective is long-term growth of capital.
| n | | Unless otherwise stated, information presented in this report is as of October 31, 2015, and is based on total net assets. |
| n | | Unless otherwise noted, all data provided by Invesco. |
| n | | To access your Fund’s reports/prospectus, visit invesco.com/fundreports. |
About share classes
| n | | Class B shares may not be purchased for new or additional investments. Please see the prospectus for more information. |
| n | | Class R shares are generally available only to employer sponsored retirement and benefit plans. Please see the prospectus for more information. |
| n | | Class Y shares are available to only certain investors. Please see the prospectus for more information. |
| n | | Class R5 shares are primarily intended for employer sponsored retirement and benefit plans that meet certain standards and for institutional investors. Please see the prospectus for more information. |
Principal risks of investing in the Fund
| n | | Active trading risk. The Fund engages in frequent trading of portfolio securities. Active trading results in added expenses and may result in a lower return and increased tax liability. |
| n | | Depositary receipts risk. Depositary receipts involve many of the same risks as those associated with direct investment in foreign securities. In addition, the underlying issuers of certain depositary receipts, particularly unsponsored or unregistered depositary receipts, are under no obligation to distribute shareholder communications to the holders of such receipts or to pass through to them any voting rights with respect to the deposited securities. |
| n | | Derivatives risk. The value of a derivative instrument depends largely on (and is derived from) the value of an underlying security, currency, commodity, interest rate, index or other asset (each referred to as an underlying asset). In addition to risks relating to the underlying assets, the use of derivatives may include other, possibly greater, risks, including counterparty, leverage and liquidity risks. Counterparty risk is the risk that the counterparty to the derivative contract will default on its |
| | obligation to pay the Fund the amount owed or otherwise perform under the derivative contract. Derivatives create leverage risk because they do not require payment up front equal to the economic exposure created by owning the derivative. As a result, an adverse change in the value of the underlying asset could result in the Fund sustaining a loss that is substantially greater than the amount invested in the derivative, which may make the Fund’s returns more volatile and increase the risk of loss. Derivative instruments may also be less liquid than more traditional investments and the Fund may be unable to sell or close out its derivative positions at a desirable time or price. This risk may be more acute under adverse market conditions, during which the Fund may be most in need of liquidating its derivative positions. Derivatives may also be harder to value, less tax efficient and subject to changing government regulation that could impact the Fund’s ability to use certain derivatives or their cost. Also, derivatives used for hedging or to gain or limit exposure to a particular market segment may not provide the expected benefits, particularly during adverse market conditions. |
| n | | Developing/emerging markets securities risk. The prices of securities issued by foreign companies and governments located in developing/emerging markets countries may be affected more negatively by inflation, devaluation of their currencies, higher transaction costs, delays in settlement, adverse political developments, the introduction of capital controls, withholding taxes, nationalization of private assets, expropriation, social unrest, war or lack of timely information than those in developed countries. |
| n | | Foreign securities risk. The Fund’s foreign investments may be affected by changes in a foreign country’s exchange rates, political and social instability, changes in economic or taxation policies, difficulties when enforcing obligations, |
| | decreased liquidity, and increased volatility. Foreign companies may be subject to less regulation resulting in less publicly available information about the companies. |
| n | | Geographic focus risk. From time to time the Fund may invest a substantial amount of its assets in securities of issuers located in a single country or a limited number of countries. If the Fund focuses its investments in this manner, it assumes the risk that economic, political and social conditions in those countries will have a significant impact on its investment performance. The Fund’s investment performance may also be more volatile if it focuses its investments in certain countries, especially emerging markets countries. |
| n | | Growth investing risk. Growth stocks tend to be more expensive relative to their earnings or assets compared with other types of stock. As a result they tend to be more sensitive to changes in their earnings and can be more volatile. |
| n | | Management risk. The investment techniques and risk analysis used by the Fund’s portfolio managers may not produce the desired results. |
| n | | Market risk. The prices of and the income generated by the Fund’s securities may decline in response to, among other things, investor sentiment, general economic and market conditions, regional or global instability, and currency and interest rate fluctuations. |
| n | | Preferred securities risk. Preferred securities may include provisions that permit the issuer, in its discretion, to defer or omit distributions for a certain period of time. If the Fund owns a security that is deferring or omitting its distributions, the Fund may be required to report the distribution on its tax returns, even though it may not have received this income. Further, preferred securities may lose substantial value due to the omission or deferment of dividend payments. |
| n | | Small- and mid-capitalization risks. Stocks of small- and mid-sized companies tend to be more vulnerable to adverse developments and may have little or no operating history or track record of success, and limited product lines, markets, management and financial resources. The securities of small- and |
continued on page 6
|
This report must be accompanied or preceded by a currently effective Fund prospectus, which contains more complete information, including sales charges and expenses. Investors should read it carefully before investing. |
NOT FDIC INSURED | MAY LOSE VALUE | NO BANK GUARANTEE
|
| 8 Invesco Pacific Growth Fund |
Schedule of Investments
October 31, 2015
| | | | | | | | |
| | | Shares | | | Value | |
Common Stocks & Other Equity Interests–97.95% | |
| Australia–8.87% | |
APA Group | | | 317,310 | | | $ | 2,081,719 | |
Sydney Airport | | | 186,216 | | | | 856,499 | |
Telstra Corp. Ltd. | | | 337,327 | | | | 1,298,959 | |
Westpac Banking Corp. | | | 105,858 | | | | 2,368,793 | |
Westpac Banking Corp.(a) | | | 4,603 | | | | 99,949 | |
| | | | | | | | 6,705,919 | |
|
| China–13.88% | |
Bank of China Ltd.–Class H | | | 3,786,000 | | | | 1,783,244 | |
Beijing Capital International Airport Co. Ltd.–Class H | | | 1,574,000 | | | | 1,685,876 | |
China Animal Healthcare Ltd.(a) | | | 349,000 | | | | 117,075 | |
China Mobile Ltd. | | | 102,500 | | | | 1,219,354 | |
CNOOC Ltd. | | | 862,000 | | | | 980,416 | |
Guangdong Investment Ltd. | | | 1,202,000 | | | | 1,689,692 | |
Tencent Holdings Ltd. | | | 160,700 | | | | 3,015,884 | |
| | | | | | | | 10,491,541 | |
|
| Hong Kong–3.75% | |
AIA Group Ltd. | | | 485,400 | | | | 2,834,400 | |
Henderson Land Development Co. Ltd. | | | 101 | | | | 637 | |
| | | | | | | | 2,835,037 | |
|
| India–6.70% | |
Axis Bank Ltd. | | | 210,854 | | | | 1,530,630 | |
Bajaj Finance Ltd. | | | 16,848 | | | | 1,344,771 | |
Maruti Suzuki India Ltd. | | | 32,224 | | | | 2,191,335 | |
| | | | | | | | 5,066,736 | |
|
| Indonesia–2.38% | |
PT Perusahaan Gas Negara Persero Tbk | | | 2,014,200 | | | | 438,646 | |
PT Unilever Indonesia Tbk | | | 502,300 | | | | 1,355,697 | |
| | | | | | | | 1,794,343 | |
|
| Japan–43.15% | |
AIDA ENGINEERING, LTD. | | | 137,100 | | | | 1,300,732 | |
Astellas Pharma Inc. | | | 90,600 | | | | 1,309,770 | |
Daicel Corp. | | | 78,000 | | | | 1,026,194 | |
Daikin Industries, Ltd. | | | 19,900 | | | | 1,274,065 | |
Daiwa House Industry Co., Ltd. | | | 56,200 | | | | 1,467,382 | |
FUKUSHIMA INDUSTRIES CORP. | | | 67,100 | | | | 1,455,093 | |
Gulliver International Co., Ltd.(b) | | | 65,300 | | | | 654,169 | |
Hitachi High-Technologies Corp. | | | 37,700 | | | | 1,011,009 | |
K’s Holdings Corp. | | | 40,700 | | | | 1,433,599 | |
Konoike Transport Co., Ltd. | | | 100,100 | | | | 1,237,675 | |
Maeda Road Construction Co., Ltd. | | | 71,000 | | | | 1,292,870 | |
Mitsubishi Corp. | | | 56,200 | | | | 1,018,095 | |
Mitsubishi UFJ Financial Group, Inc. | | | 207,800 | | | | 1,343,694 | |
Nidec Corp. | | | 15,500 | | | | 1,164,616 | |
Nifco Inc. | | | 28,900 | | | | 1,111,759 | |
OMRON Corp. | | | 38,000 | | | | 1,253,429 | |
| | | | | | | | |
| | | Shares | | | Value | |
| Japan–(continued) | |
Otsuka Corp. | | | 32,700 | | | $ | 1,578,762 | |
Relo Holdings, Inc. | | | 9,400 | | | | 1,000,187 | |
Resorttrust, Inc. | | | 44,300 | | | | 1,135,196 | |
SCSK Corp. | | | 30,900 | | | | 1,183,556 | |
Sekisui Chemical Co., Ltd. | | | 133,000 | | | | 1,562,961 | |
Seria Co., Ltd. | | | 11,100 | | | | 470,264 | |
Seven & i Holdings Co., Ltd. | | | 29,300 | | | | 1,324,005 | |
Shimamura Co., Ltd. | | | 11,100 | | | | 1,242,837 | |
Temp Holdings Co. Ltd. | | | 67,500 | | | | 1,005,548 | |
Tsubakimoto Chain Co. | | | 179,000 | | | | 1,306,207 | |
Yamaha Motor Co., Ltd. | | | 64,800 | | | | 1,451,919 | |
| | | | | | | | 32,615,593 | |
|
| Singapore–2.11% | |
Singapore Post Ltd. | | | 1,180,100 | | | | 1,596,323 | |
|
| South Korea–9.92% | |
AMOREPACIFIC Group | | | 13,299 | | | | 1,861,830 | |
Green Cross Corp. | | | 6,067 | | | | 958,661 | |
Nongshim Co., Ltd. | | | 5,942 | | | | 1,914,739 | |
Ottogi Corp. | | | 1,079 | | | | 987,971 | |
Yuhan Corp. | | | 7,188 | | | | 1,775,740 | |
| | | | | | | | 7,498,941 | |
|
| Taiwan–4.69% | |
Largan Precision Co., Ltd. | | | 20,000 | | | | 1,538,508 | |
Taiwan Semiconductor Manufacturing Co. Ltd. | | | 477,143 | | | | 2,008,540 | |
| | | | | | | | 3,547,048 | |
|
| Thailand–2.50% | |
Bumrungrad Hospital PCL | | | 313,200 | | | | 1,892,239 | |
Total Common Stocks & Other Equity Interests
(Cost $69,727,956) | | | | 74,043,720 | |
| | |
Money Market Funds–1.62% | | | | | | | | |
Liquid Assets Portfolio–Institutional
Class, 0.16%(c) | | | 613,598 | | | | 613,598 | |
Premier Portfolio–Institutional Class, 0.12%(c) | | | 613,598 | | | | 613,598 | |
Total Money Market Funds
(Cost $1,227,196) | | | | 1,227,196 | |
TOTAL INVESTMENTS (excluding investments purchased with cash collateral from securities on loan)–99.57%
(Cost $70,955,152) | | | | 75,270,916 | |
| |
Investments Purchased with Cash Collateral from Securities on Loan | | | | | |
Money Market Fund–0.69% | |
Liquid Assets Portfolio–Institutional Class (Cost $521,274), 0.16%(c)(d) | | | 521,274 | | | | 521,274 | |
TOTAL INVESTMENTS–100.26%
(Cost $71,476,426) | | | | 75,792,190 | |
OTHER ASSETS LESS LIABILITIES–(0.26)% | | | | (196,892 | ) |
NET ASSETS–100.00% | | | $ | 75,595,298 | |
See accompanying Notes to Financial Statements which are an integral part of the financial statements.
9 Invesco Pacific Growth Fund
Notes to Schedule of Investments:
| (a) | Non-income producing security. |
| (b) | All or a portion of this security was out on loan at October 31, 2015. |
| (c) | The money market fund and the Fund are affiliated by having the same investment adviser. The rate shown is the 7-day SEC standardized yield as of October 31, 2015. |
| (d) | The security has been segregated to satisfy the commitment to return the cash collateral received in securities lending transactions upon the borrower’s return of the securities loaned. See Note 1I. |
See accompanying Notes to Financial Statements which are an integral part of the financial statements.
10 Invesco Pacific Growth Fund
Statement of Assets and Liabilities
October 31, 2015
| | | | |
Assets: | |
Investments, at value (Cost $69,727,956)* | | $ | 74,043,720 | |
Investments in affiliated money market funds, at value and cost | | | 1,748,470 | |
Total investments, at value (Cost $71,476,426) | | | 75,792,190 | |
Foreign currencies, at value (Cost $190,537) | | | 190,724 | |
Receivable for: | | | | |
Fund shares sold | | | 152,197 | |
Dividends | | | 339,538 | |
Investment for trustee deferred compensation and retirement plans | | | 37,727 | |
Other assets | | | 23,227 | |
Total assets | | | 76,535,603 | |
|
Liabilities: | |
Payable for: | | | | |
Fund shares reacquired | | | 69,048 | |
Collateral upon return of securities loaned | | | 521,274 | |
Accrued foreign taxes | | | 59,004 | |
Accrued fees to affiliates | | | 113,551 | |
Accrued trustees’ and officers’ fees and benefits | | | 1,495 | |
Accrued other operating expenses | | | 74,868 | |
Trustee deferred compensation and retirement plans | | | 101,065 | |
Total liabilities | | | 940,305 | |
Net assets applicable to shares outstanding | | $ | 75,595,298 | |
|
Net assets consist of: | |
Shares of beneficial interest | | $ | 86,314,286 | |
Undistributed net investment income | | | (103,879 | ) |
Undistributed net realized gain (loss) | | | (14,927,052 | ) |
Net unrealized appreciation | | | 4,311,943 | |
| | | $ | 75,595,298 | |
| | | | |
Net Assets: | |
Class A | | $ | 66,599,138 | |
Class B | | $ | 271,632 | |
Class C | | $ | 4,879,864 | |
Class R | | $ | 245,291 | |
Class Y | | $ | 3,586,603 | |
Class R5 | | $ | 12,770 | |
|
Shares outstanding, $0.01 par value per share,
with an unlimited number of shares authorized: | |
Class A | | | 2,771,839 | |
Class B | | | 12,096 | |
Class C | | | 216,907 | |
Class R | | | 10,297 | |
Class Y | | | 146,943 | |
Class R5 | | | 523 | |
Class A: | | | | |
Net asset value per share | | $ | 24.03 | |
Maximum offering price per share | | | | |
(Net asset value of $24.03 ¸ 94.50%) | | $ | 25.43 | |
Class B: | | | | |
Net asset value and offering price per share | | $ | 22.46 | |
Class C: | | | | |
Net asset value and offering price per share | | $ | 22.50 | |
Class R: | | | | |
Net asset value and offering price per share | | $ | 23.82 | |
Class Y: | | | | |
Net asset value and offering price per share | | $ | 24.41 | |
Class R5: | | | | |
Net asset value and offering price per share | | $ | 24.42 | |
| * | At October 31, 2015, securities with an aggregate value of $498,016 were on loan to brokers. |
See accompanying Notes to Financial Statements which are an integral part of the financial statements.
11 Invesco Pacific Growth Fund
Statement of Operations
For the year ended October 31, 2015
| | | | |
Investment income: | |
Dividends (net of foreign withholding taxes of $132,015) | | $ | 1,583,961 | |
Dividends from affiliated money market funds (includes securities lending income of $2,731) | | | 3,481 | |
Total investment income | | | 1,587,442 | |
| |
Expenses: | | | | |
Advisory fees | | | 692,295 | |
Administrative services fees | | | 50,000 | |
Custodian fees | | | 85,024 | |
Distribution fees: | | | | |
Class A | | | 172,576 | |
Class B | | | 3,551 | |
Class C | | | 50,686 | |
Class R | | | 1,535 | |
Transfer agent fees | | | 176,164 | |
Transfer agent fees — R5 | | | 10 | |
Trustees’ and officers’ fees and benefits | | | 28,292 | |
Other | | | 188,908 | |
Total expenses | | | 1,449,041 | |
Less: Fees waived and expense offset arrangement(s) | | | (1,869 | ) |
Net expenses | | | 1,447,172 | |
Net investment income | | | 140,270 | |
| |
Realized and unrealized gain (loss) from: | | | | |
Net realized gain (loss) from: | | | | |
Investment securities (net of foreign taxes of $128,221) | | | 3,033,235 | |
Foreign currencies | | | (429,783 | ) |
| | | | 2,603,452 | |
Change in net unrealized appreciation (depreciation) of: | | | | |
Investment securities (net of foreign taxes on holdings of $81,444) | | | (4,672,886 | ) |
Foreign currencies | | | 110,600 | |
| | | | (4,562,286 | ) |
Net realized and unrealized gain (loss) | | | (1,958,834 | ) |
Net increase (decrease) in net assets resulting from operations | | $ | (1,818,564 | ) |
See accompanying Notes to Financial Statements which are an integral part of the financial statements.
12 Invesco Pacific Growth Fund
Statement of Changes in Net Assets
For the years ended October 31, 2015 and 2014
| | | | | | | | |
| | | 2015 | | | 2014 | |
Operations: | | | | | |
Net investment income | | $ | 140,270 | | | $ | 469,064 | |
Net realized gain | | | 2,603,452 | | | | 6,523,096 | |
Change in net unrealized appreciation (depreciation) | | | (4,562,286 | ) | | | (3,830,874 | ) |
Net increase (decrease) in net assets resulting from operations | | | (1,818,564 | ) | | | 3,161,286 | |
| | |
Distributions to shareholders from net investment income: | | | | | | | | |
Class A | | | (82,200 | ) | | | (1,136,339 | ) |
Class B | | | — | | | | (6,423 | ) |
Class C | | | — | | | | (37,052 | ) |
Class R | | | — | | | | (3,682 | ) |
Class Y | | | (11,222 | ) | | | (57,092 | ) |
Class R5 | | | (67 | ) | | | (228 | ) |
Total distributions from net investment income | | | (93,489 | ) | | | (1,240,816 | ) |
| | |
Share transactions–net: | | | | | | | | |
Class A | | | (5,325,439 | ) | | | (7,943,838 | ) |
Class B | | | (199,876 | ) | | | (411,438 | ) |
Class C | | | 440,928 | | | | (506,174 | ) |
Class R | | | (94,501 | ) | | | 44,765 | |
Class Y | | | 809,820 | | | | (435,625 | ) |
Net increase (decrease) in net assets resulting from share transactions | | | (4,369,068 | ) | | | (9,252,310 | ) |
Net increase (decrease) in net assets | | | (6,281,121 | ) | | | (7,331,840 | ) |
| | |
Net assets: | | | | | | | | |
Beginning of year | | | 81,876,419 | | | | 89,208,259 | |
End of year (includes undistributed net investment income of $(103,879) and $(381,825), respectively) | | $ | 75,595,298 | | | $ | 81,876,419 | |
Notes to Financial Statements
October 31, 2015
NOTE 1—Significant Accounting Policies
Invesco Pacific Growth Fund (the “Fund”) is a series portfolio of AIM Investment Funds (Invesco Investment Funds) (the “Trust”). The Trust is organized as a Delaware statutory trust and is registered under the Investment Company Act of 1940, as amended (the “1940 Act”), as an open-end series management investment company consisting of twenty-four separate series portfolios, each authorized to issue an unlimited number of shares of beneficial interest. The assets, liabilities and operations of each portfolio are accounted for separately. Information presented in these financial statements pertains only to the Fund. Matters affecting each portfolio or class will be voted on exclusively by the shareholders of such portfolio or class.
The Fund’s investment objective is long-term growth of capital.
The Fund currently consists of six different classes of shares: Class A, Class B, Class C, Class R, Class Y and Class R5. Class A shares are sold with a front-end sales charge unless certain waiver criteria are met and under certain circumstances load waived shares may be subject to contingent deferred sales charges (“CDSC”). Class C shares are sold with a CDSC. Class R, Class Y and Class R5 shares are sold at net asset value. Effective November 30, 2010, new or additional investments in Class B shares are no longer permitted. Existing shareholders of Class B shares may continue to reinvest dividends and capital gains distributions in Class B shares until they convert to Class A shares. Also, shareholders in Class B shares will be able to exchange those shares for Class B shares of other Invesco Funds offering such shares until they convert to Class A shares. Generally, Class B shares will automatically convert to Class A shares on or about the month-end, which is at least eight years after the date of purchase. Redemption of Class B shares prior to the conversion date will be subject to a CDSC.
The following is a summary of the significant accounting policies followed by the Fund in the preparation of its financial statements.
| A. | Security Valuations — Securities, including restricted securities, are valued according to the following policy. |
A security listed or traded on an exchange (except convertible securities) is valued at its last sales price or official closing price as of the close of the customary trading session on the exchange where the security is principally traded, or lacking any sales or official closing price on a particular day, the security may be valued at the closing bid price on that day. Securities traded in the over-the-counter market are valued based on prices furnished by independent pricing services or market makers. When such securities are valued by an independent pricing service they may be considered fair valued. Futures contracts are valued at the final settlement price set by an exchange on which they are principally traded.
13 Invesco Pacific Growth Fund
Listed options are valued at the mean between the last bid and asked prices from the exchange on which they are principally traded. Options not listed on an exchange are valued by an independent source at the mean between the last bid and asked prices. For purposes of determining net asset value (“NAV”) per share, futures and option contracts generally are valued 15 minutes after the close of the customary trading session of the New York Stock Exchange (“NYSE”).
Investments in open-end and closed-end registered investment companies that do not trade on an exchange are valued at the end-of-day net asset value per share. Investments in open-end and closed-end registered investment companies that trade on an exchange are valued at the last sales price or official closing price as of the close of the customary trading session on the exchange where the security is principally traded.
Debt obligations (including convertible securities) and unlisted equities are fair valued using an evaluated quote provided by an independent pricing service. Evaluated quotes provided by the pricing service may be determined without exclusive reliance on quoted prices, and may reflect appropriate factors such as institution-size trading in similar groups of securities, developments related to specific securities, dividend rate (for unlisted equities), yield (for debt obligations), quality, type of issue, coupon rate (for debt obligations), maturity (for debt obligations), individual trading characteristics and other market data. Debt obligations are subject to interest rate and credit risks. In addition, all debt obligations involve some risk of default with respect to interest and/or principal payments.
Foreign securities’ (including foreign exchange contracts) prices are converted into U.S. dollar amounts using the applicable exchange rates as of the close of the NYSE. If market quotations are available and reliable for foreign exchange-traded equity securities, the securities will be valued at the market quotations. Because trading hours for certain foreign securities end before the close of the NYSE, closing market quotations may become unreliable. If between the time trading ends on a particular security and the close of the customary trading session on the NYSE, events occur that the Adviser determines are significant and make the closing price unreliable, the Fund may fair value the security. If the event is likely to have affected the closing price of the security, the security will be valued at fair value in good faith using procedures approved by the Board of Trustees. Adjustments to closing prices to reflect fair value may also be based on a screening process of an independent pricing service to indicate the degree of certainty, based on historical data, that the closing price in the principal market where a foreign security trades is not the current value as of the close of the NYSE. Foreign securities’ prices meeting the approved degree of certainty that the price is not reflective of current value will be priced at the indication of fair value from the independent pricing service. Multiple factors may be considered by the independent pricing service in determining adjustments to reflect fair value and may include information relating to sector indices, American Depositary Receipts and domestic and foreign index futures. Foreign securities may have additional risks including exchange rate changes, potential for sharply devalued currencies and high inflation, political and economic upheaval, the relative lack of issuer information, relatively low market liquidity and the potential lack of strict financial and accounting controls and standards.
Securities for which market prices are not provided by any of the above methods may be valued based upon quotes furnished by independent sources. The last bid price may be used to value equity securities. The mean between the last bid and asked prices is used to value debt obligations, including corporate loans.
Securities for which market quotations are not readily available or became unreliable are valued at fair value as determined in good faith by or under the supervision of the Trust’s officers following procedures approved by the Board of Trustees. Issuer specific events, market trends, bid/asked quotes of brokers and information providers and other market data may be reviewed in the course of making a good faith determination of a security’s fair value.
The Fund may invest in securities that are subject to interest rate risk, meaning the risk that the prices will generally fall as interest rates rise and, conversely, the prices will generally rise as interest rates fall. Specific securities differ in their sensitivity to changes in interest rates depending on their individual characteristics. Changes in interest rates may result in increased market volatility, which may affect the value and/or liquidity of certain Fund investments.
Valuations change in response to many factors including the historical and prospective earnings of the issuer, the value of the issuer’s assets, general economic conditions, interest rates, investor perceptions and market liquidity. Because of the inherent uncertainties of valuation, the values reflected in the financial statements may materially differ from the value received upon actual sale of those investments.
| B. | Securities Transactions and Investment Income — Securities transactions are accounted for on a trade date basis. Realized gains or losses on sales are computed on the basis of specific identification of the securities sold. Interest income (net of withholding tax, if any) is recorded on the accrual basis from settlement date. Dividend income (net of withholding tax, if any) is recorded on the ex-dividend date. |
The Fund may periodically participate in litigation related to Fund investments. As such, the Fund may receive proceeds from litigation settlements. Any proceeds received are included in the Statement of Operations as realized gain (loss) for investments no longer held and as unrealized gain (loss) for investments still held.
Brokerage commissions and mark ups are considered transaction costs and are recorded as an increase to the cost basis of securities purchased and/or a reduction of proceeds on a sale of securities. Such transaction costs are included in the determination of net realized and unrealized gain (loss) from investment securities reported in the Statement of Operations and the Statement of Changes in Net Assets and the net realized and unrealized gains (losses) on securities per share in the Financial Highlights. Transaction costs are included in the calculation of the Fund’s net asset value and, accordingly, they reduce the Fund’s total returns. These transaction costs are not considered operating expenses and are not reflected in net investment income reported in the Statement of Operations and the Statement of Changes in Net Assets, or the net investment income per share and the ratios of expenses and net investment income reported in the Financial Highlights, nor are they limited by any expense limitation arrangements between the Fund and the investment adviser.
The Fund allocates income and realized and unrealized capital gains and losses to a class based on the relative net assets of each class.
| C. | Country Determination — For the purposes of making investment selection decisions and presentation in the Schedule of Investments, the investment adviser may determine the country in which an issuer is located and/or credit risk exposure based on various factors. These factors include the laws of the country under which the issuer is organized, where the issuer maintains a principal office, the country in which the issuer derives 50% or more of its total revenues and the country that has the primary market for the issuer’s securities, as well as other criteria. Among the other criteria that may be evaluated for making this determination are the country in which the issuer maintains 50% or more of its assets, the type of security, financial guarantees and enhancements, the nature of the collateral and the sponsor organization. Country of issuer and/or credit risk exposure has been determined to be the United States of America, unless otherwise noted. |
14 Invesco Pacific Growth Fund
| D. | Distributions — Distributions from net investment income and net realized capital gain, if any, are generally declared and paid annually and recorded on the ex-dividend date. The Fund may elect to treat a portion of the proceeds from redemptions as distributions for federal income tax purposes. |
| E. | Federal Income Taxes — The Fund intends to comply with the requirements of Subchapter M of the Internal Revenue Code of 1986, as amended (the “Internal Revenue Code”), necessary to qualify as a regulated investment company and to distribute substantially all of the Fund’s taxable earnings to shareholders. As such, the Fund will not be subject to federal income taxes on otherwise taxable income (including net realized capital gain) that is distributed to shareholders. Therefore, no provision for federal income taxes is recorded in the financial statements. |
The Fund recognizes the tax benefits of uncertain tax positions only when the position is more likely than not to be sustained. Management has analyzed the Fund’s uncertain tax positions and concluded that no liability for unrecognized tax benefits should be recorded related to uncertain tax positions. Management is not aware of any tax positions for which it is reasonably possible that the total amounts of unrecognized tax benefits will change materially in the next 12 months.
The Fund files tax returns in the U.S. Federal jurisdiction and certain other jurisdictions. Generally, the Fund is subject to examinations by such taxing authorities for up to three years after the filing of the return for the tax period.
| F. | Expenses — Fees provided for under the Rule 12b-1 plan of a particular class of the Fund are charged to the operations of such class. Transfer agency fees and expenses and other shareholder recordkeeping fees and expenses attributable to Class R5 are charged to such class. Transfer agency fees and expenses and other shareholder recordkeeping fees and expenses relating to all other classes are allocated among those classes based on relative net assets. All other expenses are allocated among the classes based on relative net assets. |
| G. | Accounting Estimates — The preparation of financial statements in conformity with accounting principles generally accepted in the United States of America (“GAAP”) requires management to make estimates and assumptions that affect the reported amounts of assets and liabilities at the date of the financial statements and the reported amounts of revenues and expenses during the reporting period including estimates and assumptions related to taxation. Actual results could differ from those estimates by a significant amount. In addition, the Fund monitors for material events or transactions that may occur or become known after the period-end date and before the date the financial statements are released to print. |
| H. | Indemnifications — Under the Trust’s organizational documents, each Trustee, officer, employee or other agent of the Trust is indemnified against certain liabilities that may arise out of the performance of their duties to the Fund. Additionally, in the normal course of business, the Fund enters into contracts, including the Fund’s servicing agreements, that contain a variety of indemnification clauses. The Fund’s maximum exposure under these arrangements is unknown as this would involve future claims that may be made against the Fund that have not yet occurred. The risk of material loss as a result of such indemnification claims is considered remote. |
| I. | Securities Lending — The Fund may lend portfolio securities having a market value up to one-third of the Fund’s total assets. Such loans are secured by collateral equal to no less than the market value of the loaned securities determined daily by the securities lending provider. Such collateral will be cash or debt securities issued or guaranteed by the U.S. Government or any of its sponsored agencies. Cash collateral received in connection with these loans is invested in short-term money market instruments or affiliated money market funds and is shown as such on the Schedule of Investments. The Fund bears the risk of loss with respect to the investment of collateral. It is the Fund’s policy to obtain additional collateral from or return excess collateral to the borrower by the end of the next business day, following the valuation date of the securities loaned. Therefore, the value of the collateral held may be temporarily less than the value of the securities on loan. When loaning securities, the Fund retains certain benefits of owning the securities, including the economic equivalent of dividends or interest generated by the security. Lending securities entails a risk of loss to the Fund if, and to the extent that, the market value of the securities loaned were to increase and the borrower did not increase the collateral accordingly, and the borrower failed to return the securities. The securities loaned are subject to termination at the option of the borrower or the Fund. Upon termination, the borrower will return to the Fund the securities loaned and the Fund will return the collateral. Upon the failure of the borrower to return the securities, collateral may be liquidated and the securities may be purchased on the open market to replace the loaned securities. The Fund could experience delays and costs in gaining access to the collateral and the securities may lose value during the delay which could result in potential losses to the Fund. Some of these losses may be indemnified by the lending agent. The Fund bears the risk of any deficiency in the amount of the collateral available for return to the borrower due to any loss on the collateral invested. Dividends received on cash collateral investments for securities lending transactions, which are net of compensation to counterparties, is included in Dividends from affiliated money market funds on the Statement of Operations. The aggregate value of securities out on loan, if any, is shown as a footnote on the Statement of Assets and Liabilities. |
| J. | Foreign Currency Translations — Foreign currency is valued at the close of the NYSE based on quotations posted by banks and major currency dealers. Portfolio securities and other assets and liabilities denominated in foreign currencies are translated into U.S. dollar amounts at date of valuation. Purchases and sales of portfolio securities (net of foreign taxes withheld on disposition) and income items denominated in foreign currencies are translated into U.S. dollar amounts on the respective dates of such transactions. The Fund does not separately account for the portion of the results of operations resulting from changes in foreign exchange rates on investments and the fluctuations arising from changes in market prices of securities held. The combined results of changes in foreign exchange rates and the fluctuation of market prices on investments (net of estimated foreign tax withholding) are included with the net realized and unrealized gain or loss from investments in the Statement of Operations. Reported net realized foreign currency gains or losses arise from (1) sales of foreign currencies, (2) currency gains or losses realized between the trade and settlement dates on securities transactions, and (3) the difference between the amounts of dividends, interest, and foreign withholding taxes recorded on the Fund’s books and the U.S. dollar equivalent of the amounts actually received or paid. Net unrealized foreign currency gains and losses arise from changes in the fair values of assets and liabilities, other than investments in securities at fiscal period end, resulting from changes in exchange rates. |
The Fund may invest in foreign securities, which may be subject to foreign taxes on income, gains on investments or currency repatriation, a portion of which may be recoverable. Foreign taxes, if any, are recorded based on the tax regulations and rates that exist in the foreign markets in which the Fund invests and are shown in the Statement of Operations.
| K. | Forward Foreign Currency Contracts — The Fund may engage in foreign currency transactions either on a spot (i.e. for prompt delivery and settlement) basis, or through forward foreign currency contracts, to manage or minimize currency or exchange rate risk. |
The Fund may also enter into forward foreign currency contracts for the purchase or sale of a security denominated in a foreign currency in order to “lock in” the U.S. dollar price of that security, or the Fund may also enter into forward foreign currency contracts that do not provide for
15 Invesco Pacific Growth Fund
physical settlement of the two currencies, but instead are settled by a single cash payment calculated as the difference between the agreed upon exchange rate and the spot rate at settlement based upon an agreed upon notional amount (non-deliverable forwards). The Fund will set aside liquid assets in an amount equal to daily mark-to-market obligation for forward foreign currency contracts.
A forward foreign currency contract is an obligation between two parties (“Counterparties”) to purchase or sell a specific currency for an agreed-upon price at a future date. The use of forward foreign currency contracts does not eliminate fluctuations in the price of the underlying securities the Fund owns or intends to acquire but establishes a rate of exchange in advance. Fluctuations in the value of these contracts are measured by the difference in the contract date and reporting date exchange rates and are recorded as unrealized appreciation (depreciation) until the contracts are closed. When the contracts are closed, realized gains (losses) are recorded. Realized and unrealized gains (losses) on the contracts are included in the Statement of Operations. The primary risks associated with forward foreign currency contracts include failure of the Counterparty to meet the terms of the contract and the value of the foreign currency changing unfavorably. These risks may be in excess of the amounts reflected in the Statement of Assets and Liabilities.
NOTE 2—Advisory Fees and Other Fees Paid to Affiliates
The Trust has entered into a master investment advisory agreement with Invesco Advisers, Inc. (the “Adviser” or “Invesco”). Under the terms of the investment advisory agreement, the Fund pays an advisory fee to the Adviser based on the annual rate of the Fund’s average daily net assets as follows:
| | | | |
| Average Daily Net Assets | | Rate | |
First $1 billion | | | 0.87% | |
Next $1 billion | | | 0.82% | |
Over $2 billion | | | 0.77% | |
For the year ended October 31, 2015, the effective advisory fees incurred by the Fund was 0.87%.
Under the terms of a master sub-advisory agreement between the Adviser and each of Invesco Asset Management Deutschland GmbH, Invesco Asset Management Limited, Invesco Asset Management (Japan) Limited, Invesco Hong Kong Limited, Invesco Senior Secured Management, Inc. and Invesco Canada Ltd. (collectively, the “Affiliated Sub-Advisers”) the Adviser, not the Fund, may pay 40% of the fees paid to the Adviser to any such Affiliated Sub-Adviser(s) that provide(s) discretionary investment management services to the Fund based on the percentage of assets allocated to such Affiliated Sub-Adviser(s).
The Adviser has contractually agreed, through at least June 30, 2016, to waive advisory fees and/or reimburse expenses of all shares to the extent necessary to limit total annual fund operating expenses after fee waiver and/or expense reimbursement (excluding certain items discussed below) of Class A, Class B, Class C, Class R, Class Y and Class R5 shares to 2.25%, 3.00%, 3.00%, 2.50%, 2.00% and 2.00%, respectively, of average daily net assets. In determining the Adviser’s obligation to waive advisory fees and/or reimburse expenses, the following expenses are not taken into account, and could cause the total annual fund operating expenses after fee waiver and/or expense reimbursement to exceed the numbers reflected above: (1) interest; (2) taxes; (3) dividend expense on short sales; (4) extraordinary or non-routine items, including litigation expenses; and (5) expenses that the Fund has incurred but did not actually pay because of an expense offset arrangement. Unless Invesco continues the fee waiver agreement, it will terminate on June 30, 2016. The fee waiver agreement cannot be terminated during its term. The Adviser did not waive fees and/or reimburse expenses during the period under this expense limitation.
Further, the Adviser has contractually agreed, through at least June 30, 2017, to waive the advisory fee payable by the Fund in an amount equal to 100% of the net advisory fees the Adviser receives from the affiliated money market funds on investments by the Fund of uninvested cash (excluding investments of cash collateral from securities lending) in such affiliated money market funds.
For the year ended October 31, 2015, the Adviser waived advisory fees of $1,644.
The Trust has entered into a master administrative services agreement with Invesco pursuant to which the Fund has agreed to pay Invesco for certain administrative costs incurred in providing accounting services to the Fund. For the year ended October 31, 2015, expenses incurred under the agreement are shown in the Statement of Operations as Administrative services fees.
The Trust has entered into a transfer agency and service agreement with Invesco Investment Services, Inc. (“IIS”) pursuant to which the Fund has agreed to pay IIS a fee for providing transfer agency and shareholder services to the Fund and reimburse IIS for certain expenses incurred by IIS in the course of providing such services. IIS may make payments to intermediaries that provide omnibus account services, sub-accounting services and/or networking services. All fees payable by IIS to intermediaries that provide omnibus account services or sub-accounting are charged back to the Fund, subject to certain limitations approved by the Trust’s Board of Trustees. For the year ended October 31, 2015, expenses incurred under the agreement are shown in the Statement of Operations as Transfer agent fees.
Shares of the Fund are distributed by Invesco Distributors, Inc. (“IDI”), an affiliate of the Adviser. The Fund has adopted a Plan of Distribution (the “Plan”) pursuant to Rule 12b-1 under the 1940 Act. The Plan provides that the Fund will reimburse IDI for distribution related expenses that IDI incurs up to a maximum of the following annual rates: (1) Class A — up to 0.25% of the average daily net assets of Class A shares; (2) Class B — up to 1.00% of the average daily net assets of Class B shares; (3) Class C — up to 1.00% of the average daily net assets of Class C shares; and (4) Class R — up to 0.50% of the average daily net assets of Class R shares.
In the case of Class B shares, provided that the Plan continues in effect, any cumulative expenses incurred by IDI, but not yet reimbursed to IDI, may be recovered through the payment of future distribution fees from the Fund pursuant to the Plan and contingent deferred sales charges paid by investors upon redemption of Class B shares.
For the year ended October 31, 2015, expenses incurred under these agreements are shown in the Statement of Operations as Distribution fees.
Front-end sales commissions and CDSC (collectively, the “sales charges”) are not recorded as expenses of the Fund. Front-end sales commissions are deducted from proceeds from the sales of Fund shares prior to investment in Class A shares of the Fund. CDSC are deducted from redemption proceeds prior to remittance to the shareholder. During the year ended October 31, 2015, IDI advised the Fund that IDI retained $4,917 in front-end sales commissions from the sale of Class A shares and $243 and $46 from Class B and Class C shares, respectively, for CDSC imposed on redemptions by shareholders.
Certain officers and trustees of the Trust are officers and directors of the Adviser, IIS and/or IDI.
16 Invesco Pacific Growth Fund
NOTE 3—Additional Valuation Information
GAAP defines fair value as the price that would be received to sell an asset or paid to transfer a liability in an orderly transaction between market participants at the measurement date, under current market conditions. GAAP establishes a hierarchy that prioritizes the inputs to valuation methods, giving the highest priority to readily available unadjusted quoted prices in an active market for identical assets (Level 1) and the lowest priority to significant unobservable inputs (Level 3), generally when market prices are not readily available or are unreliable. Based on the valuation inputs, the securities or other investments are tiered into one of three levels. Changes in valuation methods may result in transfers in or out of an investment’s assigned level:
| | Level 1 — | Prices are determined using quoted prices in an active market for identical assets. |
| | Level 2 — | Prices are determined using other significant observable inputs. Observable inputs are inputs that other market participants may use in pricing a security. These may include quoted prices for similar securities, interest rates, prepayment speeds, credit risk, yield curves, loss severities, default rates, discount rates, volatilities and others. |
| | Level 3 — | Prices are determined using significant unobservable inputs. In situations where quoted prices or observable inputs are unavailable (for example, when there is little or no market activity for an investment at the end of the period), unobservable inputs may be used. Unobservable inputs reflect the Fund’s own assumptions about the factors market participants would use in determining fair value of the securities or instruments and would be based on the best available information. |
The following is a summary of the tiered valuation input levels, as of October 31, 2015. The level assigned to the securities valuations may not be an indication of the risk or liquidity associated with investing in those securities. Because of the inherent uncertainties of valuation, the values reflected in the financial statements may materially differ from the value received upon actual sale of those investments.
During the year ended October 31, 2015, there were transfers from Level 1 to Level 2 of $11,079,130 and from Level 2 to Level 1 of $5,264,075, due to foreign fair value adjustments.
| | | | | | | | | | | | | | | | |
| | | Level 1 | | | Level 2 | | | Level 3 | | | Total | |
Australia | | $ | 6,705,919 | | | $ | — | | | $ | — | | | $ | 6,705,919 | |
China | | | — | | | | 10,374,466 | | | | 117,075 | | | | 10,491,541 | |
Hong Kong | | | — | | | | 2,835,037 | | | | — | | | | 2,835,037 | |
India | | | — | | | | 5,066,736 | | | | — | | | | 5,066,736 | |
Indonesia | | | — | | | | 1,794,343 | | | | — | | | | 1,794,343 | |
Japan | | | — | | | | 32,615,593 | | | | — | | | | 32,615,593 | |
Singapore | | | 1,596,323 | | | | — | | | | — | | | | 1,596,323 | |
South Korea | | | — | | | | 7,498,941 | | | | — | | | | 7,498,941 | |
Taiwan | | | — | | | | 3,547,048 | | | | — | | | | 3,547,048 | |
Thailand | | | — | | | | 1,892,239 | | | | — | | | | 1,892,239 | |
United States | | | 1,748,470 | | | | — | | | | — | | | | 1,748,470 | |
Total Investments | | $ | 10,050,712 | | | $ | 65,624,403 | | | $ | 117,075 | | | $ | 75,792,190 | |
NOTE 4—Expense Offset Arrangement(s)
The expense offset arrangement is comprised of transfer agency credits which result from balances in demand deposit accounts used by the transfer agent for clearing shareholder transactions. For the year ended October 31, 2015, the Fund received credits from this arrangement, which resulted in the reduction of the Fund’s total expenses of $225.
NOTE 5—Trustees’ and Officers’ Fees and Benefits
Trustees’ and Officers’ Fees and Benefits include amounts accrued by the Fund to pay remuneration to certain Trustees and Officers of the Fund. Trustees have the option to defer compensation payable by the Fund, and Trustees’ and Officers’ Fees and Benefits also include amounts accrued by the Fund to fund such deferred compensation amounts. Those Trustees who defer compensation have the option to select various Invesco Funds in which their deferral accounts shall be deemed to be invested. Finally, certain current Trustees were eligible to participate in a retirement plan that provided for benefits to be paid upon retirement to Trustees over a period of time based on the number of years of service. The Fund may have certain former Trustees who also participate in a retirement plan and receive benefits under such plan. Trustees’ and Officers’ Fees and Benefits include amounts accrued by the Fund to fund such retirement benefits. Obligations under the deferred compensation and retirement plans represent unsecured claims against the general assets of the Fund.
NOTE 6—Cash Balances
The Fund is permitted to temporarily carry a negative or overdrawn balance in its account with State Street Bank and Trust Company, the custodian bank. Such balances, if any at period end, are shown in the Statement of Assets and Liabilities under the payable caption Amount due custodian. To compensate the custodian bank for such overdrafts, the overdrawn Fund may either (1) leave funds as a compensating balance in the account so the custodian bank can be compensated by earning the additional interest; or (2) compensate by paying the custodian bank at a rate agreed upon by the custodian bank and Invesco, not to exceed the contractually agreed upon rate.
17 Invesco Pacific Growth Fund
NOTE 7—Distributions to Shareholders and Tax Components of Net Assets
Tax Character of Distributions to Shareholders Paid During the Fiscal Years Ended October 31, 2015 and 2014:
| | | | | | | | |
| | | 2015 | | | 2014 | |
Ordinary income | | $ | 93,489 | | | $ | 1,240,816 | |
Tax Components of Net Assets at Period-End:
| | | | |
| | | 2015 | |
Undistributed ordinary income | | $ | (4,604 | ) |
Net unrealized appreciation — investments | | | 4,183,506 | |
Net unrealized appreciation (depreciation) — other investments | | | (3,821 | ) |
Temporary book/tax differences | | | (99,275 | ) |
Capital loss carryforward | | | (14,794,794 | ) |
Shares of beneficial interest | | | 86,314,286 | |
Total net assets | | $ | 75,595,298 | |
The difference between book-basis and tax-basis unrealized appreciation (depreciation) is due to differences in the timing of recognition of gains and losses on investments for tax and book purposes. The Fund’s net unrealized appreciation difference is attributable primarily to wash sales.
The temporary book/tax differences are a result of timing differences between book and tax recognition of income and/or expenses. The Fund’s temporary book/tax differences are the result of the trustee deferral of compensation and retirement plan benefits.
Capital loss carryforward is calculated and reported as of a specific date. Results of transactions and other activity after that date may affect the amount of capital loss carryforward actually available for the Fund to utilize. Capital losses generated in years beginning after December 22, 2010 can be carried forward for an unlimited period, whereas previous losses expire in eight tax years. Capital losses with an expiration period may not be used to offset capital gains until all net capital losses without an expiration date have been utilized. Capital loss carryforwards with no expiration date will retain their character as either short-term or long-term capital losses instead of as short-term capital losses as under prior law. The ability to utilize capital loss carryforwards in the future may be limited under the Internal Revenue Code and related regulations based on the results of future transactions.
The Fund has a capital loss carryforward as of October 31, 2015, which expires as follows:
| | | | | | | | | | | | |
| Capital Loss Carryforward* | |
| Expiration | | Short-Term | | | Long-Term | | | Total | |
October 31, 2016 | | $ | 295,867 | | | $ | — | | | $ | 295,867 | |
October 31, 2017 | | | 14,498,927 | | | | — | | | | 14,498,927 | |
| | | $ | 14,794,794 | | | $ | | | | $ | 14,794,794 | |
| * | Capital loss carryforward as of the date listed above is reduced for limitations, if any, to the extent required by the Internal Revenue Code and may be further limited depending upon a variety of factors, including the realization of net unrealized gains or losses as of the date of any reorganization. |
NOTE 8—Investment Securities
The aggregate amount of investment securities (other than short-term securities, U.S. Treasury obligations and money market funds, if any) purchased and sold by the Fund during the year ended October 31, 2015 was $105,821,400 and $105,674,202, respectively. Cost of investments on a tax basis includes the adjustments for financial reporting purposes as of the most recently completed federal income tax reporting period-end.
| | | | |
| Unrealized Appreciation (Depreciation) of Investment Securities on a Tax Basis | |
Aggregate unrealized appreciation of investment securities | | $ | 6,864,462 | |
Aggregate unrealized (depreciation) of investment securities | | | (2,680,956 | ) |
Net unrealized appreciation of investment securities | | $ | 4,183,506 | |
Cost of investments for tax purposes is $71,608,684.
NOTE 9—Reclassification of Permanent Differences
Primarily as a result of differing book/tax treatment of foreign currency transactions, net operating loss and passive foreign investment companies, on October 31, 2015, undistributed net investment income was increased by $231,165, undistributed net realized gain (loss) was decreased by $764 and shares of beneficial interest was decreased by $230,401. This reclassification had no effect on the net assets of the Fund.
18 Invesco Pacific Growth Fund
NOTE 10—Share Information
| | | | | | | | | | | | | | | | |
| | | Summary of Share Activity | |
| | | Years ended October 31, | |
| | | 2015(a) | | | 2014 | |
| | | Shares | | | Amount | | | Shares | | | Amount | |
Sold: | | | | | | | | | | | | | | | | |
Class A | | | 342,880 | | | $ | 8,510,509 | | | | 133,449 | | | $ | 3,122,847 | |
Class B | | | 1,080 | | | | 24,936 | | | | 922 | | | | 20,231 | |
Class C | | | 98,266 | | | | 2,337,682 | | | | 14,602 | | | | 327,536 | |
Class R | | | 5,689 | | | | 141,656 | | | | 12,584 | | | | 306,742 | |
Class Y | | | 161,849 | | | | 4,107,733 | | | | 107,353 | | | | 2,570,104 | |
| | | | |
Issued as reinvestment of dividends: | | | | | | | | | | | | | | | | |
Class A | | | 3,049 | | | | 70,381 | | | | 43,353 | | | | 991,482 | |
Class B | | | — | | | | — | | | | 261 | | | | 5,649 | |
Class C | | | — | | | | — | | | | 1,529 | | | | 33,187 | |
Class R | | | — | | | | — | | | | 153 | | | | 3,472 | |
Class Y | | | 450 | | | | 10,535 | | | | 2,362 | | | | 54,770 | |
| | | | |
Automatic conversion of Class B shares to Class A shares: | | | | | | | | | | | | | | | | |
Class A | | | 6,968 | | | | 169,471 | | | | 12,179 | | | | 283,842 | |
Class B | | | (7,427 | ) | | | (169,471 | ) | | | (12,895 | ) | | | (283,842 | ) |
| | | | |
Reacquired: | | | | | | | | | | | | | | | | |
Class A | | | (578,288 | ) | | | (14,075,800 | ) | | | (524,772 | ) | | | (12,342,009 | ) |
Class B | | | (2,389 | ) | | | (55,341 | ) | | | (7,007 | ) | | | (153,476 | ) |
Class C | | | (82,173 | ) | | | (1,896,754 | ) | | | (39,409 | ) | | | (866,897 | ) |
Class R | | | (9,528 | ) | | | (236,157 | ) | | | (11,043 | ) | | | (265,449 | ) |
Class Y | | | (133,611 | ) | | | (3,308,448 | ) | | | (126,963 | ) | | | (3,060,499 | ) |
Net increase (decrease) in share activity | | | (193,185 | ) | | $ | (4,369,068 | ) | | | (393,342 | ) | | $ | (9,252,310 | ) |
| (a) | There are entities that are record owners of more than 5% of the outstanding shares of the Fund and in the aggregate own 64% of the outstanding shares of the Fund. IDI has an agreement with these entities to sell Fund shares. The Fund, Invesco and/or Invesco affiliates may make payments to these entities, which are considered to be related to the Fund, for providing services to the Fund, Invesco and/or Invesco affiliates including but not limited to services such as securities brokerage, distribution, third party record keeping and account servicing. The Fund has no knowledge as to whether all or any portion of the shares owned of record by these entities are also owned beneficially. |
19 Invesco Pacific Growth Fund
NOTE 11—Financial Highlights
The following schedule presents financial highlights for a share of the Fund outstanding throughout the periods indicated.
| | | | | | | | | | | | | | | | | | | | | | | | | | | | | | | | | | | | | | | | | | | | | | | | |
| | | Net asset
value,
beginning
of period | | | Net
investment
income
(loss)(a) | | | Net gains
(losses) on
securities
(both
realized and
unrealized) | | | Total from
investment
operations | | | Dividends
from net
investment
income | | | Net asset
value, end
of period(b) | | | Total
return(c) | | | Net assets,
end of period
(000’s omitted) | | | Ratio of
expenses
to average
net assets
with fee waivers
and/or expenses
absorbed | | | Ratio of
expenses
to average net
assets without
fee waivers
and/or expenses
absorbed | | | Ratio of net
investment
income (loss)
to average
net assets | | | Portfolio
turnover(d) | |
Class A | |
Year ended 10/31/15 | | $ | 24.51 | | | $ | 0.05 | | | $ | (0.50 | ) | | $ | (0.45 | ) | | $ | (0.03 | ) | | $ | 24.03 | | | | (1.84 | )% | | $ | 66,599 | | | | 1.78 | %(e) | | | 1.78 | %(e) | | | 0.21 | %(e) | | | 137 | % |
Year ended 10/31/14 | | | 23.90 | | | | 0.14 | | | | 0.82 | | | | 0.96 | | | | (0.35 | ) | | | 24.51 | | | | 4.10 | (f) | | | 73,457 | | | | 1.77 | (f) | | | 1.77 | (f) | | | 0.60 | (f) | | | 63 | |
Year ended 10/31/13 | | | 20.05 | | | | 0.12 | | | | 3.83 | | | | 3.95 | | | | (0.10 | ) | | | 23.90 | | | | 19.76 | | | | 79,672 | | | | 1.81 | | | | 1.81 | | | | 0.56 | | | | 87 | |
Year ended 10/31/12 | | | 20.05 | | | | 0.15 | | | | 0.20 | | | | 0.35 | | | | (0.35 | ) | | | 20.05 | | | | 1.81 | | | | 74,319 | | | | 1.79 | | | | 1.79 | | | | 0.76 | | | | 101 | |
Year ended 10/31/11 | | | 22.21 | | | | 0.23 | | | | (2.20 | ) | | | (1.97 | ) | | | (0.19 | ) | | | 20.05 | | | | (8.95 | ) | | | 83,779 | | | | 1.68 | | | | 1.68 | | | | 1.03 | | | | 109 | |
Class B | |
Year ended 10/31/15 | | | 23.05 | | | | (0.12 | ) | | | (0.47 | ) | | | (0.59 | ) | | | — | | | | 22.46 | | | | (2.56 | ) | | | 272 | | | | 2.53 | (e) | | | 2.53 | (e) | | | (0.54 | )(e) | | | 137 | |
Year ended 10/31/14 | | | 22.49 | | | | (0.04 | ) | | | 0.77 | | | | 0.73 | | | | (0.17 | ) | | | 23.05 | | | | 3.28 | | | | 480 | | | | 2.53 | | | | 2.53 | | | | (0.16 | ) | | | 63 | |
Year ended 10/31/13 | | | 18.92 | | | | (0.04 | ) | | | 3.61 | | | | 3.57 | | | | — | | | | 22.49 | | | | 18.87 | | | | 889 | | | | 2.56 | | | | 2.56 | | | | (0.19 | ) | | | 87 | |
Year ended 10/31/12 | | | 18.91 | | | | (0.00 | ) | | | 0.20 | | | | 0.20 | | | | (0.19 | ) | | | 18.92 | | | | 1.09 | | | | 1,847 | | | | 2.55 | | | | 2.55 | | | | (0.00 | ) | | | 101 | |
Year ended 10/31/11 | | | 20.97 | | | | 0.06 | | | | (2.08 | ) | | | (2.02 | ) | | | (0.04 | ) | | | 18.91 | | | | (9.68 | ) | | | 4,376 | | | | 2.43 | | | | 2.43 | | | | 0.28 | | | | 109 | |
Class C | |
Year ended 10/31/15 | | | 23.09 | | | | (0.12 | ) | | | (0.47 | ) | | | (0.59 | ) | | | — | | | | 22.50 | | | | (2.55 | ) | | | 4,880 | | | | 2.53 | (e) | | | 2.53 | (e) | | | (0.54 | )(e) | | | 137 | |
Year ended 10/31/14 | | | 22.53 | | | | (0.03 | ) | | | 0.76 | | | | 0.73 | | | | (0.17 | ) | | | 23.09 | | | | 3.28 | (f) | | | 4,638 | | | | 2.52 | (f) | | | 2.52 | (f) | | | (0.15 | )(f) | | | 63 | |
Year ended 10/31/13 | | | 18.95 | | | | (0.04 | ) | | | 3.62 | | | | 3.58 | | | | — | | | | 22.53 | | | | 18.89 | | | | 5,049 | | | | 2.56 | | | | 2.56 | | | | (0.19 | ) | | | 87 | |
Year ended 10/31/12 | | | 18.94 | | | | 0.02 | | | | 0.19 | | | | 0.21 | | | | (0.20 | ) | | | 18.95 | | | | 1.15 | (f) | | | 4,624 | | | | 2.46 | (f) | | | 2.46 | (f) | | | 0.09 | (f) | | | 101 | |
Year ended 10/31/11 | | | 20.99 | | | | 0.07 | | | | (2.08 | ) | | | (2.01 | ) | | | (0.04 | ) | | | 18.94 | | | | (9.62 | )(f) | | | 5,572 | | | | 2.39 | (f) | | | 2.39 | (f) | | | 0.32 | (f) | | | 109 | |
Class R | |
Year ended 10/31/15 | | | 24.33 | | | | (0.01 | ) | | | (0.50 | ) | | | (0.51 | ) | | | — | | | | 23.82 | | | | (2.10 | ) | | | 245 | | | | 2.03 | (e) | | | 2.03 | (e) | | | (0.04 | )(e) | | | 137 | |
Year ended 10/31/14 | | | 23.74 | | | | 0.08 | | | | 0.80 | | | | 0.88 | | | | (0.29 | ) | | | 24.33 | | | | 3.78 | | | | 344 | | | | 2.03 | | | | 2.03 | | | | 0.34 | | | | 63 | |
Year ended 10/31/13 | | | 19.93 | | | | 0.07 | | | | 3.80 | | | | 3.87 | | | | (0.06 | ) | | | 23.74 | | | | 19.44 | | | | 295 | | | | 2.06 | | | | 2.06 | | | | 0.31 | | | | 87 | |
Year ended 10/31/12 | | | 19.95 | | | | 0.10 | | | | 0.20 | | | | 0.30 | | | | (0.32 | ) | | | 19.93 | | | | 1.59 | | | | 236 | | | | 2.05 | | | | 2.05 | | | | 0.50 | | | | 101 | |
Year ended 10/31/11 | | | 22.11 | | | | 0.17 | | | | (2.19 | ) | | | (2.02 | ) | | | (0.14 | ) | | | 19.95 | | | | (9.21 | ) | | | 129 | | | | 1.93 | | | | 1.93 | | | | 0.78 | | | | 109 | |
Class Y | |
Year ended 10/31/15 | | | 24.90 | | | | 0.12 | | | | (0.52 | ) | | | (0.40 | ) | | | (0.09 | ) | | | 24.41 | | | | (1.59 | ) | | | 3,587 | | | | 1.53 | (e) | | | 1.53 | (e) | | | 0.46 | (e) | | | 137 | |
Year ended 10/31/14 | | | 24.28 | | | | 0.20 | | | | 0.82 | | | | 1.02 | | | | (0.40 | ) | | | 24.90 | | | | 4.34 | | | | 2,944 | | | | 1.53 | | | | 1.53 | | | | 0.84 | | | | 63 | |
Year ended 10/31/13 | | | 20.37 | | | | 0.18 | | | | 3.88 | | | | 4.06 | | | | (0.15 | ) | | | 24.28 | | | | 20.03 | | | | 3,291 | | | | 1.56 | | | | 1.56 | | | | 0.81 | | | | 87 | |
Year ended 10/31/12 | | | 20.37 | | | | 0.20 | | | | 0.21 | | | | 0.41 | | | | (0.41 | ) | | | 20.37 | | | | 2.10 | | | | 5,240 | | | | 1.55 | | | | 1.55 | | | | 1.00 | | | | 101 | |
Year ended 10/31/11 | | | 22.57 | | | | 0.29 | | | | (2.24 | ) | | | (1.95 | ) | | | (0.25 | ) | | | 20.37 | | | | (8.77 | ) | | | 7,998 | | | | 1.43 | | | | 1.43 | | | | 1.28 | | | | 109 | |
Class R5 | |
Year ended 10/31/15 | | | 24.92 | | | | 0.15 | | | | (0.52 | ) | | | (0.37 | ) | | | (0.13 | ) | | | 24.42 | | | | (1.47 | ) | | | 13 | | | | 1.39 | (e) | | | 1.39 | (e) | | | 0.60 | (e) | | | 137 | |
Year ended 10/31/14 | | | 24.30 | | | | 0.24 | | | | 0.82 | | | | 1.06 | | | | (0.44 | ) | | | 24.92 | | | | 4.48 | | | | 13 | | | | 1.37 | | | | 1.37 | | | | 1.00 | | | | 63 | |
Year ended 10/31/13 | | | 20.39 | | | | 0.21 | | | | 3.89 | | | | 4.10 | | | | (0.19 | ) | | | 24.30 | | | | 20.23 | | | | 13 | | | | 1.43 | | | | 1.43 | | | | 0.94 | | | | 87 | |
Year ended 10/31/12 | | | 20.39 | | | | 0.24 | | | | 0.20 | | | | 0.44 | | | | (0.44 | ) | | | 20.39 | | | | 2.24 | | | | 11 | | | | 1.37 | | | | 1.37 | | | | 1.18 | | | | 101 | |
Year ended 10/31/11(g) | | | 23.52 | | | | 0.35 | | | | (3.48 | ) | | | (3.13 | ) | | | — | | | | 20.39 | | | | (13.31 | ) | | | 11 | | | | 1.22 | (h) | | | 1.22 | (h) | | | 1.49 | (h) | | | 109 | |
| (a) | Calculated using average shares outstanding. |
| (b) | Includes redemption fees added to shares of beneficial interest which were less than $0.005 per share for the years ended October 31, 2012 and October 31, 2011. |
| (c) | Includes adjustments in accordance with accounting principles generally accepted in the United States of America and as such, the net asset value for financial reporting purposes and the returns based upon those net asset values may differ from the net asset value and returns for shareholder transactions. Does not include sales charges and is not annualized for periods less than one year, if applicable. |
| (d) | Portfolio turnover is calculated at the fund level and is not annualized for periods less than one year, if applicable. For the period ended October 31, 2011, the portfolio turnover calculation excludes the value of securities purchased of $5,980,249 and sold of $4,944,271 in the effort to realign the Fund’s portfolio holdings after the reorganization of Invesco Japan Fund into the Fund. |
| (e) | Ratios are based on average daily net assets (000’s omitted) of $70,105, $355, $5,069, $307, $3,725 and $13 for Class A, Class B, Class C, Class R, Class Y and Class R5 shares, respectively. |
| (f) | The total return, ratio of expenses to average net assets and ratio of net investment income to average net assets reflect actual 12b-1 fees of 0.24% for Class A shares for the year ended October 31, 2014 and 0.99%, 0.90% and 0.95% for Class C shares for the years ended October 31, 2014, 2012 and 2011, respectively. |
| (g) | Commencement date of May 23, 2011 for Class R5 shares. |
20 Invesco Pacific Growth Fund
Report of Independent Registered Public Accounting Firm
To the Board of Trustees of AIM Investment Funds (Invesco Investment Funds)
and Shareholders of Invesco Pacific Growth Fund:
In our opinion, the accompanying statement of assets and liabilities, including the schedule of investments, and the related statements of operations and of changes in net assets and the financial highlights present fairly, in all material respects, the financial position of Invesco Pacific Growth Fund (one of the funds constituting AIM Investment Funds (Invesco Investment Funds), hereafter referred to as the “Fund”) at October 31, 2015, the results of its operations for the year then ended, the changes in its net assets for each of the two years in the period then ended and the financial highlights for each of the five years in the period then ended, in conformity with accounting principles generally accepted in the United States of America. These financial statements and financial highlights (hereafter referred to as “financial statements”) are the responsibility of the Fund’s management. Our responsibility is to express an opinion on these financial statements based on our audits. We conducted our audits of these financial statements in accordance with the standards of the Public Company Accounting Oversight Board (United States). Those standards require that we plan and perform the audit to obtain reasonable assurance about whether the financial statements are free of material misstatement. An audit includes examining, on a test basis, evidence supporting the amounts and disclosures in the financial statements, assessing the accounting principles used and significant estimates made by management, and evaluating the overall financial statement presentation. We believe that our audits, which included confirmation of securities at October 31, 2015 by correspondence with the custodian and brokers, provide a reasonable basis for our opinion.
PRICEWATERHOUSECOOPERS LLP
December 23, 2015
Houston, Texas
21 Invesco Pacific Growth Fund
Calculating your ongoing Fund expenses
Example
As a shareholder of the Fund, you incur two types of costs: (1) transaction costs, which may include sales charges (loads) on purchase payments or contingent deferred sales charges on redemptions, if any; and (2) ongoing costs, including management fees, distribution and/or service (12b-1) fees, and other Fund expenses. This example is intended to help you understand your ongoing costs (in dollars) of investing in the Fund and to compare these costs with ongoing costs of investing in other mutual funds. The example is based on an investment of $1,000 invested at the beginning of the period and held for the entire period May 1, 2015 through October 31, 2015.
Actual expenses
The table below provides information about actual account values and actual expenses. You may use the information in this table, together with the amount you invested, to estimate the expenses that you paid over the period. Simply divide your account value by $1,000 (for example, an $8,600 account value divided by $1,000 = 8.6), then multiply the result by the number in the table under the heading entitled “Actual Expenses Paid During Period” to estimate the expenses you paid on your account during this period.
Hypothetical example for comparison purposes
The table below also provides information about hypothetical account values and hypothetical expenses based on the Fund’s actual expense ratio and an assumed rate of return of 5% per year before expenses, which is not the Fund’s actual return.
The hypothetical account values and expenses may not be used to estimate the actual ending account balance or expenses you paid for the period. You may use this information to compare the ongoing costs of investing in the Fund and other funds. To do so, compare this 5% hypothetical example with the 5% hypothetical examples that appear in the shareholder reports of the other funds.
Please note that the expenses shown in the table are meant to highlight your ongoing costs only and do not reflect any transaction costs, such as sales charges (loads) on purchase payments or contingent deferred sales charges on redemptions, if any. Therefore, the hypothetical information is useful in comparing ongoing costs only, and will not help you determine the relative total costs of owning different funds. In addition, if these transaction costs were included, your costs would have been higher.
| | | | | | | | | | | | | | | | | | | | | | | | |
| Class | | Beginning
Account Value
(05/01/15) | | | ACTUAL | | | HYPOTHETICAL (5% annual return before expenses) | | | Annualized
Expense
Ratio | |
| | | Ending
Account Value
(10/31/15)1 | | | Expenses
Paid During
Period2 | | | Ending
Account Value
(10/31/15) | | | Expenses
Paid During
Period2 | | |
| A | | $ | 1,000.00 | | | $ | 935.70 | | | $ | 8.78 | | | $ | 1,016.13 | | | $ | 9.15 | | | | 1.80 | % |
| B | | | 1,000.00 | | | | 932.30 | | | | 12.42 | | | | 1,012.35 | | | | 12.93 | | | | 2.55 | |
| C | | | 1,000.00 | | | | 932.40 | | | | 12.42 | | | | 1,012.35 | | | | 12.93 | | | | 2.55 | |
| R | | | 1,000.00 | | | | 934.80 | | | | 10.00 | | | | 1,014.87 | | | | 10.41 | | | | 2.05 | |
| Y | | | 1,000.00 | | | | 937.00 | | | | 7.57 | | | | 1,017.39 | | | | 7.88 | | | | 1.55 | |
| R5 | | | 1,000.00 | | | | 937.80 | | | | 6.94 | | | | 1,018.05 | | | | 7.22 | | | | 1.42 | |
| 1 | The actual ending account value is based on the actual total return of the Fund for the period May 1, 2015 through October 31, 2015, after actual expenses and will differ from the hypothetical ending account value which is based on the Fund’s expense ratio and a hypothetical annual return of 5% before expenses. |
| 2 | Expenses are equal to the Fund’s annualized expense ratio as indicated above multiplied by the average account value over the period, multiplied by 184/365 to reflect the most recent fiscal half year. |
22 Invesco Pacific Growth Fund
Approval of Investment Advisory and Sub-Advisory Contracts
The Board of Trustees (the Board) of AIM Investment Funds (Invesco Investment Funds) is required under the Investment Company Act of 1940, as amended, to approve annually the renewal of Invesco Pacific Growth Fund’s (the Fund) investment advisory agreements. During contract renewal meetings held on June 9-10, 2015, the Board as a whole, and the disinterested or “independent” Trustees, who comprise over 75% of the Board, voting separately, approved the continuance for the Fund of the Master Investment Advisory Agreement with Invesco Advisers, Inc. (Invesco Advisers and the investment advisory agreement) and the Master Intergroup Sub-Advisory Contract for Mutual Funds with Invesco Asset Management Deutschland GmbH, Invesco Asset Management Limited, Invesco Asset Management (Japan) Limited, Invesco Hong Kong Limited, Invesco Senior Secured Management, Inc. and Invesco Canada Ltd. (collectively, the Affiliated Sub-Advisers and the sub-advisory contracts) for another year, effective July 1, 2015.
In evaluating the fairness and reasonableness of compensation under the Fund’s investment advisory agreement and sub-advisory contracts, the Board considered, among other things, the factors discussed below. The Board determined that continuation of the Fund’s investment advisory agreement and the sub-advisory contracts is in the best interest of the Fund and its shareholders and that the compensation payable to Invesco Advisers and the Affiliated Sub-Advisers under the agreements is fair and reasonable.
The Board’s Fund Evaluation Process
The Board’s Investments Committee has established three Sub-Committees, each of which is primarily responsible for overseeing the performance and investment management services provided by Invesco Advisers and the Affiliated Sub-Advisers to a number of the funds advised by Invesco Advisers (the Invesco Funds). The Sub-Committees meet throughout the year to review the performance of their assigned Invesco Funds, including reviewing materials prepared under the direction of the independent Senior Officer, an officer of the Invesco Funds who reports directly to the independent Trustees. Over the course of each year, the Sub-Committees meet with portfolio managers for their assigned Invesco Funds and other members of management to review the performance, investment objective(s), policies, strategies, limitations and investment risks of these funds. The Board had the benefit of reports from the Sub-Committees and Investments Committee throughout the year in considering approval of the continuance of each Invesco Fund’s investment advisory agreement and sub-advisory contracts for another year.
During the contract renewal process, the Board receives comparative performance and fee data regarding the Invesco Funds prepared by Invesco Advisers and Lipper Inc. (Lipper), an independent provider of investment company data. The Board also receives a report and this independent written evaluation from the Senior Officer. The Senior Officer’s evaluation is prepared as part of his responsibility to manage the process by which the Invesco Funds’ proposed management fees are negotiated during the annual contract renewal process to ensure they are negotiated in a manner that is at arms’ length and reasonable. In addition to meetings with Invesco Advisers and fund counsel, the independent Trustees also discuss the continuance of the investment advisory agreement and sub-advisory contracts in separate sessions with the Senior Officer and with independent legal counsel.
The Trustees recognized that the advisory fee rates for the Invesco Funds are, in many cases, the result of years of review and negotiation. The Trustees’ deliberations and conclusions in a particular year may be based in part on their deliberations and conclusions regarding these arrangements throughout the year and in prior years. The Trustees’ review and conclusions are based on the comprehensive consideration of all information presented to them and are not the result of any single determinative factor. Moreover, one Trustee may have weighed a particular piece of information or factor differently than another Trustee.
The discussion below is a summary of the Senior Officer’s independent written evaluation with respect to the Fund’s investment advisory agreement as well as a discussion of the material factors and related conclusions that formed the basis for the Board’s approval of the Fund’s investment advisory agreement and sub-advisory contracts. Unless otherwise stated, this information is current as of June 10, 2015, and does not reflect consideration of factors that became known to the Board after that date.
Factors and Conclusions and Summary of Independent Written Fee Evaluation
| A. | Nature, Extent and Quality of Services Provided by Invesco Advisers and the Affiliated Sub-Advisers |
The Board reviewed the advisory services provided to the Fund by Invesco Advisers under the Fund’s investment advisory agreement, the performance of Invesco Advisers in providing these services, and the credentials and experience of the officers and employees of Invesco Advisers who provide these services, including the Fund’s portfolio manager or managers. The Board’s review of the qualifications of Invesco Advisers to provide advisory services included the Board’s consideration of Invesco Advisers’ investment
process oversight, independent credit analysis and investment risk management. The Board also considered non-advisory services that Invesco Advisers and its affiliates provide to the Invesco Funds such as various back office support functions, equity and fixed income trading operations, internal audit, distribution, valuation and legal and compliance.
In determining whether to continue the Fund’s investment advisory agreement, the Board considered the benefits of reapproving an existing relationship and the greater uncertainty that may be associated with entering into a new relationship. The Board concluded that the nature, extent and quality of the services provided to the Fund by Invesco Advisers are appropriate and satisfactory and consistent with the terms of the Fund’s investment advisory agreement.
The Board reviewed the services provided by the Affiliated Sub-Advisers under the sub-advisory contracts and the credentials and experience of the officers and employees of the Affiliated Sub-Advisers who provide these services. The Board noted that the Affiliated Sub-Advisers have offices and personnel that are located in financial centers around the world. As a result, the Affiliated Sub-Advisers can provide research and investment analysis on the markets and economies of various countries in which the Fund may invest, make recommendations regarding securities and assist with security trades. The Board concluded that the sub-advisory contracts benefit the Fund and its shareholders by permitting Invesco Advisers to use the resources and talents of the Affiliated Sub-Advisers in managing the Fund. The Board concluded that the nature, extent and quality of the services provided by the Affiliated Sub-Advisers are appropriate and satisfactory and consistent with the terms of the Fund’s sub-advisory contracts.
The Board considered Fund performance as a relevant factor in considering whether to approve the investment advisory agreement as well as the sub-advisory contracts for the Fund, as Invesco Asset Management (Japan) Limited and Invesco Hong Kong Limited currently manage assets of the Fund.
The Board compared the Fund’s performance during the past one, three and five calendar years to the performance of funds in the Lipper performance universe and against the Lipper Pacific Region Funds Index. The Board noted that performance of Class A shares of the Fund was in the fourth quintile of its performance universe for the one year period and the fifth quintile for the three and five year periods (the first quintile being the best performing funds and the fifth quintile being the worst performing funds). The Board noted that performance of Class A shares of the Fund was below the performance of the Index for the one, three and
23 Invesco Pacific Growth Fund
five year periods. Invesco Advisers noted that the portfolio management team is managing to a new index, which has slightly lower exposure to Japan, but that performance remains challenged and is under review by Invesco Hong Kong Limited. The Trustees also reviewed more recent Fund performance and this review did not change their conclusions.
| C. | Advisory and Sub-Advisory Fees |
The Board compared the Fund’s contractual management fee rate to the contractual management fee rates of funds in the Fund’s Lipper expense group at a common asset level. The Board noted that the contractual management fee rate for Class A shares of the Fund was below the median contractual management fee rate of funds in its expense group. The Board noted that the term “contractual management fee” may include both advisory and certain administrative services fees, but that Lipper does not provide information on a fund by fund basis as to what is included. The Board noted that Invesco Advisers does not charge the Invesco Funds for the administrative services included in the term as defined by Lipper. The Board also reviewed the methodology used by Lipper in providing expense group information, which includes using each fund’s contractual management fee schedule (including any applicable breakpoints) as reported in the most recent prospectus or statement of additional information for each fund in the expense group.
The Board noted that Invesco Advisers and the Affiliated Sub-Advisers do not manage other mutual funds or client accounts with investment strategies comparable to those of the Fund.
The Board also considered the services provided by the Affiliated Sub-Advisers pursuant to the sub-advisory contracts, as well as the fees payable by Invesco Advisers to the Affiliated Sub-Advisers pursuant to the sub-advisory contracts. The Board noted that Invesco Advisers retains overall responsibility for, and provides services to, sub-advised Invesco Funds, including oversight of the Affiliated Sub-Advisers as well as the additional services described herein other than day-to-day portfolio management. The Board also noted that the sub-advisory fees are not paid directly by the Fund, but rather, are payable by Invesco Advisers to the Affiliated Sub-Advisers.
| D. | Economies of Scale and Breakpoints |
The Board considered the extent to which there are economies of scale in the provision of advisory services to the Fund. The Board also considered whether the Fund benefits from economies of scale through contractual breakpoints in the Fund’s advisory fee schedule. The Board also noted that the Fund shares directly in economies of scale through lower fees charged by third party service providers based on the combined size of the Invesco Funds and other clients advised by Invesco Advisers.
| E. | Profitability and Financial Resources |
The Board reviewed information from Invesco Advisers concerning the costs of the advisory
and other services that Invesco Advisers and its affiliates provide to the Fund and the Invesco Funds and the profitability of Invesco Advisers and its affiliates in providing these services. The Board received information from Invesco Advisers about the methodology used to prepare the profitability information. The Board noted that Invesco Advisers continues to operate at a net profit from services Invesco Advisers and its affiliates provide to the Invesco Funds and the Fund. The Board did not deem the level of profits realized by Invesco Advisers and its affiliates from providing services to the Fund to be excessive given the nature, quality and extent of the services provided. The Board received and accepted information from Invesco Advisers demonstrating that Invesco Advisers and each Affiliated Sub-Adviser are financially sound and have the resources necessary to perform their obligations under the investment advisory agreement and sub-advisory contracts.
| F. | Collateral Benefits to Invesco Advisers and its Affiliates |
The Board considered various other benefits received by Invesco Advisers and its affiliates from the relationship with the Fund, including the fees received for providing transfer agency and distribution services to the Fund. The Board considered comparative information regarding fees charged for these services, including information provided by Lipper and other independent sources. The Board considered the performance of Invesco Advisers and its affiliates in providing these services and the organizational structure employed to provide these services. The Board also considered that these services are provided to the Fund pursuant to written contracts that are reviewed and approved on an annual basis by the Board; and that the services are required for the operation of the Fund.
The Board considered the benefits realized by Invesco Advisers and the Affiliated Sub-Advisers as a result of portfolio brokerage transactions executed through “soft dollar” arrangements. The Board noted that soft dollar arrangements shift the payment obligation for research services from Invesco Advisers and the Affiliated Sub-Advisers to the Invesco Funds and that the research received may be used with other clients of Invesco Advisers and may reduce Invesco Advisers’ and the Affiliated Sub-Advisers’ expenses. The Board also considered that it receives periodic reports from the Chief Compliance Officer of the Invesco Funds demonstrating that these arrangements are consistent with regulatory requirements. The Board did not deem the soft dollar arrangements to be inappropriate.
The Board considered that the Fund’s uninvested cash and cash collateral from any securities lending arrangements may be invested in money market funds advised by Invesco Advisers pursuant to procedures approved by the Board. The Board noted that Invesco Advisers receives advisory fees from these affiliated money market funds attributable to such investments, although
Invesco Advisers has contractually agreed to waive through varying periods the advisory fees payable by the Invesco Funds with respect to investments in the affiliated money market funds. The waiver is in an amount equal to 100% of the net advisory fee Invesco Advisers receives from the affiliated money market funds with respect to the Fund’s investment in the affiliated money market funds of uninvested cash, but not cash collateral. The Board concluded that the amount of advisory fees received by Invesco Advisors from the Fund’s investment of cash collateral from any securities lending arrangements in the affiliated money market funds is fair and reasonable.
The Board also considered the Fund may use an affiliated broker to execute certain trades for the Fund to, among other things, control information leakage, and were advised that such trades would be executed in compliance with rules under the Investment Company Act of 1940, as amended, and consistent with best execution obligations.
24 Invesco Pacific Growth Fund
Tax Information
Form 1099-DIV, Form 1042-S and other year–end tax information provide shareholders with actual calendar year amounts that should be included in their tax returns. Shareholders should consult their tax advisors.
The following distribution information is being provided as required by the Internal Revenue Code or to meet a specific state’s requirement.
The Fund designates the following amounts or, if subsequently determined to be different, the maximum amount allowable for its fiscal year ended October 31, 2015:
| | | | |
Federal and State Income Tax | |
Qualified Dividend Income* | | | 95.07 | % |
Corporate Dividends Received Deduction* | | | 0 | % |
U.S. Treasury Obligations* | | | 0 | % |
| | * | The above percentages are based on ordinary income dividends paid to shareholders during the Fund’s fiscal year. |
25 Invesco Pacific Growth Fund
Trustees and Officers
The address of each trustee and officer is AIM Investment Funds (Invesco Investment Funds) (the “Trust”), 11 Greenway Plaza, Suite 1000, Houston, Texas 77046-1173. The trustees serve for the life of the Trust, subject to their earlier death, incapacitation, resignation, retirement or removal as more specifically provided in the Trust’s organizational documents. Each officer serves for a one year term or until their successors are elected and qualified. Column two below includes length of time served with predecessor entities, if any.
| | | | | | | | |
Name, Year of Birth and
Position(s) Held with the Trust | | Trustee and/
or Officer Since | | Principal Occupation(s)
During Past 5 Years | | Number of Funds in Fund Complex Overseen by Trustee | | Other Directorship(s) Held by Trustee During Past 5 Years |
| Interested Persons | | | | | | | | |
| Martin L. Flanagan1 — 1960 Trustee | | 2007 | | Executive Director, Chief Executive Officer and President, Invesco Ltd. (ultimate parent of Invesco and a global investment management firm); Advisor to the Board, Invesco Advisers, Inc. (formerly known as Invesco Institutional (N.A.), Inc.); Trustee, The Invesco Funds; Vice Chair, Investment Company Institute; and Member of Executive Board, SMU Cox School of Business Formerly: Chairman and Chief Executive Officer, Invesco Advisers, Inc. (registered investment adviser); Director, Chairman, Chief Executive Officer and President, IVZ Inc. (holding company), INVESCO Group Services, Inc. (service provider) and Invesco North American Holdings, Inc. (holding company); Director, Chief Executive Officer and President, Invesco Holding Company Limited (parent of Invesco and a global investment management firm); Director, Invesco Ltd.; Chairman, Investment Company Institute and President, Co-Chief Executive Officer, Co-President, Chief Operating Officer and Chief Financial Officer, Franklin Resources, Inc. (global investment management organization). | | 145 | | None |
Philip A. Taylor2 — 1954
Trustee, President and Principal Executive Officer | | 2006 | | Head of North American Retail and Senior Managing Director, Invesco Ltd.; Director, Co-Chairman, Co-President and Co-Chief Executive Officer, Invesco Advisers, Inc. (formerly known as Invesco Institutional (N.A.), Inc.) (registered investment adviser); Director, Chairman, Chief Executive Officer and President, Invesco Management Group, Inc. (formerly known as Invesco Aim Management Group, Inc.) (financial services holding company); Director and President, INVESCO Funds Group, Inc. (registered investment adviser and registered transfer agent); Director and Chairman, Invesco Investment Services, Inc. (formerly known as Invesco Aim Investment Services, Inc.) (registered transfer agent) and IVZ Distributors, Inc. (formerly known as INVESCO Distributors, Inc.) (registered broker dealer); Chief Executive Officer, Invesco Corporate Class Inc. (corporate mutual fund company) Director, Chairman and Chief Executive Officer, Invesco Canada Ltd. (formerly known as Invesco Trimark Ltd./Invesco Trimark Ltèe) (registered investment adviser and registered transfer agent); Trustee, President and Principal Executive Officer, The Invesco Funds (other than AIM Treasurer’s Series Trust (Invesco Treasurer’s Series Trust), Short-Term Investments Trust and Invesco Management Trust); Trustee and Executive Vice President, The Invesco Funds (AIM Treasurer’s Series Trust (Invesco Treasurer’s Series Trust), Short-Term Investments Trust and Invesco Management Trust only); Director, Invesco Investment Advisers LLC (formerly known as Van Kampen Asset Management); Director, Chief Executive Officer and President, Van Kampen Exchange Corp. Formerly: Director, President and Chairman, Invesco Inc. (holding company), Invesco Canada Holdings Inc. (holding company), Trimark Investments Ltd./Placements Trimark Ltèe and Invesco Financial Services Ltd/Services Financiers Invesco Ltèe; Chief Executive Officer, Invesco Canada Fund Inc (corporate mutual fund company); Director and Chairman, Van Kampen Investor Services Inc.; Director, Chief Executive Officer and President, 1371 Preferred Inc. (holding company) and Van Kampen Investments Inc.; Director and President, AIM GP Canada Inc. (general partner for limited partnerships) and Van Kampen Advisors, Inc.; Director and Chief Executive Officer, Invesco Trimark Dealer Inc. (registered broker dealer); Director, Invesco Distributors, Inc. (formerly known as Invesco Aim Distributors, Inc.) (registered broker dealer); Manager, Invesco PowerShares Capital Management LLC; Director, Chief Executive Officer and President, Invesco Advisers, Inc.; Director, Chairman, Chief Executive Officer and President, Invesco Aim Capital Management, Inc.; President, Invesco Trimark Dealer Inc. and Invesco Trimark Ltd./Invesco Trimark Ltèe; Director and President, AIM Trimark Corporate Class Inc. and AIM Trimark Canada Fund Inc.; Senior Managing Director, Invesco Holding Company Limited; Director and Chairman, Fund Management Company (former registered broker dealer); President and Principal Executive Officer, The Invesco Funds (AIM Treasurer’s Series Trust (Invesco Treasurer’s Series Trust), and Short-Term Investments Trust only); President, AIM Trimark Global Fund Inc. and AIM Trimark Canada Fund Inc.. | | 145 | | None |
| 1 | Mr. Flanagan is considered an interested person (within the meaning of Section 2(a)(19) of the 1940 Act) of the Trust because he is an officer of the Adviser to the Trust, and an officer and a director of Invesco Ltd., ultimate parent of the Adviser. |
| 2 | Mr. Taylor is considered an interested person (within the meaning of Section 2(a)(19) of the 1940 Act) of the Trust because he is an officer and a director of the Adviser. |
T-1 Invesco Pacific Growth Fund
Trustees and Officers—(continued)
| | | | | | | | |
Name, Year of Birth and Position(s) Held with the Trust | | Trustee and/ or Officer Since | | Principal Occupation(s) During Past 5 Years | | Number of Funds in Fund Complex Overseen by Trustee | | Other Directorship(s) Held by Trustee During Past 5 Years |
| Independent Trustees | | | | | | | | |
Bruce L. Crockett — 1944 Trustee and Chair | | 2003 | | Chairman, Crockett Technologies Associates (technology consulting company) Formerly: Director, Captaris (unified messaging provider); Director, President and Chief Executive Officer, COMSAT Corporation; Chairman, Board of Governors of INTELSAT (international communications company); ACE Limited (insurance company); Independent Directors Council and Investment Company Institute | | 145 | | ALPS (Attorneys Liability Protection Society) (insurance company) and Globe Specialty Metals, Inc. (metallurgical company) |
David C. Arch — 1945 Trustee | | 2010 | | Chairman of Blistex Inc., a consumer health care products manufacturer | | 145 | | Board member of the Illinois Manufacturers’ Association; Member of the Board of Visitors, Institute for the Humanities, University of Michigan; Member of the Audit Committee of the Edward-Elmhurst Hospital |
James T. Bunch — 1942 Trustee | | 2000 | | Managing Member, Grumman Hill Group LLC (family office/private equity investments) Formerly: Founder, Green Manning & Bunch Ltd. (investment banking firm) (1988-2010); Executive Committee, United States Golf Association; and Chairman, Board of Governors, Western Golf Association | | 145 | | Chairman of the Board of Trustees, Evans Scholars Foundation; and Chairman of the Board, Denver Film Society |
Rodney F. Dammeyer — 1940 Trustee | | 2010 | | Chairman of CAC, LLC, (private company offering capital investment and management advisory services) Formerly: Prior to 2001, Managing Partner at Equity Group Corporate Investments; Prior to 1995, Chief Executive Officer of Itel Corporation (formerly Anixter International); Prior to 1985, experience includes Senior Vice President and Chief Financial Officer of Household International, Inc., Executive Vice President and Chief Financial Officer of Northwest Industries, Inc. and Partner of Arthur Andersen & Co.; From 1987 to 2010, Director/Trustee of investment companies in the Van Kampen Funds complex | | 145 | | Director of Quidel Corporation and Stericycle, Inc. |
Albert R. Dowden — 1941 Trustee | | 2003 | | Director of a number of public and private business corporations, including the Boss Group, Ltd. (private investment and management); Nature’s Sunshine Products, Inc. and Reich & Tang Funds (5 portfolios) (registered investment company) Formerly: Director, Homeowners of America Holding Corporation/Homeowners of America Insurance Company (property casualty company); Director, Continental Energy Services, LLC (oil and gas pipeline service); Director, CompuDyne Corporation (provider of product and services to the public security market) and Director, Annuity and Life Re (Holdings), Ltd. (reinsurance company); Director, President and Chief Executive Officer, Volvo Group North America, Inc.; Senior Vice President, AB Volvo; Director of various public and private corporations; Chairman, DHJ Media, Inc.; Director, Magellan Insurance Company; and Director, The Hertz Corporation, Genmar Corporation (boat manufacturer), National Media Corporation; Advisory Board of Rotary Power International (designer, manufacturer, and seller of rotary power engines); and Chairman, Cortland Trust, Inc. (registered investment company) | | 145 | | Director of: Nature’s Sunshine Products, Inc., Reich & Tang Funds, Homeowners of America Holding Corporation/ Homeowners of America Insurance Company, the Boss Group |
Jack M. Fields — 1952 Trustee | | 2003 | | Chief Executive Officer, Twenty First Century Group, Inc. (government affairs company); Owner and Chief Executive Officer, Dos Angeles Ranch, L.P. (cattle, hunting, corporate entertainment); and Discovery Global Education Fund (non-profit) Formerly: Chief Executive Officer, Texana Timber LP (sustainable forestry company); Director of Cross Timbers Quail Research Ranch (non-profit); and member of the U.S. House of Representatives | | 145 | | Insperity, Inc. (formerly known as Administaff) |
Prema Mathai-Davis — 1950 Trustee | | 2003 | | Retired. Formerly: Chief Executive Officer, YWCA of the U.S.A. | | 145 | | None |
Larry Soll — 1942 Trustee | | 1997 | | Retired. Formerly: Chairman, Chief Executive Officer and President, Synergen Corp. (a biotechnology company) | | 145 | | None |
Hugo F. Sonnenschein — 1940 Trustee | | 2010 | | President Emeritus and Honorary Trustee of the University of Chicago and the Adam Smith Distinguished Service Professor in the Department of Economics at the University of Chicago. Prior to 2000, President of the University of Chicago | | 145 | | Trustee of the University of Rochester and a member of its investment committee; Member of the National Academy of Sciences and the American Philosophical Society; Fellow of the American Academy of Arts and Sciences |
Raymond Stickel, Jr. — 1944 Trustee | | 2005 | | Retired. Formerly: Director, Mainstay VP Series Funds, Inc. (25 portfolios) and Partner, Deloitte & Touche | | 145 | | None |
T-2 Invesco Pacific Growth Fund
Trustees and Officers—(continued)
| | | | | | | | |
Name, Year of Birth and Position(s) Held with the Trust | | Trustee and/ or Officer Since | | Principal Occupation(s) During Past 5 Years | | Number of Funds in Fund Complex Overseen by Trustee | | Other Directorship(s) Held by Trustee During Past 5 Years |
| Independent Trustees—(continued) |
Suzanne H. Woolsey — 1941 Trustee | | 2014 | | Chief Executive Officer of Woolsey Partners LLC | | 145 | | Emeritus Chair of the Board of Trustees of the Institute for Defense Analyses; Trustee of Colorado College; Trustee of California Institute of Technology; Prior to 2014, Director of Fluor Corp.; Prior to 2010, Trustee of the German Marshall Fund of the United States; Prior to 2010 Trustee of the Rocky Mountain Institute |
| Other Officers | | | | | | | | |
Russell C. Burk — 1958
Senior Vice President and Senior Officer | | 2005 | | Senior Vice President and Senior Officer, The Invesco Funds | | N/A | | N/A |
John M. Zerr — 1962
Senior Vice President, Chief Legal Officer and Secretary | | 2006 | | Director, Senior Vice President, Secretary and General Counsel, Invesco Management Group, Inc. (formerly known as Invesco Aim Management Group, Inc.) and Van Kampen Exchange Corp.; Senior Vice President, Invesco Advisers, Inc. (formerly known as Invesco Institutional (N.A.), Inc.) (registered investment adviser); Senior Vice President and Secretary, Invesco Distributors, Inc. (formerly known as Invesco Aim Distributors, Inc.); Director, Vice President and Secretary, Invesco Investment Services, Inc. (formerly known as Invesco Aim Investment Services, Inc.) and IVZ Distributors, Inc. (formerly known as INVESCO Distributors, Inc.); Director and Vice President, INVESCO Funds Group, Inc.; Senior Vice President, Chief Legal Officer and Secretary, The Invesco Funds; Managing Director, Invesco PowerShares Capital Management LLC; Director, Secretary and General Counsel, Invesco Investment Advisers LLC (formerly known as Van Kampen Asset Management); Secretary and General Counsel, Invesco Capital Markets, Inc. (formerly known as Van Kampen Funds Inc.) and Chief Legal Officer, PowerShares Exchange-Traded Fund Trust, PowerShares Exchange-Traded Fund Trust II, PowerShares India Exchange-Traded Fund Trust, PowerShares Actively Managed Exchange-Traded Fund Trust, and PowerShares Actively Managed Exchange-Traded Commodity Fund Trust Formerly: Director and Vice President, Van Kampen Advisors Inc.; Director, Vice President, Secretary and General Counsel, Van Kampen Investor Services Inc.; Director, Invesco Distributors, Inc. (formerly known as Invesco Aim Distributors, Inc.); Director, Senior Vice President, General Counsel and Secretary, Invesco Aim Advisers, Inc. and Van Kampen Investments Inc.; Director, Vice President and Secretary, Fund Management Company; Director, Senior Vice President, Secretary, General Counsel and Vice President, Invesco Aim Capital Management, Inc.; Chief Operating Officer and General Counsel, Liberty Ridge Capital, Inc. (an investment adviser); Vice President and Secretary, PBHG Funds (an investment company) and PBHG Insurance Series Fund (an investment company); Chief Operating Officer, General Counsel and Secretary, Old Mutual Investment Partners (a broker-dealer); General Counsel and Secretary, Old Mutual Fund Services (an administrator) and Old Mutual Shareholder Services (a shareholder servicing center); Executive Vice President, General Counsel and Secretary, Old Mutual Capital, Inc. (an investment adviser); and Vice President and Secretary, Old Mutual Advisors Funds (an investment company) | | N/A | | N/A |
Sheri Morris — 1964
Vice President, Treasurer and Principal Financial Officer | | 2003 | | Vice President, Treasurer and Principal Financial Officer, The Invesco Funds; Vice President, Invesco Advisers, Inc. (formerly known as Invesco Institutional (N.A.), Inc.) (registered investment adviser); and Vice President, PowerShares Exchange-Traded Fund Trust, PowerShares Exchange-Traded Fund Trust II, PowerShares India Exchange-Traded Fund Trust, PowerShares Actively Managed Exchange-Traded Fund Trust, and PowerShares Actively Managed Exchange-Traded Commodity Fund Trust Formerly: Vice President, Invesco Aim Advisers, Inc., Invesco Aim Capital Management, Inc. and Invesco Aim Private Asset Management, Inc.; Assistant Vice President and Assistant Treasurer, The Invesco Funds and Assistant Vice President, Invesco Advisers, Inc., Invesco Aim Capital Management, Inc. and Invesco Aim Private Asset Management, Inc.; and Treasurer, PowerShares Exchange-Traded Fund Trust, PowerShares Exchange-Traded Fund Trust II, PowerShares India Exchange-Traded Fund Trust and PowerShares Actively Managed Exchange-Traded Fund Trust | | N/A | | N/A |
T-3 Invesco Pacific Growth Fund
Trustees and Officers—(continued)
| | | | | | | | |
Name, Year of Birth and
Position(s) Held with the Trust | | Trustee and/
or Officer Since | | Principal Occupation(s)
During Past 5 Years | | Number of Funds in Fund Complex Overseen by Trustee | | Other Directorship(s) Held by Trustee During Past 5 Years |
| Other Officers—(continued) | | | | | | | | |
Karen Dunn Kelley — 1960
Vice President | | 2003 | | Senior Managing Director, Investments, Invesco Ltd.; Director, Co-President, Co-Chief Executive Officer, and Co-Chairman, Invesco Advisers, Inc. (formerly known as Invesco Institutional (N.A.), Inc.) (registered investment adviser); Chairman, Invesco Senior Secured Management, Inc.; Senior Vice President, Invesco Management Group, Inc. (formerly known as Invesco Aim Management Group, Inc.); Executive Vice President, Invesco Distributors, Inc. (formerly known as Invesco Aim Distributors, Inc.); Director, Invesco Mortgage Capital Inc. and Invesco Management Company Limited; Vice President, The Invesco Funds (other than AIM Treasurer’s Series Trust (Invesco Treasurer’s Series Trust), Short-Term Investments Trust and Invesco Management Trust); and President and Principal Executive Officer, The Invesco Funds (AIM Treasurer’s Series Trust (Invesco Treasurer’s Series Trust), Short-Term Investments Trust and Invesco Management Trust only) Formerly: Director and President, INVESCO Asset Management (Bermuda) Ltd., Director, INVESCO Global Asset Management Limited and INVESCO Management S.A.; Senior Vice President, Van Kampen Investments Inc. and Invesco Advisers, Inc. (formerly known as Invesco Institutional (N.A.), Inc.) (registered investment adviser); Vice President, Invesco Advisers, Inc. (formerly known as Invesco Institutional (N.A.), Inc.); Director of Cash Management and Senior Vice President, Invesco Advisers, Inc. and Invesco Aim Capital Management, Inc.; Director and President, Fund Management Company; Chief Cash Management Officer, Director of Cash Management, Senior Vice President, and Managing Director, Invesco Aim Capital Management, Inc.; Director of Cash Management, Senior Vice President, and Vice President, Invesco Advisers, Inc. and The Invesco Funds (AIM Treasurer’s Series Trust (Invesco Treasurer’s Series Trust), and Short-Term Investments Trust only) | | N/A | | N/A |
Crissie M. Wisdom — 1969 Anti-Money Laundering Compliance Officer | | 2013 | | Anti-Money Laundering Compliance Officer, Invesco Advisers, Inc. (formerly known as Invesco Institutional (N.A.), Inc.) (registered investment adviser), Invesco Capital Markets, Inc. (formerly known as Van Kampen Funds Inc.), Invesco Distributors, Inc., Invesco Investment Services, Inc., Invesco Management Group, Inc., Van Kampen Exchange Corp., The Invesco Funds, and PowerShares Exchange-Traded Fund Trust, PowerShares Exchange-Traded Fund Trust II, PowerShares India Exchange-Traded Fund Trust, PowerShares Actively Managed Exchange-Traded Fund Trust and PowerShares Actively Managed Exchange-Traded Commodity Fund Trust; Anti-Money Laundering Compliance Officer and Bank Secrecy Act Officer, INVESCO National Trust Company and Invesco Trust Company; and Fraud Prevention Manager and Controls and Risk Analysis Manager for Invesco Investment Services, Inc.. | | N/A | | N/A |
Lisa O. Brinkley — 1959 Chief Compliance Officer | | 2015 | | Senior Vice President and Chief Compliance Officer, Invesco Advisers, Inc. (registered investment adviser) (formerly known as Invesco Institutional (N.A., Inc.); and Chief Compliance Officer, The Invesco Funds Formerly: Global Assurance Officer, Invesco Ltd. and Vice President, The Invesco Funds; Chief Compliance Officer, Invesco Distributors, Inc. (formerly known as Invesco Aim Distributors, Inc.), Invesco Investment Services, Inc.(formerly known as Invesco Aim Investment Services, Inc.) and Van Kampen Investor Services Inc.; Senior Vice President, Invesco Management Group, Inc.; Senior Vice President and Chief Compliance Officer, Invesco Advisers, Inc. and The Invesco Funds; Vice President and Chief Compliance Officer, Invesco Aim Capital Management, Inc. and Invesco Distributors, Inc.; Vice President, Invesco Investment Services, Inc. and Fund Management Company. | | N/A | | N/A |
The Statement of Additional Information of the Trust includes additional information about the Fund’s Trustees and is available upon request, without charge, by calling 1.800.959.4246. Please refer to the Fund’s prospectus for information on the Fund’s sub-advisers.
| | | | | | |
Office of the Fund 11 Greenway Plaza, Suite 1000 Houston, TX 77046-1173 | | Investment Adviser Invesco Advisers, Inc. 1555 Peachtree Street, N.E. Atlanta, GA 30309 | | Distributor
Invesco Distributors, Inc. 11 Greenway Plaza, Suite 1000 Houston, TX 77046-1173 | | Auditors PricewaterhouseCoopers LLP 1000 Louisiana Street, Suite 5800 Houston, TX 77002-5678 |
| | | |
| | | | | | |
Counsel to the Fund Stradley Ronon Stevens & Young, LLP 2005 Market Street, Suite 2600 Philadelphia, PA 19103-7018 | | Counsel to the Independent Trustees Goodwin Procter LLP 901 New York Avenue, N.W. Washington, D.C. 20001 | | Transfer Agent Invesco Investment Services, Inc. 11 Greenway Plaza, Suite 1000 Houston, TX 77046-1173 | | Custodian State Street Bank and Trust Company 225 Franklin Street Boston, MA 02110-2801 |
T-4 Invesco Pacific Growth Fund

Invesco mailing information
Send general correspondence to Invesco Investment Services, Inc., P.O. Box 219078, Kansas City, MO 64121-9078.
Important notice regarding delivery of security holder documents
To reduce Fund expenses, only one copy of most shareholder documents may be mailed to shareholders with multiple accounts at the same address (Householding). Mailing of your shareholder documents may be householded indefinitely unless you instruct us otherwise. If you do not want the mailing of these documents to be combined with those for other members of your household, please contact Invesco Investment Services, Inc. at 800 959 4246 or contact your financial institution. We will begin sending you individual copies for each account within 30 days after receiving your request.
Fund holdings and proxy voting information
The Fund provides a complete list of its holdings four times in each fiscal year, at the quarter ends. For the second and fourth quarters, the lists appear in the Fund’s semiannual and annual reports to shareholders. For the first and third quarters, the Fund files the lists with the Securities and Exchange Commission (SEC) on Form N-Q. The most recent list of portfolio holdings is available at invesco.com/completeqtrholdings. Shareholders can also look up the Fund’s Forms N-Q on the SEC website at sec.gov. Copies of the Fund’s Forms N-Q may be reviewed and copied at the SEC Public Reference Room in Washington, D.C. You can obtain information on the operation of the Public Reference Room, including information about duplicating fee charges, by calling 202 551 8090 or 800 732 0330, or by electronic request at the following email address: publicinfo@sec.gov. The SEC file numbers for the Fund are shown below.
A description of the policies and procedures that the Fund uses to determine how to vote proxies relating to portfolio securities is available without charge, upon request, from our Client Services department at 800 959 4246 or at invesco.com/proxyguidelines. The information is also available on the SEC website, sec.gov.
| | |
Information regarding how the Fund voted proxies related to its portfolio securities during the most recent 12-month period ended June 30 is available at invesco.com/proxysearch. The information is also available on the SEC website, sec.gov. Invesco Advisers, Inc. is an investment adviser; it provides investment advisory services to individual and institutional clients and does not sell securities. Invesco Distributors, Inc. is the US distributor for Invesco Ltd.’s retail mutual funds, exchange-traded funds and institutional money market funds. Both are wholly owned, indirect subsidiaries of Invesco Ltd. | |  |
SEC file numbers: 811-05426 and 033-19338 MS-PGRO-AR-1 Invesco Distributors, Inc.
| | | | | | |
| | | | |
| |  | | Annual Report to Shareholders | | October 31, 2015 |
| | | |
| | | Invesco Premium Income Fund |
| | | Nasdaq: |
| | | A: PIAFX n C: PICFX n R: PIRFX n Y: PIYFX n R5: IPNFX n R6: PIFFX |

Letters to Shareholders
| | |

Philip Taylor | | Dear Shareholders: This annual report includes information about your Fund, including performance data and a complete list of its investments as of the close of the reporting period. Inside is a discussion of how your Fund was managed and the factors that affected its performance during the reporting period. I hope you find this report of interest. The US economy expanded and unemployment declined throughout the reporting period. Continuing low energy prices benefited consumers, but a strong US dollar crimped corporate profits. The US Federal Reserve signaled that it was increasingly likely to raise interest rates, based on generally positive economic data, but uncertainty remained about when it might act. Overseas, the story was much different. Low energy prices hurt the economies of some oil-producing nations, such as Brazil and Russia. During the reporting period, the European Central |
| |
Bank as well as central banks in China and Japan – among other countries – either instituted or maintained extraordinarily accommodative monetary policies in response to economic weakness. Investor uncertainty, such as we saw for much of the reporting period – and market volatility, such as we saw at the end of the reporting period – are unfortunate facts of life when it comes to investing. Some investors use these things as excuses to delay saving and investing for their long-term financial goals. That’s why Invesco encourages investors to work with a professional financial adviser who can stress the importance of starting to save and invest early and the importance of adhering to a disciplined investment plan – when times are good and when they’re uncertain. A financial adviser who knows your unique financial situation, investment goals and risk tolerance can be an invaluable partner as you seek to achieve your financial goals. He or she can offer a long-term perspective when markets are volatile and time-tested advice and guidance when your financial situation or investment goals change. |
Timely information when and where you want it
Invesco’s efforts to help investors achieve their financial objectives include providing individual investors and financial professionals with timely information about the markets, the economy and investing – whenever and wherever they want it.
Our website, invesco.com/us, offers a wide range of market insights and investment perspectives. On the website, you’ll find detailed information about our funds, including prices, performance, holdings and portfolio manager commentaries. You can access information about your account by completing a simple, secure online registration. Click on the “Need to register” link in the “Account Access” box on our homepage to get started.
Invesco’s mobile apps for iPhone® and iPad® (both available free from the App StoreSM) allow you to obtain the same detailed information, monitor your account and create customizable watch lists. Also, they allow you to access investment insights from our investment leaders, market strategists, economists and retirement experts. You can sign up to be alerted when new commentary is added, and you can watch portfolio manager videos and have instant access to Invesco news and updates wherever you may be.
In addition to the resources accessible on our website and through our mobile app, you can obtain timely updates to help you stay informed about the markets, the economy and investing by connecting with Invesco on Twitter, LinkedIn or Facebook. You can access our blog at blog.invesco.us.com. Our goal is to provide you the information you want, when and where you want it.
Have questions?
For questions about your account, feel free to contact an Invesco client services representative at 800 959 4246. For Invesco-related questions or comments, please email me directly at phil@invesco.com.
All of us at Invesco look forward to serving your investment management needs for many years to come. Thank you for investing with us.
Sincerely,

Philip Taylor
Senior Managing Director, Invesco Ltd.
iPhone and iPad are trademarks of Apple Inc., registered in the US and other countries. App Store is a service mark of Apple Inc. Invesco Distributors, Inc. is not affiliated with Apple Inc.
2 Invesco Premium Income Fund
| | |

Bruce Crockett | | Dear Fellow Shareholders: Among the many important lessons I’ve learned in more than 40 years in a variety of business endeavors is the value of a trusted advocate. As independent chair of the Invesco Funds Board, I can assure you that the members of the Board are strong advocates for the interests of investors in Invesco’s mutual funds. We work hard to represent your interests through oversight of the quality of the investment management services your funds receive and other matters important to your investment, including but not limited to: n Ensuring that Invesco offers a diverse lineup of mutual funds that your financial adviser can use to strive to meet your financial needs as your investment goals change over time. n Monitoring how the portfolio management teams of the Invesco funds are performing in light of changing economic and market conditions. |
| | n | | Assessing each portfolio management team’s investment performance within the context of the investment strategy described in the fund’s prospectus. |
| | n | | Monitoring for potential conflicts of interests that may impact the nature of the services that your funds receive. |
We believe one of the most important services we provide our fund shareholders is the annual review of the funds’ advisory and sub-advisory contracts with Invesco Advisers and its affiliates. This review is required by the Investment Company Act of 1940 and focuses on the nature and quality of the services Invesco provides as the adviser to the Invesco funds and the reasonableness of the fees that it charges for those services. Each year, we spend months carefully reviewing information received from Invesco and a variety of independent sources, such as performance and fee data prepared by Lipper Inc., an independent, third-party firm widely recognized as a leader in its field. We also meet with our independent legal counsel and other independent advisers to review and help us assess the information that we have received. Our goal is to assure that you receive quality investment management services for a reasonable fee.
I trust the measures outlined above provide assurance that you have a worthy advocate when it comes to choosing the Invesco Funds.
As always, please contact me at bruce@brucecrockett.com with any questions or concerns you may have. On behalf of the Board, we look forward to continuing to represent your interests and serving your needs.
Sincerely,

Bruce L. Crockett
Independent Chair
Invesco Funds Board of Trustees
3 Invesco Premium Income Fund
Management’s Discussion of Fund Performance
Performance summary
For the fiscal year ended October 31, 2015, Class A shares of Invesco Premium Income Fund (the Fund), at net asset value (NAV), underperformed the Custom Invesco Premium Income Index, the Fund’s style-specific index.
Your Fund’s long-term performance appears later in this report.
Fund vs. Indexes
Total returns, 10/31/14 to 10/31/15, at net asset value (NAV). Performance shown does not include applicable contingent deferred sales charges (CDSC) or front-end sales charges, which would have reduced performance.
| | | | | |
Class A Shares | | | | 2.02 | % |
Class C Shares | | | | 1.26 | |
Class R Shares | | | | 1.77 | |
Class Y Shares | | | | 2.28 | |
Class R5 Shares | | | | 2.28 | |
Class R6 Shares | | | | 2.28 | |
Barclays U.S. Aggregate Index▼ (Broad Market Index) | | | | 1.96 | |
Custom Invesco Premium Income Index¢ (Style-Specific Index) | | | | 3.75 | |
Lipper Mixed-Asset Target Allocation Conservative Funds Index¿
(Peer Group Index) | | | | -0.15 | |
|
| Source(s): ▼FactSet Research Systems Inc.; ¢Invesco, FactSet Research Systems Inc.; ¿Lipper Inc. | |
Market conditions and your Fund
Among the four strategic asset classes in which the Fund invests – preferred stocks, high yield bonds, emerging market debt securities and US government obligations (including US Treasury obligations issued by the US government under the Separate Trading of Registered Interest and Principal Securities (STRIPS) program) – preferred stocks and US Treasury STRIPS contributed the most to Fund performance during the reporting period. Emerging market debt securities and high yield bonds detracted from Fund performance during the reporting period primarily due to increased market volatility and investor preferences for lower-risk securities. Tactical positioning was a contributor to overall Fund performance and was consistent with an intentionally small allocation versus the strategic allocation.
Tactical adjustments to the Fund’s portfolio are made on a monthly basis to try to take advantage of short-term market dynamics.
At the start of the fiscal year, US Treasuries were the primary contributor to Fund performance as increasing market volatility drove demand for safe-haven assets.1 The plunge in energy prices during the quarter was the key contributor to this demand, as a late-November decision by OPEC to maintain production levels caused the decline in oil prices to accelerate. Uncertainty over the effect falling oil prices would have on global growth increased demand for safe-haven assets, such as US Treasuries, but weighed heavily on emerging market debt and high yield bonds. Preferred stocks continued to contribute to Fund performance as the US Federal Reserve (the Fed) maintained a
more “patient” view toward raising interest rates, which favored the asset class.
In the first quarter of 2015, preferred stocks were the leading contributor to Fund performance as their hybrid stock/bond characteristic benefited from good performance across financial assets during the quarter. US Treasuries benefited from large gains in January as a result of weak economic data, fears of a Greek exit from the eurozone and the Swiss breaking their euro peg. Both high yield and emerging market debt were supported by falling government bond yields, relative stability in oil prices and a more cautious tone from the Fed on interest rate increases. The Fund’s high yield investments benefited from increased exposure to energy, which experienced steep declines in 2014 due to falling oil prices and investors’ fear of defaults.
US Treasuries were the big loser for the second quarter of 2015 as a rise in European inflation and central bank jawboning about the imminent increase in interest rates caused a spike in yields off of historically low levels. Increased demand for safe-haven assets in response to the renewed Greek financial crisis and the collapse in Chinese equity prices helped to soften the sting of higher yields but could not reverse the damage done. The combination of higher yields, renewed concerns over Greece and the drop in the Chinese stock market were too much to bear for emerging market bonds and preferred stocks. High yield debt securities also suffered late in the second quarter of 2015 but were able to finish the reporting period with a modest gain.
Demand for safe-haven assets increased in the third quarter of 2015 due to renewed concerns over the Greek
| | | | | | |
| Portfolio Composition | |
By security type | | | % of total net assets | |
| | | | | |
U.S. Dollar-Denominated Bonds
and Notes | | | | 40.2 | % |
| Preferred Stocks | | | | 20.7 | |
| Common Stocks and Other Equity Interests | | | | 13.0 | |
| U.S. Treasury Securities | | | | 6.3 | |
Non-U.S. Dollar-Denominated
Bonds and Notes | | | | 1.2 | |
Money Market Funds
Plus Other Assets Less Liabilities | | | | 18.6 | |
| | | | |
| Top 10 Debt Issuers* |
| | % of total net assets |
| | | | | | | |
1. | | U.S. Treasury Securities | | | | 6.3 | % |
2. | | MHP S.A. | | | | 0.6 | |
3. | | Argentina Bonar Bonds | | | | 0.6 | |
4. | | Hungary Government International Bond | | | | 0.6 | |
5. | | OCP S.A. | | | | 0.6 | |
6. | | HCA, Inc. | | | | 0.6 | |
7. | | CCO Holdings LLC / CCO Holdings Capital Corp. | | | | 0.5 | |
8. | | Kazakhstan Government International Bond | | | | 0.5 | |
9. | | Reliance Industries Ltd. | | | | 0.5 | |
10. | | Turkcell Iletisim Hizmetleri A.S. | | | | 0.5 | |
| | | | | |
Total Net Assets | | | | $150.1 million | |
| |
| Total Number of Holdings* | | | | 489 | |
The Fund’s holdings are subject to change, and there is no assurance that the Fund will continue to hold any particular security.
*Excluding money market fund holdings.
Data presented here are as of October 31, 2015.
|
| 4 Invesco Premium Income Fund |
financial crisis as well as volatility increases across key equity markets partially in response to weaker economic data from key markets. Looking at performance attribution for the third quarter of 2015, it was apparent that investors were avoiding what they perceived to be risky assets in favor of high-quality securities. Both emerging market debt securities and high yield bonds detracted from Fund performance for most of the third quarter of 2015; preferred stocks and 30-year US Treasury STRIPS also contributed to Fund performance for the third quarter of 2015 but experienced a marginally negative month in August as a result of converging correlations between the two asset classes.
The fiscal year ended with positive performance in all four strategic asset classes in which the Fund invests for the month of October. Emerging market debt was the top contributor to Fund performance as investors returned to what they perceived to be risky assets. High yield bonds, preferred stocks and US Treasury STRIPS, all implemented through individual securities, also posted gains at the end of the reporting period.
Please note that our strategy utilizes derivative instruments that include futures and total return swaps. Therefore, some of the performance of the strategy, both positive and negative, can be attributed to these instruments. Derivatives can be a cost-effective way to gain exposure to asset classes. However, derivatives may amplify traditional investment risks through the creation of leverage and may be less liquid than traditional securities.
Thank you for your continued commitment to Invesco Premium Income Fund.
| 1 | So-called “safe-haven” assets do not imply risk-free investing. |
The views and opinions expressed in management’s discussion of Fund performance are those of Invesco Advisers, Inc. These views and opinions are subject to change at any time based on factors such as market and economic conditions. These views and opinions may not be relied upon as investment advice or recommendations, or as an offer for a particular security. The information is not a complete analysis of every aspect of any market, country, industry, security or the Fund. Statements of fact are from sources considered reliable, but Invesco Advisers, Inc. makes no representation or warranty as to their completeness or accuracy. Although historical performance is no guarantee of future results, these insights may help you understand our investment management philosophy.
See important Fund and, if applicable, index disclosures later in this report.
| | |
 | | Scott Wolle Chartered Financial Analyst, Portfolio Manager, is lead manager of Invesco Premium Income Fund. He joined |
| Invesco in 1999. Mr. Wolle earned a BS in finance from Virginia Polytechnic Institute and State University and an MBA from Duke University Fuqua School of Business. |
| | |
 | | Mark Ahnrud Chartered Financial Analyst, Portfolio Manager, is manager of Invesco Premium Income Fund. He joined Invesco in |
| 2000. Mr. Ahnrud earned a BS in finance and investments from Babson College and an MBA from Duke University Fuqua School of Business. |
| | |
 | | Chris Devine Chartered Financial Analyst, Portfolio Manager, is manager of Invesco Premium Income Fund. He joined Invesco in |
| 1998. Mr. Devine earned a BA in economics from Wake Forest University and an MBA from the University of Georgia. |
| | |
 | | Scott Hixon Chartered Financial Analyst, Portfolio Manager, is manager of Invesco Premium Income Fund. He joined Invesco in |
| 1994. Mr. Hixon earned a BBA in finance from Georgia Southern University and an MBA in finance from Georgia State University. |
| | |
 | | Peter Hubbard Portfolio Manager, is manager of Invesco Premium Income Fund. He joined Invesco in 2005. Mr. Hubbard earned a |
| BA in business and economics from Wheaton College. |
| | |
 | | Darren Hughes Chartered Financial Analyst, Portfolio Manager, is manager of Invesco Premium Income Fund. He joined Invesco |
| in 1992. Mr. Hughes earned a BBA in finance and economics from Baylor University. |
| | |
 | | Jeff Kernagis Chartered Financial Analyst, Portfolio Manager, is manager of Invesco Premium Income Fund. He joined Invesco in |
| 2007. Mr. Kernagis earned a BBA from the University of Notre Dame and an MBA from DePaul University. |
| | |
 | | Richard Ose Portfolio Manager, is manager of Invesco Premium Income Fund. He joined Invesco and/or its affiliates in 2011. |
| Mr. Ose earned a BS with concentrations in finance and economics from Carroll University and an MBA with a concentration in finance from DePaul University. |
| | |
 | | Joseph Portera Portfolio Manager, is manager of Invesco Premium Income Fund. He joined Invesco in 2012. Mr. Portera earned |
| BA and MA degrees in Soviet studies and an MA in international political economy and development from Fordham University. |
| | |
 | | Rashique Rahman Portfolio Manager, is manager of Invesco Premium Income Fund. Mr. Rahman is the Head of Emerging Markets for Invesco |
| Fixed Income. He joined Invesco in 2014. Mr. Rahman earned a BA in economics and political science from the University of California, Los Angeles, and an MA in international affairs, as well as an MBA, from Columbia University. |
| | |
 | | Scott Roberts Chartered Financial Analyst, Portfolio Manager, is manager of Invesco Premium Income Fund. He joined Invesco in |
| 2000. Mr. Roberts earned a BBA in finance from the University of Houston. |
| | |
 | | Christian Ulrich Chartered Financial Analyst, Portfolio Manager, is manager of Invesco Premium Income Fund. He joined Invesco in |
| 2000. Mr. Ulrich earned the equivalent of a BBA from the KV Zurich Business School in Zurich, Switzerland. |
|
| 5 Invesco Premium Income Fund |
Your Fund’s Long-Term Performance
Results of a $10,000 Investment – Oldest Share Class(es) since Inception
Fund and index data from 12/14/11
Past performance cannot guarantee comparable future results.
The data shown in the chart include reinvested distributions, applicable sales charges and Fund expenses including management fees. Index results include reinvested dividends, but they do not reflect sales charges. Performance of the peer group, if applicable, reflects fund expenses and management fees; performance of a market index does not. Performance shown in the chart and table(s) does not reflect deduction of taxes a shareholder would pay on Fund distributions or sale of Fund shares.
|
| 6 Invesco Premium Income Fund |
| | | | | |
| Average Annual Total Returns As of 10/31/15, including maximum applicable sales charges |
|
| |
| Class A Shares | | | | | |
| Inception (12/14/11) | | | | 4.14 | % |
| 1 Year | | | | -3.55 | |
| |
| Class C Shares | | | | | |
| Inception (12/14/11) | | | | 4.87 | % |
| 1 Year | | | | 0.28 | |
| |
| Class R Shares | | | | | |
| Inception (12/14/11) | | | | 5.38 | % |
| 1 Year | | | | 1.77 | |
| |
| Class Y Shares | | | | | |
| Inception (12/14/11) | | | | 5.92 | % |
| 1 Year | | | | 2.28 | |
| |
| Class R5 Shares | | | | | |
| Inception (12/14/11) | | | | 5.92 | % |
| 1 Year | | | | 2.28 | |
| |
| Class R6 Shares | | | | | |
| Inception | | | | 5.87 | % |
| 1 Year | | | | 2.28 | |
Class R6 shares incepted on September 24, 2012. Performance shown prior to that date is that of Class A shares and includes the 12b-1 fees applicable to Class A shares.
The performance data quoted represent past performance and cannot guarantee comparable future results; current performance may be lower or higher. Please visit invesco.com/performance for the most recent month-end performance. Performance figures reflect reinvested distributions, changes in net asset value and the effect of the maximum sales charge unless otherwise stated. Investment return and principal value will fluctuate so that you may have a gain or loss when you sell shares.
The net annual Fund operating expense ratio set forth in the most recent Fund prospectus as of the date of this report for Class A, Class C, Class R, Class Y, Class R5 and Class R6 shares was 1.05%, 1.80%, 1.30%, 0.80%, 0.80% and 0.80%, respectively.1,2 The total annual Fund operating expense ratio set forth in the most recent Fund prospectus as of the date of this report for Class A, Class C, Class R, Class Y, Class R5 and Class R6 shares was 1.29%, 2.04%, 1.54%, 1.04%, 0.91% and 0.91%, respectively. The expense ratios presented above may vary from the expense ratios presented in other sections of
| | | | | |
| Average Annual Total Returns As of 9/30/15, the most recent calendar quarter
end, including maximum applicable sales charges |
| |
| Class A Shares | | | | | |
| Inception (12/14/11) | | | | 3.44 | % |
| 1 Year | | | | -5.07 | |
| |
| Class C Shares | | | | | |
| Inception (12/14/11) | | | | 4.23 | % |
| 1 Year | | | | -1.13 | |
| |
| Class R Shares | | | | | |
| Inception (12/14/11) | | | | 4.73 | % |
| 1 Year | | | | 0.33 | |
| |
| Class Y Shares | | | | | |
| Inception (12/14/11) | | | | 5.27 | % |
| 1 Year | | | | 0.84 | |
| |
| Class R5 Shares | | | | | |
| Inception (12/14/11) | | | | 5.27 | % |
| 1 Year | | | | 0.84 | |
| |
| Class R6 Shares | | | | | |
| Inception | | | | 5.22 | % |
| 1 Year | | | | 0.84 | |
this report that are based on expenses incurred during the period covered by this report.
Class A share performance reflects the maximum 5.50% sales charge, and Class C share performance reflects the applicable contingent deferred sales charge (CDSC) for the period involved. The CDSC on Class C shares is 1% for the first year after purchase. Class R, Class Y, Class R5 and Class R6 shares do not have a front-end sales charge or a CDSC; therefore, performance is at net asset value.
The performance of the Fund’s share classes will differ primarily due to different sales charge structures and class expenses.
Fund performance reflects any applicable fee waivers and/or expense reimbursements. Had the adviser not waived fees and/or reimbursed expenses currently or in the past, returns would have been lower. See current prospectus for more information.
| 1 | Total annual Fund operating expenses after any contractual fee waivers and/or expense reimbursements by the adviser in effect through at least February 28, 2017. See current prospectus for more information. |
| 2 | Total annual Fund operating expenses after any contractual fee waivers and/or expense reimbursements by the adviser in effect through at least June 30, 2017. See current prospectus for more information. |
|
| 7 Invesco Premium Income Fund |
Invesco Premium Income Fund’s investment objective is to provide current income.
| n | | Unless otherwise stated, information presented in this report is as of October 31, 2015, and is based on total net assets. |
| n | | Unless otherwise noted, all data provided by Invesco. |
| n | | To access your Fund’s reports/prospectus, visit invesco.com/fundreports. |
About share classes
| n | | Class R shares are generally available only to employer sponsored retirement and benefit plans. Please see the prospectus for more information. |
| n | | Class Y shares are available only to certain investors. Please see the prospectus for more information. |
| n | | Class R5 shares and Class R6 shares are primarily intended for employer sponsored retirement and benefit plans that meet certain standards and for institutional investors. Please see the prospectus for more information. |
Principal risks of investing in the Fund
| n | | Active trading risk. The Fund engages in frequent trading of portfolio securities. Active trading results in added expenses and may result in a lower return and increased tax liability. |
| n | | Call risk. If interest rates fall, it is possible that issuers of debt securities with high interest rates will prepay or call their securities before their maturity dates. In this event, the proceeds from the called securities would likely be reinvested by the Fund in securities bearing the new, lower interest rates, resulting in a possible decline in the Fund’s income and distributions to shareholders. |
| n | | Changing fixed income market conditions risk. The current low interest rate environment was created in part by the Federal Reserve Board (FRB) and certain foreign central banks keeping the federal funds and equivalent foreign rates at or near zero. There is a risk that interest rates will rise when the FRB and central banks raise these rates. This risk is heightened due to the FRB’s quantitative easing program and the “tapering” of other similar foreign central bank actions. This eventual increase in the federal funds and equivalent foreign rates may expose fixed income markets to heightened volatility and reduced liquidity for certain fixed income investments, particularly those with longer maturities. In addition, decreases in fixed |
| | | income dealer market making capacity may also potentially lead to heightened volatility and reduced liquidity in the fixed income markets. As a result, the value of the Fund’s investments and share price may decline. Changes in central bank policies could also result in higher than normal shareholder redemptions, which could potentially increase portfolio turnover and the Fund’s transaction costs. |
| n | | Credit linked notes risk. Risks of credit linked notes include those risks associated with the underlying reference obligation including but not limited to market risk, interest rate risk, credit risk, default risk and foreign currency risk. In the case of a credit linked note created with credit default swaps, the structure will be “funded” such that the par amount of the security will represent the maximum loss that could be incurred on the investment and no leverage is introduced. An investor in a credit linked note bears counterparty risk or the risk that the issuer of the credit linked note will default or become bankrupt and not make timely payment of principal and interest of the structured security. |
| n | | Credit risk. The issuer of instruments in which the Fund invests may be unable to meet interest and/or principal payments, thereby causing its instruments to decrease in value and lowering the issuer’s credit rating. |
| n | | Currency/exchange rate risk. The dollar value of the Fund’s foreign investments will be affected by changes in the exchange rates between the dollar and the currencies in which those investments are traded. |
| n | | Derivatives risk. The value of a derivative instrument depends largely on (and is derived from) the value of an underlying security, currency, commodity, interest rate, index or other asset (each referred to as an underlying asset). In addition to risks relating to the underlying assets, the use of derivatives may include other, possibly greater, risks, including counterparty, leverage and liquidity risks. Counterparty risk is the risk that the counterparty to |
| | | the derivative contract will default on its obligation to pay the Fund the amount owed or otherwise perform under the derivative contract. Derivatives create leverage risk because they do not require payment up front equal to the economic exposure created by owning the derivative. As a result, an adverse change in the value of the underlying asset could result in the Fund sustaining a loss that is substantially greater than the amount invested in the derivative, which may make the Fund’s returns more volatile and increase the risk of loss. Derivative instruments may also be less liquid than more traditional investments and the Fund may be unable to sell or close out its derivative positions at a desirable time or price. This risk may be more acute under adverse market conditions, during which the Fund may be most in need of liquidating its derivative positions. Derivatives may also be harder to value, less tax efficient and subject to changing government regulation that could impact the Fund’s ability to use certain derivatives or their cost. Also, derivatives used for hedging or to gain or limit exposure to a particular market segment may not provide the expected benefits, particularly during adverse market conditions. |
| n | | Developing/emerging markets securities risk. The prices of securities issued by foreign companies and governments located in developing/emerging markets countries may be affected more negatively by inflation, devaluation of their currencies, higher transaction costs, delays in settlement, adverse political developments, the introduction of capital controls, withholding taxes, nationalization of private assets, expropriation, social unrest, war or lack of timely information than those in developed countries. |
| n | | Energy sector risk. Certain of the businesses in which the Fund invests may be adversely affected by foreign, federal or state regulations governing energy production, distribution and sale as well as supply-and-demand for energy resources. Although individual security |
|
This report must be accompanied or preceded by a currently effective Fund prospectus, which contains more complete information, including sales charges and expenses. Investors should read it carefully before investing. |
|
NOT FDIC INSURED | MAY LOSE VALUE | NO BANK GUARANTEE |
|
| 8 Invesco Premium Income Fund |
selection drives the performance of the Fund, short-term fluctuations in energy prices may cause price fluctuations in its shares.
| n | | Exchange-traded funds risk. An investment by the Fund in exchange-traded funds generally presents the same primary risks as an investment in a mutual fund. In addition, an exchange-traded fund may be subject to the following: (1) a discount of the exchange-traded fund’s shares to its net asset value; (2) failure to develop an active trading market for the exchange-traded fund’s shares; (3) the listing exchange halting trading of the exchange-traded fund’s shares; (4) failure of the exchange-traded fund’s shares to track the referenced asset; and (5) holding troubled securities in the referenced index or basket of investments. Investments in exchange-traded funds may involve duplication of management fees and certain other expenses, as the Fund indirectly bears its proportionate share of any expenses paid by the exchange- traded funds in which it invests. Further, certain of the exchange-traded funds in which the Fund may invest are leveraged. The more the Fund invests in such leveraged exchange-traded funds, the more this leverage will magnify any losses on those investments. |
| n | | Financial institutions risk. Investments in financial institutions may be subject to certain risks, including, but not limited to, the risk of regulatory actions, changes in interest rates and concentration of loan portfolios in an industry or sector. Financial institutions are highly regulated and may suffer set-backs should regulatory rules and interpretations under which they operate change. Likewise, there is a high level of competition among financial institutions which could adversely affect the viability of an institution. |
| n | | Floating rate risk. The Fund may invest in floating rate loans and debt securities that require collateral. There is a risk that the value of the collateral may not be sufficient to cover the amount owed, collateral securing a loan may be found invalid, and collateral may be used to pay other outstanding obligations of the borrower under applicable law or may be difficult to sell. There is also the risk that the collateral may be |
| | difficult to liquidate, or that a majority of the collateral may be illiquid. |
| n | | Foreign currency tax risk. If the US Treasury Department were to exercise its authority to issue regulations that exclude from the definition of “qualifying income” foreign currency gains not directly related to the Fund’s business of investing in securities (which it has not done since such authority was granted to it in 1986, but has the right to do at any time), the Fund may be unable to qualify as a regulated investment company for one or more years. In this event, the Fund’s Board of Trustees may authorize a significant change in investment strategy or other action. |
| n | | Foreign securities risk. The Fund’s foreign investments may be affected by changes in a foreign country’s exchange rates, political and social instability, changes in economic or taxation policies, difficulties when enforcing obligations, decreased liquidity, and increased volatility. Foreign companies may be subject to less regulation resulting in less publicly available information about the companies. |
| n | | High yield bond (junk bond) risk. Junk bonds involve a greater risk of default or price changes due to changes in the credit quality of the issuer. The values of junk bonds fluctuate more than those of high- quality bonds in response to company, political, regulatory or economic developments. Values of junk bonds can decline significantly over short periods of time. |
| n | | Interest rate risk. Interest rate risk refers to the risk that bond prices generally fall as interest rates rise; conversely, bond prices generally rise as interest rates fall. Specific bonds differ in their sensitivity to changes in interest rates depending on their individual characteristics, including duration. |
| n | | Liquidity risk. The Fund may hold illiquid securities that it is unable to sell at the preferred time or price and could lose its entire investment in such securities. |
| n | | MLP (master limited partnership) risk. An MLP is a public limited partnership or limited liability company. Although the characteristics of MLPs closely resemble a traditional limited partnership, a major difference is that MLPs may trade on a public exchange or in |
| | the over-the-counter market. The ability to trade on a public exchange or in the over-the-counter market provides a certain amount of liquidity not found in many limited partnership investments. However, MLP interests may be less liquid and subject to more abrupt or erratic price movements than conventional publicly traded securities. The risks of investing in an MLP are similar to those of investing in a partnership and include more flexible governance structures, which could result in less protection for investors than investments in a corporation. Investors in an MLP would normally not be liable for the debts of the MLP beyond the amount that the investor has contributed but investors may not be shielded to the same extent that a shareholder of a corporation would be. MLPs are generally considered interest-rate sensitive investments. During periods of interest rate volatility, these investments may not provide attractive returns. |
| n | | MLP tax risk. MLPs taxed as partnerships do not pay US federal income tax at the partnership level. Rather, each partner is allocated a share of the partnership’s income, gains, losses, deductions and expenses. A change in current tax law, or a change in the underlying business mix of a given MLP, could result in an MLP being treated as a corporation for US federal income tax purposes, which would result in such MLP being required to pay US federal income tax on its taxable income. The classification of an MLP as a corporation for US federal income tax purposes would have the effect of reducing the amount of cash available for distribution by the MLP. Thus, if any of the MLPs owned by the Fund were treated as a corporation for US federal income tax purposes, it could result in a reduction of the value of the Fund’s investment, and consequently your investment in the Fund and lower income. MLPs taxed as partnerships file a partnership tax return for US federal, state and local income tax purposes and communicate to each investor in such MLP the investor’s allocable share of the MLP’s income, gains, losses, deductions and expenses via a “Schedule K-1.” Each year, the Fund will send you an annual tax statement (Form 1099) |
continued on page 10
9 Invesco Premium Income Fund
continued from page 9
| | to assist you in completing your federal, state and local tax returns. An MLP might need to amend its partnership tax return and, in turn, send amended Schedules K-1 to investors in the MLP, such as the Fund. When necessary, the Fund will send you a corrected Form 1099 to reflect Schedule K-1 information reclassified by an MLP, which could, in turn, require you to amend your federal, state or local tax returns. |
| n | | Management risk. The investment techniques and risk analysis used by the Fund’s portfolio managers may not produce the desired results. Because the Fund’s investment process relies heavily on its asset allocation process, market movements that are counter to the portfolio managers’ expectations may have a significant adverse effect on the Fund’s net asset value. |
| n | | Market risk. The prices of and the income generated by the Fund’s securities may decline in response to, among other things, investor sentiment, general economic and market conditions, regional or global instability, and currency and interest rate fluctuations. |
| n | | Mortgage- and asset-backed securities risk. The Fund may invest in mortgage- and asset-backed securities that are subject to prepayment or call risk, which is the risk that the borrower’s payments may be received earlier or later than expected due to changes in prepayment rates on underlying loans. Faster prepayments often happen when interest rates are falling. As a result, the Fund may reinvest these early payments at lower interest rates, thereby reducing the Fund’s income. Conversely, when interest rates rise, prepayments may happen more slowly, causing the security to lengthen in duration. Longer duration securities tend to be more volatile. Securities may be prepaid at a price less than the original purchase value. An unexpectedly high rate of defaults on the mortgages held by a mortgage pool may adversely affect the value of mortgage-backed securities and could result in losses to the Fund. The risk of such defaults is generally higher in the case of mortgage pools that include subprime mortgages. Subprime mortgages refer to loans made to borrowers with weakened credit histories or with lower capacity to make timely payments on their mortgages. |
| n | | Non-correlation risk. The return of the Fund’s preferred equity segment may not match the return of the Index for a number of reasons. For example, the Fund incurs operating expenses not applicable to the Index, and incurs costs in buying and selling securities, especially when rebalancing securities holdings to reflect changes in the Index. In addition, the performance of the preferred equity segment and the Index may vary due to asset valuation differences and differences between the preferred equity segment and the Index resulting from legal restrictions, cost or liquidity constraints. |
| n | | Preferred securities risk. Preferred securities may include provisions that permit the issuer, in its discretion, to defer or omit distributions for a certain period of time. If the Fund owns a security that is deferring or omitting its distributions, the Fund may be required to report the distribution on its tax returns, even though it may not have received this income. Further, preferred securities may lose substantial value due to the omission or deferment of dividend payments. |
| n | | Reinvestment risk. Reinvestment risk is the risk that a bond’s cash flows (coupon income and principal repayment) will be reinvested at an interest rate below that on the original bond. |
| n | | REIT (real estate investment trust) risk/real estate risk. Investments in real estate related instruments may be affected by economic, legal, cultural, environmental or technological factors that affect property values, rents or occupancies of real estate related to the Fund’s holdings. Shares of real estate related companies, which tend to be small- and mid-cap companies, may be more volatile and less liquid. |
| n | | Sovereign debt risk. Investments in foreign sovereign debt obligations involve certain risks in addition to those relating to foreign securities or debt securities generally. The issuer of the debt or the governmental authorities that control the repayment of the debt may be unable or unwilling to repay principal or interest when due in accordance with the terms of such debt, and the Fund may have limited recourse in the event of a default against the defaulting government. Without the approval of debt holders, some governmental debtors have in the past been able to reschedule or restructure their debt payments or declare moratoria on payments. |
| n | | US government obligations risk. The Fund may invest in obligations issued by US government agencies and instrumentalities that may receive varying levels of support from the government, which could affect the Fund’s ability to recover should they default. |
About indexes used in this report
| n | | The Barclays U.S. Aggregate Index is an unmanaged index considered representative of the US investment-grade, fixed-rate bond market. |
| n | | The Custom Invesco Premium Income Index, created by Invesco to serve as a benchmark for Invesco Premium Income Fund, comprises the following indexes: S&P 500 (50%) and Barclays U.S. Universal (50%). |
| n | | The Lipper Mixed-Asset Target Allocation Conservative Funds Index is an unmanaged index considered representative of mixed-asset target allocation conservative funds tracked by Lipper. |
| n | | The S&P 500® Index is an unmanaged index considered representative of the US stock market. |
| n | | The Barclays U.S. Universal Index is an unmanaged index comprising US dollar-denominated, taxable bonds that are rated investment grade or below investment grade. |
| n | | The Fund is not managed to track the performance of any particular index, including the index(es) described here, and consequently, the performance of the Fund may deviate significantly from the performance of the index(es). |
| n | | A direct investment cannot be made in an index. Unless otherwise indicated, index results include reinvested dividends, and they do not reflect sales charges. Performance of the peer group, if applicable, reflects fund expenses; performance of a market index does not. |
Other information
| n | | The returns shown in management’s discussion of Fund performance are based on net asset values (NAVs) calculated for shareholder transactions. Generally accepted accounting principles require adjustments to be made to the net assets of the Fund at period end for financial reporting purposes, and as such, the NAVs for shareholder transactions and the returns based on those NAVs may differ from the NAVs and returns reported in the Financial Highlights. |
10 Invesco Premium Income Fund
Schedule of Investments(a)
October 31, 2015
| | | | | | | | |
| | | Principal
Amount | | | Value | |
U.S. Dollar Denominated Bonds and Notes–40.19% | |
| Aerospace & Defense–0.95% | |
Aerojet Rocketdyne Holdings, Inc., Sec. Gtd. Second Lien Global Notes,
7.13%, 03/15/21 | | $ | 165,000 | | | $ | 174,281 | |
Bombardier Inc. (Canada),
Sr. Unsec. Notes,
7.50%, 03/15/25(b) | | | 236,000 | | | | 183,490 | |
7.75%, 03/15/20(b) | | | 136,000 | | | | 119,680 | |
DigitalGlobe Inc., Sr. Unsec. Gtd. Notes,
5.25%, 02/01/21(b) | | | 85,000 | | | | 76,713 | |
KLX Inc., Sr. Unsec. Gtd. Notes,
5.88%, 12/01/22(b) | | | 150,000 | | | | 153,563 | |
Moog Inc., Sr. Unsec. Gtd. Notes,
5.25%, 12/01/22(b) | | | 130,000 | | | | 133,250 | |
Orbital ATK Inc., Sr. Unsec. Gtd. Notes,
5.50%, 10/01/23(b) | | | 135,000 | | | | 141,581 | |
TransDigm Inc., Sr. Unsec. Gtd. Sub. Notes, 6.50%, 05/15/25(b) | | | 433,000 | | | | 442,742 | |
| | | | | | | | 1,425,300 | |
|
| Agricultural & Farm Machinery–0.09% | |
Titan International Inc., Sr. Sec. Gtd. First Lien Global Notes, 6.88%, 10/01/20 | | | 159,000 | | | | 136,939 | |
|
| Airlines–0.19% | |
Air Canada (Canada), Sr. Unsec. Gtd. Notes, 7.75%, 04/15/21(b) | | | 270,000 | | | | 282,150 | |
|
| Alternative Carriers–0.57% | |
EarthLink Holdings Corp., Sr. Sec. Gtd. First Lien Global Notes,
7.38%, 06/01/20 | | | 255,000 | | | | 265,200 | |
Level 3 Communications, Inc., Sr. Unsec. Global Notes, 5.75%, 12/01/22 | | | 510,000 | | | | 526,575 | |
Level 3 Financing, Inc., Sr. Unsec. Gtd. Notes, 5.13%, 05/01/23(b) | | | 60,000 | | | | 60,900 | |
| | | | | | | | 852,675 | |
|
| Apparel Retail–0.16% | |
Hot Topic, Inc., Sr. Sec. Gtd. First Lien Notes, 9.25%, 06/15/21(b) | | | 253,000 | | | | 244,778 | |
|
| Apparel, Accessories & Luxury Goods–0.04% | |
William Carter Co. (The), Sr. Unsec. Gtd. Global Notes, 5.25%, 08/15/21 | | | 59,000 | | | | 61,508 | |
|
| Application Software–0.05% | |
SS&C Technologies Holdings, Inc., Sr. Unsec. Gtd. Notes,
5.88%, 07/15/23(b) | | | 77,000 | | | | 81,235 | |
|
| Asset Management & Custody Banks–0.11% | |
DJO Finco Inc./DJO Finance LLC/Corp., Sec. Second Lien Notes,
8.13%, 06/15/21(b) | | | 160,000 | | | | 160,000 | |
| | | | | | | | |
| | | Principal
Amount | | | Value | |
| Auto Parts & Equipment–0.31% | |
CTP Transportation Products LLC/CTP Finance Inc., Sr. Sec. Notes,
8.25%, 12/15/19(b) | | $ | 224,000 | | | $ | 239,680 | |
Dana Holding Corp., Sr. Unsec. Notes, | | | | | | | | |
5.38%, 09/15/21 | | | 67,000 | | | | 68,843 | |
5.50%, 12/15/24 | | | 104,000 | | | | 104,260 | |
Tenneco Inc., Sr. Unsec. Gtd. Global Notes, 5.38%, 12/15/24 | | | 46,000 | | | | 47,610 | |
| | | | | | | | 460,393 | |
|
| Automotive Retail–0.05% | |
CST Brands, Inc., Sr. Unsec. Gtd. Global Notes, 5.00%, 05/01/23 | | | 67,000 | | | | 68,256 | |
|
| Broadcasting–0.46% | |
iHeartCommunications, Inc., Sr. Sec. Gtd. First Lien Global Notes,
10.63%, 03/15/23 | | | 160,000 | | | | 135,200 | |
Netflix, Inc., Sr. Unsec. Global Notes,
5.75%, 03/01/24 | | | 188,000 | | | | 198,810 | |
Sinclair Television Group Inc., Sr. Unsec. Gtd. Notes, 5.63%, 08/01/24(b) | | | 180,000 | | | | 177,075 | |
TEGNA, Inc., Sr. Unsec. Gtd. Global Notes,
6.38%, 10/15/23 | | | 169,000 | | | | 183,365 | |
| | | | | | | | 694,450 | |
|
| Building Products–1.52% | |
Allegion PLC, Sr. Unsec. Gtd. Notes,
5.88%, 09/15/23 | | | 172,000 | | | | 179,740 | |
Builders FirstSource, Inc.,
Sr. Sec. First Lien Notes, | | | | | | | | |
7.63%, 06/01/21(b) | | | 425,000 | | | | 453,156 | |
Sr. Unsec. Gtd. Notes,
10.75%, 08/15/23(b) | | | 141,000 | | | | 146,288 | |
Building Materials Corp. of America, Sr. Unsec. Notes, | | | | | | | | |
5.38%, 11/15/24(b) | | | 246,000 | | | | 254,610 | |
6.00%, 10/15/25(b) | | | 109,000 | | | | 116,630 | |
Building Materials Holding Corp., Sr. Sec. Notes, 9.00%, 09/15/18(b) | | | 400,000 | | | | 424,000 | |
Gibraltar Industries Inc., Sr. Unsec. Gtd. Sub. Global Notes, 6.25%, 02/01/21 | | | 310,000 | | | | 320,850 | |
Hardwoods Acquisition, Inc., Sr. Sec. Gtd. First Lien Notes, 7.50%, 08/01/21(b) | | | 45,000 | | | | 41,850 | |
NCI Building Systems, Inc., Sr. Unsec. Gtd. Notes, 8.25%, 01/15/23(b) | | | 30,000 | | | | 31,950 | |
Norbord Inc. (Canada),
Sr. Sec. First Lien Notes,
5.38%, 12/01/20(b) | | | 103,000 | | | | 105,482 | |
Sr. Sec. Gtd. First Lien Notes,
6.25%, 04/15/23(b) | | | 205,000 | | | | 206,753 | |
| | | | | | | | 2,281,309 | |
See accompanying Notes to Financial Statements which are an integral part of the financial statements.
11 Invesco Premium Income Fund
| | | | | | | | |
| | | Principal
Amount | | | Value | |
| Cable & Satellite–1.84% | |
Altice Luxembourg S.A. (Luxembourg), Sr. Unsec. Gtd. Notes, | | | | | | | | |
7.75%, 05/15/22(b) | | $ | 350,000 | | | $ | 338,187 | |
REGS, Sr. Unsec. Gtd. Euro Notes, | | | | | | | | |
7.75%, 05/15/22(b) | | | 200,000 | | | | 193,000 | |
CCO Holdings LLC/CCO Holdings Capital Corp.,
Sr. Unsec. Gtd. Global Notes, 5.25%, 09/30/22 | | | 50,000 | | | | 50,875 | |
Sr. Unsec. Gtd. Notes,
5.13%, 05/01/23(b) | | | 549,000 | | | | 551,745 | |
5.38%, 05/01/25(b) | | | 215,000 | | | | 213,925 | |
DISH DBS Corp., Sr. Unsec. Gtd. Global Notes, 5.88%, 11/15/24 | | | 332,000 | | | | 318,720 | |
Intelsat Jackson Holdings S.A. (Luxembourg), Sr. Unsec. Gtd. Global Bonds, | | | | | | | | |
5.50%, 08/01/23 | | | 255,000 | | | | 213,563 | |
6.63%, 12/15/22 | | | 99,000 | | | | 78,705 | |
Numericable-SFR S.A. (France), Sr. Sec. Gtd. First Lien Bonds,
6.00%, 05/15/22(b) | | | 400,000 | | | | 402,000 | |
Unitymedia Hessen GmbH & Co. KG/Unitymedia NRW GmbH (Germany), REGS, Sr. Sec. Gtd. First Lien Euro Bonds, 5.00%, 01/15/25(b) | | | 200,000 | | | | 199,750 | |
VTR Finance B.V. (Chile), Sr. Sec. First Lien Notes, 6.88%, 01/15/24(b) | | | 200,000 | | | | 194,000 | |
| | | | | | | | 2,754,470 | |
|
| Casinos & Gaming–0.44% | |
Boyd Gaming Corp., Sr. Unsec. Gtd. Global Notes, 6.88%, 05/15/23 | | | 358,000 | | | | 383,060 | |
MGM Resorts International,
Sr. Unsec. Gtd. Global Notes,
6.63%, 12/15/21 | | | 45,000 | | | | 48,150 | |
Sr. Unsec. Gtd. Notes, 6.00%, 03/15/23 | | | 115,000 | | | | 117,587 | |
7.75%, 03/15/22 | | | 53,000 | | | | 58,962 | |
Mohegan Tribal Gaming Authority, Sr. Unsec. Gtd. Notes,
9.75%, 09/01/21(b) | | | 43,000 | | | | 44,613 | |
| | | | | | | | 652,372 | |
|
| Commercial Printing–0.25% | |
Multi-Color Corp., Sr. Unsec. Gtd. Notes,
6.13%, 12/01/22(b) | | | 364,000 | | | | 375,375 | |
|
| Communications Equipment–0.10% | |
Hughes Satellite Systems Corp., Sr. Unsec. Gtd. Global Notes, 7.63%, 06/15/21 | | | 142,000 | | | | 155,845 | |
|
| Computer & Electronics Retail–0.15% | |
Rent-A-Center, Inc., Sr. Unsec. Gtd. Global Notes, 4.75%, 05/01/21 | | | 271,000 | | | | 225,608 | |
|
| Construction & Engineering–0.41% | |
AECOM, Sr. Unsec. Gtd. Notes,
5.75%, 10/15/22(b) | | | 359,000 | | | | 373,653 | |
| | | | | | | | |
| | | Principal
Amount | | | Value | |
| Construction & Engineering–(continued) | |
Odebrecht Finance Ltd. (Brazil), REGS, Sr. Unsec. Gtd. Euro Notes,
5.25%, 06/27/29(b) | | $ | 400,000 | | | $ | 234,500 | |
| | | | | | | | 608,153 | |
|
| Construction Machinery & Heavy Trucks–0.92% | |
Allied Specialty Vehicles, Inc., Sr. Sec. Notes, 8.50%, 11/01/19(b) | | | 392,000 | | | | 410,620 | |
Commercial Vehicle Group Inc., Sec. Gtd. Second Lien Global Notes,
7.88%, 04/15/19 | | | 230,000 | | | | 234,600 | |
Meritor Inc., Sr. Unsec. Gtd. Notes, | | | | | | | | |
6.25%, 02/15/24 | | | 13,000 | | | | 12,545 | |
6.75%, 06/15/21 | | | 110,000 | | | | 109,175 | |
Navistar International Corp.,
Sr. Unsec. Gtd. Notes, | | | | | | | | |
8.25%, 11/01/21 | | | 149,000 | | | | 116,965 | |
Sr. Unsec. Sub. Conv. Bonds,
4.75%, 04/15/19 | | | 95,000 | | | | 66,500 | |
Oshkosh Corp., Sr. Unsec. Gtd. Global Notes,
5.38%, 03/01/22 | | | 239,000 | | | | 244,975 | |
5.38%, 03/01/25 | | | 180,000 | | | | 182,700 | |
| | | | | | | | 1,378,080 | |
|
| Construction Materials–0.46% | |
Cemex S.A.B. de C.V. (Mexico), REGS, Sr. Sec. Gtd. First Lien Euro Notes,
5.70%, 01/11/25(b) | | | 490,000 | | | | 454,475 | |
CPG Merger Sub LLC, Sr. Unsec. Gtd. Notes,
8.00%, 10/01/21(b) | | | 31,000 | | | | 31,465 | |
Unifrax I LLC/Unifrax Holding Co., Sr. Unsec. Gtd. Notes,
7.50%, 02/15/19(b) | | | 217,000 | | | | 210,490 | |
| | | | | | | | 696,430 | |
|
| Consumer Finance–0.26% | |
Ally Financial Inc., Sr. Unsec. Global Notes, 5.13%, 09/30/24 | | | 286,000 | | | | 303,518 | |
Credit Acceptance Corp., Sr. Unsec. Gtd. Notes, 7.38%, 03/15/23(b) | | | 78,000 | | | | 81,315 | |
| | | | | | | | 384,833 | |
|
| Distillers & Vintners–0.04% | |
Constellation Brands Inc., Sr. Unsec. Gtd. Notes, 4.75%, 11/15/24 | | | 55,000 | | | | 57,750 | |
|
| Diversified Banks–0.94% | |
Banco Santander Mexico S.A. Institucion de Banca Multiple Grupo Financiero Santander (Mexico), Unsec. Sub. Notes,
5.95%, 01/30/24(b) | | | 300,000 | | | | 310,687 | |
BBVA Bancomer S.A. (Mexico), Unsec. Sub. Notes, 6.75%, 09/30/22(b) | | | 150,000 | | | | 168,598 | |
Emirates NBD Tier 1 Ltd. (United Arab Emirates), Jr. Unsec. Gtd. Sub. Euro Bonds, 5.75%(c) | | | 500,000 | | | | 503,125 | |
Global Bank Corp. (Panama), Sr. Unsec. Notes, 5.13%, 10/30/19(b) | | | 200,000 | | | | 203,375 | |
See accompanying Notes to Financial Statements which are an integral part of the financial statements.
12 Invesco Premium Income Fund
| | | | | | | | |
| | | Principal
Amount | | | Value | |
| Diversified Banks–(continued) | |
Industrial & Commercial Bank of China Ltd. (China), Unsec. Sub. Notes,
4.88%, 09/21/25(b) | | $ | 220,000 | | | $ | 223,340 | |
| | | | | | | | 1,409,125 | |
|
| Diversified Chemicals–0.65% | |
Chemours Co. (The), Sr. Unsec. Notes, 6.63%, 05/15/23(b) | | | 105,000 | | | | 79,275 | |
OCP S.A. (Morocco),
Sr. Unsec. Notes, | | | | | | | | |
4.50%, 10/22/25(b) | | | 476,000 | | | | 460,530 | |
REGS, Sr. Unsec. Euro Notes, | | | | | | | | |
4.50%, 10/22/25(b) | | | 450,000 | | | | 432,721 | |
| | | | | | | | 972,526 | |
|
| Diversified Metals & Mining–0.44% | |
Compass Minerals International, Inc., Sr. Unsec. Gtd. Notes,
4.88%, 07/15/24(b) | | | 74,000 | | | | 72,705 | |
HudBay Minerals, Inc. (Canada), Sr. Unsec. Gtd. Global Notes,
9.50%, 10/01/20 | | | 65,000 | | | | 57,363 | |
Lundin Mining Corp. (Canada), Sr. Sec. Gtd. First Lien Notes,
7.88%, 11/01/22(b) | | | 150,000 | | | | 150,375 | |
MMC Norilsk Nickel OJSC via MMC Finance Ltd. (Russia), Sr. Unsec. Notes,
6.63%, 10/14/22(b) | | | 369,000 | | | | 379,723 | |
| | | | | | | | 660,166 | |
|
| Electric Utilities–0.60% | |
Hrvatska elektroprivreda d.d. (Croatia), Sr. Unsec. Notes, 5.88%, 10/23/22(b) | | | 385,000 | | | | 390,190 | |
Majapahit Holding B.V. (Indonesia), Sr. Unsec. Gtd. Notes,
7.75%, 01/20/20(b) | | | 100,000 | | | | 113,301 | |
PT Perusahaan Listrik Negara (Indonesia), REGS, Sr. Unsec. Euro Notes,
5.50%, 11/22/21(b) | | | 200,000 | | | | 206,836 | |
Star Energy Geothermal Wayang Windu Ltd. (Indonesia), REGS, Sr. Sec. Gtd. First Lien Euro Notes,
6.13%, 03/27/20(b) | | | 200,000 | | | | 195,500 | |
| | | | | | | | 905,827 | |
|
| Electrical Components & Equipment–0.32% | |
EnerSys, Sr. Unsec. Gtd. Notes,
5.00%, 04/30/23(b) | | | 329,000 | | | | 335,580 | |
Sensata Technologies B.V. (Netherlands), Sr. Unsec. Gtd. Notes, | | | | | | | | |
4.88%, 10/15/23(b) | | | 99,000 | | | | 96,525 | |
5.00%, 10/01/25(b) | | | 44,000 | | | | 42,900 | |
| | | | | | | | 475,005 | |
|
| Environmental & Facilities Services–0.21% | |
ADS Waste Holdings, Inc., Sr. Unsec. Gtd. Global Notes, 8.25%, 10/01/20 | | | 298,000 | | | | 315,135 | |
|
| Fertilizers & Agricultural Chemicals–0.41% | |
Israel Chemicals Ltd. (Israel), Sr. Unsec. Euro Bonds, 4.50%, 12/02/24(b) | | | 600,000 | | | | 611,280 | |
| | | | | | | | |
| | | Principal
Amount | | | Value | |
| Gas Utilities–0.29% | |
Ferrellgas L.P./Ferrellgas Finance Corp., Sr. Unsec. Global Notes,
6.75%, 01/15/22 | | $ | 30,000 | | | $ | 27,900 | |
Suburban Propane Partners, L.P./Suburban Energy Finance Corp., Sr. Unsec. Global Notes, 7.38%, 08/01/21 | | | 44,000 | | | | 46,530 | |
Transportadora de Gas Internacional S.A. E.S.P. (Colombia), REGS, Sr. Unsec. Euro Notes, 5.70%, 03/20/22(b) | | | 350,000 | | | | 361,375 | |
| | | | | | | | 435,805 | |
|
| General Merchandise Stores–0.25% | |
Dollar Tree, Inc., Sr. Unsec. Gtd. Notes,
5.75%, 03/01/23(b) | | | 349,000 | | | | 368,195 | |
|
| Health Care Facilities–1.71% | |
Acadia Healthcare Co., Inc.,
Sr. Unsec. Gtd. Global Notes,
5.63%, 02/15/23 | | | 266,000 | | | | 269,325 | |
Sr. Unsec. Gtd. Notes,
5.63%, 02/15/23(b) | | | 60,000 | | | | 60,750 | |
Amsurg Corp., Sr. Unsec. Gtd. Global Notes, 5.63%, 07/15/22 | | | 290,000 | | | | 286,375 | |
Community Health Systems, Inc., Sr. Unsec. Gtd. Global Notes,
6.88%, 02/01/22 | | | 207,470 | | | | 210,063 | |
HCA, Inc.,
Sr. Sec. Gtd. First Lien Global Notes, | | | | | | | | |
5.88%, 03/15/22 | | | 199,000 | | | | 218,838 | |
Sr. Sec. Gtd. First Lien Notes,
5.25%, 04/15/25 | | | 60,000 | | | | 62,400 | |
Sr. Unsec. Gtd. Global Notes,
7.50%, 02/15/22 | | | 141,000 | | | | 163,208 | |
Sr. Unsec. Gtd. Notes,
5.38%, 02/01/25 | | | 381,000 | | | | 394,811 | |
HealthSouth Corp., Sr. Unsec. Gtd. Notes,
5.75%, 09/15/25(b) | | | 88,000 | | | | 87,780 | |
Surgical Care Affiliates, Inc., Sr. Unsec. Gtd. Notes, 6.00%, 04/01/23(b) | | | 310,000 | | | | 313,875 | |
Tenet Healthcare Corp., Sr. Unsec. Global Notes, | | | | | | | | |
6.75%, 02/01/20 | | | 25,000 | | | | 25,500 | |
6.75%, 06/15/23 | | | 69,000 | | | | 69,259 | |
8.13%, 04/01/22 | | | 378,000 | | | | 402,570 | |
| | | | | | | | 2,564,754 | |
|
| Health Care Services–0.34% | |
DaVita HealthCare Partners Inc., Sr. Unsec. Gtd. Global Notes,
5.00%, 05/01/25 | | | 270,000 | | | | 269,325 | |
MPH Acquisition Holdings LLC, Sr. Unsec. Gtd. Notes, 6.63%, 04/01/22(b) | | | 235,000 | | | | 242,050 | |
| | | | | | | | 511,375 | |
|
| Home Improvement Retail–0.33% | |
Hillman Group Inc. (The), Sr. Unsec. Notes,
6.38%, 07/15/22(b) | | | 525,000 | | | | 492,187 | |
See accompanying Notes to Financial Statements which are an integral part of the financial statements.
13 Invesco Premium Income Fund
| | | | | | | | |
| | | Principal
Amount | | | Value | |
| Homebuilding–1.31% | |
Ashton Woods USA LLC/Ashton Woods Finance Co., Sr. Unsec. Notes,
6.88%, 02/15/21(b) | | $ | 408,000 | | | $ | 380,460 | |
AV Homes, Inc., Sr. Unsec. Gtd. Global Notes, 8.50%, 07/01/19 | | | 60,000 | | | | 60,225 | |
Beazer Homes USA Inc., Sr. Unsec. Gtd. Global Notes, 7.50%, 09/15/21 | | | 394,000 | | | | 387,105 | |
CalAtlantic Group Inc., Sr. Unsec. Gtd. Notes, 5.38%, 10/01/22 | | | 281,000 | | | | 288,727 | |
K. Hovnanian Enterprises Inc.,
Sr. Sec. Gtd. First Lien Notes, | | | | | | | | |
7.25%, 10/15/20(b) | | | 61,000 | | | | 57,493 | |
Sr. Unsec. Gtd. Notes,
7.00%, 01/15/19(b) | | | 109,000 | | | | 88,017 | |
8.00%, 11/01/19(b) | | | 375,000 | | | | 292,500 | |
KB Home, Sr. Unsec. Gtd. Notes, | | | | | | | | |
7.00%, 12/15/21 | | | 118,000 | | | | 120,212 | |
7.50%, 09/15/22 | | | 23,000 | | | | 23,575 | |
Meritage Homes Corp., Sr. Unsec. Gtd. Global Notes,
6.00%, 06/01/25 | | | 85,000 | | | | 87,975 | |
7.15%, 04/15/20 | | | 65,000 | | | | 71,175 | |
Shea Homes L.P./Shea Homes Funding Corp., Sr. Unsec. Gtd. Notes,
5.88%, 04/01/23(b) | | | 30,000 | | | | 31,613 | |
Taylor Morrison Communities Inc./ Monarch Communities Inc., Sr. Unsec. Gtd. Notes, 5.88%, 04/15/23(b) | | | 80,000 | | | | 80,800 | |
| | | | | | | | 1,969,877 | |
|
| Household Products–0.37% | |
Reynolds Group Issuer Inc./LLC (New Zealand), Sr. Unsec. Gtd. Global Notes, 8.25%, 02/15/21 | | | 300,000 | | | | 312,750 | |
Springs Industries, Inc., Sr. Sec. Global Notes, 6.25%, 06/01/21 | | | 241,000 | | | | 241,000 | |
| | | | | | | | 553,750 | |
|
| Independent Power Producers & Energy Traders–0.49% | |
AES Corp., Sr. Unsec. Notes,
5.50%, 04/15/25 | | | 265,000 | | | | 247,112 | |
AES Gener S.A. (Chile), Sr. Unsec. Notes, 5.00%, 07/14/25(b) | | | 400,000 | | | | 408,500 | |
Calpine Corp.,
Sr. Sec. Gtd. First Lien Notes, | | | | | | | | |
5.88%, 01/15/24(b) | | | 15,000 | | | | 15,900 | |
Sr. Unsec. Global Notes,
5.50%, 02/01/24 | | | 74,000 | | | | 70,763 | |
| | | | | | | | 742,275 | |
|
| Industrial Machinery–0.21% | |
Optimas OE Solutions Holding, LLC/Optimas OE Solutions, Inc., Sr. Sec. Notes, 8.63%, 06/01/21(b) | | | 159,000 | | | | 151,845 | |
Waterjet Holdings, Inc., Sr. Sec.
Gtd. Notes, 7.63%, 02/01/20(b) | | | 168,000 | | | | 169,470 | |
| | | | | | | | 321,315 | |
| | | | | | | | |
| | | Principal
Amount | | | Value | |
| Integrated Oil & Gas–0.51% | |
California Resources Corp., Sr. Unsec. Gtd. Global Notes, 5.50%, 09/15/21 | | $ | 191,000 | | | $ | 133,223 | |
Gazprom OAO Via Gaz Capital S.A. (Russia), Sr. Unsec. Notes, 4.30%, 11/12/15(b) | | | 250,000 | | | | 249,687 | |
Petroleos de Venezuela S.A. (Venezuela), REGS, Sr. Unsec. Gtd. Euro Bonds, 6.00%, 05/16/24(b) | | | 207,644 | | | | 75,011 | |
Petroleos Mexicanos (Mexico),
Sr. Unsec. Gtd. Global Notes, | | | | | | | | |
6.50%, 06/02/41 | | | 159,000 | | | | 153,536 | |
Sr. Unsec. Gtd. Notes,
4.50%, 01/23/26(b) | | | 160,000 | | | | 153,764 | |
| | | | | | | | 765,221 | |
|
| Integrated Telecommunication Services–0.94% | |
Colombia Telecomunicaciones S.A. E.S.P. (Colombia), REGS, Sr. Unsec. Euro Notes, 5.38%, 09/27/22(b) | | | 390,000 | | | | 349,050 | |
Frontier Communications Corp., Sr. Unsec. Notes, | | | | | | | | |
8.88%, 09/15/20(b) | | | 88,000 | | | | 91,850 | |
11.00%, 09/15/25(b) | | | 113,000 | | | | 118,791 | |
T-Mobile USA, Inc.,
Sr. Unsec. Gtd. Global Bonds, | | | | | | | | |
6.84%, 04/28/23 | | | 223,000 | | | | 231,084 | |
Sr. Unsec. Gtd. Global Notes,
6.38%, 03/01/25 | | | 349,000 | | | | 351,181 | |
6.63%, 04/01/23 | | | 60,000 | | | | 61,650 | |
Telecom Italia S.p.A. (Italy), Sr. Unsec. Notes, 5.30%, 05/30/24(b) | | | 200,000 | | | | 202,000 | |
| | | | | | | | 1,405,606 | |
|
| Internet Software & Services–0.21% | |
Equinix Inc., Sr. Unsec. Notes, | | | | | | | | |
5.38%, 01/01/22 | | | 172,000 | | | | 180,170 | |
5.38%, 04/01/23 | | | 135,000 | | | | 141,075 | |
| | | | | | | | 321,245 | |
|
| Leisure Products–0.27% | |
Party City Holdings Inc., Sr. Unsec. Gtd. Notes, 6.13%, 08/15/23(b) | | | 44,000 | | | | 45,650 | |
Vista Outdoor Inc., Sr. Unsec. Gtd. Notes,
5.88%, 10/01/23(b) | | | 350,000 | | | | 366,625 | |
| | | | | | | | 412,275 | |
|
| Life Sciences Tools & Services–0.03% | |
Quintiles Transnational Corp., Sr. Unsec. Gtd. Notes, 4.88%, 05/15/23(b) | | | 38,000 | | | | 38,950 | |
|
| Marine–0.29% | |
Navios Maritime Acquisition Corp./Navios Acquisition Finance U.S. Inc., Sr. Sec. Gtd. First Lien Mortgage Notes,
8.13%, 11/15/21 (Acquired 10/29/13-07/16/15; Cost $452,678)(b) | | | 455,000 | | | | 437,938 | |
See accompanying Notes to Financial Statements which are an integral part of the financial statements.
14 Invesco Premium Income Fund
| | | | | | | | |
| | | Principal
Amount | | | Value | |
| Marine Ports & Services–0.23% | |
PT Pelabuhan Indonesia II (Indonesia), Sr. Unsec. Notes, 4.25%, 05/05/25(b) | | $ | 380,000 | | | $ | 351,025 | |
|
| Metal & Glass Containers–0.47% | |
Berry Plastics Corp., Sec. Gtd. Second Lien Notes, | | | | | | | | |
5.50%, 05/15/22 | | | 137,000 | | | | 140,939 | |
6.00%, 10/15/22(b) | | | 142,000 | | | | 149,277 | |
Coveris Holdings S.A. (Luxembourg), Sr. Unsec. Gtd. Notes, 7.88%, 11/01/19(b) | | | 200,000 | | | | 189,000 | |
Owens-Brockway Glass Container, Inc., Sr. Unsec. Gtd. Notes, | | | | | | | | |
5.00%, 01/15/22(b) | | | 40,000 | | | | 40,800 | |
5.88%, 08/15/23(b) | | | 69,000 | | | | 73,485 | |
6.38%, 08/15/25(b) | | | 104,000 | | | | 110,500 | |
| | | | | | | | 704,001 | |
|
| Movies & Entertainment–0.14% | |
LIN Television Corp., Sr. Unsec. Gtd. Global Notes, 6.38%, 01/15/21 | | | 75,000 | | | | 78,656 | |
Mediacom Broadband LLC/Corp., Sr. Unsec. Gtd. Global Notes, 5.50%, 04/15/21 | | | 130,000 | | | | 127,075 | |
| | | | | | | | 205,731 | |
|
| Office REIT’s–0.15% | |
Wanda Properties International Co., Ltd. (China), REGS, Sr. Unsec. Gtd. Euro Bonds, 7.25%, 01/29/24(b) | | | 200,000 | | | | 220,118 | |
|
| Oil & Gas Exploration & Production–1.14% | |
Antero Resources Corp., Sr. Unsec. Gtd. Global Notes, 6.00%, 12/01/20 | | | 92,000 | | | | 88,780 | |
Carrizo Oil & Gas, Inc., Sr. Unsec. Gtd. Notes, 7.50%, 09/15/20 | | | 22,000 | | | | 22,110 | |
Chaparral Energy, Inc., Sr. Unsec. Gtd. Global Notes, 9.88%, 10/01/20 | | | 174,000 | | | | 64,380 | |
Concho Resources Inc., Sr. Unsec. Gtd. Global Notes, 5.50%, 10/01/22 | | | 241,000 | | | | 243,410 | |
Denbury Resources Inc., Sr. Unsec. Gtd. Sub. Notes, 5.50%, 05/01/22 | | | 50,000 | | | | 35,750 | |
Gulfport Energy Corp., Sr. Unsec. Gtd. Global Notes, 6.63%, 05/01/23 | | | 111,000 | | | | 104,895 | |
Halcón Resources Corp., Sec. Gtd. Second Lien Notes, 8.63%, 02/01/20(b) | | | 60,000 | | | | 52,050 | |
Oasis Petroleum Inc., Sr. Unsec. Gtd. Global Notes, 6.88%, 03/15/22 | | | 43,000 | | | | 36,873 | |
Pertamina Persero PT (Indonesia), REGS, Sr. Unsec. Medium-Term Euro Notes, 4.30%, 05/20/23(b) | | | 500,000 | | | | 474,247 | |
QEP Resources Inc., Sr. Unsec. Global Notes, 5.25%, 05/01/23 | | | 73,000 | | | | 65,152 | |
Range Resources Corp.,
Sr. Unsec. Gtd. Sub. Global Notes, | | | | | | | | |
5.00%, 03/15/23 | | | 195,000 | | | | 174,525 | |
Sr. Unsec. Gtd. Sub. Notes,
5.75%, 06/01/21 | | | 31,000 | | | | 29,218 | |
| | | | | | | | |
| | | Principal
Amount | | | Value | |
| Oil & Gas Exploration & Production–(continued) | |
Rice Energy Inc., Sr. Unsec. Gtd. Global Notes, 6.25%, 05/01/22 | | $ | 53,000 | | | $ | 48,495 | |
Whiting Petroleum Corp., Sr. Unsec. Gtd. Notes, 5.00%, 03/15/19 | | | 99,000 | | | | 94,545 | |
WPX Energy, Inc., Sr. Unsec. Notes,
7.50%, 08/01/20 | | | 183,100 | | | | 173,029 | |
| | | | | | | | 1,707,459 | |
|
| Oil & Gas Refining & Marketing–0.52% | |
Reliance Industries Ltd. (India), REGS, Sr. Unsec. Euro Notes,
4.13%, 01/28/25(b) | | | 770,000 | | | | 774,530 | |
|
| Oil & Gas Storage & Transportation–0.82% | |
Crestwood Midstream Partners L.P./Crestwood Midstream Finance Corp., Sr. Unsec. Gtd. Global Bonds,
6.13%, 03/01/22 | | | 67,000 | | | | 58,123 | |
Genesis Energy L.P./Genesis Energy Finance Corp., Sr. Unsec. Gtd. Notes,
6.00%, 05/15/23 | | | 27,000 | | | | 24,705 | |
GNL Quintero S.A. (Chile), Sr. Unsec. Notes, 4.63%, 07/31/29(b) | | | 200,000 | | | | 198,634 | |
NGL Energy Partners L.P./NGL Energy Finance Corp., Sr. Unsec. Gtd. Global Notes, 6.88%, 10/15/21 | | | 96,000 | | | | 91,680 | |
Sabine Pass Liquefaction, LLC, Sr. Sec. First Lien Global Notes,
5.63%, 02/01/21 | | | 250,000 | | | | 249,375 | |
Targa Resources Partners L.P./Targa Resources Partners Finance Corp., Sr. Unsec. Gtd. Global Notes,
6.88%, 02/01/21 | | | 132,000 | | | | 133,320 | |
Teekay Corp. (Bermuda), Sr. Unsec. Global Notes, 8.50%, 01/15/20 | | | 60,000 | | | | 59,400 | |
Teekay Offshore Partners L.P./Teekay Offshore Finance Corp. (Bermuda), Sr. Unsec. Global Notes, 6.00%, 07/30/19 | | | 104,000 | | | | 83,720 | |
Tesoro Logistics L.P./Tesoro Logistics Finance Corp.,
Sr. Unsec. Gtd. Global Notes, | | | | | | | | |
5.88%, 10/01/20 | | | 223,000 | | | | 231,920 | |
Sr. Unsec. Gtd. Notes,
6.25%, 10/15/22(b) | | | 14,000 | | | | 14,630 | |
Williams Partners L.P./ACMP Finance Corp., Sr. Unsec. Global Notes,
4.88%, 05/15/23 | | | 101,000 | | | | 91,657 | |
| | | | | | | | 1,237,164 | |
|
| Other Diversified Financial Services–0.44% | |
Power Sector Assets & Liabilities Management Corp. (Philippines), Sr. Unsec. Gtd. Bonds, | | | | | | | | |
7.39%, 12/02/24(b) | | | 300,000 | | | | 395,250 | |
REGS, Sr. Unsec. Gtd. Euro Bond, | | | | | | | | |
7.39%,��12/02/24(b) | | | 200,000 | | | | 262,000 | |
| | | | | | | | 657,250 | |
See accompanying Notes to Financial Statements which are an integral part of the financial statements.
15 Invesco Premium Income Fund
| | | | | | | | |
| | | Principal
Amount | | | Value | |
| Packaged Foods & Meats–1.20% | |
FAGE Dairy Industry S.A./FAGE USA Dairy Industry, Inc. (Greece), Sr. Unsec. Gtd. Notes, 9.88%, 02/01/20(b) | | $ | 250,000 | | | $ | 261,312 | |
JBS Investments GmbH (Brazil),
Sr. Unsec. Gtd. Notes, 7.25%, 04/03/24(b) | | | 200,000 | | | | 206,250 | |
REGS, Sr. Unsec. Gtd. Euro Notes,
7.25%, 04/03/24(b) | | | 200,000 | | | | 206,500 | |
MHP S.A. (Ukraine), REGS, Sr. Unsec. Gtd. Euro Notes, 8.25%, 04/02/20(b) | | | 1,100,000 | | | | 954,580 | |
Smithfield Foods Inc., Sr. Unsec. Notes,
6.63%, 08/15/22 | | | 74,000 | | | | 79,180 | |
WhiteWave Foods Co. (The), Sr. Unsec. Gtd. Notes, 5.38%, 10/01/22 | | | 92,000 | | | | 98,900 | |
| | | | | | | | 1,806,722 | |
|
| Paper Packaging–0.12% | |
Graphic Packaging International Inc., Sr. Unsec. Gtd. Notes, | | | | | | | | |
4.75%, 04/15/21 | | | 6,000 | | | | 6,172 | |
4.88%, 11/15/22 | | | 163,000 | | | | 167,279 | |
| | | | | | | | 173,451 | |
|
| Paper Products–0.24% | |
Clearwater Paper Corp.,
Sr. Unsec. Gtd. Global Notes, | | | | | | | | |
4.50%, 02/01/23 | | | 156,000 | | | | 152,490 | |
Sr. Unsec. Gtd. Notes,
5.38%, 02/01/25(b) | | | 94,000 | | | | 94,235 | |
Mercer International Inc. (Canada), Sr. Unsec. Gtd. Global Notes,
7.00%, 12/01/19 | | | 110,000 | | | | 113,025 | |
| | | | | | | | 359,750 | |
|
| Personal Products–0.23% | |
Alphabet Holding Co., Inc., Sr. Unsec. Global PIK Notes,
8.50%, 11/01/17(d) | | | 352,000 | | | | 346,720 | |
|
| Pharmaceuticals–0.67% | |
Concordia Healthcare Corp. (Canada), Sr. Unsec. Gtd. Notes, | | | | | | | | |
7.00%, 04/15/23(b) | | | 198,000 | | | | 173,745 | |
REGS, Sr. Unsec. Gtd. Euro Notes,
7.00%, 04/15/23(b) | | | 120,000 | | | | 105,000 | |
Valeant Pharmaceuticals International, Inc.,
Sr. Unsec. Gtd. Notes, | | | | | | | | |
5.50%, 03/01/23(b) | | | 130,000 | | | | 109,850 | |
5.63%, 12/01/21(b) | | | 140,000 | | | | 121,975 | |
5.88%, 05/15/23(b) | | | 42,000 | | | | 35,595 | |
6.13%, 04/15/25(b) | | | 452,000 | | | | 380,810 | |
REGS, Sr. Unsec. Gtd. Euro Notes,
6.13%, 04/15/25(b) | | | 90,000 | | | | 76,162 | |
| | | | | | | | 1,003,137 | |
|
| Railroads–0.27% | |
Lima Metro Line 2 Finance Ltd. (Peru), Sr. Sec. First Lien Bonds,
5.88%, 07/05/34(b) | | | 400,000 | | | | 404,000 | |
| | | | | | | | |
| | | Principal
Amount | | | Value | |
| Real Estate Development–0.49% | |
CIFI Holdings (Group) Co. Ltd. (China), Sr. Unsec. Gtd. Euro Notes,
8.88%, 01/27/19 | | $ | 210,000 | | | $ | 222,331 | |
Country Garden Holdings Co. Ltd. (China), REGS, Sr. Unsec. Gtd. Euro Notes, 7.50%, 01/10/23(b) | | | 230,000 | | | | 238,953 | |
Shimao Property Holdings Ltd. (Hong Kong), REGS, Sr. Unsec. Gtd. Euro Bonds, 8.38%, 02/10/22(b) | | | 250,000 | | | | 269,820 | |
| | | | | | | | 731,104 | |
|
| Regional Banks–0.69% | |
Banco Internacional del Perú S.A.A.—Interbank (Peru), Unsec. Sub. Notes, 6.63%, 03/19/29(b) | | | 300,000 | | | | 309,750 | |
CIT Group Inc., Sr. Unsec. Global Notes, | | | | | | | | |
5.00%, 08/15/22 | | | 359,000 | | | | 379,642 | |
5.00%, 08/01/23 | | | 175,000 | | | | 184,188 | |
Synovus Financial Corp., Sr. Unsec. Global Notes, 7.88%, 02/15/19 | | | 147,000 | | | | 165,375 | |
| | | | | | | | 1,038,955 | |
|
| Restaurants–0.45% | |
1011778 BC ULC/ New Red Finance, Inc. (Canada),
Sec. Gtd. Second Lien Notes,
6.00%, 04/01/22(b) | | | 306,000 | | | | 320,917 | |
REGS, Sec. Gtd. Second Lien Euro Notes,
6.00%, 04/01/22(b) | | | 120,000 | | | | 125,700 | |
Arcos Dorados Holdings Inc. (Brazil), REGS, Sr. Unsec. Gtd. Euro Notes,
6.63%, 09/27/23(b) | | | 140,000 | | | | 116,900 | |
Carrols Restaurant Group, Inc., Sec. Gtd. Second Lien Global Notes,
8.00%, 05/01/22 | | | 106,000 | | | | 112,625 | |
| | | | | | | | 676,142 | |
|
| Security & Alarm Services–0.05% | |
ADT Corp. (The), Sr. Unsec. Global Notes,
6.25%, 10/15/21 | | | 75,000 | | | | 81,000 | |
|
| Semiconductor Equipment–0.12% | |
Amkor Technology Inc., Sr. Unsec. Global Notes, 6.38%, 10/01/22 | | | 188,000 | | | | 183,770 | |
|
| Sovereign Debt–5.92% | |
Argentina Bonar Bonds (Argentina),
Series X, Sr. Unsec. Bonds,
7.00%, 04/17/17 | | | 920,000 | | | | 916,320 | |
Costa Rica Government International Bond (Costa Rica), REGS, Sr. Unsec. Euro Notes, 4.38%, 04/30/25(b) | | | 430,000 | | | | 374,100 | |
Dominican Republic International Bond (Dominican Repubic),
Sr. Unsec. Notes, | | | | | | | | |
9.04%, 01/23/18(b) | | | 136,997 | | | | 146,758 | |
REGS, Sr. Unsec. Euro Bonds, | | | | | | | | |
5.50%, 01/27/25(b) | | | 100,000 | | | | 99,250 | |
El Salvador Government International Bond (El Salvador), Unsec. Notes,
6.38%, 01/18/27(b) | | | 172,000 | | | | 154,370 | |
See accompanying Notes to Financial Statements which are an integral part of the financial statements.
16 Invesco Premium Income Fund
| | | | | | | | |
| | | Principal
Amount | | | Value | |
| Sovereign Debt–(continued) | |
Guatemala Government Bond (Guatemala), Sr. Unsec. Bonds,
8.13%, 10/06/19(b)(e) | | $ | 359,000 | | | $ | 468,495 | |
Honduras Government International Bond (Honduras), REGS, Sr. Unsec. Euro Notes, 7.50%, 03/15/24(b) | | | 400,000 | | | | 425,000 | |
Hungary Government International Bond (Hungary), Sr. Unsec. Global Notes, 5.38%, 03/25/24 | | | 810,000 | | | | 897,075 | |
Ivory Coast Government International Bond (Ivory Coast), Sr. Unsec. Notes,
6.38%, 03/03/28(b) | | | 382,000 | | | | 353,827 | |
Jamaica Government International Bond (Jamaica), Sr. Unsec. Global Notes,
7.63%, 07/09/25 | | | 500,000 | | | | 547,500 | |
Kazakhstan Government International Bond (Kazakhstan), Sr. Unsec. Notes,
5.13%, 07/21/25(b) | | | 812,000 | | | | 810,396 | |
Magyar Export-Import Bank Zrt. (Hungary), Sr. Unsec. Gtd. Bonds,
4.00%, 01/30/20(b) | | | 200,000 | | | | 205,126 | |
Mexico Government International Bond (Mexico), Sr. Unsec. Global Notes, | | | | | | | | |
3.60%, 01/30/25 | | | 300,000 | | | | 299,250 | |
4.60%, 01/23/46 | | | 200,000 | | | | 186,250 | |
Pakistan Government International Bond (Pakistan), Unsec. Bonds,
6.75%, 12/03/19(b) | | | 238,000 | | | | 247,597 | |
Panama Government International Bond (Panama), Sr. Unsec. Global Bonds, | | | | | | | | |
3.75%, 03/16/25 | | | 200,000 | | | | 198,500 | |
4.00%, 09/22/24 | | | 530,000 | | | | 537,950 | |
Peruvian Government International Bond (Peru), Sr. Unsec. Global Bonds,
8.75%, 11/21/33 | | | 212,000 | | | | 310,050 | |
Poland Government International Bond (Poland), Sr. Unsec. Global Notes, | | | | | | | | |
3.00%, 03/17/23 | | | 106,000 | | | | 107,278 | |
4.00%, 01/22/24 | | | 400,000 | | | | 426,866 | |
5.00%, 03/23/22 | | | 146,000 | | | | 164,812 | |
Romanian Government International Bond (Romania), Sr. Unsec. Notes,
4.88%, 01/22/24(b) | | | 106,000 | | | | 115,520 | |
Russian Foreign Bond (Russia), REGS, Sr. Unsec. Euro Bonds,
4.88%, 09/16/23(b) | | | 400,000 | | | | 414,240 | |
Ukraine Government International Bond (Ukraine), REGS, Sr. Unsec. Euro Notes, | | | | | | | | |
6.75%, 11/14/17(b) | | | 305,000 | | | | 241,713 | |
9.25%, 07/24/17(b) | | | 300,000 | | | | 237,750 | |
| | | | | | | | 8,885,993 | |
|
| Specialized Consumer Services–0.17% | |
ServiceMaster Co., LLC (The), Sr. Unsec. Notes, 7.45%, 08/15/27 | | | 254,000 | | | | 260,668 | |
|
| Specialized Finance–0.87% | |
Aircastle Ltd., Sr. Unsec. Notes,
5.50%, 02/15/22 | | | 460,000 | | | | 487,600 | |
| | | | | | | | |
| | | Principal
Amount | | | Value | |
| Specialized Finance–(continued) | |
International Lease Finance Corp., Sr. Unsec. Global Notes, | | | | | | | | |
5.88%, 08/15/22 | | $ | 138,000 | | | $ | 151,800 | |
Sr. Unsec. Notes,
8.25%, 12/15/20 | | | 324,000 | | | | 390,420 | |
MSCI Inc., Sr. Unsec. Gtd. Notes,
5.25%, 11/15/24(b) | | | 265,000 | | | | 279,575 | |
| | | | | | | | 1,309,395 | |
|
| Specialized REIT’s–0.56% | |
Crown Castle International Corp.,
Sr. Unsec. Global Notes,
5.25%, 01/15/23 | | | 440,000 | | | | 475,200 | |
Sr. Unsec. Notes,
4.88%, 04/15/22 | | | 36,000 | | | | 38,250 | |
CyrusOne L.P./CyrusOne Finance Corp., | | | | | | | | |
Sr. Unsec. Gtd. Global Notes,
6.38%, 11/15/22 | | | 241,000 | | | | 248,832 | |
Sr. Unsec. Gtd. Notes,
6.38%, 11/15/22(b) | | | 80,000 | | | | 82,600 | |
| | | | | | | | 844,882 | |
|
| Specialty Chemicals–0.05% | |
Ashland Inc., Sr. Unsec. Gtd. Global Notes, 4.75%, 08/15/22 | | | 80,000 | | | | 80,200 | |
|
| Steel–0.22% | |
FMG Resources (August 2006) Pty. Ltd. (Australia), Sr. Unsec. Gtd. Notes, | | | | | | | | |
6.88%, 04/01/22(b) | | | 116,000 | | | | 84,100 | |
8.25%, 11/01/19(b) | | | 202,000 | | | | 172,710 | |
Steel Dynamics, Inc., Sr. Unsec. Gtd. Global Notes, 5.50%, 10/01/24 | | | 81,000 | | | | 79,583 | |
| | | | | | | | 336,393 | |
|
| Trading Companies & Distributors–0.50% | |
AerCap Ireland Capital Ltd./AerCap Global Aviation Trust (Netherlands), Sr. Unsec. Gtd. Global Notes,
4.63%, 10/30/20 | | | 150,000 | | | | 156,187 | |
Fly Leasing Ltd. (Ireland), Sr. Unsec. Global Notes, 6.75%, 12/15/20 | | | 400,000 | | | | 423,000 | |
United Rentals North America Inc., Sr. Unsec. Gtd. Notes, 6.13%, 06/15/23 | | | 170,000 | | | | 177,225 | |
| | | | | | | | 756,412 | |
|
| Trucking–0.12% | |
OPE KAG Finance Sub Inc., Sr. Unsec. Notes, 7.88%, 07/31/23(b) | | | 170,000 | | | | 176,800 | |
|
| Wireless Telecommunication Services–2.85% | |
Bharti Airtel Ltd. (India), Sr. Unsec. Notes, 4.38%, 06/10/25(b) | | | 466,000 | | | | 470,660 | |
Comcel Trust via Comunicaciones Celulares S.A. (Guatemala), REGS, Sr. Unsec. Gtd. Euro Bonds, 6.88%, 02/06/24(b) | | | 467,000 | | | | 377,102 | |
See accompanying Notes to Financial Statements which are an integral part of the financial statements.
17 Invesco Premium Income Fund
| | | | | | | | |
| | | Principal
Amount | | | Value | |
| Wireless Telecommunication Services–(continued) | |
Digicel Ltd. (Jamaica),
Sr. Unsec. Gtd. Notes, | | | | | | | | |
6.75%, 03/01/23(b) | | $ | 400,000 | | | $ | 362,000 | |
Sr. Unsec. Notes,
6.00%, 04/15/21(b) | | | 400,000 | | | | 364,000 | |
SBA Communications Corp., Sr. Unsec. Global Notes, 4.88%, 07/15/22 | | | 290,000 | | | | 299,062 | |
Sprint Communications Inc., Sr. Unsec. Global Notes, 11.50%, 11/15/21 | | | 70,000 | | | | 73,850 | |
Sprint Corp., Sr. Unsec. Gtd. Global Notes, | | | | | | | | |
7.63%, 02/15/25 | | | 575,000 | | | | 508,875 | |
7.88%, 09/15/23 | | | 93,000 | | | | 86,723 | |
Turkcell Iletisim Hizmetleri A.S. (Turkey), Unsec. Notes, 5.75%, 10/15/25(b) | | | 750,000 | | | | 751,875 | |
VimpelCom Holdings B.V. (Russia), REGS, Sr. Unsec. Gtd. Euro Notes, | | | | | | | | |
5.95%, 02/13/23(b) | | | 400,000 | | | | 384,500 | |
7.50%, 03/01/22(b) | | | 280,000 | | | | 295,924 | |
Wind Acquisition Finance S.A. (Italy), Sec. Gtd. Second Lien Notes,
7.38%, 04/23/21(b) | | | 300,000 | | | | 303,750 | |
| | | | | | | | 4,278,321 | |
Total U.S. Dollar Denominated Bonds and Notes
(Cost $60,952,323) | | | | 60,318,834 | |
| | |
| | | Shares | | | | |
Preferred Stocks–20.73% | |
| Asset Management & Custody Banks–0.58% | |
Affiliated Managers Group Inc.,
6.38% Sr. Unsec. Pfd. | | | 3,100 | | | | 80,817 | |
Apollo Investment Corp.,
6.88% Sr. Unsec. Pfd. | | | 2,700 | | | | 68,607 | |
Bank of New York Mellon Corp. (The),
5.20% Pfd. | | | 6,400 | | | | 164,416 | |
Northern Trust Corp., Series C, 5.85% Pfd. | | | 4,400 | | | | 115,588 | |
State Street Corp., 6.00% Pfd. | | | 9,000 | | | | 232,650 | |
State Street Corp., Series C, 5.25% Pfd. | | | 4,500 | | | | 115,110 | |
State Street Corp., Series D, 5.90% Pfd. | | | 3,600 | | | | 95,832 | |
| | | | | | | | 873,020 | |
|
| Cable & Satellite–0.05% | |
Comcast Corp., 5.00% Sr. Unsec. Gtd. Pfd. | | | 2,600 | | | | 68,536 | |
|
| Consumer Finance–0.57% | |
Capital One Financial Corp., Series B, 6.00% Pfd. | | | 9,000 | | | | 230,670 | |
Capital One Financial Corp., Series C, 6.25% Pfd. | | | 5,500 | | | | 142,450 | |
Capital One Financial Corp., Series D, 6.70% Pfd. | | | 3,900 | | | | 106,119 | |
Capital One Financial Corp., Series F, 6.20% Pfd. | | | 3,600 | | | | 93,060 | |
Discover Financial Services, Series B, 6.50% Pfd. | | | 6,400 | | | | 170,816 | |
Navient Corp., 6.00% Sr. Unsec. Pfd. | | | 5,600 | | | | 104,440 | |
| | | | | 847,555 | |
| | | | | | | | |
| | |
Shares | | | Value | |
| Diversified Banks–7.47% | |
Bank of America Corp., Series 3, 6.38% Pfd. | | | 7,300 | | | $ | 188,121 | |
Bank of America Corp., Series D, 6.20% Pfd. | | | 6,400 | | | | 164,288 | |
Bank of America Corp., Series I, 6.63% Pfd. | | | 16,951 | | | | 442,251 | |
Bank of America Corp., Series W, 6.63% Pfd. | | | 33,200 | | | | 881,128 | |
Bank of America Corp., Series Y, 6.50% Pfd. | | | 18,800 | | | | 494,816 | |
Barclays Bank PLC (United Kingdom), Series 4, 7.75% Pfd. | | | 20,200 | | | | 530,250 | |
Barclays Bank PLC (United Kingdom), Series 5, 8.13% Pfd. | | | 23,400 | | | | 614,952 | |
Citigroup Inc., Series J, 7.13% Pfd. | | | 10,000 | | | | 275,700 | |
Citigroup Inc., Series K, 6.88% Pfd. | | | 14,000 | | | | 385,560 | |
Citigroup Inc., Series L, 6.88% Pfd. | | | 4,000 | | | | 107,160 | |
Countrywide Capital V, 7.00% Jr. Unsec. Gtd. Sub. Pfd. | | | 2,700 | | | | 69,336 | |
HSBC Holdings PLC (United Kingdom), Series 2, 8.00% Jr. Unsec. Sub. Pfd. | | | 62,100 | | | | 1,614,600 | |
JPMorgan Chase & Co., Series O, 5.50% Pfd. | | | 6,900 | | | | 170,361 | |
JPMorgan Chase & Co., Series P, 5.45% Pfd. | | | 9,000 | | | | 222,750 | |
JPMorgan Chase & Co., Series T, 6.70% Pfd. | | | 1,800 | | | | 48,600 | |
JPMorgan Chase & Co., Series W, 6.30% Pfd. | | | 4,800 | | | | 125,040 | |
JPMorgan Chase & Co., Series Y, 6.13% Pfd. | | | 16,100 | | | | 408,135 | |
JPMorgan Chase & Co., Series AA, 6.10% Pfd. | | | 15,800 | | | | 399,898 | |
JPMorgan Chase & Co., Series BB, 6.15% Pfd. | | | 12,500 | | | | 315,125 | |
RBS Capital Funding Trust VII (Netherlands), Series G, 6.08% Jr. Unsec. Sub. Gtd. Pfd. | | | 15,402 | | | | 383,510 | |
Royal Bank of Scotland Group PLC (The) (United Kingdom), Series L, 5.75% Jr. Unsec. Sub. Pfd. | | | 15,401 | | | | 380,251 | |
Royal Bank of Scotland Group PLC (The) (United Kingdom), Series R, 6.13% Jr. Unsec. Sub. Pfd. | | | 9,900 | | | | 247,401 | |
Royal Bank of Scotland Group PLC (The) (United Kingdom), Series S, 6.60% Jr. Unsec. Sub. Pfd. | | | 15,400 | | | | 391,006 | |
Royal Bank of Scotland Group PLC (The) (United Kingdom), Series T, 7.25% Jr. Unsec. Sub. Pfd. | | | 4,500 | | | | 114,660 | |
Santander Finance Preferred SAU (Spain), 6.50% Jr. Unsec. Gtd. Sub. Pfd. | | | 1,700 | | | | 44,030 | |
US Bancorp, Series F, 6.50% Pfd. | | | 18,900 | | | | 547,722 | |
Wells Fargo & Co., 5.20% Pfd. | | | 16,000 | | | | 400,960 | |
Wells Fargo & Co., 5.85% Pfd. | | | 6,300 | | | | 163,737 | |
Wells Fargo & Co., 6.63% Pfd. | | | 7,900 | | | | 222,306 | |
Wells Fargo & Co., Series J, 8.00% Pfd. | | | 4,500 | | | | 126,225 | |
Wells Fargo & Co., Series O, 5.13% Pfd. | | | 14,500 | | | | 361,195 | |
Wells Fargo & Co., Series T, 6.00% Pfd. | | | 14,500 | | | | 376,420 | |
| | | | | 11,217,494 | |
See accompanying Notes to Financial Statements which are an integral part of the financial statements.
18 Invesco Premium Income Fund
| | | | | | | | |
| | | Shares | | | Value | |
| Diversified Capital Markets–0.72% | |
Deutsche Bank Contingent Capital Trust III (Germany), 7.60% Jr. Unsec. Sub. Gtd. Pfd. | | | 13,600 | | | $ | 363,664 | |
Deutsche Bank Contingent Capital Trust V (Germany), 8.05% Jr. Unsec. Sub. Gtd. Pfd. | | | 17,700 | | | | 483,918 | |
KKR Financial Holdings LLC, 8.38% Sr. Unsec. Pfd. | | | 4,200 | | | | 114,870 | |
KKR Financial Holdings LLC, Series A, 7.38% Pfd. | | | 4,500 | | | | 119,115 | |
| | | | | 1,081,567 | |
|
| Diversified REIT’s–0.15% | |
PS Business Parks, Inc., Series S, 6.45% Pfd. | | | 8,700 | | | | 227,592 | |
|
| Electric Utilities–1.07% | |
BGE Capital Trust II, 6.20% Jr. Unsec. Sub. Gtd. Pfd. | | | 2,300 | | | | 59,156 | |
Duke Energy Corp., 5.13% Jr. Unsec. Sub. Pfd. | | | 5,500 | | | | 139,040 | |
Entergy Louisiana LLC, 5.25% Sr. Sec. First Mortgage Pfd. | | | 3,300 | | | | 84,183 | |
Entergy Mississippi Inc., 6.00% Sr. Sec. First Mortgage Pfd. | | | 5,500 | | | | 140,800 | |
Entergy Texas Inc., 5.63% Sr. Sec. First Mortgage Pfd. | | | 5,600 | | | | 146,776 | |
Interstate Power & Light Co., Series D, 5.10% Pfd. | | | 1,800 | | | | 46,350 | |
NextEra Energy Capital Holdings Inc., 5.00% Jr. Unsec. Sub. Gtd. Pfd. | | | 6,600 | | | | 157,278 | |
NextEra Energy Capital Holdings Inc., Series G, 5.70% Jr. Unsec. Sub. Gtd. Pfd. | | | 4,800 | | | | 124,032 | |
NextEra Energy Capital Holdings Inc., Series H, 5.63% Jr. Unsec. Sub. Gtd. Pfd. | | | 8,000 | | | | 202,960 | |
Pacific Gas & Electric Co., Series A, 6.00% Pfd. | | | 1,000 | | | | 29,240 | |
PPL Capital Funding, Inc., Series B, 5.90% Jr. Unsec. Sub. Gtd. Pfd. | | | 5,400 | | | | 136,836 | |
SCE Trust I, 5.63% Jr. Unsec. Sub. Pfd. | | | 10,000 | | | | 256,600 | |
SCE Trust IV, Series J, 5.38% Jr. Unsec. Sub. Pfd. | | | 2,900 | | | | 76,357 | |
| | | | | 1,599,608 | |
|
| Health Care REIT’s–0.14% | |
Senior Housing Properties Trust, 5.63% Sr. Unsec. Pfd. | | | 3,200 | | | | 79,008 | |
Ventas Realty L.P. / Ventas Capital Corp., 5.45% Sr. Unsec. Gtd. Pfd. | | | 2,300 | | | | 60,812 | |
Welltower Inc., Series J, 6.50% Pfd. | | | 2,600 | | | | 69,030 | |
| | | | | 208,850 | |
|
| Hotel and Resort REIT’s–0.05% | |
Hospitality Properties Trust, Series D, 7.13% Pfd. | | | 2,600 | | | | 68,510 | |
|
| Industrial Conglomerates–0.34% | |
General Electric Capital Corp., 4.70% Sr. Unsec. Pfd. | | | 6,600 | | | | 167,640 | |
| | | | | | | | |
| | | Shares | | | Value | |
| Industrial Conglomerates–(continued) | |
General Electric Capital Corp., 4.88% Sr. Unsec. Pfd. | | | 6,400 | | | $ | 164,032 | |
General Electric Capital Corp., 4.88% Sr. Unsec. Pfd. | | | 6,700 | | | | 171,520 | |
| | | | | 503,192 | |
|
| Industrial Machinery–0.10% | |
Stanley Black & Decker Inc., 5.75% Jr. Unsec. Sub. Pfd. | | | 6,000 | | | | 156,540 | |
|
| Integrated Telecommunication Services–0.65% | |
Qwest Corp., 6.13% Sr. Unsec. Pfd. | | | 5,400 | | | | 134,352 | |
Qwest Corp., 6.88% Sr. Unsec. Pfd. | | | 4,900 | | | | 126,420 | |
Qwest Corp., 7.00% Sr. Unsec. Pfd. | | | 4,800 | | | | 125,376 | |
Qwest Corp., 7.00% Sr. Unsec. Pfd. | | | 6,700 | | | | 176,947 | |
Qwest Corp., 7.38% Sr. Unsec. Pfd. | | | 5,600 | | | | 144,536 | |
Qwest Corp., 7.50% Sr. Unsec. Pfd. | | | 4,900 | | | | 128,380 | |
Verizon Communications Inc., 5.90% Sr. Unsec. Pfd. | | | 5,500 | | | | 146,300 | |
| | | | | 982,311 | |
|
| Investment Banking & Brokerage–1.87% | |
BGC Partners Inc., 8.13% Sr. Unsec. Pfd. | | | 1,000 | | | | 27,170 | |
Charles Schwab Corp. (The), Series B, 6.00% Pfd. | | | 5,400 | | | | 140,454 | |
Charles Schwab Corp. (The), Series C, 6.00% Pfd. | | | 4,800 | | | | 124,368 | |
Goldman Sachs Group, Inc. (The), 6.50% Sr. Unsec. Pfd. | | | 2,400 | | | | 63,840 | |
Goldman Sachs Group, Inc. (The), Series I, 5.95% Pfd. | | | 12,700 | | | | 324,866 | |
Goldman Sachs Group, Inc. (The), Series J, 5.50% Pfd. | | | 13,600 | | | | 338,504 | |
Goldman Sachs Group, Inc. (The), Series K, 6.38% Pfd. | | | 14,400 | | | | 386,352 | |
Morgan Stanley, Series E, 7.13% Pfd. | | | 6,300 | | | | 175,455 | |
Morgan Stanley, Series F, 6.88% Pfd. | | | 11,300 | | | | 305,665 | |
Morgan Stanley, Series G, 6.63% Pfd. | | | 7,000 | | | | 187,320 | |
Morgan Stanley, Series I, 6.38% Pfd. | | | 21,800 | | | | 564,620 | |
Raymond James Financial Inc., 6.90% Sr. Unsec. Pfd. | | | 4,200 | | | | 113,106 | |
Stifel Financial Corp., 5.38% Sr. Unsec. Pfd. | | | 1,900 | | | | 49,134 | |
| | | | | | | | 2,800,854 | |
|
| Life & Health Insurance–0.80% | |
Aegon N.V. (Netherlands), 6.38% Jr. Unsec. Sub. Pfd. | | | 4,800 | | | | 122,880 | |
Aegon N.V. (Netherlands), 8.00% Unsec. Sub. Pfd. | | | 10,100 | | | | 279,568 | |
Aflac Inc., 5.50% Jr. Unsec. Sub. Pfd. | | | 5,500 | | | | 140,470 | |
Protective Life Corp., 6.25% Unsec. Sub. Pfd. | | | 4,300 | | | | 112,144 | |
Prudential Financial Inc., 5.70% Jr. Unsec. Sub. Pfd. | | | 7,200 | | | | 186,840 | |
Prudential Financial Inc., 5.75% Jr. Unsec. Sub. Pfd. | | | 6,600 | | | | 171,468 | |
Prudential PLC (United Kingdom), 6.75% Jr. Unsec. Sub. Pfd. | | | 6,100 | | | | 160,003 | |
See accompanying Notes to Financial Statements which are an integral part of the financial statements.
19 Invesco Premium Income Fund
| | | | | | | | |
| | | Shares | | | Value | |
| Life & Health Insurance–(continued) | |
Torchmark Corp., 5.88% Jr. Unsec. Sub. Pfd. | | | 1,100 | | | $ | 28,160 | |
| | | | | | | | 1,201,533 | |
|
| Mortgage REIT’s–0.08% | |
Wells Fargo Real Estate Investment Corp., Series A, 6.38% Pfd. | | | 4,600 | | | | 121,348 | |
|
| Multi-Line Insurance–0.29% | |
American Financial Group Inc., 6.38% Sr. Unsec. Pfd. | | | 4,100 | | | | 108,732 | |
Aviva PLC (United Kingdom), 8.25% Unsec. Sub. Pfd. | | | 4,800 | | | | 129,648 | |
Hartford Financial Services Group Inc. (The), 7.88% Jr. Unsec. Sub. Pfd. | | | 5,500 | | | | 169,400 | |
Kemper Corp., 7.38% Unsec. Sub. Pfd. | | | 1,200 | | | | 33,168 | |
| | | | | | | | 440,948 | |
|
| Multi-Utilities–0.18% | |
DTE Energy Co., 6.50% Jr. Unsec. Sub. Pfd. | | | 5,300 | | | | 142,146 | |
Integrys Holding, Inc., 6.00% Jr. Unsec. Sub. Pfd. | | | 4,800 | | | | 122,550 | |
| | | | | | | | 264,696 | |
|
| Office REIT’s–0.36% | |
Alexandria Real Estate Equities Inc., Series E, 6.45% Pfd. | | | 1,200 | | | | 30,804 | |
Boston Properties, Inc., 5.25% Pfd. | | | 1,800 | | | | 46,350 | |
Equity Commonwealth, 5.75% Sr. Unsec. Pfd. | | | 5,400 | | | | 127,710 | |
Kilroy Realty Corp., Series G, 6.88% Pfd. | | | 900 | | | | 23,112 | |
Kilroy Realty Corp., Series H, 6.38% Pfd. | | | 900 | | | | 22,374 | |
SL Green Realty Corp., Series I, 6.50% Pfd. | | | 2,100 | | | | 55,062 | |
Vornado Realty Trust, Series J, 6.88% Pfd. | | | 9,300 | | | | 240,870 | |
| | | | | | | | 546,282 | |
|
| Office Services & Supplies–0.09% | |
Pitney Bowes Inc., 5.25% Sr. Unsec. Pfd. | | | 800 | | | | 20,272 | |
Pitney Bowes Inc., 6.70% Sr. Unsec. Pfd. | | | 4,400 | | | | 118,932 | |
| | | | | | | | 139,204 | |
|
| Oil & Gas Exploration & Production–0.09% | |
WPX Energy Inc., Series A, $3.13% Conv. Pfd. | | | 3,680 | | | | 136,123 | |
|
| Oil & Gas Refining & Marketing–0.08% | |
NuStar Logistics L.P., 7.63% Jr. Unsec. Sub. Gtd. Pfd. | | | 4,800 | | | | 122,976 | |
|
| Other Diversified Financial Services–0.52% | |
ING Groep NV (Netherlands), 6.38% Jr. Unsec. Sub. Pfd. | | | 30,600 | | | | 783,666 | |
|
| Property & Casualty Insurance–0.90% | |
Allstate Corp. (The), 5.10% Unsec. Sub. Pfd. | | | 4,300 | | | | 110,639 | |
Allstate Corp. (The), 5.63% Pfd. | | | 2,800 | | | | 72,772 | |
Allstate Corp. (The), Series C, 6.75% Pfd. | | | 3,000 | | | | 81,780 | |
Allstate Corp. (The), Series E, 6.63% Pfd. | | | 9,000 | | | | 244,710 | |
Allstate Corp. (The), Series F, 6.25% Pfd. | | | 3,600 | | | | 95,796 | |
Arch Capital Group Ltd., Series C, 6.75% Pfd. | | | 3,900 | | | | 104,754 | |
| | | | | | | | |
| | | Shares | | | Value | |
| Property & Casualty Insurance–(continued) | |
Argo Group U.S. Inc., 6.50% Sr. Unsec. Gtd. Pfd. | | | 1,300 | | | $ | 33,137 | |
Aspen Insurance Holdings Ltd. (Bermuda), 5.95% Pfd. | | | 2,300 | | | | 58,627 | |
Aspen Insurance Holdings Ltd. (Bermuda), 7.25% Pfd. | | | 2,900 | | | | 77,314 | |
Assured Guaranty Municipal Holdings Inc., 6.25% Sr. Unsec. Gtd. Pfd. | | | 5,100 | | | | 130,866 | |
Axis Capital Holdings Ltd., Series C, 6.88% Pfd. | | | 6,600 | | | | 178,464 | |
Hanover Insurance Group, Inc. (The), 6.35% Jr. Unsec. Sub. Pfd. | | | 1,600 | | | | 40,704 | |
Selective Insurance Group, Inc., 5.88% Sr. Unsec. Pfd. | | | 1,600 | | | | 41,248 | |
W. R. Berkley Corp., 5.63% Jr. Unsec. Sub. Pfd. | | | 3,200 | | | | 79,744 | |
| | | | | | | | 1,350,555 | |
|
| Regional Banks–1.58% | |
BB&T Corp., 5.85% Pfd. | | | 5,600 | | | | 146,776 | |
BB&T Corp., Series E, 5.63% Pfd. | | | 15,400 | | | | 396,704 | |
City National Corp., Series C, 5.50% Pfd. | | | 2,500 | | | | 61,800 | |
Commerce Bancshares Inc., Series B, 6.00% Pfd. | | | 1,600 | | | | 42,224 | |
Cullen/Frost Bankers, Inc., 5.38% Pfd. | | | 1,400 | | | | 35,518 | |
Fifth Third Bancorp, Series I, 6.63% Pfd. | | | 4,100 | | | | 114,390 | |
First Horizon National Corp., Series A, 6.20% Pfd. | | | 900 | | | | 22,644 | |
First Niagara Financial Group Inc., Series B, 8.63% Pfd. | | | 4,200 | | | | 115,668 | |
First Republic Bank, 5.50% Pfd. | | | 3,000 | | | | 74,730 | |
First Republic Bank, 7.00% Pfd. | | | 1,800 | | | | 49,320 | |
First Republic Bank, Series A, 6.70% Pfd. | | | 2,100 | | | | 55,230 | |
First Republic Bank, Series B, 6.20% Pfd. | | | 2,200 | | | | 57,464 | |
First Republic Bank,Series F, 5.70% Pfd. | | | 2,300 | | | | 57,155 | |
FirstMerit Corp., Series A, 5.88% Pfd. | | | 900 | | | | 22,644 | |
FNB Corp., 7.25% Pfd. | | | 1,000 | | | | 29,200 | |
Hancock Holding Co., 5.95% Unsec. Sub. Pfd. | | | 1,800 | | | | 44,208 | |
PNC Financial Services Group, Inc. (The), Series P, 6.13% Pfd. | | | 14,100 | | | | 392,685 | |
Regions Financial Corp., Series A, 6.38% Pfd. | | | 5,500 | | | | 143,000 | |
Regions Financial Corp., Series B, 6.38% Pfd. | | | 5,600 | | | | 148,288 | |
SunTrust Banks Inc., Series E, 5.88% Pfd. | | | 5,400 | | | | 137,322 | |
TCF Financial Corp., 7.50% Pfd. | | | 1,200 | | | | 32,400 | |
TCF Financial Corp., Series B, 6.45% Pfd. | | | 1,200 | | | | 30,480 | |
Texas Capital Bancshares, Inc., Series A, 6.50% Pfd. | | | 2,400 | | | | 61,368 | |
Webster Financial Corp., Series E, 6.40% Pfd. | | | 1,100 | | | | 28,050 | |
Zions Bancorp., Series F, 7.90% Pfd. | | | 2,872 | | | | 76,252 | |
| | | | | 2,375,520 | |
See accompanying Notes to Financial Statements which are an integral part of the financial statements.
20 Invesco Premium Income Fund
| | | | | | | | |
| | | Shares | | | Value | |
| Reinsurance–0.50% | |
Endurance Specialty Holdings Ltd., Series A, 7.75% Pfd. | | | 1,800 | | | $ | 46,404 | |
Endurance Specialty Holdings Ltd., Series B, 7.50% Pfd. | | | 2,100 | | | | 54,705 | |
Maiden Holdings Ltd., Series A, 8.25% Pfd. | | | 5,600 | | | | 148,624 | |
PartnerRe Ltd. (Bermuda), Series E, 7.25% Pfd. | | | 8,200 | | | | 234,356 | |
Reinsurance Group of America, Inc., 6.20% Unsec. Sub. Pfd. | | | 4,800 | | | | 139,104 | |
RenaissanceRe Holdings Ltd. (Bermuda), Series E, 5.38% Pfd. | | | 4,800 | | | | 119,232 | |
| | | | | 742,425 | |
|
| Retail REIT’s–0.44% | |
DDR Corp., Class J, 6.50% Pfd. | | | 3,200 | | | | 83,584 | |
Kimco Realty Corp., Series I, 6.00% Pfd. | | | 8,600 | | | | 221,880 | |
National Retail Properties Inc., Series D, 6.63% Pfd. | | | 6,400 | | | | 169,344 | |
Realty Income Corp., Series F, 6.63% Pfd. | | | 4,900 | | | | 129,997 | |
Regency Centers Corp., Series 6, 6.63% Pfd. | | | 2,300 | | | | 59,754 | |
| | | | | 664,559 | |
|
| Specialized REIT’s–0.80% | |
Digital Realty Trust, Inc., Series F, 6.63% Pfd. | | | 3,300 | | | | 85,602 | |
Digital Realty Trust, Inc., Series G, 5.88% Pfd. | | | 4,500 | | | | 109,305 | |
Digital Realty Trust, Inc., Series H, 7.38% Pfd. | | | 4,400 | | | | 120,780 | |
EPR Properties, Series F, 6.63% Pfd. | | | 1,100 | | | | 27,918 | |
Public Storage, Series A, 5.88% Pfd. | | | 5,600 | | | | 145,936 | |
Public Storage, Series Q, 6.50% Pfd. | | | 15,400 | | | | 394,086 | |
Public Storage, Series Y, 6.38% Pfd. | | | 11,800 | | | | 315,650 | |
| | | | | 1,199,277 | |
|
| Thrifts & Mortgage Finance–0.02% | |
Astoria Financial Corp., Series C, 6.50% Pfd. | | | 1,200 | | | | 30,912 | |
|
| Wireless Telecommunication Services–0.24% | |
Telephone & Data Systems Inc., 7.00% Sr. Unsec. Pfd. | | | 8,300 | | | | 212,480 | |
United States Cellular Corp., 6.95% Sr. Unsec. Pfd. | | | 3,100 | | | | 79,081 | |
United States Cellular Corp., 7.25% Sr. Unsec. Pfd. | | | 2,800 | | | | 71,736 | |
| | | | | 363,297 | |
Total Preferred Stocks
(Cost $29,384,684) | | | | 31,118,950 | |
|
Common Stocks & Other Equity Interests–8.35% | |
| Mortgage REIT’s–8.35% | |
Altisource Residential Corp. | | | 18,900 | | | | 271,971 | |
American Capital Agency Corp. | | | 68,200 | | | | 1,216,006 | |
American Capital Mortgage Investment Corp. | | | 16,900 | | | | 245,219 | |
Annaly Capital Management Inc. | | | 127,500 | | | | 1,268,625 | |
Apollo Commercial Real Estate Finance, Inc. | | | 19,300 | | | | 320,573 | |
ARMOUR Residential REIT, Inc. | | | 14,500 | | | | 297,540 | |
Blackstone Mortgage Trust, Inc.–Class A | | | 30,800 | | | | 847,616 | |
| | | | | | | | |
| | | Shares | | | Value | |
| Mortgage REIT’s–(continued) | |
Capstead Mortgage Corp. | | | 31,700 | | | $ | 305,905 | |
Chimera Investment Corp. | | | 68,000 | | | | 957,440 | |
Colony Capital, Inc.–Class A | | | 36,900 | | | | 750,546 | |
CYS Investments, Inc. | | | 51,900 | | | | 400,668 | |
Hannon Armstrong Sustainable Infrastructure Capital, Inc. | | | 10,300 | | | | 185,503 | |
Hatteras Financial Corp. | | | 32,000 | | | | 457,920 | |
MFA Financial, Inc. | | | 122,400 | | | | 847,008 | |
New Residential Investment Corp. | | | 76,200 | | | | 924,306 | |
New York Mortgage Trust, Inc. | | | 36,200 | | | | 205,616 | |
PennyMac Mortgage Investment Trust | | | 24,700 | | | | 361,114 | |
Redwood Trust, Inc. | | | 28,000 | | | | 371,840 | |
Starwood Property Trust, Inc. | | | 63,300 | | | | 1,271,697 | |
Two Harbors Investment Corp. | | | 121,500 | | | | 1,027,890 | |
Total Common Stocks & Other Equity Interests
(Cost $12,986,740) | | | | 12,535,003 | |
| | |
| | | Principal
Amount | | | | |
U.S. Treasury Securities–6.34% | |
| U.S. Treasury Bills–0.29% | |
0.11%, 05/26/16(f)(g) | | $ | 195,000 | | | | 194,743 | |
0.24%, 05/26/16(f)(g) | | | 235,000 | | | | 234,691 | |
| | | | | | | | 429,434 | |
|
| U.S. Treasury STRIPS–6.05% | |
2.74%, 02/15/43(f)(h) | | | 200,000 | | | | 87,297 | |
2.91%, 02/15/43(f)(h) | | | 1,550,000 | | | | 676,551 | |
3.03%, 02/15/43(f)(h) | | | 1,100,000 | | | | 480,133 | |
3.36%, 02/15/43(f)(h) | | | 2,450,000 | | | | 1,069,387 | |
3.98%, 02/15/43(f)(h) | | | 10,800,000 | | | | 4,714,031 | |
4.11%, 02/15/43(f)(h) | | | 4,700,000 | | | | 2,051,476 | |
| | | | | | | | 9,078,875 | |
Total U.S. Treasury Securities
(Cost $7,927,507) | | | | 9,508,309 | |
|
Exchange Traded Notes–4.60% | |
JPMorgan Alerian MLP Index ETN, 5.16%, 05/24/24
(Cost $6,607,292) | | | 207,800 | | | | 6,898,960 | |
|
Non-U.S. Dollar Denominated Bonds & Notes–1.22%(i) | |
| Automobile Manufacturers–0.07% | |
Hydra Dutch Holdings 2 B.V. (Netherlands), Sr. Sec. Gtd. First Lien Notes, 8.00%, 04/15/19(b) | | EUR | 100,000 | | | | 112,719 | |
|
| Cable & Satellite–0.30% | |
Virgin Media Secured Finance PLC (United Kingdom),
Sr. Sec. Gtd. First Lien Notes, 4.88%, 01/15/27(b) | | GBP | 100,000 | | | | 147,049 | |
REGS, Sr. Sec. Gtd. First Lien Medium-Term Euro Notes, | | | | | | | | |
5.13%, 01/15/25(b) | | GBP | 200,000 | | | | 297,568 | |
| | | | | | | | 444,617 | |
See accompanying Notes to Financial Statements which are an integral part of the financial statements.
21 Invesco Premium Income Fund
| | | | | | | | |
| | | Principal
Amount | | | Value | |
| Hotels, Resorts & Cruise Lines–0.14% | |
Thomas Cook Finance PLC (United Kingdom), Sr. Unsec. Gtd. Bonds, 6.75%, 06/15/21(b) | | EUR | 100,000 | | | $ | 117,118 | |
Thomas Cook Group PLC (United Kingdom), Sr. Unsec. Gtd. Medium-Term Euro Notes, 7.75%, 06/22/17 | | GBP | 57,000 | | | | 93,046 | |
| | | | | | | | 210,164 | |
|
| Internet Software & Services–0.08% | |
United Group B.V. (Serbia), REGS, Sr. Sec. Gtd. Euro Notes, 7.88%, 11/15/20(b) | | EUR | 100,000 | | | | 118,124 | |
|
| Marine–0.07% | |
CMA CGM S.A. (France), Sr. Unsec. Notes, 7.75%, 01/15/21(b) | | EUR | 100,000 | | | | 101,992 | |
|
| Multi-Sector Holdings–0.27% | |
Gala Electric Casinos PLC (United Kingdom), REGS, Sec. Gtd. Second Lien Euro Notes, 11.50%, 06/01/19(b) | | GBP | 100,000 | | | | 164,606 | |
Odeon & UCI Finco PLC (United Kingdom), REGS, Sr. Sec. Gtd. First Lien Medium-Term Euro Notes, 9.00%, 08/01/18(b) | | GBP | 150,000 | | | | 241,673 | |
| | | | | | | | 406,279 | |
|
| Other Diversified Financial Services–0.19% | |
Cabot Financial Luxembourg S.A. (United Kingdom), REGS, Sr. Sec. Gtd. First Lien Euro Notes, 10.38%, 10/01/19(b) | | GBP | 100,000 | | | | 166,587 | |
| | | | | | | | |
| | | Principal
Amount | | | Value | |
| Other Diversified Financial Services–(continued) | |
Financiere Gaillon 8 SAS (France), Sr. Sec. First Lien Notes, 7.00%, 09/30/19(b) | | EUR | 100,000 | | | $ | 114,347 | |
| | | | | | | | 280,934 | |
|
| Packaged Foods & Meats–0.10% | |
Moy Park (Bondco) PLC (United Kingdom), Sr. Unsec. Gtd. Notes, 6.25%, 05/29/21(b) | | GBP | 100,000 | | | | 158,129 | |
Total Non-U.S. Dollar Denominated Bonds & Notes
(Cost $1,879,197) | | | | 1,832,958 | |
| | |
| | | Shares | | | | |
Money Market Funds–12.10% | |
Liquid Assets Portfolio–Institutional Class, 0.16%(j) | | | 9,080,746 | | | | 9,080,746 | |
Premier Portfolio–Institutional Class, 0.12%(j) | | | 9,080,746 | | | | 9,080,746 | |
Total Money Market Funds
(Cost $18,161,492) | | | | | | | 18,161,492 | |
TOTAL INVESTMENTS–93.53%
(Cost $137,899,235) | | | | 140,374,506 | |
OTHER ASSETS LESS LIABILITIES–6.47% | | | | 9,712,060 | |
NET ASSETS–100.00% | | | $ | 150,086,566 | |
Investment Abbreviations:
| | |
| Conv. | | – Convertible |
| ETN | | – Exchange Traded Notes |
| EUR | | – Euro |
| GBP | | – British Pound Sterling |
| Gtd. | | – Guaranteed |
| Jr. | | – Junior |
| MLP | | – Master Limited Partnerships |
| Pfd. | | – Preferred |
| | |
| PIK | | – Payment in Kind |
| REGS | | – Regulation S |
| REIT | | – Real Estate Investment Trust |
| Sec. | | – Secured |
| Sr. | | – Senior |
| STRIPS | | – Separately Traded Registered Interest and Principal Security |
| Sub. | | – Subordinated |
| Unsec. | | – Unsecured |
Notes to Schedule of Investments:
| (a) | Industry and/or sector classifications used in this report are generally according to the Global Industry Classification Standard, which was developed by and is the exclusive property and a service mark of MSCI Inc. and Standard & Poor’s. |
| (b) | Security purchased or received in a transaction exempt from registration under the Securities Act of 1933, as amended (the “1933 Act”). The security may be resold pursuant to an exemption from registration under the 1933 Act, typically to qualified institutional buyers. The aggregate value of these securities at October 31, 2015 was $36,749,486, which represented 24.49% of the Fund’s Net Assets. |
| (c) | Perpetual bond with no specified maturity date. |
| (d) | All or a portion of this security is Payment-in-Kind. |
| | | | | | | | |
| Issuer | | Cash Rate | | | PIK Rate | |
Alphabet Holding Co., Inc., Sr. Unsec. Global PIK Notes | | | 7.75 | % | | | 8.50 | % |
| (e) | Security has an irrevocable call by the issuer or mandatory put by the holder. Maturity date reflects such call or put. |
| (f) | Security traded on a discount basis. The interest rate shown represents the discount rate at the time of purchase by the Fund. |
| (g) | All or a portion of the value was pledged as collateral to cover margin requirements for swap agreements. See Note 1L and Note 4. |
| (h) | All or a portion of the value was pledged as collateral to cover margin requirements for open futures contracts. See Note 1K and Note 4. |
| (i) | Foreign denominated security. Principal amount is denominated in the currency indicated. |
| (j) | The money market fund and the Fund are affiliated by having the same investment adviser. The rate shown is the 7-day SEC standardized yield as of October 31, 2015. |
See accompanying Notes to Financial Statements which are an integral part of the financial statements.
22 Invesco Premium Income Fund
Statement of Assets and Liabilities
October 31, 2015
| | | | |
Assets: | |
Investments, at value (Cost $119,737,743) | | $ | 122,213,014 | |
Investments in affiliated money market funds, at value and cost | | | 18,161,492 | |
Total investments, at value (Cost $137,899,235) | | | 140,374,506 | |
Cash | | | 2,414 | |
Foreign currencies, at value (Cost $4,108) | | | 4,016 | |
Receivable for: | | | | |
Investments sold | | | 10,353,944 | |
Variation margin — centrally cleared swap agreements | | | 1,278 | |
Fund shares sold | | | 806,248 | |
Dividends and interest | | | 1,074,904 | |
Investment for trustee deferred compensation and retirement plans | | | 22,464 | |
Unrealized appreciation on forward foreign currency contracts outstanding | | | 16,900 | |
Other assets | | | 8,663 | |
Total assets | | | 152,665,337 | |
|
Liabilities: | |
Payable for: | | | | |
Investments purchased | | | 2,316,862 | |
Fund shares reacquired | | | 81,613 | |
Variation margin — futures | | | 24,675 | |
Accrued fees to affiliates | | | 55,780 | |
Accrued trustees’ and officers’ fees and benefits | | | 1,657 | |
Accrued other operating expenses | | | 65,634 | |
Trustee deferred compensation and retirement plans | | | 24,745 | |
Unrealized depreciation on forward foreign currency contracts outstanding | | | 7,805 | |
Total liabilities | | | 2,578,771 | |
Net assets applicable to shares outstanding | | $ | 150,086,566 | |
|
Net assets consist of: | |
Shares of beneficial interest | | $ | 157,095,933 | |
Undistributed net investment income | | | (122,117 | ) |
Undistributed net realized gain (loss) | | | (10,072,056 | ) |
Net unrealized appreciation | | | 3,184,806 | |
| | | $ | 150,086,566 | |
| | | | |
Net Assets: | |
Class A | | $ | 52,612,971 | |
Class C | | $ | 17,132,883 | |
Class R | | $ | 338,777 | |
Class Y | | $ | 12,423,766 | |
Class R5 | | $ | 10,104 | |
Class R6 | | $ | 67,568,065 | |
|
Shares outstanding, $0.01 par value per share,
with an unlimited number of shares authorized: | |
Class A | | | 5,215,927 | |
Class C | | | 1,700,117 | |
Class R | | | 33,593 | |
Class Y | | | 1,231,073 | |
Class R5 | | | 1,001 | |
Class R6 | | | 6,693,709 | |
Class A: | | | | |
Net asset value per share | | $ | 10.09 | |
Maximum offering price per share | | | | |
(Net asset value of $10.09 ¸ 94.50%) | | $ | 10.68 | |
Class C: | | | | |
Net asset value and offering price per share | | $ | 10.08 | |
Class R: | | | | |
Net asset value and offering price per share | | $ | 10.08 | |
Class Y: | | | | |
Net asset value and offering price per share | | $ | 10.09 | |
Class R5: | | | | |
Net asset value and offering price per share | | $ | 10.09 | |
Class R6: | | | | |
Net asset value and offering price per share | | $ | 10.09 | |
See accompanying Notes to Financial Statements which are an integral part of the financial statements.
23 Invesco Premium Income Fund
Statement of Operations
For the year ended October 31, 2015
| | | | |
Investment income: | |
Interest (net of foreign withholding taxes of $1,619) | | $ | 5,250,803 | |
Dividends (net of foreign withholding taxes of $1,209) | | | 2,307,948 | |
Dividends from affiliated money market funds | | | 7,313 | |
Total investment income | | | 7,566,064 | |
| |
Expenses: | | | | |
Advisory fees | | | 893,205 | |
Administrative services fees | | | 50,000 | |
Custodian fees | | | 27,425 | |
Distribution fees: | | | | |
Class A | | | 120,705 | |
Class C | | | 163,233 | |
Class R | | | 865 | |
Transfer agent fees — A, C, R and Y | | | 101,667 | |
Transfer agent fees — R6 | | | 184 | |
Trustees’ and officers’ fees and benefits | | | 20,732 | |
Other | | | 230,508 | |
Total expenses | | | 1,608,524 | |
Less: Fees waived, expenses reimbursed and expense offset arrangement(s) | | | (305,363 | ) |
Net expenses | | | 1,303,161 | |
Net investment income | | | 6,262,903 | |
| |
Realized and unrealized gain (loss) from: | | | | |
Net realized gain (loss) from: | | | | |
Investment securities (includes net gains from securities sold to affiliates of $1,211) | | | (3,117,885 | ) |
Foreign currencies | | | (59,473 | ) |
Forward foreign currency contracts | | | 146,653 | |
Futures contracts | | | (455,467 | ) |
Swap agreements | | | 82,098 | |
| | | | (3,404,074 | ) |
Change in net unrealized appreciation (depreciation) of: | | | | |
Investment securities | | | (1,163,866 | ) |
Foreign currencies | | | 1,000 | |
Forward foreign currency contracts | | | (46,222 | ) |
Futures contracts | | | 663,375 | |
Swap agreements | | | 58,460 | |
| | | | (487,253 | ) |
Net realized and unrealized gain (loss) | | | (3,891,327 | ) |
Net increase in net assets resulting from operations | | $ | 2,371,576 | |
See accompanying Notes to Financial Statements which are an integral part of the financial statements.
24 Invesco Premium Income Fund
Statement of Changes in Net Assets
For the years ended October 31, 2015 and 2014
| | | | | | | | |
| | | 2015 | | | 2014 | |
Operations: | | | | | |
Net investment income | | $ | 6,262,903 | | | $ | 6,899,924 | |
Net realized gain (loss) | | | (3,404,074 | ) | | | 1,242,323 | |
Change in net unrealized appreciation (depreciation) | | | (487,253 | ) | | | 3,867,728 | |
Net increase in net assets resulting from operations | | | 2,371,576 | | | | 12,009,975 | |
| | |
Distributions to shareholders from net investment income: | | | | | | | | |
Class A | | | (2,285,486 | ) | | | (1,808,084 | ) |
Class C | | | (649,749 | ) | | | (638,928 | ) |
Class R | | | (7,758 | ) | | | (4,535 | ) |
Class Y | | | (631,870 | ) | | | (339,729 | ) |
Class R5 | | | (513 | ) | | | (543 | ) |
Class R6 | | | (2,998,898 | ) | | | (4,760,854 | ) |
Total distributions from net investment income | | | (6,574,274 | ) | | | (7,552,673 | ) |
| | |
Share transactions–net: | | | | | | | | |
Class A | | | 12,053,236 | | | | 560,935 | |
Class C | | | 2,778,173 | | | | (2,185,049 | ) |
Class R | | | 201,235 | | | | 87,569 | |
Class Y | | | 6,112,094 | | | | (920,949 | ) |
Class R6 | | | 18,253,102 | | | | (122,825,649 | ) |
Net increase (decrease) in net assets resulting from share transactions | | | 39,397,840 | | | | (125,283,143 | ) |
Net increase (decrease) in net assets | | | 35,195,142 | | | | (120,825,841 | ) |
| | |
Net assets: | | | | | | | | |
Beginning of year | | | 114,891,424 | | | | 235,717,265 | |
End of year (includes undistributed net investment income of $(122,117) and $(112,914), respectively) | | $ | 150,086,566 | | | $ | 114,891,424 | |
Notes to Financial Statements
October 31, 2015
NOTE 1—Significant Accounting Policies
Invesco Premium Income Fund (the “Fund”) is a series portfolio of AIM Investment Funds (Invesco Investment Funds) (the “Trust”). The Trust is organized as a Delaware statutory trust and is registered under the Investment Company Act of 1940, as amended (the “1940 Act”), as an open-end series management investment company consisting of twenty-four separate series portfolios, each authorized to issue an unlimited number of shares of beneficial interest. The assets, liabilities and operations of each portfolio are accounted for separately. Information presented in these financial statements pertains only to the Fund. Matters affecting each portfolio or class will be voted on exclusively by the shareholders of such portfolio or class.
The Fund’s investment objective is to provide current income.
The Fund currently consists of six different classes of shares: Class A, Class C, Class R, Class Y, Class R5 and Class R6. Class A shares are sold with a front-end sales charge unless certain waiver criteria are met and under certain circumstances load waived shares may be subject to contingent deferred sales charges (“CDSC”). Class C shares are sold with a CDSC. Class R, Class Y, Class R5 and Class R6 shares are sold at net asset value.
The following is a summary of the significant accounting policies followed by the Fund in the preparation of its financial statements.
| A. | Security Valuations — Securities, including restricted securities, are valued according to the following policy. |
Debt obligations (including convertible securities) and unlisted equities are fair valued using an evaluated quote provided by an independent pricing service. Evaluated quotes provided by the pricing service may be determined without exclusive reliance on quoted prices, and may reflect appropriate factors such as institution-size trading in similar groups of securities, developments related to specific securities, dividend rate (for unlisted equities), yield (for debt obligations), quality, type of issue, coupon rate (for debt obligations), maturity (for debt obligations), individual trading characteristics and other market data. Debt obligations are subject to interest rate and credit risks. In addition, all debt obligations involve some risk of default with respect to interest and/or principal payments.
A security listed or traded on an exchange (except convertible securities) is valued at its last sales price or official closing price as of the close of the customary trading session on the exchange where the security is principally traded, or lacking any sales or official closing price on a particular day, the security may be valued at the closing bid price on that day. Securities traded in the over-the-counter market are valued based on prices furnished by independent pricing services or market makers. When such securities are valued by an independent pricing service they
25 Invesco Premium Income Fund
may be considered fair valued. Futures contracts are valued at the final settlement price set by an exchange on which they are principally traded. Listed options are valued at the mean between the last bid and asked prices from the exchange on which they are principally traded. Options not listed on an exchange are valued by an independent source at the mean between the last bid and asked prices. For purposes of determining net asset value (“NAV”) per share, futures and option contracts generally are valued 15 minutes after the close of the customary trading session of the New York Stock Exchange (“NYSE”).
Investments in open-end and closed-end registered investment companies that do not trade on an exchange are valued at the end-of-day net asset value per share. Investments in open-end and closed-end registered investment companies that trade on an exchange are valued at the last sales price or official closing price as of the close of the customary trading session on the exchange where the security is principally traded.
Swap agreements are fair valued using an evaluated quote, if available, provided by an independent pricing service. Evaluated quotes provided by the pricing service are valued based on a model which may include end-of-day net present values, spreads, ratings, industry, company performance and returns of referenced assets.
Foreign securities’ (including foreign exchange contracts) prices are converted into U.S. dollar amounts using the applicable exchange rates as of the close of the NYSE. If market quotations are available and reliable for foreign exchange-traded equity securities, the securities will be valued at the market quotations. Because trading hours for certain foreign securities end before the close of the NYSE, closing market quotations may become unreliable. If between the time trading ends on a particular security and the close of the customary trading session on the NYSE, events occur that the Adviser determines are significant and make the closing price unreliable, the Fund may fair value the security. If the event is likely to have affected the closing price of the security, the security will be valued at fair value in good faith using procedures approved by the Board of Trustees. Adjustments to closing prices to reflect fair value may also be based on a screening process of an independent pricing service to indicate the degree of certainty, based on historical data, that the closing price in the principal market where a foreign security trades is not the current value as of the close of the NYSE. Foreign securities’ prices meeting the approved degree of certainty that the price is not reflective of current value will be priced at the indication of fair value from the independent pricing service. Multiple factors may be considered by the independent pricing service in determining adjustments to reflect fair value and may include information relating to sector indices, American Depositary Receipts and domestic and foreign index futures. Foreign securities may have additional risks including exchange rate changes, potential for sharply devalued currencies and high inflation, political and economic upheaval, the relative lack of issuer information, relatively low market liquidity and the potential lack of strict financial and accounting controls and standards.
Securities for which market prices are not provided by any of the above methods may be valued based upon quotes furnished by independent sources. The last bid price may be used to value equity securities. The mean between the last bid and asked prices is used to value debt obligations, including corporate loans.
Securities for which market quotations are not readily available or became unreliable are valued at fair value as determined in good faith by or under the supervision of the Trust’s officers following procedures approved by the Board of Trustees. Issuer specific events, market trends, bid/asked quotes of brokers and information providers and other market data may be reviewed in the course of making a good faith determination of a security’s fair value.
The Fund may invest in securities that are subject to interest rate risk, meaning the risk that the prices will generally fall as interest rates rise and, conversely, the prices will generally rise as interest rates fall. Specific securities differ in their sensitivity to changes in interest rates depending on their individual characteristics. Changes in interest rates may result in increased market volatility, which may affect the value and/or liquidity of certain Fund investments.
Valuations change in response to many factors including the historical and prospective earnings of the issuer, the value of the issuer’s assets, general economic conditions, interest rates, investor perceptions and market liquidity. Because of the inherent uncertainties of valuation, the values reflected in the financial statements may materially differ from the value received upon actual sale of those investments.
| B. | Securities Transactions and Investment Income — Securities transactions are accounted for on a trade date basis. Realized gains or losses on sales are computed on the basis of specific identification of the securities sold. Interest income (net of withholding tax, if any) is recorded on the accrual basis from settlement date. Paydown gains and losses on mortgage and asset-backed securities are recorded as adjustments to interest income. Dividend income (net of withholding tax, if any) is recorded on the ex-dividend date. Bond premiums and discounts are amortized and/or accreted for financial reporting purposes. |
The Fund may periodically participate in litigation related to Fund investments. As such, the Fund may receive proceeds from litigation settlements. Any proceeds received are included in the Statement of Operations as realized gain (loss) for investments no longer held and as unrealized gain (loss) for investments still held.
Brokerage commissions and mark ups are considered transaction costs and are recorded as an increase to the cost basis of securities purchased and/or a reduction of proceeds on a sale of securities. Such transaction costs are included in the determination of net realized and unrealized gain (loss) from investment securities reported in the Statement of Operations and the Statement of Changes in Net Assets and the net realized and unrealized gains (losses) on securities per share in the Financial Highlights. Transaction costs are included in the calculation of the Fund’s net asset value and, accordingly, they reduce the Fund’s total returns. These transaction costs are not considered operating expenses and are not reflected in net investment income reported in the Statement of Operations and the Statement of Changes in Net Assets, or the net investment income per share and the ratios of expenses and net investment income reported in the Financial Highlights, nor are they limited by any expense limitation arrangements between the Fund and the investment adviser.
The Fund allocates income and realized and unrealized capital gains and losses to a class based on the relative net assets of each class.
| C. | Country Determination — For the purposes of making investment selection decisions and presentation in the Schedule of Investments, the investment adviser may determine the country in which an issuer is located and/or credit risk exposure based on various factors. These factors include the laws of the country under which the issuer is organized, where the issuer maintains a principal office, the country in which the issuer derives 50% or more of its total revenues and the country that has the primary market for the issuer’s securities, as well as other criteria. Among the other criteria that may be evaluated for making this determination are the country in which the issuer maintains 50% or more of its assets, the type of security, financial guarantees and enhancements, the nature of the collateral and the sponsor organization. Country of issuer and/or credit risk exposure has been determined to be the United States of America, unless otherwise noted. |
26 Invesco Premium Income Fund
| D. | Distributions — Distributions from net investment income, if any, are declared and paid monthly. Distributions from net realized capital gain, if any, are generally declared and paid annually and recorded on the ex-dividend date. The Fund may elect to treat a portion of the proceeds from redemptions as distributions for federal income tax purposes. |
| E. | Federal Income Taxes — The Fund intends to comply with the requirements of Subchapter M of the Internal Revenue Code of 1986, as amended (the “Internal Revenue Code”), necessary to qualify as a regulated investment company and to distribute substantially all of the Fund’s taxable earnings to shareholders. As such, the Fund will not be subject to federal income taxes on otherwise taxable income (including net realized capital gain) that is distributed to shareholders. Therefore, no provision for federal income taxes is recorded in the financial statements. |
The Fund recognizes the tax benefits of uncertain tax positions only when the position is more likely than not to be sustained. Management has analyzed the Fund’s uncertain tax positions and concluded that no liability for unrecognized tax benefits should be recorded related to uncertain tax positions. Management is not aware of any tax positions for which it is reasonably possible that the total amounts of unrecognized tax benefits will change materially in the next 12 months.
The Fund files tax returns in the U.S. Federal jurisdiction and certain other jurisdictions. Generally, the Fund is subject to examinations by such taxing authorities for up to three years after the filing of the return for the tax period.
| F. | Expenses — Fees provided for under the Rule 12b-1 plan of a particular class of the Fund are charged to the operations of such class. Transfer agency fees and expenses and other shareholder recordkeeping fees and expenses attributable to Class R5 and Class R6 are allocated to each share class based on relative net assets. Sub-accounting fees attributable to Class R5 are charged to the operations of the class. Transfer agency fees and expenses and other shareholder recordkeeping fees and expenses relating to all other classes are allocated among those classes based on relative net assets. All other expenses are allocated among the classes based on relative net assets. |
| G. | Accounting Estimates — The preparation of financial statements in conformity with accounting principles generally accepted in the United States of America (“GAAP”) requires management to make estimates and assumptions that affect the reported amounts of assets and liabilities at the date of the financial statements and the reported amounts of revenues and expenses during the reporting period including estimates and assumptions related to taxation. Actual results could differ from those estimates by a significant amount. In addition, the Fund monitors for material events or transactions that may occur or become known after the period-end date and before the date the financial statements are released to print. |
| H. | Indemnifications — Under the Trust’s organizational documents, each Trustee, officer, employee or other agent of the Trust is indemnified against certain liabilities that may arise out of the performance of their duties to the Fund. Additionally, in the normal course of business, the Fund enters into contracts, including the Fund’s servicing agreements, that contain a variety of indemnification clauses. The Fund’s maximum exposure under these arrangements is unknown as this would involve future claims that may be made against the Fund that have not yet occurred. The risk of material loss as a result of such indemnification claims is considered remote. |
| I. | Foreign Currency Translations — Foreign currency is valued at the close of the NYSE based on quotations posted by banks and major currency dealers. Portfolio securities and other assets and liabilities denominated in foreign currencies are translated into U.S. dollar amounts at date of valuation. Purchases and sales of portfolio securities (net of foreign taxes withheld on disposition) and income items denominated in foreign currencies are translated into U.S. dollar amounts on the respective dates of such transactions. The Fund does not separately account for the portion of the results of operations resulting from changes in foreign exchange rates on investments and the fluctuations arising from changes in market prices of securities held. The combined results of changes in foreign exchange rates and the fluctuation of market prices on investments (net of estimated foreign tax withholding) are included with the net realized and unrealized gain or loss from investments in the Statement of Operations. Reported net realized foreign currency gains or losses arise from (1) sales of foreign currencies, (2) currency gains or losses realized between the trade and settlement dates on securities transactions, and (3) the difference between the amounts of dividends, interest, and foreign withholding taxes recorded on the Fund’s books and the U.S. dollar equivalent of the amounts actually received or paid. Net unrealized foreign currency gains and losses arise from changes in the fair values of assets and liabilities, other than investments in securities at fiscal period end, resulting from changes in exchange rates. |
The Fund may invest in foreign securities, which may be subject to foreign taxes on income, gains on investments or currency repatriation, a portion of which may be recoverable. Foreign taxes, if any, are recorded based on the tax regulations and rates that exist in the foreign markets in which the Fund invests and are shown in the Statement of Operations.
| J. | Forward Foreign Currency Contracts — The Fund may engage in foreign currency transactions either on a spot (i.e. for prompt delivery and settlement) basis, or through forward foreign currency contracts, to manage or minimize currency or exchange rate risk. |
The Fund may also enter into forward foreign currency contracts for the purchase or sale of a security denominated in a foreign currency in order to “lock in” the U.S. dollar price of that security, or the Fund may also enter into forward foreign currency contracts that do not provide for physical settlement of the two currencies, but instead are settled by a single cash payment calculated as the difference between the agreed upon exchange rate and the spot rate at settlement based upon an agreed upon notional amount (non-deliverable forwards). The Fund will set aside liquid assets in an amount equal to daily mark-to-market obligation for forward foreign currency contracts.
A forward foreign currency contract is an obligation between two parties (“Counterparties”) to purchase or sell a specific currency for an agreed-upon price at a future date. The use of forward foreign currency contracts does not eliminate fluctuations in the price of the underlying securities the Fund owns or intends to acquire but establishes a rate of exchange in advance. Fluctuations in the value of these contracts are measured by the difference in the contract date and reporting date exchange rates and are recorded as unrealized appreciation (depreciation) until the contracts are closed. When the contracts are closed, realized gains (losses) are recorded. Realized and unrealized gains (losses) on the contracts are included in the Statement of Operations. The primary risks associated with forward foreign currency contracts include failure of the Counterparty to meet the terms of the contract and the value of the foreign currency changing unfavorably. These risks may be in excess of the amounts reflected in the Statement of Assets and Liabilities.
| K. | Futures Contracts — The Fund may enter into futures contracts to manage exposure to interest rate, equity and market price movements and/or currency risks. A futures contract is an agreement between Counterparties to purchase or sell a specified underlying security, currency or commodity (or delivery of a cash settlement price, in the case of an index future) for a fixed price at a future date. The Fund currently invests only in exchange-traded futures and they are standardized as to maturity date and underlying financial instrument. Initial margin deposits required upon entering into futures contracts are satisfied by the segregation of specific securities or cash as collateral at the futures commission |
27 Invesco Premium Income Fund
| | merchant (broker). During the period the futures contracts are open, changes in the value of the contracts are recognized as unrealized gains or losses by recalculating the value of the contracts on a daily basis. Subsequent or variation margin payments are received or made depending upon whether unrealized gains or losses are incurred. These amounts are reflected as receivables or payables on the Statement of Assets and Liabilities. When the contracts are closed or expire, the Fund recognizes a realized gain or loss equal to the difference between the proceeds from, or cost of, the closing transaction and the Fund’s basis in the contract. The net realized gain (loss) and the change in unrealized gain (loss) on futures contracts held during the period is included on the Statement of Operations. The primary risks associated with futures contracts are market risk and the absence of a liquid secondary market. If the Fund were unable to liquidate a futures contract and/or enter into an offsetting closing transaction, the Fund would continue to be subject to market risk with respect to the value of the contracts and continue to be required to maintain the margin deposits on the futures contracts. Futures contracts have minimal Counterparty risk since the exchange’s clearinghouse, as Counterparty to all exchange-traded futures, guarantees the futures against default. Risks may exceed amounts recognized in the Statement of Assets and Liabilities. |
| L. | Swap Agreements — The Fund may enter into various swap transactions, including interest rate, total return, index, currency and credit default swap contracts (“CDS”) for investment purposes or to manage interest rate, currency or credit risk. Such transactions are agreements between Counterparties. A swap agreement may be negotiated bilaterally and traded over-the-counter (“OTC”) between two parties (“uncleared/OTC”) or, in some instances, must be transacted through a future commission merchant (“FCM”) and cleared through a clearinghouse that serves as a central Counterparty (“centrally cleared swap”). These agreements may contain among other conditions, events of default and termination events, and various covenants and representations such as provisions that require the Fund to maintain a pre-determined level of net assets, and/or provide limits regarding the decline of the Fund’s NAV over specific periods of time. If the Fund were to trigger such provisions and have open derivative positions at that time, the Counterparty may be able to terminate such agreement and request immediate payment in an amount equal to the net liability positions, if any. |
Interest rate, total return, index, and currency swap agreements are two-party contracts entered into primarily to exchange the returns (or differentials in rates of returns) earned or realized on particular predetermined investments or instruments. The gross returns to be exchanged or “swapped” between the parties are calculated with respect to a notional amount, i.e., the return on or increase in value of a particular dollar amount invested at a particular interest rate or return of an underlying asset, in a particular foreign currency, or in a “basket” of securities representing a particular index.
In a centrally cleared swap, the Fund’s ultimate Counterparty is a central clearinghouse. The Fund initially will enter into centrally cleared swaps through an executing broker. When a fund enters into a centrally cleared swap, it must deliver to the central Counterparty (via the FCM) an amount referred to as “initial margin.” Initial margin requirements are determined by the central Counterparty, but an FCM may require additional initial margin above the amount required by the central Counterparty. Initial margin deposits required upon entering into centrally cleared swaps are satisfied by cash or securities as collateral at the FCM. Securities deposited as initial margin are designated on the Schedule of Investments and cash deposited is recorded on the Statement of Assets and Liabilities. During the term of a cleared swap agreement, a “variation margin” amount may be required to be paid by the Fund or may be received by the Fund, based on the daily change in price of the underlying reference instrument subject to the swap agreement and is recorded as a receivable or payable for variation margin in the Statement of Assets and Liabilities until the centrally cleared swap is terminated at which time a realized gain or loss is recorded.
A CDS is an agreement between Counterparties to exchange the credit risk of an issuer. A buyer of a CDS is said to buy protection by paying a fixed payment over the life of the agreement and in some situations an upfront payment to the seller of the CDS. If a defined credit event occurs (such as payment default or bankruptcy), the Fund as a protection buyer would cease paying its fixed payment, the Fund would deliver eligible bonds issued by the reference entity to the seller, and the seller would pay the full notional value, or the “par value”, of the referenced obligation to the Fund. A seller of a CDS is said to sell protection and thus would receive a fixed payment over the life of the agreement and an upfront payment, if applicable. If a credit event occurs, the Fund as a protection seller would cease to receive the fixed payment stream, the Fund would pay the buyer “par value” or the full notional value of the referenced obligation, and the Fund would receive the eligible bonds issued by the reference entity. In turn, these bonds may be sold in order to realize a recovery value. Alternatively, the seller of the CDS and its Counterparty may agree to net the notional amount and the market value of the bonds and make a cash payment equal to the difference to the buyer of protection. If no credit event occurs, the Fund receives the fixed payment over the life of the agreement. As the seller, the Fund would effectively add leverage to its portfolio because, in addition to its total net assets, the Fund would be subject to investment exposure on the notional amount of the CDS. In connection with these agreements, cash and securities may be identified as collateral in accordance with the terms of the respective swap agreements to provide assets of value and recourse in the event of default under the swap agreement or bankruptcy/insolvency of a party to the swap agreement. If a Counterparty becomes bankrupt or otherwise fails to perform its obligations due to financial difficulties, the Fund may experience significant delays in obtaining any recovery in a bankruptcy or other reorganization proceeding. The Fund may obtain only limited recovery or may obtain no recovery in such circumstances. The Fund’s maximum risk of loss from Counterparty risk, either as the protection seller or as the protection buyer, is the value of the contract. The risk may be mitigated by having a master netting arrangement between the Fund and the Counterparty and by the designation of collateral by the Counterparty to cover the Fund’s exposure to the Counterparty.
Implied credit spreads represent the current level at which protection could be bought or sold given the terms of the existing CDS contract and serve as an indicator of the current status of the payment/performance risk of the CDS. An implied spread that has widened or increased since entry into the initial contract may indicate a deteriorating credit profile and increased risk of default for the reference entity. A declining or narrowing spread may indicate an improving credit profile or decreased risk of default for the reference entity. Alternatively, credit spreads may increase or decrease reflecting the general tolerance for risk in the credit markets.
An interest rate swap is an agreement between Counterparties pursuant to which the parties exchange a floating rate payment for a fixed rate payment based on a specified notional amount.
Changes in the value of centrally cleared and OTC swap agreements are recognized as unrealized gains (losses) in the Statement of Operations by “marking to market” on a daily basis to reflect the value of the swap agreement at the end of each trading day. Payments received or paid at the beginning of the agreement are reflected as such on the Statement of Assets and Liabilities and may be referred to as upfront payments. The Fund accrues for the fixed payment stream and amortizes upfront payments, if any, on swap agreements on a daily basis with the net amount,
28 Invesco Premium Income Fund
recorded as a component of realized gain (loss) on the Statement of Operations. A liquidation payment received or made at the termination of a swap agreement is recorded as realized gain (loss) on the Statement of Operations. The Fund segregates liquid securities having a value at least equal to the amount of the potential obligation of a Fund under any swap transaction. Entering into these agreements involves, to varying degrees, lack of liquidity and elements of credit, market, and Counterparty risk in excess of amounts recognized on the Statement of Assets and Liabilities. Such risks involve the possibility that a swap is difficult to sell or liquidate; the Counterparty does not honor its obligations under the agreement and unfavorable interest rates and market fluctuations. It is possible that developments in the swaps market, including potential government regulation, could adversely affect the Fund’s ability to terminate existing swap agreements or to realize amounts to be received under such agreements. A short position in a security poses more risk than holding the same security long. As there is no limit on how much the price of the security can increase, the Fund’s exposure is unlimited.
Notional amounts of each individual credit default swap agreement outstanding as of October 31, 2015 for which the Fund is the seller of protection are disclosed in the open swap agreements table. These potential amounts would be partially offset by any recovery values of the respective referenced obligations, upfront payments received upon entering into the agreement, or net amounts received from the settlement of buy protection credit default swap agreements entered into by the Fund for the same referenced entity or entities.
| M. | Other Risks — The Fund may invest in lower-quality debt securities, i.e., “junk bonds”. Investments in lower-rated securities or unrated securities of comparable quality tend to be more sensitive to economic conditions than higher rated securities. Junk bonds involve a greater risk of default by the issuer because such securities are generally unsecured and are often subordinated to other creditors’ claim. |
| N. | Leverage Risk — Leverage exists when the Fund can lose more than it originally invests because it purchases or sells an instrument or enters into a transaction without investing an amount equal to the full economic exposure of the instrument or transaction. |
| O. | Collateral — To the extent the Fund has designated or segregated a security as collateral and that security is subsequently sold, it is the Fund’s practice to replace such collateral no later than the next business day. |
NOTE 2—Advisory Fees and Other Fees Paid to Affiliates
The Trust has entered into a master investment advisory agreement with Invesco Advisers, Inc. (the “Adviser” or “Invesco”). Under the terms of the investment advisory agreement, the Fund pays an advisory fee to the Adviser based on the annual rate of the Fund’s average daily net assets as follows:
| | | | |
| Average Daily Net Assets | | Rate | |
First $500 million | | | 0.65% | |
Next $500 million | | | 0.60% | |
Next $500 million | | | 0.55% | |
Over $1.5 billion | | | 0.54% | |
For the year ended October 31, 2015, the effective advisory fees incurred by the Fund was 0.65%.
Under the terms of a master sub-advisory agreement between the Adviser and each of Invesco Asset Management Deutschland GmbH, Invesco Asset Management Limited, Invesco Asset Management (Japan) Limited, Invesco Hong Kong Limited, Invesco Senior Secured Management, Inc., Invesco Canada Ltd. and Invesco PowerShares Capital Management LLC (collectively, the “Affiliated Sub-Advisers”) the Adviser, not the Fund, may pay 40% of the fees paid to the Adviser to any such Affiliated Sub-Adviser(s) that provide(s) discretionary investment management services to the Fund based on the percentage of assets allocated to such Affiliated Sub-Adviser(s).
Effective March 1, 2015, the Adviser has contractually agreed, through at least February 28, 2017, to waive advisory fees and/or reimburse expenses of all shares to the extent necessary to limit total annual fund operating expenses after fee waiver and/or expense reimbursement (excluding certain items discussed below) of Class A, Class C, Class R, Class Y, Class R5 and Class R6 shares to 1.05%, 1.80%, 1.30%, 0.80%, 0.80% and 0.80% of average daily net assets, respectively. Prior to March 1, 2015, the Adviser had contractually agreed to waive advisory fees and/or reimburse expenses of all shares to the extent necessary to limit total annual fund operating expenses after fee waiver and/or expense reimbursement (excluding certain items discussed below) of Class A, Class C, Class R, Class Y, Class R5 and Class R6 shares to 0.89%, 1.64%, 1.14%, 0.64%, 0.64% and 0.64% of average daily net assets, respectively. In determining the Adviser’s obligation to waive advisory fees and/or reimburse expenses, the following expenses are not taken into account, and could cause the total annual fund operating expenses after fee waiver and/or expense reimbursement to exceed the numbers reflected above: (1) interest; (2) taxes; (3) dividend expense on short sales; (4) extraordinary or non-routine items, including litigation expenses; and (5) expenses that the Fund has incurred but did not actually pay because of an expense offset arrangement. Unless Invesco continues the fee waiver agreement, it will terminate on February 28, 2017. The fee waiver agreement cannot be terminated during its term.
Further, the Adviser has contractually agreed, through at least June 30, 2017, to waive the advisory fee payable by the Fund in an amount equal to 100% of the net advisory fees the Adviser receives from the affiliated money market funds on investments by the Fund of uninvested cash in such affiliated money market funds.
For the year ended October 31, 2015, the Adviser waived advisory fees of $203,512 and reimbursed class level expenses of $63,525, $21,477, $228, $16,269 and $184 of Class A, Class C, Class R, Class Y and Class R6 shares, respectively.
The Trust has entered into a master administrative services agreement with Invesco pursuant to which the Fund has agreed to pay Invesco for certain administrative costs incurred in providing accounting services to the Fund. For the year ended October 31, 2015, expenses incurred under the agreement are shown in the Statement of Operations as Administrative services fees.
The Trust has entered into a transfer agency and service agreement with Invesco Investment Services, Inc. (“IIS”) pursuant to which the Fund has agreed to pay IIS a fee for providing transfer agency and shareholder services to the Fund and reimburse IIS for certain expenses incurred by IIS in the course of providing such services. IIS may make payments to intermediaries that provide omnibus account services, sub-accounting services and/or networking services. All fees payable by IIS to intermediaries that provide omnibus account services or sub-accounting are charged back to the Fund, subject to certain limitations approved by the Trust’s Board of Trustees. For the year ended October 31, 2015, expenses incurred under the agreement are shown in the Statement of Operations as Transfer agent fees.
29 Invesco Premium Income Fund
The Trust has entered into master distribution agreements with Invesco Distributors, Inc. (“IDI”) to serve as the distributor for the Class A, Class C, Class R, Class Y, Class R5 and Class R6 shares of the Fund. The Trust has adopted plans pursuant to Rule 12b-1 under the 1940 Act with respect to the Fund’s Class A, Class C and Class R shares (collectively the “Plans”). The Fund, pursuant to the Plans, pays IDI compensation at the annual rate of 0.25% of the Fund’s average daily net assets of Class A shares, 1.00% of the average daily net assets of Class C shares and 0.50% of the average daily net assets of Class R shares. Of the Plan payments, up to 0.25% of the average daily net assets of each class of shares may be paid to furnish continuing personal shareholder services to customers who purchase and own shares of such classes. Any amounts not paid as a service fee under the Plans would constitute an asset-based sales charge. Rules of the Financial Industry Regulatory Authority (“FINRA”) impose a cap on the total sales charges, including asset-based sales charges, that may be paid by any class of shares of the Fund. For the year ended October 31, 2015, expenses incurred under the Plans are shown in the Statement of Operations as Distribution fees.
Front-end sales commissions and CDSC (collectively, the “sales charges”) are not recorded as expenses of the Fund. Front-end sales commissions are deducted from proceeds from the sales of Fund shares prior to investment in Class A shares of the Fund. CDSC are deducted from redemption proceeds prior to remittance to the shareholder. During the year ended October 31, 2015, IDI advised the Fund that IDI retained $20,346 in front-end sales commissions from the sale of Class A shares and $1,954 and $1,865 from Class A and Class C shares, respectively, for CDSC imposed upon redemptions by shareholders.
Certain officers and trustees of the Trust are officers and directors of the Adviser, IIS and/or IDI.
NOTE 3—Additional Valuation Information
GAAP defines fair value as the price that would be received to sell an asset or paid to transfer a liability in an orderly transaction between market participants at the measurement date, under current market conditions. GAAP establishes a hierarchy that prioritizes the inputs to valuation methods, giving the highest priority to readily available unadjusted quoted prices in an active market for identical assets (Level 1) and the lowest priority to significant unobservable inputs (Level 3), generally when market prices are not readily available or are unreliable. Based on the valuation inputs, the securities or other investments are tiered into one of three levels. Changes in valuation methods may result in transfers in or out of an investment’s assigned level:
| | Level 1 — | Prices are determined using quoted prices in an active market for identical assets. |
| | Level 2 — | Prices are determined using other significant observable inputs. Observable inputs are inputs that other market participants may use in pricing a security. These may include quoted prices for similar securities, interest rates, prepayment speeds, credit risk, yield curves, loss severities, default rates, discount rates, volatilities and others. |
| | Level 3 — | Prices are determined using significant unobservable inputs. In situations where quoted prices or observable inputs are unavailable (for example, when there is little or no market activity for an investment at the end of the period), unobservable inputs may be used. Unobservable inputs reflect the Fund’s own assumptions about the factors market participants would use in determining fair value of the securities or instruments and would be based on the best available information. |
The following is a summary of the tiered valuation input levels, as of October 31, 2015. The level assigned to the securities valuations may not be an indication of the risk or liquidity associated with investing in those securities. Because of the inherent uncertainties of valuation, the values reflected in the financial statements may materially differ from the value received upon actual sale of those investments.
| | | | | | | | | | | | | | | | |
| | | Level 1 | | | Level 2 | | | Level 3 | | | Total | |
Equity Securities | | $ | 61,692,895 | | | $ | 122,550 | | | $ | — | | | $ | 61,815,445 | |
Exchange Traded Notes | | | 6,898,960 | | | | — | | | | — | | | | 6,898,960 | |
U.S. Treasury Securities | | | — | | | | 9,508,309 | | | | — | | | | 9,508,309 | |
Corporate Debt Securities | | | — | | | | 51,432,841 | | | | — | | | | 51,432,841 | |
Foreign Debt Securities | | | — | | | | 1,832,958 | | | | — | | | | 1,832,958 | |
Foreign Sovereign Debt Securities | | | — | | | | 8,885,993 | | | | — | | | | 8,885,993 | |
| | | | 68,591,855 | | | | 71,782,651 | | | | — | | | | 140,374,506 | |
Forward Foreign Currency Contracts* | | | — | | | | 9,095 | | | | — | | | | 9,095 | |
Futures Contracts* | | | 683,137 | | | | — | | | | — | | | | 683,137 | |
Swap Agreements* | | | — | | | | 17,616 | | | | — | | | | 17,616 | |
Total Investments | | $ | 69,274,992 | | | $ | 71,809,362 | | | $ | — | | | $ | 141,084,354 | |
| * | Unrealized appreciation. |
30 Invesco Premium Income Fund
NOTE 4—Derivative Investments
Value of Derivative Investments at Period-End
The table below summarizes the value of the Fund’s derivative investments, detailed by primary risk exposure, held as of October 31, 2015:
| | | | | | | | |
| | | Value | |
| Risk Exposure/Derivative Type | | Assets | | | Liabilities | |
Credit risk: | | | | | | | | |
Swap agreements(a) | | $ | 17,616 | | | $ | (— | ) |
Currency risk: | | | | | | | | |
Forward foreign currency contracts(b) | | | 16,900 | | | | (7,805 | ) |
Equity risk: | | | | | | | | |
Futures contracts(c) | | | 591,277 | | | | (30,701 | ) |
Interest rate risk: | | | | | | | | |
Futures contracts(c) | | | 214,615 | | | | (92,054 | ) |
Total | | $ | 840,408 | | | $ | (130,560 | ) |
| (a) | Includes cumulative appreciation of centrally cleared swap agreements. Only current day’s variation margin receivable is reported within the Statement of Assets and Liabilities. |
| (b) | Values are disclosed on the Statement of Assets and Liabilities under the captions Unrealized appreciation on forward foreign currency contracts outstanding and Unrealized depreciation on forward foreign currency contracts outstanding. |
| (c) | Includes cumulative appreciation (depreciation) of futures contracts. Only current day’s variation margin receivable (payable) is reported within the Statement of Assets and Liabilities. |
Effect of Derivative Investments for the year ended October 31, 2015
The table below summarizes the gains (losses) on derivative investments, detailed by primary risk exposure, recognized in earnings during the period:
| | | | | | | | | | | | |
| | | Location of Gain (Loss) on
Statement of Operations | |
| | | Forward
Foreign Currency
Contracts | | | Futures
Contracts | | | Swap
Agreements | |
Realized Gain (Loss): | | | | | | | | | | | | |
Credit risk | | $ | — | | | $ | — | | | $ | 82,098 | |
Currency risk | | | 146,653 | | | | — | | | | — | |
Equity risk | | | — | | | | (829,957 | ) | | | — | |
Interest rate risk | | | — | | | | 374,490 | | | | — | |
Change in Net Unrealized Appreciation (Depreciation): | | | | | | | | | | | | |
Credit risk | | | — | | | | — | | | | 58,460 | |
Currency risk | | | (46,222 | ) | | | — | | | | — | |
Equity risk | | | — | | | | 796,349 | | | | — | |
Interest rate risk | | | — | | | | (132,974 | ) | | | — | |
Total | | $ | 100,431 | | | $ | 207,908 | | | $ | 140,558 | |
The table below summarizes the average notional value of forward foreign currency contracts, futures contracts and swap agreements outstanding during the period.
| | | | | | | | | | | | |
| | | Forward
Foreign Currency
Contracts | | | Futures
Contracts | | | Swap
Agreements | |
Average notional value | | $ | 2,151,002 | | | $ | 25,530,964 | | | $ | 2,075,339 | |
| | | | | | | | | | | | | | | | | | | | | | | | | | |
| Open Forward Foreign Currency Contracts | |
Settlement
Date | | Counterparty | | Contract to | | | Notional
Value | | | Unrealized
Appreciation
(Depreciation) | |
| | | Deliver | | | Receive | | | |
12/04/15 | | Deutsche Bank Securities Inc. | | | EUR | | | | 589,444 | | | | USD | | | | 665,465 | | | $ | 648,565 | | | $ | 16,900 | |
12/04/15 | | Goldman Sachs International | | | GBP | | | | 753,808 | | | | USD | | | | 1,155,692 | | | | 1,161,968 | | | | (6,276 | ) |
12/04/15 | | Deutsche Bank Securities Inc. | | | USD | | | | 101,830 | | | | EUR | | | | 91,158 | | | | 100,301 | | | | (1,529 | ) |
Total Open Forward Foreign Currency Contracts — Currency Risk | | | | | | | | | | | | | | | | | | | $ | 9,095 | |
Currency Abbreviations:
| | |
| EUR | | – Euro |
| GBP | | – British Pound Sterling |
| USD | | – U.S. Dollar |
31 Invesco Premium Income Fund
| | | | | | | | | | | | | | | | | | | | |
| Open Futures Contracts | |
| Futures Contracts | | Type of
Contract | | | Number of
Contracts | | | Expiration Month | | | Notional
Value | | | Unrealized Appreciation
(Depreciation) | |
Australian 10 Year Bonds | | | Long | | | | 62 | | | | December-2015 | | | $ | 5,719,364 | | | $ | 40,331 | |
Canada 10 Year Bonds | | | Long | | | | 62 | | | | December-2015 | | | | 6,661,314 | | | | (92,054 | ) |
Euro Bond | | | Long | | | | 36 | | | | December-2015 | | | | 6,223,818 | | | | 88,764 | |
Japanese 10 Year Mini Bonds | | | Long | | | | 50 | | | | December-2015 | | | | 6,154,802 | | | | 34,447 | |
Long Gilt | | | Long | | | | 37 | | | | December-2015 | | | | 6,717,237 | | | | 6,840 | |
U.S. Treasury Long Bonds | | | Long | | | | 25 | | | | December-2015 | | | | 3,910,938 | | | | 44,233 | |
Subtotal — Interest Rate Risk | | | | | | | | | | | | | | | | | | $ | 122,561 | |
Dow Jones Euro STOXX 50 Index | | | Short | | | | 7 | | | | December-2015 | | | $ | (261,960 | ) | | $ | (12,799 | ) |
E-Mini S&P 500 Index | | | Long | | | | 19 | | | | December-2015 | | | | 1,970,015 | | | | 157,852 | |
FTSE 100 Index | | | Long | | | | 13 | | | | December-2015 | | | | 1,266,743 | | | | 47,003 | |
Hang Seng Index | | | Long | | | | 8 | | | | November-2015 | | | | 1,170,696 | | | | (17,902 | ) |
Russell 2000 Mini Index | | | Long | | | | 37 | | | | December-2015 | | | | 4,285,710 | | | | 168,090 | |
Tokyo Stock Price Index | | | Long | | | | 20 | | | | December-2015 | | | | 2,583,078 | | | | 218,332 | |
Subtotal — Equity Risk | | | | | | | | | | | | | | | | | | | 560,576 | |
Total Futures Contracts | | | | | | | | | | | | | | | | | | $ | 683,137 | |
| | | | | | | | | | | | | | | | | | | | | | | | | | | | | | |
| Total Open Centrally Cleared Credit Default Swap Agreements — Credit Risk | |
| Counterparty/Clearinghouse | | Reference Entity | | Buy/Sell Protection | | | (Pay)/Receive Fixed Rate | | | Expiration
Date | | | Implied
Credit
Spread(a) | | | Notional Value | | | Upfront
Payments | | | Unrealized Appreciation | |
Credit Suisse Securities (USA) LLC/CME | | Markit CDX North America High Yield Index | | | Sell | | | | 5.00 | % | | | 12/20/19 | | | | 3.09 | % | | $ | 1,346,360 | | | $ | 81,289 | | | $ | 17,616 | |
Abbreviations:
| | |
| CME | | – Chicago Mercantile Exchange |
| (a) | Implied credit spreads represent the current level as of October 31, 2015 at which protection could be bought or sold given the terms of the existing credit default swap contract and serve as an indicator of the current status of the payment/performance risk of the credit default swap contract. An implied credit spread that has widened or increased since entry into the initial contract may indicate a deteriorating credit profile and increased risk of default for the reference entity. A declining or narrowing spread may indicate an improving credit profile or decreased risk of default for the reference entity. Alternatively, credit spreads may increase or decrease reflecting the general tolerance for risk in the credit markets generally. |
Offsetting Assets and Liabilities
Accounting Standards Update (“ASU”) No. 2011-11, Disclosures about Offsetting Assets and Liabilities, which was subsequently clarified in Financial Accounting Standards Board ASU 2013-01 “Clarifying the Scope of Disclosures about Offsetting Assets and Liabilities” is intended to enhance disclosures about financial instruments and derivative instruments that are subject to offsetting arrangements on the Statement of Assets and Liabilities and to enable investors to better understand the effect of those arrangements on the Fund’s financial position. In order for an arrangement to be eligible for netting, the Fund must have a basis to conclude that such netting arrangements are legally enforceable. The Fund enters into netting agreements and collateral agreements in an attempt to reduce the Fund’s Counterparty credit risk by providing for a single net settlement with a Counterparty of all financial transactions covered by the agreement in an event of default as defined under such agreement.
The following tables present derivative instruments that are either subject to an enforceable netting agreement or offset by collateral arrangements as of October 31, 2015.
| | | | | | | | | | | | | | | | | | | | |
| | | Gross amounts
of Recognized
Assets | | | Gross Amounts Not Offset in the
Statement of Assets and Liabilities | | | | |
| | | | Financial
Instruments | | | Collateral Received | | | Net
Amount | |
| Counterparty | | | | Non-Cash | | | Cash | | |
Credit Suisse Securities (USA) LLC/CME(a) | | $ | 98,905 | | | $ | — | | | $ | — | | | $ | — | | | $ | 98,905 | |
Deutsche Bank Securities Inc.(b) | | | 16,900 | | | | (1,529 | ) | | | — | | | | — | | | | 15,371 | |
Total | | $ | 115,805 | | | $ | (1,529 | ) | | $ | — | | | $ | — | | | $ | 114,276 | |
| | | | | |
| | | | | | | | | | | | | | | | | | | | |
| | | Gross amounts
of Recognized
Liabilities | | | Gross Amounts Not Offset in the
Statement of Assets and Liabilities | | | | |
| | | | Financial
Instruments | | | Collateral Pledged | | | Net
Amount | |
| Counterparty | | | | Non-Cash | | | Cash | | |
Deutsche Bank Securities Inc.(b) | | $ | 1,529 | | | $ | (1,529 | ) | | $ | — | | | $ | — | | | $ | — | |
Goldman Sachs International(b) | | | 6,276 | | | | — | | | | — | | | | — | | | | 6,276 | |
Total | | $ | 7,805 | | | $ | (1,529 | ) | | $ | — | | | $ | — | | | $ | 6,276 | |
| (a) | Swap agreements — centrally cleared Counterparty. Includes cumulative appreciation (depreciation). |
| (b) | Forward foreign currency contracts Counterparty. |
32 Invesco Premium Income Fund
NOTE 5—Expense Offset Arrangement(s)
The expense offset arrangement is comprised of transfer agency credits which result from balances in demand deposit accounts used by the transfer agent for clearing shareholder transactions. For the year ended October 31, 2015, the Fund received credits from this arrangement, which resulted in the reduction of the Fund’s total expenses of $168.
NOTE 6—Security Transactions with Affiliated Funds
The Fund is permitted to purchase or sell securities from or to certain other Invesco Funds under specified conditions outlined in procedures adopted by the Board of Trustees of the Trust. The procedures have been designed to ensure that any purchase or sale of securities by the Fund from or to another fund or portfolio that is or could be considered an affiliate by virtue of having a common investment adviser (or affiliated investment advisers), common Trustees and/or common officers complies with Rule 17a-7 of the 1940 Act. Further, as defined under the procedures, each transaction is effected at the current market price. Pursuant to these procedures, for the year ended October 31, 2015, the Fund engaged in securities securities sales of $234,253, which resulted in net realized gains of $1,211.
NOTE 7—Trustees’ and Officers’ Fees and Benefits
Trustees’ and Officers’ Fees and Benefits include amounts accrued by the Fund to pay remuneration to certain Trustees and Officers of the Fund. Trustees have the option to defer compensation payable by the Fund, and Trustees’ and Officers’ Fees and Benefits also include amounts accrued by the Fund to fund such deferred compensation amounts. Those Trustees who defer compensation have the option to select various Invesco Funds in which their deferral accounts shall be deemed to be invested. Finally, certain current Trustees were eligible to participate in a retirement plan that provided for benefits to be paid upon retirement to Trustees over a period of time based on the number of years of service. The Fund may have certain former Trustees who also participate in a retirement plan and receive benefits under such plan. Trustees’ and Officers’ Fees and Benefits include amounts accrued by the Fund to fund such retirement benefits. Obligations under the deferred compensation and retirement plans represent unsecured claims against the general assets of the Fund.
NOTE 8—Cash Balances
The Fund is permitted to temporarily carry a negative or overdrawn balance in its account with State Street Bank and Trust Company, the custodian bank. Such balances, if any at period end, are shown in the Statement of Assets and Liabilities under the payable caption Amount due custodian. To compensate the custodian bank for such overdrafts, the overdrawn Fund may either (1) leave funds as a compensating balance in the account so the custodian bank can be compensated by earning the additional interest; or (2) compensate by paying the custodian bank at a rate agreed upon by the custodian bank and Invesco, not to exceed the contractually agreed upon rate.
NOTE 9—Distributions to Shareholders and Tax Components of Net Assets
Tax Character of Distributions to Shareholders Paid During the Fiscal Years Ended October 31, 2015 and 2014:
| | | | | | | | |
| | | 2015 | | | 2014 | |
Ordinary income | | $ | 6,574,274 | | | $ | 7,552,673 | |
Tax Components of Net Assets at Period-End:
| | | | |
| | | 2015 | |
Undistributed ordinary income | | $ | 53,689 | |
Net unrealized appreciation — investments | | | 2,020,274 | |
Net unrealized appreciation — other investments | | | 192,927 | |
Temporary book/tax differences | | | (24,096 | ) |
Capital loss carryforward | | | (9,252,161 | ) |
Shares of beneficial interest | | | 157,095,933 | |
Total net assets | | $ | 150,086,566 | |
The difference between book-basis and tax-basis unrealized appreciation (depreciation) is due to differences in the timing of recognition of gain and losses on investments for tax and book purposes. The Fund’s net unrealized appreciation difference is attributable primarily to wash sales and bond premiums.
The temporary book/tax differences are a result of timing differences between book and tax recognition of income and/or expenses. The Fund’s temporary book/tax differences are the result of the trustee deferral of compensation and retirement plan benefits.
Capital loss carryforward is calculated and reported as of a specific date. Results of transactions and other activity after that date may affect the amount of capital loss carryforward actually available for the Fund to utilize. Capital losses generated in years beginning after December 22, 2010 can be carried forward for an unlimited period, whereas previous losses expire in eight tax years. Capital losses with an expiration period may not be used to offset capital gains until all net capital losses without an expiration date have been utilized. Capital loss carryforwards with no expiration date will retain their character as either short-term or long-term capital losses instead of as short-term capital losses as under prior law. The ability to utilize capital loss carryforwards in the future may be limited under the Internal Revenue Code and related regulations based on the results of future transactions.
33 Invesco Premium Income Fund
The Fund has a capital loss carryforward as of October 31, 2015, which expires as follows:
| | | | | | | | | | | | |
| Capital Loss Carryforward* | |
| Expiration | | Short-Term | | | Long-Term | | | Total | |
Not subject to expiration | | $ | 7,113,589 | | | $ | 2,138,572 | | | $ | 9,252,161 | |
| * | Capital loss carryforward as of the date listed above is reduced for limitations, if any, to the extent required by the Internal Revenue Code and may be further limited depending upon a variety of factors, including the realization of net unrealized gains or losses as of the date of any reorganization. |
NOTE 10—Investment Securities
The aggregate amount of investment securities (other than short-term securities, U.S. Treasury obligations and money market funds, if any) purchased and sold by the Fund during the year ended October 31, 2015 was $166,152,389 and $145,945,033, respectively. During the same period, purchases and sales of U.S. Treasury obligations were $4,752,391 and $4,102,567, respectively. Cost of investments on a tax basis includes the adjustments for financial reporting purposes as of the most recently completed federal income tax reporting period-end.
| | | | |
| Unrealized Appreciation (Depreciation) of Investment Securities on a Tax Basis | |
Aggregate unrealized appreciation of investment securities | | $ | 4,228,709 | |
Aggregate unrealized (depreciation) of investment securities | | | (2,208,435 | ) |
Net unrealized appreciation of investment securities | | $ | 2,020,274 | |
Cost of investments for tax purposes is $138,354,232.
NOTE 11—Reclassification of Permanent Differences
Primarily as a result of differing book/tax treatment of swap income, foreign currency transactions and bond premium amortization, on October 31, 2015, undistributed net investment income was increased by $302,168 and undistributed net realized gain (loss) was decreased by $302,168. This reclassification had no effect on the net assets of the Fund.
NOTE 12—Share Information
| | | | | | | | | | | | | | | | |
| | | Summary of Share Activity | |
| | | Years ended October 31, | |
| | | 2015(a) | | | 2014 | |
| | | Shares | | | Amount | | | Shares | | | Amount | |
Sold: | | | | | | | | | | | | | | | | |
Class A | | | 3,054,961 | | | $ | 31,571,397 | | | | 1,674,041 | | | $ | 17,271,491 | |
Class C | | | 665,576 | | | | 6,862,470 | | | | 395,527 | | | | 4,043,695 | |
Class R | | | 22,519 | | | | 227,585 | | | | 8,385 | | | | 85,861 | |
Class Y | | | 1,777,827 | | | | 18,357,253 | | | | 999,906 | | | | 10,319,807 | |
Class R6 | | | 1,558,502 | | | | 16,063,482 | | | | 1,318,479 | | | | 13,484,561 | |
| | | | |
Issued as reinvestment of dividends: | | | | | | | | | | | | | | | | |
Class A | | | 149,450 | | | | 1,530,255 | | | | 121,004 | | | | 1,228,961 | |
Class C | | | 42,814 | | | | 438,178 | | | | 44,317 | | | | 449,554 | |
Class R | | | 705 | | | | 7,215 | | | | 395 | | | | 4,044 | |
Class Y | | | 37,371 | | | | 383,770 | | | | 27,683 | | | | 281,703 | |
Class R6 | | | 292,705 | | | | 2,998,897 | | | | 473,502 | | | | 4,760,854 | |
| | | | |
Reacquired: | | | | | | | | | | | | | | | | |
Class A | | | (2,049,651 | ) | | | (21,048,416 | ) | | | (1,769,874 | ) | | | (17,939,517 | ) |
Class C | | | (442,432 | ) | | | (4,522,475 | ) | | | (660,296 | ) | | | (6,678,298 | ) |
Class R | | | (3,273 | ) | | | (33,565 | ) | | | (223 | ) | | | (2,336 | ) |
Class Y | | | (1,232,469 | ) | | | (12,628,929 | ) | | | (1,116,824 | ) | | | (11,522,459 | ) |
Class R6 | | | (78,709 | ) | | | (809,277 | ) | | | (13,919,440 | ) | | | (141,071,064 | ) |
Net increase (decrease) in share activity | | | 3,795,896 | | | $ | 39,397,840 | | | | (12,403,418 | ) | | $ | (125,283,143 | ) |
| (a) | There are entities that are record owners of more than 5% of the outstanding shares of the Fund and in the aggregate own 30% of the outstanding shares of the Fund. IDI has an agreement with these entities to sell Fund shares. The Fund, Invesco and/or Invesco affiliates may make payments to these entities, which are considered to be related to the Fund, for providing services to the Fund, Invesco and/or Invesco affiliates including but not limited to services such as securities brokerage, distribution, third party record keeping and account servicing. The Fund has no knowledge as to whether all or any portion of the shares owned of record by these entities are also owned beneficially. |
| | In addition, 45% of the outstanding shares of the Fund are owned by affiliated mutual funds. Affiliated mutual funds are other mutual funds that are also advised by Invesco. |
34 Invesco Premium Income Fund
NOTE 13—Financial Highlights
The following schedule presents financial highlights for a share of the Fund outstanding throughout the periods indicated.
| | | | | | | | | | | | | | | | | | | | | | | | | | | | | | | | | | | | | | | | | | | | | | | | | | | | | | | | |
| | | Net asset
value,
beginning
of period | | | Net
investment
income(a) | | | Net gains
(losses)
on securities
(both
realized and
unrealized) | | | Total from
investment
operations | | | Dividends
from net
investment
income | | | Distributions
from net
realized
gains | | | Total
distributions | | | Net asset
value, end
of period | | | Total
return(b) | | | Net assets,
end of period
(000’s omitted) | | | Ratio of
expenses
to average
net assets
with fee waivers
and/or expenses
absorbed | | | Ratio of
expenses
to average net
assets without
fee waivers
and/or expenses
absorbed | | | Ratio of net
investment
income
to average
net assets | | | Portfolio
turnover(c) | |
Class A | |
Year ended 10/31/15 | | $ | 10.37 | | | $ | 0.46 | | | $ | (0.25 | ) | | $ | 0.21 | | | $ | (0.49 | ) | | $ | — | | | $ | (0.49 | ) | | $ | 10.09 | | | | 2.02 | % | | $ | 52,613 | | | | 0.99 | %(d) | | | 1.27 | %(d) | | | 4.52 | %(d) | | | 120 | % |
Year ended 10/31/14 | | | 10.04 | | | | 0.48 | | | | 0.37 | | | | 0.85 | | | | (0.52 | ) | | | — | | | | (0.52 | ) | | | 10.37 | | | | 8.66 | | | | 42,104 | | | | 0.88 | | | | 1.28 | | | | 4.69 | | | | 89 | |
Year ended 10/31/13 | | | 10.83 | | | | 0.50 | | | | (0.58 | ) | | | (0.08 | ) | | | (0.55 | ) | | | (0.16 | ) | | | (0.71 | ) | | | 10.04 | | | | (0.83 | ) | | | 40,515 | | | | 0.88 | | | | 1.22 | | | | 4.83 | | | | 86 | |
Year ended 10/31/12(e) | | | 10.03 | | | | 0.43 | | | | 0.81 | | | | 1.24 | | | | (0.44 | ) | | | — | | | | (0.44 | ) | | | 10.83 | | | | 12.64 | | | | 24,388 | | | | 0.88 | (f) | | | 1.18 | (f) | | | 4.54 | (f) | | | 79 | |
Class C | |
Year ended 10/31/15 | | | 10.36 | | | | 0.39 | | | | (0.26 | ) | | | 0.13 | | | | (0.41 | ) | | | — | | | | (0.41 | ) | | | 10.08 | | | | 1.26 | | | | 17,133 | | | | 1.74 | (d) | | | 2.02 | (d) | | | 3.77 | (d) | | | 120 | |
Year ended 10/31/14 | | | 10.03 | | | | 0.40 | | | | 0.37 | | | | 0.77 | | | | (0.44 | ) | | | — | | | | (0.44 | ) | | | 10.36 | | | | 7.85 | | | | 14,854 | | | | 1.63 | | | | 2.03 | | | | 3.94 | | | | 89 | |
Year ended 10/31/13 | | | 10.82 | | | | 0.42 | | | | (0.58 | ) | | | (0.16 | ) | | | (0.47 | ) | | | (0.16 | ) | | | (0.63 | ) | | | 10.03 | | | | (1.58 | ) | | | 16,592 | | | | 1.63 | | | | 1.97 | | | | 4.08 | | | | 86 | |
Year ended 10/31/12(e) | | | 10.03 | | | | 0.36 | | | | 0.81 | | | | 1.17 | | | | (0.38 | ) | | | — | | | | (0.38 | ) | | | 10.82 | | | | 11.91 | | | | 10,469 | | | | 1.63 | (f) | | | 1.93 | (f) | | | 3.79 | (f) | | | 79 | |
Class R | |
Year ended 10/31/15 | | | 10.36 | | | | 0.44 | | | | (0.26 | ) | | | 0.18 | | | | (0.46 | ) | | | — | | | | (0.46 | ) | | | 10.08 | | | | 1.77 | | | | 339 | | | | 1.24 | (d) | | | 1.52 | (d) | | | 4.27 | (d) | | | 120 | |
Year ended 10/31/14 | | | 10.03 | | | | 0.46 | | | | 0.36 | | | | 0.82 | | | | (0.49 | ) | | | — | | | | (0.49 | ) | | | 10.36 | | | | 8.39 | | | | 141 | | | | 1.13 | | | | 1.53 | | | | 4.44 | | | | 89 | |
Year ended 10/31/13 | | | 10.83 | | | | 0.47 | | | | (0.59 | ) | | | (0.12 | ) | | | (0.52 | ) | | | (0.16 | ) | | | (0.68 | ) | | | 10.03 | | | | (1.17 | ) | | | 51 | | | | 1.13 | | | | 1.47 | | | | 4.58 | | | | 86 | |
Year ended 10/31/12(e) | | | 10.03 | | | | 0.40 | | | | 0.82 | | | | 1.22 | | | | (0.42 | ) | | | — | | | | (0.42 | ) | | | 10.83 | | | | 12.43 | | | | 50 | | | | 1.13 | (f) | | | 1.43 | (f) | | | 4.29 | (f) | | | 79 | |
Class Y | |
Year ended 10/31/15 | | | 10.37 | | | | 0.49 | | | | (0.26 | ) | | | 0.23 | | | | (0.51 | ) | | | — | | | | (0.51 | ) | | | 10.09 | | | | 2.28 | | | | 12,424 | | | | 0.74 | (d) | | | 1.02 | (d) | | | 4.77 | (d) | | | 120 | |
Year ended 10/31/14 | | | 10.05 | | | | 0.51 | | | | 0.35 | | | | 0.86 | | | | (0.54 | ) | | | — | | | | (0.54 | ) | | | 10.37 | | | | 8.82 | | | | 6,725 | | | | 0.63 | | | | 1.03 | | | | 4.94 | | | | 89 | |
Year ended 10/31/13 | | | 10.84 | | | | 0.53 | | | | (0.58 | ) | | | (0.05 | ) | | | (0.58 | ) | | | (0.16 | ) | | | (0.74 | ) | | | 10.05 | | | | (0.57 | ) | | | 7,409 | | | | 0.63 | | | | 0.97 | | | | 5.08 | | | | 86 | |
Year ended 10/31/12(e) | | | 10.03 | | | | 0.45 | | | | 0.82 | | | | 1.27 | | | | (0.46 | ) | | | — | | | | (0.46 | ) | | | 10.84 | | | | 12.96 | | | | 4,482 | | | | 0.63 | (f) | | | 0.93 | (f) | | | 4.79 | (f) | | | 79 | |
Class R5 | |
Year ended 10/31/15 | | | 10.37 | | | | 0.49 | | | | (0.26 | ) | | | 0.23 | | | | (0.51 | ) | | | — | | | | (0.51 | ) | | | 10.09 | | | | 2.28 | | | | 10 | | | | 0.74 | (d) | | | 0.89 | (d) | | | 4.77 | (d) | | | 120 | |
Year ended 10/31/14 | | | 10.05 | | | | 0.50 | | | | 0.36 | | | | 0.86 | | | | (0.54 | ) | | | — | | | | (0.54 | ) | | | 10.37 | | | | 8.82 | | | | 10 | | | | 0.63 | | | | 0.90 | | | | 4.94 | | | | 89 | |
Year ended 10/31/13 | | | 10.84 | | | | 0.54 | | | | (0.59 | ) | | | (0.05 | ) | | | (0.58 | ) | | | (0.16 | ) | | | (0.74 | ) | | | 10.05 | | | | (0.57 | ) | | | 10 | | | | 0.63 | | | | 0.90 | | | | 5.08 | | | | 86 | |
Year ended 10/31/12(e) | | | 10.03 | | | | 0.44 | | | | 0.83 | | | | 1.27 | | | | (0.46 | ) | | | — | | | | (0.46 | ) | | | 10.84 | | | | 12.96 | | | | 766 | | | | 0.63 | (f) | | | 0.85 | (f) | | | 4.79 | (f) | | | 79 | |
Class R6 | |
Year ended 10/31/15 | | | 10.37 | | | | 0.49 | | | | (0.26 | ) | | | 0.23 | | | | (0.51 | ) | | | — | | | | (0.51 | ) | | | 10.09 | | | | 2.28 | | | | 67,568 | | | | 0.74 | (d) | | | 0.89 | (d) | | | 4.77 | (d) | | | 120 | |
Year ended 10/31/14 | | | 10.04 | | | | 0.50 | | | | 0.37 | | | | 0.87 | | | | (0.54 | ) | | | — | | | | (0.54 | ) | | | 10.37 | | | | 8.93 | | | | 51,057 | | | | 0.63 | | | | 0.90 | | | | 4.94 | | | | 89 | |
Year ended 10/31/13 | | | 10.84 | | | | 0.53 | | | | (0.59 | ) | | | (0.06 | ) | | | (0.58 | ) | | | (0.16 | ) | | | (0.74 | ) | | | 10.04 | | | | (0.67 | ) | | | 171,140 | | | | 0.63 | | | | 0.85 | | | | 5.08 | | | | 86 | |
Year ended 10/31/12(e) | | | 10.75 | | | | 0.05 | | | | 0.09 | | | | 0.14 | | | | (0.05 | ) | | | — | | | | (0.05 | ) | | | 10.84 | | | | 1.31 | | | | 138,779 | | | | 0.63 | (f) | | | 0.82 | (f) | | | 4.79 | (f) | | | 79 | |
| (a) | Calculated using average shares outstanding. |
| (b) | Includes adjustments in accordance with accounting principles generally accepted in the United States of America and as such, the net asset value for financial reporting purposes and the returns based upon those net asset values may differ from the net asset value and returns for shareholder transactions. Does not include sales charges and is not annualized for periods less than one year, if applicable. |
| (c) | Portfolio turnover is calculated at the fund level and is not annualized for periods less than one year, if applicable. |
| (d) | Ratios are based on average daily net assets (000’s omitted) of $48,282, $16,323, $173, $12,365, $10 and $60,262 for Class A, Class C, Class R, Class Y, Class R5 and Class R6 shares, respectively. |
| (e) | Commencement date of December 14, 2011 for Class A, Class C, Class R, Class Y and Class R5 shares and September 24, 2012 for Class R6 shares. |
35 Invesco Premium Income Fund
Report of Independent Registered Public Accounting Firm
To the Board of Trustees of AIM Investment Funds (Invesco Investment Funds)
and Shareholders of Invesco Premium Income Fund:
In our opinion, the accompanying statement of assets and liabilities, including the schedule of investments, and the related statements of operations and of changes in net assets and the financial highlights present fairly, in all material respects, the financial position of Invesco Premium Income Fund (one of the funds constituting AIM Investment Funds (Invesco Investment Funds), hereafter referred to as the “Fund”) at October 31, 2015, the results of its operations for the year then ended, the changes in its net assets for each of the two years in the period then ended and the financial highlights for each of the three years in the period then ended and for the period December 14, 2011 (commencement of operations) through October 31, 2012, in conformity with accounting principles generally accepted in the United States of America. These financial statements and financial highlights (hereafter referred to as “financial statements”) are the responsibility of the Fund’s management. Our responsibility is to express an opinion on these financial statements based on our audits. We conducted our audits of these financial statements in accordance with the standards of the Public Company Accounting Oversight Board (United States). Those standards require that we plan and perform the audit to obtain reasonable assurance about whether the financial statements are free of material misstatement. An audit includes examining, on a test basis, evidence supporting the amounts and disclosures in the financial statements, assessing the accounting principles used and significant estimates made by management, and evaluating the overall financial statement presentation. We believe that our audits, which included confirmation of securities at October 31, 2015 by correspondence with the custodian and brokers, and the application of alternative auditing procedures where confirmations of security purchases have not been received, provide a reasonable basis for our opinion.
PRICEWATERHOUSECOOPERS LLP
December 23, 2015
Houston, Texas
36 Invesco Premium Income Fund
Calculating your ongoing Fund expenses
Example
As a shareholder of the Fund, you incur two types of costs: (1) transaction costs, which may include sales charges (loads) on purchase payments or contingent deferred sales charges on redemptions, if any; and (2) ongoing costs, including management fees, distribution and/or service (12b-1) fees, and other Fund expenses. This example is intended to help you understand your ongoing costs (in dollars) of investing in the Fund and to compare these costs with ongoing costs of investing in other mutual funds. The example is based on an investment of $1,000 invested at the beginning of the period and held for the entire period May 1, 2015 through October 31, 2015.
Actual expenses
The table below provides information about actual account values and actual expenses. You may use the information in this table, together with the amount you invested, to estimate the expenses that you paid over the period. Simply divide your account value by $1,000 (for example, an $8,600 account value divided by $1,000 = 8.6), then multiply the result by the number in the table under the heading entitled “Actual Expenses Paid During Period” to estimate the expenses you paid on your account during this period.
Hypothetical example for comparison purposes
The table below also provides information about hypothetical account values and hypothetical expenses based on the Fund’s actual expense ratio and an assumed rate of return of 5% per year before expenses, which is not the Fund’s actual return.
The hypothetical account values and expenses may not be used to estimate the actual ending account balance or expenses you paid for the period. You may use this information to compare the ongoing costs of investing in the Fund and other funds. To do so, compare this 5% hypothetical example with the 5% hypothetical examples that appear in the shareholder reports of the other funds.
Please note that the expenses shown in the table are meant to highlight your ongoing costs only and do not reflect any transaction costs, such as sales charges (loads) on purchase payments or contingent deferred sales charges on redemptions, if any. Therefore, the hypothetical information is useful in comparing ongoing costs only, and will not help you determine the relative total costs of owning different funds. In addition, if these transaction costs were included, your costs would have been higher.
| | | | | | | | | | | | | | | | | | | | | | | | |
| Class | | Beginning Account Value (05/01/15) | | | ACTUAL | | | HYPOTHETICAL
(5% annual return before
expenses) | | | Annualized Expense Ratio | |
| | | Ending Account Value (10/31/15)1 | | | Expenses Paid During Period2 | | | Ending Account Value (10/31/15) | | | Expenses Paid During Period2 | | |
| A | | $ | 1,000.00 | | | $ | 983.80 | | | $ | 5.20 | | | $ | 1,019.66 | | | $ | 5.30 | | | | 1.04 | % |
| C | | | 1,000.00 | | | | 980.10 | | | | 8.93 | | | | 1,016.18 | | | | 9.10 | | | | 1.79 | |
| R | | | 1,000.00 | | | | 982.60 | | | | 6.45 | | | | 1,018.70 | | | | 6.56 | | | | 1.29 | |
| Y | | | 1,000.00 | | | | 985.10 | | | | 3.95 | | | | 1,021.22 | | | | 4.02 | | | | 0.79 | |
| R5 | | | 1,000.00 | | | | 984.10 | | | | 3.95 | | | | 1,021.22 | | | | 4.02 | | | | 0.79 | |
| R6 | | | 1,000.00 | | | | 984.10 | | | | 3.95 | | | | 1,021.22 | | | | 4.02 | | | | 0.79 | |
| 1 | The actual ending account value is based on the actual total return of the Fund for the period May 1, 2015 through October 31, 2015, after actual expenses and will differ from the hypothetical ending account value which is based on the Fund’s expense ratio and a hypothetical annual return of 5% before expenses. |
| 2 | Expenses are equal to the Fund’s annualized expense ratio as indicated above multiplied by the average account value over the period, multiplied by 184/365 to reflect the most recent fiscal half year. |
37 Invesco Premium Income Fund
Approval of Investment Advisory and Sub-Advisory Contracts
The Board of Trustees (the Board) of AIM Investment Funds (Invesco Investment Funds) is required under the Investment Company Act of 1940, as amended, to approve annually the renewal of Invesco Premium Income Fund’s (the Fund) investment advisory agreements. During contract renewal meetings held on June 9-10, 2015, the Board as a whole, and the disinterested or “independent” Trustees, who comprise over 75% of the Board, voting separately, approved the continuance for the Fund of the Master Investment Advisory Agreement with Invesco Advisers, Inc. (Invesco Advisers and the investment advisory agreement) and the Master Intergroup Sub-Advisory Contract for Mutual Funds with Invesco Asset Management Deutschland GmbH, Invesco Asset Management Limited, Invesco Asset Management (Japan) Limited, Invesco Hong Kong Limited, Invesco Senior Secured Management, Inc., Invesco Canada Ltd. and Invesco PowerShares Capital Management LLC (collectively, the Affiliated Sub-Advisers and the sub-advisory contracts) for another year, effective July 1, 2015.
In evaluating the fairness and reasonableness of compensation under the Fund’s investment advisory agreement and sub-advisory contracts, the Board considered, among other things, the factors discussed below. The Board determined that continuation of the Fund’s investment advisory agreement and the sub-advisory contracts are in the best interest of the Fund and its shareholders and that the compensation payable to Invesco Advisers and the Affiliated Sub-Advisers under the agreements is fair and reasonable.
The Board’s Fund Evaluation Process
The Board’s Investments Committee has established three Sub-Committees, each of which is primarily responsible for overseeing the performance and investment management services provided by Invesco Advisers and the Affiliated Sub-Advisers to a number of the funds advised by Invesco Advisers (the Invesco Funds). The Sub-Committees meet throughout the year to review the performance of their assigned Invesco Funds, including reviewing materials prepared under the direction of the independent Senior Officer, an officer of the Invesco Funds who reports directly to the independent Trustees. Over the course of each year, the Sub-Committees meet with portfolio managers for their assigned Invesco Funds and other members of management to review the performance, investment objective(s), policies, strategies, limitations and investment risks of these funds. The Board had the benefit of reports form the Sub-Committees and Investments Committee throughout the year in considering approval of the continuance of each Invesco Fund’s investment advisory agreement and sub-advisory contracts for another year.
During the contract renewal process, the Board receives comparative performance and fee data regarding the Invesco Funds prepared by Invesco Advisers and Lipper Inc. (Lipper), an independent provider of investment company data. The Board also receives a report and this independent written evaluation from the Senior Officer. The Senior Officer’s evaluation is prepared as part of his responsibility to manage the process by which the Invesco Funds’ proposed management fees are negotiated during the annual contract renewal process to ensure they are negotiated in a manner that is at arms’ length and reasonable. In addition to meetings with Invesco Advisers and fund counsel, the independent Trustees also discuss the continuance of the investment advisory agreement and sub-advisory contracts in separate sessions with the Senior Officer and with independent legal counsel.
The Trustees recognized that the advisory fee rates for the Invesco Funds are, in many cases, the result of years of review and negotiation. The Trustees’ deliberations and conclusions in a particular year may be based in part on their deliberations and conclusions regarding these same arrangements throughout the year and in prior years. The Trustees’ review and conclusions are based on the comprehensive consideration of all information presented to them and are not the result of any single determinative factor. Moreover, one Trustee may have weighed a particular piece of information or factor differently than another Trustee.
The discussion below is a summary of the Senior Officer’s independent written evaluation with respect to the Fund’s investment advisory agreement as well as a discussion of the material factors and related conclusions that formed the basis for the Board’s approval of the Fund’s investment advisory agreement and sub-advisory contracts. Unless otherwise stated, this information is current as of June 10, 2015, and does not reflect consideration of factors that became known to the Board after that date.
Factors and Conclusions and Summary of Independent Written Fee Evaluation
| A. | Nature, Extent and Quality of Services Provided by Invesco Advisers and the Affiliated Sub-Advisers |
The Board reviewed the advisory services provided to the Fund by Invesco Advisers under the Fund’s investment advisory agreement, the performance of Invesco Advisers in providing these services, and the credentials and experience of the officers and employees of Invesco Advisers who provide these services, including the Fund’s portfolio manager or managers. The Board’s review of the qualifications of Invesco Advisers to provide advisory services included the Board’s
consideration of Invesco Advisers’ investment process oversight, independent credit analysis and investment risk management. The Board also considered non-advisory services that Invesco Advisers and its affiliates provide to the Invesco Funds such as various back office support functions, equity and fixed income trading operations, internal audit, distribution, valuation and legal and compliance.
In determining whether to continue the Fund’s investment advisory agreement, the Board considered the benefits of reapproving an existing relationship and the greater uncertainty that may be associated with entering into a new relationship. The Board concluded that the nature, extent and quality of the services provided to the Fund by Invesco Advisers are appropriate and satisfactory and consistent with the terms of the Fund’s investment advisory agreement.
The Board reviewed the services that may be provided by the Affiliated Sub-Advisers under the sub-advisory contracts and the credentials and experience of the officers and employees of the Affiliated Sub-Advisers who provide these services. The Board noted that the Affiliated Sub-Advisers have offices and personnel that are located in financial centers around the world. As a result, the Affiliated Sub-Advisers can provide research and investment analysis on the markets and economies of various countries in which the Fund may invest, make recommendations regarding securities and assist with security trades. The Board concluded that the sub-advisory contracts benefit the Fund and its shareholders by permitting Invesco Advisers to use the resources and talents of the Affiliated Sub-Advisers in managing the Fund. The Board concluded that the nature, extent and quality of the services that may be provided by the Affiliated Sub-Advisers are appropriate and satisfactory and consistent with the terms of the Fund’s sub-advisory contracts.
The Board considered Fund performance as a relevant factor in considering whether to approve the investment advisory agreement as well as the sub-advisory contracts for the Fund, as Invesco PowerShares Capital Management LLC currently manages certain assets of the Fund.
The Board noted that the Fund recently began operations and that comparative performance data for only the past three calendar years was available. The Board compared the Fund’s performance during the past three calendar years to the performance of funds in the Lipper performance universe and against the Lipper Mixed-Asset Target Allocation Conservative Funds Index. The Board noted that performance of Class A shares of the Fund was in the first quintile of its performance universe for the one year and in the fourth quintile for the three year period (the first quintile being
38 Invesco Premium Income Fund
the best performing funds and the fifth quintile being the worst performing funds). The Board noted that the Fund’s performance was above the performance of the Index for the one period and below the performance of the index for the three year periods. Invesco Advisers noted that performance benefited from duration and high yield exposures. The Trustees also reviewed more recent Fund performance and this review did not change their conclusions.
| C. | Advisory and Sub-Advisory Fees |
The Board compared the Fund’s contractual management fee rate to the contractual management fee rates of funds in the Fund’s Lipper expense group at a common asset level. The Board noted that the contractual management fee rate for Class A shares of the Fund was at the median contractual management fee rate of funds in its expense group. The Board noted that the term “contractual management fee” may include both advisory and certain administrative services fees, but that Lipper does not provide information on a fund by fund basis as to what is included. The Board noted that Invesco Advisers does not charge the Invesco Funds for the administrative services included in the term as defined by Lipper. The Board also reviewed the methodology used by Lipper in providing expense group information, which includes using each fund’s contractual management fee schedule (including any applicable breakpoints) as reported in the most recent prospectus or statement of additional information for each fund in the expense group.
The Board noted that Invesco Advisers has contractually agreed to waive fees and/or limit expenses of the Fund through at least February 29, 2016 in an amount necessary to limit total annual operating expenses to a specified percentage of average daily net assets for each class of the Fund.
The Board noted that Invesco Advisers and its affiliates manage two other mutual funds using an investment process substantially similar to the investment process used for the Fund. The Board noted that both of the other mutual funds are fund of funds and Invesco Advisers does not charge advisory fees at the fund level. Invesco Advisors and the Affiliated Sub-Advisers do not manage other client accounts using an investment process substantially similar to the investment process used for the Fund.
The Board also considered the services that may be provided by the Affiliated Sub-Advisers pursuant to the sub-advisory contracts, as well as the fees payable by Invesco Advisers to the Affiliated Sub-Advisers pursuant to the sub-advisory contracts. The Board noted that Invesco Advisers retains overall responsibility for, and provides services to, sub-advised Invesco Funds, including oversight of the Affiliated Sub-Advisers as well as the additional services described herein other than day-to-day portfolio management other than day-to-day portfolio management. The Board also noted that the sub-advisory fees are not paid directly
by the Fund, but rather, are payable by Invesco Advisers to the Affiliated Sub-Advisers.
| D. | Economies of Scale and Breakpoints |
The Board considered the extent to which there are economies of scale in the provision of advisory services to the Fund. The Board also considered whether the Fund benefits from economies of scale through contractual breakpoints in the Fund’s advisory fee schedule. The Board also noted that the Fund shares directly in economies of scale through lower fees charged by third party service providers based on the combined size of the Invesco Funds and other clients advised by Invesco Advisers.
| E. | Profitability and Financial Resources |
The Board reviewed information from Invesco Advisers concerning the costs of the advisory and other services that Invesco Advisers and its affiliates provide to the Fund and the Invesco Funds and the profitability of Invesco Advisers and its affiliates in providing these services. The Board received information from Invesco Advisers about the methodology used to prepare the profitability information. The Board noted that Invesco Advisers continues to operate at a net profit from services Invesco Advisers and its affiliates provide to the Invesco Funds. The Board noted that although Invesco Advisers received a minimal amount of revenues from advising the Fund, Invesco Advisers and its affiliates did not make a profit from managing the Fund as a result of fee and expense waivers. The Board received and accepted information from Invesco Advisers demonstrating that Invesco Advisers and each Affiliated Sub-Adviser are financially sound and have the resources necessary to perform their obligations under the investment advisory agreement and sub-advisory contracts.
| F. | Collateral Benefits to Invesco Advisers and its Affiliates |
The Board considered various other benefits received by Invesco Advisers and its affiliates from the relationship with the Fund, including the fees received for providing transfer agency and distribution services to the Fund. The Board considered comparative information regarding fees charged for these services, including information provided by Lipper and other independent sources. The Board considered the performance of Invesco Advisers and its affiliates in providing these services and the organizational structure employed to provide these services. The Board also considered that these services are provided to the Fund pursuant to written contracts that are reviewed and approved on an annual basis by the Board; and that the services are required for the operation of the Fund.
The Board considered the benefits realized by Invesco Advisers and the Affiliated Sub-Advisers as a result of portfolio brokerage transactions executed through “soft dollar” arrangements. Invesco Advisers noted that the Fund does not execute brokerage transaction through “soft dollar” arrangements to any significant degree.
The Board considered that the Fund’s uninvested cash and cash collateral from any securities lending arrangements may be invested in money market funds advised by Invesco Advisers pursuant to procedures approved by the Board. The Board noted that Invesco Advisers receives advisory fees from these affiliated money market funds attributable to such investments, although Invesco Advisers has contractually agreed to waive through varying periods the advisory fees payable by the Invesco Funds with respect to investments in the affiliated money market funds. The waiver is in an amount equal to 100% of the net advisory fee Invesco Advisers receives from the affiliated money market funds with respect to the Fund’s investment in the affiliated money market funds of uninvested cash, but not cash collateral. The Board concluded that the amount of advisory fees received by Invesco Advisors from the Fund’s investment of cash collateral from any securities lending arrangements in the affiliated money market funds is fair and reasonable.
39 Invesco Premium Income Fund
Tax Information
Form 1099-DIV, Form 1042-S and other year–end tax information provide shareholders with actual calendar year amounts that should be included in their tax returns. Shareholders should consult their tax advisors.
The following distribution information is being provided as required by the Internal Revenue Code or to meet a specific state’s requirement.
The Fund designates the following amounts or, if subsequently determined to be different, the maximum amount allowable for its fiscal year ended October 31, 2015:
| | | | |
Federal and State Income Tax | |
Qualified Dividend Income * | | | 1.12 | % |
Corporate Dividends Received Deduction * | | | 0.98 | % |
U.S. Treasury Obligations* | | | 3.68 | % |
| * | The above percentages are based on ordinary income dividends paid to shareholders during the Fund’s fiscal year. |
Distribution Information
The following table sets forth on a per share basis the distribution that was paid in September 2015. Included in the table is a written statement of the sources of the distribution on a generally accepted accounting principles (“GAAP”) basis.
| | | | | | | | | | | | | | | | | | |
| | | | | Net Income | | | Gain from
Sale of Securities | | | Return of Principal | | | Total Distribution | |
| 09/17/15 | | Class A | | $ | 0.0391 | | | $ | 0.0000 | | | $ | 0.0008 | | | $ | 0.0399 | |
| 09/17/15 | | Class C | | | 0.0328 | | | | 0.0000 | | | | 0.0008 | | | | 0.0336 | |
| 09/17/15 | | Class R | | | 0.0370 | | | | 0.0000 | | | | 0.0008 | | | | 0.0378 | |
| 09/17/15 | | Class Y | | | 0.0413 | | | | 0.0000 | | | | 0.0008 | | | | 0.0421 | |
| 09/17/15 | | Class R5 | | | 0.0413 | | | | 0.0000 | | | | 0.0008 | | | | 0.0421 | |
| 09/17/15 | | Class R6 | | | 0.0413 | | | | 0.0000 | | | | 0.0008 | | | | 0.0421 | |
Please note that the information in the preceding chart is for financial accounting purposes only. Shareholders should be aware that the tax treatment of distributions likely differs from GAAP treatment. Form 1099-DIV for the calendar year will report distributions for federal income tax purposes. This Notice is sent to comply with certain Securities and Exchange Commission requirements.
40 Invesco Premium Income Fund
Trustees and Officers
The address of each trustee and officer is AIM Investment Funds (Invesco Investment Funds) (the “Trust”), 11 Greenway Plaza, Suite 1000, Houston, Texas 77046-1173. The trustees serve for the life of the Trust, subject to their earlier death, incapacitation, resignation, retirement or removal as more specifically provided in the Trust’s organizational documents. Each officer serves for a one year term or until their successors are elected and qualified. Column two below includes length of time served with predecessor entities, if any.
| | | | | | | | |
Name, Year of Birth and
Position(s) Held with the Trust | | Trustee and/
or Officer Since | | Principal Occupation(s)
During Past 5 Years | | Number of Funds in Fund Complex Overseen by Trustee | | Other Directorship(s) Held by Trustee During Past 5 Years |
| Interested Persons | | | | | | | | |
| Martin L. Flanagan1 — 1960 Trustee | | 2007 | | Executive Director, Chief Executive Officer and President, Invesco Ltd. (ultimate parent of Invesco and a global investment management firm); Advisor to the Board, Invesco Advisers, Inc. (formerly known as Invesco Institutional (N.A.), Inc.); Trustee, The Invesco Funds; Vice Chair, Investment Company Institute; and Member of Executive Board, SMU Cox School of Business Formerly: Chairman and Chief Executive Officer, Invesco Advisers, Inc. (registered investment adviser); Director, Chairman, Chief Executive Officer and President, IVZ Inc. (holding company), INVESCO Group Services, Inc. (service provider) and Invesco North American Holdings, Inc. (holding company); Director, Chief Executive Officer and President, Invesco Holding Company Limited (parent of Invesco and a global investment management firm); Director, Invesco Ltd.; Chairman, Investment Company Institute and President, Co-Chief Executive Officer, Co-President, Chief Operating Officer and Chief Financial Officer, Franklin Resources, Inc. (global investment management organization). | | 145 | | None |
Philip A. Taylor2 — 1954
Trustee, President and Principal Executive Officer | | 2006 | | Head of North American Retail and Senior Managing Director, Invesco Ltd.; Director, Co-Chairman, Co-President and Co-Chief Executive Officer, Invesco Advisers, Inc. (formerly known as Invesco Institutional (N.A.), Inc.) (registered investment adviser); Director, Chairman, Chief Executive Officer and President, Invesco Management Group, Inc. (formerly known as Invesco Aim Management Group, Inc.) (financial services holding company); Director and President, INVESCO Funds Group, Inc. (registered investment adviser and registered transfer agent); Director and Chairman, Invesco Investment Services, Inc. (formerly known as Invesco Aim Investment Services, Inc.) (registered transfer agent) and IVZ Distributors, Inc. (formerly known as INVESCO Distributors, Inc.) (registered broker dealer); Chief Executive Officer, Invesco Corporate Class Inc. (corporate mutual fund company) Director, Chairman and Chief Executive Officer, Invesco Canada Ltd. (formerly known as Invesco Trimark Ltd./Invesco Trimark Ltèe) (registered investment adviser and registered transfer agent); Trustee, President and Principal Executive Officer, The Invesco Funds (other than AIM Treasurer’s Series Trust (Invesco Treasurer’s Series Trust), Short-Term Investments Trust and Invesco Management Trust); Trustee and Executive Vice President, The Invesco Funds (AIM Treasurer’s Series Trust (Invesco Treasurer’s Series Trust), Short-Term Investments Trust and Invesco Management Trust only); Director, Invesco Investment Advisers LLC (formerly known as Van Kampen Asset Management); Director, Chief Executive Officer and President, Van Kampen Exchange Corp. Formerly: Director, President and Chairman, Invesco Inc. (holding company), Invesco Canada Holdings Inc. (holding company), Trimark Investments Ltd./Placements Trimark Ltèe and Invesco Financial Services Ltd/Services Financiers Invesco Ltèe; Chief Executive Officer, Invesco Canada Fund Inc (corporate mutual fund company); Director and Chairman, Van Kampen Investor Services Inc.; Director, Chief Executive Officer and President, 1371 Preferred Inc. (holding company) and Van Kampen Investments Inc.; Director and President, AIM GP Canada Inc. (general partner for limited partnerships) and Van Kampen Advisors, Inc.; Director and Chief Executive Officer, Invesco Trimark Dealer Inc. (registered broker dealer); Director, Invesco Distributors, Inc. (formerly known as Invesco Aim Distributors, Inc.) (registered broker dealer); Manager, Invesco PowerShares Capital Management LLC; Director, Chief Executive Officer and President, Invesco Advisers, Inc.; Director, Chairman, Chief Executive Officer and President, Invesco Aim Capital Management, Inc.; President, Invesco Trimark Dealer Inc. and Invesco Trimark Ltd./Invesco Trimark Ltèe; Director and President, AIM Trimark Corporate Class Inc. and AIM Trimark Canada Fund Inc.; Senior Managing Director, Invesco Holding Company Limited; Director and Chairman, Fund Management Company (former registered broker dealer); President and Principal Executive Officer, The Invesco Funds (AIM Treasurer’s Series Trust (Invesco Treasurer’s Series Trust), and Short-Term Investments Trust only); President, AIM Trimark Global Fund Inc. and AIM Trimark Canada Fund Inc.. | | 145 | | None |
| 1 | Mr. Flanagan is considered an interested person (within the meaning of Section 2(a)(19) of the 1940 Act) of the Trust because he is an officer of the Adviser to the Trust, and an officer and a director of Invesco Ltd., ultimate parent of the Adviser. |
| 2 | Mr. Taylor is considered an interested person (within the meaning of Section 2(a)(19) of the 1940 Act) of the Trust because he is an officer and a director of the Adviser. |
T-1 Invesco Premium Income Fund
Trustees and Officers—(continued)
| | | | | | | | |
Name, Year of Birth and Position(s) Held with the Trust | | Trustee and/ or Officer Since | | Principal Occupation(s) During Past 5 Years | | Number of Funds in Fund Complex Overseen by Trustee | | Other Directorship(s) Held by Trustee During Past 5 Years |
| Independent Trustees | | | | | | | | |
Bruce L. Crockett — 1944 Trustee and Chair | | 2003 | | Chairman, Crockett Technologies Associates (technology consulting company) Formerly: Director, Captaris (unified messaging provider); Director, President and Chief Executive Officer, COMSAT Corporation; Chairman, Board of Governors of INTELSAT (international communications company); ACE Limited (insurance company); Independent Directors Council and Investment Company Institute | | 145 | | ALPS (Attorneys Liability Protection Society) (insurance company) and Globe Specialty Metals, Inc. (metallurgical company) |
David C. Arch — 1945 Trustee | | 2010 | | Chairman of Blistex Inc., a consumer health care products manufacturer | | 145 | | Board member of the Illinois Manufacturers’ Association; Member of the Board of Visitors, Institute for the Humanities, University of Michigan; Member of the Audit Committee of the Edward-Elmhurst Hospital |
James T. Bunch — 1942 Trustee | | 2000 | | Managing Member, Grumman Hill Group LLC (family office/private equity investments) Formerly: Founder, Green Manning & Bunch Ltd. (investment banking firm) (1988-2010); Executive Committee, United States Golf Association; and Chairman, Board of Governors, Western Golf Association | | 145 | | Chairman of the Board of Trustees, Evans Scholars Foundation; and Chairman of the Board, Denver Film Society |
Rodney F. Dammeyer — 1940 Trustee | | 2010 | | Chairman of CAC, LLC, (private company offering capital investment and management advisory services) Formerly: Prior to 2001, Managing Partner at Equity Group Corporate Investments; Prior to 1995, Chief Executive Officer of Itel Corporation (formerly Anixter International); Prior to 1985, experience includes Senior Vice President and Chief Financial Officer of Household International, Inc., Executive Vice President and Chief Financial Officer of Northwest Industries, Inc. and Partner of Arthur Andersen & Co.; From 1987 to 2010, Director/Trustee of investment companies in the Van Kampen Funds complex | | 145 | | Director of Quidel Corporation and Stericycle, Inc. |
Albert R. Dowden — 1941 Trustee | | 2003 | | Director of a number of public and private business corporations, including the Boss Group, Ltd. (private investment and management); Nature’s Sunshine Products, Inc. and Reich & Tang Funds (5 portfolios) (registered investment company) Formerly: Director, Homeowners of America Holding Corporation/Homeowners of America Insurance Company (property casualty company); Director, Continental Energy Services, LLC (oil and gas pipeline service); Director, CompuDyne Corporation (provider of product and services to the public security market) and Director, Annuity and Life Re (Holdings), Ltd. (reinsurance company); Director, President and Chief Executive Officer, Volvo Group North America, Inc.; Senior Vice President, AB Volvo; Director of various public and private corporations; Chairman, DHJ Media, Inc.; Director, Magellan Insurance Company; and Director, The Hertz Corporation, Genmar Corporation (boat manufacturer), National Media Corporation; Advisory Board of Rotary Power International (designer, manufacturer, and seller of rotary power engines); and Chairman, Cortland Trust, Inc. (registered investment company) | | 145 | | Director of: Nature’s Sunshine Products, Inc., Reich & Tang Funds, Homeowners of America Holding Corporation/ Homeowners of America Insurance Company, the Boss Group |
Jack M. Fields — 1952 Trustee | | 2003 | | Chief Executive Officer, Twenty First Century Group, Inc. (government affairs company); Owner and Chief Executive Officer, Dos Angeles Ranch, L.P. (cattle, hunting, corporate entertainment); and Discovery Global Education Fund (non-profit) Formerly: Chief Executive Officer, Texana Timber LP (sustainable forestry company); Director of Cross Timbers Quail Research Ranch (non-profit); and member of the U.S. House of Representatives | | 145 | | Insperity, Inc. (formerly known as Administaff) |
Prema Mathai-Davis — 1950 Trustee | | 2003 | | Retired. Formerly: Chief Executive Officer, YWCA of the U.S.A. | | 145 | | None |
Larry Soll — 1942 Trustee | | 1997 | | Retired. Formerly: Chairman, Chief Executive Officer and President, Synergen Corp. (a biotechnology company) | | 145 | | None |
Hugo F. Sonnenschein — 1940 Trustee | | 2010 | | President Emeritus and Honorary Trustee of the University of Chicago and the Adam Smith Distinguished Service Professor in the Department of Economics at the University of Chicago. Prior to 2000, President of the University of Chicago | | 145 | | Trustee of the University of Rochester and a member of its investment committee; Member of the National Academy of Sciences and the American Philosophical Society; Fellow of the American Academy of Arts and Sciences |
Raymond Stickel, Jr. — 1944 Trustee | | 2005 | | Retired. Formerly: Director, Mainstay VP Series Funds, Inc. (25 portfolios) and Partner, Deloitte & Touche | | 145 | | None |
T-2 Invesco Premium Income Fund
Trustees and Officers—(continued)
| | | | | | | | |
Name, Year of Birth and Position(s) Held with the Trust | | Trustee and/ or Officer Since | | Principal Occupation(s) During Past 5 Years | | Number of Funds in Fund Complex Overseen by Trustee | | Other Directorship(s) Held by Trustee During Past 5 Years |
| Independent Trustees—(continued) |
Suzanne H. Woolsey — 1941 Trustee | | 2014 | | Chief Executive Officer of Woolsey Partners LLC | | 145 | | Emeritus Chair of the Board of Trustees of the Institute for Defense Analyses; Trustee of Colorado College; Trustee of California Institute of Technology; Prior to 2014, Director of Fluor Corp.; Prior to 2010, Trustee of the German Marshall Fund of the United States; Prior to 2010 Trustee of the Rocky Mountain Institute |
| Other Officers | | | | | | | | |
Russell C. Burk — 1958
Senior Vice President and Senior Officer | | 2005 | | Senior Vice President and Senior Officer, The Invesco Funds | | N/A | | N/A |
John M. Zerr — 1962
Senior Vice President, Chief Legal Officer and Secretary | | 2006 | | Director, Senior Vice President, Secretary and General Counsel, Invesco Management Group, Inc. (formerly known as Invesco Aim Management Group, Inc.) and Van Kampen Exchange Corp.; Senior Vice President, Invesco Advisers, Inc. (formerly known as Invesco Institutional (N.A.), Inc.) (registered investment adviser); Senior Vice President and Secretary, Invesco Distributors, Inc. (formerly known as Invesco Aim Distributors, Inc.); Director, Vice President and Secretary, Invesco Investment Services, Inc. (formerly known as Invesco Aim Investment Services, Inc.) and IVZ Distributors, Inc. (formerly known as INVESCO Distributors, Inc.); Director and Vice President, INVESCO Funds Group, Inc.; Senior Vice President, Chief Legal Officer and Secretary, The Invesco Funds; Managing Director, Invesco PowerShares Capital Management LLC; Director, Secretary and General Counsel, Invesco Investment Advisers LLC (formerly known as Van Kampen Asset Management); Secretary and General Counsel, Invesco Capital Markets, Inc. (formerly known as Van Kampen Funds Inc.) and Chief Legal Officer, PowerShares Exchange-Traded Fund Trust, PowerShares Exchange-Traded Fund Trust II, PowerShares India Exchange-Traded Fund Trust, PowerShares Actively Managed Exchange-Traded Fund Trust, and PowerShares Actively Managed Exchange-Traded Commodity Fund Trust Formerly: Director and Vice President, Van Kampen Advisors Inc.; Director, Vice President, Secretary and General Counsel, Van Kampen Investor Services Inc.; Director, Invesco Distributors, Inc. (formerly known as Invesco Aim Distributors, Inc.); Director, Senior Vice President, General Counsel and Secretary, Invesco Aim Advisers, Inc. and Van Kampen Investments Inc.; Director, Vice President and Secretary, Fund Management Company; Director, Senior Vice President, Secretary, General Counsel and Vice President, Invesco Aim Capital Management, Inc.; Chief Operating Officer and General Counsel, Liberty Ridge Capital, Inc. (an investment adviser); Vice President and Secretary, PBHG Funds (an investment company) and PBHG Insurance Series Fund (an investment company); Chief Operating Officer, General Counsel and Secretary, Old Mutual Investment Partners (a broker-dealer); General Counsel and Secretary, Old Mutual Fund Services (an administrator) and Old Mutual Shareholder Services (a shareholder servicing center); Executive Vice President, General Counsel and Secretary, Old Mutual Capital, Inc. (an investment adviser); and Vice President and Secretary, Old Mutual Advisors Funds (an investment company) | | N/A | | N/A |
Sheri Morris — 1964
Vice President, Treasurer and Principal Financial Officer | | 2003 | | Vice President, Treasurer and Principal Financial Officer, The Invesco Funds; Vice President, Invesco Advisers, Inc. (formerly known as Invesco Institutional (N.A.), Inc.) (registered investment adviser); and Vice President, PowerShares Exchange-Traded Fund Trust, PowerShares Exchange-Traded Fund Trust II, PowerShares India Exchange-Traded Fund Trust, PowerShares Actively Managed Exchange-Traded Fund Trust, and PowerShares Actively Managed Exchange-Traded Commodity Fund Trust Formerly: Vice President, Invesco Aim Advisers, Inc., Invesco Aim Capital Management, Inc. and Invesco Aim Private Asset Management, Inc.; Assistant Vice President and Assistant Treasurer, The Invesco Funds and Assistant Vice President, Invesco Advisers, Inc., Invesco Aim Capital Management, Inc. and Invesco Aim Private Asset Management, Inc.; and Treasurer, PowerShares Exchange-Traded Fund Trust, PowerShares Exchange-Traded Fund Trust II, PowerShares India Exchange-Traded Fund Trust and PowerShares Actively Managed Exchange-Traded Fund Trust | | N/A | | N/A |
T-3 Invesco Premium Income Fund
Trustees and Officers—(continued)
| | | | | | | | |
Name, Year of Birth and
Position(s) Held with the Trust | | Trustee and/
or Officer Since | | Principal Occupation(s)
During Past 5 Years | | Number of Funds in Fund Complex Overseen by Trustee | | Other Directorship(s) Held by Trustee During Past 5 Years |
| Other Officers—(continued) | | | | | | | | |
Karen Dunn Kelley — 1960
Vice President | | 2003 | | Senior Managing Director, Investments, Invesco Ltd.; Director, Co-President, Co-Chief Executive Officer, and Co-Chairman, Invesco Advisers, Inc. (formerly known as Invesco Institutional (N.A.), Inc.) (registered investment adviser); Chairman, Invesco Senior Secured Management, Inc.; Senior Vice President, Invesco Management Group, Inc. (formerly known as Invesco Aim Management Group, Inc.); Executive Vice President, Invesco Distributors, Inc. (formerly known as Invesco Aim Distributors, Inc.); Director, Invesco Mortgage Capital Inc. and Invesco Management Company Limited; Vice President, The Invesco Funds (other than AIM Treasurer’s Series Trust (Invesco Treasurer’s Series Trust), Short-Term Investments Trust and Invesco Management Trust); and President and Principal Executive Officer, The Invesco Funds (AIM Treasurer’s Series Trust (Invesco Treasurer’s Series Trust), Short-Term Investments Trust and Invesco Management Trust only) Formerly: Director and President, INVESCO Asset Management (Bermuda) Ltd., Director, INVESCO Global Asset Management Limited and INVESCO Management S.A.; Senior Vice President, Van Kampen Investments Inc. and Invesco Advisers, Inc. (formerly known as Invesco Institutional (N.A.), Inc.) (registered investment adviser); Vice President, Invesco Advisers, Inc. (formerly known as Invesco Institutional (N.A.), Inc.); Director of Cash Management and Senior Vice President, Invesco Advisers, Inc. and Invesco Aim Capital Management, Inc.; Director and President, Fund Management Company; Chief Cash Management Officer, Director of Cash Management, Senior Vice President, and Managing Director, Invesco Aim Capital Management, Inc.; Director of Cash Management, Senior Vice President, and Vice President, Invesco Advisers, Inc. and The Invesco Funds (AIM Treasurer’s Series Trust (Invesco Treasurer’s Series Trust), and Short-Term Investments Trust only) | | N/A | | N/A |
Crissie M. Wisdom — 1969 Anti-Money Laundering Compliance Officer | | 2013 | | Anti-Money Laundering Compliance Officer, Invesco Advisers, Inc. (formerly known as Invesco Institutional (N.A.), Inc.) (registered investment adviser), Invesco Capital Markets, Inc. (formerly known as Van Kampen Funds Inc.), Invesco Distributors, Inc., Invesco Investment Services, Inc., Invesco Management Group, Inc., Van Kampen Exchange Corp., The Invesco Funds, and PowerShares Exchange-Traded Fund Trust, PowerShares Exchange-Traded Fund Trust II, PowerShares India Exchange-Traded Fund Trust, PowerShares Actively Managed Exchange-Traded Fund Trust and PowerShares Actively Managed Exchange-Traded Commodity Fund Trust; Anti-Money Laundering Compliance Officer and Bank Secrecy Act Officer, INVESCO National Trust Company and Invesco Trust Company; and Fraud Prevention Manager and Controls and Risk Analysis Manager for Invesco Investment Services, Inc.. | | N/A | | N/A |
Lisa O. Brinkley — 1959 Chief Compliance Officer | | 2015 | | Senior Vice President and Chief Compliance Officer, Invesco Advisers, Inc. (registered investment adviser) (formerly known as Invesco Institutional (N.A., Inc.); and Chief Compliance Officer, The Invesco Funds Formerly: Global Assurance Officer, Invesco Ltd. and Vice President, The Invesco Funds; Chief Compliance Officer, Invesco Distributors, Inc. (formerly known as Invesco Aim Distributors, Inc.), Invesco Investment Services, Inc.(formerly known as Invesco Aim Investment Services, Inc.) and Van Kampen Investor Services Inc.; Senior Vice President, Invesco Management Group, Inc.; Senior Vice President and Chief Compliance Officer, Invesco Advisers, Inc. and The Invesco Funds; Vice President and Chief Compliance Officer, Invesco Aim Capital Management, Inc. and Invesco Distributors, Inc.; Vice President, Invesco Investment Services, Inc. and Fund Management Company. | | N/A | | N/A |
The Statement of Additional Information of the Trust includes additional information about the Fund’s Trustees and is available upon request, without charge, by calling 1.800.959.4246. Please refer to the Fund’s prospectus for information on the Fund’s sub-advisers.
| | | | | | |
Office of the Fund 11 Greenway Plaza, Suite 1000 Houston, TX 77046-1173 | | Investment Adviser Invesco Advisers, Inc. 1555 Peachtree Street, N.E. Atlanta, GA 30309 | | Distributor
Invesco Distributors, Inc. 11 Greenway Plaza, Suite 1000 Houston, TX 77046-1173 | | Auditors PricewaterhouseCoopers LLP 1000 Louisiana Street, Suite 5800 Houston, TX 77002-5678 |
| | | |
| | | | | | |
Counsel to the Fund Stradley Ronon Stevens & Young, LLP 2005 Market Street, Suite 2600 Philadelphia, PA 19103-7018 | | Counsel to the Independent Trustees Goodwin Procter LLP 901 New York Avenue, N.W. Washington, D.C. 20001 | | Transfer Agent Invesco Investment Services, Inc. 11 Greenway Plaza, Suite 1000 Houston, TX 77046-1173 | | Custodian State Street Bank and Trust Company 225 Franklin Street Boston, MA 02110-2801 |
T-4 Invesco Premium Income Fund

Invesco mailing information
Send general correspondence to Invesco Investment Services, Inc., P.O. Box 219078, Kansas City, MO 64121-9078.
Important notice regarding delivery of security holder documents
To reduce Fund expenses, only one copy of most shareholder documents may be mailed to shareholders with multiple accounts at the same address (Householding). Mailing of your shareholder documents may be householded indefinitely unless you instruct us otherwise. If you do not want the mailing of these documents to be combined with those for other members of your household, please contact Invesco Investment Services, Inc. at 800 959 4246 or contact your financial institution. We will begin sending you individual copies for each account within 30 days after receiving your request.
Fund holdings and proxy voting information
The Fund provides a complete list of its holdings four times in each fiscal year, at the quarter ends. For the second and fourth quarters, the lists appear in the Fund’s semiannual and annual reports to shareholders. For the first and third quarters, the Fund files the lists with the Securities and Exchange Commission (SEC) on Form N-Q. The most recent list of portfolio holdings is available at invesco.com/completeqtrholdings. Shareholders can also look up the Fund’s Forms N-Q on the SEC website at sec.gov. Copies of the Fund’s Forms N-Q may be reviewed and copied at the SEC Public Reference Room in Washington, D.C. You can obtain information on the operation of the Public Reference Room, including information about duplicating fee charges, by calling 202 551 8090 or 800 732 0330, or by electronic request at the following email address: publicinfo@sec.gov. The SEC file numbers for the Fund are shown below.
A description of the policies and procedures that the Fund uses to determine how to vote proxies relating to portfolio securities is available without charge, upon request, from our Client Services department at 800 959 4246 or at invesco.com/proxyguidelines. The information is also available on the SEC website, sec.gov.
| | |
Information regarding how the Fund voted proxies related to its portfolio securities during the most recent 12-month period ended June 30 is available at invesco.com/proxysearch. The information is also available on the SEC website, sec.gov. Invesco Advisers, Inc. is an investment adviser; it provides investment advisory services to individual and institutional clients and does not sell securities. Invesco Distributors, Inc. is the US distributor for Invesco Ltd.’s retail mutual funds, exchange-traded funds and institutional money market funds. Both are wholly owned, indirect subsidiaries of Invesco Ltd. | |  |
SEC file numbers: 811-05426 and 033-19338 PIN-AR-1 Invesco Distributors, Inc.
| | | | |
| | |
 | | Annual Report to Shareholders | | October 31, 2015 |
| | |
| | Invesco Select Companies Fund |
| | Nasdaq: |
| | A: ATIAX n B: ATIBX n C: ATICX n R: ATIRX n Y: ATIYX n R5: ATIIX |

Letters to Shareholders
| | |

Philip Taylor | | Dear Shareholders: This annual report includes information about your Fund, including performance data and a complete list of its investments as of the close of the reporting period. Inside is a discussion of how your Fund was managed and the factors that affected its performance during the reporting period. I hope you find this report of interest. The US economy expanded and unemployment declined throughout the reporting period. Continuing low energy prices benefited consumers, but a strong US dollar crimped corporate profits. The US Federal Reserve signaled that it was increasingly likely to raise interest rates, based on generally positive economic data, but uncertainty remained about when it might act. Overseas, the story was much different. Low energy prices hurt the economies of some oil-producing nations, such as Brazil and Russia. During the reporting period, the European Central |
Bank as well as central banks in China and Japan – among other countries – either instituted or maintained extraordinarily accommodative monetary policies in response to economic weakness. Investor uncertainty, such as we saw for much of the reporting period – and market volatility, such as we saw at the end of the reporting period – are unfortunate facts of life when it comes to investing. Some investors use these things as excuses to delay saving and investing for their long-term financial goals. That’s why Invesco encourages investors to work with a professional financial adviser who can stress the importance of starting to save and invest early and the importance of adhering to a disciplined investment plan – when times are good and when they’re uncertain. A financial adviser who knows your unique financial situation, investment goals and risk tolerance can be an invaluable partner as you seek to achieve your financial goals. He or she can offer a long-term perspective when markets are volatile and time-tested advice and guidance when your financial situation or investment goals change. |
Timely information when and where you want it
Invesco’s efforts to help investors achieve their financial objectives include providing individual investors and financial professionals with timely information about the markets, the economy and investing – whenever and wherever they want it.
Our website, invesco.com/us, offers a wide range of market insights and investment perspectives. On the website, you’ll find detailed information about our funds, including prices, performance, holdings and portfolio manager commentaries. You can access information about your account by completing a simple, secure online registration. Click on the “Need to register” link in the “Account Access” box on our homepage to get started.
Invesco’s mobile apps for iPhone® and iPad® (both available free from the App StoreSM) allow you to obtain the same detailed information, monitor your account and create customizable watch lists. Also, they allow you to access investment insights from our investment leaders, market strategists, economists and retirement experts. You can sign up to be alerted when new commentary is added, and you can watch portfolio manager videos and have instant access to Invesco news and updates wherever you may be.
In addition to the resources accessible on our website and through our mobile app, you can obtain timely updates to help you stay informed about the markets, the economy and investing by connecting with Invesco on Twitter, LinkedIn or Facebook. You can access our blog at blog.invesco.us.com. Our goal is to provide you the information you want, when and where you want it.
Have questions?
For questions about your account, feel free to contact an Invesco client services representative at 800 959 4246. For Invesco-related questions or comments, please email me directly at phil@invesco.com.
All of us at Invesco look forward to serving your investment management needs for many years to come. Thank you for investing with us.
Sincerely,

Philip Taylor
Senior Managing Director, Invesco Ltd.
iPhone and iPad are trademarks of Apple Inc., registered in the US and other countries. App Store is a service mark of Apple Inc. Invesco Distributors, Inc. is not affiliated with Apple Inc.
|
| 2 Invesco Select Companies Fund |
| | |

Bruce Crockett | | Dear Fellow Shareholders: Among the many important lessons I’ve learned in more than 40 years in a variety of business endeavors is the value of a trusted advocate. As independent chair of the Invesco Funds Board, I can assure you that the members of the Board are strong advocates for the interests of investors in Invesco’s mutual funds. We work hard to represent your interests through oversight of the quality of the investment management services your funds receive and other matters important to your investment, including but not limited to: n Ensuring that Invesco offers a diverse lineup of mutual funds that your financial adviser can use to strive to meet your financial needs as your investment goals change over time. n Monitoring how the portfolio management teams of the Invesco funds are performing in light of changing economic and market conditions. |
| | n | | Assessing each portfolio management team’s investment performance within the context of the investment strategy described in the fund’s prospectus. |
| | n | | Monitoring for potential conflicts of interests that may impact the nature of the services that your funds receive. |
We believe one of the most important services we provide our fund shareholders is the annual review of the funds’ advisory and sub-advisory contracts with Invesco Advisers and its affiliates. This review is required by the Investment Company Act of 1940 and focuses on the nature and quality of the services Invesco provides as the adviser to the Invesco funds and the reasonableness of the fees that it charges for those services. Each year, we spend months carefully reviewing information received from Invesco and a variety of independent sources, such as performance and fee data prepared by Lipper Inc., an independent, third-party firm widely recognized as a leader in its field. We also meet with our independent legal counsel and other independent advisers to review and help us assess the information that we have received. Our goal is to assure that you receive quality investment management services for a reasonable fee.
I trust the measures outlined above provide assurance that you have a worthy advocate when it comes to choosing the Invesco Funds.
As always, please contact me at bruce@brucecrockett.com with any questions or concerns you may have. On behalf of the Board, we look forward to continuing to represent your interests and serving your needs.
Sincerely,

Bruce L. Crockett
Independent Chair
Invesco Funds Board of Trustees
|
| 3 Invesco Select Companies Fund |
Management’s Discussion of Fund Performance
Performance summary
For the fiscal year ended October 31, 2015, Class A shares of Invesco Select Companies Fund (the Fund), at net asset value (NAV), underperformed the Fund’s broad market, style-specific and peer group indexes, the S&P 500 Index, the Russell 2000 Index and the Lipper Small-Cap Core Funds Index, respectively.
Your Fund’s long-term performance appears later in this report.
Fund vs. Indexes
Total returns, 10/31/14 to 10/31/15, at net asset value (NAV). Performance shown does not include applicable contingent deferred sales charges (CDSC) or front-end sales charges, which would have reduced performance.
| | | | | |
Class A Shares | | | | -10.79 | % |
Class B Shares | | | | -11.44 | |
Class C Shares | | | | -11.45 | |
Class R Shares | | | | -11.03 | |
Class Y Shares | | | | -10.56 | |
Class R5 Shares | | | | -10.47 | |
S&P 500 Index▼ (Broad Market Index) | | | | 5.20 | |
Russell 2000 Index▼ (Style-Specific Index) | | | | 0.34 | |
| Lipper Small-Cap Core Funds Index¢ (Peer Group Index) | | | | 0.69 | |
| |
| Source(s): ▼FactSet Research Systems Inc.; ¢Lipper Inc. | | | | | |
Market conditions and your Fund
The US economy improved slowly, but steadily, during the fiscal year ended October 31, 2015 – although the health of individual economic sectors varied dramatically. The headline story was the continued slowdown in energy markets, as oil prices plummeted when too much supply overwhelmed slowing global demand. However, the more subtle story, which drove the economy forward during the year, was the improved position of the US consumer.
As the reporting period began in late 2014, economic growth appeared to be stronger in the US than in the rest of the world. US equity markets were recovering from the initial crash of oil prices when OPEC added additional uncertainty by deciding to maintain high production despite low prices and slowing global growth. In this environment, commodity-
based economies and most currencies underperformed those of the US. The continued strengthening of the US consumer led US equity markets higher through the spring. Continued low interest rates, the increasing availability of credit from lenders and an improving employment picture all contributed to higher consumer confidence. This strength also helped the market overcome fears that Greece and the eurozone would fail to reach an agreement on a financial bailout plan. In the summer of 2015, however, US equity markets moved sharply lower. A significant downturn in China’s financial markets and weak global economic growth led the US Federal Reserve to delay raising interest rates, which, in turn, increased investor uncertainty and market volatility. In October, however, the US market marched higher and recovered from its earlier decline, finishing higher for the fiscal year.
We view ourselves as business people buying businesses, and we consider the purchase of a stock as an ownership interest in a business. We strive to develop a proprietary view of a business through in-depth, fundamental research that includes careful financial statement analysis and meetings with company management. We then seek to purchase businesses whose stock prices are below what we have calculated to be the true value of the company based on its future free cash flows.
Our investment approach focuses on individual businesses rather than market sectors. Therefore, your Fund shares little in common with sector weightings of various market indexes. However, if we were to broadly categorize businesses with which we had the most success during the fiscal year, our investments in select information technology (IT) stocks were the largest contributors to Fund performance. Select holdings in the energy and IT sectors were among the largest detractors.
IT sector companies Global Payments, Microsemi and Booz Allen Hamilton were the largest contributors to Fund performance during the fiscal year. Global Payments is the world’s fourth-largest data processing company and one of the few merchant acquirers with a global footprint. The company’s share price rose due to strong operating results as the business has shown robust international growth. Microsemi is a designer, manufacturer and marketer of analog and mixed-signal semiconductor solutions for communications, defense and security, aerospace and industrial markets. The company reported strong financial results for the reporting period. Booz Allen Hamilton provides high-end IT consulting services to the military and has a long-standing reputation as the elite of the
| | | | | | |
| Portfolio Composition | |
By sector | | | % of total net assets | |
| | | | |
Information Technology | | | 28.2 | % |
| Health Care | | | 13.0 | |
| Consumer Discretionary | | | 11.8 | |
| Industrials | | | 10.9 | |
| Financials | | | 10.8 | |
| Energy | | | 4.1 | |
| Materials | | | 1.8 | |
| Telecommunication Services | | | 1.4 | |
Money Market Funds
Plus Other Assets Less Liabilities | | | 18.0 | |
| | | | |
| Top 10 Equity Holdings* |
| | % of total net assets |
| | | | | | |
1. | | Encore Capital Group, Inc | | | 7.6 | % |
2. | | Booz Allen Hamilton Holding Corp. | | | 6.8 | |
3. | | Microsemi Corp. | | | 6.4 | |
4. | | Alere, Inc. | | | 5.7 | |
5. | | John Wiley & Sons, Inc.-Class A | | | 5.1 | |
6. | | Charles River Laboratories International, Inc. | | | 5.1 | |
7. | | Mitel Networks Corp. | | | 4.9 | |
8. | | Cubic Corp. | | | 4.8 | |
9. | | Regal-Beloit Corp. | | | 4.6 | |
10. | | America’s Car-Mart, Inc. | | | 3.8 | |
| | | | | |
Total Net Assets | | | | $850.7 million | |
| |
| Total Number of Holdings* | | | | 24 | |
The Fund’s holdings are subject to change, and there is no assurance that the Fund will continue to hold any particular security.
*Excluding money market fund holdings.
Data presented here are as of October 31, 2015.
|
| 4 Invesco Select Companies Fund |
government IT consulting industry. We were attracted to the company’s unique culture, in which every partner is paid the same regardless of his or her individual performance. This has resulted in a company run by individuals who row in the same direction, creating an environment where the whole is greater than each of its parts. Booz Allen Hamilton has a long history of double-digit organic growth as a result of its culture. We were able to purchase the company’s shares a couple of years ago at depressed levels due to investor concern about the impact of potential reductions in government spending on the military due to budget constraints. Shares of the company rose during the fiscal year after reporting strong operating results. We decreased our positions in these three companies during the reporting period on the strength of results.
Among the largest detractors from Fund performance were energy sector companies Ultra Petroleum and ION Geophysical. Ultra Petroleum is a low-cost US natural gas producer with some exposure to oil assets. The company’s share price declined in sympathy with oil prices. Though Ultra Petroleum focuses mainly on natural gas, there is a link with oil prices because they are substitutable commodities. We have confidence in the company’s long-term fundamentals because it has over 25 years of reserves from its existing land base, giving it the flexibility to wait out low energy prices for an extended period. We added to the Fund’s position in Ultra Petroleum on price weakness. ION Geophysical’s share price declined after reporting disappointing operating results, largely due to a reduction in exploration as oil prices remained depressed. We consider this to be a cyclical issue, which eventually will turn around. We continue to believe in the long-term growth prospects of the business and that offshore oil is an asset that will eventually be required. In our view, ION Geophysical is trading at cheap valuations and has a strong balance sheet to weather the short-term headwinds.
IT sector company Rovi was also a large detractor from Fund performance during the reporting period. Rovi is focused on delivering solutions that enable consumers to intuitively connect to new entertainment from
many sources and locations. Shares of the company declined after it released updates about ongoing litigation against Netflix (not a Fund holding) for five patents. These five patents are only a handful of Rovi’s 5,000+ patents, and not necessarily the most critical ones. We believe
markets overreacted to the news, and we added to our position in Rovi.
During the fiscal year, we made some new investments and added to some of our existing holdings. We also sold several holdings based on valuations and other factors. The Fund’s large cash position was a result of existing holdings being acquired by other companies not held by the Fund over the past few years and therefore removed or sold from the portfolio as well as a lack of opportunities as markets continued to rise. We believe the cash may act as a shock absorber in the next market correction, while providing us with the ability to invest in attractive opportunities as they present themselves.
We continued to focus on finding quality businesses trading at attractive values relative to what we believe are their long-term prospects. In contrast, the market is often driven by short-term events or outlooks in both good times and bad. Market volatility allows us to take advantage of investment opportunities we believe will benefit your Fund in the long term.
While we can never predict future Fund performance, we pledge to you that we will adhere to our discipline of being business people who buy businesses; we will continually strive to upgrade the quality of your Fund’s portfolio.
As always, we thank you for your investment in Invesco Select Companies Fund and for sharing our long-term investment perspective.
The views and opinions expressed in management’s discussion of Fund performance are those of Invesco Advisers, Inc. These views and opinions are subject to change at any time based on factors such as market and economic conditions. These views and opinions may not be relied upon as investment advice or recommendations, or as an offer for a particular security. The information is not a complete analysis of every aspect of any market, country, industry, security or the Fund. Statements of fact are from sources considered reliable, but Invesco Advisers, Inc. makes no representation or warranty as to their completeness or accuracy. Although historical performance is no guarantee of future results, these insights may help you understand our investment management philosophy.
See important Fund and, if applicable, index disclosures later in this report.
| | |
 | | Robert Mikalachki Chartered Financial Analyst, Portfolio Manager, is lead manager of Invesco Select Companies |
| Fund. He joined Invesco in 1999. Mr. Mikalachki earned a business degree from Wilfrid Laurier University. |
| | |
 | | Virginia Au Chartered Financial Analyst, Portfolio Manager, is manager of Invesco Select Companies Fund. She |
| joined Invesco in 2006. Ms. Au earned a Bachelor of Commerce degree in finance from The University of British Columbia. |
| | |
 | | Jason Whiting Chartered Financial Analyst, Portfolio Manager, is manager of Invesco Select Companies Fund. He |
| joined Invesco in 2003. Mr. Whiting earned a BBA from Wilfrid Laurier University. |
|
| 5 Invesco Select Companies Fund |
Your Fund’s Long-Term Performance
Results of a $10,000 Investment – Oldest Share Class(es)
Fund and index data from 10/31/05
Past performance cannot guarantee comparable future results.
The data shown in the chart include reinvested distributions, applicable sales charges and Fund expenses including management fees. Results for Class B shares are calculated as if a hypothetical shareholder had liquidated his entire investment in the Fund at the close of the reporting period and paid the contingent deferred sales charges, if applicable.
Index results include reinvested dividends, but they do not reflect sales charges. Performance of the peer group, if applicable, reflects fund expenses and management fees; performance of a market index does not. Performance shown in the chart and table(s) does not reflect deduction of taxes a shareholder would pay on Fund distributions or sale of Fund shares.
|
| 6 Invesco Select Companies Fund |
| | | | | |
Average Annual Total Returns As of 10/31/15, including maximum applicable
sales charges |
| |
| Class A Shares | | | | | |
| Inception (11/4/03) | | | | 9.19 | % |
| 10 Years | | | | 7.63 | |
| 5 Years | | | | 9.34 | |
| 1 Year | | | | -15.69 | |
| |
| Class B Shares | | | | | |
| Inception (11/4/03) | | | | 9.18 | % |
| 10 Years | | | | 7.61 | |
| 5 Years | | | | 9.48 | |
| 1 Year | | | | -15.39 | |
| |
| Class C Shares | | | | | |
| Inception (11/4/03) | | | | 8.91 | % |
| 10 Years | | | | 7.44 | |
| 5 Years | | | | 9.77 | |
| 1 Year | | | | -12.23 | |
| |
| Class R Shares | | | | | |
| Inception (4/30/04) | | | | 9.36 | % |
| 10 Years | | | | 7.98 | |
| 5 Years | | | | 10.31 | |
| 1 Year | | | | -11.03 | |
| |
| Class Y Shares | | | | | |
| 10 Years | | | | 8.44 | % |
| 5 Years | | | | 10.87 | |
| 1 Year | | | | -10.56 | |
| |
| Class R5 Shares | | | | | |
| Inception (4/30/04) | | | | 10.08 | % |
| 10 Years | | | | 8.70 | |
| 5 Years | | | | 10.97 | |
| 1 Year | | | | -10.47 | |
Class Y shares incepted on October 3, 2008. Performance shown prior to that date is that of Class A shares and includes the 12b-1 fees applicable to Class A shares.
The performance data quoted represent past performance and cannot guarantee comparable future results; current performance may be lower or higher. Please visit invesco.com/performance for the most recent month-end performance. Performance figures reflect reinvested distributions, changes in net asset value and the effect of the maximum sales charge unless otherwise stated. Investment return and principal value will fluctuate so that you may have a gain or loss when you sell shares.
The net annual Fund operating expense ratio set forth in the most recent Fund prospectus as of the date of this report for Class A, Class B, Class C, Class R, Class Y and Class R5
| | | | | |
| Average Annual Total Returns As of 9/30/15, the most recent calendar quarter
end, including maximum applicable sales charges |
| |
| Class A Shares | | | | | |
| Inception (11/4/03) | | | | 8.83 | % |
| 10 Years | | | | 6.84 | |
| 5 Years | | | | 9.39 | |
| 1 Year | | | | -16.05 | |
| |
| Class B Shares | | | | | |
| Inception (11/4/03) | | | | 8.81 | % |
| 10 Years | | | | 6.81 | |
| 5 Years | | | | 9.53 | |
| 1 Year | | | | -15.74 | |
| |
| Class C Shares | | | | | |
| Inception (11/4/03) | | | | 8.55 | % |
| 10 Years | | | | 6.64 | |
| 5 Years | | | | 9.81 | |
| 1 Year | | | | -12.61 | |
| |
| Class R Shares | | | | | |
| Inception (4/30/04) | | | | 8.98 | % |
| 10 Years | | | | 7.18 | |
| 5 Years | | | | 10.35 | |
| 1 Year | | | | -11.40 | |
| |
| Class Y Shares | | | | | |
| 10 Years | | | | 7.64 | % |
| 5 Years | | | | 10.92 | |
| 1 Year | | | | -10.96 | |
| |
| Class R5 Shares | | | | | |
| Inception (4/30/04) | | | | 9.69 | % |
| 10 Years | | | | 7.89 | |
| 5 Years | | | | 11.01 | |
| 1 Year | | | | -10.92 | |
shares was 1.20%, 1.95%, 1.95%, 1.45%, 0.95% and 0.88%, respectively.1 The total annual Fund operating expense ratio set forth in the most recent Fund prospectus as of the date of this report for Class A, Class B,
Class C, Class R, Class Y and Class R5 shares was 1.24%, 1.99%, 1.99%, 1.49%, 0.99% and 0.92%, respectively. The expense ratios presented above may vary from the expense ratios presented in other sections of this report that are based on expenses incurred during the period covered by this report.
Class A share performance reflects the maximum 5.50% sales charge, and Class B and Class C share performance reflects the applicable contingent deferred sales charge (CDSC) for the period involved. The CDSC on Class B shares declines from 5% beginning at the time of purchase to 0% at the beginning of the seventh year. The
CDSC on Class C shares is 1% for the first year after purchase.
Class R, Class Y and Class R5 shares do not have a front-end sales charge or a CDSC; therefore, performance is at net asset value.
The performance of the Fund’s share classes will differ primarily due to different sales charge structures and class expenses.
Fund performance reflects any applicable fee waivers and/or expense reimbursements. Had the adviser not waived fees and/or reimbursed expenses currently or in the past, returns would have been lower. See current prospectus for more information.
| 1 | Total annual Fund operating expenses after any contractual fee waivers and/or expense reimbursements by the adviser in effect through at least June 30, 2017. See current prospectus for more information. |
|
| 7 Invesco Select Companies Fund |
Invesco Select Companies Fund’s investment objective is long-term growth of capital.
| n | | Unless otherwise stated, information presented in this report is as of October 31, 2015, and is based on total net assets. |
| n | | Unless otherwise noted, all data provided by Invesco. |
| n | | To access your Fund’s reports/prospectus, visit invesco.com/fundreports. |
About share classes
| n | | Class B shares may not be purchased for new or additional investments. Please see the prospectus for more information. |
| n | | Class R shares are generally available only to employer sponsored retirement and benefit plans. Please see the prospectus for more information. |
| n | | Class Y shares are available only to certain investors. Please see the prospectus for more information. |
| n | | Class R5 shares are primarily intended for employer sponsored retirement and benefit plans that meet certain standards and for institutional investors. Please see the prospectus for more information. |
Principal risks of investing
in the Fund
| n | | Cash/cash equivalents risk. Holding cash or cash equivalents may negatively affect performance. |
| n | | Debt securities risk. The Fund may invest in debt securities that are affected by changing interest rates and changes in their effective maturities and credit quality. |
| n | | Foreign securities risk. The Fund’s foreign investments may be affected by changes in a foreign country’s exchange rates, political and social instability, changes in economic or taxation policies, difficulties when enforcing obligations, decreased liquidity, and increased volatility. Foreign companies may be subject to less regulation resulting in less publicly available information about the companies. |
| n | | Management risk. The investment techniques and risk analysis used by the Fund’s portfolio managers may not produce the desired results. |
| n | | Market risk. The prices of and the income generated by the Fund’s securities may decline in response to, among other things, investor sentiment, general economic and market conditions, regional or global instability, and currency and interest rate fluctuations. |
| n | | Small- and mid-capitalization risks. Stocks of small- and mid-sized companies tend to be more vulnerable to adverse developments and may have little or no operating history or track record of success, and limited product lines, markets, management and financial resources. The securities of small- and mid-sized companies may be more volatile due to less market interest and less publicly available information about the issuer. They also may be illiquid or restricted as to resale, or may trade less frequently and in smaller volumes, all of which may cause difficulty when establishing or closing a position at a desirable price. |
| n | | US government obligations risk. The Fund may invest in obligations issued by US government agencies and instrumentalities that may receive varying levels of support from the government, which could affect the Fund’s ability to recover should they default. |
| n | | Value investing style risk. The Fund emphasizes a value style of investing, which focuses on undervalued companies with characteristics for improved valuations. This style of investing is subject to the risk that the valuations never improve or that the returns on value equity securities are less than returns on other styles of investing or the overall stock market. Value stocks also may decline in price, even though in theory they are already underpriced. |
About indexes used in this report
| n | | The S&P 500® Index is an unmanaged index considered representative of the US stock market. |
| n | | The Russell 2000® Index is an unmanaged index considered representative of small-cap stocks. The Russell 2000 Index is a trademark/service mark of the Frank Russell Co. Russell® is a trademark of the Frank Russell Co. |
| n | | The Lipper Small-Cap Core Funds Index is an unmanaged index considered representative of small-cap core funds tracked by Lipper. |
| n | | The Fund is not managed to track the performance of any particular index, including the index(es) described here, and consequently, the performance of the Fund may deviate significantly from the performance of the index(es). |
| n | | A direct investment cannot be made in an index. Unless otherwise indicated, index results include reinvested dividends, and they do not reflect sales charges. Performance of the peer group, if applicable, reflects fund expenses; performance of a market index does not. |
Other information
| n | | The returns shown in management’s discussion of Fund performance are based on net asset values (NAVs) calculated for shareholder transactions. Generally accepted accounting principles require adjustments to be made to the net assets of the Fund at period end for financial reporting purposes, and as such, the NAVs for shareholder transactions and the returns based on those NAVs may differ from the NAVs and returns reported in the Financial Highlights. |
| n | | Industry classifications used in this report are generally according to the Global Industry Classification Standard, which was developed by and is the exclusive property and a service mark of MSCI Inc. and Standard & Poor’s. |
|
This report must be accompanied or preceded by a currently effective Fund prospectus, which contains more complete information, including sales charges and expenses. Investors should read it carefully before investing. |
|
|
| NOT FDIC INSURED | MAY LOSE VALUE | NO BANK GUARANTEE |
|
| 8 Invesco Select Companies Fund |
Schedule of Investments(a)
October 31, 2015
| | | | | | | | |
| | | Shares | | | Value | |
Common Stocks & Other Equity Interests–82.00% | |
| Aerospace & Defense–4.77% | |
Cubic Corp. | | | 903,682 | | | $ | 40,530,138 | |
|
| Aluminum–0.00% | |
Cymat Technologies Ltd. (Canada)(b) | | | 249,750 | | | | 19,098 | |
|
| Apparel, Accessories & Luxury Goods–0.01% | |
Hampshire Group, Ltd.(b)(c) | | | 592,824 | | | | 88,924 | |
|
| Automotive Retail–3.79% | |
America’s Car-Mart, Inc.(b)(c) | | | 942,136 | | | | 32,258,737 | |
|
| Commodity Chemicals–1.75% | |
Chemtrade Logistics Income Fund (Canada) | | | 1,045,784 | | | | 14,866,655 | |
|
| Communications Equipment–4.91% | |
Mitel Networks Corp.(b) | | | 5,334,275 | | | | 41,767,373 | |
|
| Consumer Finance–7.64% | |
Encore Capital Group, Inc.(b)(c) | | | 1,597,305 | | | | 65,010,313 | |
|
| Data Processing & Outsourced Services–6.74% | |
Alliance Data Systems Corp.(b) | | | 101,995 | | | | 30,324,133 | |
Global Payments Inc. | | | 197,755 | | | | 26,975,760 | |
| | | | | | | | 57,299,893 | |
|
| Diversified Support Services–1.50% | |
Performant Financial Corp.(b)(c) | | | 5,527,196 | | | | 12,767,823 | |
|
| Education Services–2.91% | |
American Public Education Inc.(b)(c) | | | 1,140,072 | | | | 24,773,765 | |
|
| Electrical Components & Equipment–4.61% | |
Regal-Beloit Corp. | | | 614,559 | | | | 39,202,719 | |
|
| Health Care Supplies–7.96% | |
Alere, Inc.(b) | | | 1,043,442 | | | | 48,123,545 | |
Cooper Cos., Inc. (The) | | | 128,239 | | | | 19,538,494 | |
| | | | | | | | 67,662,039 | |
|
| Integrated Telecommunication Services–1.42% | |
General Communication, Inc.–Class A(b) | | | 590,716 | | | | 12,029,931 | |
| | | | | | | | |
| | | Shares | | | Value | |
| IT Consulting & Other Services–6.84% | |
Booz Allen Hamilton Holding Corp. | | | 1,976,094 | | | $ | 58,215,729 | |
|
| Life Sciences Tools & Services–5.08% | |
Charles River Laboratories International, Inc.(b) | | | 662,655 | | | | 43,231,612 | |
|
| Oil & Gas Equipment & Services–0.61% | |
ION Geophysical Corp.(b)(c) | | | 14,077,289 | | | | 5,208,597 | |
|
| Oil & Gas Exploration & Production–3.50% | |
Ultra Petroleum Corp.(b) | | | 5,439,470 | | | | 29,808,296 | |
|
| Other Diversified Financial Services–0.00% | |
Brompton Corp. (Canada)(b) | | | 69,374 | | | | 0 | |
|
| Publishing–5.12% | |
John Wiley & Sons, Inc.–Class A | | | 831,616 | | | | 43,518,465 | |
|
| Real Estate Services–3.12% | |
Colliers International Group Inc. (Canada) | | | 535,253 | | | | 26,535,484 | |
|
| Semiconductors–6.37% | |
Microsemi Corp.(b) | | | 1,505,279 | | | | 54,205,097 | |
|
| Systems Software–3.35% | |
Rovi Corp.(b) | | | 3,115,677 | | | | 28,508,444 | |
Total Common Stocks & Other Equity Interests
(Cost $687,925,182) | | | | 697,509,132 | |
|
Money Market Funds–15.66% | |
Liquid Assets Portfolio–Institutional Class, 0.16%(d) | | | 66,619,029 | | | | 66,619,029 | |
Premier Portfolio–Institutional Class, 0.12%(d) | | | 66,619,030 | | | | 66,619,030 | |
Total Money Market Funds
(Cost $133,238,059) | | | | 133,238,059 | |
TOTAL INVESTMENTS–97.66%
(Cost $821,163,241) | | | | 830,747,191 | |
OTHER ASSETS LESS LIABILITIES–2.34% | | | | 19,909,895 | |
NET ASSETS–100.00% | | | $ | 850,657,086 | |
Notes to Schedule of Investments:
| (a) | Industry and/or sector classifications used in this report are generally according to the Global Industry Classification Standard, which was developed by and is the exclusive property and a service mark of MSCI Inc. and Standard & Poor’s. |
| (b) | Non-income producing security. |
| (c) | Affiliated company during the period. The Investment Company Act of 1940 defines an “affiliated person” as an issuance in which a fund holds 5% or more of the outstanding voting securities. The Fund has not owned enough of the outstanding voting securities of the issuer to have control (as defined in the Investment Company Act of 1940) of that issuer. The aggregate value of these securities as of October 31, 2015 was $140,108,159, which represented 16.47% of the Fund’s Net Assets. See Note 4. |
| (d) | The money market fund and the Fund are affiliated by having the same investment adviser. The rate shown is the 7-day SEC standardized yield as of October 31, 2015. |
See accompanying Notes to Financial Statements which are an integral part of the financial statements.
9 Invesco Select Companies Fund
Statement of Assets and Liabilities
October 31, 2015
| | | | |
Assets: | |
Investments, at value (Cost $412,473,060) | | $ | 557,400,973 | |
Investments in affiliates, at value (Cost $408,690,181) | | | 273,346,218 | |
Total investments, at value (Cost $821,163,241) | | | 830,747,191 | |
Receivable for: | | | | |
Investments sold | | | 26,221,555 | |
Fund shares sold | | | 239,868 | |
Dividends | | | 83,846 | |
Investment for trustee deferred compensation and retirement plans | | | 139,141 | |
Other assets | | | 40,138 | |
Total assets | | | 857,471,739 | |
|
Liabilities: | |
Payable for: | | | | |
Investments purchased | | | 836,625 | |
Fund shares reacquired | | | 5,073,245 | |
Accrued fees to affiliates | | | 664,945 | |
Accrued trustees’ and officers’ fees and benefits | | | 2,796 | |
Accrued other operating expenses | | | 78,398 | |
Trustee deferred compensation and retirement plans | | | 158,644 | |
Total liabilities | | | 6,814,653 | |
Net assets applicable to shares outstanding | | $ | 850,657,086 | |
|
Net assets consist of: | |
Shares of beneficial interest | | $ | 687,636,573 | |
Undistributed net investment income (loss) | | | (9,250,127 | ) |
Undistributed net realized gain | | | 162,685,716 | |
Net unrealized appreciation | | | 9,584,924 | |
| | | $ | 850,657,086 | |
| | | | |
Net Assets: | |
Class A | | $ | 475,536,221 | |
Class B | | $ | 4,027,115 | |
Class C | | $ | 125,947,457 | |
Class R | | $ | 45,560,521 | |
Class Y | | $ | 147,927,044 | |
Class R5 | | $ | 51,658,728 | |
|
Shares outstanding, $0.01 par value per share,
with an unlimited number of shares authorized: | |
Class A | | | 23,260,989 | |
Class B | | | 216,598 | |
Class C | | | 6,783,714 | |
Class R | | | 2,293,651 | |
Class Y | | | 7,143,704 | |
Class R5 | | | 2,422,417 | |
Class A: | | | | |
Net asset value per share | | $ | 20.44 | |
Maximum offering price per share | | | | |
(Net asset value of $20.44 ¸ 94.50%) | | $ | 21.63 | |
Class B: | | | | |
Net asset value and offering price per share | | $ | 18.59 | |
Class C: | | | | |
Net asset value and offering price per share | | $ | 18.57 | |
Class R: | | | | |
Net asset value and offering price per share | | $ | 19.86 | |
Class Y: | | | | |
Net asset value and offering price per share | | $ | 20.71 | |
Class R5: | | | | |
Net asset value and offering price per share | | $ | 21.33 | |
See accompanying Notes to Financial Statements which are an integral part of the financial statements.
10 Invesco Select Companies Fund
Statement of Operations
For the year ended October 31, 2015
| | | | |
Investment income: | |
Dividends (net of foreign withholding taxes of $186,973) | | $ | 3,406,941 | |
Dividends from affiliates | | | 156,829 | |
Interest | | | 7,835 | |
Total investment income | | | 3,571,605 | |
| |
Expenses: | | | | |
Advisory fees | | | 8,470,773 | |
Administrative services fees | | | 294,681 | |
Custodian fees | | | 33,502 | |
Distribution fees: | | | | |
Class A | | | 1,602,192 | |
Class B | | | 69,037 | |
Class C | | | 1,608,700 | |
Class R | | | 295,040 | |
Transfer agent fees — A, B, C, R and Y | | | 1,879,989 | |
Transfer agent fees — R5 | | | 62,386 | |
Trustees’ and officers’ fees and benefits | | | 38,689 | |
Other | | | 267,948 | |
Total expenses | | | 14,622,937 | |
Less: Fees waived and expense offset arrangement(s) | | | (375,047 | ) |
Net expenses | | | 14,247,890 | |
Net investment income (loss) | | | (10,676,285 | ) |
| |
Realized and unrealized gain (loss) from: | | | | |
Net realized gain (loss) from: | | | | |
Investment securities (includes net gains from securities sold to affiliates of $868,030) | | | 163,032,981 | |
Foreign currencies | | | (3,210,344 | ) |
| | | | 159,822,637 | |
Change in net unrealized appreciation (depreciation) of: | | | | |
Investment securities | | | (272,074,353 | ) |
Foreign currencies | | | 753,892 | |
| | | | (271,320,461 | ) |
Net realized and unrealized gain (loss) | | | (111,497,824 | ) |
Net increase (decrease) in net assets resulting from operations | | $ | (122,174,109 | ) |
See accompanying Notes to Financial Statements which are an integral part of the financial statements.
11 Invesco Select Companies Fund
Statement of Changes in Net Assets
For the years ended October 31, 2015 and 2014
| | | | | | | | |
| | | 2015 | | | 2014 | |
Operations: | | | | | |
Net investment income (loss) | | $ | (10,676,285 | ) | | $ | (4,716,720 | ) |
Net realized gain | | | 159,822,637 | | | | 136,727,123 | |
Change in net unrealized appreciation (depreciation) | | | (271,320,461 | ) | | | 35,296,385 | |
Net increase (decrease) in net assets resulting from operations | | | (122,174,109 | ) | | | 167,306,788 | |
| | |
Distributions to shareholders from net realized gains: | | | | | | | | |
Class A | | | (71,199,853 | ) | | | (41,356,017 | ) |
Class B | | | (916,857 | ) | | | (565,193 | ) |
Class C | | | (18,752,500 | ) | | | (9,079,104 | ) |
Class R | | | (6,758,426 | ) | | | (3,610,155 | ) |
Class Y | | | (28,688,490 | ) | | | (17,699,816 | ) |
Class R5 | | | (6,188,617 | ) | | | (3,696,664 | ) |
Total distributions from net realized gains | | | (132,504,743 | ) | | | (76,006,949 | ) |
| | |
Share transactions–net: | | | | | | | | |
Class A | | | (140,909,514 | ) | | | (180,545,095 | ) |
Class B | | | (3,398,328 | ) | | | (2,998,780 | ) |
Class C | | | (17,809,047 | ) | | | (10,931,159 | ) |
Class R | | | (11,731,066 | ) | | | (10,410,262 | ) |
Class Y | | | (104,389,400 | ) | | | (88,773,706 | ) |
Class R5 | | | (1,476,849 | ) | | | (19,977,867 | ) |
Net increase (decrease) in net assets resulting from share transactions | | | (279,714,204 | ) | | | (313,636,869 | ) |
Net increase (decrease) in net assets | | | (534,393,056 | ) | | | (222,337,030 | ) |
| | |
Net assets: | | | | | | | | |
Beginning of year | | | 1,385,050,142 | | | | 1,607,387,172 | |
End of year (includes undistributed net investment income (loss) of $(9,250,127) and $(4,763,959), respectively) | | $ | 850,657,086 | | | $ | 1,385,050,142 | |
Notes to Financial Statements
October 31, 2015
NOTE 1—Significant Accounting Policies
Invesco Select Companies Fund (the “Fund”) is a series portfolio of AIM Investment Funds (Invesco Investment Funds) (the “Trust”). The Trust is organized as a Delaware statutory trust and is registered under the Investment Company Act of 1940, as amended (the “1940 Act”), as an open-end series management investment company consisting of twenty-four separate series portfolios, each authorized to issue an unlimited number of shares of beneficial interest. The assets, liabilities and operations of each portfolio are accounted for separately. Information presented in these financial statements pertains only to the Fund. Matters affecting each portfolio or class will be voted on exclusively by the shareholders of such portfolio or class.
The Fund’s investment objective is long-term growth of capital.
The Fund currently consists of six different classes of shares: Class A, Class B, Class C, Class R, Class Y and Class R5. Class A shares are sold with a front-end sales charge unless certain waiver criteria are met and under certain circumstances load waived shares may be subject to contingent deferred sales charges (“CDSC”). Class C shares are sold with a CDSC. Class R, Class Y and Class R5 shares are sold at net asset value. Effective November 30, 2010, new or additional investments in Class B shares are no longer permitted. Existing shareholders of Class B shares may continue to reinvest dividends and capital gains distributions in Class B shares until they convert to Class A shares. Also, shareholders in Class B shares will be able to exchange those shares for Class B shares of other Invesco Funds offering such shares until they convert to Class A shares. Generally, Class B shares will automatically convert to Class A shares on or about the month-end, which is at least eight years after the date of purchase. Redemption of Class B shares prior to the conversion date will be subject to a CDSC.
As of the open of business on March 5, 2014, the Fund has closed to all investors, except Employer Sponsored Retirement and Benefit Plans already invested in the Fund.
The following is a summary of the significant accounting policies followed by the Fund in the preparation of its financial statements.
| A. | Security Valuations — Securities, including restricted securities, are valued according to the following policy. |
A security listed or traded on an exchange (except convertible securities) is valued at its last sales price or official closing price as of the close of the customary trading session on the exchange where the security is principally traded, or lacking any sales or official closing price on a particular day, the security may be valued at the closing bid price on that day. Securities traded in the over-the-counter market are valued based
12 Invesco Select Companies Fund
on prices furnished by independent pricing services or market makers. When such securities are valued by an independent pricing service they may be considered fair valued. Futures contracts are valued at the final settlement price set by an exchange on which they are principally traded. Listed options are valued at the mean between the last bid and asked prices from the exchange on which they are principally traded. Options not listed on an exchange are valued by an independent source at the mean between the last bid and asked prices. For purposes of determining net asset value (“NAV”) per share, futures and option contracts generally are valued 15 minutes after the close of the customary trading session of the New York Stock Exchange (“NYSE”).
Investments in open-end and closed-end registered investment companies that do not trade on an exchange are valued at the end-of-day net asset value per share. Investments in open-end and closed-end registered investment companies that trade on an exchange are valued at the last sales price or official closing price as of the close of the customary trading session on the exchange where the security is principally traded.
Debt obligations (including convertible securities) and unlisted equities are fair valued using an evaluated quote provided by an independent pricing service. Evaluated quotes provided by the pricing service may be determined without exclusive reliance on quoted prices, and may reflect appropriate factors such as institution-size trading in similar groups of securities, developments related to specific securities, dividend rate (for unlisted equities), yield (for debt obligations), quality, type of issue, coupon rate (for debt obligations), maturity (for debt obligations), individual trading characteristics and other market data. Debt obligations are subject to interest rate and credit risks. In addition, all debt obligations involve some risk of default with respect to interest and/or principal payments.
Foreign securities’ (including foreign exchange contracts) prices are converted into U.S. dollar amounts using the applicable exchange rates as of the close of the NYSE. If market quotations are available and reliable for foreign exchange-traded equity securities, the securities will be valued at the market quotations. Because trading hours for certain foreign securities end before the close of the NYSE, closing market quotations may become unreliable. If between the time trading ends on a particular security and the close of the customary trading session on the NYSE, events occur that the Adviser determines are significant and make the closing price unreliable, the Fund may fair value the security. If the event is likely to have affected the closing price of the security, the security will be valued at fair value in good faith using procedures approved by the Board of Trustees. Adjustments to closing prices to reflect fair value may also be based on a screening process of an independent pricing service to indicate the degree of certainty, based on historical data, that the closing price in the principal market where a foreign security trades is not the current value as of the close of the NYSE. Foreign securities’ prices meeting the approved degree of certainty that the price is not reflective of current value will be priced at the indication of fair value from the independent pricing service. Multiple factors may be considered by the independent pricing service in determining adjustments to reflect fair value and may include information relating to sector indices, American Depositary Receipts and domestic and foreign index futures. Foreign securities may have additional risks including exchange rate changes, potential for sharply devalued currencies and high inflation, political and economic upheaval, the relative lack of issuer information, relatively low market liquidity and the potential lack of strict financial and accounting controls and standards.
Securities for which market prices are not provided by any of the above methods may be valued based upon quotes furnished by independent sources. The last bid price may be used to value equity securities. The mean between the last bid and asked prices is used to value debt obligations, including corporate loans.
Securities for which market quotations are not readily available or became unreliable are valued at fair value as determined in good faith by or under the supervision of the Trust’s officers following procedures approved by the Board of Trustees. Issuer specific events, market trends, bid/asked quotes of brokers and information providers and other market data may be reviewed in the course of making a good faith determination of a security’s fair value.
The Fund may invest in securities that are subject to interest rate risk, meaning the risk that the prices will generally fall as interest rates rise and, conversely, the prices will generally rise as interest rates fall. Specific securities differ in their sensitivity to changes in interest rates depending on their individual characteristics. Changes in interest rates may result in increased market volatility, which may affect the value and/or liquidity of certain Fund investments.
Valuations change in response to many factors including the historical and prospective earnings of the issuer, the value of the issuer’s assets, general economic conditions, interest rates, investor perceptions and market liquidity. Because of the inherent uncertainties of valuation, the values reflected in the financial statements may materially differ from the value received upon actual sale of those investments.
| B. | Securities Transactions and Investment Income — Securities transactions are accounted for on a trade date basis. Realized gains or losses on sales are computed on the basis of specific identification of the securities sold. Interest income (net of withholding tax, if any) is recorded on the accrual basis from settlement date. Dividend income (net of withholding tax, if any) is recorded on the ex-dividend date. |
The Fund may periodically participate in litigation related to Fund investments. As such, the Fund may receive proceeds from litigation settlements. Any proceeds received are included in the Statement of Operations as realized gain (loss) for investments no longer held and as unrealized gain (loss) for investments still held.
Brokerage commissions and mark ups are considered transaction costs and are recorded as an increase to the cost basis of securities purchased and/or a reduction of proceeds on a sale of securities. Such transaction costs are included in the determination of net realized and unrealized gain (loss) from investment securities reported in the Statement of Operations and the Statement of Changes in Net Assets and the net realized and unrealized gains (losses) on securities per share in the Financial Highlights. Transaction costs are included in the calculation of the Fund’s net asset value and, accordingly, they reduce the Fund’s total returns. These transaction costs are not considered operating expenses and are not reflected in net investment income reported in the Statement of Operations and the Statement of Changes in Net Assets, or the net investment income per share and the ratios of expenses and net investment income reported in the Financial Highlights, nor are they limited by any expense limitation arrangements between the Fund and the investment adviser.
The Fund allocates income and realized and unrealized capital gains and losses to a class based on the relative net assets of each class.
| C. | Country Determination — For the purposes of making investment selection decisions and presentation in the Schedule of Investments, the investment adviser may determine the country in which an issuer is located and/or credit risk exposure based on various factors. These factors include the laws of the country under which the issuer is organized, where the issuer maintains a principal office, the country in which the issuer derives 50% or more of its total revenues and the country that has the primary market for the issuer’s securities, as well as other criteria. Among the other criteria that may be evaluated for making this determination are the country in which the issuer maintains 50% or more of its assets, the type of security, financial guarantees and enhancements, the nature of the collateral and the sponsor organization. Country of issuer and/or credit risk exposure has been determined to be the United States of America, unless otherwise noted. |
13 Invesco Select Companies Fund
| D. | Distributions — Distributions from net investment income and net realized capital gain, if any, are generally declared and paid annually and recorded on the ex-dividend date. The Fund may elect to treat a portion of the proceeds from redemptions as distributions for federal income tax purposes. |
| E. | Federal Income Taxes — The Fund intends to comply with the requirements of Subchapter M of the Internal Revenue Code of 1986, as amended (the “Internal Revenue Code”), necessary to qualify as a regulated investment company and to distribute substantially all of the Fund’s taxable earnings to shareholders. As such, the Fund will not be subject to federal income taxes on otherwise taxable income (including net realized capital gain) that is distributed to shareholders. Therefore, no provision for federal income taxes is recorded in the financial statements. |
The Fund recognizes the tax benefits of uncertain tax positions only when the position is more likely than not to be sustained. Management has analyzed the Fund’s uncertain tax positions and concluded that no liability for unrecognized tax benefits should be recorded related to uncertain tax positions. Management is not aware of any tax positions for which it is reasonably possible that the total amounts of unrecognized tax benefits will change materially in the next 12 months.
The Fund files tax returns in the U.S. Federal jurisdiction and certain other jurisdictions. Generally, the Fund is subject to examinations by such taxing authorities for up to three years after the filing of the return for the tax period.
| F. | Expenses — Fees provided for under the Rule 12b-1 plan of a particular class of the Fund are charged to the operations of such class. Transfer agency fees and expenses and other shareholder recordkeeping fees and expenses attributable to Class R5 are charged to such class. Transfer agency fees and expenses and other shareholder recordkeeping fees and expenses relating to all other classes are allocated among those classes based on relative net assets. All other expenses are allocated among the classes based on relative net assets. |
| G. | Accounting Estimates — The preparation of financial statements in conformity with accounting principles generally accepted in the United States of America (“GAAP”) requires management to make estimates and assumptions that affect the reported amounts of assets and liabilities at the date of the financial statements and the reported amounts of revenues and expenses during the reporting period including estimates and assumptions related to taxation. Actual results could differ from those estimates by a significant amount. In addition, the Fund monitors for material events or transactions that may occur or become known after the period-end date and before the date the financial statements are released to print. |
| H. | Indemnifications — Under the Trust’s organizational documents, each Trustee, officer, employee or other agent of the Trust is indemnified against certain liabilities that may arise out of the performance of their duties to the Fund. Additionally, in the normal course of business, the Fund enters into contracts, including the Fund’s servicing agreements, that contain a variety of indemnification clauses. The Fund’s maximum exposure under these arrangements is unknown as this would involve future claims that may be made against the Fund that have not yet occurred. The risk of material loss as a result of such indemnification claims is considered remote. |
| I. | Foreign Currency Translations — Foreign currency is valued at the close of the NYSE based on quotations posted by banks and major currency dealers. Portfolio securities and other assets and liabilities denominated in foreign currencies are translated into U.S. dollar amounts at date of valuation. Purchases and sales of portfolio securities (net of foreign taxes withheld on disposition) and income items denominated in foreign currencies are translated into U.S. dollar amounts on the respective dates of such transactions. The Fund does not separately account for the portion of the results of operations resulting from changes in foreign exchange rates on investments and the fluctuations arising from changes in market prices of securities held. The combined results of changes in foreign exchange rates and the fluctuation of market prices on investments (net of estimated foreign tax withholding) are included with the net realized and unrealized gain or loss from investments in the Statement of Operations. Reported net realized foreign currency gains or losses arise from (1) sales of foreign currencies, (2) currency gains or losses realized between the trade and settlement dates on securities transactions, and (3) the difference between the amounts of dividends, interest, and foreign withholding taxes recorded on the Fund’s books and the U.S. dollar equivalent of the amounts actually received or paid. Net unrealized foreign currency gains and losses arise from changes in the fair values of assets and liabilities, other than investments in securities at fiscal period end, resulting from changes in exchange rates. |
The Fund may invest in foreign securities, which may be subject to foreign taxes on income, gains on investments or currency repatriation, a portion of which may be recoverable. Foreign taxes, if any, are recorded based on the tax regulations and rates that exist in the foreign markets in which the Fund invests and are shown in the Statement of Operations.
| J. | Forward Foreign Currency Contracts — The Fund may engage in foreign currency transactions either on a spot (i.e. for prompt delivery and settlement) basis, or through forward foreign currency contracts, to manage or minimize currency or exchange rate risk. |
The Fund may also enter into forward foreign currency contracts for the purchase or sale of a security denominated in a foreign currency in order to “lock in” the U.S. dollar price of that security, or the Fund may also enter into forward foreign currency contracts that do not provide for physical settlement of the two currencies, but instead are settled by a single cash payment calculated as the difference between the agreed upon exchange rate and the spot rate at settlement based upon an agreed upon notional amount (non-deliverable forwards). The Fund will set aside liquid assets in an amount equal to daily mark-to-market obligation for forward foreign currency contracts.
A forward foreign currency contract is an obligation between two parties (“Counterparties”) to purchase or sell a specific currency for an agreed-upon price at a future date. The use of forward foreign currency contracts does not eliminate fluctuations in the price of the underlying securities the Fund owns or intends to acquire but establishes a rate of exchange in advance. Fluctuations in the value of these contracts are measured by the difference in the contract date and reporting date exchange rates and are recorded as unrealized appreciation (depreciation) until the contracts are closed. When the contracts are closed, realized gains (losses) are recorded. Realized and unrealized gains (losses) on the contracts are included in the Statement of Operations. The primary risks associated with forward foreign currency contracts include failure of the Counterparty to meet the terms of the contract and the value of the foreign currency changing unfavorably. These risks may be in excess of the amounts reflected in the Statement of Assets and Liabilities.
14 Invesco Select Companies Fund
NOTE 2—Advisory Fees and Other Fees Paid to Affiliates
The Trust has entered into a master investment advisory agreement with Invesco Advisers, Inc. (the “Adviser” or “Invesco”). Under the terms of the investment advisory agreement, the Fund pays an advisory fee to the Adviser based on the annual rate of the Fund’s average daily net assets as follows:
| | | | | | |
| Average Daily Net Assets | | Rate |
First $250 million | | | 0 | .745% | | |
Next $250 million | | | 0 | .73% | | |
Next $500 million | | | 0 | .715% | | |
Next $1.5 billion | | | 0 | .70% | | |
Next $2.5 billion | | | 0 | .685% | | |
Next $2.5 billion | | | 0 | .67% | | |
Next $2.5 billion | | | 0 | .655% | | |
Over $10 billion | | | 0 | .64% | | |
For the year ended October 31, 2015, the effective advisory fees incurred by the Fund was 0.72%.
Under the terms of a master sub-advisory agreement between the Adviser and each of Invesco Asset Management Deutschland GmbH, Invesco Asset Management Limited, Invesco Asset Management (Japan) Limited, Invesco Hong Kong Limited, Invesco Senior Secured Management, Inc. and Invesco Canada Ltd. (collectively, the “Affiliated Sub-Advisers”) the Adviser, not the Fund, may pay 40% of the fees paid to the Adviser to any such Affiliated Sub-Adviser(s) that provide(s) discretionary investment management services to the Fund based on the percentage of assets allocated to such Affiliated Sub-Adviser(s).
The Adviser has contractually agreed, through at least June 30, 2016, to waive advisory fees and/or reimburse expenses to the extent necessary to limit total annual fund operating expenses after fee waivers and/or expense reimbursements (excluding certain items discussed below) of Class A, Class B, Class C, Class R, Class Y and Class R5 shares to 2.00%, 2.75%, 2.75%, 2.25%, 1.75% and 1.75% of average daily net assets, respectively. In determining the Adviser’s obligation to waive advisory fees and/or reimburse expenses, the following expenses are not taken into account, and could cause the total annual fund operating expenses after fee waivers and/or expense reimbursements to exceed the numbers reflected above: (1) interest; (2) taxes; (3) dividend expense on short sales; (4) extraordinary or non-routine items, including litigation expenses; and (5) expenses that the Fund has incurred but did not actually pay because of an expense offset arrangement. Unless Invesco continues the fee waiver agreement, it will terminate on June 30, 2016. The fee waiver agreement cannot be terminated during its term. The Adviser did not waive fees and/or reimburse expenses during the period under this expense limitation.
Further, the Adviser has contractually agreed, through at least June 30, 2017, to waive the advisory fee payable by the Fund in an amount equal to 100% of the net advisory fees the Adviser receives from the affiliated money market funds on investments by the Fund of uninvested cash in such affiliated money market funds.
For the year ended October 31, 2015, the Adviser waived advisory fees of $372,793.
The Trust has entered into a master administrative services agreement with Invesco pursuant to which the Fund has agreed to pay Invesco for certain administrative costs incurred in providing accounting services to the Fund. For the year ended October 31, 2015, expenses incurred under the agreement are shown in the Statement of Operations as Administrative services fees.
The Trust has entered into a transfer agency and service agreement with Invesco Investment Services, Inc. (“IIS”) pursuant to which the Fund has agreed to pay IIS a fee for providing transfer agency and shareholder services to the Fund and reimburse IIS for certain expenses incurred by IIS in the course of providing such services. IIS may make payments to intermediaries that provide omnibus account services, sub-accounting services and/or networking services. All fees payable by IIS to intermediaries that provide omnibus account services or sub-accounting are charged back to the Fund, subject to certain limitations approved by the Trust’s Board of Trustees. For the year ended October 31, 2015, expenses incurred under the agreement are shown in the Statement of Operations as Transfer agent fees.
The Trust has entered into master distribution agreements with Invesco Distributors, Inc. (“IDI”) to serve as the distributor for the Class A, Class B, Class C, Class R, Class Y and Class R5 shares of the Fund. The Trust has adopted plans pursuant to Rule 12b-1 under the 1940 Act with respect to the Fund’s Class A, Class B, Class C and Class R shares (collectively, the “Plans”). The Fund, pursuant to the Plans, pays IDI compensation at the annual rate of 0.25% of the Fund’s average daily net assets of Class A shares, 1.00% of the average daily net assets of Class B and Class C shares and 0.50% of the average daily net assets of Class R shares. Of the Plan payments, up to 0.25% of the average daily net assets of each class of shares may be paid to furnish continuing personal shareholder services to customers who purchase and own shares of such classes. Any amounts not paid as a service fee under the Plans would constitute an asset-based sales charge. Rules of the Financial Industry Regulatory Authority (“FINRA”) impose a cap on the total sales charges, including asset-based sales charges, that may be paid by any class of shares of the Fund. For the year ended October 31, 2015, expenses incurred under the Plans are shown in the Statement of Operations as Distribution fees.
Front-end sales commissions and CDSC (collectively, the “sales charges”) are not recorded as expenses of the Fund. Front-end sales commissions are deducted from proceeds from the sales of Fund shares prior to investment in Class A shares of the Fund. CDSC are deducted from redemption proceeds prior to remittance to the shareholder. During the year ended October 31, 2015, IDI advised the Fund that IDI retained $1,865 in front-end sales commissions from the sale of Class A shares and $18,228, $2,672 and $882 from Class A, Class B and Class C shares, respectively, for CDSC imposed on redemptions by shareholders.
Certain officers and trustees of the Trust are officers and directors of the Adviser, IIS and/or IDI.
15 Invesco Select Companies Fund
NOTE 3—Additional Valuation Information
GAAP defines fair value as the price that would be received to sell an asset or paid to transfer a liability in an orderly transaction between market participants at the measurement date, under current market conditions. GAAP establishes a hierarchy that prioritizes the inputs to valuation methods, giving the highest priority to readily available unadjusted quoted prices in an active market for identical assets (Level 1) and the lowest priority to significant unobservable inputs (Level 3), generally when market prices are not readily available or are unreliable. Based on the valuation inputs, the securities or other investments are tiered into one of three levels. Changes in valuation methods may result in transfers in or out of an investment’s assigned level:
| | Level 1 — | Prices are determined using quoted prices in an active market for identical assets. |
| | Level 2 — | Prices are determined using other significant observable inputs. Observable inputs are inputs that other market participants may use in pricing a security. These may include quoted prices for similar securities, interest rates, prepayment speeds, credit risk, yield curves, loss severities, default rates, discount rates, volatilities and others. |
| | Level 3 — | Prices are determined using significant unobservable inputs. In situations where quoted prices or observable inputs are unavailable (for example, when there is little or no market activity for an investment at the end of the period), unobservable inputs may be used. Unobservable inputs reflect the Fund’s own assumptions about the factors market participants would use in determining fair value of the securities or instruments and would be based on the best available information. |
The following is a summary of the tiered valuation input levels, as of October 31, 2015. The level assigned to the securities valuations may not be an indication of the risk or liquidity associated with investing in those securities. Because of the inherent uncertainties of valuation, the values reflected in the financial statements may materially differ from the value received upon actual sale of those investments.
| | | | | | | | | | | | | | | | |
| | | Level 1 | | | Level 2 | | | Level 3 | | | Total | |
Equity Securities | | $ | 830,658,267 | | | $ | 88,924 | | | $ | 0 | | | $ | 830,747,191 | |
NOTE 4—Investments in Other Affiliates
The 1940 Act defines an “affiliated person” as an issuance in which a fund holds 5% or more of the outstanding voting securities. The Fund has not owned enough of the outstanding voting securities of the issuer to have control (as defined in the 1940 Act) of that issuer. The following is a summary of the investments in other affiliates for the year ended October 31, 2015.
| | | | | | | | | | | | | | | | | | | | | | | | | | | | |
| | | Value
10/31/14 | | | Purchases
at Cost | | | Proceeds
from Sales | | | Change in
Unrealized
Appreciation
(Depreciation) | | | Realized
Gain (Loss) | | | Value
10/31/15 | | | Interest /
Dividend
Income | |
America’s Car-Mart, Inc. | | $ | 43,319,413 | | | $ | — | | | $ | — | | | $ | (11,060,676 | ) | | $ | — | | | $ | 32,258,737 | | | $ | — | |
American Public Education Inc. | | | 44,098,925 | | | | — | | | | (8,567,854 | ) | | | (8,695,866 | ) | | | (2,061,440 | ) | | | 24,773,765 | | | | — | |
Encore Capital Group, Inc. | | | 50,744,469 | | | | 20,676,989 | | | | — | | | | (6,411,145 | ) | | | — | | | | 65,010,313 | | | | — | |
Hampshire Group, Ltd. | | | 1,487,988 | | | | — | | | | — | | | | (1,399,064 | ) | | | — | | | | 88,924 | | | | — | |
ION Geophysical Corp. | | | 39,416,409 | | | | — | | | | — | | | | (34,207,812 | ) | | | — | | | | 5,208,597 | | | | — | |
Performant Financial Corp. | | | 28,744,105 | | | | 14,640,846 | | | | (20,900 | ) | | | (30,570,716 | ) | | | (25,512 | ) | | | 12,767,823 | | | | — | |
Total | | $ | 207,811,309 | | | $ | 35,317,835 | | | $ | (8,588,754 | ) | | $ | (92,345,279 | ) | | $ | (2,086,952 | ) | | $ | 140,108,159 | | | $ | — | |
NOTE 5—Security Transactions with Affiliated Funds
The Fund is permitted to purchase or sell securities from or to certain other Invesco Funds under specified conditions outlined in procedures adopted by the Board of Trustees of the Trust. The procedures have been designed to ensure that any purchase or sale of securities by the Fund from or to another fund or portfolio that is or could be considered an affiliate by virtue of having a common investment adviser (or affiliated investment advisers), common Trustees and/or common officers complies with Rule 17a-7 of the 1940 Act. Further, as defined under the procedures, each transaction is effected at the current market price. Pursuant to these procedures, for the year ended October 31, 2015, the Fund engaged in securities sales of $3,107,936, which resulted in net realized gains of $868,030.
NOTE 6—Expense Offset Arrangement(s)
The expense offset arrangement is comprised of transfer agency credits which result from balances in demand deposit accounts used by the transfer agent for clearing shareholder transactions. For the year ended October 31, 2015, the Fund received credits from this arrangement, which resulted in the reduction of the Fund’s total expenses of $2,254.
NOTE 7—Trustees’ and Officers’ Fees and Benefits
Trustees’ and Officers’ Fees and Benefits include amounts accrued by the Fund to pay remuneration to certain Trustees and Officers of the Fund. Trustees have the option to defer compensation payable by the Fund, and Trustees’ and Officers’ Fees and Benefits also include amounts accrued by the Fund to fund such deferred compensation amounts. Those Trustees who defer compensation have the option to select various Invesco Funds in which their deferral accounts shall be deemed to be invested. Finally, certain current Trustees were eligible to participate in a retirement plan that provided for benefits to be paid upon retirement to Trustees over a period of time based on the number of years of service. The Fund may have certain former Trustees who also participate in a retirement plan and receive benefits under such plan. Trustees’ and Officers’ Fees and Benefits include amounts accrued by the Fund to fund such retirement benefits. Obligations under the deferred compensation and retirement plans represent unsecured claims against the general assets of the Fund.
16 Invesco Select Companies Fund
NOTE 8—Cash Balances
The Fund is permitted to temporarily carry a negative or overdrawn balance in its account with State Street Bank and Trust Company, the custodian bank. Such balances, if any at period end, are shown in the Statement of Assets and Liabilities under the payable caption Amount due custodian. To compensate the custodian bank for such overdrafts, the overdrawn Fund may either (1) leave funds as a compensating balance in the account so the custodian bank can be compensated by earning the additional interest; or (2) compensate by paying the custodian bank at a rate agreed upon by the custodian bank and Invesco, not to exceed the contractually agreed upon rate.
NOTE 9—Distributions to Shareholders and Tax Components of Net Assets
Tax Character of Distributions to Shareholders Paid During the Fiscal Years Ended October 31, 2015 and 2014:
| | | | | | | | |
| | | 2015 | | | 2014 | |
Long-term capital gain | | $ | 132,504,743 | | | $ | 76,006,949 | |
Tax Components of Net Assets at Period-End:
| | | | |
| | | 2015 | |
Undistributed long-term gain | | $ | 162,883,270 | |
Net unrealized appreciation — investments | | | 9,386,396 | |
Net unrealized appreciation — other investments | | | 974 | |
Temporary book/tax differences | | | (159,046 | ) |
Late-Year ordinary loss deferral | | | (9,091,081 | ) |
Shares of beneficial interest | | | 687,636,573 | |
Total net assets | | $ | 850,657,086 | |
The difference between book-basis and tax-basis unrealized appreciation (depreciation) is due to differences in the timing of recognition of gains and losses on investments for tax and book purposes. The Fund’s net unrealized appreciation difference is attributable primarily to wash sales.
The temporary book/tax differences are a result of timing differences between book and tax recognition of income and/or expenses. The Fund’s temporary book/tax differences are the result of the trustee deferral of compensation and retirement plan benefits.
Capital loss carryforward is calculated and reported as of a specific date. Results of transactions and other activity after that date may affect the amount of capital loss carryforward actually available for the Fund to utilize. Capital losses generated in years beginning after December 22, 2010 can be carried forward for an unlimited period, whereas previous losses expire in eight tax years. Capital losses with an expiration period may not be used to offset capital gains until all net capital losses without an expiration date have been utilized. Capital loss carryforwards with no expiration date will retain their character as either short-term or long-term capital losses instead of as short-term capital losses as under prior law. The ability to utilize capital loss carryforwards in the future may be limited under the Internal Revenue Code and related regulations based on the results of future transactions.
The Fund does not have a capital loss carryforward as of October 31, 2015.
NOTE 10—Investment Securities
The aggregate amount of investment securities (other than short-term securities, U.S. Treasury obligations and money market funds, if any) purchased and sold by the Fund during the year ended October 31, 2015 was $131,694,553 and $338,379,074, respectively. Cost of investments on a tax basis includes the adjustments for financial reporting purposes as of the most recently completed federal income tax reporting period-end.
| | | | |
| Unrealized Appreciation (Depreciation) of Investment Securities on a Tax Basis | |
Aggregate unrealized appreciation of investment securities | | $ | 217,282,846 | |
Aggregate unrealized (depreciation) of investment securities | | | (207,896,450 | ) |
Net unrealized appreciation of investment securities | | $ | 9,386,396 | |
Cost of investments for tax purposes is $821,360,795.
NOTE 11—Reclassification of Permanent Differences
Primarily as a result of differing book/tax treatment of net operating loss and foreign currency transactions, on October 31, 2015, undistributed net investment income (loss) was increased by $6,190,117, undistributed net realized gain was increased by $3,210,345 and shares of beneficial interest was decreased by $9,400,462. This reclassification had no effect on the net assets of the Fund.
17 Invesco Select Companies Fund
NOTE 12—Share Information
| | | | | | | | | | | | | | | | |
| | | Summary of Share Activity | |
| | | Years ended October 31, | |
| | | 2015(a) | | | 2014 | |
| | | Shares | | | Amount | | | Shares | | | Amount | |
Sold: | | | | | | | | | | | | | | | | |
Class A | | | 1,412,942 | | | $ | 31,995,201 | | | | 3,644,392 | | | $ | 86,862,251 | |
Class B | | | 3,991 | | | | 75,134 | | | | 13,561 | | | | 301,065 | |
Class C | | | 108,970 | | | | 2,269,796 | | | | 333,846 | | | | 7,383,566 | |
Class R | | | 489,174 | | | | 10,794,717 | | | | 669,277 | | | | 15,849,454 | |
Class Y | | | 754,311 | | | | 17,155,525 | | | | 4,809,060 | | | | 116,897,383 | |
Class R5 | | | 506,037 | | | | 11,854,368 | | | | 613,241 | | | | 15,312,739 | |
| | | | |
Issued as reinvestment of dividends: | | | | | | | | | | | | | | | | |
Class A | | | 3,010,749 | | | | 66,718,192 | | | | 1,721,956 | | | | 38,847,334 | |
Class B | | | 42,091 | | | | 854,027 | | | | 24,878 | | | | 522,441 | |
Class C | | | 881,605 | | | | 17,861,315 | | | | 411,569 | | | | 8,634,710 | |
Class R | | | 313,180 | | | | 6,758,426 | | | | 163,418 | | | | 3,608,270 | |
Class Y | | | 1,152,785 | | | | 25,822,392 | | | | 623,137 | | | | 14,157,670 | |
Class R5 | | | 264,206 | | | | 6,089,938 | | | | 133,694 | | | | 3,115,068 | |
| | | | |
Automatic conversion of Class B shares to Class A shares: | | | | | | | | | | | | | | | | |
Class A | | | 133,661 | | | | 2,972,639 | | | | 78,001 | | | | 1,886,904 | |
Class B | | | (146,438 | ) | | | (2,972,639 | ) | | | (84,013 | ) | | | (1,886,904 | ) |
| | | | |
Reacquired: | | | | | | | | | | | | | | | | |
Class A | | | (10,911,072 | ) | | | (242,595,546 | ) | | | (12,693,542 | ) | | | (308,141,584 | ) |
Class B | | | (66,806 | ) | | | (1,354,850 | ) | | | (86,383 | ) | | | (1,935,382 | ) |
Class C | | | (1,894,478 | ) | | | (37,940,158 | ) | | | (1,203,216 | ) | | | (26,949,435 | ) |
Class R | | | (1,329,652 | ) | | | (29,284,209 | ) | | | (1,265,120 | ) | | | (29,867,986 | ) |
Class Y | | | (6,613,315 | ) | | | (147,367,317 | ) | | | (9,038,247 | ) | | | (219,828,759 | ) |
Class R5 | | | (851,150 | ) | | | (19,421,155 | ) | | | (1,544,955 | ) | | | (38,405,674 | ) |
Net increase (decrease) in share activity | | | (12,739,209 | ) | | $ | (279,714,204 | ) | | | (12,675,446 | ) | | $ | (313,636,869 | ) |
| (a) | There are entities that are record owners of more than 5% of the outstanding shares of the Fund and in the aggregate own 40% of the outstanding shares of the Fund. IDI has an agreement with these entities to sell Fund shares. The Fund, Invesco and/or Invesco affiliates may make payments to these entities, which are considered to be related to the Fund, for providing services to the Fund, Invesco and/or Invesco affiliates including but not limited to services such as securities brokerage, distribution, third party record keeping and account servicing. The Fund has no knowledge as to whether all or any portion of the shares owned of record by these entities are also owned beneficially. |
18 Invesco Select Companies Fund
NOTE 13—Financial Highlights
The following schedule presents financial highlights for a share of the Fund outstanding throughout the periods indicated.
| | | | | | | | | | | | | | | | | | | | | | | | | | | | | | | | | | | | | | | | | | | | | | | | | | | | | | | | |
| | | Net asset
value,
beginning
of period | | | Net
investment
income
(loss)(a) | | | Net gains
(losses)
on securities
(both
realized and
unrealized) | | | Total from
investment
operations | | | Dividends
from net
investment
income | | | Distributions
from net
realized
gains | | | Total
distributions | | | Net asset
value, end
of period | | | Total
return(b) | | | Net assets,
end of period
(000’s omitted) | | | Ratio of
expenses
to average
net assets
with fee waivers
and/or expenses
absorbed | | | Ratio of
expenses
to average net
assets without
fee waivers
and/or expenses
absorbed | | | Ratio of net
investment
income (loss)
to average
net assets | | | Portfolio
turnover(c) | |
Class A | |
Year ended 10/31/15 | | $ | 25.47 | | | $ | (0.19 | ) | | $ | (2.37 | ) | | $ | (2.56 | ) | | $ | — | | | $ | (2.47 | ) | | $ | (2.47 | ) | | $ | 20.44 | | | | (10.79 | )% | | $ | 475,536 | | | | 1.17 | %(d) | | | 1.20 | %(d) | | | (0.86 | )%(d) | | | 14 | % |
Year ended 10/31/14 | | | 23.95 | | | | (0.06 | ) | | | 2.71 | | | | 2.65 | | | | — | | | | (1.13 | ) | | | (1.13 | ) | | | 25.47 | | | | 11.66 | | | | 754,310 | | | | 1.16 | | | | 1.20 | | | | (0.28 | ) | | | 10 | |
Year ended 10/31/13 | | | 20.57 | | | | (0.12 | ) | | | 4.95 | | | | 4.83 | | | | (0.23 | ) | | | (1.22 | ) | | | (1.45 | ) | | | 23.95 | | | | 25.11 | | | | 883,072 | | | | 1.16 | | | | 1.20 | | | | (0.55 | ) | | | 19 | |
Year ended 10/31/12 | | | 18.97 | | | | (0.07 | ) | | | 1.67 | (e) | | | 1.60 | | | | — | | | | — | | | | — | | | | 20.57 | | | | 8.43 | | | | 725,950 | | | | 1.18 | | | | 1.23 | | | | (0.34 | ) | | | 37 | |
Year ended 10/31/11 | | | 15.50 | | | | (0.12 | ) | | | 3.59 | | | | 3.47 | | | | — | | | | — | | | | — | | | | 18.97 | | | | 22.39 | | | | 485,609 | | | | 1.24 | | | | 1.27 | | | | (0.64 | ) | | | 38 | |
Class B | | | | | | | | | | | | | | | | | | | | | | | | | | | | | | | | | | | | | | | | | | | | | | | | | | | | | | | | |
Year ended 10/31/15 | | | 23.55 | | | | (0.33 | ) | | | (2.16 | ) | | | (2.49 | ) | | | — | | | | (2.47 | ) | | | (2.47 | ) | | | 18.59 | | | | (11.44 | ) | | | 4,027 | | | | 1.92 | (d) | | | 1.95 | (d) | | | (1.61 | )(d) | | | 14 | |
Year ended 10/31/14 | | | 22.40 | | | | (0.23 | ) | | | 2.51 | | | | 2.28 | | | | — | | | | (1.13 | ) | | | (1.13 | ) | | | 23.55 | | | | 10.77 | | | | 9,039 | | | | 1.91 | | | | 1.95 | | | | (1.03 | ) | | | 10 | |
Year ended 10/31/13 | | | 19.32 | | | | (0.26 | ) | | | 4.65 | | | | 4.39 | | | | (0.09 | ) | | | (1.22 | ) | | | (1.31 | ) | | | 22.40 | | | | 24.22 | | | | 11,551 | | | | 1.91 | | | | 1.95 | | | | (1.30 | ) | | | 19 | |
Year ended 10/31/12 | | | 17.95 | | | | (0.21 | ) | | | 1.58 | (e) | | | 1.37 | | | | — | | | | — | | | | — | | | | 19.32 | | | | 7.63 | | | | 13,251 | | | | 1.93 | | | | 1.98 | | | | (1.09 | ) | | | 37 | |
Year ended 10/31/11 | | | 14.78 | | | | (0.24 | ) | | | 3.41 | | | | 3.17 | | | | — | | | | — | | | | — | | | | 17.95 | | | | 21.45 | | | | 15,478 | | | | 1.99 | | | | 2.02 | | | | (1.39 | ) | | | 38 | |
Class C | |
Year ended 10/31/15 | | | 23.53 | | | | (0.33 | ) | | | (2.16 | ) | | | (2.49 | ) | | | — | | | | (2.47 | ) | | | (2.47 | ) | | | 18.57 | | | | (11.45 | ) | | | 125,947 | | | | 1.92 | (d) | | | 1.95 | (d) | | | (1.61 | )(d) | | | 14 | |
Year ended 10/31/14 | | | 22.37 | | | | (0.23 | ) | | | 2.52 | | | | 2.29 | | | | — | | | | (1.13 | ) | | | (1.13 | ) | | | 23.53 | | | | 10.83 | | | | 180,853 | | | | 1.91 | | | | 1.95 | | | | (1.03 | ) | | | 10 | |
Year ended 10/31/13 | | | 19.30 | | | | (0.26 | ) | | | 4.64 | | | | 4.38 | | | | (0.09 | ) | | | (1.22 | ) | | | (1.31 | ) | | | 22.37 | | | | 24.19 | | | | 182,221 | | | | 1.91 | | | | 1.95 | | | | (1.30 | ) | | | 19 | |
Year ended 10/31/12 | | | 17.93 | | | | (0.21 | ) | | | 1.58 | (e) | | | 1.37 | | | | — | | | | — | | | | — | | | | 19.30 | | | | 7.64 | | | | 160,090 | | | | 1.93 | | | | 1.98 | | | | (1.09 | ) | | | 37 | |
Year ended 10/31/11 | | | 14.76 | | | | (0.24 | ) | | | 3.41 | | | | 3.17 | | | | — | | | | — | | | | — | | | | 17.93 | | | | 21.48 | | | | 123,286 | | | | 1.99 | | | | 2.02 | | | | (1.39 | ) | | | 38 | |
Class R | |
Year ended 10/31/15 | | | 24.88 | | | | (0.24 | ) | | | (2.31 | ) | | | (2.55 | ) | | | — | | | | (2.47 | ) | | | (2.47 | ) | | | 19.86 | | | | (11.03 | ) | | | 45,561 | | | | 1.42 | (d) | | | 1.45 | (d) | | | (1.11 | )(d) | | | 14 | |
Year ended 10/31/14 | | | 23.48 | | | | (0.12 | ) | | | 2.65 | | | | 2.53 | | | | — | | | | (1.13 | ) | | | (1.13 | ) | | | 24.88 | | | | 11.37 | | | | 70,177 | | | | 1.41 | | | | 1.45 | | | | (0.53 | ) | | | 10 | |
Year ended 10/31/13 | | | 20.19 | | | | (0.17 | ) | | | 4.86 | | | | 4.69 | | | | (0.18 | ) | | | (1.22 | ) | | | (1.40 | ) | | | 23.48 | | | | 24.83 | | | | 76,385 | | | | 1.41 | | | | 1.45 | | | | (0.80 | ) | | | 19 | |
Year ended 10/31/12 | | | 18.66 | | | | (0.12 | ) | | | 1.65 | (e) | | | 1.53 | | | | — | | | | — | | | | — | | | | 20.19 | | | | 8.20 | | | | 71,040 | | | | 1.43 | | | | 1.48 | | | | (0.59 | ) | | | 37 | |
Year ended 10/31/11 | | | 15.29 | | | | (0.16 | ) | | | 3.53 | | | | 3.37 | | | | — | | | | — | | | | — | | | | 18.66 | | | | 22.04 | | | | 62,112 | | | | 1.49 | | | | 1.52 | | | | (0.89 | ) | | | 38 | |
Class Y | |
Year ended 10/31/15 | | | 25.71 | | | | (0.13 | ) | | | (2.40 | ) | | | (2.53 | ) | | | — | | | | (2.47 | ) | | | (2.47 | ) | | | 20.71 | | | | (10.56 | ) | | | 147,927 | | | | 0.92 | (d) | | | 0.95 | (d) | | | (0.61 | )(d) | | | 14 | |
Year ended 10/31/14 | | | 24.11 | | | | (0.01 | ) | | | 2.74 | | | | 2.73 | | | | — | | | | (1.13 | ) | | | (1.13 | ) | | | 25.71 | | | | 11.92 | | | | 304,629 | | | | 0.91 | | | | 0.95 | | | | (0.03 | ) | | | 10 | |
Year ended 10/31/13 | | | 20.69 | | | | (0.06 | ) | | | 4.98 | | | | 4.92 | | | | (0.28 | ) | | | (1.22 | ) | | | (1.50 | ) | | | 24.11 | | | | 25.47 | | | | 372,632 | | | | 0.91 | | | | 0.95 | | | | (0.30 | ) | | | 19 | |
Year ended 10/31/12 | | | 19.03 | | | | (0.02 | ) | | | 1.68 | (e) | | | 1.66 | | | | — | | | | — | | | | — | | | | 20.69 | | | | 8.72 | | | | 235,268 | | | | 0.93 | | | | 0.98 | | | | (0.09 | ) | | | 37 | |
Year ended 10/31/11 | | | 15.51 | | | | (0.07 | ) | | | 3.59 | | | | 3.52 | | | | — | | | | — | | | | — | | | | 19.03 | | | | 22.70 | | | | 41,476 | | | | 0.99 | | | | 1.02 | | | | (0.39 | ) | | | 38 | |
Class R5 | |
Year ended 10/31/15 | | | 26.38 | | | | (0.12 | ) | | | (2.46 | ) | | | (2.58 | ) | | | — | | | | (2.47 | ) | | | (2.47 | ) | | | 21.33 | | | | (10.47 | ) | | | 51,659 | | | | 0.85 | (d) | | | 0.88 | (d) | | | (0.54 | )(d) | | | 14 | |
Year ended 10/31/14 | | | 24.69 | | | | 0.01 | | | | 2.81 | | | | 2.82 | | | | — | | | | (1.13 | ) | | | (1.13 | ) | | | 26.38 | | | | 12.01 | | | | 66,042 | | | | 0.84 | | | | 0.88 | | | | 0.04 | | | | 10 | |
Year ended 10/31/13 | | | 21.16 | | | | (0.05 | ) | | | 5.10 | | | | 5.05 | | | | (0.30 | ) | | | (1.22 | ) | | | (1.52 | ) | | | 24.69 | | | | 25.53 | | | | 81,527 | | | | 0.83 | | | | 0.87 | | | | (0.22 | ) | | | 19 | |
Year ended 10/31/12 | | | 19.45 | | | | (0.00 | ) | | | 1.71 | (e) | | | 1.71 | | | | — | | | | — | | | | — | | | | 21.16 | | | | 8.79 | | | | 71,138 | | | | 0.84 | | | | 0.89 | | | | (0.00 | ) | | | 37 | |
Year ended 10/31/11 | | | 15.82 | | | | (0.04 | ) | | | 3.67 | | | | 3.63 | | | | — | | | | — | | | | — | | | | 19.45 | | | | 22.95 | | | | 70,652 | | | | 0.83 | | | | 0.86 | | | | (0.23 | ) | | | 38 | |
| (a) | Calculated using average shares outstanding. |
| (b) | Includes adjustments in accordance with accounting principles generally accepted in the United States of America and as such, the net asset value for financial reporting purposes and the returns based upon those net asset values may differ from the net asset value and returns for shareholder transactions. Does not include sales charges and is not annualized for periods less than one year, if applicable. |
| (c) | Portfolio turnover is calculated at the fund level and is not annualized for periods less than one year, if applicable. |
| (d) | Ratios are based on average daily net assets (000’s omitted) of $640,877, $6,904, $160,870, $59,008, $242,317 and $62,550 for Class A, Class B, Class C, Class R, Class Y and Class R5 shares, respectively. |
| (e) | Net gains (losses) on securities (both realized and unrealized) include capital gains realized on distributions from Booz Allen Hamilton Holding Corp. on June 7, 2012 and Generac Holdings, Inc. on July 2, 2012. Net gains (losses) on securities (both realized and unrealized) excluding the capital gains are $1.55, $1.46, $1.46, $1.53, $1.56 and $1.59 for Class A, Class B, Class C, Class R, Class Y and Class R5, respectively. |
19 Invesco Select Companies Fund
Report of Independent Registered Public Accounting Firm
To the Board of Trustees of AIM Investment Funds (Invesco Investment Funds)
and Shareholders of Invesco Select Companies Fund:
In our opinion, the accompanying statement of assets and liabilities, including the schedule of investments, and the related statements of operations and of changes in net assets and the financial highlights present fairly, in all material respects, the financial position of Invesco Select Companies Fund (one of the funds constituting AIM Investment Funds (Invesco Investment Funds), hereafter referred to as the “Fund”) at October 31, 2015, the results of its operations for the year then ended, the changes in its net assets for each of the two years in the period then ended and the financial highlights for each of the five years in the period then ended, in conformity with accounting principles generally accepted in the United States of America. These financial statements and financial highlights (hereafter referred to as “financial statements”) are the responsibility of the Fund’s management. Our responsibility is to express an opinion on these financial statements based on our audits. We conducted our audits of these financial statements in accordance with the standards of the Public Company Accounting Oversight Board (United States). Those standards require that we plan and perform the audit to obtain reasonable assurance about whether the financial statements are free of material misstatement. An audit includes examining, on a test basis, evidence supporting the amounts and disclosures in the financial statements, assessing the accounting principles used and significant estimates made by management, and evaluating the overall financial statement presentation. We believe that our audits, which included confirmation of securities at October 31, 2015 by correspondence with the custodian and brokers, and the application of alternative auditing procedures where confirmations of security purchases have not been received, provide a reasonable basis for our opinion.
PRICEWATERHOUSECOOPERS LLP
December 23, 2015
Houston, Texas
20 Invesco Select Companies Fund
Calculating your ongoing Fund expenses
Example
As a shareholder of the Fund, you incur two types of costs: (1) transaction costs, which may include sales charges (loads) on purchase payments or contingent deferred sales charges on redemptions, if any; and (2) ongoing costs, including management fees, distribution and/or service (12b-1) fees, and other Fund expenses. This example is intended to help you understand your ongoing costs (in dollars) of investing in the Fund and to compare these costs with ongoing costs of investing in other mutual funds. The example is based on an investment of $1,000 invested at the beginning of the period and held for the entire period May 1, 2015 through October 31, 2015.
Actual expenses
The table below provides information about actual account values and actual expenses. You may use the information in this table, together with the amount you invested, to estimate the expenses that you paid over the period. Simply divide your account value by $1,000 (for example, an $8,600 account value divided by $1,000 = 8.6), then multiply the result by the number in the table under the heading entitled “Actual Expenses Paid During Period” to estimate the expenses you paid on your account during this period.
Hypothetical example for comparison purposes
The table below also provides information about hypothetical account values and hypothetical expenses based on the Fund’s actual expense ratio and an assumed rate of return of 5% per year before expenses, which is not the Fund’s actual return.
The hypothetical account values and expenses may not be used to estimate the actual ending account balance or expenses you paid for the period. You may use this information to compare the ongoing costs of investing in the Fund and other funds. To do so, compare this 5% hypothetical example with the 5% hypothetical examples that appear in the shareholder reports of the other funds.
Please note that the expenses shown in the table are meant to highlight your ongoing costs only and do not reflect any transaction costs, such as sales charges (loads) on purchase payments or contingent deferred sales charges on redemptions, if any. Therefore, the hypothetical information is useful in comparing ongoing costs only, and will not help you determine the relative total costs of owning different funds. In addition, if these transaction costs were included, your costs would have been higher.
| | | | | | | | | | | | | | | | | | | | | | | | |
| Class | | Beginning
Account Value
(05/01/15) | | | ACTUAL | | | HYPOTHETICAL (5% annual return before expenses) | | | Annualized
Expense
Ratio | |
| | | Ending
Account Value
(10/31/15)1 | | | Expenses
Paid During
Period2 | | | Ending
Account Value
(10/31/15) | | | Expenses
Paid During
Period2 | | |
| A | | $ | 1,000.00 | | | $ | 888.30 | | | $ | 5.57 | | | $ | 1,019.31 | | | $ | 5.96 | | | | 1.17 | % |
| B | | | 1,000.00 | | | | 885.20 | | | | 9.12 | | | | 1,015.53 | | | | 9.75 | | | | 1.92 | |
| C | | | 1,000.00 | | | | 1,114.50 | | | | 10.23 | | | | 1,015.53 | | | | 9.75 | | | | 1.92 | |
| R | | | 1,000.00 | | | | 887.40 | | | | 6.76 | | | | 1,018.05 | | | | 7.22 | | | | 1.42 | |
| Y | | | 1,000.00 | | | | 889.60 | | | | 4.38 | | | | 1,020.57 | | | | 4.69 | | | | 0.92 | |
| R5 | | | 1,000.00 | | | | 890.20 | | | | 4.00 | | | | 1,020.97 | | | | 4.28 | | | | 0.84 | |
| 1 | The actual ending account value is based on the actual total return of the Fund for the period May 1, 2015 through October 31, 2015, after actual expenses and will differ from the hypothetical ending account value which is based on the Fund’s expense ratio and a hypothetical annual return of 5% before expenses. |
| 2 | Expenses are equal to the Fund’s annualized expense ratio as indicated above multiplied by the average account value over the period, multiplied by 184/365 to reflect the most recent fiscal half year. |
21 Invesco Select Companies Fund
Approval of Investment Advisory and Sub-Advisory Contracts
The Board of Trustees (the Board) of AIM Investment Funds (Invesco Investment Funds) is required under the Investment Company Act of 1940, as amended, to approve annually the renewal of Invesco Select Companies Fund’s (the Fund) investment advisory agreements. During contract renewal meetings held on June 9-10, 2015, the Board as a whole, and the disinterested or “independent” Trustees, who comprise over 75% of the Board, voting separately, approved the continuance for the Fund of the Master Investment Advisory Agreement with Invesco Advisers, Inc. (Invesco Advisers and the investment advisory agreement) and the Master Intergroup Sub-Advisory Contract for Mutual Funds with Invesco Asset Management Deutschland GmbH, Invesco Asset Management Limited, Invesco Asset Management (Japan) Limited, Invesco Hong Kong Limited, Invesco Senior Secured Management, Inc. and Invesco Canada Ltd. (collectively, the Affiliated Sub-Advisers and the sub-advisory contracts) for another year, effective July 1, 2015.
In evaluating the fairness and reasonableness of compensation under the Fund’s investment advisory agreement and sub-advisory contracts, the Board considered, among other things, the factors discussed below. The Board determined that continuation of the Fund’s investment advisory agreement and the sub-advisory contracts are in the best interest of the Fund and its shareholders and that the compensation payable to Invesco Advisers and the Affiliated Sub-Advisers under the agreements is fair and reasonable.
The Board’s Fund Evaluation Process
The Board’s Investments Committee has established three Sub-Committees, each of which is primarily responsible for overseeing the performance and investment management services provided by Invesco Advisers and the Affiliated Sub-Advisers to a number of the funds advised by Invesco Advisers (the Invesco Funds). The Sub-Committees meet throughout the year to review the performance of their assigned Invesco Funds, including reviewing materials prepared under the direction of the independent Senior Officer, an officer of the Invesco Funds who reports directly to the independent Trustees. Over the course of each year, the Sub-Committees meet with portfolio managers for their assigned Invesco Funds and other members of management to review the performance, investment objective(s), policies, strategies, limitations and investment risks of these funds. The Board had the benefit of reports form the Sub-Committees and Investments Committee throughout the year in considering approval of the continuance of each Invesco Fund’s investment advisory agreement and sub-advisory contracts for another year.
During the contract renewal process, the Board receives comparative performance and fee data regarding the Invesco Funds prepared by Invesco Advisers and Lipper Inc. (Lipper), an independent provider of investment company data. The Board also receives a report and this independent written evaluation from the Senior Officer. The Senior Officer’s evaluation is prepared as part of his responsibility to manage the process by which the Invesco Funds’ proposed management fees are negotiated during the annual contract renewal process to ensure they are negotiated in a manner that is at arms’ length and reasonable. In addition to meetings with Invesco Advisers and fund counsel, the independent Trustees also discuss the continuance of the investment advisory agreement and sub-advisory contracts in separate sessions with the Senior Officer and with independent legal counsel.
The Trustees recognized that the advisory fee rates for the Invesco Funds are, in many cases, the result of years of review and negotiation. The Trustees’ deliberations and conclusions in a particular year may be based in part on their deliberations and conclusions regarding these same arrangements throughout the year and in prior years. The Trustees’ review and conclusions are based on the comprehensive consideration of all information presented to them and are not the result of any single determinative factor. Moreover, one Trustee may have weighed a particular piece of information or factor differently than another Trustee.
The discussion below is a summary of the Senior Officer’s independent written evaluation with respect to the Fund’s investment advisory agreement as well as a discussion of the material factors and related conclusions that formed the basis for the Board’s approval of the Fund’s investment advisory agreement and sub-advisory contracts. Unless otherwise stated, this information is current as of June 10, 2015, and does not reflect consideration of factors that became known to the Board after that date.
Factors and Conclusions and Summary of Independent Written Fee Evaluation
| A. | Nature, Extent and Quality of Services Provided by Invesco Advisers and the Affiliated Sub-Advisers |
The Board reviewed the advisory services provided to the Fund by Invesco Advisers under the Fund’s investment advisory agreement, the performance of Invesco Advisers in providing these services, and the credentials and experience of the officers and employees of Invesco Advisers who provide these services, including the Fund’s portfolio manager or managers. The Board’s review of the qualifications of Invesco Advisers to provide advisory services included the Board’s
consideration of Invesco Advisers’ investment process oversight, independent credit analysis and investment risk management. The Board also considered non-advisory services that Invesco Advisers and its affiliates provide to the Invesco Funds such as various back office support functions, equity and fixed income trading operations, internal audit, distribution, valuation and legal and compliance.
In determining whether to continue the Fund’s investment advisory agreement, the Board considered the benefits of reapproving an existing relationship and the greater uncertainty that may be associated with entering into a new relationship. The Board concluded that the nature, extent and quality of the services provided to the Fund by Invesco Advisers are appropriate and satisfactory and consistent with the terms of the Fund’s investment advisory agreement.
The Board reviewed the services that may be provided by the Affiliated Sub-Advisers under the sub-advisory contracts and the credentials and experience of the officers and employees of the Affiliated Sub-Advisers who provide these services. The Board noted that the Affiliated Sub-Advisers have offices and personnel that are located in financial centers around the world. As a result, the Affiliated Sub-Advisers can provide research and investment analysis on the markets and economies of various countries in which the Fund may invest, make recommendations regarding securities and assist with security trades. The Board concluded that the sub-advisory contracts benefit the Fund and its shareholders by permitting Invesco Advisers to use the resources and talents of the Affiliated Sub-Advisers in managing the Fund. The Board concluded that the nature, extent and quality of the services that may be provided by the Affiliated Sub-Advisers are appropriate and satisfactory and consistent with the terms of the Fund’s sub-advisory contracts.
The Board considered Fund performance as a relevant factor in considering whether to approve the investment advisory agreement as well as the sub-advisory contracts for the Fund, as Invesco Canada Ltd. currently manages assets of the Fund.
The Board compared the Fund’s performance during the past one, three and five calendar years to the performance of funds in the Lipper performance universe and against the Lipper Small-Cap Core Funds Index. The Board noted that performance of Class A shares of the Fund was in the first quintile of its performance universe for the one year period, the fifth quintile for the three year period and the third quintile for the five year period (the first quintile being the best performing funds and the fifth quintile being the worst performing funds). The Board noted that performance of Class A shares of the Fund was above the performance
22 Invesco Select Companies Fund
of the Index for the one and five year periods and below the performance of the Index for the three year periods. The Trustees also reviewed more recent Fund performance and this review did not change their conclusions.
| C. | Advisory and Sub-Advisory Fees |
The Board compared the Fund’s contractual management fee rate to the contractual management fee rates of funds in the Fund’s Lipper expense group at a common asset level. The Board noted that the contractual management fee rate for Class A shares of the Fund was below the median contractual management fee rate of funds in its expense group. The Board noted that the term “contractual management fee” may include both advisory and certain administrative services fees, but that Lipper does not provide information on a fund by fund basis as to what is included. The Board noted that Invesco Advisers does not charge the Invesco Funds for the administrative services included in the term as defined by Lipper. The Board also reviewed the methodology used by Lipper in providing expense group information, which includes using each fund’s contractual management fee schedule (including any applicable breakpoints) as reported in the most recent prospectus or statement of additional information for each fund in the expense group.
The Board also compared the Fund’s effective advisory fee rate (the advisory fee rate after advisory fee waivers and before other expense limitations/waivers) to the effective advisory fee rates of other mutual funds advised by Invesco Advisers and its affiliates with investment strategies comparable to those of the Fund. The Board noted that the Fund’s rate was below the effective advisory fee rate of one off-shore advised by Invesco Advisers using a similar investment process. The Board also noted how the Fund’s rate compared to the effective sub-adviser fee rate of one fund sub-advised by Invesco Advisers. The Board noted that Invesco Advisers and the Affiliated Sub-Advisers do not manage other client accounts with investment strategies comparable to those of the Fund.
The Board also considered the services that may be provided by the Affiliated Sub-Advisers pursuant to the sub-advisory contracts, as well as the fees payable by Invesco Advisers to the Affiliated Sub-Advisers pursuant to the sub-advisory contracts. The Board noted that Invesco Advisers retains overall responsibility for, and provides services to, sub-advised Invesco Funds, including oversight of the Affiliated Sub-Advisers as well as the additional services described herein other than day-to-day portfolio management. The Board also noted that the sub-advisory fees are not paid directly by the Fund, but rather, are payable by Invesco Advisers to the Affiliated Sub-Advisers.
| D. | Economies of Scale and Breakpoints |
The Board considered the extent to which there are economies of scale in the provision of advisory services to the Fund. The Board also considered whether the Fund benefits from economies of scale through contractual
breakpoints in the Fund’s advisory fee schedule. The Board also noted that the Fund shares directly in economies of scale through lower fees charged by third party service providers based on the combined size of the Invesco Funds and other clients advised by Invesco Advisers.
| E. | Profitability and Financial Resources |
The Board reviewed information from Invesco Advisers concerning the costs of the advisory and other services that Invesco Advisers and its affiliates provide to the Fund and the Invesco Funds and the profitability of Invesco Advisers and its affiliates in providing these services. The Board received information from Invesco Advisers about the methodology used to prepare the profitability information. The Board noted that Invesco Advisers continues to operate at a net profit from services Invesco Advisers and its affiliates provide to the Invesco Funds and the Fund. The Board received and accepted information from Invesco Advisers demonstrating that Invesco Advisers and each Affiliated Sub-Adviser are financially sound and have the resources necessary to perform their obligations under the investment advisory agreement and sub-advisory contracts.
| F. | Collateral Benefits to Invesco Advisers and its Affiliates |
The Board considered various other benefits received by Invesco Advisers and its affiliates from the relationship with the Fund, including the fees received for providing transfer agency and distribution services to the Fund. The Board considered comparative information regarding fees charged for these services, including information provided by Lipper and other independent sources. The Board considered the performance of Invesco Advisers and its affiliates in providing these services and the organizational structure employed to provide these services. The Board also considered that these services are provided to the Fund pursuant to written contracts that are reviewed and approved on an annual basis by the Board; and that the services are required for the operation of the Fund.
The Board considered the benefits realized by Invesco Advisers and the Affiliated Sub-Advisers as a result of portfolio brokerage transactions executed through “soft dollar” arrangements. The Board noted that soft dollar arrangements shift the payment obligation for research services from Invesco Advisers and the Affiliated Sub-Advisers to the Invesco Funds and that the research received may be used with other clients of Invesco Advisers and may reduce Invesco Advisers’ and the Affiliated Sub-Advisers’ expenses. The Board also considered that it receives periodic reports from the Chief Compliance Officer of the Invesco Funds demonstrating that these arrangements are consistent with regulatory requirements. The Board did not deem the soft dollar arrangements to be inappropriate.
The Board considered that the Fund’s uninvested cash and cash collateral from any securities lending arrangements may be
invested in money market funds advised by Invesco Advisers pursuant to procedures approved by the Board. The Board noted that Invesco Advisers receives advisory fees from these affiliated money market funds attributable to such investments, although Invesco Advisers has contractually agreed to waive through varying periods the advisory fees payable by the Invesco Funds with respect to investments in the affiliated money market funds. The waiver is in an amount equal to 100% of the net advisory fee Invesco Advisers receives from the affiliated money market funds with respect to the Fund’s investment in the affiliated money market funds of uninvested cash, but not cash collateral. The Board concluded that the amount of advisory fees received by Invesco Advisors from the Fund’s investment of cash collateral from any securities lending arrangements in the affiliated money market funds is fair and reasonable.
The Board also considered the Fund may use an affiliated broker to execute certain trades for the Fund to among other things, control information leakage, and were advised that such trades would be executed in compliance with rules under the Investment Company Act of 1940, as amended, and consistent with best execution obligations.
23 Invesco Select Companies Fund
Tax Information
Form 1099-DIV, Form 1042-S and other year-end tax information provide shareholders with actual calendar year amounts that should be included in their tax returns. Shareholders should consult their tax advisors.
The following distribution information is being provided as required by the Internal Revenue Code or to meet a specific state’s requirement.
The Fund designates the following amounts or, if subsequently determined to be different, the maximum amount allowable for its fiscal year ended October 31, 2015:
| | | | |
Federal and State Income Tax | |
Long-Term Capital Gain Distributions | | $ | 132,504,743 | |
Qualified Dividend Income* | | | 0 | % |
Corporate Dividends Received Deduction* | | | 0 | % |
U.S. Treasury Obligations* | | | 0 | % |
| | * | The above percentages are based on ordinary income dividends paid to shareholders during the Fund’s fiscal year. |
24 Invesco Select Companies Fund
Trustees and Officers
The address of each trustee and officer is AIM Investment Funds (Invesco Investment Funds) (the “Trust”), 11 Greenway Plaza, Suite 1000, Houston, Texas 77046-1173. The trustees serve for the life of the Trust, subject to their earlier death, incapacitation, resignation, retirement or removal as more specifically provided in the Trust’s organizational documents. Each officer serves for a one year term or until their successors are elected and qualified. Column two below includes length of time served with predecessor entities, if any.
| | | | | | | | |
Name, Year of Birth and
Position(s) Held with the Trust | | Trustee and/
or Officer Since | | Principal Occupation(s)
During Past 5 Years | | Number of Funds in Fund Complex Overseen by Trustee | | Other Directorship(s) Held by Trustee During Past 5 Years |
| Interested Persons | | | | | | | | |
| Martin L. Flanagan1 — 1960 Trustee | | 2007 | | Executive Director, Chief Executive Officer and President, Invesco Ltd. (ultimate parent of Invesco and a global investment management firm); Advisor to the Board, Invesco Advisers, Inc. (formerly known as Invesco Institutional (N.A.), Inc.); Trustee, The Invesco Funds; Vice Chair, Investment Company Institute; and Member of Executive Board, SMU Cox School of Business Formerly: Chairman and Chief Executive Officer, Invesco Advisers, Inc. (registered investment adviser); Director, Chairman, Chief Executive Officer and President, IVZ Inc. (holding company), INVESCO Group Services, Inc. (service provider) and Invesco North American Holdings, Inc. (holding company); Director, Chief Executive Officer and President, Invesco Holding Company Limited (parent of Invesco and a global investment management firm); Director, Invesco Ltd.; Chairman, Investment Company Institute and President, Co-Chief Executive Officer, Co-President, Chief Operating Officer and Chief Financial Officer, Franklin Resources, Inc. (global investment management organization). | | 145 | | None |
Philip A. Taylor2 — 1954
Trustee, President and Principal Executive Officer | | 2006 | | Head of North American Retail and Senior Managing Director, Invesco Ltd.; Director, Co-Chairman, Co-President and Co-Chief Executive Officer, Invesco Advisers, Inc. (formerly known as Invesco Institutional (N.A.), Inc.) (registered investment adviser); Director, Chairman, Chief Executive Officer and President, Invesco Management Group, Inc. (formerly known as Invesco Aim Management Group, Inc.) (financial services holding company); Director and President, INVESCO Funds Group, Inc. (registered investment adviser and registered transfer agent); Director and Chairman, Invesco Investment Services, Inc. (formerly known as Invesco Aim Investment Services, Inc.) (registered transfer agent) and IVZ Distributors, Inc. (formerly known as INVESCO Distributors, Inc.) (registered broker dealer); Chief Executive Officer, Invesco Corporate Class Inc. (corporate mutual fund company) Director, Chairman and Chief Executive Officer, Invesco Canada Ltd. (formerly known as Invesco Trimark Ltd./Invesco Trimark Ltèe) (registered investment adviser and registered transfer agent); Trustee, President and Principal Executive Officer, The Invesco Funds (other than AIM Treasurer’s Series Trust (Invesco Treasurer’s Series Trust), Short-Term Investments Trust and Invesco Management Trust); Trustee and Executive Vice President, The Invesco Funds (AIM Treasurer’s Series Trust (Invesco Treasurer’s Series Trust), Short-Term Investments Trust and Invesco Management Trust only); Director, Invesco Investment Advisers LLC (formerly known as Van Kampen Asset Management); Director, Chief Executive Officer and President, Van Kampen Exchange Corp. Formerly: Director, President and Chairman, Invesco Inc. (holding company), Invesco Canada Holdings Inc. (holding company), Trimark Investments Ltd./Placements Trimark Ltèe and Invesco Financial Services Ltd/Services Financiers Invesco Ltèe; Chief Executive Officer, Invesco Canada Fund Inc (corporate mutual fund company); Director and Chairman, Van Kampen Investor Services Inc.; Director, Chief Executive Officer and President, 1371 Preferred Inc. (holding company) and Van Kampen Investments Inc.; Director and President, AIM GP Canada Inc. (general partner for limited partnerships) and Van Kampen Advisors, Inc.; Director and Chief Executive Officer, Invesco Trimark Dealer Inc. (registered broker dealer); Director, Invesco Distributors, Inc. (formerly known as Invesco Aim Distributors, Inc.) (registered broker dealer); Manager, Invesco PowerShares Capital Management LLC; Director, Chief Executive Officer and President, Invesco Advisers, Inc.; Director, Chairman, Chief Executive Officer and President, Invesco Aim Capital Management, Inc.; President, Invesco Trimark Dealer Inc. and Invesco Trimark Ltd./Invesco Trimark Ltèe; Director and President, AIM Trimark Corporate Class Inc. and AIM Trimark Canada Fund Inc.; Senior Managing Director, Invesco Holding Company Limited; Director and Chairman, Fund Management Company (former registered broker dealer); President and Principal Executive Officer, The Invesco Funds (AIM Treasurer’s Series Trust (Invesco Treasurer’s Series Trust), and Short-Term Investments Trust only); President, AIM Trimark Global Fund Inc. and AIM Trimark Canada Fund Inc.. | | 145 | | None |
| 1 | Mr. Flanagan is considered an interested person (within the meaning of Section 2(a)(19) of the 1940 Act) of the Trust because he is an officer of the Adviser to the Trust, and an officer and a director of Invesco Ltd., ultimate parent of the Adviser. |
| 2 | Mr. Taylor is considered an interested person (within the meaning of Section 2(a)(19) of the 1940 Act) of the Trust because he is an officer and a director of the Adviser. |
T-1 Invesco Select Companies Fund
Trustees and Officers—(continued)
| | | | | | | | |
Name, Year of Birth and Position(s) Held with the Trust | | Trustee and/ or Officer Since | | Principal Occupation(s) During Past 5 Years | | Number of Funds in Fund Complex Overseen by Trustee | | Other Directorship(s) Held by Trustee During Past 5 Years |
| Independent Trustees | | | | | | | | |
Bruce L. Crockett — 1944 Trustee and Chair | | 2003 | | Chairman, Crockett Technologies Associates (technology consulting company) Formerly: Director, Captaris (unified messaging provider); Director, President and Chief Executive Officer, COMSAT Corporation; Chairman, Board of Governors of INTELSAT (international communications company); ACE Limited (insurance company); Independent Directors Council and Investment Company Institute | | 145 | | ALPS (Attorneys Liability Protection Society) (insurance company) and Globe Specialty Metals, Inc. (metallurgical company) |
David C. Arch — 1945 Trustee | | 2010 | | Chairman of Blistex Inc., a consumer health care products manufacturer | | 145 | | Board member of the Illinois Manufacturers’ Association; Member of the Board of Visitors, Institute for the Humanities, University of Michigan; Member of the Audit Committee of the Edward-Elmhurst Hospital |
James T. Bunch — 1942 Trustee | | 2000 | | Managing Member, Grumman Hill Group LLC (family office/private equity investments) Formerly: Founder, Green Manning & Bunch Ltd. (investment banking firm) (1988-2010); Executive Committee, United States Golf Association; and Chairman, Board of Governors, Western Golf Association | | 145 | | Chairman of the Board of Trustees, Evans Scholars Foundation; and Chairman of the Board, Denver Film Society |
Rodney F. Dammeyer — 1940 Trustee | | 2010 | | Chairman of CAC, LLC, (private company offering capital investment and management advisory services) Formerly: Prior to 2001, Managing Partner at Equity Group Corporate Investments; Prior to 1995, Chief Executive Officer of Itel Corporation (formerly Anixter International); Prior to 1985, experience includes Senior Vice President and Chief Financial Officer of Household International, Inc., Executive Vice President and Chief Financial Officer of Northwest Industries, Inc. and Partner of Arthur Andersen & Co.; From 1987 to 2010, Director/Trustee of investment companies in the Van Kampen Funds complex | | 145 | | Director of Quidel Corporation and Stericycle, Inc. |
Albert R. Dowden — 1941 Trustee | | 2003 | | Director of a number of public and private business corporations, including the Boss Group, Ltd. (private investment and management); Nature’s Sunshine Products, Inc. and Reich & Tang Funds (5 portfolios) (registered investment company) Formerly: Director, Homeowners of America Holding Corporation/Homeowners of America Insurance Company (property casualty company); Director, Continental Energy Services, LLC (oil and gas pipeline service); Director, CompuDyne Corporation (provider of product and services to the public security market) and Director, Annuity and Life Re (Holdings), Ltd. (reinsurance company); Director, President and Chief Executive Officer, Volvo Group North America, Inc.; Senior Vice President, AB Volvo; Director of various public and private corporations; Chairman, DHJ Media, Inc.; Director, Magellan Insurance Company; and Director, The Hertz Corporation, Genmar Corporation (boat manufacturer), National Media Corporation; Advisory Board of Rotary Power International (designer, manufacturer, and seller of rotary power engines); and Chairman, Cortland Trust, Inc. (registered investment company) | | 145 | | Director of: Nature’s Sunshine Products, Inc., Reich & Tang Funds, Homeowners of America Holding Corporation/ Homeowners of America Insurance Company, the Boss Group |
Jack M. Fields — 1952 Trustee | | 2003 | | Chief Executive Officer, Twenty First Century Group, Inc. (government affairs company); Owner and Chief Executive Officer, Dos Angeles Ranch, L.P. (cattle, hunting, corporate entertainment); and Discovery Global Education Fund (non-profit) Formerly: Chief Executive Officer, Texana Timber LP (sustainable forestry company); Director of Cross Timbers Quail Research Ranch (non-profit); and member of the U.S. House of Representatives | | 145 | | Insperity, Inc. (formerly known as Administaff) |
Prema Mathai-Davis — 1950 Trustee | | 2003 | | Retired. Formerly: Chief Executive Officer, YWCA of the U.S.A. | | 145 | | None |
Larry Soll — 1942 Trustee | | 1997 | | Retired. Formerly: Chairman, Chief Executive Officer and President, Synergen Corp. (a biotechnology company) | | 145 | | None |
Hugo F. Sonnenschein — 1940 Trustee | | 2010 | | President Emeritus and Honorary Trustee of the University of Chicago and the Adam Smith Distinguished Service Professor in the Department of Economics at the University of Chicago. Prior to 2000, President of the University of Chicago | | 145 | | Trustee of the University of Rochester and a member of its investment committee; Member of the National Academy of Sciences and the American Philosophical Society; Fellow of the American Academy of Arts and Sciences |
Raymond Stickel, Jr. — 1944 Trustee | | 2005 | | Retired. Formerly: Director, Mainstay VP Series Funds, Inc. (25 portfolios) and Partner, Deloitte & Touche | | 145 | | None |
T-2 Invesco Select Companies Fund
Trustees and Officers—(continued)
| | | | | | | | |
Name, Year of Birth and Position(s) Held with the Trust | | Trustee and/ or Officer Since | | Principal Occupation(s) During Past 5 Years | | Number of Funds in Fund Complex Overseen by Trustee | | Other Directorship(s) Held by Trustee During Past 5 Years |
| Independent Trustees—(continued) |
Suzanne H. Woolsey — 1941 Trustee | | 2014 | | Chief Executive Officer of Woolsey Partners LLC | | 145 | | Emeritus Chair of the Board of Trustees of the Institute for Defense Analyses; Trustee of Colorado College; Trustee of California Institute of Technology; Prior to 2014, Director of Fluor Corp.; Prior to 2010, Trustee of the German Marshall Fund of the United States; Prior to 2010 Trustee of the Rocky Mountain Institute |
| Other Officers | | | | | | | | |
Russell C. Burk — 1958
Senior Vice President and Senior Officer | | 2005 | | Senior Vice President and Senior Officer, The Invesco Funds | | N/A | | N/A |
John M. Zerr — 1962
Senior Vice President, Chief Legal Officer and Secretary | | 2006 | | Director, Senior Vice President, Secretary and General Counsel, Invesco Management Group, Inc. (formerly known as Invesco Aim Management Group, Inc.) and Van Kampen Exchange Corp.; Senior Vice President, Invesco Advisers, Inc. (formerly known as Invesco Institutional (N.A.), Inc.) (registered investment adviser); Senior Vice President and Secretary, Invesco Distributors, Inc. (formerly known as Invesco Aim Distributors, Inc.); Director, Vice President and Secretary, Invesco Investment Services, Inc. (formerly known as Invesco Aim Investment Services, Inc.) and IVZ Distributors, Inc. (formerly known as INVESCO Distributors, Inc.); Director and Vice President, INVESCO Funds Group, Inc.; Senior Vice President, Chief Legal Officer and Secretary, The Invesco Funds; Managing Director, Invesco PowerShares Capital Management LLC; Director, Secretary and General Counsel, Invesco Investment Advisers LLC (formerly known as Van Kampen Asset Management); Secretary and General Counsel, Invesco Capital Markets, Inc. (formerly known as Van Kampen Funds Inc.) and Chief Legal Officer, PowerShares Exchange-Traded Fund Trust, PowerShares Exchange-Traded Fund Trust II, PowerShares India Exchange-Traded Fund Trust, PowerShares Actively Managed Exchange-Traded Fund Trust, and PowerShares Actively Managed Exchange-Traded Commodity Fund Trust Formerly: Director and Vice President, Van Kampen Advisors Inc.; Director, Vice President, Secretary and General Counsel, Van Kampen Investor Services Inc.; Director, Invesco Distributors, Inc. (formerly known as Invesco Aim Distributors, Inc.); Director, Senior Vice President, General Counsel and Secretary, Invesco Aim Advisers, Inc. and Van Kampen Investments Inc.; Director, Vice President and Secretary, Fund Management Company; Director, Senior Vice President, Secretary, General Counsel and Vice President, Invesco Aim Capital Management, Inc.; Chief Operating Officer and General Counsel, Liberty Ridge Capital, Inc. (an investment adviser); Vice President and Secretary, PBHG Funds (an investment company) and PBHG Insurance Series Fund (an investment company); Chief Operating Officer, General Counsel and Secretary, Old Mutual Investment Partners (a broker-dealer); General Counsel and Secretary, Old Mutual Fund Services (an administrator) and Old Mutual Shareholder Services (a shareholder servicing center); Executive Vice President, General Counsel and Secretary, Old Mutual Capital, Inc. (an investment adviser); and Vice President and Secretary, Old Mutual Advisors Funds (an investment company) | | N/A | | N/A |
Sheri Morris — 1964
Vice President, Treasurer and Principal Financial Officer | | 2003 | | Vice President, Treasurer and Principal Financial Officer, The Invesco Funds; Vice President, Invesco Advisers, Inc. (formerly known as Invesco Institutional (N.A.), Inc.) (registered investment adviser); and Vice President, PowerShares Exchange-Traded Fund Trust, PowerShares Exchange-Traded Fund Trust II, PowerShares India Exchange-Traded Fund Trust, PowerShares Actively Managed Exchange-Traded Fund Trust, and PowerShares Actively Managed Exchange-Traded Commodity Fund Trust Formerly: Vice President, Invesco Aim Advisers, Inc., Invesco Aim Capital Management, Inc. and Invesco Aim Private Asset Management, Inc.; Assistant Vice President and Assistant Treasurer, The Invesco Funds and Assistant Vice President, Invesco Advisers, Inc., Invesco Aim Capital Management, Inc. and Invesco Aim Private Asset Management, Inc.; and Treasurer, PowerShares Exchange-Traded Fund Trust, PowerShares Exchange-Traded Fund Trust II, PowerShares India Exchange-Traded Fund Trust and PowerShares Actively Managed Exchange-Traded Fund Trust | | N/A | | N/A |
T-3 Invesco Select Companies Fund
Trustees and Officers—(continued)
| | | | | | | | |
Name, Year of Birth and
Position(s) Held with the Trust | | Trustee and/
or Officer Since | | Principal Occupation(s)
During Past 5 Years | | Number of Funds in Fund Complex Overseen by Trustee | | Other Directorship(s) Held by Trustee During Past 5 Years |
| Other Officers—(continued) | | | | | | | | |
Karen Dunn Kelley — 1960
Vice President | | 2003 | | Senior Managing Director, Investments, Invesco Ltd.; Director, Co-President, Co-Chief Executive Officer, and Co-Chairman, Invesco Advisers, Inc. (formerly known as Invesco Institutional (N.A.), Inc.) (registered investment adviser); Chairman, Invesco Senior Secured Management, Inc.; Senior Vice President, Invesco Management Group, Inc. (formerly known as Invesco Aim Management Group, Inc.); Executive Vice President, Invesco Distributors, Inc. (formerly known as Invesco Aim Distributors, Inc.); Director, Invesco Mortgage Capital Inc. and Invesco Management Company Limited; Vice President, The Invesco Funds (other than AIM Treasurer’s Series Trust (Invesco Treasurer’s Series Trust), Short-Term Investments Trust and Invesco Management Trust); and President and Principal Executive Officer, The Invesco Funds (AIM Treasurer’s Series Trust (Invesco Treasurer’s Series Trust), Short-Term Investments Trust and Invesco Management Trust only) Formerly: Director and President, INVESCO Asset Management (Bermuda) Ltd., Director, INVESCO Global Asset Management Limited and INVESCO Management S.A.; Senior Vice President, Van Kampen Investments Inc. and Invesco Advisers, Inc. (formerly known as Invesco Institutional (N.A.), Inc.) (registered investment adviser); Vice President, Invesco Advisers, Inc. (formerly known as Invesco Institutional (N.A.), Inc.); Director of Cash Management and Senior Vice President, Invesco Advisers, Inc. and Invesco Aim Capital Management, Inc.; Director and President, Fund Management Company; Chief Cash Management Officer, Director of Cash Management, Senior Vice President, and Managing Director, Invesco Aim Capital Management, Inc.; Director of Cash Management, Senior Vice President, and Vice President, Invesco Advisers, Inc. and The Invesco Funds (AIM Treasurer’s Series Trust (Invesco Treasurer’s Series Trust), and Short-Term Investments Trust only) | | N/A | | N/A |
Crissie M. Wisdom — 1969 Anti-Money Laundering Compliance Officer | | 2013 | | Anti-Money Laundering Compliance Officer, Invesco Advisers, Inc. (formerly known as Invesco Institutional (N.A.), Inc.) (registered investment adviser), Invesco Capital Markets, Inc. (formerly known as Van Kampen Funds Inc.), Invesco Distributors, Inc., Invesco Investment Services, Inc., Invesco Management Group, Inc., Van Kampen Exchange Corp., The Invesco Funds, and PowerShares Exchange-Traded Fund Trust, PowerShares Exchange-Traded Fund Trust II, PowerShares India Exchange-Traded Fund Trust, PowerShares Actively Managed Exchange-Traded Fund Trust and PowerShares Actively Managed Exchange-Traded Commodity Fund Trust; Anti-Money Laundering Compliance Officer and Bank Secrecy Act Officer, INVESCO National Trust Company and Invesco Trust Company; and Fraud Prevention Manager and Controls and Risk Analysis Manager for Invesco Investment Services, Inc.. | | N/A | | N/A |
Lisa O. Brinkley — 1959 Chief Compliance Officer | | 2015 | | Senior Vice President and Chief Compliance Officer, Invesco Advisers, Inc. (registered investment adviser) (formerly known as Invesco Institutional (N.A., Inc.); and Chief Compliance Officer, The Invesco Funds Formerly: Global Assurance Officer, Invesco Ltd. and Vice President, The Invesco Funds; Chief Compliance Officer, Invesco Distributors, Inc. (formerly known as Invesco Aim Distributors, Inc.), Invesco Investment Services, Inc. (formerly known as Invesco Aim Investment Services, Inc.) and Van Kampen Investor Services Inc.; Senior Vice President, Invesco Management Group, Inc.; Senior Vice President and Chief Compliance Officer, Invesco Advisers, Inc. and The Invesco Funds; Vice President and Chief Compliance Officer, Invesco Aim Capital Management, Inc. and Invesco Distributors, Inc.; Vice President, Invesco Investment Services, Inc. and Fund Management Company. | | N/A | | N/A |
The Statement of Additional Information of the Trust includes additional information about the Fund’s Trustees and is available upon request, without charge, by calling 1.800.959.4246. Please refer to the Fund’s prospectus for information on the Fund’s sub-advisers.
| | | | | | |
Office of the Fund 11 Greenway Plaza, Suite 1000 Houston, TX 77046-1173 | | Investment Adviser Invesco Advisers, Inc. 1555 Peachtree Street, N.E. Atlanta, GA 30309 | | Distributor
Invesco Distributors, Inc. 11 Greenway Plaza, Suite 1000 Houston, TX 77046-1173 | | Auditors PricewaterhouseCoopers LLP 1000 Louisiana Street, Suite 5800 Houston, TX 77002-5678 |
| | | |
| | | | | | |
Counsel to the Fund Stradley Ronon Stevens & Young, LLP 2005 Market Street, Suite 2600 Philadelphia, PA 19103-7018 | | Counsel to the Independent Trustees Goodwin Procter LLP 901 New York Avenue, N.W. Washington, D.C. 20001 | | Transfer Agent Invesco Investment Services, Inc. 11 Greenway Plaza, Suite 1000 Houston, TX 77046-1173 | | Custodian State Street Bank and Trust Company 225 Franklin Street Boston, MA 02110-2801 |
T-4 Invesco Select Companies Fund

Invesco mailing information
Send general correspondence to Invesco Investment Services, Inc., P.O. Box 219078, Kansas City, MO 64121-9078.
Important notice regarding delivery of security holder documents
To reduce Fund expenses, only one copy of most shareholder documents may be mailed to shareholders with multiple accounts at the same address (Householding). Mailing of your shareholder documents may be householded indefinitely unless you instruct us otherwise. If you do not want the mailing of these documents to be combined with those for other members of your household, please contact Invesco Investment Services, Inc. at 800 959 4246 or contact your financial institution. We will begin sending you individual copies for each account within 30 days after receiving your request.
Fund holdings and proxy voting information
The Fund provides a complete list of its holdings four times in each fiscal year, at the quarter ends. For the second and fourth quarters, the lists appear in the Fund’s semiannual and annual reports to shareholders. For the first and third quarters, the Fund files the lists with the Securities and Exchange Commission (SEC) on Form N-Q. The most recent list of portfolio holdings is available at invesco.com/completeqtrholdings. Shareholders can also look up the Fund’s Forms N-Q on the SEC website at sec.gov. Copies of the Fund’s Forms N-Q may be reviewed and copied at the SEC Public Reference Room in Washington, D.C. You can obtain information on the operation of the Public Reference Room, including information about duplicating fee charges, by calling 202 551 8090 or 800 732 0330, or by electronic request at the following email address: publicinfo@sec.gov. The SEC file numbers for the Fund are shown below.
A description of the policies and procedures that the Fund uses to determine how to vote proxies relating to portfolio securities is available without charge, upon request, from our Client Services department at 800 959 4246 or at invesco.com/proxyguidelines. The information is also available on the SEC website, sec.gov.
| | |
Information regarding how the Fund voted proxies related to its portfolio securities during the most recent 12-month period ended June 30 is available at invesco.com/proxysearch. The information is also available on the SEC website, sec.gov. Invesco Advisers, Inc. is an investment adviser; it provides investment advisory services to individual and institutional clients and does not sell securities. Invesco Distributors, Inc. is the US distributor for Invesco Ltd.’s retail mutual funds, exchange-traded funds and institutional money market funds. Both are wholly owned, indirect subsidiaries of Invesco Ltd. | |  |
SEC file numbers: 811-05426 and 033-19338 SCO-AR-1 Invesco Distributors, Inc.
There were no amendments to the Code of Ethics (the “Code”) that applies to the Registrant’s Principal Executive Officer (“PEO”) and Principal Financial Officer (“PFO”) during the period covered by the report. The Registrant did not grant any waivers, including implicit waivers, from any provisions of the Code to the PEO or PFO during the period covered by this report.
| ITEM 3. | AUDIT COMMITTEE FINANCIAL EXPERT. |
The Board of Trustees has determined that the Registrant has at least one audit committee financial expert serving on its Audit Committee. The Audit Committee financial expert is Raymond Stickel, Jr. Mr. Stickel is “independent” within the meaning of that term as used in Form N-CSR.
| ITEM 4. | PRINCIPAL ACCOUNTANT FEES AND SERVICES. |
(a) to (d)
Fees Billed by PWC Related to the Registrant
PWC billed the Registrant aggregate fees for services rendered to the Registrant for the last two fiscal years as follows:
| | | | | | | | | | | | | | |
| | | Fees Billed for
Services Rendered to
the Registrant for
fiscal year end 2015 | | (e)(2)
Percentage of Fees
Billed Applicable to
Non-Audit Services
Provided for fiscal
year end 2015
Pursuant to Waiver of
Pre-Approval
Requirement(1) | | Fees Billed for
Services Rendered to
the Registrant for
fiscal year end 2014 | | (e)(2)
Percentage of Fees
Billed Applicable to
Non-Audit Services
Provided for fiscal
year end 2014
Pursuant to Waiver of
Pre-Approval
Requirement(1) |
| | | | |
Audit Fees | | | $ | 931,700 | | | N/A | | | $ | 892,000 | | | N/A |
Audit-Related Fees | | | $ | 0 | | | 0% | | | $ | 0 | | | 0% |
Tax Fees(2) | | | $ | 376,200 | | | 0% | | | $ | 298,893 | | | 0% |
All Other Fees | | | $ | 0 | | | 0% | | | $ | 0 | | | 0% |
| | | | | | | | | | | | | | |
Total Fees | | | $ | 1,307,900 | | | 0% | | | $ | 1,190,893 | | | 0% |
(g) PWC billed the Registrant aggregate non-audit fees of $376,200 for the fiscal year ended 2015, and $298,893
for the fiscal year ended 2014, for non-audit services rendered to the Registrant.
| (1) | With respect to the provision of non-audit services, the pre-approval requirement is waived pursuant to a de minimis exception if (i) such services were not recognized as non-audit services by the Registrant at the time of engagement, (ii) the aggregate amount of all such services provided is no more than 5% of the aggregate audit and non-audit fees paid by the Registrant to PWC during a fiscal year; and (iii) such services are promptly brought to the attention of the Registrant’s Audit Committee and approved by the Registrant’s Audit Committee prior to the completion of the audit. |
| (2) | Tax fees for the fiscal year end 2015 include fees billed for reviewing tax returns and consultation services. Tax fees for the fiscal year end 2014 includes fees billed for reviewing tax returns. |
Fees Billed by PWC Related to Invesco and Invesco Affiliates
PWC billed Invesco Advisers, Inc. (“Invesco”), the Registrant’s adviser, and any entity controlling, controlled by or under common control with Invesco that provides ongoing services to the Registrant (“Invesco Affiliates”) aggregate fees for pre-approved non-audit services rendered to Invesco and Invesco Affiliates for the last two fiscal years as follows:
| | | | | | | | | | | | | | | | | | | | |
| | | Fees Billed for Non-
Audit Services
Rendered to Invesco
and Invesco Affiliates
for fiscal year end
2015 That Were
Required to be Pre-Approved by the Registrant’s Audit Committee | | (e)(2) Percentage of Fees
Billed Applicable to
Non-Audit Services
Provided for fiscal year
end 2015 Pursuant to
Waiver of Pre-
Approval
Requirement(1) | | Fees Billed for Non-
Audit Services
Rendered to Invesco
and Invesco Affiliates
for fiscal year end
2014 That Were
Required to be Pre-Approved by the Registrant’s Audit Committee | | (e)(2) Percentage of Fees
Billed Applicable to
Non-Audit Services
Provided for fiscal year
end 2014 Pursuant to
Waiver of Pre-
Approval
Requirement(1) |
| | | | |
Audit-Related Fees | | | $ | 574,000 | | | | | 0 | % | | | $ | 574,000 | | | | | 0 | % |
Tax Fees | | | $ | 0 | | | | | 0 | % | | | $ | 0 | | | | | 0 | % |
All Other Fees | | | $ | 3,750,000 | | | | | 0 | % | | | $ | 0 | | | | | 0 | % |
| | | | | | | | | | | | | | | | | | | | |
Total Fees(2) | | | $ | 4,324,000 | | | | | 0 | % | | | $ | 574,000 | | | | | 0 | % |
| (1) | With respect to the provision of non-audit services, the pre-approval requirement is waived pursuant to a de minimis exception if (i) such services were not recognized as non-audit services by the Registrant at the time of engagement, (ii) the aggregate amount of all such services provided is no more than 5% of the aggregate audit and non-audit fees paid by the Registrant, Invesco and Invesco Affiliates to PWC during a fiscal year; and (iii) such services are promptly brought to the attention of the Registrant’s Audit Committee and approved by the Registrant’s Audit Committee prior to the completion of the audit. |
| (2) | Audit-Related fees for the year end 2015 include fees billed related to reviewing controls at a service organization. Audit-Related fees for the year end 2014 include fees billed related to reviewing controls at a service organization. |
(g) Including the fees for services not required to be pre-approved by the registrant’s audit committee, PWC billed Invesco and Invesco Affiliates aggregate non-audit fees of $9,083,022 for the fiscal year ended 2015, and $2,939,346 for the fiscal year ended 2014 for non-audit services rendered to Invesco and Invesco Affiliates.
(h) The Audit Committee also has considered whether the provision of non-audit services that were rendered to Invesco and Invesco Affiliates that were not required to be pre-approved pursuant to SEC regulations, if any, is compatible with maintaining PWC’s independence. To the extent that such services were provided, the Audit Committee determined that the provision of such services is compatible with PWC maintaining independence with respect to the Registrant.
(f) Not applicable.
(e)(1)
PRE-APPROVAL OF AUDIT AND NON-AUDIT SERVICES
POLICIES AND PROCEDURES
As adopted by the Audit Committees of
the Invesco Funds (the “Funds”)
Last Amended May 4, 2010
Statement of Principles
Under the Sarbanes-Oxley Act of 2002 and rules adopted by the Securities and Exchange Commission (“SEC”) (“Rules”), the Audit Committees of the Funds’ (the “Audit Committees”) Board of Trustees (the “Board”) are responsible for the appointment, compensation and oversight of the work of independent accountants (an “Auditor”). As part of this responsibility and to assure that the Auditor’s independence is not impaired, the Audit Committees pre-approve the audit and non-audit services provided to the Funds by each Auditor, as well as all non-audit services provided by the Auditor to the Funds’ investment adviser and to affiliates of the adviser that provide ongoing services to the Funds (“Service Affiliates”) if the services directly impact the Funds’ operations or financial reporting. The SEC Rules also specify the types of services that an Auditor may not provide to its audit client. The following policies and procedures comply with the requirements for pre-approval and provide a mechanism by which management of the Funds may request and secure pre-approval of audit and non-audit services in an orderly manner with minimal disruption to normal business operations.
Proposed services either may be pre-approved without consideration of specific case-by-case services by the Audit Committees (“general pre-approval”) or require the specific pre-approval of the Audit Committees (“specific pre-approval”). As set forth in these policies and procedures, unless a type of service has received general pre-approval, it will require specific pre-approval by the Audit Committees. Additionally, any fees exceeding 110% of estimated pre-approved fee levels provided at the time the service was pre-approved will also require specific approval by the Audit Committees before payment is made. The Audit Committees will also consider the impact of additional fees on the Auditor’s independence when determining whether to approve any additional fees for previously pre-approved services.
The Audit Committees will annually review and generally pre-approve the services that may be provided by each Auditor without obtaining specific pre-approval from the Audit Committee generally on an annual basis. The term of any general pre-approval runs from the date of such pre-approval through September 30th of the following year, unless the Audit Committees consider a different period and state otherwise. The Audit Committees will add to or subtract from the list of general pre-approved services from time to time, based on subsequent determinations.
The purpose of these policies and procedures is to set forth the guidelines to assist the Audit Committees in fulfilling their responsibilities.
Delegation
The Audit Committees may from time to time delegate pre-approval authority to one or more of its members who are Independent Trustees. All decisions to pre-approve a service by a delegated member shall be reported to the Audit Committees at the next quarterly meeting.
Audit Services
The annual audit services engagement terms will be subject to specific pre-approval of the Audit Committees. Audit services include the annual financial statement audit and other procedures such as tax provision work that is required to be performed by the independent auditor to be able to form an opinion on the Funds’ financial statements. The Audit Committees will obtain, review and consider sufficient information concerning the proposed Auditor to make a reasonable evaluation of the Auditor’s qualifications and independence.
In addition to the annual Audit services engagement, the Audit Committees may grant either general or specific pre-approval of other audit services, which are those services that only the independent auditor
reasonably can provide. Other Audit services may include services such as issuing consents for the inclusion of audited financial statements with SEC registration statements, periodic reports and other documents filed with the SEC or other documents issued in connection with securities offerings.
Non-Audit Services
The Audit Committees may provide either general or specific pre-approval of any non-audit services to the Funds and its Service Affiliates if the Audit Committees believe that the provision of the service will not impair the independence of the Auditor, is consistent with the SEC’s Rules on auditor independence, and otherwise conforms to the Audit Committees’ general principles and policies as set forth herein.
Audit-Related Services
“Audit-related services” are assurance and related services that are reasonably related to the performance of the audit or review of the Fund’s financial statements or that are traditionally performed by the independent auditor. Audit-related services include, among others, accounting consultations related to accounting, financial reporting or disclosure matters not classified as “Audit services”; assistance with understanding and implementing new accounting and financial reporting guidance from rulemaking authorities; and agreed-upon procedures related to mergers, compliance with ratings agency requirements and interfund lending activities.
Tax Services
“Tax services” include, but are not limited to, the review and signing of the Funds’ federal tax returns, the review of required distributions by the Funds and consultations regarding tax matters such as the tax treatment of new investments or the impact of new regulations. The Audit Committees will scrutinize carefully the retention of the Auditor in connection with a transaction initially recommended by the Auditor, the major business purpose of which may be tax avoidance or the tax treatment of which may not be supported in the Internal Revenue Code and related regulations. The Audit Committees will consult with the Funds’ Treasurer (or his or her designee) and may consult with outside counsel or advisors as necessary to ensure the consistency of Tax services rendered by the Auditor with the foregoing policy.
No Auditor shall represent any Fund or any Service Affiliate before a tax court, district court or federal court of claims.
Under rules adopted by the Public Company Accounting Oversight Board and approved by the SEC, in connection with seeking Audit Committees’ pre-approval of permissible Tax services, the Auditor shall:
| | 1. | Describe in writing to the Audit Committees, which writing may be in the form of the proposed engagement letter: |
| | a. | The scope of the service, the fee structure for the engagement, and any side letter or amendment to the engagement letter, or any other agreement between the Auditor and the Fund, relating to the service; and |
| | b. | Any compensation arrangement or other agreement, such as a referral agreement, a referral fee or fee-sharing arrangement, between the Auditor and any person (other than the Fund) with respect to the promoting, marketing, or recommending of a transaction covered by the service; |
| | 2. | Discuss with the Audit Committees the potential effects of the services on the independence of the Auditor; and |
| | 3. | Document the substance of its discussion with the Audit Committees. |
All Other Auditor Services
The Audit Committees may pre-approve non-audit services classified as “All other services” that are not categorically prohibited by the SEC, as listed in Exhibit 1 to this policy.
Pre-Approval Fee Levels or Established Amounts
Pre-approval of estimated fees or established amounts for services to be provided by the Auditor under general or specific pre-approval policies will be set periodically by the Audit Committees. Any proposed fees exceeding 110% of the maximum estimated pre-approved fees or established amounts for pre-approved audit and non-audit services will be reported to the Audit Committees at the quarterly Audit Committees meeting and will require specific approval by the Audit Committees before payment is made. The Audit Committees will always factor in the overall relationship of fees for audit and non-audit services in determining whether to pre-approve any such services and in determining whether to approve any additional fees exceeding 110% of the maximum pre-approved fees or established amounts for previously pre-approved services.
Procedures
Generally on an annual basis, Invesco Advisers, Inc. (“Invesco”) will submit to the Audit Committees for general pre-approval, a list of non-audit services that the Funds or Service Affiliates of the Funds may request from the Auditor. The list will describe the non-audit services in reasonable detail and will include an estimated range of fees and such other information as the Audit Committee may request.
Each request for services to be provided by the Auditor under the general pre-approval of the Audit Committees will be submitted to the Funds’ Treasurer (or his or her designee) and must include a detailed description of the services to be rendered. The Treasurer or his or her designee will ensure that such services are included within the list of services that have received the general pre-approval of the Audit Committees. The Audit Committees will be informed at the next quarterly scheduled Audit Committees meeting of any such services for which the Auditor rendered an invoice and whether such services and fees had been pre-approved and if so, by what means.
Each request to provide services that require specific approval by the Audit Committees shall be submitted to the Audit Committees jointly by the Fund’s Treasurer or his or her designee and the Auditor, and must include a joint statement that, in their view, such request is consistent with the policies and procedures and the SEC Rules.
Each request to provide tax services under either the general or specific pre-approval of the Audit Committees will describe in writing: (i) the scope of the service, the fee structure for the engagement, and any side letter or amendment to the engagement letter, or any other agreement between the Auditor and the audit client, relating to the service; and (ii) any compensation arrangement or other agreement between the Auditor and any person (other than the audit client) with respect to the promoting, marketing, or recommending of a transaction covered by the service. The Auditor will discuss with the Audit Committees the potential effects of the services on the Auditor’s independence and will document the substance of the discussion.
Non-audit services pursuant to the de minimis exception provided by the SEC Rules will be promptly brought to the attention of the Audit Committees for approval, including documentation that each of the conditions for this exception, as set forth in the SEC Rules, has been satisfied.
On at least an annual basis, the Auditor will prepare a summary of all the services provided to any entity in the investment company complex as defined in section 2-01(f)(14) of Regulation S-X in sufficient detail as to the nature of the engagement and the fees associated with those services.
The Audit Committees have designated the Funds’ Treasurer to monitor the performance of all services provided by the Auditor and to ensure such services are in compliance with these policies and procedures. The Funds’ Treasurer will report to the Audit Committees on a periodic basis as to the results of such monitoring. Both the Funds’ Treasurer and management of Invesco will immediately report to the chairman of the Audit Committees any breach of these policies and procedures that comes to the attention of the Funds’ Treasurer or senior management of Invesco.
Exhibit 1 to Pre-Approval of Audit and Non-Audit Services Policies and Procedures
Conditionally Prohibited Non-Audit Services (not prohibited if the Fund can reasonably conclude that the results of the service would not be subject to audit procedures in connection with the audit of the Fund’s financial statements)
| | ● | | Bookkeeping or other services related to the accounting records or financial statements of the audit client |
| | ● | | Financial information systems design and implementation |
| | ● | | Appraisal or valuation services, fairness opinions, or contribution-in-kind reports |
| | ● | | Internal audit outsourcing services |
Categorically Prohibited Non-Audit Services
| | ● | | Broker-dealer, investment adviser, or investment banking services |
| | ● | | Expert services unrelated to the audit |
| | ● | | Any service or product provided for a contingent fee or a commission |
| | ● | | Services related to marketing, planning, or opining in favor of the tax treatment of confidential transactions or aggressive tax position transactions, a significant purpose of which is tax avoidance |
| | ● | | Tax services for persons in financial reporting oversight roles at the Fund |
| | ● | | Any other service that the Public Company Oversight Board determines by regulation is impermissible. |
| ITEM 5. | AUDIT COMMITTEE OF LISTED REGISTRANTS. |
Not applicable.
| ITEM 6. | SCHEDULE OF INVESTMENTS. |
Investments in securities of unaffiliated issuers is included as part of the reports to stockholders filed under Item 1 of this Form.
| ITEM 7. | DISCLOSURE OF PROXY VOTING POLICIES AND PROCEDURES FOR CLOSED-END MANAGEMENT INVESTMENT COMPANIES. |
Not applicable.
| ITEM 8. | PORTFOLIO MANAGERS OF CLOSED-END MANAGEMENT COMPANIES. |
Not applicable.
| ITEM 9. | PURCHASES OF EQUITY SECURITIES BY CLOSED-END MANAGEMENT INVESTMENT COMPANY AND AFFILIATED PURCHASERS. |
Not applicable.
| ITEM 10. | SUBMISSION OF MATTERS TO A VOTE OF SECURITY HOLDERS. |
None
| ITEM 11. | CONTROLS AND PROCEDURES. |
| (a) | As of November 20, 2015, an evaluation was performed under the supervision and with the participation of the officers of the Registrant, including the PEO and PFO, to assess the effectiveness of the Registrant’s disclosure controls and procedures, as that term is defined in Rule 30a-3(c) under the Investment Company Act of 1940 (the “Act”), as amended. Based on that evaluation, the Registrant’s officers, including the PEO and PFO, concluded that, as of November 20, 2015, the Registrant’s disclosure controls and procedures were reasonably designed to ensure: (1) that information required to be disclosed by the Registrant on Form N-CSR is recorded, processed, summarized and reported within the time periods specified by the rules and forms of the Securities and Exchange Commission; and (2) that material information relating to the Registrant is made known to the PEO and PFO as appropriate to allow timely decisions regarding required disclosure. |
| (b) | There have been no changes in the Registrant’s internal control over financial reporting (as defined in Rule 30a-3(d) under the Act) that occurred during the second fiscal quarter of the period covered by this report that have materially affected, or are reasonably likely to materially affect, the Registrant’s internal control over financial reporting. |
| 12(a) (2) | Certifications of principal executive officer and principal financial officer as required by Rule 30a-2(a) under the Investment Company Act of 1940. |
| 12(b) | Certifications of principal executive officer and principal financial officer as required by Rule 30a-2(b) under the Investment Company Act of 1940. |
SIGNATURES
Pursuant to the requirements of the Securities Exchange Act of 1934 and the Investment Company Act of 1940, the Registrant has duly caused this report to be signed on its behalf by the undersigned, thereunto duly authorized.
Registrant: AIM Investment Funds (Invesco Investment Funds)
| | |
| By: | | /s/ Philip A. Taylor |
| | Philip A. Taylor |
| | Principal Executive Officer |
| |
| Date: | | January 8, 2016 |
Pursuant to the requirements of the Securities and Exchange Act of 1934 and the Investment Company Act of 1940, this report has been signed below by the following persons on behalf of the Registrant and in the capacities and on the dates indicated.
| | |
| By: | | /s/ Philip A. Taylor |
| | Philip A. Taylor |
| | Principal Executive Officer |
| |
| Date: | | January 8, 2016 |
| | |
| By: | | /s/ Sheri Morris |
| | Sheri Morris |
| | Principal Financial Officer |
| |
| Date: | | January 8, 2016 |
EXHIBIT INDEX
| | |
| 12(a) (1) | | Code of Ethics. |
| |
| 12(a) (2) | | Certifications of principal executive officer and principal financial officer as required by Rule 30a-2(a) under the Investment Company Act of 1940. |
| |
| 12(a) (3) | | Not applicable. |
| |
| 12(b) | | Certifications of principal executive officer and principal financial officer as required by Rule 30a-2(b) under the Investment Company Act of 1940. |